


Abstract
Deep learning-based semantic segmentation is increasingly used for automated structural health monitoring (SHM) of masonry infrastructure, yet model evaluation is still primarily based on segmentation metrics. Such metrics capture predictive performance, while the underlying decision-making mechanisms of the models remain unclear. In this study, the relationship between segmentation performance and explainability was investigated for Attention U-Net, U-Net++, and SegFormer-B2 in masonry wall segmentation. All models achieved successful brick segmentation, while SegFormer-B2 showed a modest advantage across all segmentation metrics, with a Dice score of 0.9665 and an IoU of 0.9462. Explanation characteristics were examined using Seg-Grad-CAM, Integrated Gradients, and SLIC-LIME. Attention-gate coefficient maps were additionally analyzed for Attention U-Net. Despite their comparable segmentation performance, the models exhibited distinct spatial explanation patterns, and the quantitative XAI results varied across evaluation metrics. Seg-Grad-CAM achieved the highest Pointing Game and Mask IoU values, while SLIC-LIME produced a low Deletion AUC despite minimal overlap with ground-truth masks. High spatial alignment does not guarantee explanation quality, so method selection depends directly on the evaluated criterion. The findings indicate that segmentation accuracy and explanation behavior provide complementary information for model evaluation.
1. Introduction
Masonry structures are common in the existing building stock, infrastructure, and cultural heritage assets. Aging, material deterioration, and damage from environmental and use-related factors can progressively affect their condition, so periodic monitoring and evaluation are necessary [1,2,3,4]. Conventional assessment methods are based on visual observation and manual documentation, which are labor-intensive, costly, and potentially subjective [5,6,7]. To address these limitations, image-based deep learning methods have been widely adopted in automated detection and segmentation of structural components and damage [8,9,10,11].
In structural health monitoring (SHM), semantic segmentation plays a significant role in delineating complex structural components. Semantic segmentation supports image-based reconstruction and digital-twin generation by enabling the extraction of geometric information [1,12]. Additionally, it facilitates large-scale heritage documentation, integration of condition information into heritage information models, and quantitative characterization of masonry structures [13,14,15,16]. For this purpose, U-Net-based encoder–decoder architectures have been widely adopted for masonry segmentation [2,3,4,6]. Recently, transformer-based architectures such as SegFormer have emerged as alternatives to convolutional models. SegFormer combines a hierarchical multiscale encoder with efficient self-attention [17]. Transformer-based models have also been applied to damage segmentation and assessment in historic buildings [18].
Although deep learning models have achieved impressive results in masonry segmentation, model comparisons still focus mainly on predictive performance. Such performance metrics fail to provide in-depth insights into the underlying model behavior and practical suitability for SHM applications [19,20]. High performance alone does not establish applicability beyond the tested conditions. Models can exploit visual patterns specific to the dataset [21,22], a challenge identified in cross-domain masonry crack analysis [23]. This problem is particularly critical for masonry imagery, where joint geometry, surface texture, illumination conditions, and color can vary substantially [9,24]. Despite similar segmentation performance, models can exhibit different spatial explanation patterns. For SHM applications, predictive metrics should be complemented by explanation analysis [25], including quantitative assessments of localization within regions relevant to the task and perturbation-based faithfulness [26].
Explainable artificial intelligence (XAI) approaches leverage both model-internal attention visualizations and post-hoc methods, including gradient-weighted activation mapping, path-integrated gradient attribution, and perturbation-based local explanations [20,21,27,28,29,30,31]. Variations in their underlying mechanisms and model-access requirements generate different explanations for the same predictions [19,32,33,34,35]. However, systematic comparisons of masonry segmentation architectures and explanation methods are still limited. Consequently, further investigation is needed to determine whether architecture comparisons remain consistent under different explanation methods and evaluation criteria.
In this study, an attention-enhanced convolutional architecture (Attention U-Net), a nested convolutional architecture (U-Net++), and a transformer-based architecture (SegFormer-B2) were compared for binary brick segmentation. Seg-Grad-CAM, Integrated Gradients, and LIME with SLIC superpixels (hereafter SLIC-LIME) were applied to all deep learning models, while the attention-gate coefficient maps of Attention U-Net were examined separately. The analysis assessed the consistency of the model comparisons in terms of segmentation metrics, qualitative explanation patterns, and quantitative XAI metrics.
2. Materials and Methods
2.1. Dataset
In this study, the MCrack1300 dataset [8,36] was used. The dataset comprises 1300 masonry images with a spatial resolution of pixels. Of these images, 251 were derived from the Crack900 dataset [37]. Among the remaining 1049 images, 376 were collected from online sources and 673 were acquired on the University of Birmingham campus. For binary brick segmentation, the brick and broken brick annotations formed the brick class, and the crack annotations were merged with the background. The original data partition was retained, consisting of 1000 training, 150 validation, and 150 test images.
2.2. Segmentation Models
Attention U-Net, U-Net++, and SegFormer-B2 were used as segmentation models in this study.
2.2.1. Attention U-Net
Attention U-Net [38] extends the U-Net architecture with attention gates (AGs) and was originally proposed for medical image segmentation. Integrated into skip connections, these gates use coarse-scale contextual information to suppress irrelevant and noisy activations while highlighting task-relevant encoder features. At spatial location i, an attention gate integrates the encoder feature vector with a gating vector obtained from a coarser decoder level. Following projection to a shared feature space and spatial alignment, the gate computes the unnormalized attention score as
where denotes the ReLU function, and , , , , and are trainable parameters. The corresponding attention coefficient is
where denotes the sigmoid function. Where spatial dimensions differ, the coefficient map is resampled to match the spatial resolution of . The aligned coefficient then scales all channels at location i,
where is the number of channels in layer l. The filtered encoder feature map is passed through the skip connection and concatenated with the corresponding decoder feature map.
2.2.2. U-Net++
U-Net++ [39] replaces the direct skip connections of U-Net with nested, densely connected skip pathways. These pathways progressively enrich high-resolution encoder features before their fusion with semantically rich decoder features, thus narrowing the semantic gap and improving gradient flow during optimization.
The output of a node at resolution level i and nested stage j is denoted by , where increasing values of i correspond to progressively coarser spatial resolutions. Here, represents an encoder feature map, while denotes the output of a node within the corresponding nested skip pathway for . This output is computed as
where denotes a convolutional transformation followed by a nonlinear activation, is an upsampling operator, and denotes channel-wise concatenation. Each node aggregates all preceding feature maps at the same resolution with the upsampled feature map from the next coarser level.
2.2.3. SegFormer-B2
SegFormer-B2 [17] pairs a four-stage hierarchical Mix Transformer (MiT-B2) encoder with a lightweight All-MLP decoder. The encoder incorporates overlapping patch embeddings, efficient self-attention with sequence reduction, and Mix-FFN blocks containing depthwise convolutions to generate multiscale feature maps at , , , and of the input resolution. The decoder linearly projects these feature maps to a common channel dimension, upsamples them to of the input resolution, concatenates and fuses them, and produces pixel-wise segmentation logits.
For attention head h in encoder block l, the sequence-reduced self-attention operation is defined as
where is the attention matrix, is the output of the attention head, and is the feature dimension of each head. The softmax operation is applied over the key positions. The query matrix is computed from the unreduced token sequence, whereas and are computed from a sequence-reduced representation of the same token sequence.
2.3. Model Training and Hyperparameter Optimization
Each model was trained independently, with hyperparameters optimized using Optuna (v4.9.0) [40] over 100 trials per architecture. The search space included the learning rate, weight decay, dropout rate, data augmentation, learning-rate schedule, pixel-wise classification loss type, and the loss weighting. Data augmentation was applied horizontal and vertical flips, rotations within , and brightness and contrast jitter. The convolutional architectures (Attention U-Net and U-Net++) were trained from random initialization, with learning rates sampled logarithmically within and weight decay in . SegFormer-B2 was instead initialized with ImageNet-pretrained MiT-B2 weights and fine-tuned using differential learning rates for the encoder and decoder. Parameters were updated using AdamW with gradient clipping, and the random seed fixed at 42 to support reproducibility. The training objective combined Dice loss with a pixel-wise classification loss selected by the search. This training strategy aimed to obtain high-performing models for the subsequent XAI assessment. The selected configurations and training settings are summarized in Table 1. All models used input images and were trained for up to 60 epochs, with early stopping based on the validation Dice score. The two U-Net variants were trained on a GeForce RTX 3060 GPU and SegFormer-B2 on a Tesla T4 (both NVIDIA Corporation, Santa Clara, CA, USA). The final model for each architecture was taken from its best Optuna trial.
Table 1.
Selected hyperparameters and training settings for the final models.
2.4. XAI Methods
To explain model predictions, this study evaluated Attention Maps, Seg-Grad-CAM, Integrated Gradients, and SLIC-LIME as XAI techniques. However, these methods are not uniformly applicable to all architectures, as particular techniques rely on structural components that are not present in all networks. Table 2 presents the applicability of the explanation methods to the evaluated architectures.
Table 2.
Applicability of the XAI methods to the segmentation models.
2.4.1. Attention Maps
To evaluate model-internal spatial representations, spatial attention coefficients were extracted from the four attention gates of Attention U-Net [38], as defined in Equation (2). Each coefficient map was upsampled to using bilinear interpolation and independently min–max normalized. The final explanation map was the average of these gate maps, followed by a final min–max normalization.
Due to the absence of attention gates in U-Net++, this method is not applicable. While SegFormer-B2 provides self-attention matrices, these represent pairwise interactions between query and key tokens rather than scalar spatial coefficients. Obtaining a single image-level map would require an additional, non-unique aggregation procedure across attention heads, token interactions, and encoder stages. The resulting maps are not directly comparable to the attention-gate coefficient maps of Attention U-Net, and attention-map statistics were not computed for SegFormer-B2.
2.4.2. Seg-Grad-CAM
Grad-CAM [28] was adapted to binary segmentation following the Seg-Grad-CAM approach of Vinogradova et al. [29]. In the present variant, the target score for each image was defined as the mean predicted foreground probability inside the ground-truth mask, rather than the sum of class logits used in the original formulation
where denotes the foreground logit at pixel i, denotes the corresponding sigmoid probability, and denotes the ground-truth mask. Given the activation map of channel k at the selected target layer, the channel-importance weight was computed by globally averaging the gradient of S with respect to ,
where H and W denote the spatial dimensions of the selected activation map. The Seg-Grad-CAM explanation map was defined as
Similarly, bilinear interpolation resized the resulting heatmap to pixels prior to min–max normalization and quantitative evaluation. The target layer was selected as the final decoder convolution block for Attention U-Net and U-Net++, and as the linear fusion layer of the MLP decoder for SegFormer-B2.
2.4.3. Integrated Gradients
Integrated Gradients method [30] attributes a model output to input features by integrating gradients along a straight-line path from a baseline image to the input image x. In this study, the baseline was defined as a zero tensor in the normalized input space, which corresponds to the mean of ImageNet in the raw image space rather than a black image. The scalar target function was defined as the sum of the predicted foreground probabilities over all pixels,
where denotes the foreground logit at pixel i and denotes the corresponding sigmoid probability. The attribution at spatial location i and input channel c is given by
The integral was approximated using uniformly spaced interpolation steps between the baseline and the input. To obtain a two-dimensional explanation map, the signed attributions were combined across channels using absolute values, compressed using a transformation, clipped at the 99th percentile, and min–max normalized. All quantitative metrics were evaluated on this final map, although these post-processing steps break the theoretical completeness property of raw Integrated Gradients.
2.4.4. SLIC-LIME
LIME [31] with SLIC superpixel segmentation [41] was used as the representative perturbation-based method. As a black-box method, it does not require access to model gradients, activations, or architectural details and is applicable to all segmentation models. The input image was first partitioned into M SLIC superpixel regions . A binary perturbation vector was sampled for each perturbation. If , all pixels belonging to the segment were replaced by the channel-wise mean value of the image. If , the segment was left unchanged.
For each perturbed image, the segmentation model was evaluated, and a scalar response was computed as the mean foreground sigmoid probability over all pixels,
where denotes the image domain, is the foreground logit at pixel i for the perturbed image, and denotes the sigmoid function. Each image was partitioned into superpixels using SLIC with a target of 32 segments, a compactness of 20, and a smoothing parameter of 2. For each image, 300 perturbation vectors were drawn, with each component set to 1 with probability 0.5. A ridge-regression surrogate was fitted to the binary perturbation matrix and the corresponding model responses using a regularization coefficient of , without proximity weighting of the perturbation samples. The learned coefficient of each superpixel was assigned back to all pixels in that region to obtain a dense explanation map. Negative coefficients were set to zero, and explanation maps were min–max normalized prior to quantitative evaluation. Samples yielding a standard deviation of model response below were assigned a zero map (non-informative) and excluded from metric evaluation. In these cases, the model responses provided insufficient variation for fitting the surrogate regression, so its coefficients would not have been meaningful.
2.5. Evaluation Metrics
The metrics are divided into two groups. The first evaluates segmentation performance against ground-truth masks. The second evaluates the explanation maps using localization metrics, Spearman rank correlation with the foreground-probability map, and Dice-based Deletion and Insertion AUC. Dice and IoU are computed as per-image means (macro average), whereas Precision, Recall, F1-Score, and Accuracy are computed from TP, TN, FP, and FN counts pooled across all test images (micro average). Table 3 provides the metric definitions, valid ranges, and optimal values for each metric.
Table 3.
Quantitative metrics used for segmentation performance and XAI evaluation.
Calculating Deletion and Insertion AUC metrics involved ranking pixels in descending order of explanation relevance and perturbing them over 30 uniform steps. For Deletion, the highest-ranked pixels were progressively set to zero, whereas for Insertion, their original input values were progressively restored in a zero-valued baseline image. At each step, the Dice score between the model output for the perturbed image and the ground-truth mask was recomputed, with the final AUC obtained by trapezoidal integration over the fraction of perturbed pixels.
In the Pointing Game evaluation, the pixel with maximum relevance was tested for inclusion within the ground-truth mask. Constant explanation maps were treated as undefined and excluded from the average, while ties were resolved by selecting the first occurrence of the maximum value. In the Deletion and Insertion procedure, pixels with equal relevance were ordered by their index. Mask IoU was determined by binarization of each normalized explanation map using Otsu thresholding before calculating the intersection-over-union with the ground-truth mask. Dense pixel-wise Spearman rank correlations were computed between explanation maps and the corresponding foreground probability maps.
Two-sided paired Wilcoxon signed-rank tests evaluated statistical significance on per-image metric pairs. This included both within-model comparisons among different XAI methods and cross-model comparisons for a fixed XAI method, with significance defined at . Effect sizes were expressed as matched-pairs rank-biserial correlations, together with median paired differences. The p values for the 15 Mask IoU comparisons were adjusted for multiple testing using the Holm procedure.
3. Experiments and Results
3.1. Segmentation Performance
Table 4 details the segmentation performance of the evaluated deep learning architectures. All models achieved high accuracy on the segmentation task. The differences among the architectures were small, and SegFormer-B2 had the highest value on every metric. Paired tests on the image-level Dice scores confirmed that SegFormer-B2 achieved higher scores than both U-Net variants ().
Table 4.
Segmentation performance of deep learning models.
3.2. Qualitative Comparison of XAI Visualizations
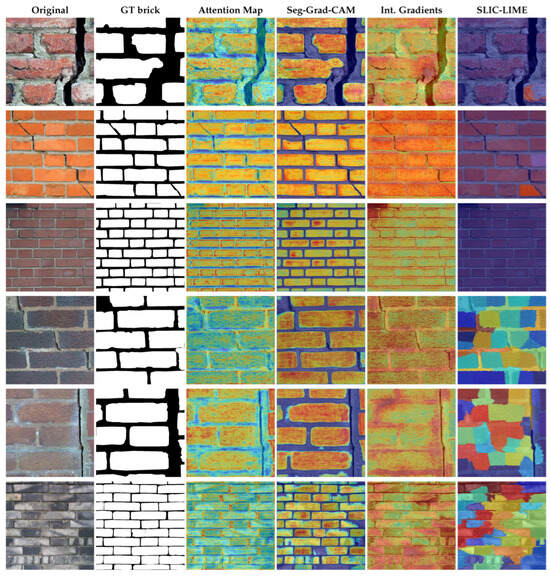
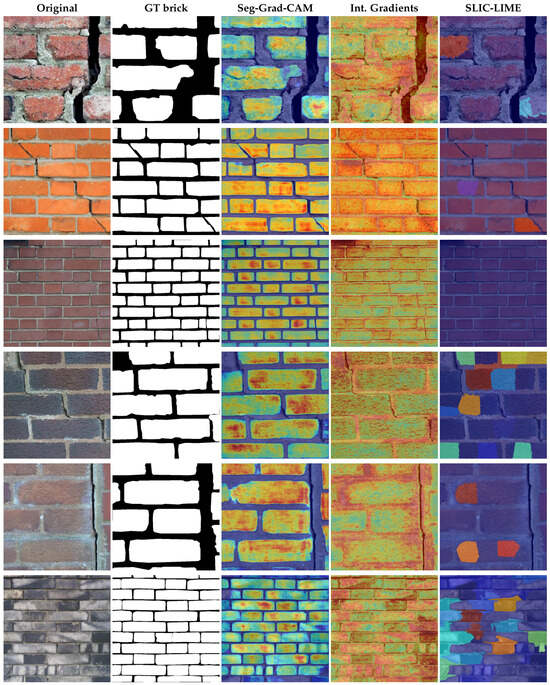
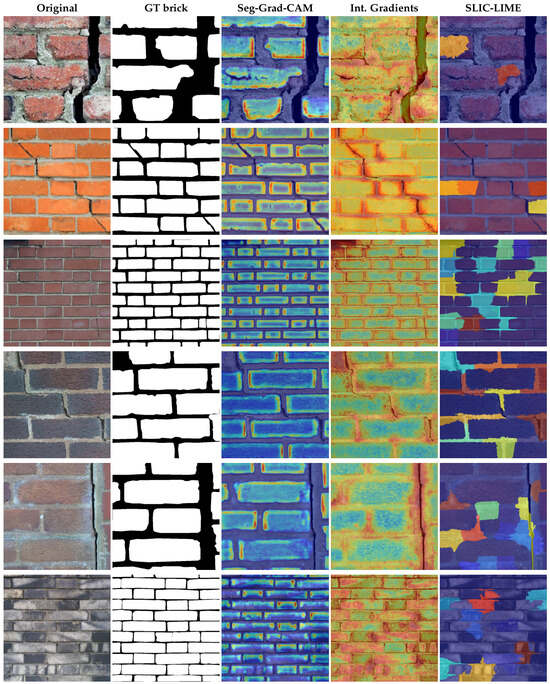
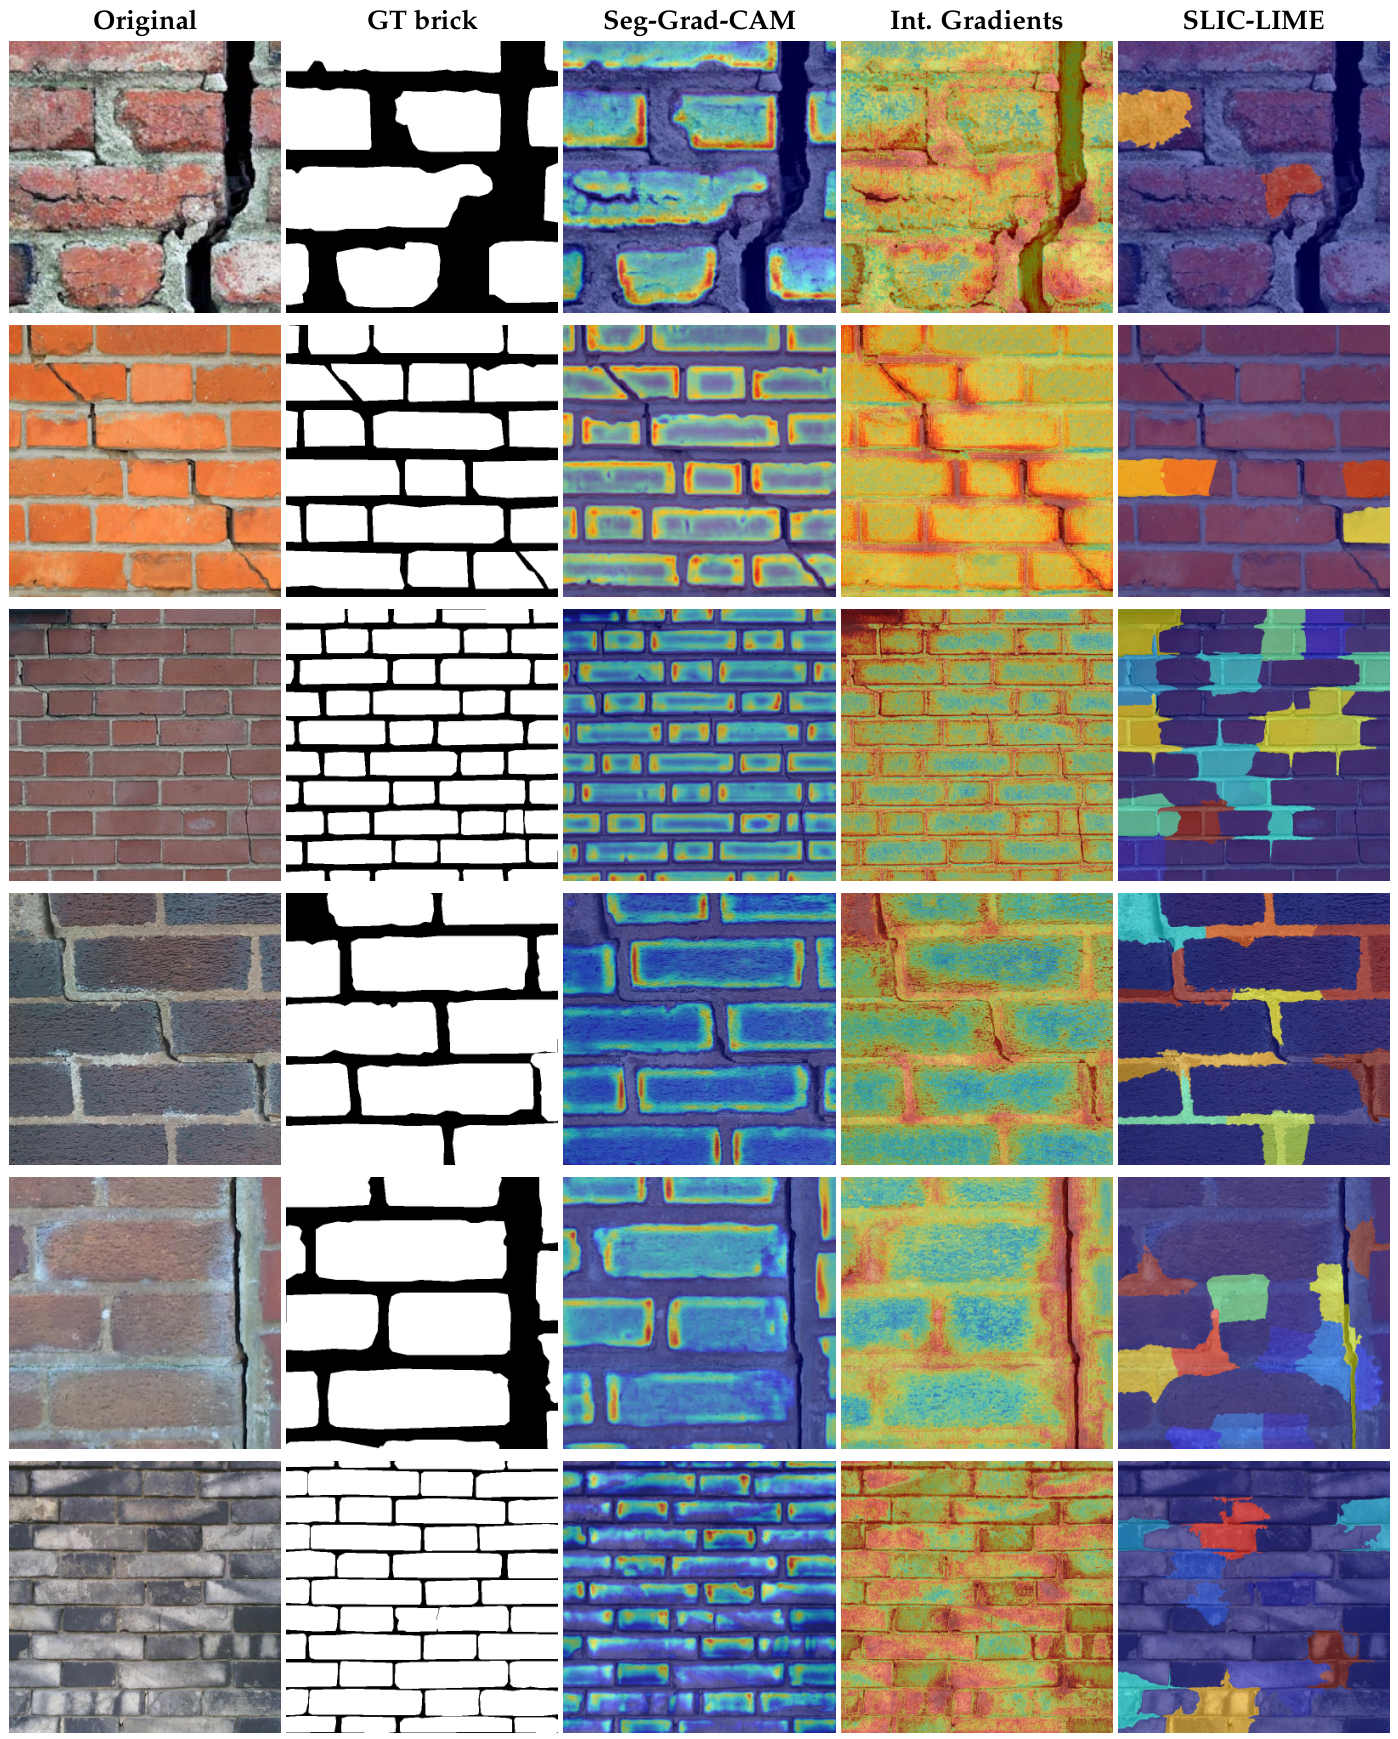
Figure 1, Figure 2 and Figure 3 illustrate the XAI visualizations for six test images selected to cover a range of brick colors, mortar widths, image scales, lighting conditions, and damage patterns.
Figure 1.
Qualitative comparison of explanations for Attention U-Net. From left to right, the columns show the input image, the ground-truth mask, the averaged attention-gate map, and explanation maps generated using Seg-Grad-CAM, Integrated Gradients, and SLIC-LIME.
Figure 2.
Qualitative comparison of explanations for U-Net++. From left to right, the columns show the input image, the ground-truth mask, and explanation maps generated using Seg-Grad-CAM, Integrated Gradients, and SLIC-LIME.
Figure 3.
Qualitative comparison of explanations for SegFormer-B2. From left to right, the columns show the input image, the ground-truth mask, and explanation maps generated using Seg-Grad-CAM, Integrated Gradients, and SLIC-LIME.
The attention-gate maps are presented only for Attention U-Net, whereas the other three methods are shown for all models. The averaged attention-gate maps had relatively high values on parts of the brick surfaces and joint boundaries (Figure 1). Seg-Grad-CAM formed clearly delineated high-relevance regions within brick interiors, while mortar joints, cracks, and other non-brick regions received comparatively low relevance. Integrated Gradients provided spatially dense, fine-grained attributions throughout brick surfaces, mortar interfaces, and surface irregularities. SLIC-LIME varied from image to image, with some maps nearly uniform and others containing positively weighted superpixels that only partially aligned with individual bricks.
Explanations generated for U-Net++ reflected strong method-dependent divergence (Figure 2). Seg-Grad-CAM localized high relevance within brick surfaces, similar to the pattern observed for Attention U-Net. Integrated Gradients produced a diffuse attribution pattern over foreground regions, whereas SLIC-LIME presented image-dependent variability, ranging from isolated positively weighted superpixels to broader regions spanning mortar joints and adjacent bricks.
In SegFormer-B2, Seg-Grad-CAM highlighted structural boundaries rather than interior regions (Figure 3). High-relevance attributions were concentrated along brick edges and brick–mortar transitions, while brick interiors showed lower and less uniformly distributed relevance values. Integrated Gradients targeted transition regions and fine material details while extending onto brick surfaces. SLIC-LIME maintained its coarse superpixel distribution, with positively weighted patches that overlapped both brick surfaces and mortar joints.
Based on the six examples, Seg-Grad-CAM mainly highlighted brick interiors for Attention U-Net and U-Net++, whereas its SegFormer-B2 maps were more closely associated with brick boundaries. Integrated Gradients attributions were broadly distributed over brick surfaces and interfaces for all models. SLIC-LIME remained coarse and superpixel-dependent in all models. These observations describe the visualized samples and the evaluated model–method configurations. The quantitative metrics in Section 3.3 complement these observations by quantifying interior alignment and perturbation response across the full test set.
3.3. Quantitative XAI Results
Table 5 summarizes the five quantitative metrics for all applicable model–method combinations. In all models, Seg-Grad-CAM produced the best Pointing Game and Mask IoU values together with positive mean Spearman correlations, Integrated Gradients the best Insertion AUC with negative correlations, and SLIC-LIME the lowest Deletion AUC. Mean Spearman correlations were positive for Seg-Grad-CAM and negative for Integrated Gradients. These contrasting findings indicate that localization, perturbation response, and spatial correlation characterize different aspects of the explanation maps. The Seg-Grad-CAM Mask IoU metric itself varied by architecture, decreasing from for Attention U-Net and for U-Net++ to for SegFormer-B2, consistent with the more boundary-oriented attribution pattern observed for SegFormer-B2 in Section 3.2. Attention Maps consistently showed moderate performance among the XAI methods in all metrics. This balanced performance was obtained directly from the model’s forward pass, without requiring post-hoc computations.
Table 5.
Quantitative XAI results (mean ± SD).
Integrated Gradients achieved the highest Insertion AUC in all models, although its mean Spearman correlations were negative. These negative mean values indicate that the pixel-wise attribution ranks were inversely associated with the foreground-probability ranks. Consequently, high Insertion AUC did not imply agreement between the pixel rankings in the attribution and probability maps. These findings were not sensitive to the post-processing of the attribution maps. Deletion AUC, Insertion AUC, and Spearman correlation were unchanged without the logarithmic transform or clipping, since these metrics depend only on the pixel ordering. The correlation approached zero only when the signed rather than the absolute attribution was used. The logarithmic transform was required for Otsu thresholding to yield a meaningful mask. The Pointing Game values in Table 5 were calculated without clipping, which otherwise assigns equal values to the top one percent of pixels.
For all models, SLIC-LIME combined the lowest Deletion AUC with the lowest Mask IoU. This metric disagreement aligns with its superpixel-based representation, in which each superpixel receives a single relevance value even when spanning both brick and mortar regions. Because the average superpixel size was comparable to that of a single perturbation step, a highly ranked superpixel was typically removed within one or a few steps, inducing an abrupt decline in the Dice score. Therefore, the low Deletion AUC reflects this coarse perturbation granularity rather than precise spatial localization. Restricting the comparison to the 91 test images for which SLIC-LIME produced an informative map in all three models shifted the mean Mask IoU values by at most 0.019 and the mean Deletion AUC values by at most 0.020. The rankings of the explanation methods within each model and of the three models for each method were unchanged. The number of superpixels was varied between 16 and 64 on a subset of 50 test images. The SLIC-LIME Deletion AUC changed by at most 0.04, and SLIC-LIME remained lowest on this metric in every model at every setting. The proportion of images yielding non-informative maps decreased from 26–54% at 16 segments to at most 4% at 64 segments, but Mask IoU did not increase.
Paired Wilcoxon signed-rank tests with Holm correction were applied to the image-level Mask IoU values (Table 6). All 15 comparisons remained significant after correction (all adjusted ). Within each model, the comparisons among explanation methods had median paired differences and rank-biserial correlations with absolute values from 0.144 to 0.795 and from 0.62 to 1.00, respectively. The cross-model comparisons of Seg-Grad-CAM were also significant, with median differences from 0.015 to 0.081. The difference between Attention U-Net and U-Net++ (0.015) was small relative to those between explanation methods.
Table 6.
Paired Wilcoxon signed-rank test results for image-level Mask IoU comparisons.
Seg-Grad-CAM used the ground-truth mask to define its target score, whereas Integrated Gradients and SLIC-LIME used a global foreground target. Therefore, Seg-Grad-CAM was recomputed with the same global target and re-evaluated on the same test images (Table 7). Mean Mask IoU changed from 0.904 to 0.901 for Attention U-Net and from 0.885 to 0.888 for U-Net++. For SegFormer-B2, the mean fell from 0.782 to 0.737, but the median paired difference was small and not significant (median in favor of the global target, ). The lower mean was driven by a small number of images, not by a consistent shift. Pointing Game values did not differ significantly in the two models where the paired test was applicable (p = 0.16). Under the global target, Seg-Grad-CAM remained well above Integrated Gradients and SLIC-LIME on Mask IoU in every model, and the ordering of the three models was preserved.
Table 7.
Seg-Grad-CAM localization metrics under two target definitions (mean ± SD, ).
The sensitivity of Seg-Grad-CAM to the target layer was also examined by recomputing the maps at three lower-resolution decoder levels for Attention U-Net and U-Net++, and at the four encoder stages for SegFormer-B2. For each model, the layer used in the main analysis generated the highest Mask IoU. The difference between this layer and the next-best alternative ranged from 0.088 to 0.116 across models. SegFormer-B2 had the lowest Mask IoU among the three models at every evaluated level.
3.4. Deletion and Insertion Curves
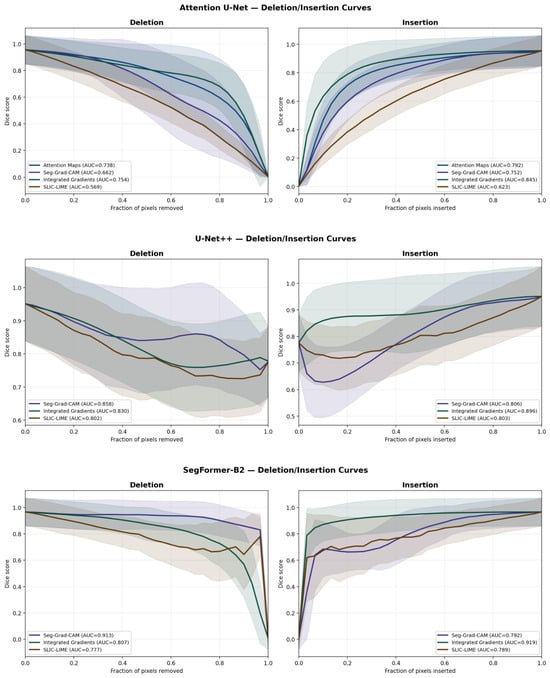
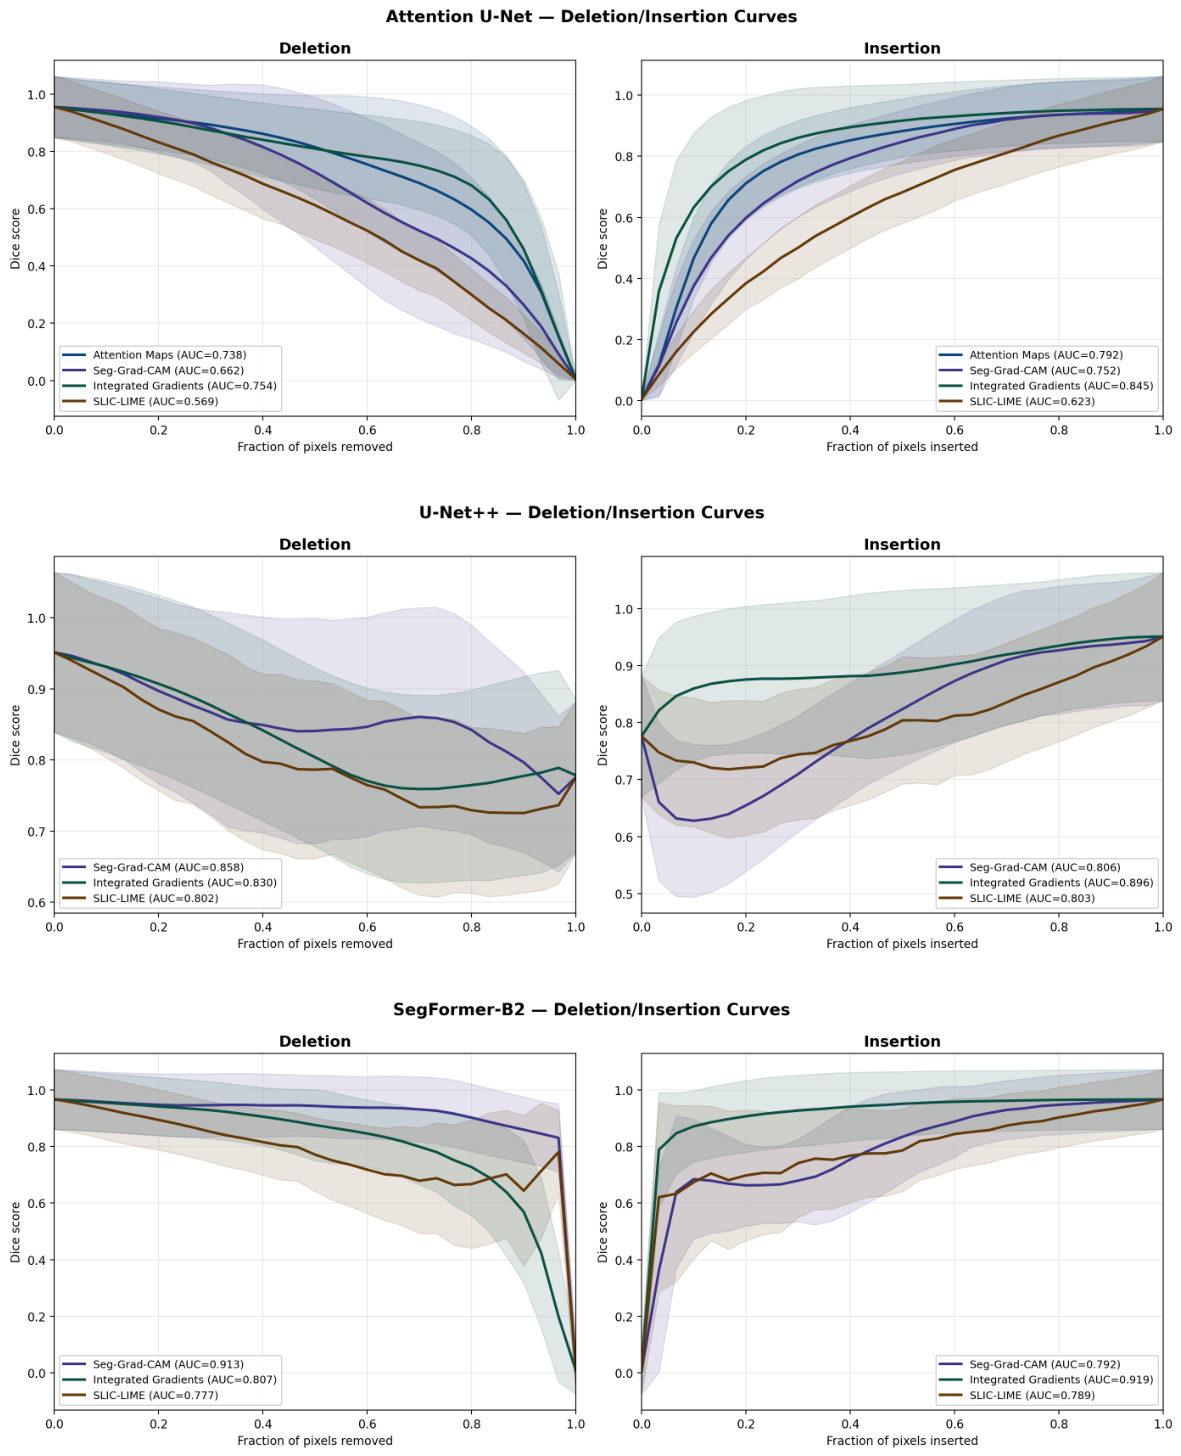
Figure 4 shows the mean Deletion and Insertion curves with standard-deviation intervals for the models.
Figure 4.
Mean Deletion and Insertion curves for Attention U-Net, U-Net++, and SegFormer-B2.
The Attention U-Net curves changed smoothly throughout the perturbation range. Integrated Gradients had the highest Insertion AUC () and SLIC-LIME the lowest Deletion AUC (). The SLIC-LIME Deletion curve fell below the other two within the first fifth of the range and stayed there.
Unlike the other two models, U-Net++ did not approach a Dice score of zero at either end of the range. Its Insertion curves started at Dice scores of approximately –, and its Deletion curves ended at similar values. When given the all-zero baseline image, U-Net++ assigned the foreground class to 89% of pixels, whereas Attention U-Net and SegFormer-B2 assigned it to fewer than 1%. The corresponding Dice score against the test masks was 0.78, which matched the starting point of the Insertion curves. This offset appeared for all methods, so the absolute AUC values for this model were not directly comparable with those of the other two. Integrated Gradients again achieved the highest Insertion AUC (). Its Insertion curve rose to approximately within the first fifth of the range and then plateaued. The Seg-Grad-CAM Insertion curve instead dropped from about to about before recovering, so adding its highest-ranked pixels first lowered the Dice score.
In SegFormer-B2, the Seg-Grad-CAM Deletion curve stayed close to its initial Dice score over most of the range and fell sharply only when the final few percent of pixels were removed. The AUC was . The Seg-Grad-CAM maps for this model were boundary-oriented, so its highest-ranked pixels lay mainly along brick edges and interfaces. Integrated Gradients again produced the highest Insertion AUC (), with most of the increase in Dice occurring within the first tenth of the range.
The Deletion and Insertion analysis was repeated with two alternative baselines, a per-channel mean image and a Gaussian-blurred image, on all 150 test images. Integrated Gradients retained the highest Insertion AUC in every model under every baseline. SLIC-LIME had the lowest Deletion AUC with the zero baseline but did not consistently retain this ranking under the alternative baselines. Integrated Gradients produced the lowest Deletion AUC in three of the six cases, and the difference between the two methods was below 0.015 in four cases. All Deletion AUC values increased under the mean and blurred baselines, reaching 0.85 to 0.95 with blurring. These alternatives removed less information than the zero baseline and reduced the discriminative range of the curves.
4. Discussion
Deep learning models exhibited good predictive performance for brick segmentation on the MCrack1300 dataset. Attention U-Net and U-Net++ achieved IoU values of and , respectively, while SegFormer-B2 had the highest IoU at . However, direct comparison with existing studies is limited by differences in label configuration. In this study, bricks and broken bricks were combined into a single class, whereas Ye et al. [8] evaluated brick, broken brick, and crack classes separately. For the target brick class, the IoU values are broadly consistent with those obtained by Ye et al. ( for SOLOv2, for Mask2Former, and for their proposed LoRA-SAM with a Mask2Former decoder). Despite the different label sets, both studies indicate that the brick class can be segmented with high accuracy on this dataset, suggesting potential for the downstream extraction of geometric information relevant to SHM applications.
Comparative evaluation highlights that explanation characteristics do not consistently correspond to predictive performance. In particular, SegFormer-B2 performed best on the segmentation metrics but achieved the lowest Seg-Grad-CAM Mask IoU. Higher spatial overlap with ground-truth masks does not necessarily reflect superior explanation quality [42]. Brick–mortar interfaces and brick boundaries can provide discriminative features for class separation even when they are not part of the target mask.
The spatial patterns also varied with both the model and the XAI method. Recent studies describe post-hoc maps as broad and non-specific in some cases and fragmented and noisy in others [43,44]. These maps capture model-derived spatial sensitivities and are best interpreted as diagnostic information rather than definitive evidence that a network has learned a valid representation of the masonry structure [45]. No single method–target configuration performed best on all criteria, and the three metric categories offered complementary views of explanation behavior [42,45]. Explanation assessment should therefore consider quantitative metrics, perturbation-curve shapes, baseline behavior, and qualitative maps together.
The explanation methods evaluated relied on distinct target definitions [26]. Seg-Grad-CAM was defined using the mean foreground probability within the ground-truth mask, whereas Integrated Gradients and SLIC-LIME used global foreground predictions as their targets. The ablation in Section 3.3 showed that this asymmetry did not account for the stronger mask alignment of Seg-Grad-CAM. Under a global target, its Mask IoU changed by less than 0.05 in every model. The requirement for ground-truth masks nevertheless makes this Seg-Grad-CAM implementation more suitable as an evaluation-time diagnostic tool than as a general-purpose explanation method.
The selection of an XAI method follows from the objectives of the SHM application [35,42]. For checks concerned with unit layout and geometric documentation, localization can be prioritized, since it measures spatial correspondence with the task region. Where mortar joint geometry and brick arrangement are relevant, interface-oriented relevance remains informative even when it overlaps less with brick interiors. Perturbation-based assessment addresses a different question, whether the prediction depends on the highlighted pixels, and its result depends on the baseline and the perturbation granularity. XAI provides additional information about model behavior, and explanation maps are best interpreted together with predictive performance metrics and application-specific needs.
5. Conclusions
This study assessed predictive performance and explanation behavior for binary brick segmentation on the MCrack1300 dataset. All evaluated models (Attention U-Net, U-Net++, and SegFormer-B2) demonstrated high segmentation accuracy, but their explanations exhibited distinct spatial patterns and model-dependent sensitivities. In the two U-Net-based models, the Seg-Grad-CAM maps focused mainly on brick interiors, whereas in SegFormer-B2 they were more closely aligned with brick boundaries and mortar interfaces. Integrated Gradients spread relevance over surfaces, interfaces, and texture. SLIC-LIME produced superpixel-level maps that variably overlapped brick and mortar. The model with the highest segmentation scores, SegFormer-B2, had the lowest Seg-Grad-CAM Mask IoU. The quantitative comparison showed that spatial localization, rank correlation with the predicted probability map, and perturbation response did not consistently point to the same explanation method. For this task, the results support considering multiple explanation criteria alongside predictive performance. The localization metrics and the Dice-based perturbation metrics require reference masks and therefore provide validation-time guidance rather than field-level decision criteria. These findings are limited to binary brick segmentation on a single dataset and to the masonry characteristics and imaging conditions it represents. Future studies should investigate damage and crack segmentation for more diverse masonry types and acquisition settings.
Author Contributions
Conceptualization, O.O. and D.Z.S.; methodology, O.O.; software, O.O.; validation, O.O. and D.Z.S.; formal analysis, O.O.; investigation, O.O.; data curation, O.O.; writing—original draft preparation, O.O.; writing—review and editing, D.Z.S.; visualization, O.O.; supervision, D.Z.S. All authors have read and agreed to the published version of the manuscript.
Funding
This research received no external funding.
Data Availability Statement
The MCrack1300 dataset used in this study is openly available on Roboflow Universe at https://universe.roboflow.com/uni-of-birmingham/masonry (accessed on 25 September 2026).
Conflicts of Interest
The authors declare no conflicts of interest.
Abbreviations
The following abbreviations are used in this manuscript:
| AUC | Area under the curve |
| GT | Ground truth |
| IoU | Intersection over union |
| LIME | Local interpretable model-agnostic explanations |
| MiT | Mix Transformer |
| MLP | Multilayer perceptron |
| PG | Pointing Game |
| ReLU | Rectified linear unit |
| SD | Standard deviation |
| SHM | Structural health monitoring |
| SLIC | Simple linear iterative clustering |
| XAI | Explainable artificial intelligence |
References
- Loverdos, D.; Sarhosis, V. Geometrical digital twins of masonry structures for documentation and structural assessment using machine learning. Eng. Struct. 2023, 275, 115256. [Google Scholar] [CrossRef] [Scilit]
- Smith, J.; Paraskevopoulou, C.; Cohn, A.G.; Kromer, R.; Bedi, A.; Invernici, M. Automated masonry spalling severity segmentation in historic railway tunnels using deep learning and a block face plane fitting approach. Tunn. Undergr. Space Technol. 2024, 153, 106043. [Google Scholar] [CrossRef] [Scilit]
- Hacıefendioğlu, K.; Altunışık, A.C.; Abdioğlu, T. Deep Learning-Based Automated Detection of Cracks in Historical Masonry Structures. Buildings 2023, 13, 3113. [Google Scholar] [CrossRef] [Scilit]
- Zhang, Y.; Yu, Y.; Zhang, C.; Yue, J.; Yang, Q.; Guan, Y.; Chen, Z.; Zhao, S.; Chen, Z. Semantic Segmentation Method for Surface Gaps of Brick-Built Cultural Relic Buildings Based on the Improved U-Net Network. Struct. Control Health Monit. 2026, 2026, 3717731. [Google Scholar] [CrossRef] [Scilit]
- Valero, E.; Forster, A.; Bosché, F.; Hyslop, E.; Wilson, L.; Turmel, A. Automated defect detection and classification in ashlar masonry walls using machine learning. Autom. Constr. 2019, 106, 102846. [Google Scholar] [CrossRef] [Scilit]
- Dais, D.; Bal, I.E.; Smyrou, E.; Sarhosis, V. Automatic crack classification and segmentation on masonry surfaces using convolutional neural networks and transfer learning. Autom. Constr. 2021, 125, 103606. [Google Scholar] [CrossRef] [Scilit]
- Kalai Selvi, M.; Manjula Devi, R.; Elango, K.S.; Anandaraj, S.; Sindhu Priya, G.; Shaniya, S.; Manoj Kumar, P. Exploring Structural Health Monitoring of Buildings: State of the Art on Techniques and Future Directions. Buildings 2026, 16, 154. [Google Scholar] [CrossRef] [Scilit]
- Ye, Z.; Lovell, L.; Faramarzi, A.; Ninic, J. Sam-based instance segmentation models for the automation of structural damage detection. Adv. Eng. Inform. 2024, 62, 102826. [Google Scholar] [CrossRef] [Scilit]
- Minh Dang, L.; Wang, H.; Li, Y.; Nguyen, L.Q.; Nguyen, T.N.; Song, H.K.; Moon, H. Deep learning-based masonry crack segmentation and real-life crack length measurement. Constr. Build. Mater. 2022, 359, 129438. [Google Scholar] [CrossRef] [Scilit]
- Ibrahim, Y.; Nagy, B.; Benedek, C. Deep Learning-Based Masonry Wall Image Analysis. Remote Sens. 2020, 12, 3918. [Google Scholar] [CrossRef] [Scilit]
- Pavoni, G.; Giuliani, F.; De Falco, A.; Corsini, M.; Ponchio, F.; Callieri, M.; Cignoni, P. On Assisting and Automatizing the Semantic Segmentation of Masonry Walls. J. Comput. Cult. Herit. 2022, 15, 1–17. [Google Scholar] [CrossRef] [Scilit]
- Loverdos, D.; Sarhosis, V. Automatic image-based brick segmentation and crack detection of masonry walls using machine learning. Autom. Constr. 2022, 140, 104389. [Google Scholar] [CrossRef] [Scilit]
- Vandenabeele, L.; Loverdos, D.; Pfister, M.; Sarhosis, V. Deep Learning for the Segmentation of Large-Scale Surveys of Historic Masonry: A New Tool for Building Archaeology Applied at the Basilica of St Anthony in Padua. Int. J. Archit. Herit. 2024, 18, 1749–1761. [Google Scholar] [CrossRef] [Scilit]
- Tong, X.; Zhang, C.; Zhou, J.; Sarno, L.D. Defect Augmented Heritage-BIM For Masonry Structures Leveraging Deep Learning-Based Segmentation. Int. J. Archit. Herit. 2026, 20, 1–21. [Google Scholar] [CrossRef] [Scilit]
- Gu, S.; Xu, S.; Gu, Y.; Jiang, G.; Ren, S.; Kong, C. Automated irregularity characterization and restoration prioritization for stone masonry heritage structures using image processing and deep learning. Results Eng. 2025, 28, 107099. [Google Scholar] [CrossRef] [Scilit]
- Fornaciari, L. AI and Deep Learning for Image-Based Segmentation of Ancient Masonry: A Digital Methodology for Mensiochronology of Roman Brick. Heritage 2025, 8, 241. [Google Scholar] [CrossRef] [Scilit]
- Xie, E.; Wang, W.; Yu, Z.; Anandkumar, A.; Álvarez, J.M.; Luo, P. SegFormer: Simple and Efficient Design for Semantic Segmentation with Transformers. arXiv 2021, arXiv:2105.15203. [Google Scholar] [CrossRef] [Scilit]
- Wang, G.; Zhou, J.; Lu, H.; Xu, Q.; Li, Z.; Huang, W.; Tan, G. Damage Detection and Safety Assessment for Historic-District Buildings Using a Semantic Segmentation Model. npj Herit. Sci. 2025, 13, 636. [Google Scholar] [CrossRef] [Scilit]
- Ali, S.; Abuhmed, T.; El-Sappagh, S.; Muhammad, K.; Alonso-Moral, J.M.; Confalonieri, R.; Guidotti, R.; Del Ser, J.; Díaz-Rodríguez, N.; Herrera, F. Explainable Artificial Intelligence (XAI): What we know and what is left to attain Trustworthy Artificial Intelligence. Inf. Fusion 2023, 99, 101805. [Google Scholar] [CrossRef] [Scilit]
- Tjoa, E.; Guan, C. A Survey on Explainable Artificial Intelligence (XAI): Toward Medical XAI. IEEE Trans. Neural Netw. Learn. Syst. 2021, 32, 4793–4813. [Google Scholar] [CrossRef] [Scilit] [PubMed]
- Samek, W.; Montavon, G.; Lapuschkin, S.; Anders, C.J.; Müller, K.R. Explaining Deep Neural Networks and Beyond: A Review of Methods and Applications. Proc. IEEE 2021, 109, 247–278. [Google Scholar] [CrossRef] [Scilit]
- Lapuschkin, S.; Wäldchen, S.; Binder, A.; Montavon, G.; Samek, W.; Müller, K.R. Unmasking Clever Hans Predictors and Assessing What Machines Really Learn. Nat. Commun. 2019, 10, 1096. [Google Scholar] [CrossRef] [Scilit] [PubMed]
- Fallahy, S.; Rezazadeh, N. MARBLE-DA: Masonry analysis with robust, batch-normalised, label-free, explainable domain adaptation for crack detection. J. Build. Eng. 2025, 116, 114673. [Google Scholar] [CrossRef] [Scilit]
- Zhou, Y.; Wang, Y.; Wang, R.; Zhang, W.; Yang, H. Automatic crack detection and segmentation of masonry structure based on deep learning network and edge detection. Structures 2025, 76, 108850. [Google Scholar] [CrossRef] [Scilit]
- Zaheer, Q.; Shah, S.F.H.; Shah, S.M.A.H.; Ai, C.; Wang, J.; Qiu, S. Efficient and Interpretable Image Processing Approach for Crack Segmentation. J. Infrastruct. Syst. 2026, 32, 04026003. [Google Scholar] [CrossRef] [Scilit]
- Buono, V.; Mashhadi, P.S.; Rahat, M.; Tiwari, P.; Byttner, S. Expected Grad-CAM: Towards gradient faithfulness. arXiv 2024, arXiv:2406.01274. [Google Scholar] [CrossRef] [Scilit]
- Alharbi, K.N. Explainable AI for Deep Visual Recognition: Evaluation, Methods, and Open Challenges. Electronics 2026, 15, 3222. [Google Scholar] [CrossRef] [Scilit]
- Selvaraju, R.R.; Das, A.; Vedantam, R.; Cogswell, M.; Parikh, D.; Batra, D. Grad-CAM: Why did you say that? Visual Explanations from Deep Networks via Gradient-based Localization. arXiv 2016, arXiv:1610.02391. [Google Scholar] [CrossRef] [Scilit]
- Vinogradova, K.; Dibrov, A.; Myers, G. Towards Interpretable Semantic Segmentation via Gradient-weighted Class Activation Mapping. arXiv 2020, arXiv:2002.11434. [Google Scholar] [CrossRef] [Scilit]
- Sundararajan, M.; Taly, A.; Yan, Q. Axiomatic Attribution for Deep Networks. arXiv 2017, arXiv:1703.01365. [Google Scholar] [CrossRef] [Scilit]
- Ribeiro, M.T.; Singh, S.; Guestrin, C. “Why Should I Trust You?”: Explaining the Predictions of Any Classifier. arXiv 2016, arXiv:1602.04938. [Google Scholar] [CrossRef] [Scilit]
- Alvarez-Melis, D.; Jaakkola, T.S. On the Robustness of Interpretability Methods. arXiv 2018, arXiv:1806.08049. [Google Scholar] [CrossRef] [Scilit]
- Adebayo, J.; Gilmer, J.; Muelly, M.; Goodfellow, I.J.; Hardt, M.; Kim, B. Sanity Checks for Saliency Maps. arXiv 2018, arXiv:1810.03292. [Google Scholar] [CrossRef] [Scilit]
- Turbé, H.; Bjelogrlic, M.; Lovis, C.; Mengaldo, G. Evaluation of Post-hoc Interpretability Methods in Time-Series Classification. Nat. Mach. Intell. 2023, 5, 250–260. [Google Scholar] [CrossRef] [Scilit]
- Retzlaff, C.O.; Angerschmid, A.; Saranti, A.; Schneeberger, D.; Röttger, R.; Müller, H.; Holzinger, A. Post-hoc vs ante-hoc explanations: xAI design guidelines for data scientists. Cogn. Syst. Res. 2024, 86, 101243. [Google Scholar] [CrossRef] [Scilit]
- Ye, Z.; Lovell, L.; Faramarzi, A.; Ninic, J. SAM-based instance segmentation models for the automation of structural damage detection. arXiv 2024, arXiv:2401.15266. [Google Scholar] [CrossRef] [Scilit]
- Huang, H.; Cai, Y.; Zhang, C.; Lu, Y.; Hammad, A.; Fan, L. Crack detection of masonry structure based on thermal and visible image fusion and semantic segmentation. Autom. Constr. 2024, 158, 105213. [Google Scholar] [CrossRef] [Scilit]
- Oktay, O.; Schlemper, J.; Folgoc, L.L.; Lee, M.C.H.; Heinrich, M.P.; Misawa, K.; Mori, K.; McDonagh, S.G.; Hammerla, N.Y.; Kainz, B.; et al. Attention U-Net: Learning Where to Look for the Pancreas. arXiv 2018, arXiv:1804.03999. [Google Scholar] [CrossRef] [Scilit]
- Zhou, Z.; Siddiquee, M.M.R.; Tajbakhsh, N.; Liang, J. UNet++: A Nested U-Net Architecture for Medical Image Segmentation. In Proceedings of the Deep Learning in Medical Image Analysis and Multimodal Learning for Clinical Decision Support; Lecture Notes in Computer Science; Springer: Cham, Switzerland, 2018; Volume 11045, pp. 3–11. [Google Scholar] [CrossRef] [Scilit] [PubMed]
- Akiba, T.; Sano, S.; Yanase, T.; Ohta, T.; Koyama, M. Optuna: A Next-generation Hyperparameter Optimization Framework. arXiv 2019, arXiv:1907.10902. [Google Scholar] [CrossRef] [Scilit]
- Achanta, R.; Shaji, A.; Smith, K.; Lucchi, A.; Fua, P.; Süsstrunk, S. SLIC Superpixels Compared to State-of-the-Art Superpixel Methods. IEEE Trans. Pattern Anal. Mach. Intell. 2012, 34, 2274–2282. [Google Scholar] [CrossRef] [Scilit] [PubMed]
- Cheng, Z.; Wu, Y.; Li, Y.; Cai, L.; Ihnaini, B. A Comprehensive Review of Explainable Artificial Intelligence (XAI) in Computer Vision. Sensors 2025, 25, 4166. [Google Scholar] [CrossRef] [Scilit] [PubMed]
- Krishna, S.; Han, T.; Gu, A.; Wu, S.; Jabbari, S.; Lakkaraju, H. The Disagreement Problem in Explainable Machine Learning: A Practitioner’s Perspective. arXiv 2025, arXiv:2202.01602. [Google Scholar] [CrossRef] [Scilit]
- Muhammad, D.; Bendechache, M. More than just a heatmap: Elevating XAI with rigorous evaluation metrics. Front. Med. Technol. 2025, 7, 1674343. [Google Scholar] [CrossRef] [Scilit] [PubMed]
- Karimi, A.H. Position: Explainable AI is Causality in Disguise. arXiv 2026, arXiv:2603.28597. [Google Scholar] [CrossRef] [Scilit]

Disclaimer/Publisher’s Note: The statements, opinions and data contained in all publications are solely those of the individual author(s) and contributor(s) and not of MDPI and/or the editor(s). MDPI and/or the editor(s) disclaim responsibility for any injury to people or property resulting from any ideas, methods, instructions or products referred to in the content. |
© 2026 by the authors. Licensee MDPI, Basel, Switzerland. This article is an open access article distributed under the terms and conditions of the Creative Commons Attribution (CC BY) license.