


Abstract
Accurate assessment of indoor thermal comfort is crucial for architectural design, particularly in Mediterranean regions, where seasonal and topographical variations lead to diverse indoor environmental conditions. There is a lack of understanding of indoor thermal comfort conditions associated with indoor environmental factors in different seasons and the topography in the Mediterranean region. To fill this gap, field measurements were taken in 92 mixed-mode residences evenly distributed in mountainous and coastal areas of Cyprus. Environmental factors were measured and evaluated using Predicted Mean Vote and Standard Effective Temperature, while regional differences of outcomes were assessed using independent-samples t-tests. The study revealed a season-dependent topographic effect on indoor thermal comfort conditions. Thermal evaluations differed significantly between topographic regions in summer but not in winter. In addition, the study identified the strongest regional differentiation among the environmental factors. The significant difference in air temperature and relative humidity during the summer measurement period coincided with significant difference in thermal comfort indices in different topographies, while the significant difference of relative humidity and airspeed did not accompany a significant change in thermal comfort in both regions during the winter measurement period. Therefore, the study suggested an empirical reference range for the designers to achieve indoor thermal neutrality across different combinations of indoor environmental factor conditions in the study area.
1. Introduction
The certainty in evaluation of indoor thermal comfort improves energy efficiency in buildings and enhances occupants’ indoor well-being [1,2]. An accurate evaluation of thermal comfort is essential for creating energy-efficient [3] and environmentally friendly buildings that enhance the well-being of occupants in different climatic conditions [4]. The rational method and the adaptive approach are two primary categories of thermal comfort evaluation models [5,6,7]. According to ref. [8], the rational approach is based on the body heat balance as a function of two occupant-related parameters (such as activity level and garment insulation). In addition, it depends on four environmental parameters (such as indoor air temperature, air velocity, relative humidity, and mean radiant temperature, MRT). The environmental combination is crucial in reaching the prediction of thermal comfort in a rational approach [3,5,8]. It encompasses PMV, SET, physiological equivalent temperature (PET), and the universal thermal climate index (UTCI).
The PMV and SET indices have been widely utilized in the study of indoor comfort, while PET and UTCI were developed for outdoor applications [9]. Hence, PMV and SET were selected to investigate thermal comfort inside the buildings in the current study.
The PMV-PPD system, as delineated in the American National Standards Institute—ANSI/ASHRAE Standard 55, is the most frequently acknowledged and utilized strategy [10]. This approach thoroughly considers both environmental and individual factors, with each category containing numerous quantifiable metrics [10,11]. Four environmental elements include air temperature (Ta), mean radiant temperature (MRT), air velocity (Va), and relative humidity (RH). In contrast, personal qualities, including activity level and garment insulation, are specified by ASHRAE-55 [10]. On a thermal perception scale, the PMV predicts the average of numerous votes. This approach is based on the notion that heat dynamics and cooperative interactions between the human body and its surroundings are the only ways in which the effects of the ambient environment are mediated [12]. On the other hand, the (SET) is characterized by an air temperature in a standard environment with a relative humidity of 50%, an air velocity of 0.1 m/s, and a radiant temperature equal to the air temperature [13]. In a normal setting, the thermal dissipation from the skin of an average individual engaged in an activity level of 1.0 met and wearing clothing rated at 0.6 clo is equivalent to that in the actual environment [10].
Despite the extensive use of PMV and SET, prior research has mostly examined these indices either separately or under generalized climate conditions. Only a small amount of research has looked into their combined applicability in Mediterranean residential buildings, taking into account topographic variability and its impact on indoor environmental conditions. As a result, the impact of Mediterranean topographic microclimates on the relative performance of PMV and SET is little studied.
Furthermore, it is yet unclear how much these indices complement or diverge in their ability to predict thermal comfort under such disparate conditions, and the effect of the environmental factors on the evaluation of thermal comfort. Consequently, PMV and SET were chosen to examine thermal comfort within the buildings in this study.
It is worthy to mention that the conventional methods to evaluate thermal comfort concentrate on controlling air temperature [14,15]. This method may not completely identify the complicated nature of evaluating thermal comfort, especially in regions with significant effects of radiation, natural ventilation, and humidity like Mediterranean regions [16]. Different studies examined the effect of topography on thermal comfort conditions [17,18,19]. One of the research studies focused on the effect of the elevation of the land on thermal comfort [3]. The effect of environmental factors on thermal comfort is complicated because it is changeable based on the microclimatic characteristics of the places [20,21].
This study combines PMV and SET to evaluate thermal comfort conditions in the different topographic areas within Mediterranean climates, which is different than previous studies that applied each of these two indices separately. Furthermore, the study investigates the behavior of environmental factors inside the buildings in different thermal scenarios within the study areas. Through these combinations and comparisons, the study tries to reach a more thorough framework for evaluating thermal comfort within Mediterranean climatic and microclimatic conditions. Because of the unique and variable characteristics of Mediterranean climates, with warm summers and mild winters, it is important to study ways to control thermal comfort in these climates. The buildings in Mediterranean climates are exposed to very high levels of solar irradiance and humidity. Therefore, the current study aims to enhance thermal comfort evaluation within microclimatic conditions in Mediterranean climates. This is by evaluating the model-based thermal comfort condition utilizing PMV and SET indices in different topographic regions in Cyprus and to examine the associated indoor environmental conditions. To achieve the aim, the study seeks to answer the following question: How does indoor thermal comfort change between different topographic regions in dwellings in Mediterranean climates, and how are changes in environmental factors associated with changes in thermal comfort indices? Moreover, how does the application of PMV and SET assist in predicting thermal comfort?
To implement this, the study compared PMV and SET to evaluate indoor thermal comfort in dwellings in coastal and mountainous regions within Mediterranean climates. Moreover, the interpretation of changes in the environmental factors within the buildings in the different topographic regions was investigated. The study examined the differences in thermal comfort indices and the environmental factors across topographic regions during summer and winter.
Hence, PMV and SET have been applied in combination to provide a complementary model-based evaluation of indoor thermal conditions. SET index has been utilized along with PMV because the former considers both indoor air speed and relative humidity more, which affect thermal comfort conditions for the occupants. These environmental factors change significantly with elevation and topography in the Mediterranean regions [22]. While the SET index adds a more realistic evaluation of comfort under shifting environments; the PMV index offers a standard baseline. This gives an understanding of thermal comfort conditions inside buildings based on the variation of topography and season, with practical guidelines for climate-responsive building design approaches in Mediterranean climates.
According to the predicted seasonal effect of topography, the study hypothesized that mountainous buildings would demonstrate lower PMV and SET values than coastal buildings during summer and vice versa for winter. In a similar way, Ta, MRT, Va, and RH were hypothesized to be lower in mountainous areas than coastal areas in summer, and the opposite pattern was expected in winter. These directional hypotheses were established prior to the statistical analysis.
Therefore, a total of 92 residences with diverse orientations were selected in mountainous and coastal regions, representing 46 buildings from mountainous and 46 from coastal regions, characterized by an elevation difference of 250 m in Kyrenia, Cyprus.
In the current study, the term thermal comfort refers to the model-based prediction of the human thermal comfort sensation responding to the indoor thermal comfort environment. Hence, terms like indoor thermal comfort or thermal comfort conditions are utilized as expressions referring to predicted human thermal responses within the investigated indoor environments, rather than comfort as a property of the dwellings or inner space.
2. Materials and Methods
This section covers the review of the literature, theoretical background and analysis, plus the research design and methods conducted to reach the results.
2.1. PMV and SET Indices
One popular rational-approach thermal comfort model is the Predicted Mean Vote (PMV) [15,23]. Nevertheless, PMV cannot completely account for how adaptations affect thermal comfort [24,25]. The progressive reduction of human reactions to repeated environmental stimuli is referred to as adaptation [26]. Accordingly, PMV has been known to exaggerate thermal discomfort in both warm and cold conditions, particularly for buildings with a free-running mode [25,27]. The PMV consistently overestimates the median perceived warmth of warmer environments and the coolness of colder ones. An almost needless additional cooling load may result from overestimating the observed warmth. Numerous investigations have verified the PMV’s inaccuracy and have shown that it is not always able to accurately predict occupants’ actual thermal sensation [24,25,28]. Inaccurate information regarding the building’s real thermal load requirement to maintain indoor thermal comfort conditions during the summer may result from employing the PMV during the design stage. Humphreys and Nicol investigated the PMV in naturally ventilated (NV), air-conditioned or active mode (AM), and mixed-mode (MM) buildings using a database with more than sixteen thousand records. The PMV errors were observed to rise as the thermal environment diverged from thermal neutrality [29], with mean disparities in cold and hot conditions surpassing two scales and one scale, respectively [30]. Another research study has utilized the extensive international thermal database of ASHRAE, and analogous results have been documented [31]. Ref. [32] examined the PMV’s behavior and discovered that, in warm, naturally ventilated spaces, the PMV overestimates people’s subjective feelings of warmth.
Additionally, ref. [29] contended that the PMV is only reliable for the daily evaluation of the comfort vote under extremely limited circumstances.
Many studies have sought to improve the accuracy of PMV by examining factors that affect the results [13,33,34,35]. It has also been tried to improve the accuracy of the PMV by performing linear regression between the PMV and the real thermal sensation vote (TSV) [24,31]. However, for dry or humid circumstances, ref. [36] substituted the standard effective temperature SET for the PMV’s operative temperature TO.
Nevertheless, the computation of (SET) is more complex than that of the (PMV), as it requires prior determination of physiological characteristics of the human body using the two-node model (2NM) of thermoregulation [37]. The dynamic two-node model partitions the body into two components: the core node and the skin node [38]. It addresses the transient thermal equilibrium of the body, stipulating that the rate of heat storage must equal the net heat gain minus the heat loss for both the core and skin nodes [39]. It monitors the thermal exchange between the core body and the skin; this is not required for the computation of PMV [40].
Furthermore, SET mandates that skin temperature and skin wetness in the standard environment match those in the actual environment [41]. Ref. [10] provides specifics regarding the body’s heat balance using the two-node model. In AM buildings [42] and NV buildings [43], the SET has been widely utilized to assess indoor thermal comfort for the sleeping scenario [44], sedentary scenario [45], and transitory situation [46].
The SET’s computation of the heat exchange between the environment and the human body follows the same methodology as PMV [39]. The two primary characteristics that distinguish SET from PMV are: First, unlike PMV, which was designed for a steady-state environment, SET can be used in dynamic conditions. Secondly, unlike PMV, which is unable to predict the body’s physiological response, SET can predict the body’s skin temperature and moisture content [13]. Nevertheless, the application of the SET index requires detailed physiological inputs and is highly sensitive to air velocity and relative humidity measurements, thereby increasing uncertainty in field studies.
Even though the SET model accounts for multiple characteristics and demonstrates reasonable accuracy at rest and during modest exercise intensity, the validity of its calculation approach and the constraints of its relevant circumstances undermine its practicality and precision. Ref. [41] found that the SET model’s thermal-feeling predictions are less accurate at high activity intensities than at low exercise intensities. Moreover, ref. [45] discovered that assessing human thermal comfort in a hot and humid environment yields skewed results for SET if the body’s thermal tolerance to humidity is not accounted for, leading to the proposal of a humidity adjustment coefficient. It is important to mention that [47] employed an adaptive technique to modify SET, although this method addressed only a portion of the thermal adaptation issue, resulting in an error rate of around 25% in the updated SET for actual thermal comfort prediction. Therefore, the previous studies demonstrate that SET is still inapplicable in many conditions.
Although the wide use of these two indices (PMV and SET) is common, the previous review of the literature demonstrated that both indices have deficiencies in the evaluation of thermal comfort. Building on previous observations, the present study will employ both PMV and SET methodologies to provide complementary model-based assessments of indoor thermal conditions.
2.2. The Effects of Topographic Characteristics on Indoor Environment in the Study Area
Ref. [10] reported that, regarding climatic circumstances, the appropriate ambient temperature for comfort is somewhat elevated in the summer (23–27 °C) compared to winter (20–25 °C). Nonetheless, this is a broad assertion, and earlier research indicated that the comfort range may differ across various geographic regions [48,49].
The Mediterranean climate is characterized by hot, dry summers and moderate, rainy winters, which makes it difficult to provide thermal comfort in buildings [50].
The most common locations for this climatic type are those that border the Mediterranean Sea. The Mediterranean climate is classified as Csa/Csb, a distinct subtropical climate, according to the Koppen classification [51]. Within the extensive Mediterranean climate classification, the microclimate varies across coastal and highland regions [52]. Characteristics such as high levels of solar radiation, relative humidity, natural ventilation, and temperature fluctuations make these factors even more crucial to consider when designing an architectural structure [53]. According to [10,11], each of these environmental characteristics changes the dynamics of thermal comfort inside the building. Numerous recent studies have validated that warming rates are influenced by altitude [54]. The sun’s rays are stronger in mountainous regions [55]. Altitude and distance from the shore have a major impact on relative humidity [56]. These factors also affect wind speed [57] and air temperature [58].
A different investigation conducted in Cyprus yielded similar results [59]. Therefore, Mediterranean locations are especially sensitive to judgments about building design due to their climatic characteristics. Consequently, the influence of topography must be examined and understood when indoor thermal comfort is the objective.
Cyprus is located between latitudes 34° and 36° North and longitudes 32° and 34.5° East in the Eastern Mediterranean basin, as seen in Figure 1. According to the Köppen-Geiger climate classification, Cyprus has a mostly subtropical climate (Csa); the northeastern portion of the island experiences a somewhat arid environment (Bsh) [60]. With long, hot-to-dry summers and cold-to-mild, rainy winters, Cyprus has a typical Eastern Mediterranean climate [61]. Wintertime humidity ranges from 65% to 95% both during the day and at night. Different parts of Cyprus have subtle climate influences due to its diverse topography [59]. As a result, these factors need to be taken into account when evaluating a building’s thermal comfort [59].
Figure 1.
The topographical representation of Kyrenia (the study area) within Cyprus topographic map [3].
Cyprus covers an area of 9251 square kilometers, with a maximum east–west extension of 225 km and a maximum north–south extension of 90 km [62]. In January, the average daily temperature in the central plains is 10 °C, while in the mountains it is 3 °C. The average minimum temperature ranges between 0 and 5 °C. The average maximum temperature in July and August ranges from 27 to 36 °C, while the average daily temperature in the plains and mountains ranges from 22 to 29 °C [63].
The duration of a day in Cyprus ranges from 9.8 h in December to 14.5 h in June. It has hot summers and pleasant winters; however, this generalization is altered when one takes into account the geography, altitude, and sea effects, which result in colder summers and milder winters, with a temperature drop of around 5 °C every 1000 m [3,64]. In Cyprus, there are significant variations between daytime highs and nighttime lows, particularly in inland regions during the summer. In the winter, these daily variations are 10 °C in the lowlands and 5–6 °C in the highlands; in the summer, they rise to 16 °C in the middle plain and 9–12 °C elsewhere [59]. There is an average of 11.5 h of intense sunshine every day over the whole summer (6 months), but just 5.5 h during the cloudiest months of December and January during the winter [63].
Kyrenia, the current study area, is located in the middle of the island on Cyprus’ northern shore, at 35.34° North latitude and 33.32° East longitude. January is the coldest month, with an average temperature of 10 °C, while July is the warmest, with an average temperature of 29 °C [65]. Rainfall in the mountainous regions ranges from 500 to 750 mm, with intermittent winter and summer showers. Due to their altitude, the Kyrenia Mountains receive the most rainfall, ranging from 750 to 1110 mm [64]. The elevation of Kyrenia ranges from 2.5 m above sea level in the northern coastal area to approximately 300 m on the slopes of the Kyrenia Mountain Range, which reaches 1000 m above sea level, also known as the Beshbarmak (Five Finger Mountains) in the southern part [66]. Based on this region and its characteristics, the current research selected specific methods and tools to be applied to a selective case study of residences in the areas of the study.
2.3. Research Design and Case Study Selection
To examine indoor thermal comfort in Mediterranean dwellings across different geographic microclimates, a quantitative case study methodology was used. The PMV and SET indices were used in the study because they are two of the most often used and globally recognized metrics for evaluating indoor thermal comfort, as mentioned previously. Convenience sampling was used to choose current residences, which was deemed suitable due to occupancy, accessibility, and the practical needs of field measurements. Systematic in situ observations and environmental measurements were used to collect data, enabling the simultaneous evaluation of thermal comfort and indoor thermal conditions.
To assess seasonal and topographic differences in interior environmental conditions and thermal comfort between coastal and highland residential dwellings, the study used a comparative analytical approach. Thermal comfort indices (PMV and SET) and internal environmental factors (Ta, MRT, RH, and Va) were compared between coastal and mountainous (northern slope) residential buildings in the summer and winter using independent-samples t-tests. The 95% confidence level (p < 0.05) was used to evaluate statistical significance. Across the two topographic locations, the environmental factors associated with neutral thermal conditions were examined. The assumption of normality and homogeneity of variance were examined. Where unequal variances were identified, Welch’s t-test was used as a robustness check, which did not alter the principal statistical conclusion. Additionally, to identify the traits that lead to comparable judgments of thermal comfort, this analytical method helps build climate-responsive residential design solutions for Mediterranean locations and improves our understanding of how topography affects indoor thermal conditions. Figure 2 demonstrates the methodological framework in the current study.
Figure 2.
Methodological framework used in the study.
The study was carried out in the Kyrenia region, Cyprus, chosen for its varied topography, including both coastal and highland settings, and its typical Mediterranean climate. A variety of residential typologies, like apartment buildings, detached homes, and semi-detached homes, were represented by the 92 inhabited residential units examined. With 46 dwellings chosen from each of the two topographic areas, the sample was split evenly between them. In the current study, altitudes between 2.5 and 30 m above mean sea level (AMSL) were considered coastal zones, whereas heights between 150 and 300 m AMSL were considered mountainous (northern slope) areas; see Figure 3.
Figure 3.
The mountainous and coastal urban areas of Kyrenia on the topographic map of Cyprus [67].
Only dwellings’ ground and first floors of dwellings were included in the study to reduce the impact of building height on internal environmental conditions. All the chosen residences had mixed-mode (MM) ventilation, in which mechanical heating or cooling systems were added to natural ventilation as needed. The selected case studies were observed under their normal daily living and operational conditions. While an air conditioner or heater was operational during winter observations, at least one active cooling system (fan or air conditioner) was in use during summer measurements.
The typical extreme seasons of the Mediterranean climate, August 2025 (summer) and January 2025 (winter), were used for field measurements. Measurements were made between 10:30 and 14:30, when indoor thermal comfort conditions are most influenced by solar radiation, shade, wind speed, and relative humidity. The examination of the combined impact of environmental and climatic factors on occupants’ thermal comfort was achieved during this observation period. The measurements were taken in the living rooms, since they are the main areas where household members spend most of their daily activities.
The current study has followed the internationally accepted thermal comfort measurement guidelines [10]; globe temperature (Tg) measurements used to calculate mean radiant temperature (MRT) were taken at a height of 1.0–1.25 m above the finished floor level and at least 1.5 m away from walls and windows to guarantee measurement consistency and reduce the effects of vertical temperature stratification. To give the equipment time to attain temperature equilibrium with the inside environment before taking measurements, each monitoring session lasted between 15 and 25 min. To improve the consistency and dependability of the information gathered, further observations were made at every residence.
2.3.1. Thermal Comfort Assessment and Measurement Procedure
The evaluation of thermal comfort was approached through the application of the Center for the Built Environment (CBE) thermal comfort tool (Version 2.5.6) by [68]. Through this application, the study assessed PMV and SET indices, which are widely applied in predicting indoor thermal comfort. This application utilizes four environmental factors and two personal factors in the evaluation process. Obtaining the field data was through measuring environmental factors and calculating MRT from globe temperature using a 40 mm diameter globe thermometer, whereas Ta and RH were obtained using an interior weather station. In the same context, Va was measured through a calibrated anemometer. These field measurements were taken in the living rooms of the selected units.
Based on ASHRAE Standard 55, the personal factors like activity levels and clothing insulation level were considered 1.0 met and 0.5 clo, respectively, for the summer, and 1.0 met and 1.0 clo for the winter. The activity level was estimated as corresponding to sedentary activities like quietly sitting, which reflects the activity of occupants during the observation times. The utilized values of Met and Clo were standardized assumptions applied consistently across observations rather than values individually measured for each occupant; see Table 1.
Table 1.
Environmental and personal factors, measuring tools, and standardized input parameters utilized to calculate PMV and SET using the CBE Thermal Comfort Tool Version: 2.5.6.
In the current study, the term thermal neutrality was defined as a range around the neutral point on the PMV thermal evaluation scale rather than a single fixed value. The observations between −0.5 ≤ PMV ≤ +0.5 were categorized as neutral thermal conditions.
2.3.2. Sampling Strategy
A convenience sampling technique was conducted, taking into consideration the realistic difficulties of accessibility inside the dwelling units and the willingness of inhabitants to participate. Nevertheless, 92 residential units were covered during this study. Those units were divided evenly between two topographic regions (mountains and coastal areas) within Mediterranean climates. Hence, 46 dwellings were selected from the mountainous area and the same number in the coastal area.
Different typologies of residential units were covered, including apartments, detached and semi-detached houses, and villas, as seen in Figure 4.
Figure 4.
Samples of the selected residential units in mountainous and coastal areas in the Kyrenia region.
The size of the sample complies with the previous thermal comfort field investigations, which demonstrate that approximately 30 to 50 observation units per group give trustworthy statistical confidence for reliable assessment of thermal comfort and also provide a strong comparative analysis level in field studies [69]. The same number of samples in different topographic areas allows a confidential statistic comparison.
3. Results
The finding formulated based on 184 field observation sets conducted in 92 residential buildings. Each of these buildings was evaluated twice in the winter (January) and in the summer (August). Each observation set included measuring the environmental factors inside the buildings, which are Ta, Tg, Rh, and Va. Those measurements were gathered and applied in calculating MRT to reach PMV and SET thermal comfort standards. Independent-samples t-tests were provided to examine the locational environmental differences and identify the effect of topographical differences on the Mediterranean buildings’ indoor thermal comfort situation in both coastal and mountain regions. For this purpose, seasonal sampling was used. Additionally, the observations were classified as neutral, slightly warm, or slightly cool separately. Cohen’s d was used to interpret effect sizes; around 0.20, 0.50, and 0.80 denote modest, medium, and large effects, respectively.
3.1. Summer Thermal Conditions
3.1.1. Overall Comparison Between Coastal and Mountainous Residential Units
The summer results showed considerable geographic variations in both thermal comfort indices. PMV was substantially different between coastal and mountainous residences, t(90) = 3.17, p = 0.001, with a moderate effect size (d = 0.66). SET also differed substantially, t(90) = 2.77, p = 0.003, with a moderate effect size (d = 0.58). These findings suggest that the topographic position influences both the expected thermal feeling represented by PMV and the comparable physiological temperature indicated by SET. RH had the greatest regional variation among environmental factors (t(90) = 10.27, p < 0.001) and a substantial effect size (d = 2.14). Air temperature also differed considerably, t(90) = 2.50, p = 0.007, but the impact was mild (d = 0.52). There were no significant regional differences found for air velocity (t(90) = −0.61, p = 0.271) or MRT (t(90) = 0.32, p = 0.375), since both variables had minor impact sizes. Thus, the summer difference in thermal comfort was connected mostly with RH and, to a lesser extent, air temperature, rather than with air movement or radiant heat; see Table 2.
Table 2.
Regional comparisons through environmental factors and thermal comfort indices in summer.
3.1.2. Summer Neutral-Comfort Observations
PMV and SET did not substantially differ between the two areas when the analysis was limited to data categorized within the neutral PMV range. PMV yielded t(59) = −0.07, p = 0.473, d = 0.02, whereas SET yielded t(59) = −0.10, p = 0.461, d = 0.03. These insignificant impacts show that the two indices indicated very similar comfort levels in coastal and mountainous buildings once neutral thermal conditions were reached. However, there were differences in the environmental circumstances that led to neutrality. With a very strong impact (d = 2.08), RH remained significantly different (t(59) = 7.98, p < 0.001). Additionally, there was a significant difference in MRT (t(59) = −2.13, p = 0.019), with a modest impact (d = 0.55). Ta and Va showed no discernible variations. As a result, under various combinations of humidity and radiation conditions, comparable neutral PMV and SET results were obtained. This result suggests that different topographic locations may not always require the same environmental conditions to achieve thermal neutrality; see Table 3.
Table 3.
Summertime comparison based on the category of thermal condition.
3.1.3. Slightly Warm Summer Observations
PMV varied considerably between the locations for observations that were categorized as slightly warm (t(27) = 1.91, p = 0.034), with a high effect size (d = 0.79). SET, on the other hand, did not vary substantially (t(27) = 0.96, p = 0.173, d = 0.40). Once more, RH generated the greatest environmental difference (t(27) = 4.70, p < 0.001, d = 1.95). Although Va did not achieve the chosen significance threshold, it did have a substantial effect size (d = 0.64); Ta, Va, and MRT were not statistically distinct, as seen in Table 3. This finding implies that in slightly warm settings, a small divergence between PMV and SET despite significant differences in RH in both regions.
3.2. Winter Thermal Conditions
3.2.1. An Overall Comparison of Dwellings in Mountainous and Coastal Regions
There was no statistically significant difference between coastal and mountainous residences in either PMV or SET. Whereas SET produced t(90) = 1.05, p = 0.148, d = 0.22, the PMV comparison produced t(90) = 1.39, p = 0.084, d = 0.29. As a result, the two indices’ representations of the general winter temperature conditions in the two locations were generally similar. RH continued to be substantially different from the other environmental factors (t(90) = 6.95, p < 0.001), with a high effect size (d = 1.45). Va also showed a modest impact (d = 0.64) and a significant difference (t(90) = 3.07, p = 0.001). Ta and MRT showed no discernible variations, and their impact sizes were insignificant. These results demonstrate that regional differences in airflow and winter humidity did not produce statistically significant PMV or SET values; see Table 4.
Table 4.
Wintertime thermal comfort indices and environmental factors compared by region.
3.2.2. Neutral-Comfort Observations for Winter
PMV and SET once more demonstrated no noticeable regional variations within the neutral winter category. SET produced t(46) = −0.01, p = 0.498, d = 0.00, whereas PMV produced t(46) = 0.40, p = 0.344, d = 0.12. The SET zero effect suggests that, among neutral observations, the two areas’ SET results are almost equal. The only variable with a significant difference (t(46) = 7.78, p < 0.001) and a relatively substantial effect size (d = 2.26) was RH. There was little difference between Ta, Va, and MRT. As a result, neutral winter comfort was preserved with significantly varying humidity levels without matching geographical variations in PMV or SET; see Table 5.
Table 5.
Winter comparison based on thermal condition category.
3.2.3. Winter Observations for Slightly Cool Conditions
For the slightly cool group, there was no significant difference in PMV or SET between coastal and mountainous residences. PMV generated t(41) = 0.17, p = 0.434, d = 0.05, whereas SET produced t(41) = −0.26, p = 0.399, d = 0.08. RH showed a significant difference, t(41) = 4.98, p < 0.001, with a substantial effect size (d = 1.53). Va had a substantial and large regional difference, t(41) = 4.03, p < 0.001, d = 1.24. Ta and MRT remained statistically similar, as seen in Table 5. As a result, the somewhat cool classifications remained steady despite significant regional changes in humidity and air movement.
3.2.4. Thermal Comfort Conditions Based on Seasonal Distribution
The distribution of PMV thermal sensation categories showed significant seasonal changes between coastal and highland locales (see Table 6). During the summer, 36 of the 46 mountain residences (78%) were classed as neutral, compared to 25 coastal dwellings (54%). In contrast, fairly warm conditions were reported in 21 coastal residences (46%), but just eight mountainous dwellings (17%). Furthermore, two mountainous residences (4%) were classed as slightly cool, but no coastal dwellings fell into this group. Given their modest percentage, these slightly cool occurrences had an insignificant impact on the general regional thermal comfort pattern, which remained dominated by neutral and slightly warm circumstances. Overall, the mountainous region had a greater proportion of neutral conditions and fewer warm-discomfort instances, suggesting better summer thermal performance. This descriptive characteristic is consistent with the statistically significant geographical variations seen for PMV and SET throughout the summer.
Table 6.
Seasonal categorization of PMV thermal comfort conditions.
During the winter, the distribution moved to colder thermal feelings. Neutral conditions were found in 27 coastal houses (59%) and 21 mountainous dwellings (46%), with somewhat cool conditions found in 19 coastal buildings (41%) and 24 mountainous dwellings (52%). One mountainous dwelling (2.2%) was classified as cool and was excluded from the slightly cool subgroup analysis, resulting in a subgroup sample of 43 observations. Although neutral conditions were more common in the coastal region, the independent-samples t-test found no statistically significant regional differences in PMV or SET during winter, suggesting both regions provided comparable thermal comfort despite differences in humidity and air movement.
3.3. Relationship Between SET and PMV
To further investigate the association between PMV and SET, we categorized observed SET values according to the relevant PMV thermal condition categories for both coastal and mountainous dwellings (Table 7). This comparison converts the PMV thermal evaluation scale into practical interior temperature ranges represented by SET, providing a more interpretable framework for model-based assessing of thermal comfort under Mediterranean climate conditions.
Table 7.
Observed environmental and SET ranges associated with PMV thermal categories across different topographic regions.
In the coastal region, neutral thermal sensitivity (PMV = −0.5 to +0.5) corresponds to SET ranges of 23.2–25.9 °C in winter and 23.2–26.6 °C in summer. Cool discomfort (PMV < −0.5) was seen between 20.4 and 23.2 °C, whereas heated discomfort (PMV > +0.5) was related to SET values ranging from 26.6 to 29.9 °C. In the mountainous terrain, neutral comfort was defined as 23.5–24.8 °C in winter and 23.4–26.6 °C in summer. Slightly Cool discomfort was recorded between 20.8 and 23.5 °C, whereas slightly warm occurred between 26.14 and 27.7 °C.
The comparison shows that, whereas PMV rated both places using the same thermal sensation categories, the associated SET values differed slightly by season and topographic location. The neutral summer SET ranges were fairly comparable in both areas, with a shared maximum limit of 26.6 °C, but winter neutrality filled a shorter temperature span, particularly in mountainous residences. Similarly, the warm-discomfort threshold began at 26.6 °C in the coastal region but fell within a narrower temperature range in the mountainous region. These findings suggest that PMV alone detects occupants’ thermal condition, but SET augments PMV by expressing the underlying physiological condition as an equivalent interior temperature.
Regarding the environmental factors, the results revealed different seasonal and topographic scenarios. In summer, under neutral thermal comfort conditions, buildings located in the mountains tolerated a broader range of indoor Ta (24.1–28.9 °C) than the ones in the coastal buildings (24.9–27.4 °C). At the same time, RH in the mountainous buildings was lower (38–58% vs. 50–75%) than in the coastal buildings. Indoor air speeds were relatively similar in both regions (0.05–0.16 m/s) for mountainous areas and (0.04–0.18 m/s) in coastal areas. In the same context, neutrality in both regions in summer demonstrated a wider range in coastal areas (22.1–27.4 °C), with a lower upper limit than mountainous areas (23.1–27.8 °C). Nevertheless, despite the different ranges of the environmental factors between both regions, the upper neutral SET limit was the same, 26.6 °C. In the neutral conditions of the winter season, the range of the temperature range was narrower for Ta and MRT, especially in the mountainous region; at the same time, in the coastal buildings, the RH was higher (61–79%) than in the mountains (58–67%). Away from neutral thermal conditions, the slightly cool conditions were attributed to lower Ta and MRT in both regions. Slightly warm thermal conditions were attributed to higher humidity levels in the coastal residences (54–73%) than in the mountainous ones (43–62%). The previous results demonstrate that similar thermal comfort levels can occur in different environmental conditions.
These values help the designers to utilize these environmental ranges to achieve the threshold of thermal comfort.
To understand the relationship between PMV and SET, the analyses of Pearson correlation and linear regression were provided for summer and winter measurements. A high positive correlation was observed between the two indices in winter (r = 0.972, R2 = 0.944, p ˂ 0.001), while in summer (r = 0.970, R2 = 0.941, p ˂ 0.001). The regression equations were SET = 24.788 + 3.348 (PMV) for winter period and SET = 25.420 + 3.008 (PMV) for summer period, as seen in Figure 5.
Figure 5.
The correlation of PMV and SET in (a) winter and (b) summer observations.
Thus, this correlation of PMV with SET offers a more holistic understanding of indoor thermal comfort conditions by correlating subjective thermal perception with quantifiable temperature intervals. This integrated method provides practical temperature thresholds that can aid in climate-responsive residential building design and the implementation of model-based thermal comfort assessment in Mediterranean regions.
3.4. Overview of the Findings
Significant regional differences in indoor thermal comfort were found across topographic region in summer, but regional differences were less noticeable in the winter. Mountainous buildings had a much larger proportion of neutral thermal conditions and fewer warm-discomfort instances than coastal dwellings in summer, demonstrating elevation’s moderating effect on interior environmental conditions. Although two mountainous houses (4%) were classed as slightly cool throughout the summer, these isolated examples had little effect on the general thermal comfort pattern, which was nonetheless dominated by neutral circumstances.
While Cohen’s d showed that relative humidity generated the strongest regional effect, the independent-samples t-tests revealed significant regional variations in PMV and SET during summer but not during winter. Additionally, the integration of PMV with the measured SET ranges showed that, depending on the season and topographic location, the same thermal sensation categories correlated with somewhat varied equivalent temperature ranges.
4. Discussion
This study used the PMV and SET indices to assess indoor thermal comfort conditions in Mediterranean dwellings in coastal and mountainous (northern slope) locations. In addition, the study identified the range of environmental factors inside the residential buildings for both regions in their different thermal comfort conditions, as empirical reference ranges. Unlike many earlier studies, which evaluated only one climatic region or a single thermal comfort index, the current study examined two distinct Mediterranean topographic settings spanning summer and winter, using similar measurement techniques. The data show considerable differences in indoor environmental condition between studied topographic regions during the summer. However, these differences were diminished during the winter, despite the significant differences in some environmental factors. Furthermore, whereas PMV and SET gave broadly identical thermal comfort ratings, their combined use allowed for a more thorough interpretation of the indoor thermal environment by tying objective thermal evaluation to physiological temperature equivalents, with identification of proper environmental factor ranges to reach the thermal comfort threshold. These findings support climate-responsive dwelling design in Mediterranean regions.
4.1. Thermal Comfort and Environmental Differences Between Topographic Regions
As mentioned previously, one of the study’s key findings was that topographic areas had a significant impact on indoor thermal comfort condition throughout the summer. Residential buildings in the mountains had much lower PMV, SET, air temperature, and relative humidity than those on the coast, resulting in a far larger proportion of neutral thermal prediction (78% versus 54% in the coastal region). These findings suggest that elevation and related microclimatic factors might naturally alter indoor thermal conditions within the Mediterranean climate zone.
This finding is consistent with prior research revealing that altitude alters local climatic conditions by lowering ambient air temperature, changing sun exposure, and increasing air movement, according to Byrne and O’Gorman (2016) [56], Miller and Davenport (1998) [57], and Thapa (2020) [58]. Pepin et al. (2015) [55] found that mountain climates had lower temperatures and unique atmospheric features than surrounding lowland locations, while Barry (2008) [70] stressed the importance of elevation on local climatic variability. Ref. [59] found that naturally ventilated residential structures in Cyprus have significant seasonal fluctuations in thermal comfort related to local climatic variables. However, much research concentrated on external climate or unique metropolitan areas rather than directly comparing indoor thermal comfort conditions across geographical regions.
The study assessed the role of environmental factors on model-based thermal assessment utilizing PMV, SET, and independent-samples t-tests. This distinction is significant because building occupants are more directly exposed to the indoor environment than to external climatic variables.
Figure 6 illustrates what is the role of environmental factors in changes in indoor thermal comfort between mountainous and coastal regions, based on the significant changes associated with topographic differences.
Figure 6.
The roles of environmental factors in changing thermal comfort inside buildings in mountainous and coastal areas in both seasons.
In summer, the difference between topographic regions made a significant change in PMV and SET inside the buildings, along with significant changes in two environmental factors, which are indoor air temperature and relative humidity, while mean radiant temperature and airspeed showed insignificant changes. This indicates the effective roles of indoor air temperature and relative humidity on indoor thermal comfort in this season. In winter, the scenario was different, where significant differences appeared in relative humidity and airspeed in both regions, whereas no significant difference appeared in air temperature and MRT based on the statistical analysis of the independent-samples t-test. However, the statistical analysis demonstrated that there is no significant difference in the winter in PMV and SET between both regions, and this shows that the effective environmental factors that showed significant differences between both regions did not have effective roles in indoor thermal comfort conditions.
This result indicates that, under the winter conditions, topographic variation impacted specific indoor environmental factors like RH and Va, but did not have a significant role in the total thermal comfort level. However, several studies emphasized the role of environmental factors in changing thermal comfort level like de Dear and Brager (2002) [32]. Luo et al. (2015) [71] found that occupants’ thermal feelings change significantly with naturally ventilated and air-conditioned operation in mixed-mode buildings. Jia et al. (2020) [72] found that controlling indoor environmental factors through building operating mode influenced the thermal comfort models in mixed-mode environments. While topographic variation significantly altered indoor environmental factors like RH and Va, their impact was insignificant in this season; see Table 4.
The current study shows that the effect of specific environmental factors on occupants’ overall thermal comfort was statistically significant only in the summer, and those were Ta and RH, whereas winter conditions produced comparable PMV and SET responses despite measurable environmental differences in RH and Va. This finding contributes to current knowledge by demonstrating the role of environmental factors on indoor thermal comfort conditions in Mediterranean mixed-mode residential buildings associated with season and different topographies. Thus, this outcome should be considered alongside seasonal building operation when developing climate-responsive residential design strategies.
4.2. PMV and SET’s Complementary Roles in Evaluating Thermal Comfort
A more comprehensible framework for model-based assessment of thermal comfort in Mediterranean climatic conditions is produced by integrating both SET and the PMV, which transforms the thermal evaluation scale into useful interior temperature ranges indicated by SET. For example, the neutral thermal condition inside the residential buildings in the mountainous region in summer ranges between 23.4 and 26.6 °C, as indicated by SET; see Table 7.
Despite the slight divergence in (slightly warm) thermal conditions during the summer between SET and PMV, the study found consistent results between them in predicting indoor thermal comfort in both topographic regions within Mediterranean climates. Both methods resulted in more neutral thermal conditions in the mountainous area in summer. However, the results from both indices did not demonstrate significant variation in total thermal comfort conditions between the two regions in winter, as there were no significant differences between model-based thermal comfort evaluations in both regions in winter. However, the results demonstrate a slight difference under slightly warm summer conditions, as PMV appeared more responsive than SET, when PMV detected a significant regional difference in thermal comfort in mountainous and coastal buildings, while SET did not, as seen in Table 3. SET did not demonstrate a significant difference in different topographies despite the significant difference in RH and Va in both topographic regions. This condition-dependent divergence requires further investigation into how the interaction of RH and Va with other environmental factors influences SET under slightly warm thermal conditions.
Generally, PMV and SET have been evaluated separately in previous studies inside buildings in different climatic conditions, highlighting their strength and weaknesses; Cheung et al. (2019) [30], Gagge et al. (1986) [36], Fanger (1970) [73], de Dear et al. (2013) [74]. However, the current study integrated both of the indices to evaluate thermal comfort in mixed-mode dwellings through coastal and mountainous Mediterranean topographic areas. This method aims to obtain more credible model-based thermal evaluations and more comprehensive results about thermal comfort conditions in the study area. Commonly, PMV and SET have demonstrated consistent evaluations of seasonal thermal comfort, despite a small divergence that has been observed under slightly warm conditions in summer. This result shows complementarity rather than differences.
4.3. Empirical Reference Range for Design
Based on the outcomes of the field observations and environmental factors evaluation, along with neutral thermal comfort evaluation through SET and PMV, this study provided an empirical reference for the designers. It demonstrates the neutral thermal comfort level across different combinations of environmental conditions.
For summer, the indoor neutral thermal condition in the coastal dwellings was between 24.9 and 27.4 °C, combined with an indoor temperature range between 24.9 °C and 27.4 °C. While the relative humidity range was 50–75%, the indoor airspeed was 0.04–0.18 m/s, and the mean radiant temperature range was 22.1–27.4 °C. In the mountainous dwellings, the neutrality demonstrated different environmental factor combination ranges. The Ta range was (24.1–28.9 °C), the RH range (38–58%), Va was between 0.05 m/s and 0.16 m/s, and the MRT range (23.1–27.8 °C).
In winter, the neutrality in the coastal region is combined with environmental factor ranges of values. The indoor temperature was (20.9–23 °C), RH was (61–79%), whereas Va was (0–0.02 m/s), and MRT was (20–22.5 °C). At the same time, the mountainous dwellings in the indoor neutral thermal condition recorded the following ranges for the environmental factors inside the buildings: indoor temperature range (21.2–22.3 °C), relative humidity range (58–67%), Va was zero, and MRT was between 20.5 °C and 21.9 °C; see Table 7.
The environmental ranges related to the neutral thermal condition demonstrate empirical values that support environmental design in residential buildings in the region of study. These ranges of the observations suggest context-specific reference information for climatic designers. Also, the environmental parameters interact; they should be considered collectively rather than as independent or universally applicable design thresholds; see Table 8.
Table 8.
The observed environmental ranges associated with PMV-neutral category in the sampled dwellings in the study region.
These observed ranges characterize the combinations of Ta, Va, Rh, and MRT associated with neutral thermal conditions in the buildings of the study area. Therefore, the designers can take these ranges as a reference when evaluating environmental design strategies in coastal and mountainous dwellings.
5. Conclusions
This research has investigated the effect of topography in the Mediterranean climate on thermal comfort inside residential buildings and evaluated the efficiency of combining the PMV and SET indices and their applicability in the field of building environmental design. In contrast to several other investigations that focused just on a particular climatic zone or a specific thermal comfort metric, the present research analyzed two unique Mediterranean topographical environments throughout both summer and winter.
Different studies showed that different topographic elevations, which are the northern slope, have significant changes in air temperature and lead to noticeable differences in thermal conditions [75]. However, the results of the current study demonstrated that there is a significant effect of topography on thermal comfort conditions inside buildings, especially in the summer. Mountain dwellings exhibited significantly reduced PMV, SET, air temperature, and relative humidity compared to coastal buildings, leading to a considerably higher percentage of neutral thermal predictions (78% versus 54% in coastal areas). In the winter, thermal comfort did not change significantly and remained consistent in the mountains and coastal areas, leading to a smaller difference in achieving indoor neutrality (57% inside the buildings in both coastal regions versus 46% in the mountainous regions); see Table 6.
Based on the independent-samples t-test for both regions in both seasons, the findings show that topography significantly influences indoor thermal comfort in summer, whereas in winter, thermal comfort remains consistent, and the difference was not significant in mountainous and coastal areas, despite differing environmental factors. Hence, the study concluded that the influence of topography on indoor thermal comfort varies with the seasons rather than staying uniform year-round.
Moreover, the study found that some environmental factors change dramatically inside the buildings, and some of them change insignificantly based on statistical analyses such as independent samples t-tests. Therefore, the results showed significant regional differences in thermal comfort indices during the summer, but not in winter, in different topographic regions. The significant and not significant differences in these factors were analyzed. The current outcome contributes to the body of knowledge by statistically demonstrating that, despite the effects of topography on environmental factors inside the buildings in both seasons, significant differences across topographic regions were observed in summer rather than winter; see Figure 6.
The seasonal variation in topographic effects indicates that uniform thermal comfort strategies should not be applied across coastal and mountainous locations. In particular, the stronger summer discomfort and environmental differences observed in coastal dwellings suggest that summer design strategies should give greater attention to controlling both heat and indoor humidity. In contrast, the absence of significant regional differences in PMV and SET during winter indicates that topographic location alone may not require substantially different winter comfort strategies. Therefore, designers and decision-makers can use seasonal, topographic, and indoor environmental conditions together to establish appropriate priorities for thermal comfort management rather than relying on air temperature or elevation alone.
While PMV and SET provide complementary model-based assessments of thermal comfort inside the building, SET expresses the equivalent psychological temperature while accounting for physiological and environmental parameters. Combining both indices allows understanding indoor thermal comfort conditions through practical interior temperature thresholds, not only via thermal comfort categories. This provides a more comprehensive understanding of thermal comfort conditions within residential buildings in Mediterranean climates because it provides decision-makers with a more intuitive framework for evaluating thermal comfort inside buildings.
The research proposed empirical reference ranges for design. It is an environmental range associated with indoor neutral thermal conditions and presents empirical data that supports environmental design in residential buildings within the studied area. These empirical values represent the ranges of indoor environmental parameters that provide thermal neutrality via various combinations of Ta, Va, HR, and MRT, influenced by seasonal variations and topographical features, as seen in Table 8.
This pays attention to understanding that thermal neutrality cannot be evaluated based on air temperature only, as previous studies have emphasized [14,15,76], because of the different interactions of other environmental factors like radiation, air velocity, and humidity across different topographic regions. Therefore, the environmental design decision for the buildings should take into consideration the combined effect of different environmental factors and should not depend only on air temperature in the study area.
The demonstrated outcomes will help in selecting proper passive design strategies and environmental measures suitable for different Mediterranean microclimates. Moreover, the outcomes show that equivalent thermal feelings have been obtained under different indoor environmental conditions. These findings have practical implications for climate-responsive residential design. These findings of the study answer the study question by addressing how thermal comfort inside the dwellings changes between topographic regions and how environmental factors inside these dwellings vary in relation to the indices of thermal comfort across seasons in the Mediterranean climates.
Nevertheless, regardless of these contributions, the study’s limitations should be considered. Despite the sampling criteria controlling sample size and floor level across both topographic regions, other buildings’ characteristics were not systematically controlled, like orientation, shading, patterns of occupancy, operational practices, envelope, glazing, and insulation. The mentioned characteristics in the buildings may have contributed to the observed regional variations. It is important to mention that because of the multiple statistical comparisons performed, individual significance tests should be interpreted together with effect sizes and the overall pattern of results. The study was limited to mixed-mode dwellings in a specific region of Cyprus, and the dwellings in the mountains were all on the northern slope. Therefore, different heating/cooling modes should be considered in future studies, and various locations in the Mediterranean climate should be investigated. In addition, systematic operation for heating and cooling, in addition to natural ventilation, was not controlled, and it may have affected the measured values of indoor environmental conditions. Moreover, the study did not take into consideration the occupants’ adaptive behavior and standardized the clothing and activities in accordance with ASHRAE Standard 55. As occupant-reported TSV or TCV data were not obtained, the PMV and SET results represent model-based predictions and were not validated against subjective thermal feelings of occupants. Moreover, standardized Met and Clo values were applied rather than measured for each occupant. The observations were limited to January and August and to a specific daytime period between 10:30 and 14:30, as it was mentioned previously. Hence, the outcomes represent the monitored time condition during selected summer and winter periods. Further studies are required to involve human factors for a better understanding of thermal conditions inside residential buildings, and different architectural typologies should be examined, as well. Nonetheless, extending the time of monitoring and data collection during the day may increase the accuracy of the results. In the slightly warm thermal condition, SET did not exhibit a notable disparity across various topographies, albeit with substantial variance in RH and Va within both geographical areas. This condition-dependent divergence necessitates future research into how the interplay of relative humidity and vapor pressure with other environmental elements affects soil evaporation and transpiration at moderately elevated thermal conditions. Moreover, the differences in the active system operation in the mixed-mode selected dwellings may have contributed to the observed indoor thermal conditions and should be considered when interpreting the regional differences.
Finally, these findings have significant implications for climate-responsive residential design in the Mediterranean. The findings show that local topographic, seasonal, and indoor environmental factors should be considered early in building design since they affect baseline indoor thermal conditions.
Author Contributions
Conceptualization, S.S.M.A.-D. and M.I.; methodology, S.S.M.A.-D.; software, S.S.M.A.-D. and M.I.; validation, S.S.M.A.-D. and M.I.; formal analysis, S.S.M.A.-D.; investigation, S.S.M.A.-D. and M.I.; resources, S.S.M.A.-D. and M.I.; data curation, S.S.M.A.-D.; writing—original draft preparation, S.S.M.A.-D.; writing—review and editing, S.S.M.A.-D. and M.I.; visualization, S.S.M.A.-D.; supervision, S.S.M.A.-D.; project administration, S.S.M.A.-D. All authors have read and agreed to the published version of the manuscript.
Funding
This research received no external funding.
Data Availability Statement
The original contributions presented in this study are included in the article. Further inquiries can be directed to the corresponding author.
Acknowledgments
During the preparation of this manuscript/study, the authors used [ChatGPT plus (GPT-6 Sol; OpenAI)] for partial text grammar improvement. The authors have reviewed and edited the output and take full responsibility for the content of this publication.
Conflicts of Interest
The authors declare no conflicts of interest.
References
- Wu, Z.; Li, N.; Wargocki, P.; Peng, J.; Li, J.; Cui, H. Field study on thermal comfort and energy saving potential in 11 split air-conditioned office buildings in Changsha, China. Energy 2019, 182, 471–482. [Google Scholar] [CrossRef] [Scilit]
- Yang, L.; Yan, H.; Lam, J.C. Thermal comfort and building energy consumption implications—A review. Appl. Energy 2014, 115, 164–173. [Google Scholar] [CrossRef] [Scilit]
- Muhy Al-Din, S.S.; Saltik, B. Regulating Indoor Comfortable Temperature Limits for Sustainable Architectural Design in Mediterranean Climates. Buildings 2025, 15, 899. [Google Scholar] [CrossRef] [Scilit]
- Kajjoba, D.; Wasonga, R.; Lwanyaga, J.D.; Kasedde, H.; Olupot, P.W.; Kirabira, J.B. Assessment of thermal comfort and its potential for energy efficiency in low-income tropical buildings: A review. Sustain. Energy Res. 2025, 12, 12–25. [Google Scholar] [CrossRef] [Scilit]
- Djongyang, N.; Tchinda, R.; Njomo, D. Thermal comfort: A review paper. Renew. Sustain. Energy Rev. 2010, 14, 2626–2640. [Google Scholar] [CrossRef] [Scilit]
- Taleghani, M.; Tenpierik, M.; Kurvers, S.; van den Dobbelsteen, A. A review into thermal comfort in buildings. Renew. Sustain. Energy Rev. 2013, 26, 201–215. [Google Scholar] [CrossRef] [Scilit]
- Nikolopoulou, M.; Steemers, K. Thermal comfort and psychological adaptation as a guide for designing urban spaces. Energy Build. 2003, 35, 95–101. [Google Scholar] [CrossRef] [Scilit]
- Zhang, S.; Cheng, Y.; Fang, Z.; Lin, Z. Dynamic control of room air temperature for stratum ventilation based on heat removal efficiency: Method and experimental validations. Build. Environ. 2018, 140, 107–118. [Google Scholar] [CrossRef] [Scilit]
- Spagnolo, J.; de Dear, R. A field study of thermal comfort in outdoor and semi-outdoor environments in subtropical Sydney, Australia. Build. Environ. 2003, 38, 721–738. [Google Scholar] [CrossRef] [Scilit]
- ASHRAE Standard 55; Thermal Environmental Conditions for Human Occupancy. American Society of Heating, Refrigerating and Air-Conditioning Engineers [ASHRAE]: Atlanta, GA, USA, 2020.
- Parsons, K. Human Thermal Environment: The Effects of Hot, Moderate, and Cold Environments on Human Health, Comfort and Performance; Taylor & Francis: New York, NY, USA, 2022; ISBN 0-415-23793-9. [Google Scholar]
- de Dear, R.J.; Brager, G.S. Developing an adaptive model of thermal comfort and preference. Build. Eng. 1998, 104, 145–167. [Google Scholar]
- Zhang, S.; Lin, Z. Standard effective temperature based adaptive-rational thermal comfort model. Appl. Energy 2020, 264, 114723. [Google Scholar] [CrossRef] [Scilit]
- Haiying, W.; Olesen, B.W.; Kazanci, O.B. Using thermostats for indoor climate control in offices: The effect on thermal comfort and heating/cooling energy use. Energy Build. 2019, 188–189, 71–83. [Google Scholar] [CrossRef] [Scilit]
- Muhy Al-Din, S.S.; Hafizi, N.; Altan, H. Quantifying the Relationship Between Mean Radiant Temperature and Indoor Air Temperature Across Building Orientations in Hot and Dry Steppe Climates. Atmosphere 2025, 16, 1132. [Google Scholar] [CrossRef] [Scilit]
- Soares, R.; Corvacho, H.; Alves, F. Summer Thermal Conditions in Outdoor Public Spaces: A Case Study in a Mediterranean Climate. Sustainability 2021, 13, 5348. [Google Scholar] [CrossRef] [Scilit]
- Endler, C.; Oehler, K.; Matzarakis, A. Vertical gradient of climate change and climate tourism conditions in the Black Forest. Int. J. Biometeorol. 2010, 54, 45–61. [Google Scholar] [CrossRef] [Scilit] [PubMed]
- Caliskan, O.; Turkoglu, N.; Matzarakis, A. The Effects of Elevation on Thermal Bioclimatic Conditions in Uludağ (Turkey). Atmosfera 2013, 26, 45–57. [Google Scholar] [CrossRef] [Scilit]
- Chronopoulos, K.I.; Kamoutsis, A.P.; Matsoukis, A.S. Thermal comfort estimation in relation to different orientation in mountainous regions in Greece by using artificial neural networks. Glob. NEST J. 2012, 14, 532–539. [Google Scholar] [CrossRef] [Scilit]
- Huang, C.; Tsai, H.; Chen, H. Influence of Weather Factors on Thermal Comfort in Subtropical Urban Environments. Sustainability 2020, 12, 2001. [Google Scholar] [CrossRef] [Scilit]
- Jega, A.I.; Muhy Al-Din, S.S. Implication of Shading Passive Strategies in Buildings of Hot and Humid Climates for Energy Optimization: Lessons from Vernacular Dwellings in Nigeria. J. Salut. Archit. 2023, 2, 50–69. [Google Scholar] [CrossRef] [Scilit] [PubMed]
- Whiteman, C.D.; Haiden, T.; Pospichal, B.; Eisenbach, S.; Steinacker, R. Minimum Temperatures, Diurnal Temperature Ranges, and Temperature Inversions in Limestone Sinkholes of Different Sizes and Shapes. J. Appl. Meteorol. Climatol. 2004, 43, 1224–1236. [Google Scholar] [CrossRef] [Scilit] [PubMed]
- Tian, X.; Li, B.; Ma, Y.; Liu, D.; Li, Y.; Cheng, Y. Experimental study of local thermal comfort and ventilation performance for mixing, displacement and stratum ventilation in an office. Sustain. Cities Soc. 2019, 50, 101630. [Google Scholar] [CrossRef] [Scilit]
- Muhy Al-Din, S.S.; Ahmad Nia, H.; Rahbarianyazd, R. Enhancing Sustainability in Building Design: Hybrid Approaches for Evaluating the Impact of Building Orientation on Thermal Comfort in Semi-Arid Climates. Sustainability 2023, 15, 15180. [Google Scholar] [CrossRef] [Scilit]
- Van Hoof, J. Forty years of Fanger’s model of thermal comfort: Comfort for all? Indoor Air 2008, 18, 182–201. [Google Scholar] [CrossRef] [Scilit] [PubMed]
- Halawa, E.; Van Hoof, J. The adaptive approach to thermal comfort: A critical overview. Energy Build. 2012, 51, 101–110. [Google Scholar] [CrossRef] [Scilit]
- Manu, S.; Shukla, Y.; Rawal, R.; Thomas, L.E.; de Dear, R. Field studies of thermal comfort across multiple climate zones for the subcontinent: India Model for Adaptive Comfort (IMAC). Build. Environ. 2016, 98, 55–70. [Google Scholar] [CrossRef] [Scilit]
- Van Hoof, J.; Mazej, M.; Hensen, J.L.M. Thermal comfort: Research and practice. Front. Biosci. Landmark Ed. 2010, 15, 765–788. [Google Scholar] [CrossRef] [Scilit] [PubMed]
- Humphreys, M.A.; Nicol, J.F. The validity of ISO-PMV for predicting comfort votes in every-day thermal environments. Energy Build. 2002, 34, 667–684. [Google Scholar] [CrossRef] [Scilit]
- Cheung, T.; Schiavon, S.; Parkinson, T.; Li, P.; Brager, G. Analysis of the accuracy on PMV—PPD model using the ASHRAE Global Thermal Comfort Database II. Build. Environ. 2019, 153, 205–217. [Google Scholar] [CrossRef] [Scilit]
- Li, Y.; Rezgui, Y.; Guerriero, A.; Zhang, X.; Han, M.; Kubicki, S.; Yan, D. Development of an adaptation table to enhance the accuracy of the predicted mean vote model. Build. Environ. 2020, 168, 106504. [Google Scholar] [CrossRef] [Scilit]
- de Dear, R.; Brager, G. Thermal comfort in naturally ventilated buildings: Revisions to ASHRAE Standard 55. Energy Build. 2002, 34, 549–561. [Google Scholar] [CrossRef] [Scilit]
- Gilani, S.; Khan, M.; Ali, M. Revisiting Fanger’s thermal comfort model using mean blood pressure as a bio-marker: An experimental investigation. Appl. Therm. Eng. 2016, 109, 35–43. [Google Scholar] [CrossRef] [Scilit]
- Yao, R.; Li, B.; Liu, J. A theoretical adaptive model of thermal comfort—Adaptive Predicted Mean Vote (aPMV). Build. Environ. 2009, 44, 2089–2096. [Google Scholar] [CrossRef] [Scilit]
- Zhang, S.; Cheng, Y.; Fang, Z.; Lin, Z. Improved algorithm for adaptive coefficient of adaptive Predicted Mean Vote (aPMV). Build. Environ. 2019, 163, 106318. [Google Scholar] [CrossRef] [Scilit]
- Gagge, P.; Fobelets, A.P.R.; Berglund, L. A standard predictive index of human response to the thermal environment. Ashrae Trans. 1986, 92, 709–731. [Google Scholar]
- Gagge, A.P.; Stolwijk, J.A.J.; Nishi, Y. An Effective Temperature Scale Based on a Simple Model of Human Physiological Regulatory Response. ASHRAE Trans. 1971, 77, 247–262. [Google Scholar]
- Cheng, Y.; Niu, J.; Gao, N. Thermal comfort models: A review and numerical investigation. Build. Environ. 2012, 47, 13–22. [Google Scholar] [CrossRef] [Scilit]
- Ye, G.; Yang, C.; Chen, Y.; Li, Y. A new approach for measuring predicted mean vote (PMV) and standard effective temperature (SET*). Build. Environ. 2003, 38, 33–44. [Google Scholar] [CrossRef] [Scilit]
- Zheng, Z.; Zhang, Y.; Mao, M.; Yang, Y.; Fu, C.; Fang, Z. Analysis of SET* and PMV to evaluate thermal comfort in prefab construction site offices Case study in South China. Case Stud. Therm. Eng. 2021, 26, 101137. [Google Scholar] [CrossRef] [Scilit]
- Du, H.; Yang, C. Re-visitation of the thermal environment evaluation index standard effective temperature (SET*) based on the two-node model. Sustain. Cities Soc. 2020, 53, 101899. [Google Scholar] [CrossRef] [Scilit]
- Nguyen, A.T.; Singh, M.K.; Reiter, S. An adaptive thermal comfort model for hot humid South-East Asia. Build. Environ. 2012, 56, 291–300. [Google Scholar] [CrossRef] [Scilit]
- Omrani, S.; Garcia-Hansen, V.; Capra, B.R.; Drogemuller, R. Effect of natural ventilation mode on thermal comfort and ventilation performance: Full-scale measurement. Energy Build. 2017, 156, 226–241. [Google Scholar] [CrossRef] [Scilit]
- Zhu, M.L.; Ouyang, Q.; Shen, H.G.; Zhu, Y.X. Field study on the objective evaluation of sleep quality and sleeping thermal environment in summer. Energy Build. 2016, 133, 843–852. [Google Scholar] [CrossRef] [Scilit]
- Li, B.; Du, C.; Tan, M.; Liu, H.; Essah, E.; Yao, R. A modified method of evaluating the impact of air humidity on human acceptable air temperatures in hot-humid environments. Energy Build. 2018, 158, 393–405. [Google Scholar] [CrossRef] [Scilit]
- Yu, Z.; Yang, B.; Zhu, N.; Olofsson, T.; Zhang, G. Utility of cooling overshoot for energy efficient thermal comfort in temporarily occupied space. Build. Environ. 2016, 109, 199–207. [Google Scholar] [CrossRef] [Scilit]
- Gao, J.; Wang, Y.; Wargocki, P. Comparative analysis of modified PMV models and SET models to predict human thermal sensation in naturally ventilated buildings. Build. Environ. 2015, 92, 200–208. [Google Scholar] [CrossRef] [Scilit]
- Muhy Al-Din, S.S.; Nia, H.A.; Rahbarianyazd, R. Towards Sustainable Living through Thermoneutral Temperature Management in Subtropical Steppe Climates. Sustainability 2024, 16, 5699. [Google Scholar] [CrossRef] [Scilit]
- Lin, T.P.; Matzarakis, A. Tourism climate and thermal comfort in Sun Moon Lake, Taiwan. Int. J. Biometeorol. 2008, 52, 281–290. [Google Scholar] [CrossRef] [Scilit] [PubMed]
- Santamouris, M.; Cartalis, C.; Synnefa, A.; Kolokotsa, D. On the impact of urban heat island and global warming on the power demand and electricity consumption of buildings—A review. Energy Build. 2015, 98, 119–124. [Google Scholar] [CrossRef] [Scilit]
- Peel, M.C.; Finlayson, B.L.; McMahon, T.A. Updated world map of the Köppen-Geiger climate classification. Hydrol. Earth Syst. Sci. 2007, 11, 1633–1644. [Google Scholar] [CrossRef] [Scilit]
- Pepin, N.C.; Arnone, E.; Gobiet, A.; Haslinger, K.; Kotlarski, S.; Notarnicola, C.; Palazzi, E.; Seibert, P.; Serafin, S.; Schöner, W.; et al. Climate changes and their elevational patterns in the mountains of the world. Rev. Geophys. 2022, 60, e2020RG000730. [Google Scholar] [CrossRef] [Scilit]
- Salata, F.; Golasi, I.; de Lieto Vollaro, R.; de Lieto Vollaro, A. Outdoor thermal comfort in the Mediterranean area. A transversal study in Rome, Italy. Build. Environ. 2016, 96, 46–61. [Google Scholar] [CrossRef] [Scilit]
- Rangwala, I.; Miller, J.R. Climate change in mountains: A review of elevation-dependent warming and its possible causes. Clim. Change 2012, 114, 527–547. [Google Scholar] [CrossRef] [Scilit]
- Pepin, N.; Bradley, R.S.; Diaz, H.F.; Baraer, M.; Caceres, E.B.; Forsythe, N.; Fowler, H.; Greenwood, G.; Hashmi, M.Z.; Liu, X.D.; et al. Elevation-dependent warming in mountain regions of the world. Nat. Clim. Change 2015, 5, 424–430. [Google Scholar] [CrossRef] [Scilit]
- Byrne, M.P.; O’Gorman, P.A. Understanding Decreases in Land Relative Humidity with Global Warming: Conceptual Model and GCM Simulations. J. Clim. 2016, 29, 9045–9061. [Google Scholar] [CrossRef] [Scilit]
- Miller, C.A.; Davenport, A.G. Guidelines for the calculation of wind speed-ups in complex terrain. J. Wind Eng. Ind. Aerodyn. 1998, 74, 189–197. [Google Scholar] [CrossRef] [Scilit]
- Thapa, S. Thermal comfort in high altitude Himalayan residential houses in Darjeeling, India-An adaptive approach. Indoor Built Environ. 2020, 29, 84–100. [Google Scholar] [CrossRef] [Scilit]
- Katafygiotou, M.C.; Serghides, D.K. Bioclimatic chart analysis in three climate zones in Cyprus. Indoor Built Environ. 2014, 24, 746–760. [Google Scholar] [CrossRef] [Scilit]
- Kottek, M.; Grieser, J.; Beck, C.; Rudolf, B.; Rubel, F. World map of the Köppen-Geiger climate classification updated. Meteorol. Z. 2006, 15, 259–263. [Google Scholar] [CrossRef] [Scilit] [PubMed]
- Lingis, P.; Michaelides, S.C. Teleconnection patterns of the Siberian Anticyclone and precipitation over Cyprus. Atmos. Res. 2009, 94, 663–674. [Google Scholar] [CrossRef] [Scilit]
- Stergiou, A. CYPRUS History and Economy Until 2022. 2023. Available online: https://www.researchgate.net/publication/368691512_CYPRUS_History_and_Economy_until_2022 (accessed on 27 March 2026).
- Cyprus Meteorological Department. Department of Meteorology. Retrieved from The Climate of Cyprus. 2026. Available online: http://www.moa.gov.cy/moa/ms/ms.nsf/Dmlcyclimate_en/DMLcyclimate_en (accessed on 20 January 2026).
- Bey, E.; Turkes, M.; Hamed, M.M. Long-term air temperature trends in North Cyprus. Theor. Appl. Climatol. 2024, 155, 1113–1122. [Google Scholar] [CrossRef] [Scilit]
- Ozarisoy, B.; Altan, H. Low Energy Design Strategies for Retrofitting Existing Residential Buildings in Cyprus. Proc. Inst. Civ. Eng.-Eng. Sustain. 2018, 172, 241–255. [Google Scholar] [CrossRef] [Scilit]
- Muhy Al-Din, S.; Iranfare, M.; Surchi, Z. Building Thermal Comfort Basedon Envelope Development: Criteria for selecting right case study in Kyrenia-North Cyprus. Energy Procedia 2017, 115, 80–91. [Google Scholar] [CrossRef] [Scilit]
- Carport. (15 March 2010). Cyprus Relief Location Map [Map]. Wikimedia Commons. Retrieved 29 July 2026. Available online: https://commons.wikimedia.org/wiki/File:Cyprus_relief_location_map.jpg (accessed on 25 June 2026).
- Tartarini, F.; Schiavon, S.; Cheung, T.; Hoyt, T. CBE Thermal Comfort Tool: Online tool for thermal comfort calculations and visualizations. SoftwareX 2020, 12, 100563. [Google Scholar] [CrossRef] [Scilit]
- Makwana, D.; Engineer, P.; Dabhi, A.; Chudasama, H. Sampling Methods in Research: A Review. Int. J. Trend Sci. Res. Dev. 2023, 7, 762–768. [Google Scholar]
- Barry, R.G. Mountain Weather and Climate, 3rd ed.; Cambridge University Press: Cambridge, UK, 2008. [Google Scholar] [CrossRef] [Scilit]
- Luo, M.; Cao, B.; Damiens, J.; Lin, B.; Zhu, Y. Evaluating thermal comfort in mixed-mode buildings: A field study in a subtropical climate. Build. Environ. 2015, 88, 46–54. [Google Scholar] [CrossRef] [Scilit]
- Jia, X.; Cao, B.; Zhu, Y.; Liu, B. Thermal comfort in mixed-mode buildings: A field study in Tianjin, China. Build. Environ. 2020, 185, 107244. [Google Scholar] [CrossRef] [Scilit]
- Fanger, P.O. Thermal Comfort: Analysis and Applications in Environmental Engineering; Danish Technical Press: Copenhagen, Denmark, 1970. [Google Scholar]
- de Dear, R.; Akimoto, T.; Arens, E.; Brager, G.; Candido, C.; Cheong, K.W.D.; Li, B.; Nishihara, N.; Sekhar, C.; Tanabe, S.; et al. Progress in thermal comfort research over the last twenty years. Indoor Air 2013, 23, 442–461. [Google Scholar] [CrossRef] [Scilit] [PubMed]
- Peng, X.; Wu, W.; Zheng, Y.; Sun, J.; Hu, T.; Wang, P. Correlation analysis of land surface temperature and topographic elements in Hangzhou, China. Sci. Rep. 2020, 10, 10451. [Google Scholar] [CrossRef] [Scilit] [PubMed]
- Jeong, B. Assessing indoor air temperature settings in residential buildings during the COVID-19 era. Build. Environ. 2024, 265, 112034. [Google Scholar] [CrossRef] [Scilit]
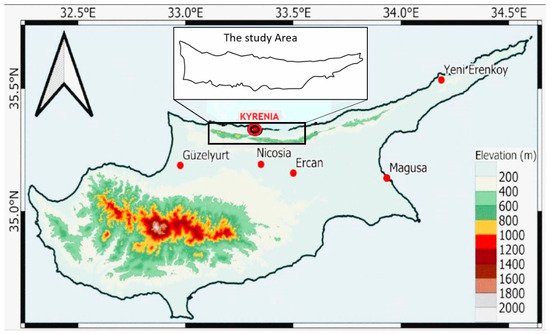
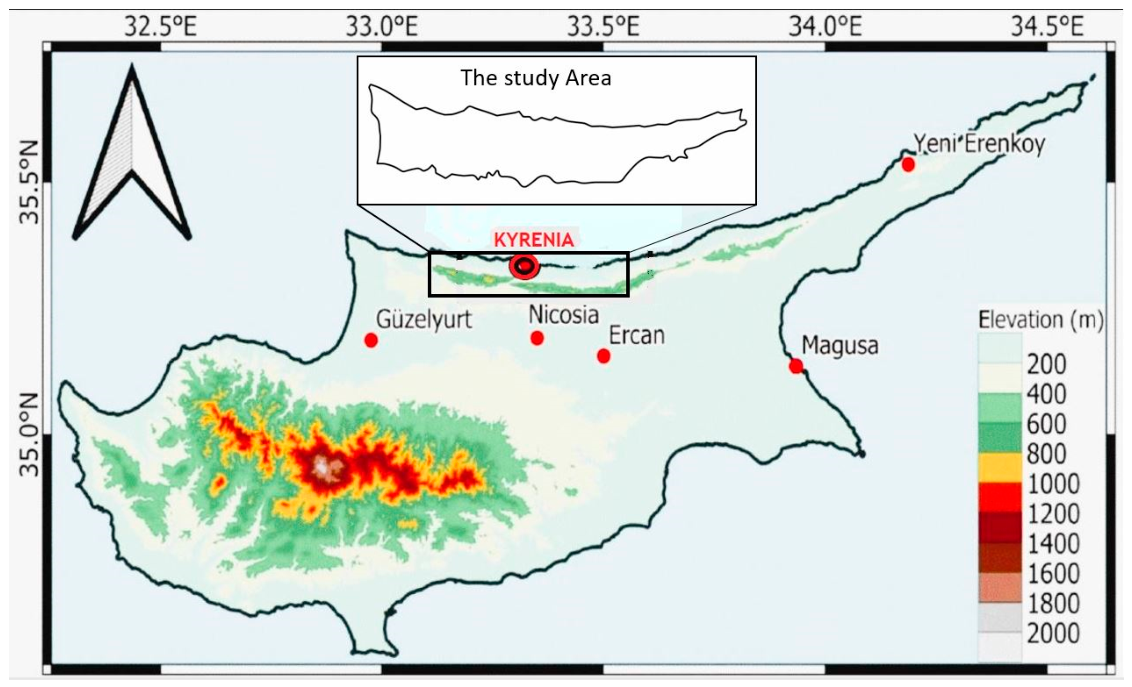
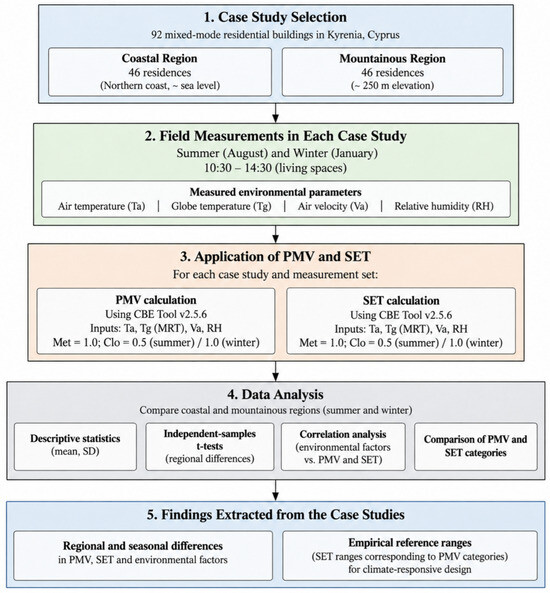
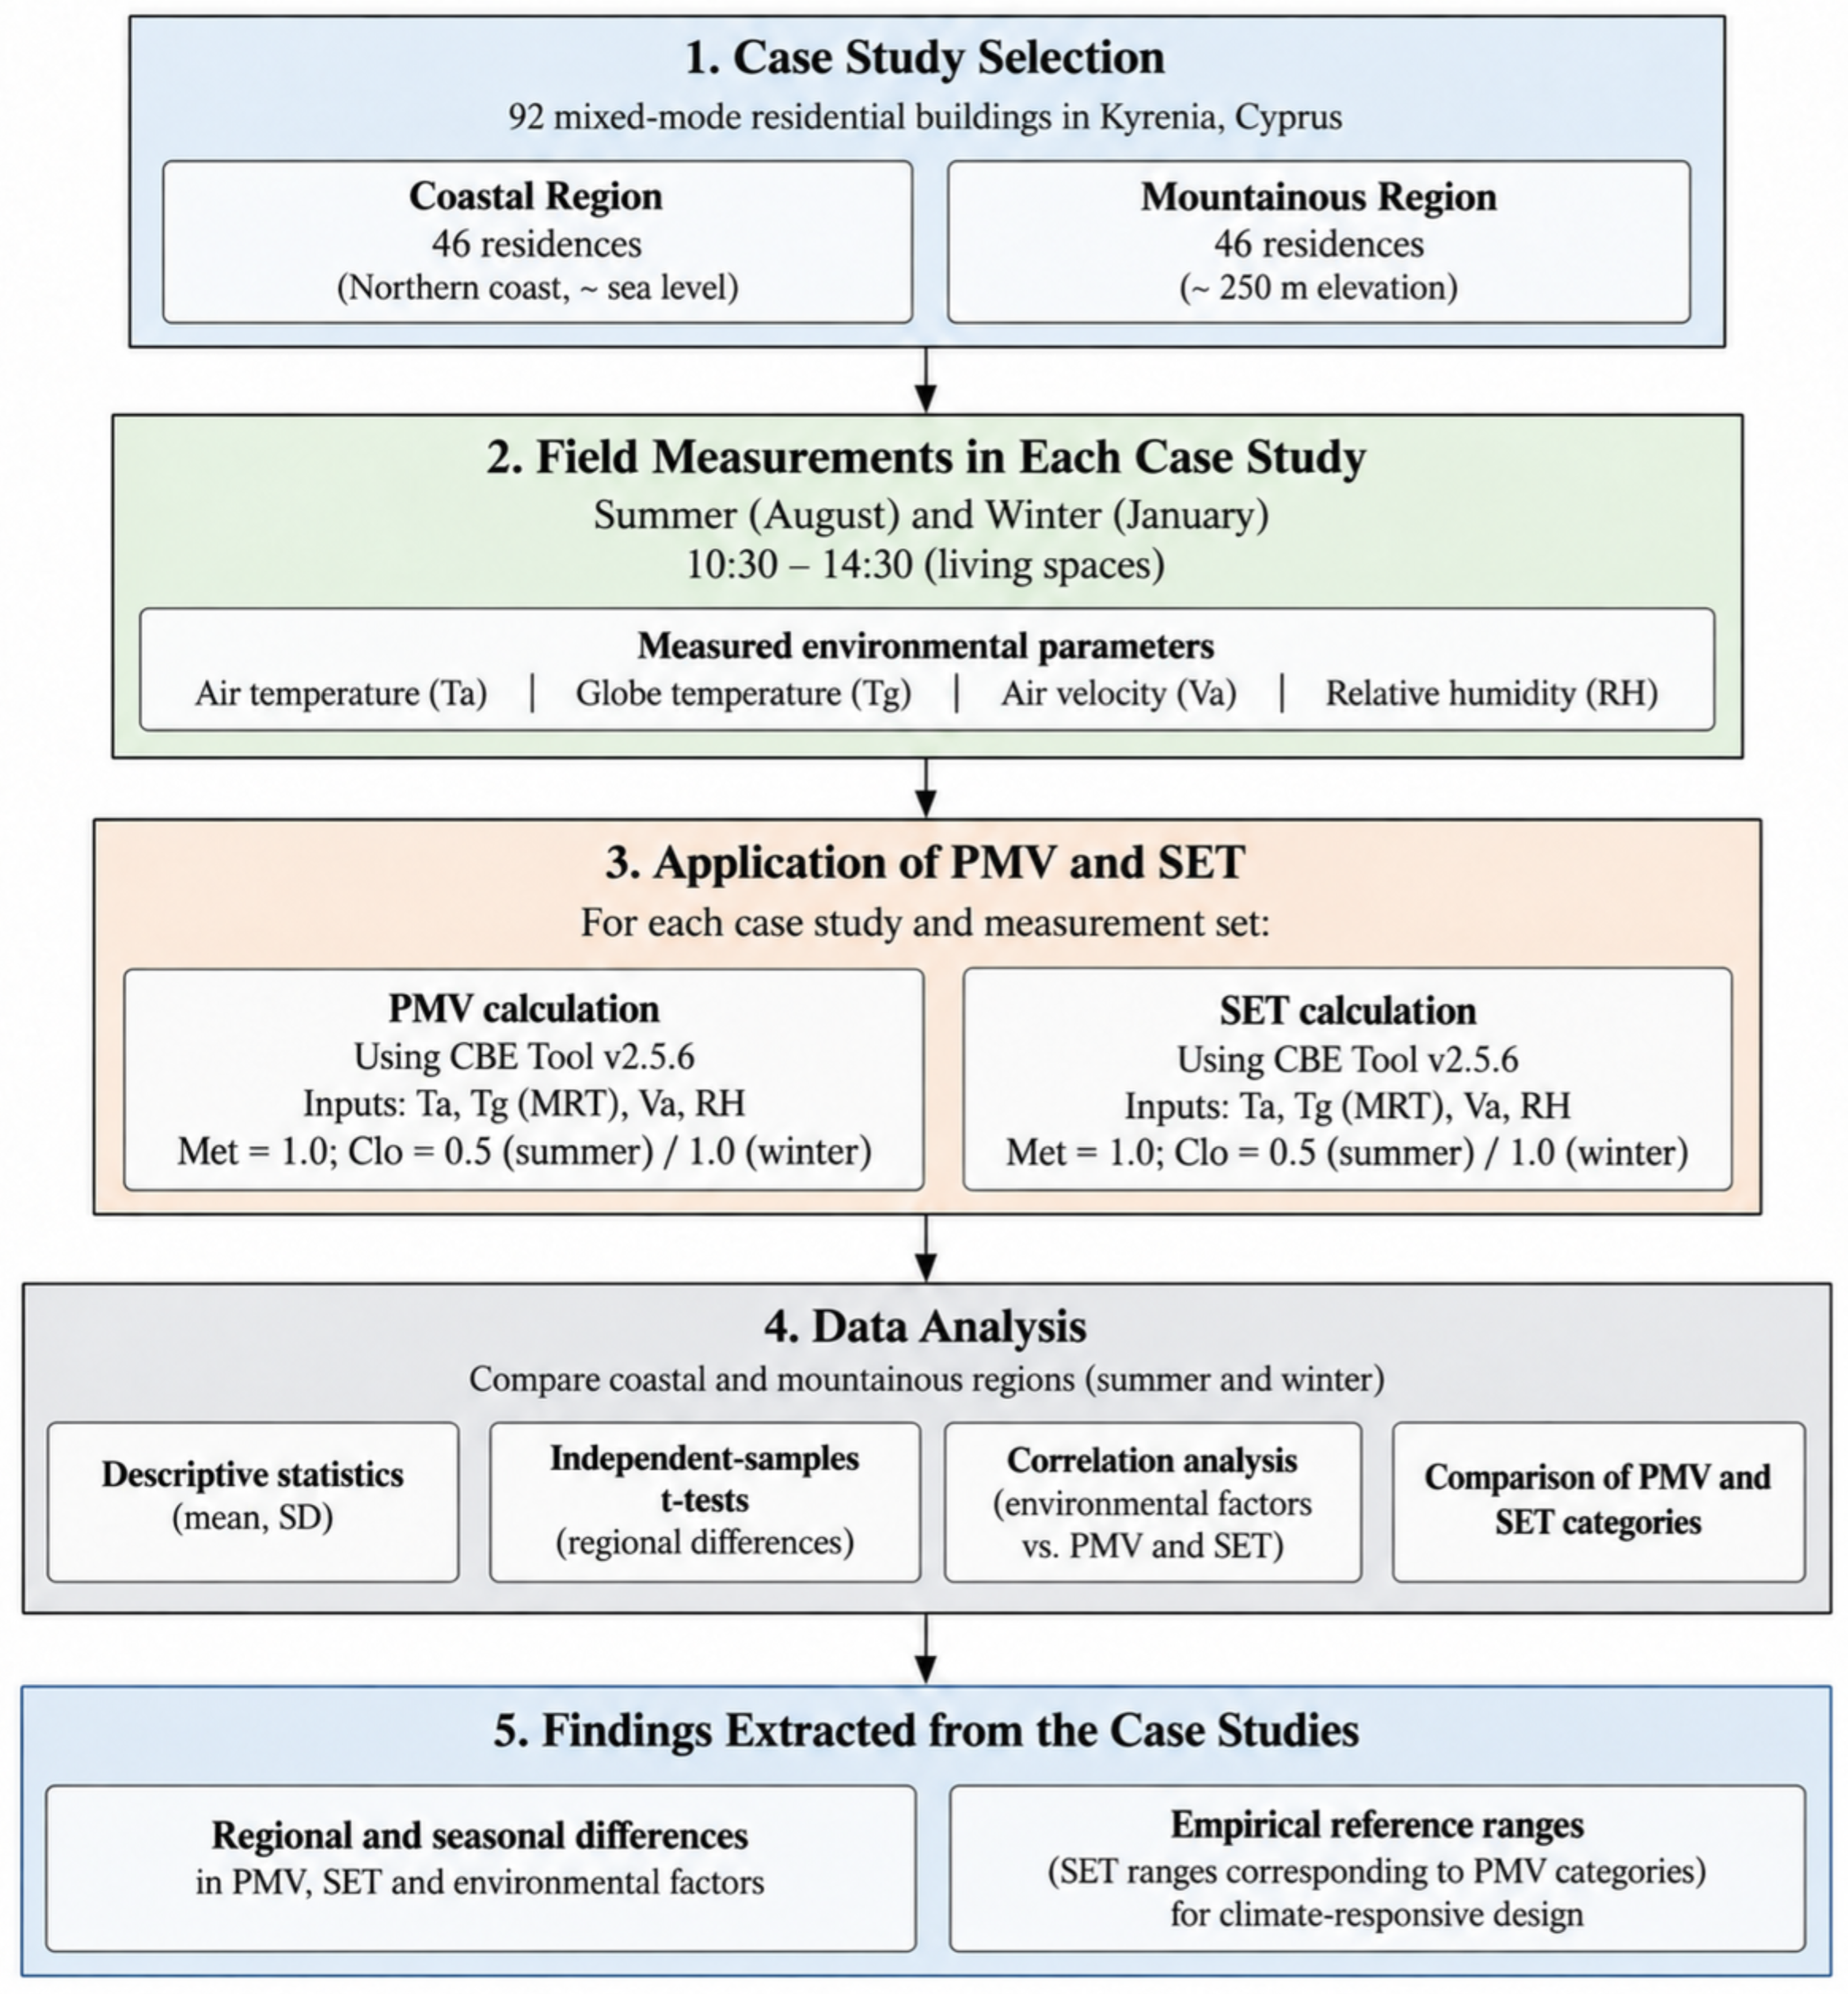
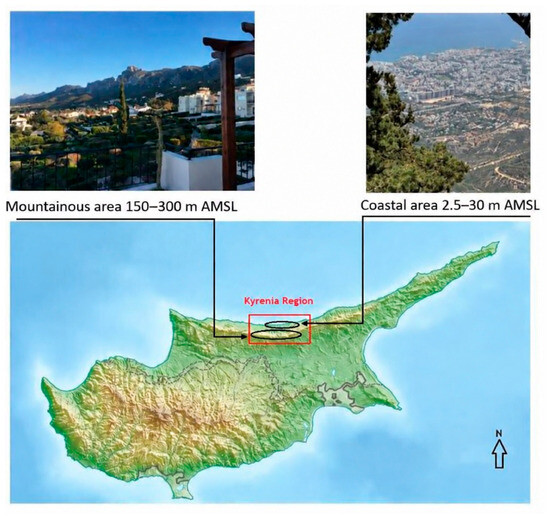
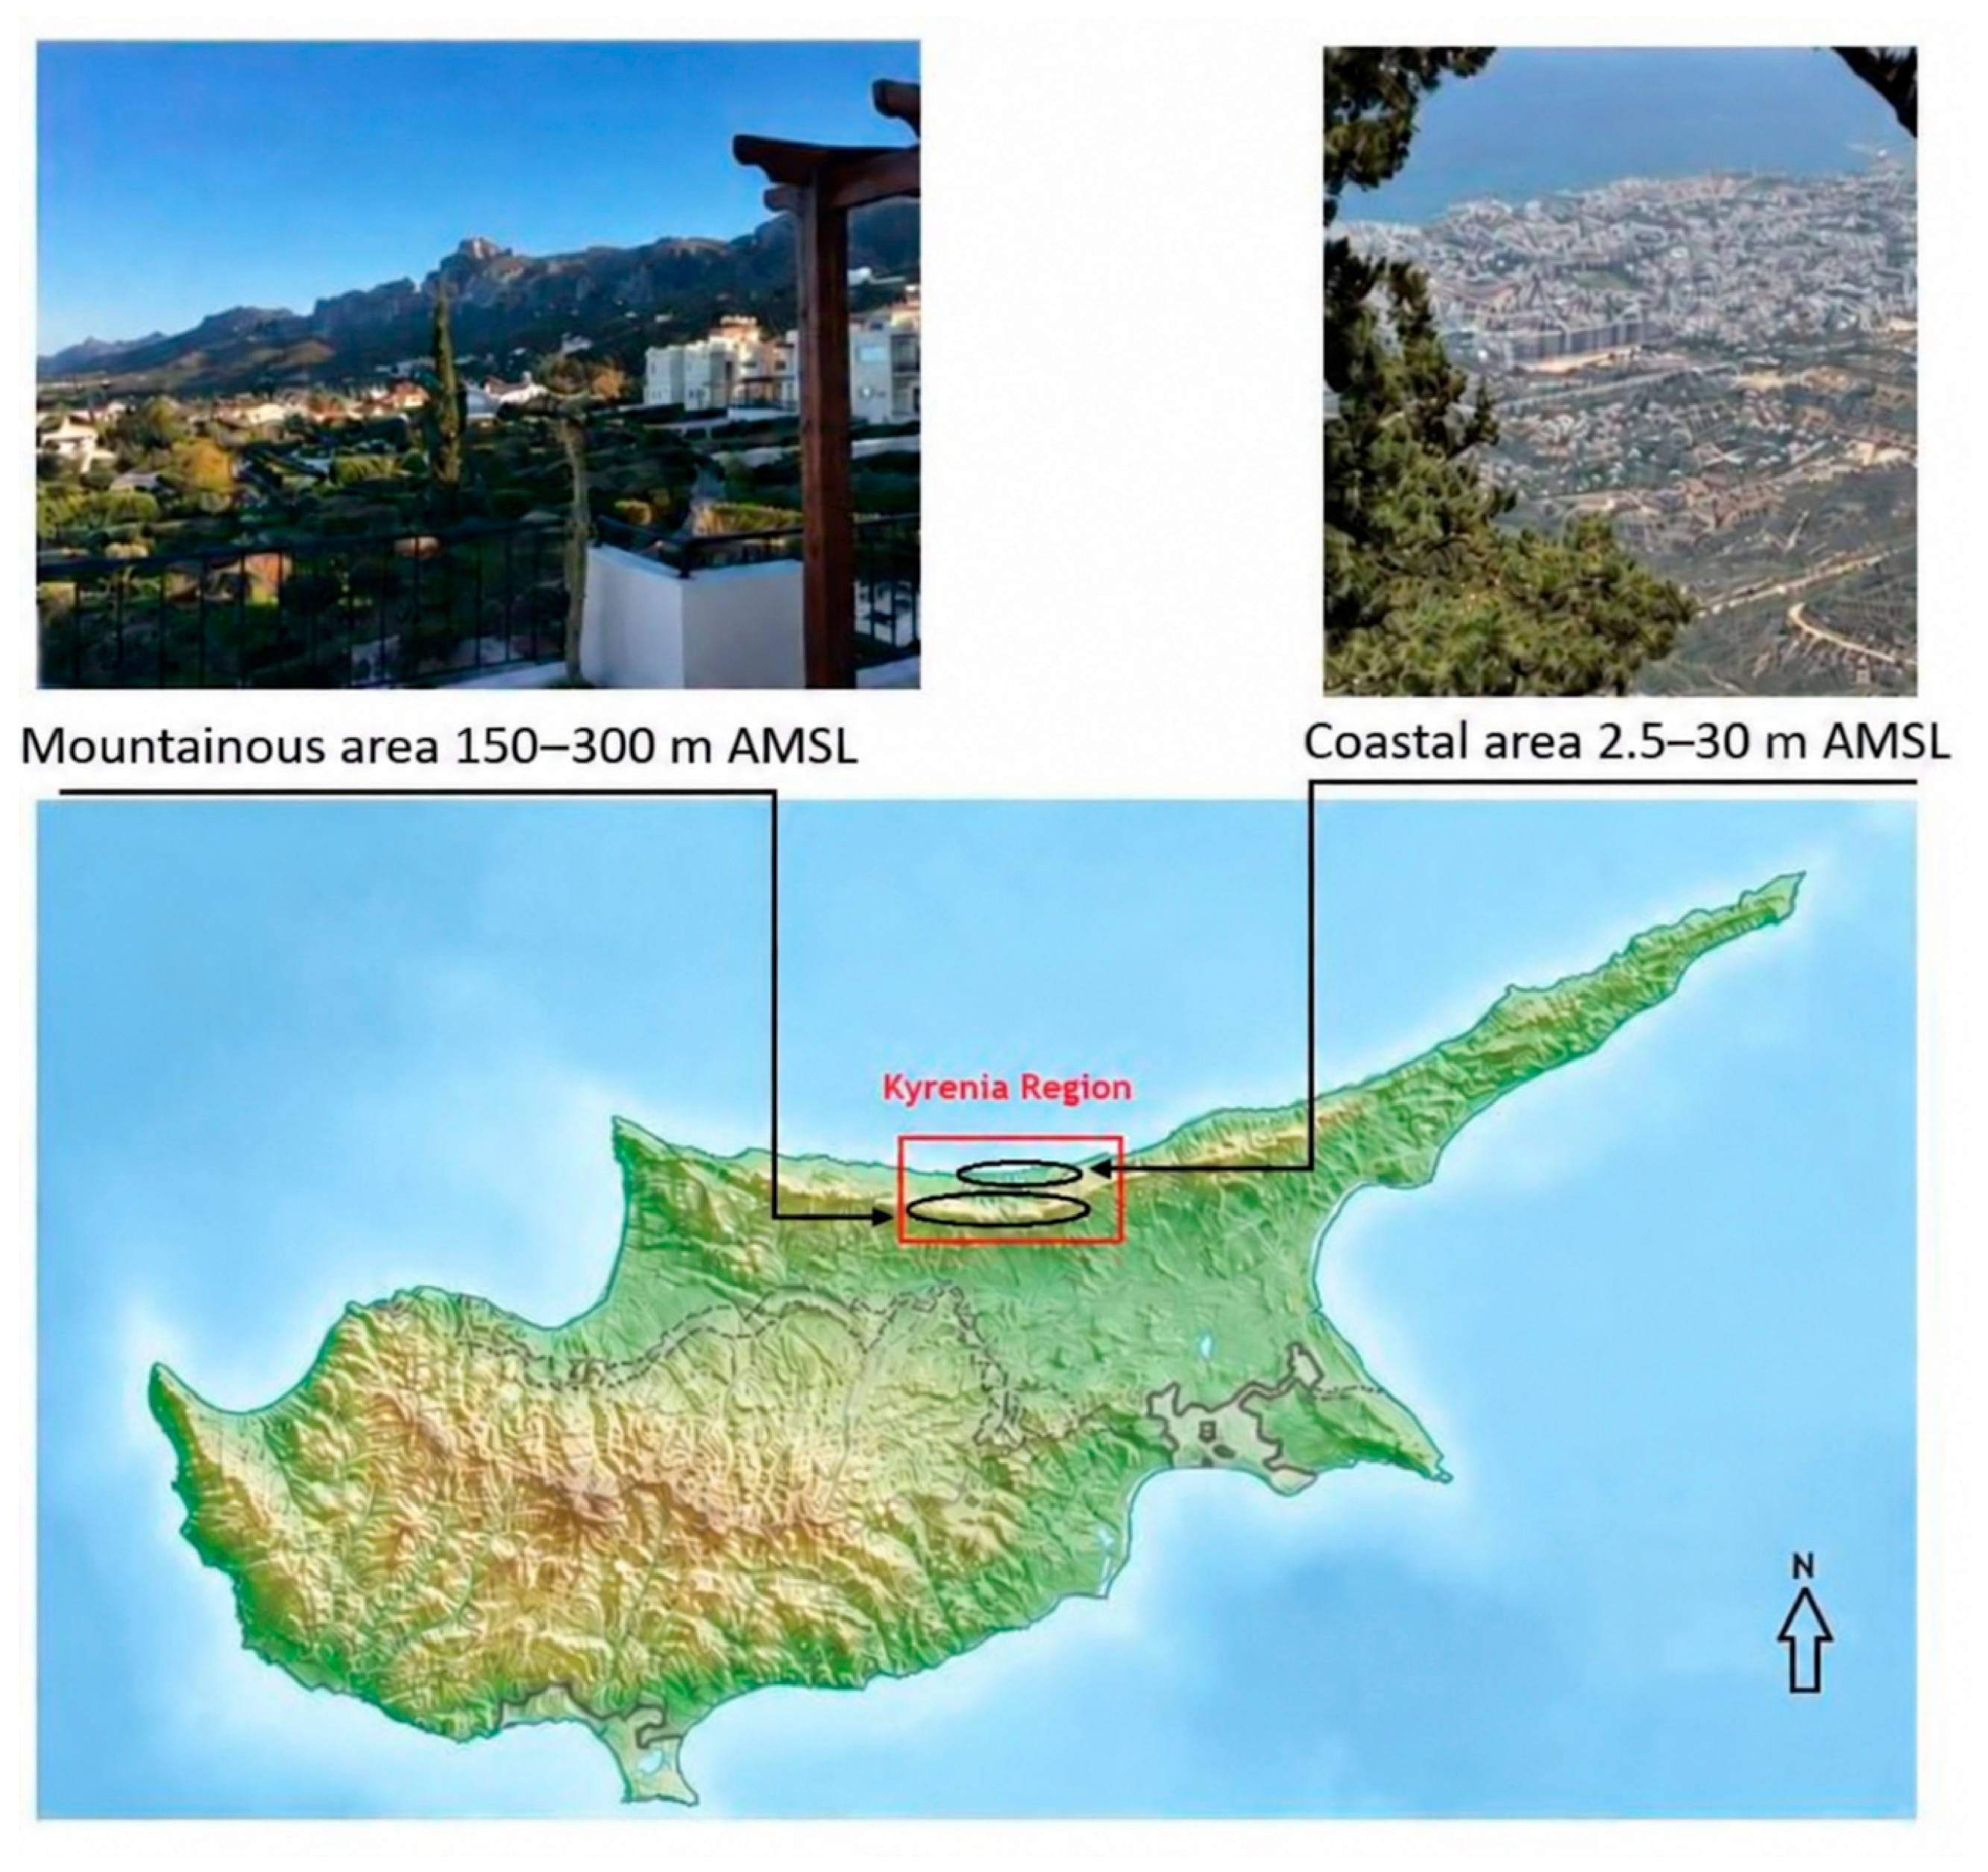
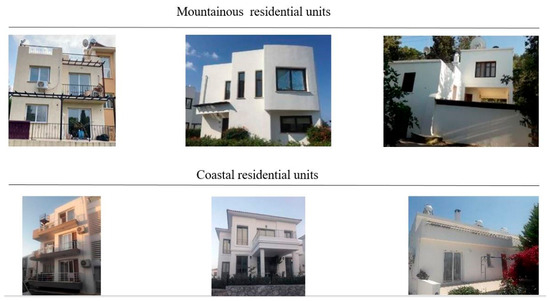
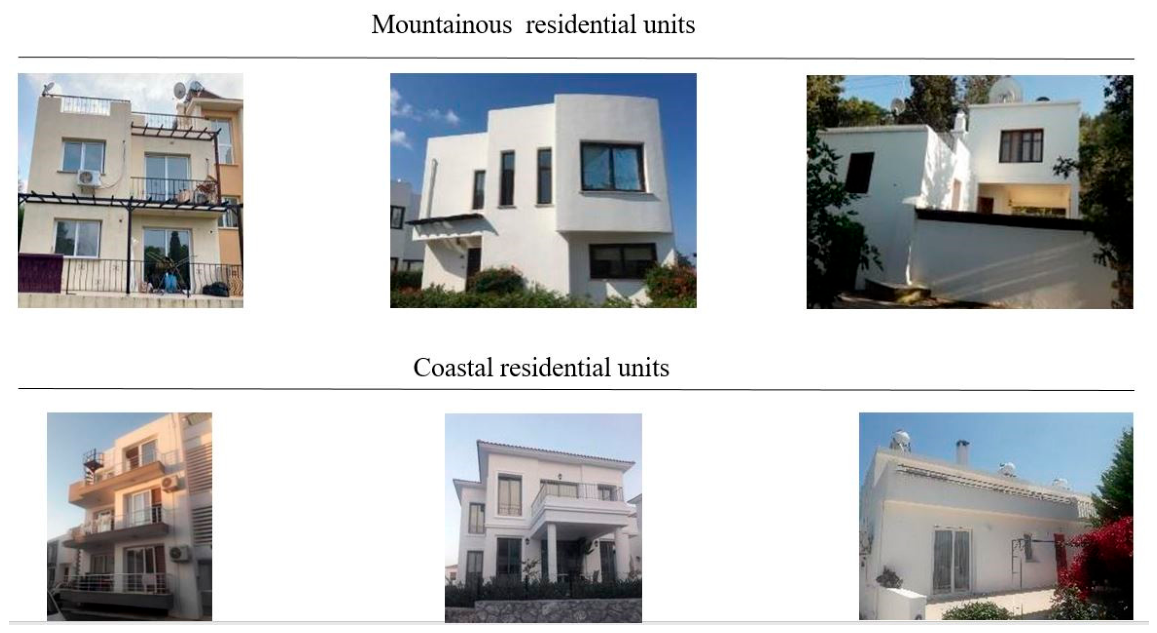
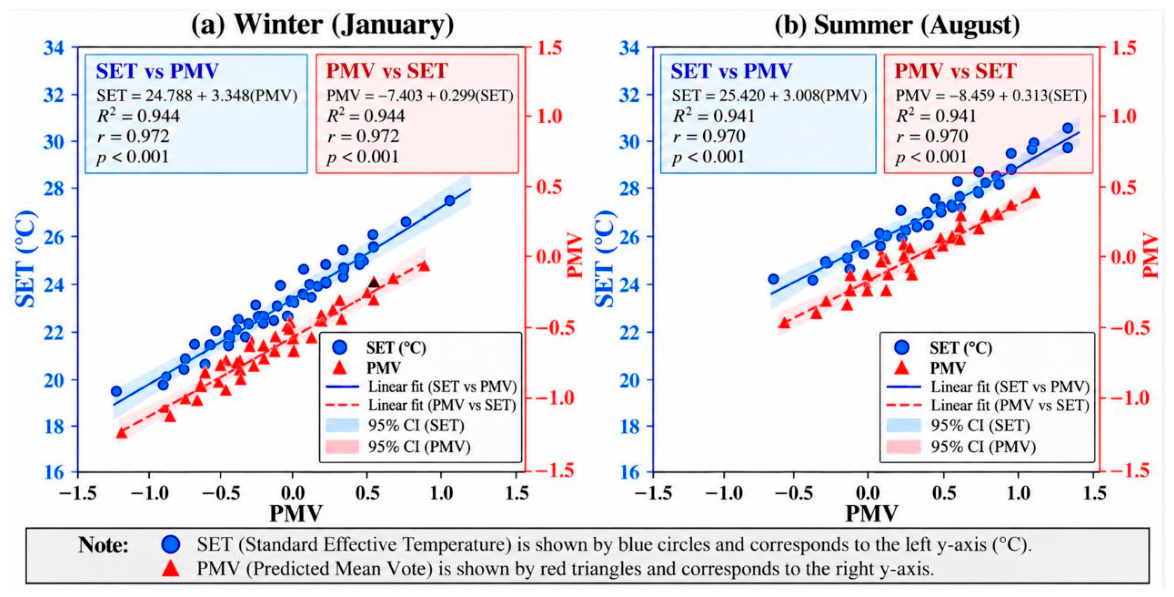
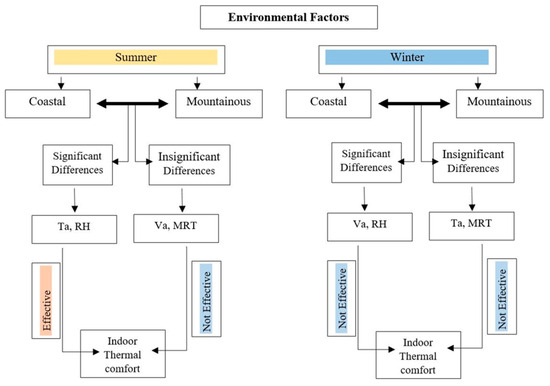
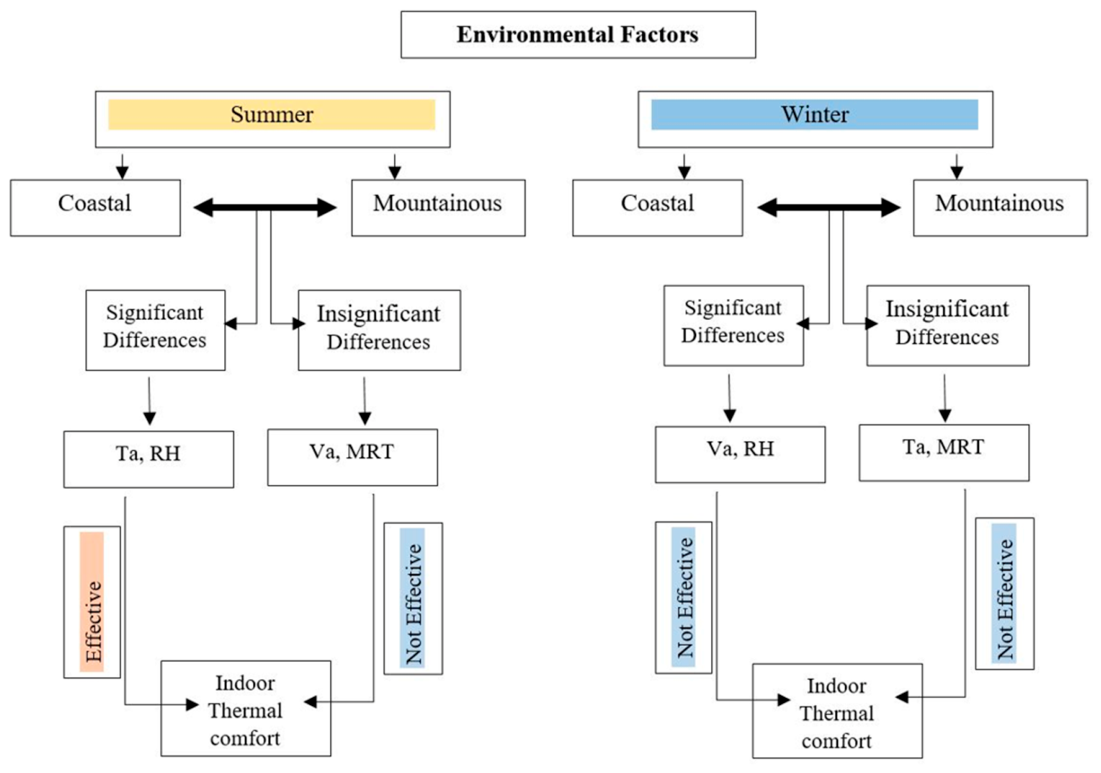

Disclaimer/Publisher’s Note: The statements, opinions and data contained in all publications are solely those of the individual author(s) and contributor(s) and not of MDPI and/or the editor(s). MDPI and/or the editor(s) disclaim responsibility for any injury to people or property resulting from any ideas, methods, instructions or products referred to in the content. |
© 2026 by the authors. Licensee MDPI, Basel, Switzerland. This article is an open access article distributed under the terms and conditions of the Creative Commons Attribution (CC BY) license.