


Abstract
This study evaluates a route in which a humidity-cured epoxy is applied to a cleaned steel surface and concrete is cast directly onto the still-tacky adhesive, eliminating welding and pre-drying. As a preliminary study, six push-out specimens in three configurations—studs only (G1), pure bonding (G2), and studs combined with bonding (G3)—were tested under monotonic load control, with two specimens loaded statically in each group. Mean ultimate capacities were 474.5, 680 and 720 kN for G1, G2 and G3. Bonded specimens failed within the concrete matrix, leaving concrete on the steel plate and indicating that the wet-cast bond line exceeded the near-surface strength of the concrete. Interface slip in G2 and G3 remained below the measurement resolution (±0.001 mm), consistent with elastic shear of the 1–2 mm epoxy layer. Concrete strains remained compressive throughout loading in bonded specimens, whereas stud specimens developed bottom-surface tensile strains of about 220 με, indicating that discrete connectors induce a local bending field that continuous bonding removes. However, bonded failure was abrupt and non-ductile; the hybrid configuration retained a post-debonding load path that provided a residual capacity of about 68% of the stud-only residual (reconstructed numerically in “Finite Element Verification”), converting a brittle mechanism into one with a secondary, damage-tolerant reserve.
1. Introduction
Steel–concrete composite structures effectively leverage the complementary strengths of both materials, tensile capacity of steel and compressive strength of concrete, resulting in efficient structural systems with high stiffness, low self-weight, and cost-effectiveness [1,2]. The flexural performance of such composite members is largely governed by interfacial shear transfer and compatibility between the steel and concrete layers [3,4].
In modern bridge engineering, the primary challenge in composite design is achieving reliable force transfer between the steel and concrete components through shear connectors at their interface. Conventionally, this is accomplished through mechanical studs (also called shear studs or headed anchors) and perfobond rib (PBL) connectors, which are welded to the steel flange before concrete casting [5,6,7,8,9,10]. While these methods benefit from decades of research and well-established design codes, they introduce specific construction challenges: on-site welding quality variability, labor intensive installation procedures, and inherent difficulty in inspecting welded connections, particularly in confined spaces such as box-girder bridge decks or retrofit applications where flange access is severely limited.
Adhesive bonding [11], in contrast, is a well-established technology in many engineering disciplines for achieving composite action between dissimilar materials. Adhesive bonding transfers shear uniformly over the whole bonded area, and both analytical and numerical studies have confirmed that it can develop reliable composite action in T-shaped steel–concrete beams [12]. Applications include structural repair and rehabilitation, where bonding layers enhance composite stress behavior between newly added and existing concrete elements [13,14]; asphalt concrete steel bridge deck systems, where bonding layers are applied to enhance pavement-to-girder adhesion and provide critical waterproofing and corrosion protection [15,16,17,18]; and, more recently, ultra-high-performance concrete (UHPC) and engineered cementitious composites (ECC) bridge decks, where bonding techniques have been explored alongside mechanical reinforcement to optimize structural performance under combined loading [19,20,21,22,23].
Comparative studies of bonded and mechanically fastened interfaces indicate that the two differ markedly in stiffness, ductility, and failure mode, which motivates combining them [24]. Most prior studies [25,26,27,28,29] of bonded steel–concrete interfaces have been conducted under controlled laboratory curing conditions or in retrofit scenarios using post-applied surface treatments. In contrast, direct adhesive bonding under humidity/wet environments with cast-in-place concrete, without specialized curing chambers or extensive surface pre-drying, has received comparatively limited experimental attention.
Recent developments in epoxy adhesive chemistry have introduced humidity-cured formulations that can bond effectively under damp conditions, making it possible to apply adhesive to steel and immediately cast concrete. This simplified process may improve construction efficiency, quality control, and worker safety by eliminating on site welding. Nevertheless, rigorous experimental validation is still required to demonstrate that such humidity-cured bonded connections can match or exceed the performance of conventional mechanical shear connectors.
This study addresses this knowledge gap through systematic push-out testing of three connection configurations: (1) mechanical studs alone (G1); (2) humidity-cured epoxy adhesive alone (G2); and (3) a hybrid combining both methods (G3). The primary objectives are (i) to quantify the shear transfer capacity, stiffness, and failure mechanisms of cast-in-place bonded connections under monotonic loading; (ii) to characterize stress distribution uniformity by comparing strain fields across the three configurations; (iii) to mechanistically explain the governing failure modes and interface behavior; and (iv) to provide preliminary design guidance and identify barriers to code standardization.
2. Experiments
2.1. Design of Experiments
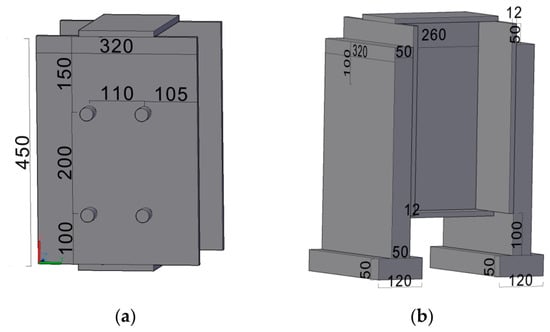
To evaluate the interface shear performance of steel–concrete composite structures using bonding, this paper designed three connection methods for comparative testing (Table 1, Figure 1).
Table 1.
Push-out specimen matrix: group designation, specimen numbering and interface connection type (two nominally identical specimens per group; no transverse reinforcement in any specimen).
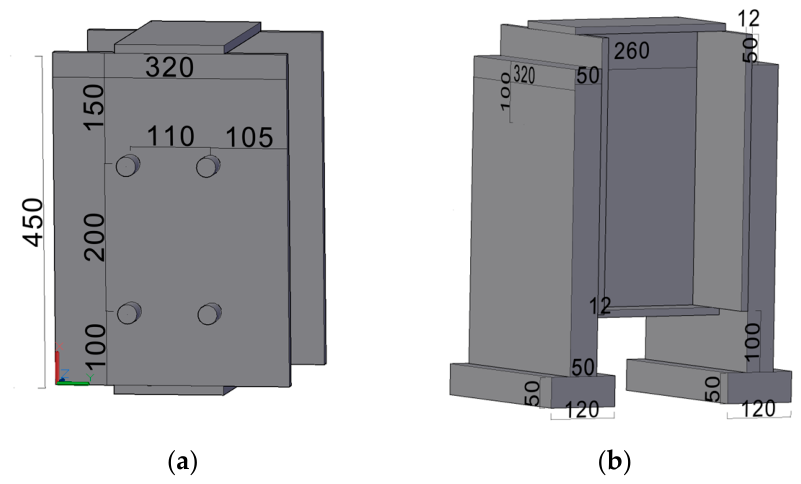
Figure 1.
Geometry of the push-out specimens: (a) steel element assembled from five 12 mm plates, showing stud layout (φ13 × 35 mm, eight per specimen, 110 mm horizontal and 200 mm vertical spacing); (b) concrete slab and steel plate dimensions, including the 50 mm slab thickness and the widened base block. Dimensions in mm.
The first method used mechanical studs made of ML15 steel with a diameter of 13 mm and a height of 35 mm as connecting members (8 connectors per specimen), arranged with a horizontal center distance of 110 mm (side distance of 105 mm) and a vertical distance of 200 mm (side distance of 100 mm), representing a commonly used shear key structure in steel–concrete composites.
The second method used a special epoxy resin as a bonding layer for interfacial linkage, without any mechanical studs. In this approach, the steel surface was cleaned and polished to remove rust before the binder was applied. The concrete slab was then poured while the binder remained tacky, ensuring proper adhesion.
The third method combined mechanical studs with a bonding agent, integrating the first two approaches to utilize both mechanical and adhesive connections.
A total of six push-out specimens were tested under monotonic loading, with two nominally identical specimens in each group. Each concrete plate (Figure 1) was 5 cm thick, positioned 5 cm below the top of the steel plate, and extended 10 cm below to accommodate the installation of measurement devices. The bottom of the slab was widened to 5 cm in height and 12 cm in width for stability during testing. Notably, no reinforcement was used in any of the three specimen types.
2.2. Material Properties
The steel component (Figure 1) used in the specimens is Q345 steel, fabricated by welding five plates with a thickness of 12 mm. The mechanical shear connectors (studs) are made of ML15 steel. The elastic modulus of the steel is taken as approximately 206 GPa, and Poisson’s ratio is 0.3. The characteristic material strengths adopted for the subsequent calculations are a yield strength of 345 MPa and an ultimate tensile strength of 500 MPa for the Q345 steel plate and a yield strength of 345 MPa and an ultimate tensile strength of 445 MPa for the ML15 studs. As the plates and studs were commercially supplied standard products, the nominal properties specified for the corresponding material grades were adopted for the analytical calculations. These values should be understood as nominal rather than batch-specific measured properties, which is a limitation of the present preliminary study.
The concrete matrix uses a high-flow mixture with steel fiber reinforcement to ensure stable behavior during the push-out test. The fiber content is 1.6% (by volume) and includes three types evenly: copper-plated microfine fibers (6 mm, L/D = 30), copper-plated microfine fibers (13 mm, L/D = 65), and hook-ended fibers (25 mm, L/D = 50) to enhance ductility. Material tests [30] show a cube compressive strength of 66.50 MPa, a four-point bending tensile strength of 7.35 MPa, and an elastic modulus of 42.90 GPa.
For specimens with a bonding layer, the interface was formed using a humidity-cured, epoxy-modified binder (model CH-3A, Chenghua Resin Industry, Neijiang, China). According to the manufacturer, the binder has a density of approximately 1.6 g/cm3, a component A:B mass ratio of 10:3, and a pot life of about 40 min at 24–26 °C; its reported strengths are 25.8 MPa (steel–steel butt tensile), 16.7 MPa (steel–steel tensile-shear), 95 MPa (adhesive compressive), and 3.5 MPa (pull-off bond to concrete). Before application, the steel surface was ground with a hand-held angle grinder to remove rust and expose fresh metal, and the binder was mixed at the specified 10:3 mass ratio and applied to both steel–concrete contact surfaces. The target layer thickness was controlled through the applied mass per unit area and uniform spreading with a scraper, giving a practical range of approximately 1–2 mm; this is therefore a controlled range rather than a point-by-point measurement of the interface. Concrete was cast while the adhesive remained tacky, before it became tack-free, and the specimens were then cured for more than one month before testing. Bonding and curing were conducted under the ambient conditions available in Chongqing in September (temperature approximately 30 °C; relative humidity not continuously recorded). The total effective bonded area is defined as 2 × 320 mm × 400 mm and is subsequently used to calculate the bond contribution and interface stress distributions.
Independent interface tests on the selected binder gave a mean concrete–binder shear bond stress of 3.89 MPa (3.47, 4.21, and 4.00 MPa; three specimens), with cohesive failure occurring in the concrete. Four-point flexural tensile tests of steel–adhesive–concrete specimens gave an average interfacial flexural-tensile strength of 5.62 MPa, again with failure predominantly in the concrete. A notched three-point bending test gave a representative steel–concrete interfacial fracture energy of approximately 229 N/m with a brittle post-peak response. These data confirm that the adhesive bond was stronger than the near-surface concrete in the tested configuration, while the low fracture energy is consistent with the abrupt debonding observed in the push-out tests.
2.3. Measure of Strain and Deformation
To obtain the mechanical parameters of the three types of push-out specimens during loading, strain gauges, displacement gauges, and other sensors were strategically installed on the surfaces of the steel plate, concrete, and mechanical studs to record structural responses under different loads.
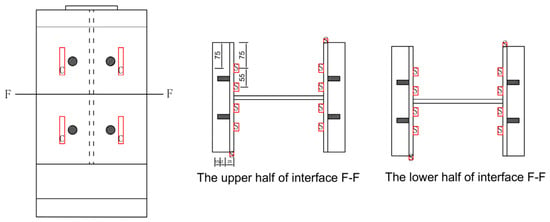
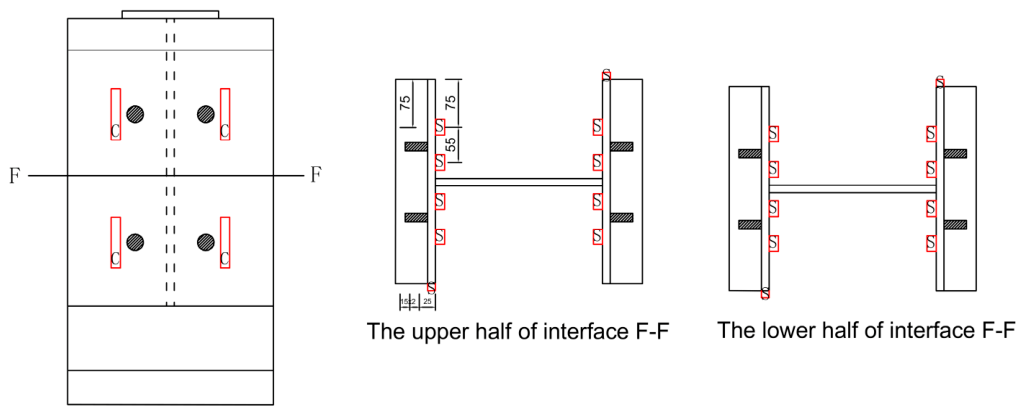
Figure 2 illustrates the arrangement of strain gauges on the surfaces of both concrete slab and steel plates. In this figure, C represents the concrete strain gauges, while S represents the steel strain gauges. A total of 8 strain gauges (model BX120-50AA) were installed on the surface of the concrete slab.
Figure 2.
Schematic diagram of strain gage deployment locations on concrete slab and steel plate.
Strain gauges (model BX120-3AA) were installed on both sides of each mechanical stud on the steel plate, with an additional gauge installed at the same height on the steel depth side, resulting in a total of 20 gauges (Figure 2).
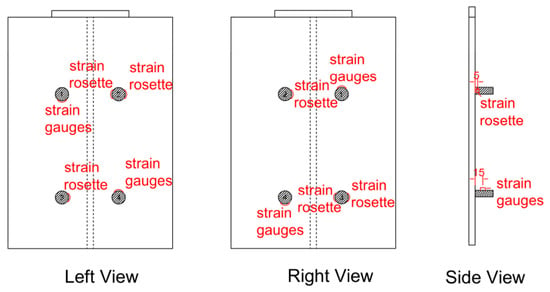
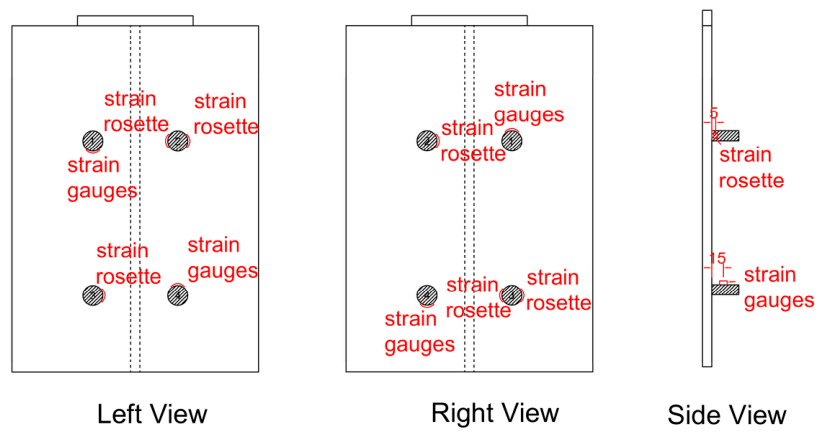
To evaluate the main stress of the mechanical studs, a strain rosette (model 120-1CA) and unidirectional strain gauges with a small gauge length (model BX120-3AA) were installed at the base of the mechanical studs. These gauges were positioned 5 mm from the steel plate, as indicated in Figure 3.
Figure 3.
Schematic diagram of strain gage deployment locations on mechanical studs.
All strain gauges had a resistance of 120 Ω and a sensitivity coefficient of 2.06.
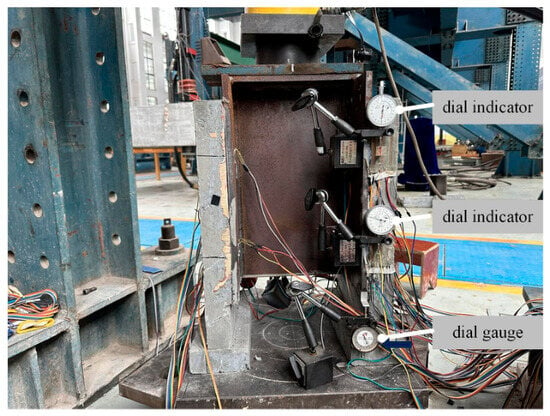
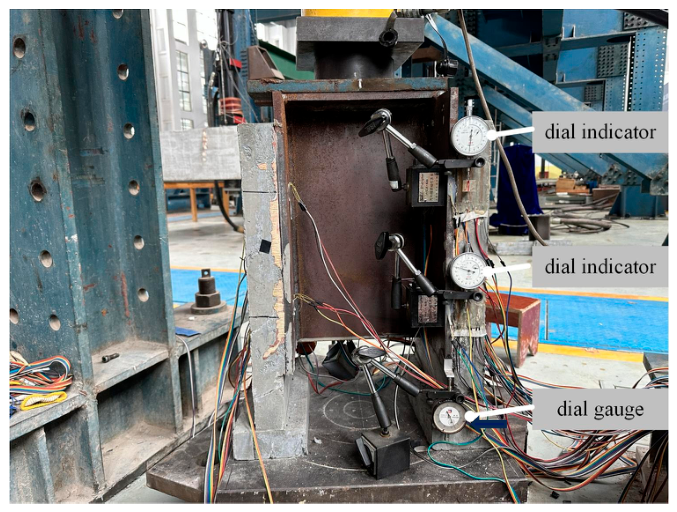
To measure the slip between the concrete slab and the steel plate, magnetic gauge holders were attached to the steel plate at the height of the mechanical studs. Small stoppers were fixed at the same height on the concrete slab to serve as pivot points for the micrometers. The dial indicator with a minimum scale of 0.001 mm were installed diagonally and symmetrically at both the front and back, resulting in a total of four devices.
Additionally, dial gauges with a minimum scale of 0.01 mm were installed at the lower edge of the steel plate to measure the overall movement of the structure. Two percentage meters were arranged in a diagonally symmetrical configuration. The specific arrangement is shown in Figure 4.
Figure 4.
Arrangement of displacement measurement instrumentation on the push-out specimens: dial indicators with a resolution of 0.001 mm to record the relative slip between the steel plate and the concrete slab, and dial gauges with a resolution of 0.01 mm to monitor total displacement of the specimen. Readings from the two symmetrically placed instruments were averaged, and the reported slip is the mean of the two sides.
2.4. Test Loading and Measurement
The test loading setup includes a reaction frame, a 100-ton oil jack, a 100-ton pressure sensor, and a universal hinge (Figure 5).
Figure 5.
Test setup and instrumentation layout: loading frame and actuator, micrometers positions for interface slip and overall displacement, and locations of strain gauges and rosettes on the steel plate, stud bases and concrete slab surfaces.
Strain and displacement measurements were recorded using the JM3812(Yangzhou Jingming Technology Co., Ltd., Yangzhou, China) multifunctional static strain-gauge system. Loading was applied manually under load (force) control, in two stages: a preload stage increased the load to 40 kN in 10 kN steps to check system and instrumentation accuracy; a formal loading stage then applied the test load in 20 kN increments, during which strain, displacement, and slip data were collected and observations (e.g., interfacial separation and cracking sounds) were recorded. Because the load was prescribed rather than the displacement, the test was not able to capture the descending (post-peak) branch: once the bonded interface debonded, the stored energy released abruptly and the response could not be followed in a controlled manner. The post-peak behaviour of the hybrid connection G3 was therefore reconstructed numerically (Section 4.5).
3. Experimental Results
3.1. Ultimate Load Capacity
The ultimate shear capacity represents the maximum load the composite connection can support before failure and is a fundamental design parameter. According to the code-based prediction [31]:
with material parameters mm2, MPa, GPa, GPa, and MPa, the theoretical capacity of a single mechanical stud is approximately 42.45 kN, yielding an overall specimen prediction of 339.6 kN.
The measured ultimate load capacities for the three configurations are presented in Table 2. Mechanical stud specimens (G1) achieved an average ultimate capacity of 474.5 kN (coefficient of variation: 9.5%), representing a 39.7% exceedance over the code prediction. Pure bonding specimens (G2) reached 680 kN (CV: 6%), which is 43.3% higher than mechanical studs alone. Hybrid specimens (G3) combining studs and bonding attained 720 kN (CV: 5.7%), representing a 51.7% increase over studs and a 5.9% increase over pure bonding.
Table 2.
Measured ultimate load capacity of the push-out specimens, with group means and the increase relative to the stud-only baseline (G1).
These preliminary results indicate that the bonding-based configurations achieved higher measured capacities than the stud-only configuration; however, the limited number of specimens does not support a statistically conclusive comparison.
3.2. Load–Displacement Curves
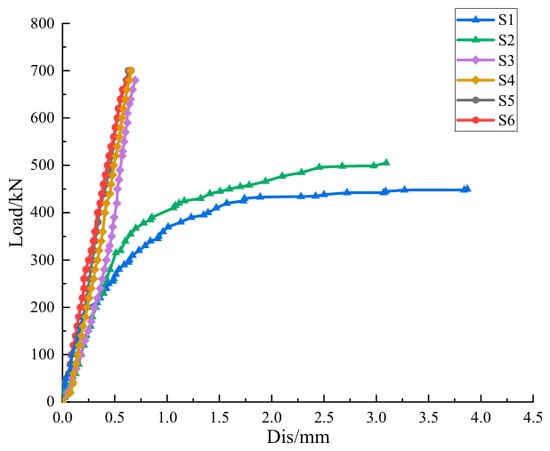
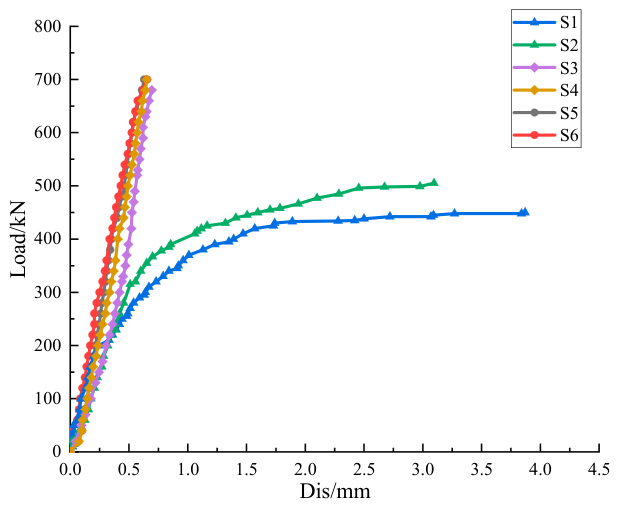
Figure 6 presents the load–displacement curves (measured as overall relative displacement between loading jack and specimen base) for all six specimens. A clear distinction emerges between the three configurations.
Figure 6.
Load–overall displacement curves of all six specimens, measured as the relative displacement between the actuator and the specimen base (includes elastic deformation of the specimen body).
Mechanical stud specimens (S1, S2) display elastic–plastic behavior with two distinct phases. Elastic Phase: Natural adhesion at this early stage (200–300 kN) enables the shear force to be primarily carried by the interface, like the bond layer in the other push-out specimens. Plastic Phase: Once the natural bond (200–300 kN) between the steel and concrete fails, the shear force is mainly resisted by the mechanical studs, resulting in a reduction in the overall stiffness of the specimens, as indicated by a decrease in the curve slope. As the load increases further, the mechanical studs eventually reach full yield, and the displacement increases nonlinearly until the ultimate bearing capacity is reached.
Conversely, the displacement curves (S3–S6, G2 and G3) for the push-out specimens with a bonded layer exhibited purely elastic behavior with a consistent linear relationship between load and displacement throughout the entire loading range.
The recorded response remained approximately linear up to the observed peak load. Because the post-debonding branch was not fully captured under load-controlled testing, complete elastic behavior cannot be inferred beyond the measured range. This resulted in a composite stress structure with enhanced performance.
The consistently lower displacement at failure for bonded specimens further confirms that bonding maintains interface integrity throughout loading, whereas studs permit significant localized slippage.
3.3. Steel–Concrete Interface Slip Curve
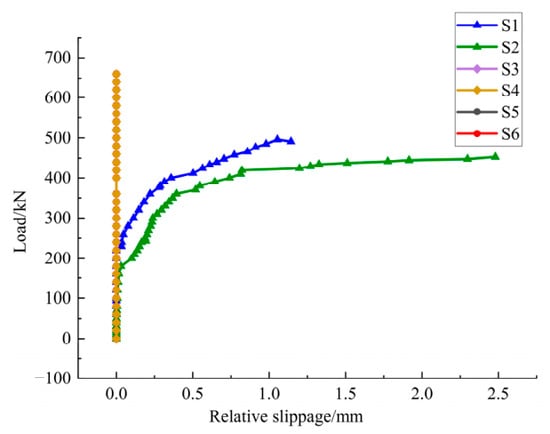
The resulting load–slip curves (Figure 7) reveal clear differences in the load-transfer mechanisms.
Figure 7.
Load–interface slip curves measured by micrometers spanning the steel–concrete interface. The S3–S6 traces overlap and remain below the 0.001 mm resolution of the transducers over the full loading range.
As shown in Figure 7, the mechanical stud launch specimen exhibits three distinct stages. Bonding Stage I: The natural interfacial bond resists shear, and slip remains negligible. Shear is carried partly through the interfacial bond and partly through stud bearing. Consequently, the system shows high initial stiffness. Elasticity Stage II: After interfacial bond rupture (about 200 kN), the studs become the dominant load path. Slip increases approximately linearly with load, indicating stable load transfer governed by stud deformation. Plastic development Stage III: The studs enter strain hardening. The load–slip curve slope decreases significantly, and slip grows nonlinearly. The reduced slope reflects progressive yielding and plastic flow of the studs, leading to diminished resistance to further slip.
For the bonded specimens (G2) and hybrid specimens (G3), the key observation is that slip remains essentially zero measurable throughout the entire loading range (Figure 7, the S3–S6 curves overlap with each other).
This response is fundamentally different from the stud-based mechanism: with the adhesive layer apparently intact during the recorded loading range, the steel and concrete behaved as a strongly coupled composite, and the load–slip relationship would effectively coincide with a zero-slip line (i.e., no detectable relative movement between the interface materials). This near-zero-slip condition indicates that the adhesive maintained effective composite action within the resolution of the displacement measurements.
The near-zero-slip response of the bonded specimens (and the combined specimens) is therefore a critical experimental finding. It confirms that the humidity-cured adhesive, when applied to steel and cast in place with concrete, enables full composite action without deterioration of interfacial contact during loading. As a result, the specimen sustains elastic working conditions, delivers excellent overall performance, and exhibits a stronger steel–concrete composite effect. In contrast, mechanical studs, due to their discrete and localized load transfer nature, inevitably allow relative slip (typically on the order of 1 mm).
3.4. Test Processes and Failure Patterns
The failure evolution of each specimen type revealed distinct mechanisms reflecting the differences in load transfer paths.
3.4.1. Mechanical Stud Specimens (G1)
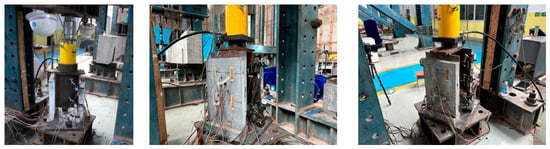
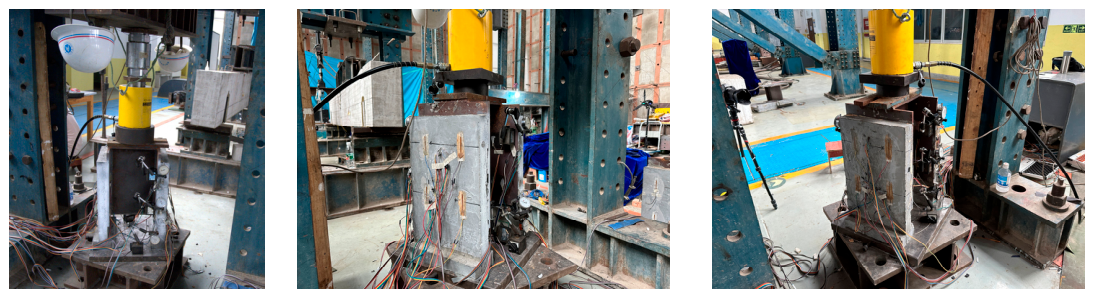
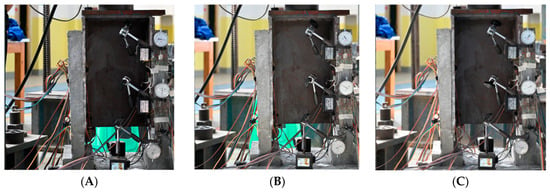
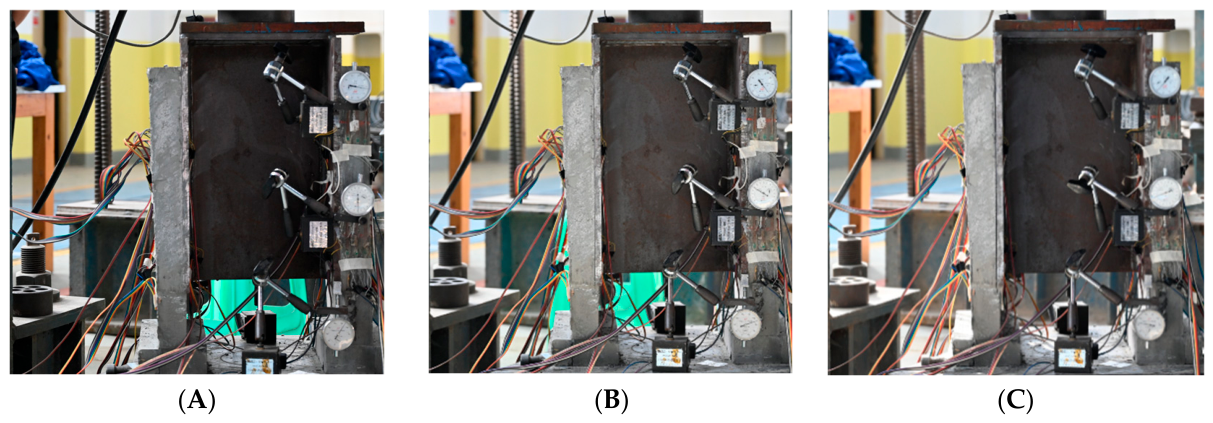
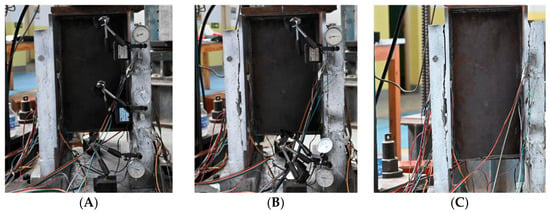
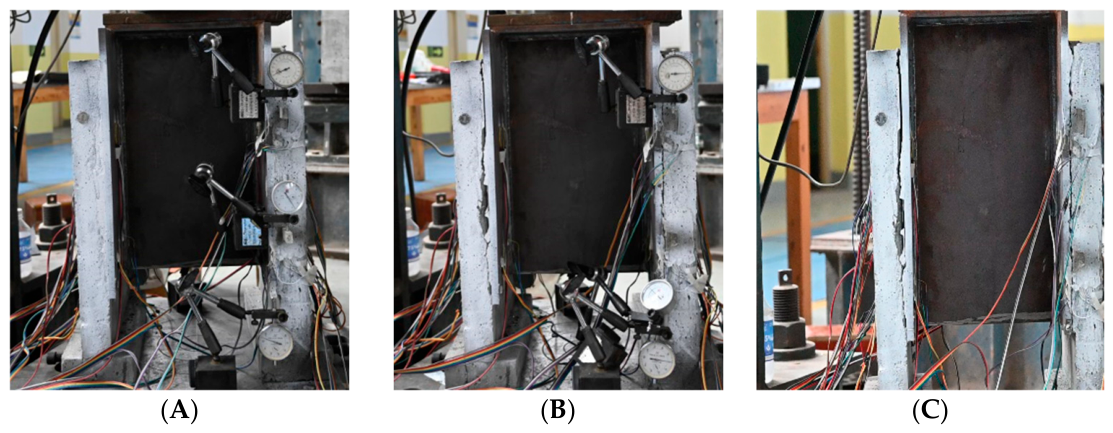
The mechanical stud push-out specimen at different loading stages is shown in Figure 8. During the initial loading phase, the mechanical stud-type push-out specimen benefits from the natural bond between the concrete and the steel plate (Figure 8A). At this stage, this natural bond resists the shear stress at the steel–concrete interface, and the entire specimen exhibits elastic behavior (Figure 6).
Figure 8.
Failure evolution of the stud specimens (G1): (A) intact natural bond at low load; (B) the phase just after the slab separate; (C) the ultimate load phase.
As loading increases, the natural bond at the steel–concrete interface begins to separate (Figure 8B). As a result, the shear forces at the interface are carried solely by the mechanical studs. With continued loading, relative slip occurs between the steel plate and the concrete slab, while the specimen remains elastic (Figure 7).
Before reaching the ultimate load capacity, the mechanical studs enter the yield-strengthening phase and undergo significant plastic deformation (Figure 7 and Figure 8C). During this stage, the specimen experiences substantial overall deformation, and the slip between the concrete and steel plate increases noticeably (Figure 8C). Ultimately, when failure occurs, the mechanical studs undergo considerable deformation and reach their strength limit, resulting in a fracture near the root of the mechanical studs.
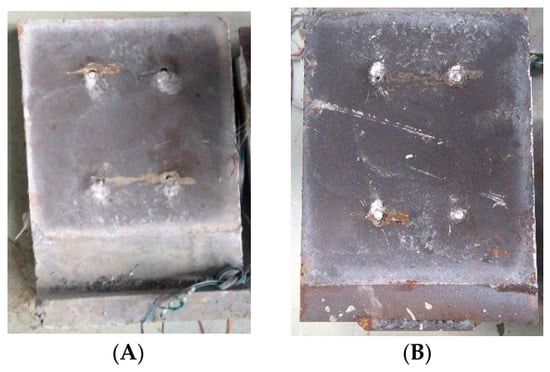
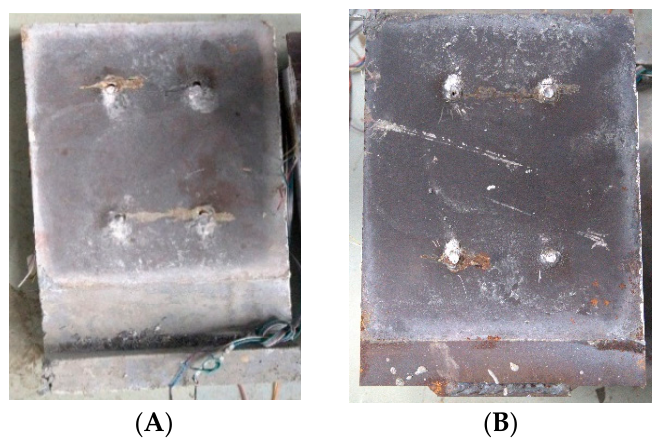
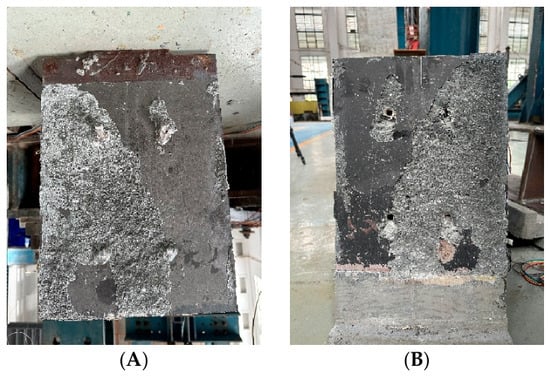
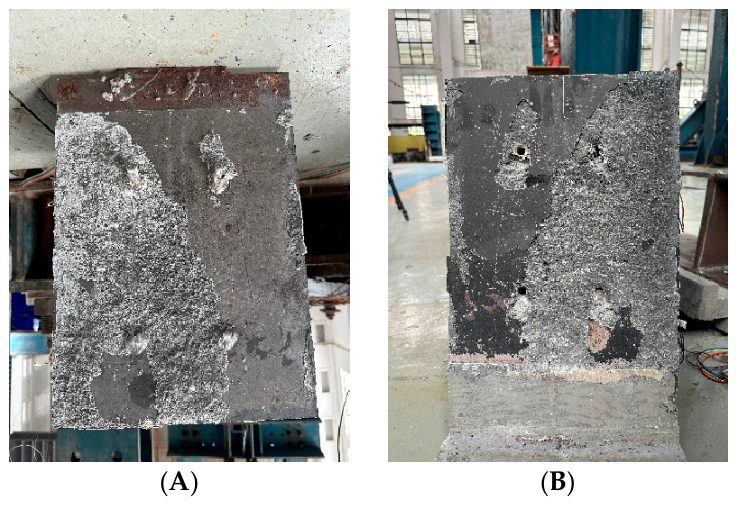
After failure, there is no concrete bond on the steel plate (Figure 9). The mechanical stud specimens fracture at the root (shear fracture), and there are small potholes at the locations of mechanical studs on the interface of the concrete slab due to stud slip, as shown in Figure 9A.
Figure 9.
Steel–concrete interface of the stud-only specimen (G1) after failure: (A) concrete side, showing the stud holes with local crushing of the concrete; (B) steel plate side, showing sheared stud shanks fractured at the weld collar and the smooth, debonded plate surface left by loss of the natural cement–steel bond.
3.4.2. Pure Bonded Specimens (G2)
Bonded specimens maintained excellent adhesion throughout the entire loading process. Critically, measurable interface slip remained zero up to ultimate failure. The specimen remained in a purely elastic state, with load and displacement exhibiting linear relationship (Figure 6, S3–S4).
As loading approached ultimate capacity, occasional audible cracking sounds were observed, indicating incipient microcracking within the concrete matrix adjacent to the interface. Upon a small additional load increment, localized debonding initiated at the steel–concrete boundary, rapidly propagating across the interface. However, this debonding was accompanied by substantial concrete remaining attached to the steel plate, indicating that the failure was internal within the concrete slab rather than at the adhesive interface. This distinction is critical: concrete strength, not adhesive strength, governed the failure mode.
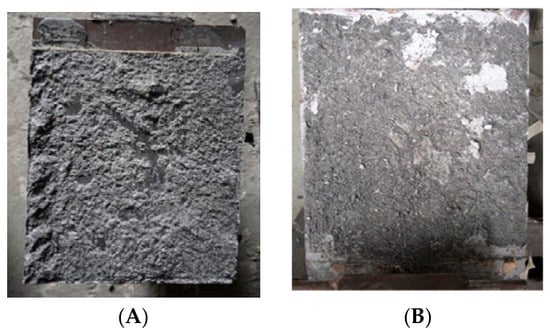
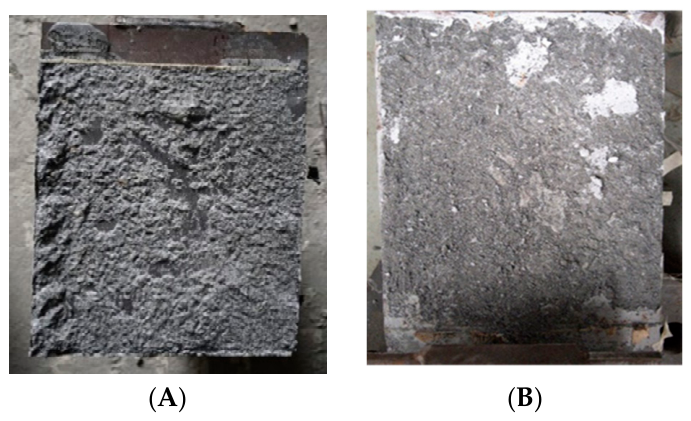
Post-test examination (Figure 10) confirms extensive concrete adhering to the steel surface, with the failure surface located inside the concrete matrix rather than at the adhesive bond line.
Figure 10.
Steel–concrete interface of the pure-bonded specimens (G2) after failure: (A) steel plate side, showing the cured adhesive layer remaining fully attached to the plate with a continuous layer of concrete adhering to it; (B) concrete side, showing the separation surface located within the concrete matrix. No adhesive–-steel debonding was observed over any part of the interface, indicating that the joint was limited by the concrete substrate rather than by adhesion.
3.4.3. Hybrid Specimens (G3, Studs and Bonding)
During the loading phase, the interface between the concrete and steel plate in the bond and mechanical stud specimens consistently exhibits a strong bond (Figure 11A), with the shear force jointly resisted by both the bond layer and the mechanical studs (Figure 7, S5–S6).
Figure 11.
Steel–concrete interface of the hybrid (bonded + stud) specimens at successive loading stages: (A) intact interface before loading; (B) debonding at the ultimate load; (C) interface after failure.
Just before reaching the ultimate load, the specimens emitted slight audible sounds. With a slight further increase in load, debonding began to occur at the interface between the steel and concrete (Figure 11B), but the connection was still maintained by the mechanical studs. At this stage, the load experienced a significant drop, falling slightly below the ultimate load of the pure mechanical stud specimens. The shear force at the interface was now borne solely by the mechanical studs, while the overall loading system remained stable and the structure still exhibited a certain load-bearing capacity.
With continued loading, the load could essentially reach the ultimate bearing capacity of the mechanical stud push-out specimens (Figure 11C), at which point plastic deformation and failure of the mechanical studs occurred, causing the structure to become unstable.
After failure, concrete was found to adhere to the surface of the steel plate, and some mechanical studs experienced shear failure, with the failure zones located within the concrete slab, as shown in Figure 12.
Figure 12.
Interface of the hybrid bonded–stud specimen (G3) after failure: (A) overall view of the steel plate side, showing adhesive and attached concrete debris; (B) corresponding concrete slab surface.
3.5. Concrete Slab Stresses
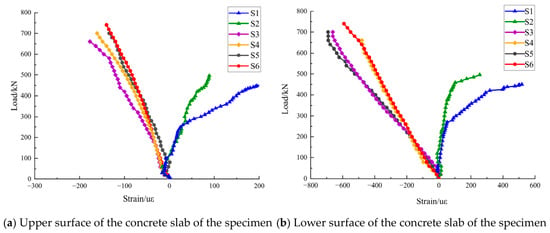
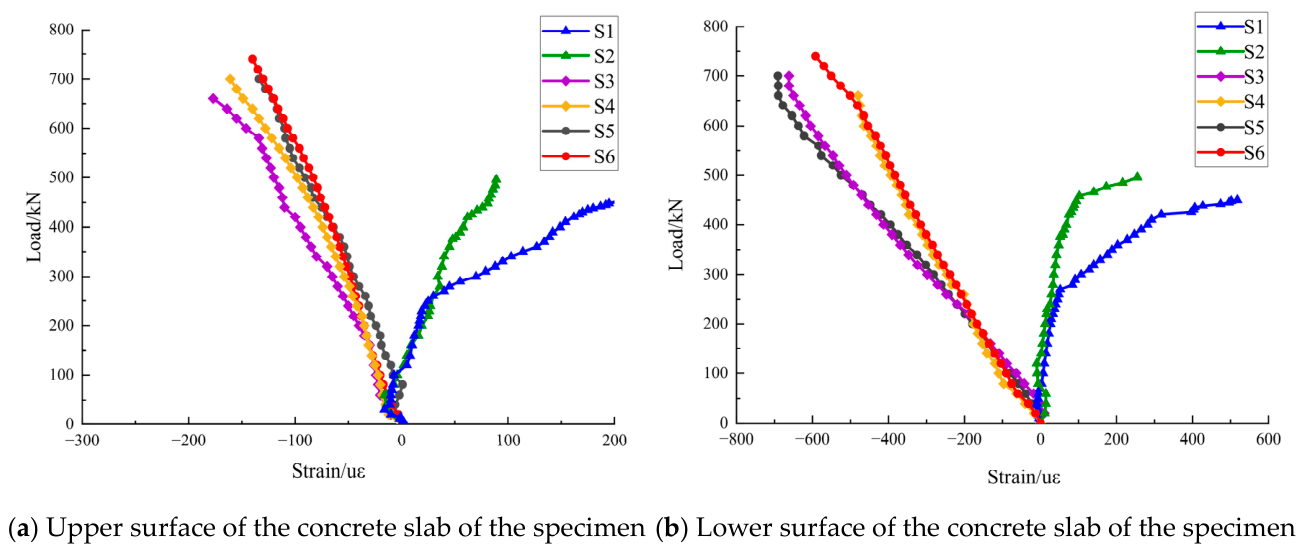
Figure 13 shows the concrete surface strains at the heights of the upper and lower mechanical studs, respectively. The figures reveal clear differences between the push-out specimens with a bonded layer and those with only mechanical stud-type specimens.
Figure 13.
Load–surface strain response of the concrete slab: (a) slab top surface; (b) slab soffit. Positive values denote tension. The stud-only specimen (S1/S2) develops tension exceeding 200 με in strain terms, whereas the bonded and hybrid specimens (S3–S6) remain in compression throughout loading.
At the beginning of the loading process, the strains on the surface of the concrete slabs increase steadily as the applied load rises. This is because the concrete slab and steel plate are initially bonded, causing the entire concrete slab to be uniformly pressurized from both the top and bottom.
As the load increases, the surface of the push-out specimen with the bond layer (S3–S6) remains under compression due to the bond, indicating that both the top and bottom interfaces of the concrete slab experience compressive stresses. In contrast, the compressive stress observed on the surface of the mechanical stud push-out specimens (S1, S2) without a bonded layer does not exhibit a linear relationship with the applied load. Instead, it shifts from compression to tension, which is particularly noticeable on the lower surface of the concrete slab. As the load nears its ultimate capacity, the tensile strain on the concrete surface exceeds 100 με, with the strain on the lower surface surpassing 200 με. At this stage, the tensile strain approaches the cracking strain.
Based on these observations of the concrete surface strains, the following conclusions can be drawn: In the push-out specimen with a bond layer, the surface strain of the concrete slab at the height of the mechanical studs consistently remains in compression. In contrast, in the standard mechanical stud type push-out specimen, as the load increases, the concrete experiences a transition from compression to tension, which may subject the concrete slab to an unfavorable stress state.
3.6. Surface Stresses on Steel Plates
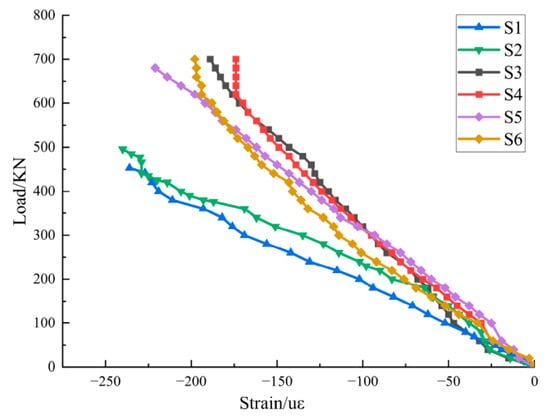
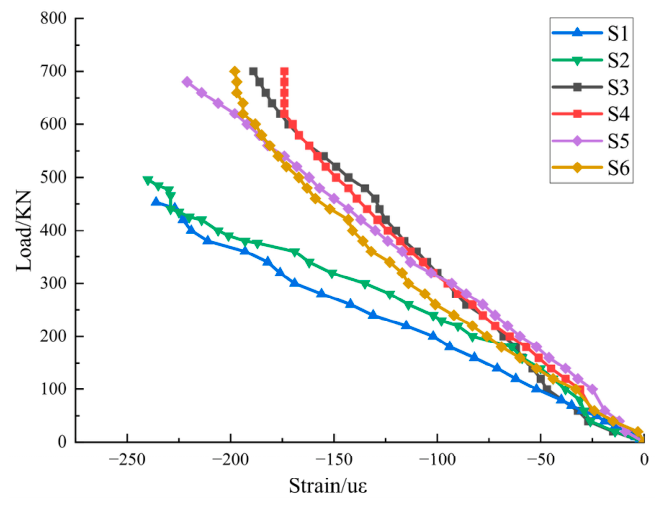
Steel plate backside strains (opposite the concrete) were measured at multiple points aligned with stud locations (Figure 14). The load–strain curves display consistent behavior across the three specimen types:
Figure 14.
Load-strain response measured on the back face of the steel plate in the upper region of the specimen. All specimens remain in compression throughout loading; the bonded and hybrid specimens (S3–S6) show lower magnitude than that of mechanical studs.
At identical loading levels, bonded specimens (S3–S6) exhibit substantially lower strain than stud-only specimens (S1, S2). Under the same load, the steel plate backside strain for studs is greater than that of bonding. This difference reflects the fundamental load-transfer distinction: studs concentrate load locally, producing high local strains in the steel, whereas bonding distributes load uniformly, reducing local strain concentration.
For all specimen types, the load–strain relationship on the steel is approximately linear throughout loading, indicating elastic behavior of the steel itself (shear transfer governs failure, not steel yielding).
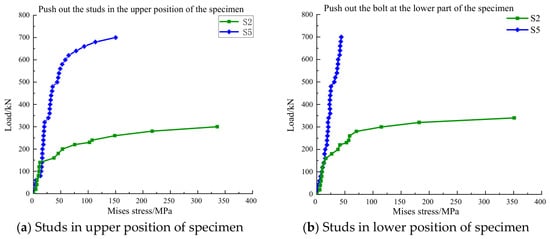
3.7. Stress of the Mechanical Stud
Strain rosettes and uniaxial gauges installed at the stud bases (Figure 3) measured the three-directional strain state. Using the transformation equations for rosette data and the generalized Hooke’s law for plane stress, the equivalent von Mises stress [32] was computed as
Figure 15 presents the load–von Mises stress curves for representative studs in specimens S2 (mechanical studs alone) and S5 (studs and bonding).
Figure 15.
Load–equivalent (von Mises) stress at the stud bases, derived from rosette measurements via plane-stress Hooke’s law: (a) studs in the upper row; (b) studs in the lower row. Curves are compared for stud-only (S2) and hybrid (S5) specimens; the dashed line marks the ML15 ultimate strength of 445 MPa.
As shown in Figure 15, the push-out specimen (S2), which depended solely on mechanical studs, initially showed a lower stress level due to the natural bond between the steel plate and the concrete. However, once this natural bond failed, the stress on the mechanical studs increased with the applied load, leading to plastic deformation. This excessive deformation eventually damaged the strain gauges. As the load continued to rise, the mechanical studs experienced shear damage, ultimately resulting in structural failure.
In contrast, for the push-out specimen (S5) with a bonded layer, the shear stresses remained consistently low as the load increased, and even at the maximum load capacity, the stress level was much lower than its ultimate strength of 445 MPa. The presence of the bond layer (S5) significantly reduces stress levels on the mechanical studs. Shear stress at the interface is uniformly transferred from the steel plate and bond layer to the concrete slab, promoting a more even distribution of stress throughout the steel–concrete composition structure and greatly decreasing stress concentration. Even after the bond layer is separated, the interface shear stress can still be supported by the mechanical studs, providing secondary load capacity.
When comparing the von Mises stresses of the mechanical studs in both types of specimens under the same loading conditions, it is evident that the bond layer greatly reduces the stresses of the mechanical studs, resulting in a more uniform distribution of overall stress within the structure.
4. Failure Mechanism and Interface Stress Analysis
4.1. Difference in Load-Transfer Area
The essential distinction between the two connection types lies in the geometric scale of the load-transfer interface. In the stud specimens, load is transferred through eight φ13 mm studs, giving an effective shear area of
In the bonded specimens, load is transferred over the entire steel–concrete contact area, mm2 (the sum of both shear planes of the push-out specimen). The two areas differ by a factor of 241. This difference in magnitude implies a fundamental change in the load-transfer mode: from discrete point transfer concentrated at the stud roots to continuous surface transfer distributed along the interface.
4.2. Interface Stress Levels of the Two Connection Types
For the stud specimens, the nominal average shear stress at failure, obtained by dividing the failure load by the actual shank shear area, is
This nominal value is of the same order as the ultimate tensile strength of the stud material (445 MPa). It should be noted, however, that 447 MPa is a nominal average obtained from the total force and the shank cross-section and does not represent the true stress state in the studs: under push-out loading the shank is subjected to combined shear, bending, and local bearing, so the actual stress field is multiaxial and non-uniform across the section. The nominal value is therefore not directly comparable to the uniaxial tensile strength, and the closeness of the two figures is reported only as an indication that the capacity of group G1 was governed by the studs themselves, consistent with the connector failure mode observed in the tests.
For the bonded interface, the nominal interfacial shear stress at failure is
For comparison purposes only, the capacity of G1 may also be expressed as a stress smeared over the full interface area,
It must be emphasized that 1.85 MPa is a notional quantity obtained by distributing the stud load over the entire interface and likewise does not represent the true stress state of the studs. The purpose of presenting these values together is not to compare them with any material strength but to show that, for an identical interface geometry, continuous bonding sustains a nominal interfacial shear stress approximately 1.4–1.5 times that of the smeared stud arrangement.
4.3. Location of Failure Initiation and the Governing Mechanism
In none of the specimens did failure occur at the adhesive–steel interface. After dismantling G2 and G3, a thin layer of concrete remained attached to the steel plate, indicating that the failure surface was located within the concrete substrate in the near-surface region (Figure 10 and Figure 12).
It must be noted, however, that the nominal shear stress of 2.66 MPa is far below the pure shear strength of the steel fibre concrete used ( MPa), which may be estimated as 0.12–0.2 , i.e., approximately 8–13 MPa.
Consequently, failure initiated within the concrete not because the adhesive layer was stronger than the concrete in an absolute sense, but because the bonded interface distributed the load over an area some two orders of magnitude larger than the discrete stud sections, reducing the nominal interfacial shear stress to a few megapascals. At this level the adhesive layer remained intact, whereas the concrete adjacent to the interface was governed not by its pure shear strength, which for the present fibre-reinforced mix ( MPa) is of the order of 8–13 MPa, but by the combined shear–peeling stress concentration that develops at the ends of a continuously bonded joint. The failure surface located a few millimeters inside the concrete matrix is therefore the signature of a transfer mechanism that has shifted from concentrated point transfer at the studs to distributed surface transfer along the bonded plane, and it also indicates that the measured capacities of the bonded specimens were limited by the substrate rather than by the adhesion itself. Table 3 consolidates the measured capacities and the interface quantities derived in Section 4.1, Section 4.2 and Section 4.3 for the three configurations.
Table 3.
Summary of measured and derived interface quantities for the three configurations. Load-transfer areas, governing, and nominal shear stresses are those derived in Section 4.1, Section 4.2 and Section 4.3.
4.4. Damage Interpretation and Limitations
The observed damage can be described using a local damage-evolution framework that distinguishes local crushing or cracking, interface separation, and subsequent changes in the structural load path. This framework is consistent with the damage-description approach reported for steel–concrete–steel composite structures [33], although that reference concerns penetration and explosive loading whereas the present study concerns quasi-static push-out loading; only the damage-evolution concept, and not the specific results, is adopted here.
In G1, the discrete studs produced local bearing, bending, and shear effects in the surrounding concrete, followed by stud deformation and interface slip. In G2, the continuous adhesive layer transferred shear over the bonded area; damage initiated and propagated near the plate ends, where coupled shear and peeling effects are expected, and the final fracture occurred mainly in the concrete near the interface. In G3, the adhesive provided the dominant load path before debonding, while the studs remained available as a secondary load path afterwards. The complete post-peak response and the end-region stress concentration are quantified by the finite-element analysis presented in Section 4.5.
No transverse reinforcement was provided in any specimen. This common boundary condition makes the three configurations comparable within the present test matrix, but it may reduce the confinement against splitting and near-surface concrete fracture and may also promote local crushing or cracking around the studs in G1. Consequently, the measured capacities and failure modes should not be directly generalized to reinforced bridge decks or other members with transverse confinement.
The interfacial shear stress, peeling stress, and end-to-middle stress concentration, together with the numerically reconstructed post-debonding load path of G3, are examined in the finite-element analysis presented next (Section 4.5), which is validated against the measured pre-peak response before being used to interpret the post-peak behavior.
4.5. Finite Element Verification
To interpret the failure mechanism and to recover the post-peak response of G3 that could not be measured, a three-dimensional finite element model was established in ABAQUS/Standard 2025. Because the push-out tests were conducted under manual load-controlled loading, the brittle post-peak branch of G3 released its energy abruptly and damaged the displacement transducers, so this response could not be captured experimentally; a displacement-controlled FE model was therefore used to recover it.
A quarter model was adopted owing to double symmetry, and the computed reaction was multiplied by four. The concrete slabs and studs were meshed with quadratic tetrahedral elements (C3D10) and the steel plates with reduced-integration hexahedral elements (C3D8R). The adhesive interlayer was represented by a cohesive zone (COH3D8) following a traction–separation law. Because the interfacial tests failed cohesively within the concrete, the cohesive-zone parameters were calibrated to the concrete-governed interfacial strength (τ = 3.5 MPa, Gf = 229 N/m) rather than to the bulk adhesive strength; a comparable finite-element treatment, in which the failure mode shifts from adhesive-layer failure to cohesive failure as the interface strength governs, has been reported for bonded steel–concrete connections [34].
Accordingly, the cohesive layer represents the equivalent bond zone linking the steel plate, adhesive, and adjacent concrete. Concrete was modelled with the concrete damaged plasticity (CDP) model calibrated to the measured properties (E = 42.9 GPa; axial compressive strength fc = 61.7 MPa, converted from the measured cube strength of 66.50 MPa), and the stud–concrete interface used frictional contact. Loading was displacement-controlled.
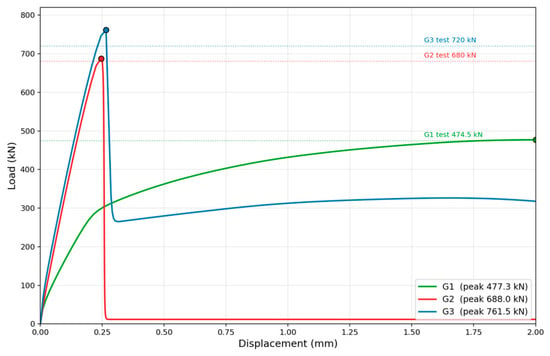
As shown in Figure 16, the model reproduces the three interfacial behaviors well. The predicted peak loads of G1, G2, and G3 are 477.3, 688.0, and 761.5 kN, deviating from the measured values (474.5, 680, 720 kN) by +0.6%, +1.2%, and +5.8%, respectively; the larger deviation for G3 stems from the idealized zero-clearance stud–hole assumption, which allows the studs to engage slightly earlier than in the physical specimen.
Figure 16.
Comparison of experimental and finite-element load–displacement curves for the three connection configurations: G1 (stud-only connection), G2 (adhesive-bonded connection), and G3 (hybrid connection). Solid lines represent the experimental results, dashed lines represent the finite-element results, and symbols indicate the measured data points.
The FE model recovers the post-peak branch of G3. After the peak, the load drops abruptly from 761.5 kN to about 265 kN and then stabilizes at a residual capacity of about 323 kN (about 68% of the residual capacity of the stud-only case G1).
Examination of the damage fields clarifies the sequence of interfacial degradation. At the peak displacement (0.265 mm), the cohesive layer is already extensively degraded (mean stiffness-degradation SDEG = 0.81, with 87% of the cohesive elements exceeding 0.5), whereas the concrete tensile damage remains negligible (mean DAMAGET = 0.0003, with no element exceeding 0.5).
By the debonding state (0.314 mm), the cohesive layer has failed completely (SDEG = 1.0 throughout), while the adjacent concrete shows only minor tensile damage (mean DAMAGET = 0.002, with fewer than 0.1% of elements exceeding 0.5).
In the present model, the degradation is therefore essentially confined to the equivalent bond zone: the model reproduces the loss of interfacial load transfer at debonding but, at this calibration, does not reproduce the near-surface concrete fracture observed experimentally. This discrepancy is addressed in the limitation stated below.
This sequence explains why the secondary capacity of the hybrid connection G3 is lower than that of the stud-only connection G1: the interfacial failure damages and de-confines the concrete around the studs so that the re-engaged studs act on a partially degraded matrix. The hybrid connection therefore does not simply superimpose the post-peak advantages of the two mechanisms; instead it exhibits a sequential resisting behavior, consistent with the coupled adhesive-plus-stud shear response reported for hybrid bonded–bolted interfaces [35]—adhesive-dominated peak resistance was followed by stud-dominated residual resistance.
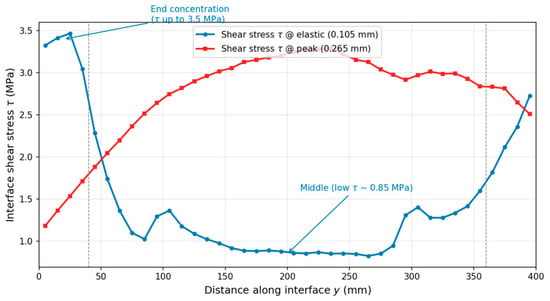
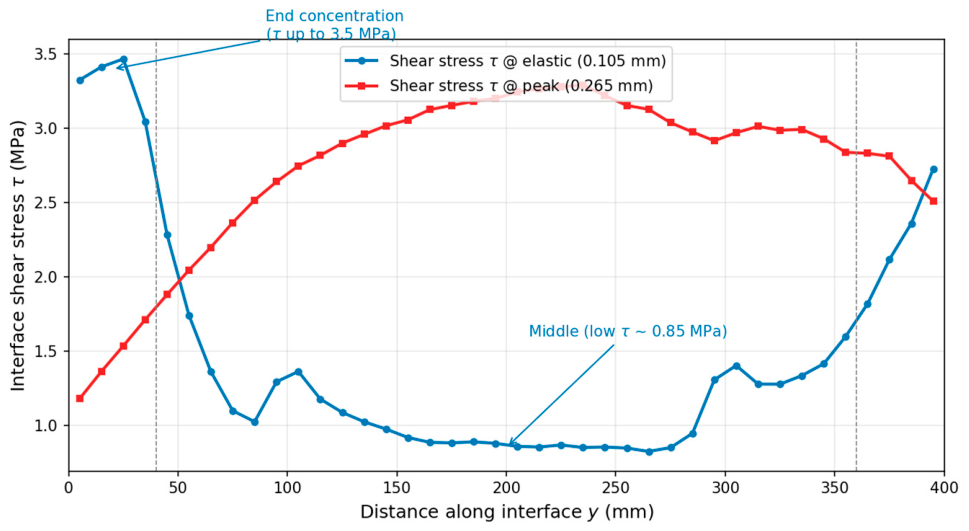
The predicted interfacial shear and peeling stresses concentrate near the slab ends (Figure 17): in the elastic stage the shear stress follows a U-shaped distribution along the bond length, with an end-to-mid ratio of about 3.2 (end mean 3.31 MPa versus mid-span 0.87 MPa; peak 3.47 MPa at the loaded end), and the peeling stress shows an end-to-mid ratio of about 5 (+1.52 versus +0.31 MPa). These concentrations are consistent with debonding initiating from the loaded end and propagating toward mid-span, and they support the use of the model for the subsequent fatigue study.
Figure 17.
Interfacial shear stress distribution along the bonding length of G3 at the elastic and peak stages, showing end-region concentration in the elastic stage and stress redistribution toward mid-span at peak load.
Scope and limitation of the FE model: In the physical specimens the fracture surface developed within the near-surface concrete (concrete-side cohesive failure), whereas in the present model the failure localizes within the equivalent bond zone with the surrounding concrete, remaining almost undamaged. This difference arises because the interface was represented by a single cohesive layer calibrated to the concrete-governed bond strength, which captures the peak resistance and the loss of interfacial load transfer but not the exact location of the fracture surface. Reproducing the near-surface concrete fracture would require embedding a thin damageable concrete layer at the steel–concrete interface, which is left for future work. Accordingly, the FE model is used here only for the two purposes for which it is validated: (i) to recover the post-peak load path of G3, which could not be measured experimentally, and (ii) to quantify the end-region stress concentration. The precise location of the fracture surface is outside the calibration target of the present model.
5. Discussion: Bonding Changes the Load-Transfer Mechanism, Not Just Its Magnitude
5.1. From Point Transfer to Surface Transfer
The stud shanks and the bonded interface operate at incomparable stress levels: at failure, studs reached
close to the ML15 ultimate strength (445 MPa)—though as noted in Section 4.2 this nominal average is not directly comparable to the uniaxial tensile strength, while the bond carried only MPa over an area 241 times larger. This is well below the pure-shear strength of the matrix (8–13 MPa), indicating that rupture is governed by a combined shear peeling state at the bonded plate ends rather than by shear alone. The two systems are therefore not a strong and a weak version of the same connector; they are two different transfer mechanisms: concentrated material exhaustion versus distributed low-stress area. Consequently the 43.3% capacity margin is a by-product of this mechanism change, not an independent finding.
5.2. From Slip-Dependent to Slip-Free Behavior
Stud specimens developed slip up to 1 mm through a three-stage response; bonded specimens showed no slip resolvable by the instrumentation at any load level (resolution 0.001 mm, Figure 7). Treating the epoxy as an elastic layer (t ≈ 1.5 mm, with G assumed as ≈3 GPa, since the shear modulus of the adhesive was not measured in this study), the predicted slip at is , an order of magnitude estimate consistent with the instrumental resolution.
This confirms that bonding does not merely reduce slip but removes the mechanism that requires it: studs provide partial composite action mobilized through connector deformation, while bonding provides full composite action with connection stiffness two to three orders of magnitude higher (G1 initial stiffness 2.3 kN/mm).
5.3. From a Bending-Type Field to Uniform Compression
Discrete studs transmit shear as eight concentrated forces, forcing the slab to span locally between them and driving the soffit into tension (220 με near ultimate load). Continuous bonding replaces this with a near-uniform traction, and the slab remained in compression throughout loading in G2 and G3. Consistently, the strains measured at the stud roots in the hybrid specimens remained far below yield level while the bond was intact, indicating that the studs act as dormant reserve elements, not parallel load paths, when bonding governs.
5.4. Why Hybrid Resistance Is Not Additive
Because the two mechanisms mobilize at deformations differing by roughly two orders of magnitude (0.001 mm vs. ~1 mm), they cannot be summed: kN is close to kN, not to kN. The value of the hybrid detail is sequential, not cumulative: bonding controls stiffness and eliminates slip at service level; after debonding, the studs re-engage and the load path recovers to approximately the stud-only capacity (Figure 11C), converting an otherwise brittle failure into a staged one. This is the direct consequence of the mechanism transition described above, and it is why the hybrid configuration, not pure bonding, is the form recommended for further development.
5.5. Cost of the Transition and Remaining Barriers
Replacing a slip-dependent mechanism with a slip-free one removes the deformation capacity that mechanism also provided: bonded specimens failed abruptly below the mm ductility threshold of EN 1994-1-1, precluding plastic design in pure bonding [26,27,28,29,30,31,32,33,34,35,36,37]. This is treated here as an inherent consequence of the mechanism change rather than a defect to be tuned away. Before field application, three factors governing the stability of this new mechanism remain unquantified: the adhesive’s glass-transition temperature relative to deck service and overlay-paving temperatures, creep under sustained load, which has been shown to redistribute the load sharing between adhesive and studs over time [38], and fatigue behaviour at the peeling-dominated bond ends. Claims of durability, fatigue performance and cost-effectiveness are accordingly not made in this paper.
6. Conclusions
Six push-out specimens were tested to examine whether a humidity-cured epoxy applied to steel, with concrete cast directly onto the uncured adhesive, can serve as a shear connection in steel–concrete composite structures. Within the scope of the tested configuration (unreinforced, 50 mm thick steel-fibre concrete slabs under monotonic load control at ambient temperature), the following conclusions are drawn.
- The wet-bonding process is mechanically feasible. In all bonded specimens the fracture surface lay within the concrete matrix, with a continuous concrete layer retained on the steel plate. The bond line formed under wet-cast, humidity-cured conditions therefore developed a resistance exceeding the near-surface capacity of the concrete substrate and was not the critical link. This is the principal result of the study.
- The measured capacity ranking is configuration-specific. Mean ultimate loads were 474.5 kN (studs), 680 kN (bonding) and 720 kN (hybrid). The 43.3% margin of bonding over studs is attributable primarily to the 241-fold difference in mobilized interface area ( mm2 versus mm2) and is amplified by the absence of transverse reinforcement, which penalised the stud baseline. It should not be extrapolated to code-compliant reinforced details. The 5.9% difference between hybrid and pure bonding is within the experimental scatterplots.
- The two connection types operate at incomparable stress levels. At failure, the stud shanks reached MPa, close to the ML15 ultimate strength (though as noted in Section 4.2, this nominal average is not directly comparable to uniaxial tensile strength owing to the multiaxial stress state), whereas the bonded interface carried a mean shear stress of only 2.66 MPa—far below the matrix pure-shear strength. Rupture of the bonded interface is governed by a combined shear–peeling state at the plate ends rather than by shear alone.
- Bonded connections deliver near-rigid composite action at service load. Slip in bonded and hybrid specimens remained below the 0.001 mm resolution of the instrumentation, consistent in order of magnitude with the elastic shear deformation predicted for a 1–2 mm epoxy layer ( mm). Correspondingly, the concrete slab remained wholly in compression, whereas stud specimens developed bottom-surface tensile strains of about 220 με arising from the local bending field induced by discrete connectors.
- Pure bonding lacks the ductility required for composite design. Failure was abrupt, with negligible slip capacity and minimal warning; the connection cannot satisfy the mm ductility criterion of EN 1994-1-1 and is unsuitable for plastic or partial shear connection design in its pure form.
- The hybrid configuration is the practically recommendable form. Stud and bond resistances are not additive because they mobilize at incompatible deformation levels. The value of combining them is sequential rather than cumulative: the adhesive governs stiffness and eliminates slip at service level, while the studs provide a post-debonding reserve (about 323 kN, ~68% of the stud-only residual capacity) that is mobilized only after bond rupture, replacing a brittle failure with a staged one. The studs are therefore not intended to reduce the number of shear connectors or to share the service-load transfer; they act as a secondary, fail-safe load path that prevents the sudden, complete loss of load transfer characterizing the purely bonded connection G2. The value of the hybrid form thus lies in converting brittle debonding into a more progressive, damage-tolerant response, rather than in economizing on welded connectors.
It should be noted that no transverse reinforcement was provided in any specimen. While this keeps the three configurations mutually comparable, it reduces confinement against splitting and, in particular, penalises the stud-only baseline; the capacity ranking and the bonding-over-studs margin reported here should therefore not be extrapolated to EN 1994-1-1-compliant reinforced details, which is why the reinforced stud baseline noted above is treated as a priority.
Priority is assigned to characterization of the adhesive (lap-shear and bulk tensile strength, modulus, and in particular relative to deck service temperatures); repetition of the stud baseline with EN 1994-1-1-compliant transverse reinforcement to establish an unbiased comparison; displacement-controlled testing to capture the descending branch and quantify slip capacity; cohesive-zone finite element modelling calibrated to these tests to separate shear and peeling contributions and to extend the results to realistic slab thicknesses; and sustained-load, thermal-cycling and fatigue programmes.
Until these are completed, the method should be regarded as a validated laboratory concept rather than a substitute for welded shear connectors, and its most defensible near-term application is as a stiffness-enhancing supplement to conventional studs rather than as their replacement.
Author Contributions
J.D.: Conceptualization, Supervision, Writing, review and editing, Funding acquisition. Y.Z.: Investigation, Data curation, Formal analysis. J.G.: Conceptualization, Methodology, Supervision, Formal analysis, Writing, original draft, Writing, review and editing, Project administration, Funding acquisition. W.C.: Investigation, Resources, Validation. J.S.: Supervision, Writing—review and editing. F.Z.: Supervision, Writing—review and editing. H.Z.: Investigation, Data curation, Visualization, Writing—review and editing. All authors have read and agreed to the published version of the manuscript.
Funding
This research received no external funding.
Data Availability Statement
The data presented in this study are available on request from the corresponding author. The data are not publicly available due to privacy or ethical restrictions.
Conflicts of Interest
Authors Jiangtian Di and Junjie Sun were employed by the company Chengdu Transportation Investment Group Co., Ltd., Author Yu Zhao was employed by the company Chengdu Jiaotou Xingrongxi Urban Development and Construction Co., Ltd., Authors Weiye Cao and Fuwei Zhu were employed by the company Chengdu Road and Bridge Operation and Management Co., Ltd. The remaining authors declare that the research was conducted in the absence of any commercial or financial relationships that could be construed as a potential conflict of interest.
References
- Oehlers, D.J.; Bradford, M.A. Composite Steel and Concrete Structural Members: Fundamental Behaviour; Pergamon: Oxford, UK, 1995. [Google Scholar]
- Vayas, I.; Iliopoulos, A. Design of Steel-Concrete Composite Bridges to Eurocodes; CRC Press: Boca Raton, FL, USA, 2013. [Google Scholar]
- Du, W.; Hu, Z.; Zhou, Z. Analytical Study of Stud Shear Connector Behavior in Steel–UHPC Composite Structures. Buildings 2024, 14, 3807. [Google Scholar] [CrossRef] [Scilit]
- Guo, S.; Liu, C.; Ma, X. Flexural Performance of Steel–Normal Concrete–Ultra-High-Performance Concrete Composite Slabs with Steel Ribs. Buildings 2024, 14, 1301. [Google Scholar] [CrossRef] [Scilit]
- Eligehausen, R.; Sawade, G. A fracture mechanics based description of the pull-out behavior of headed studs embedded in concrete. In Fracture Mechanics of Concrete Structures: From Theory to Applications; Elfgren, L., Ed.; Chapman and Hall: London, UK, 1989; pp. 281–299. [Google Scholar]
- Yang, Y.; Chen, Y. Experimental study on mechanical behavior of PBL shear connectors. J. Bridge Eng. 2018, 23, 04018062. [Google Scholar] [CrossRef] [Scilit]
- Shim, C.S.; Lee, P.G.; Yoon, T.Y. Static behavior of large stud shear connectors. Eng. Struct. 2004, 26, 1853–1860. [Google Scholar] [CrossRef] [Scilit]
- Xue, D.; Liu, Y.; Yu, Z.; He, J. Static behavior of multi-stud shear connectors for steel-concrete composite bridge. J. Constr. Steel Res. 2012, 74, 1–7. [Google Scholar] [CrossRef] [Scilit]
- Xue, W.; Ding, M.; Wang, H.; Luo, Z. Static behavior and theoretical model of stud shear connectors. J. Bridge Eng. 2008, 13, 623–634. [Google Scholar] [CrossRef] [Scilit]
- Zhang, Y.; Chen, B.; Liu, A.; Pi, Y.L.; Zhang, J.; Wang, Y.; Zhong, L. Experimental study on shear behavior of high strength bolt connection in prefabricated steel-concrete composite beam. Compos. Part B Eng. 2019, 159, 481–489. [Google Scholar] [CrossRef] [Scilit]
- Haisma, J.; Spierings, G.A.C.M. Contact bonding, including direct-bonding in a historical and recent context of materials science and technology, physics and chemistry. Mater. Sci. Eng. R Rep. 2002, 37, 1–60. [Google Scholar] [CrossRef] [Scilit]
- Daouadji, T.H.; Abbès, F.; Bensatallah, T.; Abbès, B. Analytical and Numerical Investigation of Adhesive-Bonded T-Shaped Steel–Concrete Composite Beams for Enhanced Interfacial Performance in Civil Engineering Structures. Inventions 2025, 10, 61. [Google Scholar] [CrossRef] [Scilit]
- Adams, R.D. (Ed.) Adhesive Bonding: Science, Technology and Applications; Woodhead Publishing: Cambridge, UK, 2021. [Google Scholar]
- Marques, E.A.S.; Barbosa, A.S.Q.F.; Carbas, R.J.C.; Akhavan-Safar, A.; da Silva, L.F.M. Introduction to Adhesive Bonding; Wiley-VCH: Weinheim, Germany, 2021. [Google Scholar]
- Huang, W.; Qian, Z.; Chen, G.; Yang, J. Epoxy asphalt concrete paving on the deck of long-span steel bridges. Chin. Sci. Bull. 2003, 48, 2391–2394. [Google Scholar] [CrossRef] [Scilit]
- Liu, X.; Zhou, C.; Cao, Q.; Chen, L.; Feng, D. Experimental study on properties of epoxy binder and epoxy bonding chips layer for steel bridge deck pavement. Road Mater. Pavement Des. 2022, 23, 2451–2465. [Google Scholar] [CrossRef] [Scilit]
- Zhang, M.; Hao, P.; Men, G.; Liu, N.; Yuan, G. Research on the compatibility of waterproof layer materials and asphalt mixture for steel bridge deck. Constr. Build. Mater. 2021, 269, 121346. [Google Scholar] [CrossRef] [Scilit]
- Zhou, L.; Zhang, D.; Li, X.; Gao, Z.; Chen, Q.; Wang, C. Overview: Application of resin waterproof adhesive materials in bridge deck pavement in China. Adv. Civ. Eng. 2022, 2022, 2320374. [Google Scholar] [CrossRef] [Scilit]
- Chen, Y.; Tong, J.; Li, Q.; Xu, S.; Shen, L. Application of high-performance cementitious composites in steel-concrete composite bridge deck systems: A review. J. Intell. Constr. 2024, 2, 1–23. [Google Scholar] [CrossRef] [Scilit]
- Wei, Y.; Guo, W.; Ma, L.; Liu, Y.; Yang, B. Materials, structure, and construction of a low-shrinkage UHPC overlay on concrete bridge deck. Constr. Build. Mater. 2023, 406, 133353. [Google Scholar] [CrossRef] [Scilit]
- Li, V.C. Engineered cementitious composite (ECC): Material, structural, and durability performance. In Concrete Construction Engineering Handbook; Nawy, E.G., Ed.; CRC Press: Boca Raton, FL, USA, 2008; pp. 1023–1070. [Google Scholar]
- Shoji, D.; He, Z.; Zhang, D.; Li, V.C. The greening of engineered cementitious composites (ECC): A review. Constr. Build. Mater. 2022, 327, 126701. [Google Scholar] [CrossRef] [Scilit]
- Ji, J.; Zhang, Z.; Lin, M.; Li, L.; Jiang, L.; Ding, Y.; Yu, K. Structural application of engineered cementitious composites (ECC): A state-of-the-art review. Constr. Build. Mater. 2023, 406, 133289. [Google Scholar] [CrossRef] [Scilit]
- Shao, J.; Jiang, H.; Zhang, L.; Huang, W.; Mou, T.; Sun, Y. Experimental Study on Flexural Behavior of Bonded Steel–Concrete Composite Beams. Sci. Rep. 2025, 15, 11451. [Google Scholar] [CrossRef] [Scilit] [PubMed]
- Zhou, H.; Zhang, Z.; Wu, C.; Wang, H.; Yang, J.; Zou, Y. Shear performance of high-strength bolt-epoxy bonding composite connector in steel-concrete composite structure. Structures 2024, 61, 106085. [Google Scholar] [CrossRef] [Scilit]
- Bouazaoui, L.; Perrenot, G.; Delmas, Y.; Li, A. Experimental study of bonded steel concrete composite structures. J. Constr. Steel Res. 2007, 63, 1268–1278. [Google Scholar] [CrossRef] [Scilit]
- Zhao, G.; Li, A. Numerical study of a bonded steel and concrete composite beam. Comput. Struct. 2008, 86, 1830–1838. [Google Scholar] [CrossRef] [Scilit]
- Si Larbi, A.; Ferrier, E.; Jurkiewiez, B.; Hamelin, P. Static behaviour of steel concrete beam connected by bonding. Eng. Struct. 2007, 29, 1034–1042. [Google Scholar] [CrossRef] [Scilit]
- Wang, Z.; Nie, X.; Fan, J.S.; Lu, X.Y.; Ding, R. Experimental and numerical investigation of the interfacial properties of non-steam-cured UHPC-steel composite beams. Constr. Build. Mater. 2019, 195, 323–339. [Google Scholar] [CrossRef] [Scilit]
- GB/T 50081-2019; Standard for Test Methods of Concrete Physical and Mechanical Properties. China Architecture & Building Press: Beijing, China, 2019. (In Chinese)
- GB 50917-2013; Code for Design of Steel and Concrete Composite Bridges. China Planning Press: Beijing, China, 2013. (In Chinese)
- Freddi, A.; Olmi, G.; Cristofolini, L. Experimental Stress Analysis for Materials and Structures; Springer: Cham, Switzerland, 2015. [Google Scholar]
- Liu, C.; Gao, F.; Deng, S.; Wang, Z.; Lu, H.; Deng, G.; Wang, M. Investigation on the Damage and Assessment of Steel–Concrete–Steel Composite Structures Subjected to Penetration and Explosive Loadings. Structures 2026, 83, 110841. [Google Scholar] [CrossRef] [Scilit]
- Kumar, P.; Kasar, A.A.; Chaudhary, S. Numerical Analysis of Interfacial Failure Mechanism in Bonded Steel–Concrete Composite Connections. Int. J. Steel Struct. 2023, 23, 1279–1293. [Google Scholar] [CrossRef] [Scilit]
- Zhou, D.; Song, C.; Feng, H.; Yang, G. Concrete Members Strengthened by Adhesive-Bolted Steel Plates: Shear Behaviour of the Composite Connection Interface. Structures 2025, 71, 107985. [Google Scholar] [CrossRef] [Scilit]
- EN 1994-1-1:2004; Eurocode 4: Design of Composite Steel and Concrete Structures—Part 1-1: General Rules and Rules for Buildings. European Committee for Standardization (CEN): Brussels, Belgium, 2004.
- Luo, Y.; Li, A.; Kang, Z. Reliability-based design optimization of adhesive bonded steel–concrete composite beams with probabilistic and non-probabilistic uncertainties. Eng. Struct. 2011, 33, 2110–2119. [Google Scholar] [CrossRef] [Scilit]
- Li, A.; Yurtdas, I.; Abbes, B. Creep in Steel–Concrete Composite Beams Bonded by Adhesive and Connected by Studs. Structures 2025, 74, 108560. [Google Scholar] [CrossRef] [Scilit]

Disclaimer/Publisher’s Note: The statements, opinions and data contained in all publications are solely those of the individual author(s) and contributor(s) and not of MDPI and/or the editor(s). MDPI and/or the editor(s) disclaim responsibility for any injury to people or property resulting from any ideas, methods, instructions or products referred to in the content. |
© 2026 by the authors. Licensee MDPI, Basel, Switzerland. This article is an open access article distributed under the terms and conditions of the Creative Commons Attribution (CC BY) license.