


Abstract
To investigate the dynamic response and failure mechanisms of reinforced concrete (RC) T-shaped columns under blast loading, field blast tests on 1/2-scaled components were conducted in this study to systematically examine the effects of axial compression ratio and explosive charge mass on the macroscopic failure modes of the specimens. Based on the experimental results, a three-dimensional finite element model incorporating the fluid–structure interaction (FSI) algorithm was established and validated using LS-DYNA. Subsequently, a parametric analysis was conducted focusing on cross-sectional dimensions, axial compression ratio, detonation position, and explosive charge mass. The analysis indicates that the explosive charge mass directly determines the extent of structural damage. The influence of the axial compression ratio on the blast-resistant performance exhibits evident nonlinear characteristics; maintaining a moderate axial load or enlarging the cross-sectional dimensions can effectively suppress the dynamic displacement of the components and mitigate damage. Furthermore, eccentric blast loading induces severe coupled bending-shear deformation, substantially compromising the blast-resistant stability of the components. To quantify the degree of damage, this study proposes a three-level damage classification criterion (minor, moderate, and severe) for T-shaped columns, utilizing the maximum support rotation as the evaluation index. Finally, based on the equivalent single-degree-of-freedom (SDOF) theory, a theoretical three-stage resistance function model applicable to T-shaped columns was derived. The calculation results of this model are in good agreement with both experimental and simulation data, providing robust theoretical support for the blast-resistant design and post-disaster assessment of RC special-shaped columns.
1. Introduction
Dense urban building clusters face severe explosion risks that can trigger progressive collapse and cause massive casualties. These threats primarily stem from two sources: first, warfare and terrorist attacks, such as the extensive destruction of buildings caused by the Palestinian–Israeli and Russian–Ukrainian conflicts; second, industrial accidents, such as the catastrophic explosions at Tianjin Port and the Xiangshui chemical plant in Jiangsu, which resulted in devastating damage. Such devastating events highlight the urgent need to research the blast resistance of buildings.
To clarify the dynamic mechanical properties of RC columns under blast loading, numerous researchers globally have conducted extensive experimental studies and numerical simulations based on various blast scenarios. Lan et al. [1] employed finite element simulation technology to evaluate the damage effects of portable explosive detonations on RC columns, confirming that densifying stirrups can effectively mitigate component damage. Focusing on the shock waves generated by underground explosions, Hao et al. [2] and Cui et al. [3] investigated the elastoplastic dynamic behavior and dynamic buckling phenomena of steel columns, pointing out that the buckling characteristics of the components are significantly influenced by both the site vibration frequency and the column’s top weight. Bao et al. [4] focused their research on the residual load-bearing capacity of RC columns post-explosion, developing an empirical prediction model that uses the ratio of mid-span lateral displacement to column height as the core evaluation index. To enable the rapid assessment of component damage, Dakhakhni et al. [5] introduced a nonlinear multi-degree-of-freedom calculation model, which comprehensively considers key variables such as the material’s dynamic strain rate, axial pressure, and bending stiffness, thereby generating pressure-impulse (P-I) curve bands for component failure. Shi et al. [6,7] similarly utilized numerical simulations to reveal the failure mechanisms and dynamic response processes of RC columns under blast loading, and fitted a P–I curve function through data regression, providing a theoretical tool for the rapid prediction of damage states. Based on real-field blast tests, Shi et al. [8] clarified the damage influence patterns of two core elements—axial compression ratio and scaled standoff distance—pointing out that under near-field explosion conditions, a mere 3.7% reduction in the scaled standoff distance results in a 25% surge in the component’s damage degree. Meanwhile, they confirmed that the mechanism by which the axial compression ratio affects structural blast resistance exhibits strong nonlinear characteristics as the standoff distance varies. Su et al. [9] established a three-dimensional numerical simulation model based on a brittle damage constitutive relationship, focusing on the lateral displacement evolution and failure modes of columns when the scaled standoff distance ranges from 0.5 to 2.5 m/kg1/3. The results demonstrated that the transverse deformation of the components decreases sharply with increasing standoff distance; once this parameter exceeds 2.5 m/kg1/3, the damage caused by the blast impact becomes virtually negligible.
Due to their spatial efficiency and visual appeal, special-shaped columns have been widely applied in Chinese residential construction, covering over 25 million square meters. With the rise of high-rise buildings, researching the mechanical, seismic, fire, and blast-resistant properties of these columns has become increasingly important.
Regarding the blast resistance of special-shaped columns, Wang and Xu [10] showed that enlarging the diameter of the built-in core steel tube or increasing the wall thickness of the core steel, combined with the confinement of high-strength densified stirrups, can enhance the dynamic load-bearing threshold and energy dissipation capacity of the components. Han et al. [11] and Wei [12] utilized high-fidelity numerical simulation methods to further demonstrate that asymmetric cross-sections, such as L-shapes, are highly prone to complex coupled bending-torsion failure characteristics when subjected to blast shock loads. In such complex stress fields, the built-in steel structure plays a crucial protective role in suppressing excessive plastic deformation of the components and preventing the occurrence of brittle shear failure. Focusing on special-shaped cross-sections with different configurations, Wang [13] conducted an in-depth study on open-web cross-shaped steel-reinforced concrete columns, revealing the propagation trajectory of stress waves within the components under strong dynamic loads. This study clarified the significant regulatory effect of the open-web ratio on the overall lateral stiffness and energy dissipation efficiency of the components. Wang [14] focused on the applied research of green building materials, analyzing the negative impact of an increased replacement rate of recycled aggregates on the dynamic load-bearing strength of the components. Based on this, a technical pathway was proposed to compensate for the strength loss by optimizing the steel reinforcement ratio. For traditional reinforced concrete special-shaped columns, Ren [15] pointed out that reasonable end boundary constraints and an appropriate increase in the slenderness ratio are effective ways to improve their blast resistance. Zhou et al. [16] and Huang [17] completed more detailed quantitative evaluations, elucidating how the volumetric stirrup ratio, cross-sectional geometric symmetry, and differences in blast locations jointly determine the macroscopic lateral displacement trajectory, damage evolution logic, and final failure level of the components. Zhou et al. [18] deeply analyzed the damage evolution laws of steel-reinforced concrete T-shaped columns under cyclic loading, pioneering the construction of a two-parameter damage quantification model based on drift angle and energy dissipation, which provided a basis for performance-based seismic design. Furthermore, Zhang [19] demonstrated that despite inherent asymmetric geometric defects, frame systems with special-shaped columns can maintain overall stability during local support failures via efficient load redistribution.
This study conducted field blast tests on eight groups of 1/2-scaled RC T-shaped columns. Using the experimental data for validation, a reliable finite element model was established to simulate the columns under blast loading. A parametric analysis was then performed to systematically investigate the effects of cross-sectional dimensions, axial compression ratio, blast location, and explosive charge mass on dynamic responses. To quantify component damage, a three-level classification criterion (minor, moderate, and severe) was proposed based on the maximum support rotation. Finally, a three-stage resistance function model for T-shaped columns was constructed using the equivalent single-degree-of-freedom (SDOF) theory. The accuracy of this theoretical model was verified against experimental and simulation data, providing robust support for the blast-resistant design and post-disaster assessment of RC special-shaped columns.
2. Experimental Overview and Results Analysis
2.1. Specimen Design and Experimental Setup
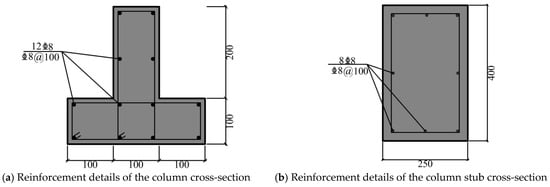
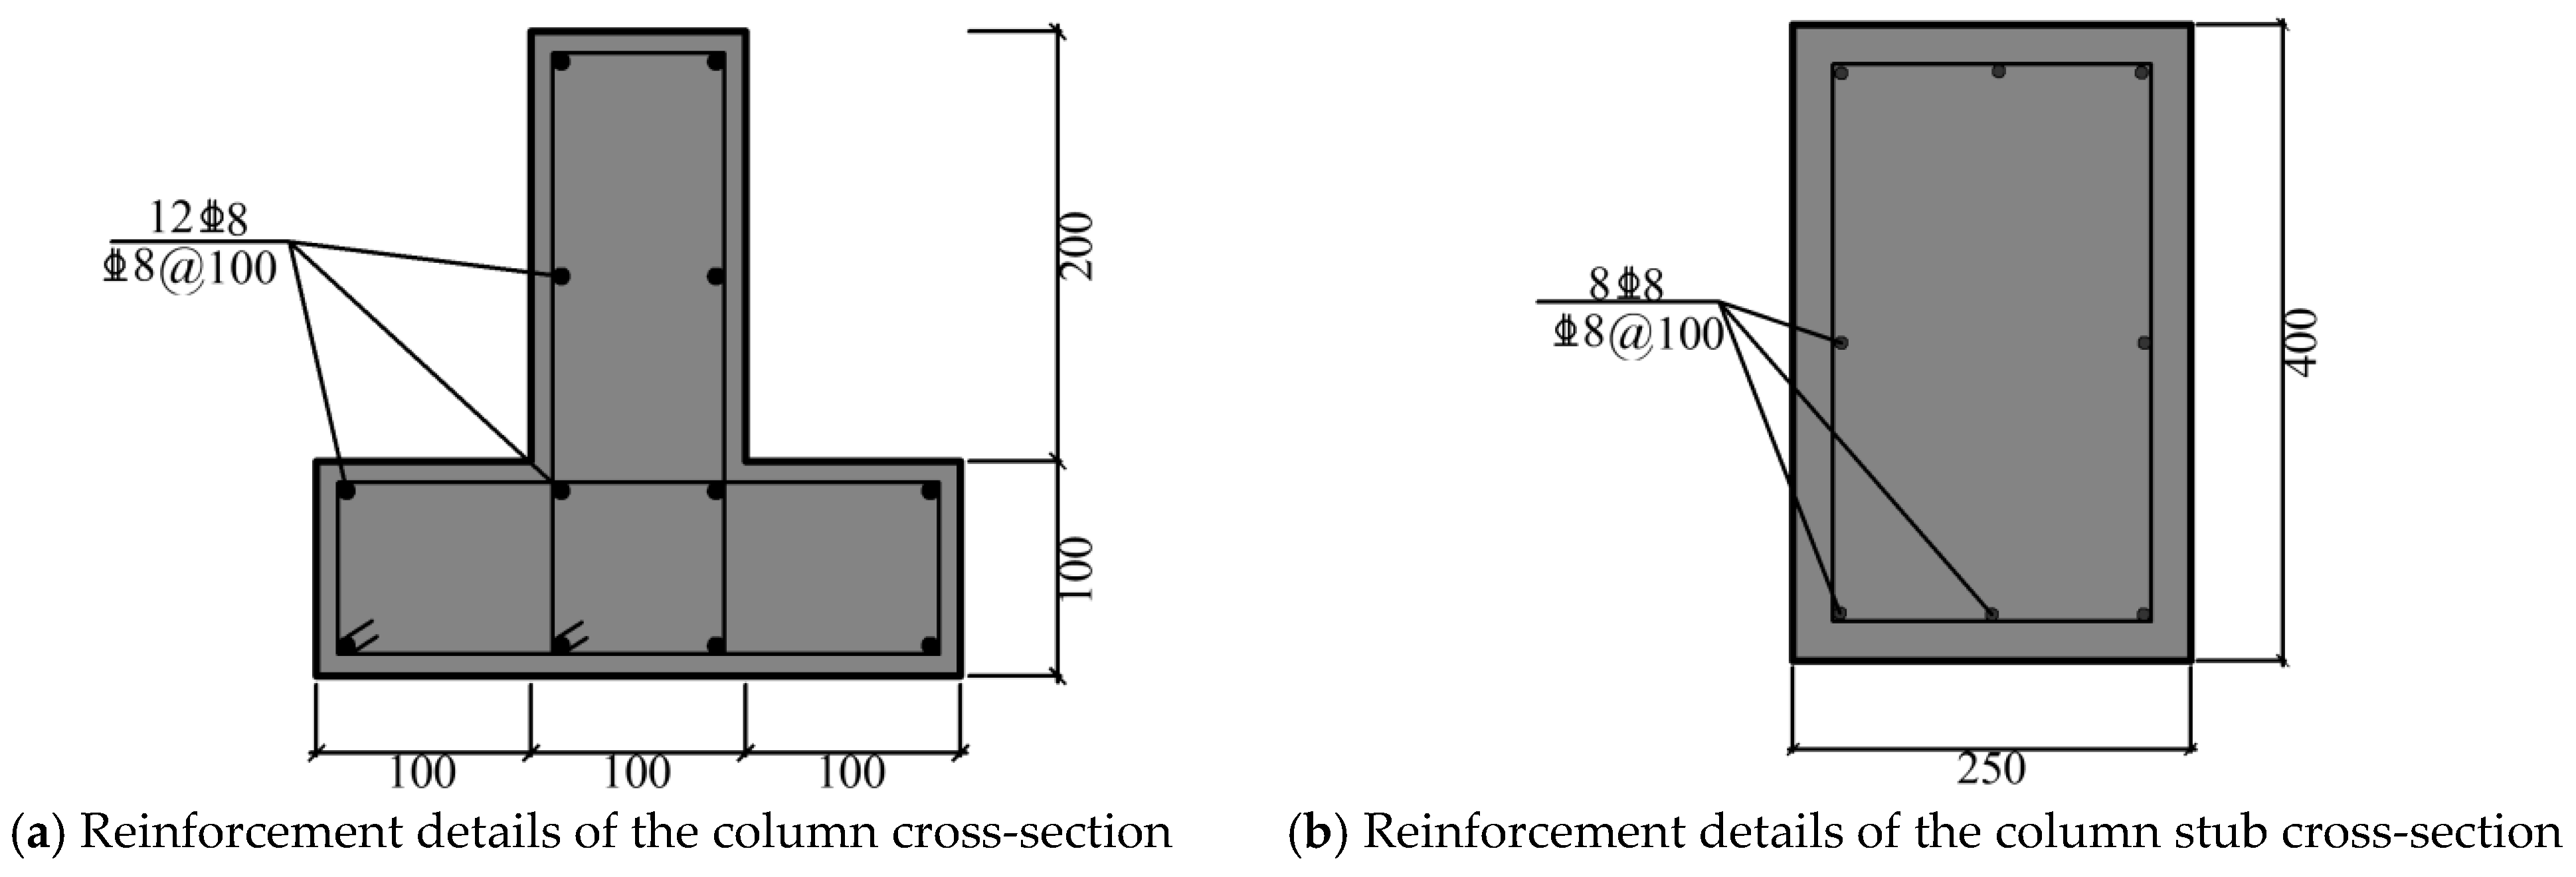
A scaled-down experiment was conducted using reinforced concrete (RC) T-shaped columns from mid-to-high-rise buildings as prototypes. The parameter design of the T-shaped columns strictly complied with the Code for Design of Concrete Structures (GB 50010-2010) [20], the Technical Specification for Concrete Structures of Tall Buildings (JGJ 3-2010) [21], and the Technical Specification for Concrete Structures with Specially Shaped Columns (JGJ 149-2017) [22]. The test columns were cast with C40 concrete. Based on similarity theory (scaling factor λ = 2), the principal dimensions of the test columns were 300 mm × 300 mm × 2100 mm. The T-shaped column features a flange thickness of 100 mm and a web length of 200 mm. The longitudinal reinforcement consisted of twelve 8-mm-diameter HRB400 steel bars, yielding a longitudinal reinforcement ratio of 1.2%. The stirrups were made of 8-mm-diameter HRB400 steel bars, spaced at 100 mm in the densified zones and 200 mm in the non-densified zones, resulting in a volumetric stirrup ratio of 0.85%. To simulate the fixed boundary conditions of columns in actual engineering practice, concrete stubs were cast at both ends of the test columns to enhance end constraint stiffness. This design prevented the ends from failing prior to the column shaft during testing, thereby ensuring effective load transfer to the column body. The end concrete stubs measured 250 mm × 400 mm × 400 mm. The longitudinal bars of the columns extended continuously through these stubs, which were additionally reinforced with eight 8-mm-diameter longitudinal bars and 8-mm-diameter stirrups spaced at 100 mm. The cross-sectional reinforcement details of the specimens are illustrated in Figure 1.
Figure 1.
Cross-sectional reinforcement details.
The compressive strength of three 150 mm × 150 mm × 150 mm cubic specimens, prepared during casting, was tested using a YE-5000 compression testing machine. As shown in Table 1, the compressive strengths of the three concrete specimens were 40.2 MPa, 41.1 MPa, and 40.3 MPa, respectively, yielding an average strength of 40.5 MPa.
Table 1.
Concrete property test record form.
To evaluate the mechanical properties of the steel reinforcement, three randomly selected specimens were tested using a UTM100KN universal testing machine; the results are presented in Table 2.
Table 2.
Reinforcement performance test record form.
In this experiment, the primary variables were the explosive charge mass, axial compression ratio, and explosive location. The axial compression ratio is defined by the following equation:
where is the applied axial force, is the concrete axial compressive strength (taken as 19.1 MPa), and is the gross cross-sectional area of the T-shaped column. The axial compression ratio ranged from 0 to 0.35, corresponding to applied axial forces of 0 kN, 143 kN, 238 kN, and 334 kN, respectively. The explosive charge mass was set to 1 kg, 3 kg, and 4 kg, and detonation locations were positioned at 1050 mm, 700 mm, and 350 mm from the column base. Case A2 served as the baseline scenario, with all specific experimental conditions detailed in Table 3.
Table 3.
Blast test cases for T-shaped column components.
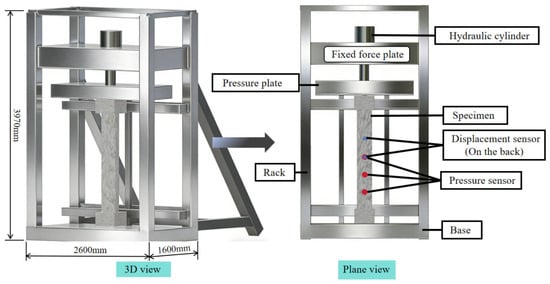
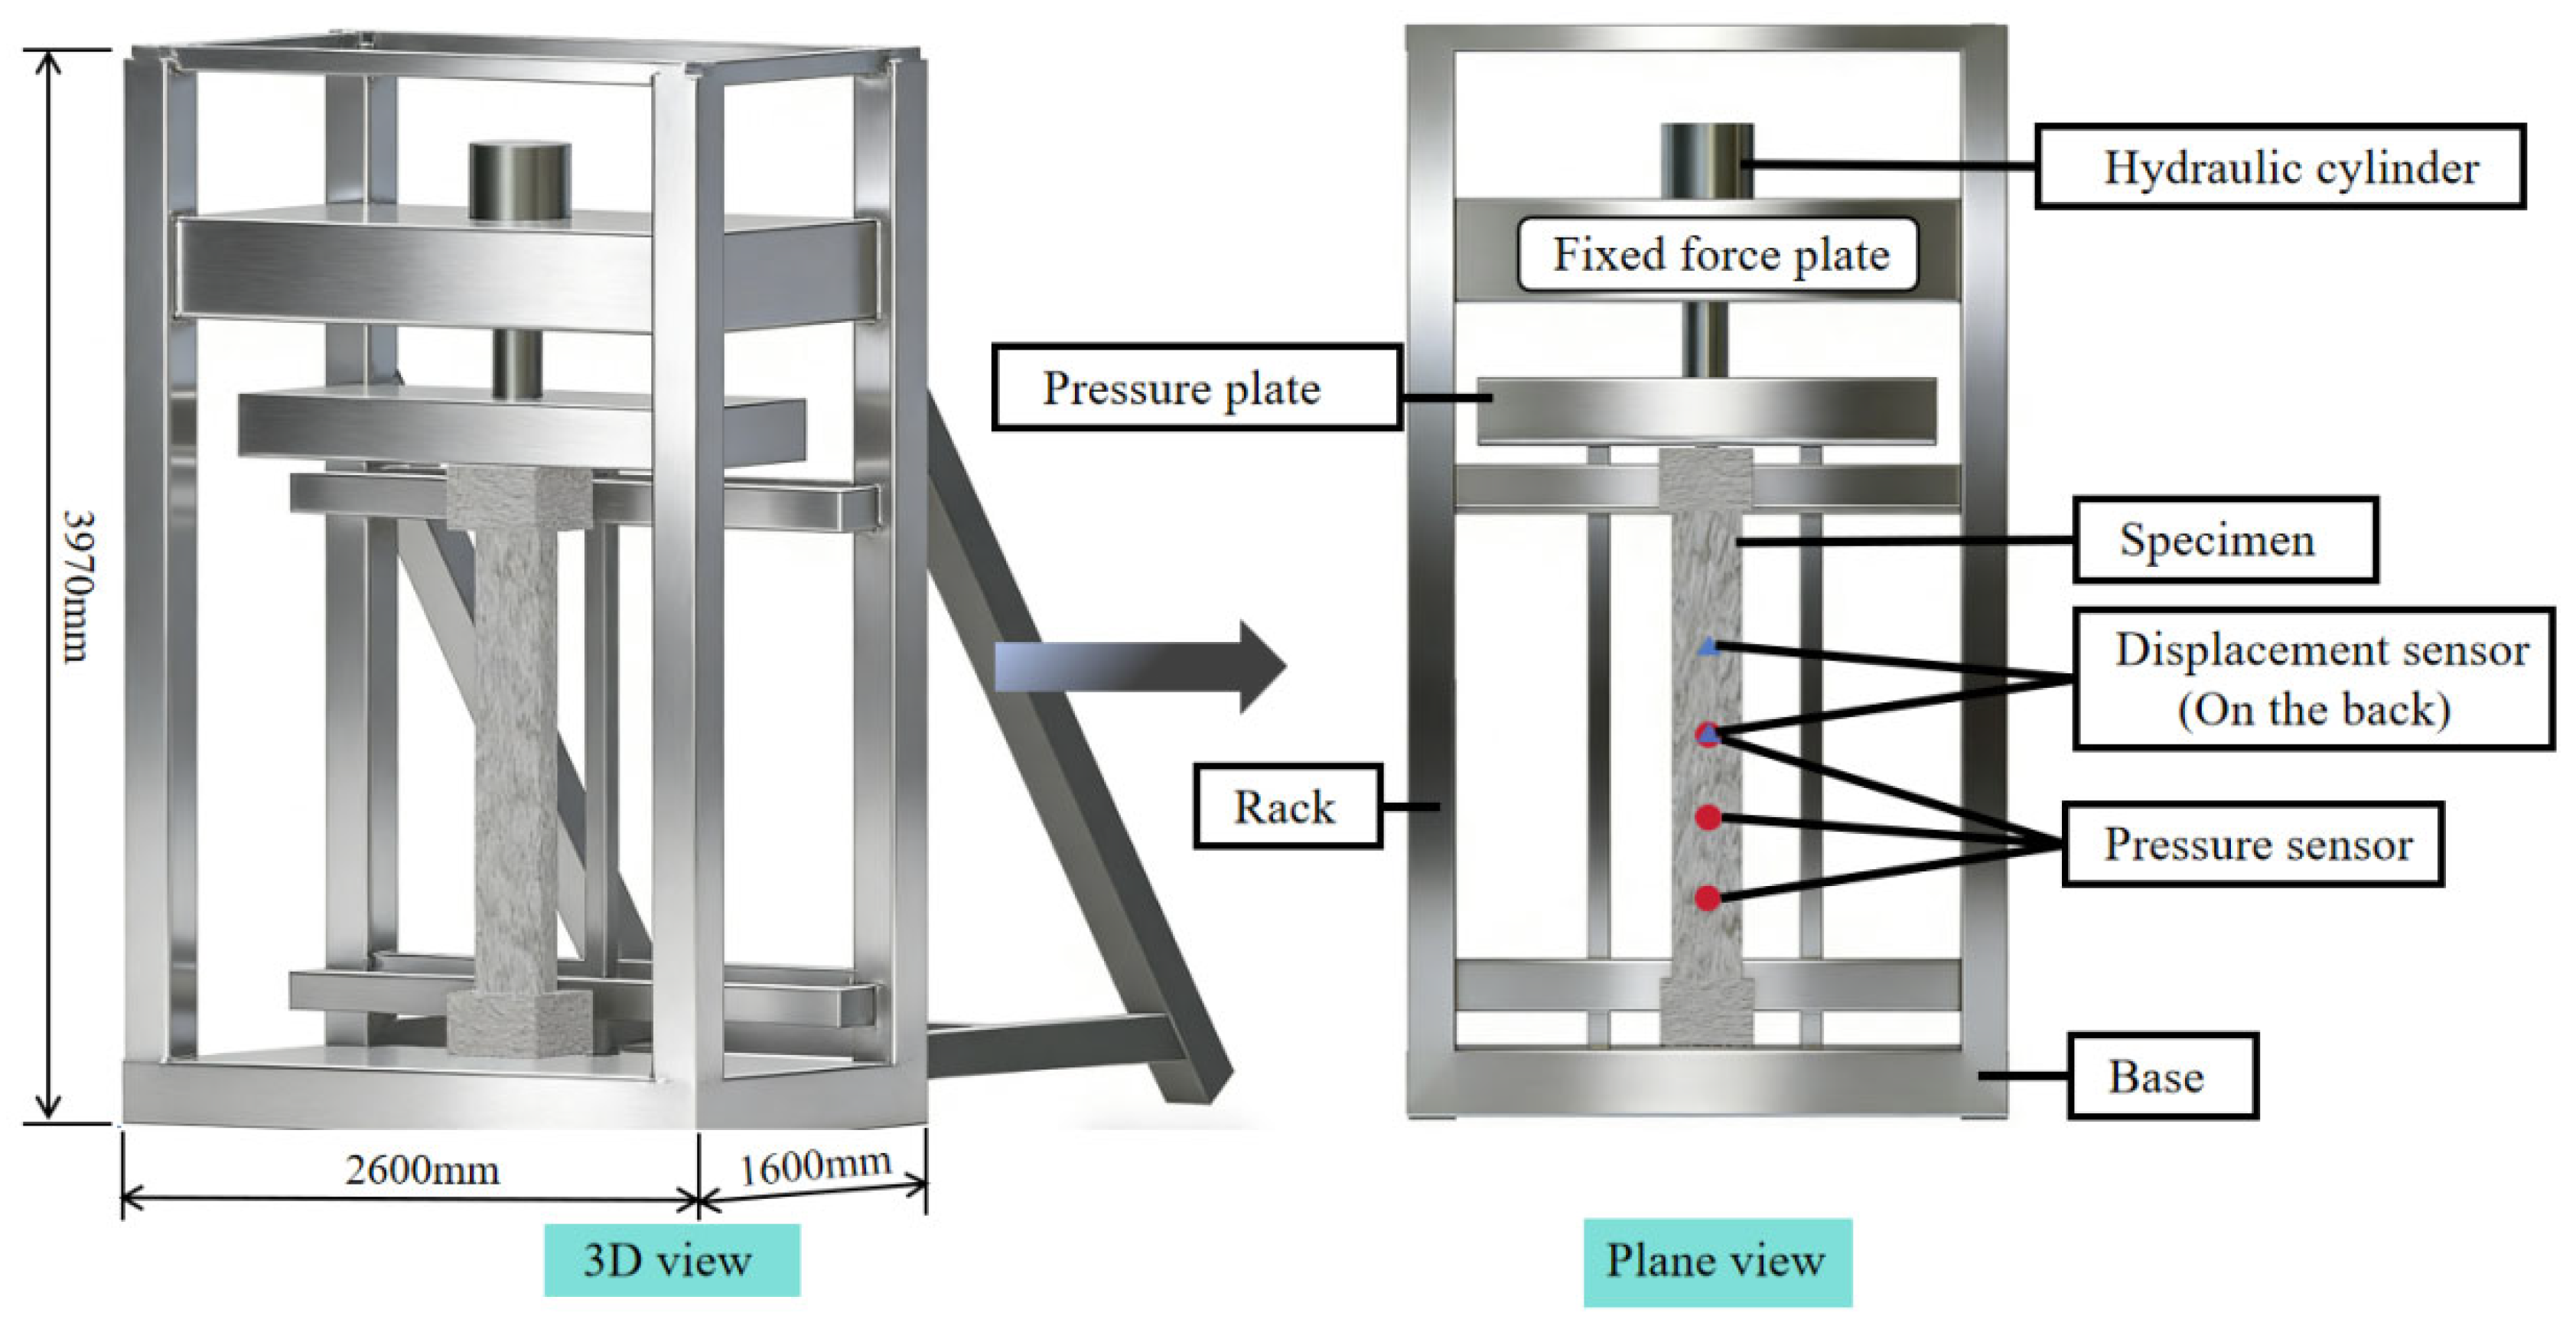
Field tests were conducted at an outdoor site, where the reinforced concrete (RC) T-shaped columns were securely mounted within a hydraulic press under fully fixed boundary conditions. A TNT explosive charge, initiated by an electric detonator, was suspended at a specified height in front of the specimen. To capture the structural response, dynamic blast pressure sensors (model DFS-200 MPa, with a measurement range of 200 MPa and a sampling rate of 2 MHz) measured the reflected pressure at the 1/2, 1/3, and 1/6 spans on the blast-facing surface. Concurrently, displacement transducers (model KD 9030LX, with a measurement range of 300 mm and a sampling rate of 2 MHz) recorded dynamic displacements at the 1/2 and 1/3 spans on the rear surface. For data processing, the raw signals acquired by the sensors were processed using a low-pass filtering algorithm to eliminate interference caused by environmental factors and sensor resonance, thereby extracting smooth and accurate time-history curves. The complete experimental setup is illustrated in Figure 2.
Figure 2.
Overall experimental setup.
2.2. Shock Wave Pressure and Structural Dynamic Responses
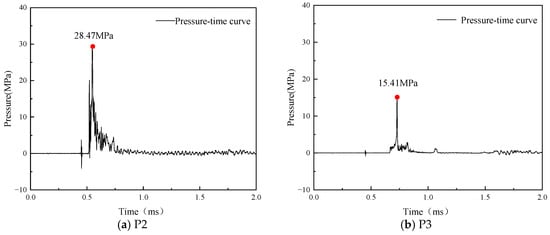
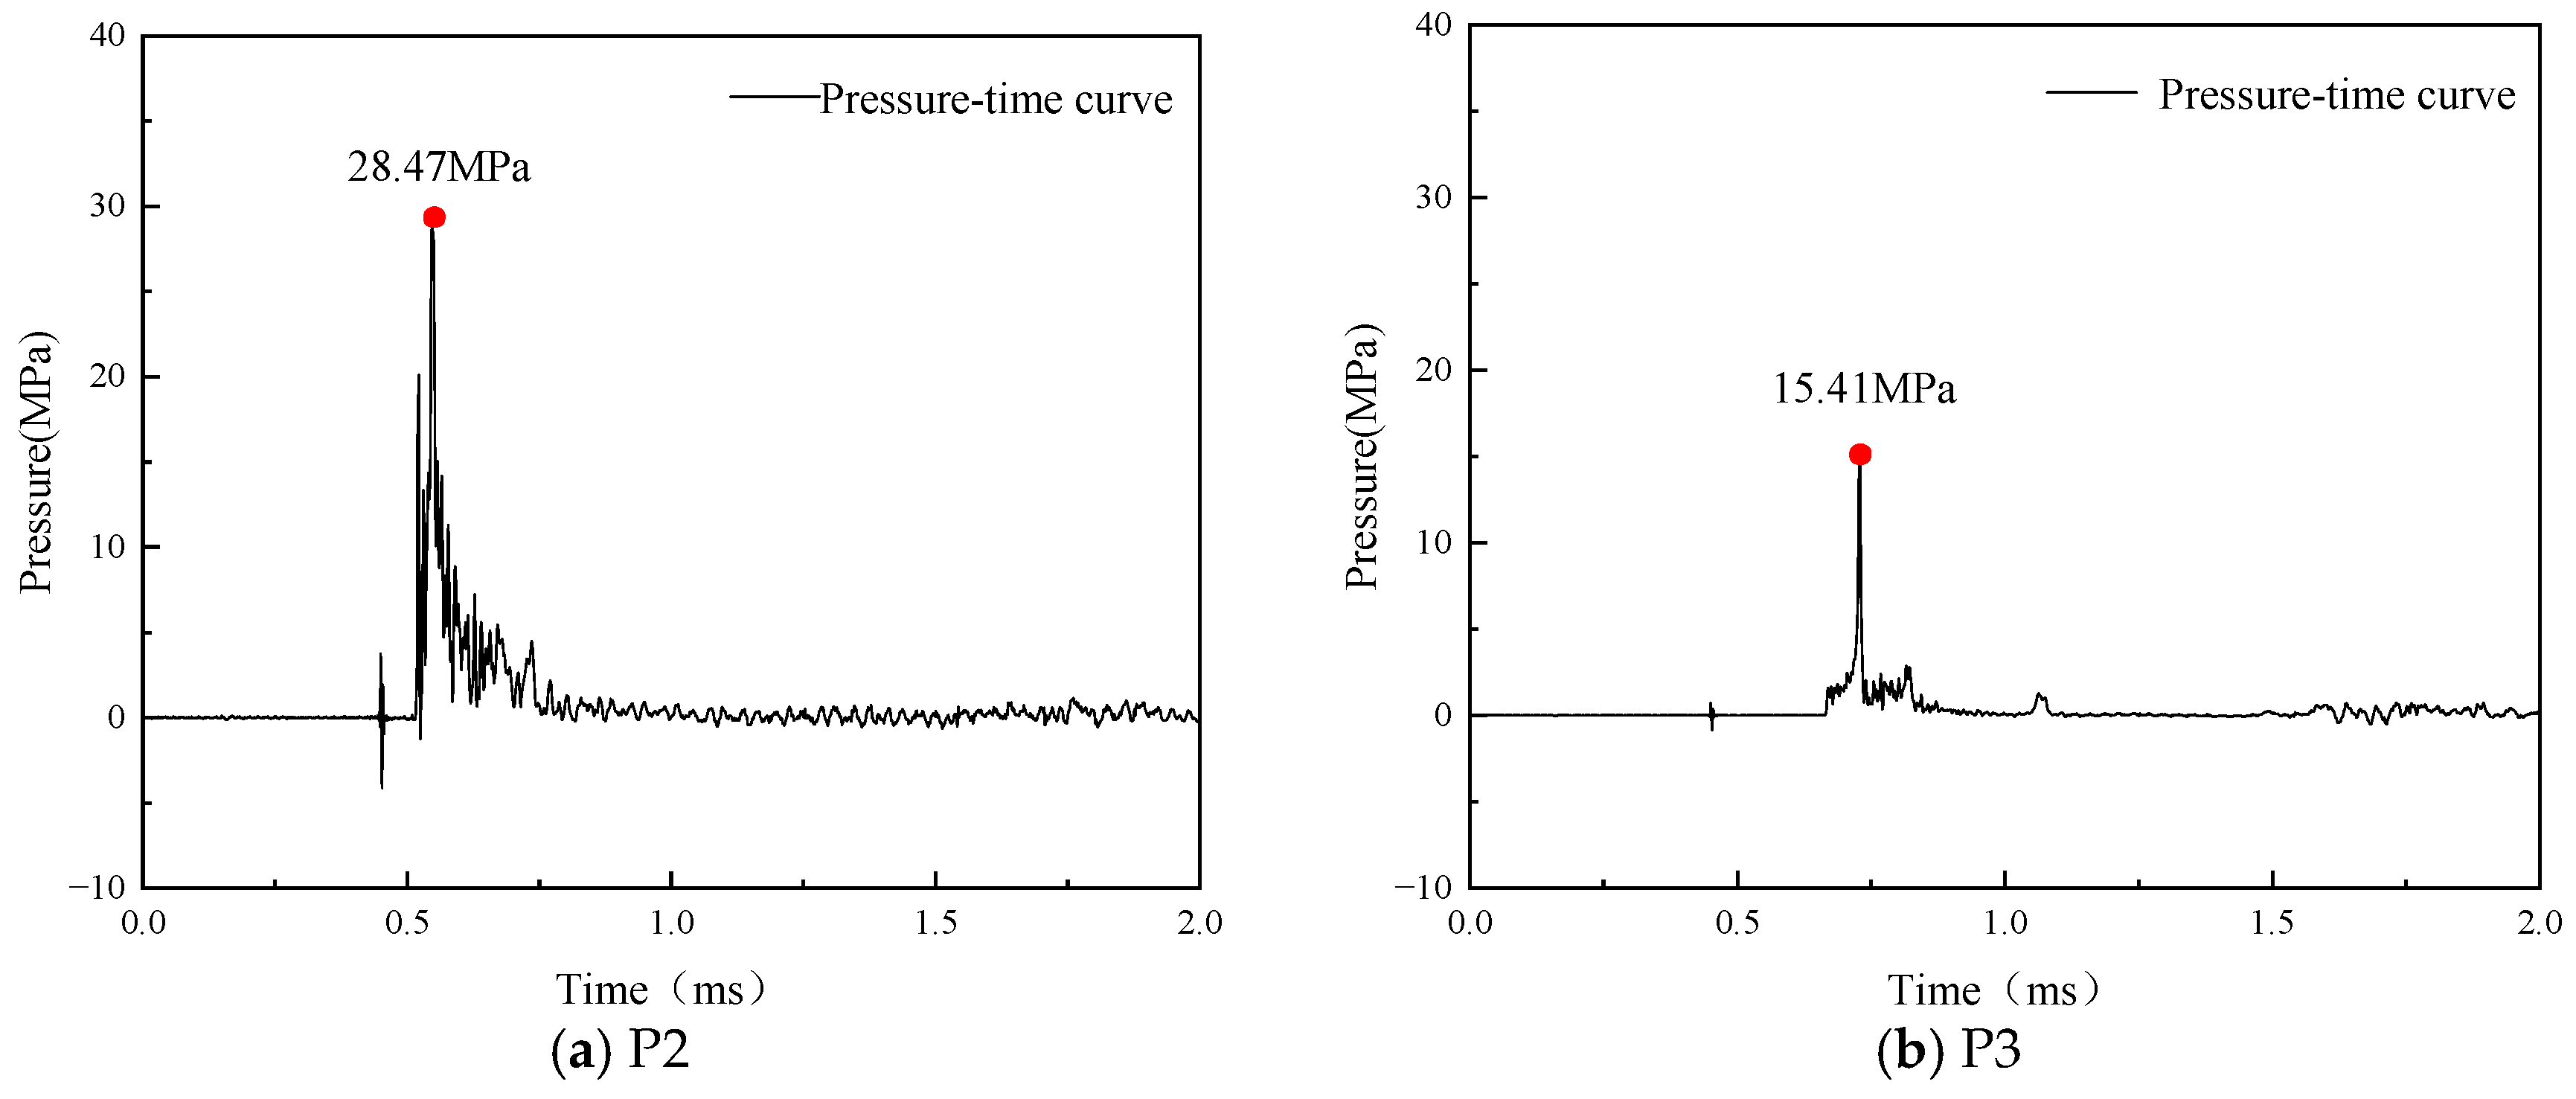
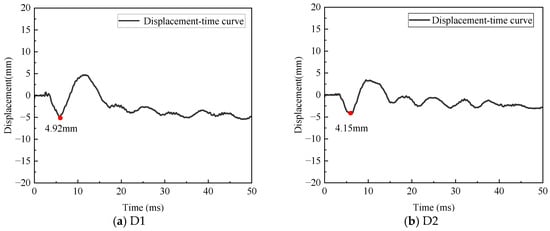
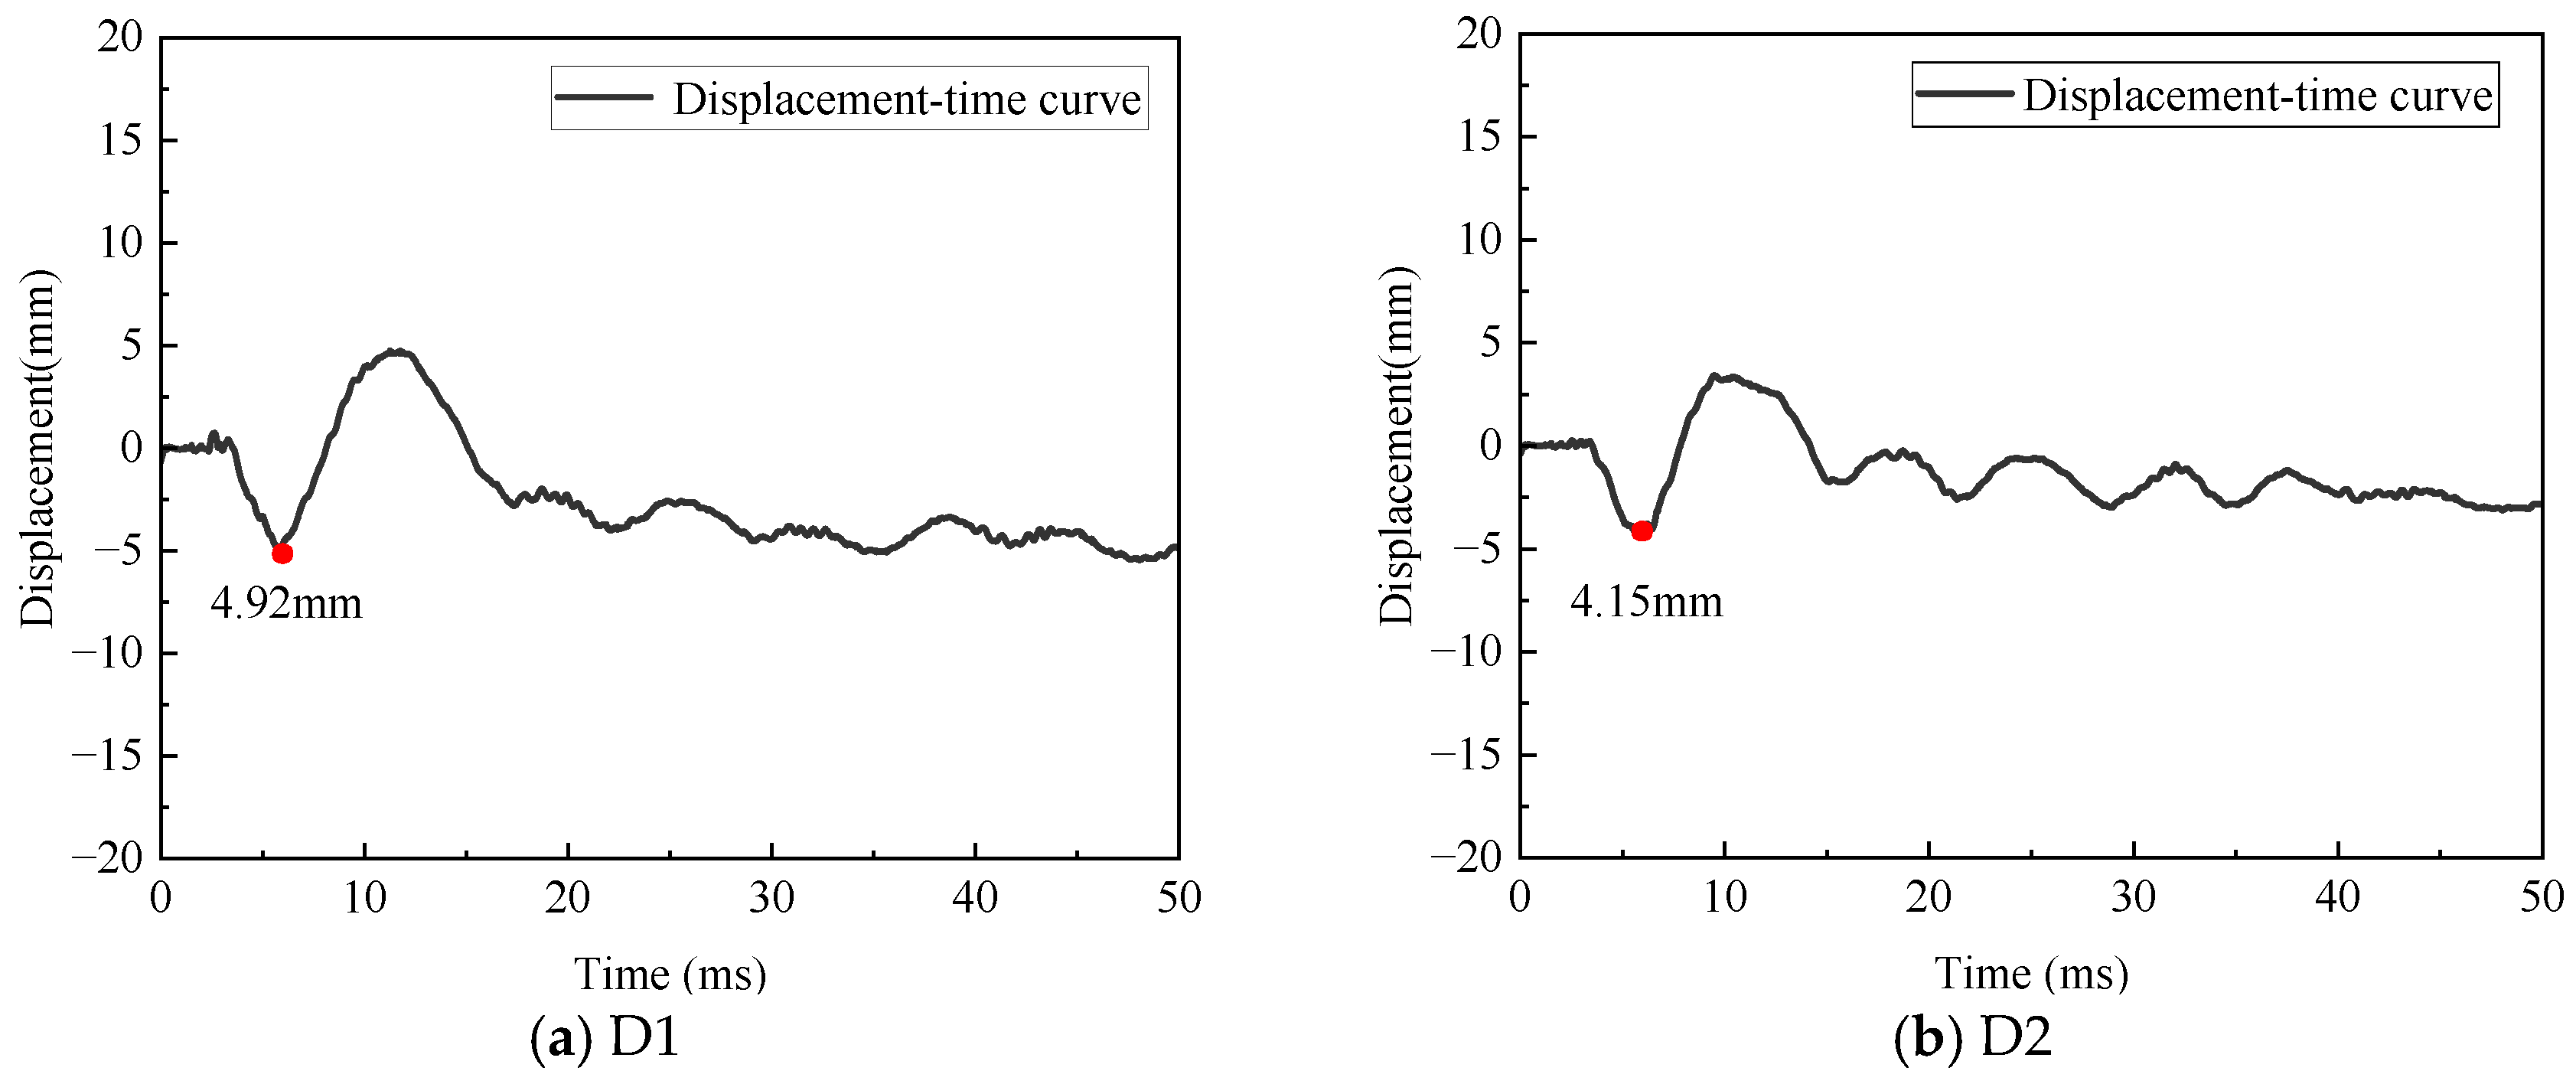
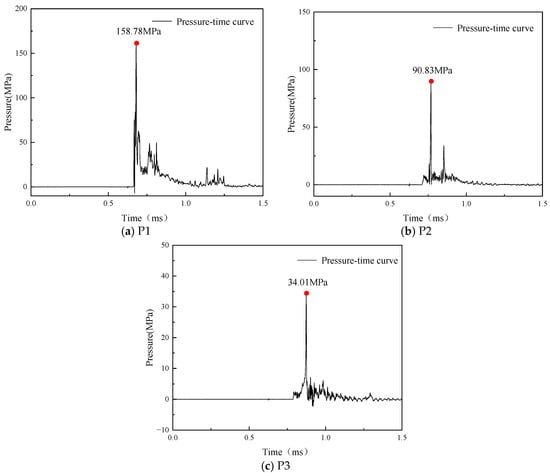
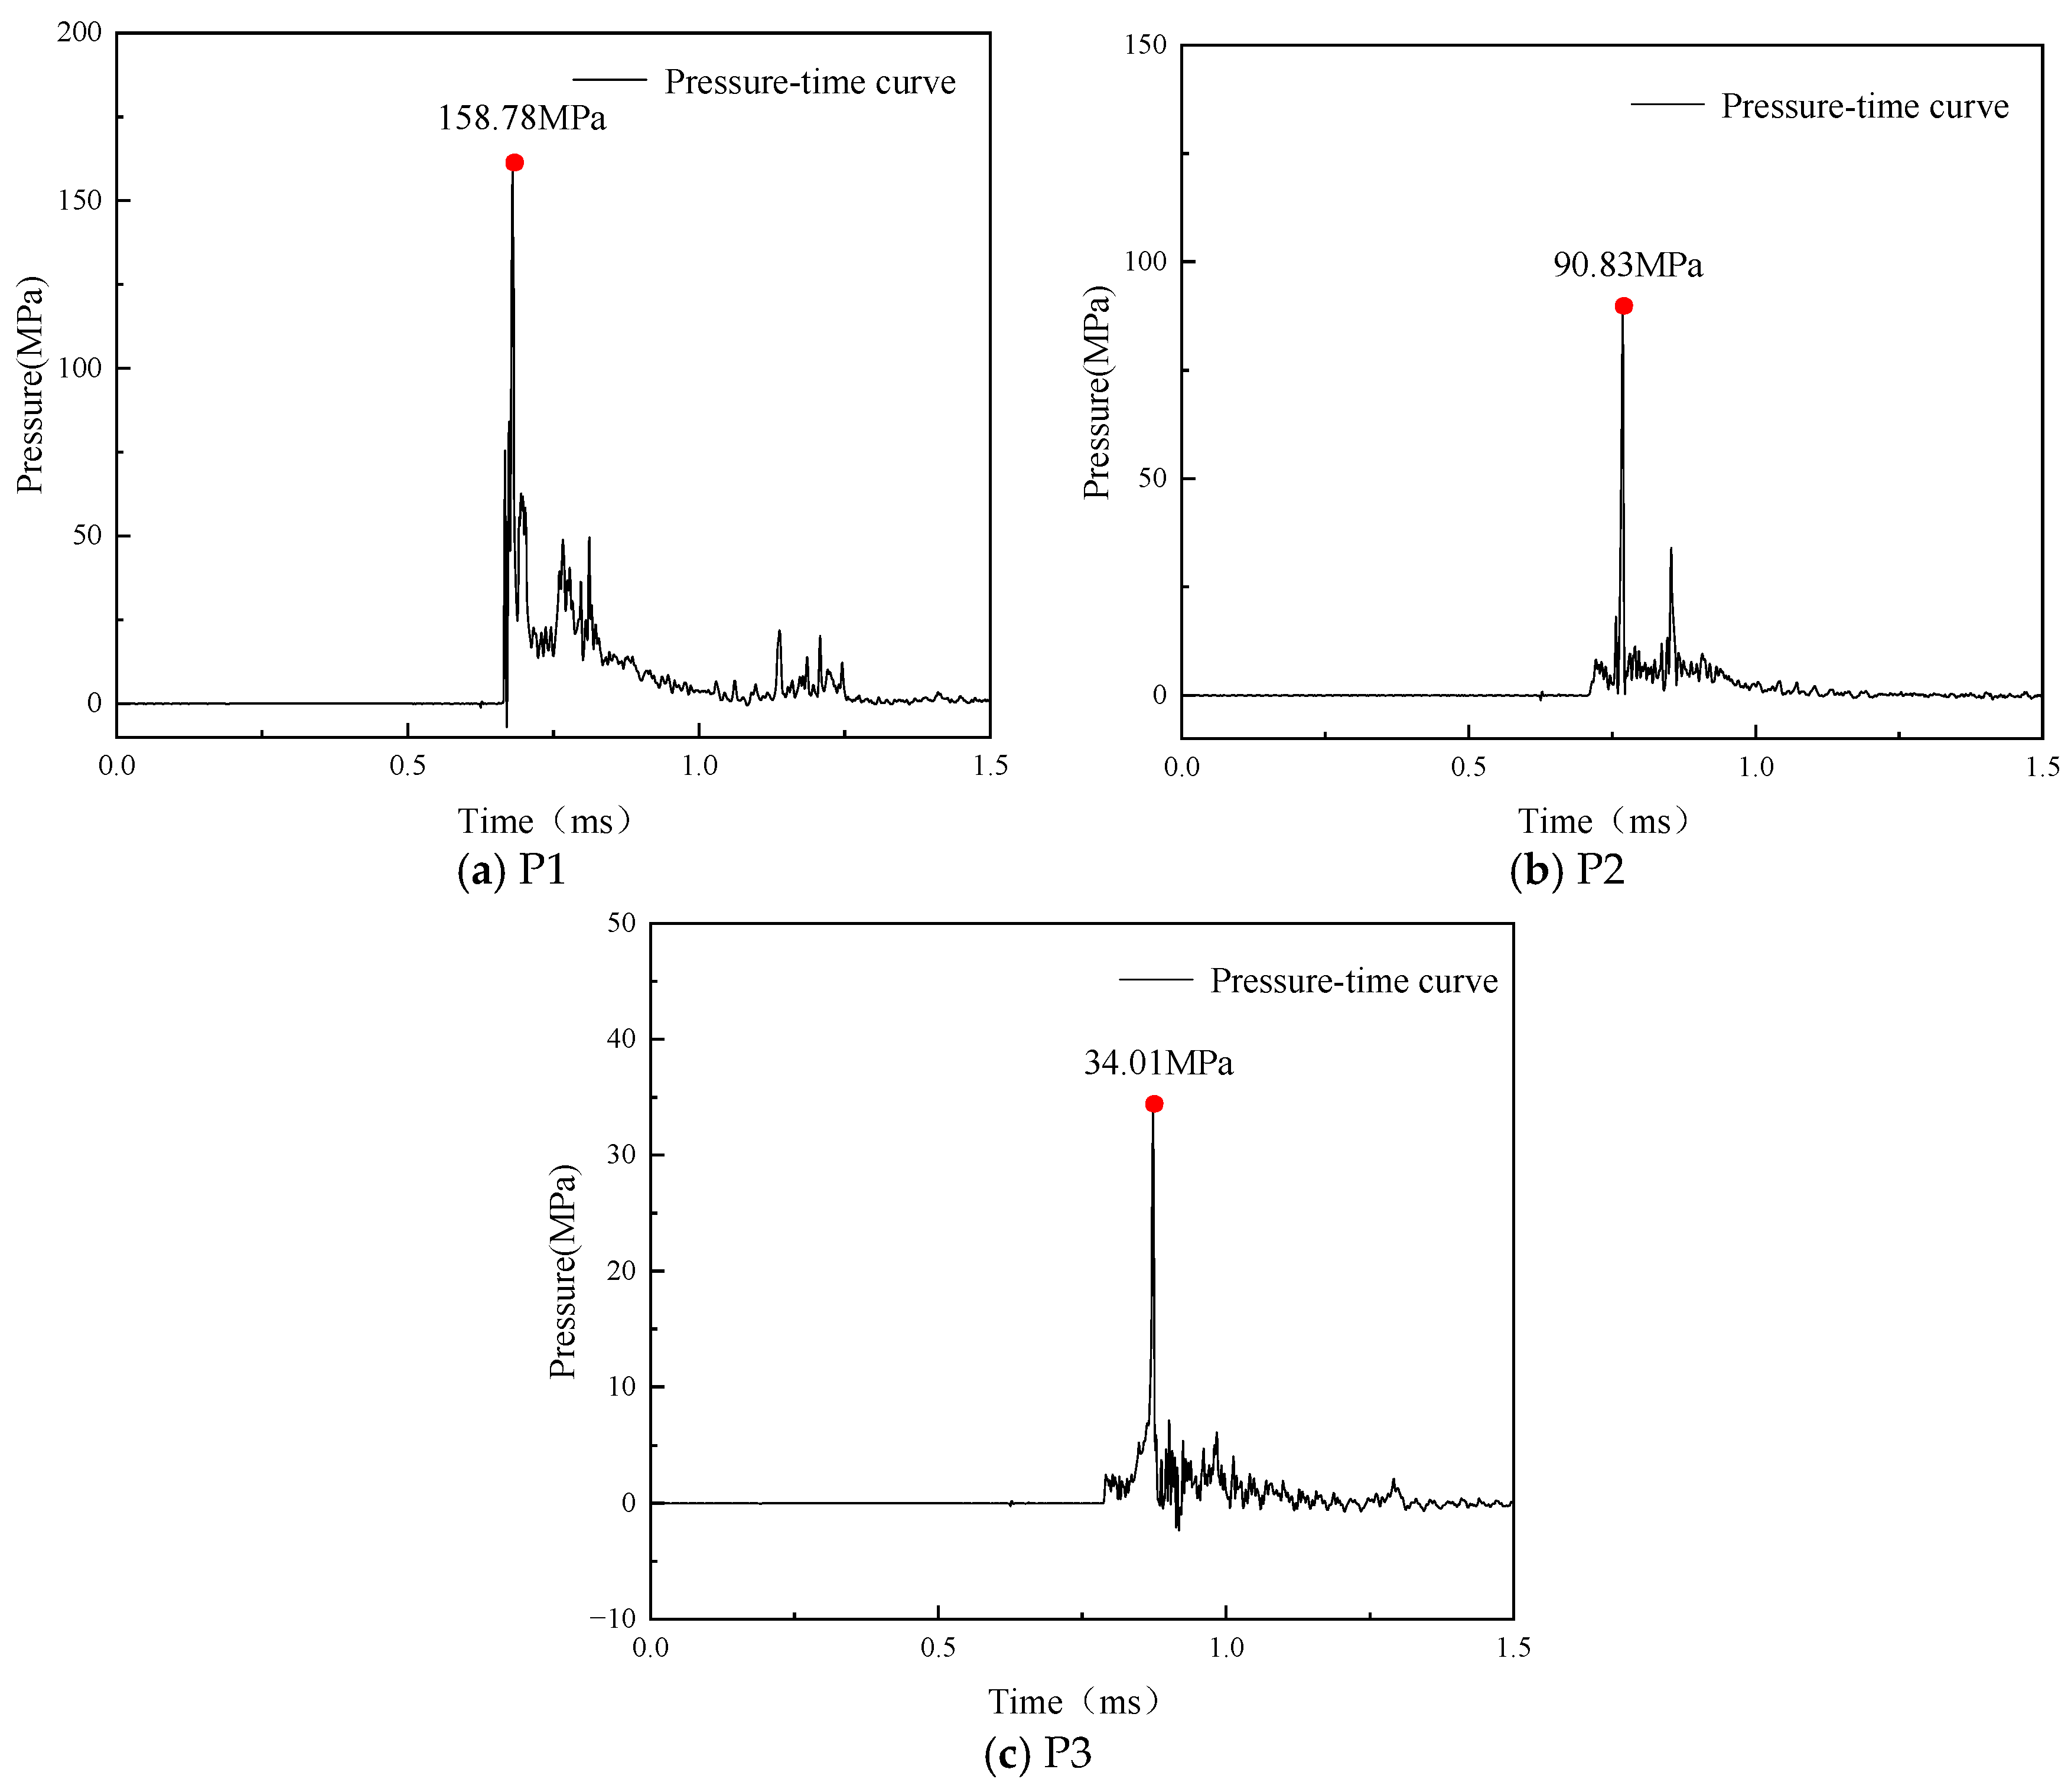
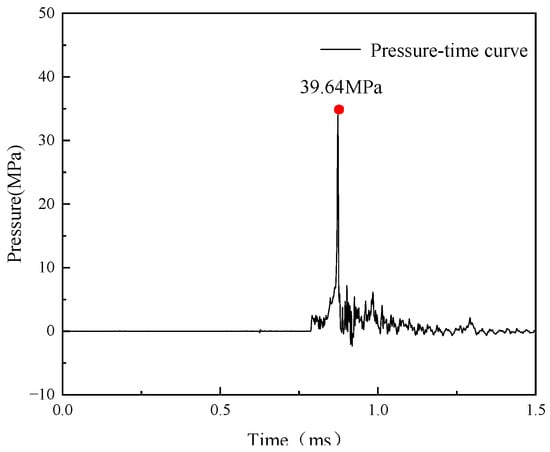
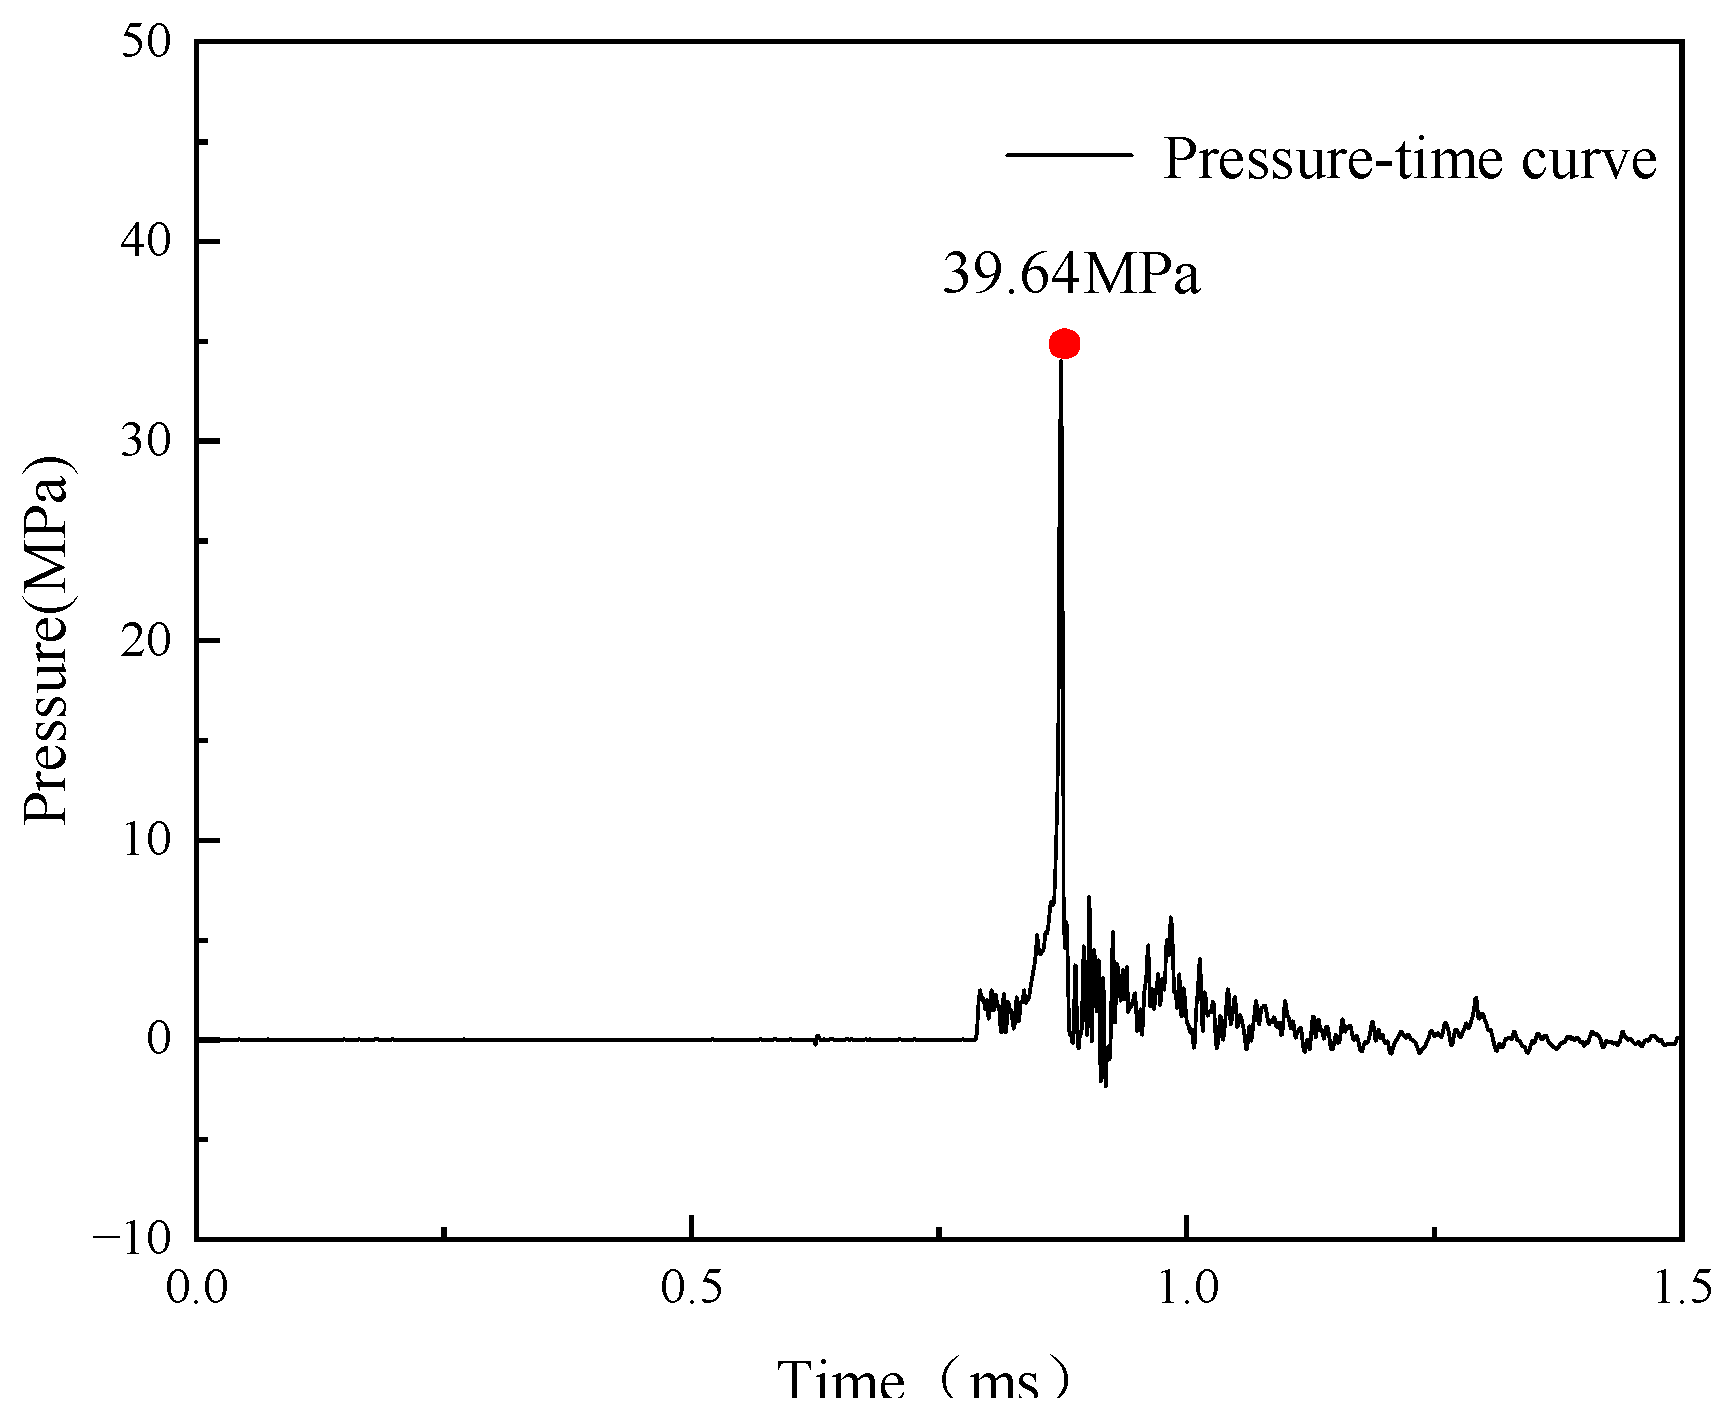
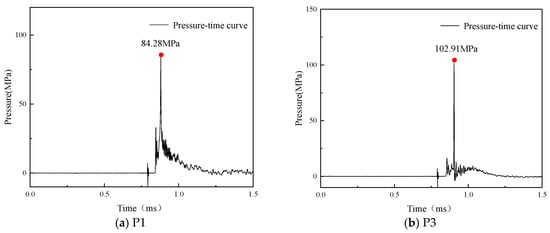
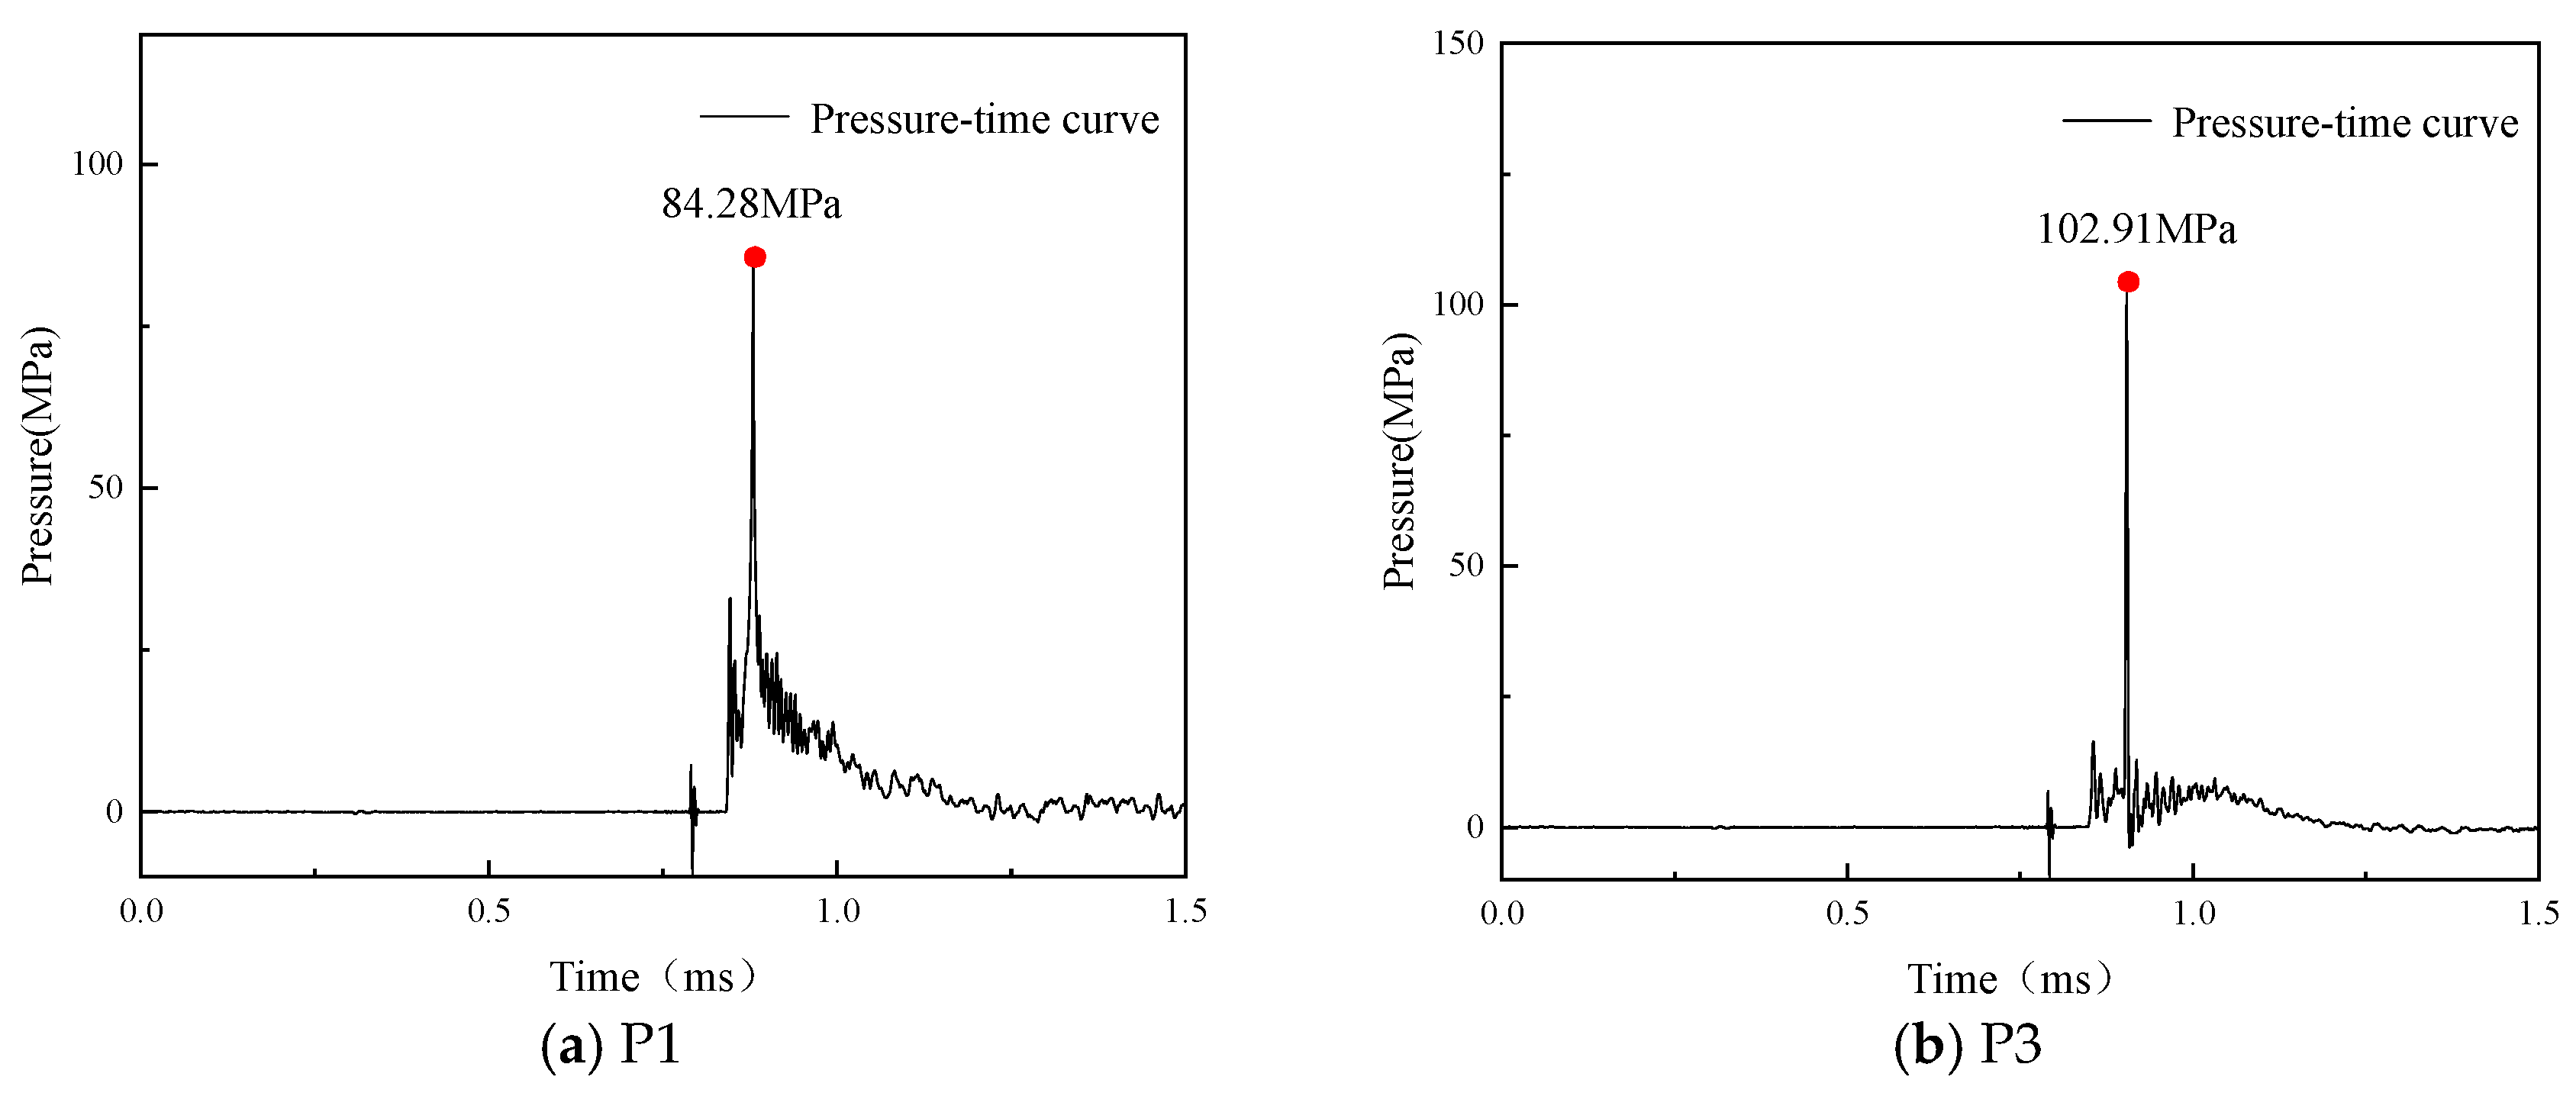
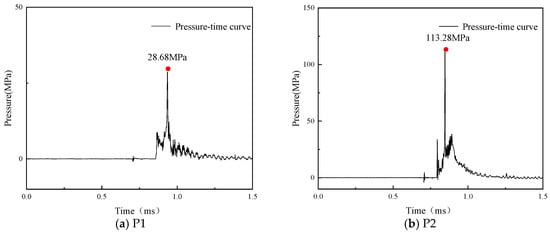
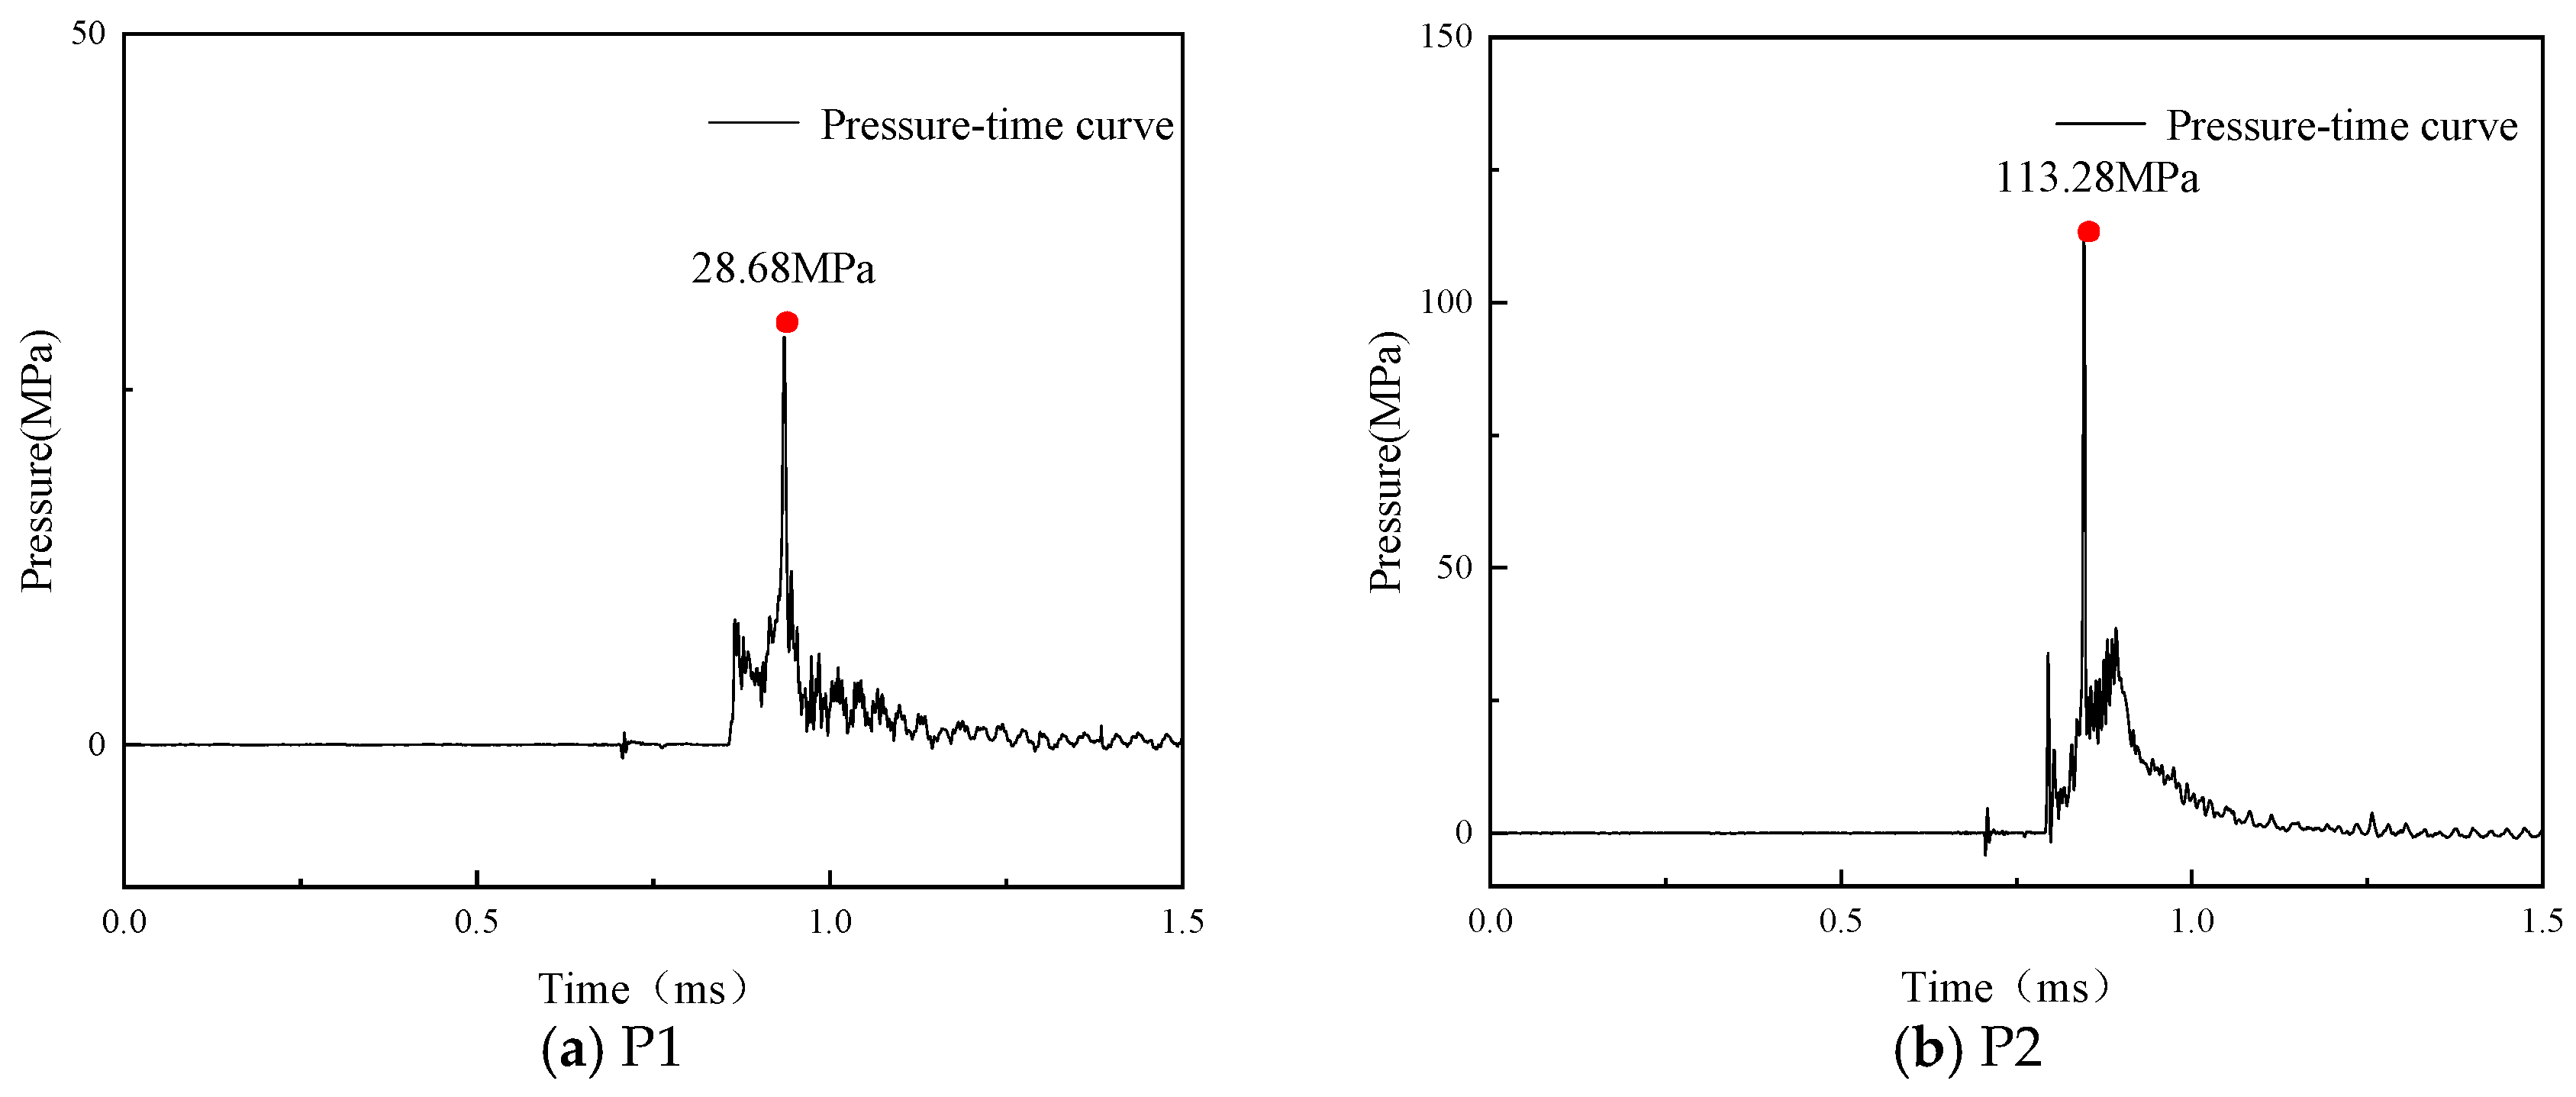
The overpressure and displacement–time-history curves for the reinforced concrete (RC) T-shaped columns across various test cases are presented in Figure 3, Figure 4, Figure 5, Figure 6, Figure 7 and Figure 8. Upon reaching the blast-facing surface, the blast wave overpressure peaks abruptly and subsequently decays exponentially. As the explosive charge mass increases from 1 kg to 4 kg, the dynamic response of the structure intensifies significantly. In Case A1, the peak reflected overpressures at measurement points P2 and P3 are 28.47 MPa and 15.41 MPa, respectively, with corresponding peak displacements at D1 and D2 measuring 4.92 mm and 4.15 mm. In Case A2, the peak overpressures at points P1, P2, and P3 reach 158.78 MPa, 90.83 MPa, and 34.01 MPa, respectively. For Case A3, the peak overpressure at point P3 increases to 39.64 MPa.
Figure 3.
Overpressure–time-history curves for Case A1.
Figure 4.
Displacement–time-history curves for Case A1.
Figure 5.
Overpressure–time-history curves for Case A2.
Figure 6.
Overpressure–time-history curve at measurement point P3 for Case A3.
Figure 7.
Overpressure–time-history curves for Case A7.
Figure 8.
Overpressure–time-history curves for Case A8.
Furthermore, the elevation of the measurement points significantly amplifies the actual blast loads exerted on the structure. In Case A7, the peak overpressures at points P1 and P3 are 84.28 MPa and 102.91 MPa, respectively; despite having identical radial distances from the blast center, the pressure at the near-ground point P3 is approximately 22% higher than at P1. Similarly, in Case A8, the peak overpressures at P1 and P2 are 28.68 MPa and 113.28 MPa, respectively. The peak pressure at the near-ground point P2 is roughly 24.7% higher than that at the exact same location in Case A2 under an equivalent standoff distance. This phenomenon highlights the strong superposition and coupling effects between the initial incident wave and the ground-reflected wave at near-ground elevations.
The peak overpressures recorded at the measurement points for the various test cases are presented in Table 4. Unlisted measurement points correspond to locations with missing or incomplete data.
Table 4.
Peak overpressures at measurement points.
2.3. Analysis of Experimental Phenomena
(1) Effect of Explosive Charge Mass
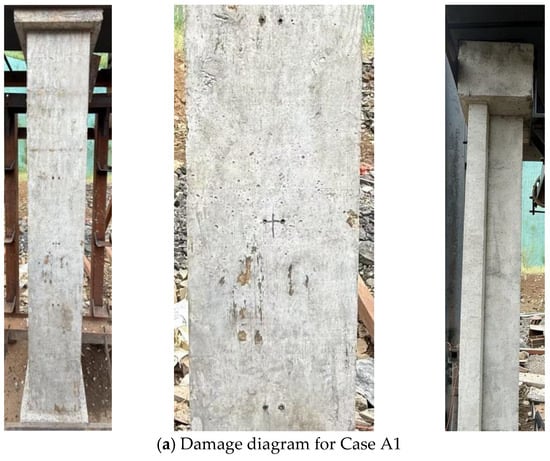
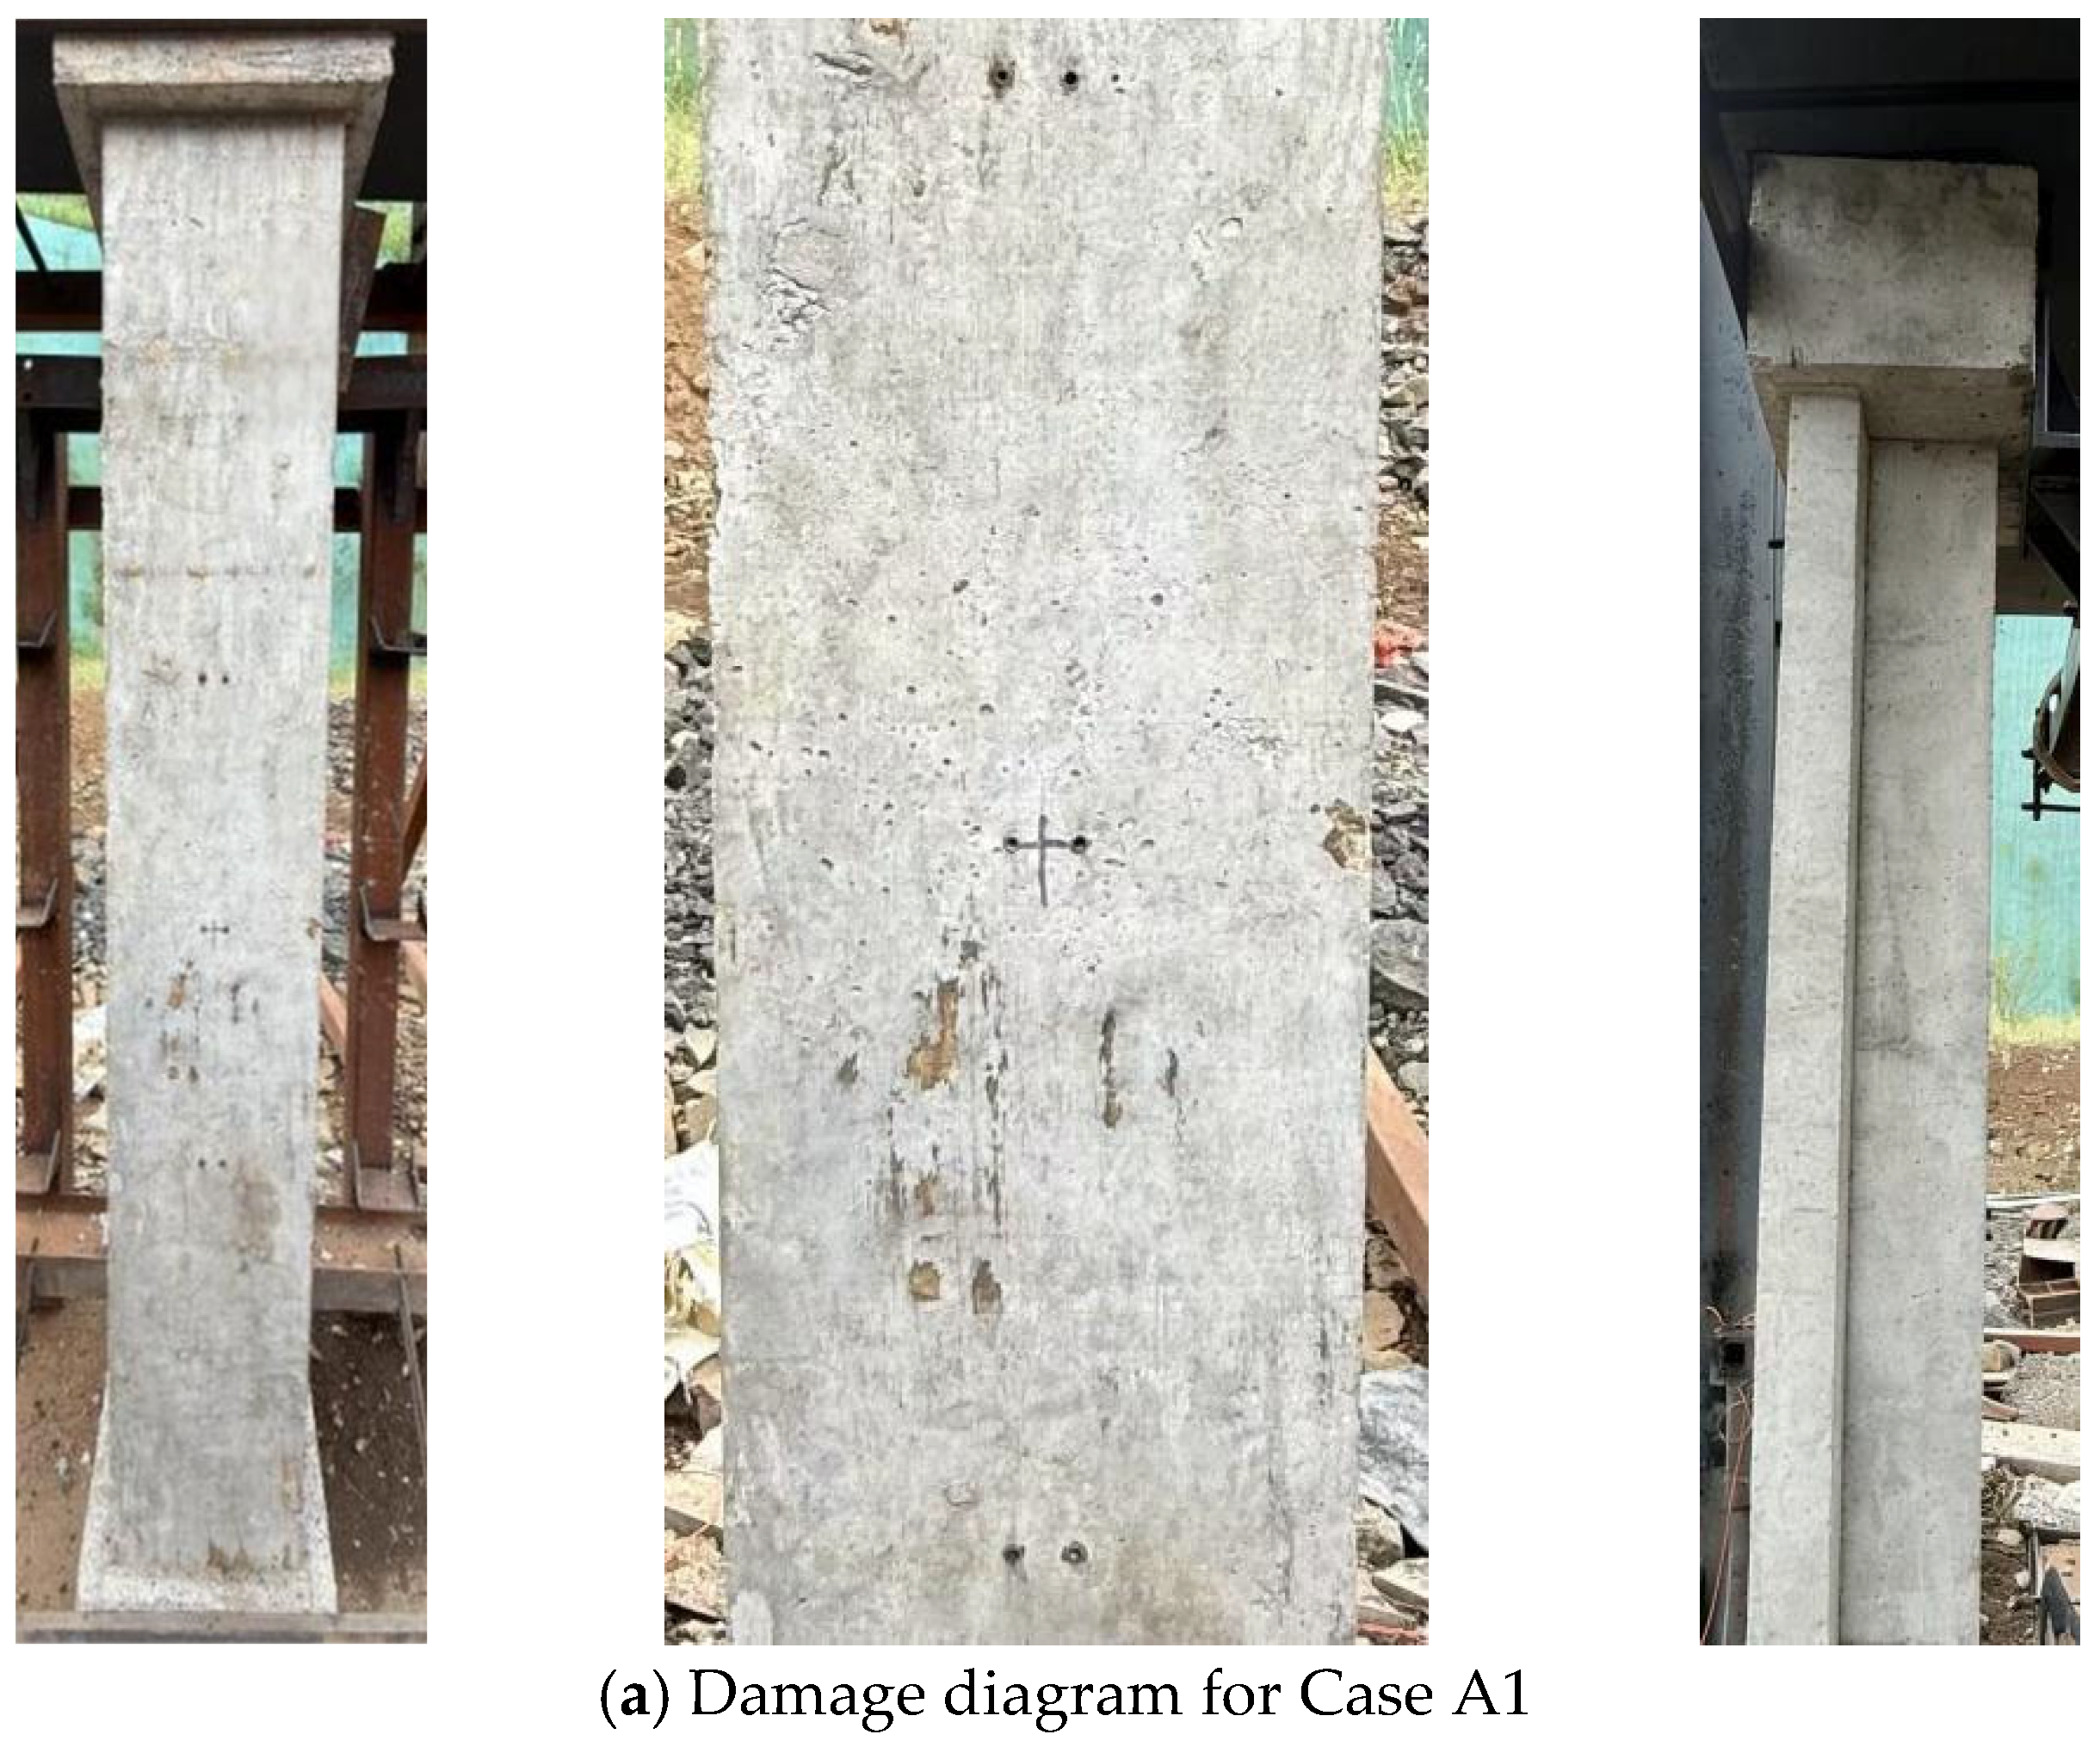
Figure 9a illustrates the failure mode of the specimen in Case A1. Due to the small explosive charge mass and low blast load intensity, the component remained visually intact without any concrete cover spalling, cratering, or visible surface cracking on the blast-facing side. The back and side surfaces showed no signs of deformation, and the internal steel reinforcement cage remained undeformed, yielding a maximum mid-span displacement of 4.92 mm.
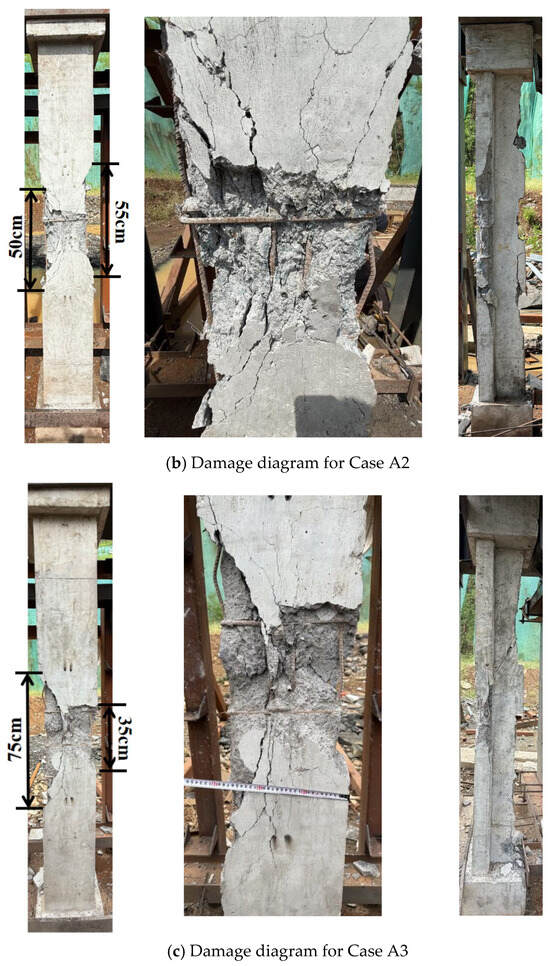
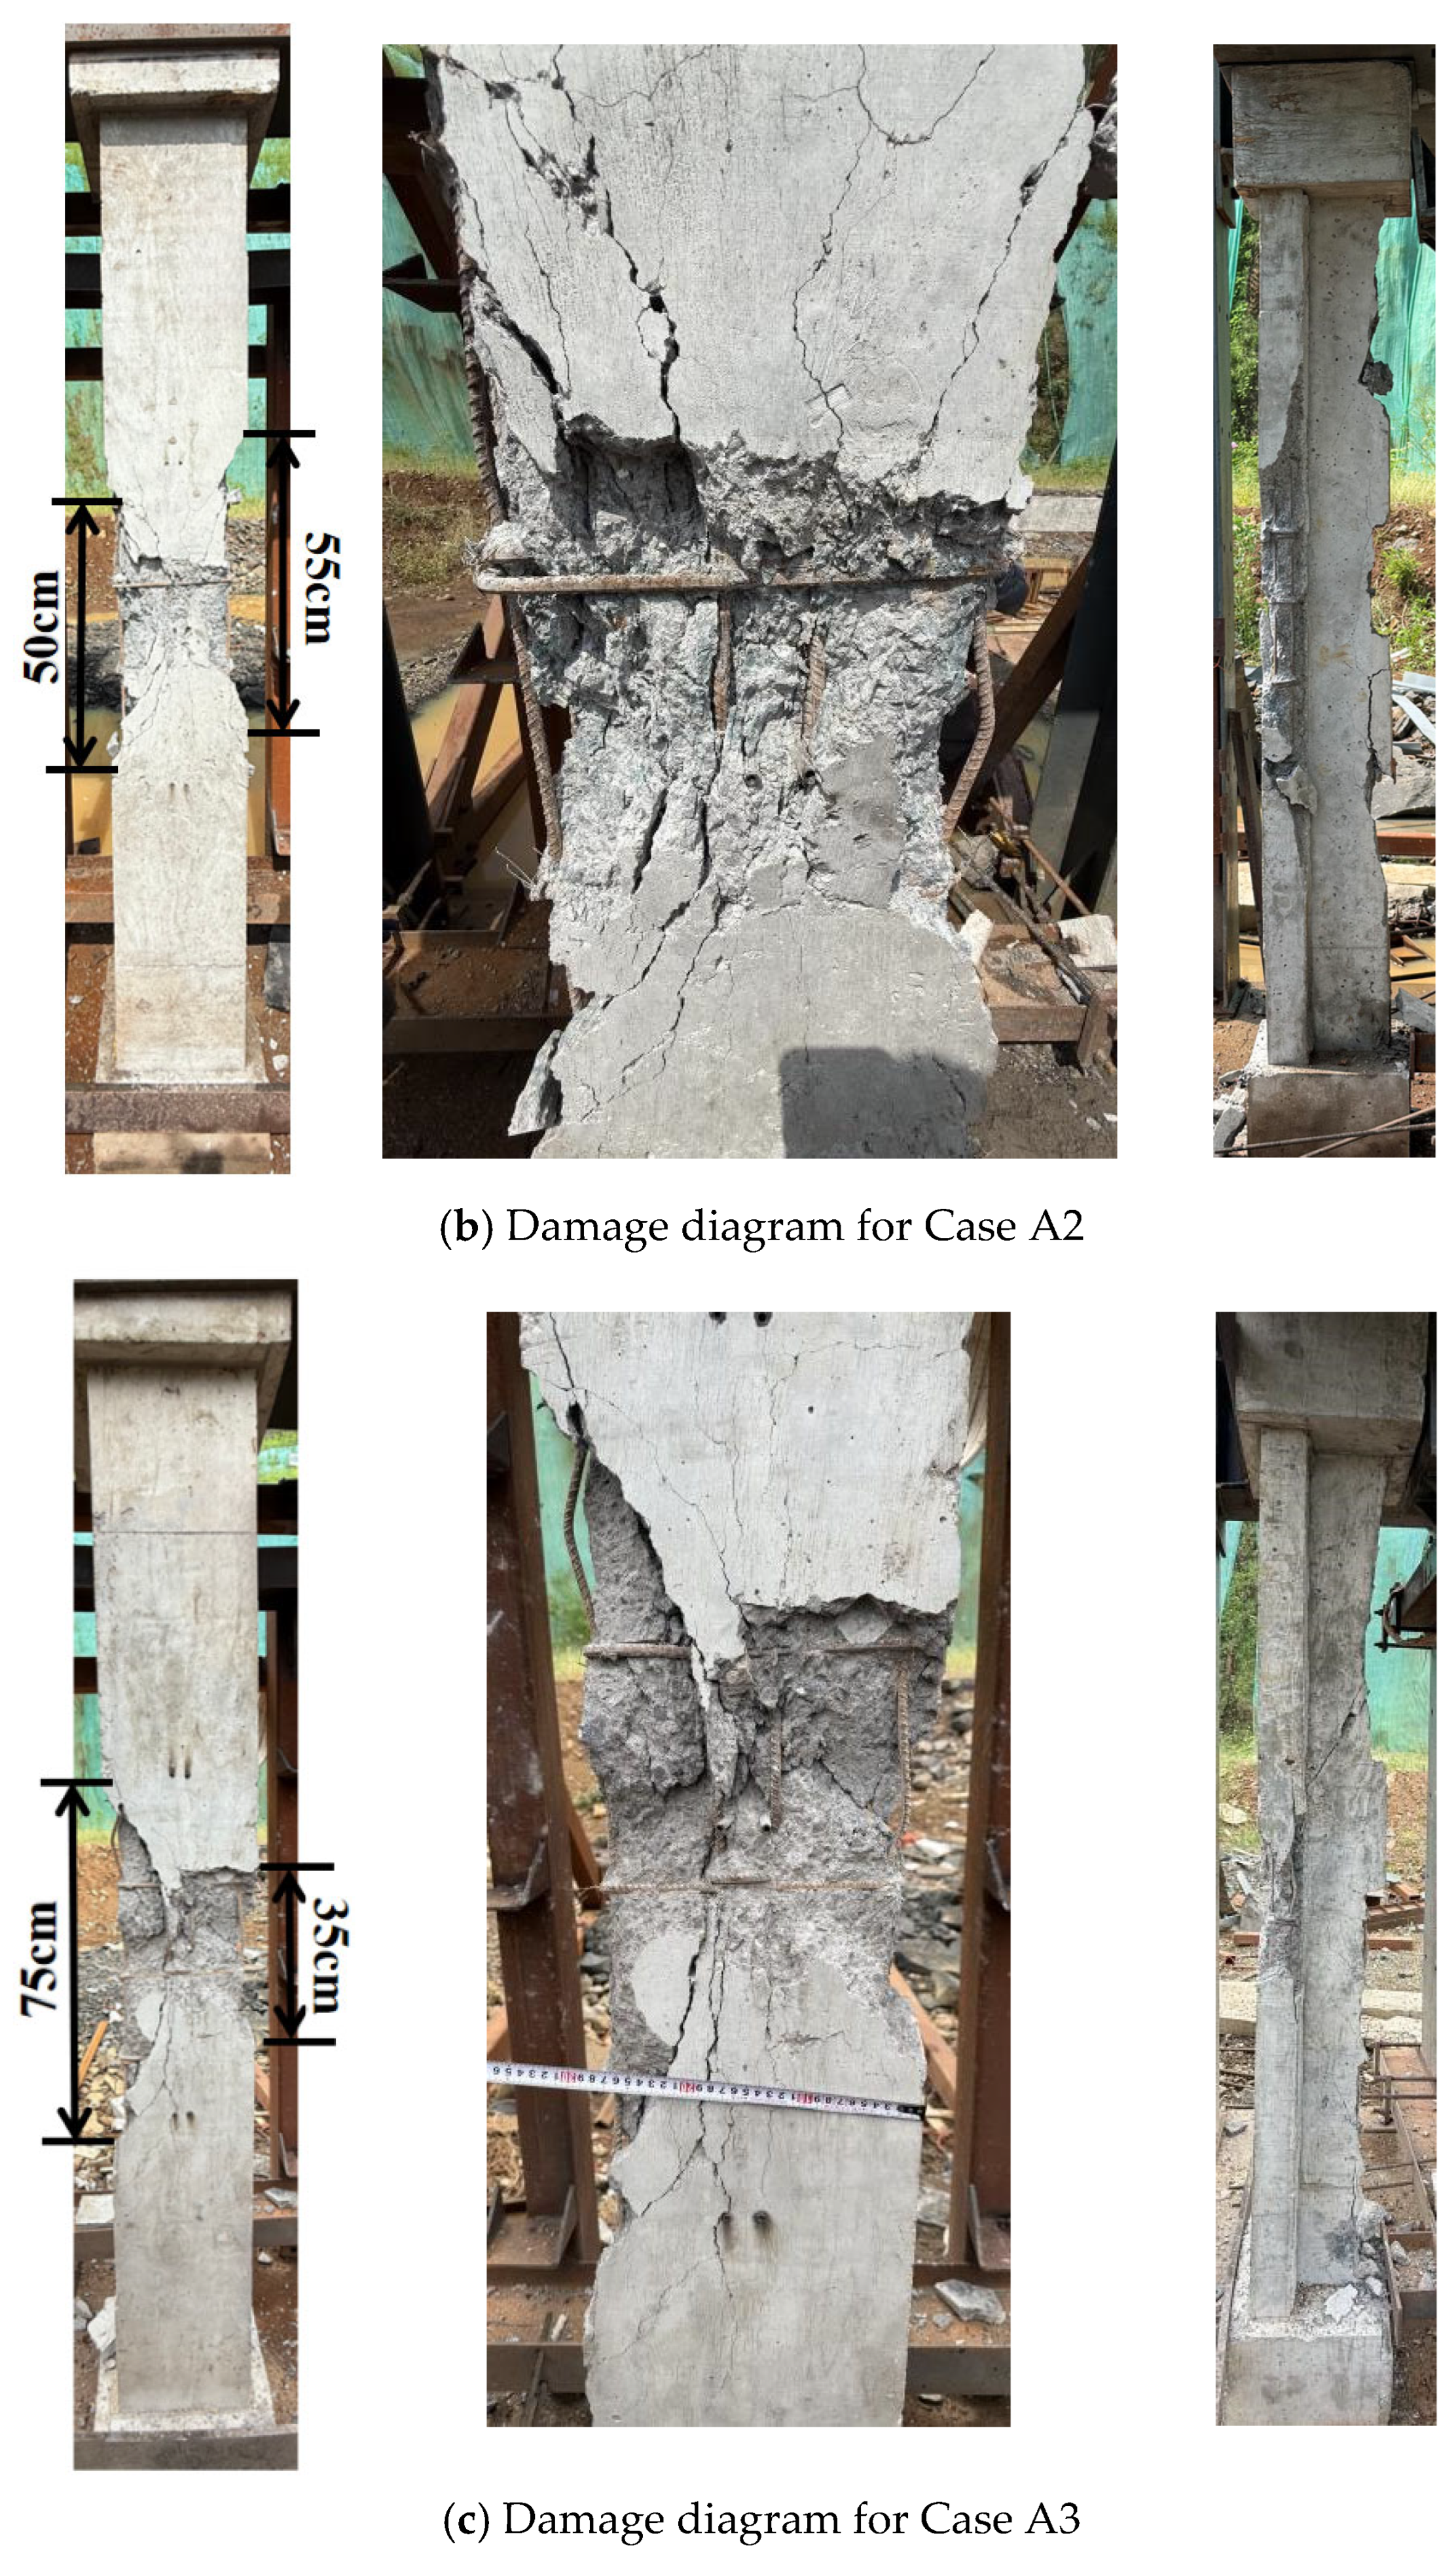
Figure 9.
Comparison of damage under different explosive charge masses.
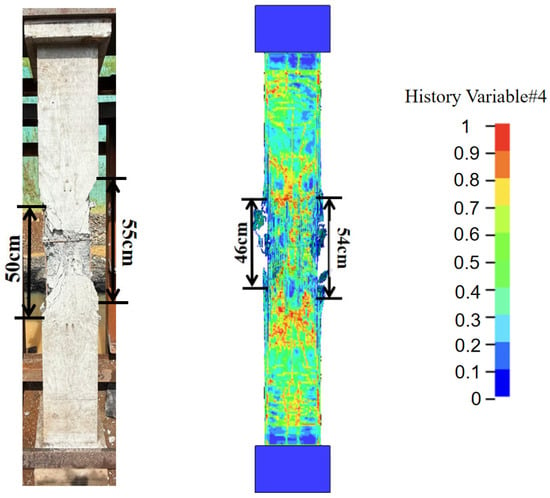
As shown in Figure 9b, the increased explosive charge in Case A2 formed a shallow crater at the center of the blast-facing surface, accompanied by distinct radial intersecting cracks. Localized concrete cover spalling occurred on both sides of the column; these spalling zones measured approximately 50 cm and 55 cm in length with a maximum depth of 8 cm, resulting in a damaged area of approximately 742 cm2 on the blast-facing surface. Consequently, four internal longitudinal bars and one stirrup were exposed and exhibited slight bending deformation. Only minor, non-through-thickness cracks were observed in the web region. Overall, the component exhibited no significant macroscopic bending, and the internal steel reinforcement did not yield.
Figure 9c presents the failure mode for Case A3. A further increase in the explosive charge mass caused deep hourglass-shaped damage on the blast-facing surface, significantly enlarging both the area and depth of the blast crater. Concrete spalling on the sides was exceptionally severe, expanding to lengths of 75 cm and 35 cm with a maximum depth of 12 cm; the total damaged area on the blast-facing surface reached approximately 1192 cm2. This intense spalling completely exposed the longitudinal bars in the affected region and caused significant bending deformation in three stirrups. Simultaneously, through-thickness cracks developed in the web region, extending from the 1/3 span toward the mid-span. Ultimately, the component developed obvious global bending deformation, and the internal reinforcement cage locally entered the plastic stage.
(2) Effect of Axial Compression Ratio
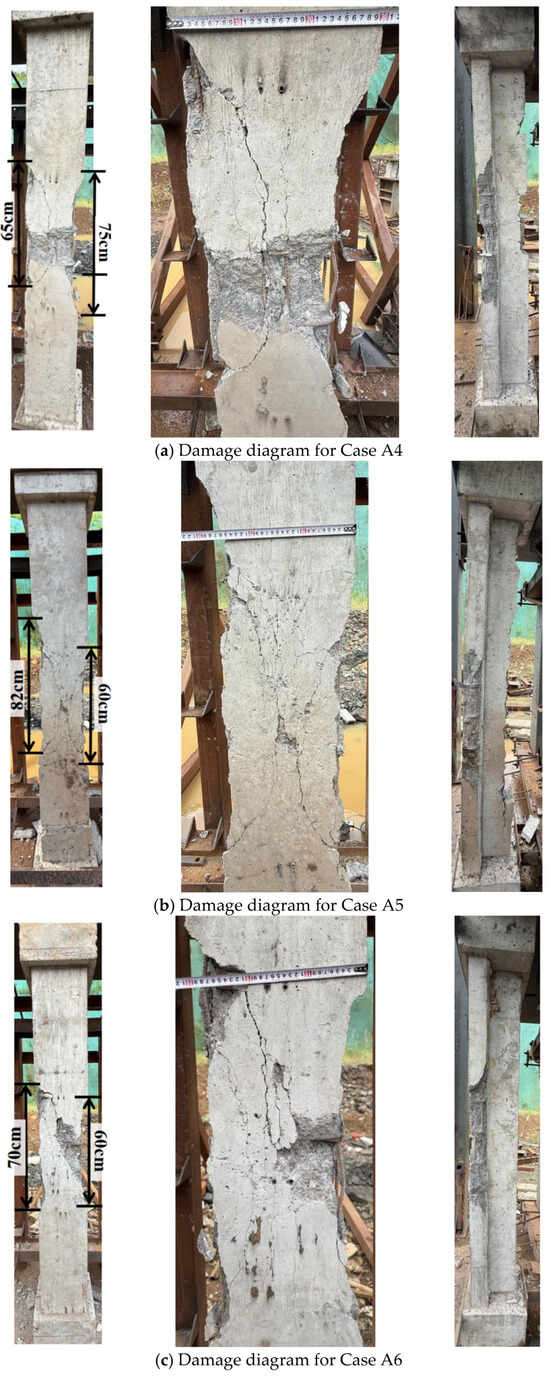
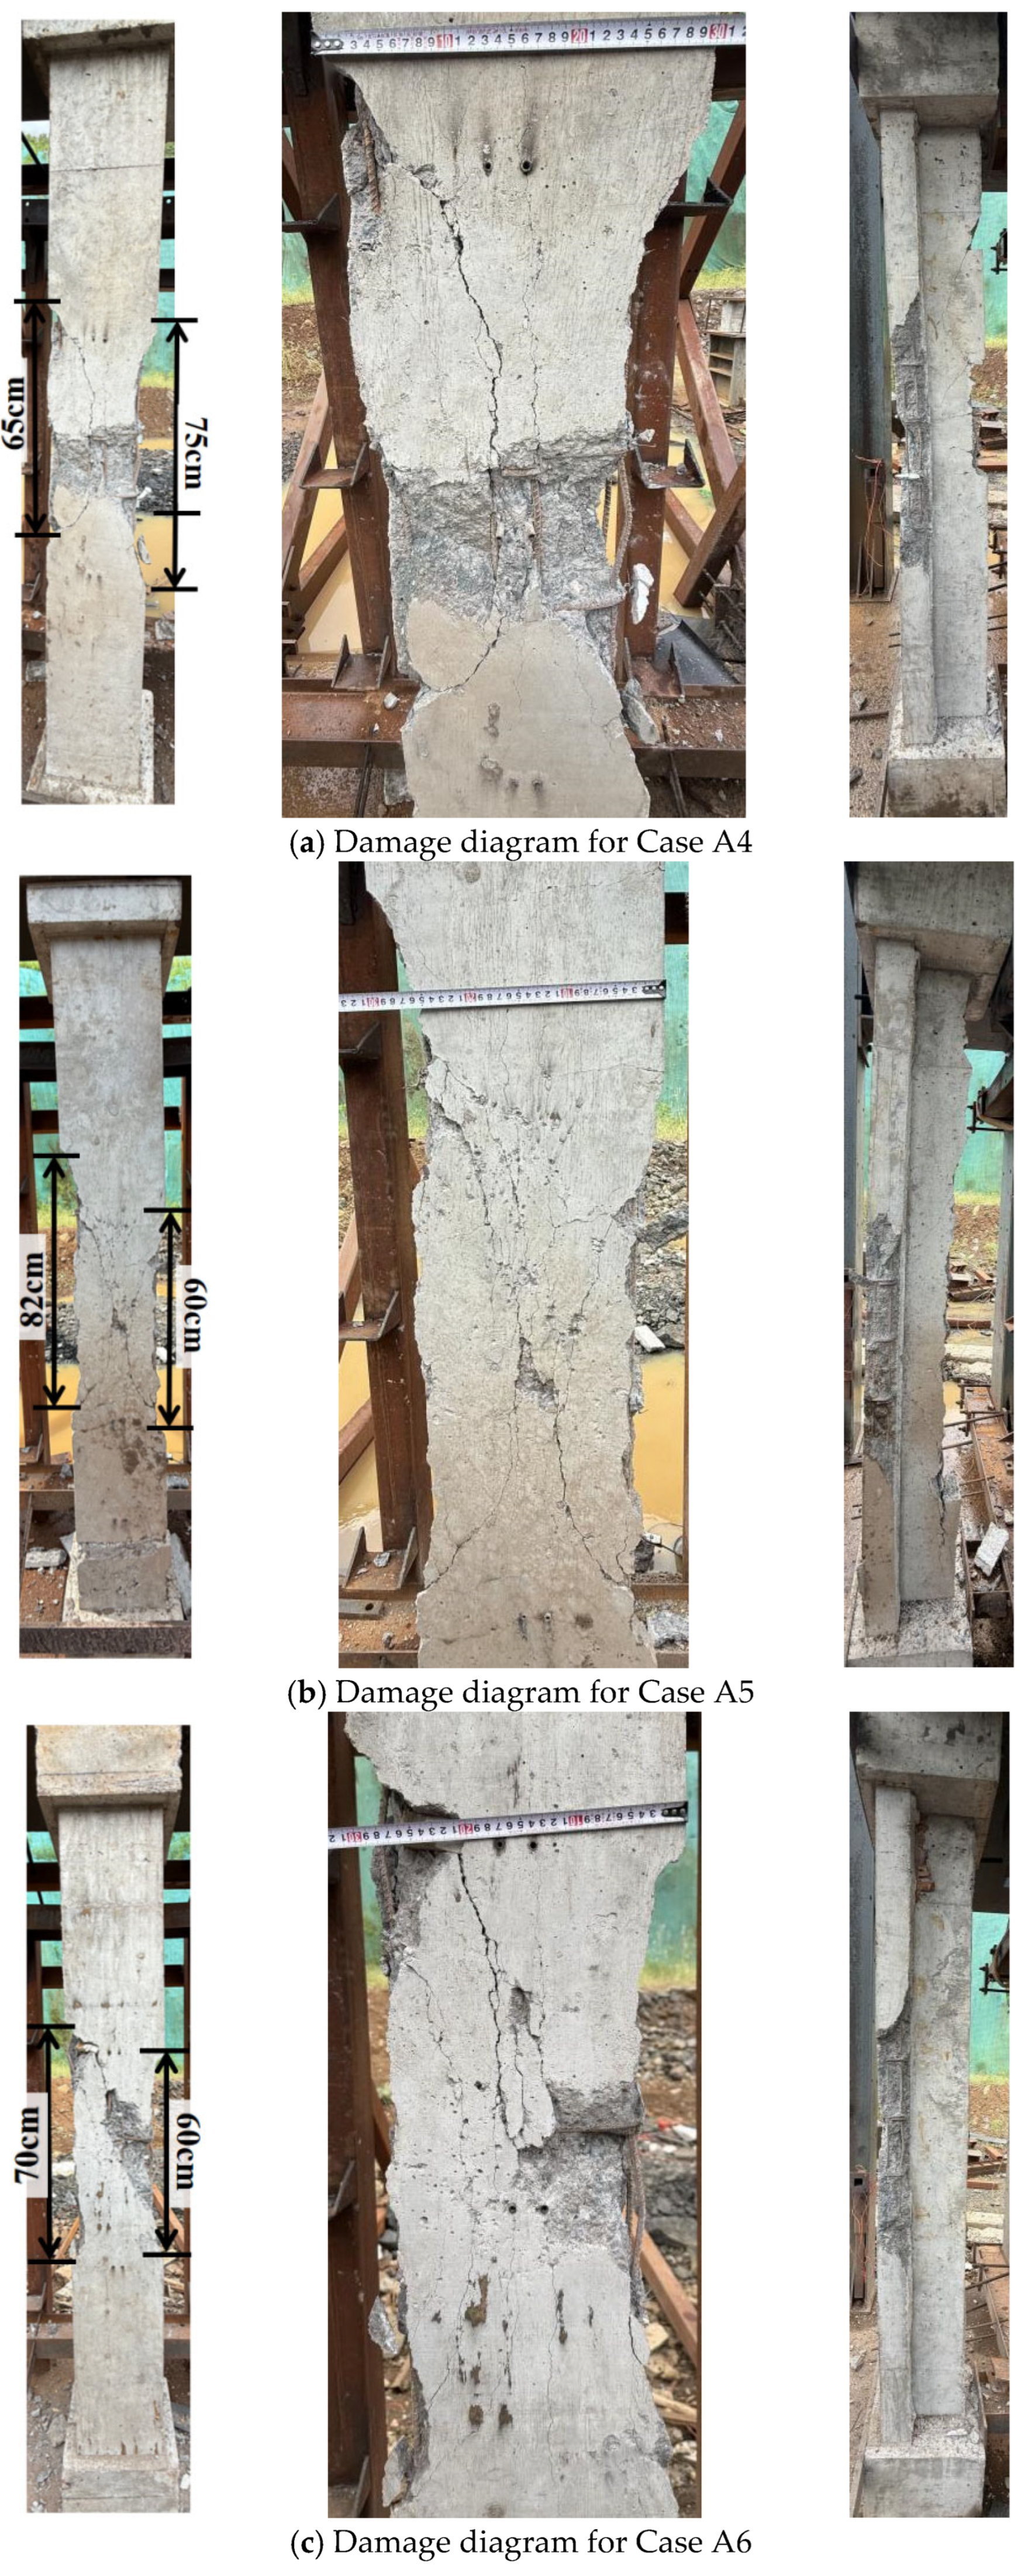
The failure modes of the specimens in Cases A4 and A6 are presented in Figure 10a and Figure 10c, respectively. Both cases exhibited obvious blast craters and intersecting cracks, along with exposed and noticeably deformed longitudinal bars and stirrups. In Case A4, the concrete spalling zones measured 65 cm and 75 cm in length, resulting in a damaged area of approximately 989 cm2 on the blast-facing surface. Conversely, Case A6 featured spalling lengths of 70 cm and 60 cm, corresponding to a damaged area of approximately 861 cm2. Furthermore, through-thickness cracks appeared in the web region in Case A4, whereas no such cracks formed in Case A6.
Figure 10.
Comparison of damage under different axial compression ratios.
Figure 10b illustrates the failure mode for Case A5. In this scenario, the blast crater on the blast-facing surface was relatively shallow. The spalling zones measured 82 cm and 60 cm, yielding a damaged area of approximately 425 cm2. Only the longitudinal bars on both sides were partially exposed, and multiple non-through-thickness cracks developed in the web.
These experimental results indicate that a moderate axial compression ratio can mitigate the damage to reinforced concrete (RC) T-shaped columns. However, this protective influence has a critical threshold; once the axial compression ratio exceeds a certain point, both overall and localized structural damage are significantly exacerbated.
(3) Effect of Blast Location
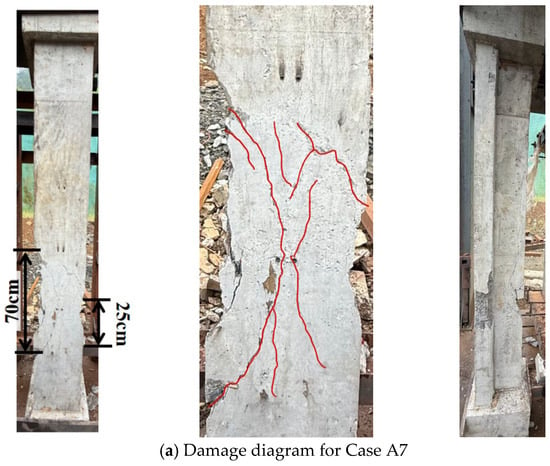
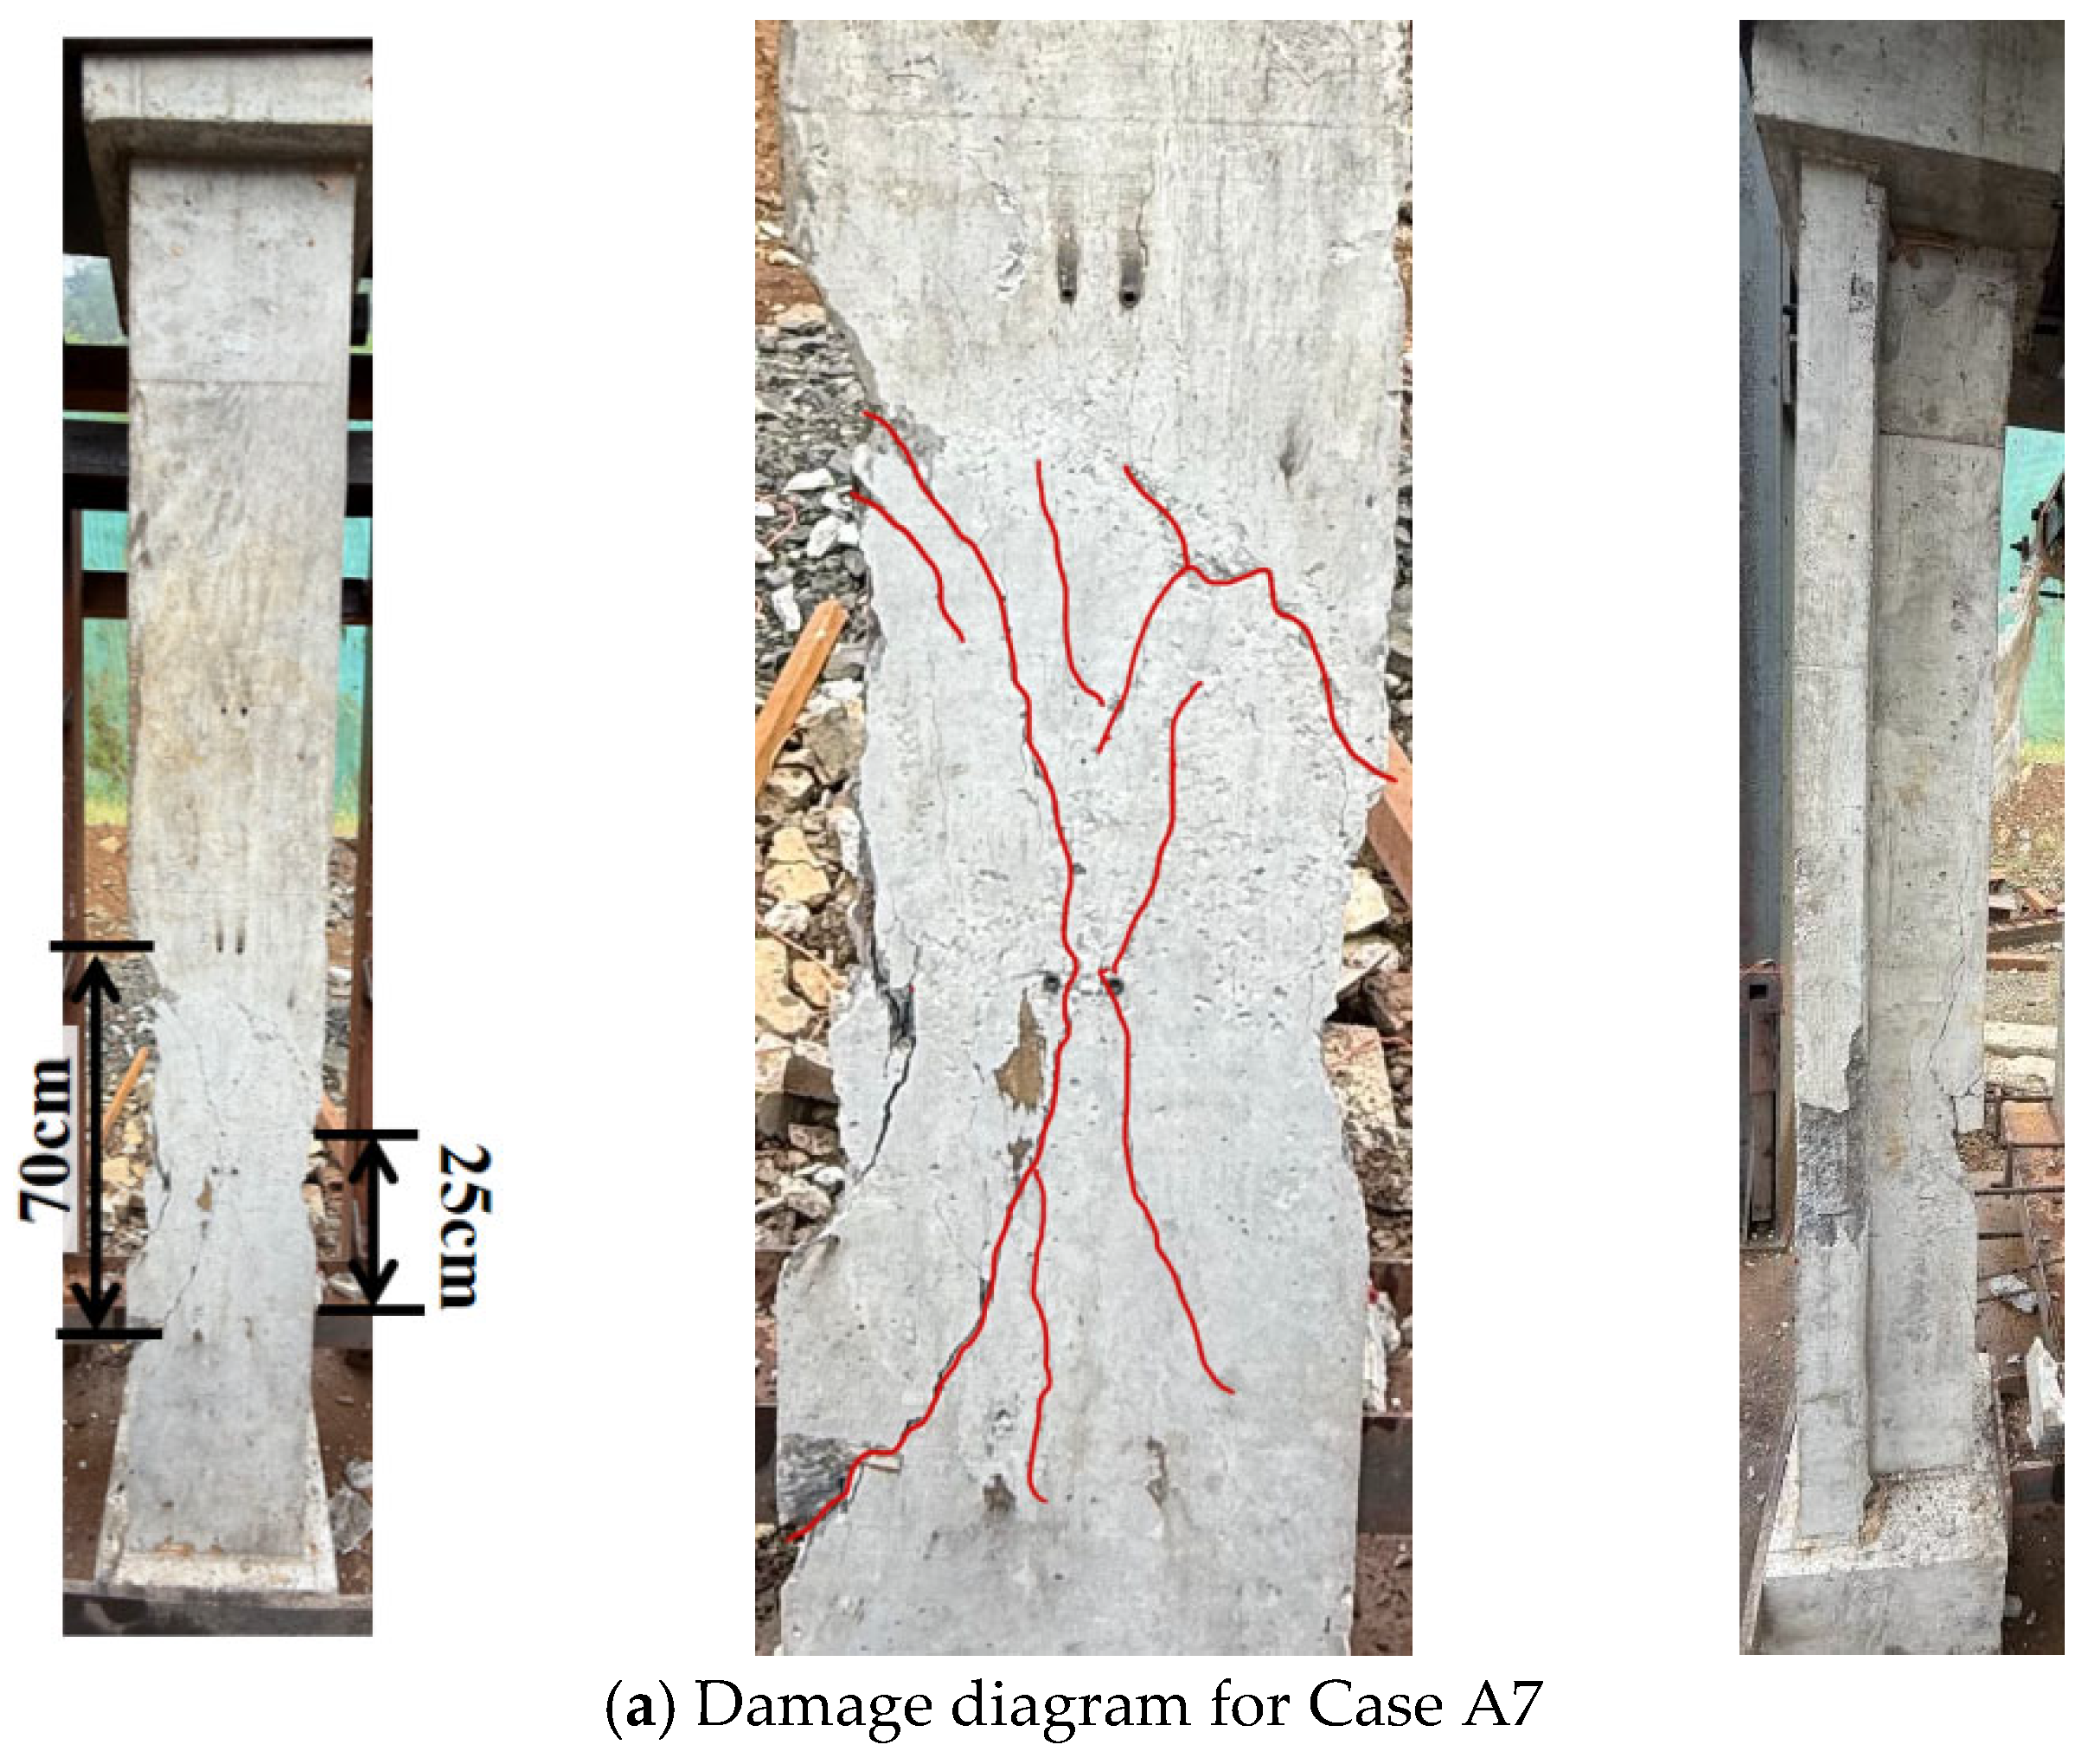
The failure mode of the specimen in Case A7 is illustrated in Figure 11a. Introducing blast eccentricity caused significant asymmetric damage to the component. On the eccentric side of the blast-facing surface, localized shallow blast craters and concrete spalling were concentrated. The spalling zones measured 70 cm and 25 cm in length with a maximum depth of 6 cm, resulting in a damaged area of approximately 235 cm2. Furthermore, multiple longitudinal and diagonal cracks propagated across the web on this side, whereas only a few microcracks were observed on the non-eccentric side. Localized longitudinal bars and stirrups on the eccentric side were exposed and slightly bent. Overall, the component underwent a limited unilateral bending response, and the steel reinforcement exhibited no obvious yielding.
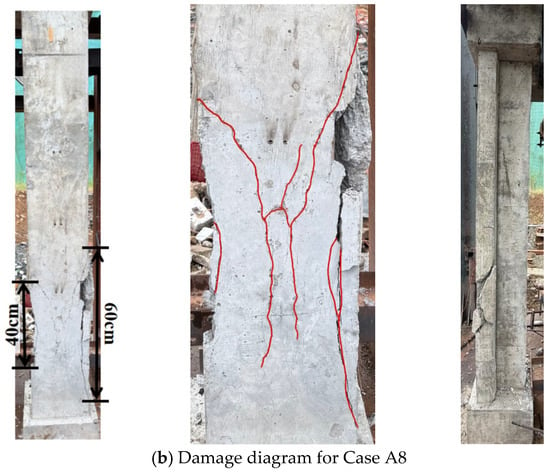
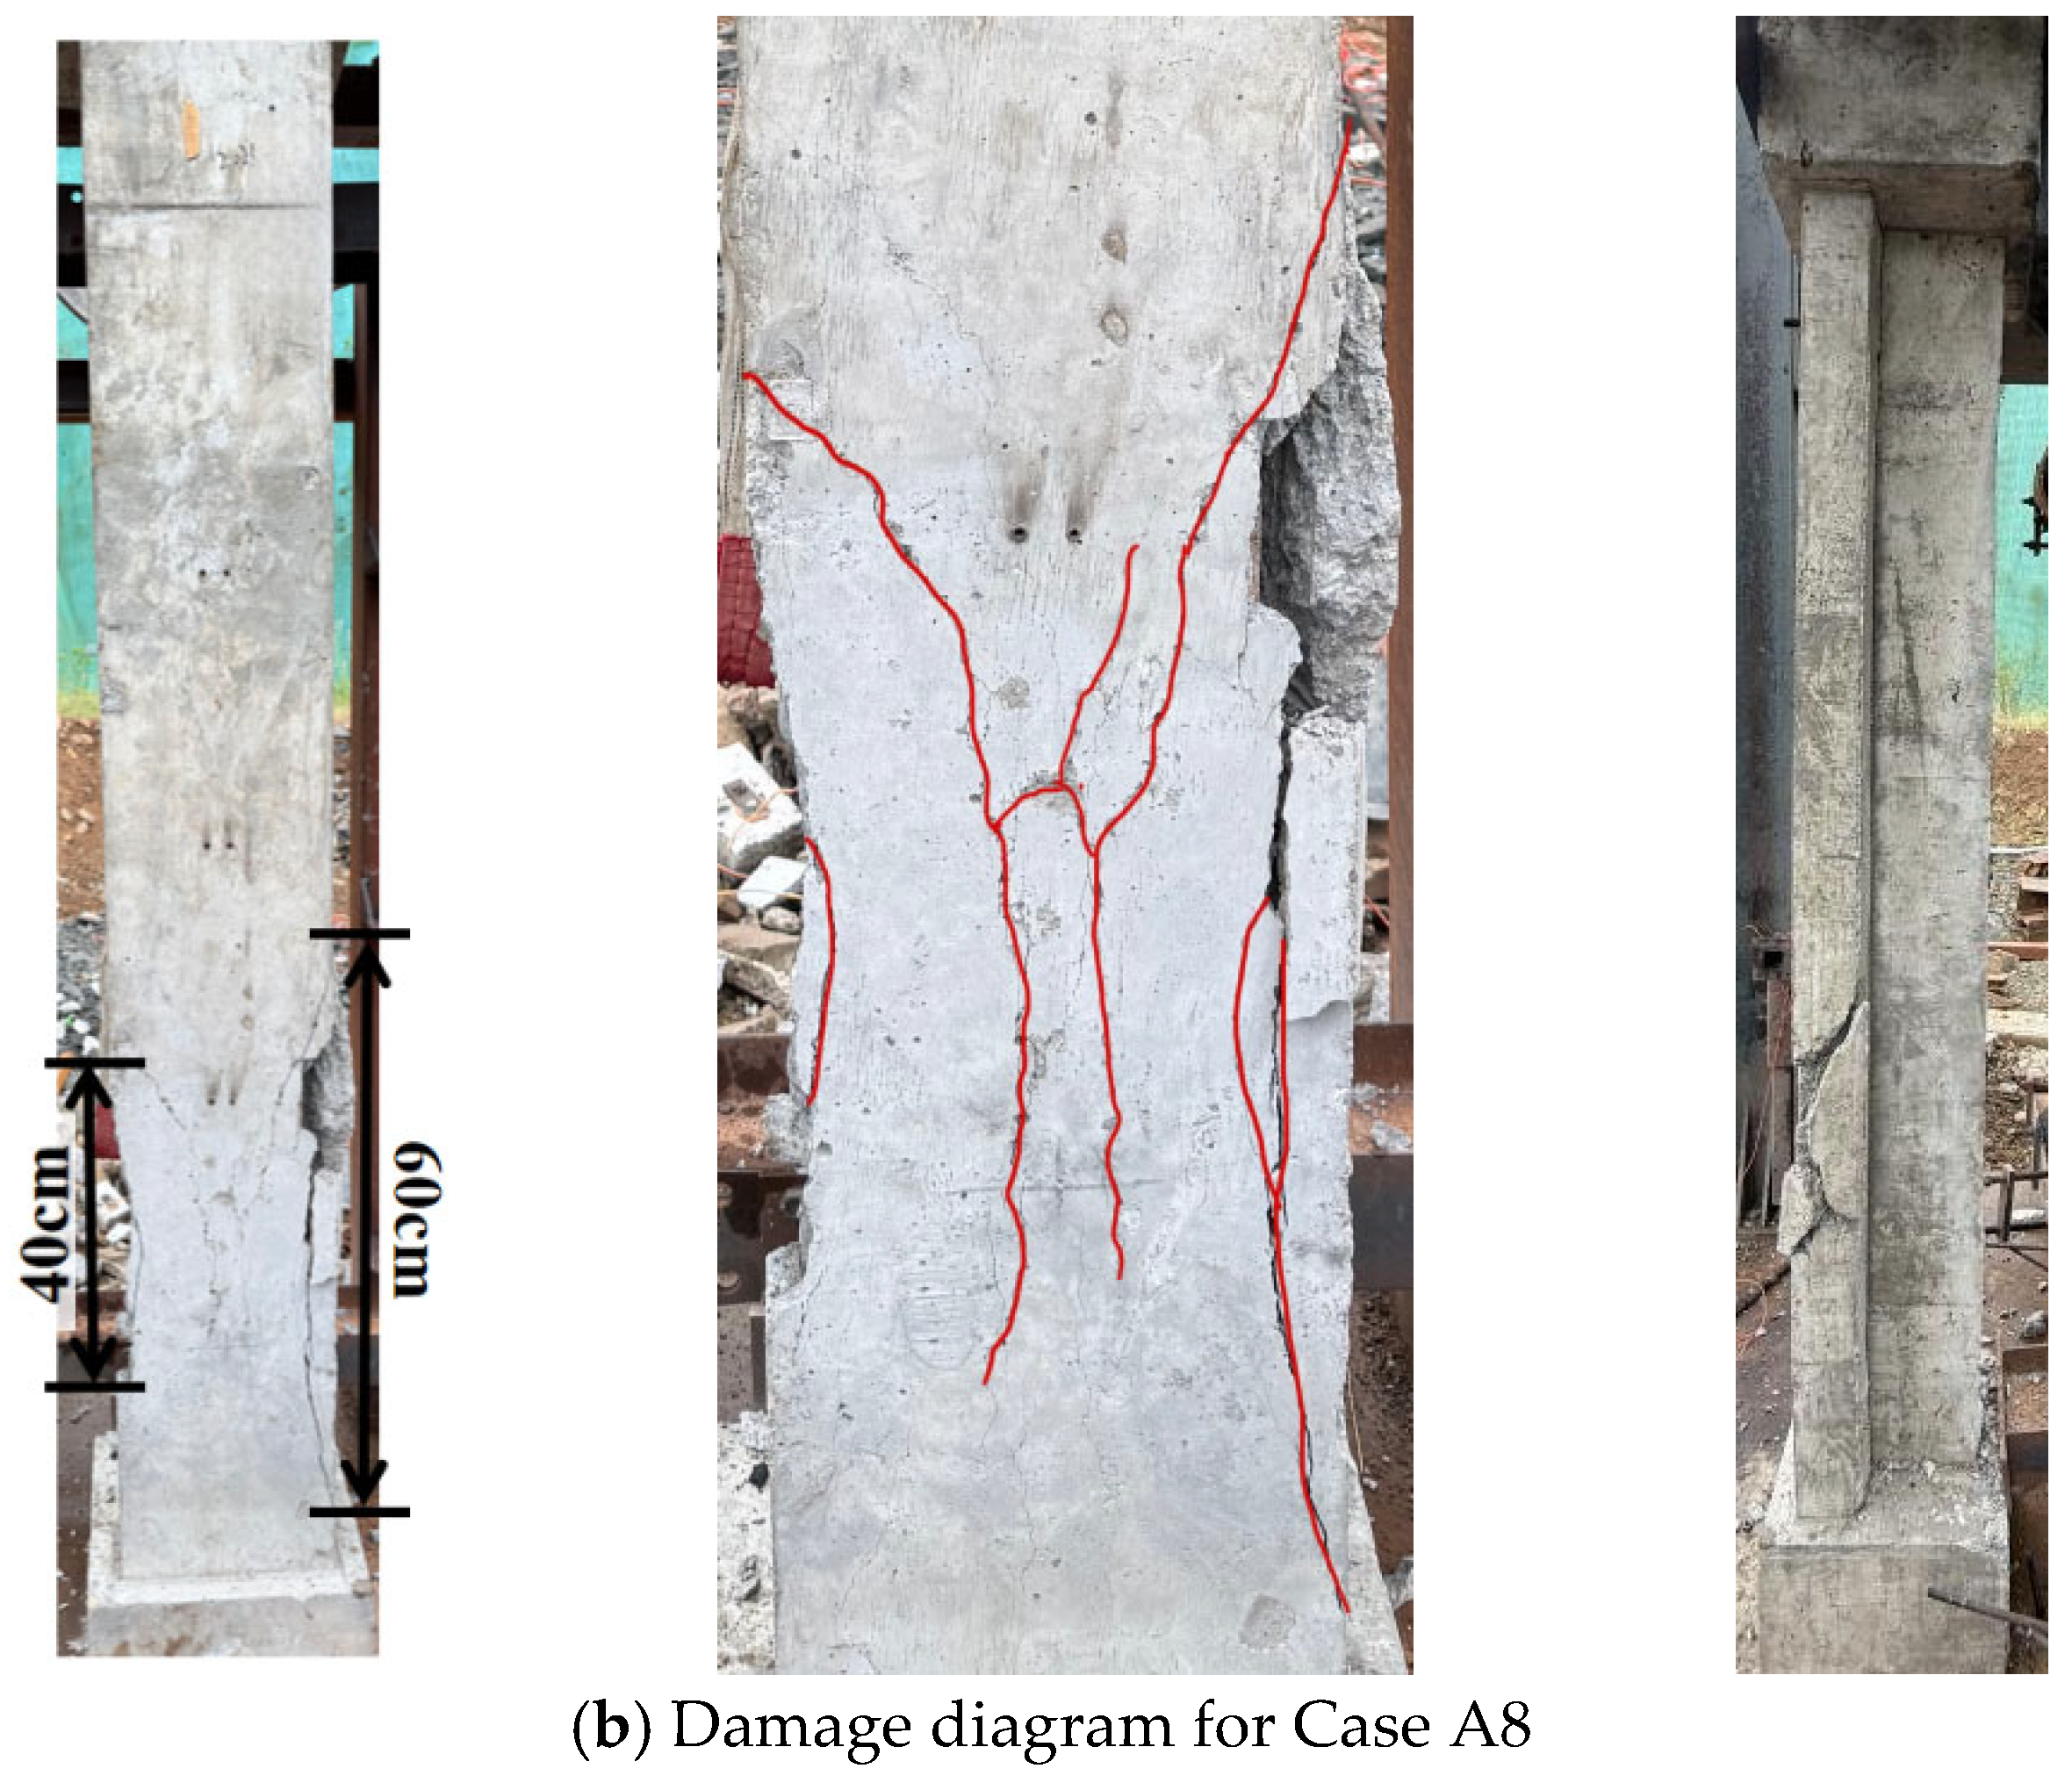
Figure 11.
Comparison of damage under different blast locations.
Figure 11b presents the failure mode for Case A8. As the eccentricity increased, the component demonstrated extreme asymmetric damage. The eccentric side of the blast-facing surface suffered localized crushing, featuring a spalling length of approximately 60 cm and a maximum depth of about 5 cm, which yielded a damaged area of approximately 210 cm2. A through-thickness principal longitudinal crack and a complex network of diagonal cracks formed on this side, with the longest crack extending to the support. Meanwhile, the non-eccentric side sustained only secondary microcracks, and signs of slight shear slip were observed at the supports.
3. Numerical Simulation Analysis
3.1. Finite Element Model
The *MAT_RHT material model in LS-DYNA was employed for the concrete. This model effectively characterizes concrete damage behavior under high strain rates and high-pressure conditions. By utilizing three characteristic stress surfaces to describe the material’s mechanical response, the RHT model accurately captures the yield, maximum, and residual strengths of concrete. It provides a reasonable description of the entire degradation process—from initial elasticity to complete failure—making it highly suitable for simulating dynamic characteristics under blast and impact loading. As indicated by studies such as Hao and Hao [23], traditional empirical DIF models are mostly applied to the macro-bending calculations of one-dimensional components. In contrast, the multi-axial dynamic strengthening criteria and damage evolution mechanisms embedded in the RHT model are better suited for simulating the local damage and global dynamic failure of T-shaped columns under the three-dimensional stress fields induced by close-in detonations. Specific parameter values are detailed in Table 5 [24]. It should be noted that in the *MAT_RHT constitutive model, the parameter fc was strictly input as 40 MPa. This value was adopted not as a direct static unconfined uniaxial substitution, but as an effective calibrated dynamic resistance baseline, which aligns with standard accepted conventions in blast numerical simulations.
Table 5.
RHT concrete material parameters.
For the steel reinforcement, the *MAT_PLASTIC_KINEMATIC model was adopted. By adjusting specific parameters, this model allows switching between kinematic and isotropic plastic hardening mechanisms. It characterizes fracture behavior by introducing a principal failure strain criterion and utilizes the Cowper–Symonds constitutive equation to account for strain rate effects. Although the DIF formula proposed by Malvar [25] exhibits exceptionally high accuracy in characterizing the dynamic strength of steel reinforcement, the *MAT_PLASTIC_KINEMATIC model is more widely adopted in existing blast-resistant numerical studies due to its superior computational convergence and numerical stability under fluid–structure interaction (FSI) algorithms.
where is dynamic yield strength; is static yield strength; C and P are strain rate-related parameters, which are taken as 40 and 5, respectively, in this study. The specific parameters are detailed in Table 6. Although the measured mean yield strength of the steel reinforcement was 447.77 MPa, the nominal yield strength of 400 MPa (standard for HRB400 steel) was adopted in the numerical model to establish a conservative baseline aligned with standard engineering design codes.
Table 6.
Material parameters of HRB400 steel reinforcement.
The explosive was modeled using *MAT_HIGH_EXPLOSIVE_BURN, with its pressure characterized by the *EOS_JWL equation of state, which is expressed as follows:
where is the detonation pressure of the TNT explosive, represents the relative volume, is the initial internal energy per unit volume, and , , , , and ω are material constants. The specific parameters are detailed in Table 7.
Table 7.
Explosive material parameters.
For the air, the *MAT_NULL model was employed; its non-viscous ideal gas characteristics were described using the *EOS_LINEAR_POLYNOMIAL equation of state, which is expressed as follows:
where / − 1, , , , , , , and are constants, represents the air pressure, and denotes the initial internal energy per unit volume. The specific parameters are presented in Table 8.
Table 8.
Air material parameters.
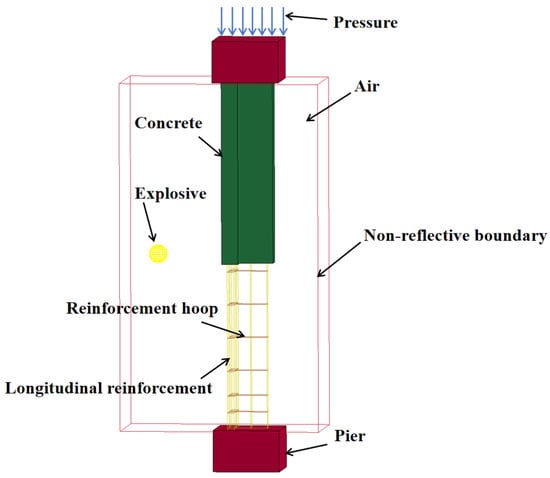
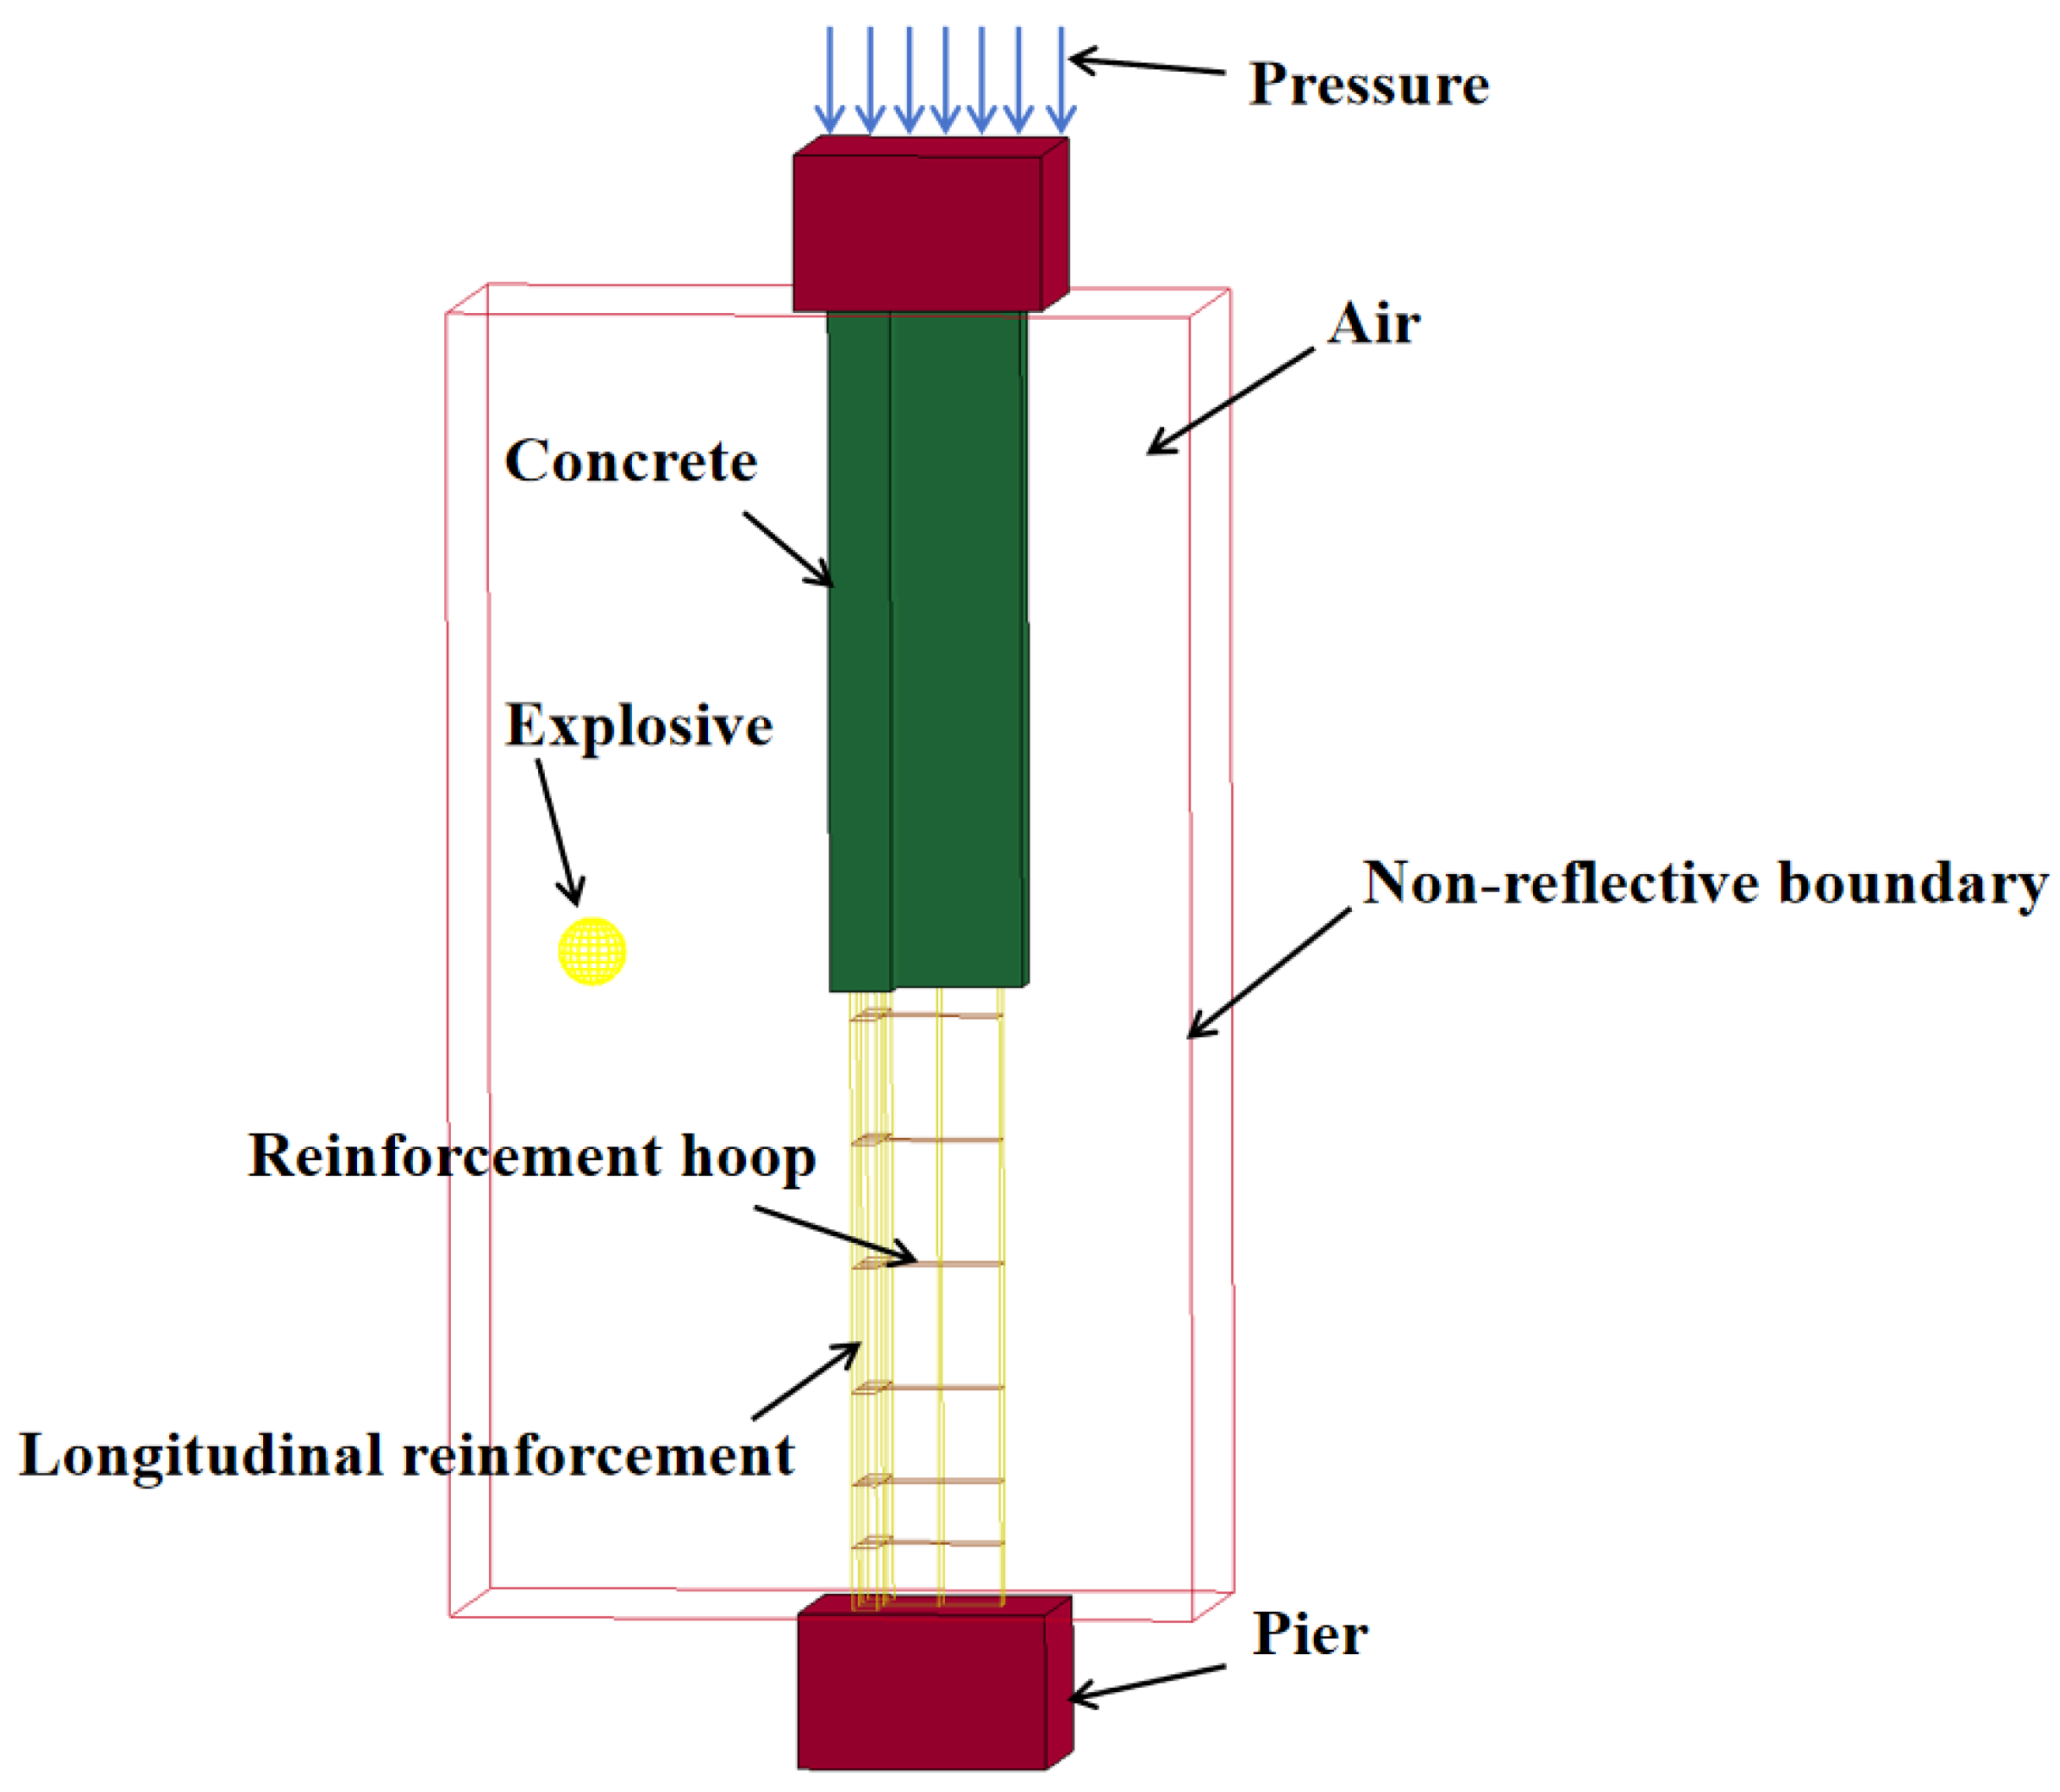
The Arbitrary Lagrangian–Eulerian (ALE) fluid–structure interaction (FSI) algorithm was employed for the numerical simulation. The concrete, air, and column stubs were modeled using SOLID 164 elements, while the steel reinforcement was modeled using BEAM 161 elements. Based on mesh convergence considerations, the mesh sizes were set to 0.5 cm for both the concrete and steel reinforcement, and 1.0 cm for the air domain. The explosive was defined utilizing the initial volume fraction method via the *INITIAL_VOLUME_FRACTION_GEOMETRY keyword. Coupling between the steel reinforcement (both stirrups and longitudinal bars) and the concrete solid elements was achieved using the *CONSTRAINED_BEAM_IN_SOLID algorithm. Furthermore, the interaction between the reinforced concrete and the air solid elements was defined using the *CONSTRAINED_LAGRANGE_IN_SOLID algorithm. The element erosion algorithm for the concrete was implemented by defining the *MAT_ADD_EROSION keyword, adopting a maximum principal strain value of 0.1 as the failure criterion [24]. The established finite element model is illustrated in Figure 12.
Figure 12.
Finite element model.
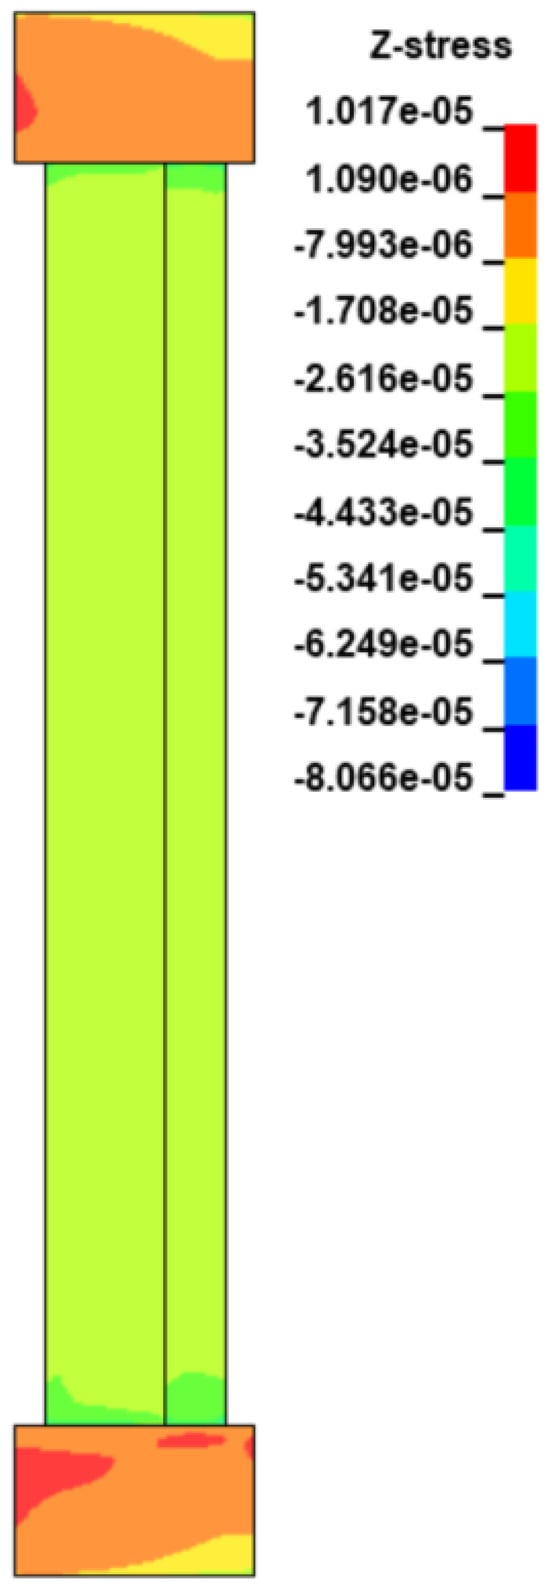
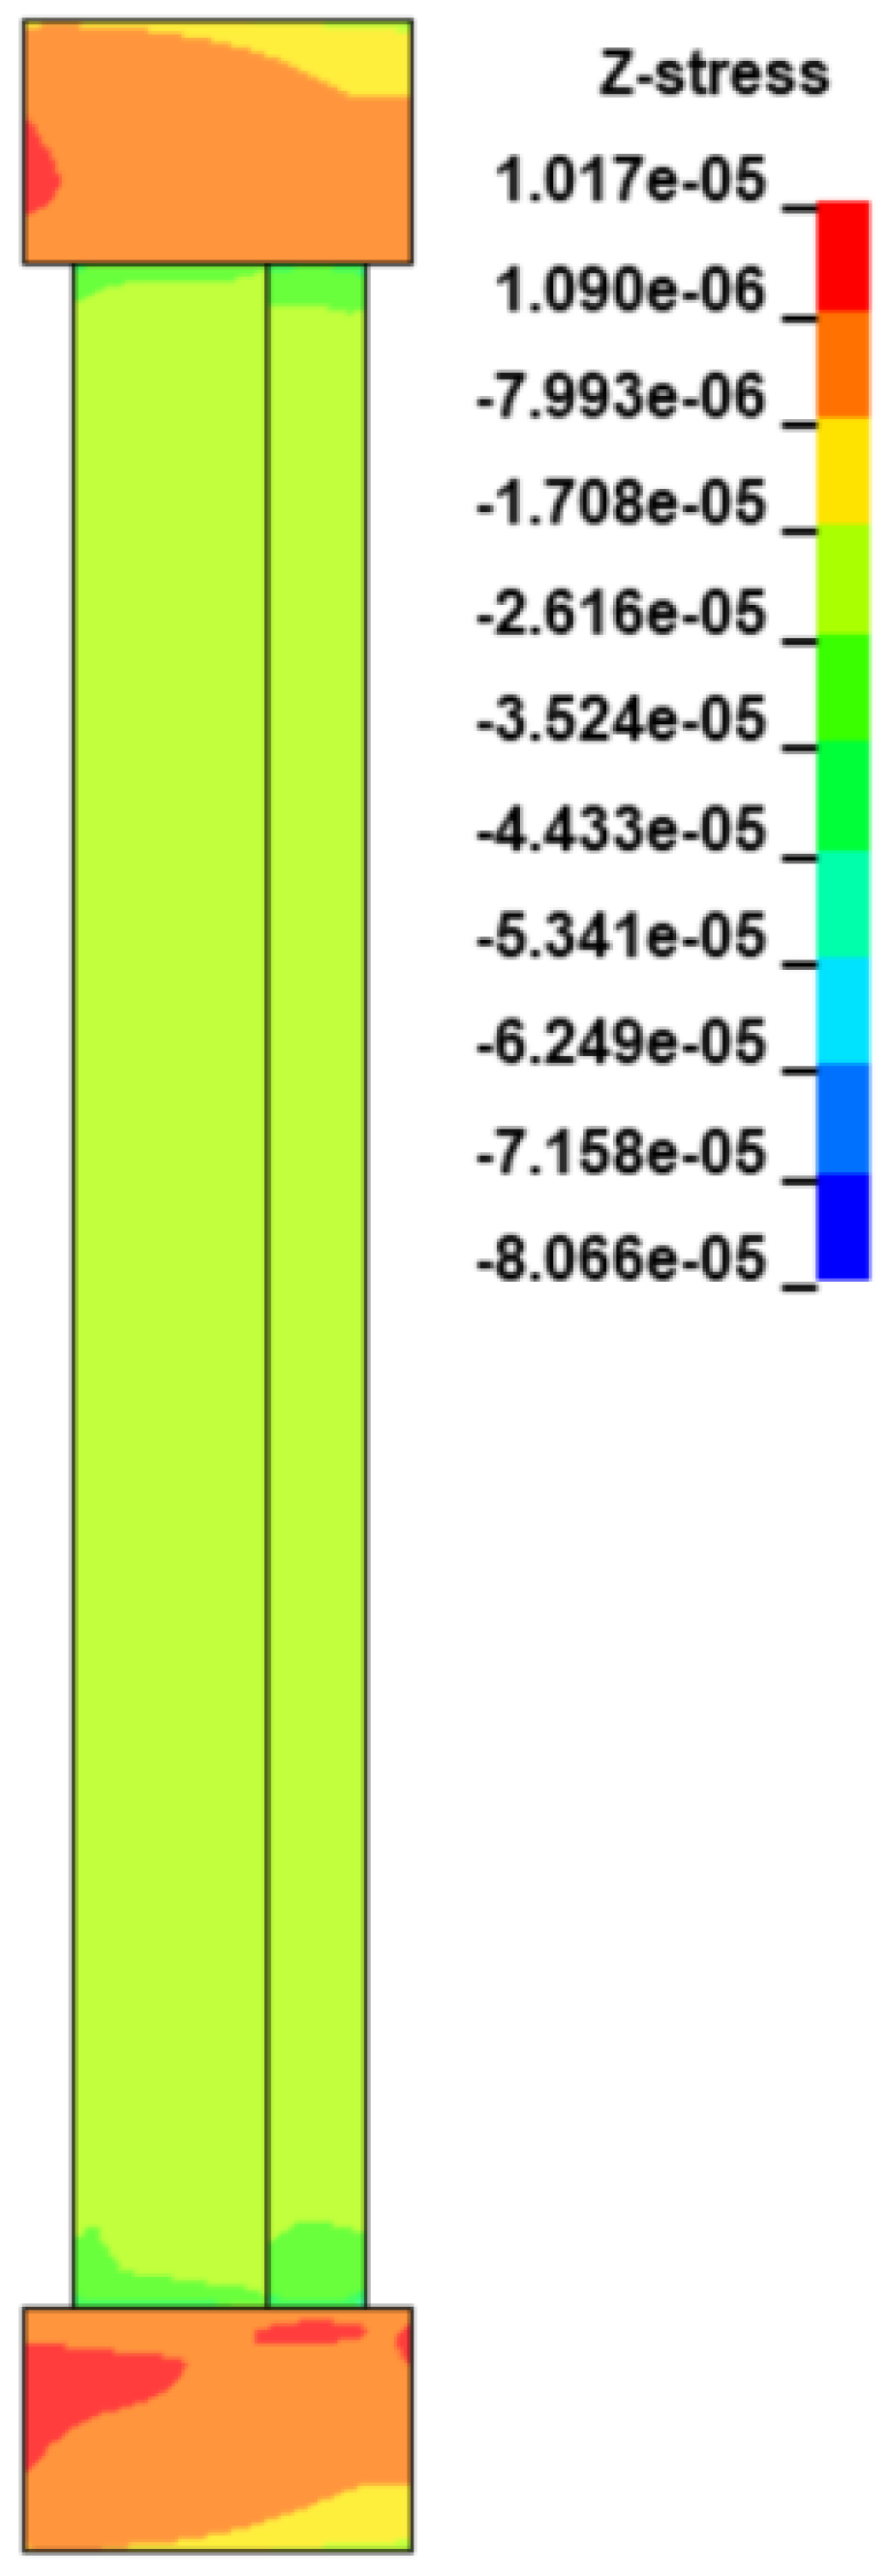
To accurately replicate the experimental setup, fully fixed boundary conditions were applied to the bottom concrete column stub throughout the entire simulation, explicitly restraining all translational and rotational degrees of freedom. The axial pre-load was established prior to the blast loading using the dynamic relaxation explicit algorithm via the *CONTROL_DYNAMIC_RELAXATION and *BOUNDARY_PRESCRIBED_MOTION_SET keywords. During this pre-loading stage, the top concrete column stub was constrained in all horizontal translational and rotational directions, while a smoothly ramped vertical displacement was prescribed until static equilibrium was reached. This ensured that the target axial compression ratio was uniformly distributed across the cross-section without inducing severe dynamic oscillations. Upon convergence, the pre-load state was locked by maintaining a constant vertical displacement curve for the top stub, effectively restricting its vertical degree of freedom during the dynamic impact, and the ALE FSI algorithm was activated for the subsequent blast simulation phase. As shown in Figure 13, the pre-blast stress distribution was verified to confirm the successful establishment of the target axial stress field while maintaining the intended boundary constraints.
Figure 13.
Stress contour plot.
3.2. Mesh Convergence Analysis
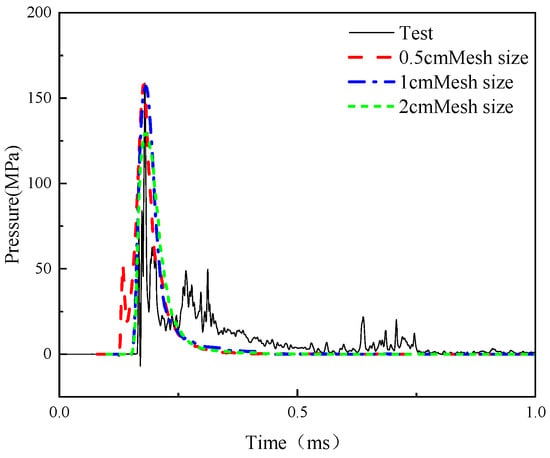
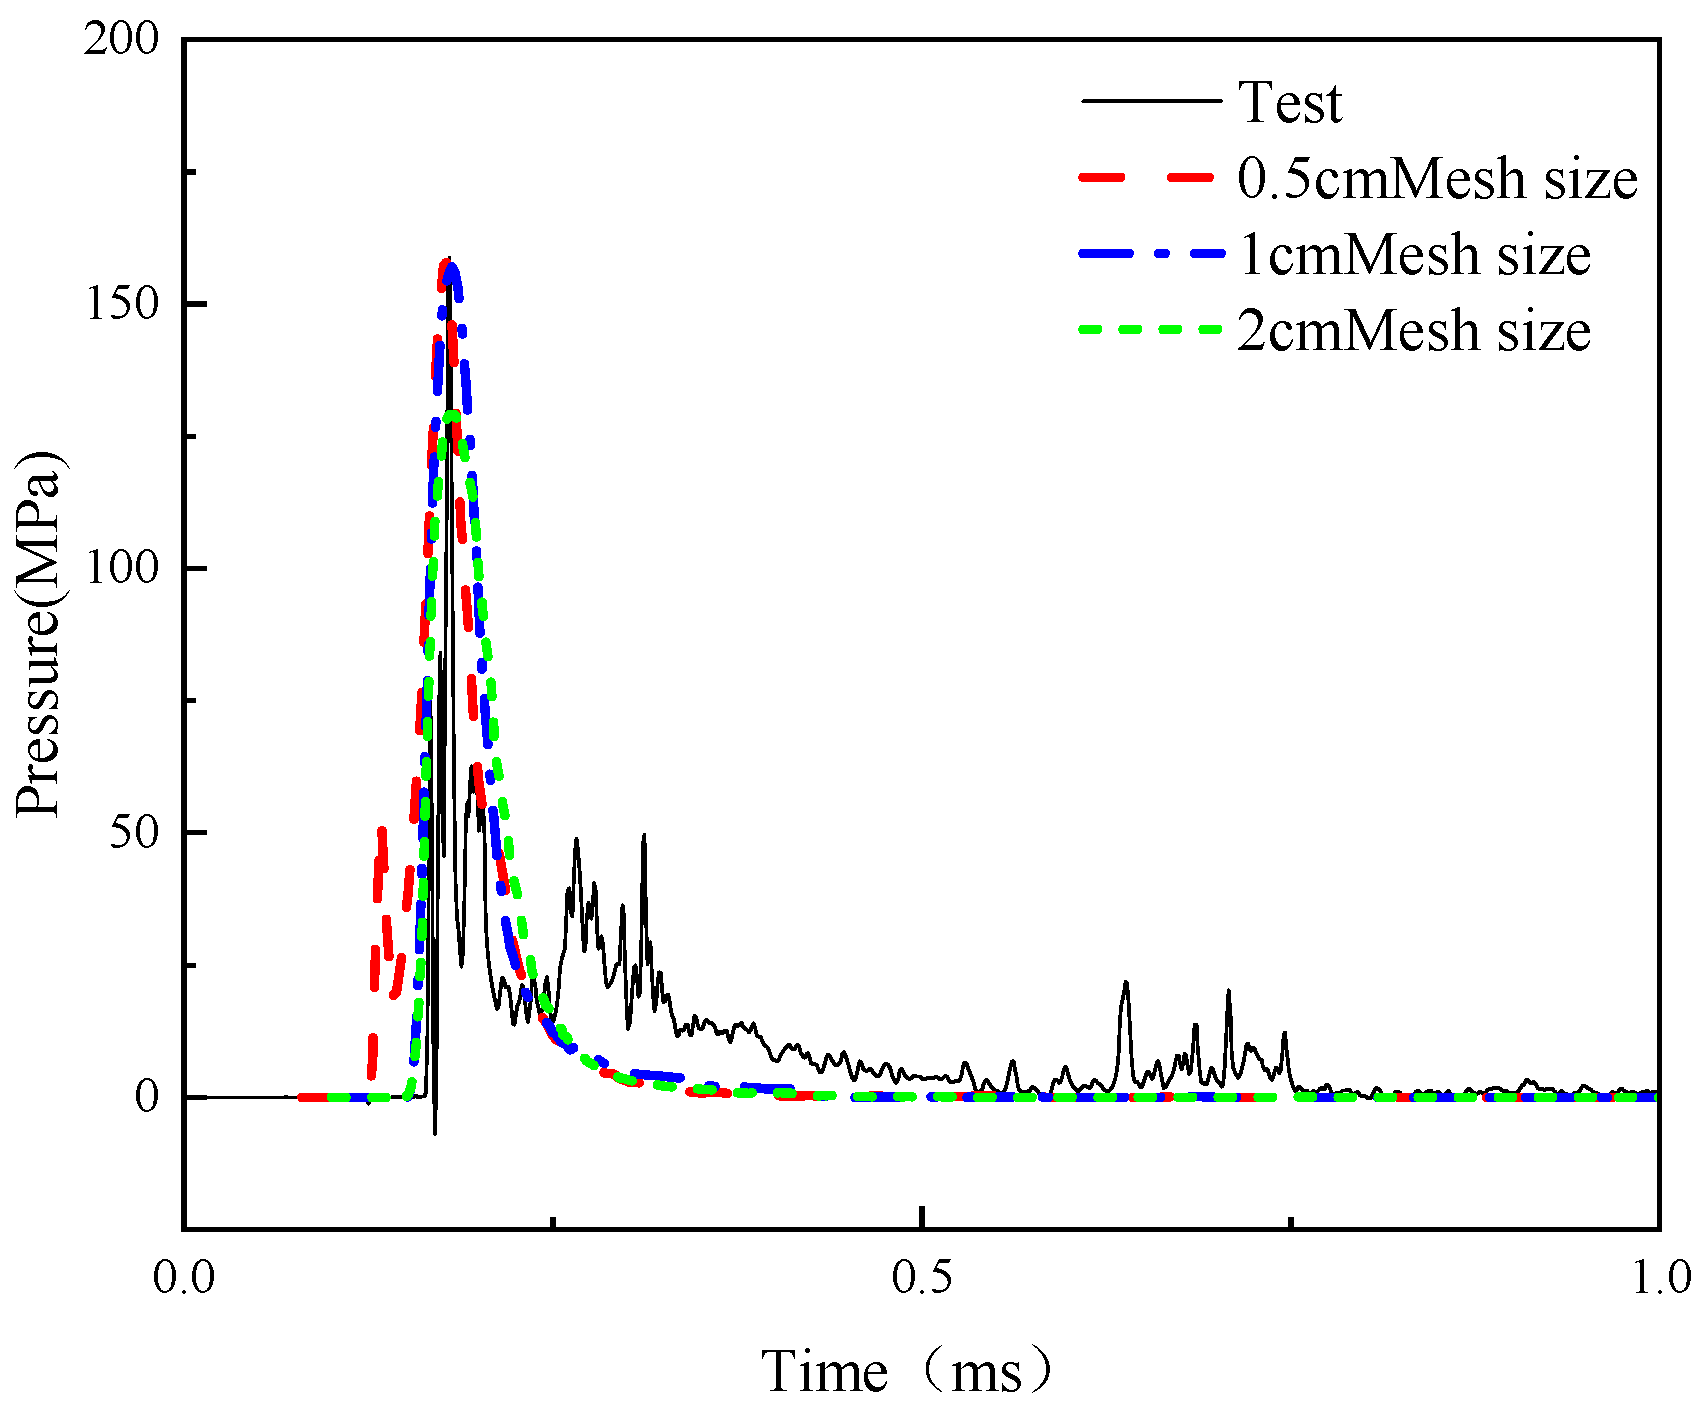
Based on experimental Case A2, a systematic mesh sensitivity analysis was conducted using the Arbitrary Lagrangian–Eulerian fluid–structure interaction model to evaluate three mesh sizes: 0.5 cm, 1.0 cm, and 2.0 cm. The simulation results for the different mesh densities are presented in Figure 14. The calculation errors for the 0.5 cm and 1.0 cm meshes were relatively small, at 1.12% and 1.75%, respectively. In contrast, the peak pressure obtained with the 2.0 cm mesh deviated significantly from the experimental value, yielding an error of 19.39%. This indicates that mesh refinement can effectively improve the simulation accuracy of the blast loads. To optimally balance computational accuracy and solving efficiency, a mesh size of 1.0 cm was ultimately selected for the air domain in the subsequent finite element analyses, while a mesh size of 0.5 cm was adopted for the concrete and steel reinforcement.
Figure 14.
Mesh convergence analysis results.
3.3. Model Validation
To verify the applicability and validity of the established finite element model, the dynamic response and damage modes of the test columns under blast loading were numerically simulated, and the results were compared with the experimental data.
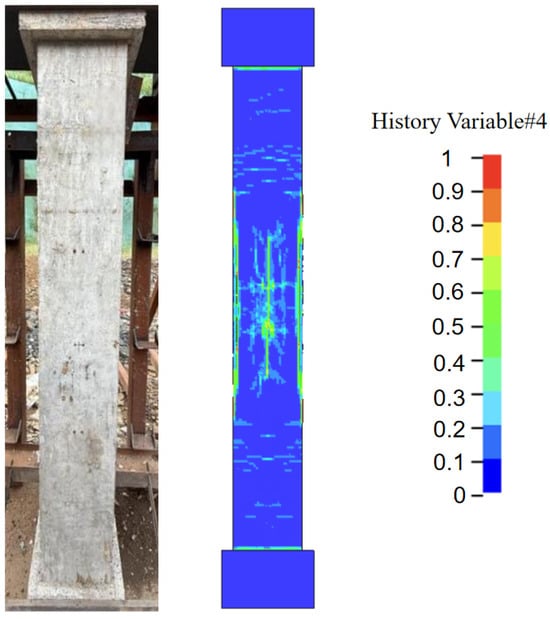
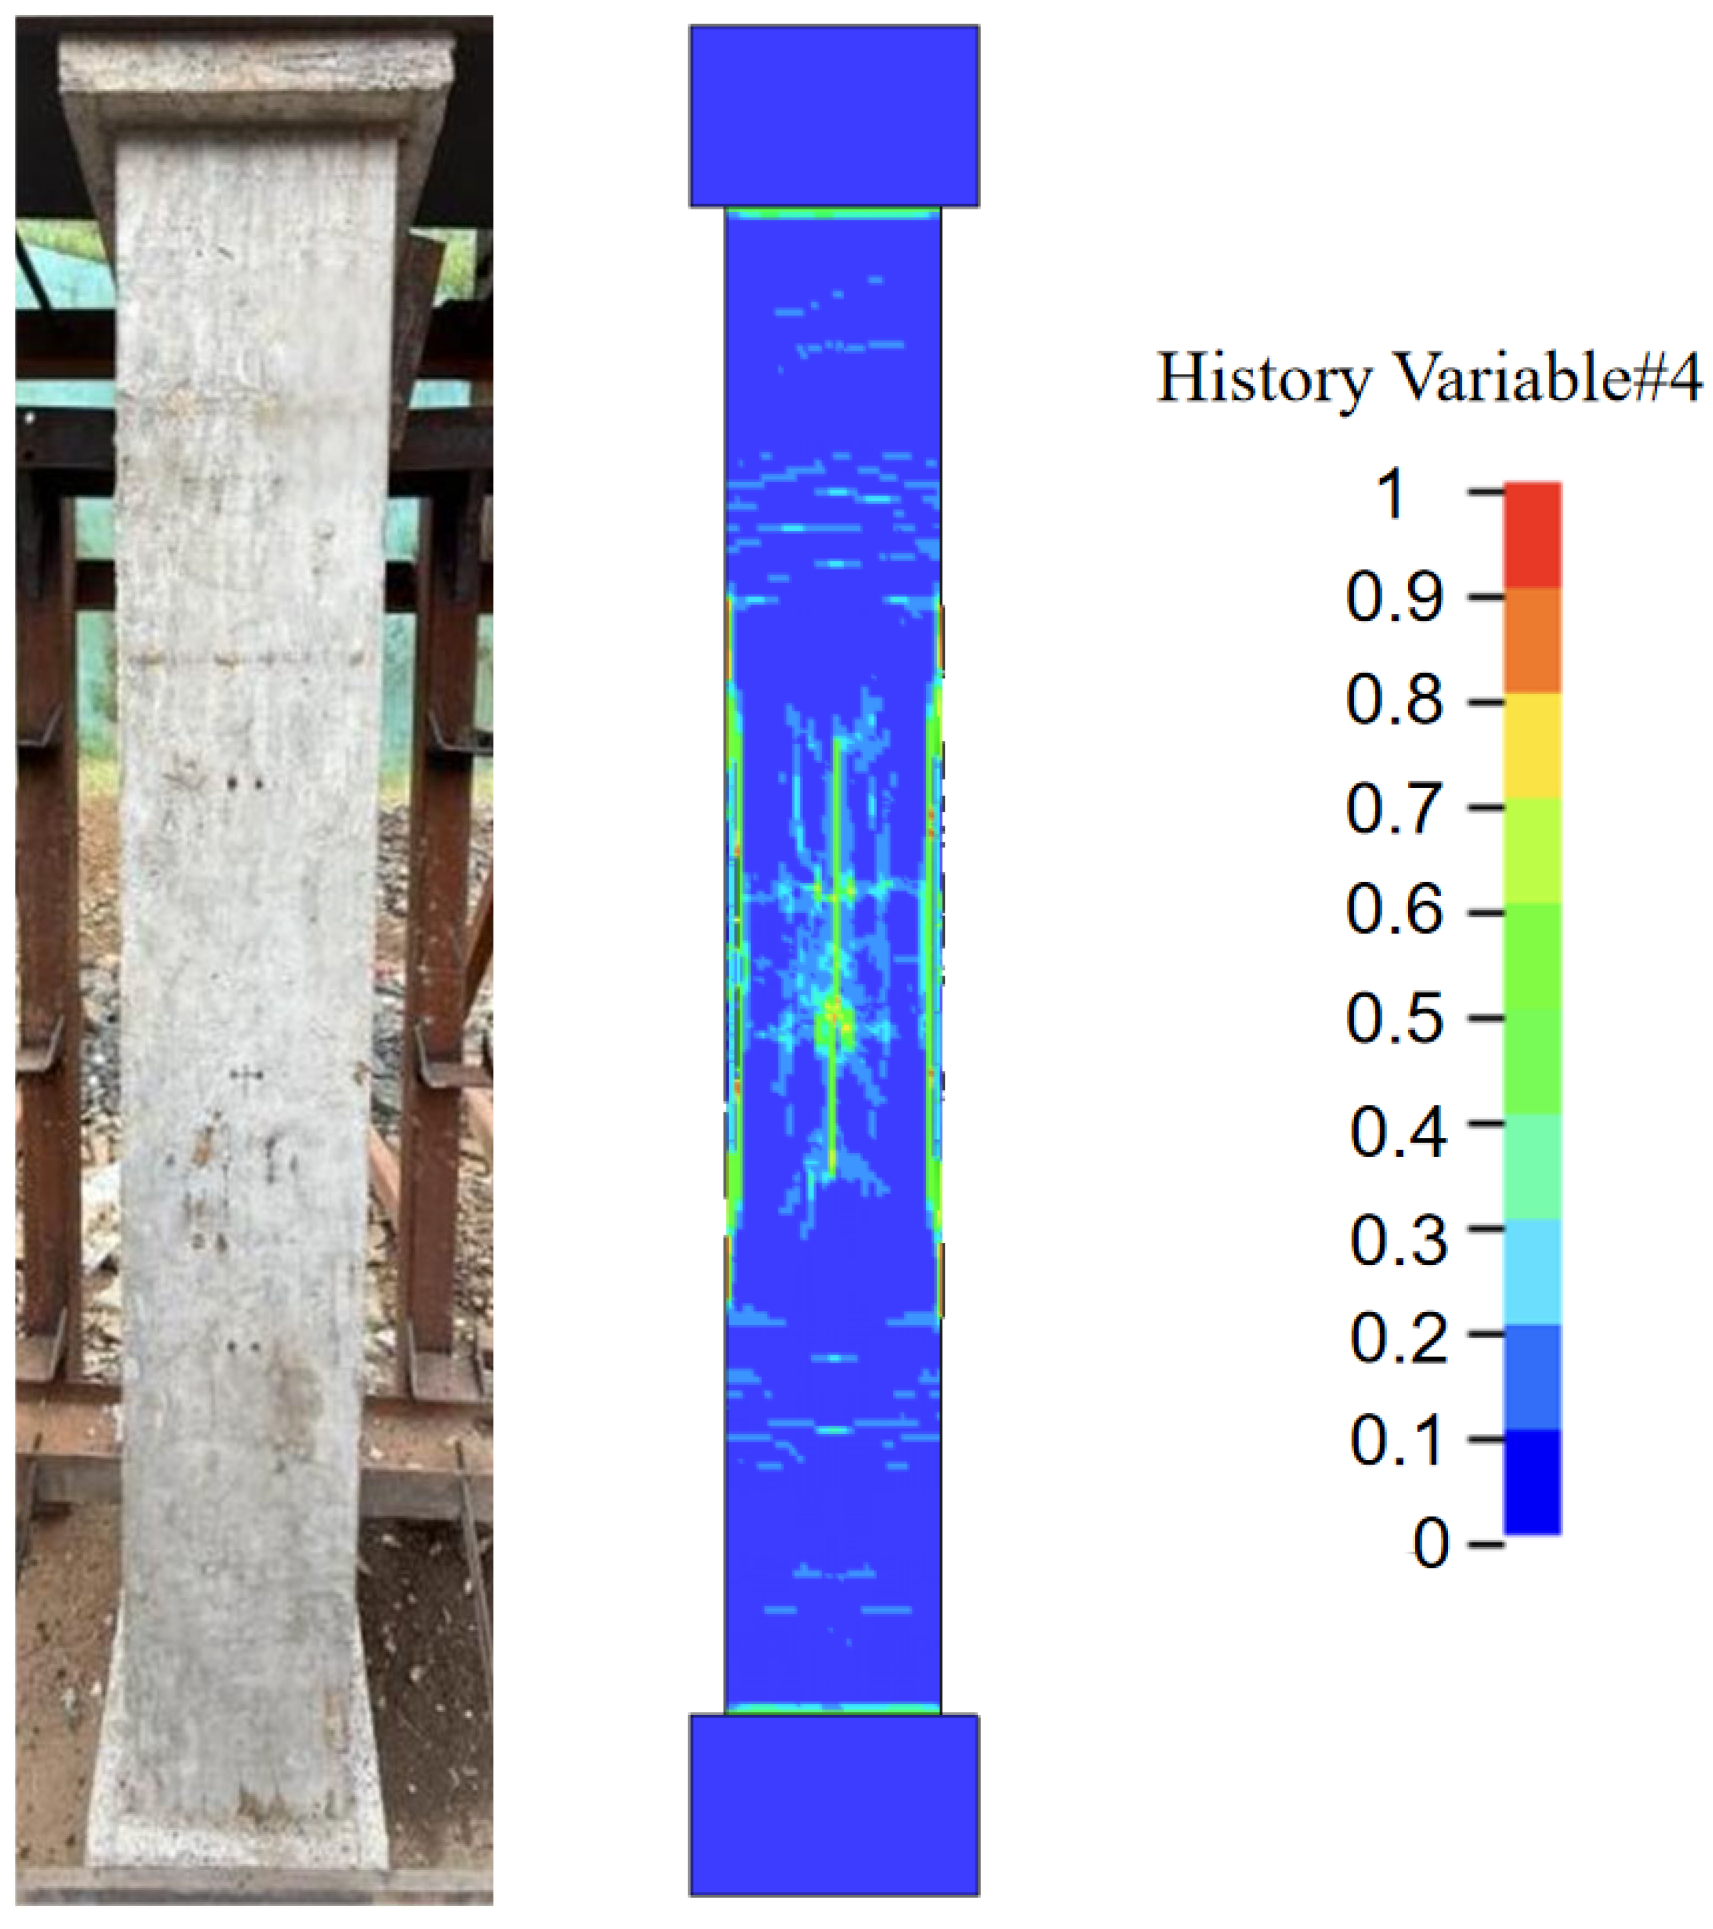
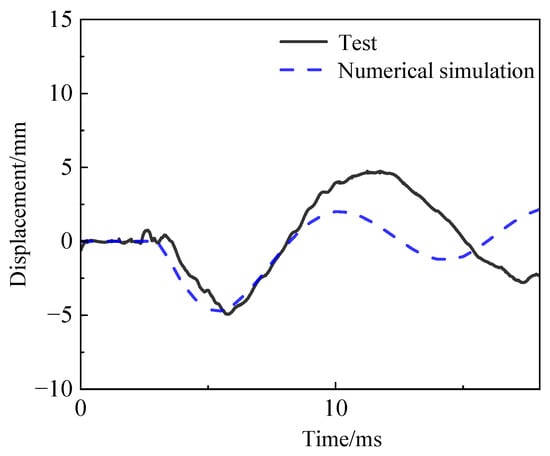
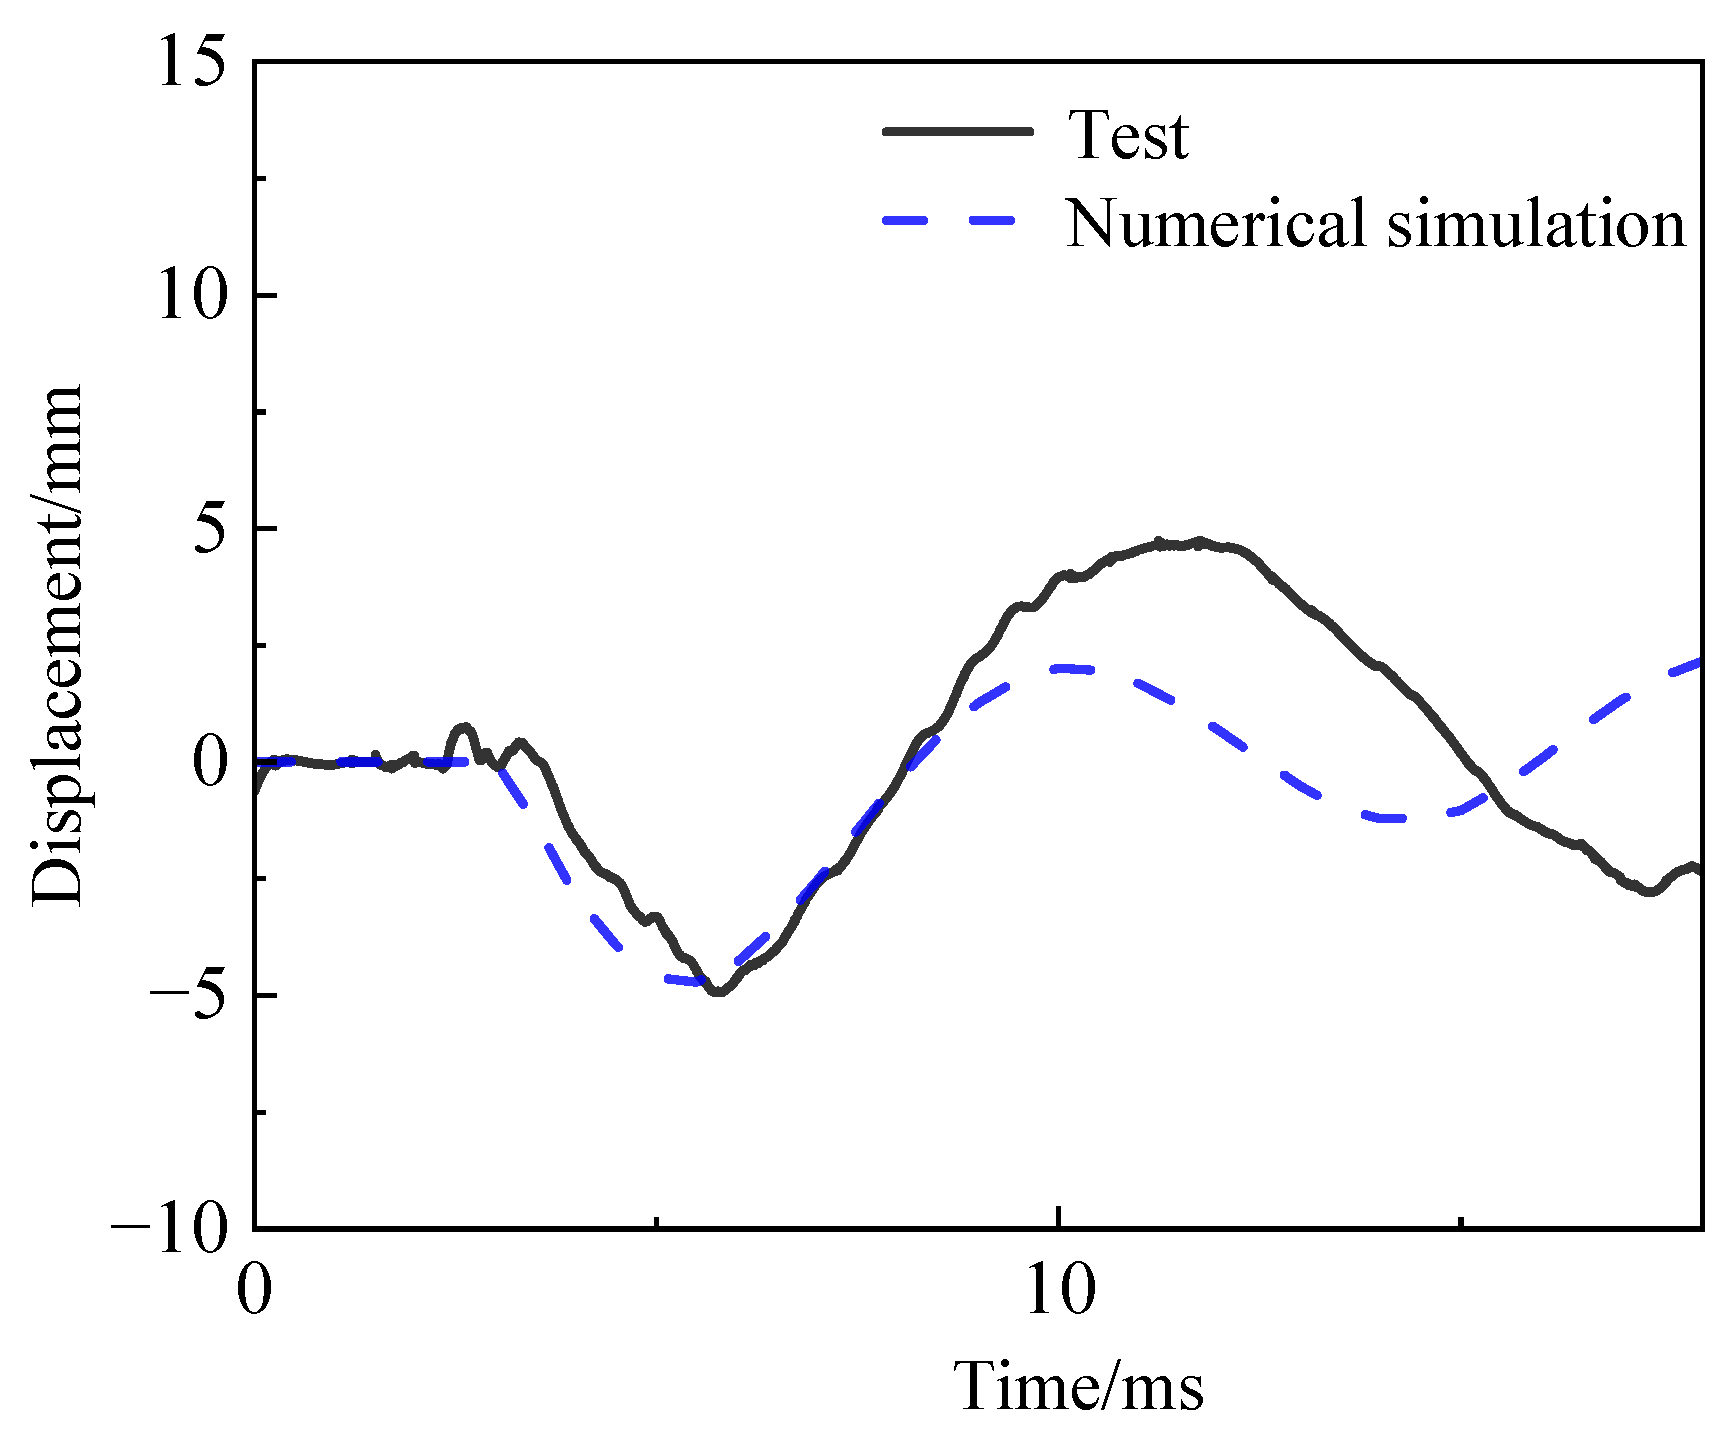
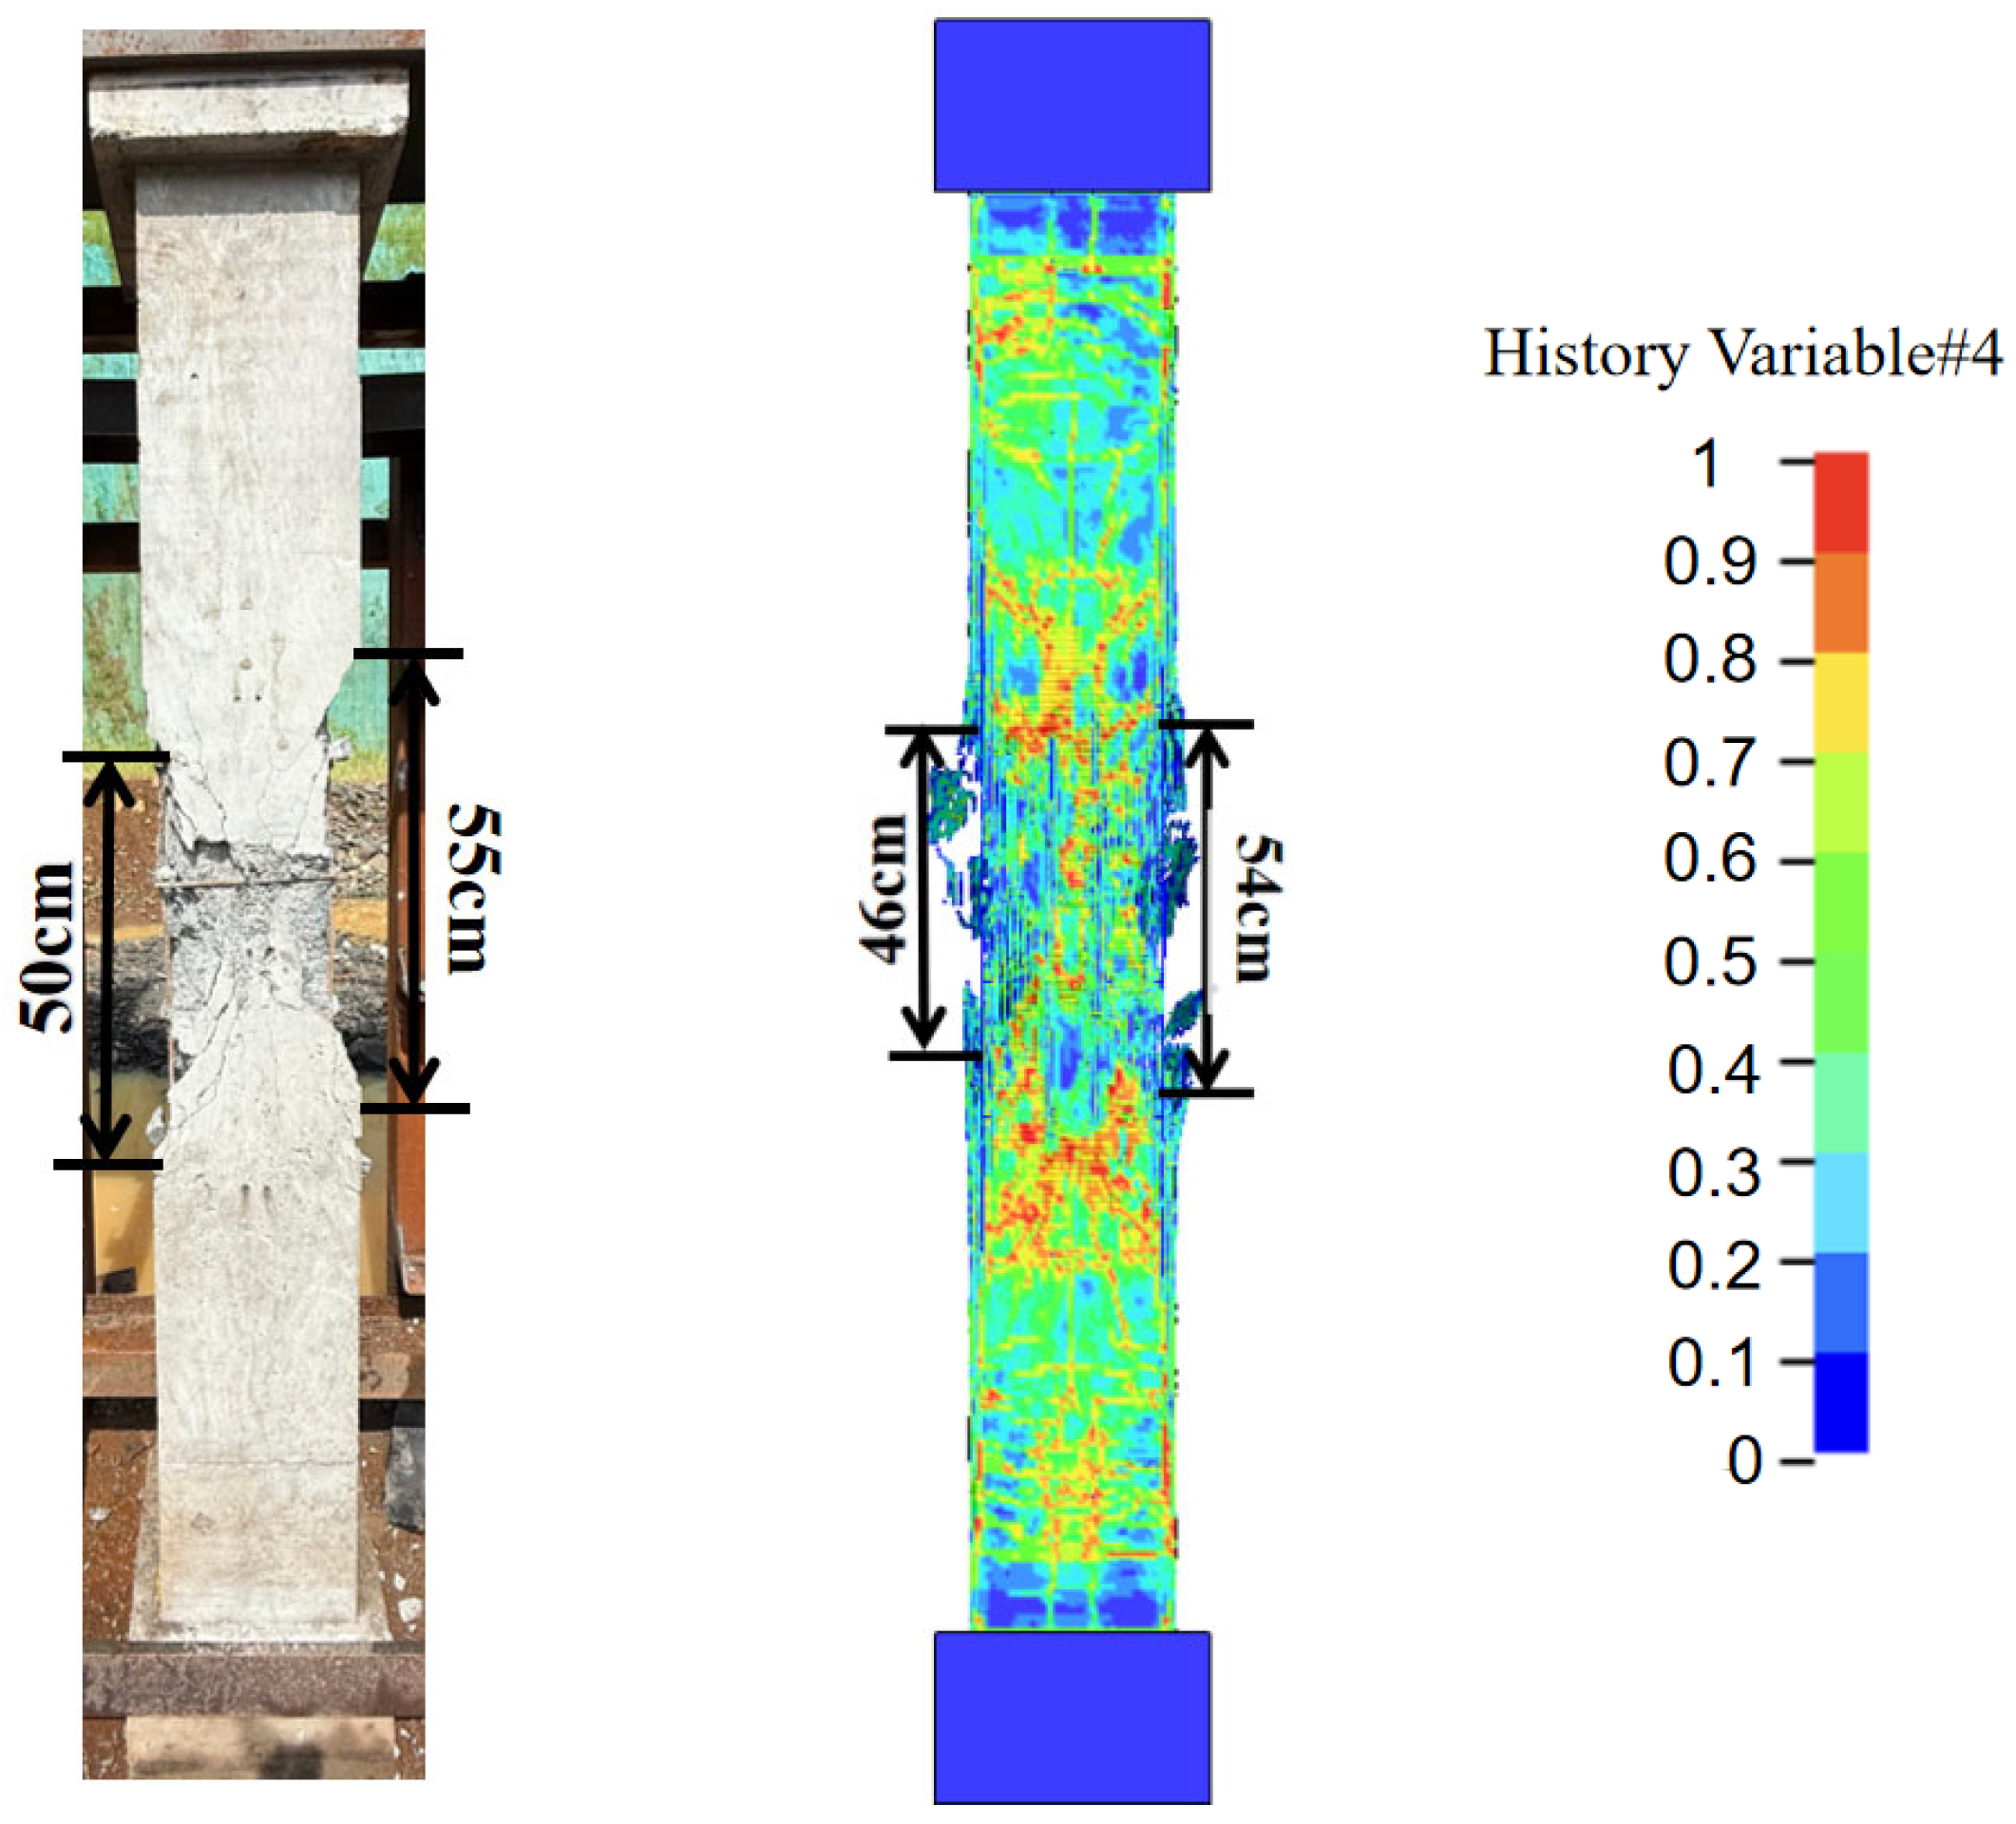
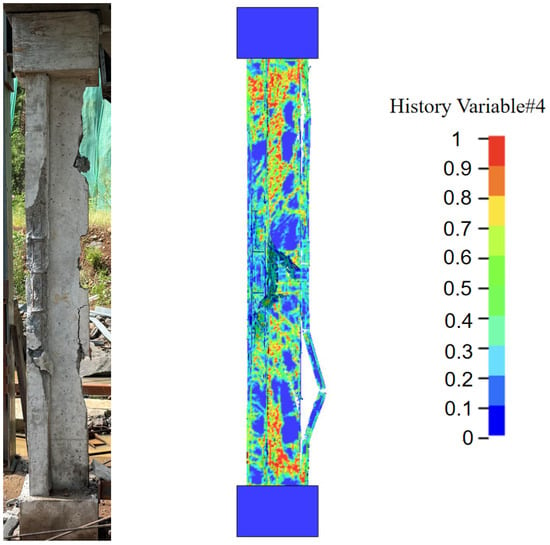
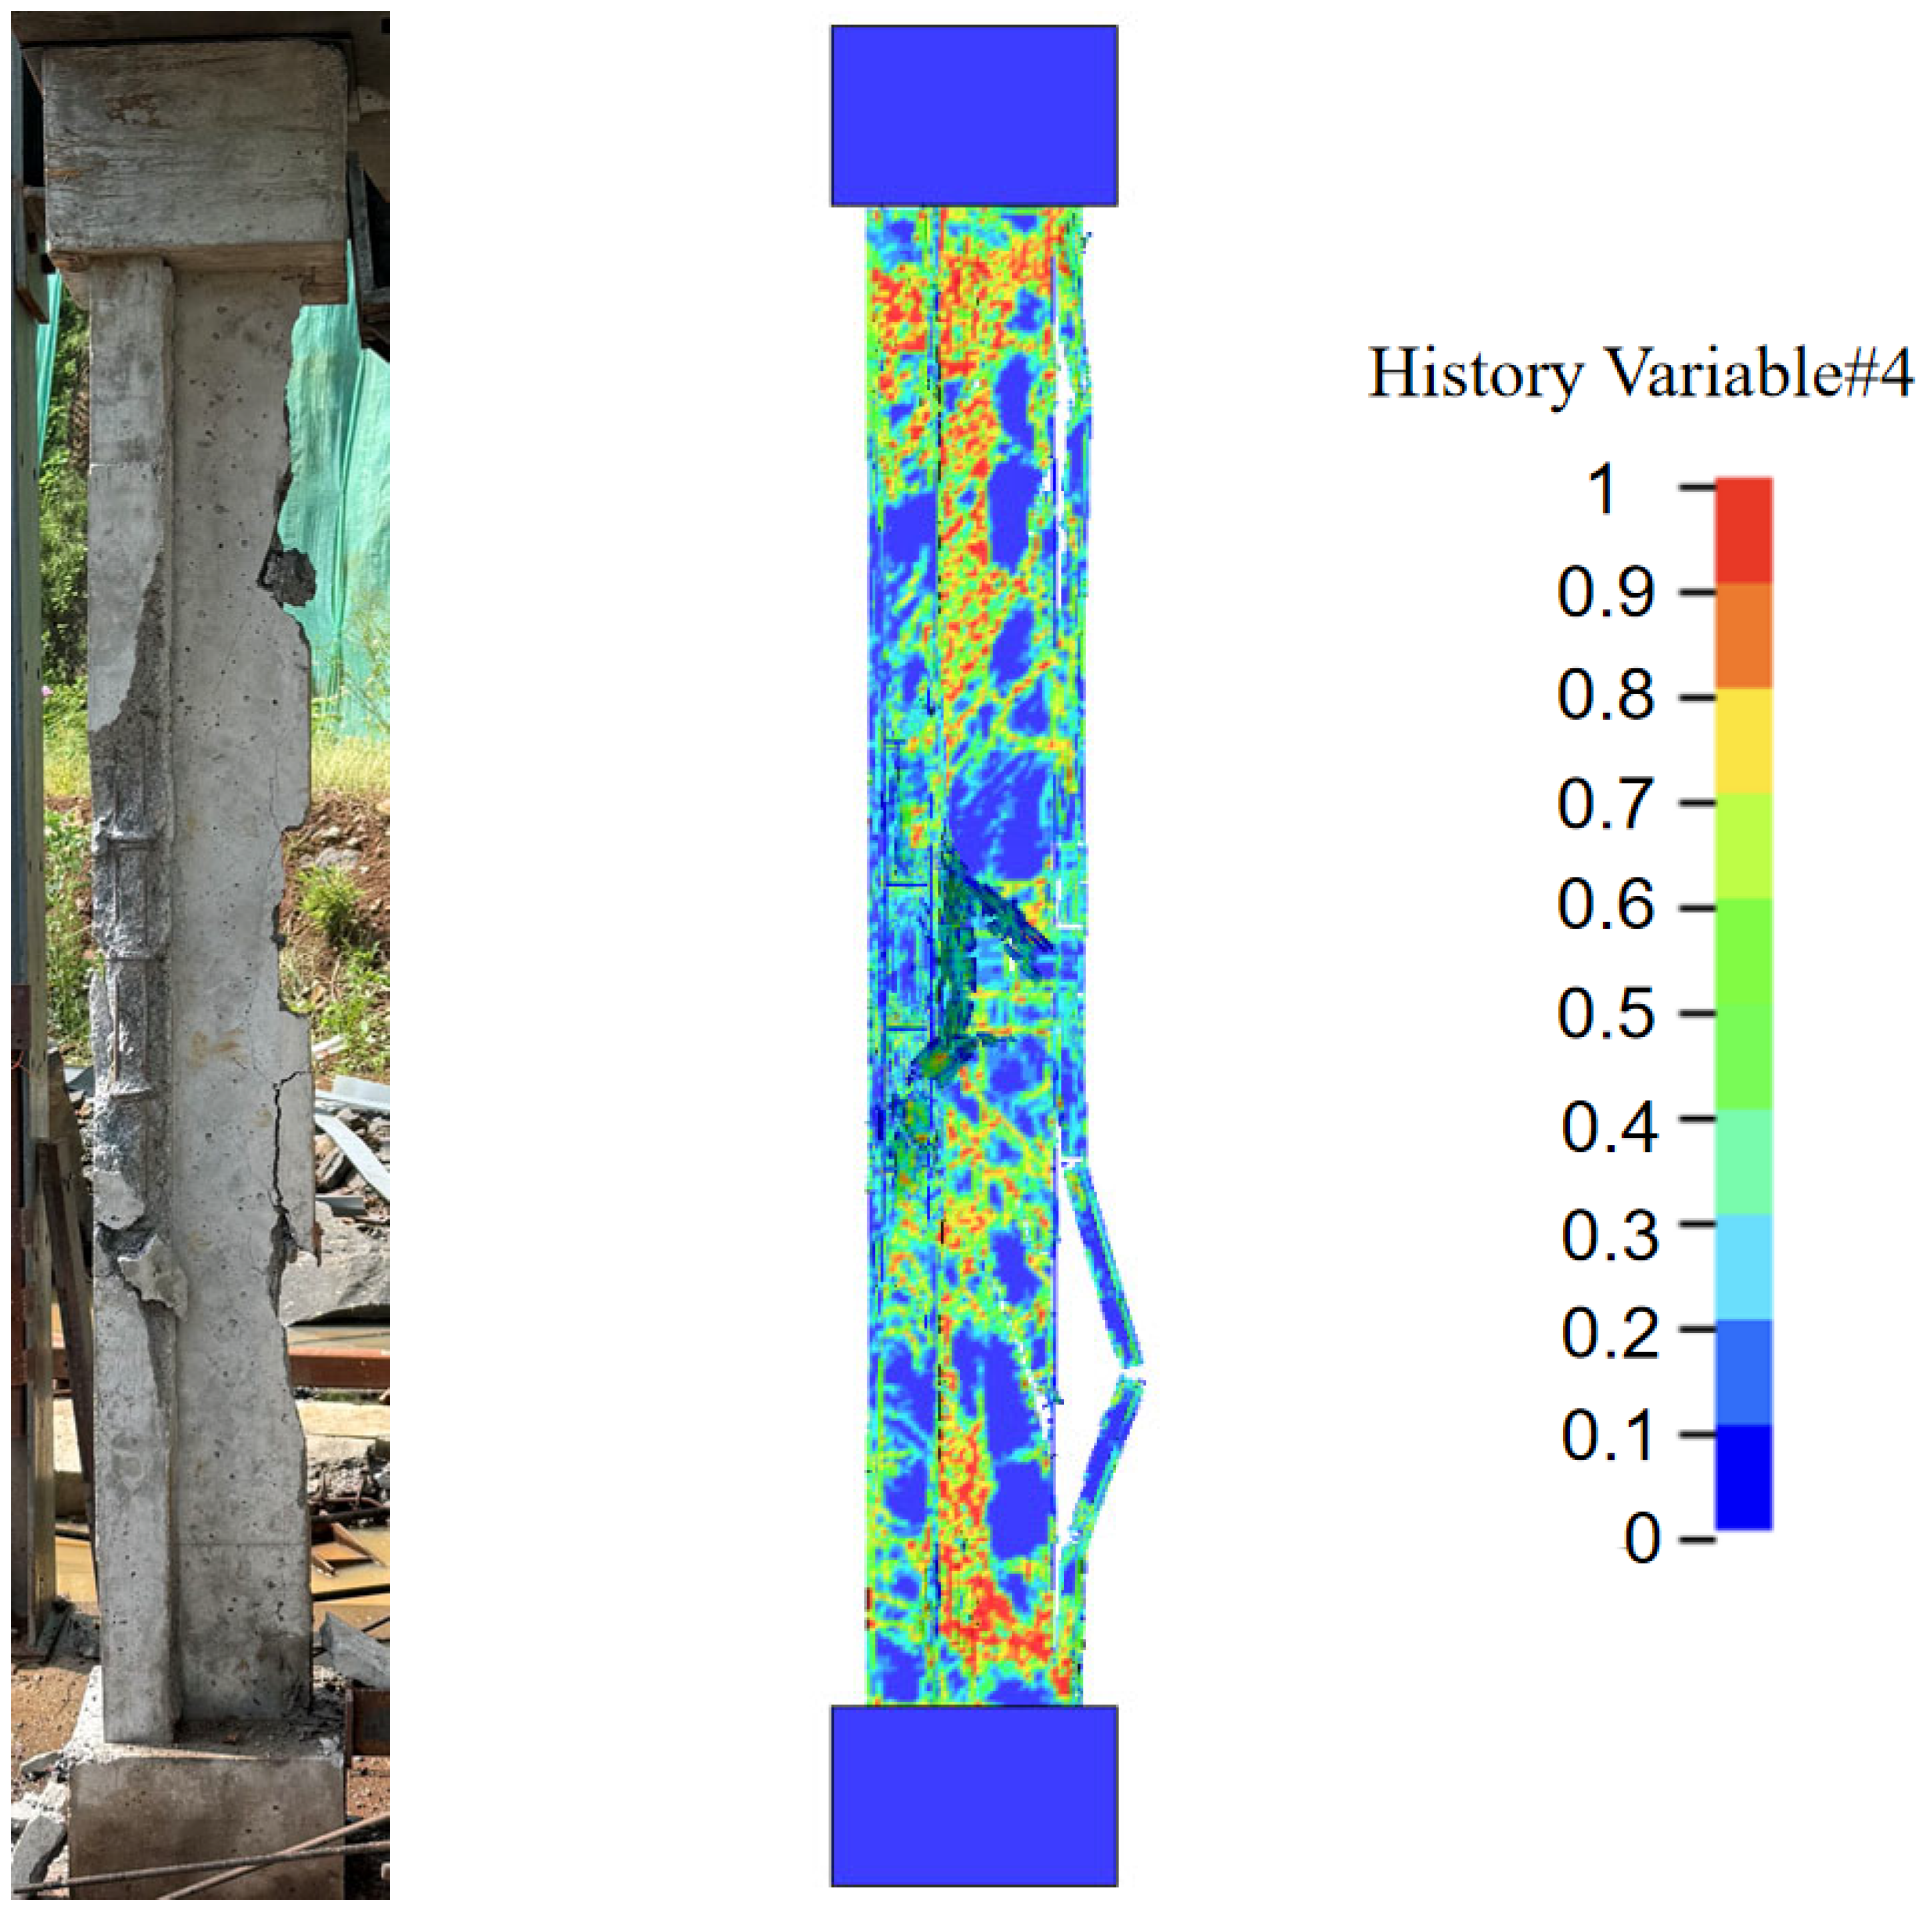
In this study, the macroscopic damage variable (D) was adopted as the primary criterion to evaluate the localized failure of the concrete. In the RHT constitutive model, this damage parameter is represented by history variable #4. Figure 15 and Figure 16 present a comparison of the damage and displacements for experimental Case A1. The numerical results indicate that the damage on the blast-facing surface of the test column was negligible. The simulated maximum mid-span displacement was 4.71 mm, yielding a relative error of 4.3% compared to the experimental value of 4.92 mm. Figure 17 and Figure 18 illustrate the damage comparison for Case A2. The simulation results demonstrate the formation of a blast crater and intersecting cracks at the center of the blast-facing surface, accompanied by partial concrete spalling on both sides. Additionally, numerous cracks developed in the web region, and extensive concrete spalling occurred on the rear surface. These findings indicate that the numerical calculation model can accurately capture the damage characteristics of the T-shaped columns.
Figure 15.
Comparison of damage on the blast-facing surface for Case A1.
Figure 16.
Comparison of mid-span displacement for Case A1.
Figure 17.
Comparison of damage on the blast-facing surface for Case A2.
Figure 18.
Comparison of side surface damage for Case A2.
3.4. Damage Evolution Characteristics
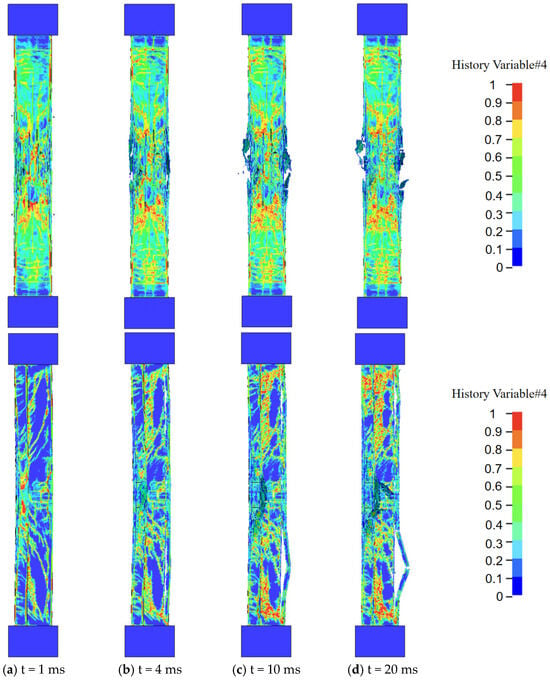
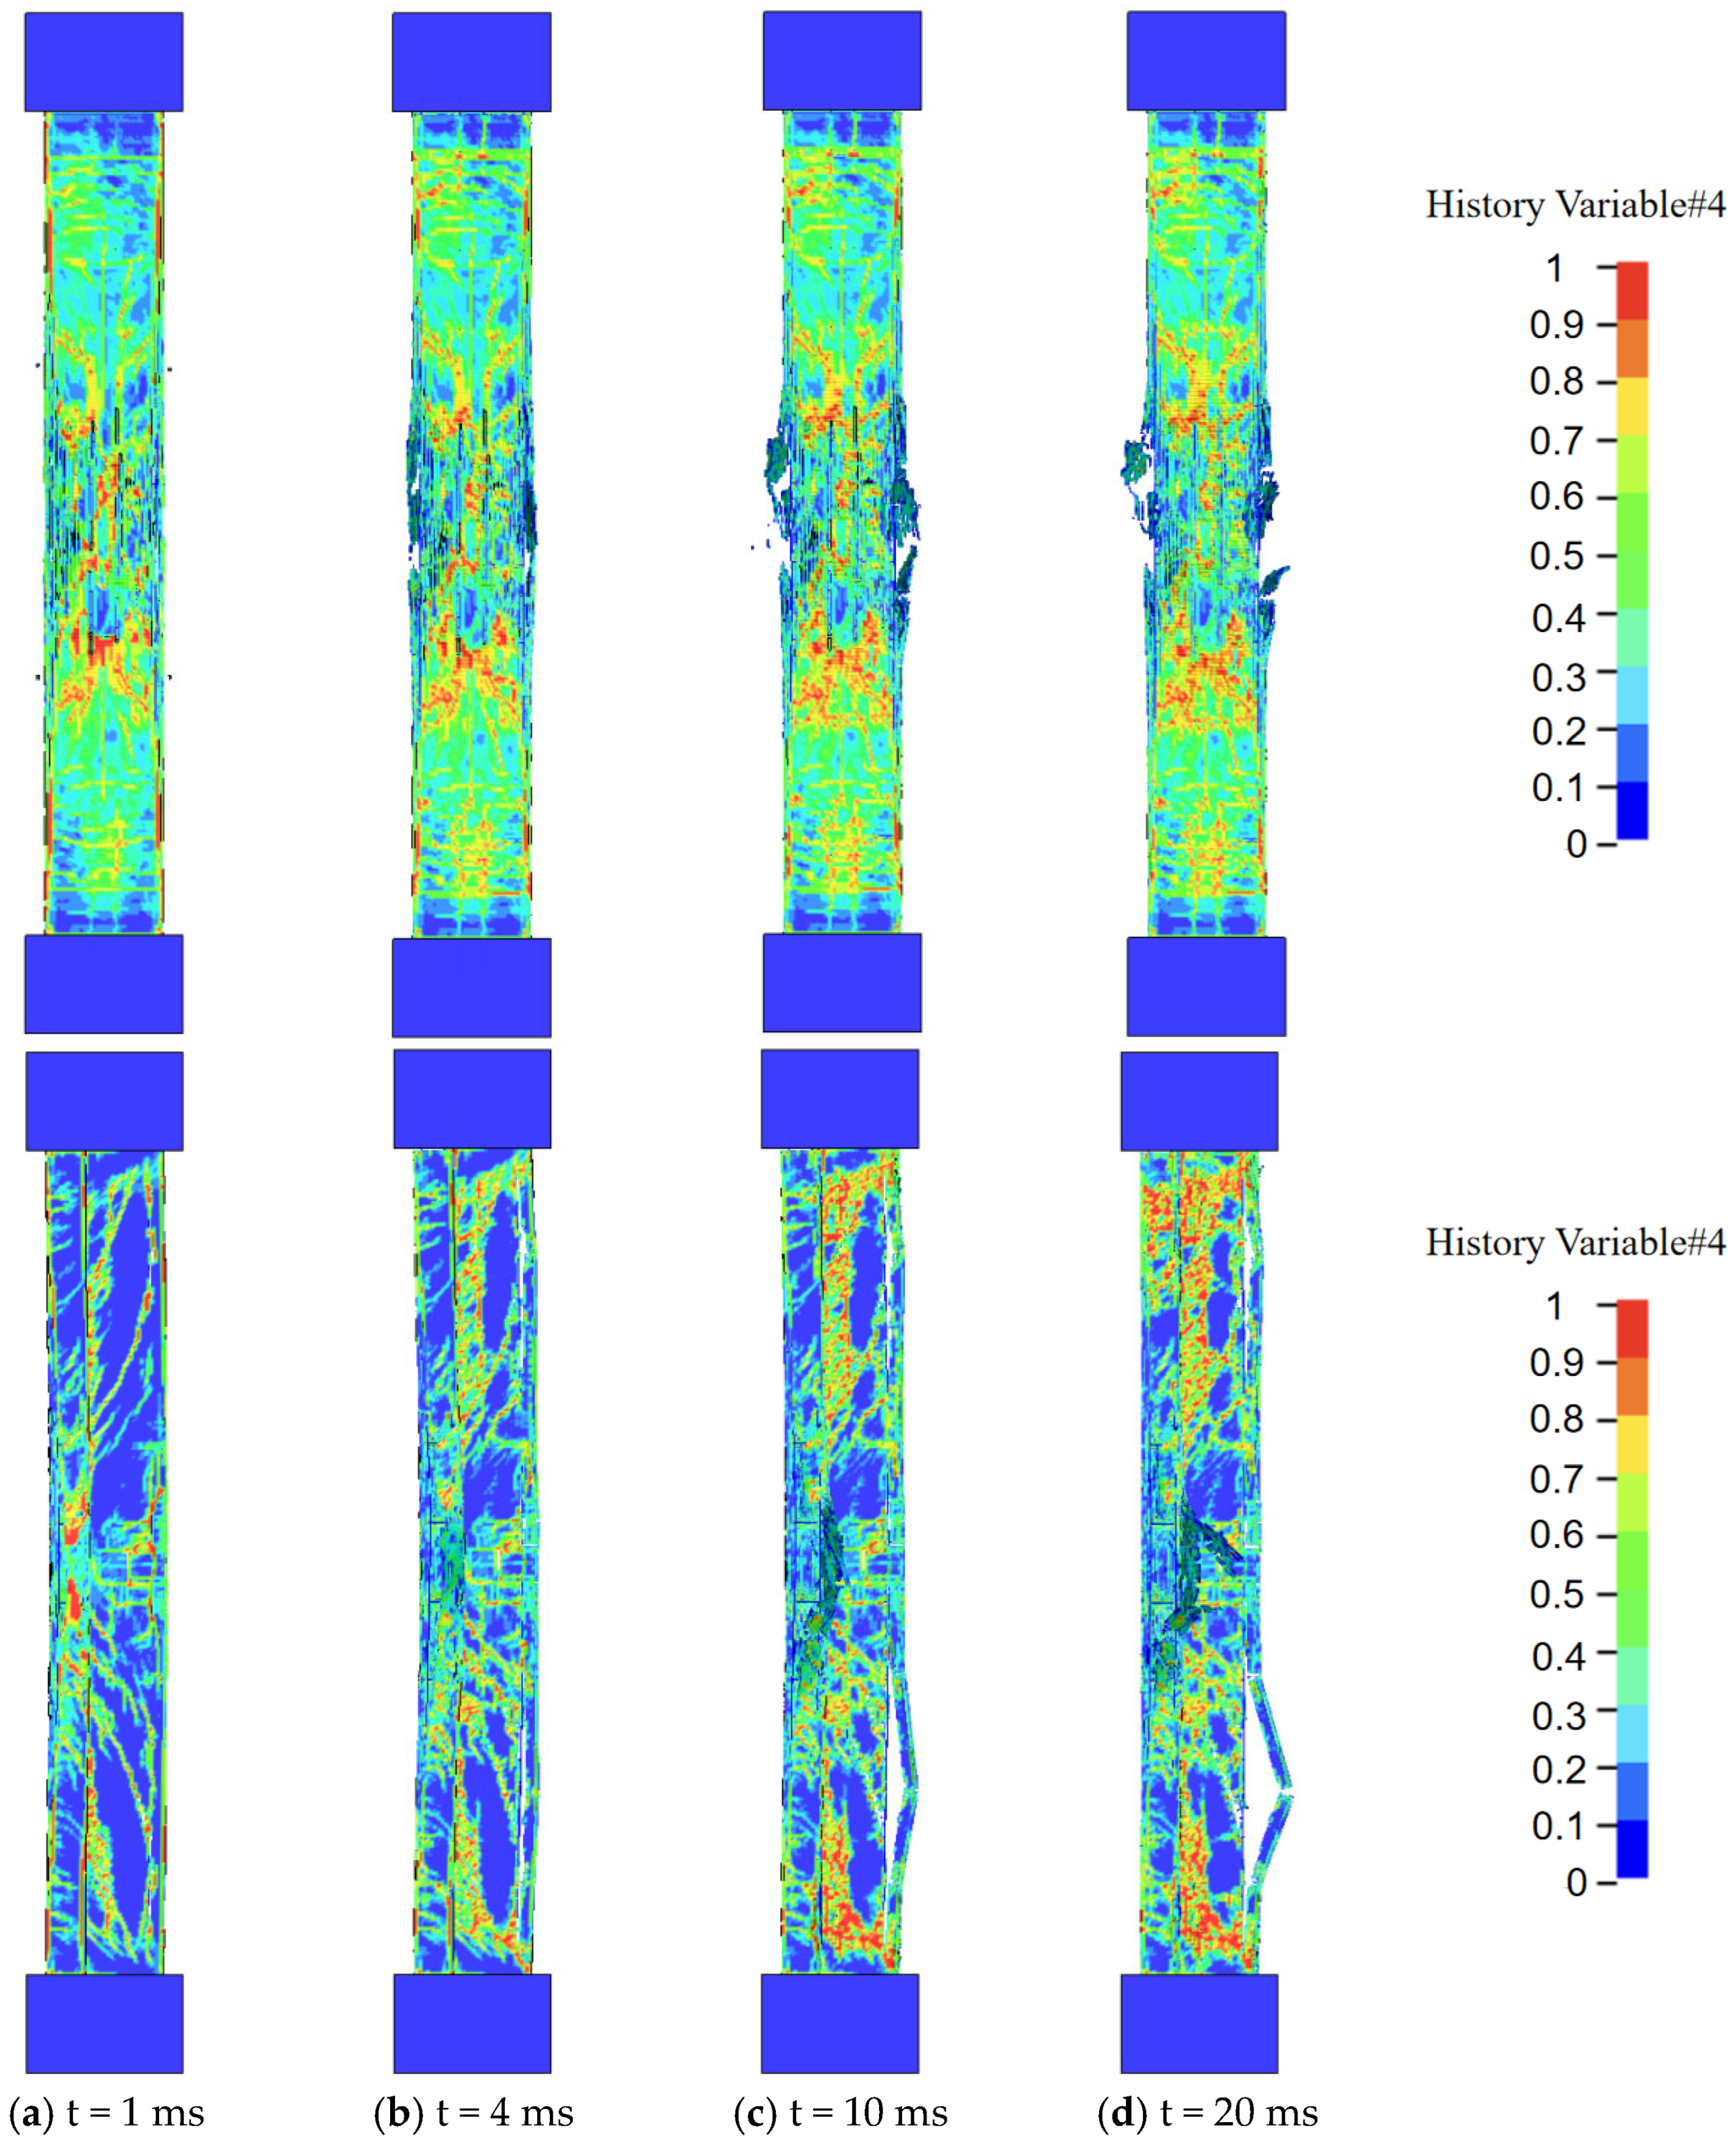
The damage and failure process of the RC T-shaped column under blast loading is illustrated in Figure 19. Based on the history variable contours and deformation modes extracted from the numerical simulations, the damage evolution of the column subjected to blast shock waves and inertial effects can be divided into four typical stages:
Figure 19.
Damage evolution process of the T-shaped column.
At t = 1 ms: The macroscopic displacement of the component is minimal. Only discrete micro-damage appears at the mid-span and ends of the blast-facing surface, while the overall stiffness and internal reinforcement cage remain intact.
At t = 4 ms: As the overpressure continues and stress wave reflections superimpose, damage rapidly accumulates and propagates along the mid-span core region. Specifically, driven by the stress concentration induced by the abrupt geometric changes in the cross-section, a continuous high-damage zone rapidly forms at the flange–web intersection. Consequently, the local stiffness of the structure degrades as it enters the plastic energy dissipation stage.
At t = 10 ms: The intense blast impulse causes the mid-span concrete on the blast-facing surface to reach its ultimate strain, resulting in extensive element erosion and spalling. The longitudinal reinforcement on the rear tension side undergoes significant tensile yielding and elongation. The high-damage zone at the flange–web intersection gradually evolves into a through-thickness failure surface, severely compromising structural integrity.
At t = 20 ms: Due to the severe prior damage, the column undergoes significant overall flexural deformation. Extensive deep spalling at the mid-span drastically reduces the effective cross-sectional area. The longitudinal bars on the tension side experience severe plastic deformation and debond from the core concrete, leaving the component on the verge of global instability.
3.5. Failure Modes
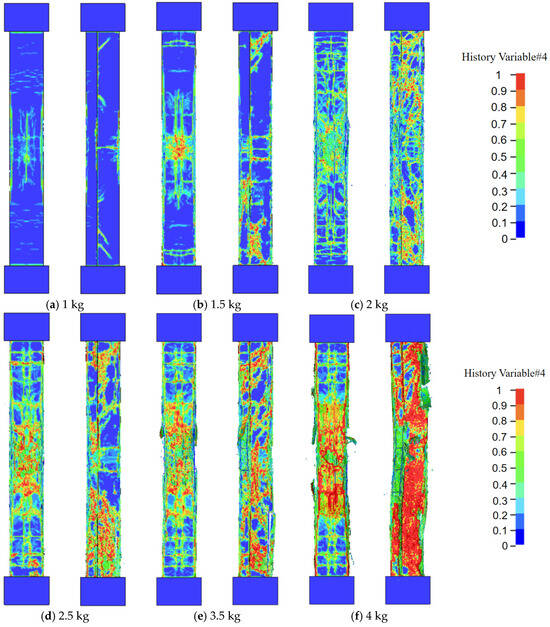
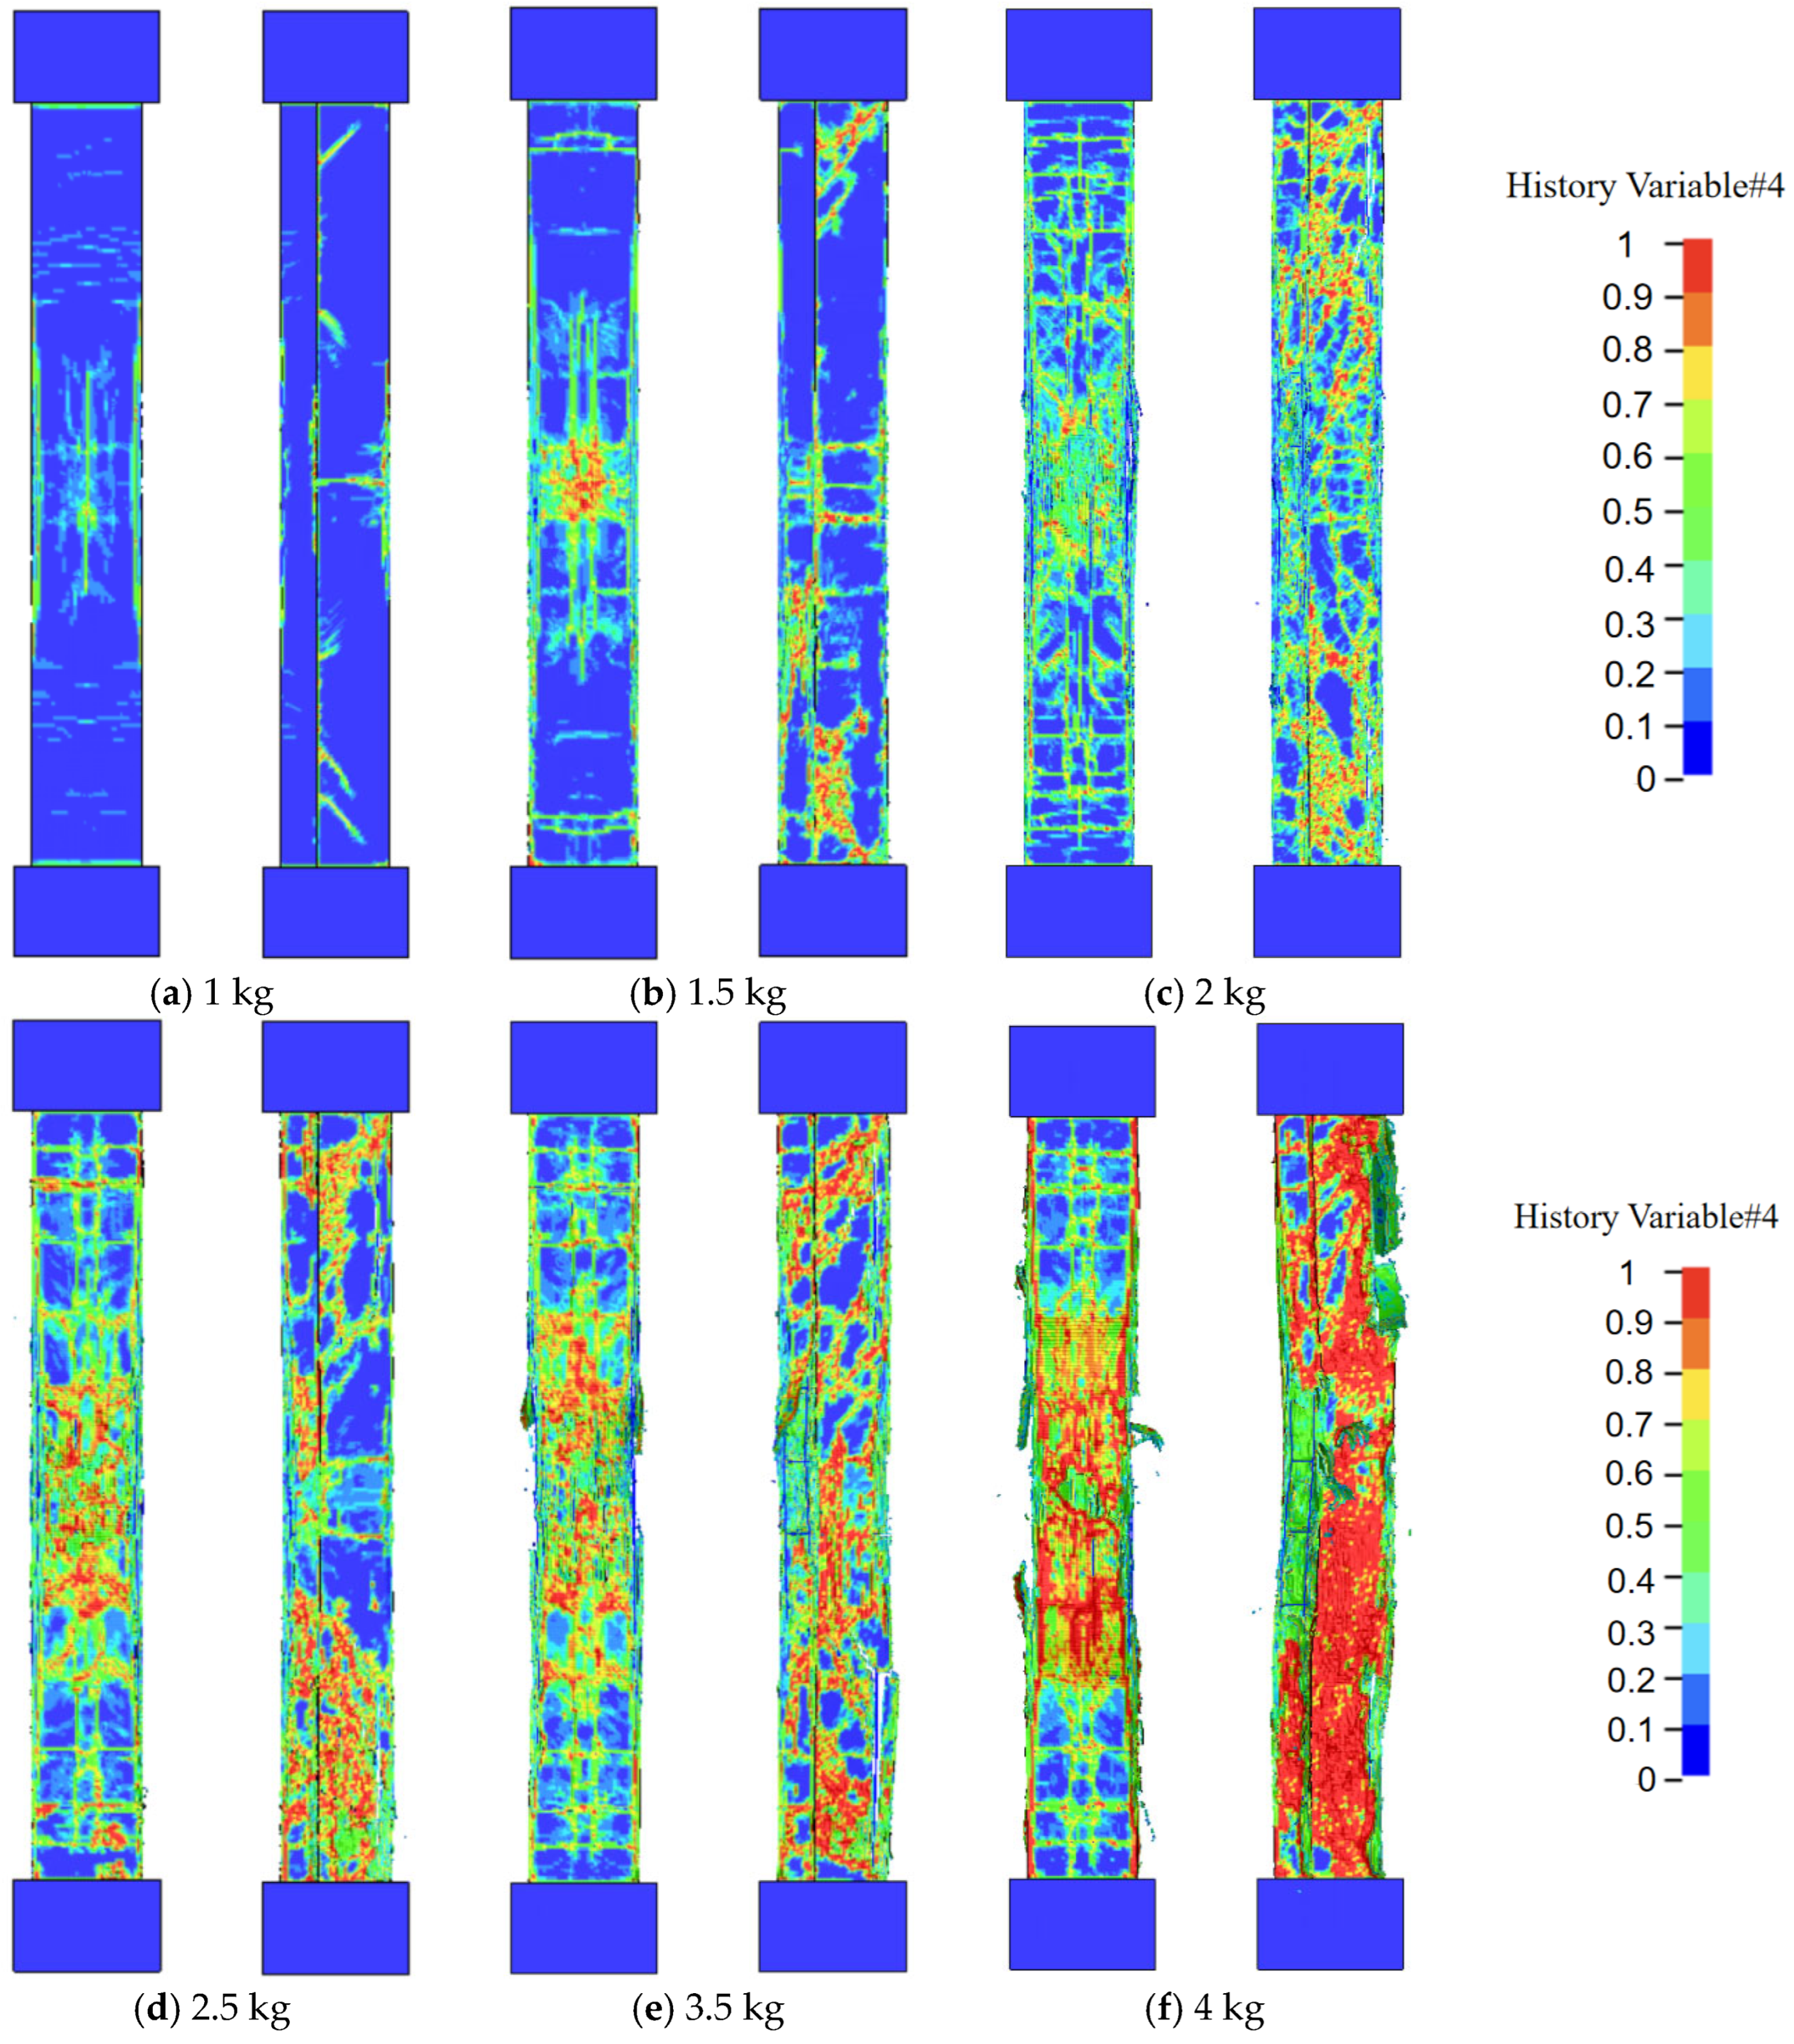
To investigate the failure modes of RC T-shaped columns, numerical simulations evaluated damage characteristics under explosive charge masses ranging from 1 to 4 kg. Based on the validated experimental conditions, the standoff distance was fixed at 400 mm with an applied axial compression ratio of n = 0.15. Specific parameters and statistical results are detailed in Table 9. Focusing on the typical cases illustrated in Figure 20, the results indicate that structural damage exacerbates significantly as the charge mass increases. The failure evolves progressively from localized surface micro-damage to deep erosion, ultimately causing global instability. Specifically, under a 1–1.5 kg charge mass, the structure exhibits a minor plastic response; damage is confined to the mid-span blast-facing surface and the flange–web intersection without macroscopic spalling. At 2–2.5 kg, high-damage zones rapidly interconnect and propagate. Concrete cover crushing and spalling expose the steel reinforcement, transitioning the failure mode toward deep spalling. When the charge mass reaches 3.5 kg and above, immense blast energy causes extensive, deep concrete crushing in the mid-span core, severely compromising the cross-section. Under the 4 kg condition in particular, the intense blast impulse inflicts extreme localized damage and induces significant global failure characterized by severe coupled bending-shear deformation.
Table 9.
Numerical simulation results.
Figure 20.
Damage images under different explosive charge masses.
Accurately assessing the damage extent of reinforced concrete (RC) T-shaped columns under close-in blast loading is critical for blast-resistant design. This study adopts the support rotation angle as the macroscopic damage evaluation threshold. This angle intuitively and dimensionlessly represents the global flexural deformation and plastic energy dissipation of the member, effectively eliminating size effects caused by varying calculation spans. Although close-in blasts often induce complex local damage and asymmetric coupled bending-shear failure, the macroscopic dynamic response limit remains the core factor determining whether a column loses its residual load-bearing capacity and triggers structural collapse. In this study, the maximum support rotation is calculated using the following equation:
where is the peak displacement of the structure at the blast center, and is the distance from the point of peak displacement to the nearest support.
The criterion adopted here originates from the damage classification system proposed by Zhou et al. [18] for steel-reinforced concrete T-shaped columns. Validated through cyclic loading tests, this criterion accurately reflects the damage evolution associated with cross-sectional asymmetry and the differential load-bearing behaviors between the strong and weak axes. Despite the high-frequency nature of blast impacts, the global failure of slender T-shaped columns under close-in explosions remains flexure-dominated; the plastic hinge distributions and damage evolution closely resemble those observed under seismic loads. Consequently, adopting established support rotation damage criteria from earthquake engineering provides a practical approximation for rapid post-blast safety evaluations. The core classification is detailed in Table 10. The schematic diagrams of various damage levels are shown in Figure 21.
Table 10.
Dynamic response classification.
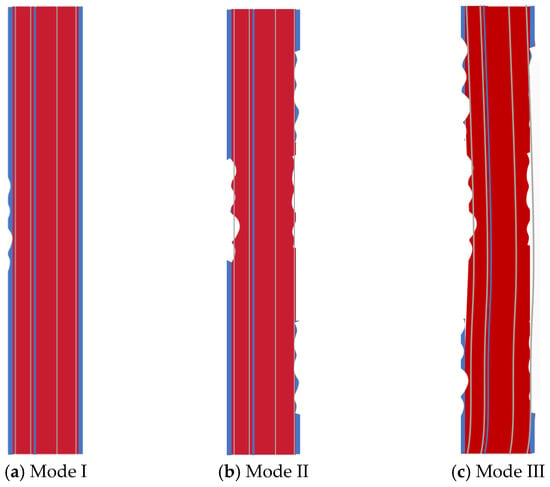
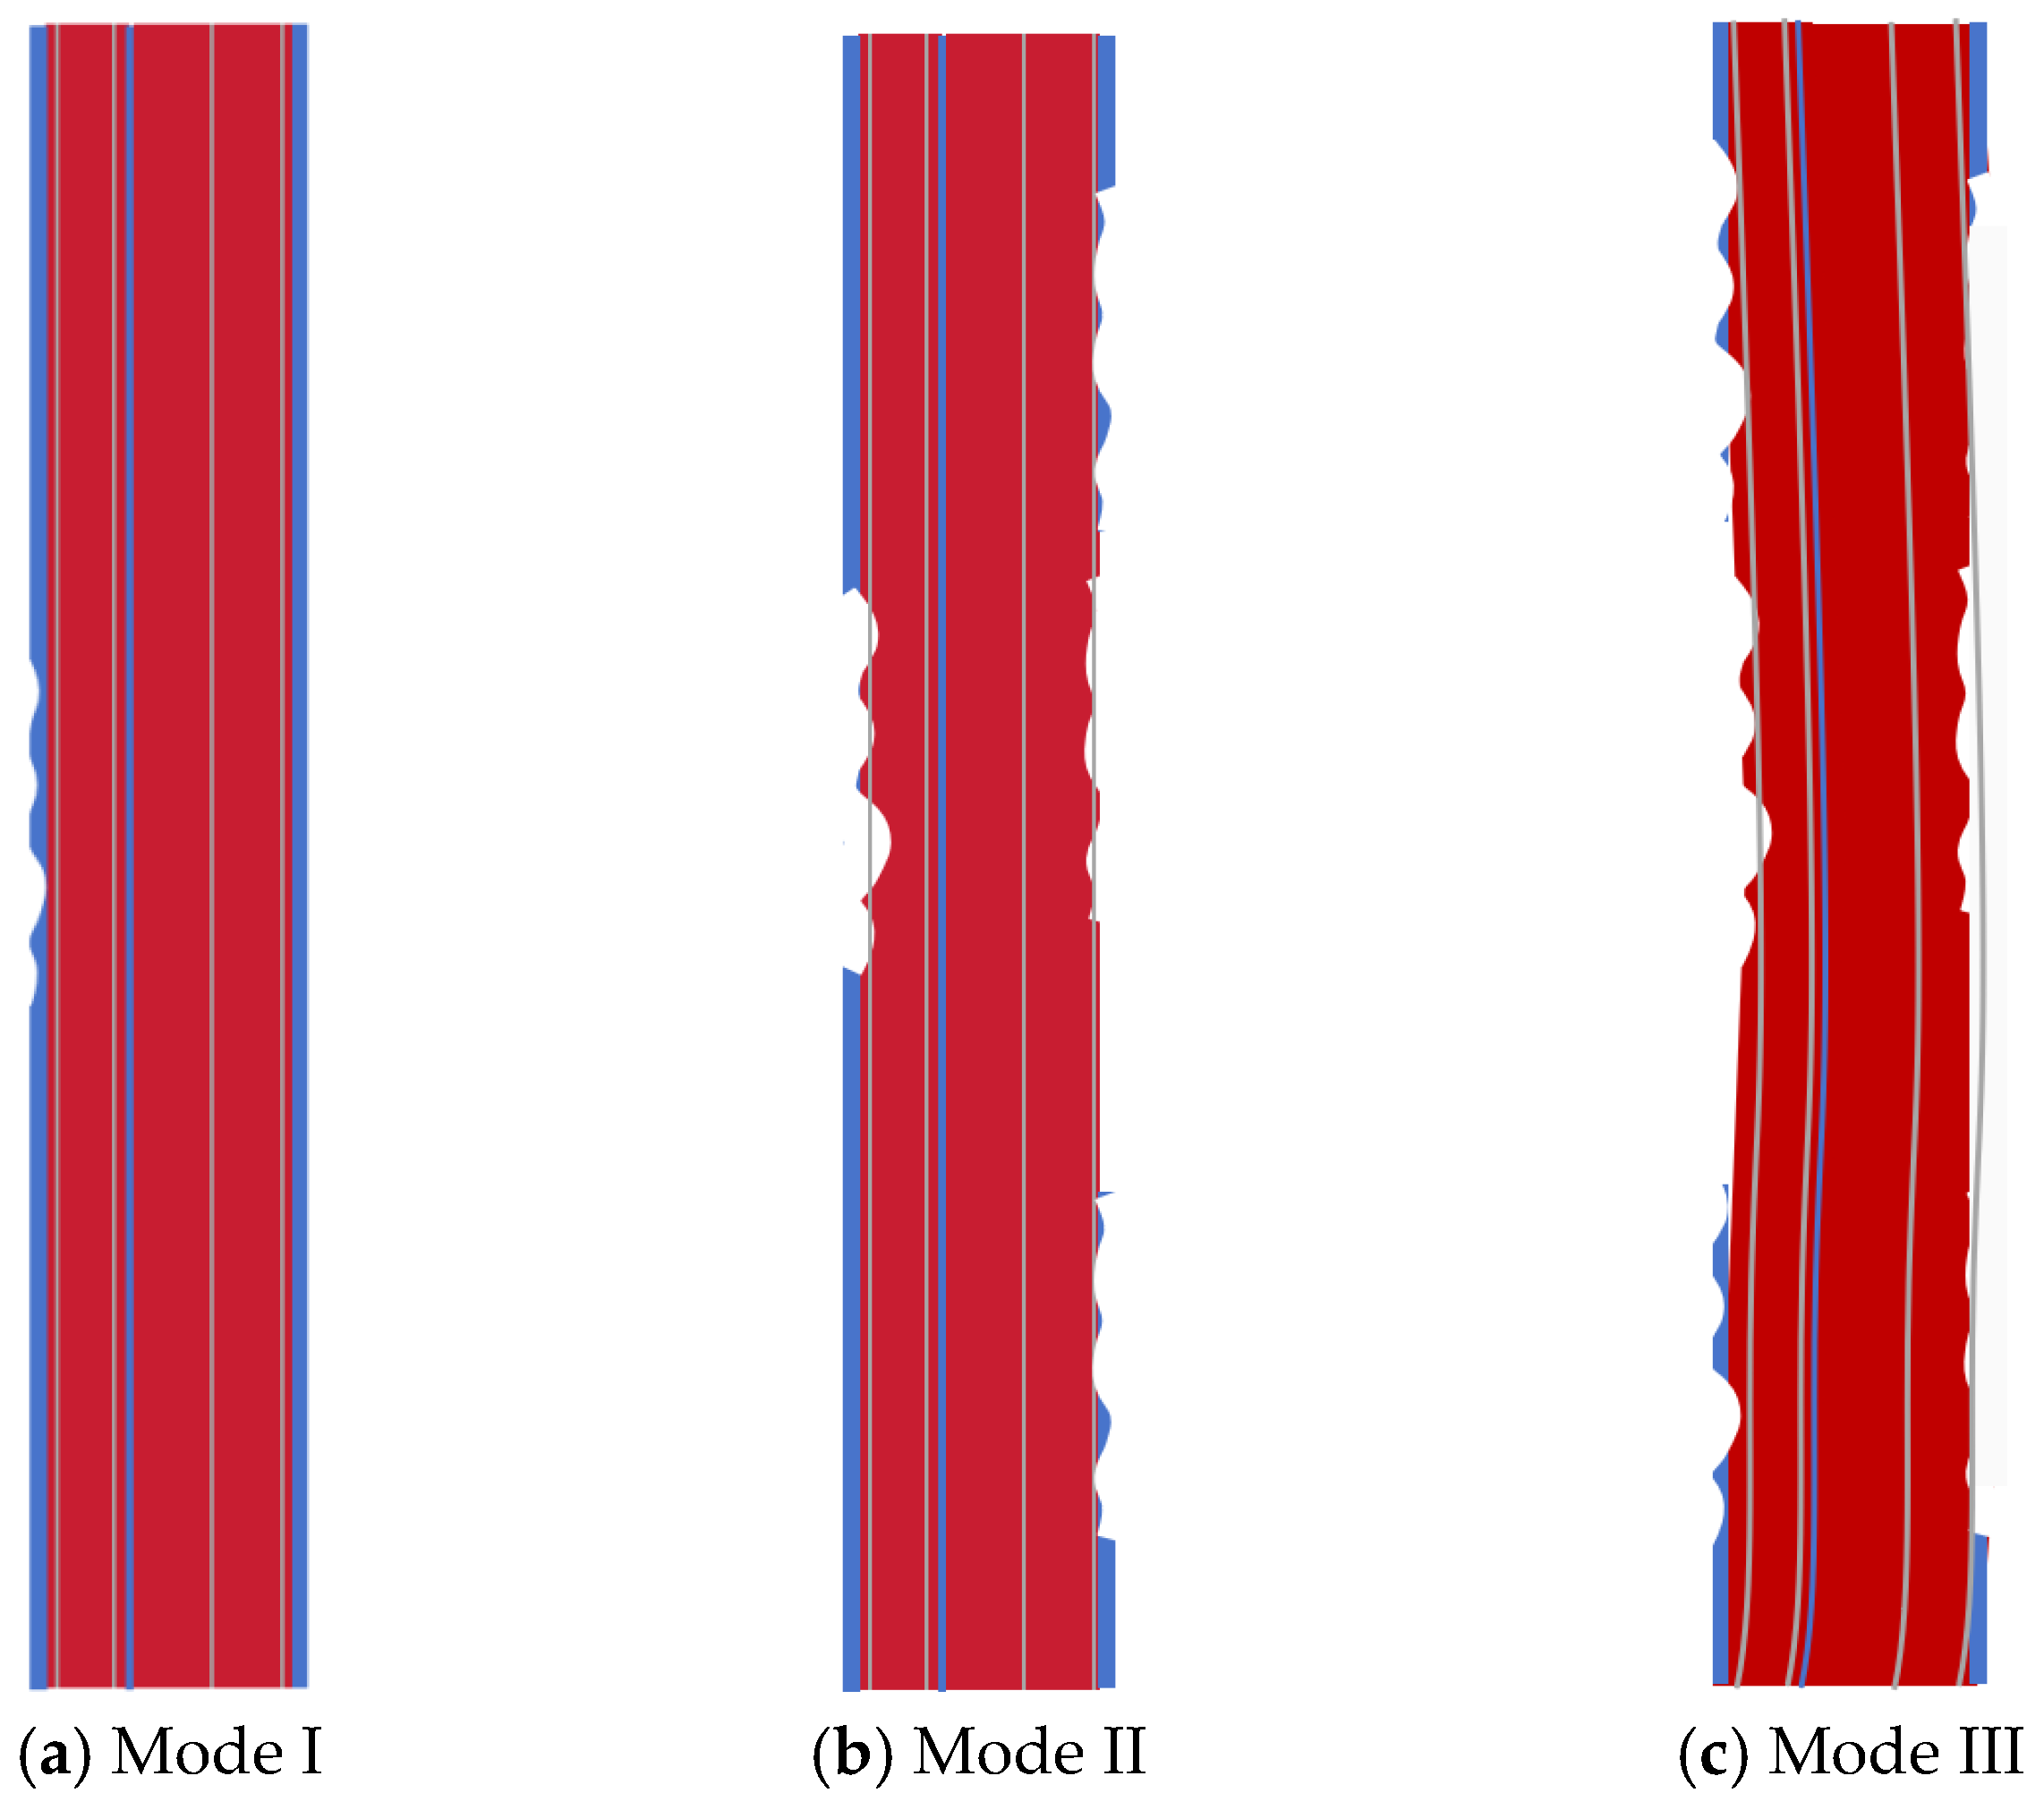
Figure 21.
Schematic diagram of damage levels.
Mode I: A minor amount of concrete cover spalls off; the longitudinal bars and stirrups exhibit neither exposure nor deformation. The overall continuity of the component remains well-preserved without localized collapse, and the support rotation is less than 0.716°.
Mode II: Localized concrete spalls off in patches; the concrete cover partially detaches, resulting in the slight exposure of a few longitudinal bars or stirrups. This degrades the local stiffness of the component, with the support rotation ranging between 0.716° and 1.273°.
Mode III: Extensive concrete collapse occurs; the longitudinal bars are significantly exposed, deformed, or even fractured, and the stirrups are severely debonded or ruptured. The component loses its overall structural integrity, and the support rotation exceeds 1.273°.
3.6. Dynamic Response Parameter Analysis
Based on the previously validated finite element model, this section conducts a parametric analysis to systematically investigate the effects of four parameters—cross-sectional depth, blast location, axial compression ratio, and explosive charge mass—on the dynamic response of reinforced concrete (RC) T-shaped columns under near-field blast loading. Adopting the control variable method, the displacement–time-history response of the components serves as the primary evaluation metric. Baseline parameters for all test cases were uniformly set as follows: cross-sectional dimensions of 300 mm × 300 mm, clear column span of 2100 mm, concrete compressive strength of 40 MPa, longitudinal reinforcement ratio of 1.2%, axial compression ratio of 0.15, standoff distance of 400 mm, and explosive charge mass of 3 kg. For brevity, “cross-sectional depth” will subsequently represent the overall cross-sectional dimensions of the components. The specific numerical simulation cases are detailed in Table 11.
Table 11.
Numerical simulation test cases.
(1) Effect of Explosive Charge Mass
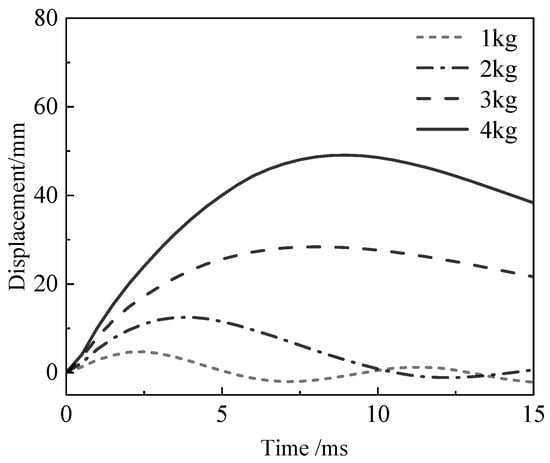
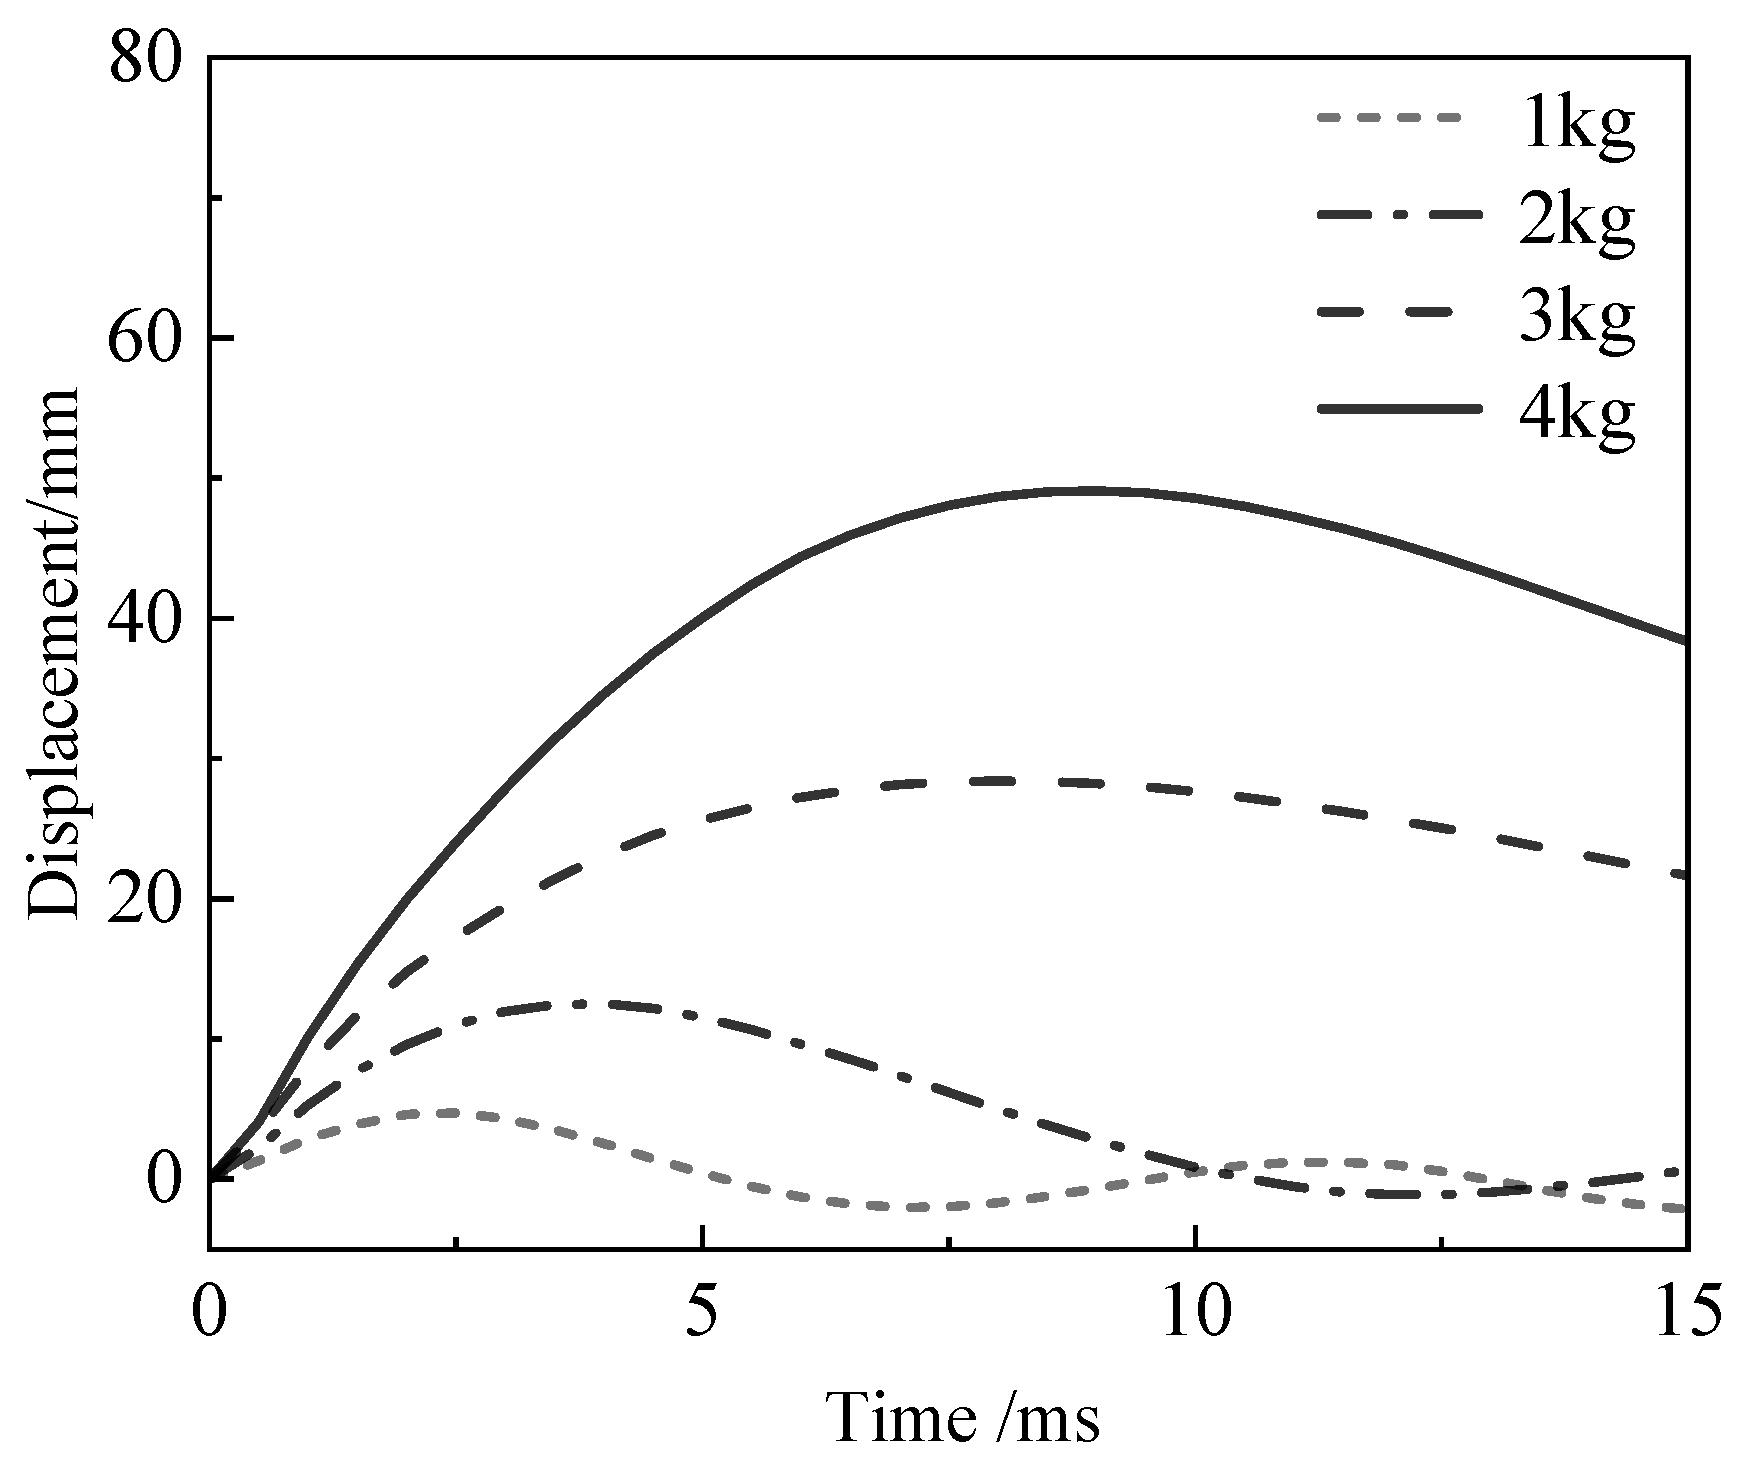
The explosive charge mass directly determines the total energy and load intensity exerted on the structure, as illustrated in Figure 22. As the explosive charge mass increases from 1 kg to 4 kg, the peak mid-span displacement exhibits a sharp nonlinear increase. With a 1 kg charge mass, the structural response is minor, yielding a peak displacement of only about 5 mm; however, when the charge mass increases to 4 kg, the peak value surges to approximately 49 mm. Concurrently, as the charge mass increases, both the duration and amplitude of the displacement response increase significantly, exacerbating the macroscopic structural damage. This indicates that blast load intensity is the decisive factor governing T-shaped column damage. An excessively large charge mass causes the dynamic response of the structure to far exceed its load-bearing limit, substantially compromising its blast-resistant safety.
Figure 22.
Displacement–time-history curves under different explosive charge masses.
(2) Effect of Axial Compression Ratio
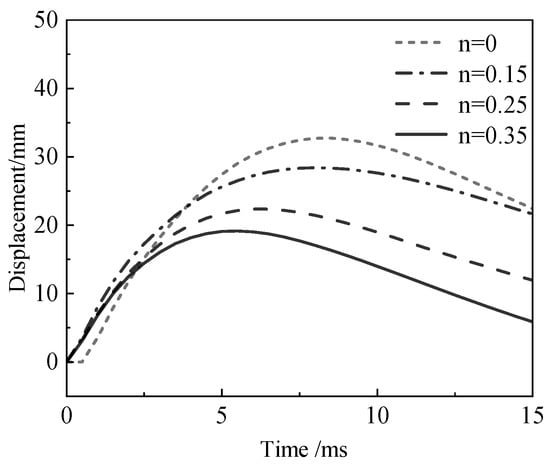
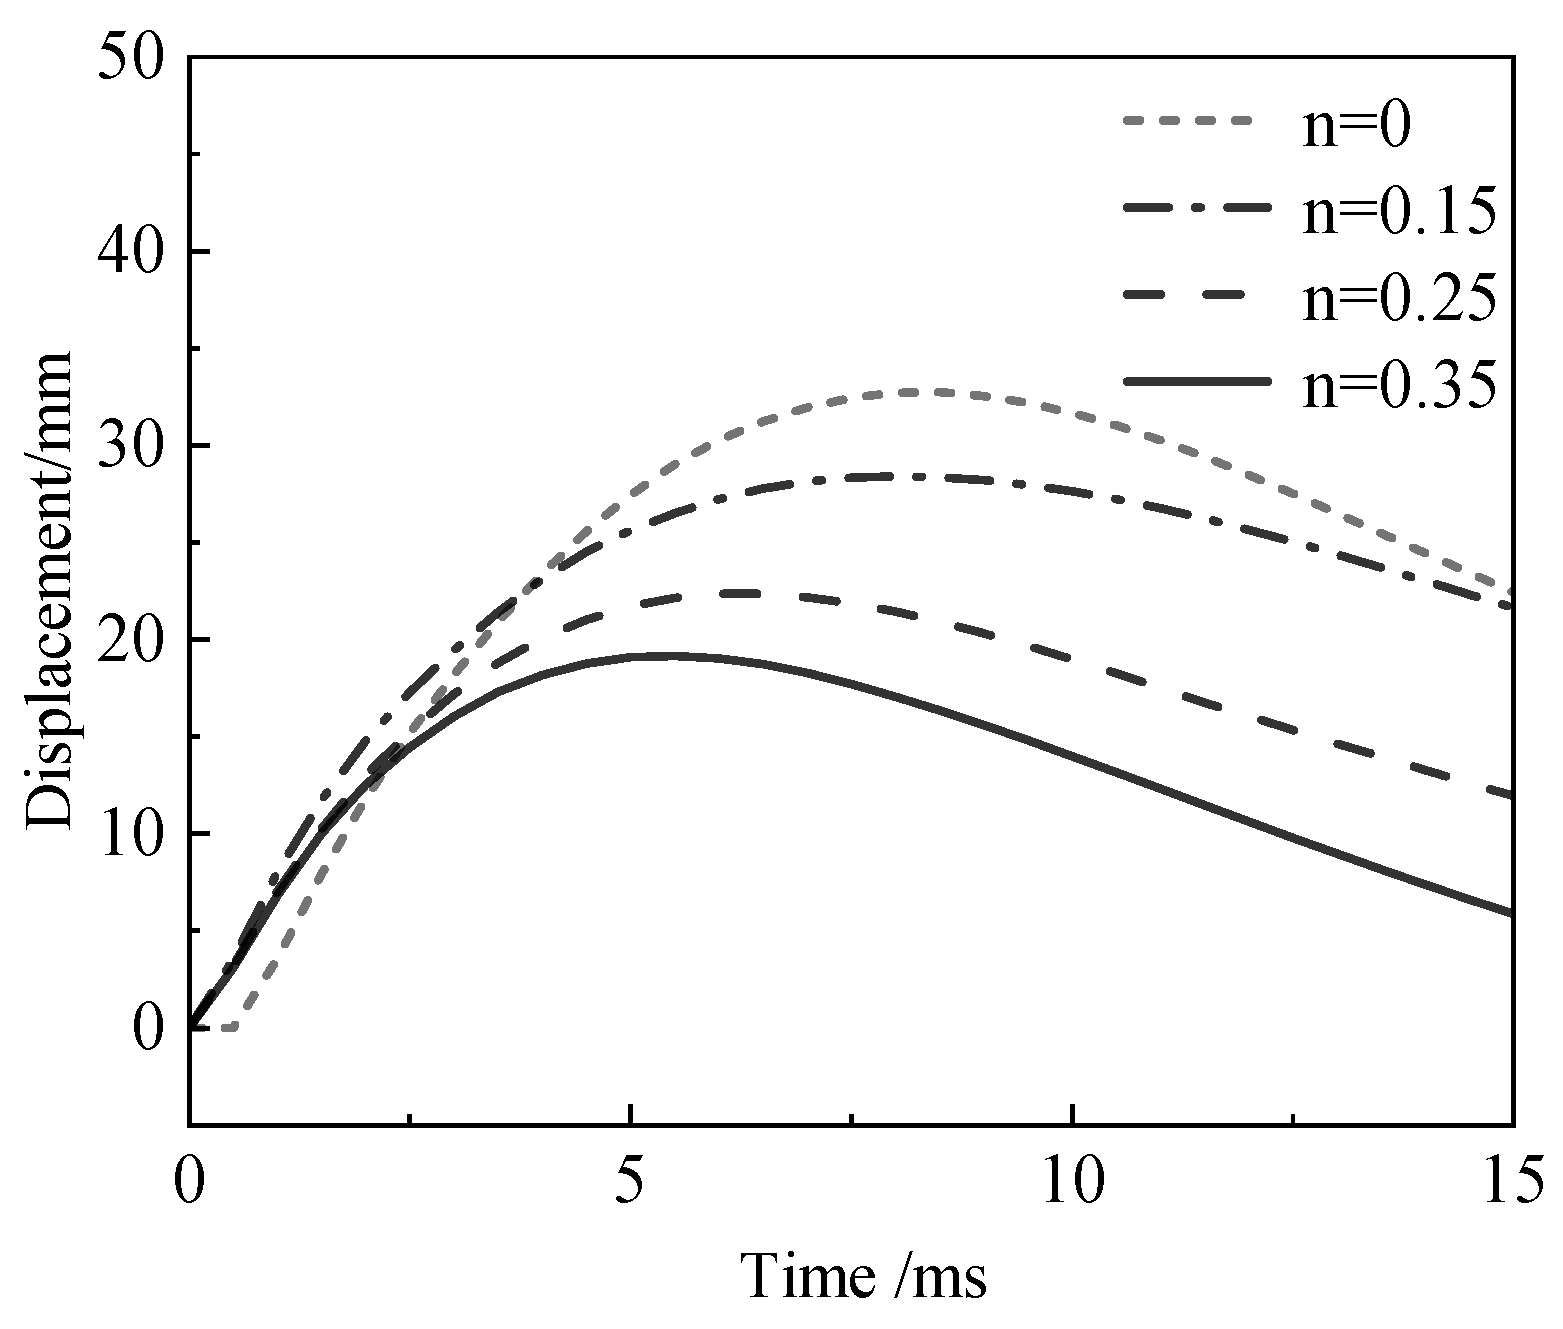
To evaluate the regulatory mechanism of axial constraints, the mid-span displacement responses under axial compression ratios (n) of 0, 0.15, 0.25, and 0.35 were analyzed, as illustrated in Figure 23. The results demonstrate that the axial compression ratio significantly suppresses the dynamic response of the T-shaped columns. As n increases from 0 to 0.35, the peak mid-span displacement continuously decreases: in the absence of an axial load, the peak displacement is approximately 33 mm; at n = 0.15, 0.25, and 0.35, the peak values drop to approximately 28 mm, 22 mm, and 19 mm, respectively.
Figure 23.
Displacement–time-history curves under different axial compression ratios.
In-depth analysis indicates that the influence of the axial compression ratio on blast resistance involves a fundamental trade-off between global response and local damage. Initially, as the axial compression ratio increases, the pre-compression stress of the column cross-section gradually rises. This effectively enhances the initial flexural stiffness and delays tension-zone cracking under blast impact, thereby continuously suppressing maximum mid-span displacement. However, this continuous reduction in global displacement does not equate to improved overall blast resistance. Conversely, when the axial compression ratio exceeds the proposed threshold of 0.25 (e.g., reaching 0.35), the initial static compressive stress consumes a substantial proportion of the concrete’s ultimate compressive strength, leaving insufficient capacity to resist additional dynamic bending-compressive stresses. Furthermore, a high axial compression ratio significantly reduces cross-sectional deformation ductility. Consequently, despite the minimized lateral displacement, the concrete at the compression edge is highly susceptible to reaching its ultimate strain and undergoing severe brittle crushing, which exacerbates local damage (as evidenced by the damaged area increasing from 425 cm2 at n = 0.25 to 861 cm2 at n = 0.35) and reinforcement buckling. Therefore, controlling the axial compression ratio within a reasonable range, with 0.25 justified as the critical upper threshold, represents the optimal balance to effectively suppress global lateral displacement while avoiding severe local brittle failure.
(3) Effect of Cross-Sectional Depth
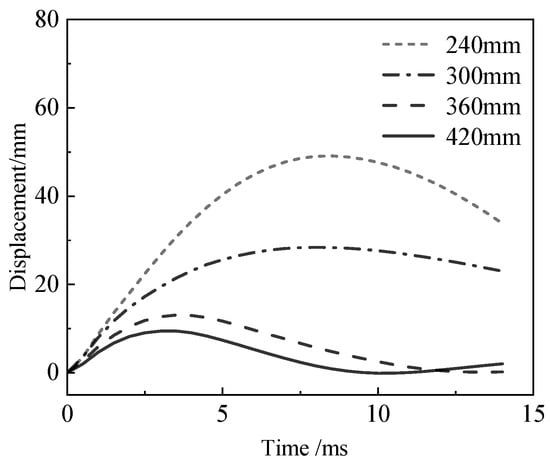
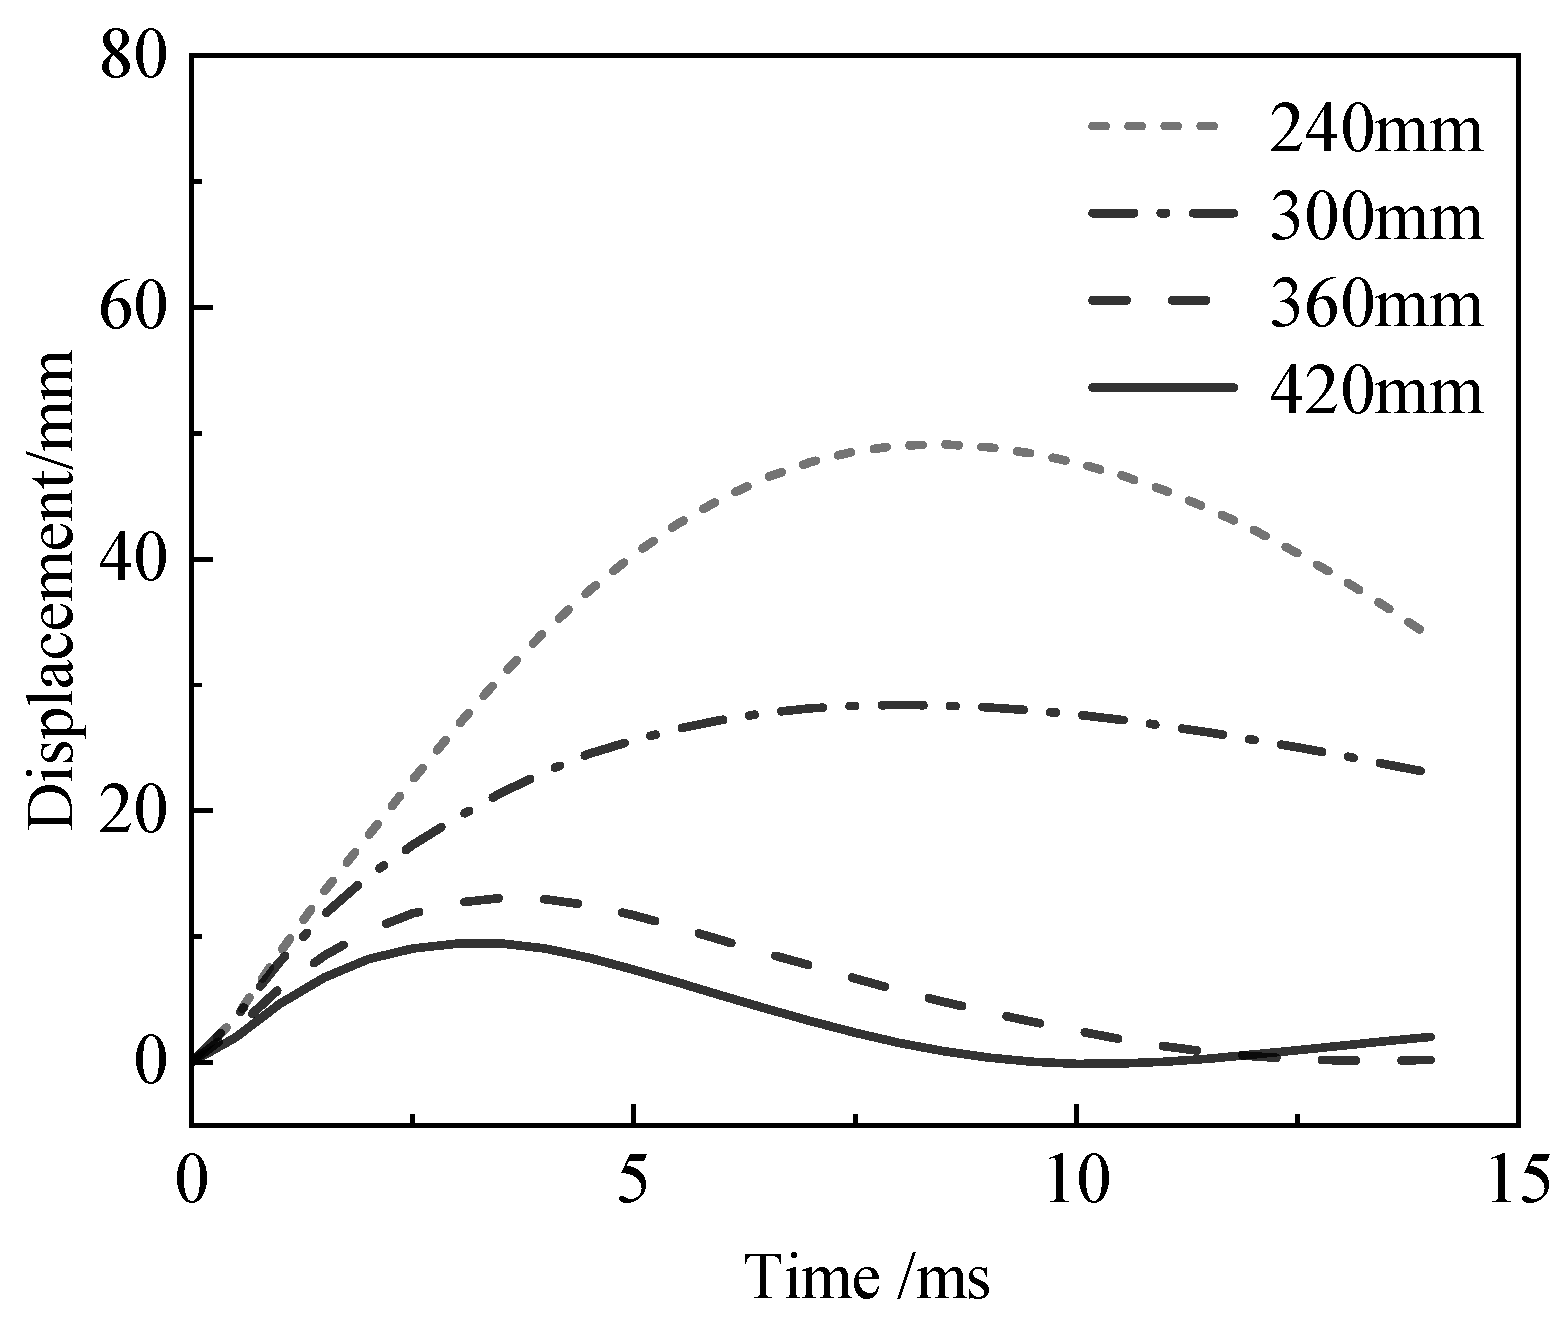
To clarify the influence of geometric characteristics, the mid-span horizontal displacement–time-history curves were compared for cross-sectional depths of 240 mm, 300 mm, 360 mm, and 420 mm, as illustrated in Figure 24. The results indicate that cross-sectional depth is a key geometric parameter determining the flexural stiffness of the T-shaped columns. As the cross-sectional depth increases, the peak mid-span displacement decreases significantly: the peak displacement for the 240 mm cross-section reaches approximately 49 mm, whereas the peak values for the 300 mm, 360 mm, and 420 mm cross-sections drop to approximately 28 mm, 13 mm, and 9 mm, respectively. This demonstrates that increasing the cross-sectional depth effectively enhances the cross-sectional moment of inertia and overall flexural stiffness, thereby substantially suppressing macroscopic dynamic deformation induced by blast loads.
Figure 24.
Mid-span displacement–time-history curves under different cross-sectional depths.
(4) Effect of Blast Location
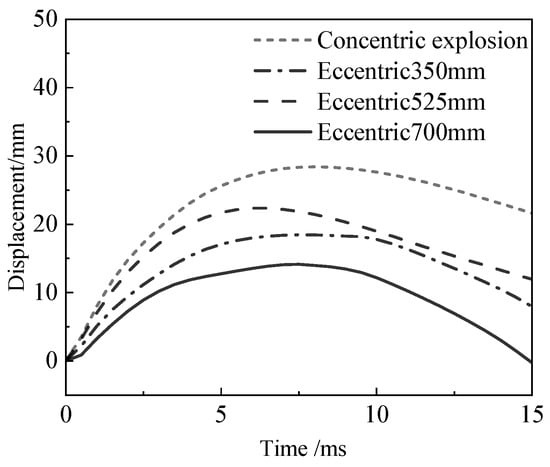
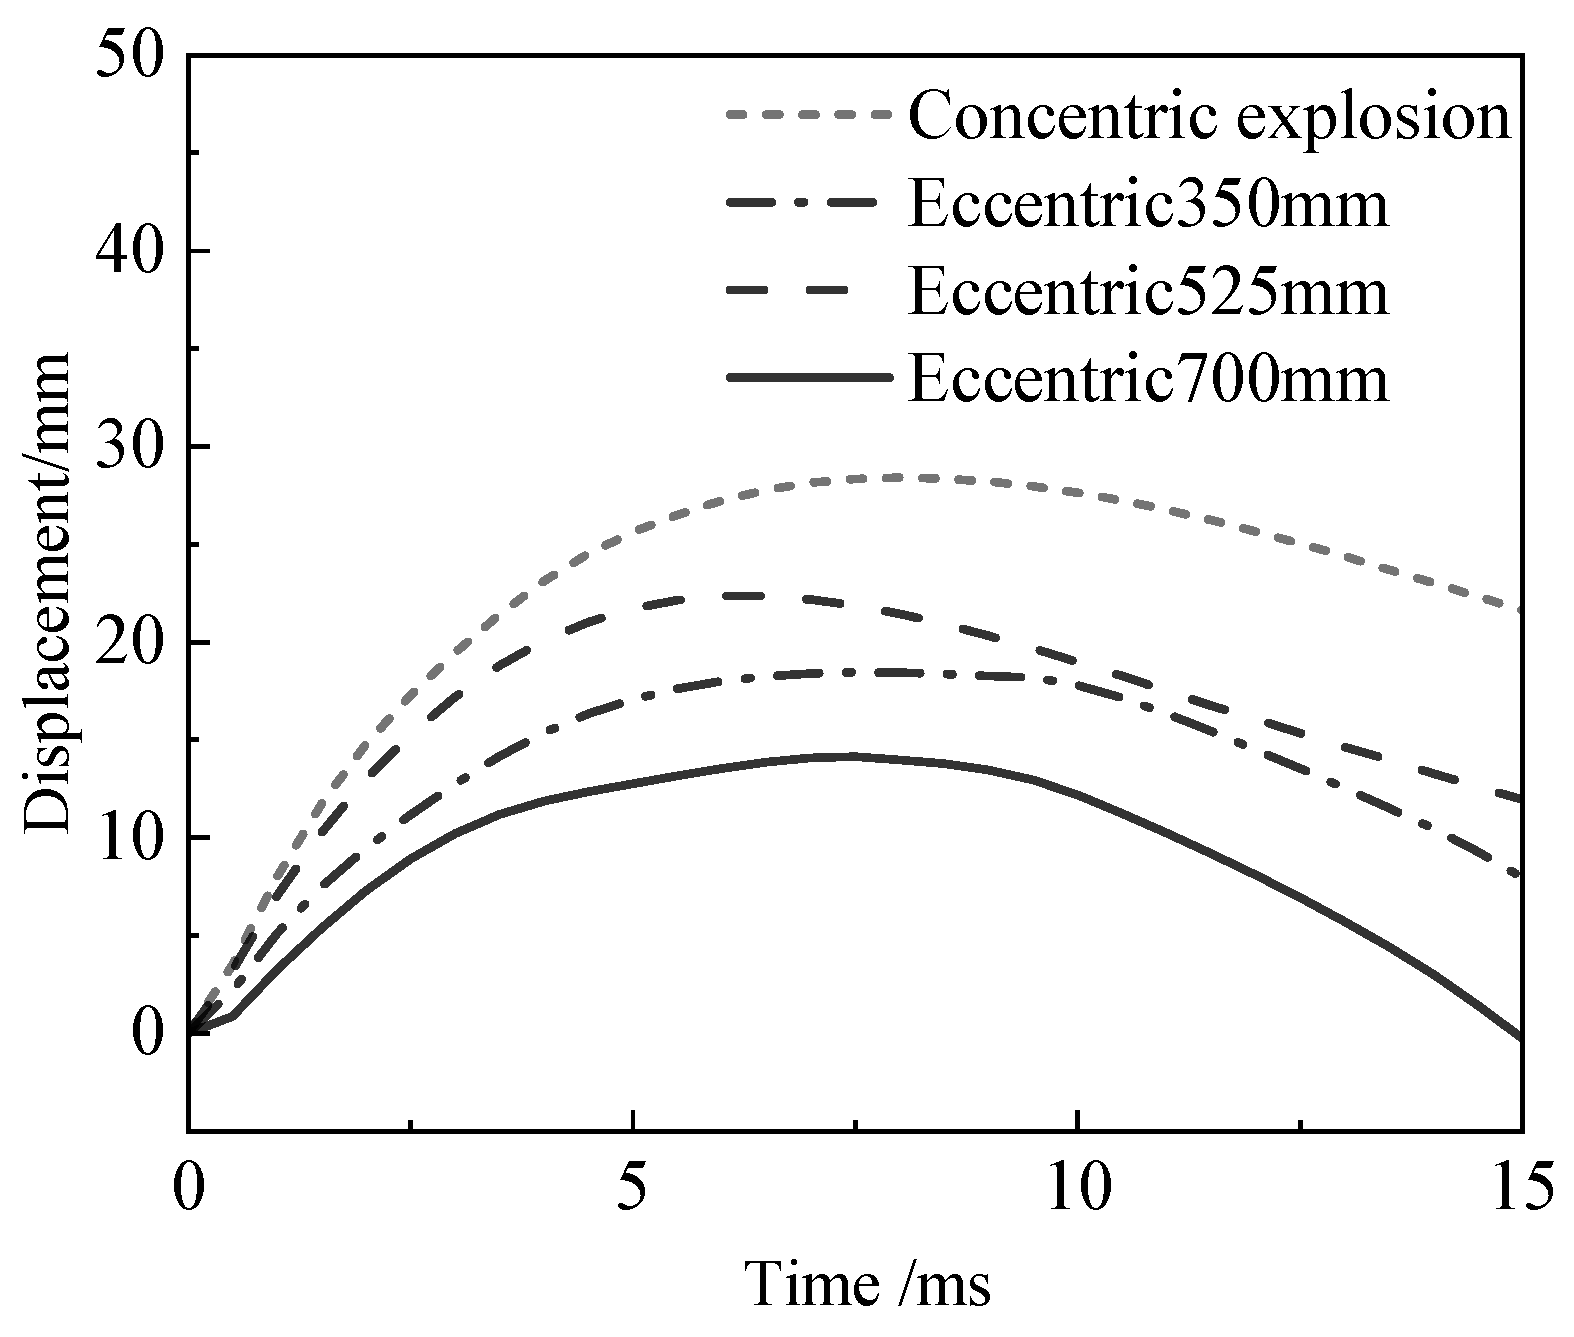
Figure 25 presents the horizontal displacement–time-history curves at the blast center elevation under various eccentricities of 0 mm, 350 mm, 525 mm, and 700 mm. The data indicate that as eccentricity increases, the peak horizontal displacements at the measurement points exhibit a decreasing trend, yielding values of 28 mm, 23 mm, 18 mm, and 14 mm, respectively. However, this reduction in displacement does not imply an enhancement in blast-resistant performance. Calculating the support rotations based on the column span reveals that the rotations for the respective eccentric test cases are 1.55°, 1.88°, 1.96°, and 2.29°, demonstrating a significant increasing trend. This phenomenon indicates that the asymmetric action of the blast shock wave induces severe coupled bending-shear deformation in the T-shaped column. Increased eccentricity exacerbates stress concentration at the flange–web intersection, leading to enlarged overall component rotation and severe asymmetric damage, thereby substantially compromising actual blast-resistant stability.
Figure 25.
Displacement–time-history curves at the elevation of the blast center under different blast locations.
4. Dynamic Response Analysis
4.1. Equivalent Analysis Method
The equivalent single-degree-of-freedom (SDOF) system [26] simplifies the motion of a continuum structure into one-dimensional motion along a characteristic direction. The fundamental principle of this method is to transform a structural component with distributed mass and external loads into an equivalent spring-mass SDOF system. Dynamic calculations are then performed by substituting the equivalent mass, resistance, and load into the SDOF equations of motion, which are expressed as follows:
where is the equivalent structural mass; is the total equivalent load acting on the structure; is the actual mass of the structure; is the viscous damping coefficient of the component, is the damping ratio, and is the critical damping constant; and is the resistance function of the structure.
In the SDOF system, the equivalent mass factor is determined by equating the kinetic energy of the continuum structure to that of the SDOF system in the characteristic direction of motion. Similarly, the equivalent load factor is derived by equating the work performed by the distributed forces acting on the continuum structure to the work performed by external forces on the SDOF system [27]. It should be noted that the viscous damping term is intentionally omitted. Under near-field blast loading, the blast overpressure duration is extremely short, and the structural component typically reaches its peak displacement during the first half-cycle of the dynamic response. In this highly impulsive transient phase, the energy dissipated by viscous damping is minimal and practically negligible compared to the massive strain energy absorbed through the plastic deformation and damage of the concrete and steel reinforcement. Therefore, following conservative blast-resistant design practices, the damping effect is conventionally ignored in the equivalent SDOF calculation to simplify the solution while providing a safe upper-bound prediction.
where is the mass per unit length of the component; is the displacement shape function of the component under blast loading; is the dynamic blast load applied to the component; and is the length of the component. The parameters listed in Table 12 are adopted to solve this problem [26].
Table 12.
Equivalent SDOF calculation parameters.
4.2. Resistance Function
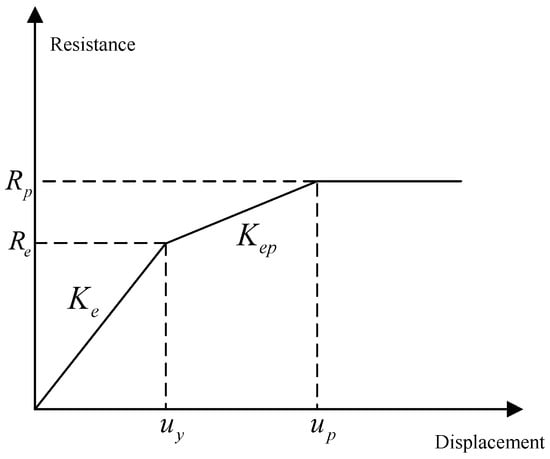
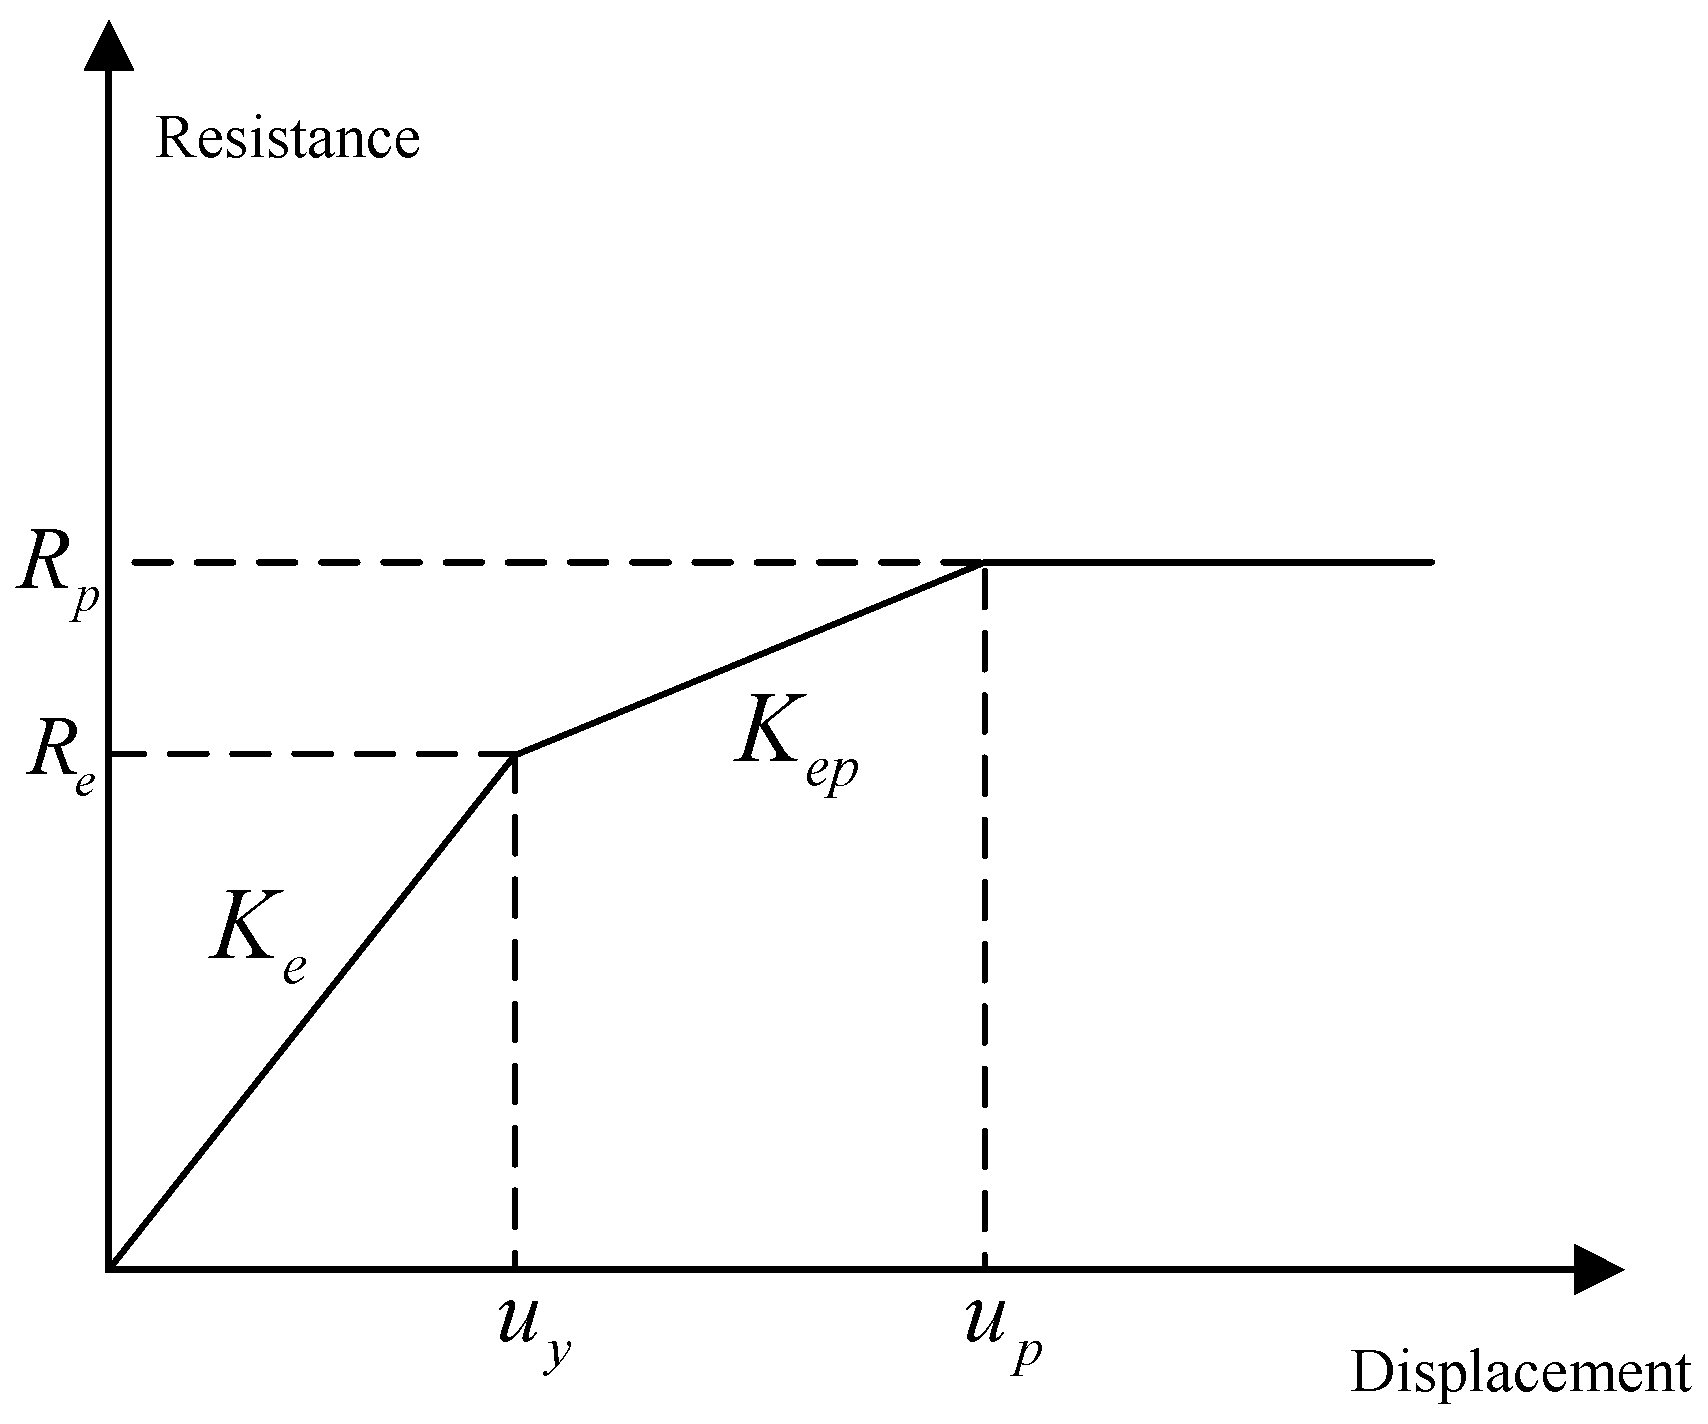
The reinforced concrete (RC) T-shaped column is assumed to be an ideal rigid-plastic component; only flexural deformation is considered, while shear deformation is neglected. Upon flexural failure, ideal plastic hinges form at both end supports and the mid-span. To accurately characterize the nonlinear dynamic response of the column under blast loading, its equivalent resistance function is divided into three stages: elastic, elastoplastic transition, and perfectly plastic.
(1) Elastic stage (
The tension zone of the entire cross-section remains uncracked or experiences only minor cracking. All steel reinforcement remains in an elastic state, and the cross-sectional resistance increases linearly with the mid-span deflection:
where is the limit displacement when the outermost longitudinal reinforcement in the tension zone initially yields; is the effective moment of inertia of the cross-section; is the equivalent elastic stiffness of the T-shaped cross-section; is the overall elastic modulus of the reinforced concrete T-shaped column cross-section; is the gross moment of inertia of the cross-section; and is the transformed moment of inertia of the cracked cross-section.
(2) Elastoplastic transition stage ()
As displacement increases, the longitudinal reinforcement in the tension zone yields progressively from the outermost edge of the cross-section toward the neutral axis. During this yielding process, the cross-sectional stiffness gradually degrades, exhibiting distinct elastoplastic hardening characteristics:
where is the initial yield resistance; is the equivalent elastoplastic hardening stiffness; and is the displacement when all longitudinal reinforcement in the tension zone yields and a full plastic hinge forms in the cross-section.
By extracting the initial yield point and the fully plastic point from the full-range moment-curvature () analysis of the cross-section, and incorporating the concentrated deformation effect of the plastic hinge length , the corresponding mid-span displacement is derived as follows:
Consequently, the secant stiffness of the elastoplastic transition stage is obtained:
where is the initial ultimate resistance.
(3) Plastic limit stage
Once a full plastic hinge forms at the mid-span cross-section, the component enters the plastic mechanism stage, and the resistance reaches its dynamic ultimate value.
The three-stage resistance function is shown in Figure 26. The three-stage resistance function for the reinforced concrete T-shaped column can be expressed as:
Figure 26.
Three-stage resistance function diagram.
4.3. Model Validation
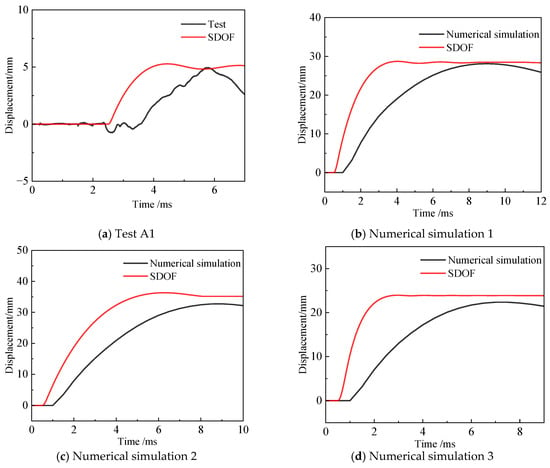
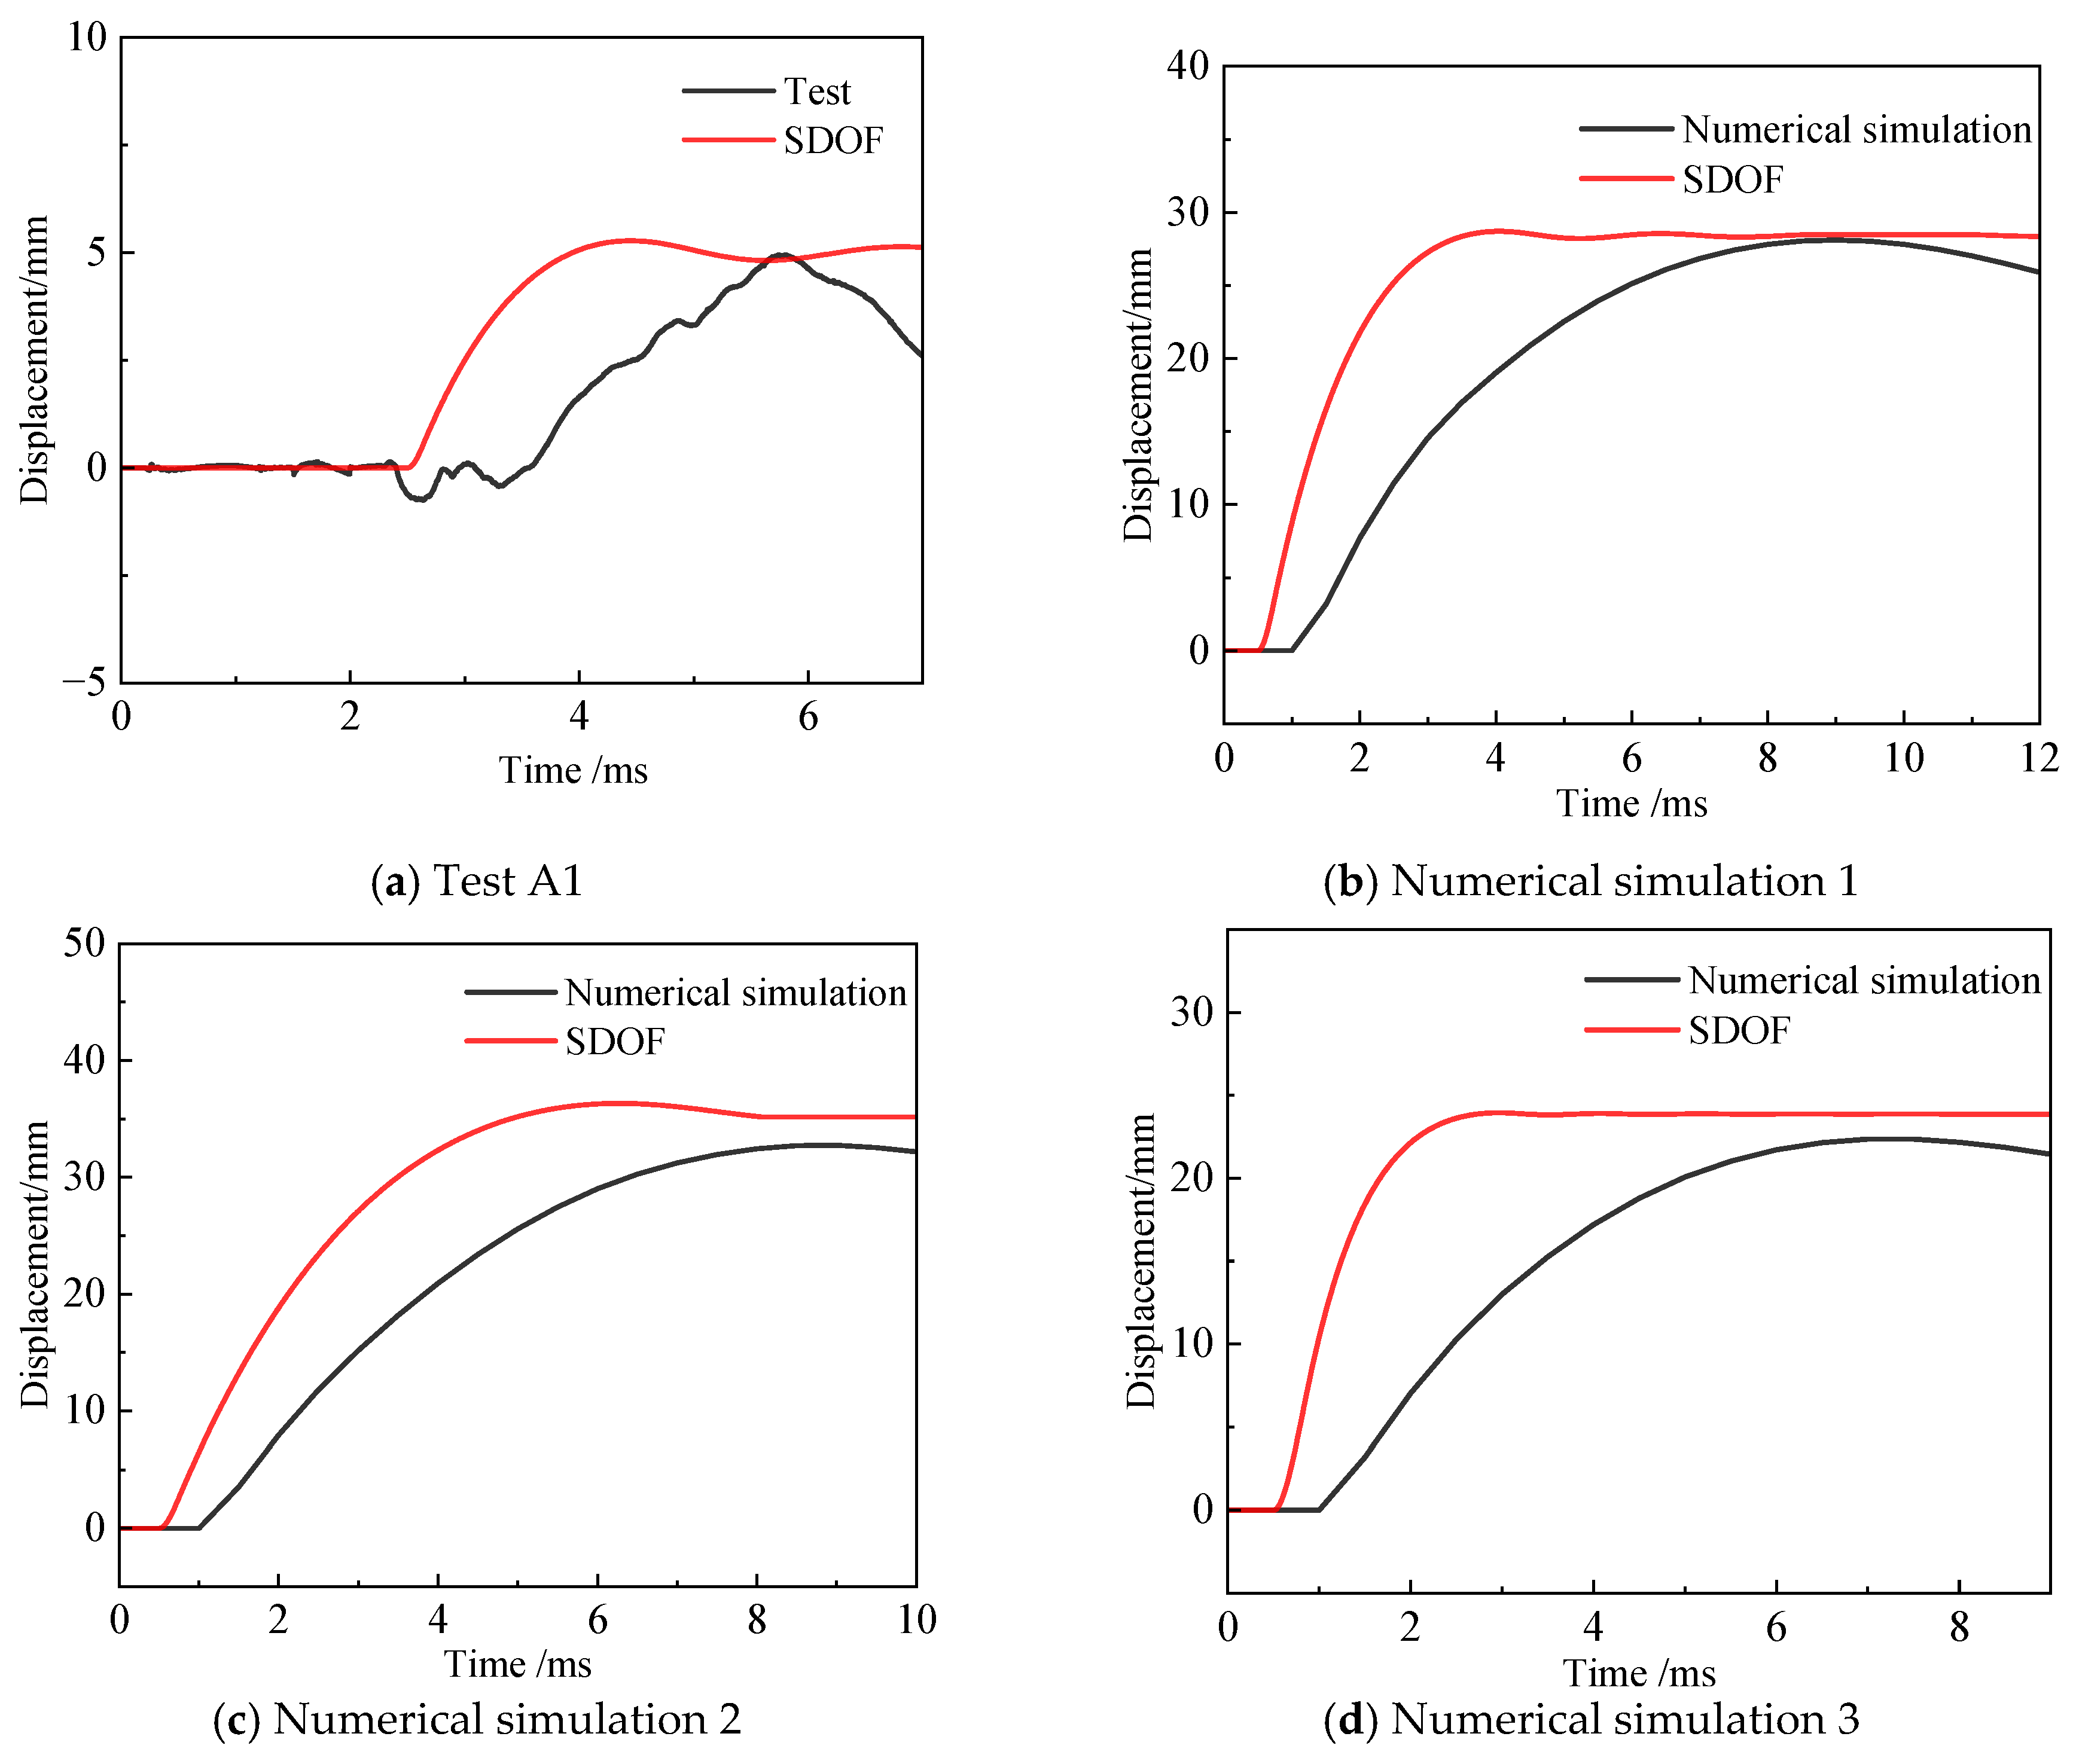
To verify the accuracy of the equivalent model, the experimental data, numerical simulation results, and analytical results from the equivalent SDOF model for Case A1 were compared. The comparison results are presented in Figure 27. The errors of the comparison results are presented in Table 13. The theoretically predicted displacements from the SDOF model show excellent agreement with the measured data, with relative errors across all test cases remaining within 15%. This demonstrates that the adopted resistance function is highly accurate and satisfies the precision requirements for blast-resistant engineering assessments.
Figure 27.
Comparison of experimental, numerical simulation, and SDOF calculation results for Case A1.
Table 13.
Comparison of SDOF test cases.
Although the equivalent SDOF model excels at predicting the global dynamic response of reinforced concrete (RC) T-shaped columns under flexure-dominated conditions, its inherent limitations must be acknowledged. The current SDOF formulation assumes flexural deformation and is restricted to centric blast loading scenarios. Consequently, high prediction accuracy is achieved only when the global response of the member is governed by flexure. However, under high axial compression or excessive explosive charge masses, local shear sliding and core concrete crushing tend to induce complex coupled flexure-shear mechanisms. Under such intricate local damage states, the applicability of the SDOF model becomes limited.
5. Conclusions
This study employed field tests, numerical simulations, and equivalent SDOF theory to reveal the dynamic response and damage mechanisms of RC T-shaped columns under blast loading. The main conclusions are as follows:
(1) The explosive charge mass directly governs the degree of component damage, while the axial compression ratio demonstrates a critical threshold. A moderate axial compression ratio of 0.15–0.25 effectively restrains macroscopic displacement, whereas an excessively high ratio exacerbates localized failure. Increasing cross-sectional dimensions significantly enhances overall flexural stiffness, suppressing the dynamic response. Under eccentric blast loading, components are highly susceptible to severe asymmetric damage and coupled bending-shear deformation; the resulting high stress concentration at the flange–web intersection substantially weakens overall blast-resistant stability.
(2) To precisely quantify post-disaster damage, this study proposes a three-level damage assessment criterion (minor, moderate, and severe damage) utilizing maximum support rotation as the control index. This provides a reliable basis for the rapid evaluation of special-shaped columns.
(3) A three-stage SDOF equivalent resistance function model was developed, encompassing the elastic, elastoplastic transition, and perfectly plastic stages. The calculated displacements from this model show excellent agreement with both experimental and numerical simulation data, verifying its accuracy and applicability for the blast-resistant design of RC special-shaped columns.
Future Research Directions:
- (1)
- Future research should adopt novel structural measures, such as Ultra-High Performance Concrete (UHPC), external Carbon Fiber Reinforced Polymer (CFRP) wrapping, and steel jacketing, to further enhance the blast-resistant performance and energy dissipation capacity of special-shaped columns.
- (2)
- Full-scale component tests should be conducted at advanced facilities to facilitate systematic comparisons with scaled-down tests. The experimental matrix should also expand to include larger explosive charge masses, broader axial compression ratios, and varying reinforcement ratios.
Author Contributions
Conceptualization, R.Z. and W.W.; validation, W.W. and C.Y.; investigation, T.F. and C.Y.; resources, R.Z.; data curation, T.F.; writing—original draft preparation, T.F.; writing—review and editing, R.Z., W.W. and C.Y.; supervision, R.Z. All authors have read and agreed to the published version of the manuscript.
Funding
This research received no external funding.
Data Availability Statement
The raw data supporting the conclusions of this article will be made available by the authors on request.
Conflicts of Interest
The authors declare no conflicts of interest.
References
- Lan, S.; Crawford, J.E.; Morrill, K.B. Design of reinforced concrete columns to resist the effects of suitcase bombs. In Proceedings of the 6th International Conference on Shock and Impact Loads on Structures, Perth, Australia, 7–9 December 2005; pp. 5–10. [Google Scholar]
- Hao, H.; Cheong, H.K.; Cui, S. Numerical study of dynamic buckling of steel columns subjected to underground explosion. Key Eng. Mater. 2002, 233, 211–216. [Google Scholar] [CrossRef] [Scilit]
- Cui, S.; Cheong, H.K.; Hao, H. Elastic-plastic dynamic response and buckling of steel columns under strong vertical ground motion. Key Eng. Mater. 2002, 233, 217–222. [Google Scholar] [CrossRef] [Scilit]
- Bao, X.; Li, B. Residual strength of blast damaged reinforced concrete columns. Int. J. Impact Eng. 2010, 37, 295–308. [Google Scholar] [CrossRef] [Scilit]
- El-Dakhakhni, W.W.; Mekky, W.F.; Changiz-Rezaei, S.H. Vulnerability screening and capacity assessment of reinforced concrete columns subjected to blast. J. Perform. Constr. Facil. 2009, 23, 353–365. [Google Scholar] [CrossRef] [Scilit]
- Shi, Y.; Hao, H.; Li, Z.-X. Numerical derivation of pressure–impulse diagrams for prediction of RC column damage to blast loads. Int. J. Impact Eng. 2008, 35, 1213–1227. [Google Scholar] [CrossRef] [Scilit]
- Shi, Y.; Li, Z. Dynamic response and failure modes of reinforced concrete columns under blast loading. J. Build. Struct. 2008, 112–117. [Google Scholar] [CrossRef]
- Shi, Y.; Hu, Y.; Chen, L.; Li, Z.-X.; Xiang, H. Experimental investigation into the close-in blast performance of RC columns with axial loading. Eng. Struct. 2022, 268, 114688. [Google Scholar] [CrossRef] [Scilit]
- Su, L.; Dong, Y.; Hou, Y. Numerical simulation of the effect of scaled standoff distance on reinforced concrete columns under blast loading. Coal Technol. 2013, 32, 115–117. [Google Scholar]
- Wang, A.; Xu, Y. Study on the influence of steel tube diameter on the blast resistance of T-shaped concrete-filled steel tubular core columns. Eng. Mech. 2013, 30, 49–52. [Google Scholar]
- Han, H.; Dong, M.; Liu, Y.; Xu, Y. Study on the blast resistance of L-shaped steel reinforced recycled concrete special-shaped columns. In Proceedings of the 22nd National Symposium on Modern Structural Engineering, Xuzhou, China, 23–24 July 2022. [Google Scholar]
- Wei, H. Study on the Blast and Impact Resistance of L-Shaped Concrete-Filled Steel Tubular Special-Shaped Columns. Master’s Thesis, Shenyang Jianzhu University, Shenyang, China, 2025. [Google Scholar] [CrossRef]
- Wang, Y. Study on the Blast and Impact Resistance of Open-Web Cross-Shaped Steel Reinforced Concrete Special-Shaped Columns. Master’s Thesis, Shenyang Jianzhu University, Shenyang, China, 2025. [Google Scholar] [CrossRef]
- Wang, X. Study on the Mechanical Performance of Cross-Shaped Steel Reinforced Recycled Concrete Columns Under Blast and Impact Loading. Master’s Thesis, Shenyang Jianzhu University, Shenyang, China, 2021. [Google Scholar] [CrossRef]
- Ren, L. Finite Element Analysis of Blast Resistance of L-Shaped Steel Reinforced Concrete Special-Shaped Columns. Master’s Thesis, Shenyang Jianzhu University, Shenyang, China, 2018. [Google Scholar]
- Zhou, Q.; Wu, Y.; Sun, L.; Zhang, X.; Mao, Y.; Song, W. Effect of reinforcement ratio on the maximum mid-span displacement of concrete special-shaped columns under blast loading. J. Yantai Univ. (Nat. Sci. Eng. Ed.) 2016, 29, 204–209. [Google Scholar] [CrossRef]
- Huang, X. Dynamic Response and Damage Analysis of Reinforced Concrete Special-Shaped Columns Under Blast Loading. Master’s Thesis, Fuzhou University, Fuzhou, China, 2020. [Google Scholar]
- Zhou, C.; Liu, Z.; Xue, J.; Ding, Y.; Pang, R. Damage and quantitative indexes for steel reinforced concrete column with T-shaped section. J. Build. Eng. 2022, 46, 103779. [Google Scholar] [CrossRef] [Scilit]
- Zhang, L. Study on the Progressive Collapse Resistance of Concrete Special-Shaped Column Frame Structures. Ph.D. Thesis, Tianjin University, Fuzhou, China, 2018. [Google Scholar]
- GB 50010-2010; Code for Design of Concrete Structures. China Architecture & Building Press: Beijing, China, 2010.
- JGJ 3-2010; Technical Specification for Concrete Structures of Tall Building. China Architecture & Building Press: Beijing, China, 2010.
- JGJ 149-2017; Technical Specification for Concrete Structures with Specially Shaped Columns. China Architecture & Building Press: Beijing, China, 2017.
- Hao, Y.; Hao, H. Influence of the concrete DIF model on the numerical predictions of RC wall responses to blast loadings. Eng. Struct. 2014, 73, 24–38. [Google Scholar] [CrossRef] [Scilit]
- Li, J.; Li, X.; Peng, J.; Wu, X.; Sun, Y.; Zhou, F. Experimental and numerical investigations of single-hole blast-induced cracks in concrete based on a calibrated RHT model. Struct. Concr. 2026, 27, 127–142. [Google Scholar] [CrossRef] [Scilit]
- Malvar, L.J.; Crawford, J.E. Dynamic Increase Factors for Steel Reinforcing Bars; Twenty-Eighth DDESB Seminar: Orlando, FL, USA, 1998. [Google Scholar]
- UFC 3-340-02; Structures to Resist the Effects of Accidental Explosions. US DoD.: Washington, DC, USA, 2008; p. 83.
- Riedel, W.; Fischer, K.; Kranzer, C.; Erskine, J.; Cleave, R.; Hadden, D.; Romani, M. Modeling and validation of a wall-window retrofit system under blast loading. Eng. Struct. 2012, 37, 235–245. [Google Scholar] [CrossRef] [Scilit]

Disclaimer/Publisher’s Note: The statements, opinions and data contained in all publications are solely those of the individual author(s) and contributor(s) and not of MDPI and/or the editor(s). MDPI and/or the editor(s) disclaim responsibility for any injury to people or property resulting from any ideas, methods, instructions or products referred to in the content. |
© 2026 by the authors. Licensee MDPI, Basel, Switzerland. This article is an open access article distributed under the terms and conditions of the Creative Commons Attribution (CC BY) license.