


Abstract
Freeze–thaw resistance is important for the use of red mud-based synthetic sand in cold regions. Mortars containing synthetic, standard, and fluvial sand were compared at a nominal water-to-cement ratio of 0.50 and cement-to-sand mass ratio of 1:3. Strengths were measured at 3, 7, 14, and 28 d. After 28 d of curing, specimens underwent 25 freeze–thaw cycles, each comprising 12 h at −20 °C and 12 h in water at 20 ± 1 °C. Digital image correlation (DIC) during loading at 0.2 kN/s and scanning electron microscopy (SEM) assessed strain localization and interfacial morphology. At 28 d, compressive and flexural strengths were 45.3 ± 0.6 and 9.9 ± 0.6 MPa for synthetic-sand mortar, 44.0 ± 0.6 and 8.9 ± 0.8 MPa for standard-sand mortar, and 42.5 ± 1.0 and 7.3 ± 0.8 MPa for fluvial-sand mortar, respectively. After cycling, synthetic sand mortar exhibited mass, compressive strength, and flexural strength losses of 0.2%, 6.1%, and 8.6%, respectively, lower than those of both reference mortars. DIC showed increased strain localization, while SEM suggested less interfacial deterioration in synthetic sand mortar. Its rough surface and possible mechanical interlocking may contribute to the observed resistance under these test conditions.
1. Introduction
Aggregates are essential constituents of cement-based materials, and their intrinsic properties, particle size and grading, and interfacial bonding with the cementitious matrix can jointly influence the mechanical properties and durability of these materials [1,2,3]. In cold regions, moisture within cement-based materials undergoes repeated freezing and thawing as the ambient temperature fluctuates. The resulting frost-induced pressure and moisture migration promote the progressive development of internal pores and microcracks, leading to mass loss, strength degradation, and localized failure, thereby severely compromising the service safety and durability of engineering structures [4,5,6]. Freeze–thaw-induced microcracks may initiate at weak regions, such as aggregate–cement paste interfaces, and subsequently propagate into the mortar matrix. Differences in aggregate properties and interfacial bonding may therefore contribute to variations in freeze–thaw damage among different mortars [7]. However, strength measurements alone cannot characterize deformation localization during subsequent loading before macroscopic cracking becomes apparent, highlighting the value of complementary full-field deformation measurements. Therefore, evaluating the freeze–thaw performance of cement-based materials containing different aggregates requires consideration of both aggregate characteristics and particle size distribution to better assess their engineering applicability and long-term durability.
Current studies on the freeze–thaw performance of aggregate-containing cement-based materials have primarily focused on natural and recycled aggregates. Dong et al. [8] analyzed changes in the mechanical properties of concrete subjected to freeze–thaw cycles, while Liu et al. [9] investigated the cracking behavior of concrete during freeze–thaw exposure. Liu et al. [10] examined the flexural failure characteristics of freeze–thaw-damaged concrete using three-point bending tests. Luo et al. [11] investigated steel-fiber-reinforced rubber concrete and reported that adding 2.0% steel fibers increased its compressive strength by 26.6% before freeze–thaw exposure. Regarding recycled aggregates, Jierula et al. [12] reported that concrete made entirely with recycled aggregates exhibited a 49.42% reduction in compressive strength after 30 freeze–thaw cycles compared with specimens without freeze–thaw exposure. Bosque et al. [13] evaluated the freeze–thaw resistance of concrete containing mixed aggregates and construction and demolition waste, while Wu et al. [14] analyzed the mechanical response of concrete incorporating demolished concrete lumps after freeze–thaw cycling. These studies provide a basis for understanding the freeze–thaw damage behavior of cement-based materials containing different aggregates. However, existing research has mainly focused on natural aggregates and recycled aggregates derived from construction waste, whereas the freeze–thaw performance of artificial aggregates manufactured from industrial solid waste remains insufficiently investigated.
Previous studies have shown that fine-aggregate characteristics influence both mechanical performance and freeze–thaw resistance. Cortes et al. [15] compared natural and manufactured sands at the same grading and linked mortar compressive strength to particle shape and aggregate packing. Wu et al. [16] found that an appropriate sand ratio improved the freeze–thaw resistance of manufactured-sand concrete, whereas excessive sand content adversely affected its performance. For red mud utilization, Tian et al. [17] produced cold-bonded red mud–fly ash aggregates with a maximum 28-day crushing strength of 6.18 MPa. These findings motivate further investigation of sintered red mud-based synthetic sand in mortar. Accordingly, this study uses standard sand as a benchmark and fluvial sand as a conventional natural aggregate reference to evaluate strength development and freeze–thaw deterioration.
Red mud-based synthetic sand is an artificial aggregate produced by firing red mud as the primary raw material with small amounts of bentonite and fly ash. Its application provides a potential route for the resource utilization of red mud and other industrial solid wastes [18]. However, owing to differences in raw material composition and firing processes, red mud-based synthetic sand may differ considerably from natural sand in terms of pore structure, water absorption behavior, surface morphology, and interfacial bonding with the cementitious matrix. These characteristics may further affect moisture migration, interfacial stress transfer, and crack propagation during freeze–thaw cycling, resulting in distinct macroscopic deterioration behavior. Nevertheless, integrated investigations of the mechanical properties, deformation localization, and interfacial microdamage of red mud-based synthetic sand mortar before and after freeze–thaw cycling remain limited. Changes in mass and strength alone are insufficient to fully reveal the evolution and underlying mechanisms of freeze–thaw damage. Previous studies have demonstrated the potential and limitations of red mud utilization. Liu et al. [19] reported 28-day compressive and flexural strengths of 39.1 and 7.4 MPa, respectively, with a flow spread of 110 mm for an optimized red mud–slag mortar. Ortega et al. [20] observed pore refinement and maintained chloride resistance with up to 20% red mud replacement, although compressive strength decreased. Turan et al. [21] found that mortar containing 30% red mud as cement replacement decreased in compressive strength from 61.0 to 37.0 MPa after 100 freeze–thaw cycles. These findings motivate further evaluation of red mud utilized as sintered fine aggregate. These studies establish the potential of red mud in cementitious binders but provide limited insight into the freeze–thaw response of mortars incorporating sintered red mud-based fine aggregates. In particular, the relationship between strength retention, strain localization, and interfacial deterioration remains insufficiently understood for this application.
Digital image correlation (DIC) is a non-contact, full-field deformation measurement technique based on matching speckle images acquired from the specimen surface. It provides displacement and strain fields throughout the loading process [12,22,23,24]. Unlike conventional contact-based point measurements, such as strain gauges, DIC is not substantially constrained by the number or location of measurement points and can continuously capture the development of strain localization [25,26,27]. This capability is particularly relevant to the present study because freeze–thaw damage is inherently heterogeneous. Microcracks generally initiate at weak regions, such as aggregate–cement paste interfaces, and subsequently propagate into the mortar matrix, whereas strength measurements alone cannot characterize deformation localization prior to crack formation [28]. By comparing the transverse and longitudinal strain fields of the three mortars before and after freeze–thaw cycling, DIC enables the identification of crack initiation locations, strain concentration levels, and changes in failure modes. When combined with scanning electron microscopy (SEM), it further establishes correlations among surface deformation evolution, interfacial microdamage, and macroscopic mechanical degradation.
Accordingly, this study investigated red mud-based synthetic sand mortar, with standard-sand and river-sand mortars used as reference mixtures. The mechanical properties of the three mortars were measured at different curing ages, and their mass loss and strength degradation after 25 freeze–thaw cycles were evaluated. During loading, DIC was employed to obtain the transverse and longitudinal strain fields on the specimen surfaces and to analyze the evolution of strain localization and failure modes before and after freeze–thaw cycling. SEM was also used to examine the interfacial microstructures between the three aggregates and the cementitious matrix. By establishing an integrated framework linking freeze–thaw cycling, deformation localization, interfacial damage, and macroscopic performance degradation, this study elucidates the freeze–thaw damage characteristics and interfacial mechanisms of red mud-based synthetic sand mortar, providing preliminary experimental evidence for evaluating its potential use in cement-based materials.
2. Materials and Methods
2.1. Raw Materials and Preparation of Red Mud-Based Synthetic Sand
The cementitious material used in this study was P·O 42.5 ordinary Portland cement produced by Anhui Conch Cement Co., Ltd., Wuhu, China. Bayer-process red mud obtained from an alumina refinery in Shandong Province, China, was used as the primary raw material, while bentonite and fly ash were employed as auxiliary constituents for producing the synthetic sand. A Na2SiO3 solution with a mass concentration of 5% was used as the binder during granulation. Three types of fine aggregates were investigated: laboratory-prepared red mud-based synthetic sand, standard sand, and fluvial sand. The standard sand complied with GB/T 17671-1999, Method of Testing Cements—Determination of Strength (ISO Method) [29]. The fluvial sand was obtained from a construction company and sieved before use to achieve a maximum particle size of 5 mm. Laboratory tap water was used throughout the experiments.
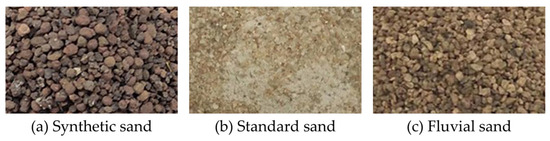
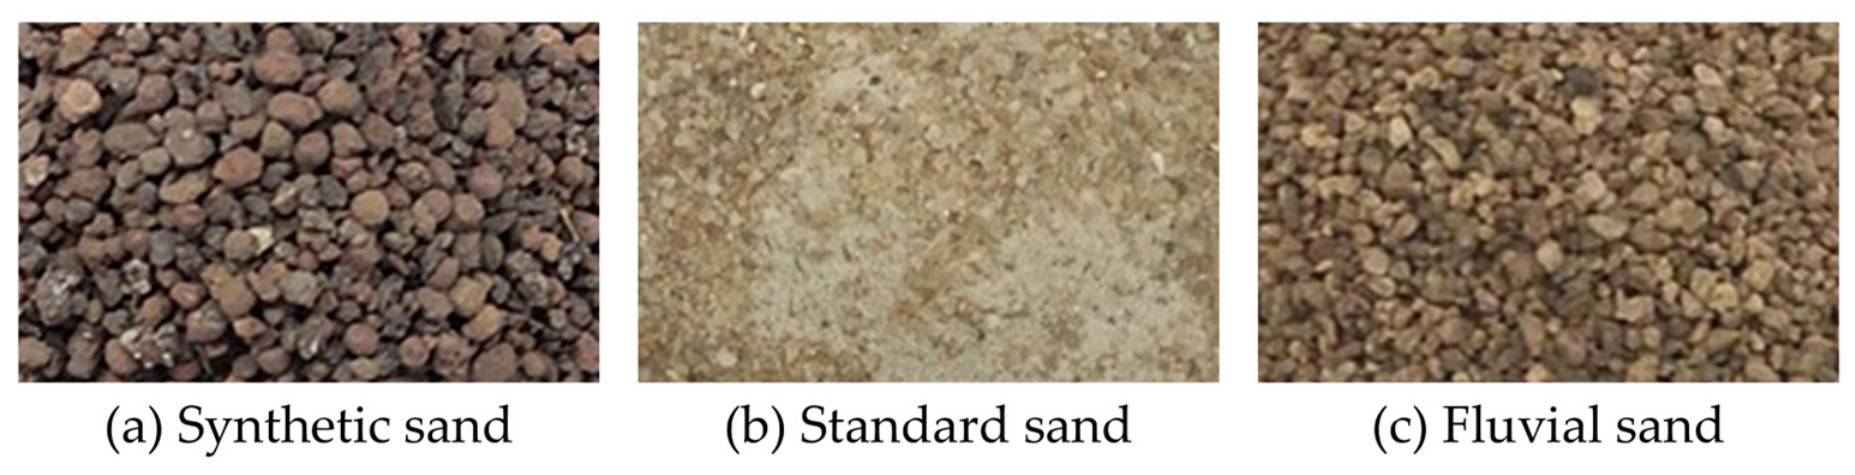
The red mud-based synthetic sand was produced using Bayer-process red mud, bentonite, and fly ash as the principal raw materials. These constituents were accurately weighed at a mass ratio of 3:1:1 and thoroughly mixed until homogeneous. The mixture was then fed into a granulator, while a Na2SiO3 solution with a mass concentration of 5% was uniformly sprayed during granulation to improve particle-forming stability. The resulting granules were dried at 100 °C for 24 h to remove internal moisture and subsequently fired at 1200 °C for 1 h. After cooling to room temperature, the fired particles were sieved to obtain the particle-size range required for the experiments. The physical appearances of the three fine aggregates are shown in Figure 1, and their basic properties are compared in Table 1.
Figure 1.
Photographs of the three types of sand.
Table 1.
Basic properties of the three types of sand.
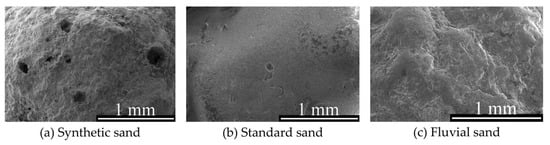
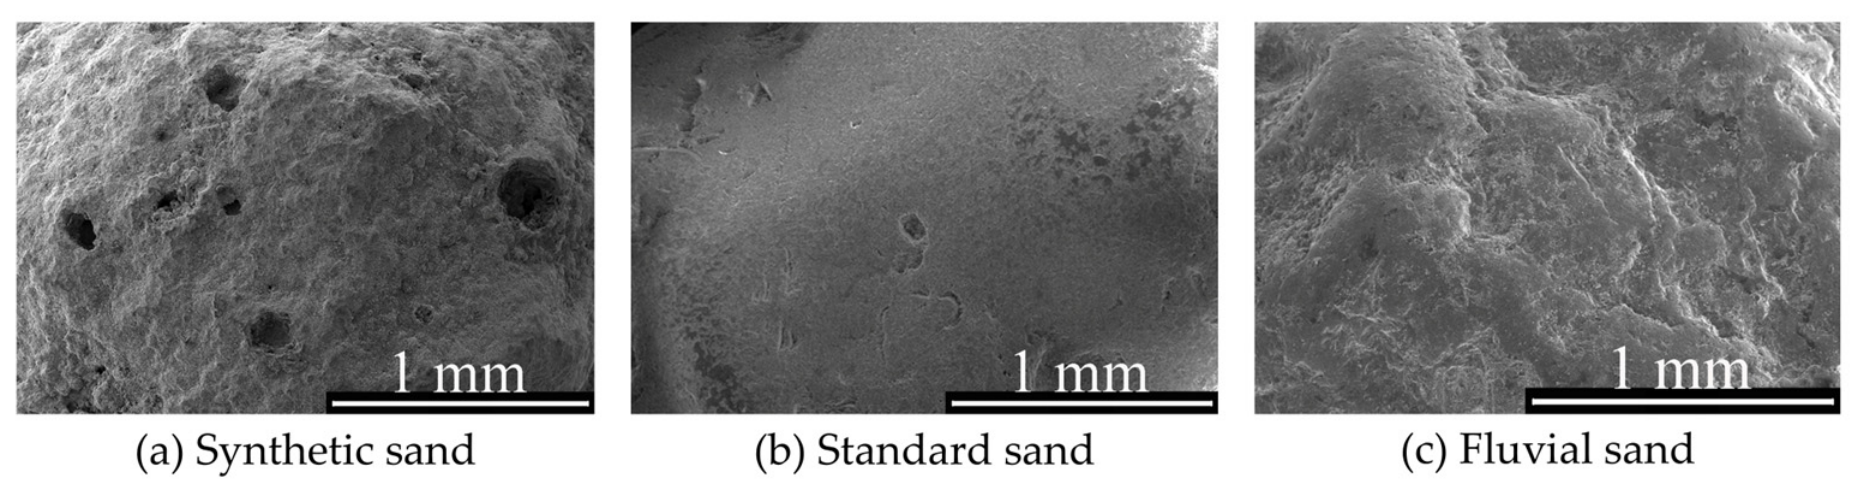
Scanning electron microscopy (SEM) was used to examine the original surface morphologies of the three fine aggregates, as shown in Figure 2. As observed in Figure 2a, the red mud-based synthetic sand exhibited a highly uneven and rough surface containing open pores of various sizes. This porous structure may have resulted from the granulation, drying, and high-temperature firing processes. As internal moisture evaporated and gases escaped from the particles, some pores remained on the surface of the sintered aggregate. In contrast, the standard sand shown in Figure 2b had a relatively smooth and dense surface, with only a few shallow depressions and no evident open pores. Although the fluvial sand in Figure 2c exhibited natural undulations and surface textures, its structure was generally continuous, without distinct open pores.
Figure 2.
SEM morphologies of the original surfaces of the three fine aggregates.
2.2. Mechanical Properties of the Sands
To ensure the comparability of the mortar test results obtained using different fine aggregates, the mixture proportions, preparation procedures, and curing conditions were kept identical for all three groups. The fine aggregates were graded according to the sieve-size intervals listed in Table 2. The tabulated values represent the mass of each particle-size fraction used per mortar batch. The mortar proportions were adopted from GB/T 17671-1999, Method of Testing Cements—Determination of Strength. For each batch, 1350 g of graded fine aggregate, 450 g of cement, and 225 mL of water were used, corresponding to a cement-to-sand mass ratio of 1:3 and a nominal water-to-cement ratio of 0.50. Based on the type of fine aggregate, the specimens were classified into the red mud-based synthetic sand, standard sand, and fluvial sand groups.
Table 2.
Masses of fine aggregate in each sieve-size fraction used per mortar batch.
The specimens were prepared in accordance with GB/T 17671-1999, Method of Testing Cements—Determination of Strength (ISO Method). Water and cement were mixed at low speed for 30 s. The fine aggregate was then gradually added over the next 30 s while mixing continued at low speed, followed by high-speed mixing for 30 s. After a 90 s pause, mixing resumed at high speed for 60 s. The total procedure lasted 240 s, including 150 s of active mixing. The same mixing sequence was applied to all three mortars. Immediately after mixing, the mortar was placed in layers into three-gang molds measuring 40 mm × 40 mm × 160 mm and compacted using the same procedure to minimize variations introduced during specimen preparation. After compaction, the excess mortar was removed, the surface was leveled, and the specimens were labeled. The specimens were demolded 24 h after casting and horizontally immersed in water at 20 ± 1 °C until the specified testing age. Specimens of each mortar type were prepared for curing periods of 3, 7, 14, and 28 d to investigate the development of strength with curing age. For each mortar type at each curing age, three prismatic specimens were tested for flexural strength. The six halves obtained after flexural testing were subsequently used to determine compressive strength. At the specified curing age, the specimens were removed from the water, and surface moisture was wiped off. Their flexural and compressive strengths were then measured using an automatic flexural and compressive strength testing machine.
2.3. Freeze–Thaw Cycles
To evaluate the effects of freeze–thaw exposure on the performance of mortars containing different fine aggregates, specimens measuring 40 mm × 40 mm × 160 mm were randomly divided into Groups A and B. For each mortar type, three prismatic specimens were assigned to each group. After casting and demolding, all specimens were cured in water at 20 ± 1 °C. At 28 d, the Group A specimens remained under water curing at 20 ± 1 °C and served as the same-age control, whereas the Group B specimens were subjected to freeze–thaw cycling. The freeze–thaw tests were conducted with reference to GB/T 50082-2024, Standard for Test Methods of Long-Term Performance and Durability of Concrete [30]. Using water-cured specimens of the same age as the control minimized the influence of age-related strength development on the test results, thereby enabling a more accurate assessment of performance deterioration caused by freeze–thaw exposure.
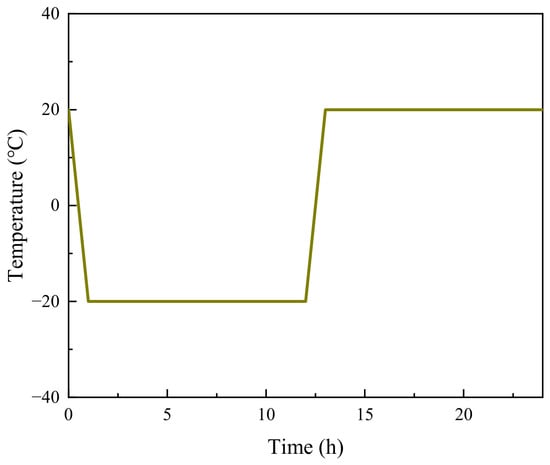
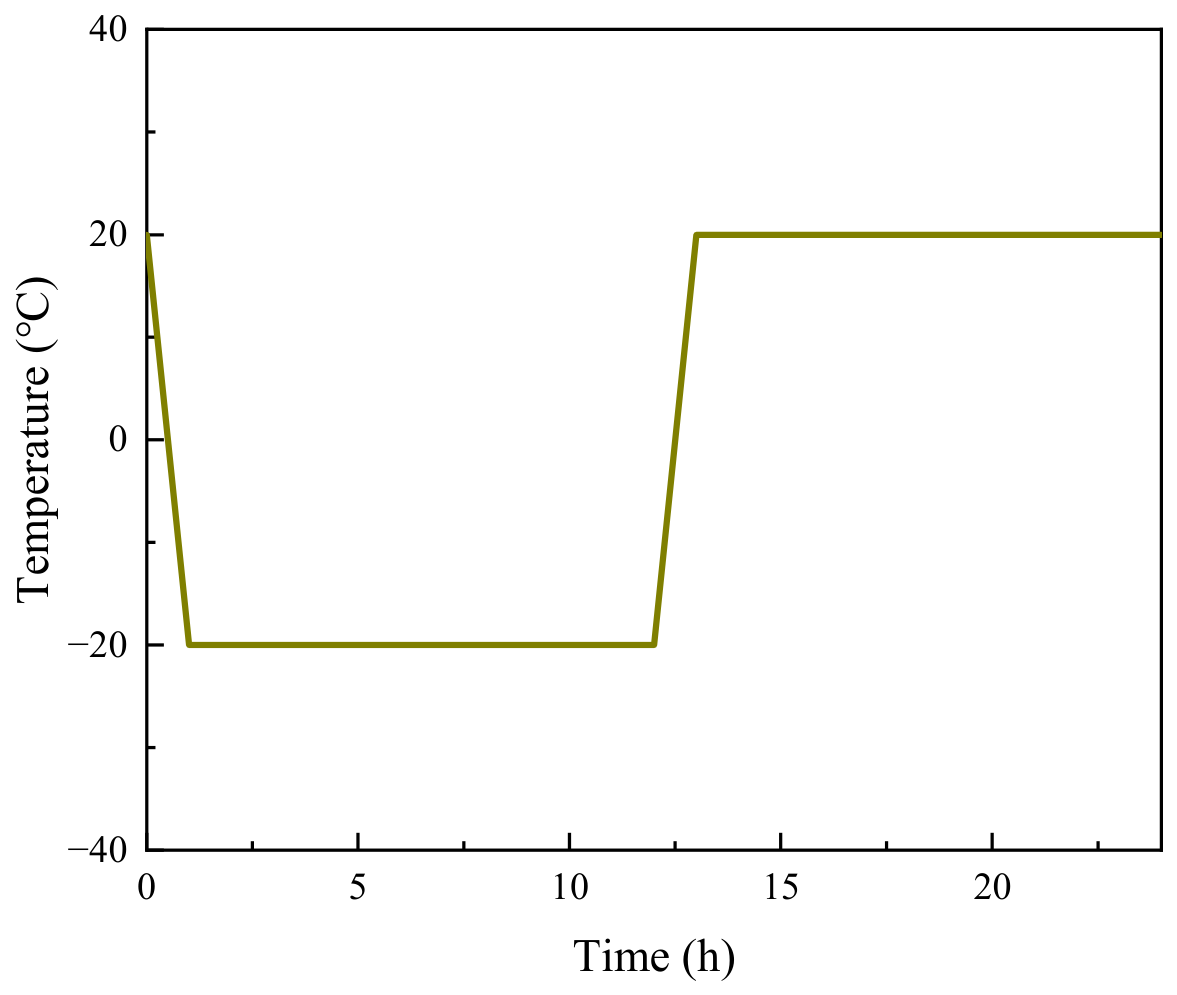
Before freeze–thaw testing, the Group B specimens were removed from the curing water, and any surface water was wiped off with a damp cloth. The initial mass of each specimen was then recorded. After weighing, the specimens were placed in a freeze–thaw chamber at −20 °C for 12 h and subsequently transferred to water at 20 ± 1 °C for thawing for 12 h. One complete freeze–thaw cycle consisted of 12 h of freezing and 12 h of thawing, with a total duration of 24 h, as illustrated in Figure 3. Immediately after each thawing stage, the specimens were subjected to the next cycle until 25 consecutive cycles had been completed. The freezing duration, thawing duration, and temperature conditions were kept identical for all specimens throughout the test.
Figure 3.
One complete freeze–thaw cycle.
After completing 25 freeze–thaw cycles, the Group B specimens were removed from the water. Surface moisture was removed using the same procedure as that adopted for the initial measurement, and each specimen was weighed. The mass loss rate was calculated separately for each of the three specimens of each mortar type, and the mean value was reported. The mass loss rate was calculated using the following equation:
where is the mass loss rate after 25 freeze–thaw cycles; is the specimen mass before freeze–thaw cycling; and is the specimen mass after 25 freeze–thaw cycles. For each mortar type in each group, the reported flexural and compressive strengths were the mean values of three and six measurements, respectively.
Upon completion of the 25 freeze–thaw cycles by Group B, the Group A specimens had been continuously cured in water at 20 °C for the same period. The specimens from both groups were then removed simultaneously, and their flexural and compressive strengths were measured using a DYE-300S automatic flexural and compressive strength testing machine (Shenzhen SANS Testing Machine Co., Ltd., Shenzhen, China), following the procedure described in Section 2.2. Taking the strength of the same-age water-cured Group A specimens as the reference, the strength loss rate of the freeze–thaw-exposed Group B specimens was calculated using the following equation:
where is the strength loss rate after freeze–thaw cycling; is the strength of the same-age water-cured Group A specimens; and is the strength of the Group B specimens after 25 freeze–thaw cycles. The corresponding flexural or compressive strength values were substituted into the equation to calculate the flexural or compressive strength loss rate, respectively.
2.4. DIC Testing of Specimens Before and After Freeze–Thaw Cycling
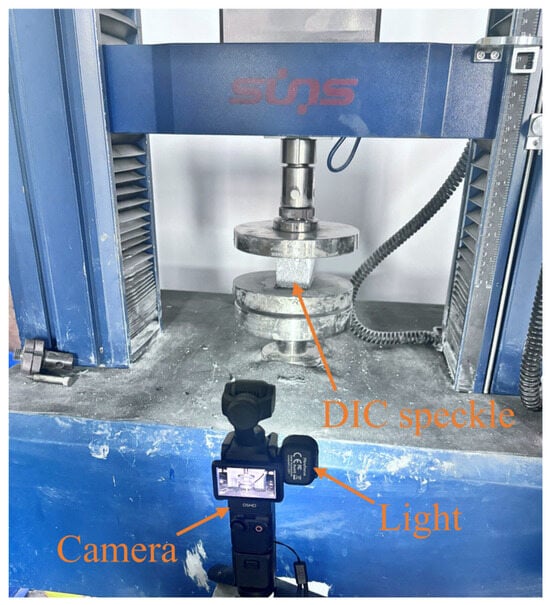
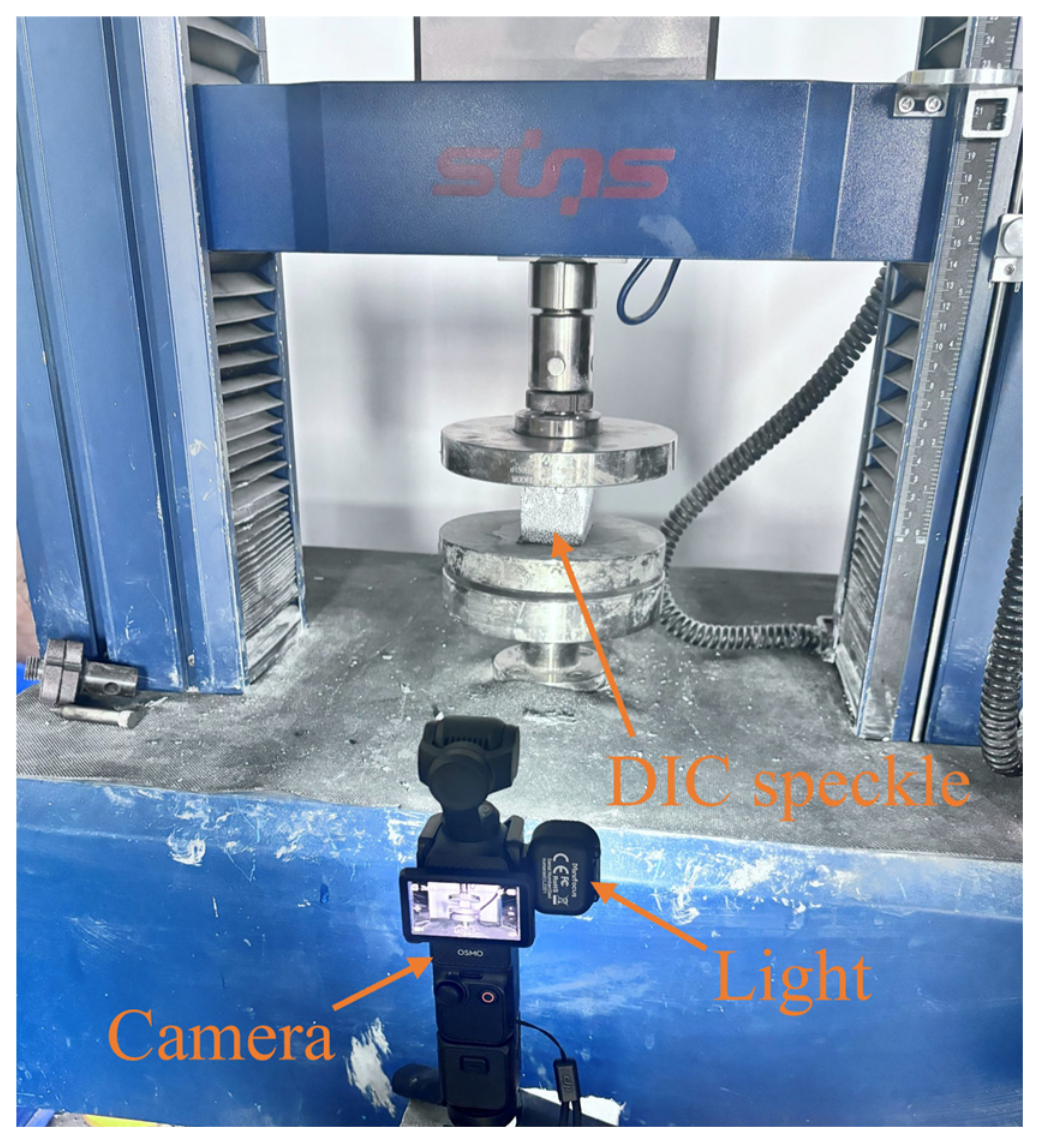
To investigate the effects of freeze–thaw exposure on deformation localization and the failure process of mortars containing different fine aggregates, DIC was used to measure the surface strain fields of the Group A and Group B specimens during loading. Group A consisted of same-age water-cured specimens, whereas Group B consisted of specimens subjected to 25 freeze–thaw cycles. Speckle images were acquired using a commercial industrial camera with an image resolution of 3840 × 2160 pixels. Cubic specimens measuring 40 mm × 40 mm × 20 mm were cut from the 40 mm × 40 mm × 160 mm prismatic specimens in both groups. The 40 mm × 40 mm face facing the camera was selected as the observation surface because it provided a large, unobstructed area for monitoring deformation during loading. A speckle pattern was applied to this face, and images were recorded under supplementary lighting. Within the observation plane, the X-direction was perpendicular to the loading direction, while the Y-direction was parallel to it. DIC was used to characterize the development of strain localization, complementing the macroscopic strength measurements. The DIC testing is shown in Figure 4. The specimens were continuously loaded at a rate of 0.2 kN/s until failure, while speckle images of the observed surface were continuously captured.
Figure 4.
DIC testing.
3. Results and Discussion
3.1. Strength Development of Mortars Containing Different Fine Aggregates
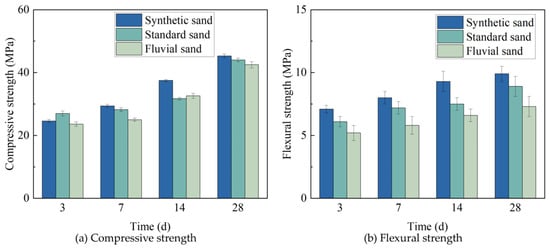
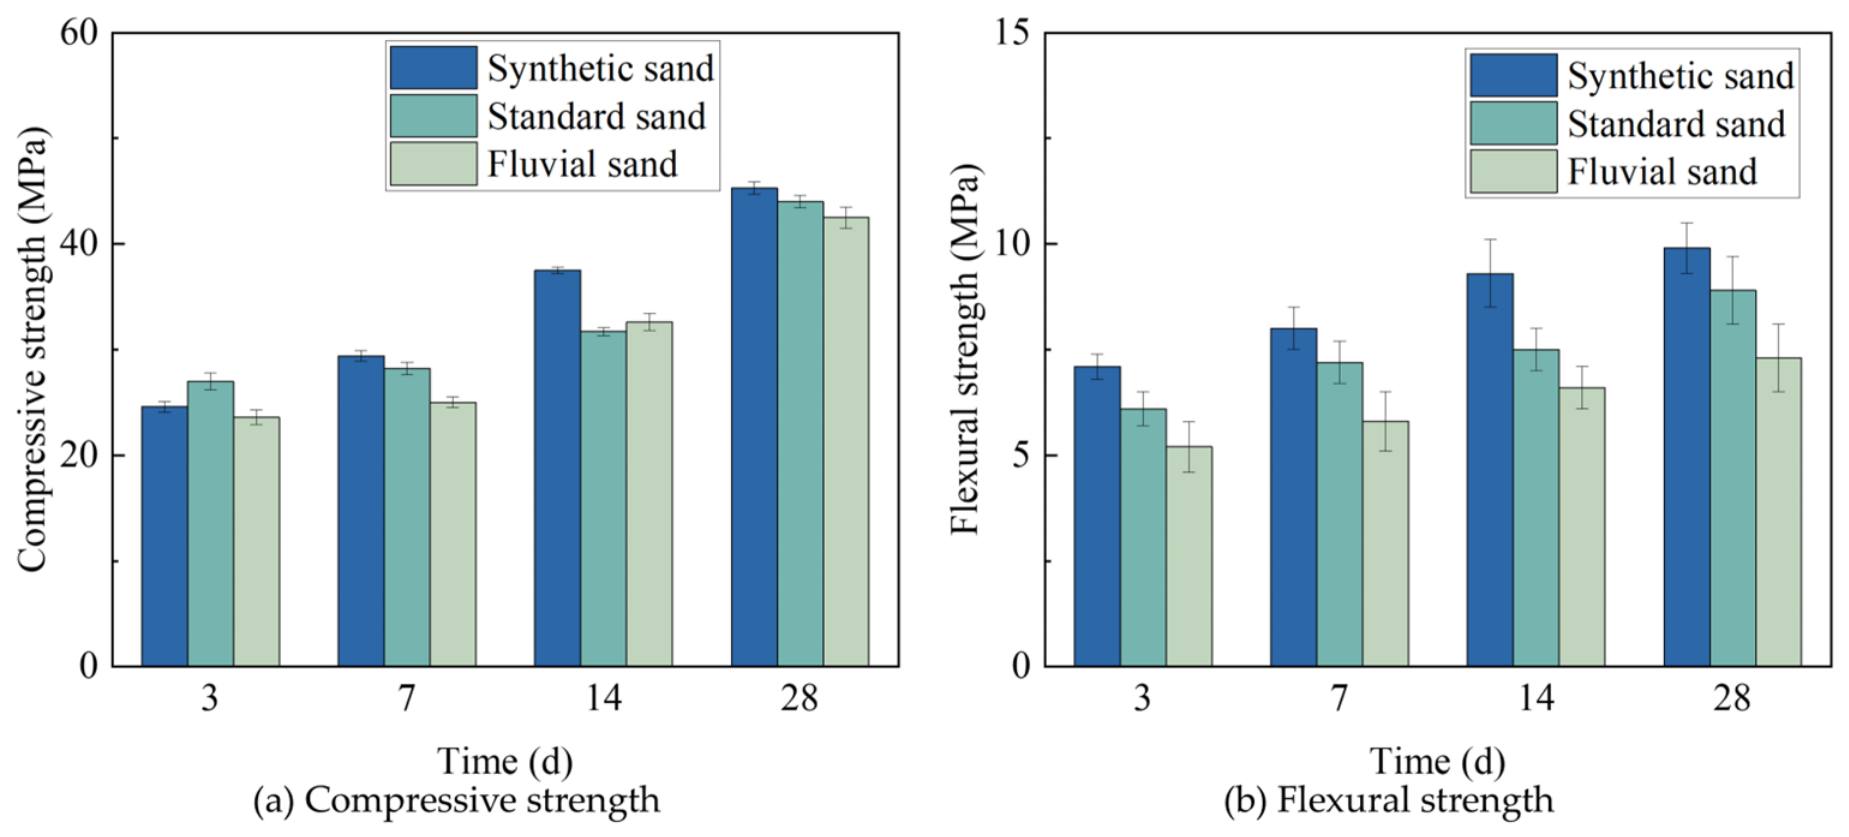
The compressive and flexural strengths of the three fine-aggregate mortars at different curing ages are presented in Figure 5. Overall, the strengths of all three mortars increased continuously with curing age, reflecting the ongoing formation of cement hydration products and the progressive densification of the mortar matrix and fine aggregate–cement paste interfaces. As shown in Figure 5a, at 3 d, the standard sand mortar exhibited the highest compressive strength of 27.0 ± 0.8 MPa, whereas the red mud-based synthetic sand and fluvial sand mortars achieved 24.6 ± 0.5 MPa and 23.6 ± 0.7 MPa, respectively. At 28 d, the compressive strength of the red mud-based synthetic sand mortar reached 45.3 ± 0.6 MPa, slightly exceeding those of the standard sand mortar (44.0 ± 0.6 MPa) and fluvial sand mortar (42.5 ± 1.0 MPa). This result indicates that the red mud-based synthetic sand mortar exhibited favorable strength development at intermediate and later curing ages. As shown in Figure 5b, the red mud-based synthetic sand mortar exhibited relatively high flexural strength at all curing ages. At 3 d, its flexural strength was 7.1 ± 0.3 MPa, compared with 6.1 ± 0.4 MPa and 5.2 ± 0.6 MPa for the standard sand and fluvial sand mortars, respectively. At 28 d, its flexural strength reached 9.9 ± 0.6 MPa, compared with 8.9 ± 0.8 MPa for the standard sand mortar and 7.3 ± 0.8 MPa for the fluvial sand mortar. Based on the mean strengths, the corresponding increases were approximately 11.2% and 35.6%, respectively. These results suggest that red mud-based synthetic sand has potential as an alternative fine aggregate for mortar under the investigated mix and curing conditions.
Figure 5.
Strengths of mortar specimens containing different types of sand.
3.2. Interfacial Microstructure and Bonding Mechanism Between Fine Aggregates and Cement Paste
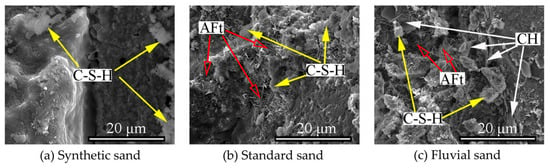
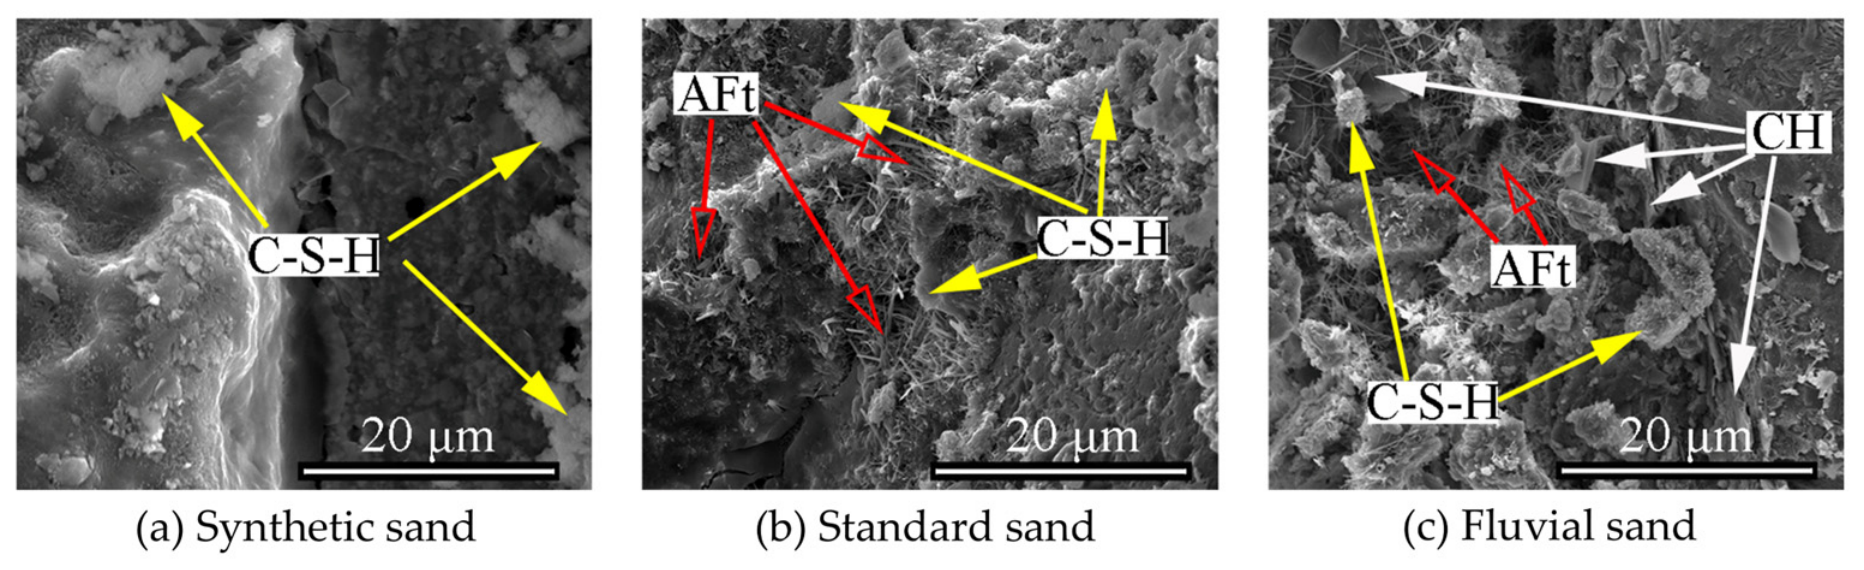
The interfacial microstructures of the three fine-aggregate mortars after 28 d of curing are shown in Figure 6. In Figure 6a, abundant flocculent products morphologically consistent with C–S–H gel are observed at the red mud-based synthetic sand–cement paste interface, which appears relatively continuous and dense. In Figure 6b, the standard sand interface contains flocculent products consistent with C–S–H gel and needle-like crystals suggestive of AFt, although some local pores remain visible. In Figure 6c, the fluvial sand interface contains similar flocculent and needle-like features, together with plate-like crystals suggestive of CH. The interfacial products are relatively loosely distributed, and the interface appears less compact. These phase assignments are tentative and based solely on SEM morphology.
Figure 6.
SEM morphologies of the interfaces between the fine aggregates and cement paste.
The formation of the interfacial transition zone between fine aggregates and cement paste is governed by the combined effects of local bleeding, the wall effect, and ion migration and precipitation [31,32]. Sand particles hinder the migration of water and cement particles, which can lead to water accumulation and a nonuniform distribution of cement particles near the aggregate surface, thereby increasing interfacial porosity [33,34,35,36]. Meanwhile, ions such as Ca2+, SO42−, and OH− in the pore solution migrate toward the interfacial region, where hydration products such as C–S–H, AFt, and CH gradually form [37,38,39].
All three mortars were prepared with a nominal water-to-cement ratio of 0.50. The saturated surface-dry water absorption of the red mud-based synthetic sand was 6.1%, considerably higher than those of the standard sand (2.1%) and fluvial sand (2.6%). Because the fine aggregates were used without prewetting or additional water compensation. The higher absorption of synthetic sand may have affected effective water availability and contributed to the observed strength differences. However, this contribution cannot be quantified from saturated absorption values alone or separated from the effects of aggregate surface characteristics using the available data. In addition, its rough and porous surface allowed the cement paste to penetrate surface pores and depressions, forming an embedded bonding structure that enhanced interfacial compactness and mechanical interlocking [40,41].
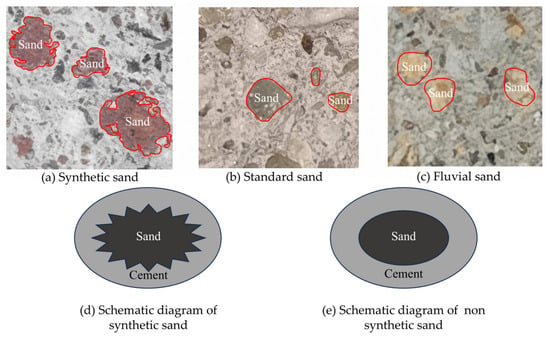
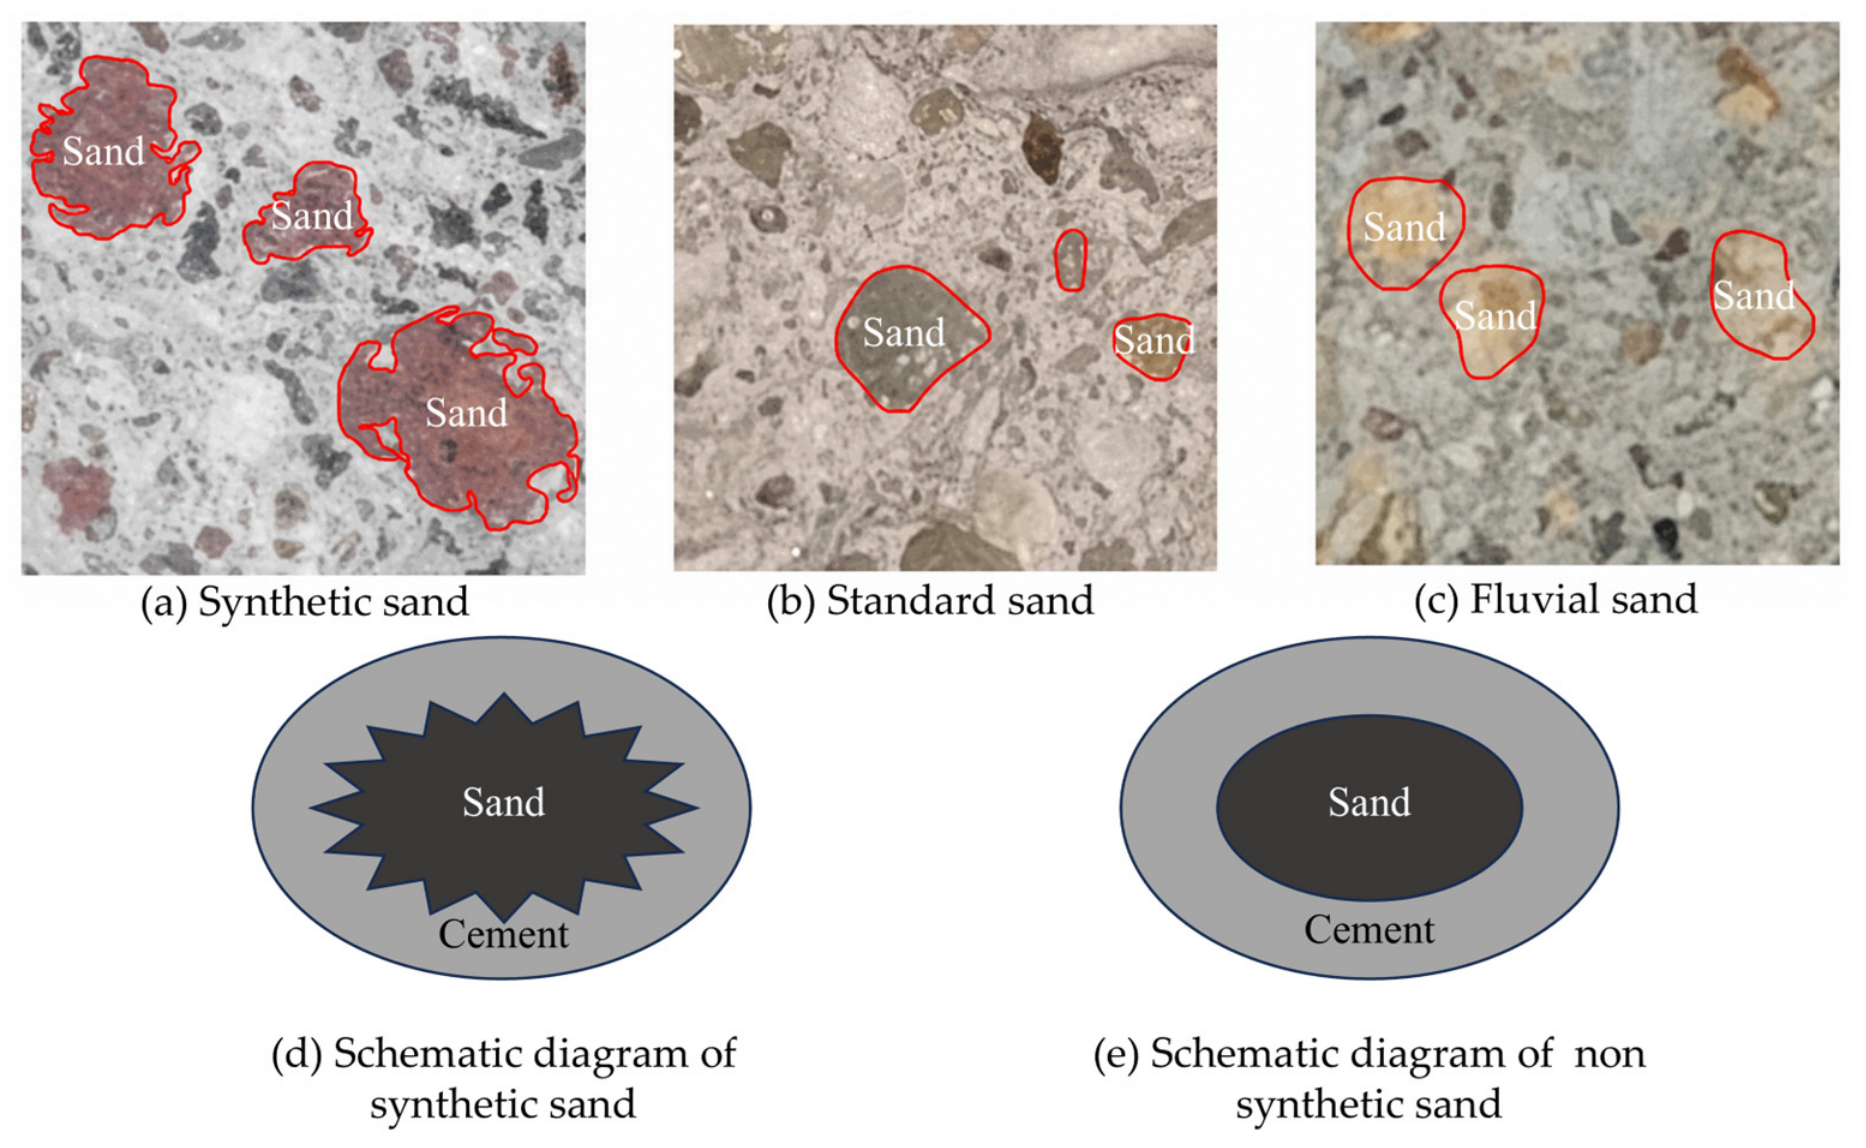
The physical morphologies and simplified models of the interfaces between the three fine aggregates and cement paste are shown in Figure 7. As shown in Figure 7a, the interface between the red mud-based synthetic sand and cement paste exhibits a tortuous profile, with the paste penetrating the surface pores of the synthetic sand to form an interlocking nested structure. In contrast, the standard sand and fluvial sand shown in Figure 7b,c have relatively smooth surfaces, resulting in comparatively flat interfacial profiles with the cement paste. Based on the observed interfacial morphologies, the interfaces are conceptually represented as the nested synthetic-sand interface in Figure 7d and the smoother conventional-sand interface in Figure 7e. Dang et al. [40] investigated the influence of pore structure and morphology of clay-brick-derived recycled fine aggregates on concrete mechanical properties. In the present study, the relatively high flexural strength of synthetic-sand mortar coincided with a compact and irregular aggregate–paste interface. The tortuous interfacial profile may promote mechanical interlocking, which could contribute to improved interfacial bonding and load transfer, providing a possible explanation for the relatively high 28 d flexural and compressive strengths of the synthetic sand mortar.
Figure 7.
Interfacial morphologies and bonding models between the fine aggregates and cement paste.
3.3. Analysis of Freeze–Thaw Performance
The mass and strength loss rates of the three fine-aggregate mortars after 25 freeze–thaw cycles are presented in Table 3. The mass loss rates of all three groups were relatively low, ranging from 0.2% to 0.4%, with only minor differences among the groups. This indicates that no pronounced surface scaling or material spalling occurred after freeze–thaw cycling. The red mud-based synthetic sand mortar exhibited the lowest mass loss rate of only 0.2%, whereas those of the standard sand and fluvial sand mortars were 0.4% and 0.3%, respectively.
Table 3.
Mass and strength loss rates of the fine-aggregate mortars after freeze–thaw cycling.
After 25 freeze–thaw cycles, the synthetic sand mortar exhibited compressive and flexural strength losses of 6.1% and 8.6%, respectively, compared with 13.9% and 23.6% for standard sand mortar and 10.1% and 17.5% for fluvial sand mortar. Relative to standard sand mortar, these represent reductions of approximately 56.1% and 63.6% in the respective loss rates. Although the mass losses of all three mortars remained within 0.2–0.4%, their strength losses ranged from 6.1% to 23.6%. This difference suggests that limited surface material loss does not necessarily indicate negligible internal deterioration, highlighting the importance of strength measurements in assessing freeze–thaw damage. For comparison, Jierula et al. [12] reported a 49.42% reduction in compressive strength after 30 freeze–thaw cycles for concrete made entirely with recycled aggregates. The synthetic-sand mortar investigated here showed a lower numerical loss of 6.1% after 25 cycles, measured against its same-age water-cured control.
During freeze–thaw cycling, the expansive pressure generated by the repeated freezing and thawing of pore water promotes the initiation and propagation of interfacial microcracks. Combined with the preceding SEM observations, the rough and porous surface of the synthetic sand enabled the formation of a nested structure with the cement paste, thereby enhancing mechanical interlocking at the interface. Furthermore, its relatively dense interfacial region helped suppress the propagation of freeze–thaw-induced cracks. Therefore, despite its relatively high water absorption, the red mud-based synthetic sand mortar exhibited low mass and strength losses after 25 freeze–thaw cycles, indicating that strong interfacial bonding can effectively mitigate freeze–thaw damage.
3.4. Preparation of Specimens for DIC Testing
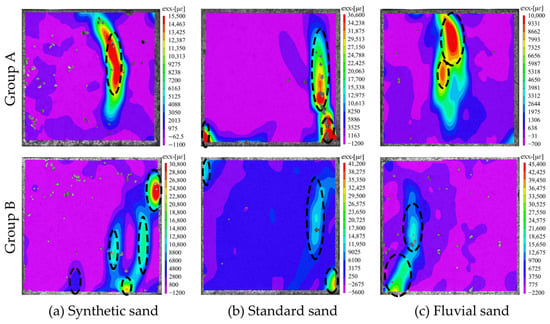
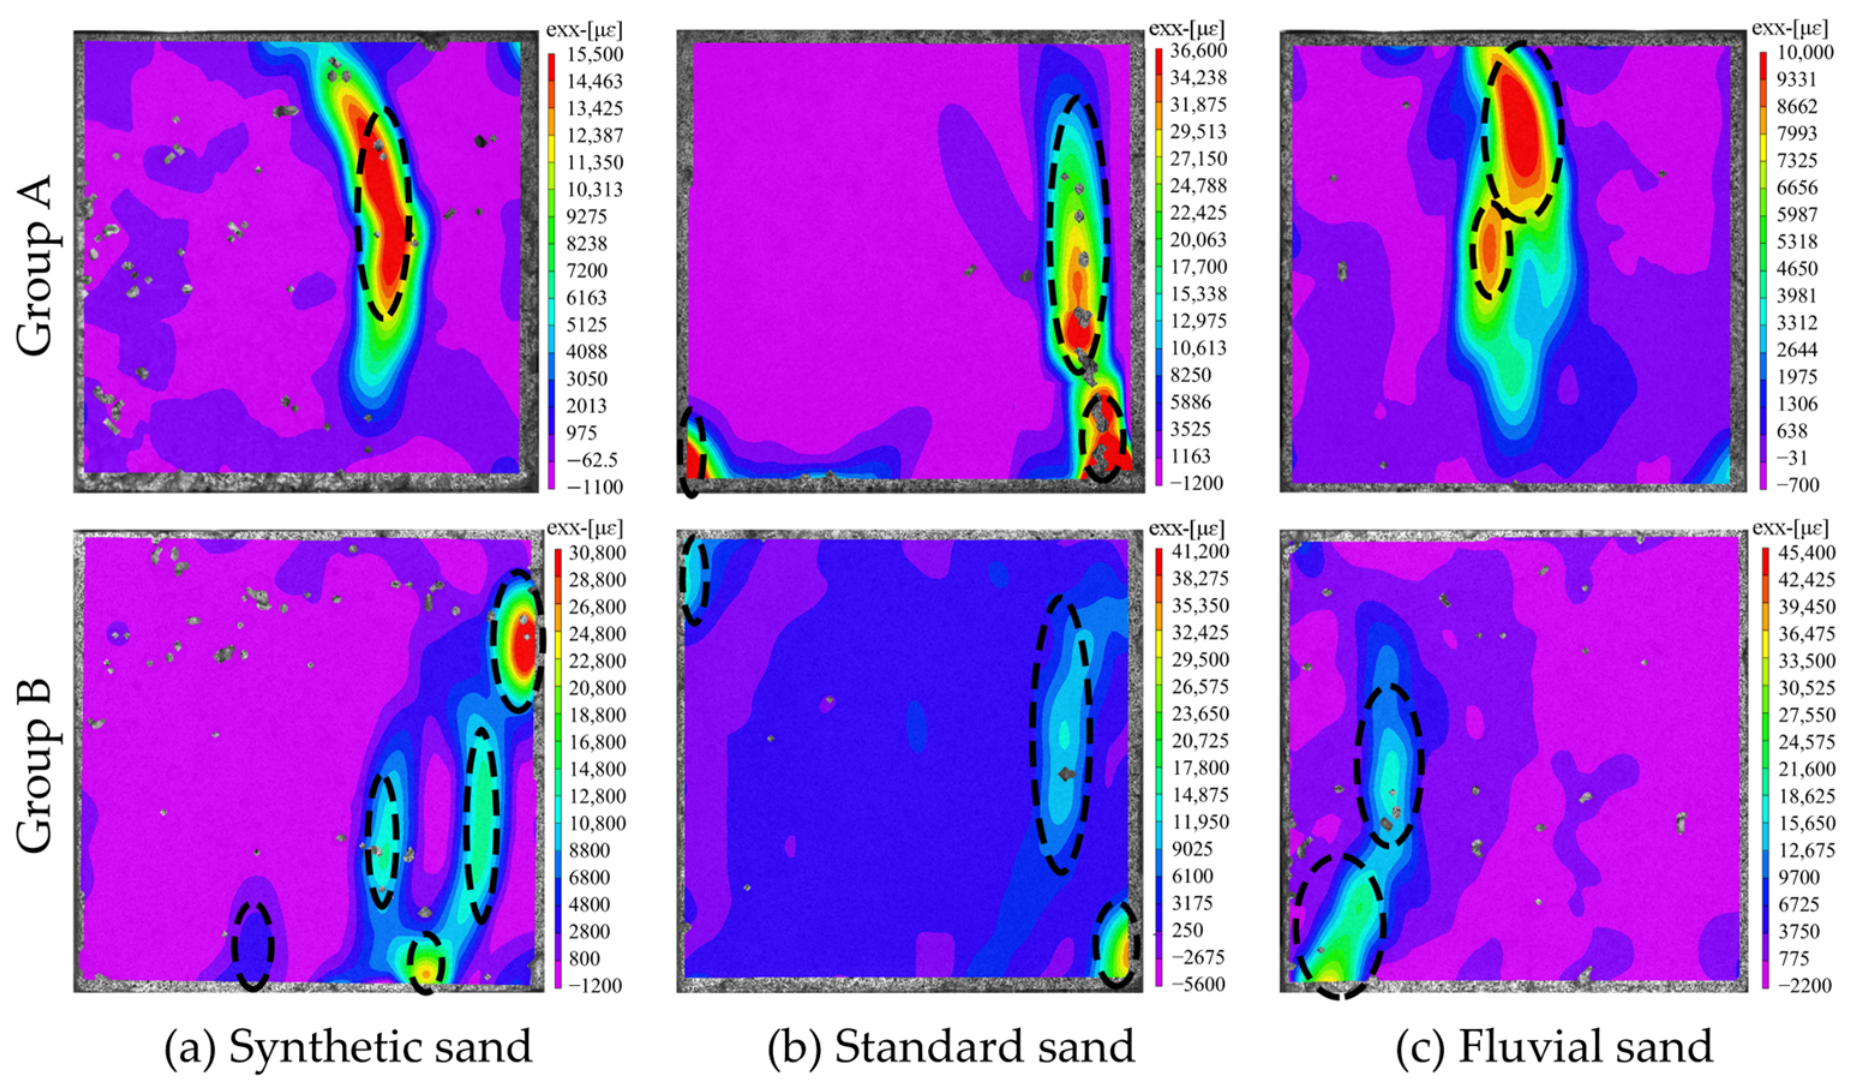
Figure 8 presents the full-field strain distributions in the X-direction for the Group A and Group B specimens at the final loading stage. For the red mud-based synthetic sand specimens, the strain in the high-strain region of Group A ranged from 4088 to 15,500 με, lower than the range of 8800–30,800 με observed in Group B. For the standard sand specimens, the corresponding strain ranges were 10,613–36,600 με for Group A and 11,950–41,200 με for Group B. For the fluvial sand specimens, the strain range of Group A was 2644–10,000 με, substantially lower than that of Group B (12,675–45,400 με). Overall, both the transverse tensile strain and the degree of strain localization increased after freeze–thaw cycling, with the fluvial sand specimens exhibiting the most pronounced changes.
Figure 8.
Final full-field strain distributions in the X-direction of the specimens.
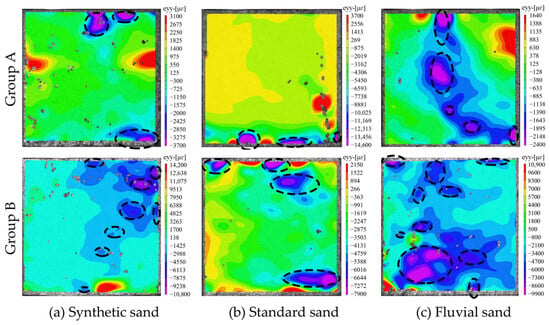
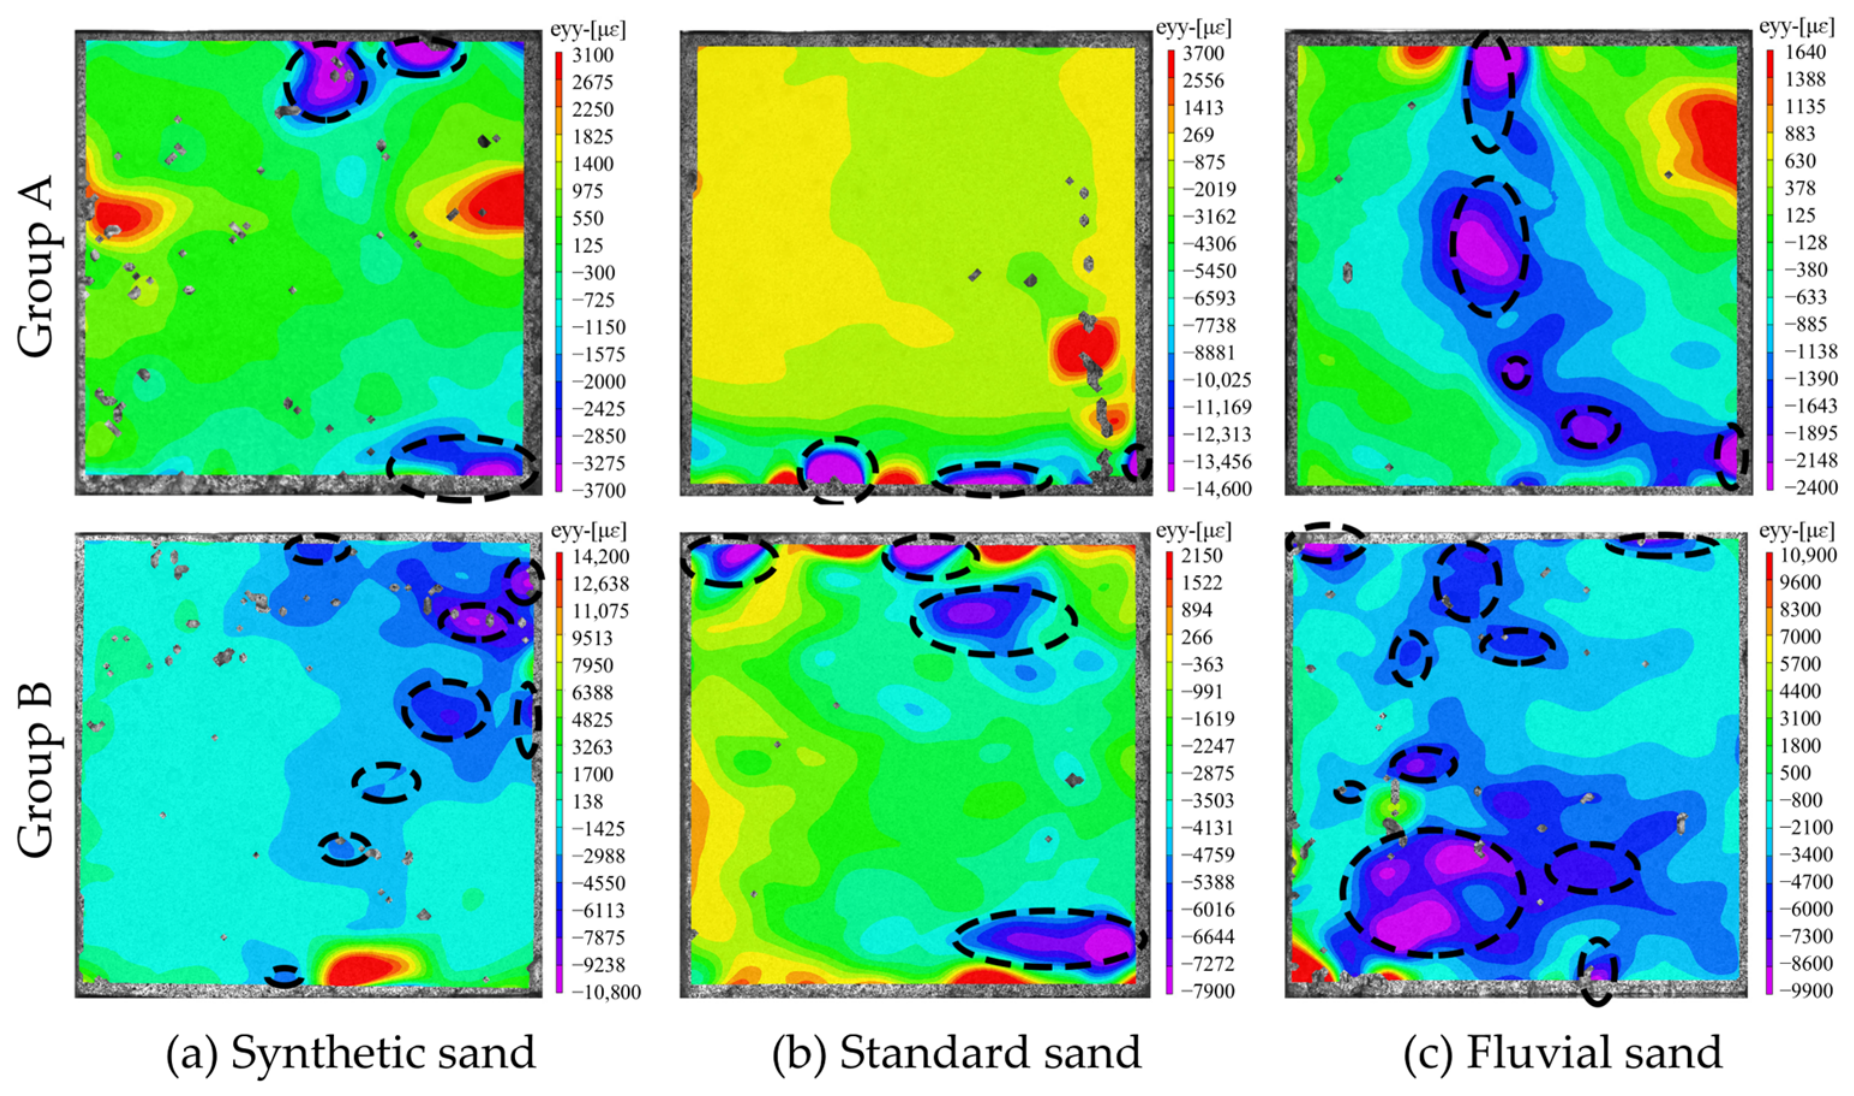
Figure 9 presents the full-field strain distributions in the Y-direction for the two groups of specimens. For the red mud-based synthetic sand specimens, the strain in the high-strain region of Group A ranged from −3700 to −2000 με, with a lower absolute magnitude than the range of −10,800 to −4550 με observed in Group B. For the fluvial sand specimens, the corresponding strain range of Group A was −2400 to −1138 με, likewise substantially lower in magnitude than that of Group B (−9900 to −4700 με). For the standard sand specimens, the absolute strain in the local high-strain region of Group A exceeded that of Group B, although this region was relatively limited in extent. Considering the primary strain region outside the elliptically marked area, the strain ranges were −3162 to −875 με for Group A and −3503 to −991 με for Group B. These results indicate that the overall longitudinal compressive strain still increased after freeze–thaw cycling.
Figure 9.
Final full-field strain distributions in the Y-direction of the specimens.
To facilitate numerical comparison, Table 4 summarizes the regional strain ranges described above for each mortar and exposure condition at the final loading stage.
Table 4.
Reported regional strain ranges at the final loading stage.
Taken together, Figure 8 and Figure 9 and Table 4 show that the strain distributions in the unfrozen Group A specimens were relatively uniform, whereas both the absolute strain magnitude and degree of strain localization generally increased in the freeze–thaw-exposed Group B specimens. This behavior may be associated with the development of internal pores and interfacial microcracks during freeze–thaw cycling, contributing to increased deformation heterogeneity. These observations are consistent with the strength degradation measured after freeze–thaw cycling.
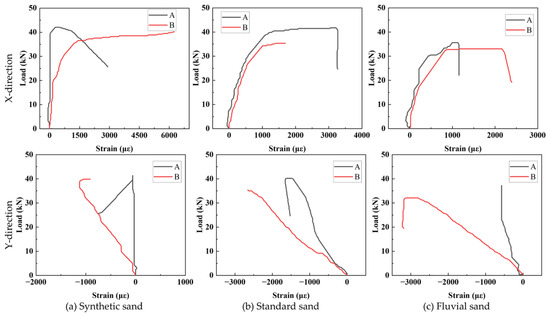
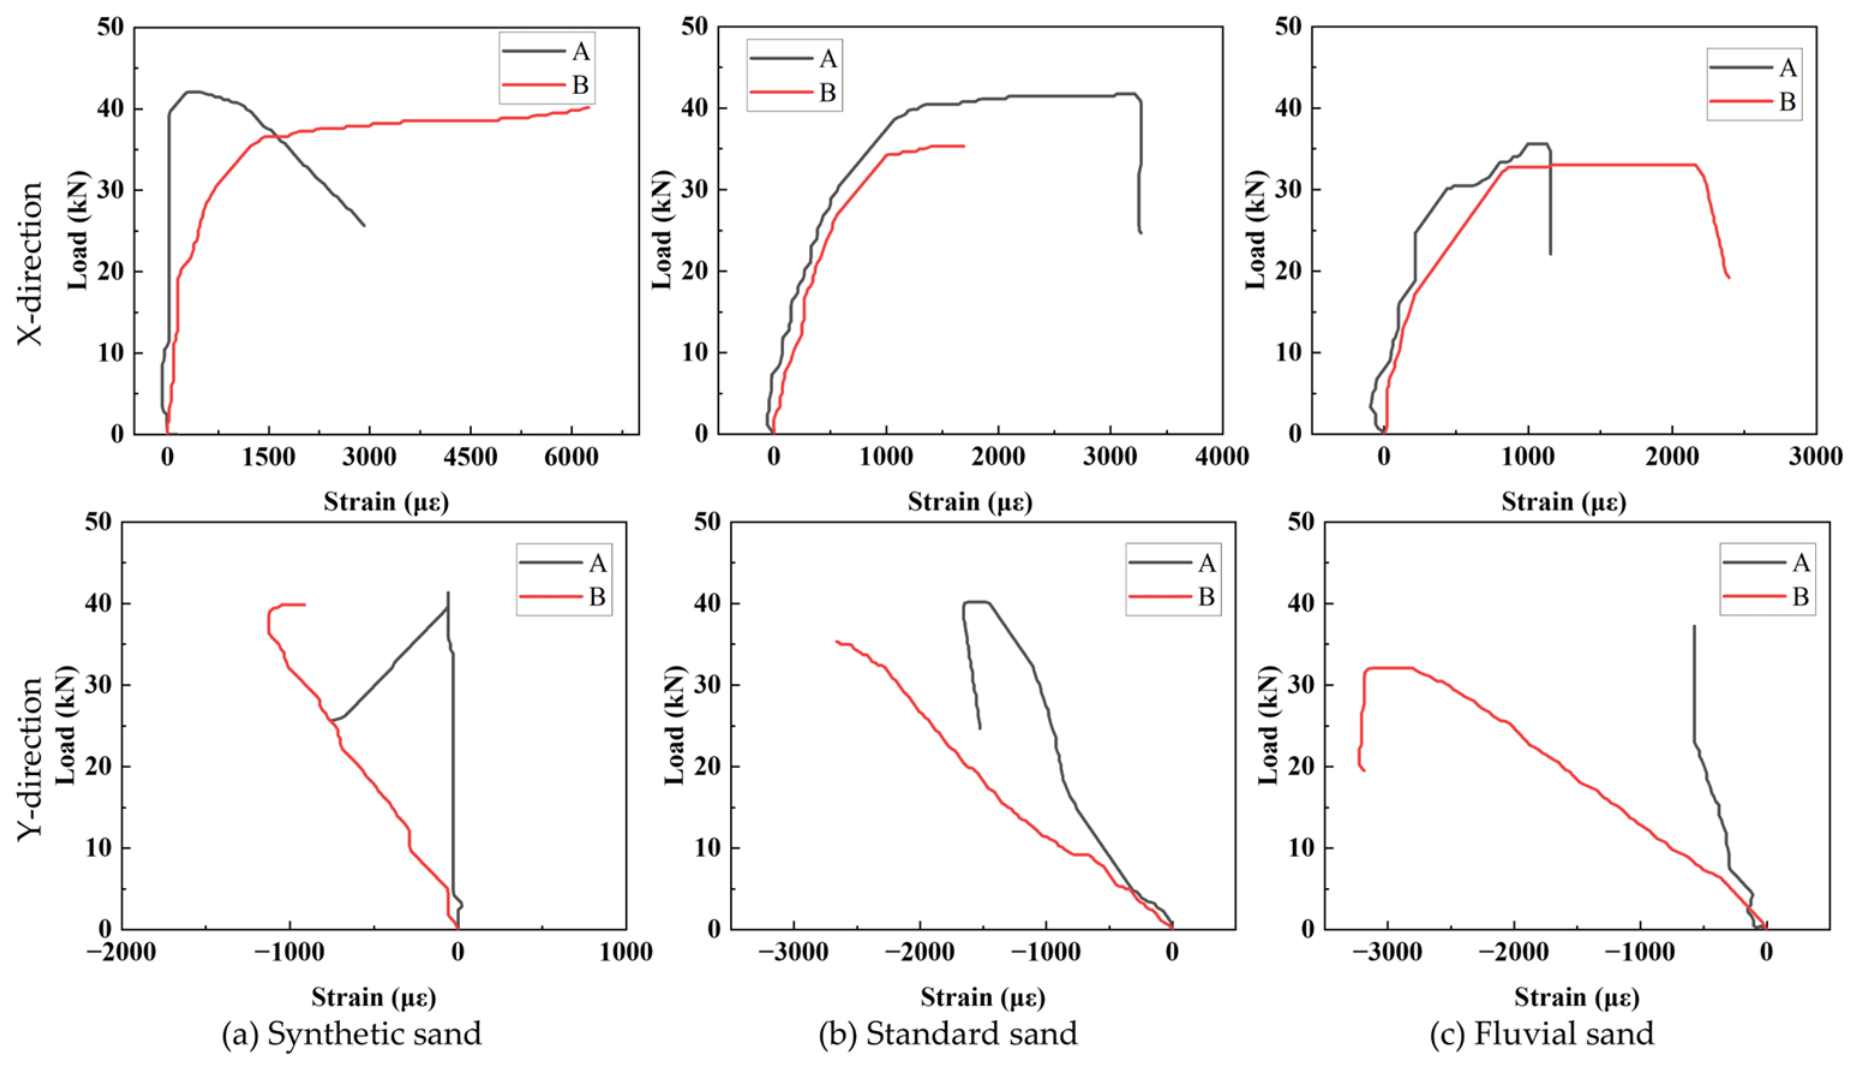
To further evaluate the overall deformation characteristics of the specimens, Figure 10 presents the average load–strain curves in the X- and Y-directions within the DIC monitoring region. The X-direction strain of the unfrozen red mud-based synthetic sand specimen in Group A changed only slightly during loading. No distinct nonlinear deformation stage occurred before failure, indicating a relatively abrupt failure mode. After freeze–thaw cycling, the Group B curve initially exhibited an approximately linear response, followed by a distinct turning point, after which the strain continued to increase with increasing load, indicating the progressive accumulation of internal damage. The initial slopes of the curves for the standard sand specimens in Groups A and B were relatively similar. However, the Group B specimen reached the turning point earlier, indicating that freeze–thaw exposure caused the specimen to enter the nonlinear damage stage at an earlier loading level. The Group A fluvial sand specimen exhibited a distinct turning point, with an approximately linear response both before and after this point. For Group B, the initial slope decreased, while the strain continued to increase during the later loading stage, indicating that freeze–thaw cycling increased its transverse deformability and promoted damage development. In the Y-direction, the absolute compressive strains of the freeze–thaw-exposed Group B specimens were generally greater than those of the unfrozen Group A specimens for all three mortars. Under the same applied load, Group B exhibited greater longitudinal compressive deformation than the corresponding Group A controls.
Figure 10.
Load–strain curves of the specimens in the X- and Y-directions.
The above results suggest that the development of internal pores and interfacial microcracks during freeze–thaw cycling may weaken the restraining effects of the cementitious matrix and the fine aggregate–cement paste interface, contributing to strength loss and increased deformation. The unfrozen red mud-based synthetic sand specimens exhibited relatively dense interfaces and strong mechanical interlocking, resulting in a high load-bearing capacity but a comparatively abrupt failure process. After freeze–thaw cycling, interfacial damage produced a more pronounced nonlinear deformation stage and reduced the characteristics of brittle failure.
3.5. Interfacial Morphology and Damage Mechanism Before and After Freeze–Thaw Cycling
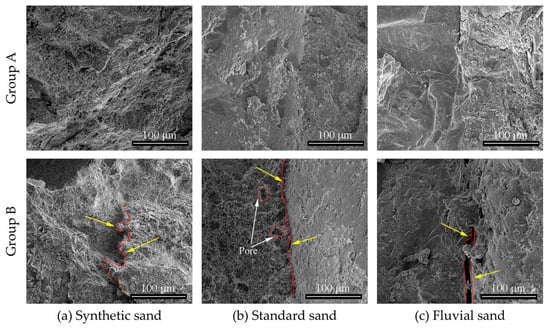
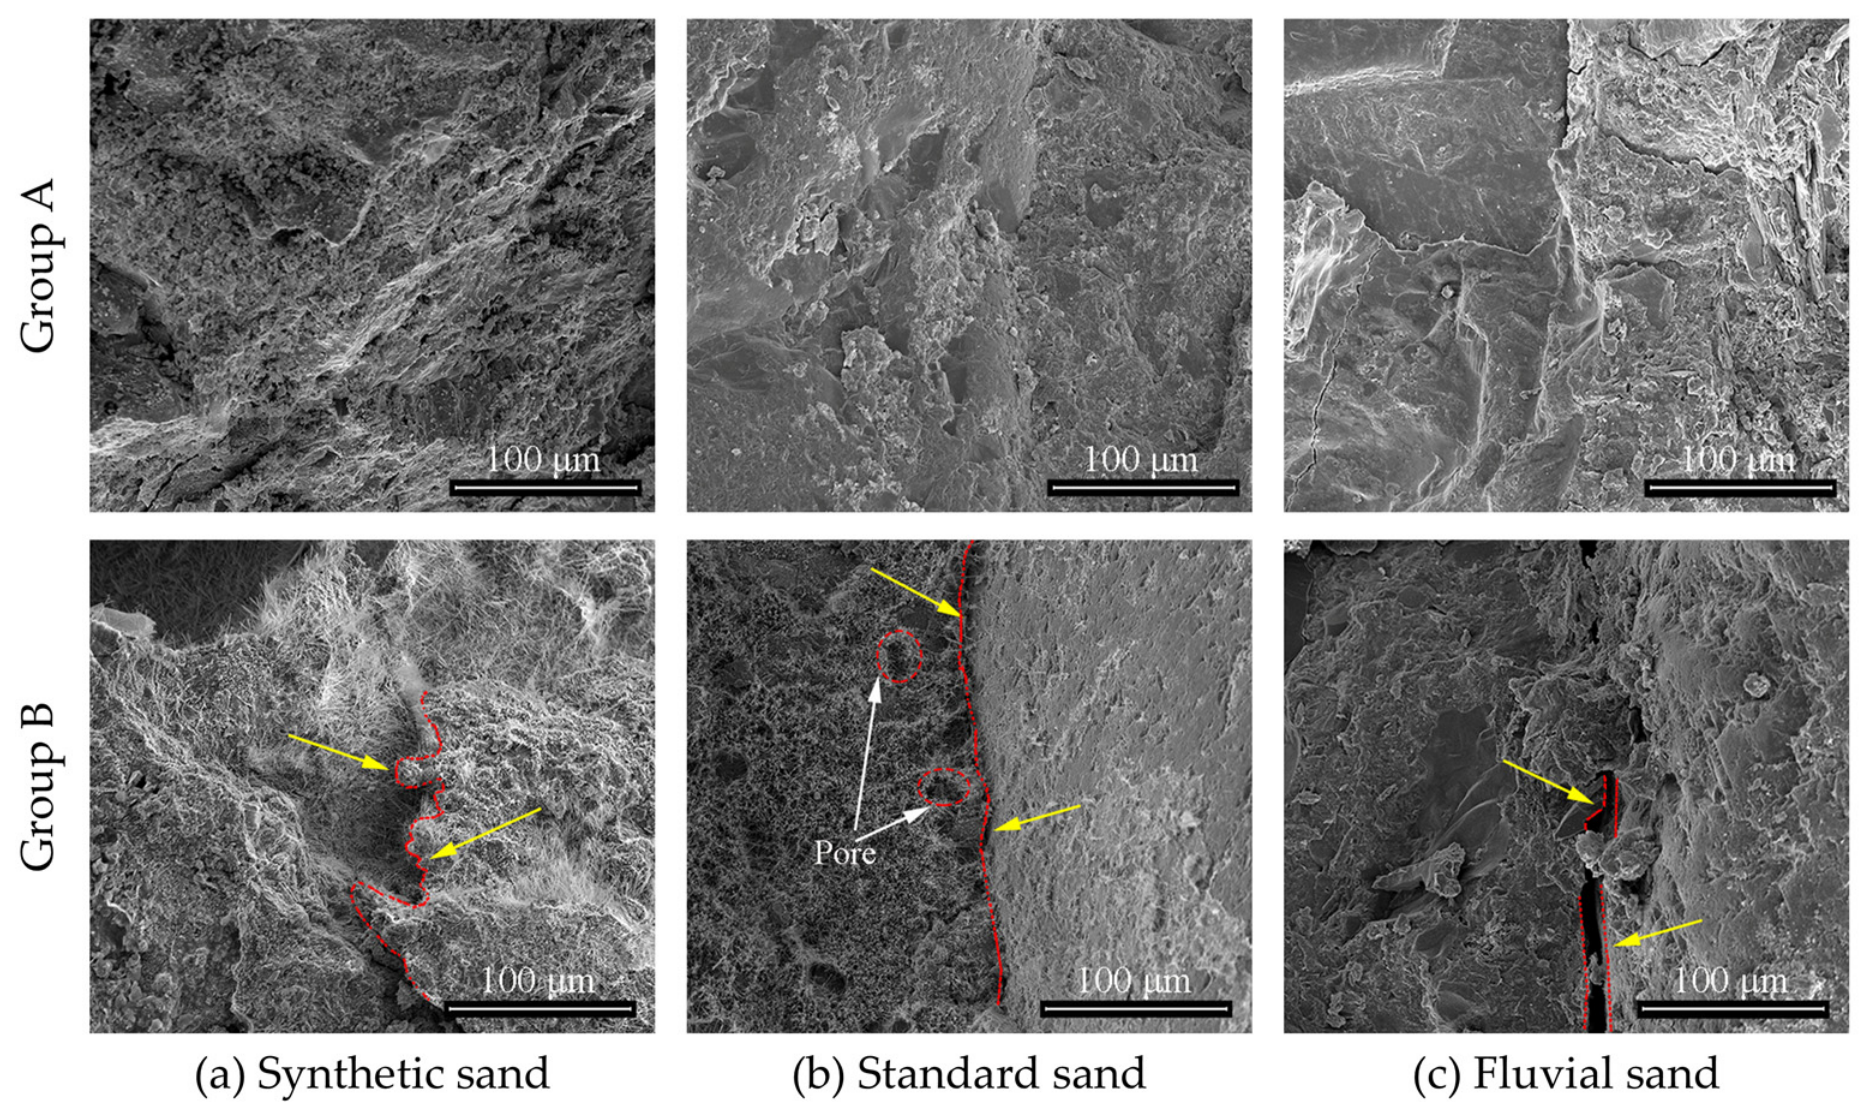
Figure 11 presents the interfacial morphologies between the different fine aggregates and cement paste before and after freeze–thaw cycling. In the unfrozen Group A specimens, all three fine aggregates were relatively tightly bonded to the cement paste, and the interfacial boundaries were indistinct. After freeze–thaw cycling, the interfacial profiles in Group B became more clearly defined. A small number of fine pores appeared between the red mud-based synthetic sand and cement paste; distinct voids were observed on the cement paste side near the standard sand interface; and a pronounced interfacial gap formed between the fluvial sand and cement paste. These observations indicate that freeze–thaw cycling caused varying degrees of deterioration at the fine aggregate–cement paste interfaces.
Figure 11.
Interfacial morphologies between the three fine aggregates and cement paste before and after freeze–thaw cycling.
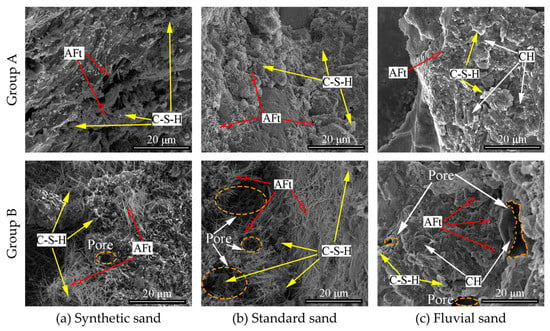
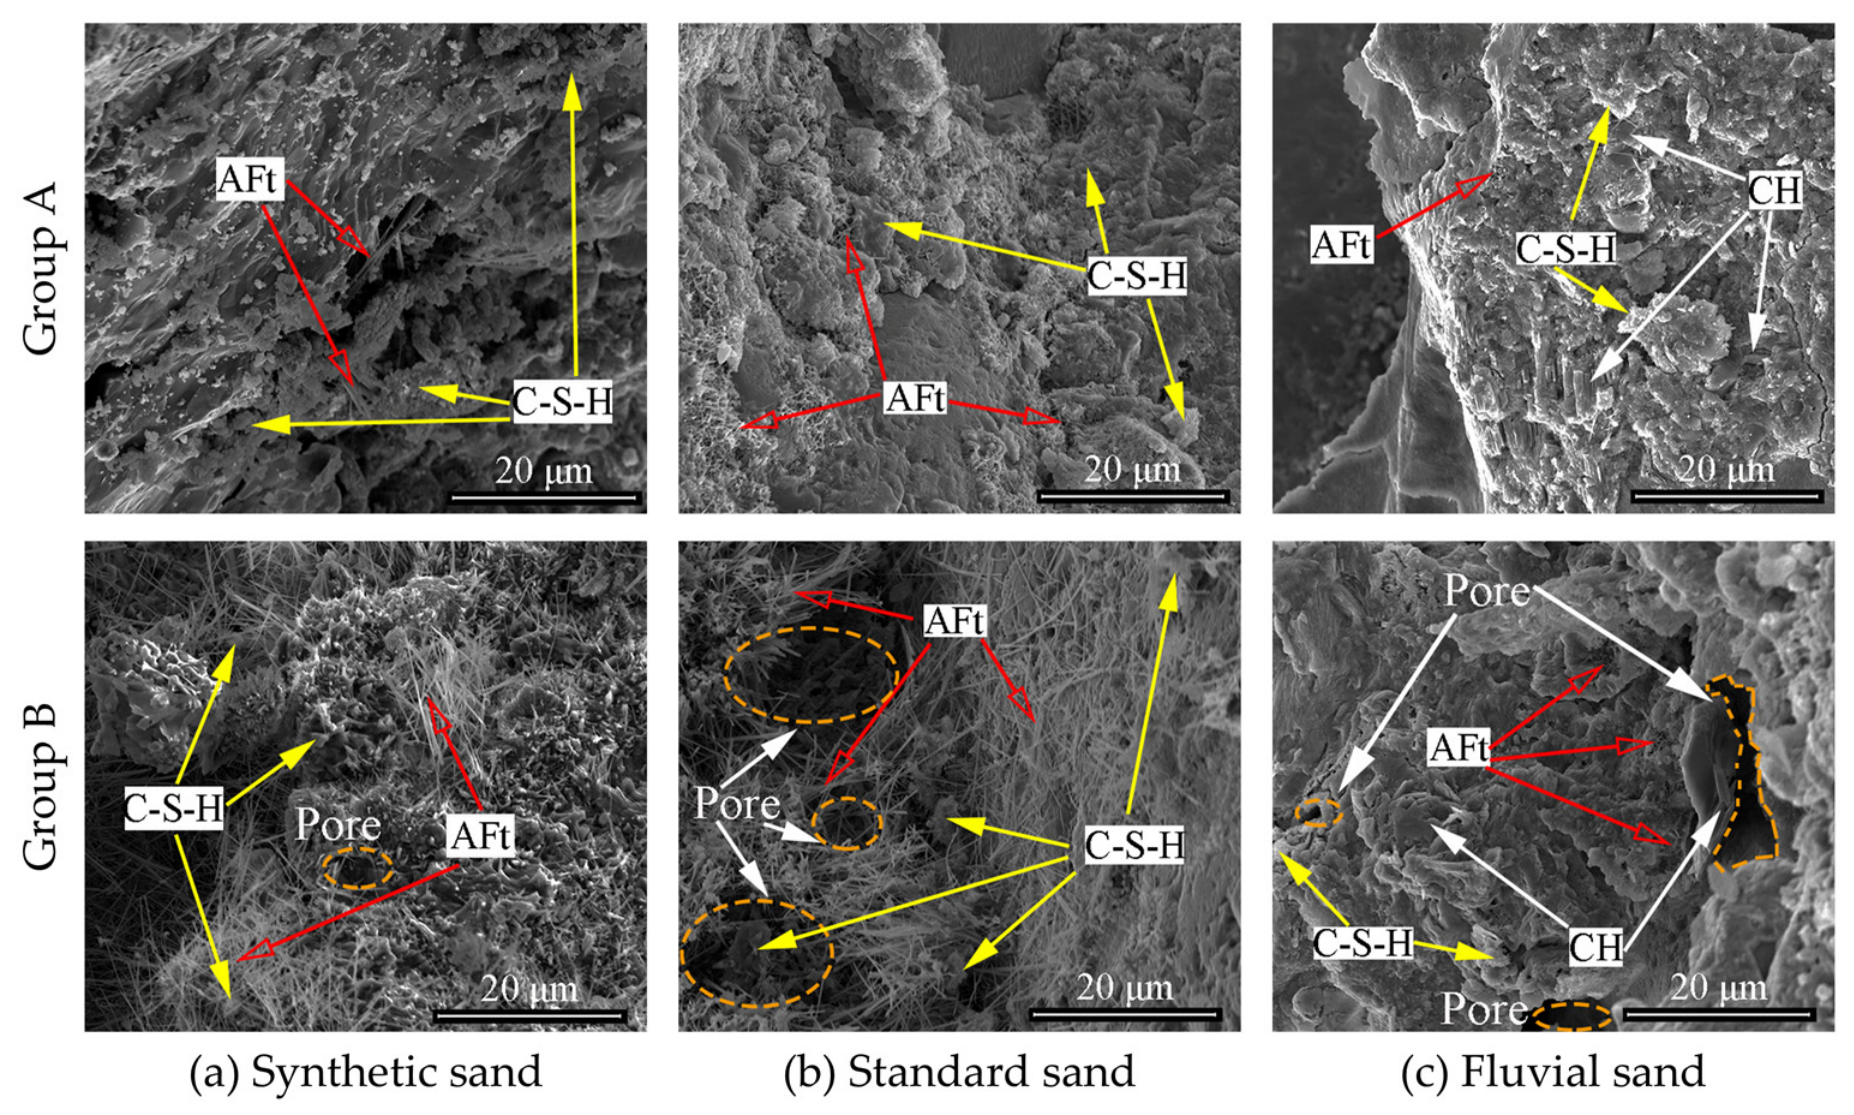
Higher-magnification SEM images of the interfaces are presented in Figure 12. The Group A synthetic sand interface appears relatively dense, with flocculent products morphologically consistent with C–S–H gel and a small number of needle- and rod-shaped crystals. In Group B, more needle-like crystals and several micropores are visible. The Group A ISO standard sand interface contains flocculent products consistent with C–S–H gel and needle-like crystals suggestive of AFt. The Group B interface appears less compact, with relatively large pores remaining between the needle-like crystals despite partial filling by flocculent products. The Group A river sand interface appears relatively intact, whereas Group B exhibits pores of various sizes and flocculent, needle-like, and plate-like products morphologically consistent with C–S–H gel, AFt, and CH, respectively. Overall, the observed interfacial deterioration is more pronounced in the standard sand and fluvial sand specimens than in the synthetic sand specimens.
Figure 12.
SEM morphologies of the interfaces between the three fine aggregates and cement paste before and after freeze–thaw cycling.
Freeze–thaw damage is primarily associated with the hydrostatic, osmotic, and crystallization pressures generated by the freezing of pore water [42,43,44]. Before freeze–thaw cycling, the specimens were immersed in water, allowing the internal capillary and interfacial pores to absorb water and gradually reach a relatively high degree of saturation. During freezing, pore water transforms into ice and undergoes an approximately 9% volumetric expansion, exerting expansive pressure on the pore walls and fine aggregate–cement paste interfaces [45,46]. Although this pressure is released during thawing, the resulting microcracks cannot fully close. With repeated freeze–thaw cycling, water continuously penetrates the newly formed cracks, promoting pore enlargement and interfacial crack propagation and ultimately reducing interfacial bonding capacity and specimen strength [47,48,49].
The rough and porous surface of the red mud-based synthetic sand enabled the formation of a nested structure with the cement paste, thereby enhancing mechanical interlocking at the interface. When the synthetic sand was neither prewetted nor provided with additional compensation water during mixing, its relatively high water absorption also reduced the free-water content and local bleeding near the interface to some extent, thereby decreasing the initial interfacial porosity. Consequently, the synthetic sand specimens retained relatively good interfacial integrity after freeze–thaw cycling, and their compressive- and flexural-strength loss rates were lower than those of the standard sand and fluvial sand specimens. These microscopic observations are consistent with the strength losses reported in Table 3 and the DIC strain analyses in Figure 9 and Figure 10, indicating that a dense interface and nested structure can retard the development of freeze–thaw damage to some extent.
4. Conclusions
This study systematically compared the strength development and freeze–thaw resistance of red mud-based synthetic sand, standard sand, and fluvial sand mortars through mechanical testing, freeze–thaw cycling, DIC full-field strain measurements, and interfacial SEM analysis. The effects of the surface structure and interfacial bonding characteristics of the synthetic sand on mortar mechanical properties and freeze–thaw damage were investigated. The main conclusions are as follows:
- The strengths of all three mortars increased with curing age. At 28 d, the compressive strength of the synthetic sand mortar was 45.3 MPa, comparable to that of the standard sand mortar (44.0 MPa) and slightly higher than that of the fluvial sand mortar (42.5 MPa). Its flexural strength reached 9.9 MPa, representing increases of 10.1% and 26.3% over the standard sand and fluvial sand mortars, respectively.
- After 25 freeze–thaw cycles, the mass loss rates of the synthetic sand, standard sand, and fluvial sand mortars were 0.2%, 0.4%, and 0.3%, respectively. All values were below 5%, with only minor differences among the groups. The compressive- and flexural-strength loss rates of the synthetic sand mortar were 6.1% and 8.6%, respectively, lower than those of the standard sand mortar (13.9% and 23.6%) and fluvial sand mortar (10.1% and 17.5%). These results demonstrate the favorable freeze–thaw resistance of the synthetic sand mortar.
- The DIC results showed that both the global strain and degree of strain localization increased after freeze–thaw cycling. The freeze–thaw-exposed specimens generally exhibited greater strain at the same applied load and earlier turning points in their load–strain curves, suggesting increased deformation and an earlier onset of nonlinear behavior. The unfrozen synthetic sand specimens exhibited limited nonlinear deformation before failure and failed relatively abruptly. After freeze–thaw cycling, the nonlinear deformation stage became more pronounced and the characteristics of brittle failure were reduced, although the load-bearing capacity decreased.
- SEM observations showed that pores and gaps of varying degrees developed at the fine aggregate–cement paste interfaces of all three mortars after freeze–thaw cycling, with the synthetic sand interface exhibiting less deterioration. The nested structure and relatively dense interface formed by the synthetic sand enhanced mechanical interlocking and suppressed freeze–thaw-induced crack propagation to some extent. Needle-like crystals appeared more prevalent in the examined interfacial regions after freeze–thaw cycling. Their morphology was suggestive of AFt, although this assignment remains tentative.
This study provides experimental evidence for the mechanical performance and freeze–thaw response of red mud-based synthetic sand mortar under the selected mixture proportions and laboratory exposure conditions. Although the observed performance supports the potential use of red mud-based synthetic sand as a fine aggregate, extrapolation to long-term durability and field performance requires validation across a broader range of mixture proportions, exposure durations, and service environments.
Author Contributions
Conceptualization, K.H. and C.G.; data curation, K.H.; formal analysis, K.H. and C.G.; funding acquisition, K.H.; investigation, C.G.; methodology, K.H. and C.G.; project administration, K.H.; resources, K.H.; Software, K.H. and C.G.; supervision, K.H. and C.G.; validation, K.H. and C.G.; visualization, K.H. and C.G.; writing—original draft, K.H. and C.G.; writing—review and editing, K.H. and C.G. All authors have read and agreed to the published version of the manuscript.
Funding
This research was funded by the Doctoral Research Startup Funding Project of JiangXi Polytechnic University, grant number JZBK25-2-7.
Data Availability Statement
The raw data supporting the conclusions of this article will be made available by the authors on request.
Conflicts of Interest
The authors declare no conflicts of interest.
References
- Wang, R.; Hu, Z.; Li, Y.; Wang, K.; Zhang, H. Review on the deterioration and approaches to enhance the durability of concrete in the freeze–thaw environment. Constr. Build. Mater. 2022, 321, 126371. [Google Scholar] [CrossRef] [Scilit]
- Su, A.; Chen, T.; Gao, X.; Li, Q.; Qin, L. Effect of carbonation curing on durability of cement mortar incorporating carbonated fly ash subjected to freeze–thaw and sulfate attack. Constr. Build. Mater. 2022, 341, 127920. [Google Scholar] [CrossRef] [Scilit]
- Huang, Y.; Shao, C.; Yu, Z.; Wei, H.; Li, Z.; Zhu, Z. Study of freeze–thaw deterioration of saturated and unsaturated hydraulic concrete based on measured strain. J. Build. Eng. 2024, 97, 110771. [Google Scholar] [CrossRef] [Scilit]
- Huang, S.; Yu, S.; Ye, Y.; Ye, Z.; Cheng, A. Pore structure change and physico-mechanical properties deterioration of sandstone suffering freeze–thaw actions. Constr. Build. Mater. 2022, 330, 127200. [Google Scholar] [CrossRef] [Scilit]
- Lu, Y.; Li, X.; Han, Y.; Wu, J. Mechanical properties of rock samples with a single natural weak plane after freeze–thaw action. Cold Reg. Sci. Technol. 2021, 181, 103179. [Google Scholar] [CrossRef] [Scilit]
- Zhou, D.; Chen, D.; Yang, F.; Mei, J.; Yao, Y.; Deng, Y. Freeze–thaw damage analysis and life prediction of modified pervious concrete based on Weibull distribution. Case Stud. Constr. Mater. 2024, 20, e03305. [Google Scholar] [CrossRef] [Scilit]
- Yuan, C.; Qu, S.; Bai, W.; Guan, J.; Xie, Y. Study on the mechanical properties and mesoscopic damage mechanism of recycled aggregate concrete under different dynamic strain rates after freeze-thaw cycles. Case Stud. Constr. Mater. 2025, 22, e04182. [Google Scholar] [CrossRef] [Scilit]
- Dong, F.; Wang, H.; Yu, J.; Liu, K.; Guo, Z.; Duan, X.; Qiong, X. Effect of freeze–thaw cycling on mechanical properties of polyethylene fiber and steel fiber reinforced concrete. Constr. Build. Mater. 2021, 295, 123427. [Google Scholar] [CrossRef] [Scilit]
- Liu, X.; Yan, Z.; Wang, D.; Zhao, R.; Niu, D.; Wang, Y. Corrosion cracking behavior of reinforced concrete under freeze–thaw cycles. J. Build. Eng. 2023, 64, 105610. [Google Scholar] [CrossRef] [Scilit]
- Liu, M.; Lu, J.; Lou, B. Research on Kaiser effect of acoustic emission in concrete subjected to bending after freeze–thaw. J. Build. Eng. 2023, 78, 107713. [Google Scholar] [CrossRef] [Scilit]
- Luo, T.; Zhang, C.; Sun, C.; Zheng, X.; Ji, Y.; Yuan, X. Experimental investigation on the freeze–thaw resistance of steel fibers reinforced rubber concrete. Materials 2020, 13, 1260. [Google Scholar] [CrossRef] [Scilit]
- Jierula, A.; Wu, C.; Fu, Z.; Niyazi, H.; Li, H. Experimental study of recycled concrete under freeze–thaw conditions. Materials 2024, 17, 3934. [Google Scholar] [CrossRef] [Scilit]
- Sáez del Bosque, I.F.; Van den Heede, P.; De Belie, N.; Sánchez de Rojas, M.I.; Medina, C. Freeze–thaw resistance of concrete containing mixed aggregate and construction and demolition waste-additioned cement in water and de-icing salts. Constr. Build. Mater. 2020, 259, 119772. [Google Scholar] [CrossRef] [Scilit]
- Wu, B.; Li, Z. Mechanical properties of compound concrete containing demolished concrete lumps after freeze–thaw cycles. Constr. Build. Mater. 2017, 155, 187–199. [Google Scholar] [CrossRef] [Scilit]
- Cortes, D.D.; Kim, H.K.; Palomino, A.M.; Santamarina, J.C. Rheological and mechanical properties of mortars prepared with natural and manufactured sands. Cem. Concr. Res. 2008, 38, 1142–1147. [Google Scholar] [CrossRef] [Scilit]
- Wu, H.; Gao, Q. Study on freeze–thaw resistance of cement concrete with manufactured sand based on BP neural network. Buildings 2024, 14, 2952. [Google Scholar] [CrossRef] [Scilit]
- Tian, K.; Wang, Y.; Hong, S.; Zhang, J.; Hou, D.; Dong, B.; Xing, F. Alkali-activated artificial aggregates fabricated by red mud and fly ash: Performance and microstructure. Constr. Build. Mater. 2021, 281, 122552. [Google Scholar] [CrossRef] [Scilit]
- Zhao, Y.; Zhang, B.; He, F.; Meng, F.; Yang, S.; Wang, Q.; Zhu, W. Effects of dosage and type of GGBS on the mechanical properties of a hybrid red-mud geopolymer. J. Mater. Civ. Eng. 2023, 35, 04023008. [Google Scholar] [CrossRef] [Scilit]
- Liu, G.; Zhu, Y.; Wan, X.; Xu, P.; Wu, C.; Yu, H. Mechanical properties of alkali-activated red mud aggregate concrete: Experimental study and mechanism analysis. Results Eng. 2026, 29, 108694. [Google Scholar] [CrossRef] [Scilit]
- Ortega, J.M.; Cabeza, M.; Tenza-Abril, A.J.; Real-Herraiz, T.; Climent, M.Á.; Sánchez, I. Effects of red mud addition in the microstructure, durability and mechanical performance of cement mortars. Appl. Sci. 2019, 9, 984. [Google Scholar] [CrossRef] [Scilit]
- Turan, E.; Alameri, I.A.; Oltulu, M. Long-term durability of red mud-modified cement mortars: Effects of high temperature and freeze-thaw cycles. Chall. J. Struct. Mech. 2025, 11, 116–127. [Google Scholar] [CrossRef] [Scilit]
- Pour, A.F.; Verma, R.K.; Nguyen, G.D.; Bui, H.H. Analysis of transition from diffuse to localized failure in sandstone and concrete using digital image correlation. Eng. Fract. Mech. 2022, 267, 108465. [Google Scholar] [CrossRef] [Scilit]
- Zhou, K.; He, J.; Huang, W.; Gao, Z.; Lei, D.; Wang, D. Effect of nanomaterials on micro-mechanical properties of concrete ITZ under freeze–thaw cycles. Constr. Build. Mater. 2025, 500, 144130. [Google Scholar] [CrossRef] [Scilit]
- Du, Y.; Yang, L.; Zhang, G.; Shang, L.; Xu, Y.; Ji, X.; Deng, M. Degradation of compressive performance and multiscale damage evolution mechanism of concrete under freeze–thaw cycles. Constr. Build. Mater. 2026, 531, 146738. [Google Scholar] [CrossRef] [Scilit]
- Pour, A.F.; Gholampour, A.; Ozbakkaloglu, T. Strain localization analysis using digital image correlation for PVA fiber-reinforced concrete-filled FRP tubes under compressive loading. Compos. Struct. 2022, 300, 116128. [Google Scholar] [CrossRef] [Scilit]
- Yu, X.; Yang, J.; Zhang, Z.; Leng, J.; Chen, R.; Zhou, J.; Zou, Y. Shear performance and degradation mechanism of UHPC–NC interface under composite salts freeze–thaw cycles. Case Stud. Constr. Mater. 2025, 22, e04408. [Google Scholar] [CrossRef] [Scilit]
- Zhao, Y.-R.; Wang, L.; Lei, Z.-K.; Han, X.-F.; Shi, J.-N. Study on bending damage and failure of basalt fiber reinforced concrete under freeze–thaw cycles. Constr. Build. Mater. 2018, 163, 460–470. [Google Scholar] [CrossRef] [Scilit]
- Xiao, M.; Li, F.; Chen, Y.; Tang, Y.; Gao, P.; Hu, J.; Wei, J.; Yu, Q. Investigation on drying-induced microcracks distribution characteristic and its formation mechanism in concrete. Constr. Build. Mater. 2025, 475, 141216. [Google Scholar] [CrossRef] [Scilit]
- GB/T 17671–1999; Method of Testing Cements—Determination of Strength. Standards Press of China: Beijing, China, 1999.
- GB/T 50082–2024; Standard for Test Methods of Long-Term Performance and Durability of Concrete. China Architecture & Building Press: Beijing, China, 2024.
- Lyu, K.; She, W.; Chang, H.; Gu, Y. Effect of fine aggregate size on the overlapping of interfacial transition zone (ITZ) in mortars. Constr. Build. Mater. 2020, 248, 118559. [Google Scholar] [CrossRef] [Scilit]
- Lei, J.-J.; Wu, Z.-X.; Wen, Z.-J.; Cheng, Z.-S.; Zhu, R. Mesoscale analysis of the effect of interfacial transition zone on the compressive damage of concrete based on discrete element method. Materials 2022, 15, 8840. [Google Scholar] [CrossRef] [Scilit]
- Josserand, L.; Coussy, O.; de Larrard, F. Bleeding of concrete as an ageing consolidation process. Cem. Concr. Res. 2006, 36, 1603–1608. [Google Scholar] [CrossRef] [Scilit]
- Shan, J.; Jing, H.; Ye, W.; Chen, S.; Lyu, P.; Guo, M.; Cui, Y.; Gao, M. Performance evolution and interfacial transition zone reconstruction mechanisms in concrete with surface-modified coal gangue aggregate. Constr. Build. Mater. 2026, 539, 147554. [Google Scholar] [CrossRef] [Scilit]
- Liu, R.; Xiao, H.; Liu, J.; Guo, S.; Pei, Y. Improving the microstructure of ITZ and reducing the permeability of concrete with various water/cement ratios using nano-silica. J. Mater. Sci. 2019, 54, 444–456. [Google Scholar] [CrossRef] [Scilit]
- Berger, R.L.; Cahn, D.S.; McGregor, J.D. Calcium hydroxide as a binder in Portland cement paste. J. Am. Ceram. Soc. 1970, 53, 57–58. [Google Scholar] [CrossRef] [Scilit]
- Tasong, W.A.; Lynsdale, C.J.; Cripps, J.C. Aggregate–cement paste interface: Part I. Influence of aggregate geochemistry. Cem. Concr. Res. 1999, 29, 1019–1025. [Google Scholar] [CrossRef] [Scilit]
- Luo, L.; Yao, W. Effect of chloride ion corrosion on the microstructure of multiple interfaces of alkali-activated GGBS/FA-based recycled concrete. J. Build. Eng. 2024, 95, 110270. [Google Scholar] [CrossRef] [Scilit]
- Liu, J.; Chen, X.; Rong, H.; Yu, A.; Ming, Y.; Li, K. Effect of interface transition zone and coarse aggregate on microscopic diffusion behavior of chloride ion. Materials 2022, 15, 4171. [Google Scholar] [CrossRef] [Scilit]
- Dang, J.; Xiao, J.; Duan, Z. Effect of pore structure and morphological characteristics of recycled fine aggregates from clay bricks on mechanical properties of concrete. Constr. Build. Mater. 2022, 358, 129455. [Google Scholar] [CrossRef] [Scilit]
- Wang, Q.; Han, S.; Yang, J.; Lin, X.; An, M. Preparation of geopolymer concrete with Bayer red mud and its reaction mechanism. Constr. Build. Mater. 2023, 409, 133730. [Google Scholar] [CrossRef] [Scilit]
- Li, Y.; Guo, H.; Zhou, H.; Li, Y.; Chen, J. Damage characteristics and constitutive model of concrete under uniaxial compression after freeze–thaw damage. Constr. Build. Mater. 2022, 345, 128171. [Google Scholar] [CrossRef] [Scilit]
- Ebrahimi, K.; Daiezadeh, M.J.; Zakertabrizi, M.; Zahmatkesh, F.; Habibnejad Korayem, A. A review of the impact of micro- and nanoparticles on freeze–thaw durability of hardened concrete: Mechanism perspective. Constr. Build. Mater. 2018, 186, 1105–1113. [Google Scholar] [CrossRef] [Scilit]
- Wang, H.; Cheng, Y.; Liang, J.; Zhao, W.; Li, A. Evaluating the fracture characterization of asphalt mixtures under freeze–thaw damage based on full-field measurements. Measurement 2024, 228, 114393. [Google Scholar] [CrossRef] [Scilit]
- Lu, J.; Liu, J.; Yang, H.; Wan, X.; Gao, J.; Zhang, J.; Li, P. Experimental investigation on the mechanical properties and pore structure deterioration of fiber-reinforced concrete in different freeze–thaw media. Constr. Build. Mater. 2022, 350, 128887. [Google Scholar] [CrossRef] [Scilit]
- Rustamov, S.; Kim, S.W.; Kwon, M.; Kim, J. Mechanical behavior of fiber-reinforced lightweight concrete subjected to repeated freezing and thawing. Constr. Build. Mater. 2021, 273, 121710. [Google Scholar] [CrossRef] [Scilit]
- Zhou, Z.; Shen, Y.; Zhang, H.; Wang, Y.; Yang, H.; Pan, J.; Wei, X. Sandstone–concrete interface debonding mechanism under freeze–thaw actions: Fracture process and fracture criterion. Constr. Build. Mater. 2021, 294, 123526. [Google Scholar] [CrossRef] [Scilit]
- Pan, J.; Shen, Y.; Yang, G.; Zhang, H.; Yang, H.; Zhou, Z. Debonding behaviors and micro-mechanism of the interface transition zone in sandstone–concrete interface in response to freeze–thaw conditions. Cold Reg. Sci. Technol. 2021, 191, 103359. [Google Scholar] [CrossRef] [Scilit]
- Li, Y.; Zhang, H.; Chen, S.; Wang, H.; Liu, G. Multi-scale study on the durability degradation mechanism of aeolian sand concrete under freeze–thaw conditions. Constr. Build. Mater. 2022, 340, 127433. [Google Scholar] [CrossRef] [Scilit]

Disclaimer/Publisher’s Note: The statements, opinions and data contained in all publications are solely those of the individual author(s) and contributor(s) and not of MDPI and/or the editor(s). MDPI and/or the editor(s) disclaim responsibility for any injury to people or property resulting from any ideas, methods, instructions or products referred to in the content. |
© 2026 by the authors. Licensee MDPI, Basel, Switzerland. This article is an open access article distributed under the terms and conditions of the Creative Commons Attribution (CC BY) license.