


Abstract
Freeze–thaw deterioration in jacketed reinforced concrete (RC) columns is spatially non-uniform, yet this depth-dependent damage is rarely represented explicitly in structural simulations. This study develops an experimentally informed numerical modelling framework for cementitious grout-jacketed RC columns subjected to freeze–thaw exposure. Unidirectional freeze–thaw tests were conducted on A60 cementitious grout and C30, C45, and C60 concrete. Splitting tensile strength was measured at six depths after 0–320 freeze–thaw cycles, and an empirical layered damage model was established. The measured tensile-strength degradation was then converted into an axial-compressive-strength distribution and implemented in a layered fibre section. The framework further accounts for loss of the severely damaged surface layer, a constitutive model for confined cementitious grout incorporated into OpenSees, and the combined confinement provided by the spiral stirrups in the original column and the jacket. Five jacketed-column tests with different freeze–thaw histories before and after strengthening were used for validation, followed by parametric analyses of pre-existing damage and strengthening thickness. The results showed that strength degradation was greatest near the exposed surface and decreased towards the interior, consistent with coupled moisture and temperature gradients. The proposed model reproduced the measured cyclic hysteretic response, with an average simulated-to-measured peak-load ratio of 0.973 and errors below 5%. The framework provides a material-test-based approach for representing layered freeze–thaw damage in nonlinear analysis of cementitious grout-jacketed RC columns.
1. Introduction
Freeze–thaw deterioration is one of the principal durability problems affecting reinforced concrete (RC) structures in cold regions [1,2]. Repeated freeze–thaw cycles (FTCs) disrupt the pore system of concrete and progressively degrade its macroscopic mechanical properties [3,4,5,6]. Because heat and moisture are transmitted primarily through exposed surfaces, and internal moisture evolution can significantly influence the environmental response of cementitious materials [7,8], deterioration is generally non-uniform across the member section and develops from the exterior towards the interior. Surface loosening and spalling reduce the effective load-bearing area, while the remaining interior concrete undergoes varying degrees of material degradation. A structural model that assumes uniform damage may therefore misrepresent the residual response of freeze–thaw-affected members.
When the load-bearing capacity of an existing RC column is inadequate, enlargement of the cross-section using a cementitious grout jacket provides an effective strengthening solution. In this method, additional longitudinal reinforcement and transverse reinforcement are installed around the original member and encased in a cementitious grout layer so that the original column and the jacket act compositely [9,10,11]. The jacket increases the section size and confinement while converting exposed cracks in the original column into internal cracks and restraining their subsequent propagation. These characteristics make cementitious grout jacketing particularly attractive for deteriorated RC structures in cold regions.
A rational assessment of grout-jacketed columns in freeze–thaw environments requires both the evolution of material deterioration and its influence on structural response to be represented [12]. However, durability studies on strengthened columns remain limited [13]. Existing large-scale tests on unstrengthened RC columns have shown that FTCs reduce load capacity, ductility, stiffness, and energy dissipation and accelerate strength and stiffness degradation [14,15,16,17,18]. These findings establish the importance of freeze–thaw damage in seismic assessment, but they do not directly address the composite section and multiple confinement mechanisms created by grout jacketing.
The spatial distribution of freeze–thaw damage is also critical to numerical analysis. Previous studies have shown that non-uniform frost damage should be considered in simulations of RC members exposed to freezing and thawing [19,20,21]. Zhang et al. [22], for example, developed a model for freeze–thaw-damaged RC columns that incorporated non-uniform sectional damage together with flexural deformation, reinforcement slip, and shear effects. Recent studies have also reported advances in numerically stable transient solution schemes and low-frequency response-control strategies, further highlighting the continuing development of structural response prediction and control methods [23,24]. Nevertheless, existing models are not directly applicable to cementitious grout-jacketed columns because they do not represent the separate damage histories of the original concrete and the grout jacket or the combined confinement supplied by the original and newly installed transverse reinforcement. In addition, the transfer of pre-existing freeze–thaw damage in the original concrete after jacketing, when its relative depth from the exposed surface changes, has received limited attention.
Accordingly, this study develops an experimentally informed numerical framework for cementitious grout-jacketed RC columns with layered freeze–thaw damage. First, unidirectional freeze–thaw tests are conducted on cementitious grout and concrete to quantify the depth-dependent reduction in splitting tensile strength and to establish a layered damage function. The measured damage distribution is then transformed into an axial-compressive-strength distribution for use in nonlinear section analysis. A fibre model is constructed in OpenSees by incorporating the layered material properties, the effective loss of the severely damaged surface layer, a constitutive model for confined grout, and the combined confinement of double-layer spiral stirrups. The proposed framework is subsequently validated against cyclic tests on five grout-jacketed RC columns with different freeze–thaw histories, and additional parametric analyses are conducted. Compared with previous models for non-uniform freeze–thaw damage, the present framework further considers the distinct damage histories before and after jacketing and the corresponding confinement characteristics of grout-jacketed RC columns.
2. Experimental Characterisation of Layered Freeze–Thaw Damage
2.1. Experimental Program
2.1.1. Materials
The experimental materials comprised A60 cementitious grout and three concrete strength grades (C30, C45, and C60). The grout was prepared from composite cementitious materials, graded quartz sand, and 5–10 mm crushed stone, with the mixing water corresponding to 9% of the dry-mixture mass. The concrete mixtures contained P·O 42.5 cement (Shaanxi Yaobai Special Cement Co., Ltd., Xi’an, China), medium sand with a fineness modulus of 2.37, and 5–20 mm crushed stone. The sand and crushed stone were locally sourced in Xi’an, China, and tap water was used for mixing. Table 1 presents the mixture proportions and measured compressive strengths of all four materials.
Table 1.
Mix proportions and compressive strengths of the cementitious grout and concrete.
2.1.2. Specimen Design and Test Procedure
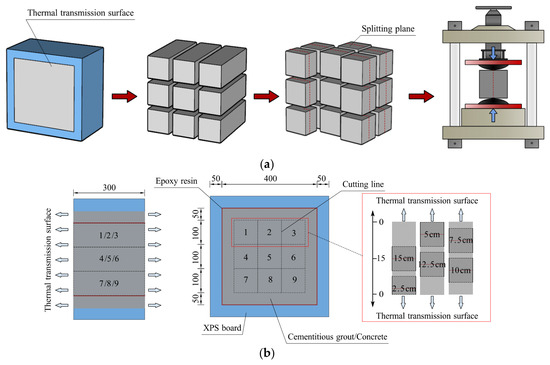
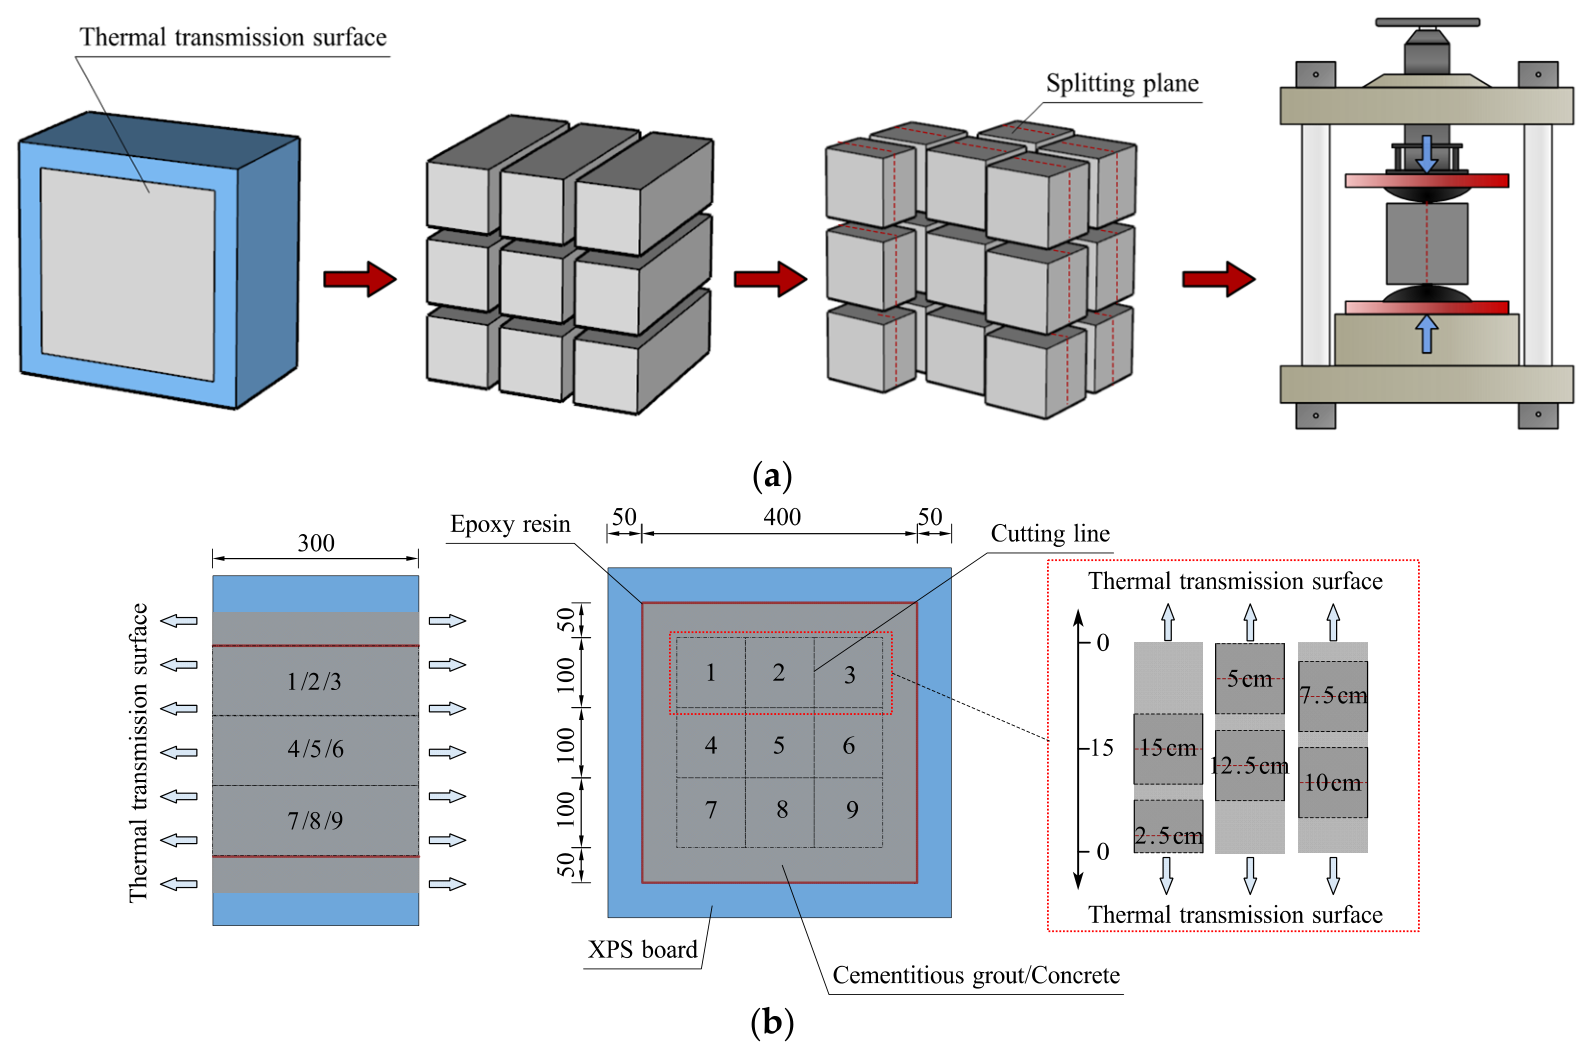
Unidirectional heat and moisture transfer was achieved by exposing only one surface of each specimen; all remaining surfaces were protected using epoxy resin and extruded polystyrene (XPS) insulation. Depth-dependent deterioration was evaluated from splitting tensile strength, which is sensitive to freeze–thaw-induced cracking and enables the mechanical response of selected depth regions to be assessed through the prescribed splitting planes.
Each layered-damage block measured 400 mm × 400 mm × 300 mm. At the specified FTC level, the block was divided into nine 100 mm × 100 mm × 300 mm prisms with the exposure-induced damage gradient oriented along their length. As shown in Figure 1, splitting specimens were then obtained at nominal depths of 2.5, 5.0, 7.5, 10.0, 12.5, and 15.0 cm. Except for the specimen centred at 2.5 cm, which was 75 mm long in the exposure direction, the nominal specimen dimensions were 100 mm × 100 mm × 100 mm. Importantly, all specimens retained the same 100 mm × 100 mm splitting plane. Preliminary comparative tests indicated comparable splitting strengths for the two geometries, suggesting that the reduced dimension had only a limited effect. Five exposure levels (0, 80, 160, 240, and 320 FTCs) were examined, with three replicate specimens for each condition.
Figure 1.
Specimen testing and cutting schemes (dimensions in mm): (a) testing scheme; (b) cutting scheme.
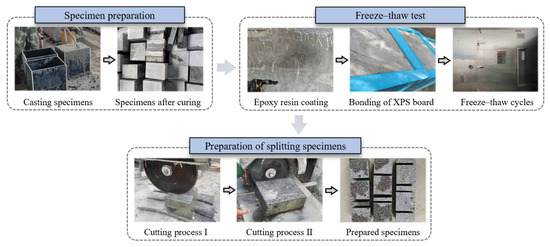
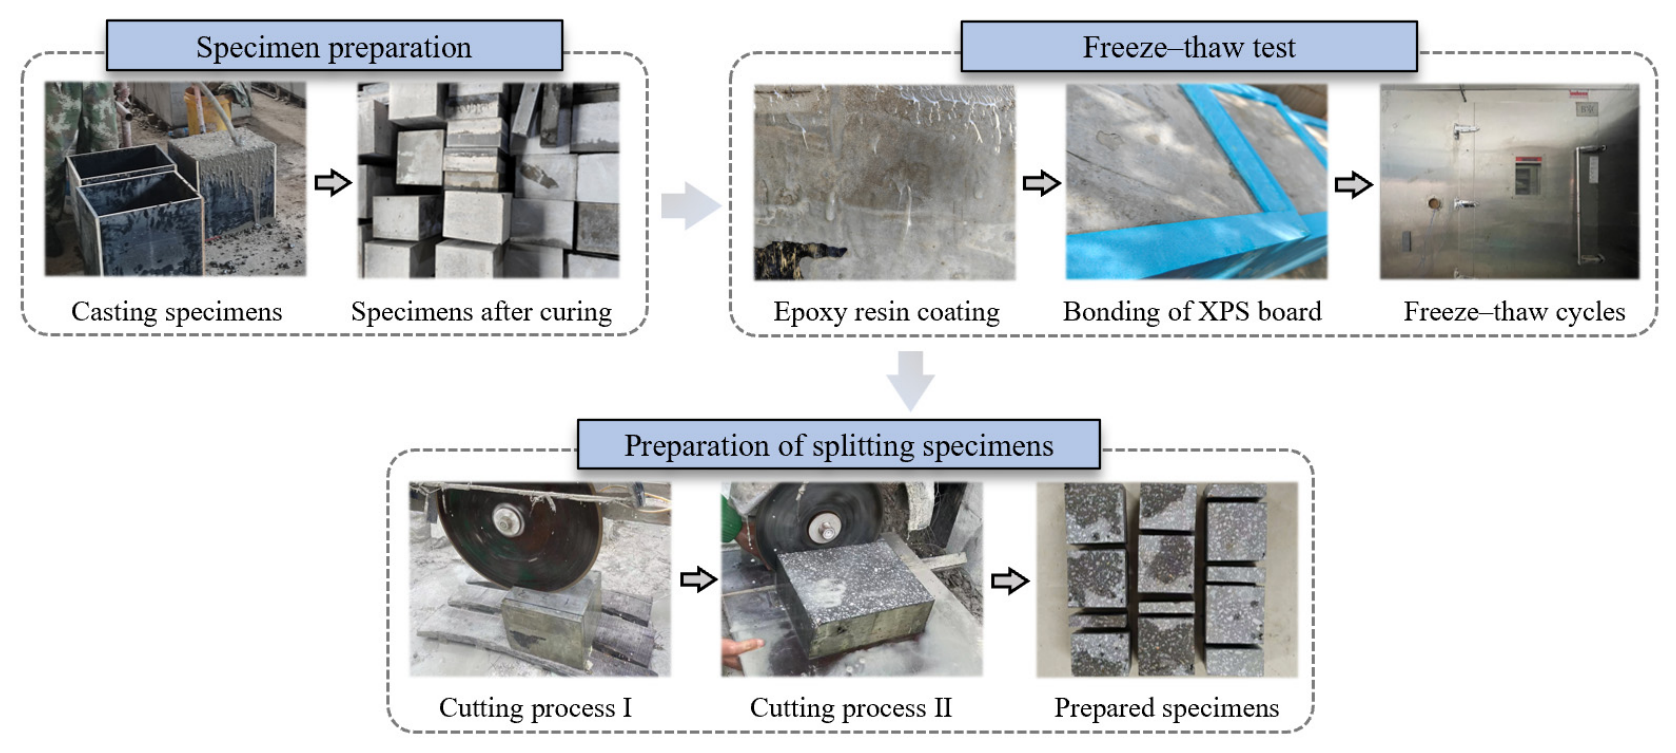
Figure 2 summarises the specimen preparation procedure. Demoulding was performed 24 h after casting, followed by 27 days of standard curing at 20 ± 2 °C and a relative humidity above 95%. To reduce interference between continued strength gain and freeze–thaw deterioration, the specimens were then stored under natural conditions for a further 90 days and regularly sprayed with water to promote continued hydration. After curing, the non-exposed surfaces were sealed with epoxy resin and XPS boards. The specimens were subsequently subjected to the prescribed FTCs in the environmental chamber and cut according to Figure 1 for splitting tests.
Figure 2.
Preparation process of layered damaged specimens.
A TYA-2000 electro-hydraulic servo machine (Cangzhou Jianyi Zhongke Road and Bridge Test Instrument Co., Ltd., Cangzhou, China) was used for the splitting tests, with the stress applied at 0.08 MPa/s. The maximum recorded load was converted to splitting tensile strength using Equation (1).
where fst is the splitting tensile strength (MPa), P is the failure load (N), and Ast is the area of the splitting plane (mm2).
2.1.3. Freeze–Thaw Cycle Regime
The FTC tests were conducted in an artificial-climate chamber. To maintain a high degree of saturation throughout the exposure [4], the specimens were immersed in water for 4 days before testing, wrapped in polyethylene film, and sealed in polyethylene bags to limit moisture loss. They were re-immersed after every 10 cycles. One complete thermal cycle lasted 9 h and covered a chamber-temperature range from −20 °C to 25 °C.
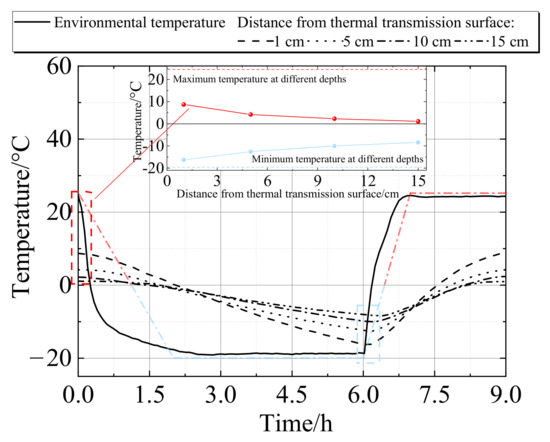
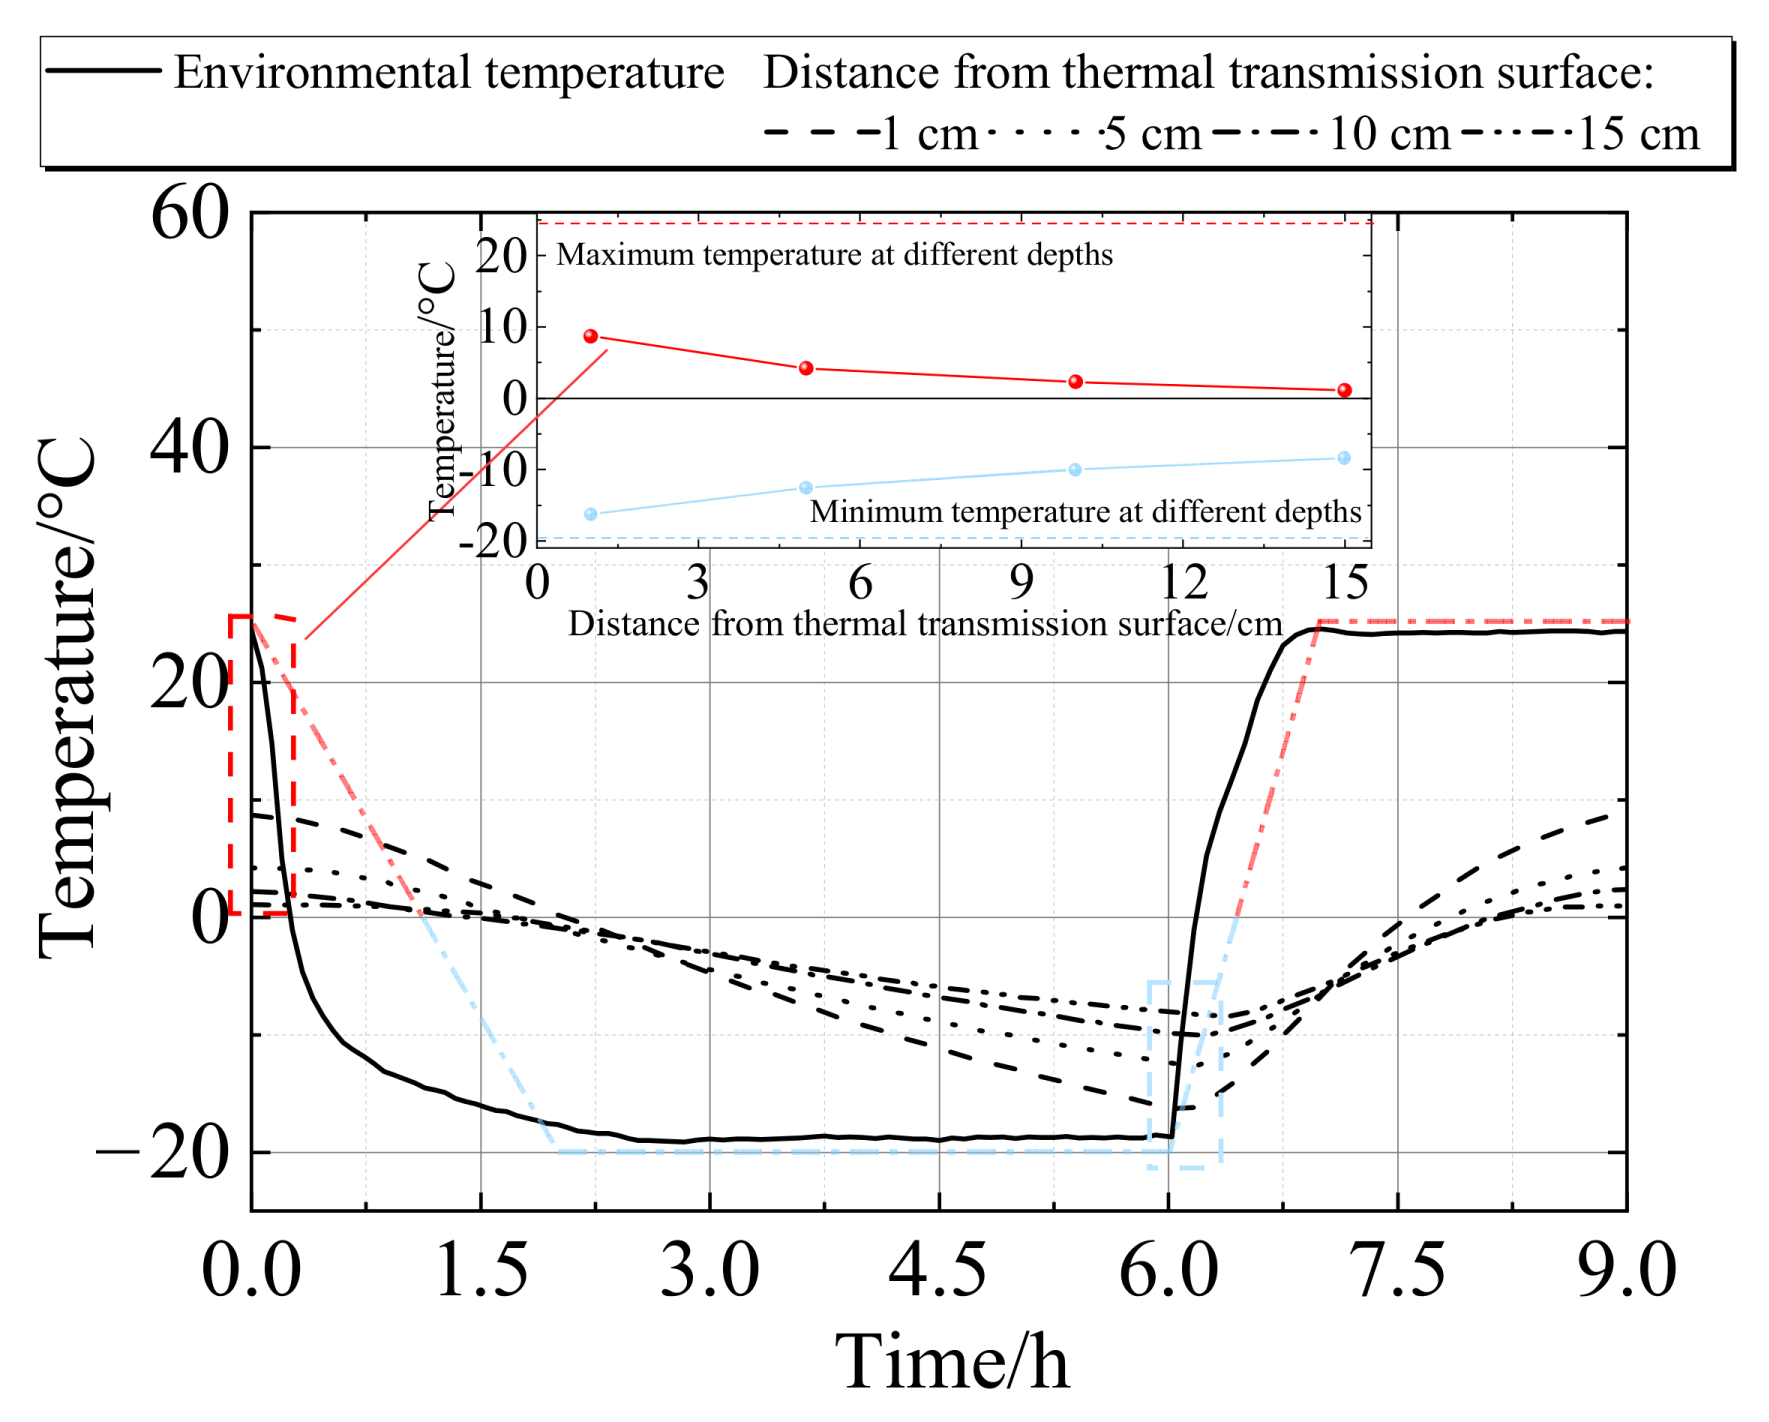
Thermocouples were embedded at different depths to monitor the internal temperature field, as shown in Figure 3. The minimum cooling rate measured at the specimen centre was approximately 1 °C/h, whereas the surface cooling rate reached approximately 4 °C/h. Both values exceed cooling rates reported for the interior of concrete structures under natural exposure [25,26], indicating that the laboratory regime was deliberately severe. The high cooling rate likely promoted deeper penetration of freeze–thaw damage; the resulting profiles are therefore conservative for internal deterioration, although the surface-to-core contrast may be less pronounced than under natural exposure.
Figure 3.
Measured temperature histories during a freeze–thaw cycle.
The freeze–thaw regime adopted in this study was accelerated; therefore, the laboratory cycle number cannot be directly equated with natural freeze–thaw exposure. In our previous study, compressive-strength loss was used as a common damage index to establish the following equivalent-cycle relationship between the present regime and the conventional rapid freeze–thaw method [27]:
where Nlab,ns and Nlab,rft denote the numbers of cycles under the present regime and the conventional rapid freeze–thaw method, respectively. Unless otherwise specified, FTCs hereafter refer to Nlab,ns.
Accordingly, the present results can first be converted into equivalent rapid FTCs and then interpreted for field conditions using existing rapid-test-to-field equivalence relationships [28]. This conversion is based on macroscopic strength-loss equivalence and should be regarded as an engineering approximation, particularly for depth-dependent damage gradients; further calibration is required for specific thermal and moisture conditions.
2.2. Results and Discussion
2.2.1. Layered Freeze–Thaw Damage Characteristics
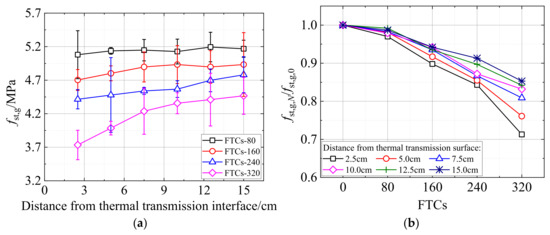
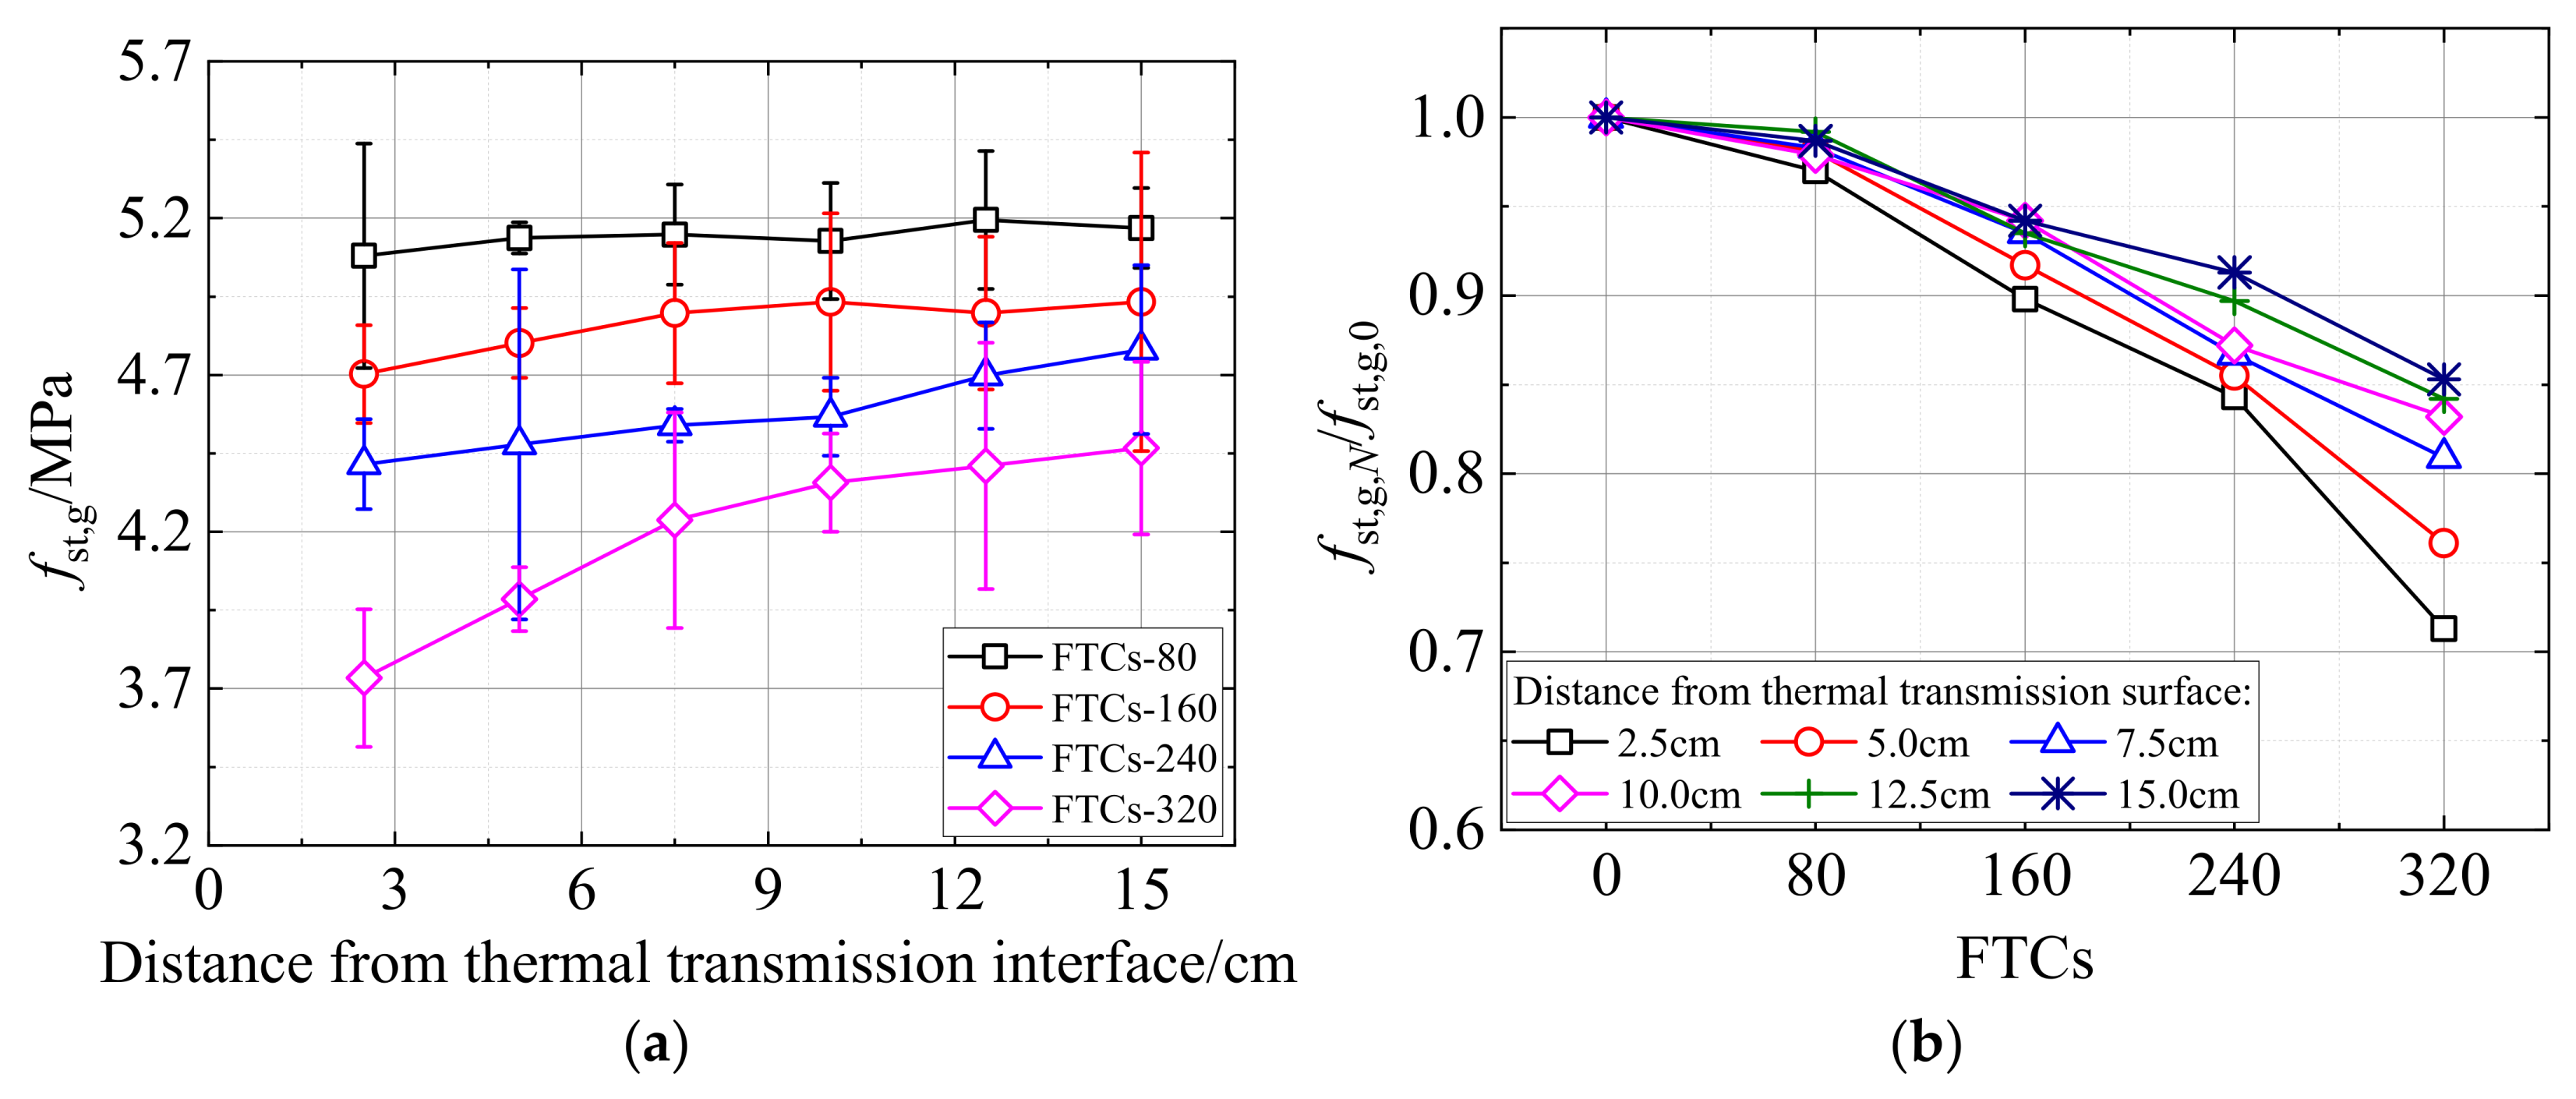
Figure 4 presents the depth-dependent response of cementitious grout. At every FTC level, the splitting tensile strength increased with distance from the exposed surface, confirming that deterioration progressed from the exterior towards the interior. After 80 cycles, the strength reductions at depths of 2.5 and 15.0 cm were 3.0% and 1.3%, respectively. After 320 cycles, the corresponding reductions increased to 28.7% and 13.7%. The surface region experienced the largest thermal fluctuations and reached critical saturation earlier because moisture entered from the exterior. Microcracks and connected pores subsequently propagated inwards, producing a non-uniform damage profile across the specimen depth.
Figure 4.
Layered freeze–thaw damage of cementitious grout: (a) splitting tensile strength; (b) relative strength degradation.
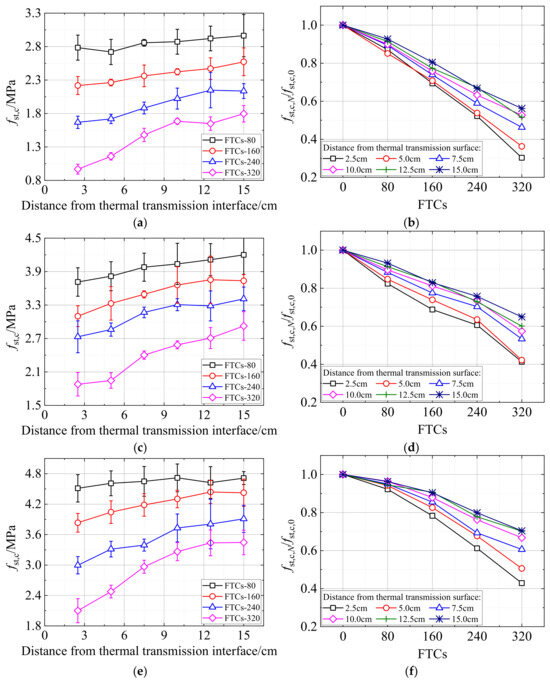
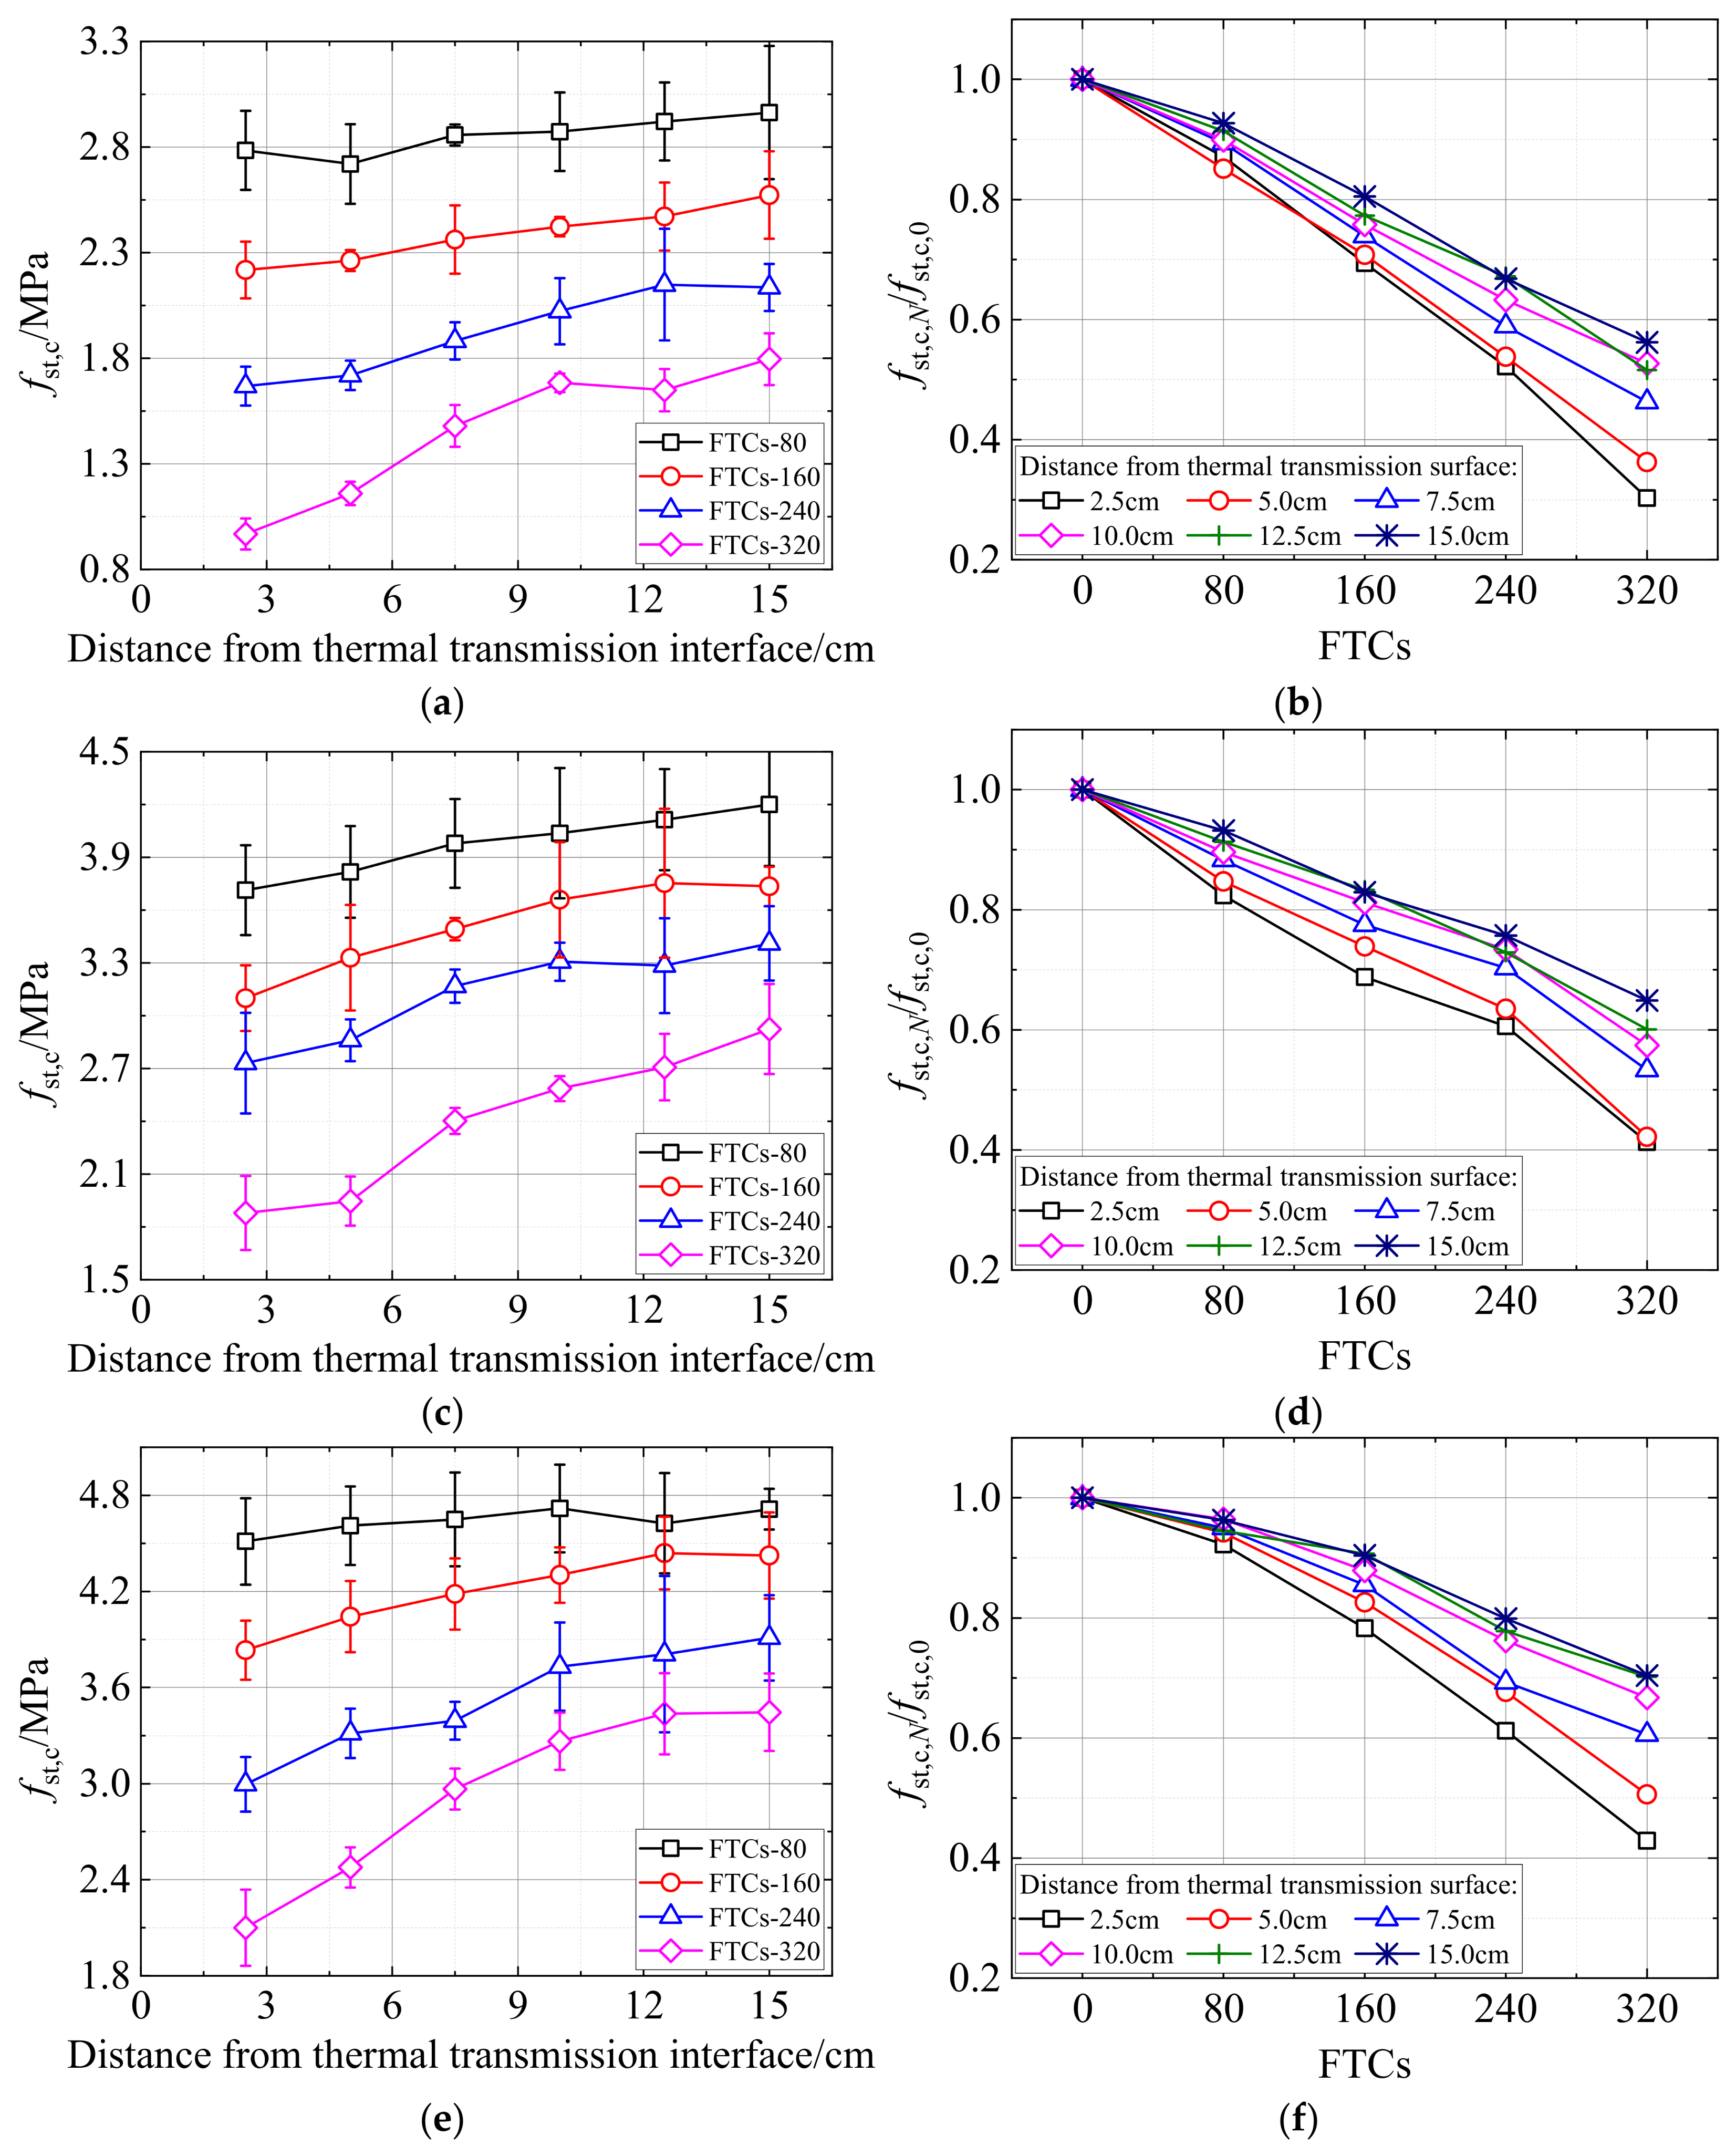
Figure 5 shows that concrete strength had a clear influence on the severity of freeze–thaw deterioration. After 320 FTCs, the splitting tensile strength at a depth of 2.5 cm decreased by 69.7%, 58.7%, and 57.1% for C30, C45, and C60 concrete, respectively, while the corresponding reductions at 15.0 cm were 43.8%, 35.1%, and 29.6%. When averaged over the six investigated depths, the normalised strength losses were 54.4%, 46.8%, and 39.8%, respectively. These results indicate that increasing concrete strength generally improves the resistance to freeze–thaw deterioration throughout the investigated depth range. This improvement is likely associated with the lower water-to-cement ratio and denser pore structure of higher-strength concrete, which can restrict moisture penetration and reduce the amount of freezable water. Under the unidirectional freeze–thaw condition adopted in this study, this effect becomes particularly important because the near-surface region is subjected to more direct moisture replenishment and a more severe thermal history.
Figure 5.
Layered freeze–thaw damage of concrete: (a) splitting tensile strength (C30); (b) relative strength degradation (C30); (c) splitting tensile strength (C45); (d) relative strength degradation (C45); (e) splitting tensile strength (C60); (f) relative strength degradation (C60).
To further quantify the through-depth variation, the normalised damage gradient was evaluated from the difference in strength loss between 2.5 and 15.0 cm divided by the corresponding depth interval. After 320 FTCs, the gradients were approximately 2.07, 1.89, and 2.20 percentage points/cm for C30, C45, and C60, respectively. Although higher-strength concrete exhibited lower overall damage, the magnitude of the through-depth gradient did not decrease monotonically with increasing strength grade. In particular, the relatively well-preserved interior of C60 concrete resulted in a pronounced difference between the near-surface and inner regions. This suggests that concrete strength mainly governs the overall resistance to freeze–thaw deterioration, whereas the development of the damage gradient is additionally controlled by the coupled spatial distributions of moisture and temperature.
2.2.2. Layered Freeze–Thaw Damage Model
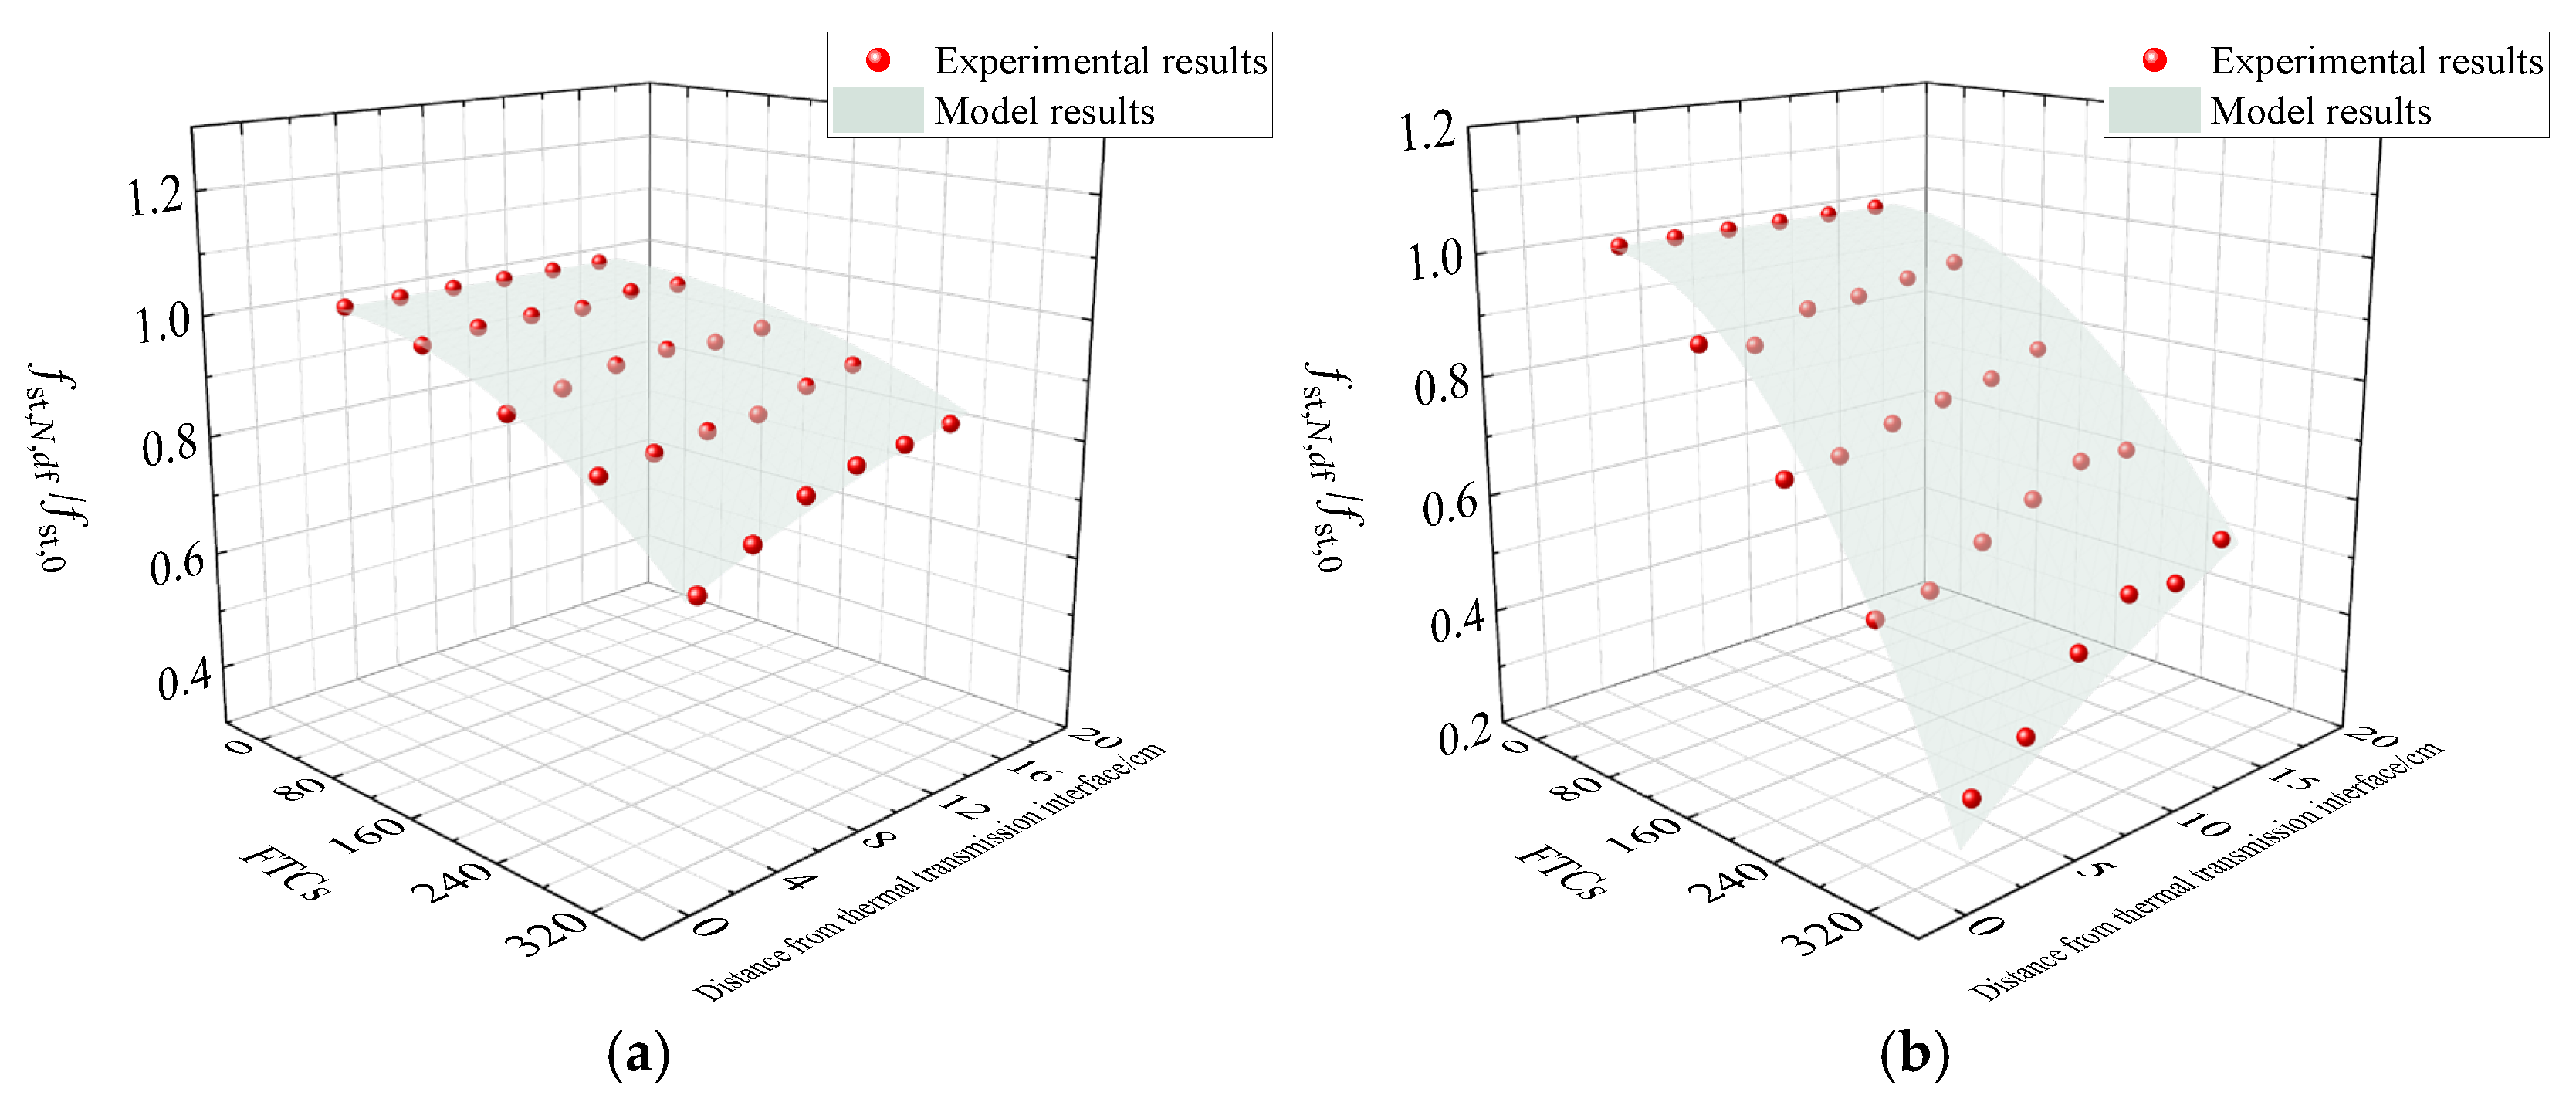
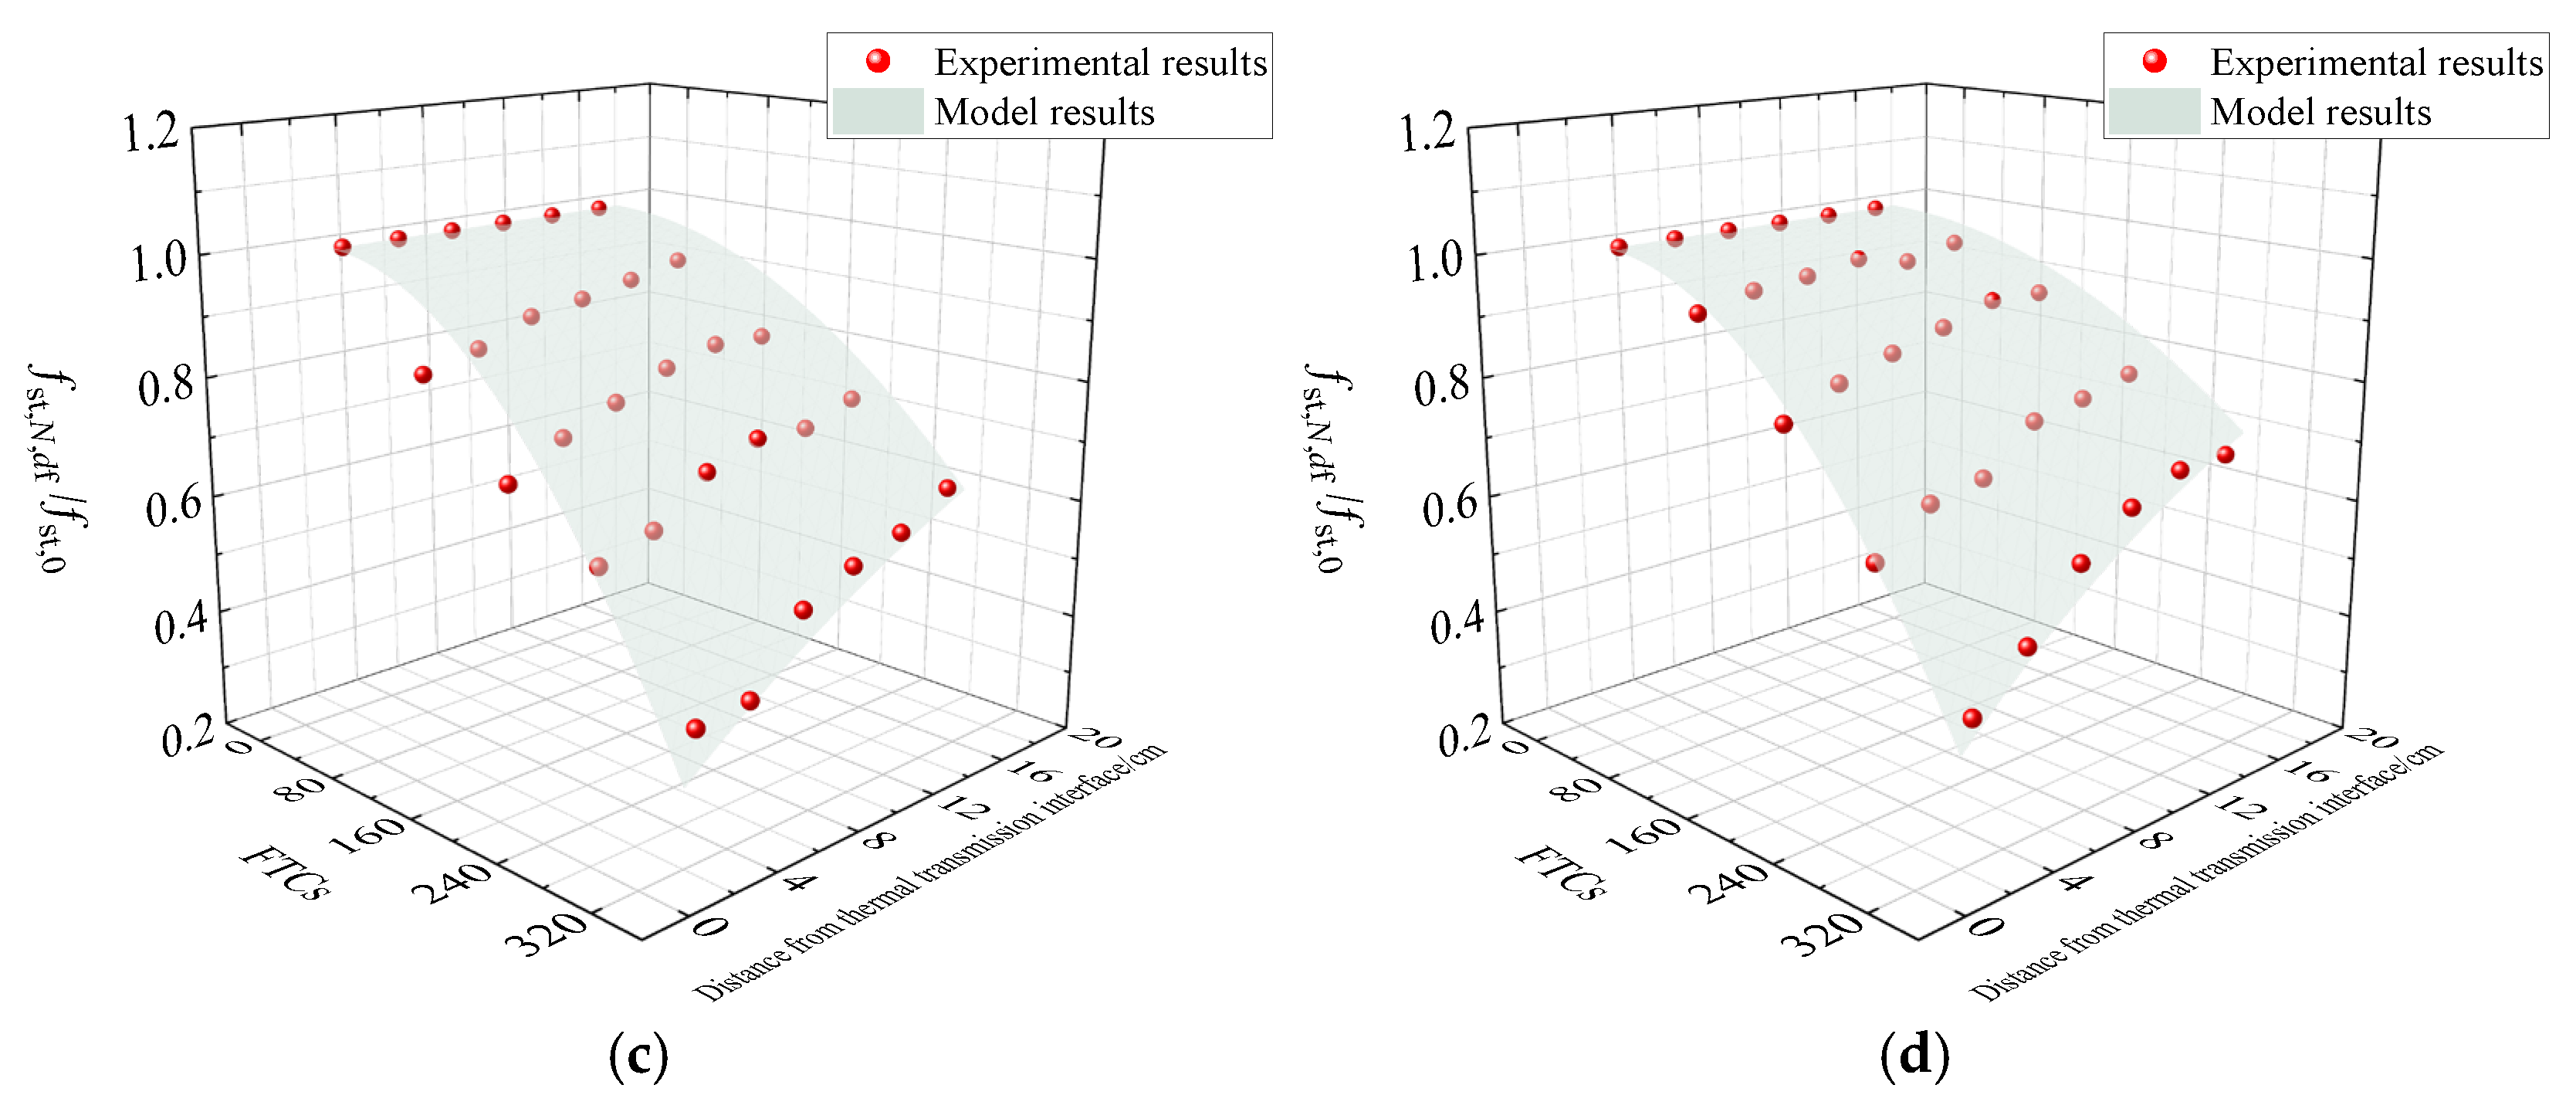
The results demonstrate that freeze–thaw damage in both cementitious grout and concrete develops progressively from the exposed surface towards the interior. The relative splitting tensile strength, fst,N/fst,0, depends on both the number of FTCs and the distance between the splitting plane and the exposed surface. After examining alternative response-surface forms, Equation (3) was adopted to describe this relationship. For concrete, the cube compressive strength was introduced into the regression coefficients to account for differences among strength grades.
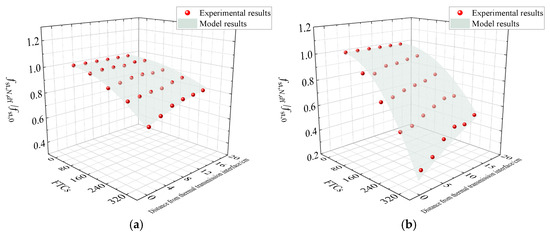
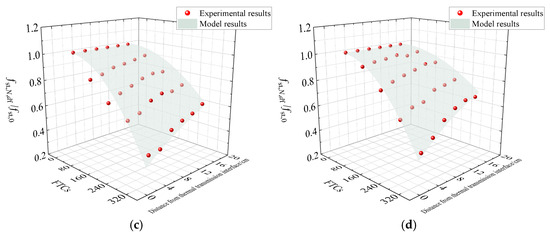
The regression coefficients and their statistical assessment are summarised in Table 2. For concrete, the coefficients were first determined separately for C30, C45, and C60 and were subsequently related to fcu,c. The 95% confidence intervals of most first-stage coefficients do not include zero, indicating generally stable parameter estimates within the investigated range. The only exception is k3 for C45 concrete, which exhibits greater statistical uncertainty, although the overall regression remains satisfactory (R2 = 0.9831). Figure 6 compares the model predictions with the measured data.
Table 2.
Regression coefficients for the layered freeze–thaw damage model: (a) First-stage regression coefficients. (b) Coefficient expressions used in the final layered damage model.
Figure 6.
Comparison of measured and predicted layered freeze–thaw damage: (a) cementitious grout; (b) C30 concrete; (c) C45 concrete; (d) C60 concrete.
The model reproduces the principal depth- and freeze–thaw cycle-dependent trends for both cementitious grout and concrete.
where fst,N,df is the splitting tensile strength (MPa) after N FTCs at a depth df from the exposed surface; fst,0 is the corresponding unexposed strength; k1, k2, and k3 are regression coefficients; N is the number of FTCs; and df is expressed in centimetres.
As an empirical relationship calibrated from the present tests, Equation (3) is applicable within the investigated ranges of 0–320 FTCs and depths of 2.5–15.0 cm from the exposed surface for A60 cementitious grout and C30–C60 concrete. The response-surface form was selected to reproduce the main experimental trends while retaining a limited number of parameters. The linear and quadratic terms in N describe the nonlinear accumulation of freeze–thaw deterioration, whereas the interaction term dfN captures the variation in damage with depth as freeze–thaw cycles accumulate. Moreover, the absence of an independent depth term ensures that the normalised strength remains equal to unity at N = 0 for all depths, consistent with the physical condition before freeze–thaw exposure. This relatively simple formulation therefore captures the principal cycle- and depth-dependent deterioration characteristics without introducing unnecessary model complexity. Extrapolation beyond these ranges requires further validation.
2.2.3. Layered Freeze–Thaw Damage Mechanism
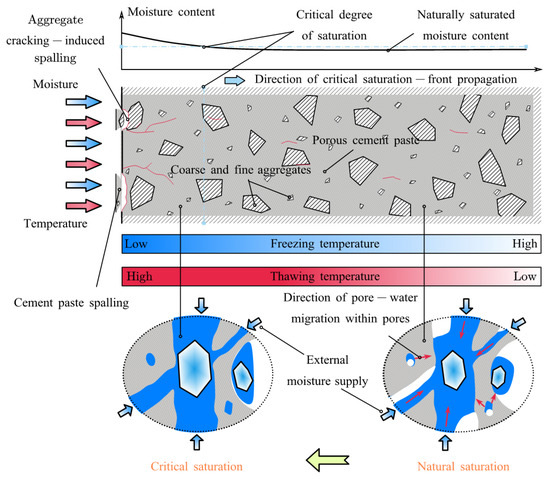
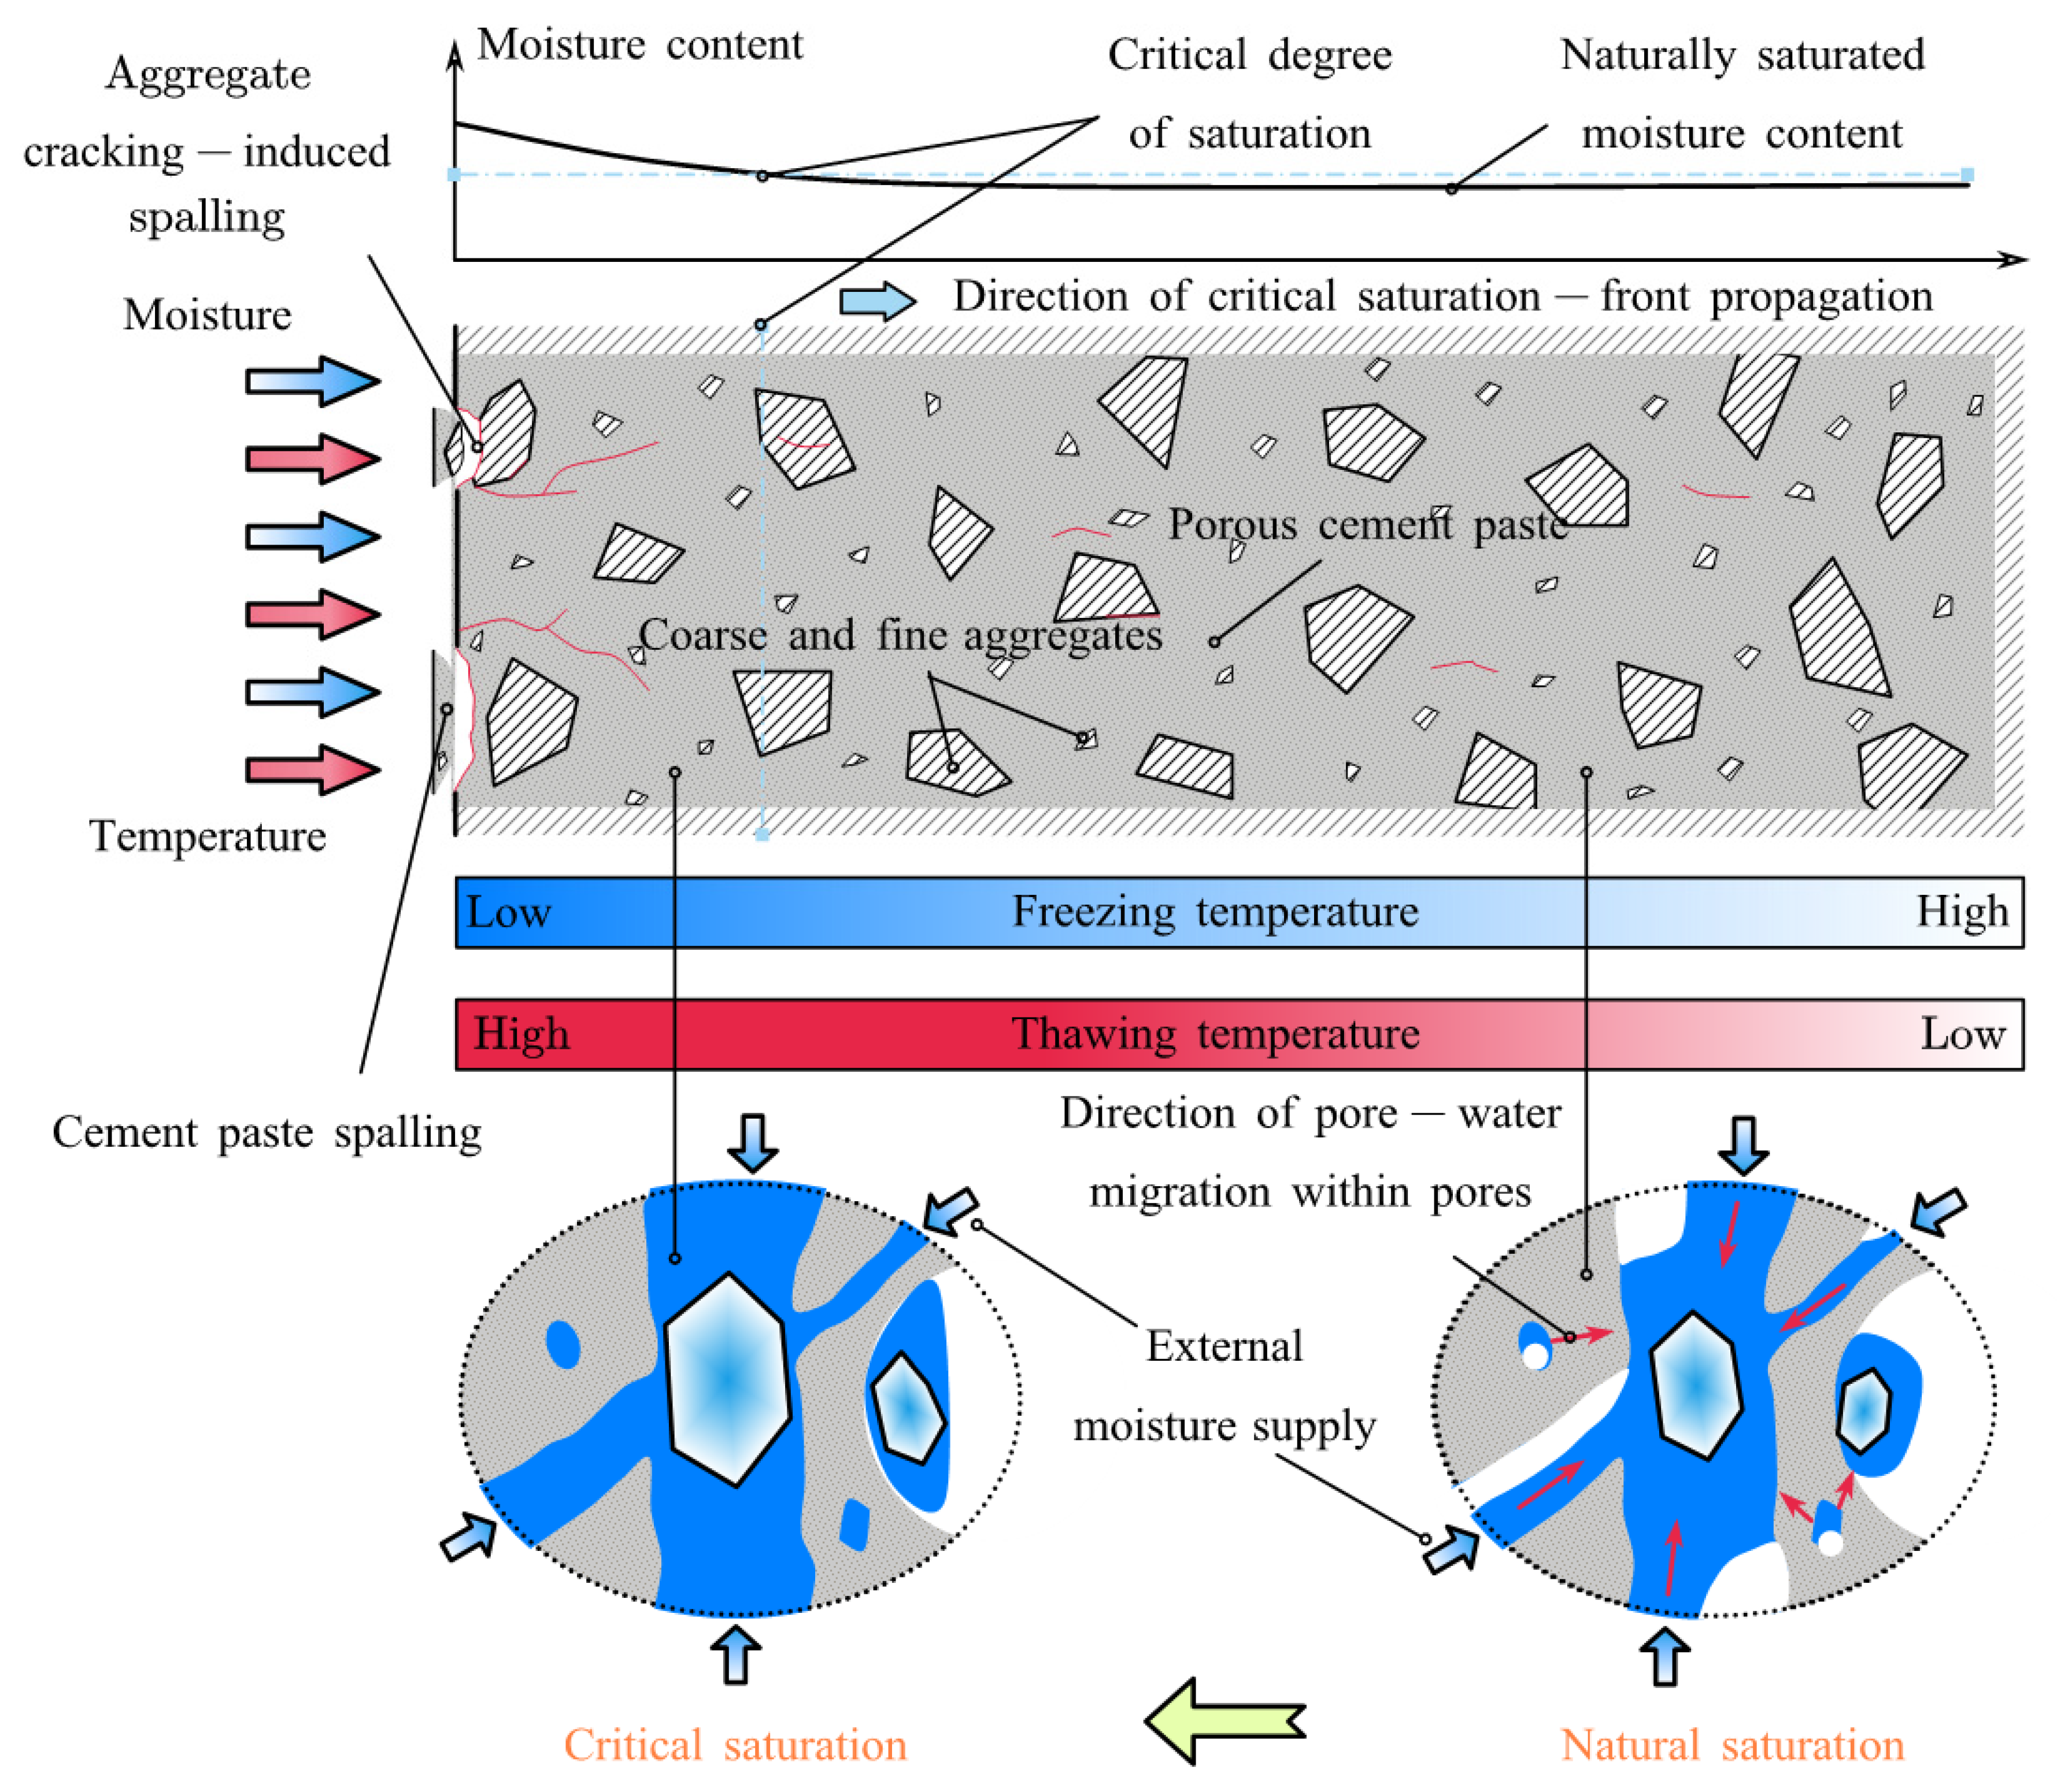
For concrete approaching saturation after natural water exposure, freeze–thaw deterioration develops a pronounced depth-dependent gradient when both heat and moisture are transferred unidirectionally from the exposed surface towards the interior, as schematically illustrated in Figure 7. Pore water does not freeze completely in situ immediately below 0 °C; instead, part of the water in capillary pores freezes first, accompanied by moisture migration from gel pores and capillary pores towards larger pores. During freezing, additional stresses associated with hydraulic pressure, osmotic pressure, and frost-heaving effects may promote microcracking in the cement paste, aggregates, and interfacial transition zones, leading to progressive material deterioration [29,30,31,32]. The evolution and redistribution of internal moisture play an important role in the environmental response of cementitious materials [8]. Because moisture can be continuously supplied from the exposed surface, the near-surface region is more likely to reach a high or even critical degree of saturation. A higher degree of saturation increases the internal pressure generated during freezing and therefore results in more severe deterioration near the exposed surface [33].
Figure 7.
Schematic illustration of the layered freeze–thaw damage mechanism under unidirectional heat and moisture transport.
Meanwhile, heat is transferred from the exposed surface towards the interior during unidirectional freeze–thaw exposure, producing a pronounced temperature gradient when the freezing duration is limited or the member size is relatively large. Regions closer to the exposed surface generally experience lower minimum freezing temperatures, faster cooling rates, and longer sub-zero durations. Because pore water freezes progressively over a range of sub-zero temperatures rather than at a single temperature, the amount of freezable water increases as temperature decreases, resulting in greater frost-induced and osmotic pressures and consequently more severe microcracking and mechanical degradation [31,34]. Differences in cooling rate and sub-zero duration at different depths further amplify this non-uniform deterioration [35,36,37].
Therefore, the inward transport of moisture and heat under unidirectional freeze–thaw exposure produces spatial variations in saturation, minimum freezing temperature, cooling rate, and sub-zero duration. The coupled non-uniformity of the moisture and temperature fields ultimately causes freeze–thaw damage to progressively decrease from the exposed surface towards the interior, thereby producing the layered freeze–thaw deterioration investigated in this study.
3. Numerical Modeling Framework
The numerical analysis links the experimentally determined damage profile to the nonlinear behaviour of the strengthened column. Its formulation focuses on two features: spatial variation in freeze–thaw-degraded properties within the composite section and the confinement of the original concrete provided jointly by the two transverse-reinforcement systems. The resulting model was implemented in OpenSees (Open System for Earthquake Engineering Simulation).
3.1. Layered Damage Distribution Within the Strengthened-Column Section
For cementitious materials, an empirical relationship is commonly used to relate splitting tensile strength to compressive strength [38]. In the absence of paired axial-compressive-strength measurements at each depth, this relationship was adopted here as an approximate mapping to estimate the depth-dependent compressive-strength distribution required for the fibre-section analysis, as expressed in Equation (4).
This conversion is intended as a numerical parameter-assignment approximation rather than a universally invariant relationship for freeze–thaw-damaged materials. Because tensile and compressive strengths may exhibit different degradation rates during freeze–thaw exposure, uncertainty associated with this approximation should be considered when extending the framework beyond the range validated herein.
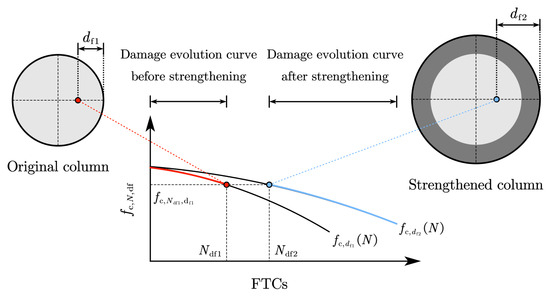
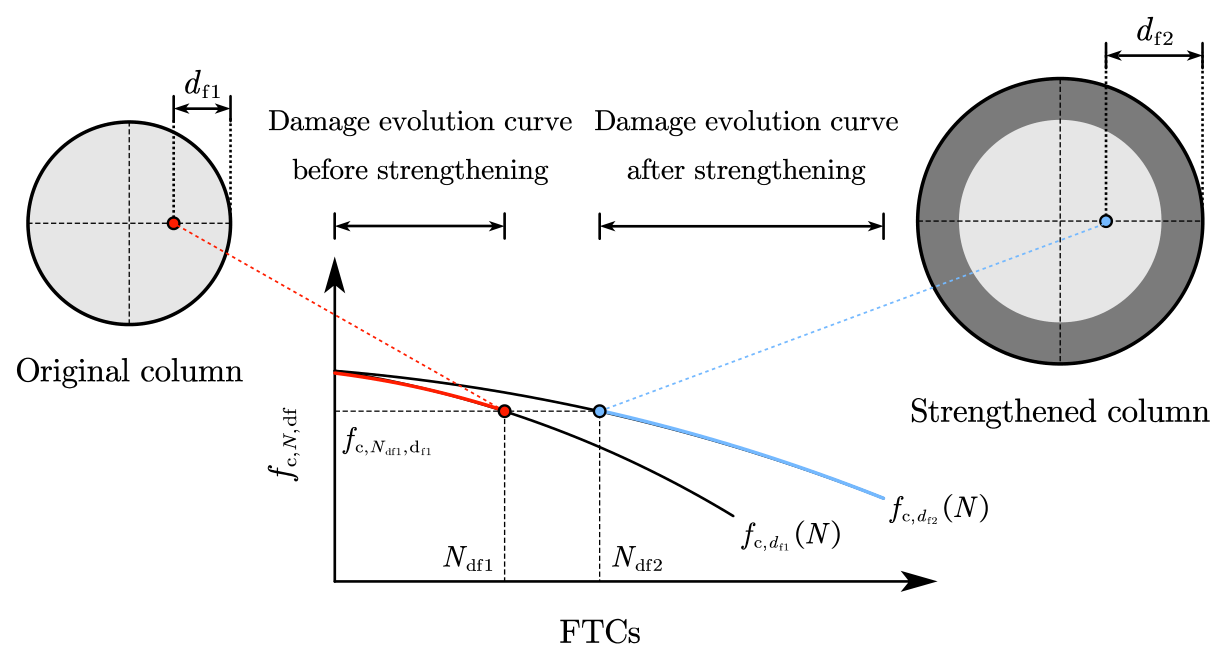
For the cementitious grout jacket, the axial compressive strength at each position is obtained directly from Equation (4). The original-column concrete requires an additional history transformation because it may have been damaged before strengthening. As illustrated in Figure 8, a material point located at a distance df1 from the original-column surface has a strength corresponding to Ndf1 cycles before jacketing. After strengthening, the same point lies at a distance of df2 from the new external surface. Its pre-existing strength is first mapped to an equivalent cycle count Ndf2 on the degradation curve associated with df2; subsequent freeze–thaw exposure is then accumulated from that equivalent state. This procedure preserves the pre-strengthening damage while accounting for the changed depth after jacketing.
Figure 8.
Procedure for determining the compressive strength of the original-column concrete.
This mapping is treated as a residual-strength-based state-equivalence approximation rather than as a strict assumption of path-independent freeze–thaw deterioration. The residual strength serves as a scalar measure of the accumulated macroscopic damage. Within the calibrated range, the degradation curve at each depth decreases monotonically with increasing FTCs, so a given residual strength can be associated with a unique equivalent cycle number at the new depth. It should be noted that potential path-dependent effects associated with differences in thermal history, moisture condition, and microcrack evolution are not explicitly represented in the present framework, which should be considered when applying the proposed approach beyond the calibrated range.
Freeze–thaw exposure may also cause surface scaling or spalling, thereby reducing the effective load-bearing area of a concrete member. Existing analytical and numerical approaches commonly reduce the section dimensions using an estimated damaged-layer or spalling thickness [39,40].
In the present column tests, visible scaling of the grout jacket remained limited, but dense surface cracking developed after repeated FTCs. During cyclic loading, the severely damaged outer grout cracked and detached rapidly and could no longer be regarded as load-bearing material. In that study, the effective thickness of the severely deteriorated surface region was determined at different FTC levels, and its variation with FTC number was fitted to obtain the following empirical relationship:
where hf,N represents an equivalent mean damaged-layer thickness rather than local spalling depth; spatial variability is not explicitly considered.
3.2. Constitutive Models
3.2.1. Reinforcing Steel
Longitudinal reinforcing bars in both parts of the composite section were modelled with OpenSees Steel02, which adopts the Giuffré–Menegotto–Pinto cyclic formulation with isotropic hardening. Its normalised stress–strain relationship is expressed by Equations (6)–(8).
where σs and εs are the steel stress and strain, respectively; hr is the strain-hardening ratio, defined as the ratio of the hardening slope E1 to the initial elastic modulus E0; (σs,0, εs,0) is the intersection of the lines with slopes E0 and E1; (σs,r, εs,r) is the reversal point of the preceding loading branch; and Rs controls the curvature of the elastic–plastic transition.
Steel02 was defined using the measured yield strength, elastic modulus, and strain-hardening ratio; the cyclic transition parameters R0, CR1, and CR2 were assigned values of 18.5, 0.925, and 0.15, respectively.
3.2.2. Concrete
Concrete04 was assigned to the original-column concrete. The material combines a Popovics-type compressive envelope with the Karsan–Jirsa unloading/reloading rules, thereby accounting for cyclic stiffness degradation. Equation (9) defines the compressive envelope adopted herein.
where σc,c and εc,c are the concrete stress and strain; fcc,c and εcc,c are the confined-concrete peak stress and corresponding strain; and r1 is the ascending-branch shape parameter.
The confinement-induced modification of the concrete peak response was evaluated following Mander et al. [41], with the confined peak strain and stress obtained from Equations (10) and (11), respectively.
where fc,c and εc0,c are the peak stress and strain of the corresponding unconfined concrete, and fl′ is the effective lateral confining stress supplied by the spiral reinforcement.
The initial elastic modulus, peak stress, peak strain, and ultimate strain of the unconfined concrete were determined from Ref. [41]. Concrete tensile strength was neglected in the present simulations. This simplification is appropriate for the present emphasis on the global axial–flexural response of columns subjected to sustained axial compression, for which the post-cracking tensile resistance is predominantly provided by the longitudinal reinforcement.
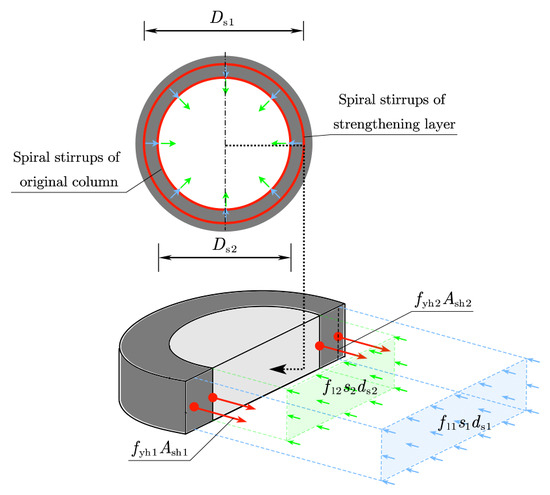
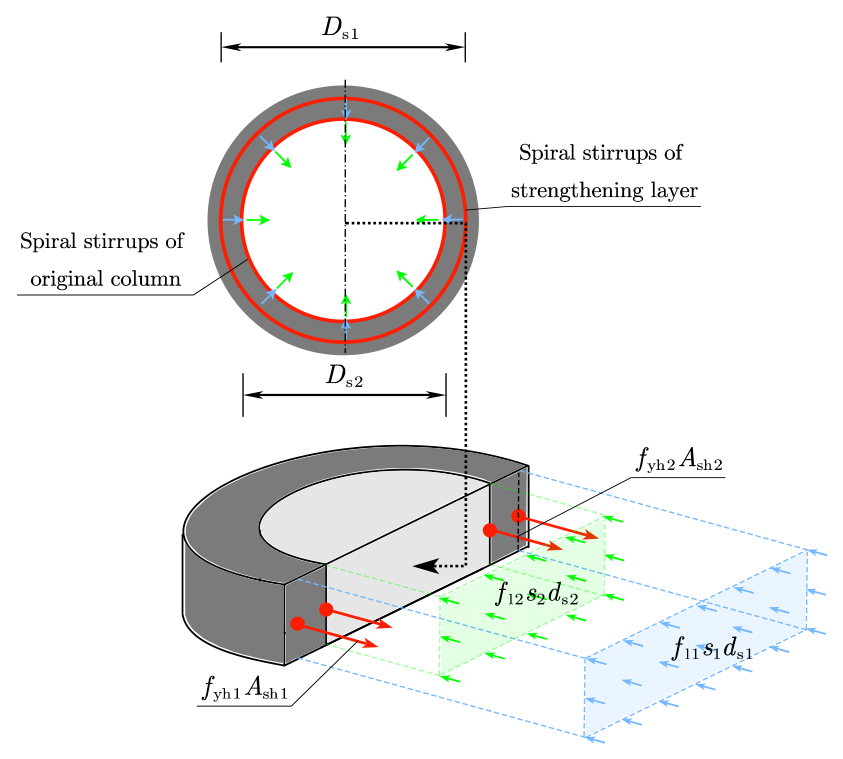
After jacketing, the original-column concrete is confined by both the original spiral stirrups and the spiral stirrups in the jacket. The effective lateral pressure from these two reinforcement layers must therefore be combined when calibrating the constitutive response. For determination of the peak parameters of the confined-concrete constitutive envelope, the confinement capacities of the original and jacket spiral reinforcement were represented by an equivalent lateral pressure. Previous cyclic tests on cementitious grout-jacketed RC columns showed that the jacket stirrups were mobilised earlier than the original-column stirrups, but both reinforcement systems reached yielding before the peak load was attained [42]. Therefore, their fully mobilised confinement contributions were superposed to estimate the effective confinement level governing the peak response, as illustrated in Figure 9.
Figure 9.
Confinement mechanism of the double-layer spiral stirrups.
The effective lateral confining stress fld′ acting on the original-column concrete was obtained by superposing the contributions of the jacket and original spiral stirrups. The resulting expression is given by Equation (12).
where fyh1 and fyh2 denote the yield strengths of the stirrups in the jacket and the original column, respectively; s1′ and s2′ represent the clear spacing of stirrups in the jacket and the original column, respectively; Ds1 and Ds2 indicate the diameters of the core regions of the jacket and the original column, respectively; ρcc1 and ρcc2 refer to the longitudinal reinforcement ratios in the stirrup-confined core regions of the jacket and the original column, respectively; ρs1 and ρs2 correspond to the volumetric stirrup ratios in the stirrup-confined core regions of the jacket and the original column, respectively.
Equation (12) extends the single-layer Mander confinement formulation by superposing the effective lateral-pressure contributions of the two spiral systems. It should be noted that Equation (12) represents an equivalent confinement level for determining the peak constitutive parameters and does not imply simultaneous mobilisation or strictly uniform radial pressure from the two transverse reinforcement systems throughout cyclic loading.
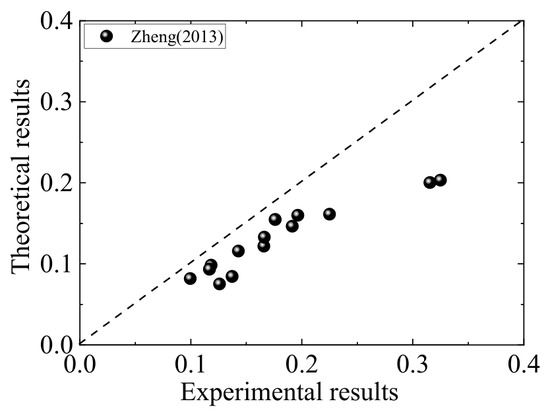
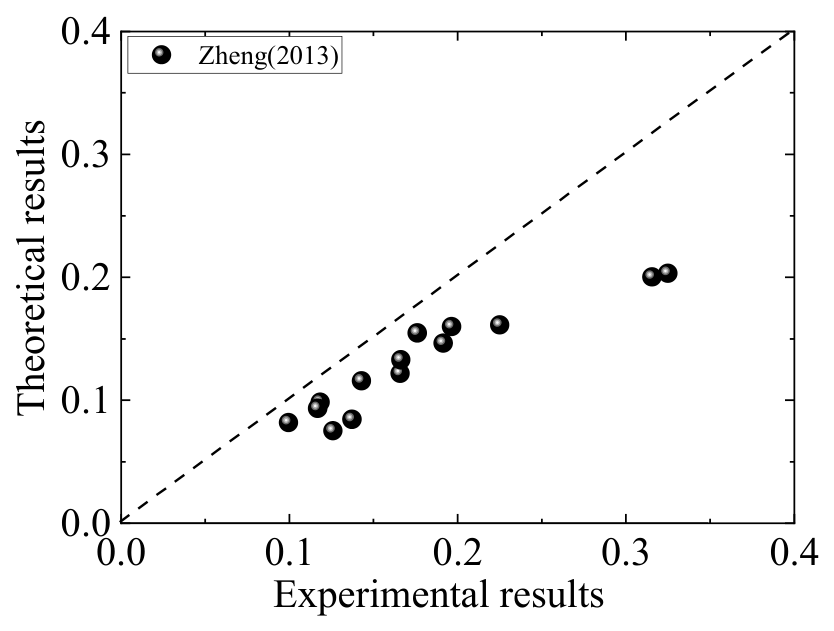
The double-layer confinement expression was evaluated using the independent tests reported by Zheng [43]. That study examined the effects of inner and outer volumetric stirrup ratios and concrete strength on the axial response of columns confined by two spiral layers. A strength-enhancement coefficient was defined as the increase in axial compressive strength relative to an otherwise comparable specimen confined only by the outer spiral. The coefficients predicted by Equation (12) are compared with the measured values in Figure 10. The predictions are close to, and generally lower than, the measured values, indicating that the proposed superposition provides an accurate and conservative estimate of double-layer confinement. Zhou et al. [44] likewise reported effective mobilisation of both spirals under axial and low-eccentric loading, further supporting the combined confinement treatment. However, validation remains limited to the available configurations and should be extended to wider reinforcement ratios and material strengths.
Figure 10.
Validation of the effective lateral confinement model for double-layer spiral stirrups using the experimental data reported by Zheng [43].
For each strengthened-column section, the effective lateral confining stress was calculated from the actual reinforcement arrangement. This pressure was combined with the depth-dependent unconfined compressive strength obtained from the layered damage model to determine the Concrete04 parameters for the original-column concrete.
3.2.3. Cementitious Grout
Compared with conventional concrete, the grout shows a steeper loss of compressive resistance after the peak. Its confined response was therefore described using the grout-specific model established in Ref. [27]. The formulation retains a Popovics-type ascending branch, while its descending branch was separately calibrated to reproduce the post-peak behaviour of the cementitious grout.
The ascending branch is expressed in Equation (13).
where σc,g and εc,g are the compressive stress and strain of the cementitious grout; fcc,g and εcc,g are the corresponding confined peak stress and strain, calculated from Equations (17) and (18); and r1 is the ascending-branch shape parameter given by Equation (14).
The modified descending branch is expressed in Equation (15). Its shape parameter r2 accounts for the influence of the effective lateral confining stress on post-peak degradation.
Regression of the confined-cementitious grout test data in Ref. [27] produced the relationship between r2 and the normalised effective confinement shown in Equation (16).
The confined-cementitious grout peak stress was calibrated against the corresponding material tests, giving Equation (17).
where fc,g is the peak compressive strength of the corresponding unconfined cementitious grout.
The peak strain of confined cementitious grout was obtained by calibrating a conventional confined-concrete strain relationship against the grout tests, as given by Equation (18).
where εc0,g is the peak strain of unconfined cementitious grout.
The initial elastic modulus, peak stress, peak strain, and ultimate strain of the unconfined cementitious grout were determined from Ref. [27]. The tensile resistance of cementitious grout was likewise neglected, with the same implications for cyclic crack opening/closure as discussed for concrete above.
To implement this constitutive model, an ActiveTcl V8.6.13 runtime environment was established, and the OpenSees V3.5.0 source code was modified and recompiled using Visual Studio 2022 V17.10.5. The cementitious grout model was added to the uniaxial material library and assigned the same unloading and reloading rules as Concrete04. Its input parameters comprise peak compressive strength, peak strain, ultimate strain, initial elastic modulus, and the descending-branch shape parameter. At each fibre location, these parameters were calculated from the layered damage function and the confinement supplied by the spiral reinforcement.
3.3. Element and Fiber-Section Formulation
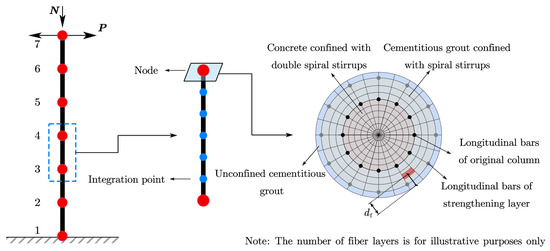
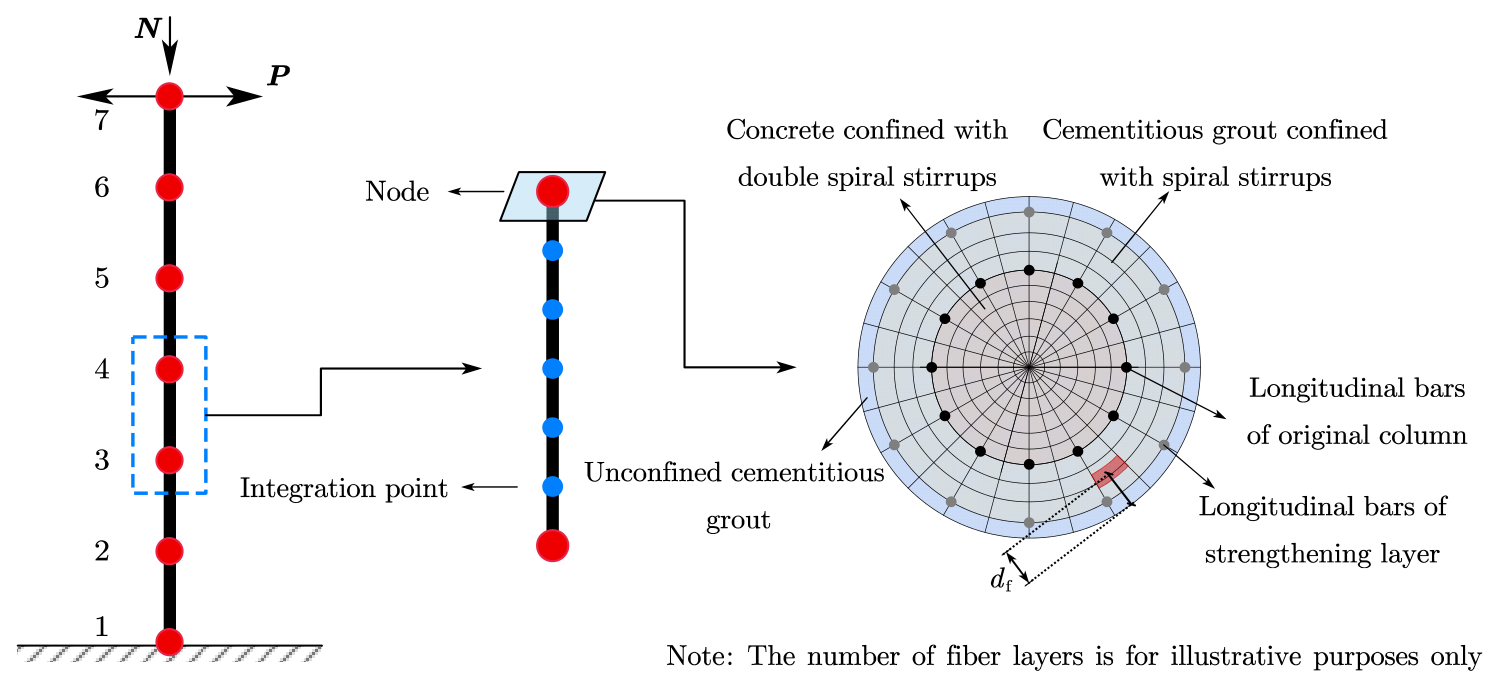
The strengthened member was discretised using displacement-based nonlinear beam–column elements, allowing distributed plasticity to develop under combined axial force and bending. Trial discretisations were examined with regard to solution stability, spatial resolution, and computational cost. The adopted mesh therefore comprised six member elements, seven nodes, and five integration points within each element (Figure 11), with sectional response evaluated through fibre discretisation. The section was represented by fibres. Because part of the original concrete cover was removed and replaced by high-strength grout during strengthening, the interface between the original column and the jacket was idealised at the centreline of the original longitudinal reinforcement. Considering the surface roughening and interface dowel reinforcement adopted in the strengthened specimens, a perfect bond was assumed between the original concrete and the grout jacket, and interfacial slip was therefore neglected in the present model. Recent studies have further highlighted the importance of interfacial load-transfer mechanisms and model interpretability in complex structural systems [45,46], providing useful perspectives for future refinement of the interface representation and interpretation of key model parameters. To represent the measured non-uniform damage, the material parameters of each grout or concrete fibre were assigned according to its distance from the external surface and its freeze–thaw history. The section was divided into 60 circumferential sectors, while the radial layers were spaced at approximately 5 mm. The same discretisation scheme was used for all validation specimens. The damaged-layer thickness, grout constitutive parameter, and fibre discretisation density affect different aspects of the predicted response, including sectional capacity, post-peak behaviour, and numerical resolution, respectively. A systematic sensitivity analysis would be valuable in future work to further quantify the relative influence of these parameters on the hysteretic prediction.
Figure 11.
Element type and section discretisation.
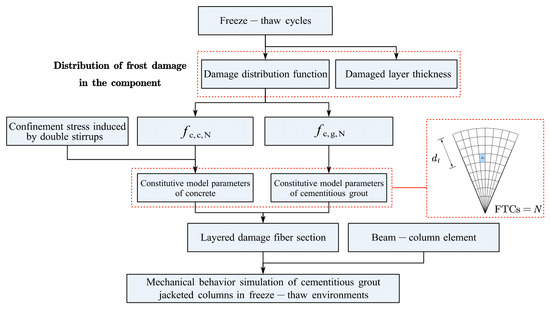
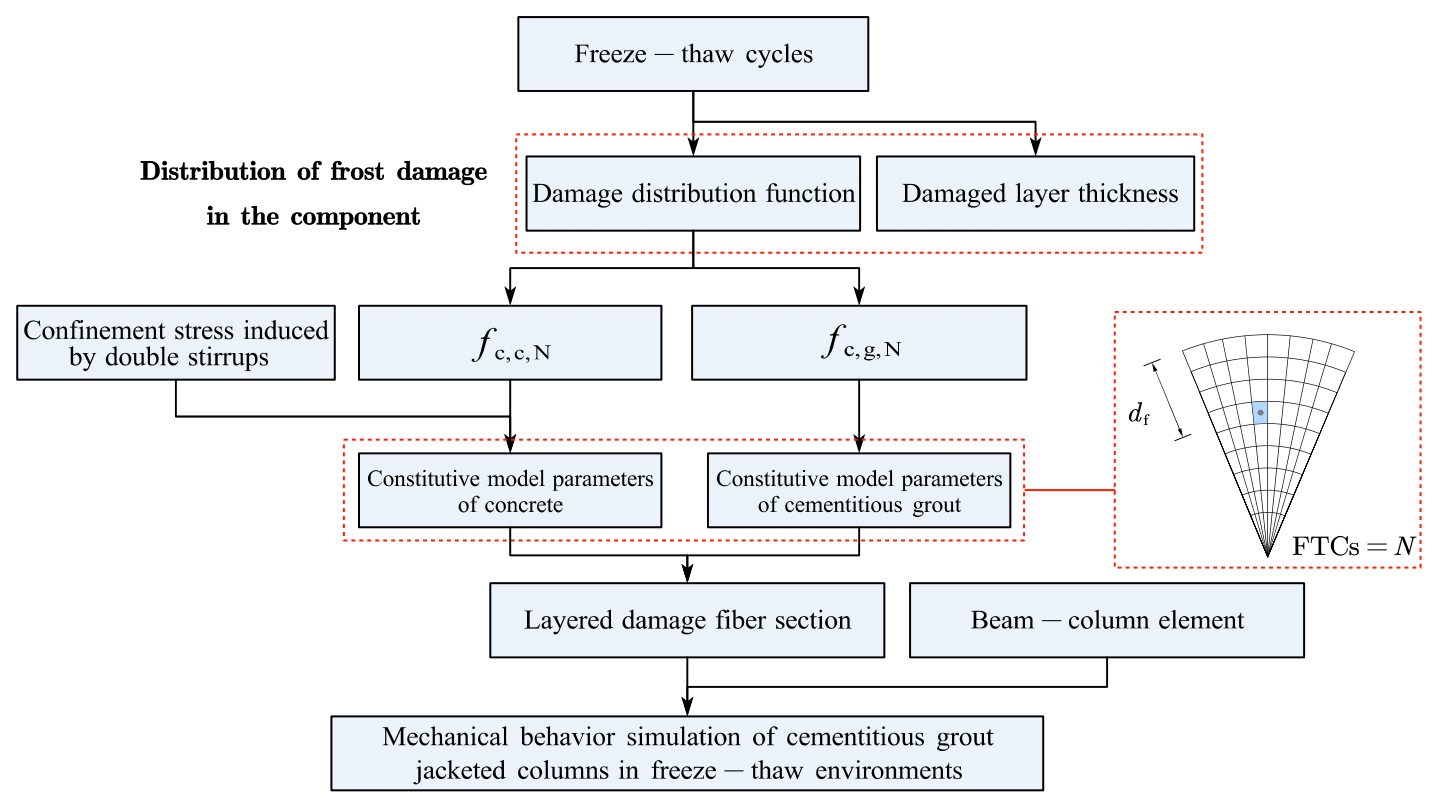
The modelling procedure is summarised in Figure 12. The layered damage function and damaged-layer thickness were first used to determine the residual section dimensions and the spatial distribution of material strength. The constitutive parameters of the cementitious grout and concrete fibres were then evaluated at their respective locations, including the confinement effects of the spiral reinforcement. These fibres were assembled into the composite section, which was assigned to the nonlinear beam–column elements to simulate the cyclic axial–flexural response of the strengthened column.
Figure 12.
Numerical modelling procedure for freeze–thaw-affected cementitious grout-jacketed columns.
4. Model Validation
4.1. Validation Specimens and Test Program
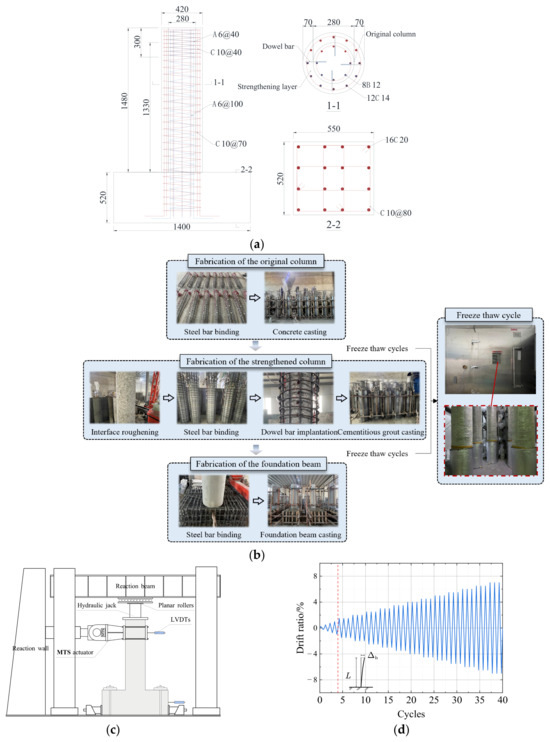
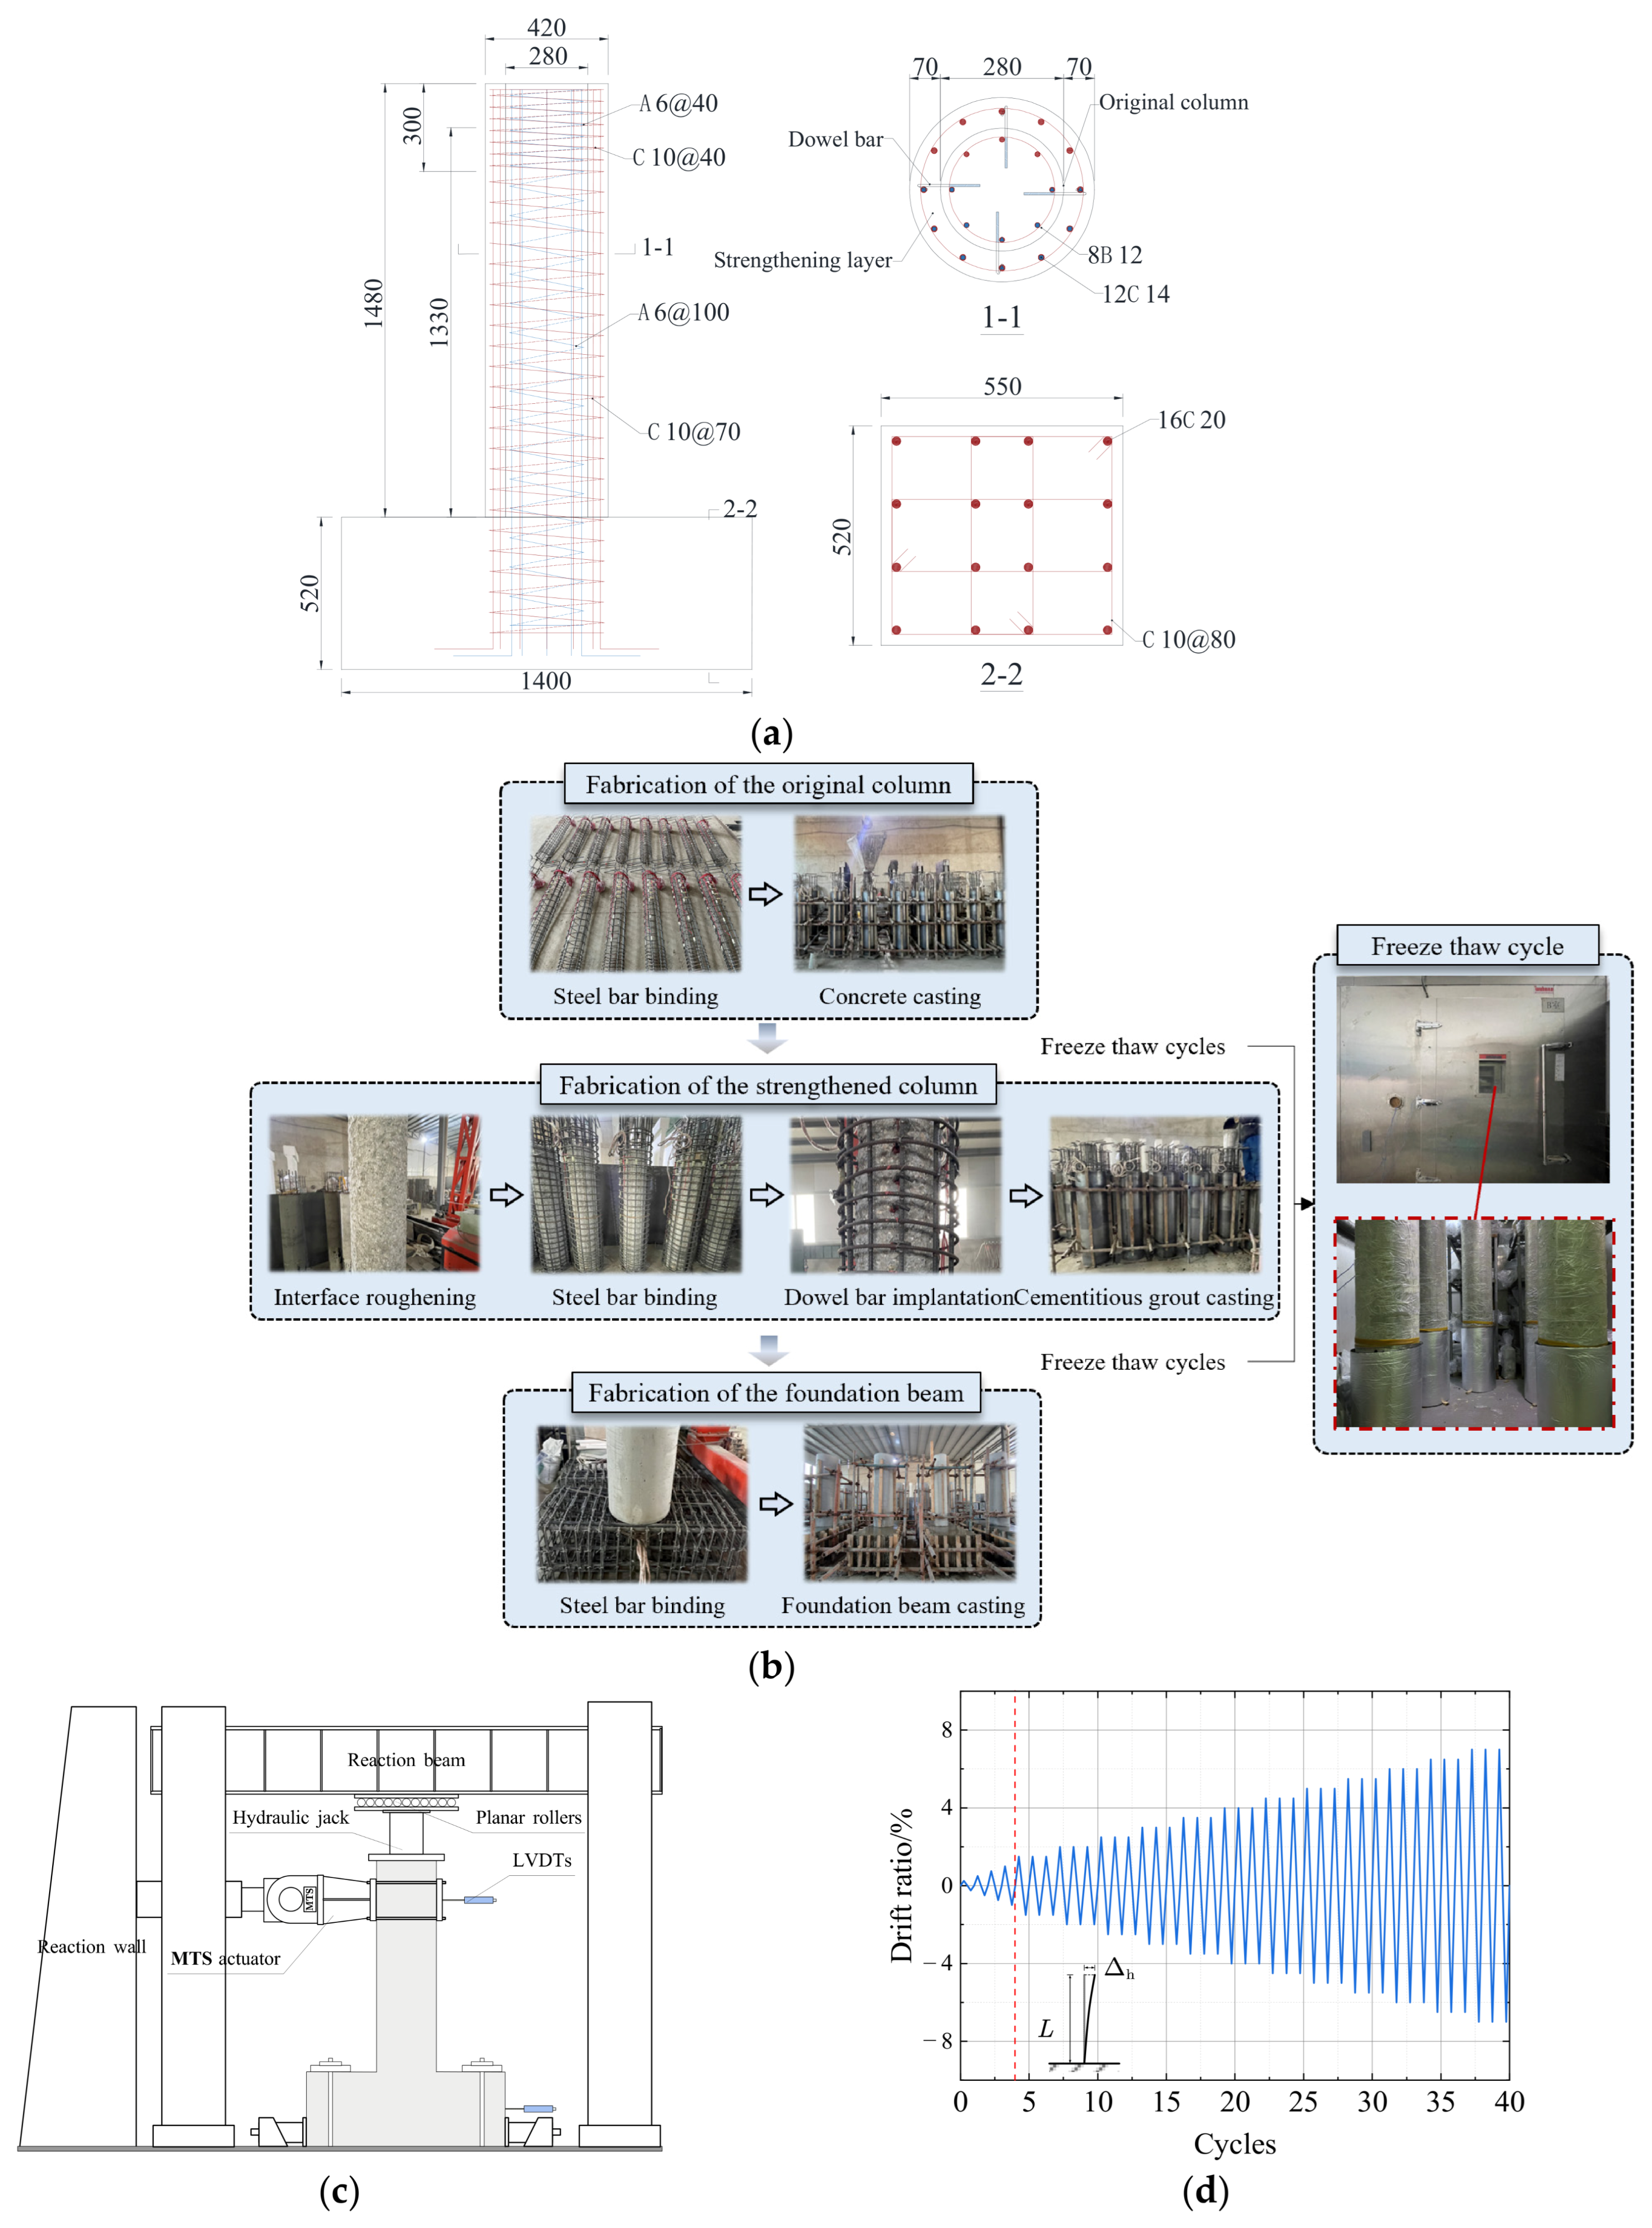
The proposed framework was validated against five cementitious grout-jacketed RC columns with different freeze–thaw histories before and after strengthening. All specimens exhibited predominantly flexural failure. Their geometry, reinforcement arrangement, preparation sequence, and loading setup are shown in Figure 13, while the principal test variables are listed in Table 3. Specimen C-1 was not exposed to FTCs. Specimen C-2 underwent 160 cycles before strengthening and no subsequent cycles, whereas C-3, C-4, and C-5 underwent 160 cycles before strengthening, followed by 80, 160, and 240 cycles after strengthening, respectively. In Table 3, No and Ns denote the numbers of cycles applied before and after strengthening.
Figure 13.
Details of the validation specimens (dimensions in mm): (a) specimen design; (b) preparation sequence; (c) loading setup; (d) loading curve.
Table 3.
Test variables and peak-load comparison of the validation specimens.
4.2. Validation of the Numerical Model
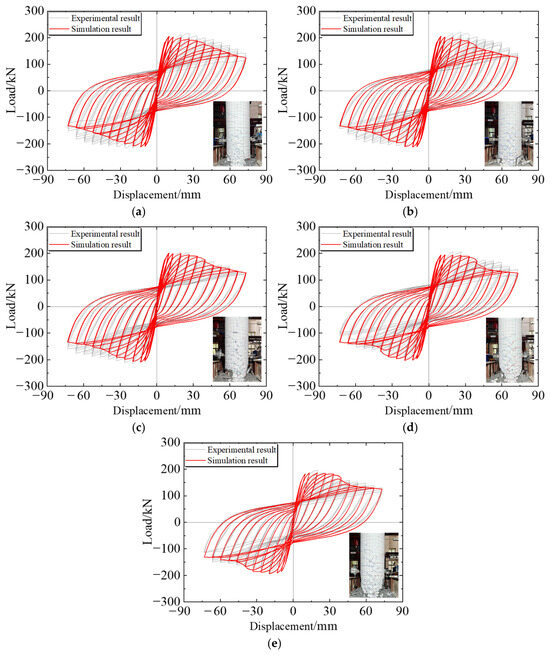
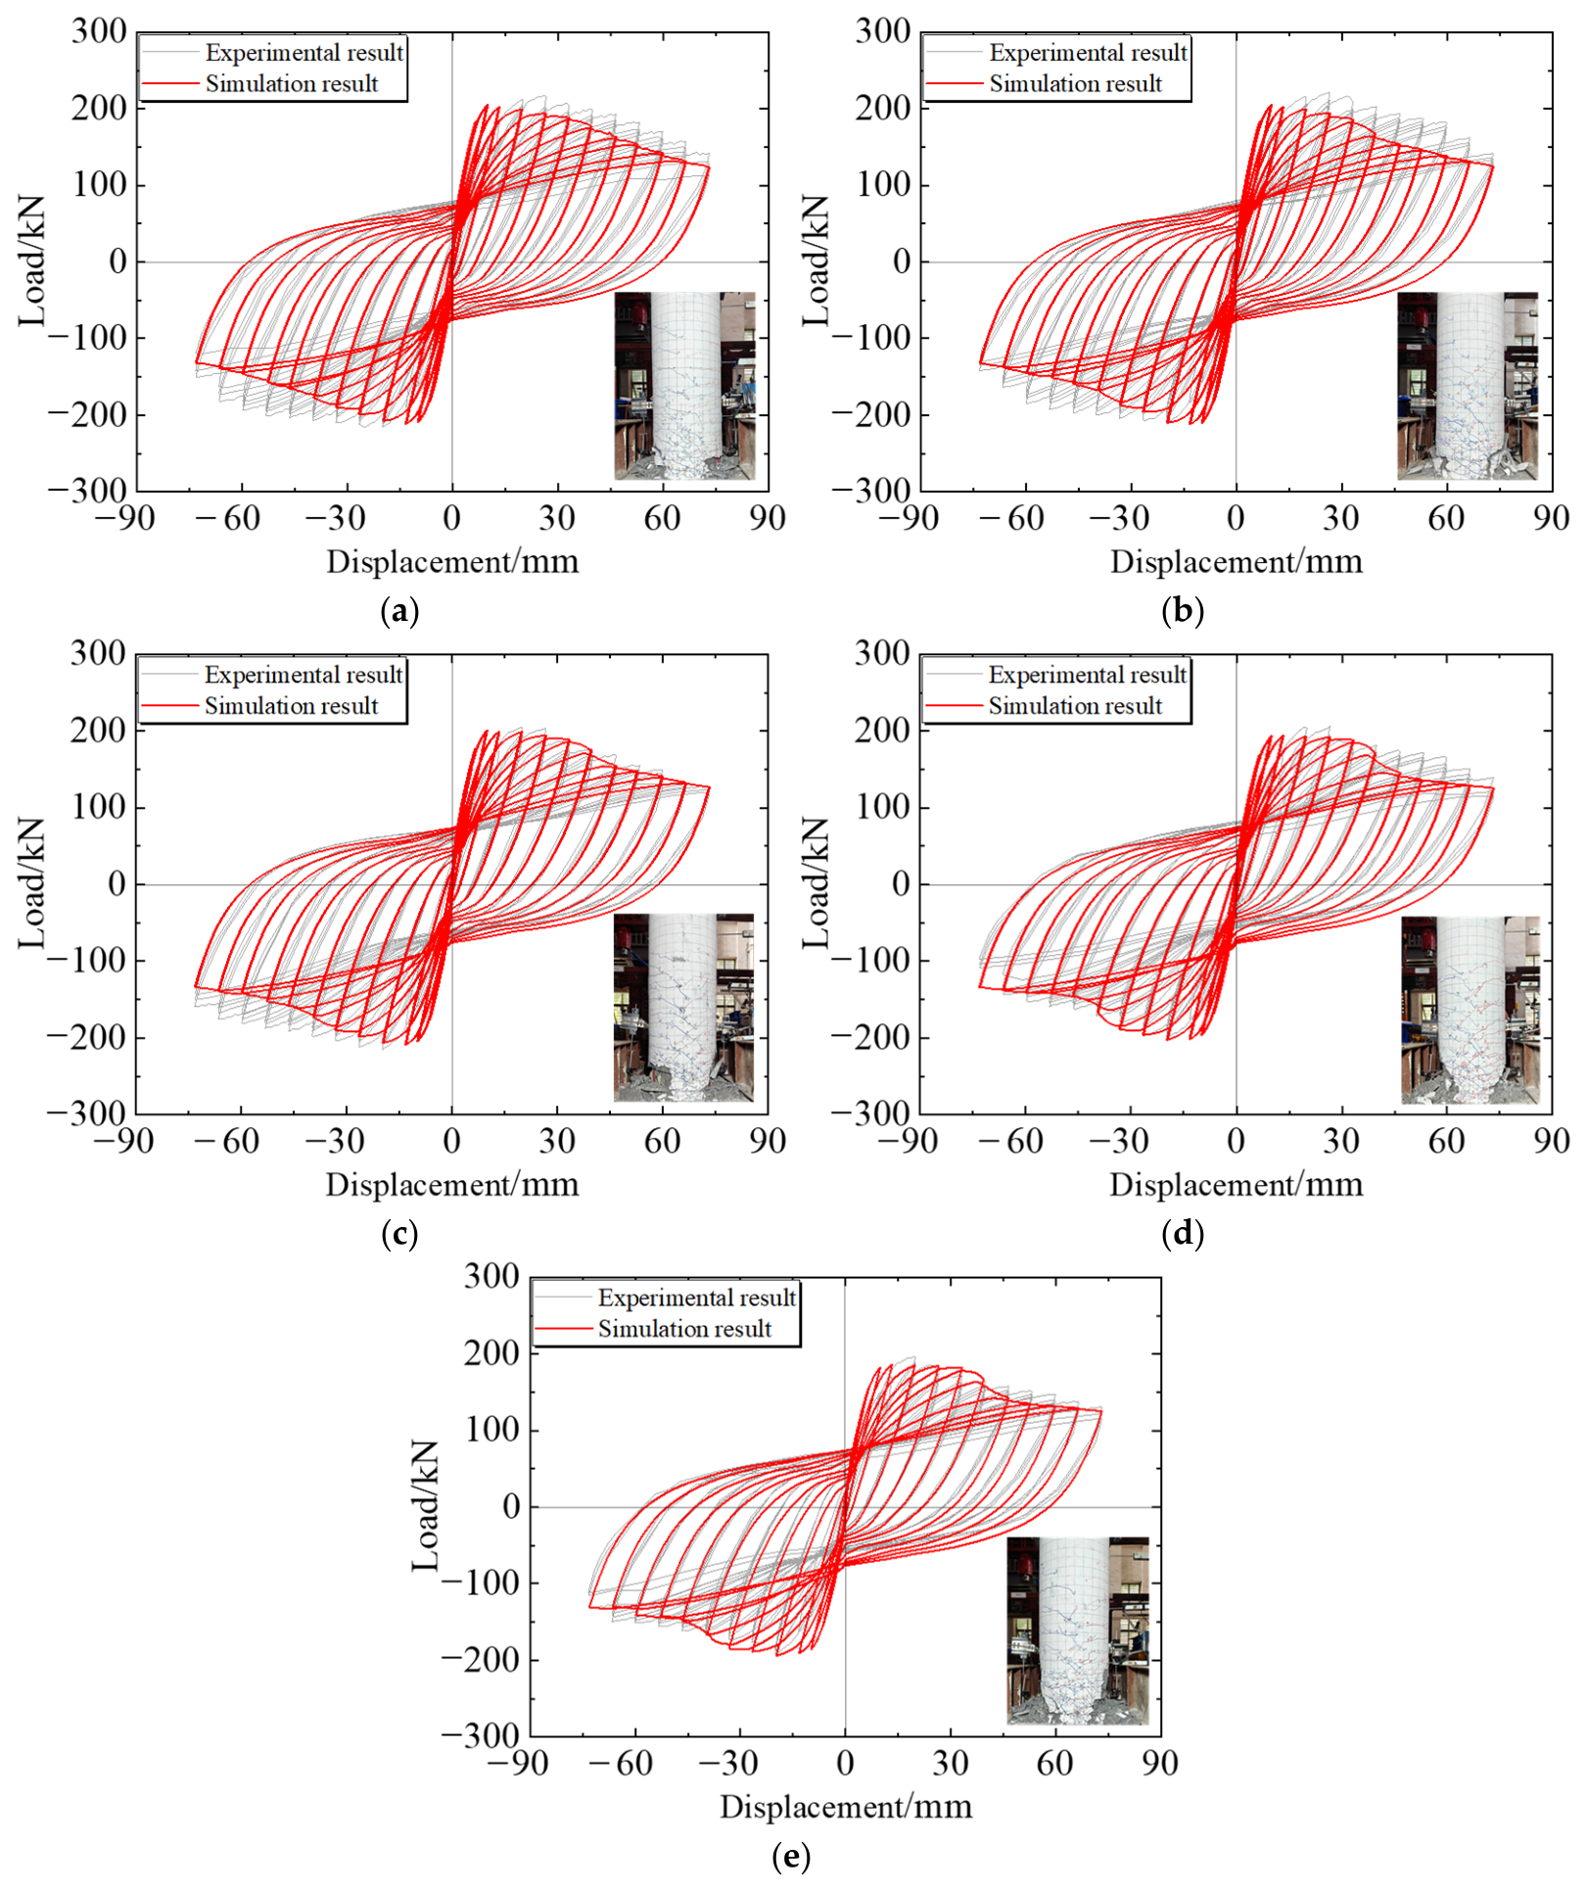
Numerical models were established using the measured material properties and geometric parameters of each specimen and were subjected to the same constant axial load and lateral displacement history as those applied in the tests. Figure 14 compares the simulated and measured hysteretic responses and also presents the observed failure patterns of the test specimens.
Figure 14.
Comparison of simulated and measured hysteretic responses: (a) C-1; (b) C-2; (c) C-3; (d) C-4; (e) C-5.
All specimens exhibited predominantly flexural failure, and no obvious interfacial slip or macroscopic debonding between the original concrete and the grout jacket was observed. Therefore, for grout-jacketed RC columns with interface dowel reinforcement and surface roughening similar to those adopted in this study, interfacial slip can be reasonably neglected within the investigated range. Only limited differences were observed between C-1 and C-2, indicating that pre-existing freeze–thaw damage in the original column had a minor influence on the post-strengthening cyclic response. However, C-2 exhibited fewer full post-peak hysteresis loops, likely because progressive grout crushing increased the influence of the degraded original concrete. From C-2 to C-5, increasing post-strengthening FTCs progressively reduced peak resistance, accelerated post-peak degradation, and reduced hysteretic-loop fullness. Consistent with this trend, the experimental cumulative energy dissipation at Δh/L = 5.5% decreased by 8.2% after 240 post-strengthening FTCs compared with the corresponding specimen without post-strengthening freeze–thaw exposure. These trends provide a useful basis for evaluating whether the numerical framework can capture the effects of the accumulated freeze–thaw damage history.
The numerical model reasonably reproduced the overall hysteretic trends, peak resistance, and stiffness degradation of all five specimens. The individual simulated and measured peak loads are summarised in Table 3. The average ratio of the simulated to measured peak load was 0.973, and the prediction error for each specimen was less than 5%. These comparisons support the applicability of the proposed framework for predicting the global cyclic response of cementitious grout-jacketed RC columns subjected to different pre- and post-strengthening freeze–thaw histories. It should be noted that some discrepancies remain in the unloading/reloading branches and the post-peak degradation stage. The former are partly associated with the neglect of concrete and grout tensile resistance, which may affect crack opening and closure and cyclic stiffness, whereas the latter are more closely related to the simplified representation of material degradation and the fact that the fibre beam–column formulation does not explicitly represent localised crack propagation and damage evolution. Therefore, the present model is more suitable for evaluating global cyclic response and strength degradation than for reproducing detailed local cracking and damage evolution in the post-peak stage.
4.3. Parametric Analysis
To further examine the applicability of the proposed framework and quantify the influence of key strengthening parameters, additional parametric analyses were conducted considering the freeze–thaw damage of the original column and the strengthening thickness. The investigated cases are summarised in Table 4.
Table 4.
Parameters considered in the extended numerical analysis.
4.3.1. Influence of Freeze–Thaw Damage of the Original Column
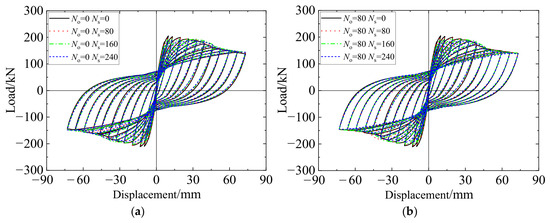
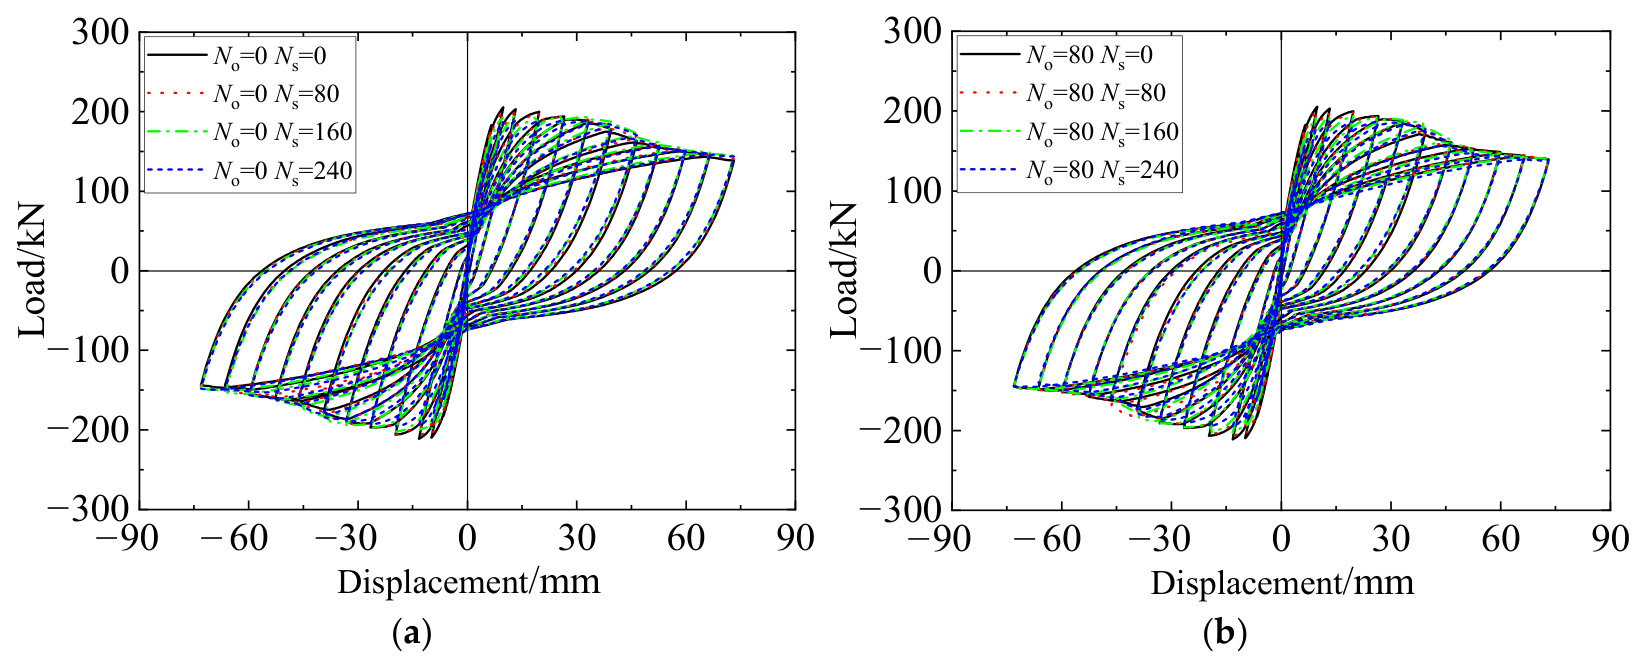
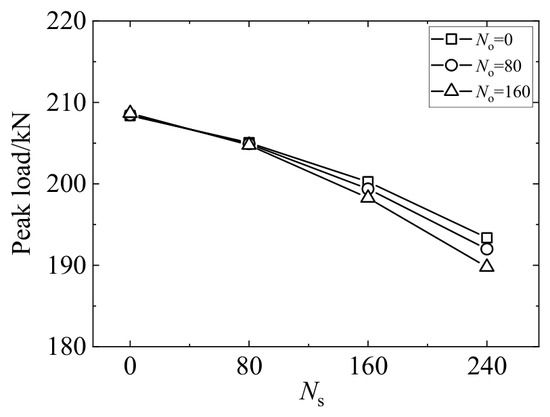
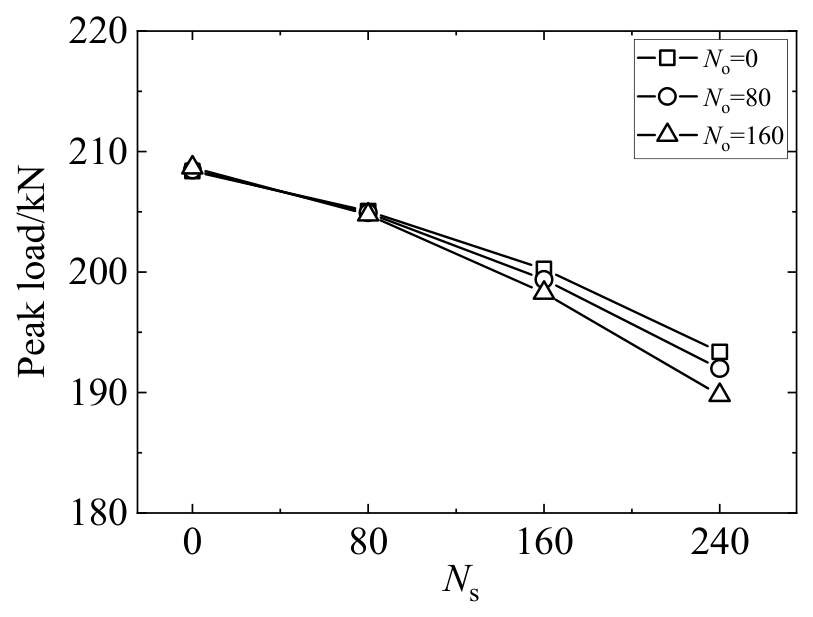
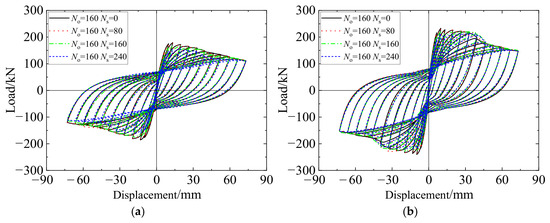
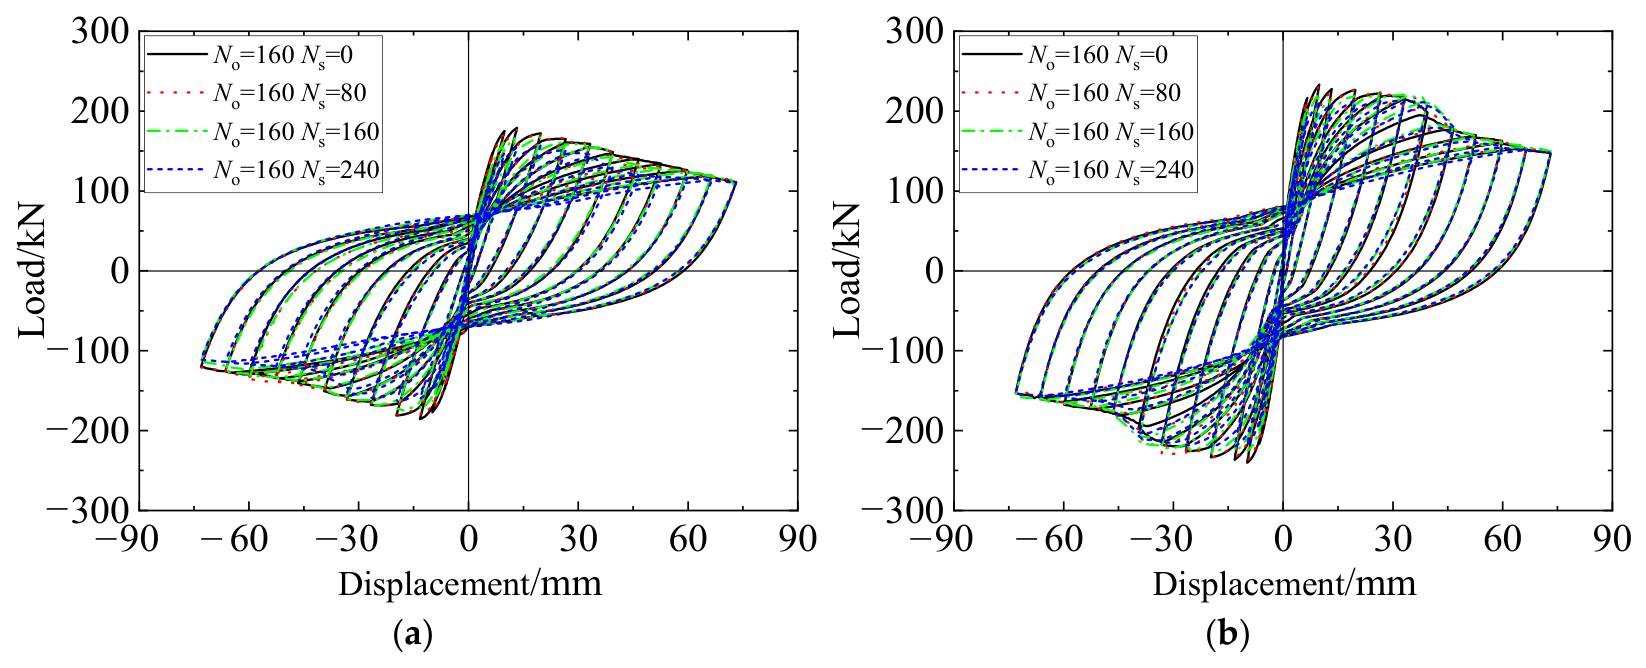
Figure 15 and Figure 16 show the hysteretic responses and peak-load variations in grout-jacketed RC columns with different levels of freeze–thaw damage of the original column. As summarised in Table 4, the original columns were subjected to 0, 80, or 160 FTCs before strengthening and were subsequently exposed to 0, 80, 160, or 240 FTCs after strengthening. The geometry, reinforcement arrangement, and loading parameters were based on specimen C-1. The cases with 160 pre-strengthening FTCs correspond to the freeze–thaw histories represented by specimens C-2 to C-5.
Figure 15.
Influence of pre-existing freeze–thaw damage of the original column on the hysteretic response of cementitious grout-jacketed RC columns: (a) No = 0; (b) No = 80.
Figure 16.
Influence of pre-existing freeze–thaw damage of the original column on the peak load of cementitious grout-jacketed RC columns.
The freeze–thaw damage of the original column has only a limited influence on the initial peak load after strengthening. However, increasing freeze–thaw damage of the original column leads to fewer full hysteretic loops and more rapid post-peak strength degradation. After 240 post-strengthening FTCs, the peak loads of columns whose original members had experienced 0, 80, and 160 FTCs decreased by 7.2%, 7.9%, and 9.1%, respectively. These results indicate that freeze–thaw damage of the original column has a relatively minor effect on the initial load-carrying capacity after strengthening but accelerates subsequent strength deterioration under continued freeze–thaw exposure and therefore reduces the freeze–thaw durability of the strengthened column.
4.3.2. Influence of Strengthening Thickness
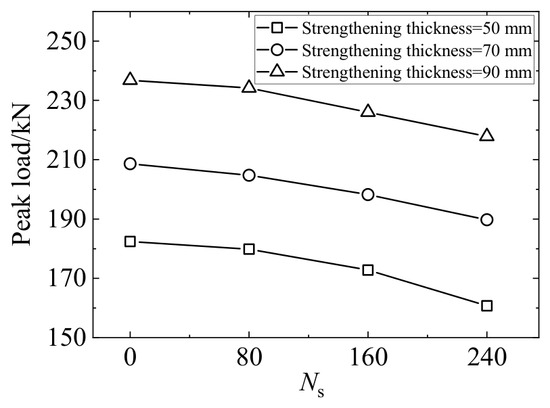
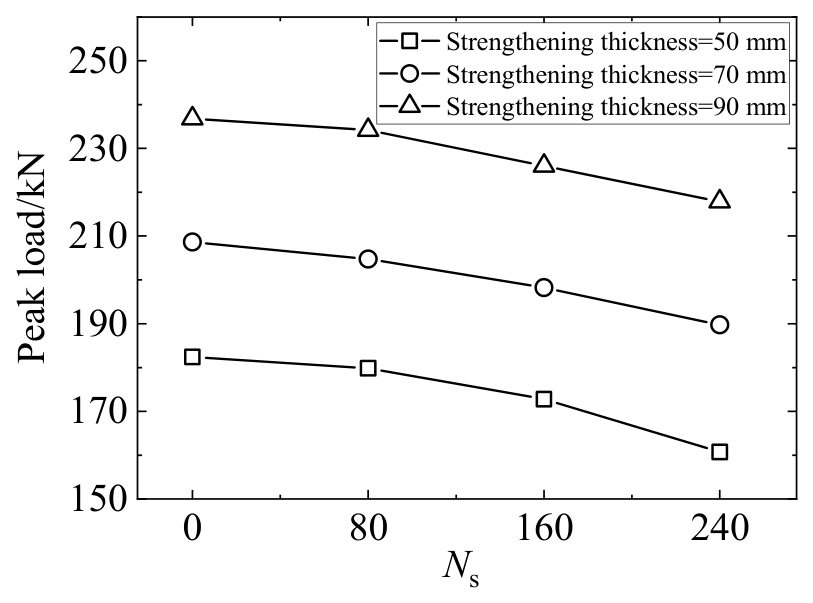
Figure 17 and Figure 18 show the hysteretic responses and peak-load variations in strengthened columns with different strengthening thicknesses. Strengthening thicknesses of 50, 70, and 90 mm were considered. The reinforcement arrangement was kept consistent with that of specimen C-1, while the axial load was adjusted to maintain the same axial-load ratio. In all cases, the original columns were subjected to 160 FTCs before strengthening and subsequently exposed to 0, 80, 160, or 240 FTCs after strengthening.
Figure 17.
Influence of strengthening thickness on the hysteretic response of cementitious grout-jacketed RC columns subjected to freeze–thaw cycles: (a) 50 mm; (b) 90 mm.
Figure 18.
Influence of strengthening thickness on the peak load of cementitious grout-jacketed RC columns subjected to freeze–thaw cycles.
The peak load decreases with increasing post-strengthening FTCs for all strengthening thicknesses, whereas increasing the strengthening thickness reduces the rate of strength degradation. After 240 FTCs, the peak loads of columns with strengthening thicknesses of 50, 70, and 90 mm decreased by 11.9%, 9.1%, and 8.0%, respectively. This trend is consistent with the depth-dependent nature of freeze–thaw deterioration: a greater strengthening thickness increases the distance between the original concrete and the exposed surface, thereby reducing the deterioration rate of the inner concrete. In addition, the proportion of frost-resistant grout within the compression zone increases with strengthening thickness under combined axial compression and bending. Accordingly, an appropriate increase in strengthening thickness can improve the load-retention capacity and freeze–thaw durability of grout-jacketed RC columns.
5. Conclusions
An experimentally informed numerical framework was developed for cementitious grout-jacketed RC columns with layered freeze–thaw damage. The principal findings are as follows:
(1) Unidirectional freeze–thaw tests on A60 cementitious grout and C30, C45 and C60 concrete confirmed that strength deterioration was strongly depth dependent. Splitting tensile strength decreased most rapidly near the exposed surface and progressively less towards the interior. A response-surface model incorporating FTC number and depth was established and reproduced the measured damage profiles for both grout and concrete.
(2) The experimentally derived tensile-strength profile was converted into an axial-compressive-strength distribution and incorporated into a layered fibre section. The framework also accounts for the ineffective, severely damaged surface layer, the change in damage history caused by jacketing, the constitutive response of confined cementitious grout, and the combined confinement of the original and jacket spiral stirrups. Validation against independent double-spiral confinement data showed that the proposed superposition of lateral pressures was accurate and conservative.
(3) The OpenSees implementation reproduced the measured hysteretic responses of five grout-jacketed RC columns with different freeze–thaw histories before and after strengthening. The average simulated-to-measured peak-load ratio was 0.973, and all peak-load errors were below 5%. The results support the use of the framework for nonlinear analysis of cementitious grout-jacketed RC columns subjected to layered freeze–thaw deterioration.
(4) The parametric analyses showed that more severe pre-strengthening freeze–thaw damage accelerated the subsequent loss of load-carrying capacity, whereas increasing the strengthening thickness reduced the rate of peak-load degradation under continued freeze–thaw exposure.
The present framework has been validated for cementitious grout-jacketed RC columns exhibiting predominantly flexural failure. Its applicability to members governed by shear failure, pronounced flexure–shear interaction, or significant reinforcement-slip effects remains to be further examined through model development and dedicated experimental validation.
Author Contributions
Conceptualisation, X.H.; methodology, S.Z.; software, S.Z.; validation, S.Z., X.H. and G.P.; formal analysis, S.Z.; investigation, S.Z. and T.Z.; resources, X.H. and G.P.; data curation, S.Z., T.Z. and Z.C.; writing—original draft preparation, S.Z.; writing—review and editing, X.H., G.P., Y.X., Z.C. and Z.W.; supervision, X.H.; project administration, X.H.; funding acquisition, X.H., G.P. and Z.W. All authors have read and agreed to the published version of the manuscript.
Funding
This research was funded by the Scientific Research Plan Projects of Shaanxi Education Department, grant number 23JS030; the National Natural Science Foundation of China, grant numbers 52078412 and 52308169; the Natural Science Foundation of the Hebei Province, grant number E2024404007; and the Program for Changjiang Scholars and Innovative Research Team in the University of China, grant number IRT_17R84.
Data Availability Statement
The original contributions presented in this study are included in the article. Further inquiries can be directed to the corresponding author.
Conflicts of Interest
The authors declare no conflicts of interest.
References
- Pigeon, M.; Pleau, R. Durability of Concrete in Cold Climates; Taylor & Francis: Oxford, UK, 1995. [Google Scholar]
- Wang, T.; Hu, M.; Jia, X.; Bi, K.; Han, Q.; Du, X. Time-Varying Seismic Fragility and Risk Analysis of Precast Concrete Bridges under the Coupling of Chloride Corrosion and Freeze-Thaw Cycles. Eng. Struct. 2025, 335, 120413. [Google Scholar] [CrossRef] [Scilit]
- Li, X.; Gu, X.; Xia, X.; Madenci, E.; Chen, A.; Zhang, Q. Peridynamic Simulation of Micro-Internal Damage and Macro-Mechanical Properties of Cement Paste under Freeze-Thaw Cycles. J. Build. Eng. 2024, 93, 109759. [Google Scholar] [CrossRef] [Scilit]
- Wang, R.; Hu, Z.; Li, Y.; Wang, K.; Zhang, H. Review on the Deterioration and Approaches to Enhance the Durability of Concrete in the Freeze–Thaw Environment. Constr. Build. Mater. 2022, 321, 126371. [Google Scholar] [CrossRef] [Scilit]
- He, Z.; Zhang, L.; Cheng, C.; Chen, Y.; Jin, Y. Study on Mechanical Properties and Microcosmic Morphology of Polypropylene Fiber Reinforced Recycled Concrete after Freeze–Thaw Cycles. Eur. J. Environ. Civ. Eng. 2024, 28, 3412–3434. [Google Scholar] [CrossRef] [Scilit]
- Guo, J.; Sun, W.; Xu, Y.; Lin, W.; Jing, W. Damage Mechanism and Modeling of Concrete in Freeze–Thaw Cycles: A Review. Buildings 2022, 12, 1317. [Google Scholar] [CrossRef] [Scilit]
- Liu, X.; Lei, Y.; Sun, Y.; Zhou, J.; Niu, D. Influence of Freeze–Thaw Damage Gradient on Stress–Strain Relationship of Stressed Concrete. Front. Struct. Civ. Eng. 2023, 17, 1326–1340. [Google Scholar] [CrossRef] [Scilit]
- Liu, Z.; Dong, T.; Lv, Y.; Qi, X.; Shui, Z. Internal moisture evolution and humidity-dependent shrinkage behavior of metakaolin-modified ultra-high-performance concrete. Constr. Build. Mater. 2026, 541, 147873. [Google Scholar] [CrossRef] [Scilit]
- Zhang, C.; Wu, L.; Elchalakani, M.; Cai, J. Cyclic Loading Test for Reinforced Concrete Columns Strengthened with High-Strength Engineered Cementitious Composite Jacket. Eng. Struct. 2023, 278, 115571. [Google Scholar] [CrossRef] [Scilit]
- Zhang, J.; Li, Z.; Wang, F.; Zhuo, S.; Wang, T. Seismic Resilience Study of Piers Enhanced by Ultrahigh-Performance Concrete Jackets Based on Cyclic Loading Test and Static Push-Over Curves. Sci. Adv. Mater. 2022, 14, 1679–1691. [Google Scholar] [CrossRef] [Scilit]
- Yang, K.-H.; Hwang, S.-H.; Mun, J.-H. Seismic Behaviour of RC Jacketed Columns under Different Axial Loads. Mag. Concr. Res. 2021, 73, 879–889. [Google Scholar] [CrossRef] [Scilit]
- Jin, C.; Chen, Z.; Niu, P.; Zhou, P.; Ma, R. Experimental Investigation of the Fatigue Behavior of RC Beams Strengthened with CFRP Grid–PCM Composite After Freeze–Thaw Cycles. Buildings 2026, 16, 849. [Google Scholar] [CrossRef] [Scilit]
- Toutanji, H.; Balaguru, P. Durability Characteristics of Concrete Columns Wrapped with FRP Tow Sheets. J. Mater. Civ. Eng. 1998, 10, 52–57. [Google Scholar] [CrossRef] [Scilit]
- Qin, Q.; Zheng, S.; Li, L.; Dong, L.; Zhang, Y.; Ding, S. Experimental Study and Numerical Simulation of Seismic Behavior for RC Columns Subjected to Freeze-Thaw Cycles. Adv. Mater. Sci. Eng. 2017, 2017, e7496345. [Google Scholar] [CrossRef] [Scilit]
- Zhang, Y.; Zheng, S.; Rong, X.; Dong, L.; Zheng, H. Seismic Performance of Reinforced Concrete Short Columns Subjected to Freeze–Thaw Cycles. Appl. Sci. 2019, 9, 2708. [Google Scholar] [CrossRef] [Scilit]
- Xu, S.; Li, A.; Ji, Z.; Wang, Y. Seismic Performance of Reinforced Concrete Columns after Freeze–Thaw Cycles. Constr. Build. Mater. 2016, 102, 861–871. [Google Scholar] [CrossRef] [Scilit]
- Liu, K.; Yan, J.; Zou, C. A Pilot Experimental Study on Seismic Behavior of Recycled Aggregate Concrete Columns after Freeze-Thaw Cycles. Constr. Build. Mater. 2018, 164, 497–507. [Google Scholar] [CrossRef] [Scilit]
- Teng, F.; Qiu, W.-L.; Pan, S.-S.; Hu, H. Experimental Study on Seismic Performance of Precast Segmental Concrete Columns after Seawater Freeze-Thaw Cycles. Constr. Build. Mater. 2020, 260, 120482. [Google Scholar] [CrossRef] [Scilit]
- Petersen, L.; Lohaus, L.; Polak, M.A. Influence of Freezing-and-Thawing Damage on Behavior of Reinforced Concrete Elements. ACI Mater. J. 2007, 104, 369. [Google Scholar] [CrossRef] [Scilit] [PubMed]
- Gong, F.; Ren, M.; Maekawa, K. Simulation of Spatially Non-Uniform Frost Damage in RC Beams under Various Exposure and Confining Conditions. Eng. Struct. 2018, 176, 859–870. [Google Scholar] [CrossRef] [Scilit]
- Rong, X.; Li, L.; Zheng, S.; Wang, F.; Huang, W.; Zhang, Y.; Lu, D. Freeze–thaw Damage Model for Concrete Considering a Nonuniform Temperature Field. J. Build. Eng. 2023, 72, 106747. [Google Scholar] [CrossRef] [Scilit]
- Zhang, Y.; Zheng, S.; Li, L.; Dong, L.; Ji, J.; Ruan, S. Modeling the Lateral Behavior of Freeze-Thaw Damaged Reinforced Concrete Columns Including Reinforcement Slip and Shear Effects. Eng. Struct. 2021, 237, 112168. [Google Scholar] [CrossRef] [Scilit]
- Hu, H.; Wang, X.; Bao, Y.; Zuo, Y.; Zhang, P.; Qi, Q.; Deng, H. Transient analysis of cylindrical shells via a numerically stable discrete time state space technique. Thin-Walled Struct. 2026, 231, 115357. [Google Scholar] [CrossRef] [Scilit]
- Zuo, Y.; Wang, X.; Gao, S. Ultra-low-frequency noise control in cruise modular cabin with thickness-graded star-shaped metamaterials. Ocean Eng. 2026, 363, 126490. [Google Scholar] [CrossRef] [Scilit]
- Pigeon, M.; Lachance, M. Critical Air Void Spacing Factors for Concretes Submitted to Slow Freeze-Thaw Cycles. ACI J. Proc. 1981, 78, 282–291. [Google Scholar] [CrossRef] [Scilit] [PubMed]
- Nokken, M.R.; Hooton, R.D.; Rogers, C.A. Measured Internal Temperatures in Concrete Exposed to Outdoor Cyclic Freezing. Cem. Concr. Aggreg. 2004, 26, CCA11928. [Google Scholar] [CrossRef] [Scilit]
- Zhong, S. Seismic Performance of RC Columns Strengthened with Cementitious Grout Jacket in Freeze-Thaw Environments. Ph.D. Thesis, Xi’an University of Architecture and Technology, Xi’an, China, 2025. [Google Scholar]
- Liu, T.; Zhang, M.; Zou, D.; Liu, J.; Ou, J. Analysis and zonation of freeze–thaw action in the Chinese Plateau Region considering spatiotemporal climate characteristics. Engineering 2024, 42, 308–325. [Google Scholar] [CrossRef] [Scilit]
- Powers, T.C. A working hypothesis for further studies of frost resistance of concrete. ACI J. Proc. 1945, 41, 245–272. [Google Scholar] [CrossRef] [Scilit] [PubMed]
- Powers, T.C.; Helmuth, R.A. Theory of volume changes in hardened Portland-cement paste during freezing. Highw. Res. Board Proc. 1953, 32, 285–297. [Google Scholar]
- Litvan, G.G. Phase transitions of adsorbates: IV. Mechanism of frost action in hardened cement paste. J. Am. Ceram. Soc. 1972, 55, 38–42. [Google Scholar] [CrossRef] [Scilit]
- Setzer, M.J. Micro-ice-lens formation in porous solid. J. Colloid Interface Sci. 2001, 243, 193–201. [Google Scholar] [CrossRef] [Scilit]
- Fagerlund, G. The significance of critical degrees of saturation at freezing of porous and brittle materials. In Durability of Concrete; American Concrete Institute: Farmington Hills, MI, USA, 1975; pp. 13–65. [Google Scholar]
- Ge, X.; Su, W.; Lu, C. Frost resistance properties of hydraulic concrete under climate change conditions. Adv. Sci. Technol. Water Resour. 2015, 35, 37–40. [Google Scholar] [CrossRef]
- Pigeon, M.; Prevost, J.; Simard, J.-M. Freeze–thaw durability versus freezing rate. ACI J. Proc. 1985, 82, 684–692. [Google Scholar] [CrossRef] [Scilit] [PubMed]
- Mao, J.; Ayuta, K. Freeze–thaw resistance of lightweight concrete and aggregate at different freezing rates. J. Mater. Civ. Eng. 2008, 20, 78–84. [Google Scholar] [CrossRef] [Scilit]
- Şahin, Y.; Akkaya, Y.; Taşdemir, M.A. Effects of freezing conditions on the frost resistance and microstructure of concrete. Constr. Build. Mater. 2021, 270, 121458. [Google Scholar] [CrossRef] [Scilit]
- Guo, Z. Strength and Constitutive Relationship of Concrete; China Architecture and Building Press: Beijing, China, 2004. [Google Scholar]
- Vesikari, E. Service Life Design of Concrete Structure with Re-Gard to Frost Resistance of Concrete; Nordic Concrete Research: Oslo, Norway, 1986. [Google Scholar]
- Guan, X.; Niu, D.; Xiao, Q. Study on Concrete Freezing-Thawing Damage Layer Considering Residual Strength Correction and Constitutive Model under Axial Compression. J. China Railw. Soc. 2021, 43, 175–182. [Google Scholar]
- Mander, J.B.; Priestley, M.J.N.; Park, R. Theoretical Stress-strain Model for Confined Concrete. J. Struct. Eng. 1988, 114, 1804–1826. [Google Scholar] [CrossRef] [Scilit]
- Hu, X.; Zhong, S.; Peng, G.; Liu, X. Seismic behavior of reinforced concrete columns strengthened with cementitious grout jacket. Structures 2025, 79, 109644. [Google Scholar] [CrossRef] [Scilit]
- Zheng, Z. Axial Compressive Behavior and Finite Element Simulation of Circular Concrete Columns Confined by Double-Layer Stirrups. Master’s Thesis, Jiangxi University of Science and Technology, Ganzhou, China, 2013. [Google Scholar]
- Zhou, C.; Chen, Z.; Huang, Z.; Cai, L. Behavior of reinforced concrete columns with double spirals under axial and eccentric loads. J. Build. Eng. 2022, 51, 104280. [Google Scholar] [CrossRef] [Scilit]
- Hu, M.; Luo, J.; Zhu, S.; Zhai, W. Friction matching and competition at interfaces of railway fastening systems. Int. J. Mech. Sci. 2026, 323, 111715. [Google Scholar] [CrossRef] [Scilit]
- Wu, G.; Tan, Y.; Xu, Z.; Yuan, Z.; Zhang, J.; He, Y.; Wang, C. XAI-Aided Method for Accurately Assessing the Stability of Unlined Double Tunnels in Rock Masses. Transp. Geotech. 2026, 61, 102052. [Google Scholar] [CrossRef] [Scilit]

Disclaimer/Publisher’s Note: The statements, opinions and data contained in all publications are solely those of the individual author(s) and contributor(s) and not of MDPI and/or the editor(s). MDPI and/or the editor(s) disclaim responsibility for any injury to people or property resulting from any ideas, methods, instructions or products referred to in the content. |
© 2026 by the authors. Licensee MDPI, Basel, Switzerland. This article is an open access article distributed under the terms and conditions of the Creative Commons Attribution (CC BY) license.