


Abstract
Red mud, an alkaline industrial by-product of alumina refining generated in enormous volumes worldwide, poses a persistent environmental disposal challenge; using it as a partial cement replacement offers a promising route toward more sustainable concrete, but the resulting compressive strength is governed by complex, nonlinear interactions among the mix constituents that conventional empirical and regression-based models struggle to capture accurately. To address this challenge, the present study develops and compares four machine learning and deep learning models, namely the Deep Gradient Boosting Machine (DGBM), the Differentiable Neural Decision Tree (DNDT), Long Short-Term Memory (LSTM), and the Monte Carlo Dropout Neural Network (MCDNN), for the accurate and uncertainty-aware prediction of the compressive strength of red mud concrete. A dataset of 183 data points, compiled from the literature and supplemented with experimental results, was used to capture the influence of red mud content, curing period, and other mix parameters, including cement dosage, water content, and admixture proportions. The data were pre-processed prior to model training, and predictive performance was evaluated using R2, RMSE, MAE, and WMAPE, among other indicators. The results show that the deep learning models outperformed the tree-based models: LSTM achieved the highest accuracy (R2 = 0.942 on the testing dataset), while MCDNN additionally provided reliable uncertainty estimates alongside comparable prediction accuracy; DNDT and DGBM were comparatively less effective. Global sensitivity analysis identified fly ash and water content as the most influential contributors to strength development. By combining rigorous data-driven modeling with sensitivity and uncertainty analysis, this study contributes to the literature a validated, uncertainty-aware deep learning framework for sustainable concrete strength prediction, and offers practical value to the construction industry by providing engineers with a reliable, data-driven tool for optimizing red mud content in concrete mix design, thereby supporting the safe and wider industrial utilization of this problematic waste stream.
1. Introduction
The rapid growth of the construction industry has led to an unprecedented demand for cement-based materials, which in turn has raised serious environmental concerns due to high energy consumption, depletion of natural resources, and significant CO2 emissions associated with cement production [1,2]. In this context, the utilization of industrial by-products and waste materials as partial replacements for conventional cementitious constituents has gained considerable attention as a sustainable strategy to reduce environmental impact while maintaining or enhancing concrete performance [3,4]. Among such industrial wastes, red mud, a by-product of the Bayer process in alumina production, poses a major disposal and environmental challenge due to its high alkalinity, large generation volume, and potential ecological risks [5,6]. Previous experimental investigations have shown that red mud can partially replace cement and influence the mechanical and durability properties of concrete [7]. At optimized replacement levels, red mud contributes to pore refinement and matrix densification through filler effects and limited pozzolanic activity. However, the compressive strength of red mud concrete is governed by complex, nonlinear interactions among several parameters, including red mud content, cement dosage, water content, aggregate proportions, curing duration, and the use of supplementary materials and chemical admixtures [8]. Capturing these interactions using conventional empirical or regression-based models is challenging, often resulting in limited predictive accuracy and generalization capability [9]. Recent comprehensive reviews continue to confirm the growing role of industrial by-products and supplementary cementitious materials in sustainable concrete production [10].
Beyond red mud concrete, artificial intelligence methods have also been applied across other lightweight, cellular, and non-conventional construction materials, including several studies published in reputed journal. These include ensemble machine learning for FRP-confined concrete cylinders [11] and foam concrete with coarse aggregate [12]; hybrid RF–GWO–XGBoost and boosting-based models for geopolymer concrete compressive strength [13,14]; ridge regression, decision tree, and XGBoost models for vibro-centrifuged variotropic concrete under aggressive environmental exposure [15]; neural network and gradient-boosting models for non-autoclaved and autoclaved aerated concrete [16,17]; and CatBoost- and descriptor-based models for ceramic tile properties and high-entropy ceramics [18]. These studies confirm that AI-based predictive modeling is being actively adopted across lightweight, cellular, and ceramic construction materials; however, a systematic, explainable, and uncertainty-aware comparison of deep learning architectures specifically for red mud concrete remains lacking, which is the gap addressed in the present study.
In recent years, machine learning (ML) and deep learning (DL) approaches have gained prominence in civil and materials engineering for predicting concrete properties, owing to their ability to model nonlinear relationships and learn directly from experimental data [19,20]. A detailed review of explainable, uncertainty-aware, and red mud-specific ML studies, together with the gaps they leave unaddressed, is presented in Section 2. Nevertheless, there remains a lack of systematic studies applying and comparing state-of-the-art deep-learning-based models for predicting the compressive strength of red mud-incorporated concrete.
To address this gap, the present study employs four advanced machine learning models, the Deep Gradient Boosting Machine (DGBM) [21], the Differentiable Neural Decision Tree (DNDT) [22], Long Short-Term Memory (LSTM) [23], and the Monte Carlo Dropout Neural Network (MCDNN) [24] to predict the compressive strength of red mud concrete. These models were selected due to their complementary strengths: DGBM effectively combines tree-based learning with deep neural networks to capture complex feature interactions; DNDT offers interpretable, end-to-end trainable decision structures; LSTM is capable of learning long-term dependencies and trends associated with curing periods; and MCDNN provides uncertainty-aware predictions through probabilistic inference using dropout during inference.
A dataset of 183 data points was compiled from nine peer-reviewed journal articles and supplemented with experimental results, covering a wide range of red mud replacement levels and curing ages. The data were pre-processed, normalized, and screened for multicollinearity prior to model training, and the models were evaluated using multiple statistical indicators, graphical diagnostics, and both external and experimental validation.
From a scientific standpoint, no systematic, explainable, and uncertainty-aware comparison of deep learning architectures currently exists for red mud concrete; from an applied standpoint, engineers lack a validated data-driven tool to estimate strength across red mud replacement levels without extensive trial mixes. Unlike the general heterogeneity-driven nonlinearity common to all concretes, red mud concrete exhibits a threshold-governed, non-monotonic strength response, in which densification and filler effects dominate at low-to-moderate replacement while excess alkalinity and water demand dominate beyond a threshold, producing a trend reversal that conventional regression models struggle to capture. Accordingly, the hypothesis of this study is that deep learning architectures incorporating temporal or probabilistic structure (LSTM, MCDNN) will outperform tree-based approaches (DGBM, DNDT) in capturing this behavior. The objectives are therefore to (i) develop reliable deep-learning-based models for estimating the compressive strength of red mud concrete, (ii) comparatively evaluate DGBM, DNDT, LSTM, and MCDNN, and (iii) identify the most accurate and robust approach for practical engineering applications.
By integrating sustainable material utilization with explainable, uncertainty-aware deep learning, this study contributes a validated data-driven framework for optimizing red mud content in concrete mix design, reducing CO2 emissions, energy consumption, and reliance on extensive trial mixes, and supporting the broader goal of environmentally responsible, high-performance construction materials. The overall predictive framework adopted in this study is illustrated in Figure 1.
Figure 1.
Methodology of the research.
2. Literature Review
Machine learning (ML) and deep learning (DL) methods have been increasingly applied to predict the compressive strength of concrete, since they can learn nonlinear relationships directly from data without requiring a predefined empirical form [19,20]. This section reviews the literature most directly related to the present work: studies on red mud concrete, beginning with experimental and statistical investigations and then machine learning-based prediction studies, followed by a brief discussion of related explainable and uncertainty-aware ML studies on other concretes that motivate the modeling choices made here.
Red mud is rich in iron oxide, alumina, silica, and alkaline compounds, which collectively influence hydration behavior and microstructural development in concrete [25]. The presence of alumina and reactive silica provides limited pozzolanic activity, while iron oxide contributes mainly as a filler. However, its high alkalinity and fine particle size significantly affect fresh and hardened concrete behavior [26]. Studies consistently report that red mud modifies hydration kinetics and pore structure, leading to denser matrices at optimized replacement levels. Rather than a linear response, the mechanical performance of red mud concrete follows a threshold-based behavior. Low to moderate cement replacement levels generally enhance compressive and flexural strength due to filler effects and improved particle packing [27]. Beyond this threshold, strength reduction is commonly observed, attributed to excessive alkalinity, increased water demand, and dilution of cementitious phases. This nonlinear behavior underscores the difficulty of using conventional regression models for strength prediction [28]. Recent investigations continue to confirm and extend this threshold-governed behavior across different red mud sources, replacement levels, and applications, including optimized mix-design guidance [29], durability performance [30], microstructural mechanisms in high-strength concrete [31], and use as a sustainable road construction material [32].
Durability-focused studies show that red mud can improve resistance to chloride ingress, sulfate attack, and corrosion when used in optimal proportions. Microstructural refinement and reduced pore connectivity contribute to enhanced durability, particularly in reinforced concrete systems [33]. Conversely, excessive red mud content may increase capillary porosity, negatively affecting acid resistance and long-term stability. These conflicting trends indicate strong interactions among mix parameters rather than isolated material effects [34]. The behavior of red mud in concrete cannot be attributed to a single mechanism. Its high iron oxide content enhances particle packing, while alumina and silica participate in secondary hydration reactions [35]. Simultaneously, residual alkalinity alters pore solution chemistry and hydration kinetics. These competing effects lead to highly nonlinear responses in compressive strength and durability, where minor changes in mix composition or curing conditions can produce disproportionate performance variations [36]. Such complexity challenges conventional deterministic modeling approaches.
A substantial body of literature has examined the mechanical and durability behavior of red mud concrete through conventional experimental and statistical approaches, without employing machine learning. Venkatesh et al. [37,38,39] carried out comprehensive characterization and durability studies of red mud concrete and compared treated versus untreated red mud in terms of mechanical and durability performance. Tang et al. [40] investigated the effect of red mud on the fresh and hardened properties of self-compacting concrete, while Monu et al. [41] examined red mud combined with hydrated lime as a partial cement replacement. Liu and Poon [42] studied the utilization of bauxite-derived red mud in self-compacting concrete, and Shaik and Kommineni [43] combined bauxite residue with metakaolin to assess strength and durability. Viyasun et al. [44] and Ghalehnovi et al. [45] further examined red mud-based concrete performance and self-compacting concrete incorporating various fillers, respectively. These studies consistently confirm the threshold-governed, non-monotonic relationship between red mud content and mechanical performance described in Section 1, but they rely on classical statistical analysis (e.g., ANOVA, regression) of relatively small, single-source experimental datasets, and none develops a predictive model capable of generalizing across multiple mix designs and data sources.
A smaller number of studies have applied machine learning specifically to red mud concrete, and these are the most directly comparable to the present work. Sunkpho et al. [34] compared four ML models, Multivariate Adaptive Regression Splines (MARS), Minimax Probability Machine Regression (MPMR), the Group Method of Data Handling (GMDH), and an Evolutionary Neural Network (ENN), to predict the compressive strength of red mud concrete containing 0–20% red mud, reporting MARS as the best-performing model based on Taylor diagrams and comprehensive ranking measures. Bano et al. [46] evaluated five ML algorithms on a considerably larger dataset (500 data points, 14 input parameters) for red mud-based concrete incorporating fly ash and found that tree-based Decision Tree and Extra Tree models outperformed the other algorithms considered. Haider et al. [47] applied four ML models to red mud recycled-aggregate concrete and reported that XGBoost achieved the highest accuracy, with SHAP analysis identifying curing age as the most influential parameter. Across these three studies, the modeling scope is limited to shallow, tree-based, or classical statistical-learning algorithms; none evaluates deep learning architectures capable of capturing sequential, curing-time-dependent behavior, and none incorporates uncertainty quantification despite the practical value of confidence estimates for mix-design decisions.
Related ML studies on other concretes help position the modeling choices made in the present study, even though they do not consider red mud. Kina et al. [48] compared deep LSTM networks against ANN, bagging, boosting, and k-nearest-neighbor models for fly ash/slag-based geopolymer concrete and reported that LSTM achieved the highest accuracy (R2 = 0.98), demonstrating the potential of sequence-aware deep learning for cementitious systems whose behavior depends on curing time. Explainable ML frameworks using SHAP-type feature attribution have likewise been developed for other supplementary-cementitious-material concretes, such as glass-powder concrete [49] and high-performance concrete [50,51,52], typically using tree-based or ensemble models without uncertainty quantification. Conversely, Li et al. [53] and Vu-Bac et al. [54] demonstrated the value of Bayesian and stochastic uncertainty quantification methods for materials and high-performance concrete property prediction, respectively, but neither developed a multi-architecture comparative framework or applied these methods to red mud concrete. Broader reviews confirm that explainable and uncertainty-aware ML frameworks remain rare for by-product-based concretes generally [10,55].
Table 1 summarizes the material scope, dataset characteristics, modeling approach, and reported performance of these related studies alongside the present work, with the red mud-specific studies [34,46,47] placed first given their direct relevance.
Table 1.
Summary of representative studies related to machine learning-based compressive strength prediction of red mud and other supplementary-cementitious-material concretes.
Collectively, this body of literature reveals three consistent gaps that motivate the present study. First, the ML-based studies on red mud concrete [34,46,47] are limited to shallow, tree-based, or classical statistical-learning models (MARS, MPMR, GMDH, ENN, Decision Tree, Extra Tree, XGBoost) and do not evaluate deep learning architectures capable of capturing sequential, curing-time-dependent behavior. Second, none of the red mud-focused studies incorporate explicit uncertainty quantification, despite its demonstrated value for material property prediction elsewhere [53,54]. Third, explainable and uncertainty-aware ML frameworks have been developed extensively for conventional and other supplementary-cementitious-material concretes [49,50,51,52,53,54] but have not previously been extended to red mud concrete. The present study addresses these gaps directly by developing and comparing four complementary architectures, DGBM, DNDT, LSTM, and MCDNN, the latter two of which are explicitly designed to capture, respectively, curing-time dependency and predictive uncertainty, within a single, uncertainty-aware, and explainable framework tailored to the threshold-governed, nonlinear behavior of red mud concrete.
3. Details of the Developed ML Model
3.1. Deep Gradient Boosting Machine
The Deep Gradient Boosting Machine (DGBM) is a hybrid predictive framework that integrates gradient boosting decision trees (GBDT) with deep neural networks (DNNs) to leverage the complementary advantages of both learning paradigms. GBDT models are highly effective for structured and tabular data due to their ability to capture nonlinear relationships and complex feature interactions. However, their representational capacity is inherently limited by the tree structure. Deep neural networks, on the other hand, possess strong representation learning capability through layered nonlinear transformations but often underperform when applied independently to tabular engineering datasets. DGBM addresses these challenges by distilling the knowledge learned by GBDT into a deep learning architecture.
In DGBM, a GBDT model is first trained to learn the mapping between the input feature vector
and the target variable . For a trained ensemble consisting of trees, each input sample is assigned to one leaf node per tree. The predicted output of the GBDT model can be expressed as
where represents the decision function of the -th tree. Instead of using directly, DGBM extracts the leaf indices reached by each sample, which implicitly encode high-order feature interactions learned during tree construction.
These discrete leaf indices are transformed into dense representations through embedding layers. For the -th tree, the leaf index is mapped to a continuous embedding vector . The tree-based feature representation is obtained by concatenating all embeddings:
This embedding process preserves the structural knowledge of the tree ensemble while reducing sparsity and improving learning efficiency. The final input to the deep neural network is formed by combining the original feature vector and the tree-derived embeddings:
This combined representation is passed through multiple fully connected layers, where nonlinear activation functions enable the network to learn higher-level abstractions and latent patterns relevant to the prediction task. Through this integrated formulation, DGBM combines the interpretability and strong nonlinear feature construction of GBDT with the expressive power of deep learning, making it particularly effective for complex engineering and materials science prediction problems. The overall architecture of the DGBM model used in this study is illustrated in Figure 2.
Figure 2.
General workflow of the Deep Gradient Boosting Machine (DGBM).
3.2. Differentiable Neural Decision Tree Framework
The Differentiable Neural Decision Tree (DNDT) is a neural network-based model that reformulates the classical decision tree in a fully differentiable manner, enabling end-to-end optimization using gradient-based learning. Traditional decision trees rely on hard, non-differentiable split rules, which prevent their direct integration with neural networks and limit their adaptability during training. DNDT overcomes this limitation by replacing discrete split decisions with continuous, learnable functions, thereby combining the interpretability of decision trees with the optimization flexibility of deep learning.
In DNDT, each internal node performs a soft decision using a parametric function applied to the input feature vector
Instead of a hard threshold, the split is modeled using a sigmoid-based gating function:
where is the sigmoid activation function, controls the sharpness of the split, is the learnable threshold, and is the selected feature at the node . This formulation allows the model to softly route each input sample toward multiple branches with different probabilities.
The probability of a sample reaching a specific leaf node is computed as the product of gating functions along the decision path:
where denotes the set of internal nodes along the path to the leaf , and indicates the branch direction at the node . Each leaf node is associated with a learnable output value , representing the prediction contribution of that leaf. The final model output is obtained as a weighted sum of all leaf predictions:
where is the total number of leaf nodes. This probabilistic aggregation enables smooth transitions between decision regions and improves model stability. By preserving the hierarchical structure of decision trees while enabling continuous optimization, DNDT provides a transparent and flexible modeling framework. Its ability to capture nonlinear relationships and feature interactions, combined with improved training stability, makes DNDT particularly suitable for structured engineering datasets and material property prediction tasks. The overall architecture of the DNDT model used in this study is illustrated in Figure 3.
Figure 3.
General workflow of the Differentiable Neural Decision Tree (DNDT).
3.3. Long Short-Term Memory
Long Short-Term Memory (LSTM) is a specialized form of recurrent neural network (RNN) designed to model sequential and time-dependent data by effectively capturing long-range dependencies. Conventional RNNs suffer from vanishing and exploding gradient problems, which limit their ability to learn relationships over extended sequences. LSTM addresses these limitations through a gated memory structure that regulates information flow, enabling stable and efficient learning of both short-term dynamics and long-term patterns. At each time step , the LSTM processes an input vector
Along with the hidden state and cell state from the previous step. The core of the LSTM architecture consists of three multiplicative gates: the forget gate, the input gate, and the output gate. These gates control the retention, update, and exposure of information stored in the cell state.
The forget gate determines the extent to which previous memory is retained:
The input gate regulates the incorporation of new information:
while the candidate memory content is computed as
The cell state is then updated as
where denotes element-wise multiplication.
The output gate controls the generation of the hidden state:
and the hidden state is computed as
For regression tasks, the final prediction is obtained through a linear transformation of the hidden state:
By explicitly controlling memory retention and update through gating mechanisms, LSTM effectively captures temporal dependencies and nonlinear dynamics in sequential data. This makes it particularly suitable for applications involving time-dependent material behavior, such as strength evolution with curing age, loading history, or environmental exposure in civil engineering systems. The overall architecture of the LSTM model used in this study is illustrated in Figure 4.
Figure 4.
General workflow of the Long Short-Term Memory (LSTM) model.
3.4. Monte Carlo Dropout Neural Network
The Monte Carlo Dropout Neural Network (MC-DNN) is a probabilistic deep learning framework that extends conventional neural networks by enabling uncertainty quantification alongside point predictions. Standard deep neural networks typically produce deterministic outputs and provide limited insight into prediction confidence, which can be a critical limitation in engineering and materials science applications. MC-DNN addresses this issue by interpreting dropout as a Bayesian approximation, allowing the model to estimate predictive uncertainty without significant modifications to the network architecture.
In a conventional feedforward neural network, the prediction for an input vector
is expressed as
where denotes the network weights. In MC-DNN, dropout layers are retained not only during training but also during inference. Each forward pass randomly deactivates a subset of neurons according to a Bernoulli distribution with dropout probability . This stochastic behavior generates different realizations of the network, effectively sampling from an approximate posterior distribution over the model parameters.
For a given input , multiple stochastic forward passes are performed:
where denotes the number of Monte Carlo samples and represents the randomly masked weight configuration in the -th pass. The predictive mean is estimated as
while the predictive variance, which reflects model uncertainty, is computed as
By averaging predictions across multiple stochastic forward passes, MC-DNN produces robust point estimates while simultaneously quantifying epistemic uncertainty. This dual capability is particularly valuable for engineering decision-making, where understanding the confidence associated with predicted material properties or structural performance is as important as prediction accuracy. The simplicity and scalability of MC-DNN make it an attractive uncertainty-aware modeling approach for data-driven civil engineering and materials science applications. The overall architecture of the MCDNN model used in this study is illustrated in Figure 5.
Figure 5.
General workflow of the Monte Carlo Dropout Neural Network (MCDNN).
3.5. Model Hyperparameter Tuning
The predictive performance of machine learning models is highly dependent on the appropriate selection of hyperparameters. In this study, key hyperparameters were determined through systematic trial-and-error to ensure a balance between accuracy and generalization. Parameters such as learning rate, network architecture, and training epochs were tuned based on model convergence and validation performance. The final optimized hyperparameter values for all developed models are presented in Table 2.
Table 2.
Optimized hyperparameters of MC-DNN, LSTM, DNDT, and DGBM Models.
3.6. Data Collection
In this study, a comprehensive dataset was compiled from published experimental research to develop machine learning models for predicting the compressive strength of red mud-incorporated concrete. Data were systematically extracted from peer-reviewed journal articles to ensure reliability and scientific rigor. A total of 183 data points were collected from nine published studies along with one experimental dataset, as summarized in Table 3. The dataset covers red mud replacement levels ranging from 0% to 20% and includes concrete specimens cured for various durations. The extracted input parameters include cement content (kg), red mud content (kg), water (L), fine aggregate (kg), coarse aggregate (kg), superplasticizer dosage (L), and supplementary materials such as fly ash or other additives, where applicable. The output variable is the compressive strength of concrete measured at specified curing ages. Most studies reported compressive strength at 28 days, while additional curing periods (7, 14, 56, 90, 150, and 180 days) were also included to enhance dataset diversity and robustness. Before training the machine learning models, we preprocessed the data to ensure consistency and reliability. Variations in measurement units and reporting formats across studies were carefully addressed, and all mixed proportions were converted to a unified unit system to ensure comparability. Statistical screening was performed to identify potential outliers, and none were detected in the dataset. All values were cross-checked against the original sources to confirm that they represented valid experimental behavior rather than reporting or transcription errors. Representative photographs of the raw materials, mixing and batching procedure, specimen casting and curing, and the compressive strength testing setup used in the experimental component of red mud concrete data are presented in Figure 6.
Table 3.
Summary of data sources used for model development and validation.
Figure 6.
General overview of the testing procedure for red mud concrete data: raw materials (red mud, cement, fine aggregate, coarse aggregate, and water), mixing and batching, workability assessment, specimen casting and curing, and the compressive strength testing setup.
3.7. Data Preprocessing and Analysis
The correlation (Figure 7) network illustrates the complex interactions among mixed constituents and their influence on compressive strength (CS). Strong positive correlations are observed between fly ash and CS (~0.69), as well as between superplasticizer (SP) and CS (~0.54), indicating that these components play a significant role in enhancing strength, likely due to improved particle packing and reduced water demand. Additionally, fly ash and SP are highly correlated (~0.67), suggesting their combined use is essential for achieving better performance. In contrast, strong negative correlations are evident between sand and coarse aggregate (~−0.84), reflecting typical mix proportion trade-offs, and between SP and coarse (~−0.77), implying reduced SP demand in coarse-rich mixes. Cement shows a notable negative correlation with RM (~−0.54), indicating a replacement effect, while RM itself exhibits only a weak relationship with CS (~0.10), suggesting limited direct contribution to strength. Most other variables display weak to moderate correlations, highlighting a balanced interaction within the system. Overall, the network emphasizes that fly ash and SP are key contributors to strength development, whereas aggregate proportions and supplementary materials primarily influence the mix indirectly. The data is normalized to the range of 0 to 1 before it is used to train the models. The normalized data is divided into training and testing sets in a 70:30 ratio [56].
Figure 7.
Correlation network of red mud concrete.
3.8. Model Performance Evaluation Metrics
To get a complete picture of how well our machine learning and deep learning models, namely DGBM, DNDT, MCDNN, and LSTM, could predict compressive strength, we used a range of statistical performance indicators. The metrics in Table 4 facilitated the assessment of model accuracy, reliability, and generalization from multiple angles, ensuring our comparison between models was fair and thorough. First, in this analysis, the coefficient of determination, or R2, indicates how much of the variation in the actual experimental compressive strength values is explained by the model’s predictions. In simple terms, a higher R2 means the model does a better job of fitting the data and making reliable predictions. However, the error-based metrics, namely root mean square error (RMSE) and mean absolute error (MAE), provide additional insight. RMSE is especially sensitive to large errors; it really penalizes big misses, while MAE gives us a straightforward average of how far off the predictions are. Together, they offer a balanced view of model accuracy. To understand how well the models performed across low, medium, and high strength values, the mean absolute percentage error (MAPE) was used. Since it expresses errors as percentages, it is great for comparing performance across different scales. We also brought in the Nash–Sutcliffe efficiency coefficient (NS), which checks how closely the predicted trends match the actual observed trends. The closer NS is to 1, the better the model performs. Alongside that, Willmott’s index (WI) and the index of agreement (IA) help detect any systematic bias and measure overall consistency between predicted and experimental values. To get a sense of forecasting reliability, we used Theil’s inequality coefficient (TIC). It measures the normalized difference between predictions and observations; basically, how far off the model tends to be in relative terms. Additionally, the root mean squared logarithmic error (RMSLE) focuses on proportional differences rather than absolute ones. That makes it especially useful when we want consistency in how errors scale with the size of the compressive strength. WMAPE gave us a weighted view of relative prediction errors across all samples, and U95 helped quantify uncertainty by showing the range where 95% of prediction errors are expected to fall. By combining all these metrics, a well-rounded validation framework is one that balances absolute accuracy, relative error, and trend consistency. This comprehensive approach lets us clearly compare the strengths of DGBM, DNDT, MCDNN, and LSTM, and really highlights how effective each model is at capturing the complex relationships that determine compressive strength in concrete.
Table 4.
Performance indicator expressions with their ideal values.
4. Results
Red mud was incorporated into concrete mixtures at replacement levels of 0%, 5%, 10%, 15%, and 20% to investigate its influence on compressive strength and durability and to evaluate the capability of advanced ML models to predict the compressive strength of red mud concrete. Four ML models, namely decision tree-based DNDT, DGBM, LSTM, and MCDNN, have been constructed, and their performance has been assessed via multiple performance indicators, as summarized in Table 5. The results indicate that all models demonstrated reasonable predictive capability. The DNDT and DGBM models exhibit acceptable predictive accuracy, with training R2 values of 0.944 and 0.904 for the training dataset, respectively, which decreased to 0.889 and 0.859 for the testing dataset. Higher values of error metrics, including RMSE, MAE, and WMAPE for the testing dataset, indicate the limited generalization capability of the developed models and suggest that tree-based models may struggle to fully capture the nonlinear relationships introduced by varying red mud content. It can be observed that the LSTM and MCDNN models showed significantly superior performance. The LSTM model obtained the highest accuracy with R2 values of 0.999 for the training dataset and 0.942 for the testing dataset, with the lowest RMSE value (0.009 for the training and 0.048 for the testing dataset). The values of other indicators, including NS, WI, and IA, obtained higher values, which indicates strong predictive performance between predicted and experimental compressive strength values. The higher predictive performance of the constructed LSTM model indicates that the model is capable of capturing complex nonlinear dependencies between red mud dosage and concrete strength. The MCDNN model also performed robustly, achieving a testing R2 of 0.941 and low error metrics comparable to LSTM, though slightly inferior in overall accuracy. The consistently lower error metric values, such as TIC and RMSLE, obtained for both LSTM and MCDNN indicate stable predictions across the full range of compressive strength values, even at higher red mud replacement levels, where variability tends to increase. From a material behavior perspective, the robust prediction capability of deep learning models indicates that the influence of red mud inclusion on compressive strength is regulated by complex nonlinear interactions. The proposed ML models effectively learned these trends directly from the experimental data without relying on simplified empirical assumptions. The obtained results confirm the suitability of advanced deep learning approaches for modeling complex sustainable concrete systems and support their use as reliable tools for optimizing red mud content in concrete design.
Table 5.
Performance indicators obtained for developed models.
The ratio of predicted to experimental compressive strength is plotted against the experimental values in Figure 8, Figure 9, Figure 10 and Figure 11 to more clearly reveal the prediction behavior of each model. Points closer to the horizontal line at a ratio of 1.0 indicate stronger agreement between predicted and measured strengths. The LSTM model (Figure 10) shows the tightest clustering around unity across the full strength range, with only a few points deviating beyond ±0.15, confirming its superior accuracy. The MCDNN model (Figure 11) shows a similarly tight distribution, with slightly more scatter across the low-to-medium strength values. In contrast, the DNDT model (Figure 8) shows greater dispersion, with several points reaching ratios of 1.2–1.5, particularly at lower experimental strengths. The DGBM model (Figure 9) exhibits the widest scatter of all four models, with ratios ranging from about 0.6 to 1.5, especially in the 20–60 MPa range, reflecting its comparatively weaker predictive reliability. This visual pattern is consistent with the R2 and error values reported in Table 5.
Figure 8.
Ratios of predicted to experimental CS plotted against the experimental CS for the DNDT model.
Figure 9.
Ratios of predicted to experimental CS plotted against the experimental CS for the DGBM model.
Figure 10.
Ratios of predicted to experimental CS plotted against the experimental CS for the LSTM model.
Figure 11.
Ratios of predicted to experimental CS plotted against the experimental CS for the MCDNN model.
The regression plots (Figure 12) clearly illustrate how effectively each machine learning model predicts the compressive strength of concrete, both for the training dataset and for unseen testing data. For all four models, the training data points lie closer to the 45° reference line than the testing points, which is expected, as models typically fit their training data better than new data. However, the extent of the performance gap between training and testing varies across models, providing insight into their generalization capability. The DNDT model demonstrates a strong linear relationship during training, with an R2 value of 0.944. However, its performance declines on the testing data, where the R2 reduces to 0.889, and a noticeable increase in scatter is observed, particularly at higher strength values. This indicates that while DNDT captures the overall trend, its predictions become less reliable under higher red mud content, suggesting sensitivity to nonlinear effects.
Figure 12.
Actual vs. predicted curve with box plot.
A similar trend is observed for the DGBM model. Its training R2 of 0.904 decreases to 0.859 in testing, accompanied by greater deviation of the regression line from the ideal and increased dispersion of residuals. This behavior reflects comparatively weaker prediction stability and suggests that tree-based ensemble approaches may struggle to fully capture the complex interactions governing red mud concrete strength. In contrast, the LSTM model exhibits superior performance. During training, it achieves an almost perfect fit with an R2 of 0.999, with data points nearly coinciding with the ideal line. Importantly, this high accuracy is maintained in the testing phase, where the R2 remains strong at 0.942, and only minimal scatter is observed. The regression line closely follows the 45° reference across the full strength range, indicating excellent generalization and robustness. The MCDNN model also performs at a high level, with a training R2 of 0.983 and a testing R2 of 0.941, closely matching the performance of LSTM. Although the testing plot shows slightly more dispersion compared to LSTM, the majority of data points remain tightly clustered around the regression line, confirming reliable predictive capability across varying red mud replacement levels. Overall, LSTM provides the most accurate and consistent predictions, followed closely by MCDNN. While DNDT and DGBM deliver acceptable results, they exhibit greater scatter and reduced accuracy on unseen data. These visual observations are consistent with the quantitative results presented in Table 1 and confirm that deep learning models are more effective in capturing the nonlinear behavior of red mud-based concrete systems.
Figure 13 illustrates the convergence performance of four prediction models, namely DNDT, DGBM, LSTM, and MCDNN, based on RMSE variation with the number of iterations. Initially, the DNDT model exhibits the highest RMSE value, indicating unstable learning behavior during the early training stage. Although the error decreases gradually with increasing iterations, its convergence remains slower and less stable compared with the other models. The DGBM model shows smoother convergence and achieves lower RMSE values than DNDT, but the reduction in error is relatively gradual throughout the iteration process.
Figure 13.
Convergence analysis of RMSE for different predictive models.
In contrast, the LSTM and MCDNN models demonstrate significantly better convergence characteristics. Both models rapidly reduce RMSE during the initial iterations and stabilize at very low error levels, indicating efficient learning and strong predictive capability. The LSTM model achieves the lowest and most stable RMSE among all models, reflecting superior generalization and optimization performance. Similarly, MCDNN exhibits excellent stability with only minor early fluctuations. Overall, the results confirm that the deep-learning-based models outperform DNDT and DGBM in terms of convergence speed, stability, and prediction accuracy.
4.1. Global Sensitivity Analysis
A detailed sensitivity assessment was developed, in which quantification of the change in several input parameters and their effect on the output was recorded. For this reason, the Sobol-based Global Sensitivity Analysis (GSA) approach has been utilized in this study, shown in Figure 14. The input space is sampled by Monte Carlo sampling with 600 realizations that can guarantee stable output variance estimation when the convergence error is kept to less than 1 percent. The Sobol method allows decomposition of the total variance of the output variable Y into contributions from individual input parameters and their interactions. The total-effect sensitivity index , representing the combined influence of the -th input, including all interaction effects with other variables, is expressed as:
Figure 14.
Sobol total order sensitivity analysis for CS value.
In these expressions, denotes the total variance of the model output, while represents the expectation operator taken over the specified input distributions. The subscripts and refer to the target input parameter and the set of all remaining parameters, respectively. Two independent Monte Carlo sample matrices were generated to compute these indices in accordance with the standard Sobol procedure.
The Sobol sensitivity indices reveal that fly ash content is the most dominant parameter with total sensitivity = 0.583, in the first order, followed by water content at 0.352, which indicates very strong control of system response by water content. Superplasticizer dosage and RM content have almost comparable influences, reflected by their sensitivity indices of 0.277 and 0.259, respectively. Sensitivity in sand content shows a moderate contribution (0.249). The effects of age, cement content, and coarse aggregate have relatively smaller effects with total sensitivities of 0.207, 0.168, and 0.142, respectively. This distribution of sensitivity indices already suggests the existence of nonlinear relationships and interaction effects among the input variables rather than purely independent contributions. These Sobol indices quantify predictive importance and interaction effects within the fitted models and should not be interpreted as direct causal effects; confirming the underlying physicochemical mechanisms, such as the pozzolanic reactivity of fly ash or the role of the water-to-binder ratio in hydration kinetics, would require independent experimental investigation.
4.2. Surface Response of the Developed Models
The comparative study of response surfaces created by DGBM, DNDT, LSTM, and MCDNN models shows clear distinctions between their capability to capture the relationship between RM, the amount of cement, and CS. The DGBM model (Figure 15a) shows good capabilities to describe complex and localized nonlinear relationships with its fluctuating surface. Still, this model suffers from high roughness due to the nature of the trees’ architecture. On the other hand, the surface obtained with the DNDT model represents the relationship in terms of a piecewise-constant function with discontinuous transitions, which means that the model is unable to capture gradual changes and interactions in data (Figure 15b). The LSTM model (Figure 15c) is able to provide a smooth and continuous response surface to show global nonlinear relationships. However, this model simplifies localized relationships and interactions within them. The last model, MCDNN (Figure 15d), gives an intermediate result with a relatively smooth response surface and the ability to capture nonlinear relationships, thus being more suitable than LSTM and less rough than DGBM. As can be seen from this discussion, the proposed DGBM model shows good results in modeling interactions, whereas DNDT performs better in finding thresholds in data. The developed LSTM model, being a relatively generic one, shows the worst performance in modeling the relationship. Finally, MCDNN can be considered the best among all the models used for the problem under consideration.
Figure 15.
Response surfaces of the DGBM, DNDT, LSTM, and MCDNN models showing the effect of RM and cement on compressive strength (CS).
4.3. Vel’s Diagram (Triangle Diagram)
The performance of DNDT, DGBM, LSTM, and MCDNN models was evaluated using the Vel’s Diagram (Triangle Diagram) approach proposed by Pradeep et al. [57], which integrates the coefficient of determination (R2), root mean square error (RMSE), and standard deviation ratio (SDR) into a single graphical framework shown in Figure 16. The enclosed area formed by each model within the triangle represents the overall prediction error, where smaller areas indicate superior predictive capability. For the training dataset, all models achieved high coefficients of determination (R2 > 0.88), indicating strong learning capability. However, noticeable differences were observed in their error characteristics. The LSTM model exhibited the smallest triangular area (0.5%), reflecting its excellent balance between high correlation, low RMSE, and minimal deviation from the observed data distribution. MCDNN ranked second with an error area of 8.2%, while DNDT and DGBM produced substantially larger areas of 23.2% and 24.5%, respectively. The error-area plot confirms that LSTM achieved the closest approximation to the ideal prediction condition, whereas DNDT and DGBM showed comparatively higher prediction uncertainty.
Figure 16.
Performance comparison using triangle diagram error areas.
In the testing phase, the superiority of the deep learning architectures became even more evident. LSTM and MCDNN maintained very small error areas of 3.2% and 2.7%, respectively, indicating excellent generalization capability and robustness when exposed to unseen data. Conversely, DGBM exhibited the largest testing error area (40.4%), followed by DNDT (19.8%). Although DGBM achieved satisfactory training accuracy, the substantial increase in its testing error area suggests possible overfitting and reduced model stability. The DNDT model demonstrated moderate predictive performance but was unable to match the consistency achieved by the deep learning models. The transition from training to testing datasets reveals that LSTM experienced only a minor increase in error area (0.5% to 3.2%), demonstrating strong generalization and resistance to overfitting. Similarly, MCDNN maintained low error areas in both phases, confirming its reliability. In contrast, the dramatic increase observed for DGBM (24.5% to 40.4%) indicates a significant degradation in prediction capability under testing conditions.
4.4. Uncertainty Analysis
A predictive uncertainty analysis was performed in this study using Monte Carlo simulations (MCS) to evaluate the robustness and reliability of the proposed models for CS prediction of sustainable concrete. To simulate uncertainty in parameter variations, all input variables in the test dataset were perturbed by ±5% Gaussian noise, as shown in Figure 17. The uncertainty analysis was performed on the testing dataset, and each sample was subjected to 500 noise-perturbed simulations to simulate a wide range of prediction scenarios. Uncertainty for each test sample was quantified using the prediction spread, defined as the difference between the maximum and minimum predicted CS values. The average spread across all samples was then assessed to evaluate overall model sensitivity. The mean spread of prediction obtained was 9.2109 MPa for all the test samples, as shown in Figure 18. For each testing sample of the mix, the original prediction, mean noisy prediction, and prediction range were compared. The results show strong agreement between experimental and mean values, indicating stable model behavior under noisy inputs. Most predictions fall within acceptable engineering limits with a low average spread, which suggests limited sensitivity to input perturbations, as shown in Figure 17.
Figure 17.
MCS uncertainty analysis of CS prediction showing ±5% input perturbation over 5000 simulations.
Figure 18.
MCS uncertainty analysis of CS prediction showing a histogram of prediction spread across test samples.
4.5. Reliability Analysis of the LSTM Model
The training phase (Figure 19a) demonstrates exceptionally high performance, with prediction errors closely clustered around zero. This is reflected in a very high reliability index () and a near-zero probability of failure (), indicating an excellent fit to the training data and highly stable predictions within acceptable error limits. In contrast, the testing phase (Figure 19b) presents a more realistic evaluation of model performance. The error distribution exhibits greater dispersion, with a noticeable spread toward higher error values. Consequently, the reliability index decreases to , while the probability of failure increases to . Despite this reduction, the model still maintains an acceptable level of reliability when applied to unseen data.
Figure 19.
Error distribution and reliability.
The disparity between training and testing performance suggests that the model, while highly effective in capturing patterns within the training dataset, does not generalize with equivalent precision. This behavior indicates the presence of mild overfitting, where the model partially captures noise in addition to the underlying relationships. Overall, the results indicate that the model achieves high accuracy and stability during training, while preserving reasonable predictive reliability during testing. The observed increase in error variability and failure probability in the testing phase highlights the need for further improvement in generalization, which may be achieved through techniques such as regularization, hyperparameter optimization, or enhancement of the training dataset.
5. Discussion
5.1. Comparative Performance of the Predictive Models
The results indicate that high-performance machine learning models are able to adequately model the unpredictable behavior of the red mud-incorporated concrete, especially when nonlinear interactions among the mix constituents are dominant. Among the analyzed models, deep learning models show better predictive accuracy and generalization than tree-based models. The LSTM model recorded the best performance, having the highest testing R2 of 0.942 and the lowest error measures. This high accuracy can mainly be credited to its ability to model serial dependencies, particularly the effect of curing age on strength development. Concrete strength evolves over time, and LSTM captures these time dynamics as well as nonlinear relationships between red mud content and other mix parameters. The regression results further support its robustness, showing small variation between predictions and experimental results across the strength range. The MCDNN model also had a high predictive power, and the performance was almost similar to that of LSTM. Its major advantage is a quantification of uncertainty, although its accuracy is slightly lower. The low values of TIC and RMSLE show that the predictions remain stable even at the high levels of replacement of red mud, where variability is usually high. This makes MCDNN especially useful in practice, as it not only provides accurate predictions but also confidence estimates, which are required in engineering decision-making. Nonetheless, given the relatively small, literature-compiled dataset used to train and validate them, the LSTM and MCDNN models should not yet be regarded as universally applicable to red mud from different sources or to substantially different concrete mixtures; as discussed in Section 6.3, expanding the dataset through data-generation techniques offers a promising route toward establishing this broader generalizability. In contrast, DNDT and DGBM models showed comparatively poor testing performance. Although DNDT captured general trends, its piecewise nature reduced sensitivity to gradual changes, especially at higher compressive strengths. Similarly, DGBM had generalization weaknesses, although it could model localized nonlinear interactions. The higher scatter in the regression plots indicates that tree-based approaches struggle to capture the fully interactive and continuous nature of concrete behavior in red mud. The triangle error-area analysis further confirms this ranking: LSTM achieved the best predictive performance, followed by MCDNN, while DNDT and DGBM exhibited larger error areas, reflecting lower prediction accuracy and generalization capability.
These findings should be considered against the broader machine learning literature on red mud concrete. Bano et al. [46] compared five machine learning models (500 data points, 14 input parameters) for red mud-based concrete incorporating fly ash and found that tree-based Decision Tree and Extra Tree models outperformed the other algorithms evaluated; similarly, Haider et al. [47] reported that XGBoost, an ensemble tree-based model, achieved the highest accuracy among four algorithms evaluated for red mud recycled aggregate concrete. This contrasts with the present findings, in which deep learning architectures (LSTM, MCDNN) outperformed tree-based approaches (DGBM, DNDT). The contrast may reflect differences in dataset size, the number and nature of mix parameters considered, and the specific tree-based architectures compared: unlike the shallow ensemble models used in [46,47], the present study additionally evaluated sequence-aware (LSTM) and uncertainty-aware (MCDNN) deep learning architectures explicitly suited to capturing curing-time dependency and threshold-governed nonlinear behavior. The superior performance of LSTM observed here is, however, consistent with Kina et al. [48], who reported an LSTM model achieving R2 = 0.98 for fly ash/slag-based geopolymer concrete, outperforming ANN, bagging, boosting, and k-nearest-neighbor models. These comparisons indicate that while tree-based ensembles remain competitive for some supplementary-cementitious-material concretes, sequence- and uncertainty-aware deep learning architectures offer a consistent advantage where curing-time dependency and nonlinear threshold behavior dominate, as is the case for red mud concrete. To our knowledge, no prior study has combined this range of architectures with explicit uncertainty quantification for red mud concrete, which represents the key methodological distinction of the present work relative to [46,47].
5.2. Material and Engineering Implications for Red Mud Concrete
Beyond model accuracy, these findings carry direct implications for the material behavior and mix design of red mud concrete. Materially, the results imply that compressive strength is controlled by complex interactions rather than single parameters. The direct relationship between red mud content and strength is weak, and the evidence indicates that its effect is highly reliant on other variables, including water content, fly ash, and superplasticizer dosage. This is further supported by the Sobol sensitivity analysis (Section 5.1), which showed fly ash and water content to be the leading contributors to compressive strength, followed by superplasticizer dosage and red mud content itself. Taken together with the threshold-governed behavior described in the Introduction, in which low-to-moderate red mud replacement improves strength through filler effects and particle packing while excess replacement increases alkalinity and water demand, these results indicate that red mud content cannot be treated as an independent mix-design variable. Instead, its proportion should be optimized jointly with fly ash and water/superplasticizer dosage to achieve a densified, well-packed matrix. For practitioners, this provides a data-driven basis for proportioning red mud concrete mixes that balance mechanical performance with the sustainable reuse of this industrial by-product in construction applications. This ranking differs from the SHAP-based sensitivity analysis of Haider et al. [47], who identified curing age as the most influential parameter for red mud recycled aggregate concrete, with red mud content and other constituents as secondary contributors. This discrepancy suggests that the relative importance of red mud content and supplementary materials such as fly ash may depend on the specific mix design space and aggregate type considered, underscoring the value of dataset-specific sensitivity analysis when developing mix-design guidance for red mud concrete.
6. Conclusions
This paper explored the compressive strength behavior of red mud incorporated concrete through the use of sophisticated machine learning models and a detailed experimental database. According to the results and analyses, the following conclusions are made:
6.1. Scientific and Theoretical Results
- The study demonstrates that the compressive strength of red mud concrete follows a nonlinear, threshold-governed relationship rather than the general heterogeneity-driven nonlinearity typical of conventional concretes: low-to-moderate red mud replacement levels enhance strength through filler effects and improved particle packing, whereas higher replacement levels reduce strength due to increased alkalinity and dilution of cementitious phases.
- This work provides a systematic, explainable, and uncertainty-aware comparison of four deep learning paradigms (DGBM, DNDT, LSTM, and MCDNN) for red mud concrete, confirming that architectures with temporal or probabilistic structure (LSTM, MCDNN) capture this threshold-governed nonlinearity substantially better than tree-based approaches (DGBM, DNDT). The LSTM model achieved the highest predictive accuracy (R2 = 0.999 for training and 0.942 for testing), while MCDNN additionally quantified predictive uncertainty, together confirming the working hypothesis stated in the Introduction.
- Sobol-based global sensitivity analysis quantifies, for red mud concrete, the relative contribution of individual mix constituents to strength variance, identifying fly ash content (total sensitivity index = 0.583) and water content (0.352) as the dominant drivers, ahead of superplasticizer dosage (0.277), red mud content itself (0.259), and sand content (0.249), and confirming that compressive strength is governed by interacting rather than isolated parameters.
6.2. Applied and Practical Results
- The developed LSTM and MCDNN models constitute a validated, data-driven tool that allows engineers to estimate the compressive strength of red mud concrete across replacement levels of 0–20% and multiple curing ages without extensive trial mixing, directly addressing the practical gap identified in the Introduction.
- Because red mud content alone shows only a weak direct correlation with strength, the results show that it cannot be treated as an independent mix-design variable; practical proportioning must instead optimize red mud jointly with fly ash, water, and superplasticizer dosage to achieve a densified, well-packed matrix, providing a concrete, data-driven basis for mix design in practice.
- The uncertainty quantification provided by the MCDNN model (mean prediction spread of 9.21 MPa) gives practitioners a confidence range around predicted strength values, supporting risk-informed decision-making in mix proportioning and quality control rather than relying on point estimates alone.
- By enabling reliable strength prediction with reduced experimental testing, the proposed framework supports increased substitution of red mud, an industrial by-product, in concrete production, contributing to reduced cement consumption and associated CO2 emissions in construction practice.
Altogether, the research combines a scientific advance in understanding the nonlinear, threshold-governed behavior of red mud concrete with a practical, validated deep-learning-based tool for predicting and optimizing its sustainable utilization, jointly supporting environmentally responsible construction.
6.3. Limitations
The dataset is limited and compiled from different studies, which may introduce variability despite preprocessing. The models are data-driven and may not perform well outside the training range. Some important factors, such as curing conditions and environmental effects, were not included. Additionally, the study focuses only on compressive strength, with limited experimental validation and no consideration of long-term durability or large-scale applications. The relatively small number of experimental data points available for model development may affect the generalizability of the proposed models. Future research should consider data-generation techniques to increase the size and variability of the dataset [58]. The influence of different levels of data variability on model performance can then be systematically investigated to develop more robust and generalizable prediction models.
6.4. Prospects for Further Research
Building on both the scientific–theoretical and applied results obtained, several prospects can be identified for the further development of this research. From a scientific–theoretical perspective, future work should extend the modeling framework toward physics-informed or hybrid mechanistic–data-driven architectures capable of explicitly representing the threshold-governed reaction mechanisms of red mud, and should broaden the explainability and uncertainty-quantification methodology developed here to other deep learning architectures and to durability-related properties such as chloride ingress, sulfate resistance, and carbonation. From an applied perspective, priority should be given to enlarging the dataset with a wider range of red mud sources, curing regimes, and environmental exposure conditions to improve model generalization; incorporating temperature and humidity as explicit input parameters; validating the models through large-scale and long-term field trials; and integrating the resulting predictive tools into practical mix-design software or decision-support systems for the construction industry. Pursuing these directions would strengthen both the fundamental understanding of red mud concrete behavior and the readiness of the proposed models for wider industrial adoption.
Author Contributions
Conceptualization, P.T.; Methodology, D.R.K.; Software, D.R.K.; Validation, C.N.D.; Formal analysis, P.K. and C.N.D.; Investigation, P.T.; Resources, P.N. and S.K.; Data curation, P.K. and S.R.L.; Writing—original draft, P.T. and D.R.K.; Writing—review and editing, P.N. and S.K.; Visualization, S.R.L.; Supervision, P.N. and S.K. All authors have read and agreed to the published version of the manuscript.
Funding
The authors received no specific funding for this work.
Data Availability Statement
The datasets generated and/or analyzed during the current study are available from the corresponding authors upon reasonable request.
Acknowledgments
This study was supported by the Thammasat Postdoctoral Fellowship.
Conflicts of Interest
The authors declare no conflict of interest.
References
- Labaran, Y.H.; Mathur, V.S.; Muhammad, S.U.; Musa, A.A. Carbon footprint management: A review of construction industry. Clean. Eng. Technol. 2022, 9, 100531. [Google Scholar] [CrossRef] [Scilit]
- Liu, G.; Zhu, Y.; Wan, X.; Xu, P.; Wu, C.; Yu, H. Mechanical properties of alkali-activated red mud aggregate concrete: Experimental study and mechanism analysis. Results Eng. 2026, 29, 108694. [Google Scholar] [CrossRef] [Scilit]
- Oyejobi, D.O.; Firoozi, A.A.; Fernández, D.B.; Avudaiappan, S. Integrating circular economy principles into concrete technology: Enhancing sustainability through industrial waste utilization. Results Eng. 2024, 24, 102846. [Google Scholar] [CrossRef] [Scilit]
- Zhu, Y.; Tian, Y.; Gong, P.; Yi, K.; Wen, G. Performance analysis of red mud concrete pier columns in coal pillarless mining and roadway deformation prediction based on machine learning. Results Eng. 2025, 28, 107166. [Google Scholar] [CrossRef] [Scilit]
- Wang, Y.; Zhang, T.A.; Lyu, G.; Guo, F.; Zhang, W.; Zhang, Y. Recovery of alkali and alumina from bauxite residue (red mud) and complete reuse of the treated residue. J. Clean. Prod. 2018, 188, 456–465. [Google Scholar] [CrossRef] [Scilit]
- Jia, K.; Zhou, Z.; Singh, S.V.; Wang, C. A review of the engineered treatment of red mud: Construction materials, metal recovery, and soilization revegetation. Results Eng. 2024, 24, 102927. [Google Scholar] [CrossRef] [Scilit]
- Tang, W.C.; Wang, Z.; Donne, S.W.; Forghani, M.; Liu, Y. Influence of red mud on mechanical and durability performance of self-compacting concrete. J. Hazard. Mater. 2019, 379, 120802. [Google Scholar] [CrossRef] [Scilit] [PubMed]
- Vakili, A.H.; Salimi, M.; Keskin, İ.; Onur, M.İ.; Tabaroei, A.; Dadgar, M. An enhanced approach to red mud (RM) sustainable management and utilization for marl stabilization considering the dynamic response and durability analysis. Case Stud. Constr. Mater. 2025, 22, e04084. [Google Scholar] [CrossRef] [Scilit]
- Bjerre, L.M.; Peixoto, C.; Alkurd, R.; Talarico, R.; Abielmona, R. Comparing AI/ML approaches and classical regression for predictive modeling using large population health databases: Applications to COVID-19 case prediction. Glob. Epidemiol. 2024, 8, 100168. [Google Scholar] [CrossRef] [Scilit] [PubMed]
- Afsoosbiria, H.; Machowska, A. Development of Sustainable Concrete Using By-Products as a Green Material, and Potential Solutions for Sustainability in Mass Concrete Construction—Comprehensive Review. Sustainability 2025, 17, 9983. [Google Scholar] [CrossRef] [Scilit]
- Kumar, P.; Arora, H.C.; Bahrami, A.; Kumar, A.; Kumar, K. Development of a Reliable Machine Learning Model to Predict Compressive Strength of FRP-Confined Concrete Cylinders. Buildings 2023, 13, 931. [Google Scholar] [CrossRef] [Scilit]
- Reddy, Y.S.; Sekar, A.; Nachiar, S.S. A Validation Study on Mechanical Properties of Foam Concrete with Coarse Aggregate Using ANN Model. Buildings 2023, 13, 218. [Google Scholar] [CrossRef] [Scilit]
- Zhang, J.; Wang, R.; Lu, Y.; Huang, J. Prediction of Compressive Strength of Geopolymer Concrete Landscape Design: Application of the Novel Hybrid RF–GWO–XGBoost Algorithm. Buildings 2024, 14, 591. [Google Scholar] [CrossRef] [Scilit]
- Ahmad, A.; Ahmad, W.; Chaiyasarn, K.; Ostrowski, K.A.; Aslam, F.; Zajdel, P.; Joyklad, P. Prediction of geopolymer concrete compressive strength using novel machine learning algorithms. Polymers 2021, 13, 3389. [Google Scholar] [CrossRef] [Scilit] [PubMed]
- Beskopylny, A.N.; Stel, S.A.; Shcherban, E.M.; Razveeva, I.; Kozhakin, A.; Pembek, A.; Kondratieva, T.N.; Elshaeva, D. Chernil Beskopylny, Prediction of the Properties of Vibro-Centrifuged Variatropic Learning Methods. Buildings 2024, 14, 1198. [Google Scholar] [CrossRef] [Scilit]
- Rudenko, O.; Galkina, D.; Sadenova, M.; Beisekenov, N.; Kulisz, M.; Begentayev, M. Modelling the properties of aerated concrete on the basis of raw materials and ash-and-slag wastes using machine learning paradigm. Front. Mater. 2024, 11, 1481871. [Google Scholar] [CrossRef] [Scilit]
- Yang, Y.; Zhang, J.; Huang, F.; Chen, Z.; Qiu, R.; Wu, S. Effect of structural parameters on compression performance of autoclaved aerated concrete: Simulation and machine learning. Constr. Build. Mater. 2024, 423, 135860. [Google Scholar] [CrossRef] [Scilit]
- Vasić, M.V.; Awoyera, P.O.; Fadugba, O.G.; Barišić, I.; Grubeša, I.N. Advanced machine learning models for the prediction of ceramic tiles’ properties during the firing stage. Sci. Rep. 2025, 15, 31397. [Google Scholar] [CrossRef] [Scilit] [PubMed]
- Kumar, R.; Althaqaf Ei Patro, S.G.K.; Simic, V.; Babbar, A.; Pamucar, D.; Singh, S.K.; Verma, A. Machine and deep learning methods for concrete strength Prediction: A bibliometric and content analysis review of research trends and future directions. Appl. Soft Comput. 2024, 164, 111956. [Google Scholar] [CrossRef] [Scilit]
- Renzo, D.A.; Laurenti, M.; Foti, P.; Benedetti, M.; Tirillò, J.; Berto, F. Methodologies developed for dataset preparation and the interpretability of machine learning algorithms used for the prediction of crack growth rate. Results Eng. 2025, 28, 107516. [Google Scholar] [CrossRef] [Scilit]
- Ke, G.; Xu, Z.; Zhang, J.; Bian, J.; Liu, T.-Y. DeepGBM: A deep learning framework distilled by GBDT for online prediction tasks. In Proceedings of the 25th ACM SIGKDD International Conference on Knowledge Discovery & Data Mining, Anchorage, AK, USA, 4–8 August 2019; pp. 384–394. [Google Scholar]
- Mao, Q.; Ren, J.; Wang, Y.; Zou, C.; Zheng, J.; Cao, Y. Differentiable Decision Tree via “ReLU+Argmin” Reformulation. Adv. Neural Inf. Process. Syst. 2025, 38, 166874–166909. [Google Scholar]
- Ma, X.; Tao, Z.; Wang, Y.; Yu, H.; Wang, Y. Long short-term memory neural network for traffic speed prediction using remote microwave sensor data. Transp. Res. Part C Emerg. Technol. 2015, 54, 187–197. [Google Scholar] [CrossRef] [Scilit]
- Contreras, J.; Bocklitz, T. Enhancing decision confidence in AI using Monte Carlo dropout for Raman spectra classification. Anal. Chim. Acta 2024, 1332, 343346. [Google Scholar] [CrossRef] [Scilit] [PubMed]
- Bahmani, H.; Mostofinejad, D. Microstructural characterization of alkali-activated concrete using waste-derived activators from industrial and agricultural sources: A review. Case Stud. Constr. Mater. 2025, 22, e04632. [Google Scholar] [CrossRef] [Scilit]
- Zhang, N.; Li, H.; Peng, D.; Liu, X. Properties evaluation of silica-alumina based concrete: Durability and environmental friendly performance. Constr. Build. Mater. 2016, 115, 105–113. [Google Scholar] [CrossRef] [Scilit]
- Kan, L.; Wang, F.; Zhang, Y.; Wei, Y.; Wu, M. An exploratory study on using red mud waste as a replacement for fly ash to prepare Engineered Cementitious Composites. Constr. Build. Mater. 2022, 342, 127900. [Google Scholar] [CrossRef] [Scilit]
- Yang, C.; Zeng, Q.; Hu, J.; Zhu, W. Study on Performance Optimization of Red Mud–Mineral Powder Composite Cementitious Material Based on Response Surface Methodology. Buildings 2025, 15, 2339. [Google Scholar] [CrossRef] [Scilit]
- Panda, S.; Pradhan, M.; Panigrahi, S.K. Optimal Red Mud Replacement Level Evaluation in Conventional Concrete Based on Fresh and Hardened Concrete Characteristics. J. Sustain. Metall. 2024, 10, 835–850. [Google Scholar] [CrossRef] [Scilit]
- Shirodkar, V.; Patel, R.; Verma, M.; Mahate, V. An investigation into the durability of concrete using red mud as a substitute in cement. Mater. Today Proc. 2023; in press. [CrossRef] [Scilit]
- Venkatesh, C.; Durga, C.S.S.; Sujatha, T.; Bellum, R.R.; Chaitanya, B.K.; Meharie, M.G. Microstructural evolution and mechanical property enhancement of red mud incorporated high strength concrete. Sci. Rep. 2025, 15, 26794. [Google Scholar] [CrossRef] [Scilit] [PubMed]
- Singh, V.; Bano, S.; Chauhan, V.B.; Pal, P.; Kumar, A.; Srivastava, J.B. Red mud as a sustainable road construction material: An experimental investigation. Constr. Build. Mater. 2024, 411, 134549. [Google Scholar] [CrossRef] [Scilit]
- Ortega, J.M.; Cabeza, M.; Tenza-Abril, A.J.; Real-Herraiz, T.; Climent, M.Á.; Sánchez, I. Effects of red mud addition in the microstructure, durability and mechanical performance of cement mortars. Appl. Sci. 2019, 9, 984. [Google Scholar] [CrossRef] [Scilit]
- Sunkpho, J.; Thangavel, P.; Kumar, D.R.; Wipulanusat, W.; Doh, J.H. Sustainable use of red mud in concrete: Assessing mechanical strength, durability, and performance through machine learning models. Green Technol. Sustain. 2025, 4, 100283. [Google Scholar] [CrossRef] [Scilit]
- Peng, G.F.; Wang, X.F.; Ding, H.; Jia, Y.J. Effect of calcined red mud on the mechanical properties and microstructure of ultra-high performance concrete. Constr. Build. Mater. 2025, 484, 141891. [Google Scholar] [CrossRef] [Scilit]
- Ding, Z.; Cheng, Y.; Jin, L.; Wang, W.; Yan, S. Study on the strength characteristics and micro-mechanism of modified solidified red mud. Front. Mater. 2024, 11, 1461198. [Google Scholar] [CrossRef] [Scilit]
- Venkatesh, C.; Nerella, R.; Chand, M.S.R. Role of red mud as a cementing material in concrete: A comprehensive study on durability behavior. Innov. Infrastruct. Solut. 2021, 6, 13. [Google Scholar] [CrossRef] [Scilit]
- Venkatesh, C.; Ruben, N.; Chand, M.S.R. Red mud as an additive in concrete: Comprehensive characterization. J. Korean Ceram. Soc. 2020, 57, 281–289. [Google Scholar] [CrossRef] [Scilit]
- Venkatesh, C.; Nerella, R.; Chand, M.S.R. Comparison of mechanical and durability properties of treated and untreated red mud concrete. Mater. Today Proc. 2020, 27, 284–287. [Google Scholar] [CrossRef] [Scilit]
- Tang, W.C.; Wang, Z.; Liu, Y.; Cui, H.Z. Influence of red mud on fresh and hardened properties of self-compacting concrete. Constr. Build. Mater. 2018, 178, 288–300. [Google Scholar] [CrossRef] [Scilit]
- Monu, G.; Arun, P.; Amit, A. Performance of Concrete Utilizing Red Mud as a Partial Replacement of Cement with Hydrated Lime. Int. J. Res. Eng. Sci. Manag. 2018, 1, 546–551. [Google Scholar]
- Liu, R.X.; Poon, C.S. Utilization of red mud derived from bauxite in self-compacting concrete. J. Clean. Prod. 2016, 112, 384–391. [Google Scholar] [CrossRef] [Scilit]
- Shaik, A.B.; Kommineni, H.R. Experimental investigation on strength and durability properties of concrete using bauxite residue and metakaolin. Mater. Today Proc. 2020, 33, 583–586. [Google Scholar] [CrossRef] [Scilit]
- Viyasun, K.; Anuradha, R.; Thangapandi, K.; Kumar, D.S.; Sivakrishna, A.; Gobinath, R. Investigation on performance of red mud based concrete. Mater. Today Proc. 2020, 39, 796–799. [Google Scholar] [CrossRef] [Scilit]
- Ghalehnovi, M.; Roshan, N.; Hakak, E.; Shamsabadi, E.A.; de Brito, J. Effect of red mud (bauxite residue) as cement replacement on the properties of self-compacting concrete incorporating various fillers. J. Clean. Prod. 2019, 240, 118213. [Google Scholar] [CrossRef] [Scilit]
- Bano, S.; Mumtaz, N.; Bano, F.; Ahmad, S.A. A scientific investigation explores the application of machine learning to assess the compressive strength of red mud-based concrete, enhanced with fly ash, for potential use as a building construction material. Asian J. Civ. Eng. 2024, 25, 1707–1723. [Google Scholar] [CrossRef] [Scilit]
- Haider, I.; Ali, T.; Qureshi, M.Z.; Kahla, N.B.; Mabrouk, A.; Alaneme, G.U.; Ajwad, A. Experimental and machine learning-based analysis of red mud influence on recycled aggregate concrete properties. Sci. Rep. 2025, 15, 37231, Erratum in Sci. Rep. 2026, 16, 5288. https://doi.org/10.1038/s41598-026-38739-6. [Google Scholar] [CrossRef] [Scilit] [PubMed]
- Kina, C.; Tanyildizi, H.; Al Bakri Abdullah, M.M.; Razak, R.A.; Imjai, T. Comparison of deep LSTM and machine learning models for predicting compressive strength of fly ash/slag-based geopolymer concrete. Sci. Rep. 2025, 15, 32871. [Google Scholar] [CrossRef] [Scilit] [PubMed]
- Mahmood, M.S.; Ali, T.; Inam, I.; Qureshi, M.Z.; Zaidi, S.S.A.; Alqurashi, M.; Ahmed, H.; Adnan, M.; Hotak, A.H. Machine learning prediction and explainability analysis of high strength glass powder concrete using SHAP PDP and ICE. Sci. Rep. 2025, 15, 22089. [Google Scholar] [CrossRef] [Scilit] [PubMed]
- Abioye, S.O.; Babatunde, Y.O.; Abikoye, O.A.; Shaibu, A.N.; Bankole, B.J. Optimized machine learning algorithms with SHAP analysis for predicting compressive strength in high-performance concrete. AI Civ. Eng. 2025, 4, 16. [Google Scholar] [CrossRef] [Scilit]
- Zhang, Y.; Ren, W.; Chen, Y.; Mi, Y.; Lei, J.; Sun, L. Predicting the compressive strength of high-performance concrete using an interpretable machine learning model. Sci. Rep. 2024, 14, 28346. [Google Scholar] [CrossRef] [Scilit] [PubMed]
- Sreedevi, V.M.; Chandran, D.; Davis, P.R.; Chithra, N.R.; Pradeepmon, T.G. Prediction of Compressive Strength of Concrete Using Machine Learning Techniques. Lect. Notes Multidiscip. Ind. Eng. Part F 2026, 1254, 311–320. [Google Scholar] [CrossRef] [Scilit]
- Li, L.; Chang, J.; Vakanski, A.; Wang, Y.; Yao, T.; Xian, M. Uncertainty quantification in multivariable regression for material property prediction with Bayesian neural networks. Sci. Rep. 2024, 14, 10543. [Google Scholar] [CrossRef] [Scilit] [PubMed]
- Vu-Bac, N.; Le-Anh, T.; Rabczuk, T. A Machine Learning based uncertainty quantification for compressive strength of high-performance concrete. Front. Struct. Civ. Eng. 2025, 19, 824–836. [Google Scholar] [CrossRef] [Scilit]
- Prasittisopin, L. Machine learning (ML) and deep learning (DL) in sustainable concrete construction: Review, trend and gap analyses. J. Asian Archit. Build. Eng. 2025, 24, 1–29. [Google Scholar] [CrossRef] [Scilit]
- Sunkpho, J.; Thangavel, P.; Wipulanusat, W. Evaluating concrete properties: Integrating ultrasonic pulse velocity and machine learning models for strain prediction. J. Struct. Integr. Maint. 2026, 11, 2624157. [Google Scholar] [CrossRef] [Scilit]
- Pradeep, T.; Kumar, D.R.; Kumar, N.; Wipulanusat, W.; Keawsawasvong, S.; Sunkpho, J. Performance Evaluation and Triangle Diagram of Deep Learning Models for Embedment Depth Prediction in Cantilever Sheet Piles. Eng. Sci. 2024, 28, 1082. [Google Scholar] [CrossRef] [Scilit]
- Kazemi, F.; Asgarkhani, N.; Ghanbari-Ghazijahani, T.; Jankowski, R. Ensemble machine learning models for estimating mechanical curves of concrete-timber-filled steel tubes. Eng. Appl. Artif. Intell. 2025, 156, 111234. [Google Scholar] [CrossRef] [Scilit]
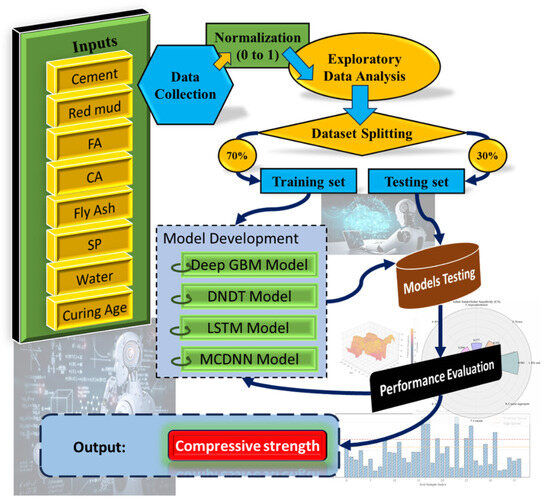
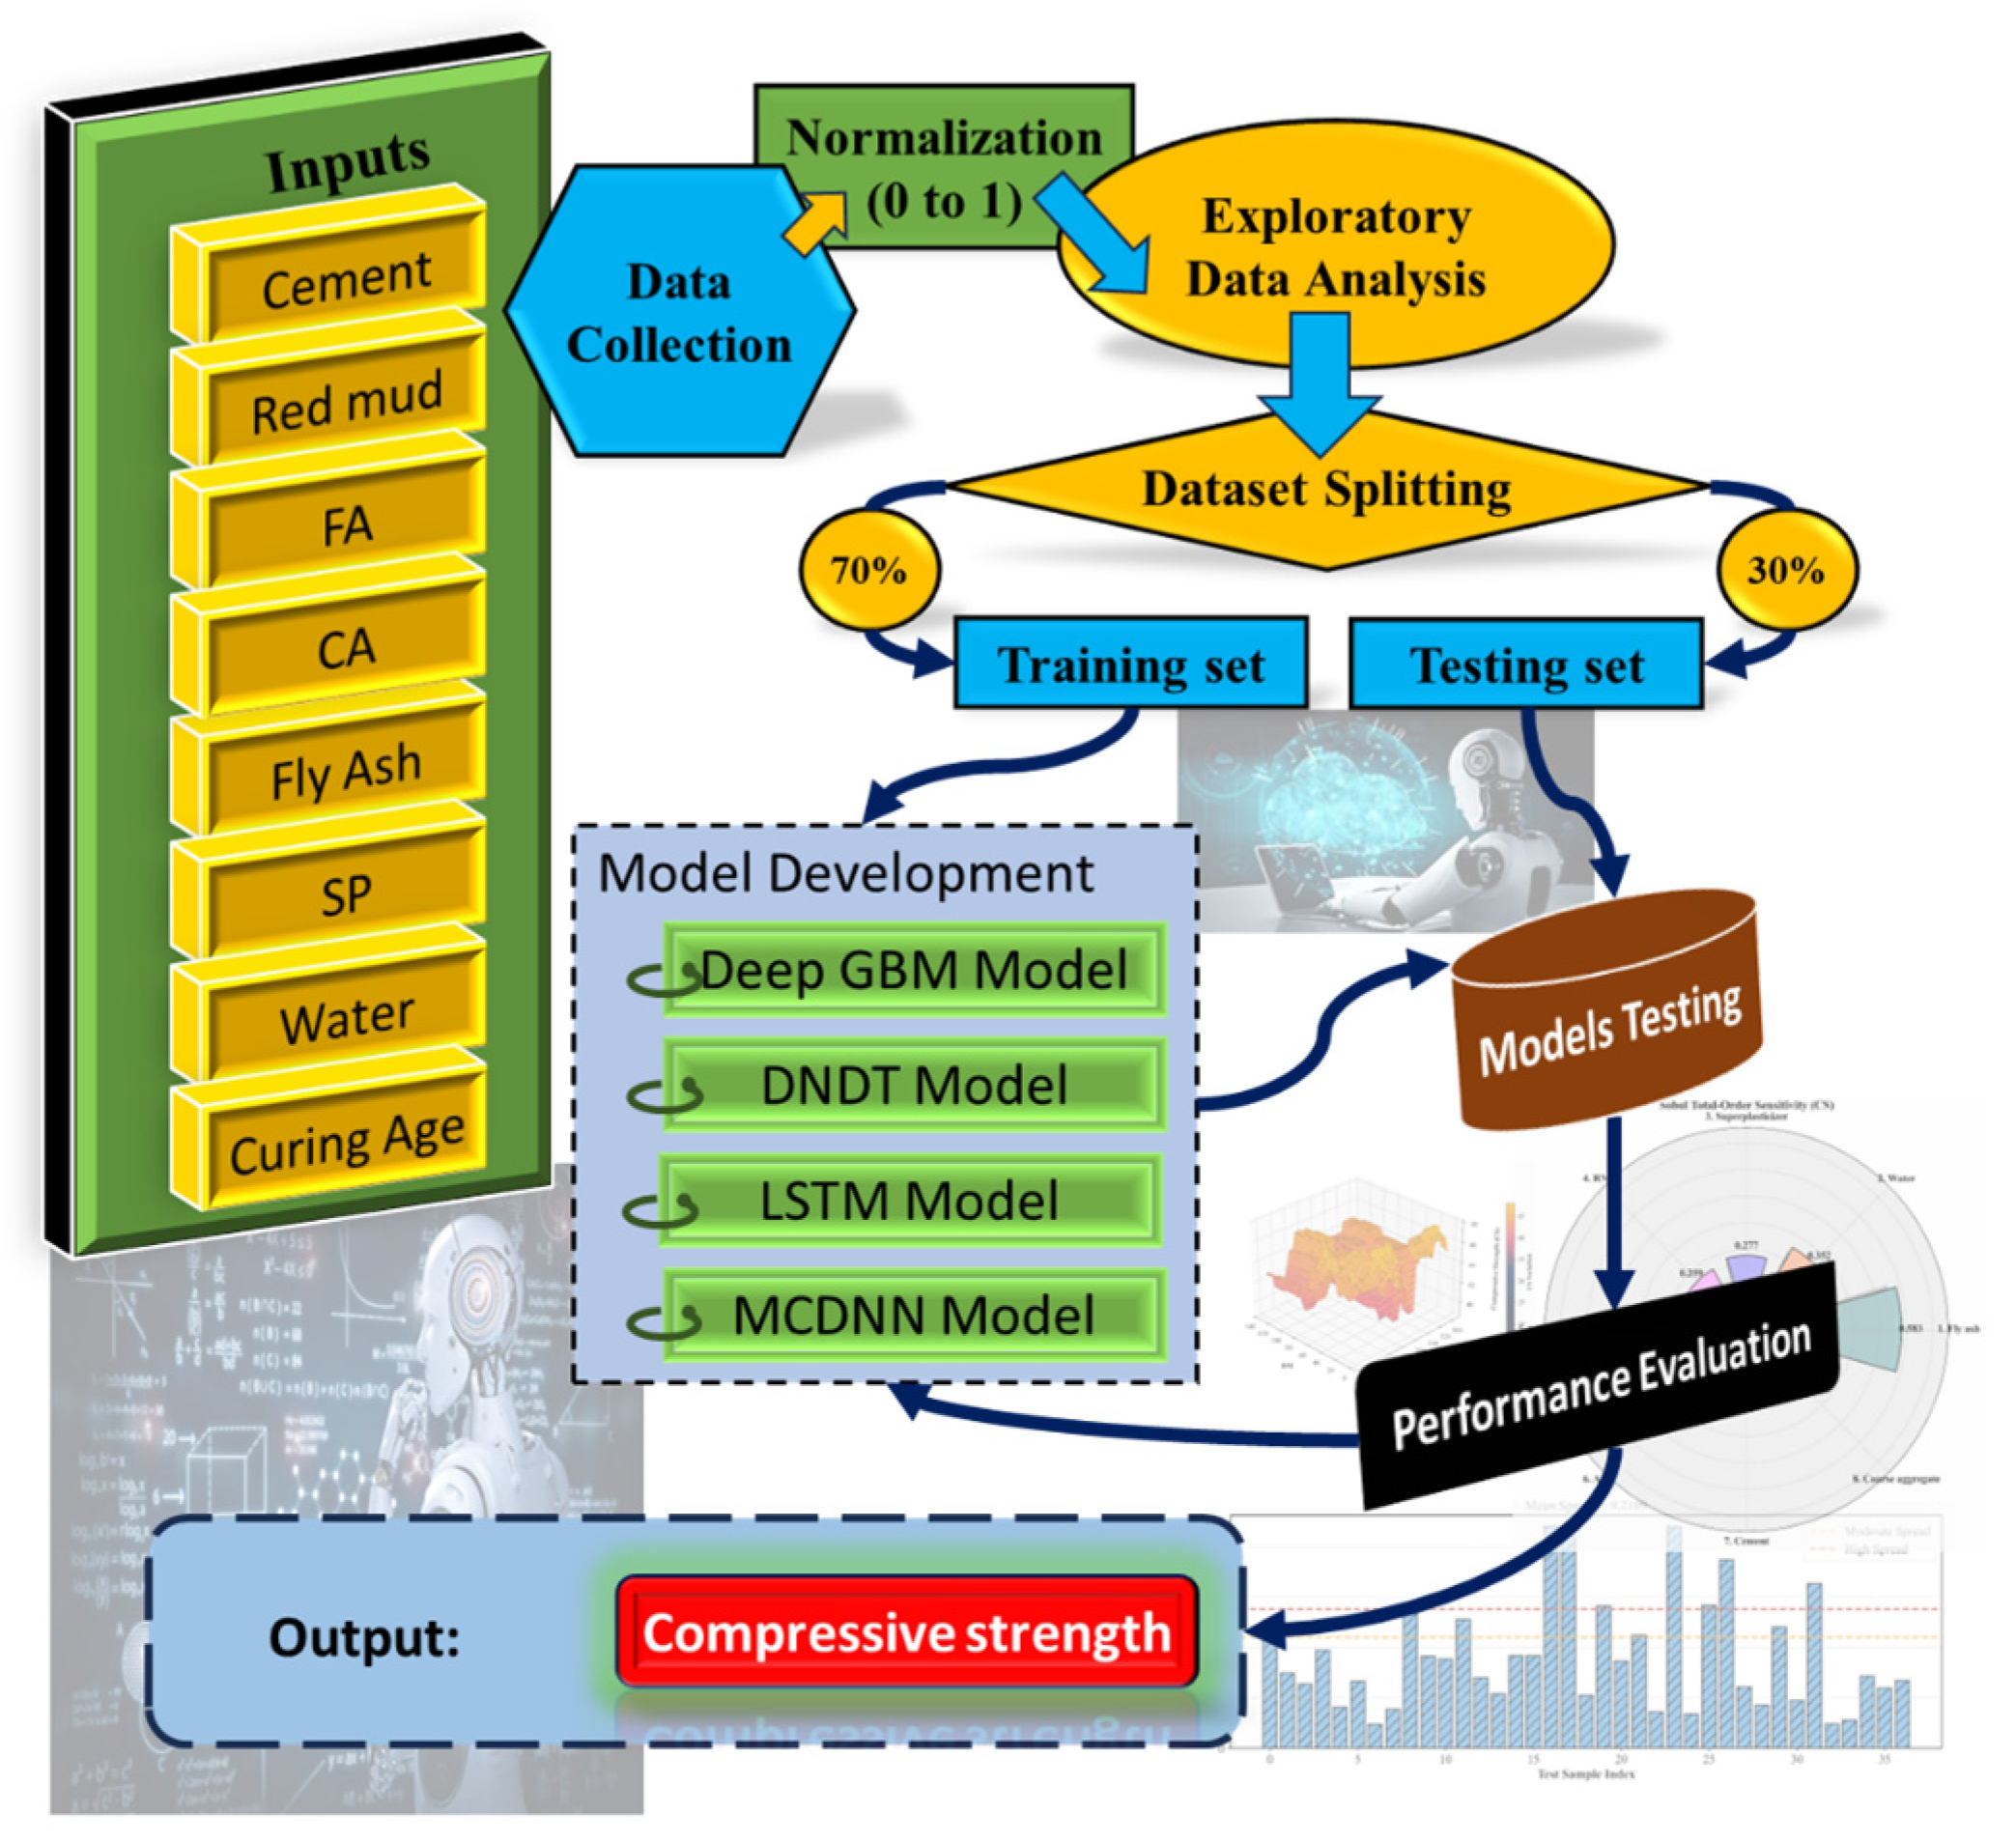
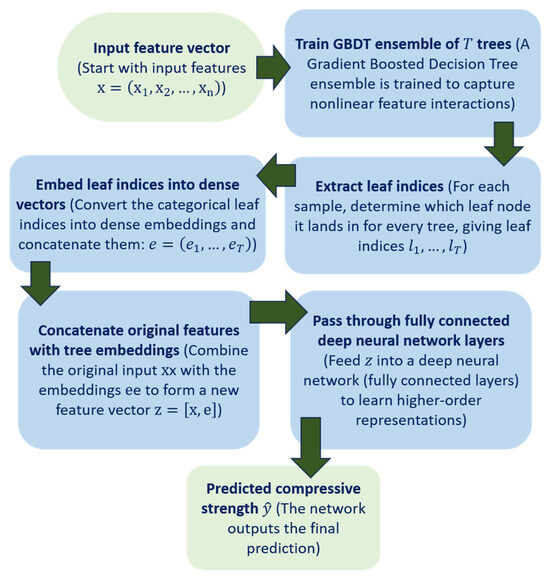
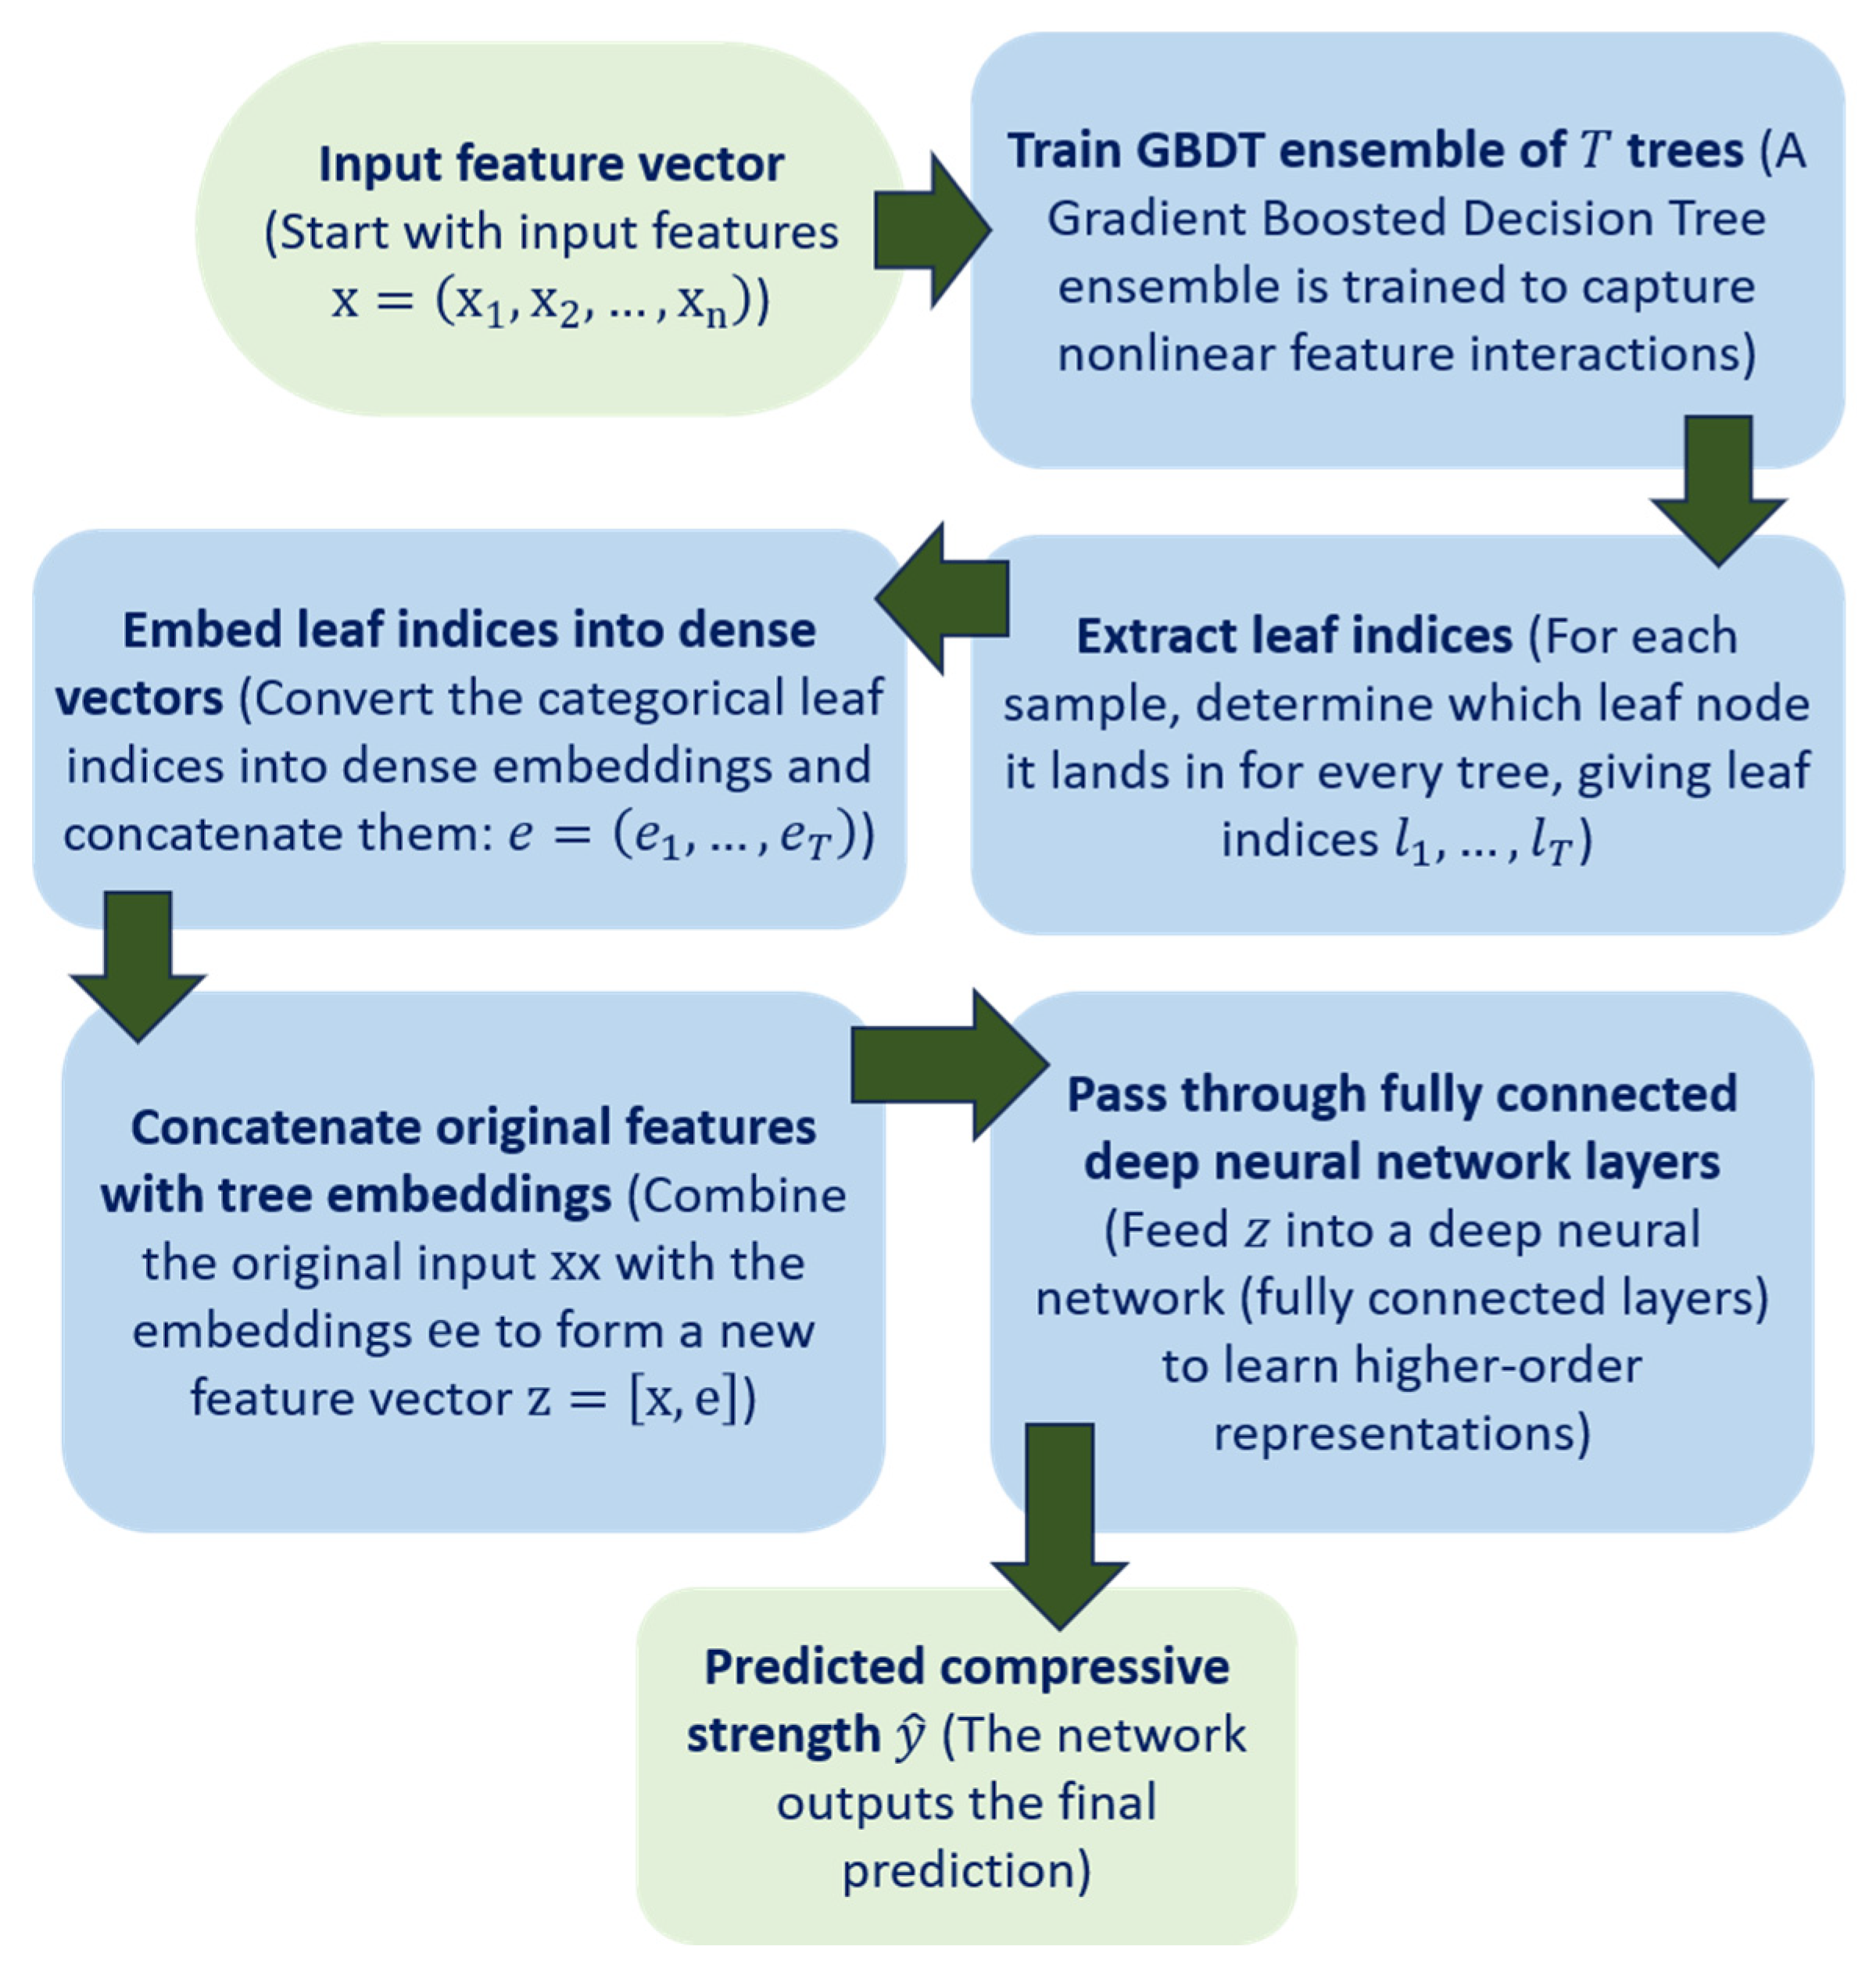
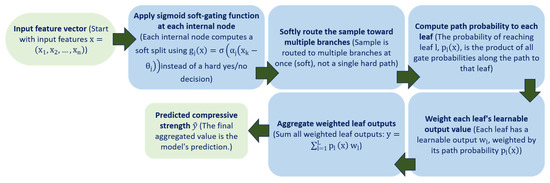
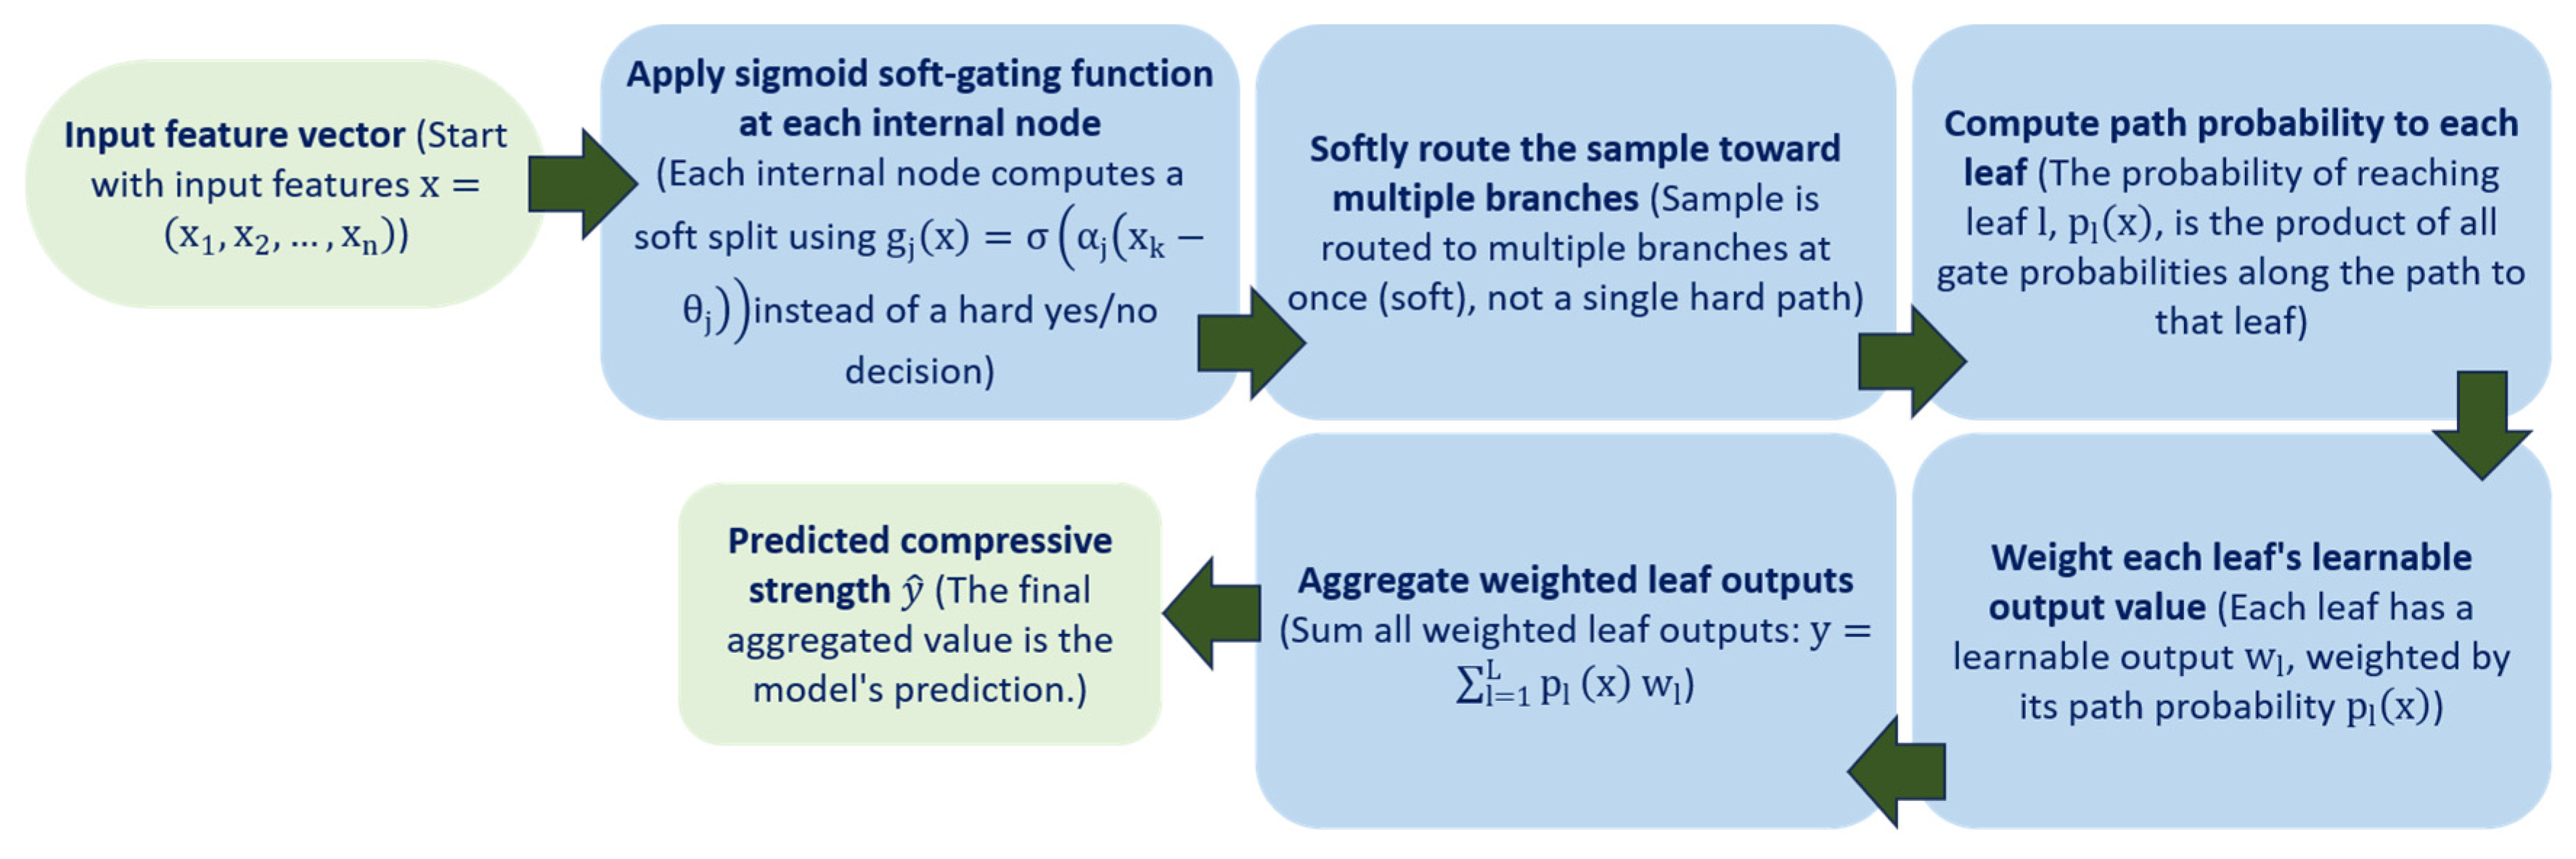
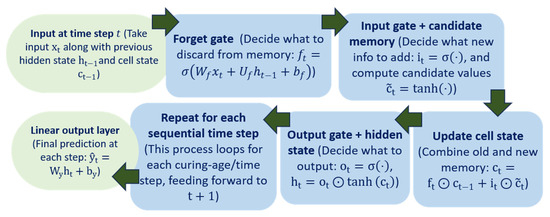
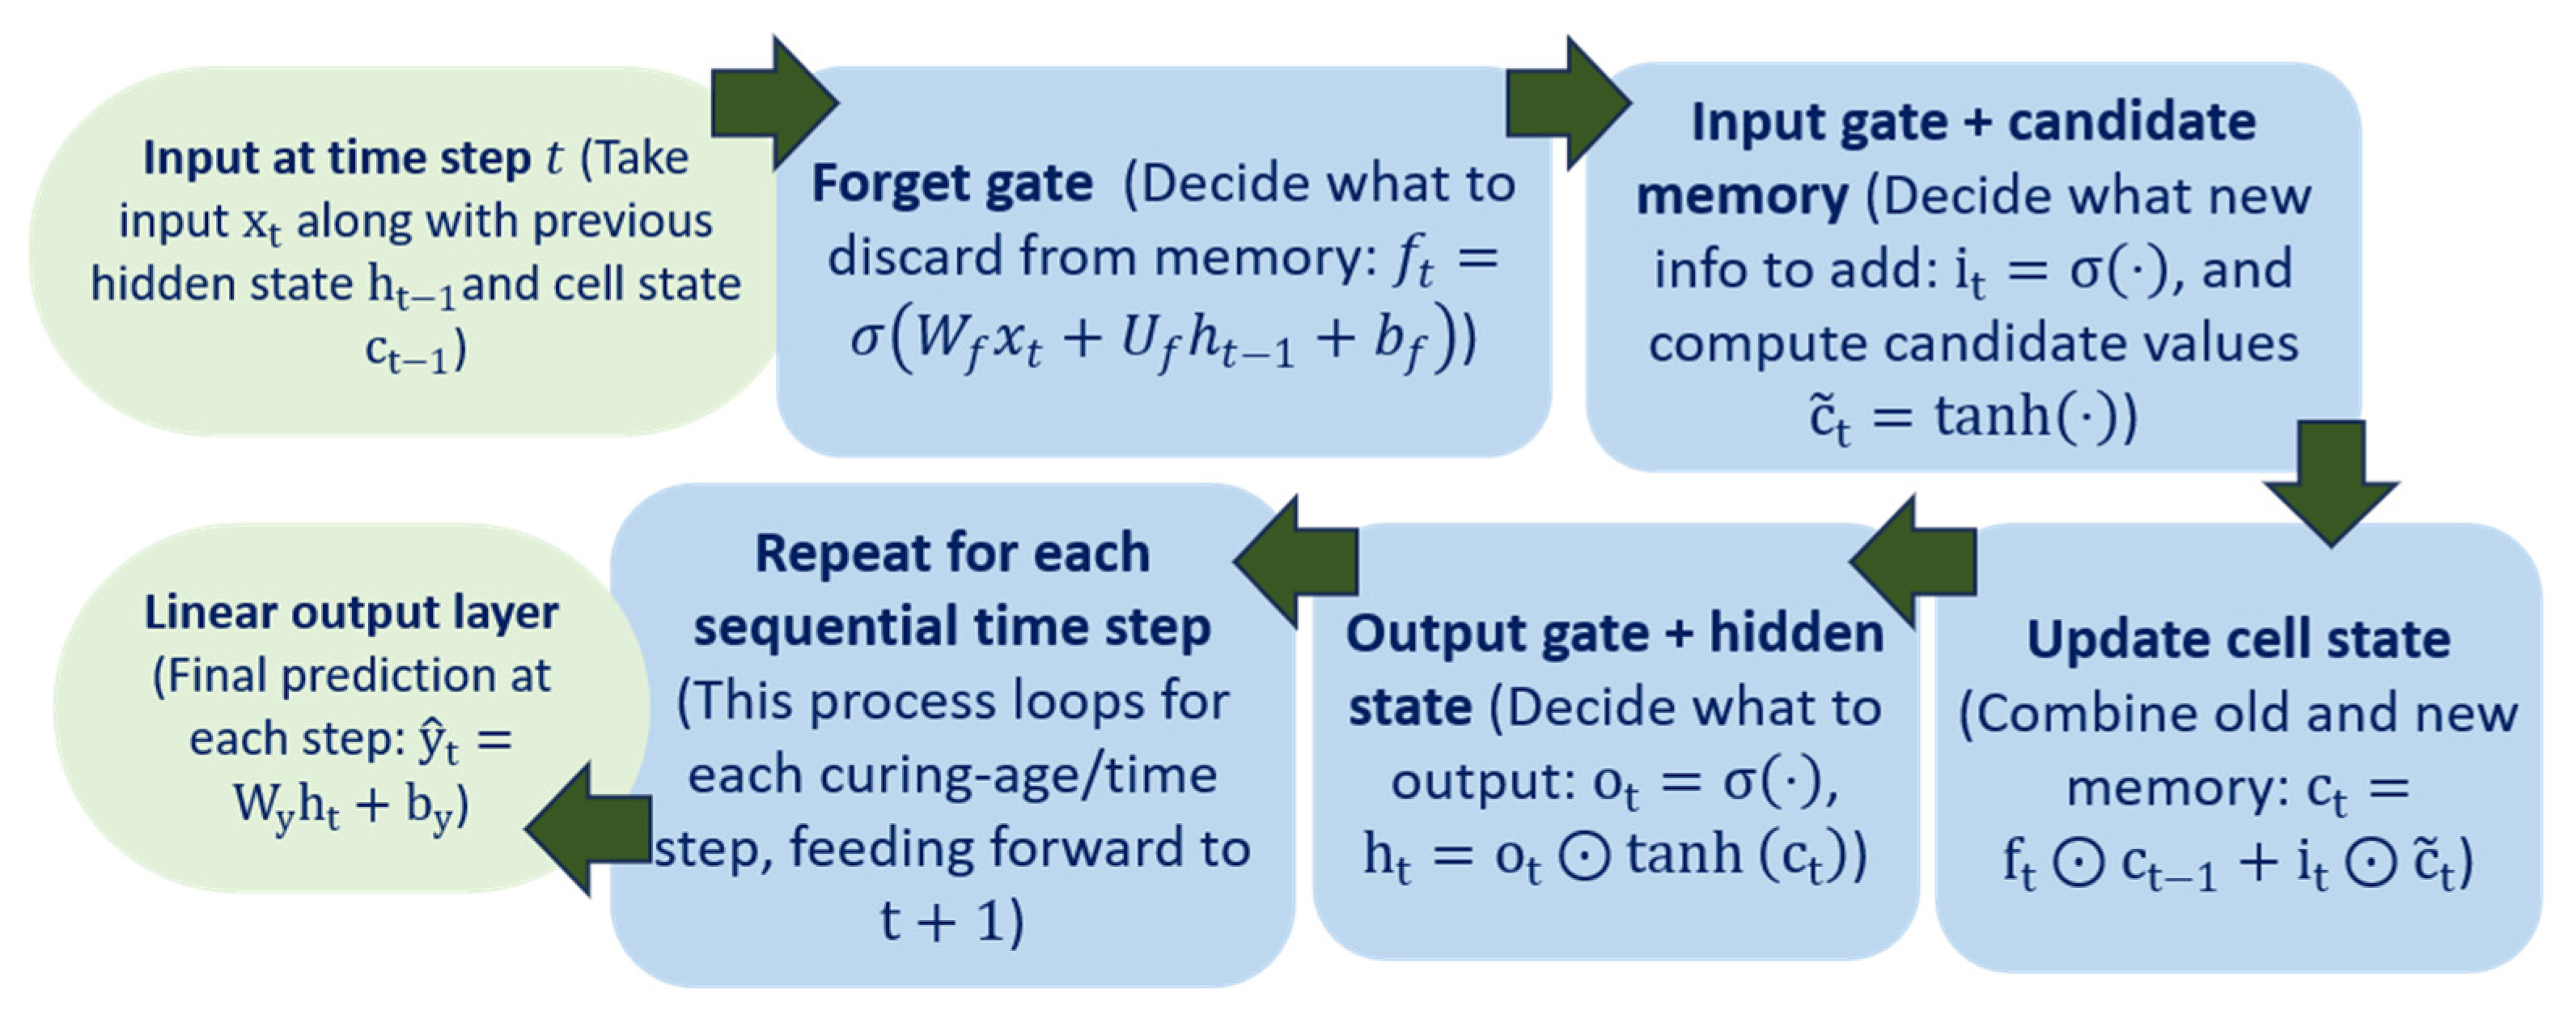
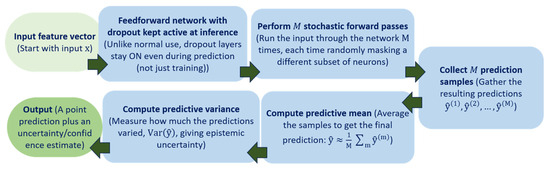
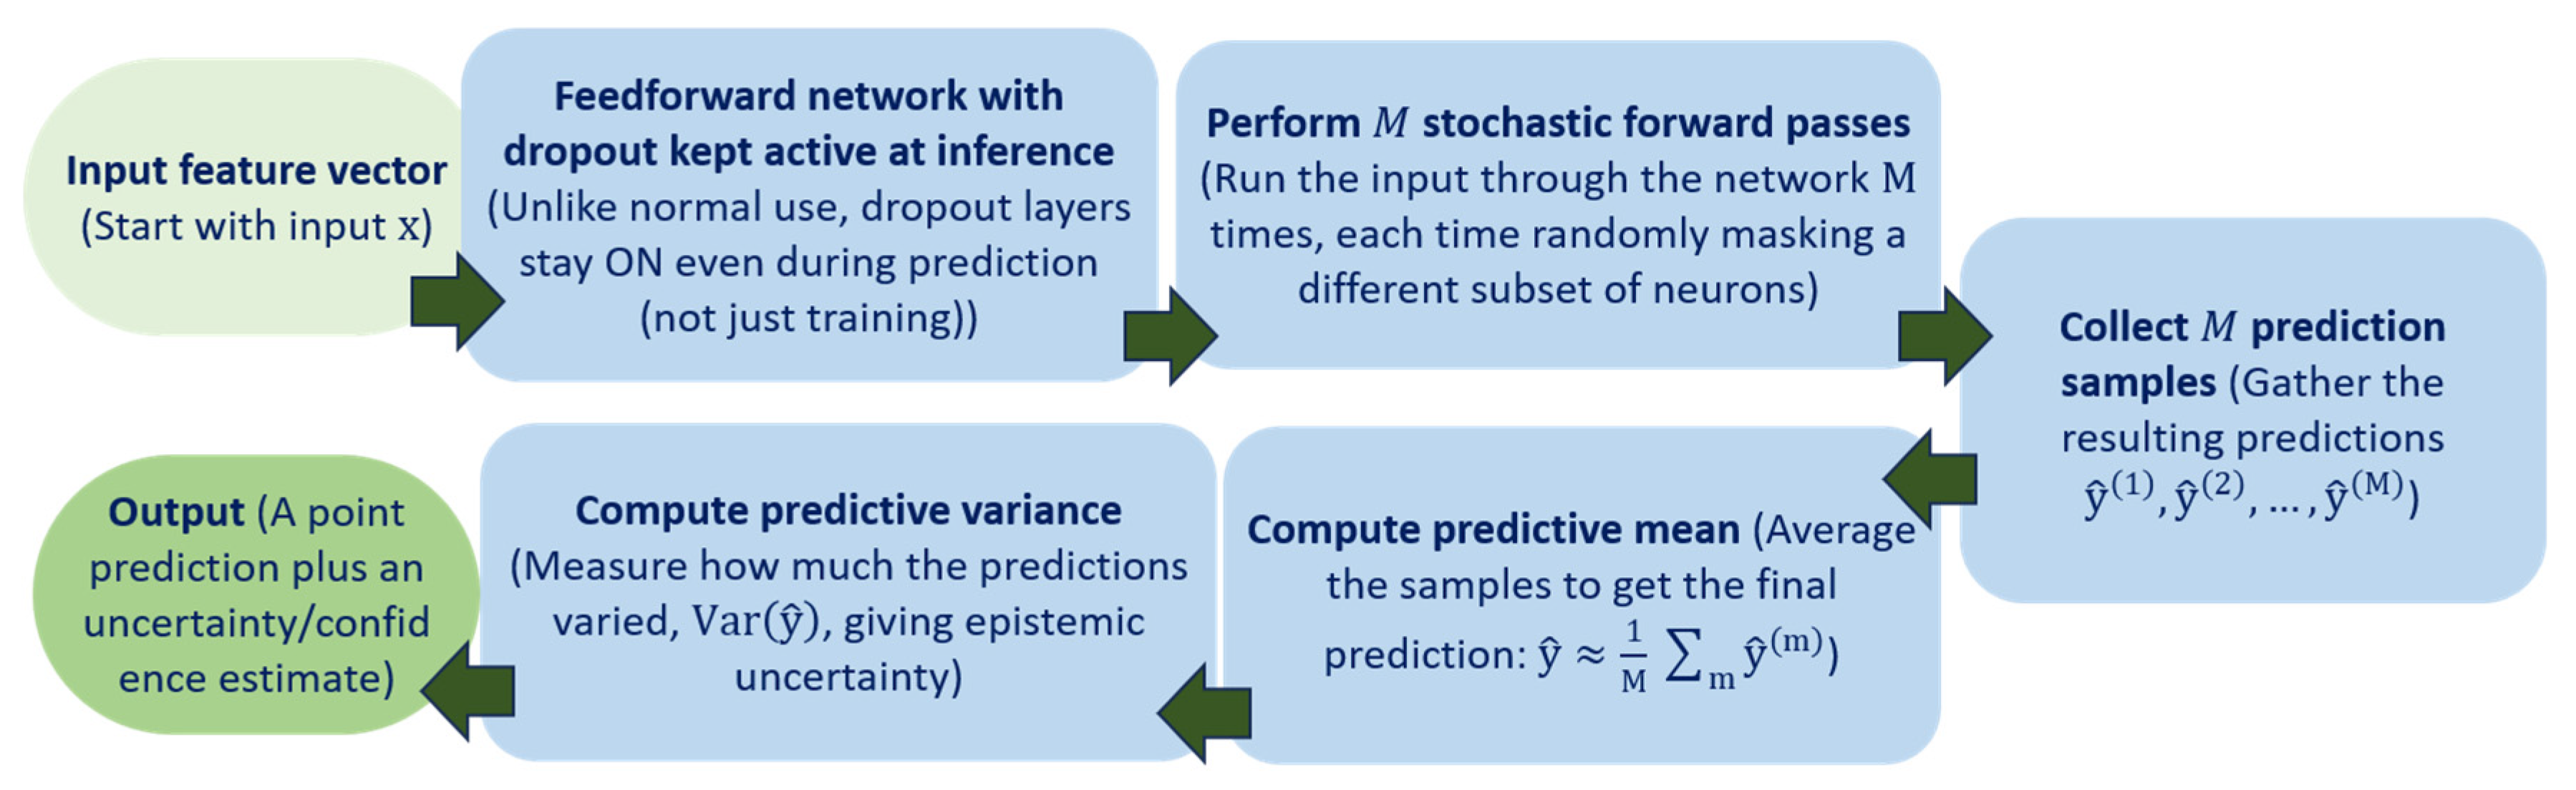
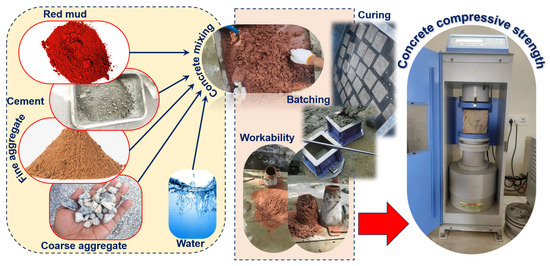
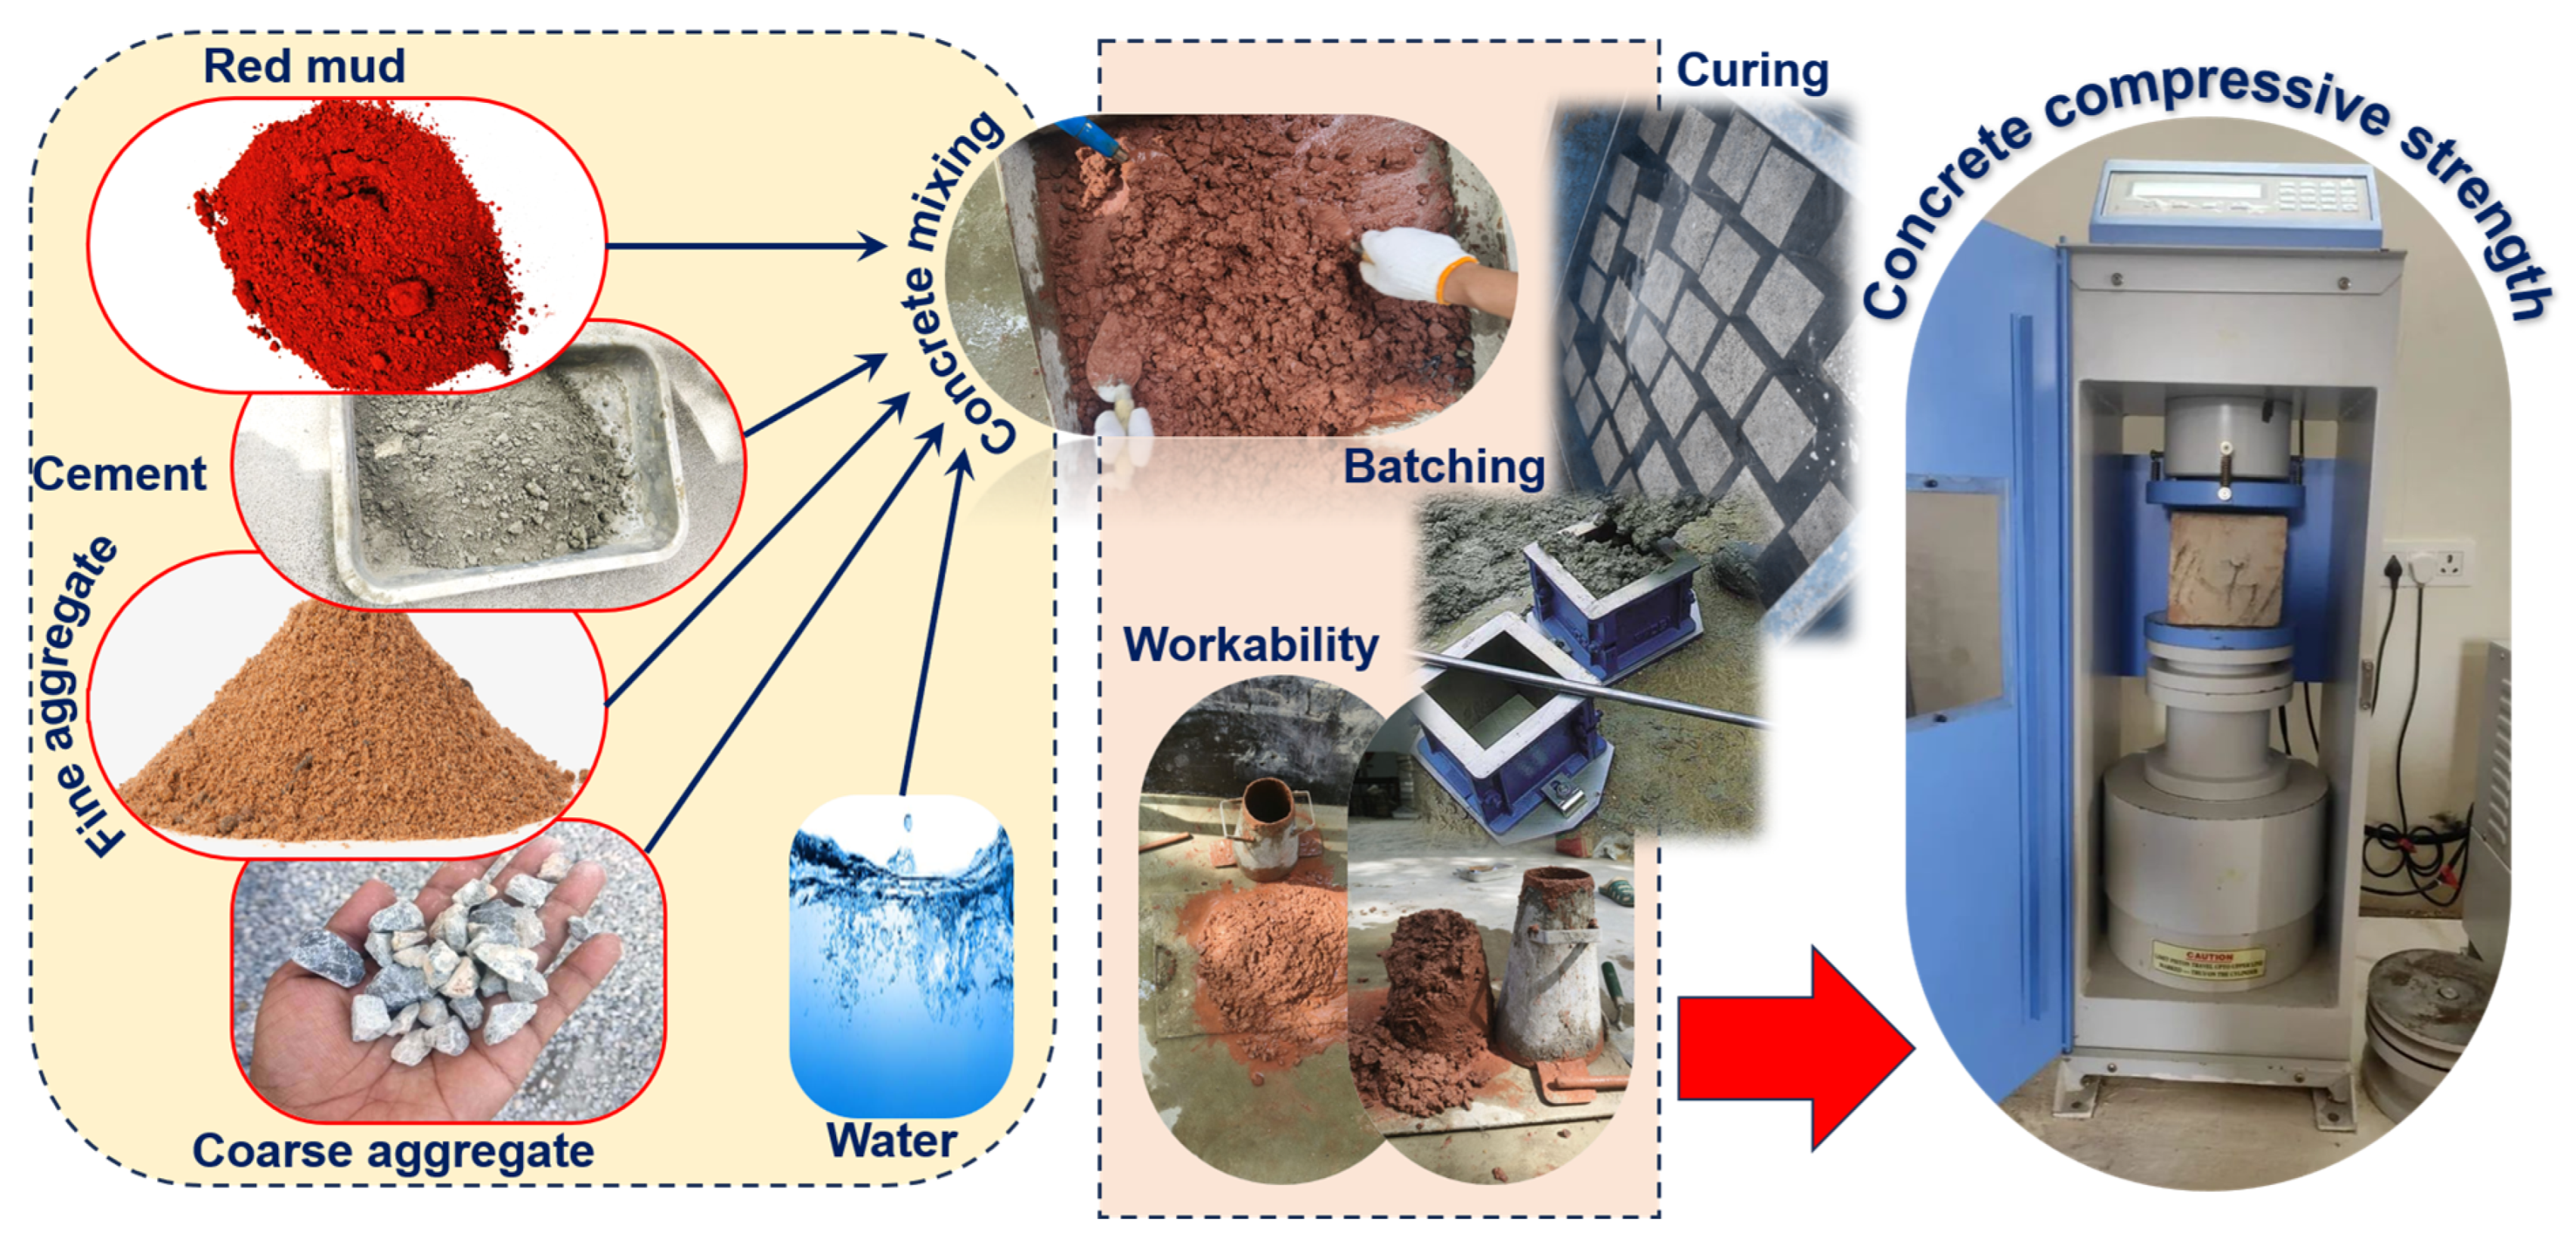
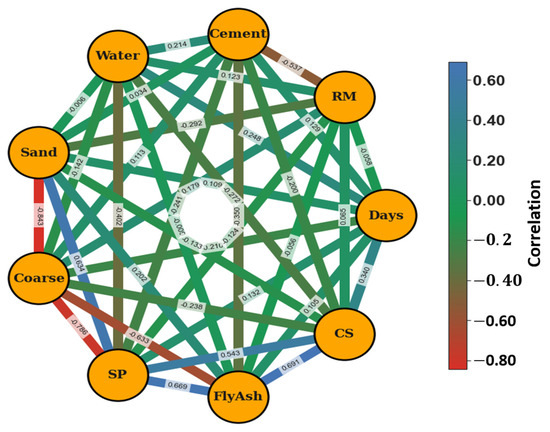
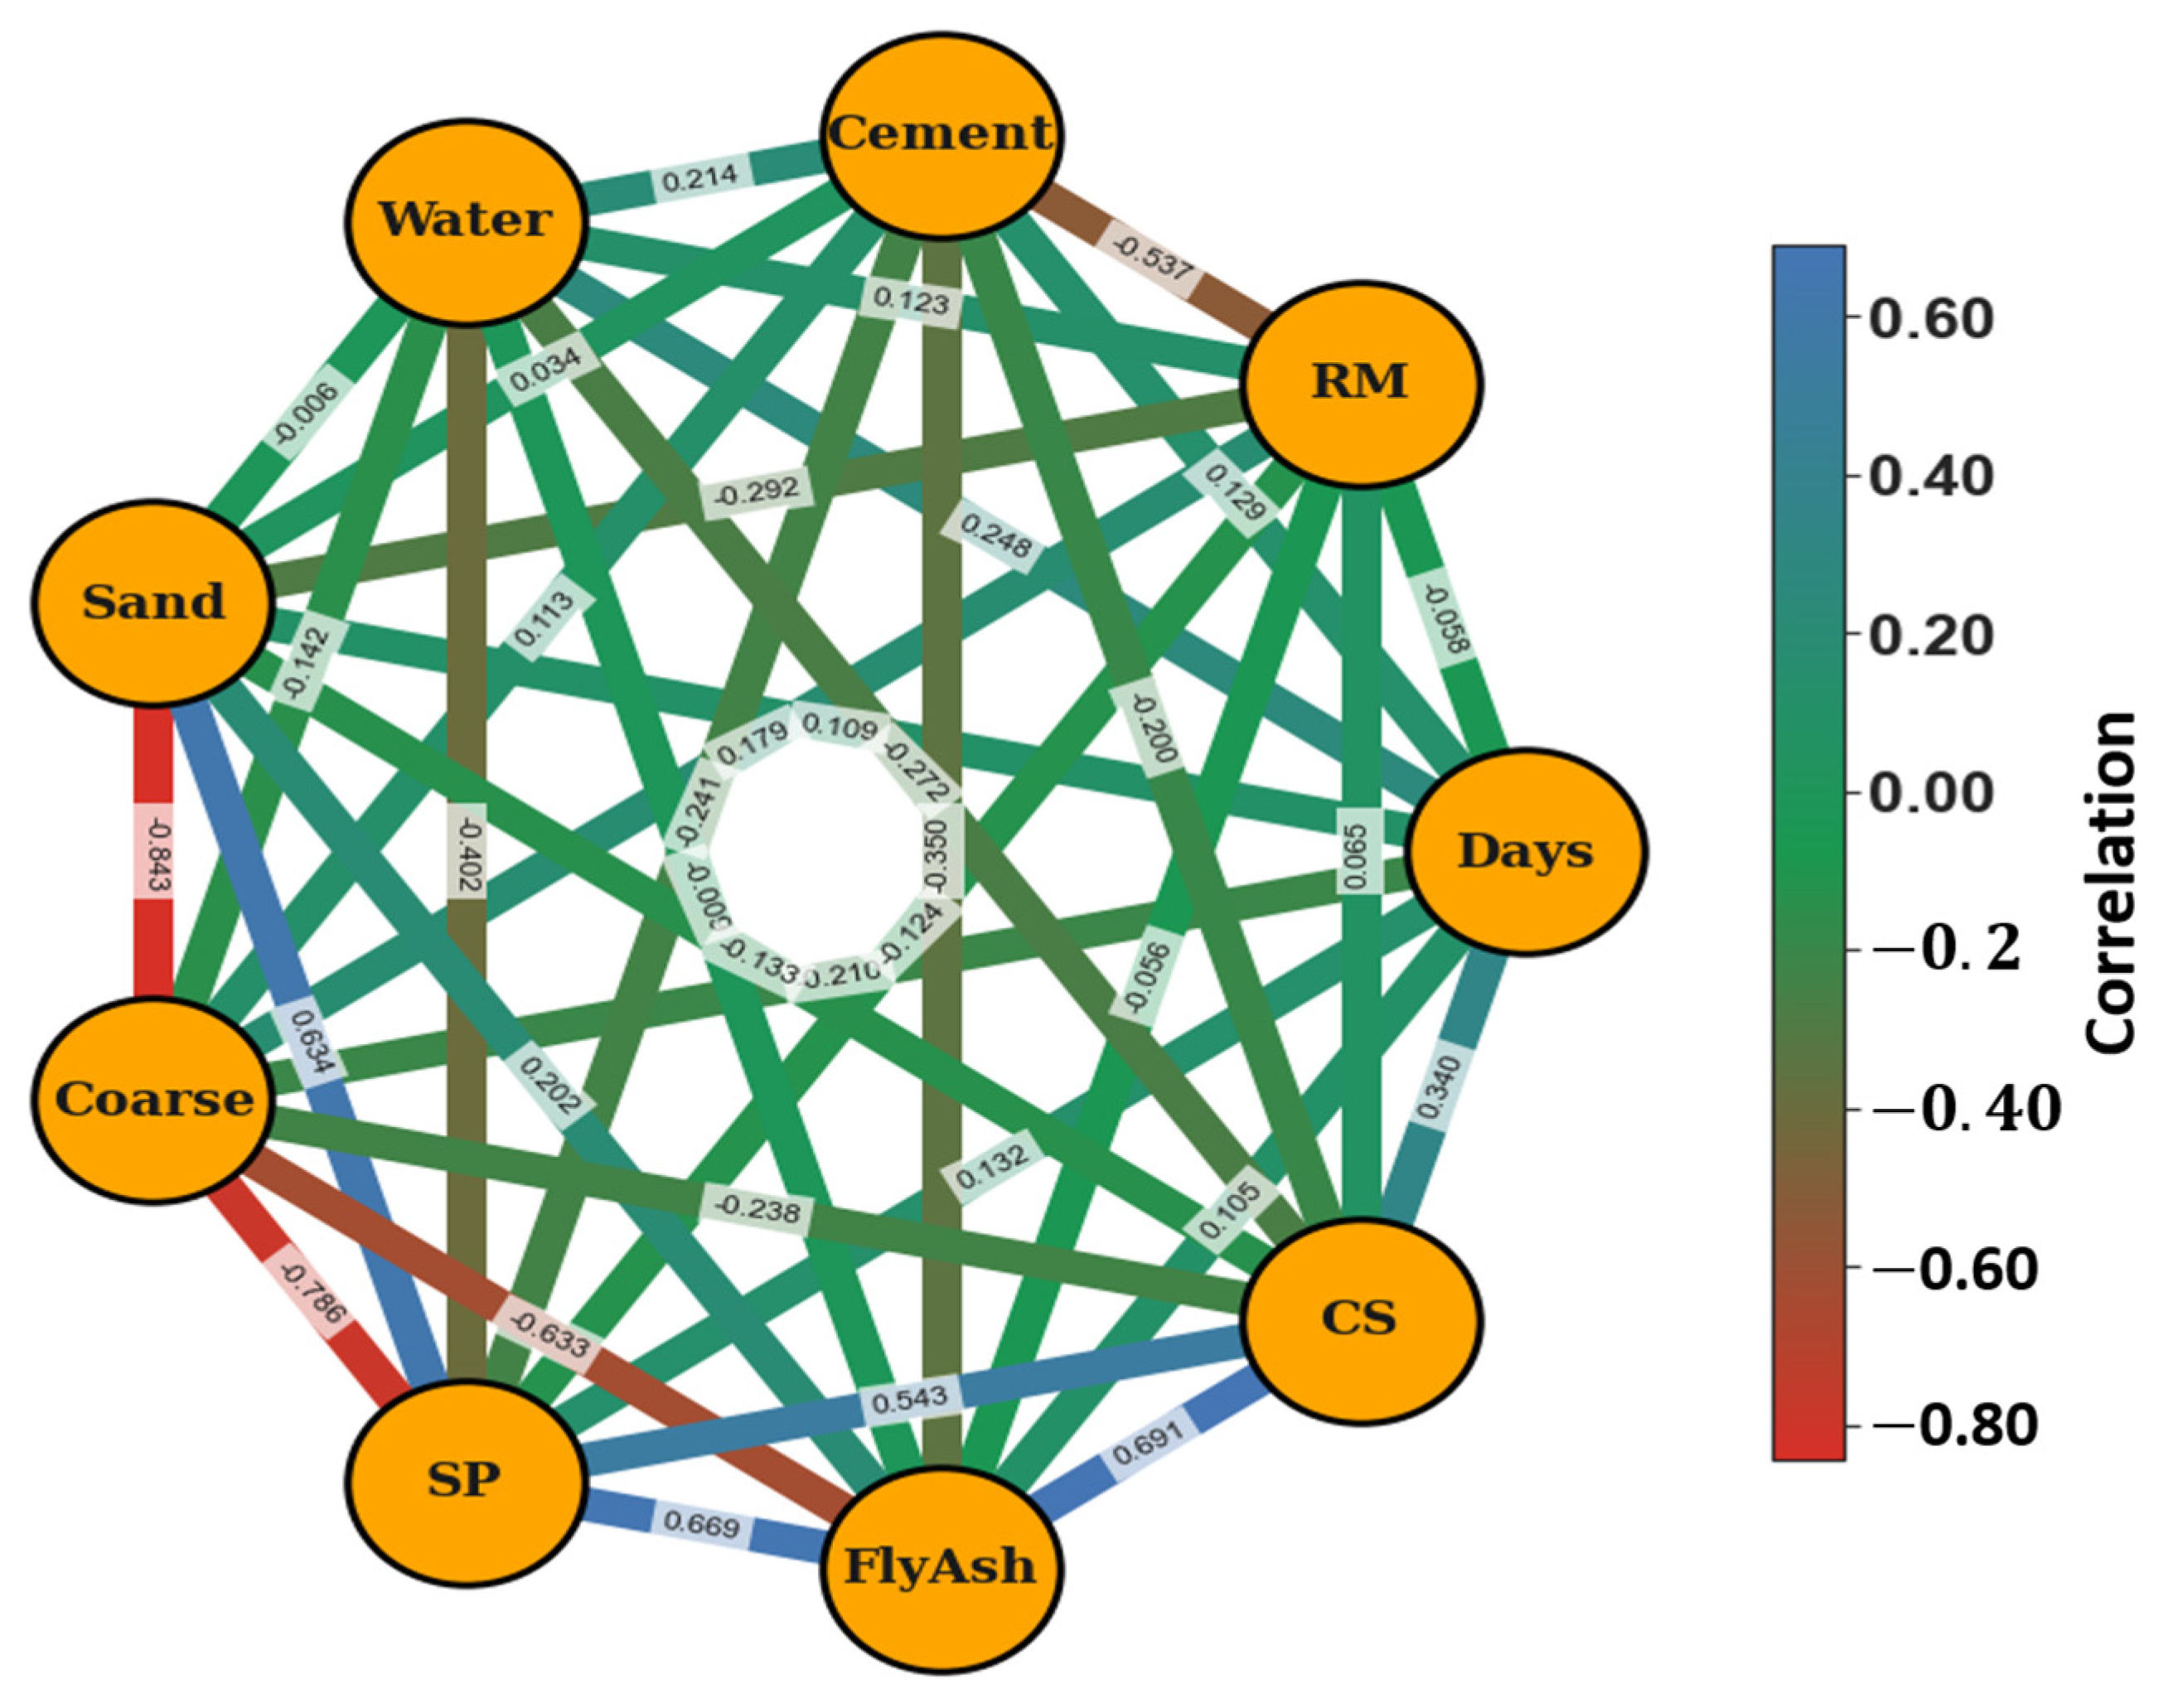
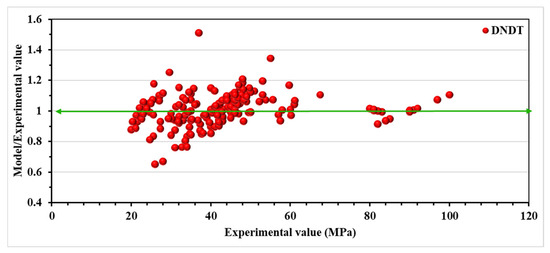
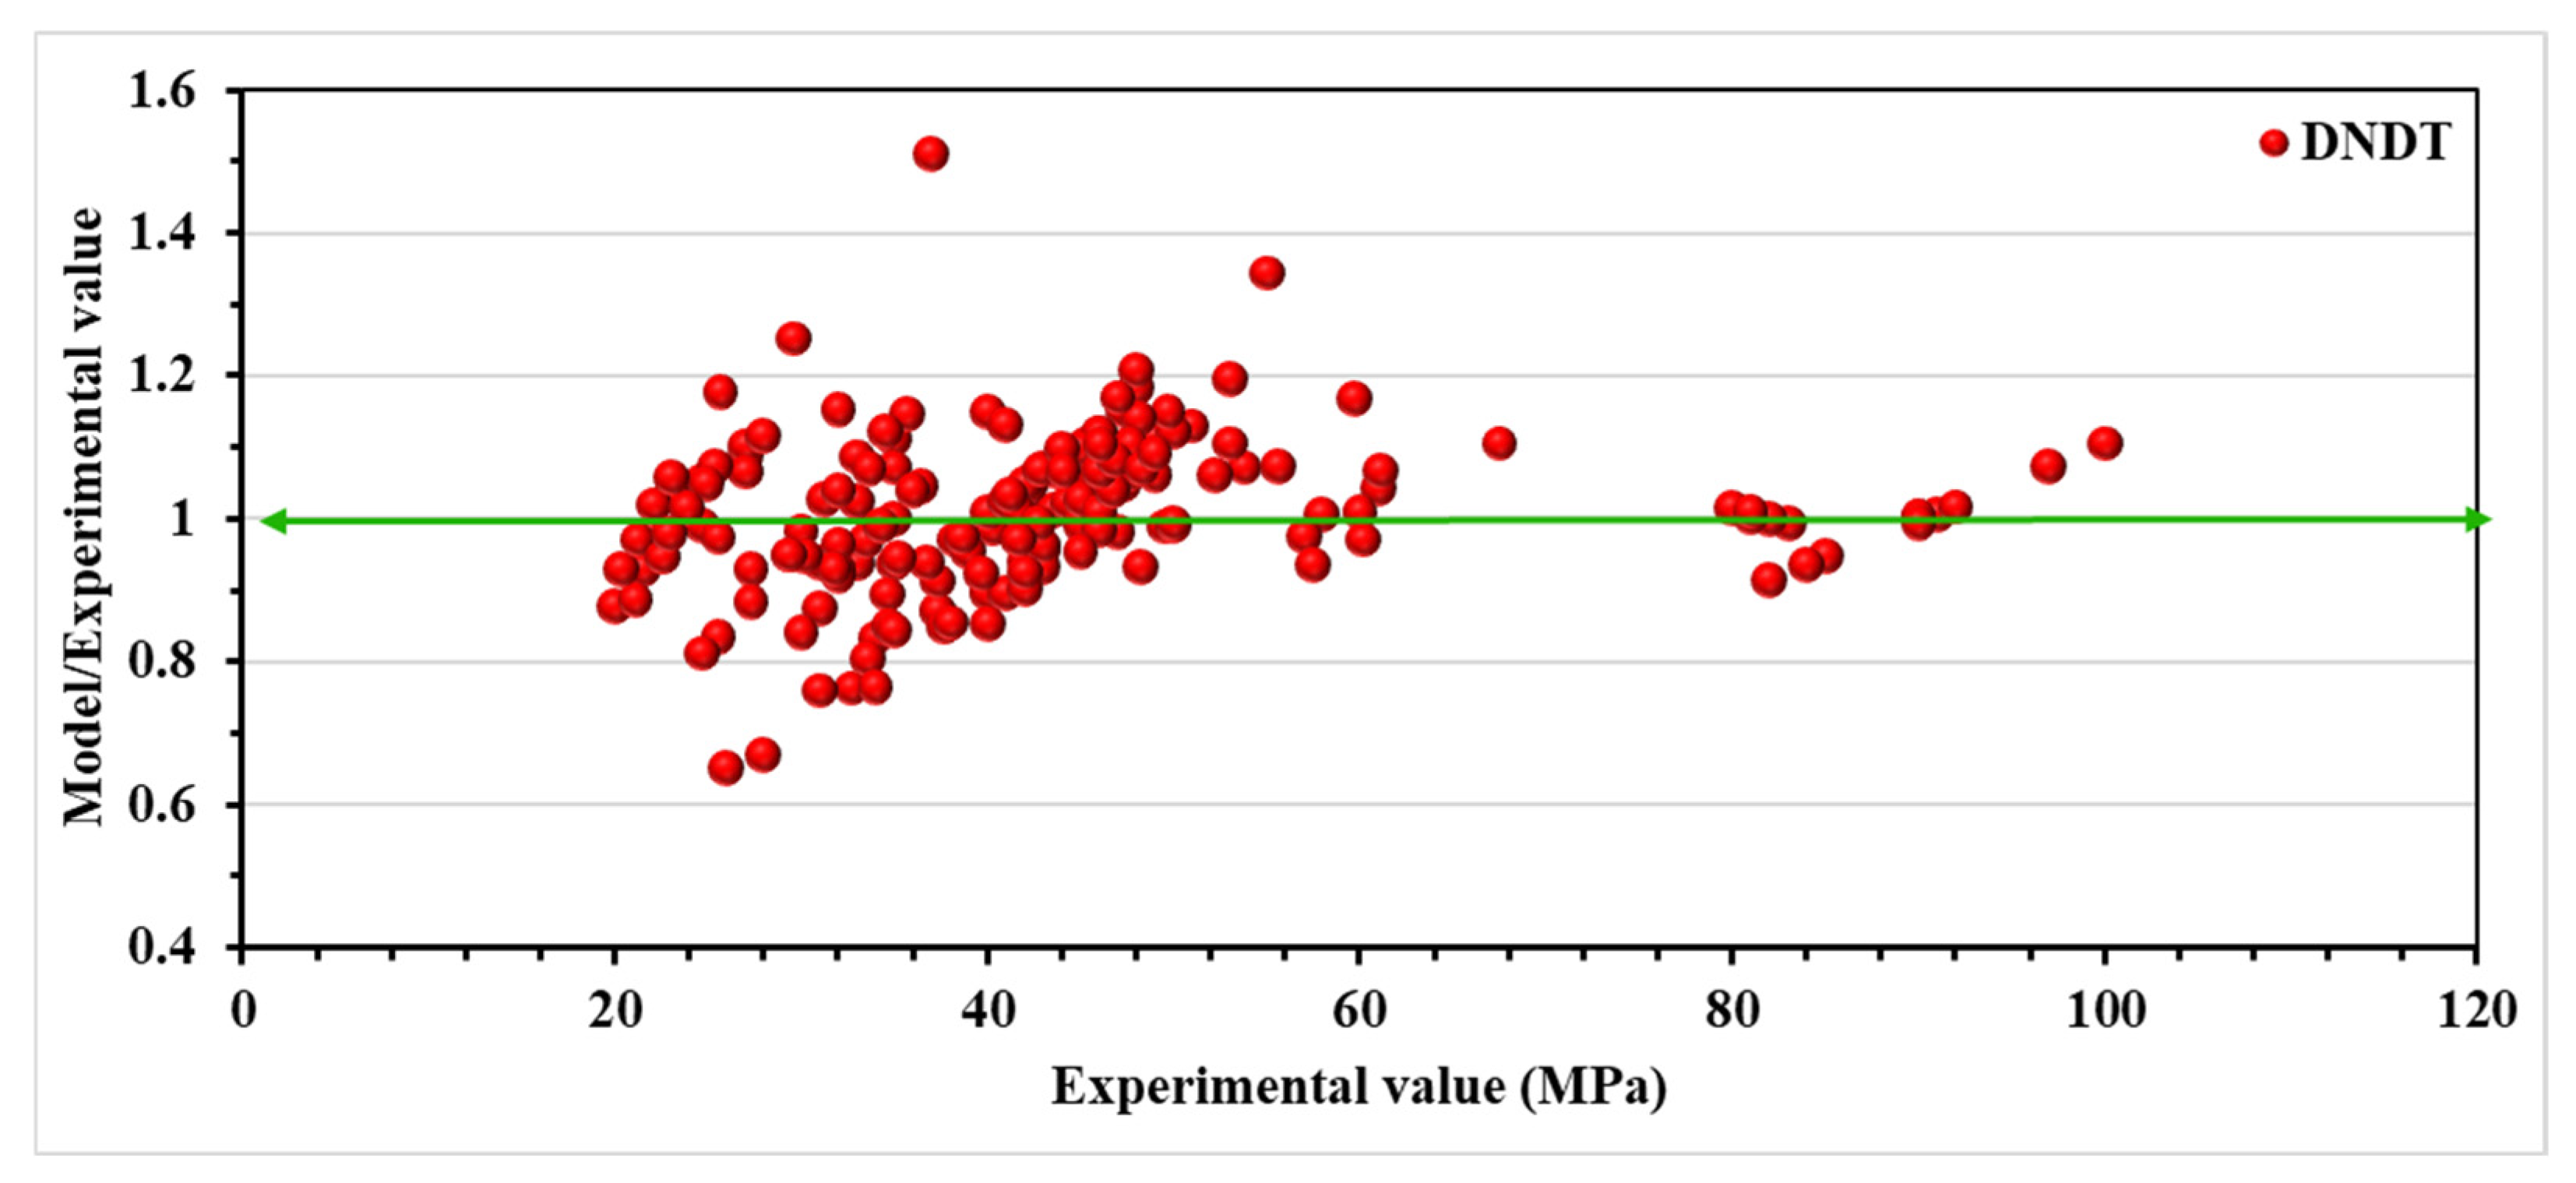
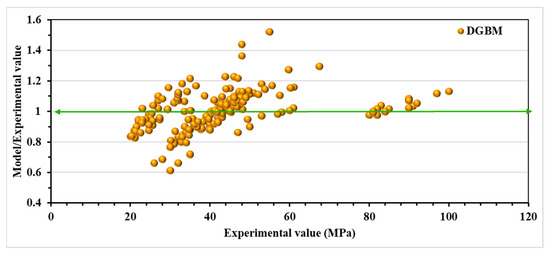
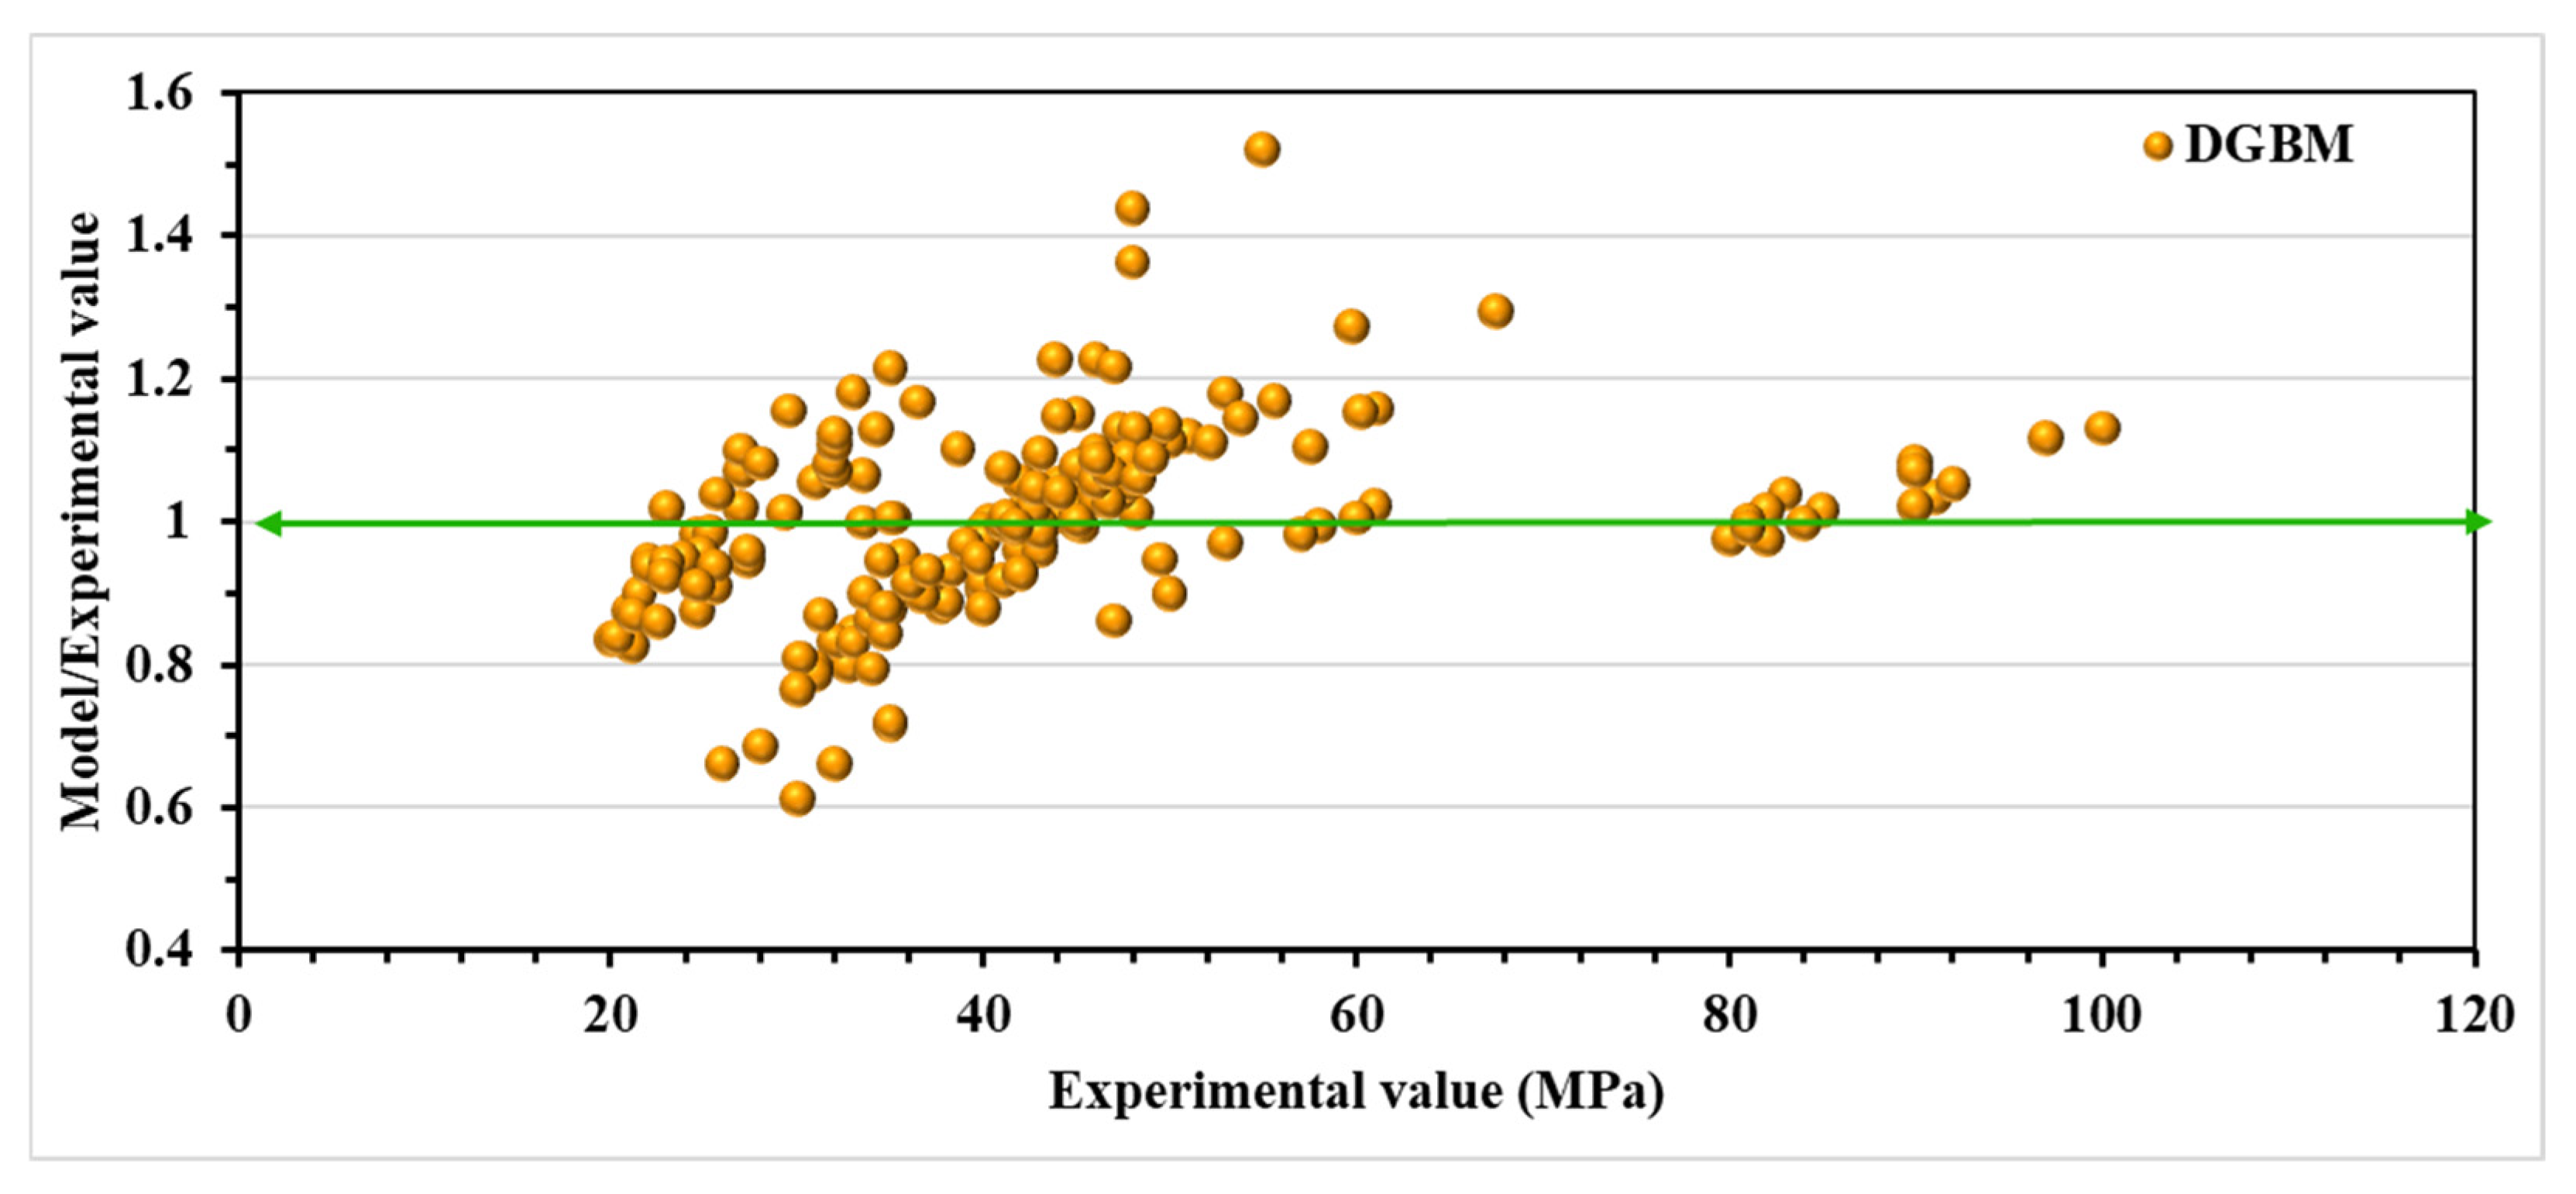
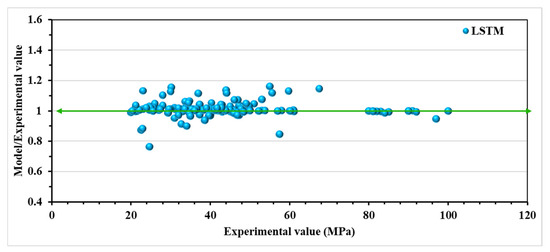
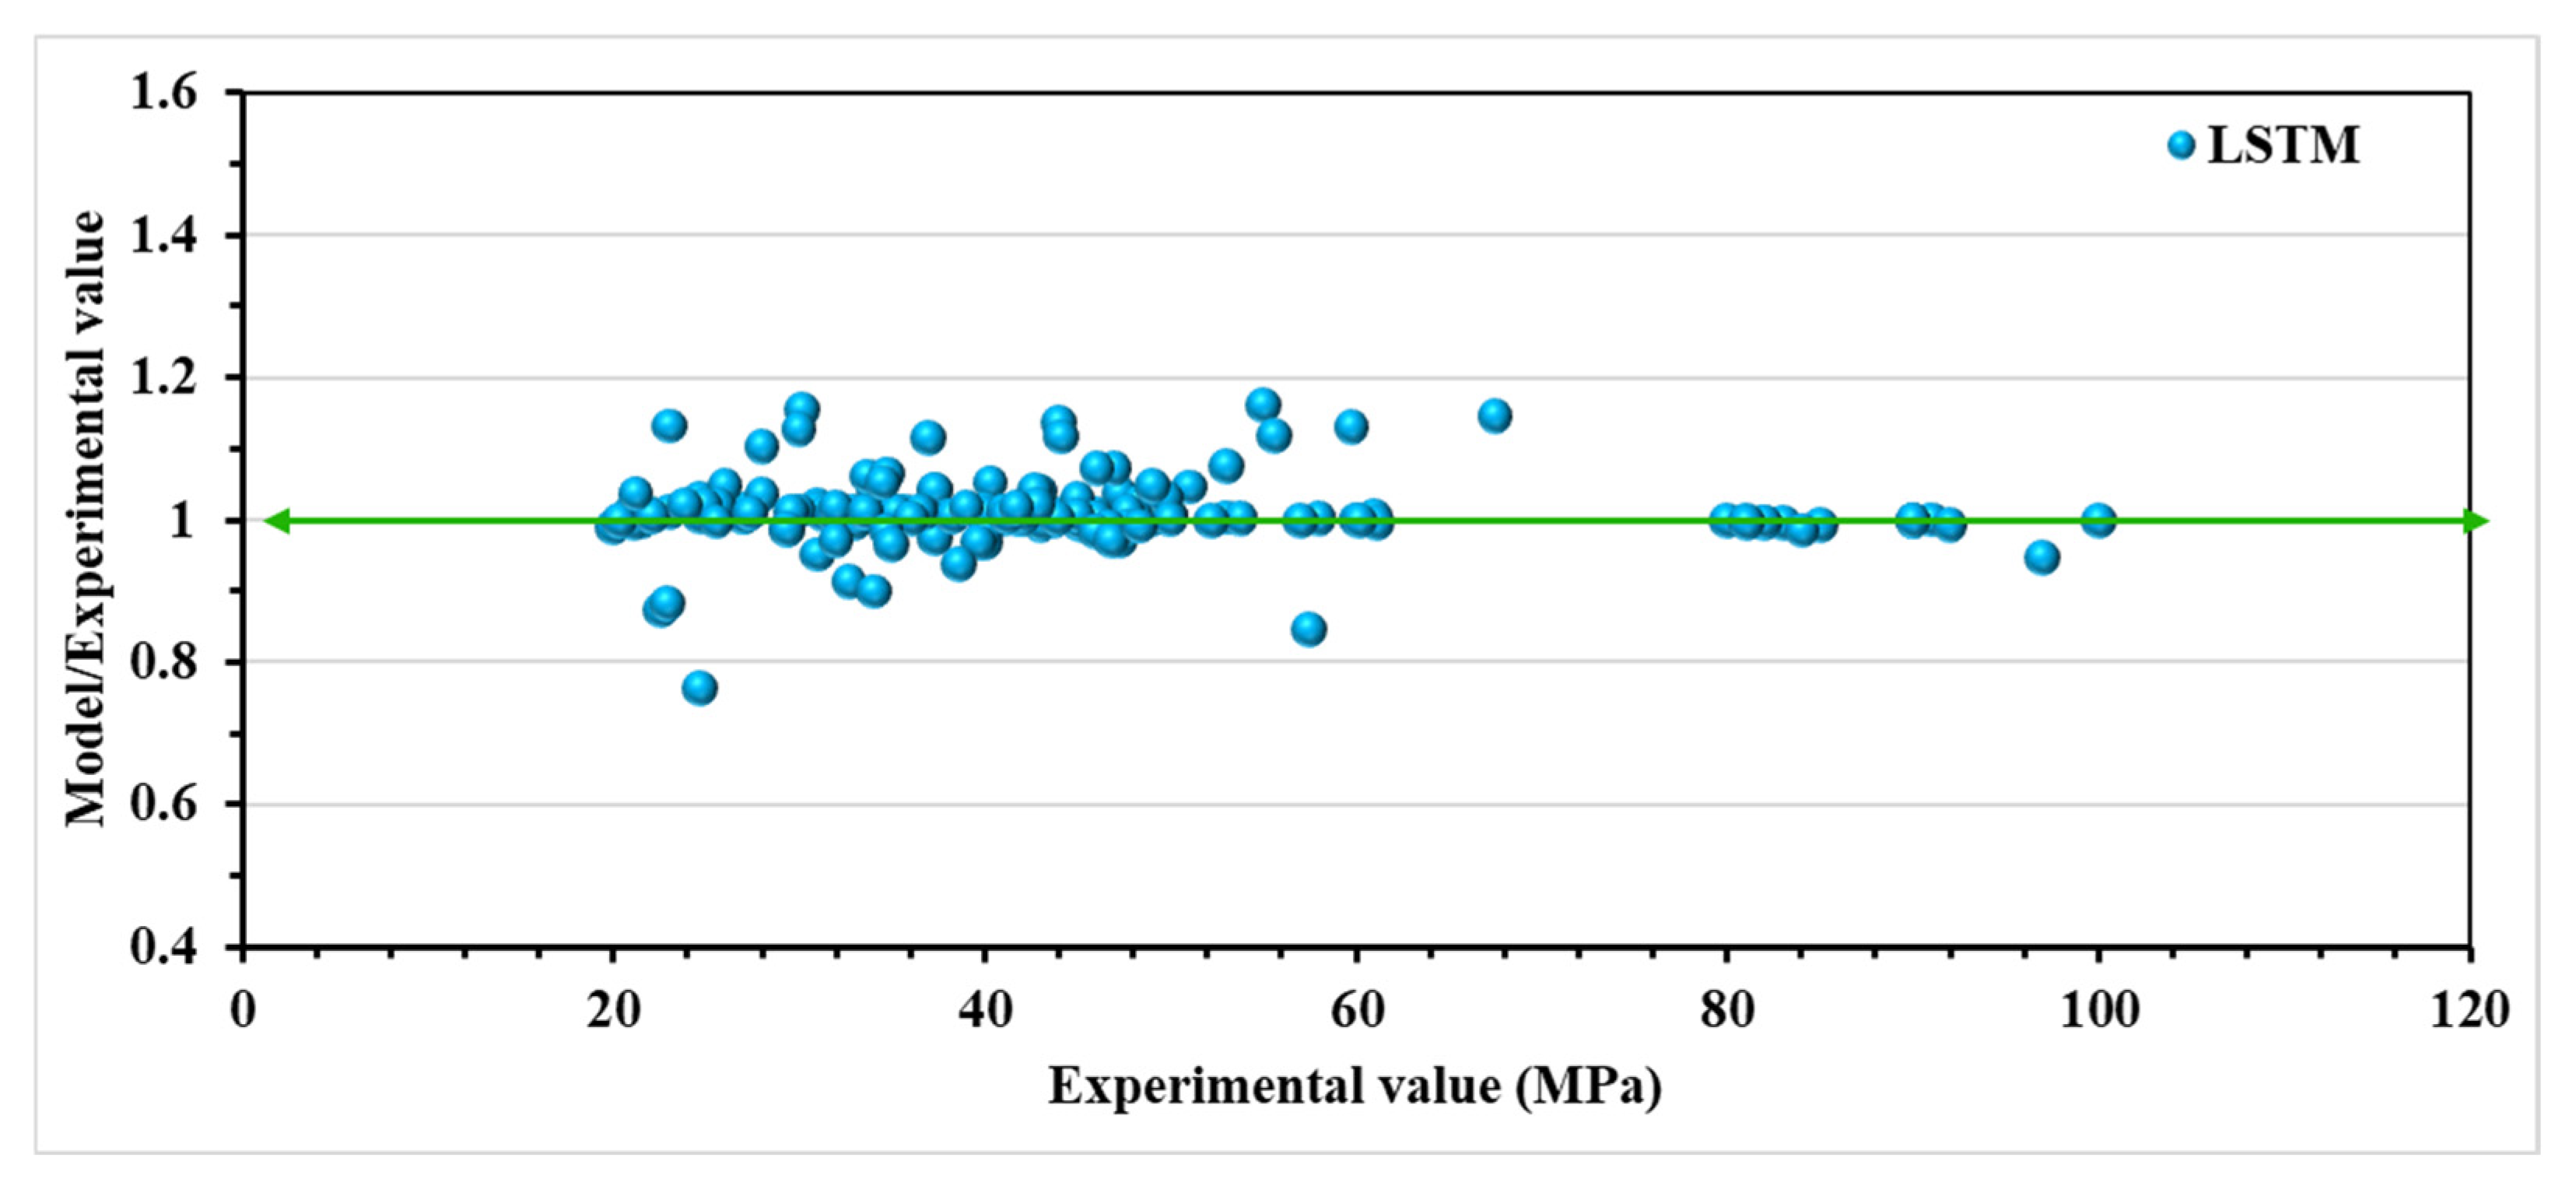
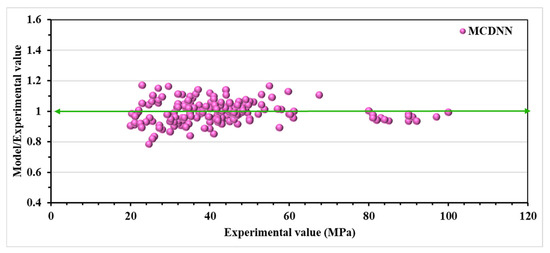
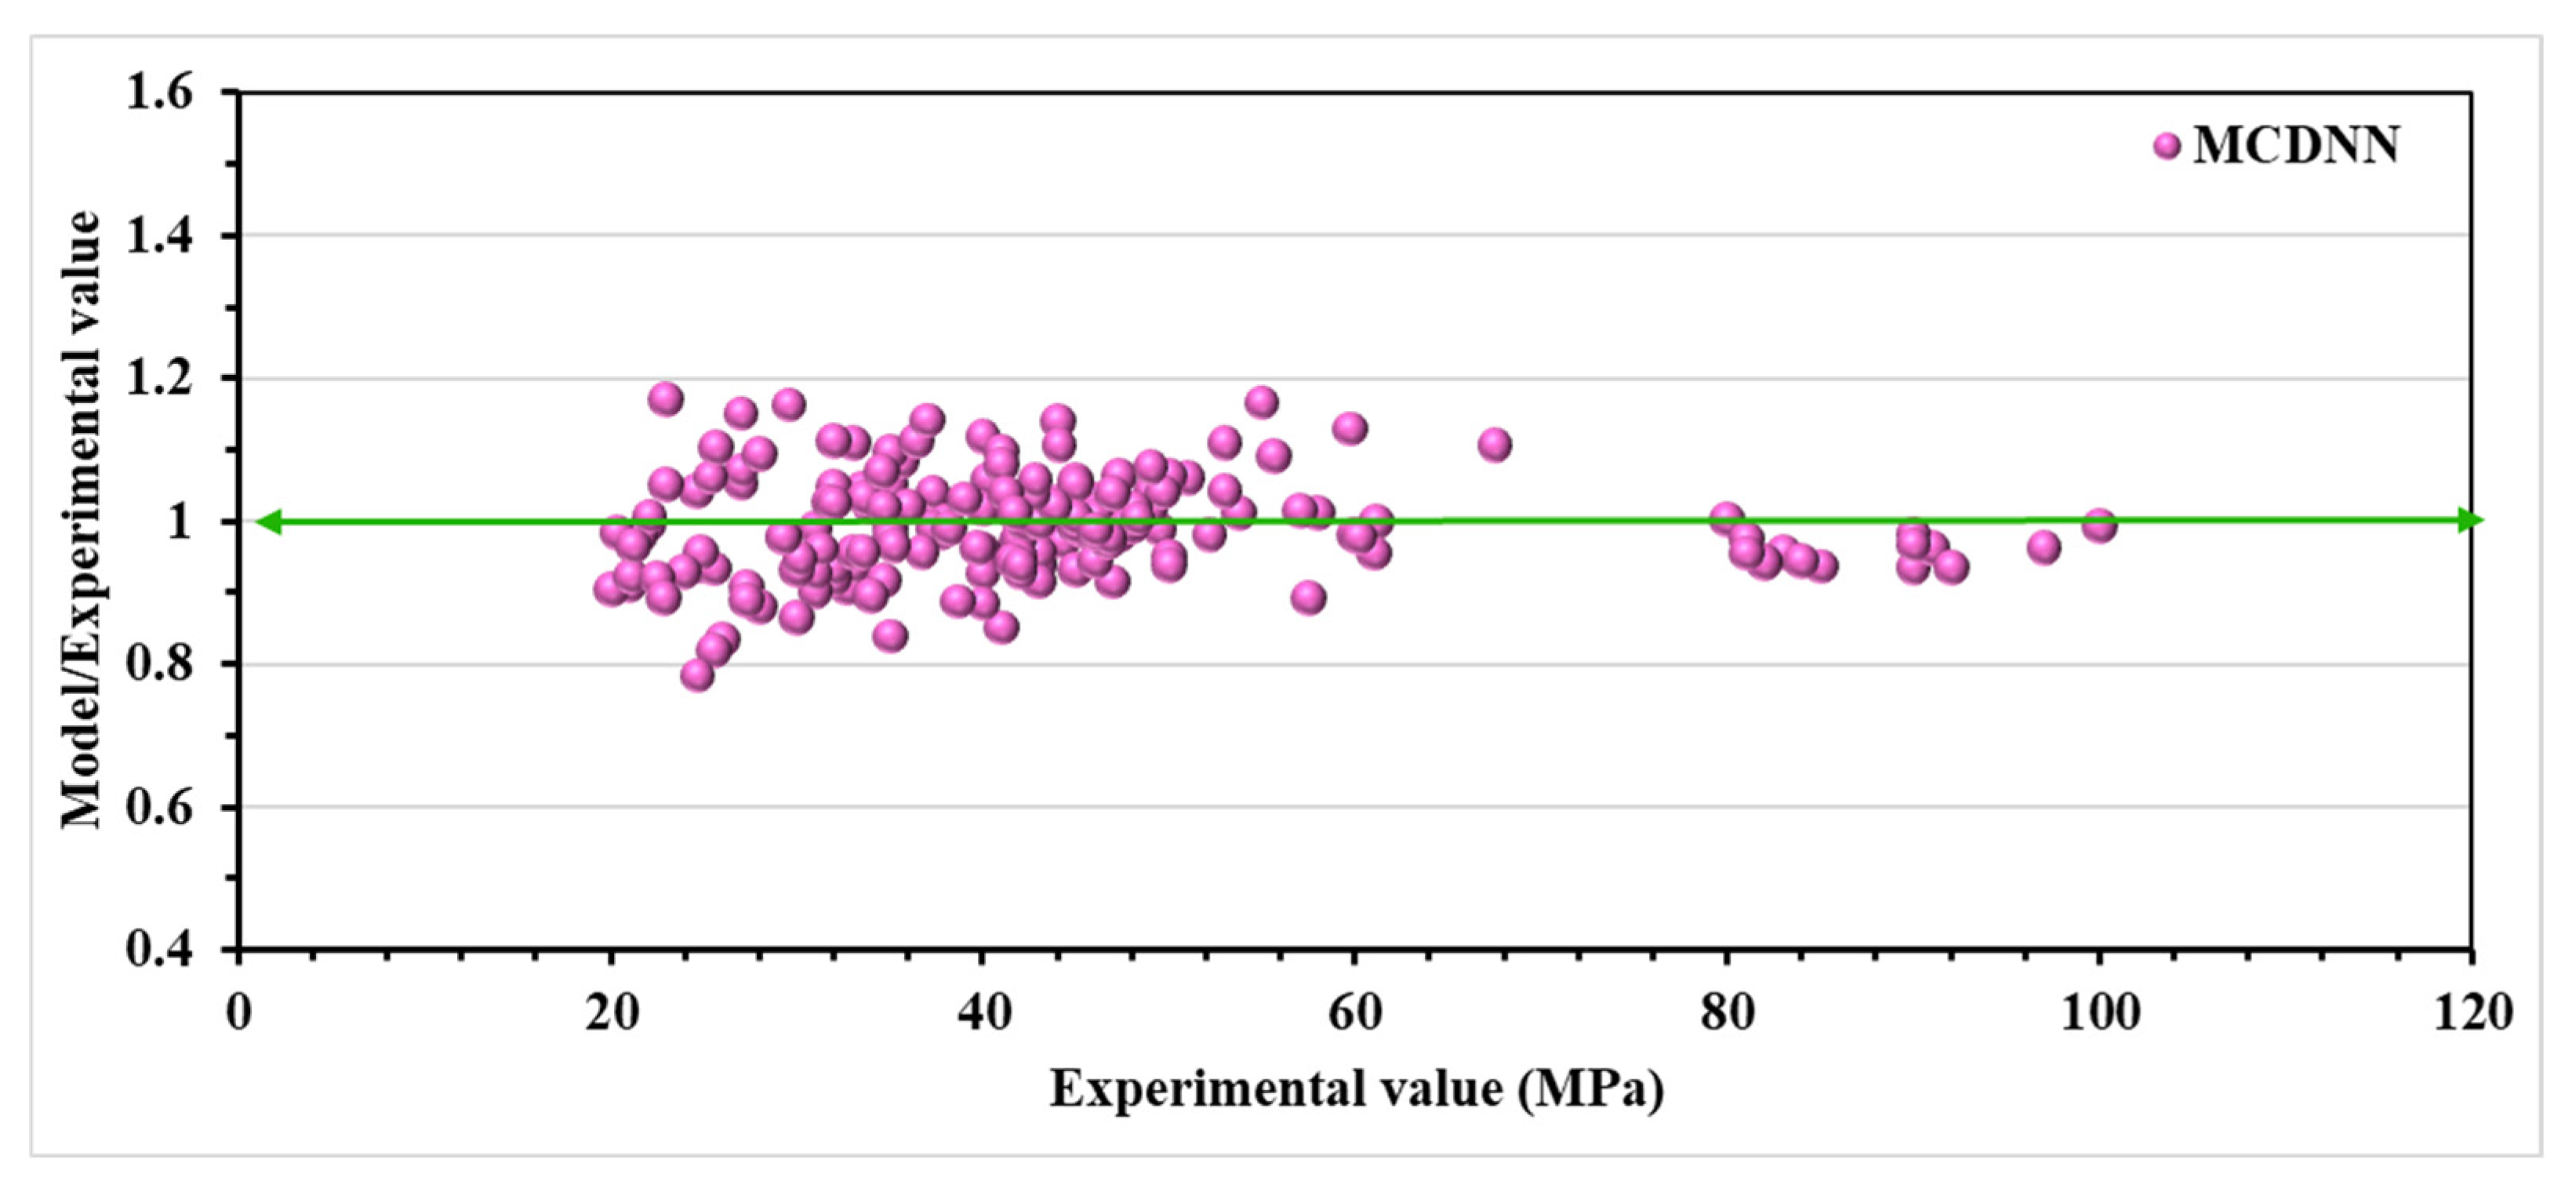
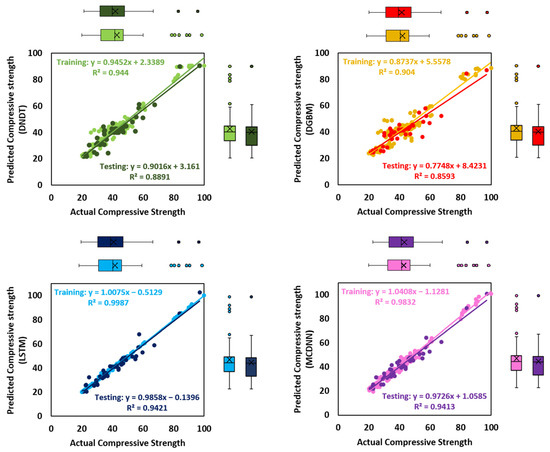
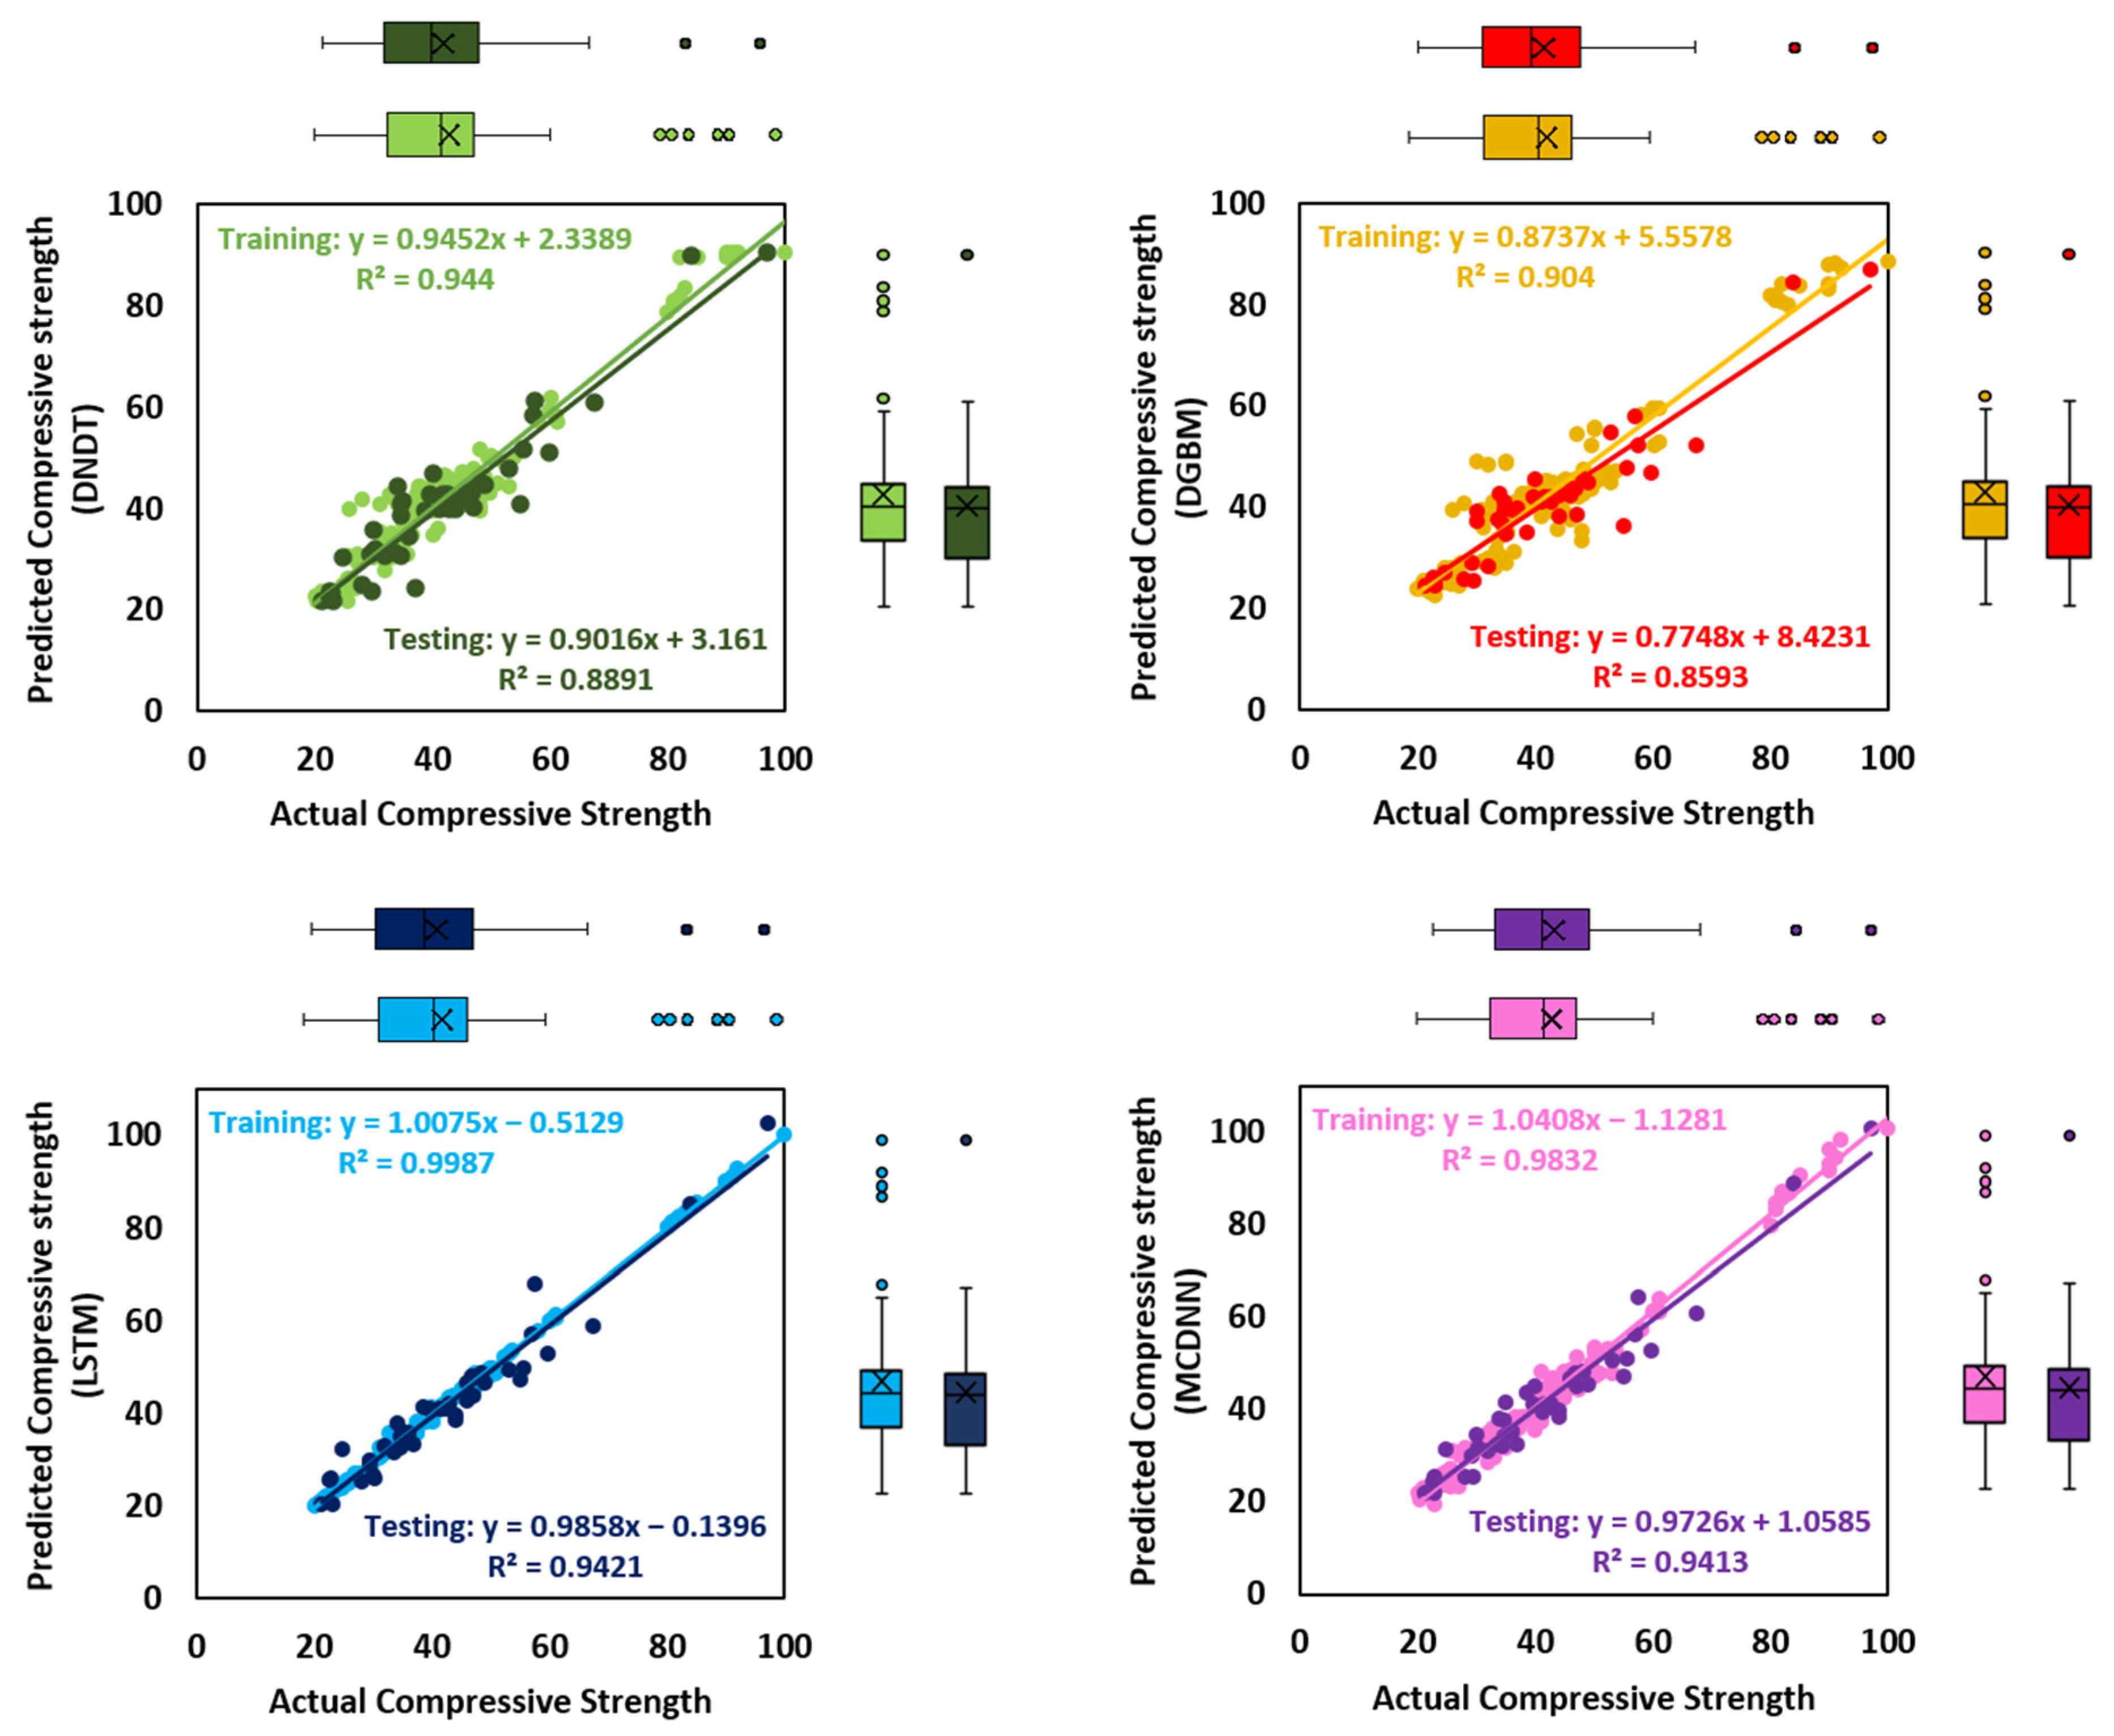
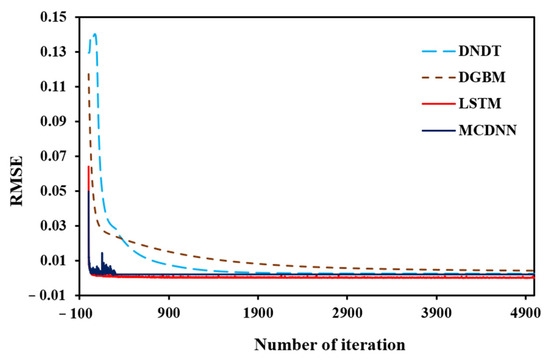
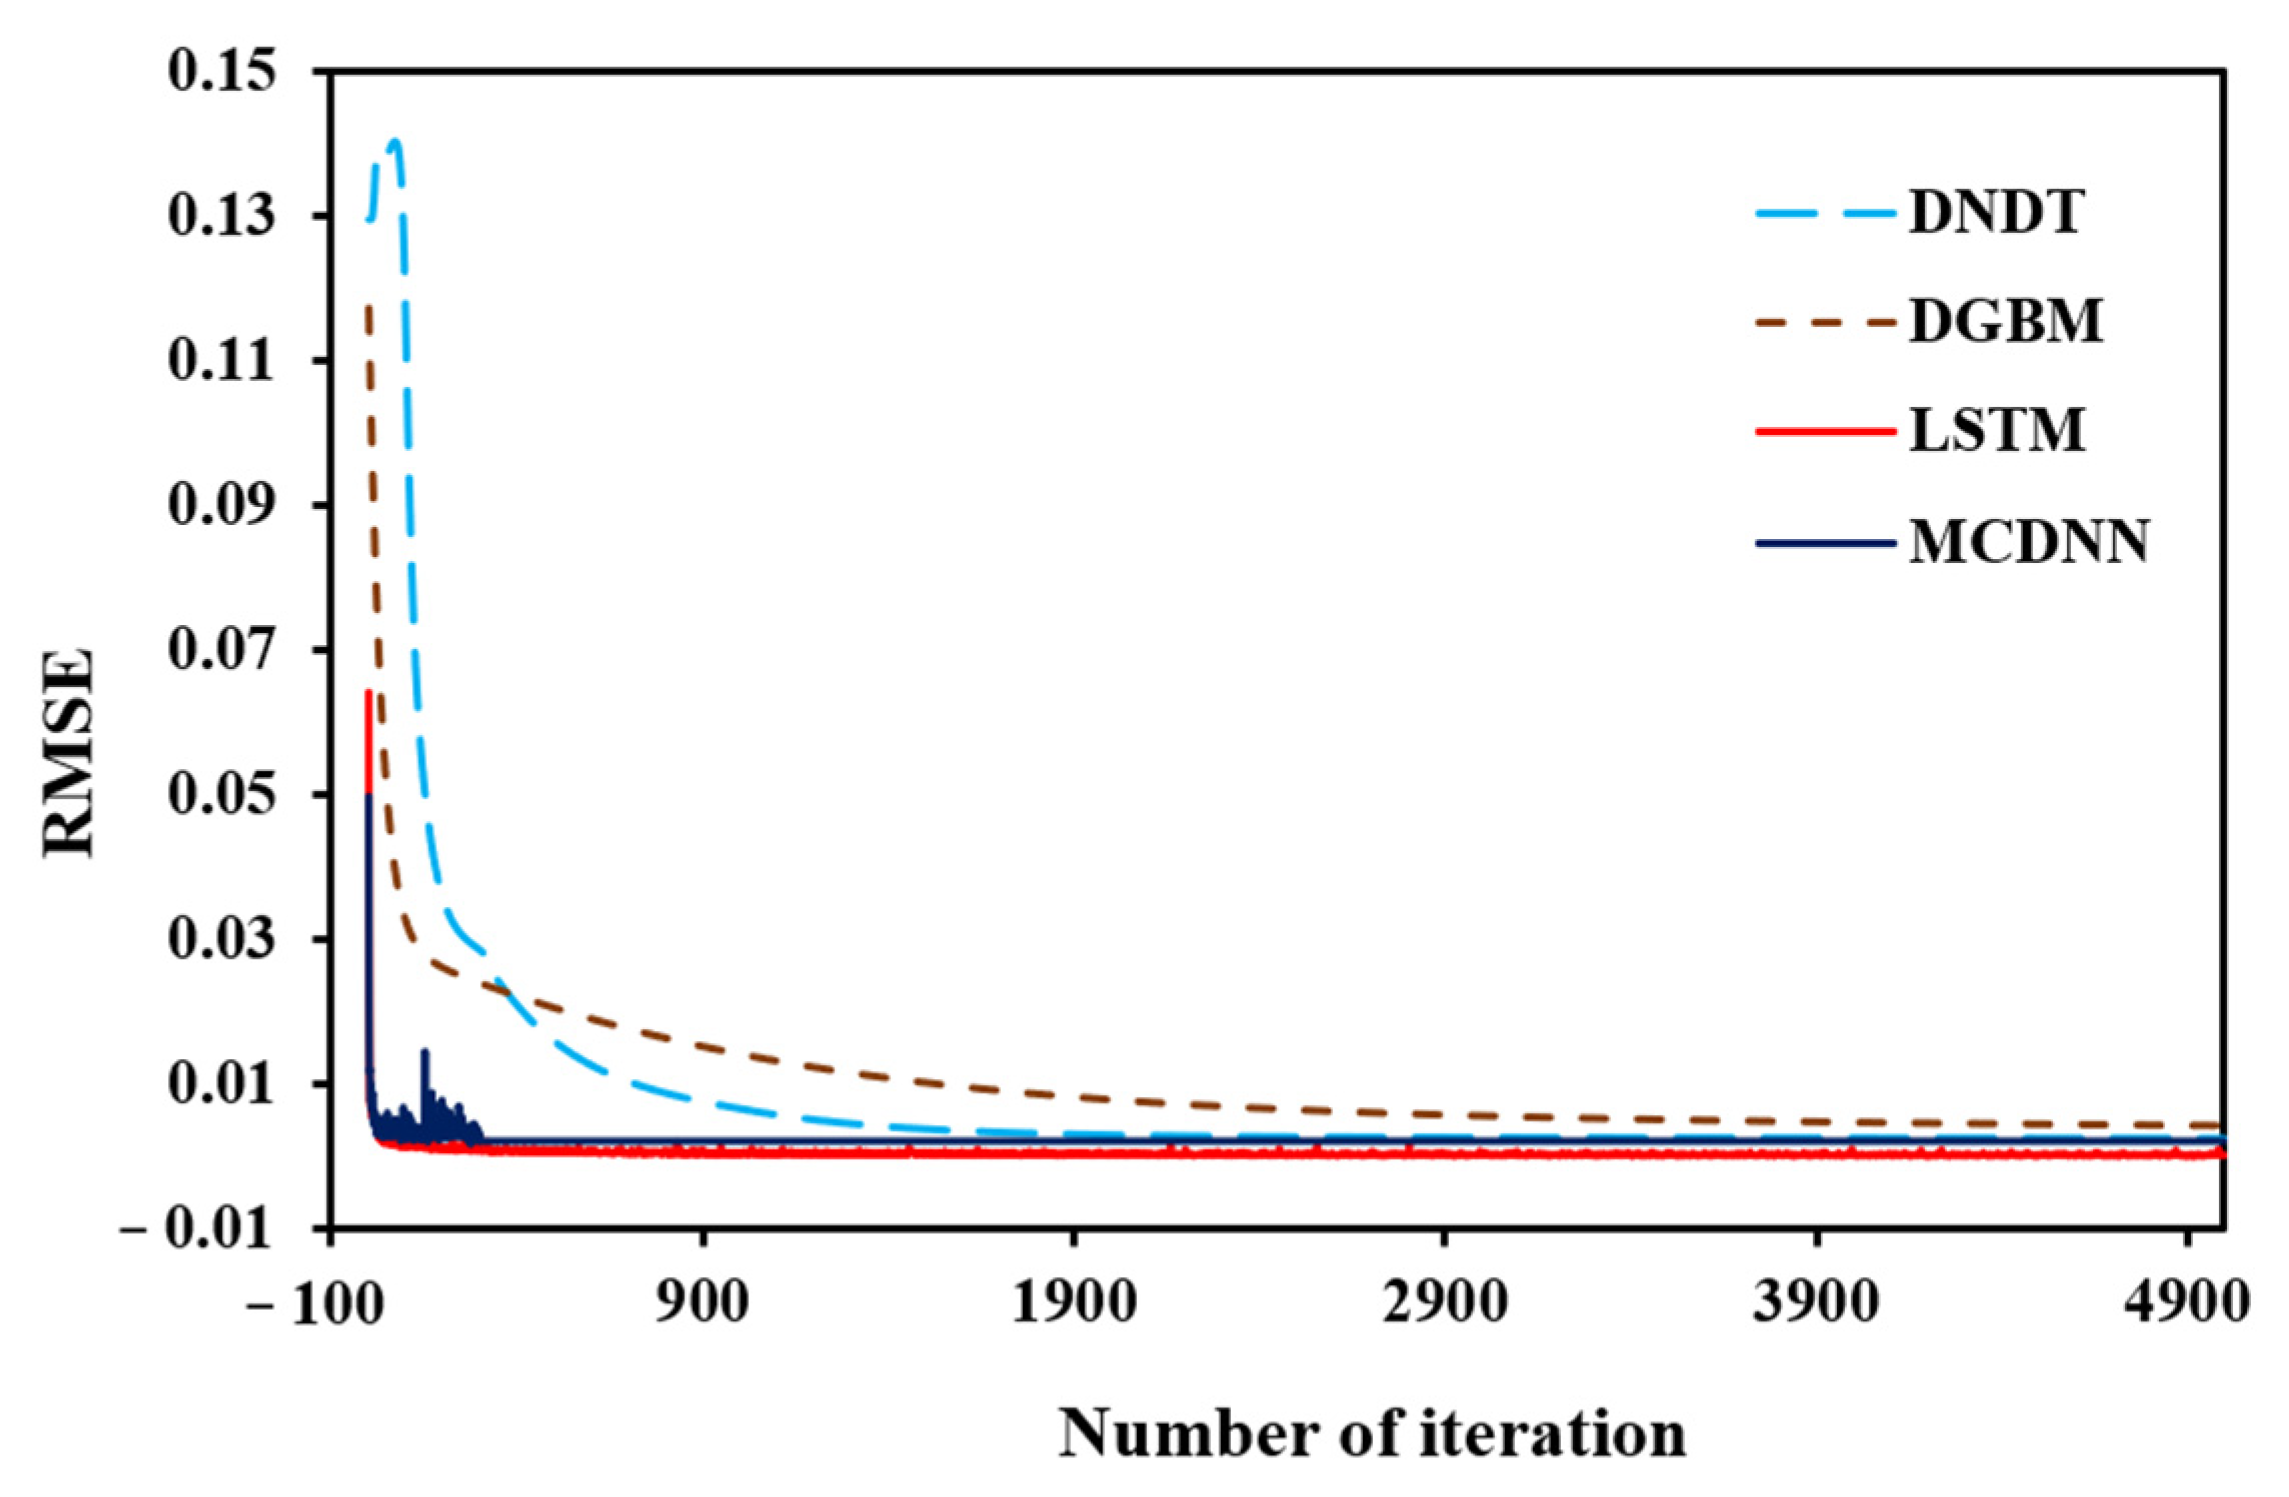
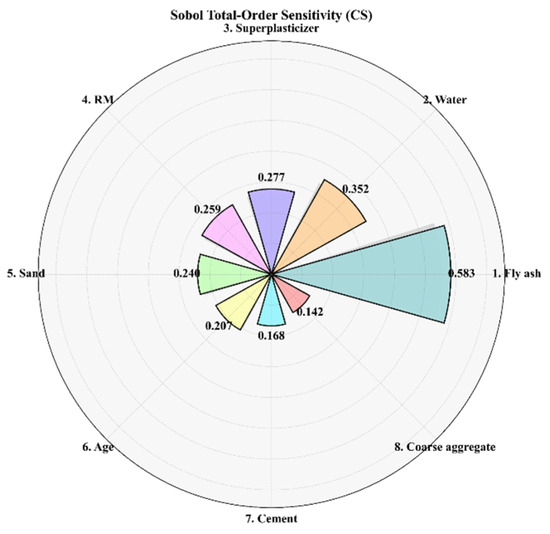
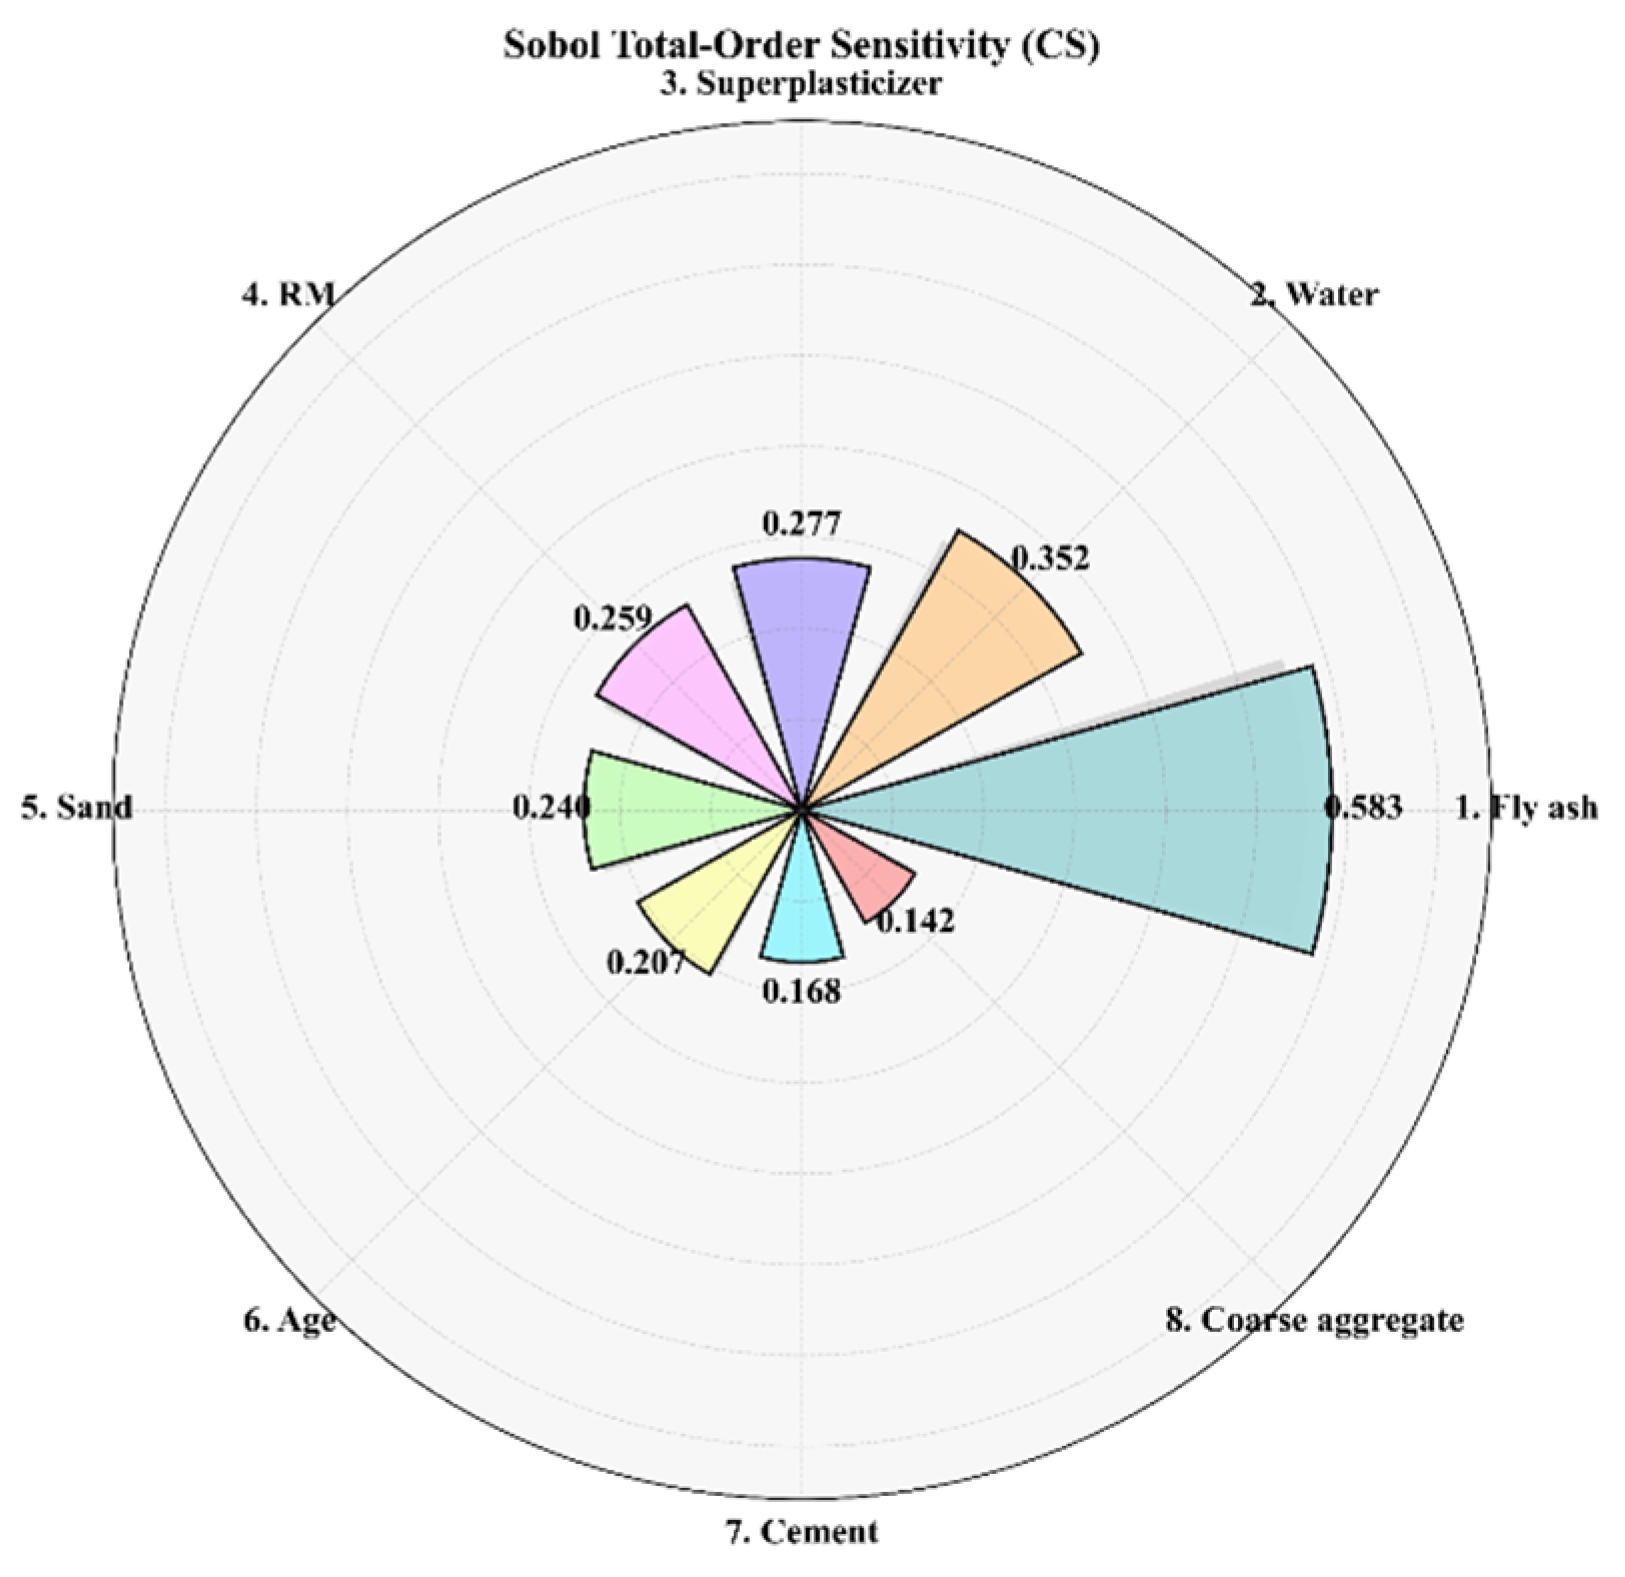
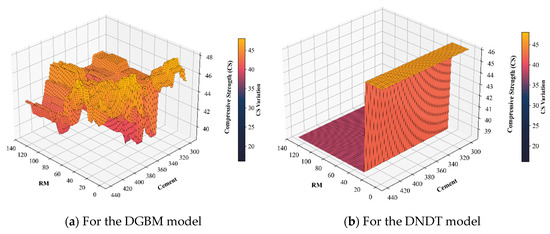
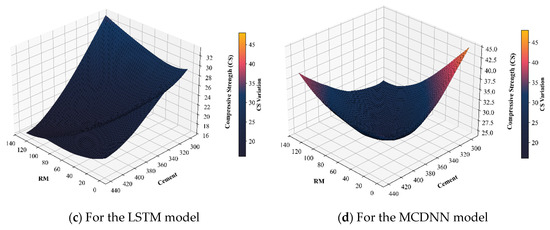
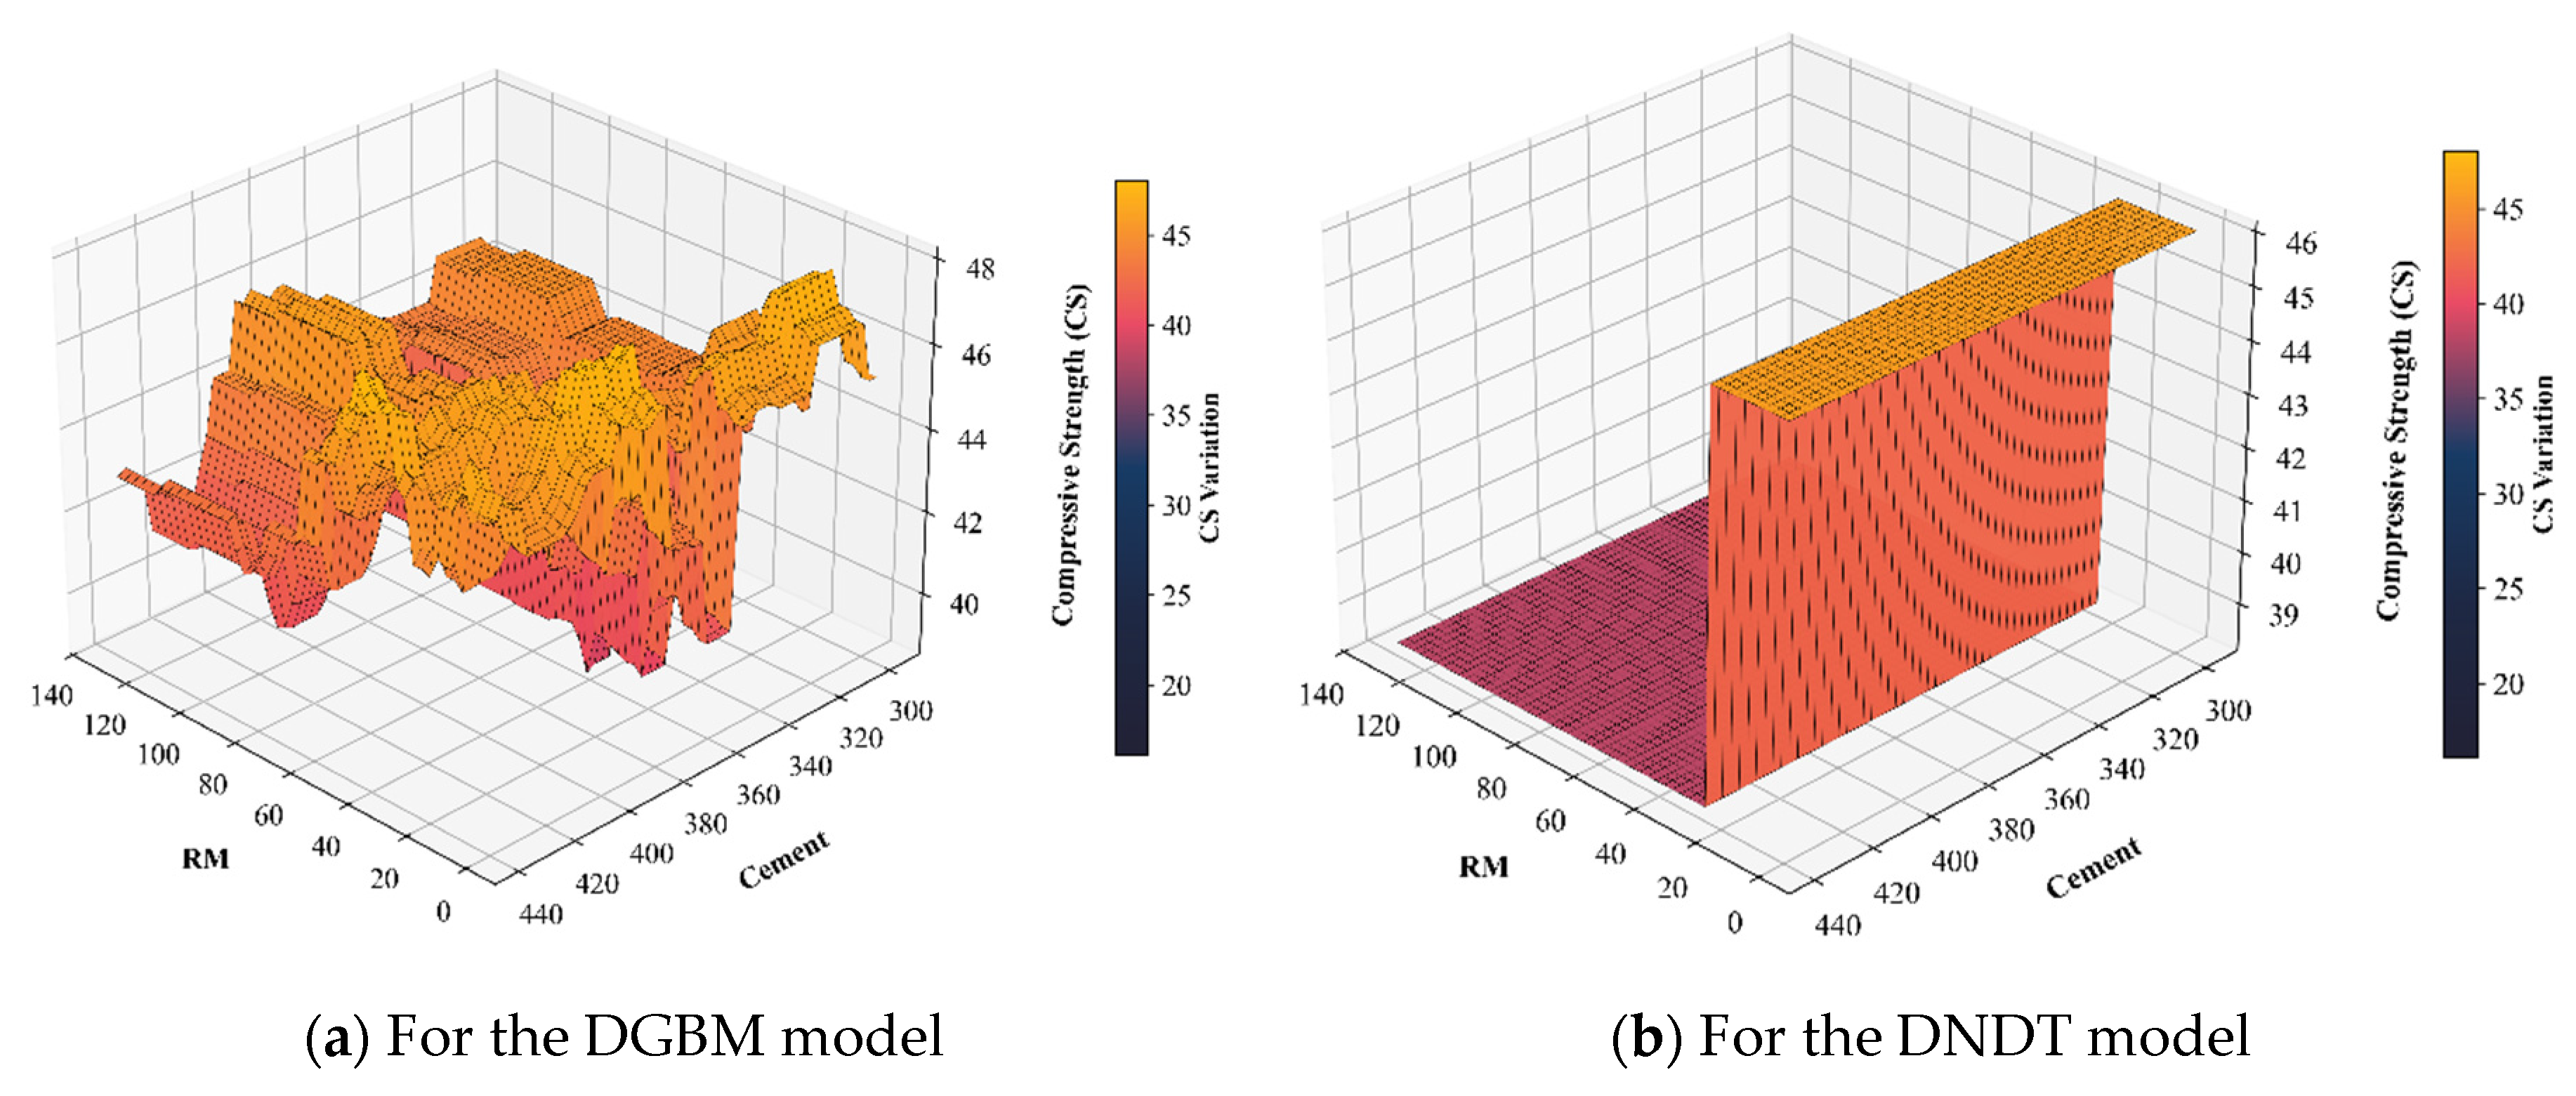
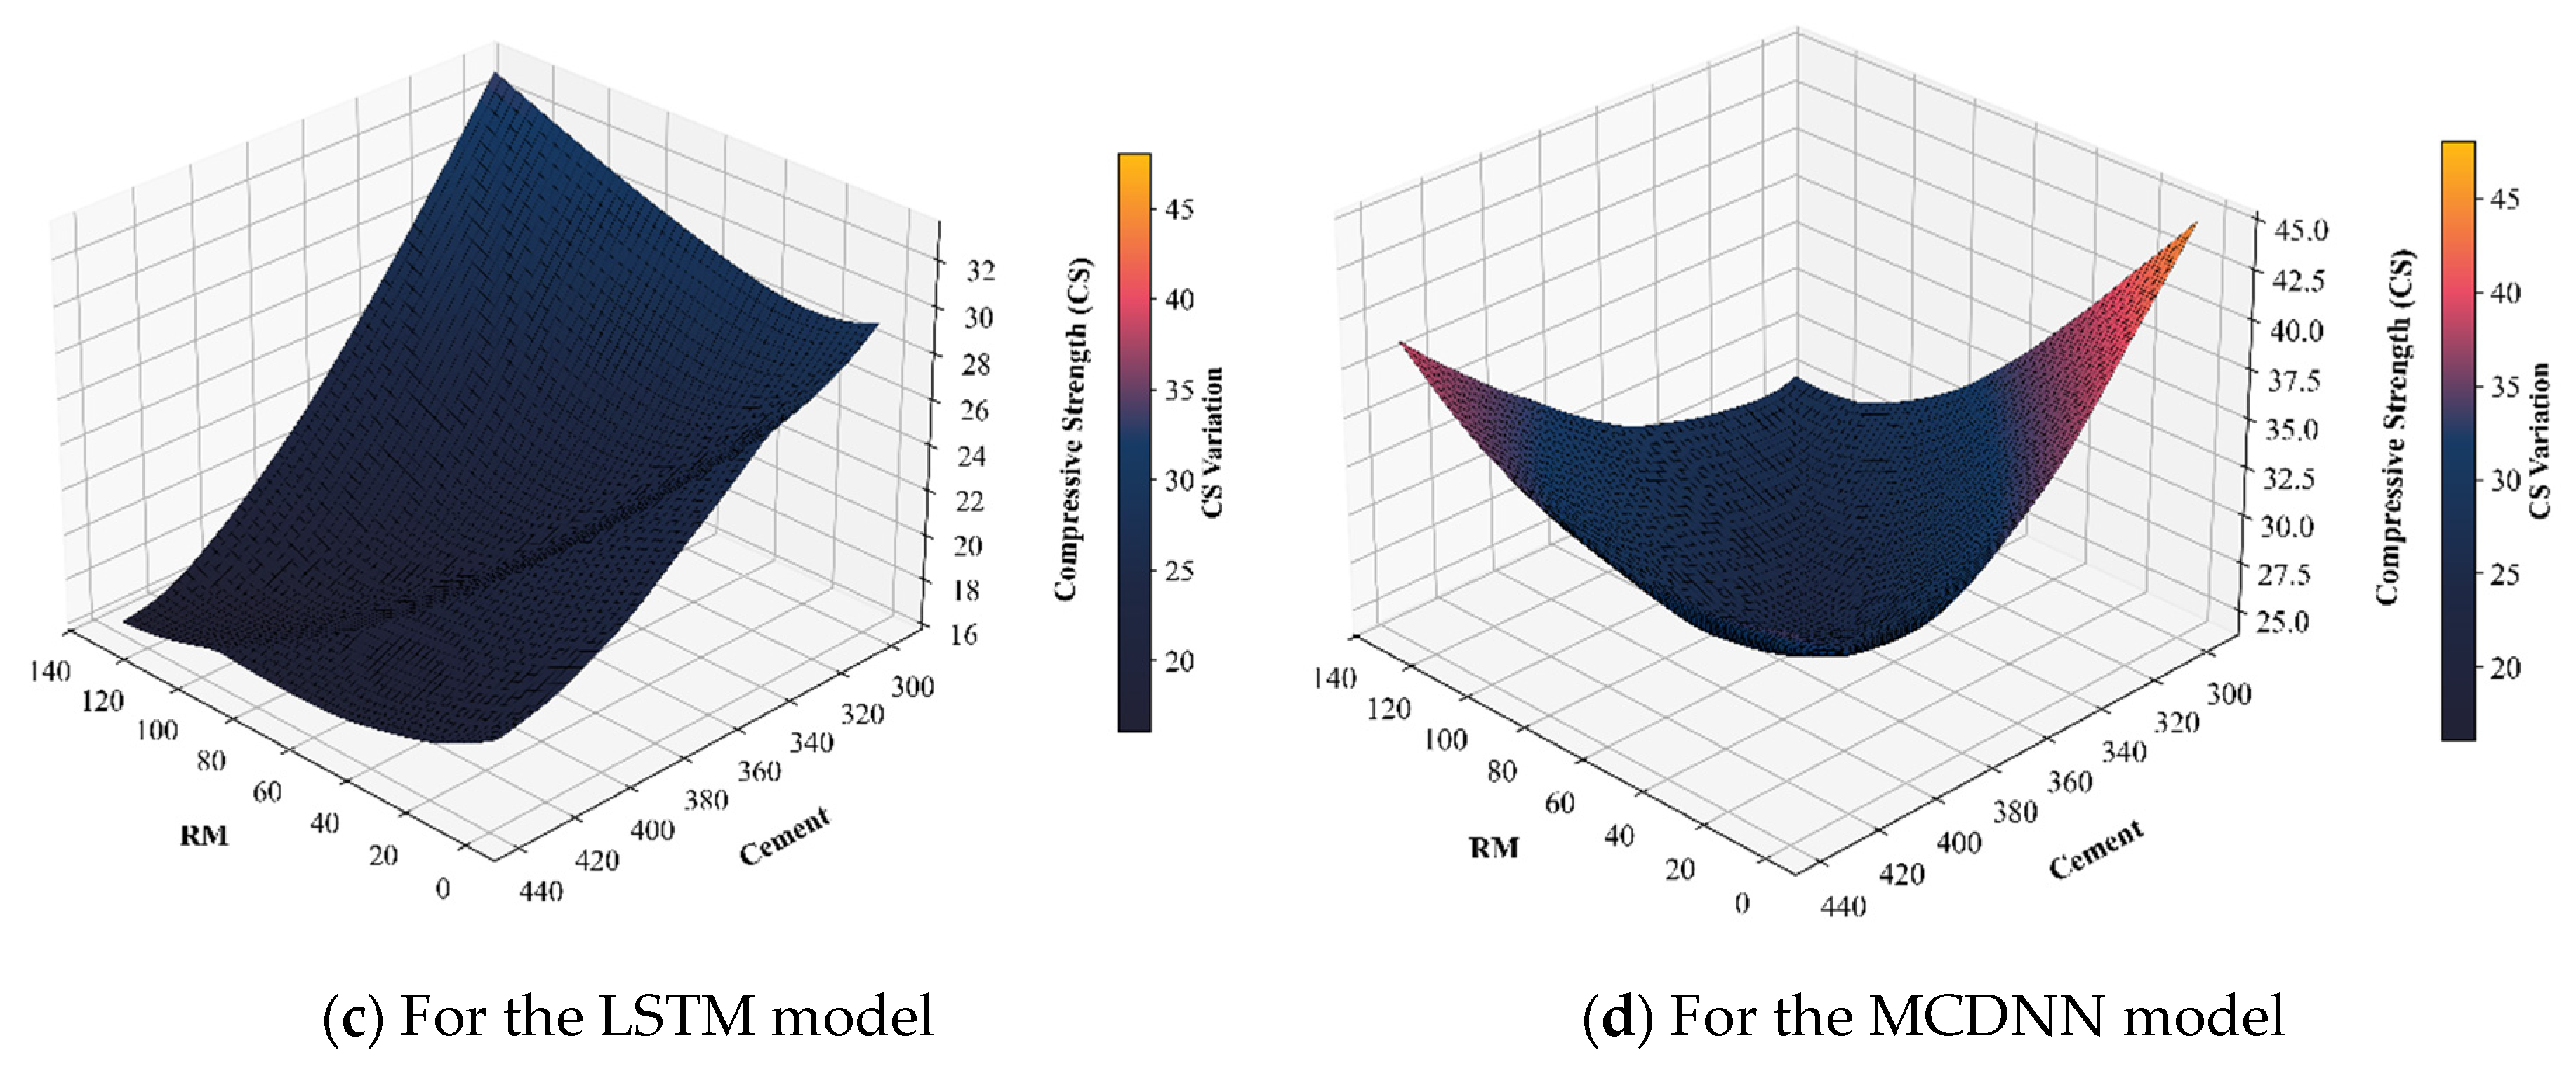
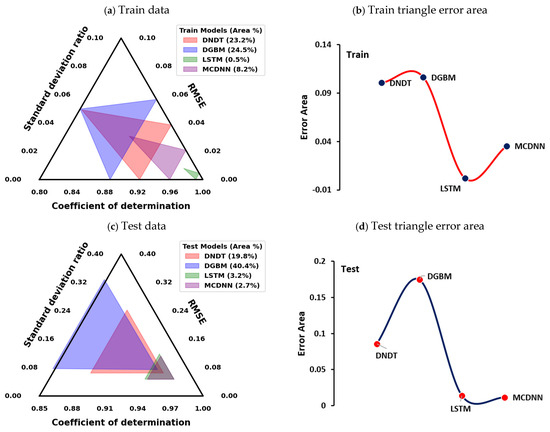
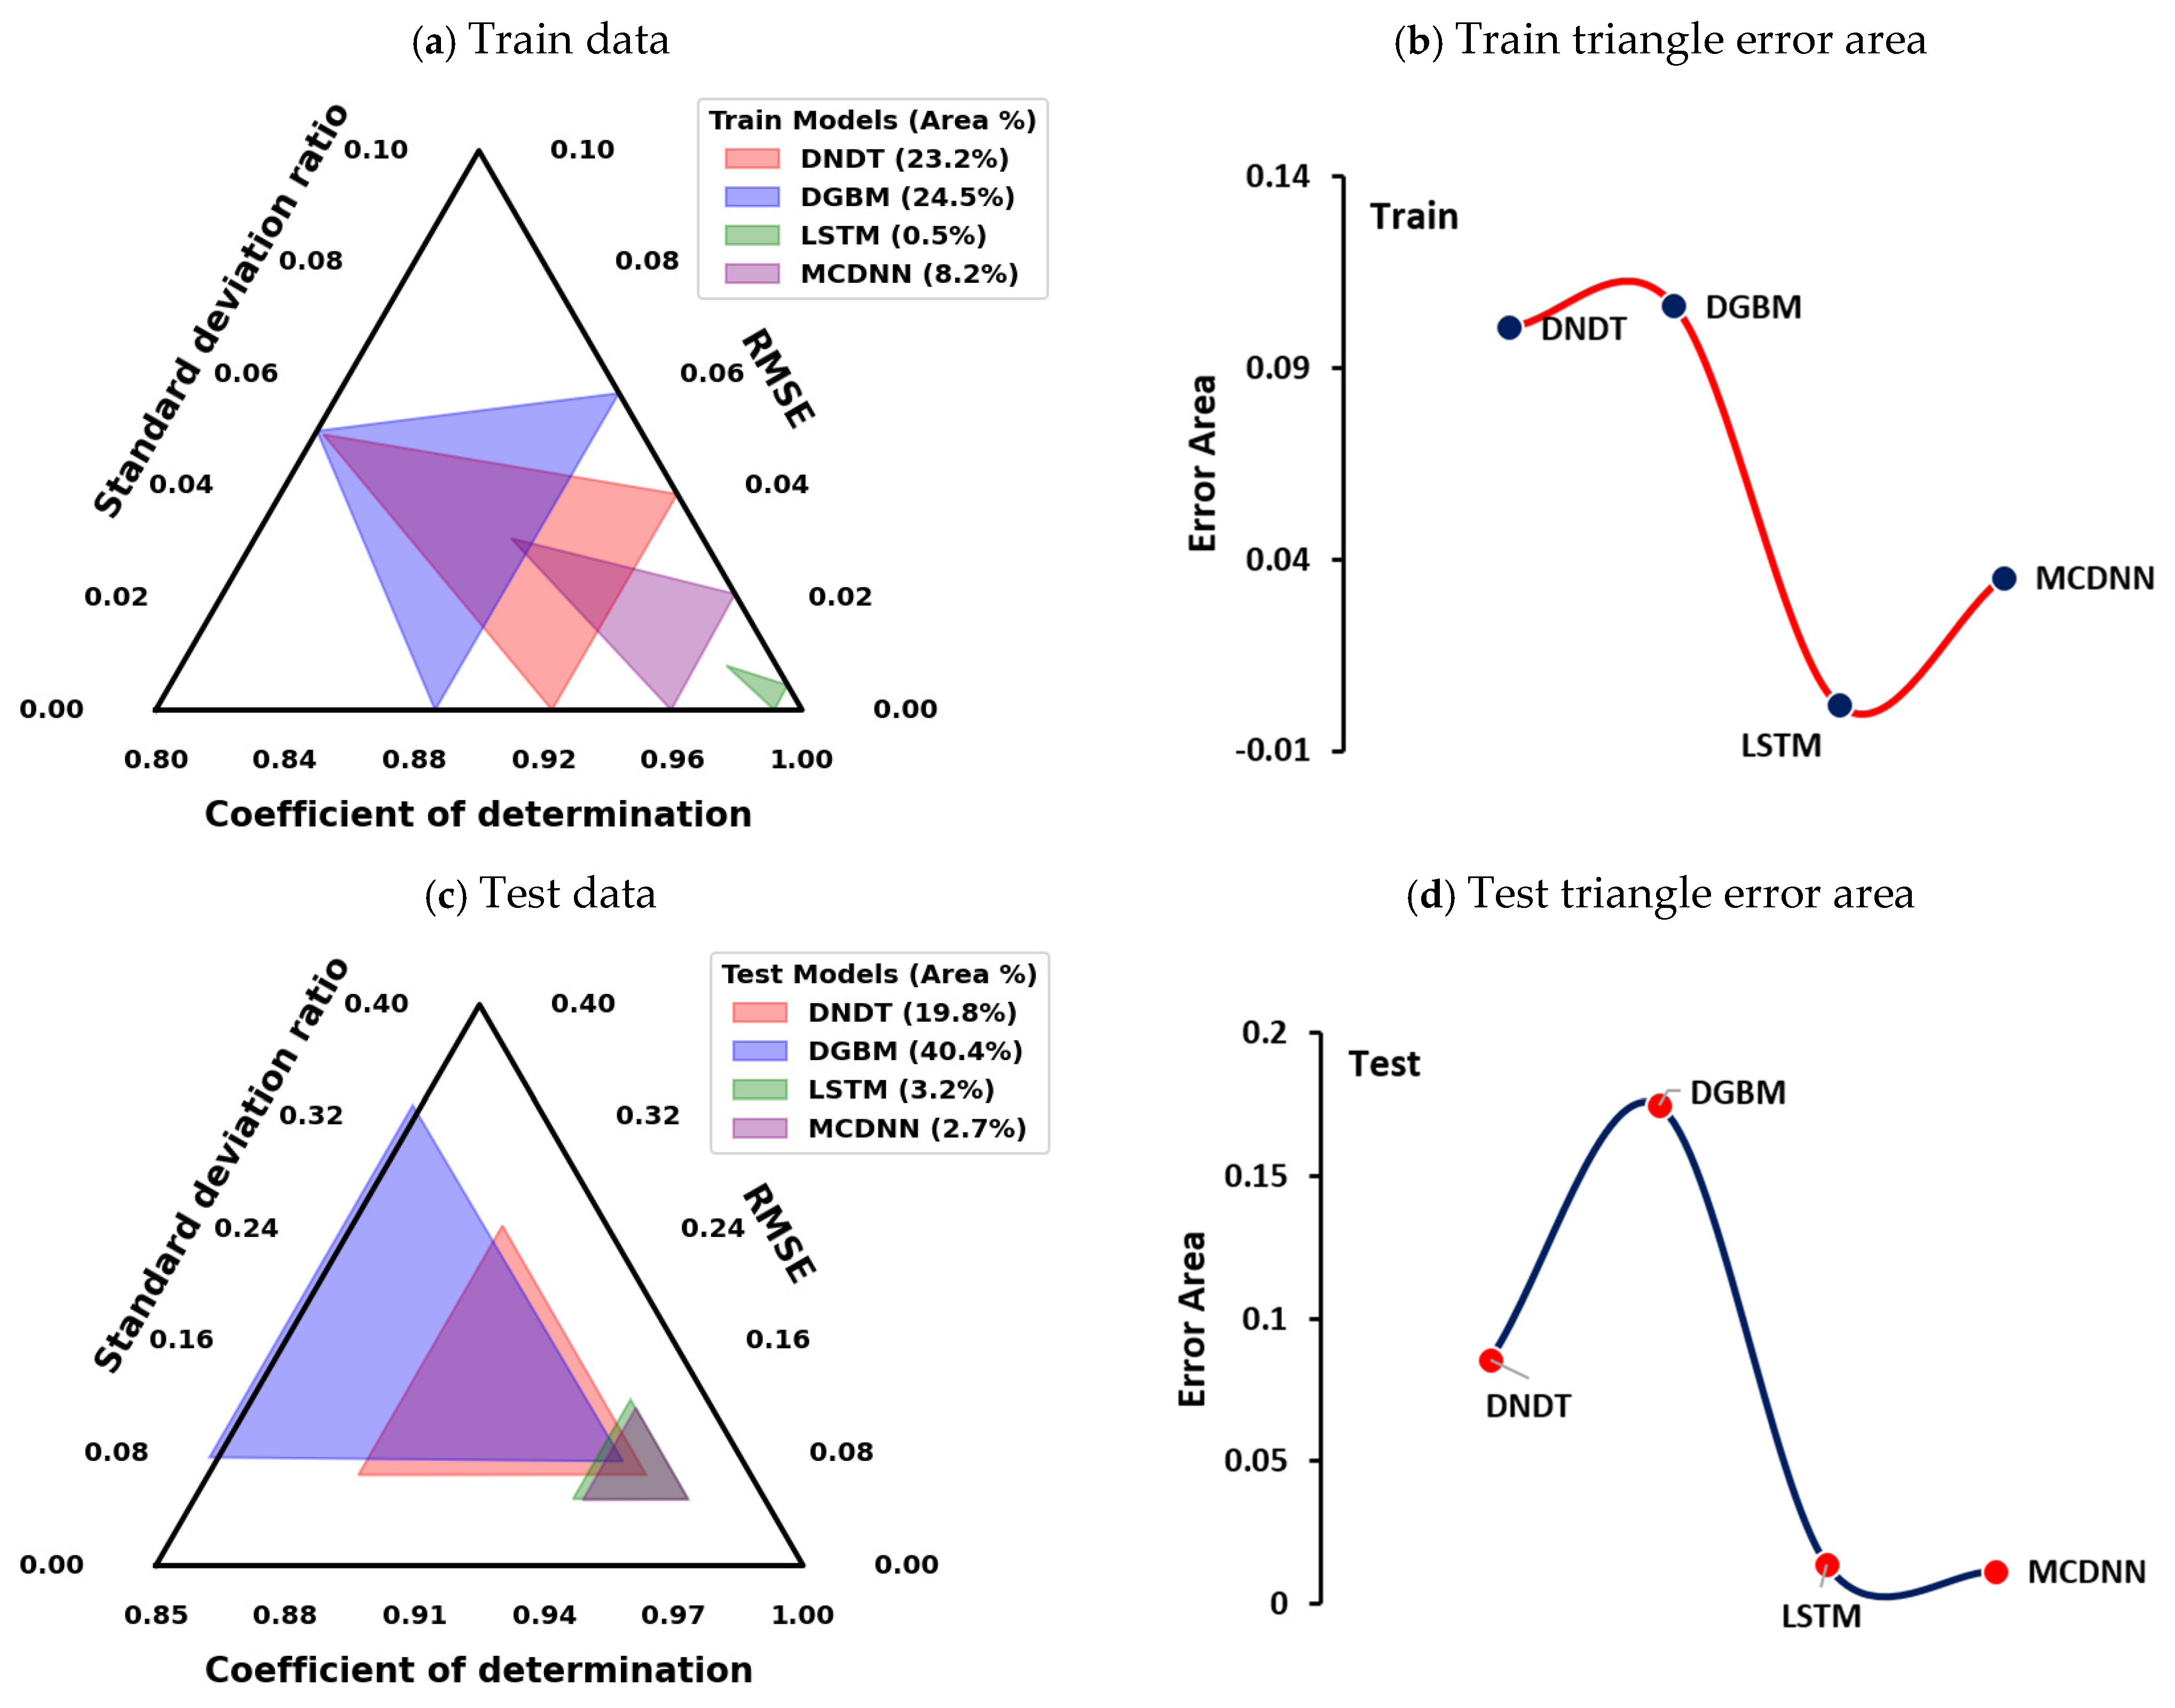
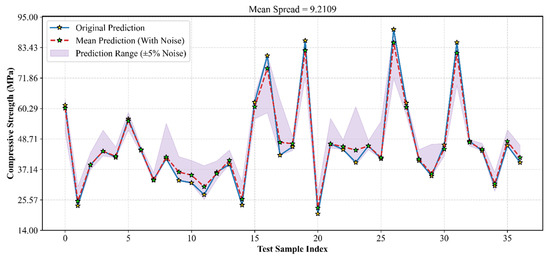
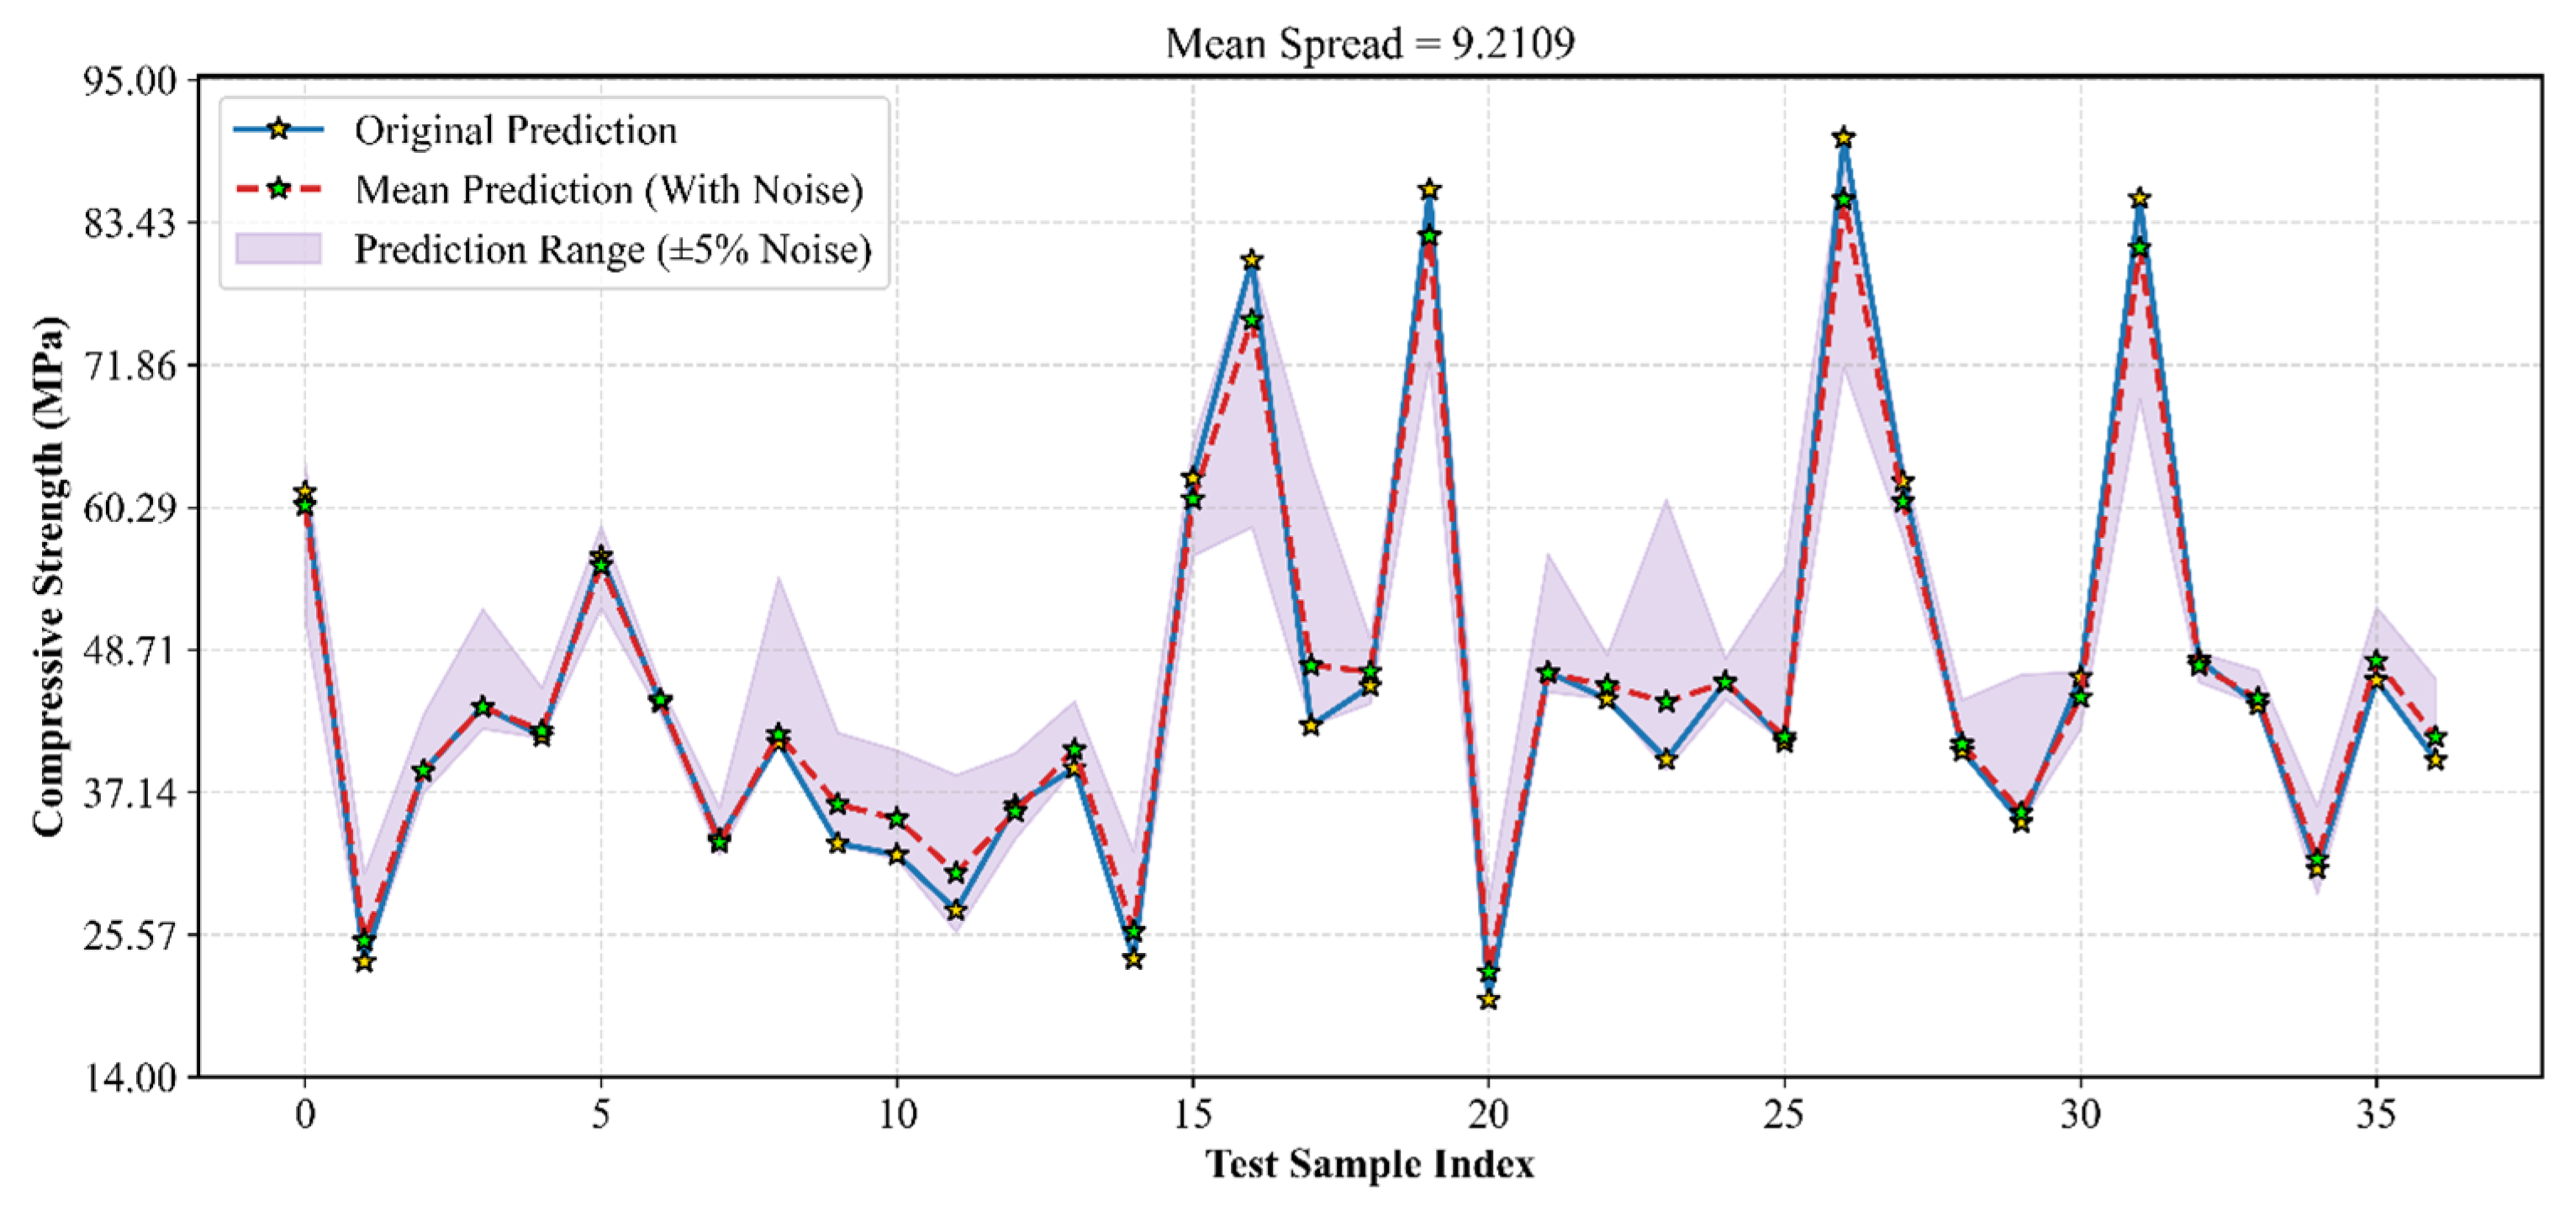
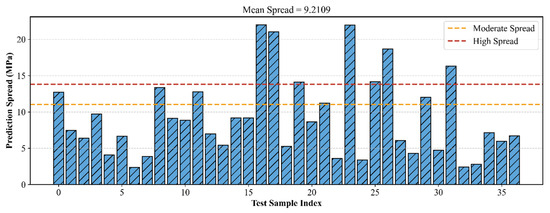
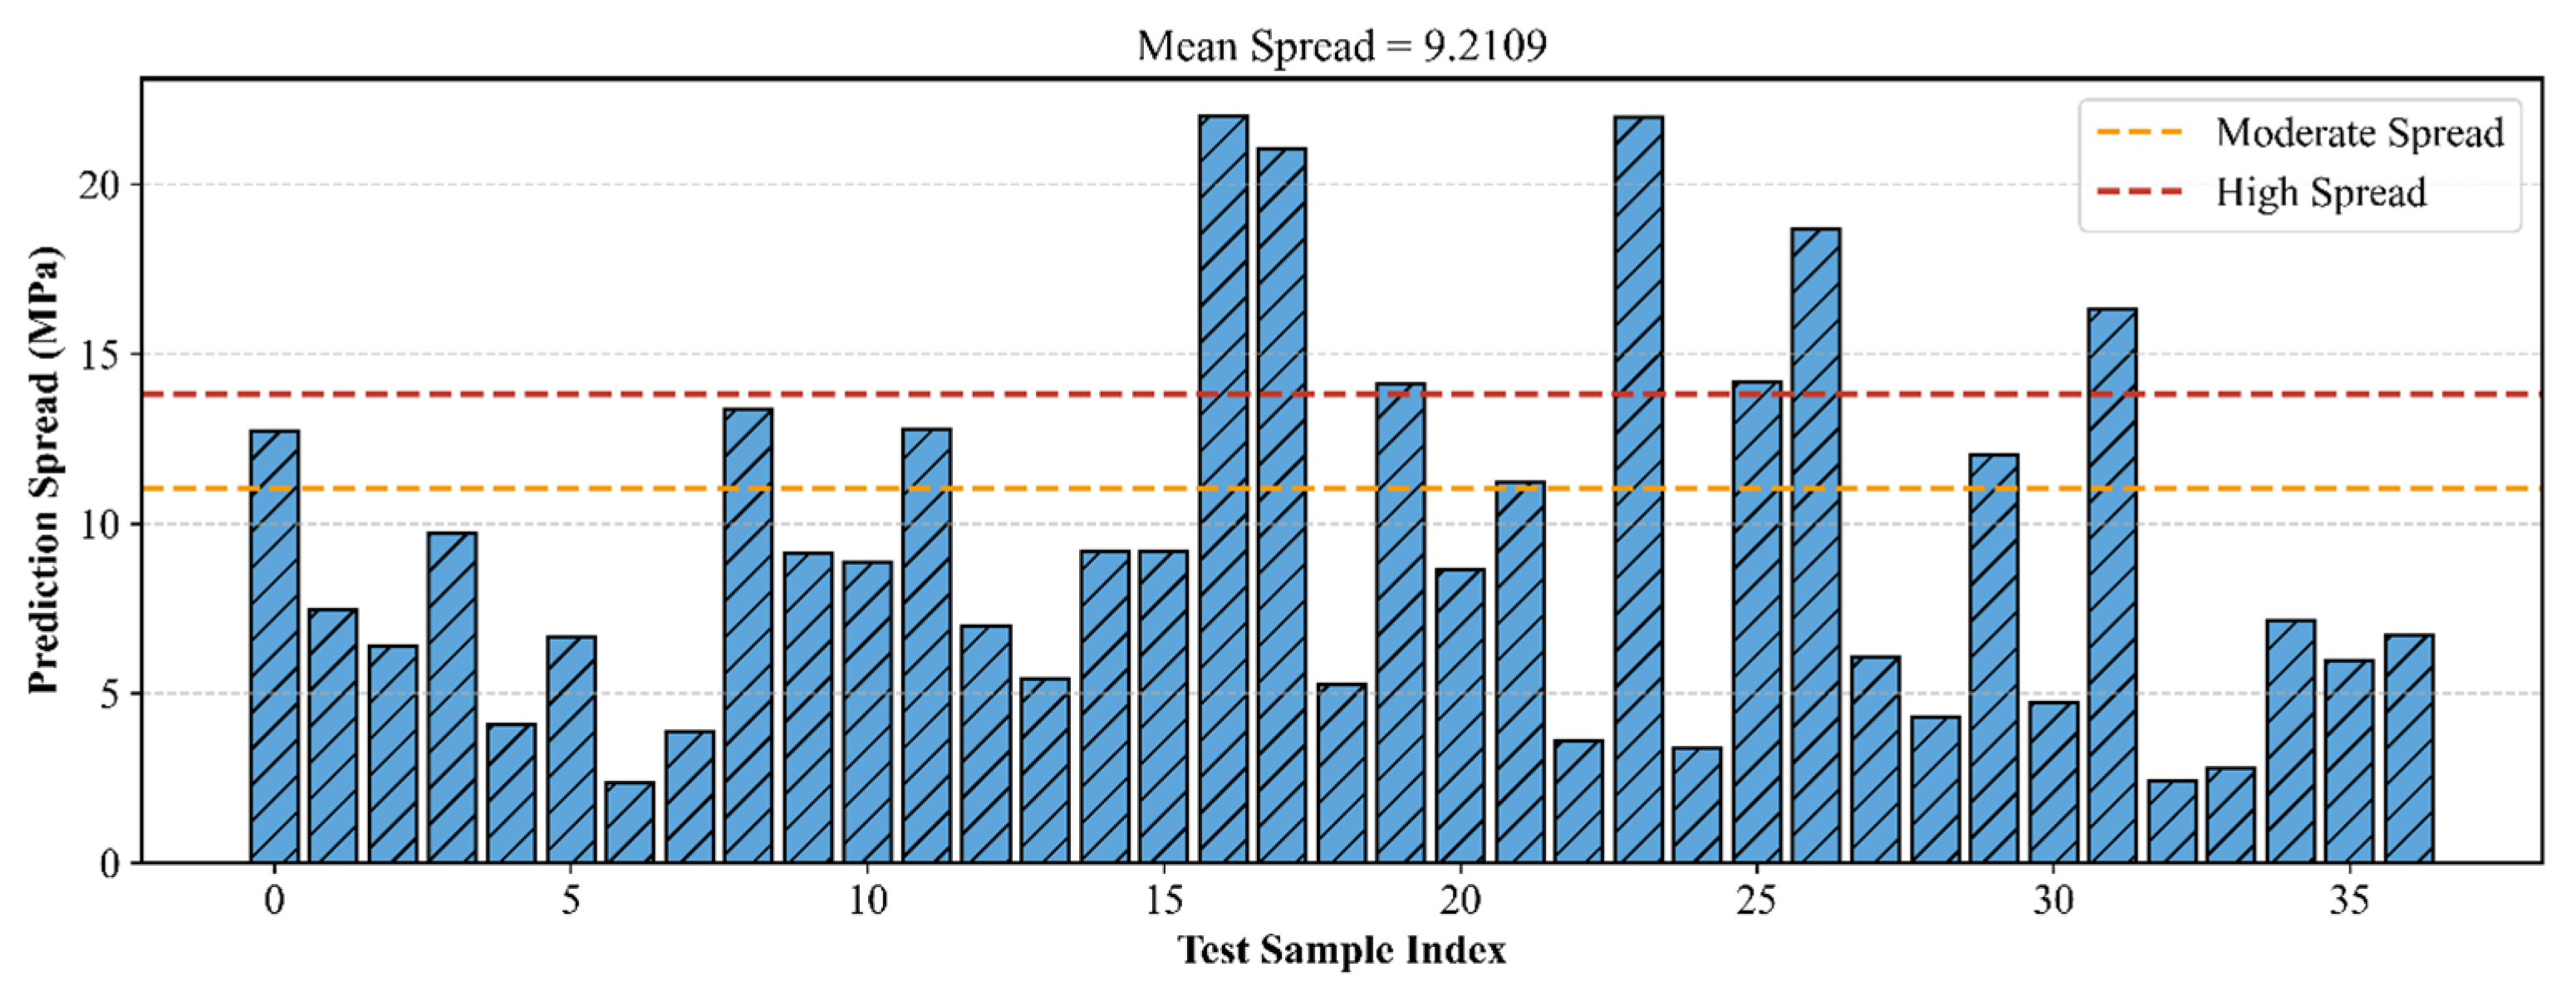
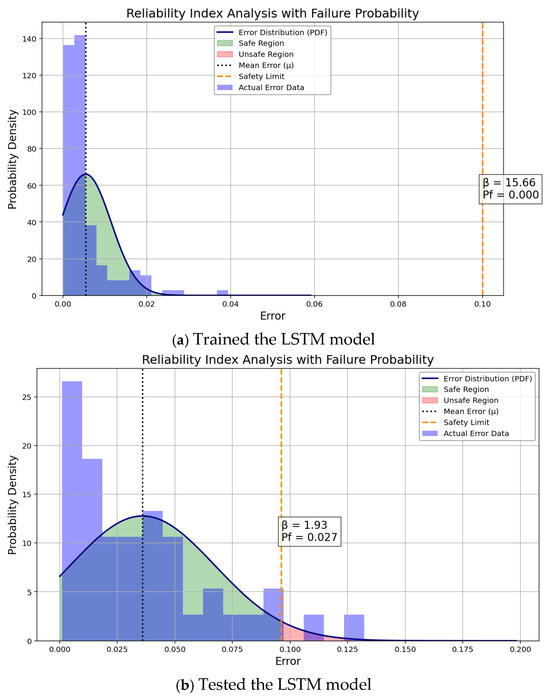
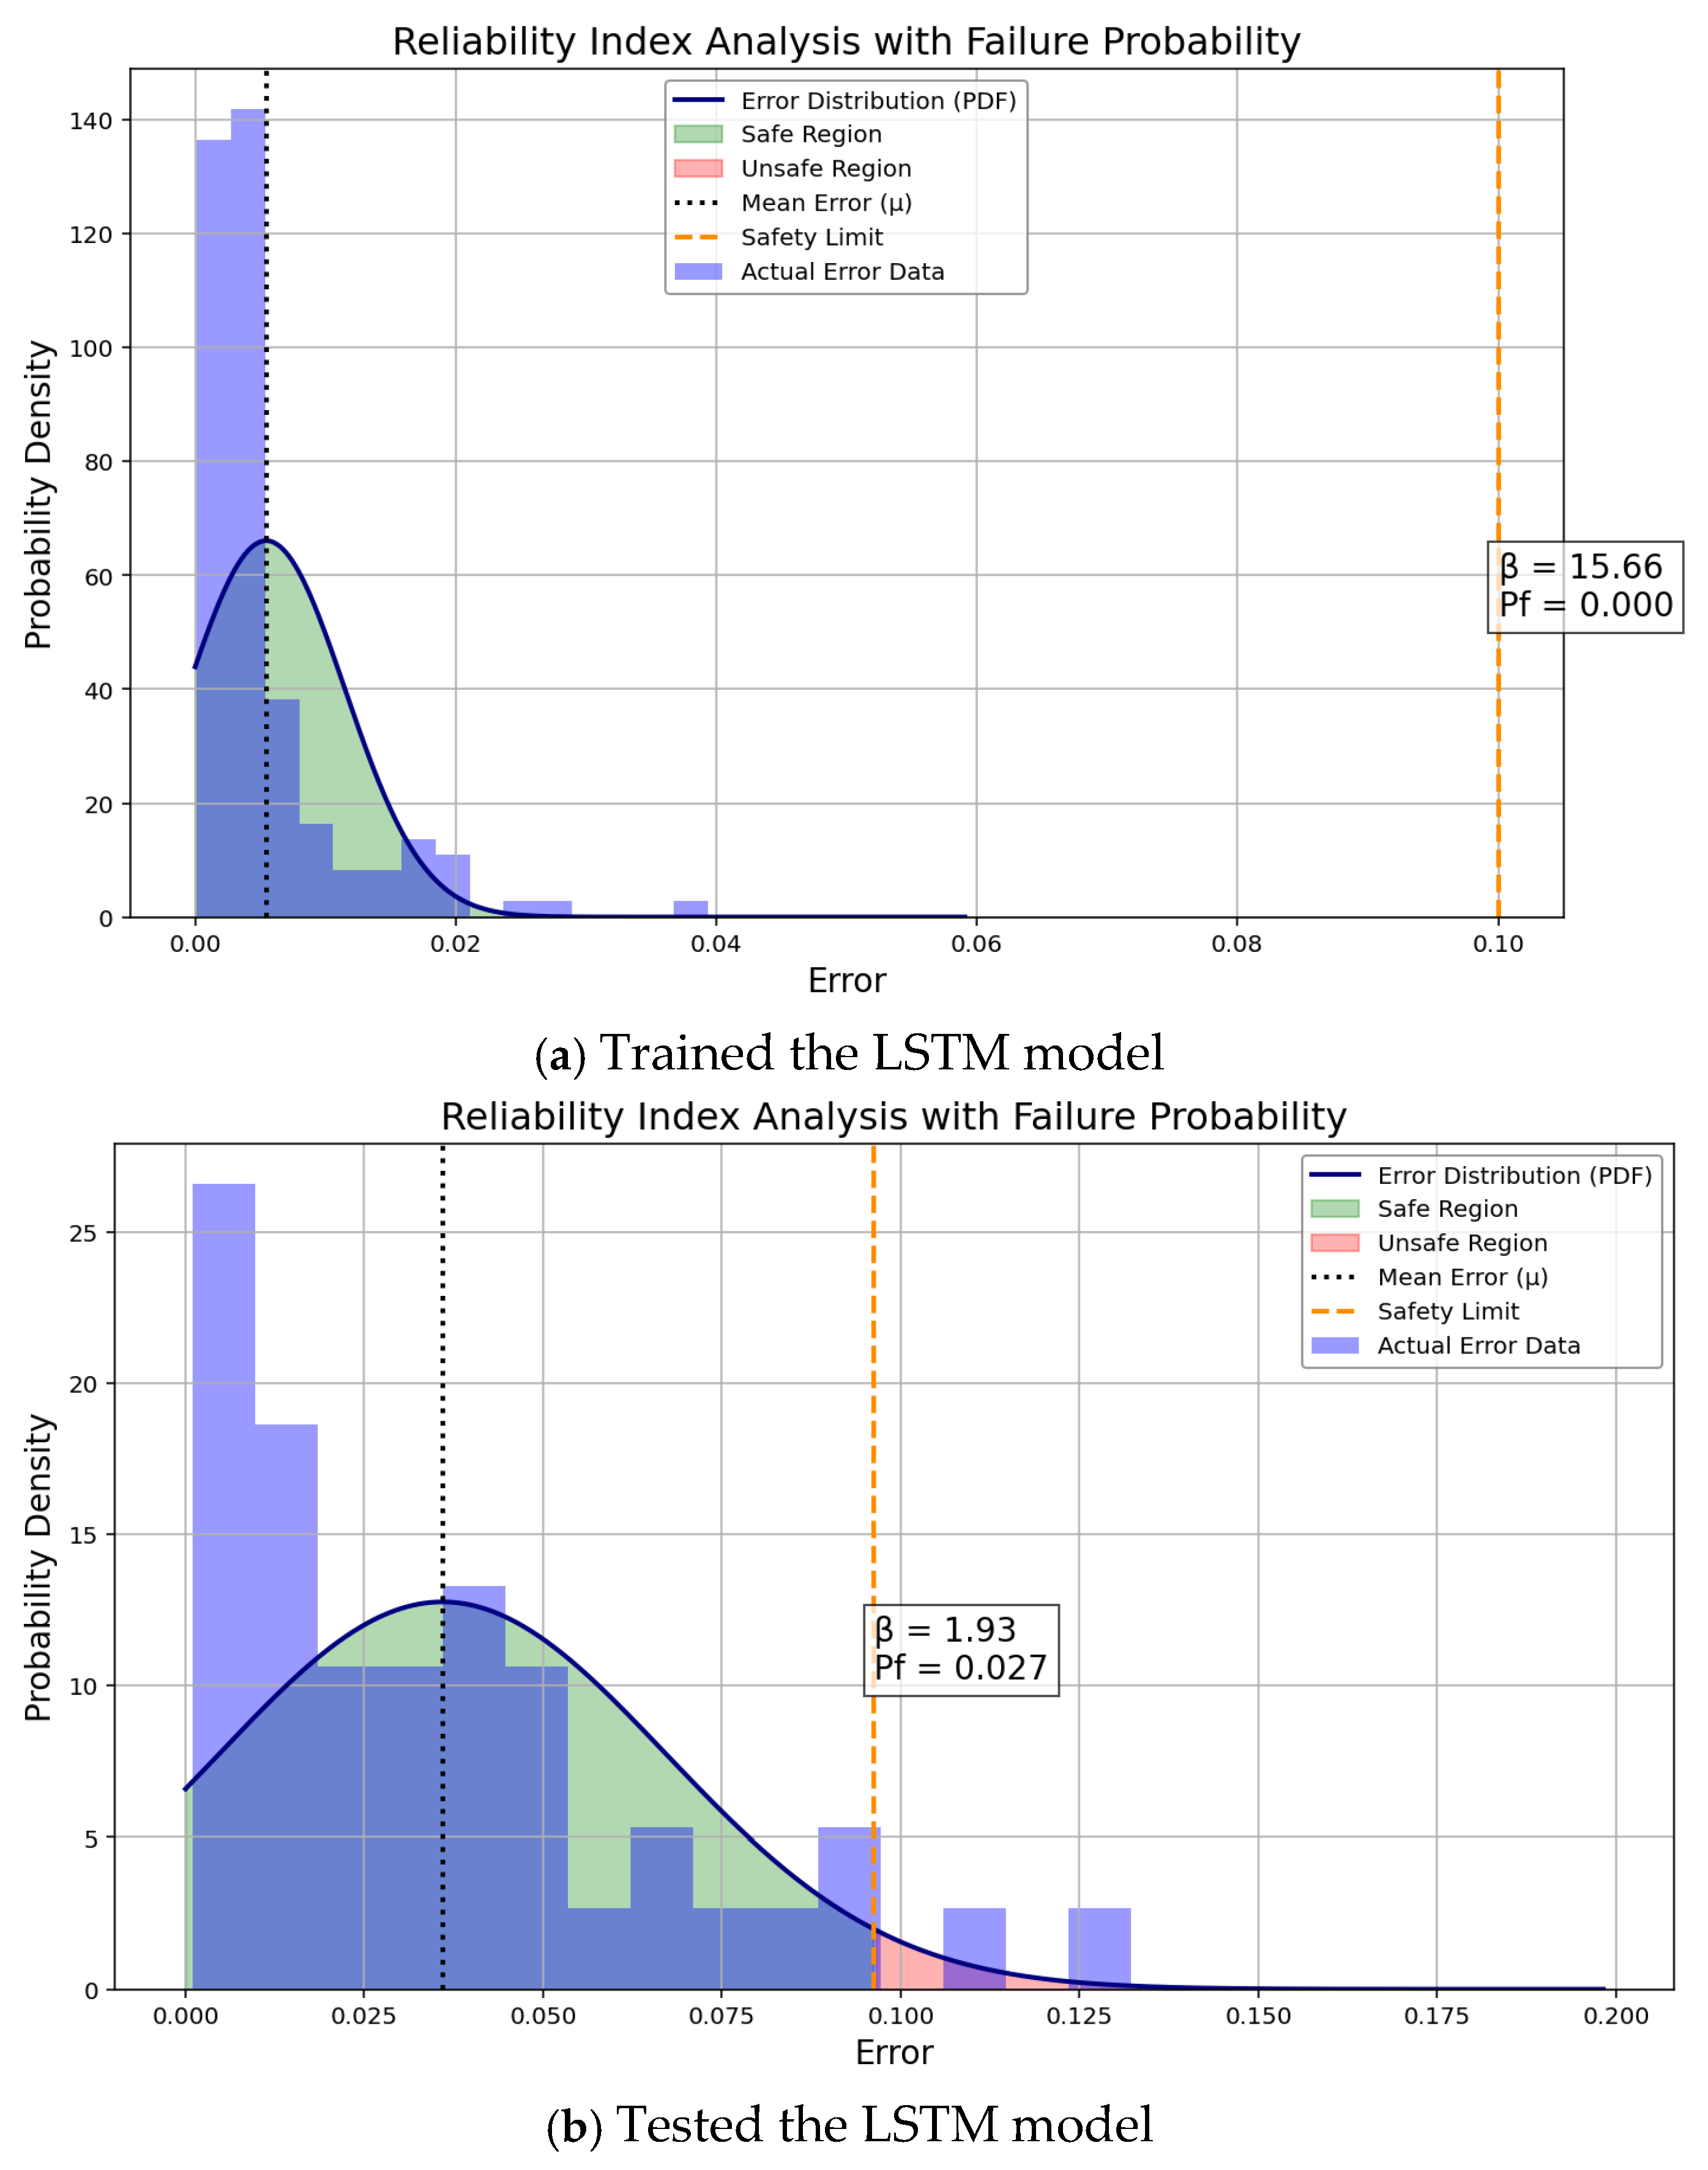

Disclaimer/Publisher’s Note: The statements, opinions and data contained in all publications are solely those of the individual author(s) and contributor(s) and not of MDPI and/or the editor(s). MDPI and/or the editor(s) disclaim responsibility for any injury to people or property resulting from any ideas, methods, instructions or products referred to in the content. |
© 2026 by the authors. Licensee MDPI, Basel, Switzerland. This article is an open access article distributed under the terms and conditions of the Creative Commons Attribution (CC BY) license.