1. Introduction
With the continuous expansion of China’s public transportation network, urban rail transit construction has developed rapidly in recent years. By the end of 2023, urban rail transit network construction plans were being implemented in 46 cities in China, with a total planned line length of 6118.62 km [
1]. Along with the ongoing growth of rail transit systems, the energy consumption of subway stations has attracted increasing attention. Existing studies have shown that station energy use is jointly affected by multiple factors, including climate conditions, station scale, passenger flow characteristics, and operational management, while HVAC systems are typically among the most energy-intensive subsystems in subway stations. Accordingly, improving the energy performance of subway station HVAC systems has become an important topic in both rail transit engineering practice and academic research [
2,
3,
4].
In subway station projects, HVAC process drawings are not merely graphical representations of system configurations, they also function as important carriers of operating modes, control requirements, and equipment interlock relationships. In general, such process drawings mainly include two core components: the operating mode table and the control table. The operating mode table is primarily used to describe the on/off states of different devices and the corresponding system operation combinations under various operating conditions, thereby reflecting how the system is organized and operated. The control table, by contrast, is mainly used to define monitored parameters, control commands, and interlock logic of equipment, thereby representing the control requirements and automation functions of the system. Therefore, HVAC process drawings do not only present the physical composition of the system but also integrate essential information related to operation management and control design. However, the preparation of such drawings still relies heavily on manual drafting and manual tabulation in current engineering practice. This not only reduces design efficiency but also makes it difficult to ensure standardization and consistency across different projects and designers. Moreover, because subway station HVAC systems involve a large number of devices, complex operational scenarios, and tightly coupled control relationships, manual drafting is both time-consuming and error-prone. Designers may overlook important details or even formulate inappropriate operating modes and control strategies, thereby affecting system performance and energy-saving outcomes. At the same time, the continuous expansion of subway lines and station facilities is creating a growing demand for design deliverables, which further exposes the limitations of conventional manual workflows. These practical challenges indicate the clear need for unified data representations, rule-driven generation logic, and reusable automatic drawing workflows for subway station HVAC process drawings.
Existing studies relevant to this problem can generally be grouped into three categories. The first category focuses on energy-saving strategy research for subway station HVAC systems. Previous studies have established benchmarking models for station energy use and identified major factors influencing station energy consumption [
2,
3]. Energy-saving strategies for underground station HVAC systems have also been systematically reviewed [
4]. At the operational level, researchers have investigated autonomous control methods for the Beijing Subway HVAC system, operating strategies for stations equipped with platform screen doors, and passenger flow-driven adaptive control approaches [
5,
6,
7]. Additional studies have analyzed the effects of mechanical fresh air supply, platform screen door airtightness, temperature setpoints, and equipment efficiency on the energy-saving performance of stations equipped with platform screen doors [
8]. Overall, these studies have provided a solid engineering and academic foundation for improving the energy-efficient operation of subway station HVAC systems.
The second category concerns the automatic generation of HVAC systems and control strategies. In the field of building MEP automation, Tang et al. [
9] reviewed BIM-based HVAC design from the perspective of automatic and intelligent methods and pointed out that the field is evolving from geometric modeling toward scheme generation, rule reasoning, and automated design. Wang et al. [
10] proposed a BIM-based automated HVAC design method for office buildings and verified the feasibility of automated scheme generation. In terms of control logic generation, Sporr et al. [
11] proposed a BIM-based method for automatically generating ventilation control strategies and later extended this idea to heat provision and distribution systems [
12], further demonstrating that BIM can support mode-based HVAC control strategy generation. Xiao et al. [
13] proposed an identification rule-based method for automatically generating MEP logic chains, allowing equipment connections, control relationships, and operational logic to be derived in a structured manner from BIM models. In parallel, studies on BIM–BAS information exchange and automation network generation have emphasized the importance of standardized data models and interoperable information structures for automated workflows [
14,
15,
16]. At the implementation level, Chen et al. [
17] proposed a rule-based HVAC duct-routing generation method, Pan et al. [
18] investigated BIM recovery from 2D MEP drawings, Wang et al. [
19] explored HVAC scheme generation using deep graph generative models, and Cai et al. [
20] extended automation to the control implementation stage through automated PLC code generation. Taken together, these studies have largely established a multi-level automation chain from information extraction and topology representation to control logic generation and implementation mapping.
The third category involves related research on automatic design in the electrical domain. Hussain et al. [
21] proposed an auto-drawing method for single-line diagrams in multivendor smart distribution systems. A key contribution of their work lies not only in the drawing algorithm itself but also in converting vendor-specific system diagrams into a standardized model prior to automatic generation, which demonstrates that cross-system automation fundamentally depends on standardized data representation and exchange formats. Yang et al. [
22] investigated practical single-line diagram recognition and systematically discussed key issues such as electrical symbol localization, text recognition, and low-resolution drawing interpretation, thereby demonstrating the applicability of deep vision models to engineering diagram recognition. Kelly and Cole [
23] further proposed a workflow for digitizing electrical circuit schematics by combining pattern recognition with OCR to recover machine-readable circuit information from images. Although these studies were conducted in the electrical domain, they are methodologically relevant to HVAC process drawing automation in terms of graphical element recognition, semantic parsing, connection recovery, and standardized output, and therefore provide useful references for structured input representation, rule formalization, and automatic deliverable generation in the present study.
Despite the substantial progress made in energy-saving strategies, HVAC system and control strategy automation, and electrical automatic design methods, studies that directly address the automatic generation of operating tables, control tables, and process tables for subway station HVAC process drawing remain limited. Compared with general building HVAC systems, subway station HVAC systems involve more operating conditions, more complex interlock relationships, stronger coupling between fire and smoke-control modes, and closer interactions among equipment, spaces, and operational scenarios. Therefore, automation in this context requires not only system diagram recognition and topology extraction but also the systematic organization of equipment information, spatial information, operating modes, control requirements, and interlock logic into standardized table-level deliverables.
To address this gap, this study proposes a rule-based automatic design method for subway station HVAC process drawing. The proposed method first recognizes HVAC system diagrams and converts them into structured drawing information. It then performs rule-based matching of the drawing information according to equipment display requirements and control requirements. Finally, standardized HVAC process drawings are automatically generated based on the developed digital design software.
Compared with existing BIM- and CAD-based automation studies that mainly focus on HVAC system modeling, duct routing, control strategy generation, or drawing recognition, this study focuses on the automatic generation of subway station HVAC process drawings. The proposed framework converts 2D CAD system diagrams into structured equipment–room–loop topology and further generates control/display lists and operating-mode tables. Therefore, the main contribution of this study lies in linking CAD-based diagram recognition, topology extraction, rule-based reasoning, and engineering table generation into an integrated workflow for subway HVAC process drawing design.
The main contributions of this study are threefold. First, a structured information representation method for subway station HVAC process drawing is established, providing a unified data basis for system diagram recognition, topology parsing, and subsequent rule matching. Second, a rule-driven method is proposed for generating operating tables, control tables, and process tables, thereby enabling the systematic organization of equipment information, control requirements, operating modes, and interlock logic. Third, digital design software for HVAC process drawing is developed to realize the automatic generation of subway station HVAC process drawings, thus providing technical support for reducing repetitive manual operations and enhancing the standardization and consistency of design deliverables.
2. Automated Design Method for Process Drawing
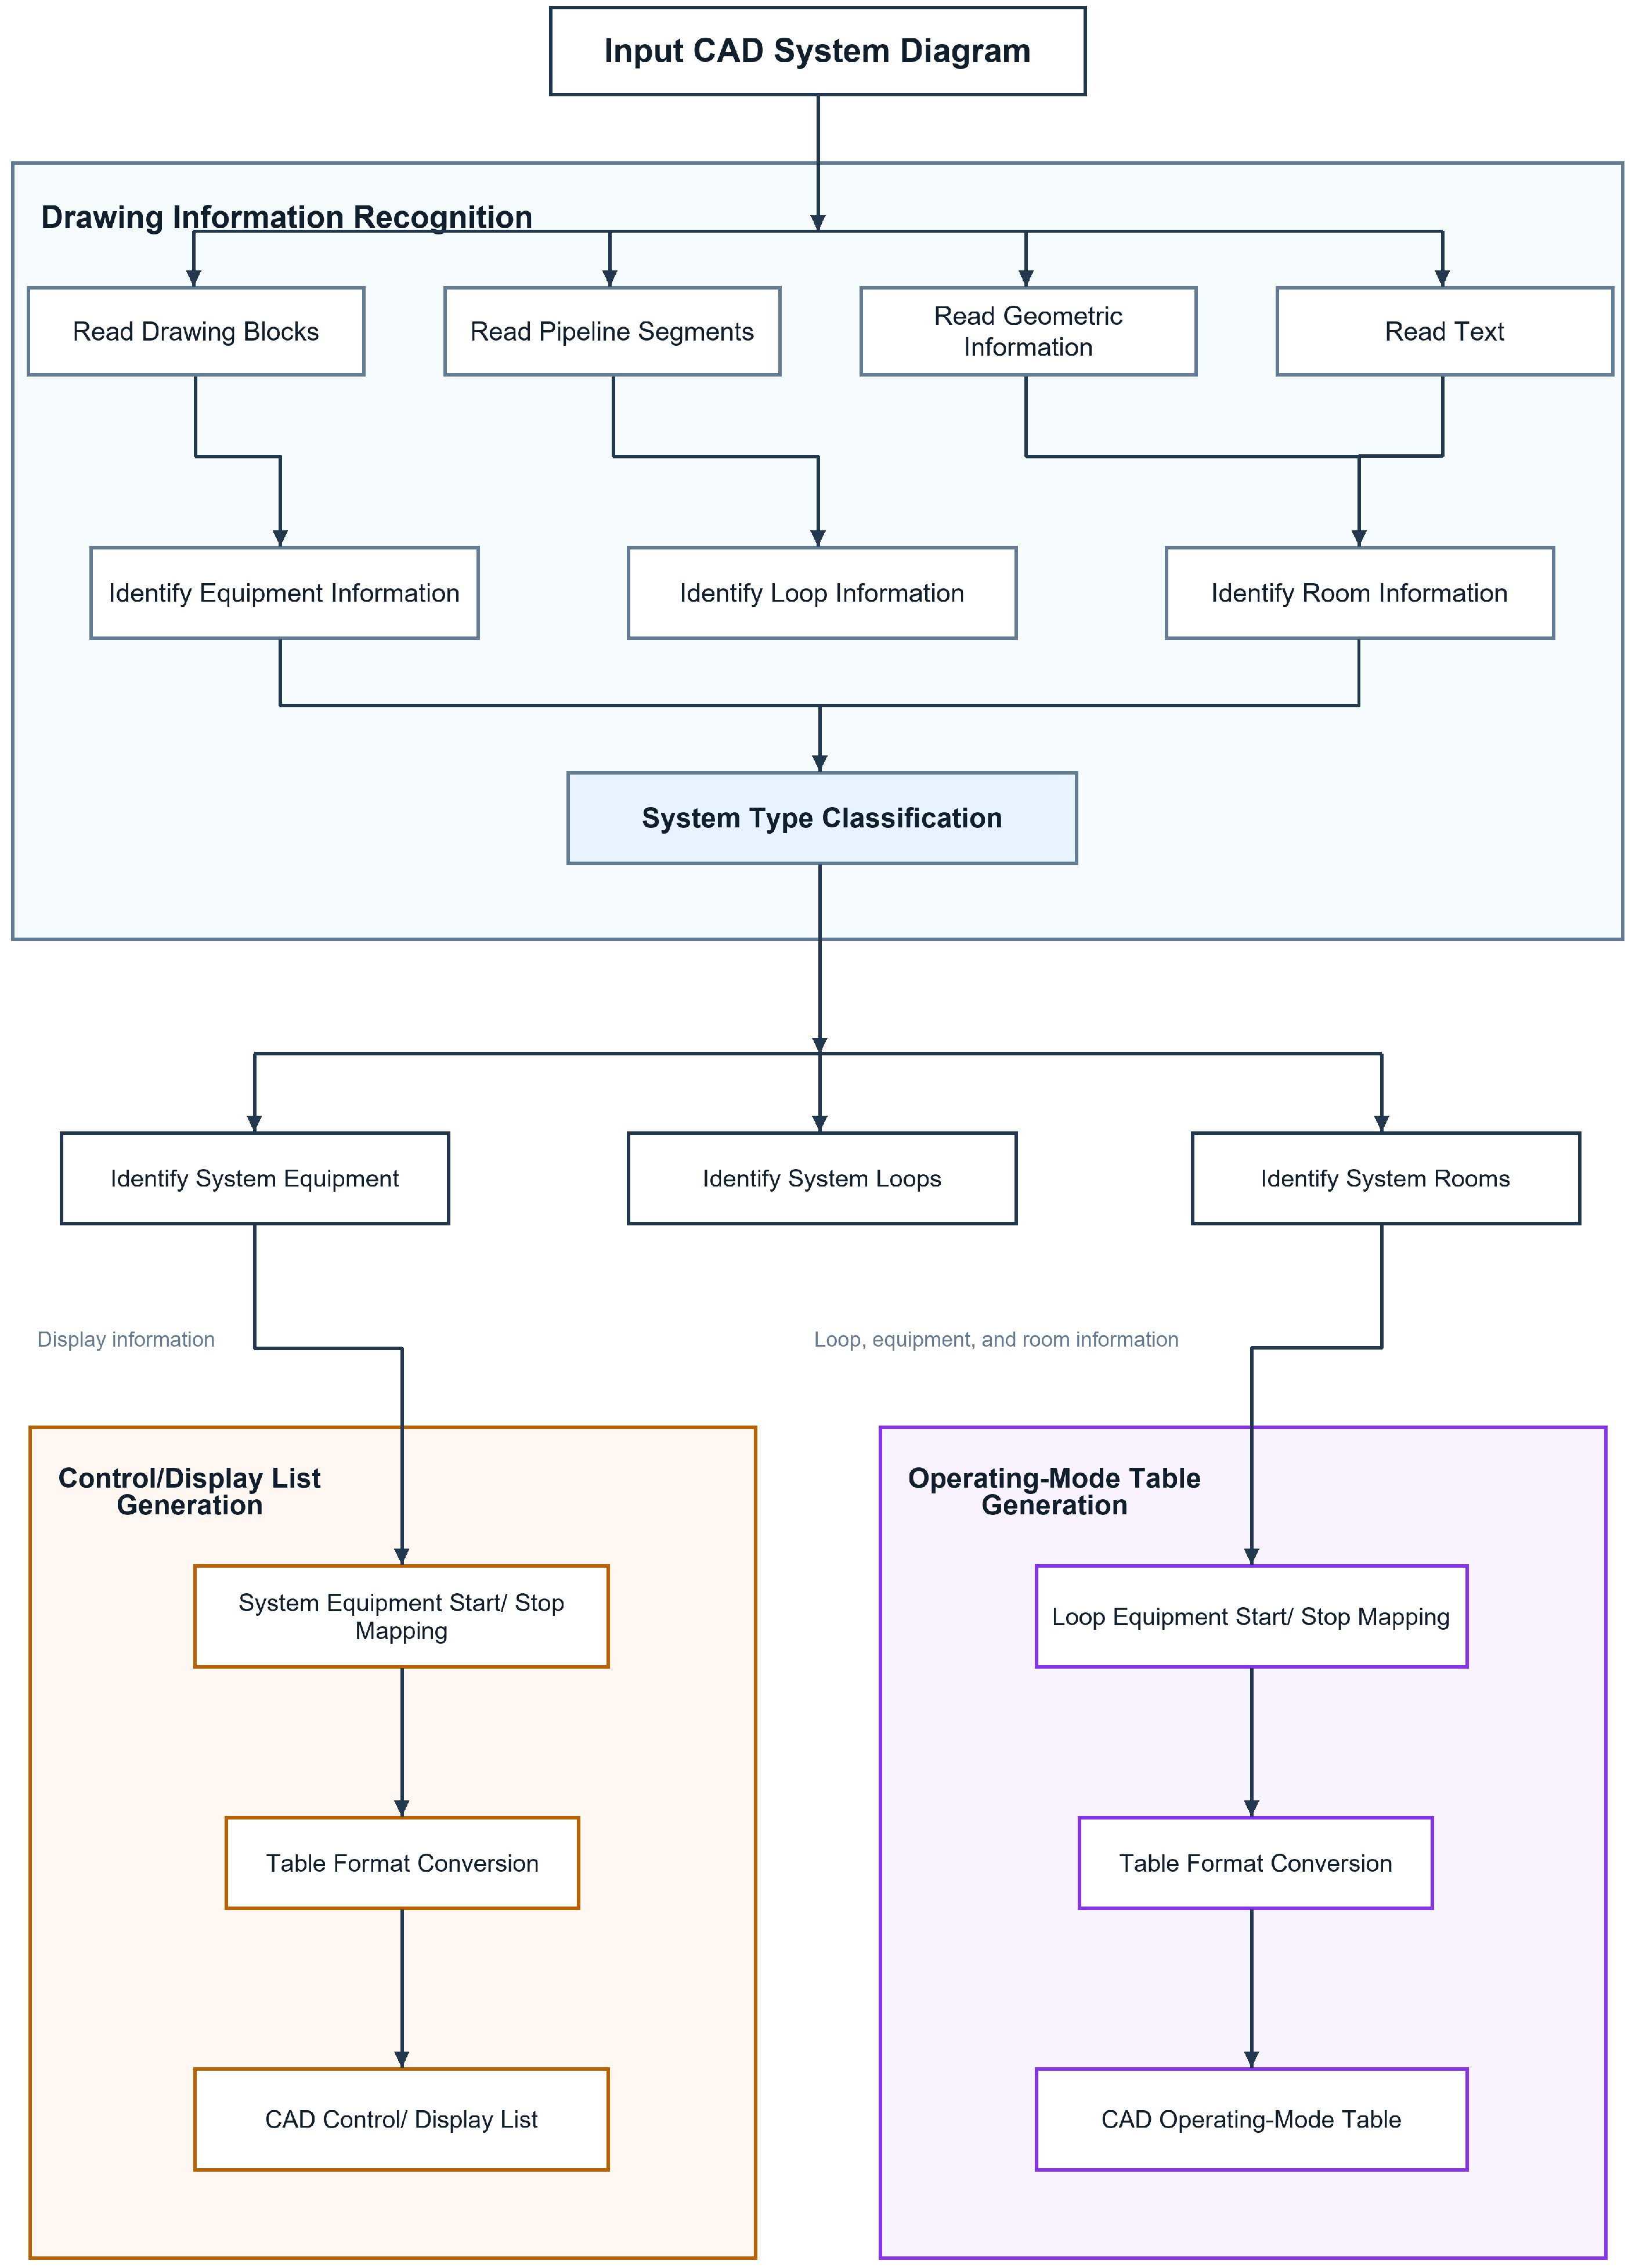
As shown in
Figure 1, the proposed automatic generation method for subway ventilation and air conditioning process drawing is developed as a three-stage framework, including system diagram recognition, control/display list generation, and operating mode schedule generation. The framework is designed to transform unstructured CAD drawings into structured engineering deliverables through progressive semantic parsing and rule-based table reconstruction.
In the first stage, the original CAD system diagram is used as the input. Multiple categories of CAD entities, including graphical blocks, pipeline segments, geometric features, and textual annotations, are extracted in parallel. By establishing the associations among these heterogeneous entities, the method identifies equipment information, loop information, and room information, and then classifies the system type. Based on the recognized system category, the framework further performs system-level recognition of equipment, loops, and associated rooms, thereby converting the original drawing content into a structured semantic representation.
In the second stage, the recognized equipment information is used to generate the control and display schedule. Specifically, equipment semantics are matched with the corresponding control requirements and display requirements according to predefined mapping rules. The obtained results are then transformed into a standardized tabular format and regenerated as CAD tables, so that the output remains consistent with engineering drawing delivery requirements.
In the third stage, the recognized loop information, equipment information, and room information are jointly integrated to generate the operating mode schedule. Through the association analysis of loops, equipment, and rooms, the operating relationships and start–stop logic under different operating modes are determined. These results are subsequently converted into a standardized schedule format and automatically represented in CAD form.
2.1. Automated Information Extraction from System Diagrams
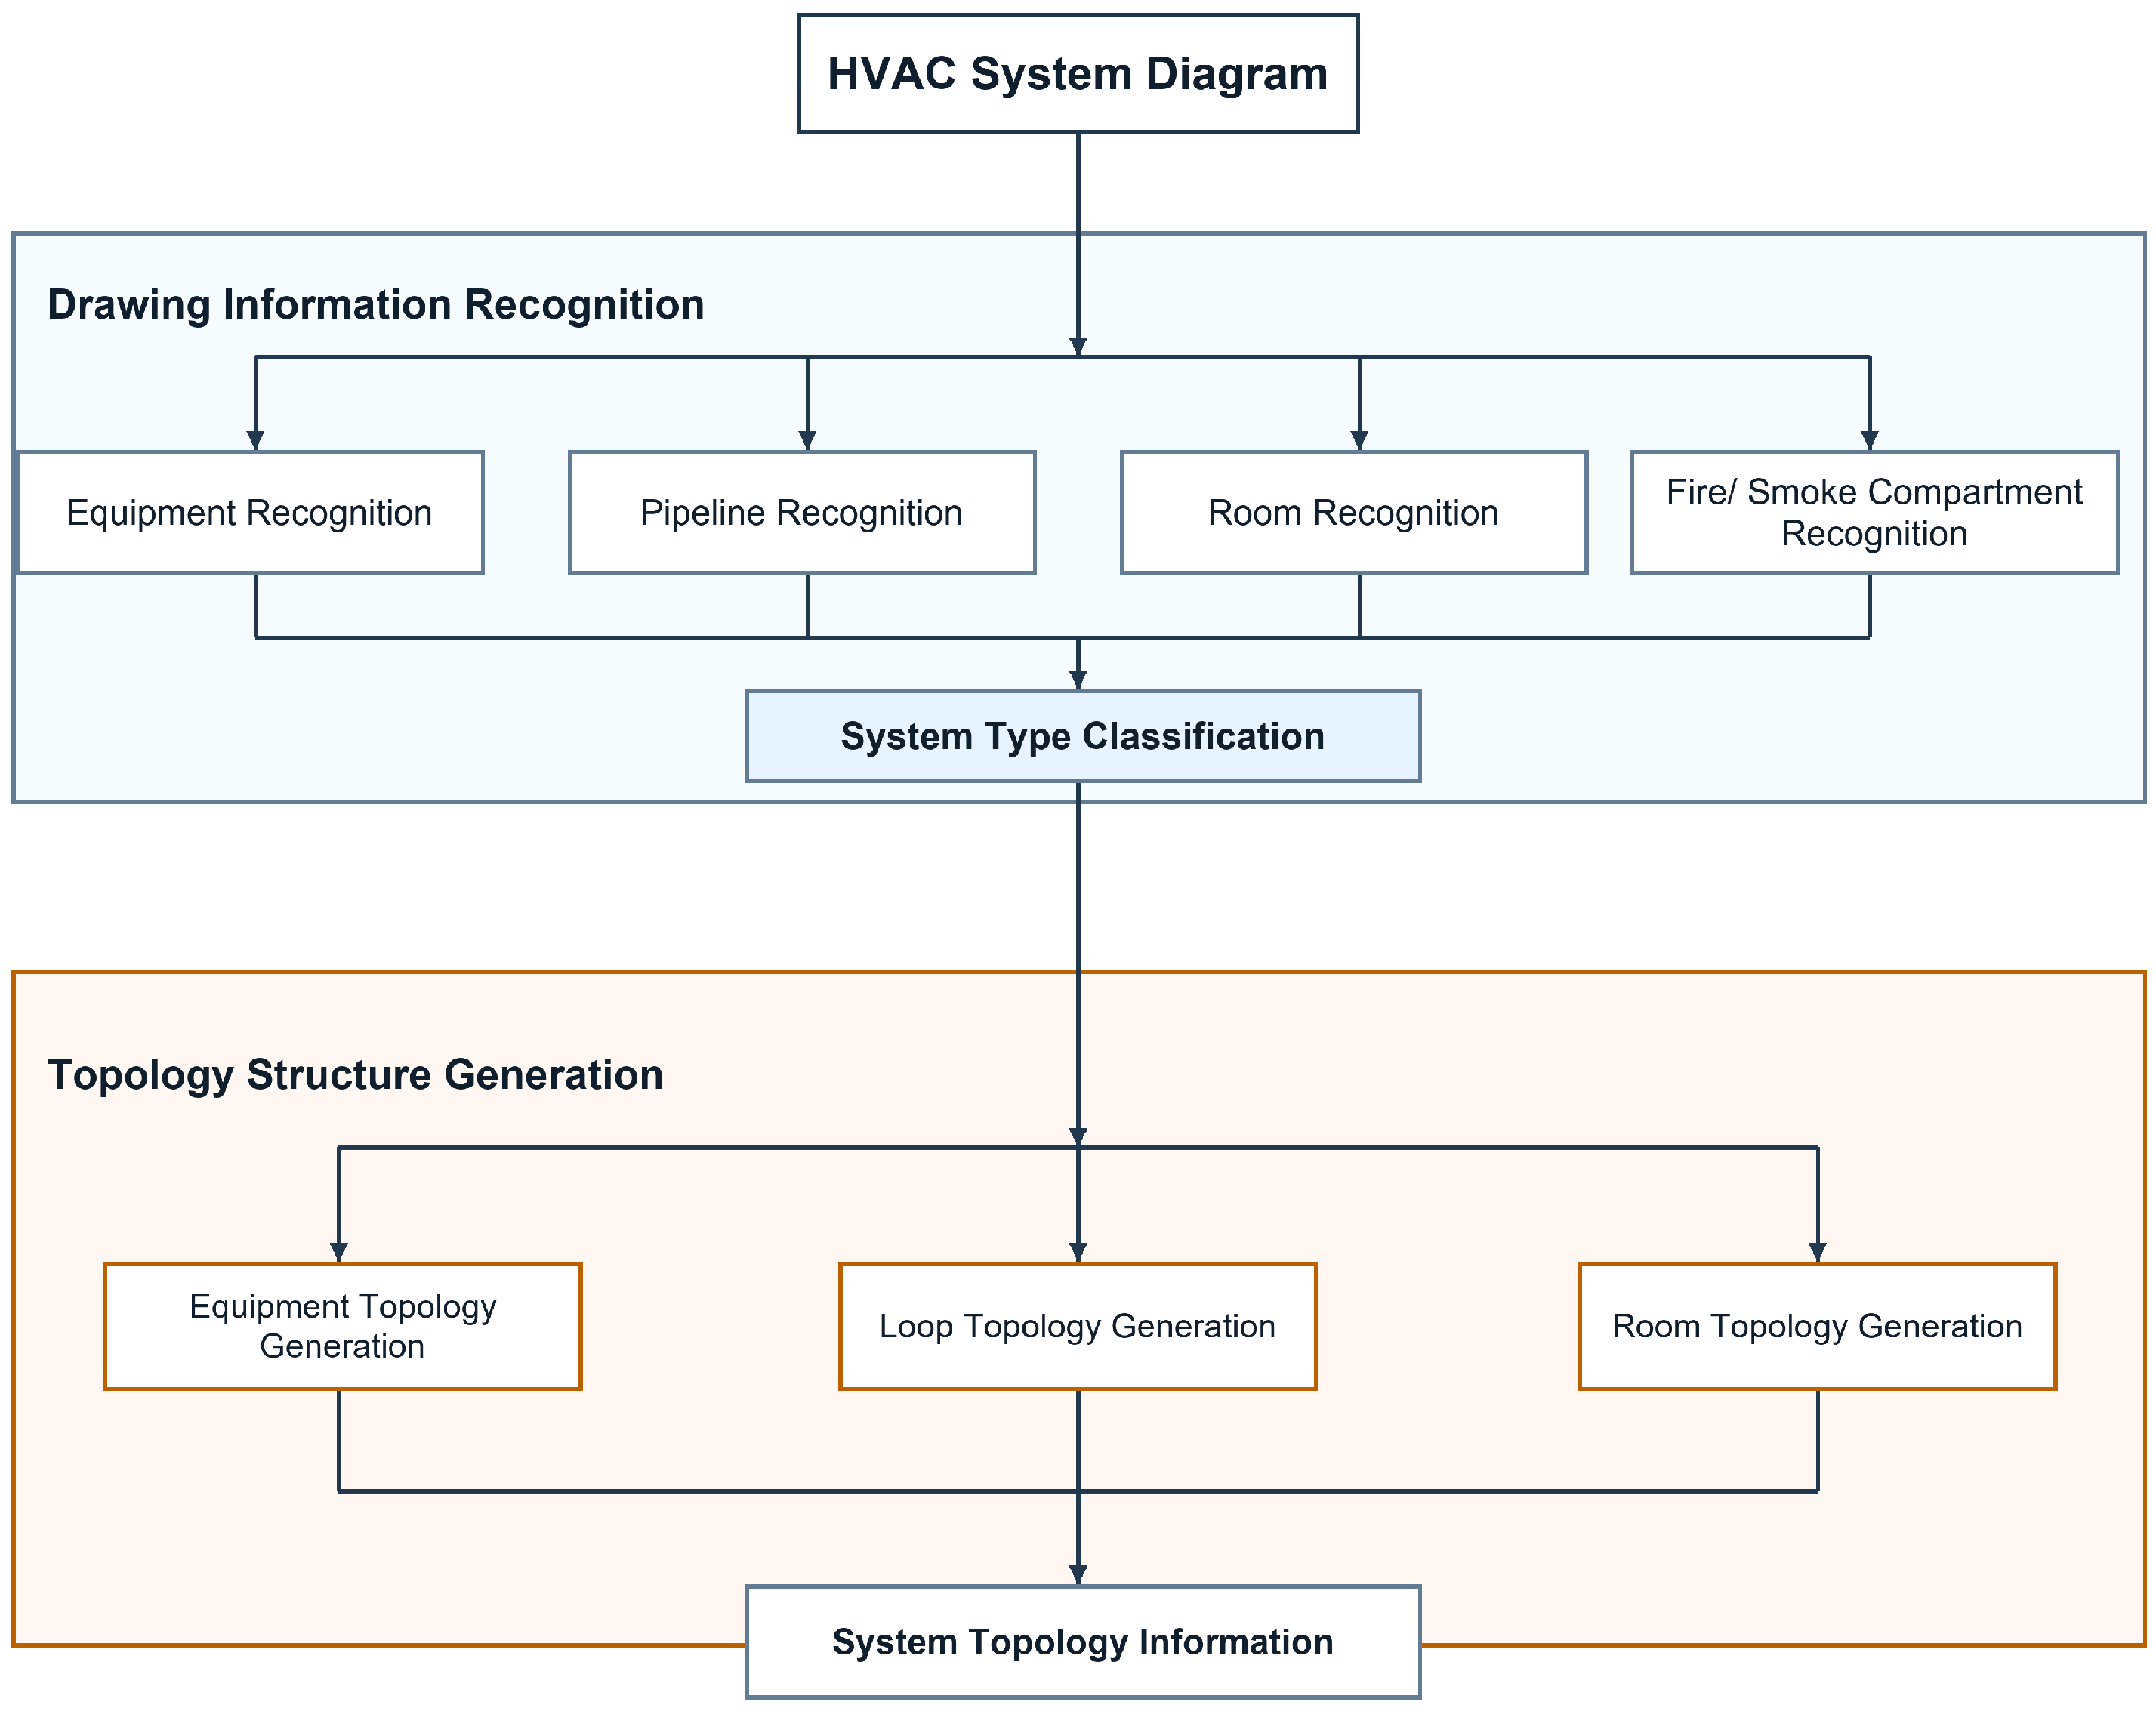
The purpose of system diagram recognition is to convert the subway HVAC system diagram from the CAD format into structured topology information that can serve as the direct input for subsequent control/display list generation and operating mode schedule generation. As the semantic parsing stage of the proposed framework, this module extracts and associates heterogeneous drawing entities from the original system diagram and organizes them into explicit relationships among equipment, loops, and rooms. The overall workflow of this module is illustrated in
Figure 2.
As shown in
Figure 2, the system diagram recognition module consists of two main stages, namely drawing information recognition and topology structure generation. In the first stage, the CAD system diagram is decomposed layer by layer to extract building borders, drawing titles, fire compartment information, smoke compartment information, room boundaries, room names, HVAC equipment, valves, sensors, pipelines, and their associated annotations. After entity extraction, distance-based matching is applied to associate textual labels with corresponding rooms, devices, and pipelines. In the second stage, the recognized drawing entities are further organized into topology information for equipment, loops, and rooms. Through this process, the original CAD system diagram is transformed into structured graph-based information with explicit loop–equipment–room relationships.
The main difficulty of this task lies in the fact that the target information is distributed across heterogeneous CAD entities rather than explicitly stored in a structured form. In particular, loop recognition requires identifying not only all devices belonging to a given loop but also the rooms served by that loop. Equipment recognition further involves multiple coupled attributes, including system ownership, location, name, number, fire protection property, interlocking relationship, device subtype, associated duct section, and service area. Room recognition also requires the integration of room boundaries, room annotations, fire protection zoning, smoke compartments, adjacency relationships, and room types. Therefore, the recognition accuracy depends on the coordinated interpretation of blocks, texts, and pipeline connectivity in the CAD drawing.
2.1.1. Drawing Information Recognition
Process drawings are drawn based on fundamental information from the ventilation and air conditioning system, including equipment, rooms, and system loops. Specifically: Equipment information refers to the main equipment requiring control within the ventilation and air conditioning system, such as chillers, water pumps, fans, valves, sensors, etc. Room information refers to the rooms served by the ventilation and air conditioning system. A loop is defined as the equipment connected to the same fan or chiller and the rooms it serves. It is determined collectively by the equipment, rooms, and the connecting air/water pipelines. This information is automatically acquired by recognizing equipment, pipelines, rooms, and fire/smoke compartments within the system diagrams. Different element information is typically located on different system diagrams; therefore, it is necessary to perform drawing segregation on the recognized information, classifying and filtering element data from different drawings according to their drawing names. The drawing information identified from the system diagrams is summarized in
Table 1.
Equipment Identification
Equipment identification aims to automatically associate equipment blocks with their corresponding textual labels in different drawings to determine the geometric location of the device represented by a specific label. Because annotation styles may vary across drawings, different matching strategies are adopted according to the graphical relationship between annotations and equipment.
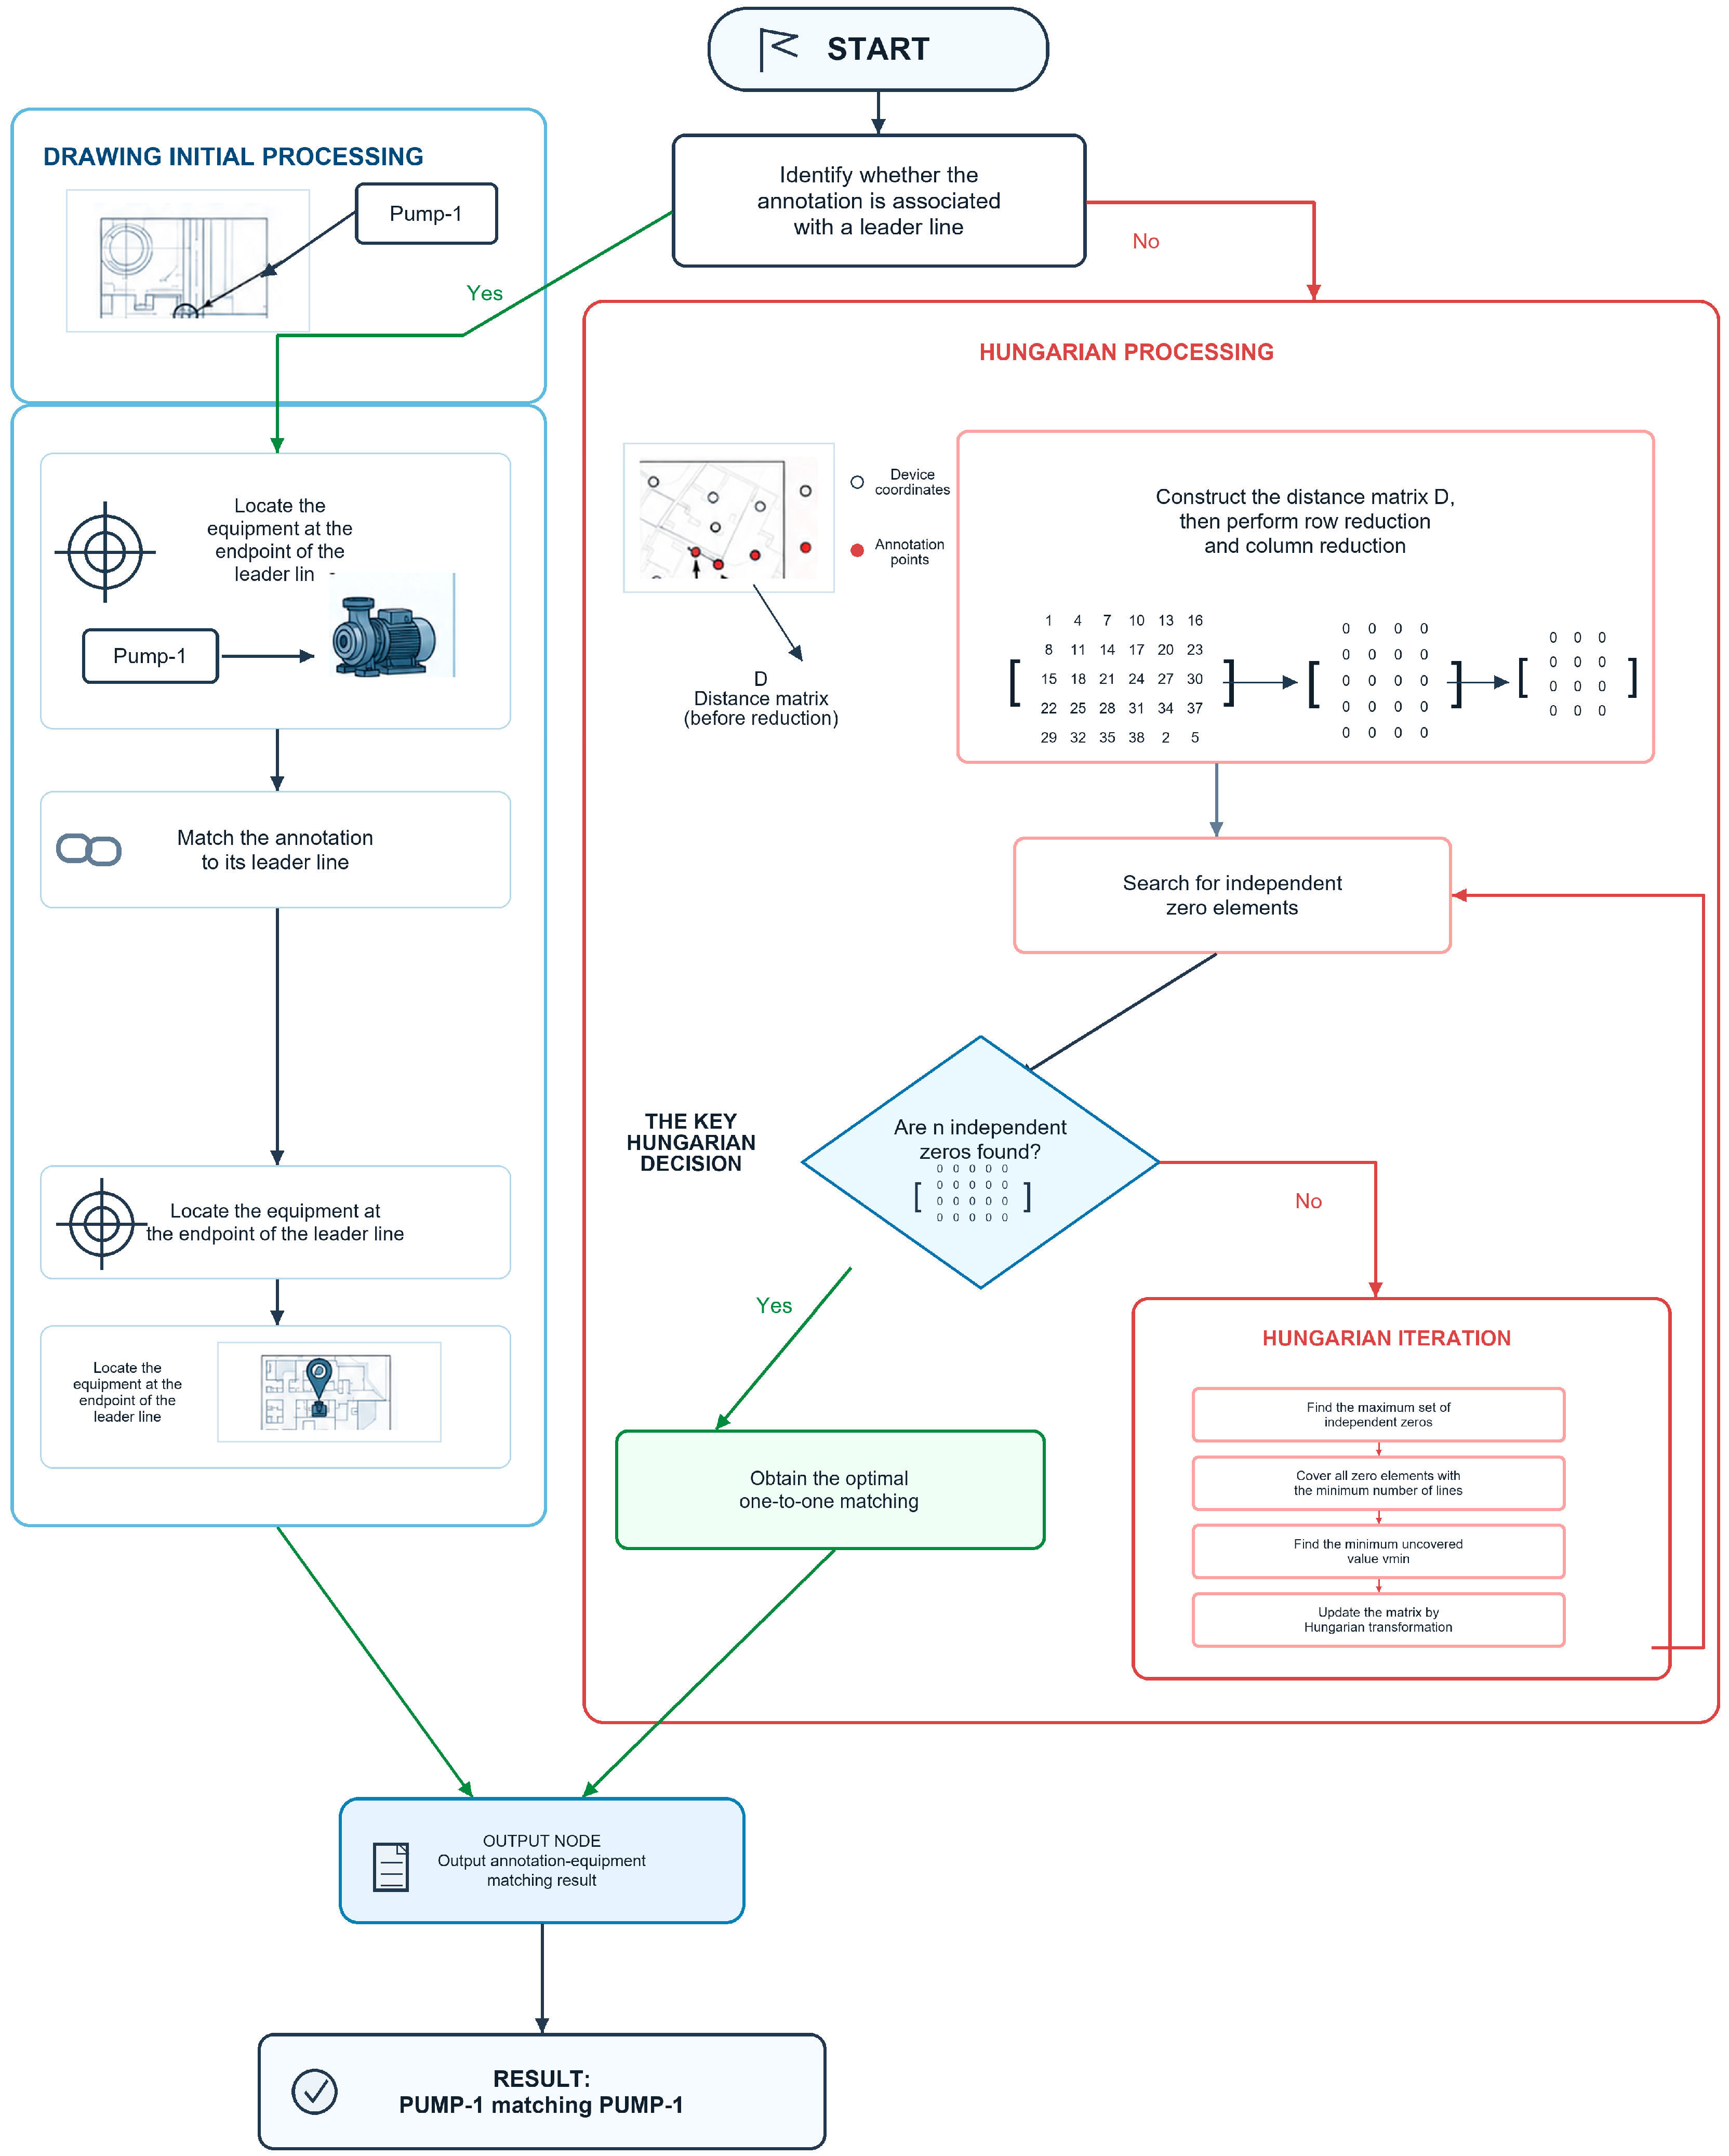
According to the different annotation styles in the drawings, the proposed equipment identification procedure is divided into two branches, as shown in
Figure 3.
For drawings in which annotations are connected to equipment through leader lines, the identification can be completed through direct geometric association. Specifically, each annotation is first matched with its corresponding leader line, and the equipment located at the endpoint of that leader line is then identified as the matching target. Since the leader line explicitly indicates the annotation–equipment relationship, this case does not require further global optimization.
For drawings in which no valid matching relationship exists between leader lines and annotations, equipment identification is formulated as a one-to-one assignment problem between equipment blocks and annotated coordinates. In this study, the Hungarian algorithm is adopted to solve this problem because it is effective for minimum cost one-to-one matching [
24]. Let
denote the Euclidean distance between the
i-th device and the
j-th annotated coordinate. Based on these distances, an n × n cost matrix
is constructed as
where each element represents the matching cost between a candidate device and a candidate annotation position.
After the cost matrix is constructed, row reduction and column reduction are performed. The minimum value in each row is first subtracted from all elements of that row, and the minimum value in each column is then subtracted from all elements of that column. This transformation preserves the equivalence of the original optimization problem while generating zero elements that indicate potential low-cost matches. The algorithm then searches for a set of independent zero elements, where no two selected zeros are located in the same row or column. In practice, rows or columns containing a unique zero are processed first, because such zeros correspond to unambiguous assignment candidates. When multiple zero elements remain in the same row or column, priority is given to rows or columns with fewer candidate zeros, and conflicting zeros are subsequently excluded. Through this procedure, the algorithm attempts to obtain n independent zero elements corresponding to a complete feasible assignment.
In implementation, candidate devices and annotation points are first grouped according to drawing type, system category, layer information, and local spatial range. Distance-based matching is then performed only within the corresponding candidate group, rather than over all entities in the entire drawing. When several candidate entities are located near the same annotation point, the candidate with the minimum spatial distance within the valid matching range is selected. If the candidate relationship cannot be determined uniquely from the spatial distance and drawing context, the case is flagged for manual checking against the original CAD drawing and associated project documents. Due to the confidentiality requirements of the cooperating enterprise, the project-specific numerical thresholds used in the implementation cannot be fully disclosed. Nevertheless, the matching workflow, candidate grouping logic, distance priority rule, and manual checking treatment for ambiguous cases are described here to make the procedure reproducible at the methodological level.
If fewer than n independent zero elements can be found, the current matrix does not yet provide a complete matching solution. In this case, the maximum number of independent zero elements is determined, and all zero elements in the matrix are covered using the minimum number of horizontal and vertical lines. If the number of covering lines is still smaller than n, the matrix is further updated using the standard Hungarian transformation. Specifically, the minimum uncovered value vmin is identified, subtracted from all uncovered elements, and added to the elements located at the intersections of the covering lines. This operation preserves the optimality of the original assignment problem while generating additional zero elements, thereby enlarging the feasible search space.
The above procedure is repeated until n independent zero elements are obtained. At that point, the positions of the selected zeros define the optimal one-to-one correspondence between annotations and equipment blocks, and the total Euclidean matching distance is minimized. In this way, the proposed equipment identification method combines direct geometric matching for leader line cases with global optimal assignment for non-leader-line cases, thereby improving both robustness and accuracy in complex HVAC process drawing.
In addition, the computational complexity of the Hungarian algorithm is \(O(n^3)\), where \(n\) denotes the number of equipment blocks and annotation positions in the same matching group; in practical engineering drawings, the matching process is performed by drawing type, system category, layer information, and spatial location to reduce the effective matching scale.
Pipeline Identifcation
Pipeline identification involves the automatic matching of pipelines with their corresponding labels across different drawings to determine the pipeline type, such as fresh air, return air, exhaust air, smoke exhaust, etc. The matching procedure is as follows:
Acquire pipeline positions and filter specified duct labels;
Iterate through each label and match it with the closest pipeline;
Iterate through the pipelines that remain unmatched after Step 2. If the start/end points of an unmatched pipeline coincide with those of an already matched pipeline, add it to the same list and assign it the same label. If all pipelines are matched with a label, the process is complete; otherwise, proceed to Step 4;
Iterate through the pipelines that remain unmatched after Step 3. For each, find the closest collinear pipeline that already has a label match, add it to the same list, and assign it the same label.
Room Identifcation
The objective of room identification is to match room coordinates with room names. A room label located within a room’s boundary is assigned to that room. For rooms in device room system diagrams, it is also necessary to identify whether the room is a fire suppression room. A room is classified as a fire suppression room if a fire suppression room fill block marker is present within its boundaries.
Fire/Smoke Compartment Identificaion
For fire and smoke compartments, it is necessary to identify the room names located within different fire protection zoning and smoke compartments. The identification procedure is as follows:
Identify the boundaries of the fire and smoke compartments and match them with their corresponding fire or smoke compartment labels;
Determine the spatial relationship between room name labels and the fire/smoke compartment boundaries. A room is considered to be within a specific fire or smoke compartment if its name label falls within the boundaries of that compartment.
2.1.2. Topological Structure Generation
The element information obtained through drawing information recognition requires further processing to generate structured graphic element information, including equipment topology, room topology, and loop topology. Among them, the loop information needs to include the equipment within the loop and the rooms served by the loop; the room information includes the associated fire protection zoning, smoke compartment, room name, adjacent rooms, and whether it is an automatic fire suppression room; the equipment information includes the associated system, associated location, equipment name, equipment number, whether it is fire protection equipment, interlocked equipment, equipment type, the pipe section where the equipment is located, and the area it serves. The structured graphic element information is shown in
Table 2.
Equipment Topology Generation
The equipment topology contains information such as equipment number, equipment name, system ownership, duct section type, installation location, fire protection attribute, and service area. The equipment name is identified according to the equipment number. The equipment type and its associated duct section are determined based on whether the target device is collinear with the fresh air fan or the return/exhaust fan and is located at the minimum distance from the corresponding reference device. For components whose location attribute is required, including disinfection and purification units, variable air path devices in combined air handling units, and fan coil units, the installation location is assigned according to the nearest designated device within the same loop. Interlocking relationships are identified based on whether the target device belongs to the same loop as the specified device and satisfies the nearest distance criterion. In addition, the rooms served by each system loop are determined from the air terminals, and the service area of the equipment contained in the loop is further inferred accordingly. The system ownership of each device is finally determined based on the system loop to which it belongs and its equipment number.
Room Topology Generation
The room topology includes room name, adjacent rooms, whether the room is an automatic fire extinguishing room, and its fire compartment and smoke compartment attributes. Whether a room is an automatic fire extinguishing room is determined by checking the existence of filling patterns within the room area in the drawing. Adjacent rooms are identified according to whether the planar regions of the target room and other rooms overlap or are collinear. The fire compartment and smoke compartment attributes of each room are determined according to the room position in the fire compartment and smoke compartment diagrams. Through this process, room-level topology information is established for subsequent system relationship analysis.
Loop Topology Generation
The loop topology includes loop number, all devices contained in the loop, and the rooms served by the loop. First, the devices are preliminarily grouped into system loops according to their equipment numbers. Second, the initial loop partition is further refined according to the specific positions and connections of pipelines in the system diagram; for example, devices connected to the same fan or chiller are classified into the same loop. Finally, the air terminals are matched with the pipelines of the corresponding system loops, and the rooms where the air terminals are located are regarded as the rooms served by the loop.
2.2. Generation of Control Lists
The purpose of control/display list generation is to produce standardized control and display schedules for subway HVAC systems based on the intermediate file generated in the system diagram recognition stage. Using the recognized system equipment information and a predefined correspondence table between equipment categories and control/display items, this module determines the required start/stop commands, status indications, alarm items, remarks, and table entries for each device, and finally presents the results in CAD format.
The main difficulty of this task lies in the fact that schedule generation is not a direct transcription of the recognized equipment information but a rule-based reconstruction process. First, different device parameters, such as start, stop, and differential pressure alarm, need to be correctly assigned according to the control and display requirements of the corresponding equipment under different control hierarchies, such as central control and station control. Second, the remarks associated with each device need to be generated by jointly considering equipment type, interlocking relationship, and installation location. Third, the positions of devices in the schedule must be arranged according to predefined ordering rules to ensure consistency with engineering drafting conventions. In addition, the generated schedules must be represented in CAD format while maintaining completeness, readability, and standardization.
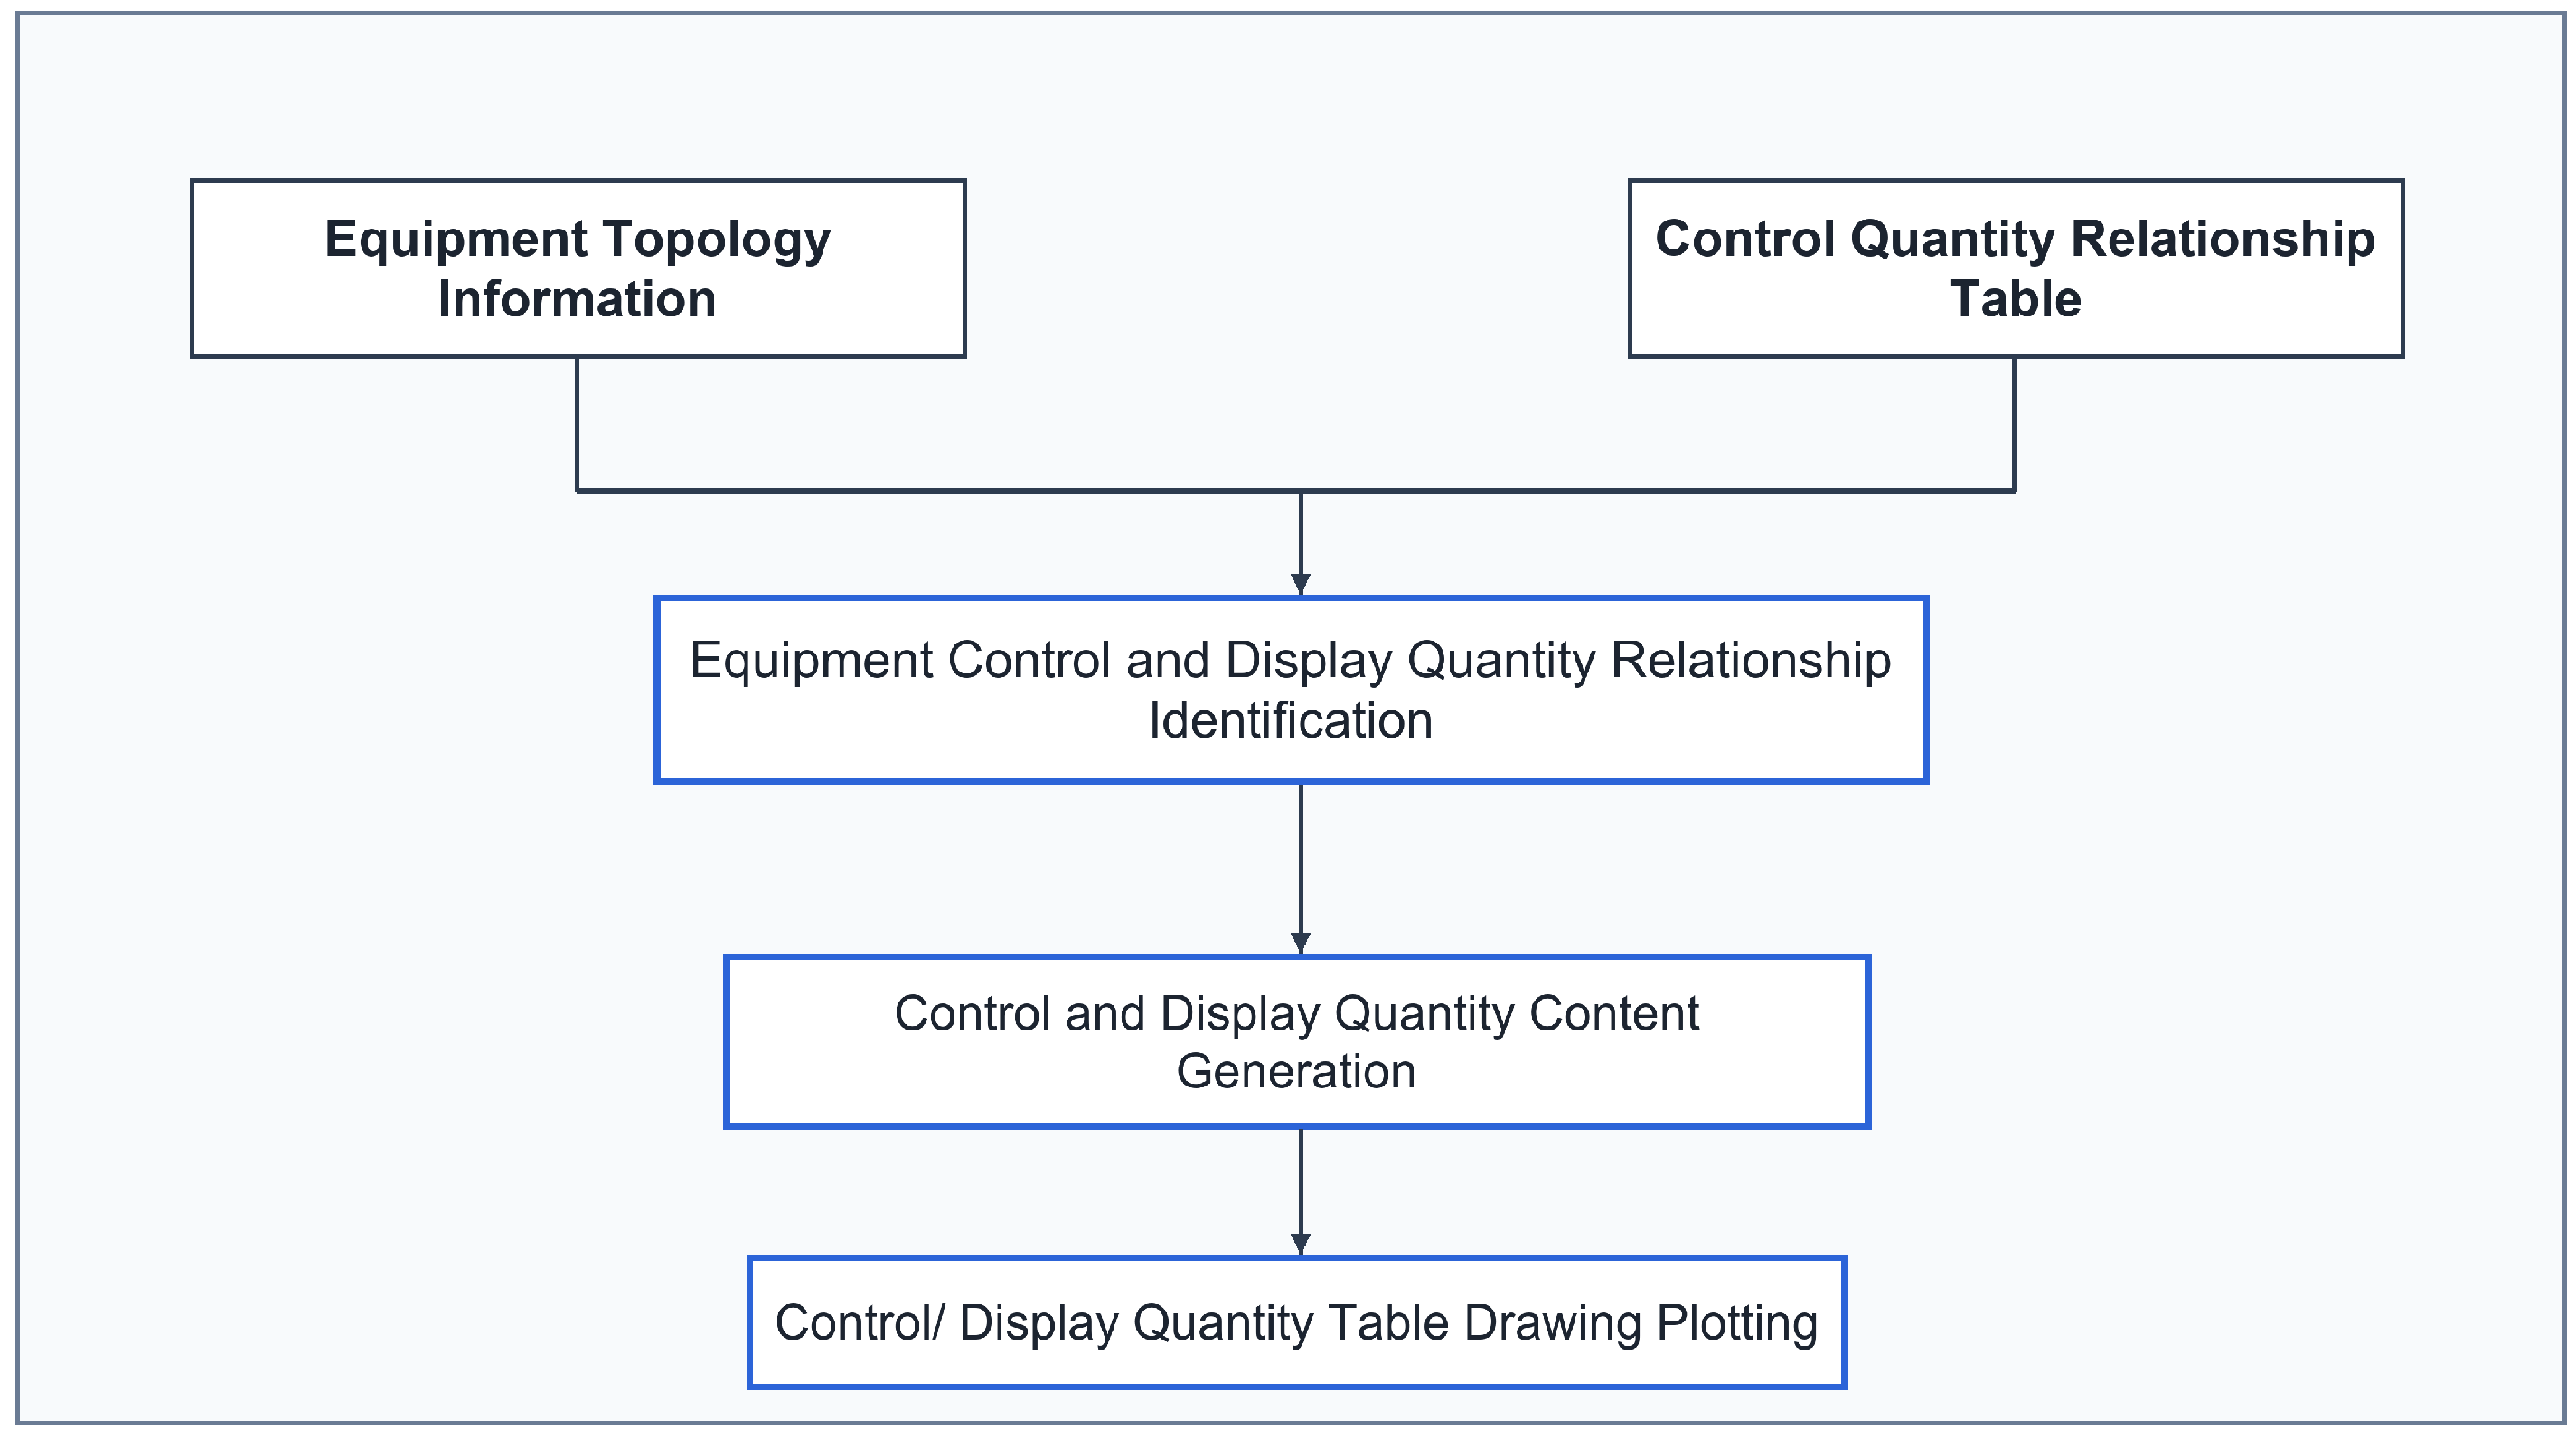
To address these issues, the proposed method performs control/display list generation through control/display relationship recognition, schedule content generation, and CAD-based table drawing. The overall workflow of this module is illustrated in
Figure 4.
As shown in
Figure 4, the recognized equipment topology information and the predefined control–quantity relationship table are first taken as the inputs of this module. Based on these two inputs, the control and display relationships of each device are identified, so that the required control items and display items can be determined according to device characteristics and predefined engineering rules. On this basis, the corresponding schedule content is generated, including control commands, display items, alarm information, remarks, and the ordered positions of devices in the table. Finally, the generated results are organized into a standardized tabular structure and automatically drawn in CAD format, thereby producing control/display lists that satisfy engineering delivery requirements.
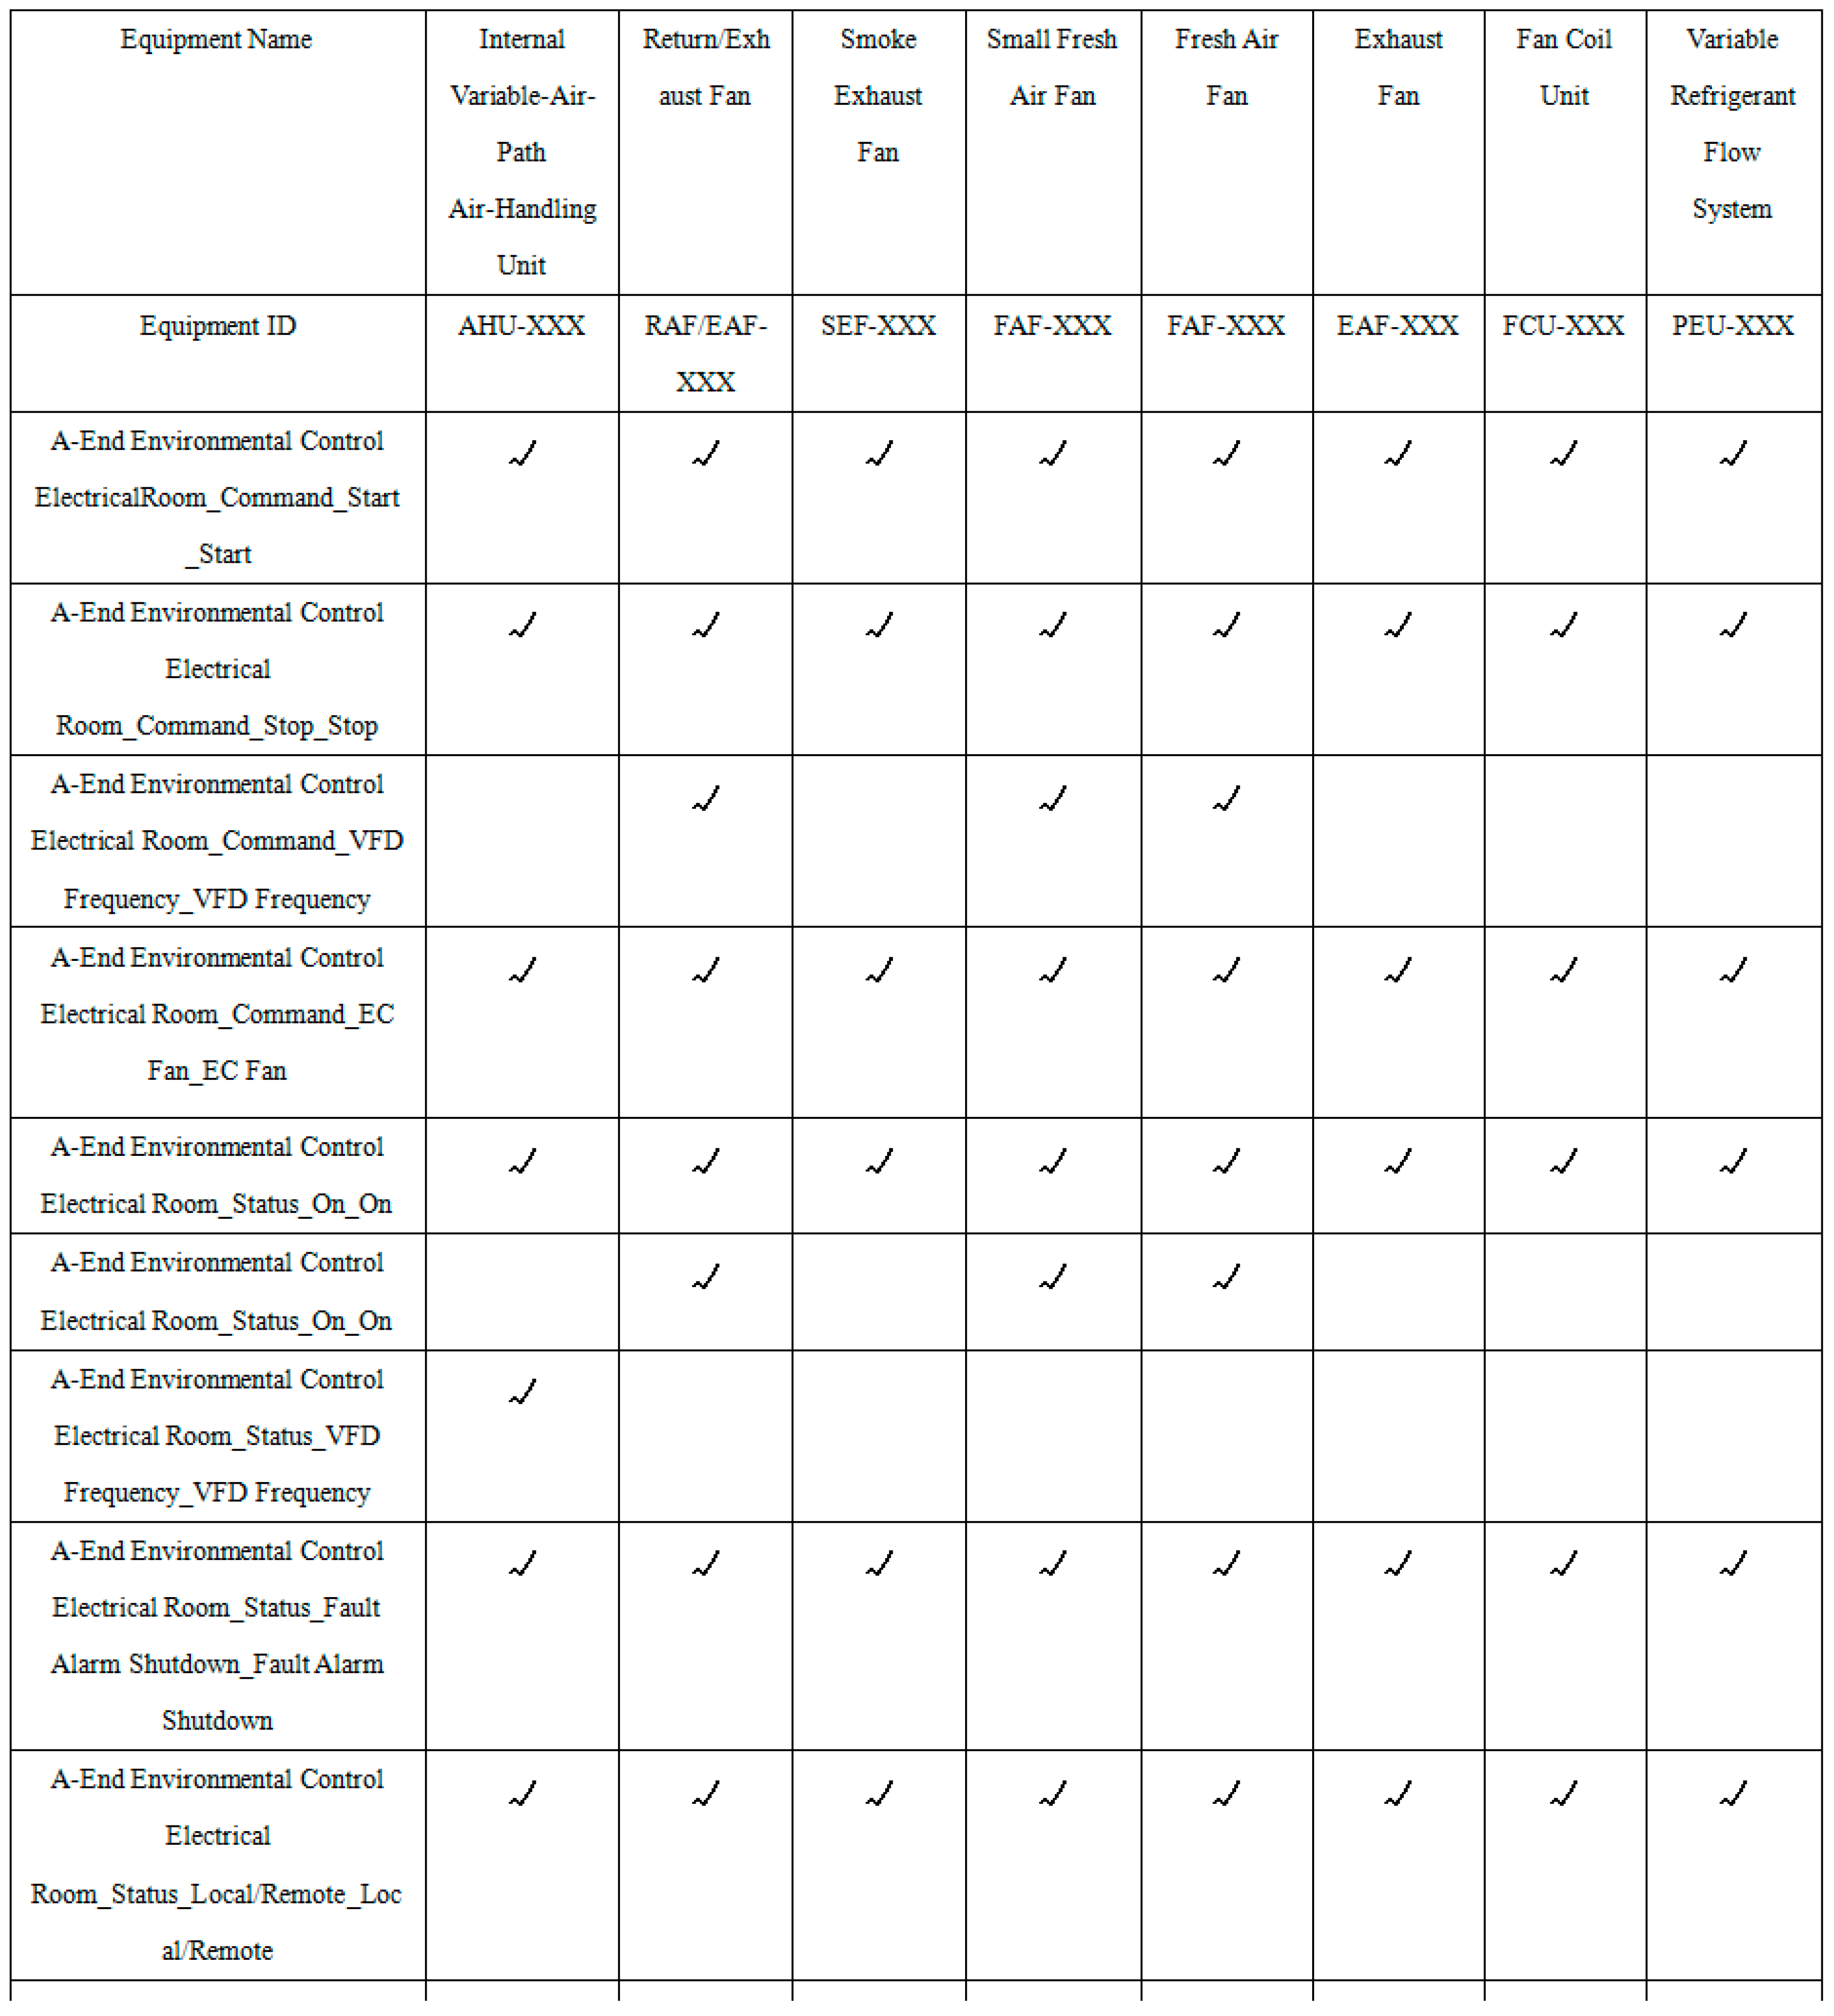
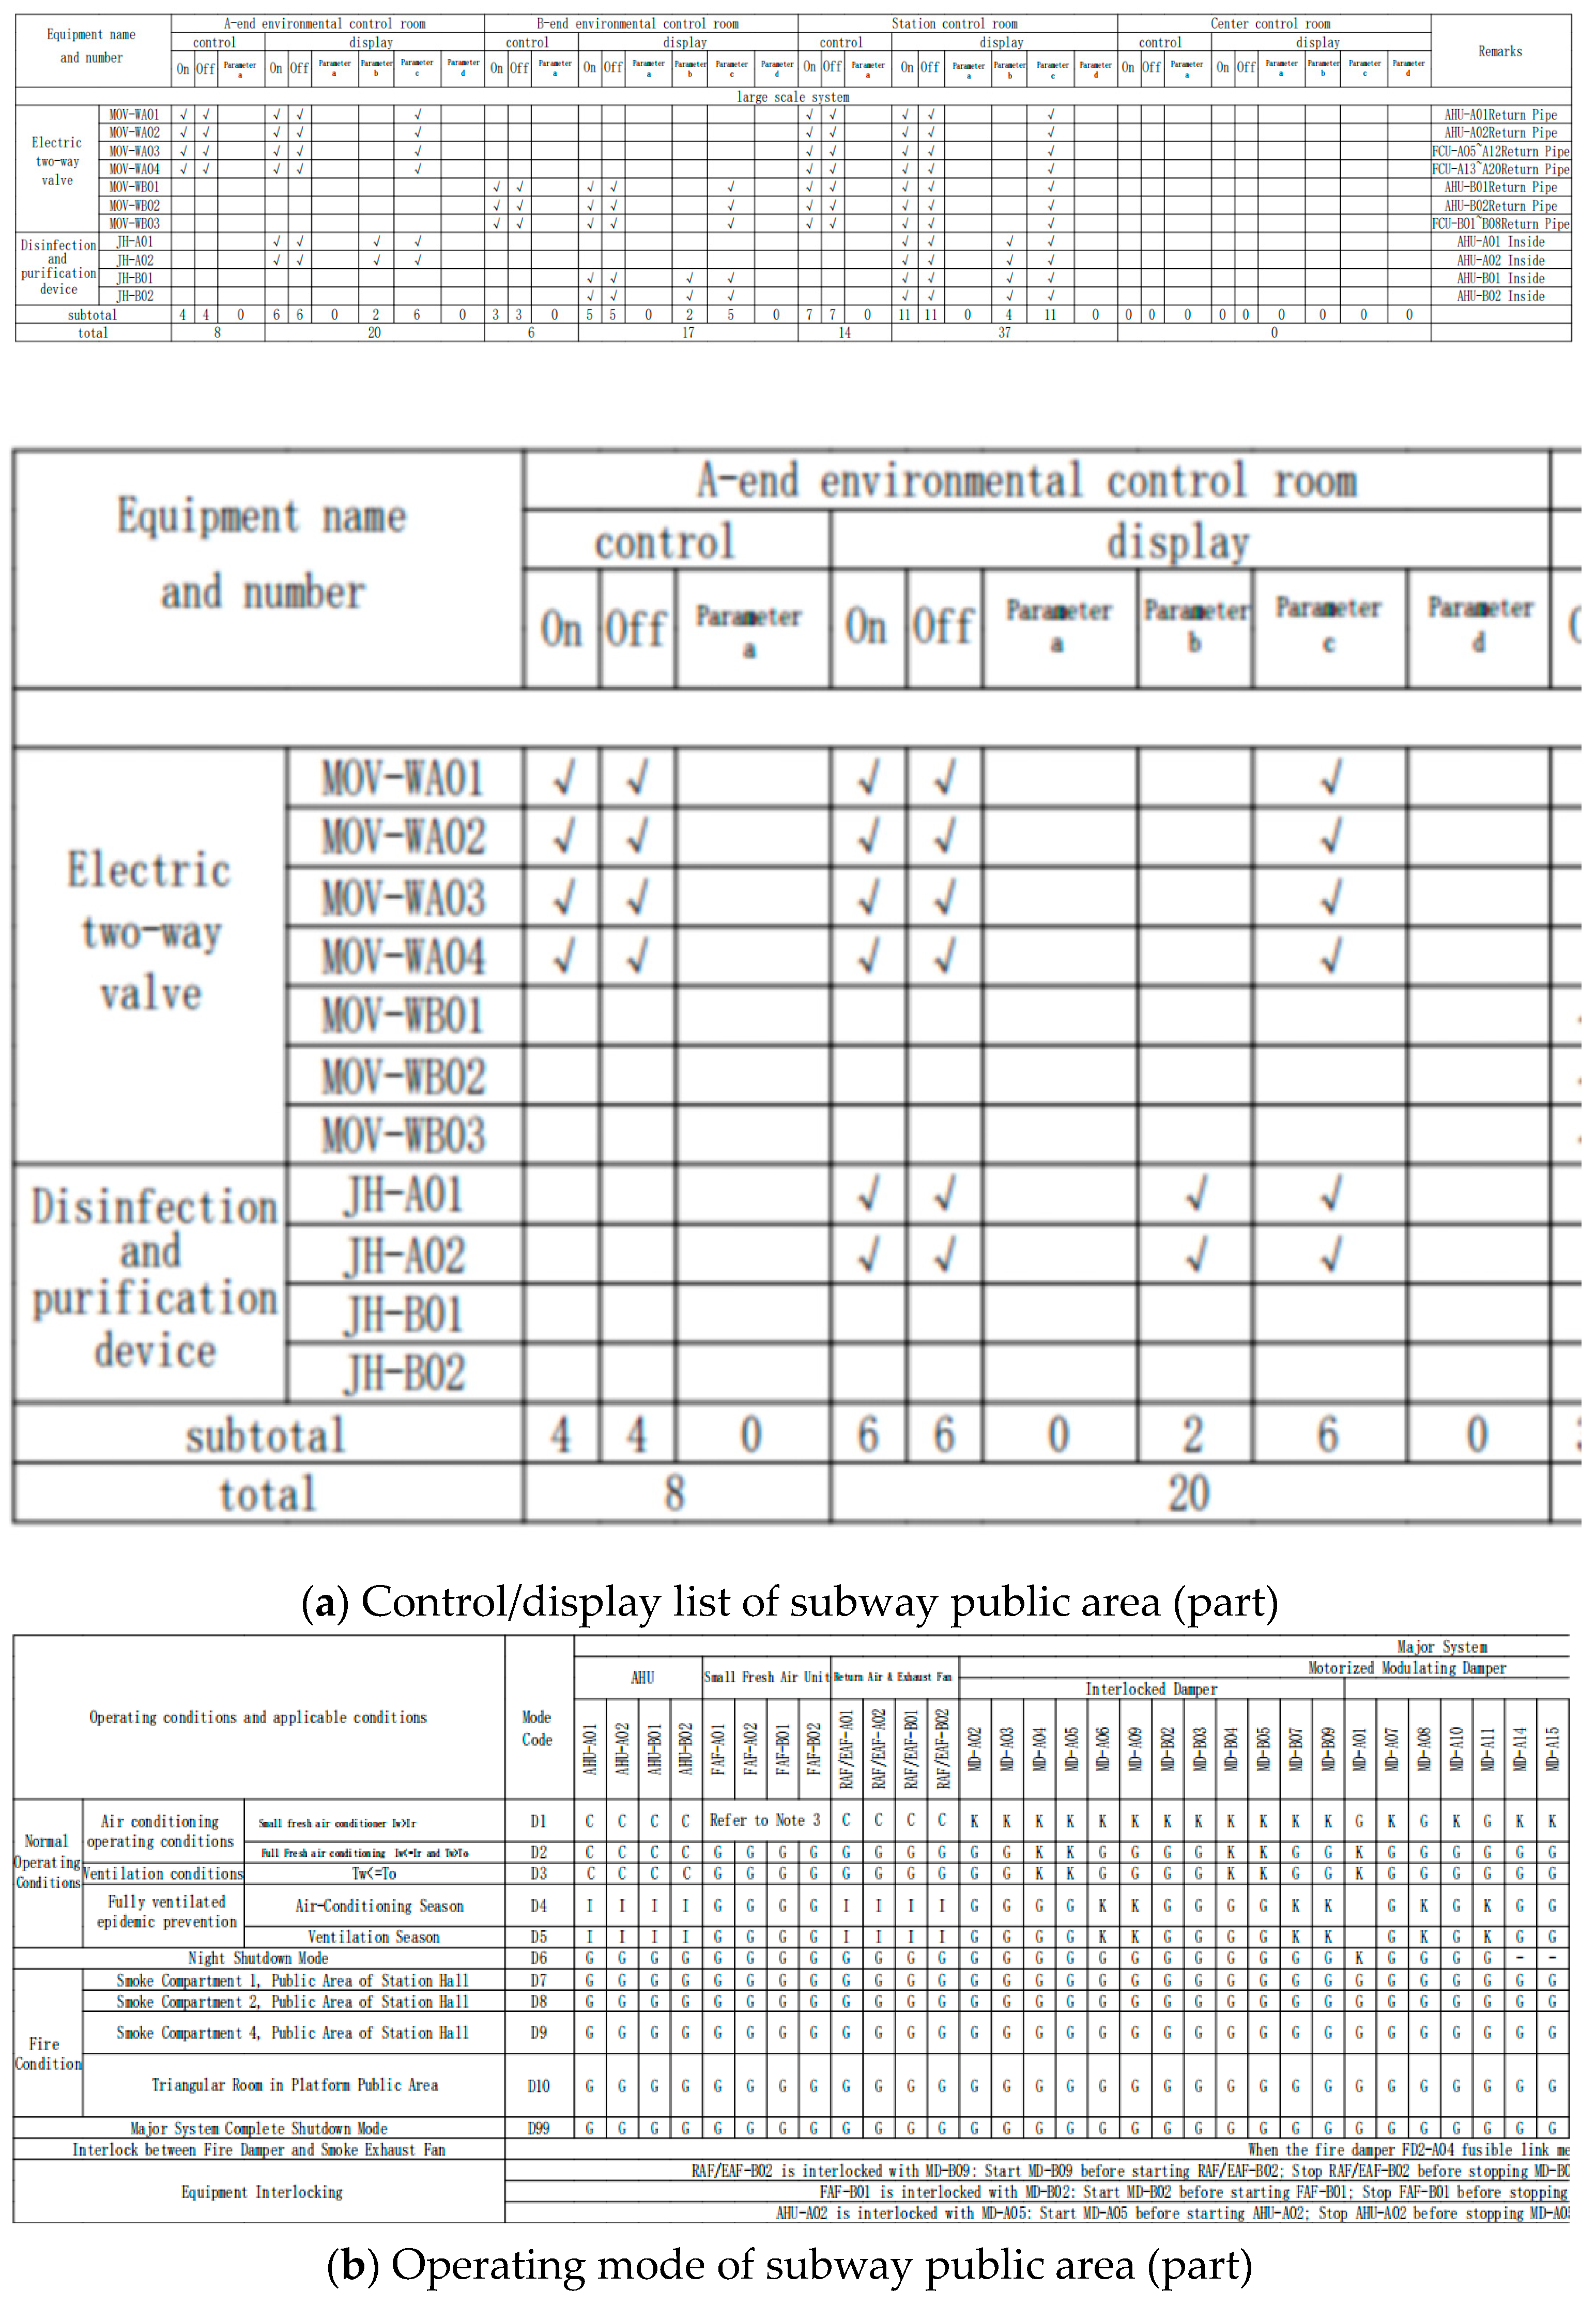
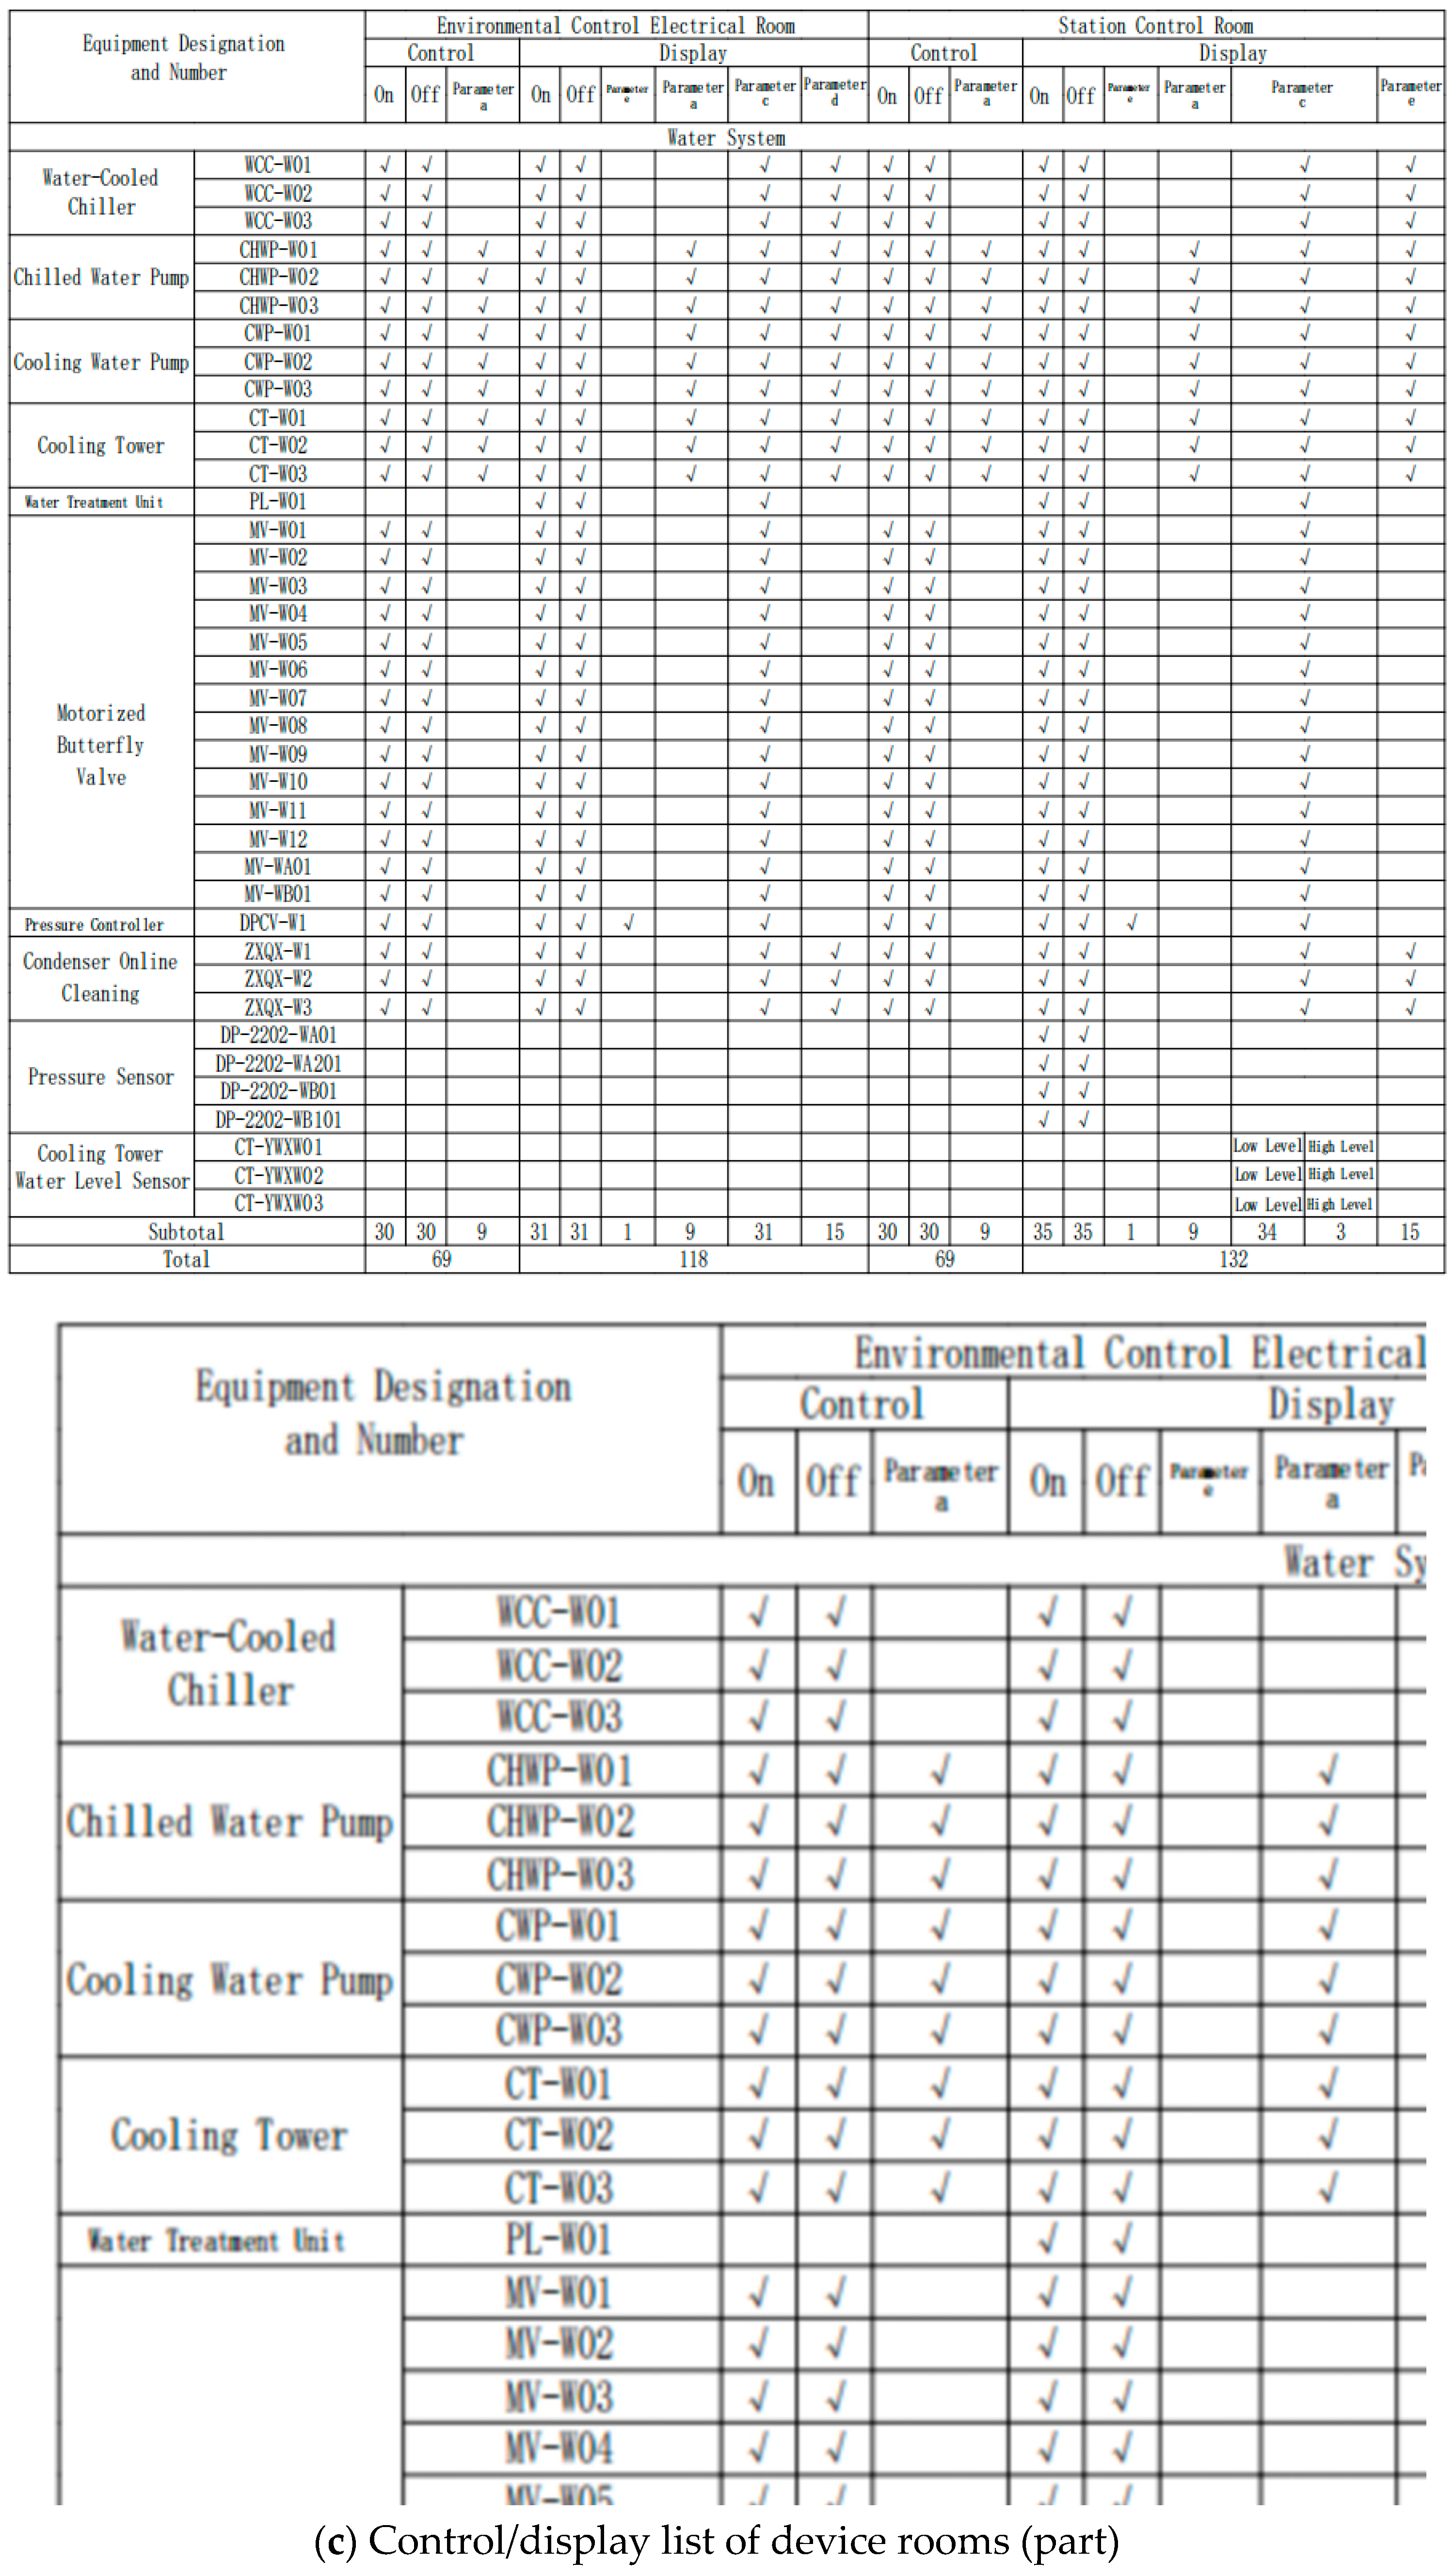
First, based on the equipment topology information extracted from the system diagrams and the control parameter requirements of the public area/device room systems, the control and display parameters for the corresponding equipment are identified, enabling the start/stop switch control for specific devices. The content of a control list is shown in
Figure 5. Typically, the first two columns of the table are the equipment name and corresponding identification number, followed by multiple columns representing equipment control and display scenarios. These scenarios are named using the format: “Location—Status Parameter—Operating Mode 1—Operating Mode 2”. The label √ in the table indicates the device control display scenarios that need to be considered for this type of device.
Subsequently, the corresponding control and display lists are generated. The equipment is sorted based on information such as equipment name and identification number, and this information serves as the left-side header of the control list. The operational states of the equipment control and display scenarios are decomposed into individual components: location, status (control, display), and specific operating modes (on, off, differential pressure alarm, etc.). This decomposed information then forms the top header of the control and display lists. For example, the operational state for a given scenario might be “A-end Environmental Control Electric Room_Control_On_On”, where the location is the A-end Environmental Control Electric Room, the status parameter is ‘Control’, Operating Mode 1 is ‘On’, and Operating Mode 2 is ‘On’. All equipment is traversed; for each piece of equipment, its corresponding operational state for each scenario is located based on the left-side and top headers, and this state is stored in the specified cell of the table. Finally, the generated table is drawn within the CAD drawing.
2.3. Operating Mode Generation
This module aims to automatically generate the operating mode from the recognized system equipment information, loop topology, and room association information, and then render the resulting table in CAD format. In essence, this process converts the topological relationships among devices, loops, and rooms into explicit device control states under different operating scenarios, and finally maps these states into a standardized tabular representation.
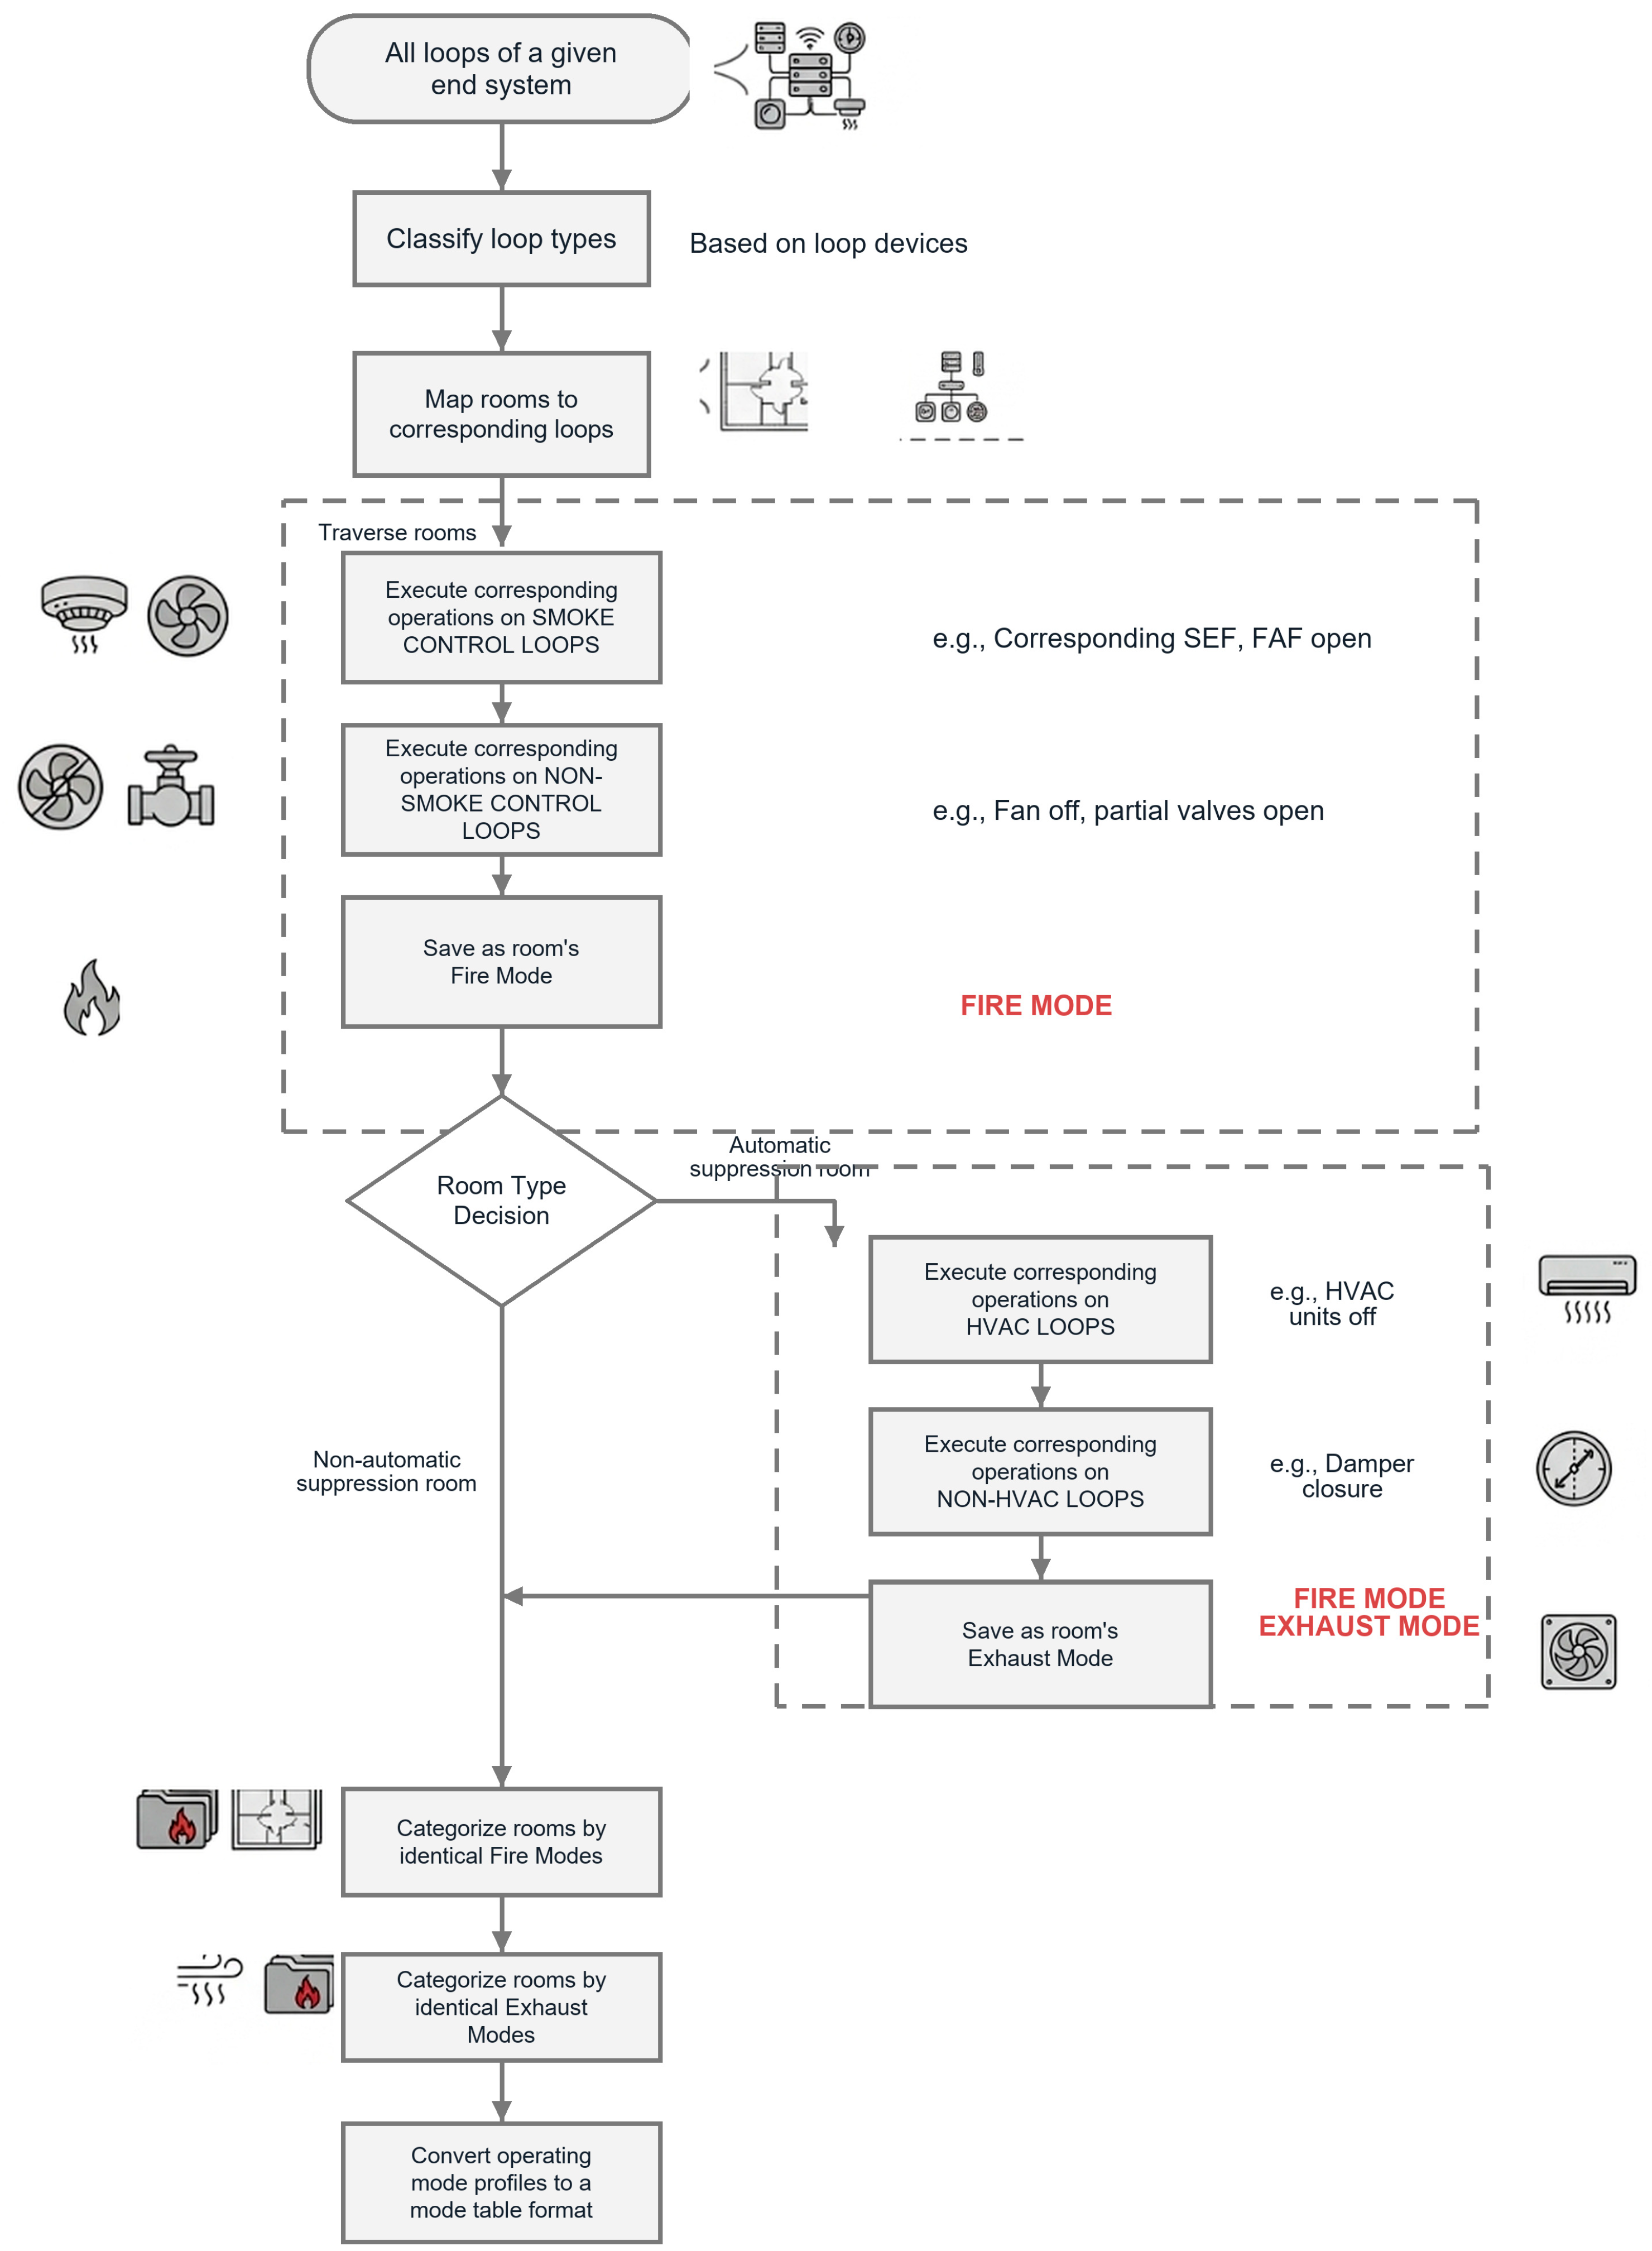
The implementation mainly consists of two sequential tasks. First, operating modes under both normal and special conditions are generated based on the identified equipment, room, and loop information. Second, the generated control states are transformed into the prescribed table format and drawn onto the CAD layout. Among these steps, the main difficulty lies in bridging the gap between topological reasoning and standardized table output. Specifically, the method must determine device actions from loop-level and room-level relationships, aggregate rooms with identical response logic into unified operating modes, and ensure that heterogeneous devices are arranged in a consistent table structure. To address these issues, a structured generation framework is established, as illustrated in
Figure 6. The figure shows the overall workflow for deriving room-level special operating modes from loop and room associations and converting them into mode table entries. On this basis, the method is further divided into table header generation, normal condition mode generation, and special condition mode generation.
2.3.1. Generation of the Table Headers
After all operating modes have been identified, a two-dimensional header structure is constructed for the operating mode. The left-side header is used to organize operating scenarios, whereas the top header is used to organize system devices.
For the left-side header, all operating scenarios are arranged in a fixed order, namely air conditioning mode, ventilation mode, fire mode, and exhaust mode. In this way, the table structure remains stable across different projects and system configurations. Normal operating scenarios are inserted directly according to predefined mode categories, while special operating scenarios are introduced after room-level mode clustering, as described in
Section 2.3.2 and
Section 2.3.3.
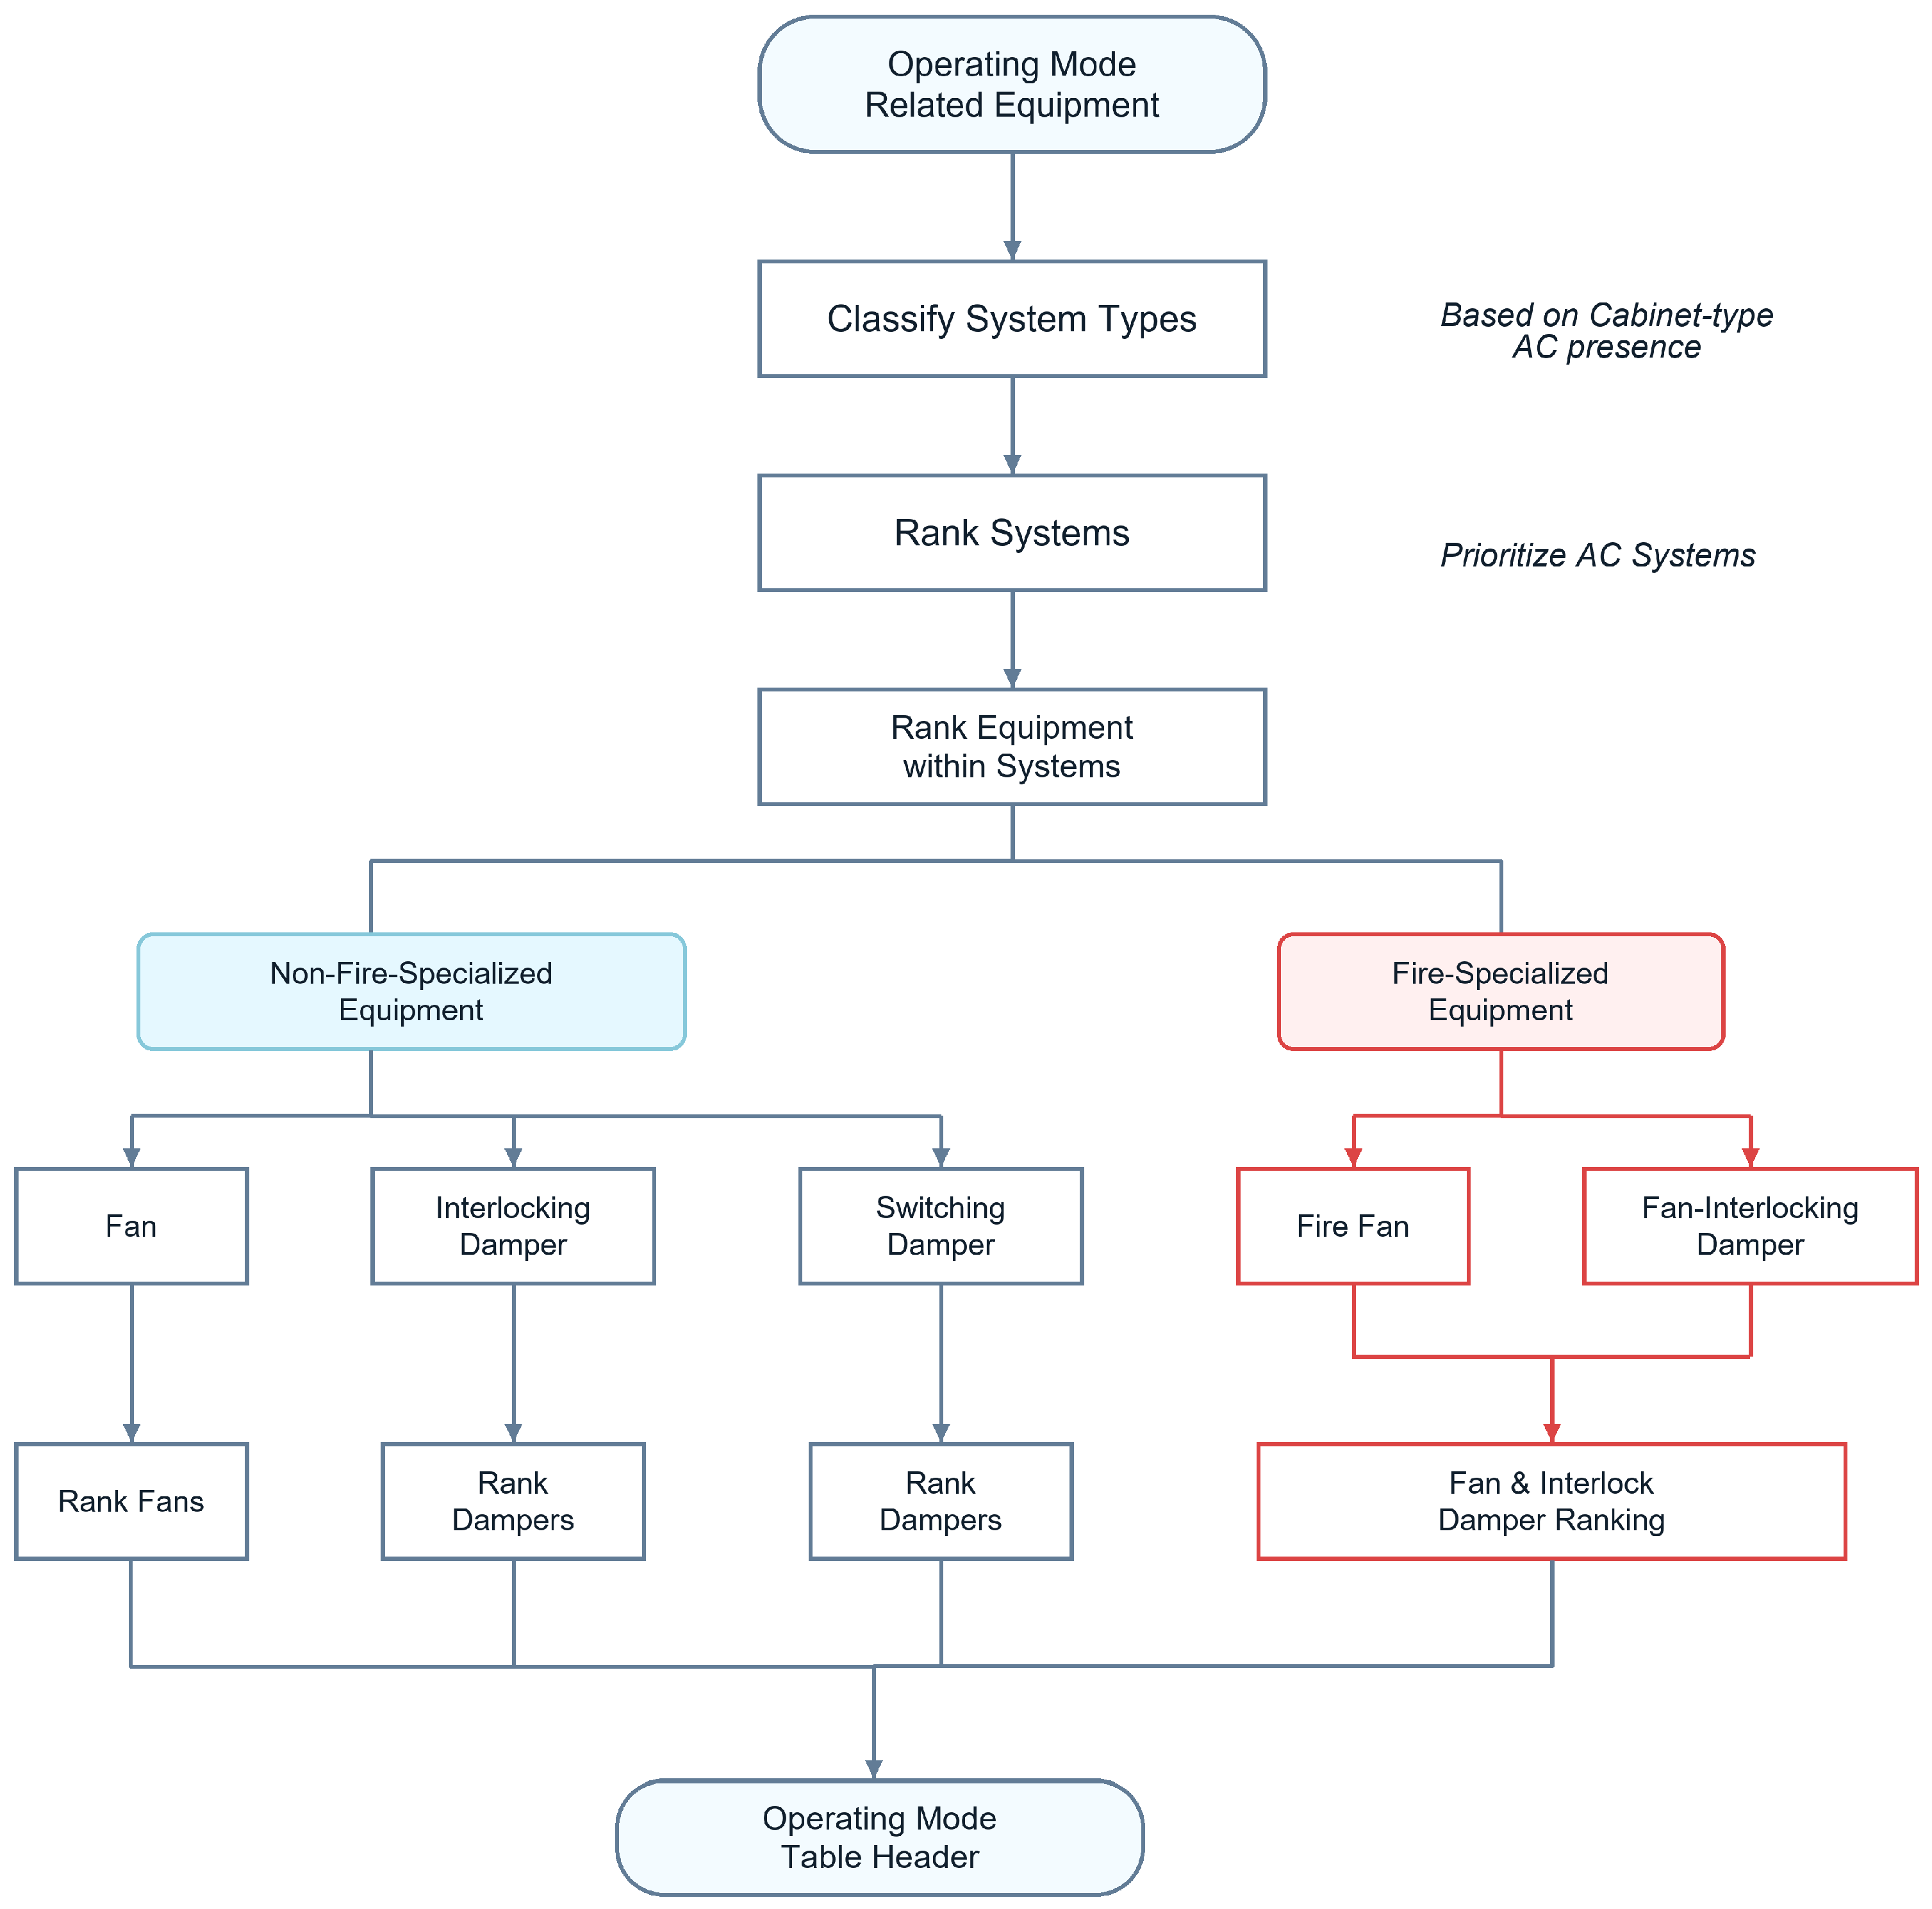
For the top header, the relevant devices participating in operating-mode switching are first extracted. As shown in
Figure 7, the devices are then organized through a hierarchical sorting strategy. The systems are first classified according to system type, for example based on whether a cabinet air conditioner is included. After that, the systems are ordered, with air conditioning systems placed before non-air-conditioning systems. Within each system, the devices are further divided into non-fire-protection devices and fire protection devices. The non-fire-protection devices are further categorized into fans, interlocked dampers, and changeover dampers, whereas the fire protection devices include fire fans and fan-interlocked fire dampers. Devices within each category are then sorted according to system number and equipment identifier. Through this process, the upper header of the operating mode is generated in a standardized and reproducible manner.
The purpose of this header generation step is not only to define the spatial layout of the table, but also to establish a one-to-one correspondence between operating scenarios and controlled devices, thereby providing the indexing basis for subsequent cell filling.
2.3.2. Generation of Operating Modes Under Normal Conditions
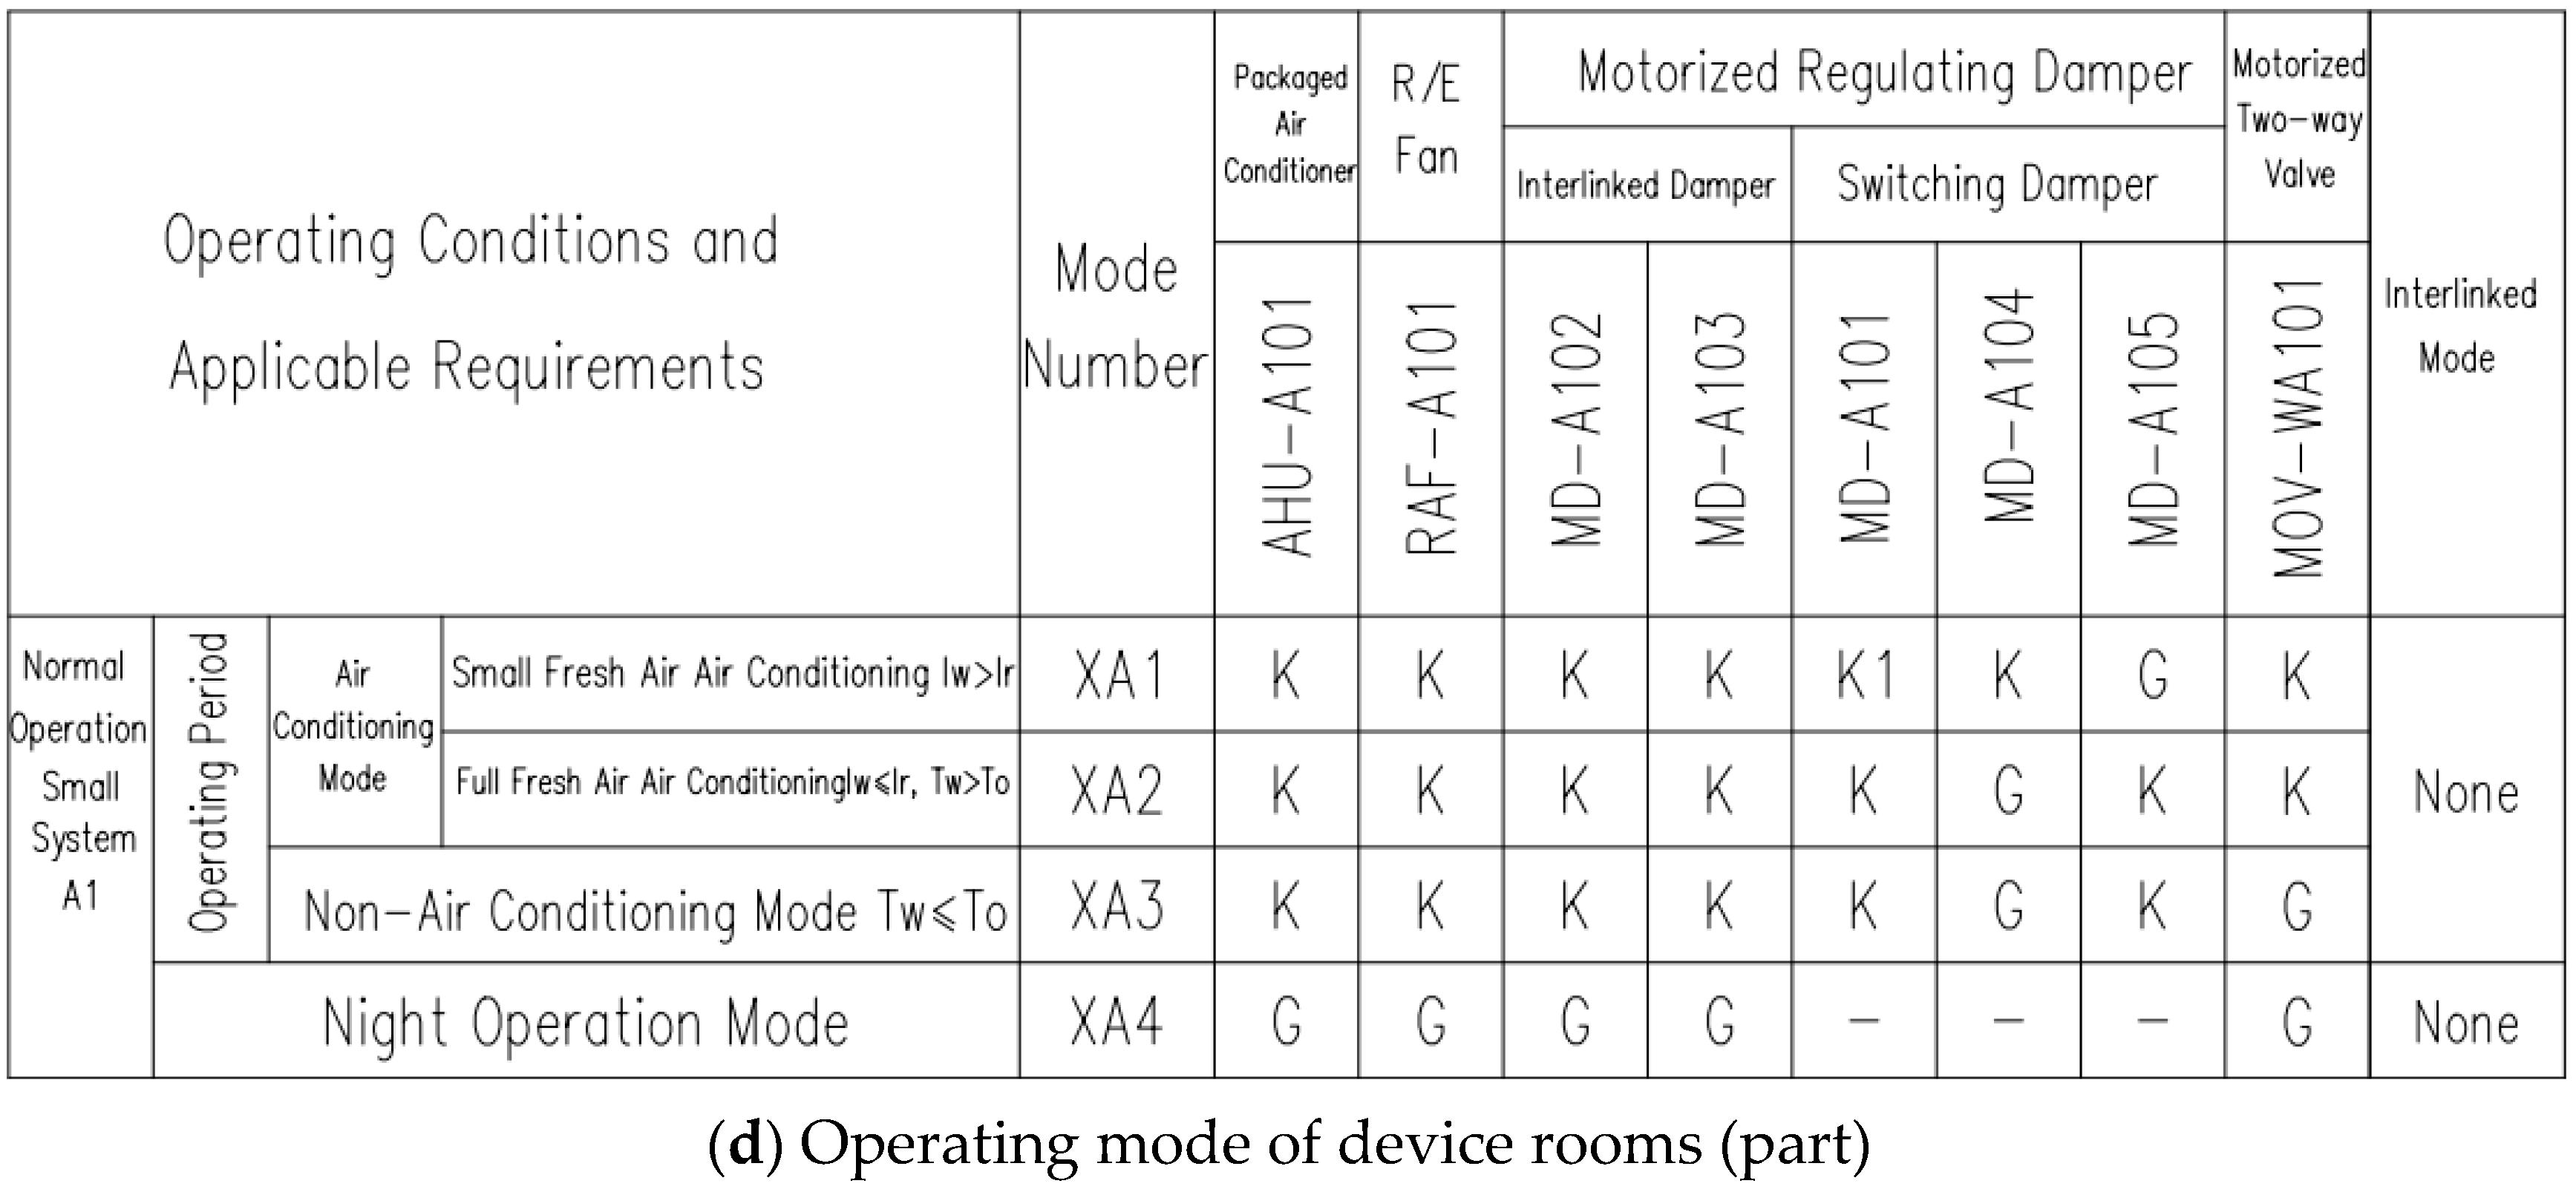
The normal operating modes include air conditioning mode and ventilation mode. Among them, the air conditioning mode is further divided into small fresh air mode, full fresh air mode, and night operation mode. The switching patterns of devices under different normal conditions are summarized in
Table 3.
The generation of normal operating modes follows a rule-based process. For each predefined mode, the control state of each device on the corresponding loops is determined according to the operational requirements of the system. These control states mainly include start/stop commands and, where applicable, the opening or closing status of associated dampers or switching valves. Since the normal modes are defined at the system operation level rather than the room response level, they can be generated directly once the system device information and loop topology have been identified.
Compared with special condition mode generation, the normal condition modes are relatively straightforward because their logical structure is stable and does not depend on room-specific fire response or gas extinguishing requirements. Nevertheless, they provide the baseline operating scenarios of the table and therefore serve as the foundation for the subsequent integration of special modes.
2.3.3. Generation of Operating Modes Under Normal Conditions
Special operating modes include fire mode and exhaust mode. In contrast to normal condition modes, these modes must be inferred from the topological relationships between rooms and loops. Therefore, room-level reasoning and mode clustering are required. The overall procedure is shown in
Figure 7.
First, the loop types are identified according to the equipment contained in each loop, and the correspondence between rooms and loops is established. Then, all rooms in each system loop are traversed one by one. For a given room, device actions on smoke exhaust loops are assigned according to fire control rules, such as starting the corresponding smoke exhaust fan (SEF) and make-up air fan (FAF). Meanwhile, devices on non-smoke-exhaust loops are also assigned their corresponding actions, for example shutting down fans and opening selected dampers when required. The resulting device state set is stored as the fire operating mode of that room.
Next, the room type is examined. If the room is an automatically extinguished room, an additional exhaust operating mode needs to be generated. In this case, corresponding control actions are assigned to devices on the air conditioning loop and on non-air-conditioning loops, and the resulting device state set is stored as the exhaust operating mode of that room. If the room does not belong to this category, only the fire operating mode is retained.
After room-level special modes have been obtained, rooms sharing the same fire operating mode are grouped into one class, and rooms sharing the same exhaust operating mode are grouped into another class. Each class is then regarded as one special operating condition. To distinguish these conditions in the table, each special mode is named using the pattern “all rooms covered by this operating mode + corresponding mode type”. For example, a mode involving the environmental control electrical room and the emergency lighting distribution room is named “Environmental control electrical room and emergency lighting distribution room fire mode”. In this way, room-level response logic is transformed into project-level special operating scenarios that can be directly inserted into the operating mode.
After both normal and special operating modes have been generated, the control states are mapped into the prescribed table format. Specifically, the row positions are determined from the left-side header, and the column positions are determined from the top header. By traversing all operating modes and all relevant devices, the control action of each device under each operating condition is written into the corresponding cell. The completed table is then output and drawn in CAD format.
3. Application Case
Based on the automated process drawing generation method proposed in this study, a Python3.9-based digital design software tool was developed and tested in the engineering project environment of the industry partner.
This application case was designed as a single-project feasibility validation of the proposed workflow in a real engineering environment, rather than as a statistical generalization assessment across different subway station projects. A metro station in Guangzhou was selected to examine whether the proposed method could complete the end-to-end process from CAD system diagram recognition to structured information extraction and process drawing generation under actual project conditions. The results show that the entire process can be completed in approximately 50 s.
3.1. System Diagram Loading and Information Extraction Results
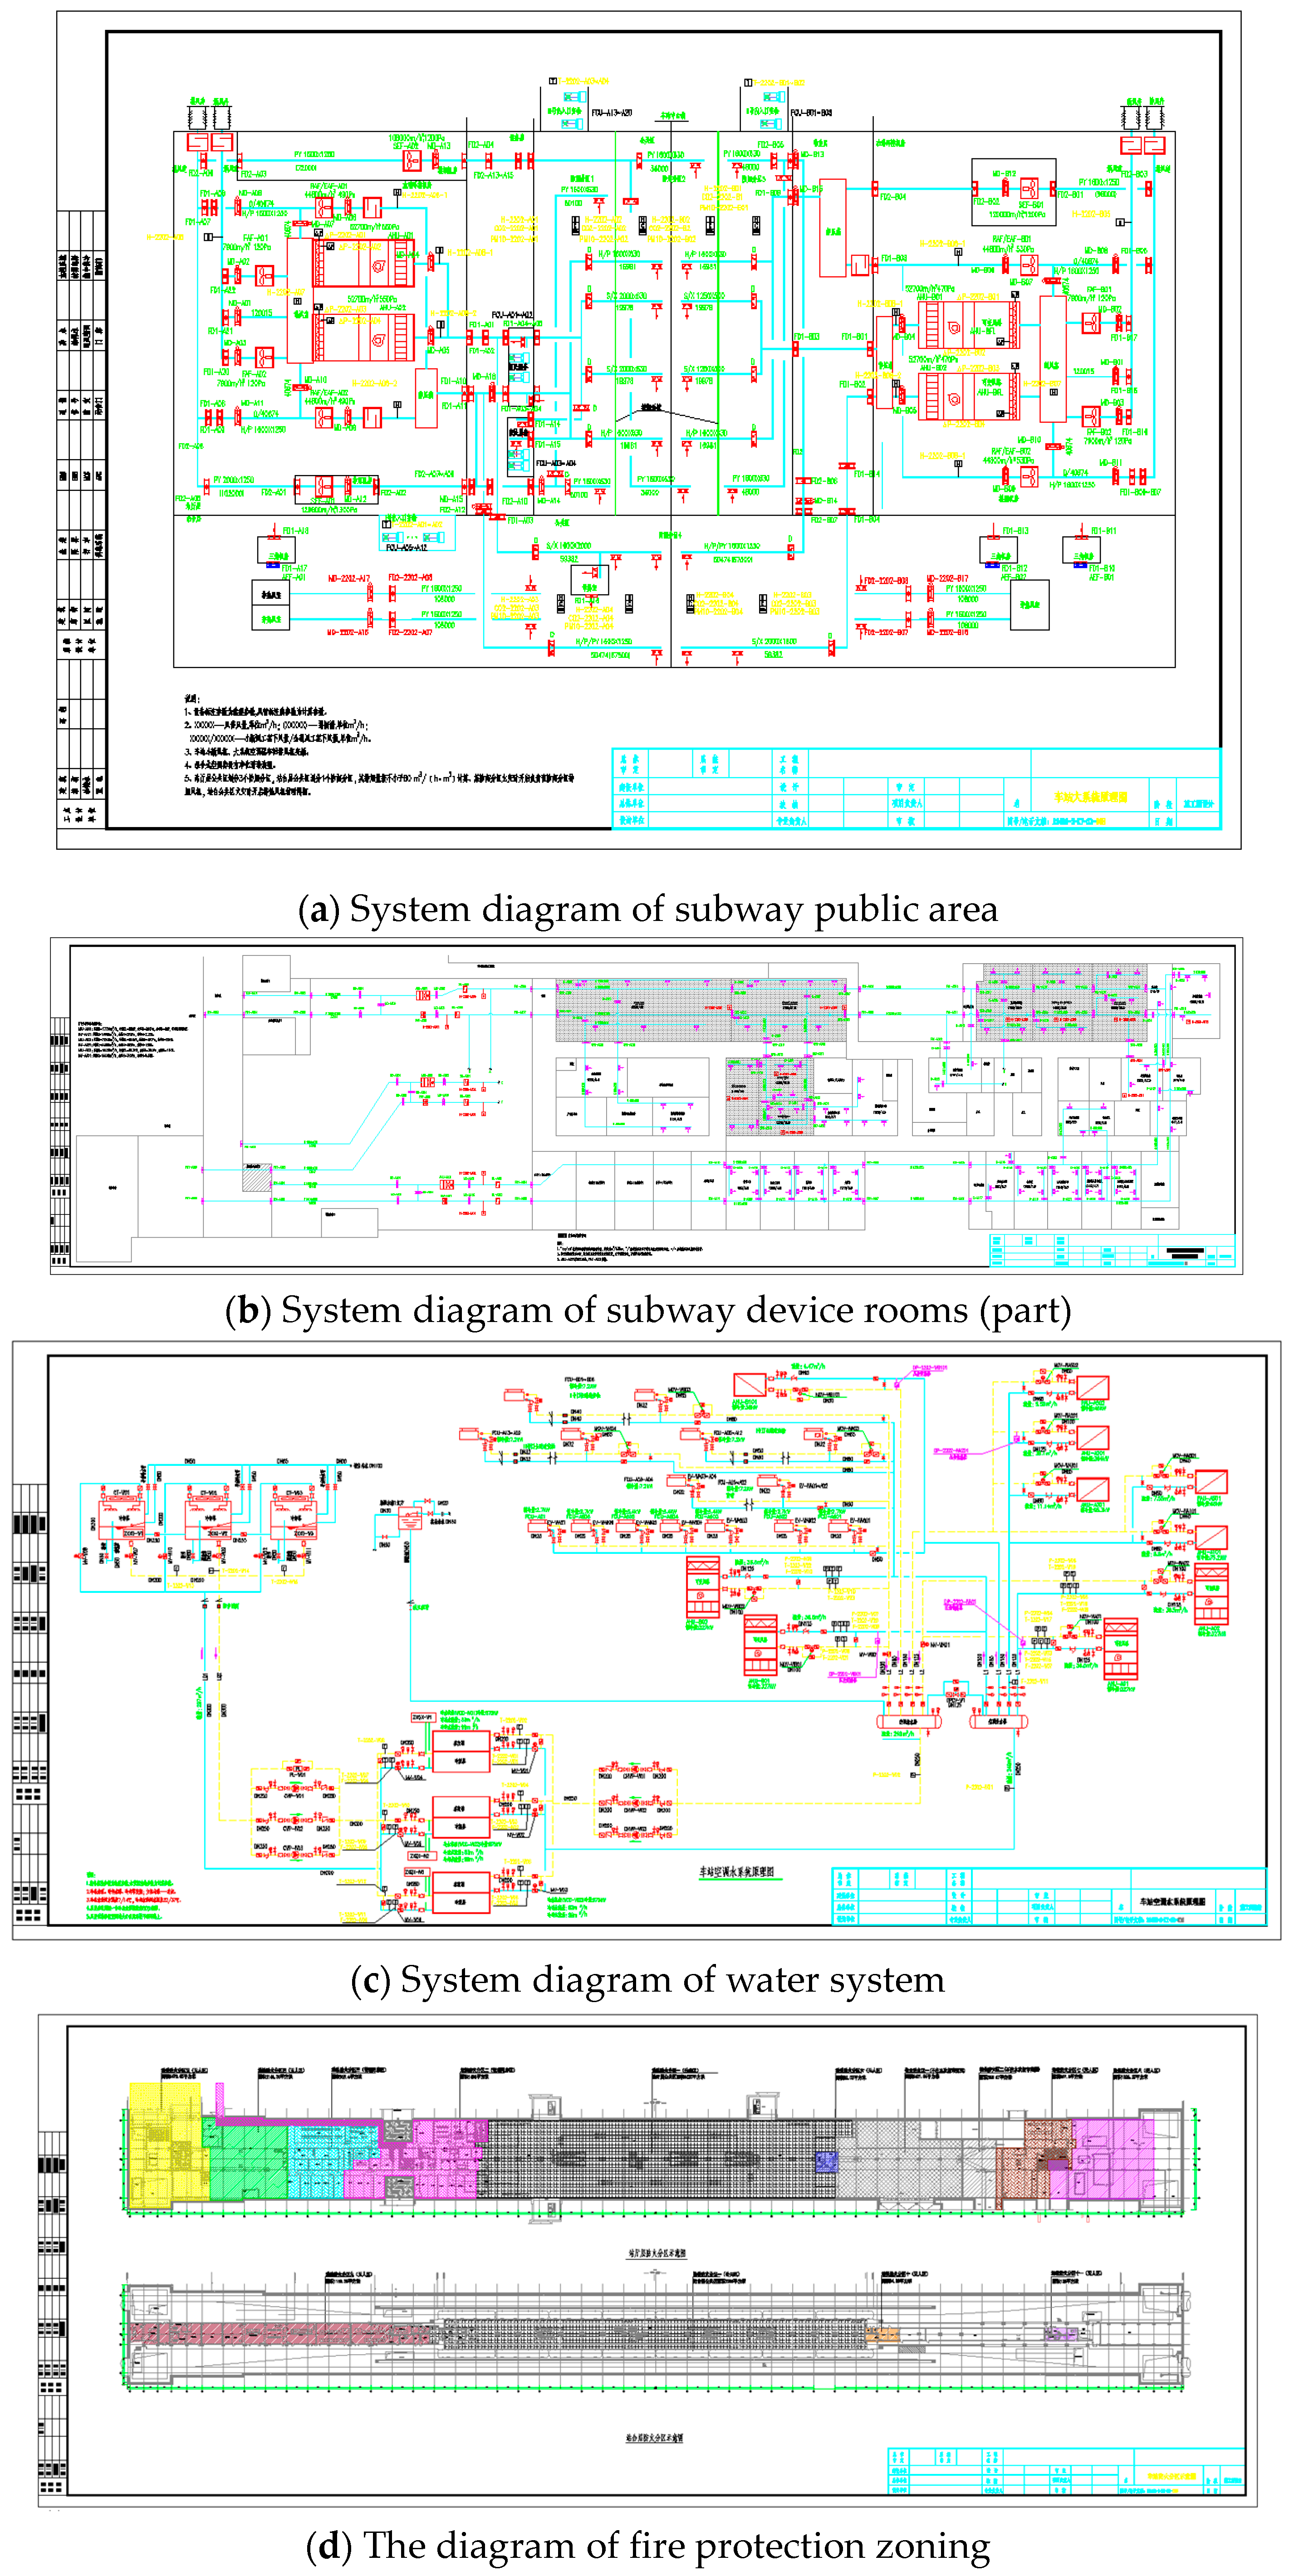
Figure 8 illustrates several system diagrams loaded by the developed software, including the system diagrams of the public area system, device room system, and water system, together with the fire compartment and smoke compartment layout diagrams. In the system diagrams, pipelines, equipment, and equipment annotation information are highlighted in blue, red, and green, respectively. In the fire compartment layout diagram, different colors are used to distinguish different fire protection zoning.
After loading the ventilation and air conditioning system diagrams for this station, a total of 10 fire protection zoning, 9 smoke compartments, 969 equipment items, 347 rooms, and 34 loops were identified. Based on the recognized and extracted drawing information, the topological structure information for the equipment, rooms, and loops was automatically generated.
To evaluate the equipment recognition and matching results in this case, a ground truth dataset was established by manually checking the original CAD system diagrams and the corresponding project design documents. All 969 equipment items involved in this project were reviewed item by item. The manual review was conducted by the manuscript authors using the original CAD system diagrams and the corresponding project design documents. Because the reviewers were also familiar with the software development and the engineering case, this review should not be regarded as an independent third-party validation. This limitation is acknowledged in the discussion of study limitations. A recognition result was regarded as correct when the equipment block was detected and its equipment type, number, and drawing position were consistent with the manually reviewed information. A matching result was regarded as correct when the textual annotation was assigned to the corresponding equipment block without ambiguity.
It should be noted that this validation was conducted within a single engineering project. The equipment categories involved in the test were limited to the device types covered in this paper, and many equipment items appeared repeatedly with similar graphical symbols and annotation patterns. Under these tested conditions, no missed equipment items or mismatched annotations were found in the manual review. This result indicates that the proposed recognition and matching procedure worked correctly for the equipment categories and drawing patterns included in this case, but it should not be interpreted as evidence of general recognition performance across all subway station projects or all possible equipment types.
3.2. Automated Generation of Process Drawing
Figure 9 presents the automatically generated results for the control and display lists and the operating modes of the public area and device room systems, respectively. The results are saved in CAD drawing format. In the tested case, the automatic generation process was completed in approximately 50 s on average over multiple runs. This runtime indicates that the proposed workflow is computationally feasible for the tested project scale. However, because no controlled comparison with manual drafting was conducted, the result should not be interpreted as a statistically verified efficiency improvement. The total automatic generation time was further divided according to the main workflow stages. In this case, drawing recognition required approximately 20 s, topology generation required approximately 8 s, and CAD-based table drawing required approximately 22 s, resulting in a total generation time of about 50 s.
To improve the readability of the generated drawing,
Table 4 explains selected parameter and equipment labels marked in
Figure 9a,c.
To provide a case-level evaluation of the proposed workflow, the generated results were examined from four aspects: drawing information extraction, equipment–annotation matching, process drawing generation, and computational time. For drawing information extraction, the automatically identified fire protection zones, smoke compartments, equipment items, rooms, and loops were compared with the manually reviewed information from the original CAD drawings and project design documents. For equipment–annotation matching, each recognized equipment item was checked against its corresponding graphical block and textual annotation. For process drawing generation, the generated control/display lists and operating mode tables were checked against the predefined rule library and the engineering drawing requirements used in the project. For computational time, the runtime of the main workflow stages was recorded, including drawing recognition, topology generation, and CAD-based table drawing.
The evaluation results are descriptive because only one engineering project was available for validation. In this case, the proposed workflow successfully processed 10 fire protection zones, 9 smoke compartments, 969 equipment items, 347 rooms, and 34 loops, and generated the corresponding process drawings in approximately 50 s. No missed equipment items or mismatched equipment annotations were found during the manual review under the tested drawing conditions. However, because the validation dataset was limited to one project and mainly contained repeated instances of the equipment categories covered in this study, statistical variability, cross-project robustness, and performance on unseen equipment types could not be evaluated.
4. Discussion
This study proposed an automated design method for subway station ventilation and air conditioning process drawing and established an end-to-end framework integrating system diagram recognition, structured information extraction, control/display list generation, and operating mode schedule generation. The results show that the automatic generation of subway HVAC process drawing can be effectively decomposed into three core tasks, through which heterogeneous CAD entities are transformed into structured loop–equipment–room relationships and then further converted into standardized engineering deliverables.
This study further demonstrates that system diagram recognition is the prerequisite for automatic process drawing generation and also one of its main technical bottlenecks. On this basis, the generation of control/display lists and operating mode schedules can be achieved through rule-driven reasoning based on equipment attributes, loop topology, room associations, and operating logic. Therefore, the proposed method provides a feasible technical route for reducing repetitive manual drafting operations and enhancing the standardization and consistency of subway HVAC process drawing deliverables under the tested project conditions.
The application to a Guangzhou subway station provides evidence of the practical feasibility of the proposed framework within the tested project conditions. The developed software successfully identified 10 fire protection zones, 9 smoke compartments, 969 equipment items, 347 rooms, and 34 loops, and completed the generation of process drawings within approximately 50 s to 1 min. These results indicate that the proposed workflow can operate end to end in a real engineering environment. However, because the validation was conducted using one completed engineering project, the results should be interpreted as a single-project feasibility validation rather than as evidence of general performance across different subway station projects.
Compared with conventional manual drafting and general BIM/CAD-based automation methods, the proposed framework has several practical advantages. First, it directly processes 2D CAD drawings, which are still widely used in subway station engineering practice. Second, the rule-based generation process is interpretable and can be checked by engineers. Third, the generated CAD-based tables can be integrated into existing design workflows.
Several limitations should be noted. First, the current validation is based on a single completed engineering case. Although this case demonstrates the feasibility of the proposed workflow under real project conditions, the robustness of the method across different station layouts, drawing standards, annotation styles, incomplete CAD inputs, and project-specific rule libraries has not yet been comprehensively evaluated. In addition, because the validation dataset mainly contained repeated instances of the equipment categories covered in this study, the result should be regarded as a case-specific verification of the implemented recognition and matching rules rather than a comprehensive test of recognition robustness for unseen device types or highly diverse annotation styles. Therefore, the results should be interpreted as a single-project feasibility validation rather than as evidence of general performance across different subway station projects.
Second, the current method still depends on the standardization level of the input CAD drawings. The drawing layers, block names, annotation formats, leader line styles, and room boundary representations need to follow relatively consistent drafting rules. When the input drawings contain non-standard layers, missing annotations, inconsistent block definitions, or incomplete room boundaries, additional preprocessing or manual checking may be required.
Third, the current framework mainly takes 2D CAD drawings as the input and does not yet support the direct import of BIM models. Although BIM models can provide richer semantic and spatial information, the interface between BIM models and the proposed rule-based generation framework still needs to be developed in future work, especially in terms of IFC-based data extraction, equipment semantic mapping, and topology conversion.
Fourth, the reasoning efficiency may decrease when the method is applied to large interchange stations with multiple HVAC loops and complex linkage working conditions. In such cases, the number of rooms, equipment items, loops, and interlocking rules increases substantially, which may enlarge the search space for operating mode generation and rule matching.
Fifth, because only one project was used for validation, the present study cannot provide statistical treatment of variability or a cross-project baseline comparison. A strictly controlled comparison with manual drafting time was also not available in this study. In the actual engineering project, the design scheme was repeatedly adjusted, and each designer was responsible for multiple tasks simultaneously. Therefore, the manual drafting time for the same process drawing could not be accurately separated from the overall project workload. Future work will conduct controlled manual versus automatic drafting comparisons under fixed input conditions and include multiple projects to further quantify the productivity improvement and robustness of the proposed method.
Due to the intellectual property and confidentiality requirements of the industry partner, the implementation-level source code, proprietary rule library, and detailed engineering parameters cannot be fully disclosed. Nevertheless, the main workflow, input-output relationships, key matching logic, and rule-based generation process are described to support methodological understanding and future reproduction under similar engineering conditions.
5. Conclusions
This study proposed an automated design method for subway station ventilation and air conditioning process drawings. The proposed framework converts 2D CAD system diagrams into structured equipment–room–loop topology information and further generates control/display lists and operating mode tables through rule-based reasoning and CAD-based table drawing. Compared with conventional manual drafting workflows, the framework provides an integrated technical route from system diagram recognition to process drawing generation.
The case study of a Guangzhou metro station demonstrated the feasibility of the proposed method. The software tool identified 10 fire protection zones, 9 smoke compartments, 969 equipment items, 347 rooms, and 34 loops from the input drawings, and automatically generated the corresponding process drawings in approximately 50 s. The recognition results were checked against manually reviewed drawing information, and the rooms, equipment items, and loops involved in the case were correctly identified under the conditions of this project.
The practical significance of this work lies in providing a structured workflow that may reduce repetitive manual drafting operations, improve the consistency of process drawing deliverables, and support the standardization of subway HVAC design workflows under similar project conditions. The proposed framework can provide engineering support for generating control/display lists and operating mode tables from structured drawing information, thereby helping designers focus more on rule checking, engineering judgment, and system optimization.
Future research will extend the validation to multiple subway station projects with different station layouts, drawing standards, annotation formats, system configurations, and rule library requirements. Further work will also focus on BIM/IFC data integration, robustness improvement for non-standard CAD drawings, optimization of rule reasoning, and controlled comparisons between manual drafting and automatic generation.