


Abstract
In situ-reconstruction and expansion of existing tunnels in complex urban areas involve simultaneous construction and traffic operation, while pre-existing structural defects may further amplify deformation and safety risks under excavation disturbance. To address this issue, this study develops a dynamic deformation-risk assessment framework for the traffic-bearing side of reconstructed tunnels by integrating defect-induced structural deterioration, excavation-stage deformation responses, and cloud-model-based uncertainty characterization. A three-dimensional finite-difference model was established for an in situ-tunnel reconstruction project in China, in which an elastic modulus weakening coefficient was introduced to represent the mechanical deterioration associated with existing defects. Field monitoring was used to validate the numerical model. At an excavation advance of 47.0 m, the measured and simulated crown settlements were 2.40 and 2.73 mm, respectively, with a relative deviation of 13.75%, while differences at more than 80% of the excavation nodes were within 1 mm. The dynamic assessment showed that the membership degrees of crown settlement and clearance convergence to Grade 2 were 0.418 and 0.406, respectively, with neither indicator entering the Grade 4–5 high-risk range. Clearance convergence entered Grade 2 earlier during excavation and was therefore identified as a priority monitoring indicator for subsequent construction. Numerical simulation was used to obtain and validate the excavation-induced deformation responses, whereas the cloud model was used to classify the corresponding dynamic risk state; no independent long-term deformation forecasting was performed in this study.
1. Introduction
The improvement and development of urban transportation systems are essential for rapid urban economic growth. In China, both the number and total scale of tunnels rank among the highest in the world. However, with the continuous increase in traffic volume in recent years, together with structural aging and frequent defects in a large number of existing tunnels, the reconstruction, expansion, and renewal of urban tunnels and other transportation infrastructure have become increasingly necessary.
Tunnel reconstruction and expansion in complex urban areas can induce deformation of adjacent buildings and structures and may even cause structural damage [1]. From the perspective of tunnel mechanical behavior, excavation disturbs the original stress equilibrium of the existing tunnel, leading to deformation and damage accumulation in the surrounding rock, increased internal forces in the supporting structures, and reduced structural stability. During long-term service, the tunnel lining is subjected to coupled effects such as hydrochemical corrosion, temperature–humidity cycles, sustained surrounding-rock loads, reinforcement corrosion, and construction deficiencies. These effects may result in observable defects, including lining cracks, looseness, voids behind the lining, and local water leakage, together with gradual deterioration of structural stiffness and load-bearing capacity [2]. The presence of such defects in the traffic-bearing tunnel weakens its restraint and load-sharing capacity, making deformation amplification and risk accumulation more likely under construction disturbance. Without dynamic assessment and timely warning, structural damage may further develop, operational safety may decline, and construction organization and traffic maintenance may be adversely affected. Therefore, the effects of existing tunnel defects should be incorporated into the dynamic risk assessment of the traffic-bearing side to support structural safety, traffic continuity, and whole-process construction risk control.
Various risk assessment methods have been widely investigated by scholars at home and abroad and have been maturely applied in engineering practice. Common methods include the expert experience method and the analytic hierarchy process (AHP). Panchal et al. used the AHP method to investigate the risk factors that lead to landslide hazards along highways [3]. Ning Xuefeng et al. established a safety assessment index system for energy storage power stations and proposed a comprehensive assessment method based on improved AHP-TOPSIS, enabling horizontal comparison among energy storage power station schemes [4]. Lyu et al. integrated ANP into a geographic information system and improved ANP analysis by determining the range scores of assessment factors for evaluating flood susceptibility in coastal cities [5].
However, conventional assessment methods are generally limited to improvements in assessment techniques and rarely investigate risk from its essential attributes, such as objectivity and randomness. In fact, risk assessment is highly subjective and has randomness, fuzziness, and unpredictability [6]. The cloud model transforms qualitative concepts into three numerical characteristics, namely expectation Ex, entropy En, and hyper-entropy He, through a cloud generator. It realizes the mapping between qualitative and quantitative samples and uses quantitative concepts to reflect qualitative concepts [7]. Therefore, it is a method capable of quantitatively transforming qualitative factors while integrating fuzziness and randomness. Yang Zitong et al. applied a cloud-model-based risk assessment method for embankment engineering to the Qinhuai River embankment project in Nanjing and verified its effectiveness [8]. Wang et al. proposed a water-inrush risk assessment method for karst tunnel excavation based on the normal cloud model, combined weighting methods with the cloud model, and verified its accuracy and practicality through a case study [9]. Yang et al. proposed a cloud-model-based method for risk assessment of mountain torrent disasters, in which AHP and the entropy weight method were combined to determine index weights and the method was applied to risk assessment of mountain torrent disasters in Guizhou [10]. Recent studies have further extended uncertainty-based and data-driven risk assessment methods to tunnel construction and existing underground structures. Sun et al. [11] developed a dynamic risk early-warning system for tunnel construction based on a two-dimensional cloud model, enabling construction risk to be updated using dynamically changing environmental and construction information. Chen et al. [12] integrated a trapezoidal cloud model with a Bayesian network to assess the safety risk of shield tunneling beneath existing tunnels and performed forward reasoning, sensitivity analysis, and reverse diagnosis of multiple risk factors. Qiu et al. [13] proposed a multisource information-fusion framework combining probabilistic machine learning, cloud modeling, evidential reasoning, and Monte Carlo simulation for tunnel water-inrush risk assessment. More recently, Xu et al. [14] introduced a cloud-theory-based improved FAHP model for evaluating the risk of existing tunnels affected by adjacent foundation-pit construction, explicitly considering hydrogeological conditions, construction disturbance, and tunnel structural capacity. These studies demonstrate a clear trend toward dynamic, uncertainty-aware, and multi-source-data-driven risk assessment in tunnel engineering.
Nevertheless, several limitations remain in the existing studies. First, conventional multi-criteria assessment methods are generally more suitable for risk screening or evaluation at a specific engineering state, whereas their ability to characterize the continuous evolution of structural response during staged tunnel reconstruction remains limited. Second, although recent studies have extended cloud-model-based approaches to dynamic tunnel construction risk, shield tunneling beneath existing tunnels, multisource construction information fusion, and existing-tunnel risk under adjacent excavation, these methods mainly introduce risk information through indicator weighting, probabilistic inference, or direct transformation of risk-factor data. The mechanical pathway through which pre-existing structural deterioration affects excavation-induced responses and is subsequently transmitted to the final dynamic risk state has received comparatively less attention. Third, for in situ-tunnel reconstruction and expansion, the existing structure remains in service while being subjected to renewed excavation disturbance. The coupled relationship among pre-existing defects, structural stiffness degradation, time-varying deformation, and uncertainty in risk classification has therefore not yet been sufficiently incorporated into a unified assessment framework.
Accordingly, this study aims to develop a dynamic risk assessment framework for the traffic-bearing side of tunnel reconstruction and expansion that explicitly considers the deterioration effect of existing tunnel defects. Based on an in situ-reconstruction and expansion project in China, the specific objectives are to (1) establish a three-dimensional numerical model in which an elastic modulus weakening coefficient is introduced to represent defect-induced structural deterioration and validate the calculated deformation responses against field monitoring data; (2) characterize the evolution of crown settlement and clearance convergence throughout the staged excavation process; and (3) integrate the excavation-stage deformation responses with a cloud model to quantify the deformation-related dynamic risk state of the traffic-bearing tunnel and identify the key indicators requiring priority control. Through these steps, this study seeks to bridge the gap between defect-induced structural deterioration analysis and dynamic risk assessment during tunnel reconstruction and expansion. It should be noted that the normal cloud-model algorithm itself is an established method; the methodological contribution of this study lies in coupling it with defect-informed and field-validated mechanical responses. Compared with direct threshold-based classification, the proposed framework retains the engineering thresholds while using risk memberships to characterize the uncertainty and gradual transition of structural states near adjacent risk-grade boundaries.
2. Materials and Methods
2.1. Project Overview
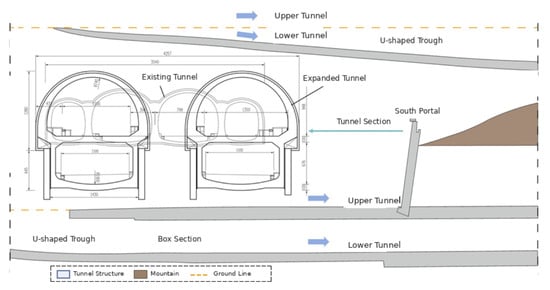
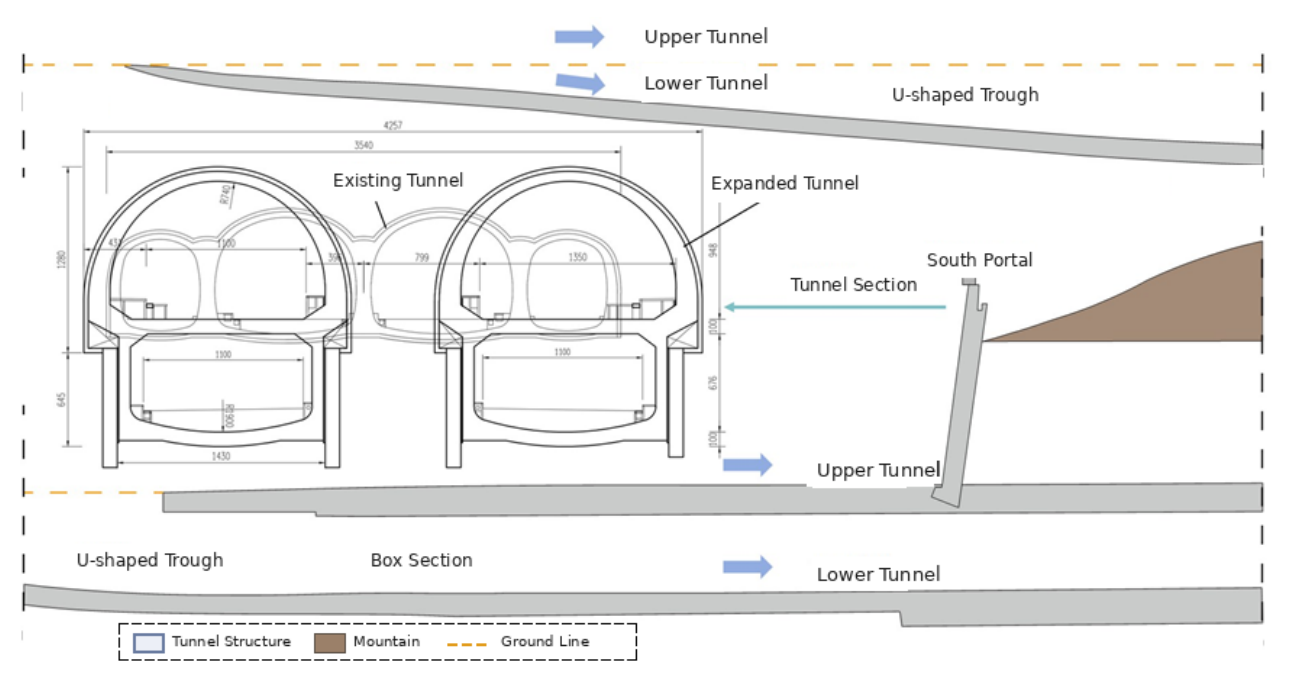
The existing tunnel is a four-arch tunnel with a total length of 200.5 m and a total span of 35.4 m. The first 124 m from the entrance is a straight section, while the remaining 76.5 m is a curved section, including a 60 m transition curve and a 16.5 m circular curve. The tunnel has a one-way longitudinal slope of −0.532%. As shown in Figure 1, the reconstruction and expansion scheme involves demolishing the existing tunnel and constructing a new double-deck tunnel in situ. The upper deck is a mined tunnel with a maximum burial depth of 15 m. The lower deck consists of an open-cut U-shaped trough section, a rectangular tunnel, and a mined tunnel, with a length of 423.7 m for the left tube and 427.5 m for the right tube. The construction scope includes tunnel demolition and expansion, road reconstruction, excavation and support of the U-shaped trough foundation pit, and related works.
Figure 1.
Cross-section of the widened tunnel.
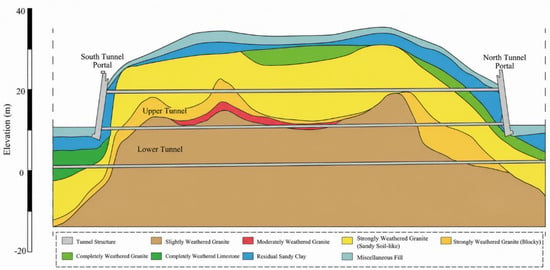
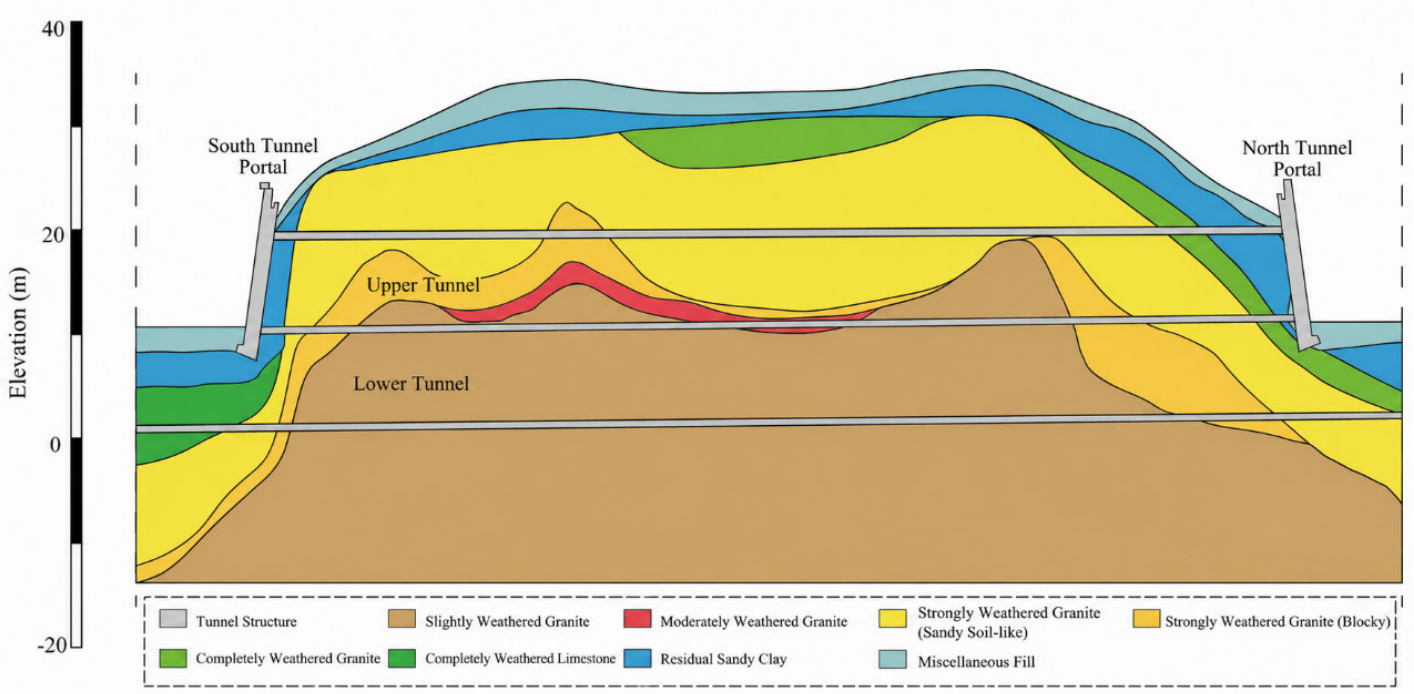
No active fault zone exists within the tunnel reconstruction and expansion area. The joints and fissures developed in the bedrock are secondary structures, and no evidence of neotectonic activity was observed at the site. As shown in Figure 2, the strata at the site mainly include miscellaneous fill, silty clay, strongly weathered granite, moderately weathered granite, and slightly weathered granite. The excavation sections of the U-shaped trough and box tunnel are located in the fill layer, whereas the mined tunnel section is located in weathered granite, with surrounding rock classified as Grade V. No adverse geological conditions were found. However, steep scarps exist at the north and south portals of the tunnel, and a geological hazard slope is present on the east side of the south portal.
Figure 2.
Geological profile of the tunnel.
2.2. Basic Conditions of Tunnel Defects
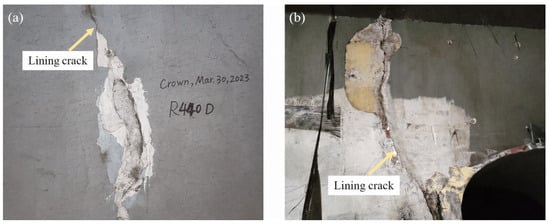
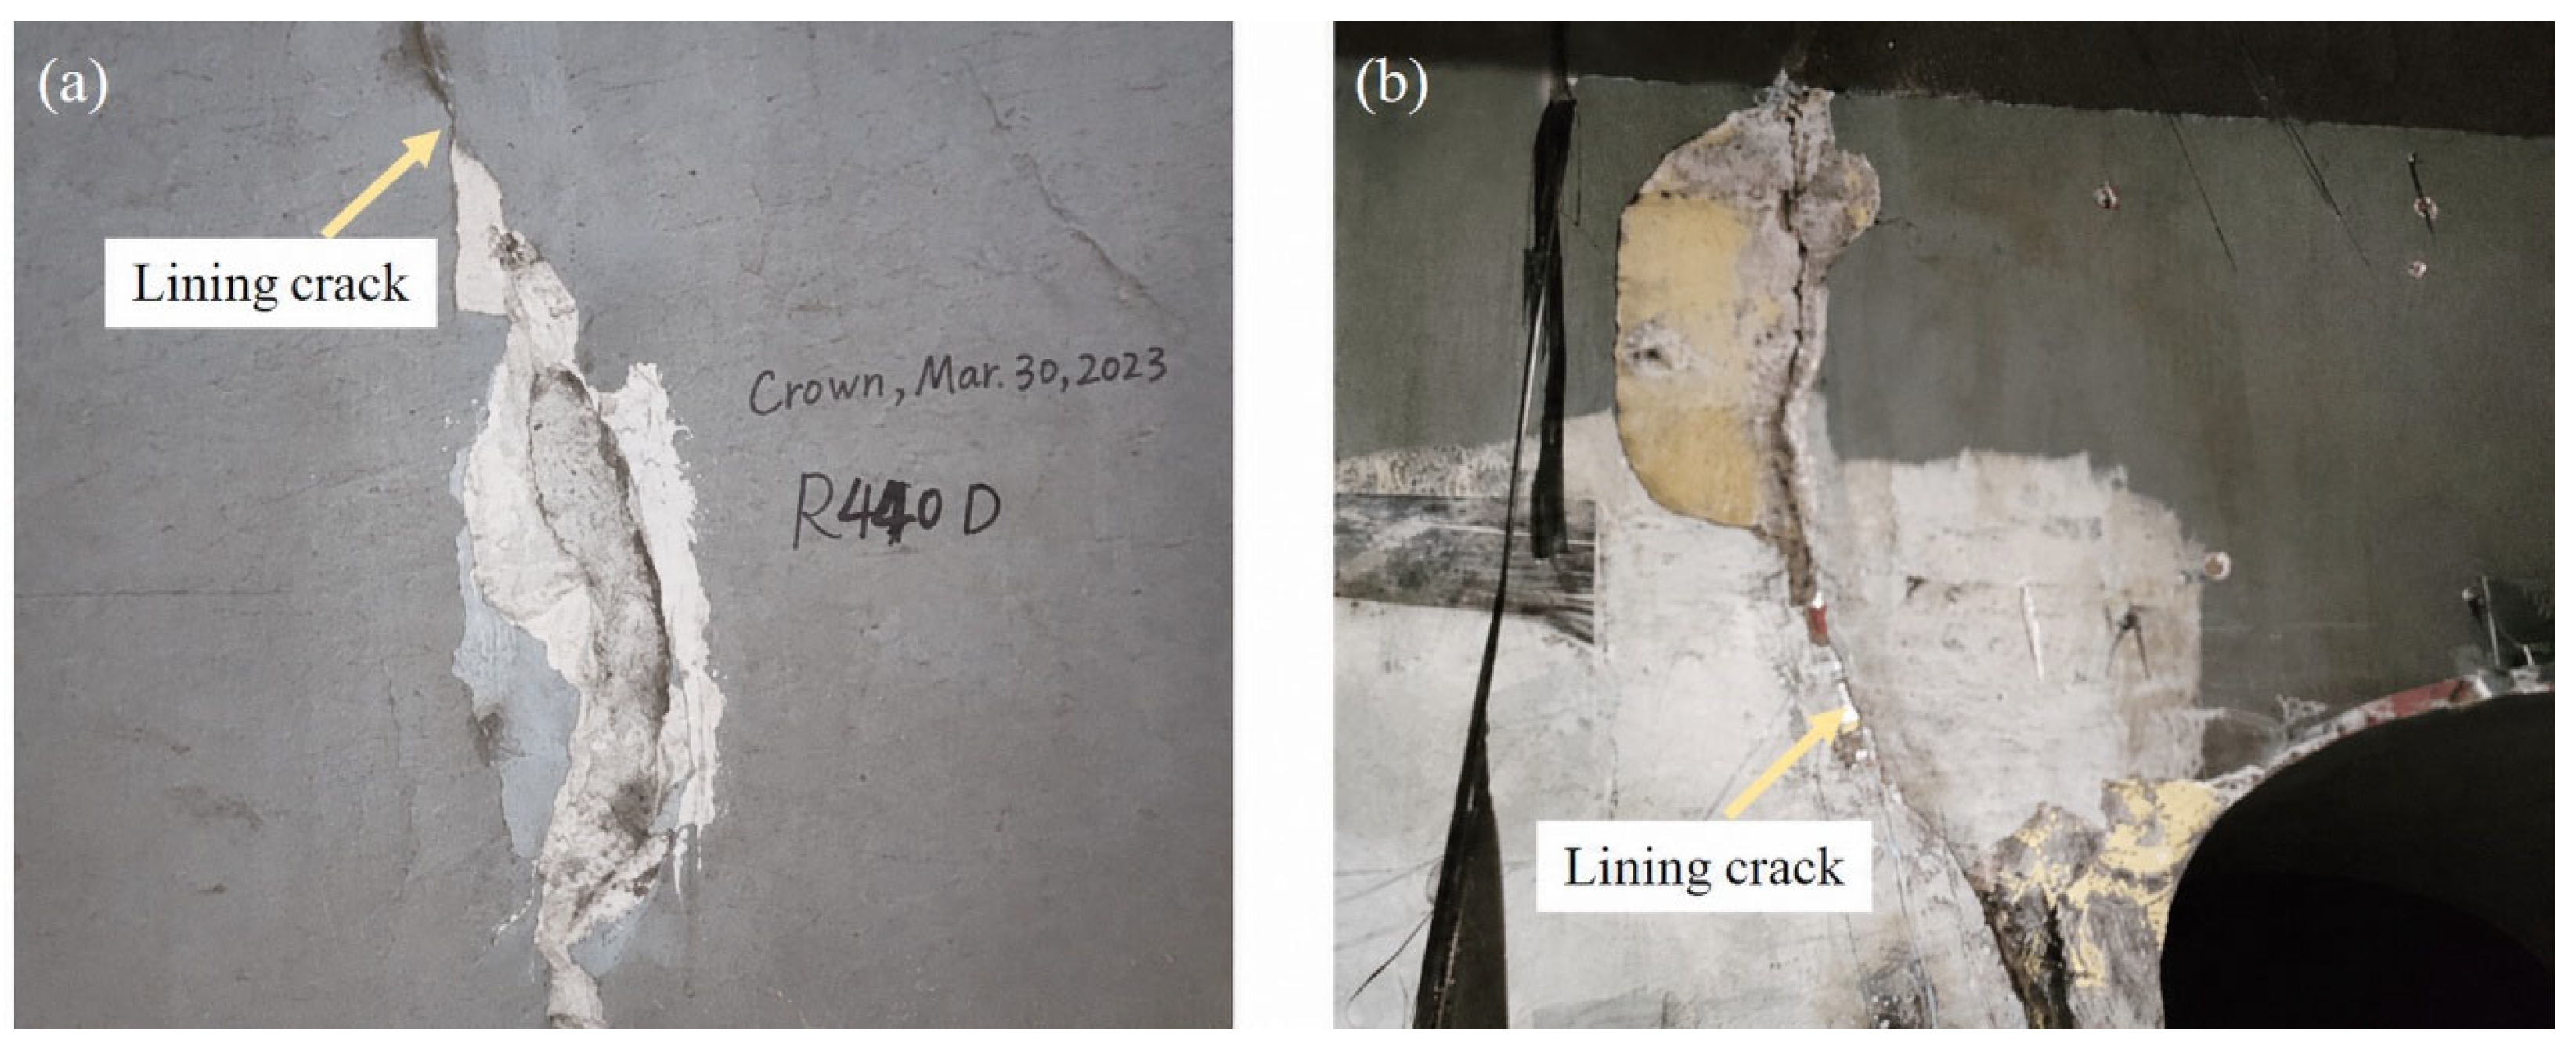
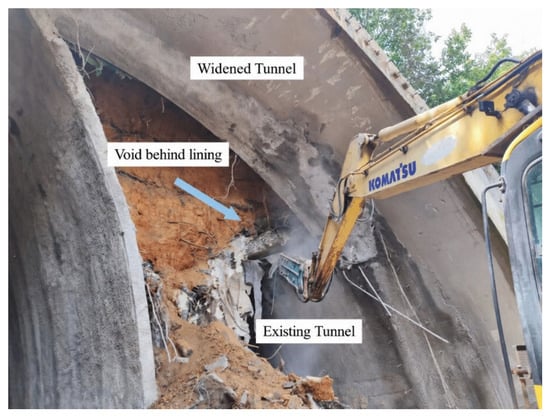
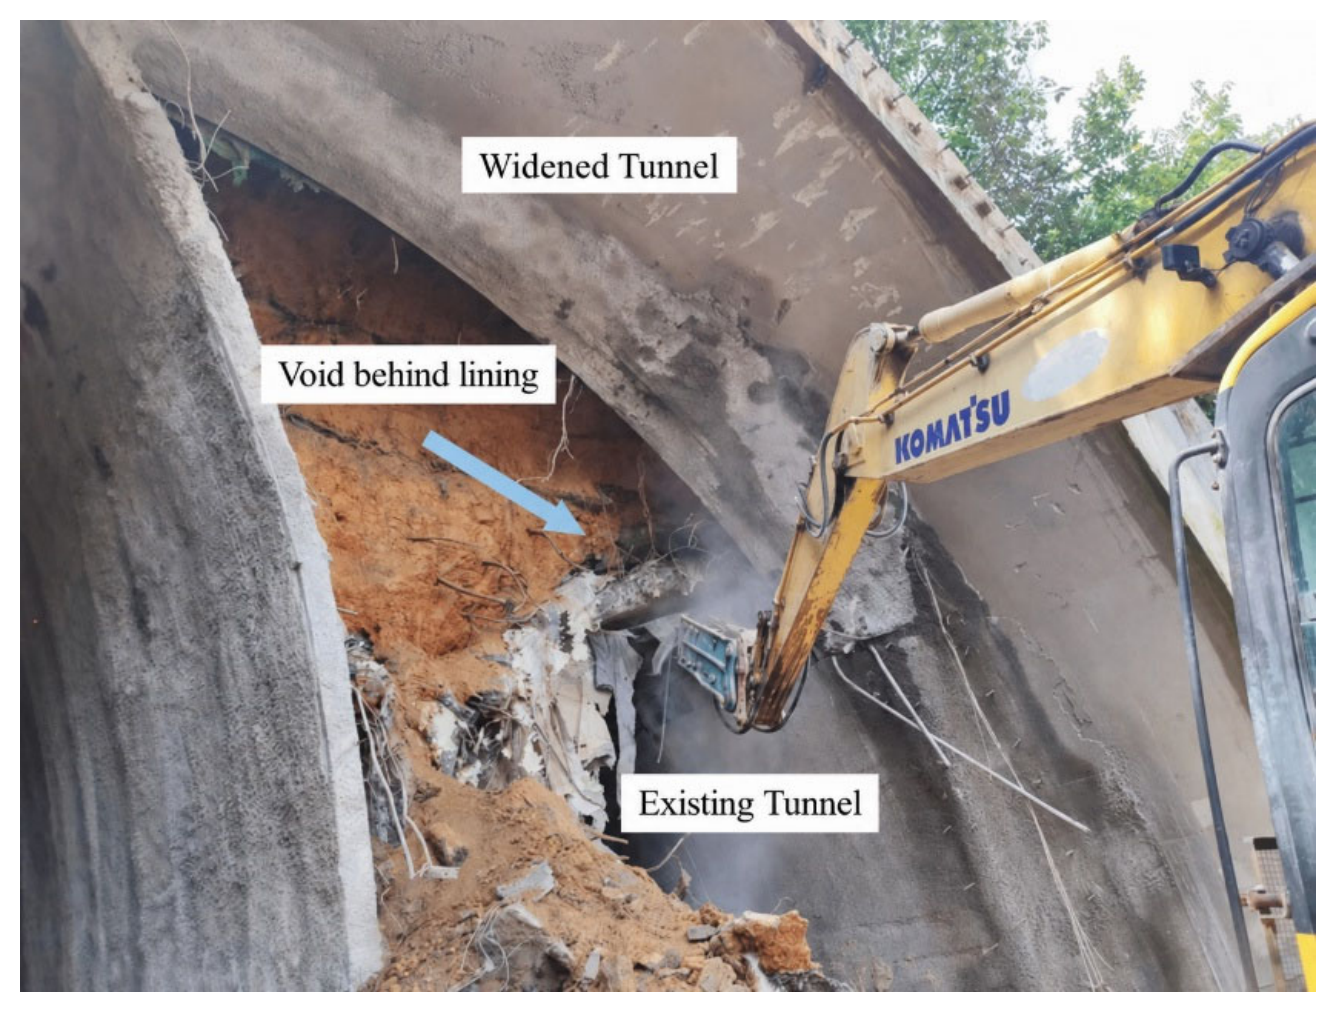
The inspection results show that the tunnel defects include lining cracking, cavities behind the lining, damage to drainage facilities, and local water leakage. Some of the defects are shown in Figure 3 and Figure 4.
Figure 3.
Cracks in the existing tunnel lining: (a) vertical cracks; (b) inclined cracks.
Figure 4.
Cavity behind the existing tunnel lining.
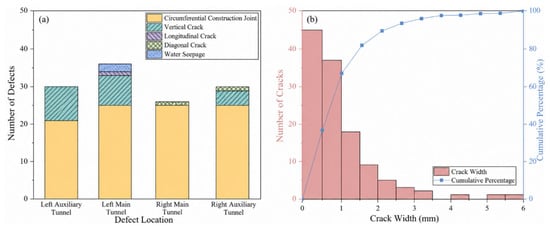
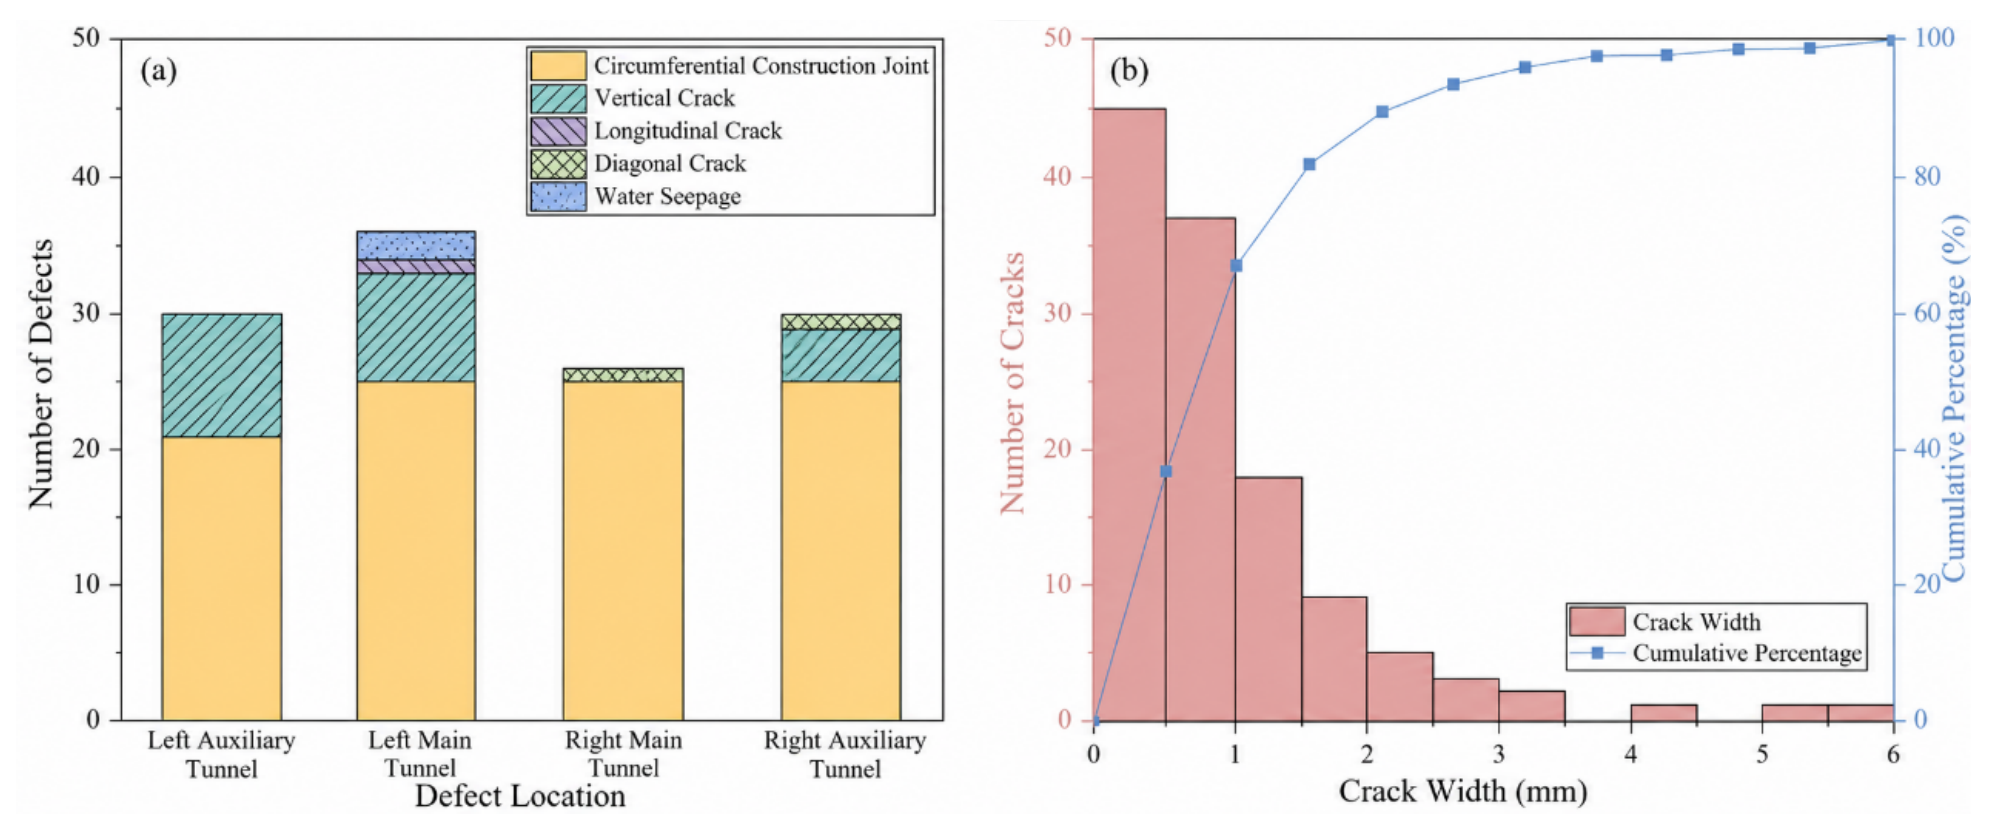
As shown in Figure 5, a total of 120 cracks were identified in the tunnel, including circumferential construction joints, vertical cracks, transverse cracks, and inclined cracks. Circumferential construction joints are the dominant crack type, followed by vertical cracks, inclined cracks, and transverse cracks. Approximately 82% of the crack widths are less than 2 mm. The maximum crack width is 5.73 mm, and the maximum crack length is 4.61 m. In addition, three water seepage locations were found in the tunnel: one at the right haunch of the left auxiliary tunnel and two at the right sidewall of the left main tunnel, all of which were in a slight seepage state.
Figure 5.
Statistics of existing tunnel lining cracks: (a) number of cracks; (b) crack width.
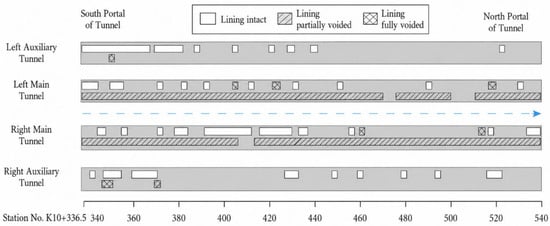
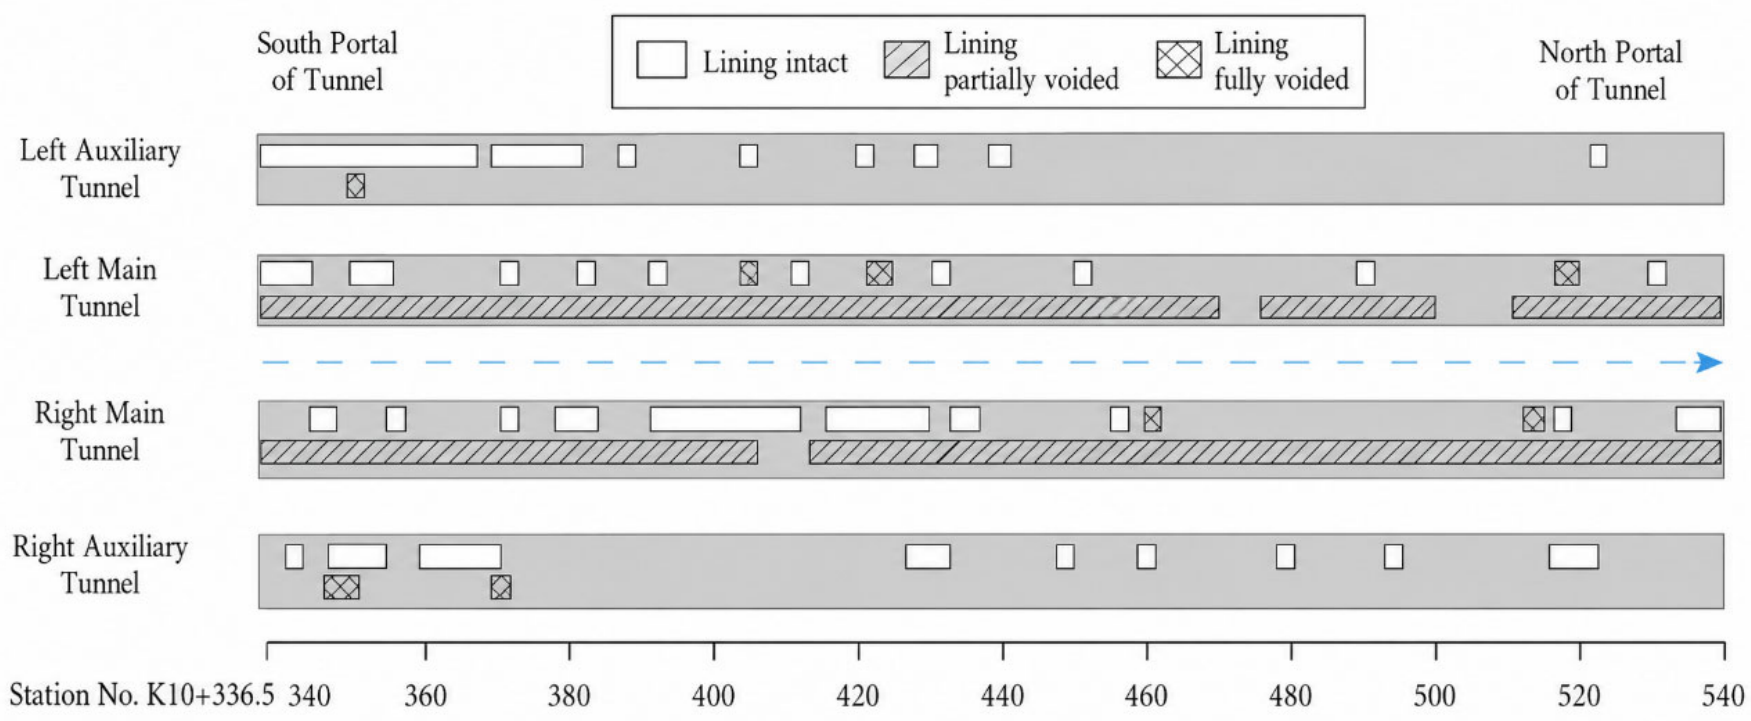
As shown in Figure 6 and Table 1, the inspection results of the compactness behind the existing tunnel lining indicate that relatively severe looseness and void defects exist in the lining. In the two auxiliary tunnels, lining defects are mainly manifested as looseness. In the left auxiliary tunnel, looseness of the lining is mainly distributed between K10 + 386.5 and K10 + 380, with a defective section length of 50.4 m. In the right auxiliary tunnel, lining looseness is more scattered, with a defective section length of 44.5 m. In the two main tunnels, looseness and voids behind the lining are severe. In the left main tunnel, lining looseness is mainly distributed between K10 + 386.5 and K10 + 392, with a loose section length of 23.7 m. In the right main tunnel, lining looseness is mainly distributed between K10 + 379 and K10 + 438, with a loose section length of 64.5 m. Lining voids are distributed along the full length of both main tunnels. In terms of defect length, the defect lengths in the main tunnels are much greater than those in the auxiliary tunnels, and the defect length ratio in the right main tunnel reaches 99.8%.
Figure 6.
Distribution of compactness behind the original tunnel lining.
Table 1.
Distribution of defects behind the existing tunnel lining.
The defect investigation results indicate that the main defects of the existing tunnel are lining cracking, looseness behind the lining, and voids. The major crack types are circumferential construction joints and vertical cracks, with a small number of transverse and inclined cracks. Although the concrete strength of the lining meets the design requirements, the two main tunnels suffer from severe looseness and void defects behind the lining, indicating a relatively serious overall safety risk.
2.3. Parameter Weakening Considering Existing Tunnel Defect Grades
In numerical analysis of the long-term service performance of tunnels, the most mainstream and engineering-applicable method for representing the bearing capacity deterioration caused by lining defects is to weaken the mechanical parameters of the lining material. The study by Usman and Galler [15] simulated long-term lining deterioration by reducing Young’s modulus, cohesion, and friction angle, and showed that degradation of these mechanical properties alters stress redistribution and load transfer within the tunnel support system. In this study, the reduction is carried out according to the following equation:
where E is the reduced elastic modulus of the lining concrete under the corresponding defect grade (GPa), E0 is the initial elastic modulus of the intact lining concrete (GPa), and αE= E/E0 is the elastic modulus weakening coefficient. The coefficients listed in Table 2 represent equivalent stiffness deterioration levels rather than universal material constants. Specifically, αE = 1.00, 0.80, 0.65, and 0.50 correspond to equivalent stiffness reductions of 0%, 20%, 35%, and 50%, respectively. Such an equivalent treatment is adopted because lining cracking, insufficient lining thickness, looseness, and voids behind the lining jointly affect the effective structural stiffness, whereas their individual mechanical effects are difficult to reproduce explicitly in a large-scale three-dimensional model. The coefficients should be regarded as engineering reference values rather than universal material constants. In the present case, the coefficient was selected conservatively according to the inspection-based health condition and was subsequently checked through comparison between the calculated and measured deformation.
Table 2.
Reference values of the elastic modulus weakening coefficient.
The coefficient is selected according to the structural health condition of the existing tunnel and the unfavorable-condition principle. Based on the field inspection, an AHP–fuzzy comprehensive evaluation was conducted using a three-level hierarchy comprising the tunnel health condition as the target layer, five criterion-layer indicators, and 13 indicator-layer items. The criterion layer comprised five criteria—lining quality, lining defects, portal conditions, invert defects, and auxiliary facilities—with corresponding weights of 0.313, 0.313, 0.099, 0.176, and 0.099, respectively. The 13 indicators included secondary-lining thickness, strengthening-lining thickness and strength, lining cracks, behind-lining looseness, water leakage, portal-area and portal-structure conditions, pavement condition, invert and filling-layer condition, maintenance walkway, drainage facilities, and traffic signs and markings. Their total weights were 0.063, 0.125, 0.125, 0.134, 0.134, 0.045, 0.049, 0.049, 0.117, 0.059, 0.020, 0.039, and 0.039, respectively. The AHP weights were obtained through pairwise comparisons using the Saaty 1–9 scale, and the consistency ratio was CR = 0.003 < 0.1. Each indicator was classified into four health grades according to the predefined criteria, and the proportions of the inspected sections assigned to the four grades were used to construct its membership vector. The indicator-level membership vectors were then aggregated using the AHP weights, yielding a comprehensive membership vector of (0.61, 0.22, 0.14, 0.03) and a health index of H = 1.6, indicating an overall condition between Grade 1 (healthy) and Grade 2 (relatively healthy).
The comprehensive health index H = 1.6 indicated a condition between Grade 1 and Grade 2. Following the unfavorable-condition principle, Grade 2 was adopted, and a weakening coefficient of αE = 0.80 was uniformly assigned to all retained existing-lining elements within the analyzed traffic-bearing tunnel section. The other coefficients in Table 2 represent reference values for different deterioration grades and were not used in the present calculation.
The weakening coefficient directly controls the equivalent stiffness and restraint capacity of the existing lining. A decrease in αE represents a more severe deterioration state and reduces the load-sharing capacity of the lining under reconstruction-induced disturbance. Consequently, under otherwise identical conditions, a smaller weakening coefficient is expected to result in larger crown settlement and clearance convergence. Since these displacement responses are subsequently used as the input variables of the cloud model, the influence of the weakening coefficient is further transmitted to the calculated cloud characteristics and risk membership degrees. Therefore, the coefficient affects the final risk assessment indirectly through the mechanical response of the traffic-bearing tunnel rather than acting as an independent risk indicator.
In this study, the inspected defects are represented using an equivalent stiffness-degradation approach rather than explicit defect-by-defect modeling. Lining cracks, looseness, voids, and cavities are therefore not individually mapped into the numerical mesh according to their exact geometry, but their combined effect is reflected through the elastic-modulus-weakening coefficient of the existing lining. The coefficients in Table 2 represent different equivalent deterioration levels rather than locally assigned values for individual defect zones.
2.4. Establishment of the Numerical Model
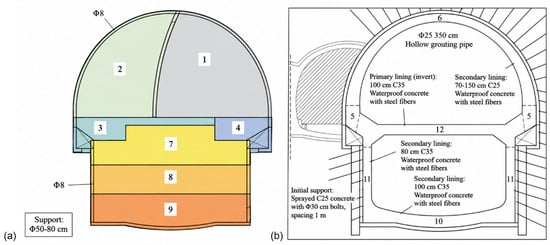
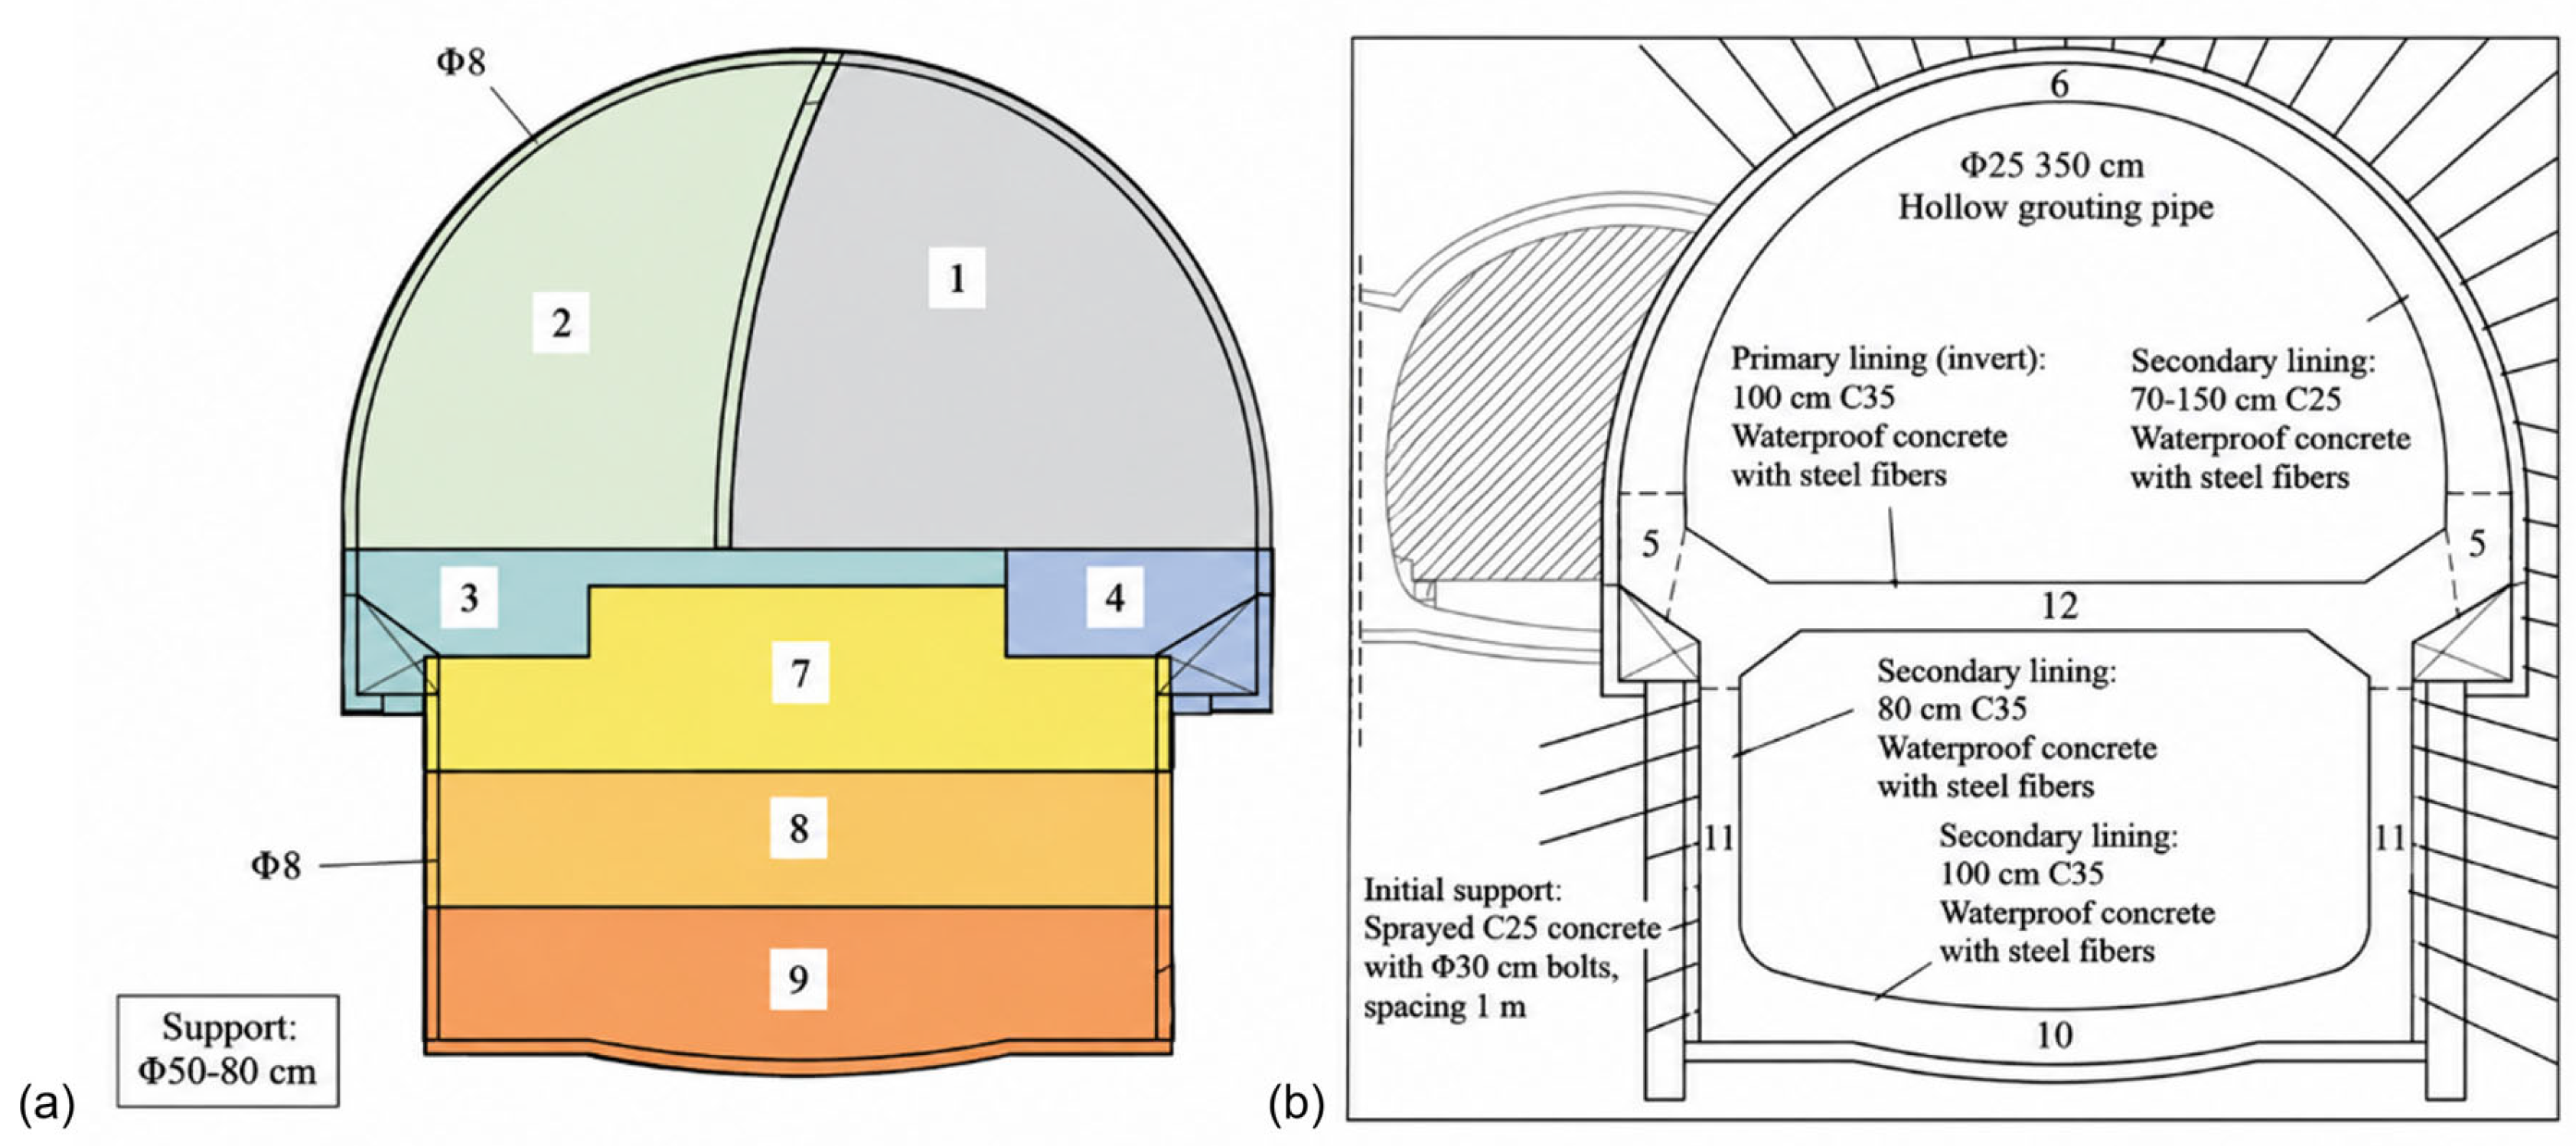
Taking the eastern tunnel as an example, the overall excavation sequence comprises seven excavation sections, including four upper-tunnel pilot headings (Nos. 1–4) and three lower-tunnel excavation stages (Nos. 7–9), as shown in Figure 7. The upper tunnel is excavated first, and excavation of the lower tunnel begins only after completion of the upper tunnel. A longitudinal distance of 15–20 m is maintained between successive excavation faces. The main construction activities include the sequential removal of the existing tunnel lining, excavation and support of the surrounding rock, and construction of the secondary lining. Primary support is installed immediately after each excavation step, and the individual support sections are subsequently connected to form an integral support system. Two types of temporary support are adopted: vertical temporary support installed after excavation of pilot heading No. 1 and horizontal temporary support used during lower-tunnel excavation. Both temporary-support systems consist of No. 25b I-steel sections with a longitudinal spacing of 0.50 m.
Figure 7.
Reconstruction and expansion construction sequence: (a) pilot heading excavation; (b) secondary lining construction.
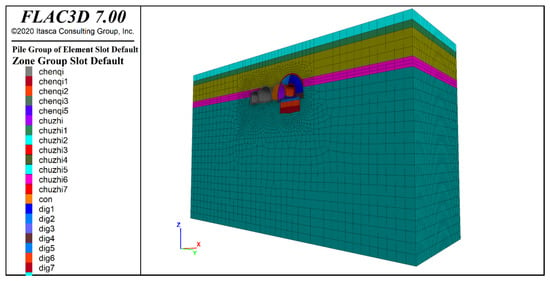
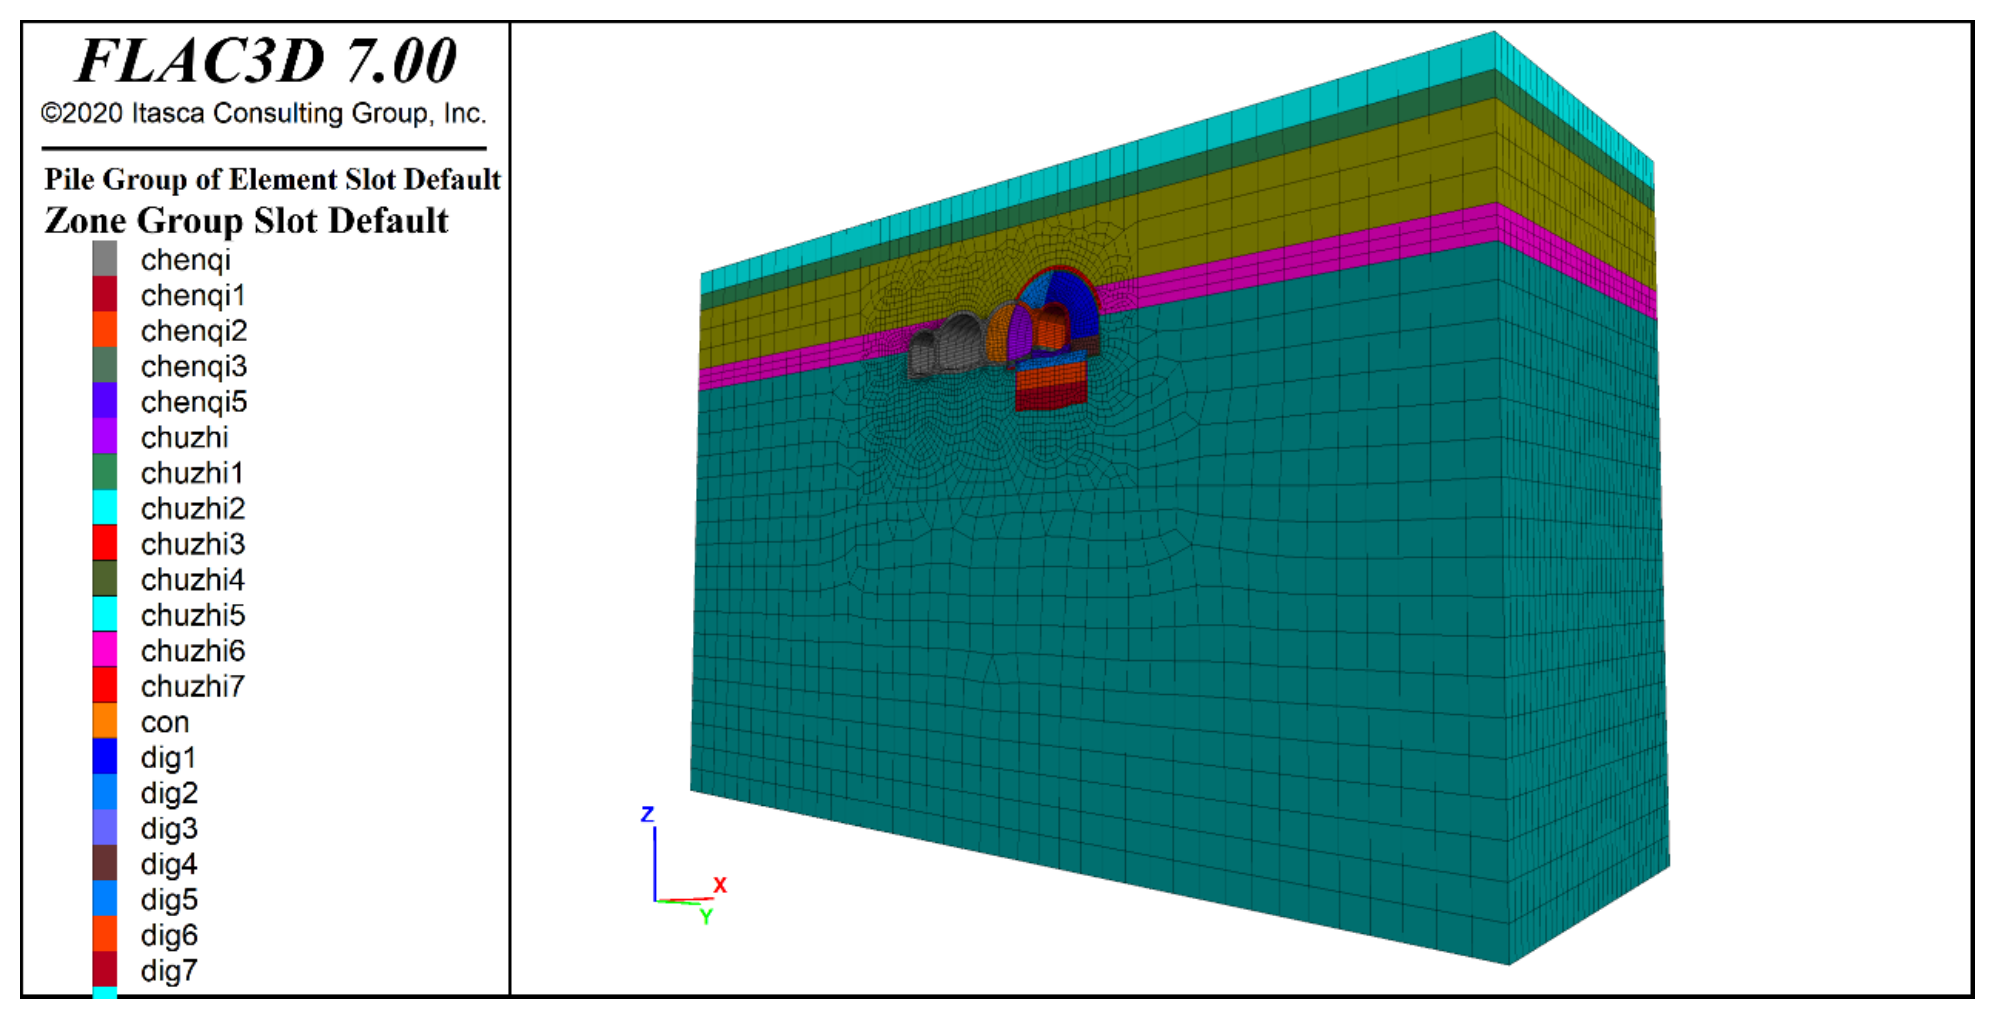
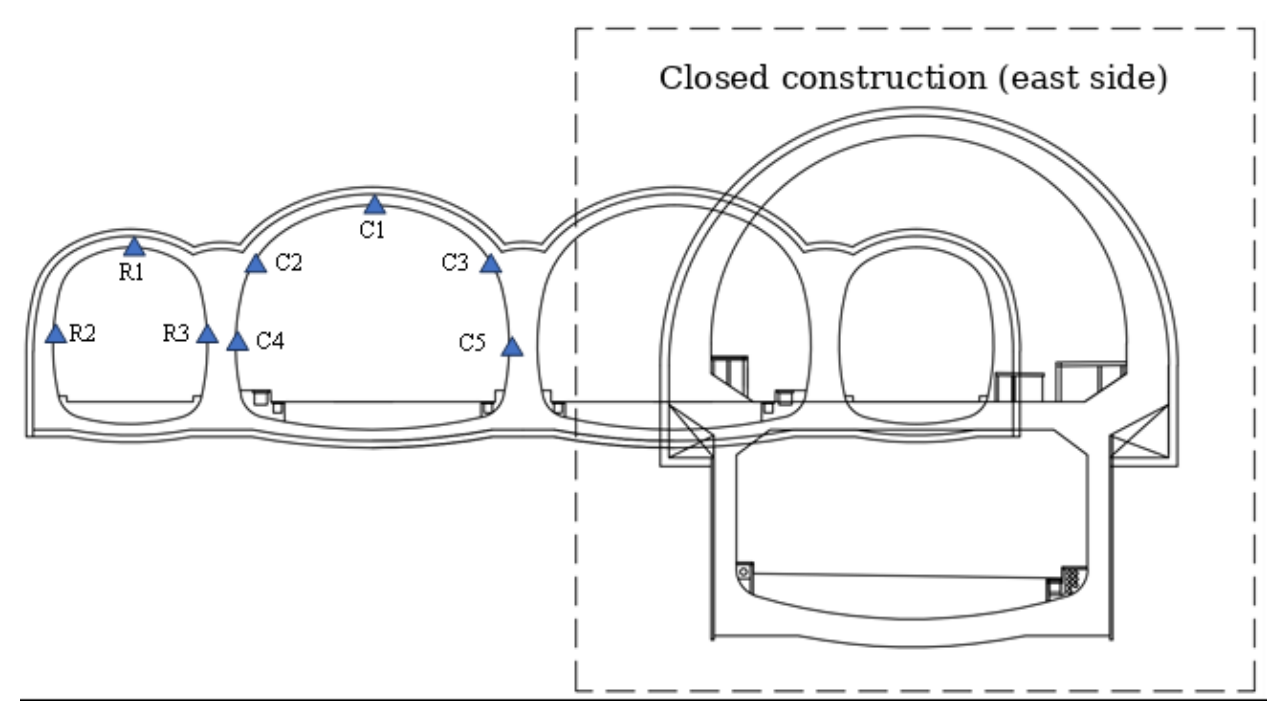
According to the design drawings, FLAC3D 7.0 finite-difference software was used in this study to conduct three-dimensional numerical simulation of the reconstruction and expansion excavation of the upper deck of the eastern tunnel in the YK0 + 409.0 − YK0 + 458.5 section of the existing tunnel, accurately simulating the excavation and support processes. The eastern tunnel was closed for construction first. The excavation width is approximately 18.42 m and the maximum height is approximately 12.8 m. The model has a transverse width of 160 m, a vertical height of 95 m, and an axial length of 49.5 m. A total of 147,220 nodes and 137,115 elements were generated. The model dimensions were selected to keep the external boundaries sufficiently far from the tunnel excavation region and thereby reduce boundary effects. The effects of mesh density and model-boundary extent are further examined in Section 3.1. During calculation, the top of the model was set as a free boundary, while normal displacement constraints were applied to the other boundaries. Before excavation, the initial geostatic stress field was established by applying gravity and solving the model to mechanical equilibrium. The finite-difference model of the tunnel is shown in Figure 8, and the mechanical parameters of the model are listed in Table 3. In the numerical model, the ground, existing lining, concrete filling, grouting-reinforcement zone, and primary support were simulated using solid elements, while piles and rock bolts were represented by pile and cable elements, respectively. The ground materials were described using Mohr–Coulomb or elastic constitutive models according to their geological characteristics, whereas the lining and support components were treated as elastic materials. Excavation was simulated progressively with a round length of 1.5 m, and the existing lining was removed sequentially together with excavation; the corresponding primary support was activated immediately after each excavation step, followed by subsequent support connection and secondary lining construction according to the actual construction sequence. Groundwater seepage and pore-pressure coupling were not explicitly considered in the present mechanical analysis. No special interface or contact elements were introduced between the lining/support and surrounding ground, and the structural components were assumed to remain compatible with the adjacent ground in the equivalent continuum model. To obtain risk monitoring indicators during the reconstruction and expansion construction process, displacement monitoring points were arranged on the lining of the existing tunnel, as shown in Figure 9.
Figure 8.
Three-dimensional finite-difference model for reconstruction and expansion excavation.
Table 3.
Mechanical parameters.
Figure 9.
Layout of tunnel displacement monitoring points.
2.5. Cloud-Model-Based Dynamic Risk Assessment Method
The cloud model, first proposed by Deyi Li, an academician of the Chinese Academy of Engineering, is an uncertainty model that enables bidirectional transformation between qualitative concepts and quantitative data. It is capable of simultaneously characterizing the fuzziness and randomness inherent in human knowledge representation [16,17]. Specifically, a forward cloud generator transforms qualitative concepts into quantitative representations, whereas a backward cloud generator extracts qualitative concepts from quantitative samples [16].
The membership relationship in a cloud model can be defined as follows. Let U denote the universe of discourse containing the objects under investigation, and let C be a qualitative concept, or equivalently a fuzzy subset, defined on U. The mapping from U to the real-valued interval [0,1] can be expressed as [17]:
For any element x∈U, if x is a random realization of the qualitative concept C, its certainty degree μ(x)∈[0,1] is a random variable exhibiting a stable statistical tendency. The distribution of x and its corresponding certainty degree over the universe of discourse U constitutes a cloud, while each ordered pair (x,μ(x)) is referred to as a cloud droplet.
The membership function characterizes the distribution of the certainty degrees of all elements within the universe of discourse. Different probability distributions of the certainty degree give rise to different types of cloud models. The normal cloud model integrates the normal distribution with the Gaussian membership function. Owing to its broad applicability and well-defined mathematical properties, the normal cloud model is adopted in this study [7,16]. The expected membership function of the normal cloud can be expressed as follows:
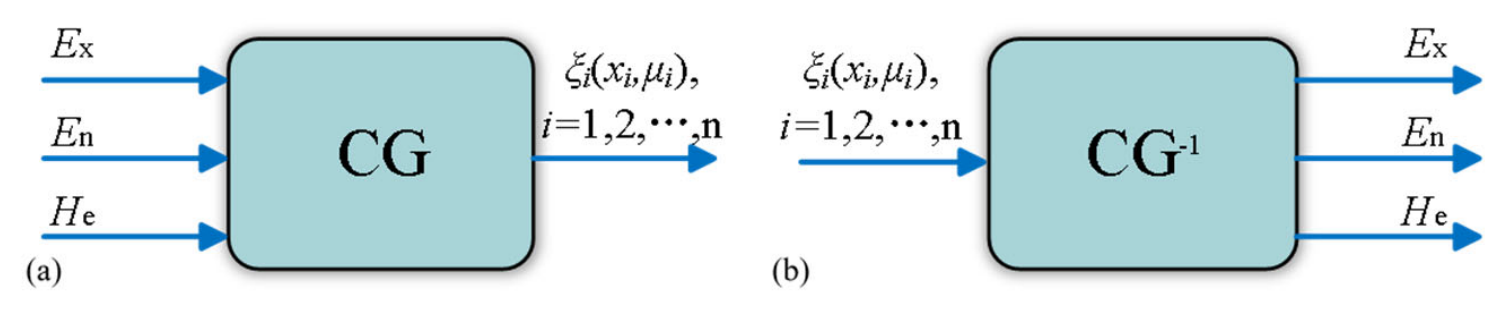
To use the cloud model for risk assessment, evaluation language must be transformed through a cloud generator (CG). Cloud generators include the forward cloud generator and the backward cloud generator [16], as shown in Figure 10.
Figure 10.
Structure of the cloud generator: (a) Forward cloud generator; (b) Backward cloud generator.
The forward cloud generator inputs known numerical characteristics of the cloud model, namely Ex, En, and He, to obtain the membership distribution function and generate a specified number of cloud droplets. The algorithm of the forward cloud generator is shown in Table 4. The backward cloud generator inversely calculates the three numerical characteristics of the cloud model from known samples. The algorithm of the backward cloud generator is shown in Table 5.
Table 4.
Algorithm of the forward cloud generator.
Table 5.
Algorithm of the backward cloud generator.
In the proposed framework, existing tunnel defects are not introduced into the cloud model as an additional independent risk indicator. Instead, their influence is transmitted to the final risk assessment through the mechanical response of the tunnel. Specifically, the observed defect condition is represented by the elastic modulus weakening coefficient, which modifies the equivalent stiffness and load-bearing response of the existing lining in the numerical model. The resulting crown settlement s and clearance convergence u therefore inherently contain the mechanical influence of the existing defects. These defect-affected displacement sequences are subsequently input into the backward cloud generator to obtain the cloud characteristics Ex, En, and He, and the generated evaluation clouds are compared with the standard risk clouds to determine the corresponding membership degrees and risk grades. Thus, the influence of existing tunnel defects is propagated through the chain of “defect condition–stiffness degradation–deformation response–cloud characteristics–risk membership”. This treatment also avoids double counting the same defect effect through both structural deformation and an additional subjective defect score.
3. Results
3.1. Validation of the Numerical Model
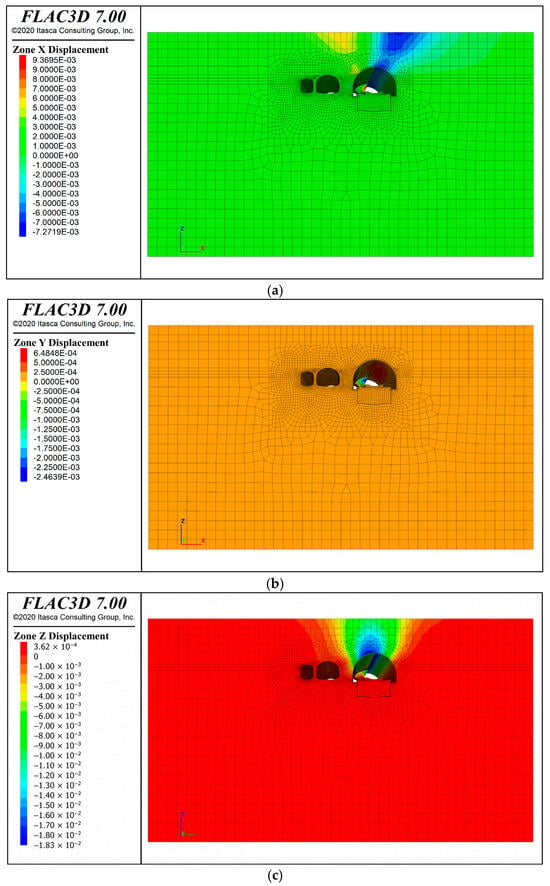
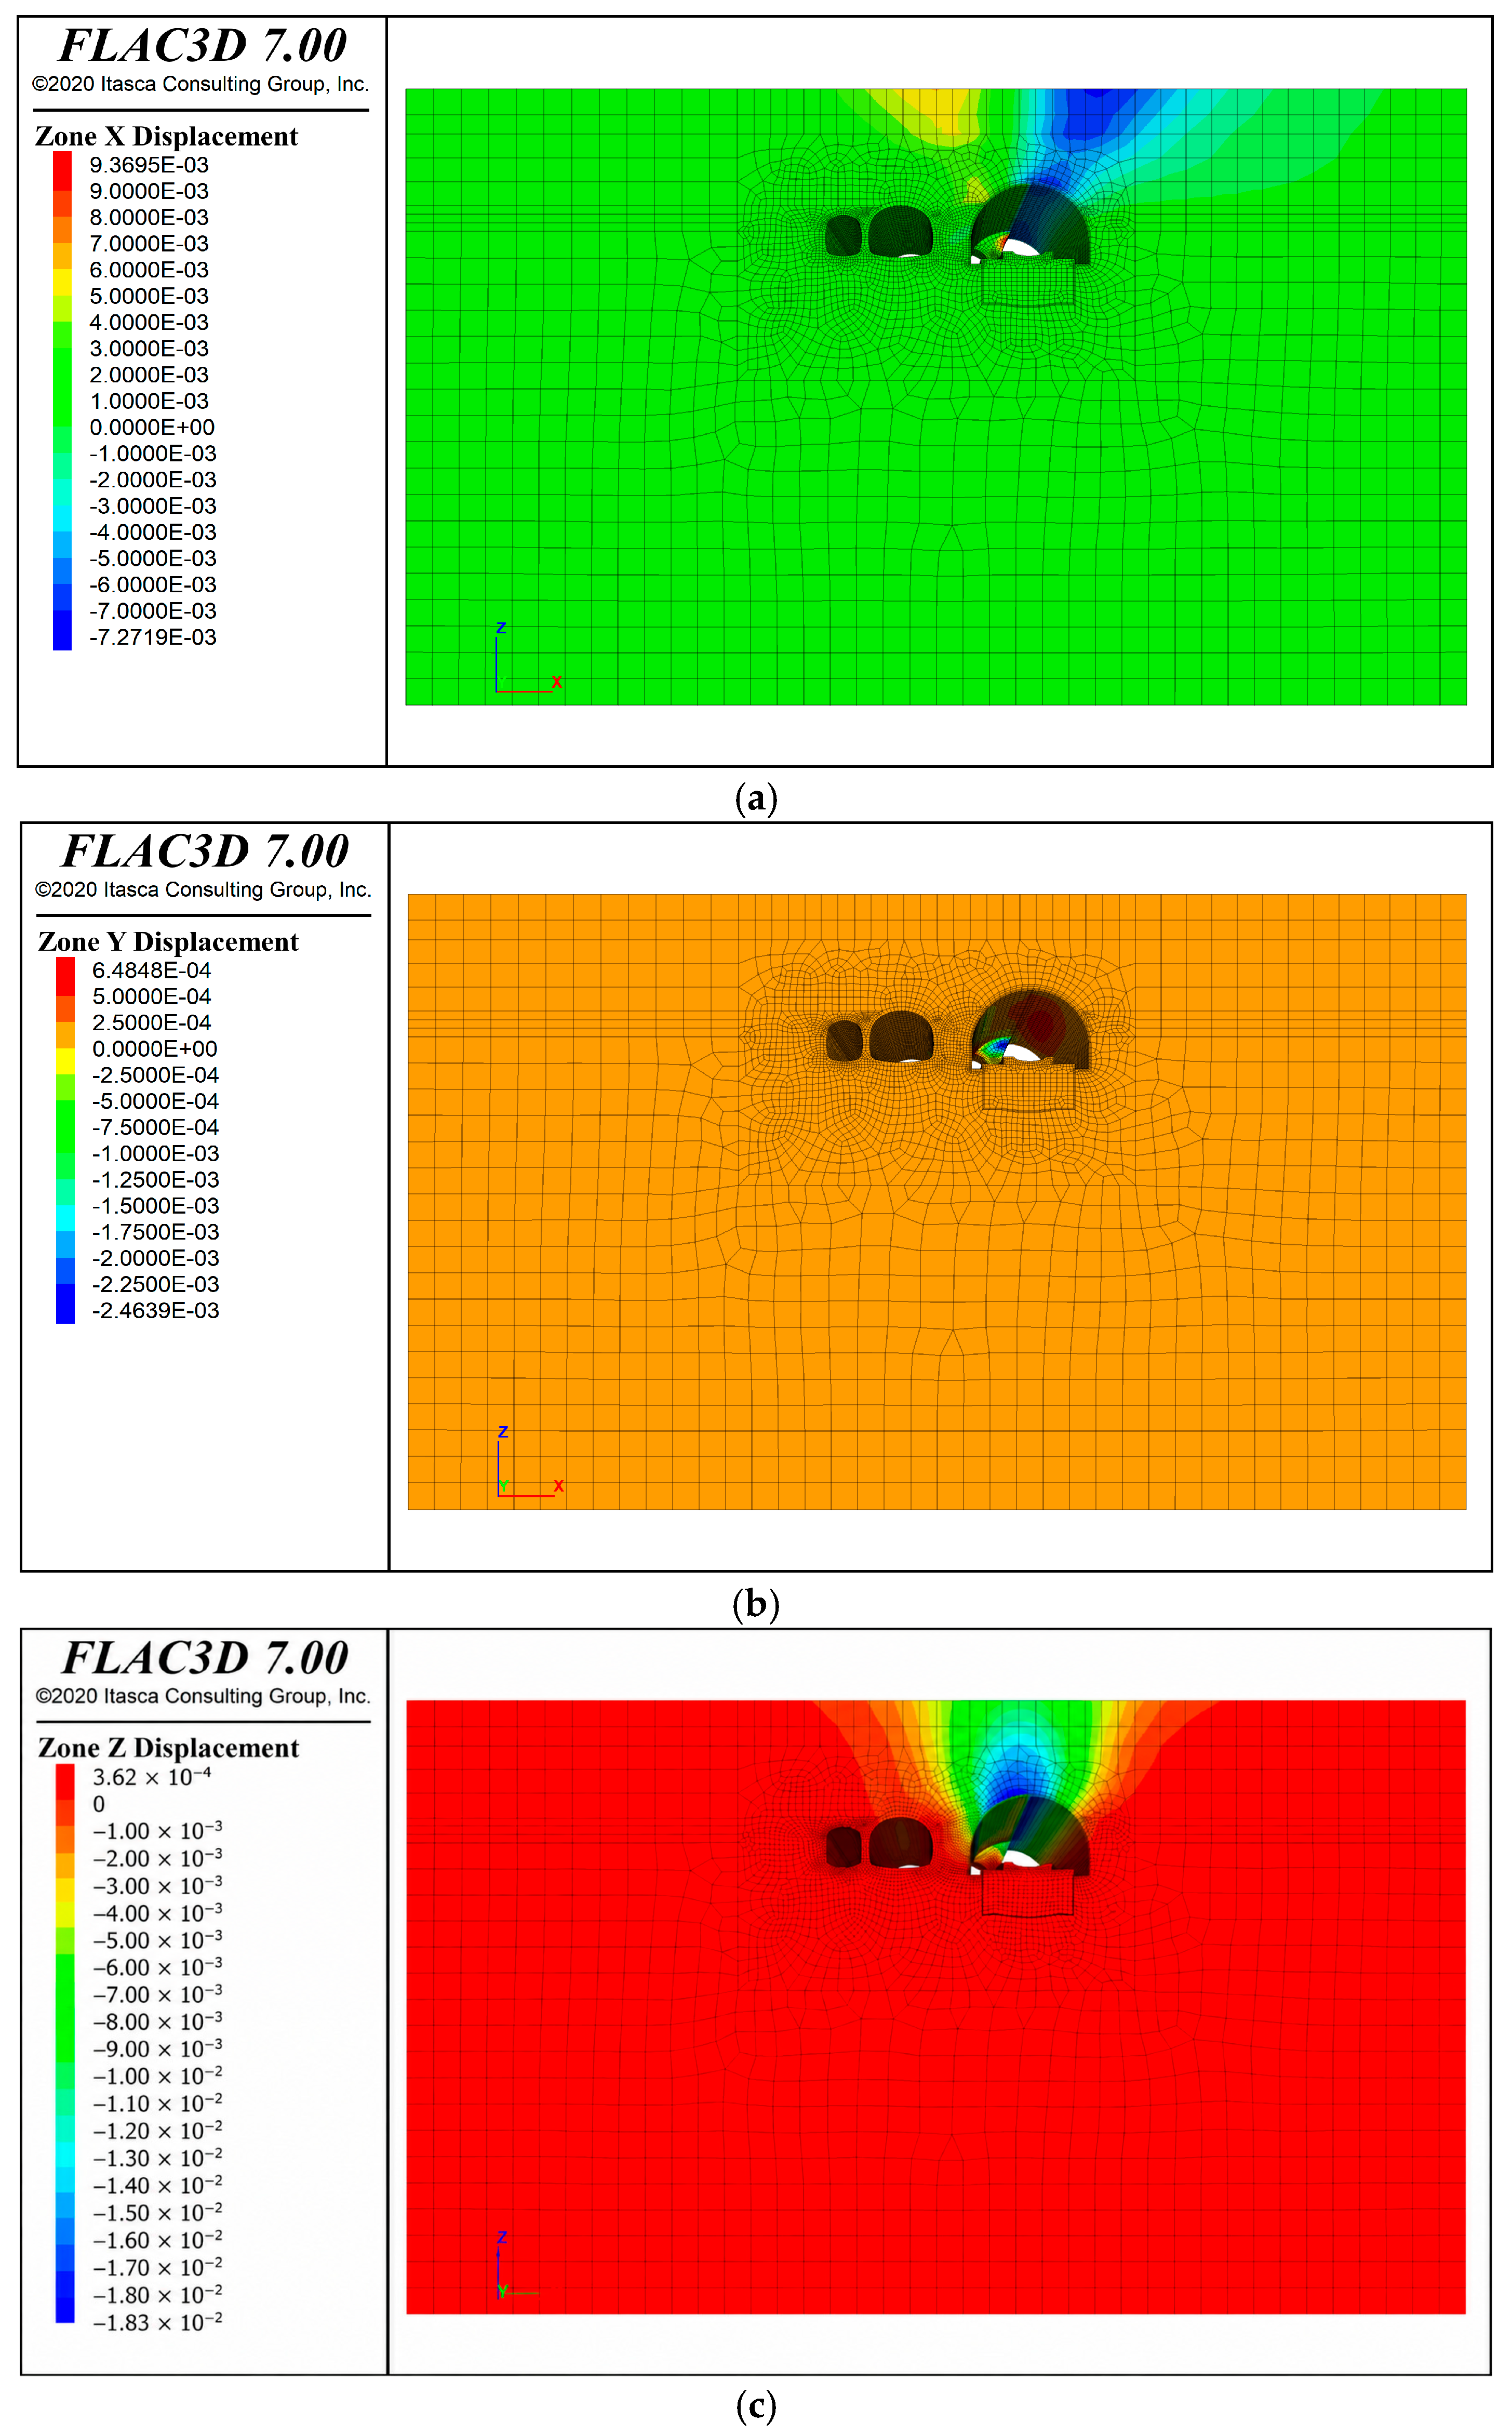
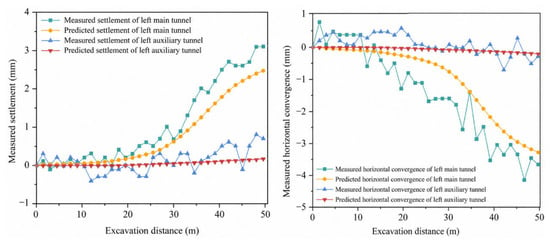
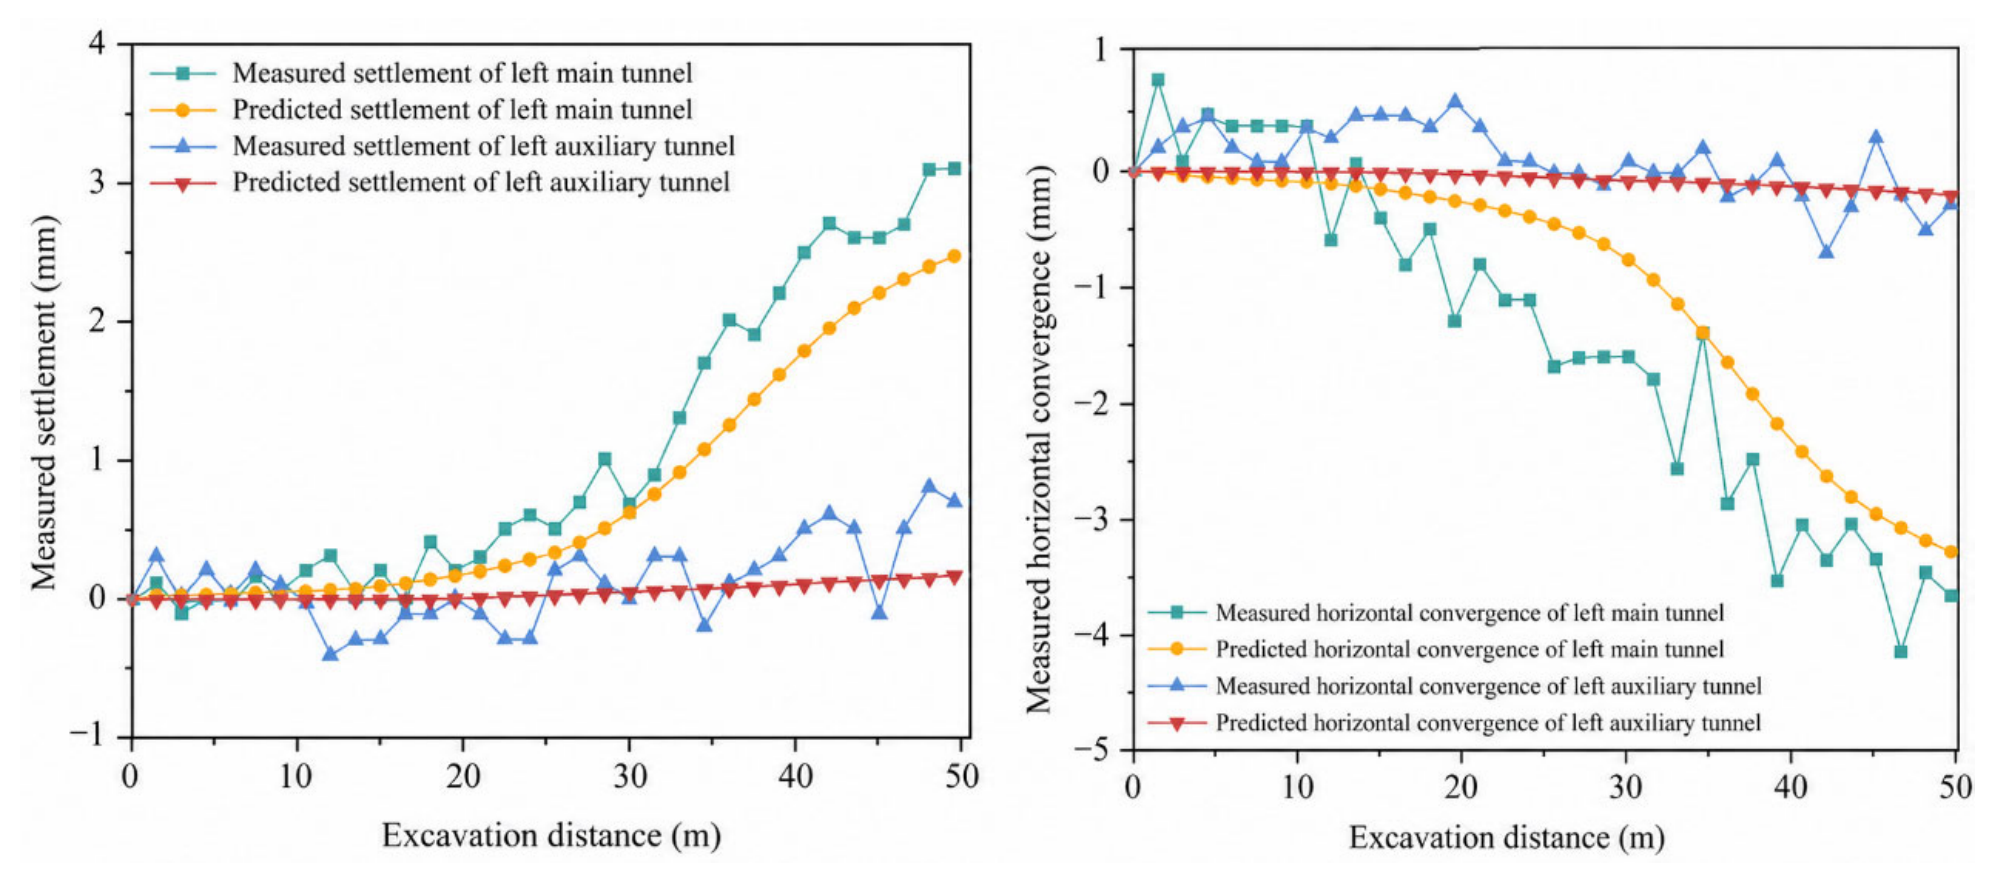
The numerical simulation focuses on the upper-tunnel excavation; therefore, the excavation process is represented by four pilot headings corresponding to Nos. 1–4 in Figure 7. Accordingly, the deformation responses used for numerical validation and cloud-model risk assessment were derived only from the staged excavation of upper-tunnel pilot headings Nos. 1–4; the lower-tunnel excavation stages Nos. 7–9 were not included in the present assessment. The excavation sequence is the upper right pilot heading, upper left pilot heading, lower left pilot heading, and lower right pilot heading. The length of each excavation round is 1.5 m, and the preceding bench advances 9 m ahead of the subsequent bench. The displacement contours of the simulated tunnel excavation are shown in Figure 11, and the variations in crown settlement and clearance convergence are shown in Figure 12. Crown settlement is reported as a positive downward displacement magnitude. Negative horizontal-convergence values in Figure 12 denote inward closure according to the numerical coordinate convention. Absolute cumulative deformation magnitudes are used in the subsequent risk assessment.
Figure 11.
Displacement contours of simulated tunnel excavation: (a) x-axis direction; (b) y-axis direction; (c) z-axis direction.
Figure 12.
Structural displacement response during tunnel excavation.
The monitoring data presented in Figure 12 were used to validate the numerical results rather than to calibrate or inversely identify the model parameters. The monitoring results show that the simulated and measured structural displacement responses of the tunnel have generally consistent trends. As excavation advances, the two datasets show similar trends. Throughout the excavation process, the measured data for the left main tunnel show a continuous increase in deformation with increasing excavation footage, and the corresponding simulated data exhibit the same increasing trend. Changes in deformation rate and turning points in numerical fluctuation are generally consistent with the measured data. The measured and simulated data for the left auxiliary tunnel also vary synchronously. In the early excavation stage (0–20 m), the numerical fluctuation is small; in the later stage, deformation develops regularly with increasing footage, and the trends show reasonable agreement. This supports the capability of the simulation results to reproduce the deformation behavior of the surrounding rock during tunnel excavation.
The overall deviation between measured and simulated data is within an engineering-acceptable range, and the difference is controllable. Taking the crown settlement of the left main tunnel as an example, when excavation reaches 47.0 m, the measured crown settlement is 2.4 mm, while the corresponding simulated value is 2.73 mm, with a relative deviation of approximately 13.75%. Throughout the excavation section, the differences between measured and simulated values at more than 80% of the excavation footage nodes are within 1 mm, with only a slight increase in deviation at the later large-footage stage. To further quantify the agreement over the complete deformation histories, the mean absolute error (MAE) and root mean square error (RMSE) were calculated using the paired measured and simulated values at the corresponding excavation-distance points. For crown settlement, the MAE/RMSE values were 0.302/0.384 mm for the left main tunnel and 0.217/0.271 mm for the left auxiliary tunnel, respectively. For clearance convergence, the corresponding MAE/RMSE values were 0.641/0.744 mm and 0.243/0.305 mm, respectively. These full-history error metrics further support the overall agreement between the numerical and measured deformation responses. The measured and simulated data for the left auxiliary tunnel show even better agreement, with the differences at most nodes within 0.2 mm over the whole section, indicating that the simulation results reproduce the actual field deformation well.
To further assess the numerical reliability of the model, mesh-refinement and boundary-size sensitivity analyses were performed under the adopted (αE = 0.80) condition. Three mesh densities were considered, containing 93,852 zones (coarse), 137,115 zones (adopted medium mesh), and 177,936 zones (fine), respectively. To maintain consistency with the deformation definition used throughout this study, the same cumulative-deformation reference was adopted for all sensitivity models. At the final excavation stage, the cumulative crown settlements obtained using the coarse, medium, and fine meshes were 2.7336, 2.7300, and 2.7294 mm, respectively, while the corresponding cumulative clearance convergences were 3.7058, 3.7000, and 3.6996 mm. Compared with the adopted medium mesh, further refinement to the fine mesh changed crown settlement by only 0.0006 mm (approximately 0.02%) and clearance convergence by 0.0004 mm (approximately 0.01%). The differences between the coarse and medium meshes were also small, amounting to approximately 0.0036 mm (0.13%) for crown settlement and 0.0058 mm (0.16%) for clearance convergence. These results indicate that both deformation responses remain essentially stable with increasing mesh density and that the adopted medium mesh provides a sufficiently converged solution for the present analysis.
The influence of model-boundary extent was further examined by enlarging the computational domain from 160 × 95 × 49.5 m to 200 × 120 × 49.5 m while maintaining the same material parameters, excavation sequence, support conditions, and tunnel-response region. The enlarged-domain model produced final cumulative crown settlement and clearance convergence values of 2.7234 and 3.7012 mm, respectively, compared with 2.7300 and 3.7000 mm for the baseline domain. The corresponding differences were approximately 0.0066 mm (0.24%) and 0.0012 mm (0.03%), respectively. The deformation-development trends also remained consistent during excavation. These results indicate that the adopted computational boundaries have only a limited influence on the calculated deformation responses.
In summary, the numerical simulation results are consistent with the trends of the field monitoring data, and the numerical deviations are controllable. The results can accurately reflect the deformation characteristics of the surrounding rock during tunnel excavation. The simulation method and parameter selection are considered reasonable for the present case, and the numerical analysis can be used as a supplementary decision-support tool together with continuous field monitoring for risk assessment of the traffic-bearing side during tunnel reconstruction and expansion. The agreement between the simulated and measured deformation also provides an engineering check on the adopted equivalent stiffness-reduction treatment. With the adopted defect representation, the differences between simulated and measured responses at more than 80% of the excavation-distance points were within 1 mm, and the relative deviation of the final crown settlement was approximately 13.75%. This indicates that the selected equivalent stiffness scenario can reasonably reproduce the overall deformation response of the existing tunnel for the present case, although the weakening coefficients should be recalibrated when applied to tunnels with different defect characteristics.
To further quantify the influence of existing tunnel defects on the deformation response, two additional numerical scenarios were considered together with the adopted αE = 0.80 condition. The three weakening coefficients, αE = 1.00, 0.80, and 0.65, represent the intact reference condition, the adopted deterioration condition, and a more severe deterioration condition, respectively. All geological conditions, excavation sequences, support parameters, and boundary conditions were kept unchanged, with only the elastic modulus of the existing lining varied. Taking the intact lining modulus E0 = 30 GPa as the reference, the corresponding elastic moduli were 30.0, 24.0, and 19.5 GPa.
The comparison shows a monotonic increase in deformation with increasing deterioration. The final crown settlements for αE = 1.00, 0.80, and 0.65 were 2.355, 2.730, and 3.149 mm, respectively. Compared with the intact condition, the adopted αE = 0.80 condition increased the crown settlement by 0.375 mm (15.94%), whereas the more severe αE = 0.65 condition increased it by 0.794 mm (33.74%). The corresponding final clearance convergences were 3.635, 3.700, and 3.769 mm, respectively, showing the same progressive increase with decreasing lining stiffness. These results provide a direct quantitative demonstration that the deterioration represented by the weakening coefficient amplifies the deformation response of the existing traffic-bearing tunnel. To facilitate a direct comparison, the deformation responses corresponding to the three weakening-coefficient scenarios are summarized in Table 6.
Table 6.
Quantitative influence of the elastic-modulus-weakening coefficient on tunnel deformation.
3.2. Dynamic Risk Assessment of the Traffic-Bearing Side in Tunnel Reconstruction and Expansion Based on the Cloud Model
3.2.1. Risk Index System Based on the Cloud Model
Monitoring measurement is a core control link for safe tunnel reconstruction and expansion construction. It is a key basis for promptly understanding the stress and deformation state of the surrounding rock and structures, warning construction risks, and dynamically adjusting construction parameters. The accuracy and timeliness of monitoring data are directly related to construction safety in tunnel reconstruction and expansion and play an irreplaceable role in preventing catastrophic accidents such as collapse and structural instability [18]. The core factors of monitoring measurement include crown settlement and clearance convergence, which are risk indicators directly related to construction and traffic safety. If monitoring measurement is inadequate, structural abnormalities cannot be detected in time, and traffic-bearing-side risks may expand.
Crown settlement is the most representative core indicator in monitoring measurement. It mainly reflects the stress and deformation characteristics of the surrounding rock and lining structure at the tunnel crown and directly indicates the stability of the crown area. Clearance convergence is another key indicator in monitoring measurement. It mainly reflects the transverse deformation and squeezing of the surrounding rock and sidewall lining around the tunnel and is directly related to whether the tunnel clearance meets safe traffic requirements. Therefore, this study uses the cumulative values of crown settlement s and clearance convergence u to evaluate the deformation-related dynamic risk of the traffic-bearing side during reconstruction and expansion excavation. Pre-existing cracks, looseness, and behind-lining voids are incorporated indirectly through the equivalent stiffness-degradation model rather than treated as independent cloud-model indicators, whereas seepage evolution and lining/support force responses are outside the scope of the present assessment. Based on the civil structural condition, surrounding rock conditions, and engineering experience of this tunnel, the warning values of the risk monitoring indicators are determined, as shown in Table 7. With reference to the Technical Specification for Structural Safety Monitoring during Operation of Urban Rail Transit (DBJ/T 13-336-2020) [19], and considering the structural condition, surrounding-rock conditions, and engineering experience of the investigated tunnel, the warning values were determined as shown in Table 7. With reference to the monitoring-measurement criteria in the Technical Specifications for Construction of Highway Tunnels (JTG/T 3660-2020) [20], the relative deformation intervals in Table 8 were adopted. For consistency with the five-level risk framework used in this study, these intervals were represented by scores 1–5, corresponding to safe, relatively safe, general, relatively dangerous, and dangerous states.
Table 7.
Warning values of risk monitoring indicators.
Table 8.
Risk grade judgment criteria for monitoring measurement data.
To obtain the continuous samples used in the cloud-model calculation, the displacement responses were normalized by their corresponding warning values as follows:
where rs and ru are the risk scores of crown settlement and clearance convergence, respectively. Downward crown settlement and inward clearance convergence are defined as positive. Thus, the warning value corresponds to a risk score of 5, while the five standard risk clouds are centered at scores 1–5. For the vehicular tunnel, s0 = u0 = 8 mm. Five consecutive normalized scores were used as one assessment window and input into the backward cloud generator.
3.2.2. Risk Assessment Results and Discussion
When the cloud model is used for risk assessment, the standard cloud model for each risk grade must be determined. The standard risk cloud model parameters Ex, En and He are calculated using Equation (5) [21].
where and are the maximum and minimum thresholds of each risk grade score, respectively. k is a constant controlling the range of cloud droplets and reflects the randomness of the grading criteria. It is a subjectively assigned value and is taken as 0.1 in this study. During the determination of the standard risk cloud, the characteristic parameters of the cloud model may be adjusted according to specific applications [22].
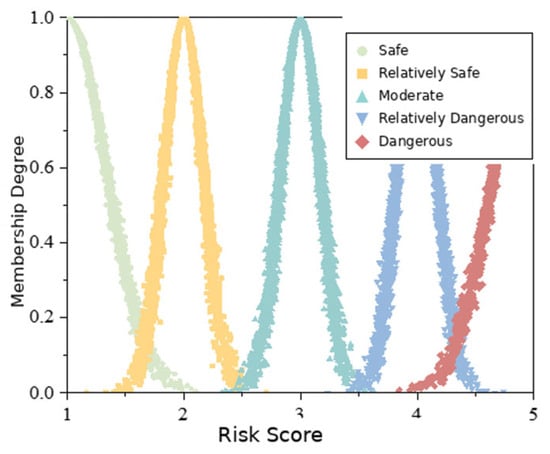
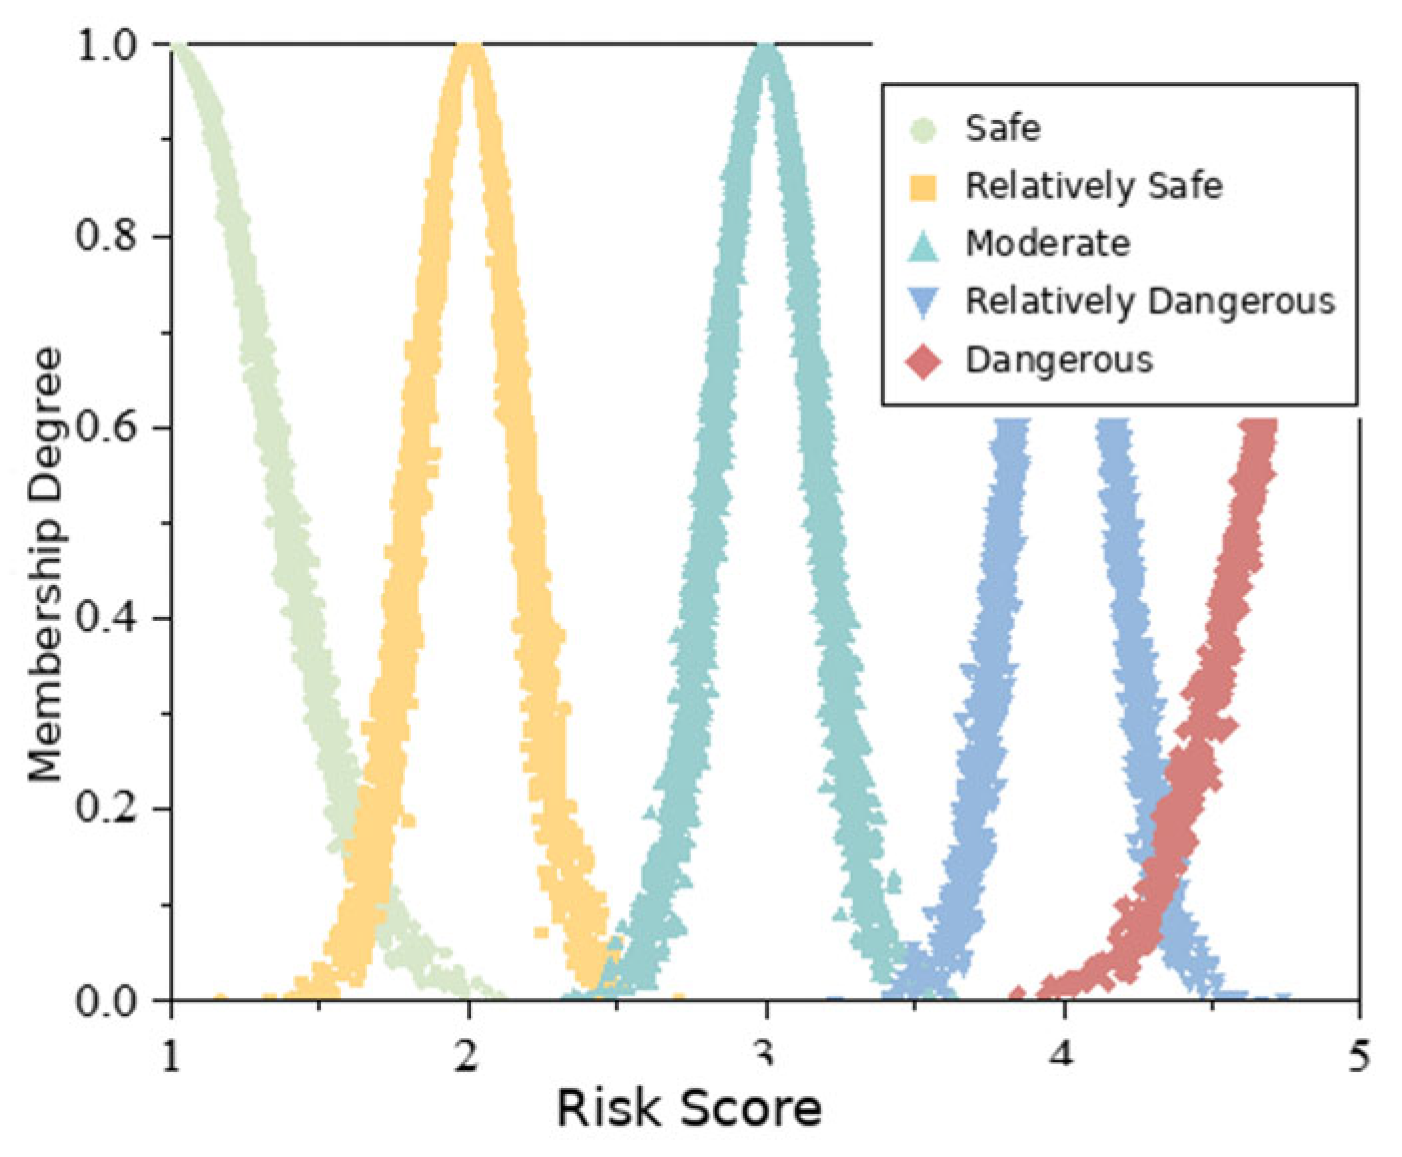
The calculation and values of the standard risk cloud model parameters are shown in Table 9. Based on the calculated cloud model parameters, the forward cloud generator is used to generate the standard risk clouds [23]. The number of cloud droplets n can be selected according to actual conditions and is set to n = 5000 in this study [24]. The calculated standard risk cloud model parameters are input into the forward cloud generator to generate standard risk clouds for the five grades, as shown in Figure 13.
Table 9.
Calculation of standard risk cloud model parameters.
Figure 13.
Standard clouds for the five risk grades.
4. Discussion
4.1. Interpretation of the Dynamic Risk Assessment Results
The overall dynamic risk assessment procedure is summarized as follows. First, the warning thresholds are used to establish the five standard risk grades and their corresponding standard cloud parameters. Second, crown settlement and clearance convergence responses from five consecutive excavation cycles are expressed in the risk-score domain and input into the backward cloud generator to obtain the evaluation-cloud parameters Ex, En, and He. Third, the forward cloud generator is used to generate cloud droplets, and their membership degrees relative to each standard risk cloud are calculated using Equations (6) and (7). The calculation is repeated R = 1000 times, and the final membership degrees are obtained using Equation (8). Finally, the risk grade is determined according to the maximum membership principle.
According to Equations (6) and (7), the membership degree of each cloud droplet in the current risk evaluation cloud of an indicator relative to a single standard risk cloud is calculated. After calculating the n cloud droplets of the indicator, the average value is obtained as the membership degree of that indicator relative to the single standard risk cloud [25]. Because the cloud droplet distribution generated by the forward cloud generator has a certain degree of inherent randomness, the result of a single cloud model run is not sufficiently accurate. Therefore, the cloud model is run 1000 times, and the average membership degree is calculated according to Equation (8) to obtain a stable and reliable membership result, which is taken as the final membership degree of the indicator evaluation cloud relative to the standard risk cloud [26].
where xi is the quantitative value of the i-th cloud droplet generated from the evaluation cloud; Ex and En are the expectation and entropy of the corresponding standard risk cloud, respectively; and μi is the membership degree of the i-th cloud droplet to the corresponding risk grade.
where n is the number of cloud droplets generated in each calculation, i denotes the cloud-droplet index (i = 1, 2,…, n), and μr′ is the average membership degree obtained in the r-th calculation.
where r denotes the index of repeated calculations, R is the total number of repeated calculations (R = 1000 in this study), and μ is the final membership degree obtained by averaging the results of the repeated calculations. Using five consecutive excavation cycles as one assessment window, the crown settlement and clearance convergence responses are first converted into the five-level risk-score domain according to the warning thresholds and risk-grade criteria in Table 7 and Table 8. Specifically, the assessment window is advanced by one excavation cycle at each update, so adjacent windows overlap by four cycles (e.g., cycles 1–5, 2–6, and so forth). Each assessment window therefore provides five risk-score samples for each indicator, which are input into the backward cloud generator to obtain Ex, En, and He. This sample size is distinct from the 5000 cloud droplets generated in each forward-cloud calculation. Accordingly, Ex represents the expectation of the indicator in the risk-assessment domain rather than the physical displacement in millimeters. To provide a reproducible worked example, the final assessment window comprising excavation cycles 30–34 is presented in Table 10. For the vehicular tunnel, the warning values are s0 = u0 = 8 mm. The five cumulative displacement values were first converted into continuous risk scores using Equation (4), and the resulting five scores for each indicator were then input into the backward cloud generator to calculate Ex, En, and He. The random-number generator was initialized with a fixed seed of 2026 for the reported cloud-model calculation. Taking the YK0 + 409.0 − YK0 + 458.5 section as an example, the cloud model parameters of the risk indicators are shown in Table 10.
Table 10.
Worked example for the final five-cycle assessment window and corresponding cloud model parameters.
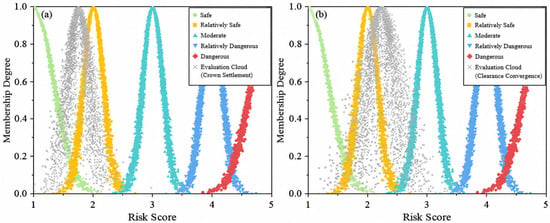
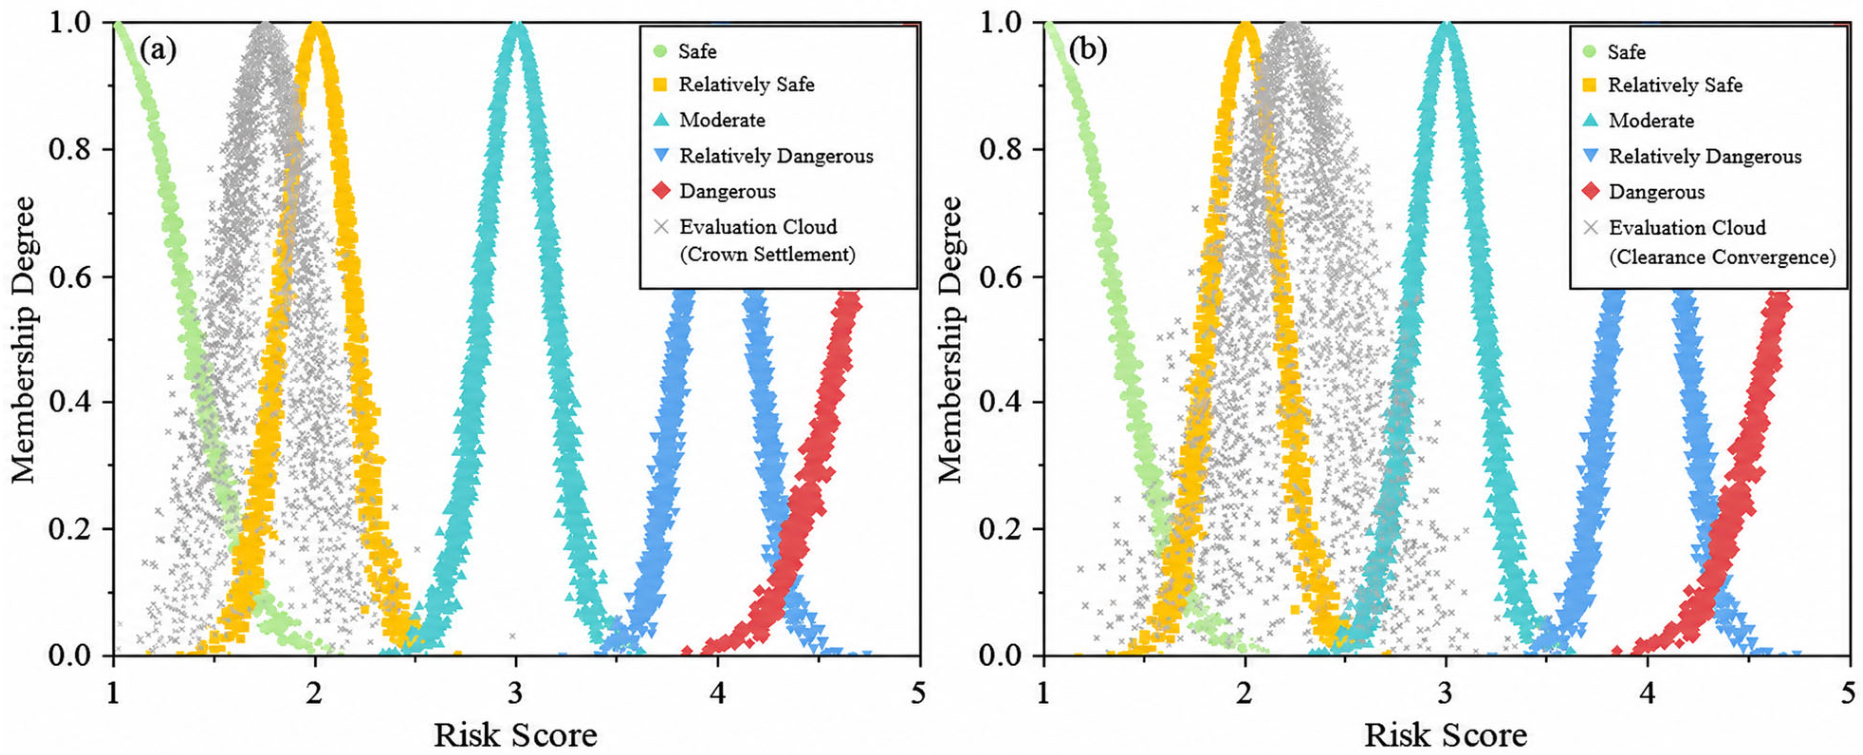
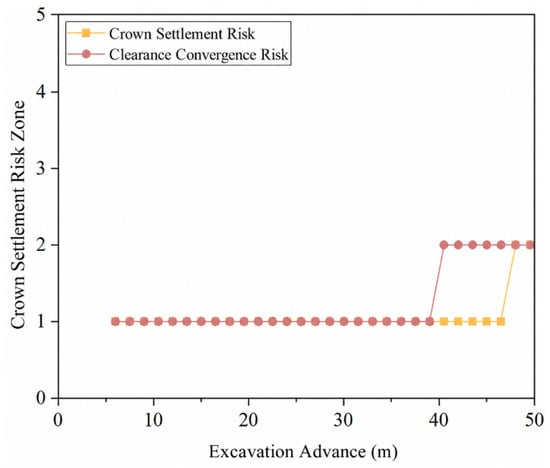
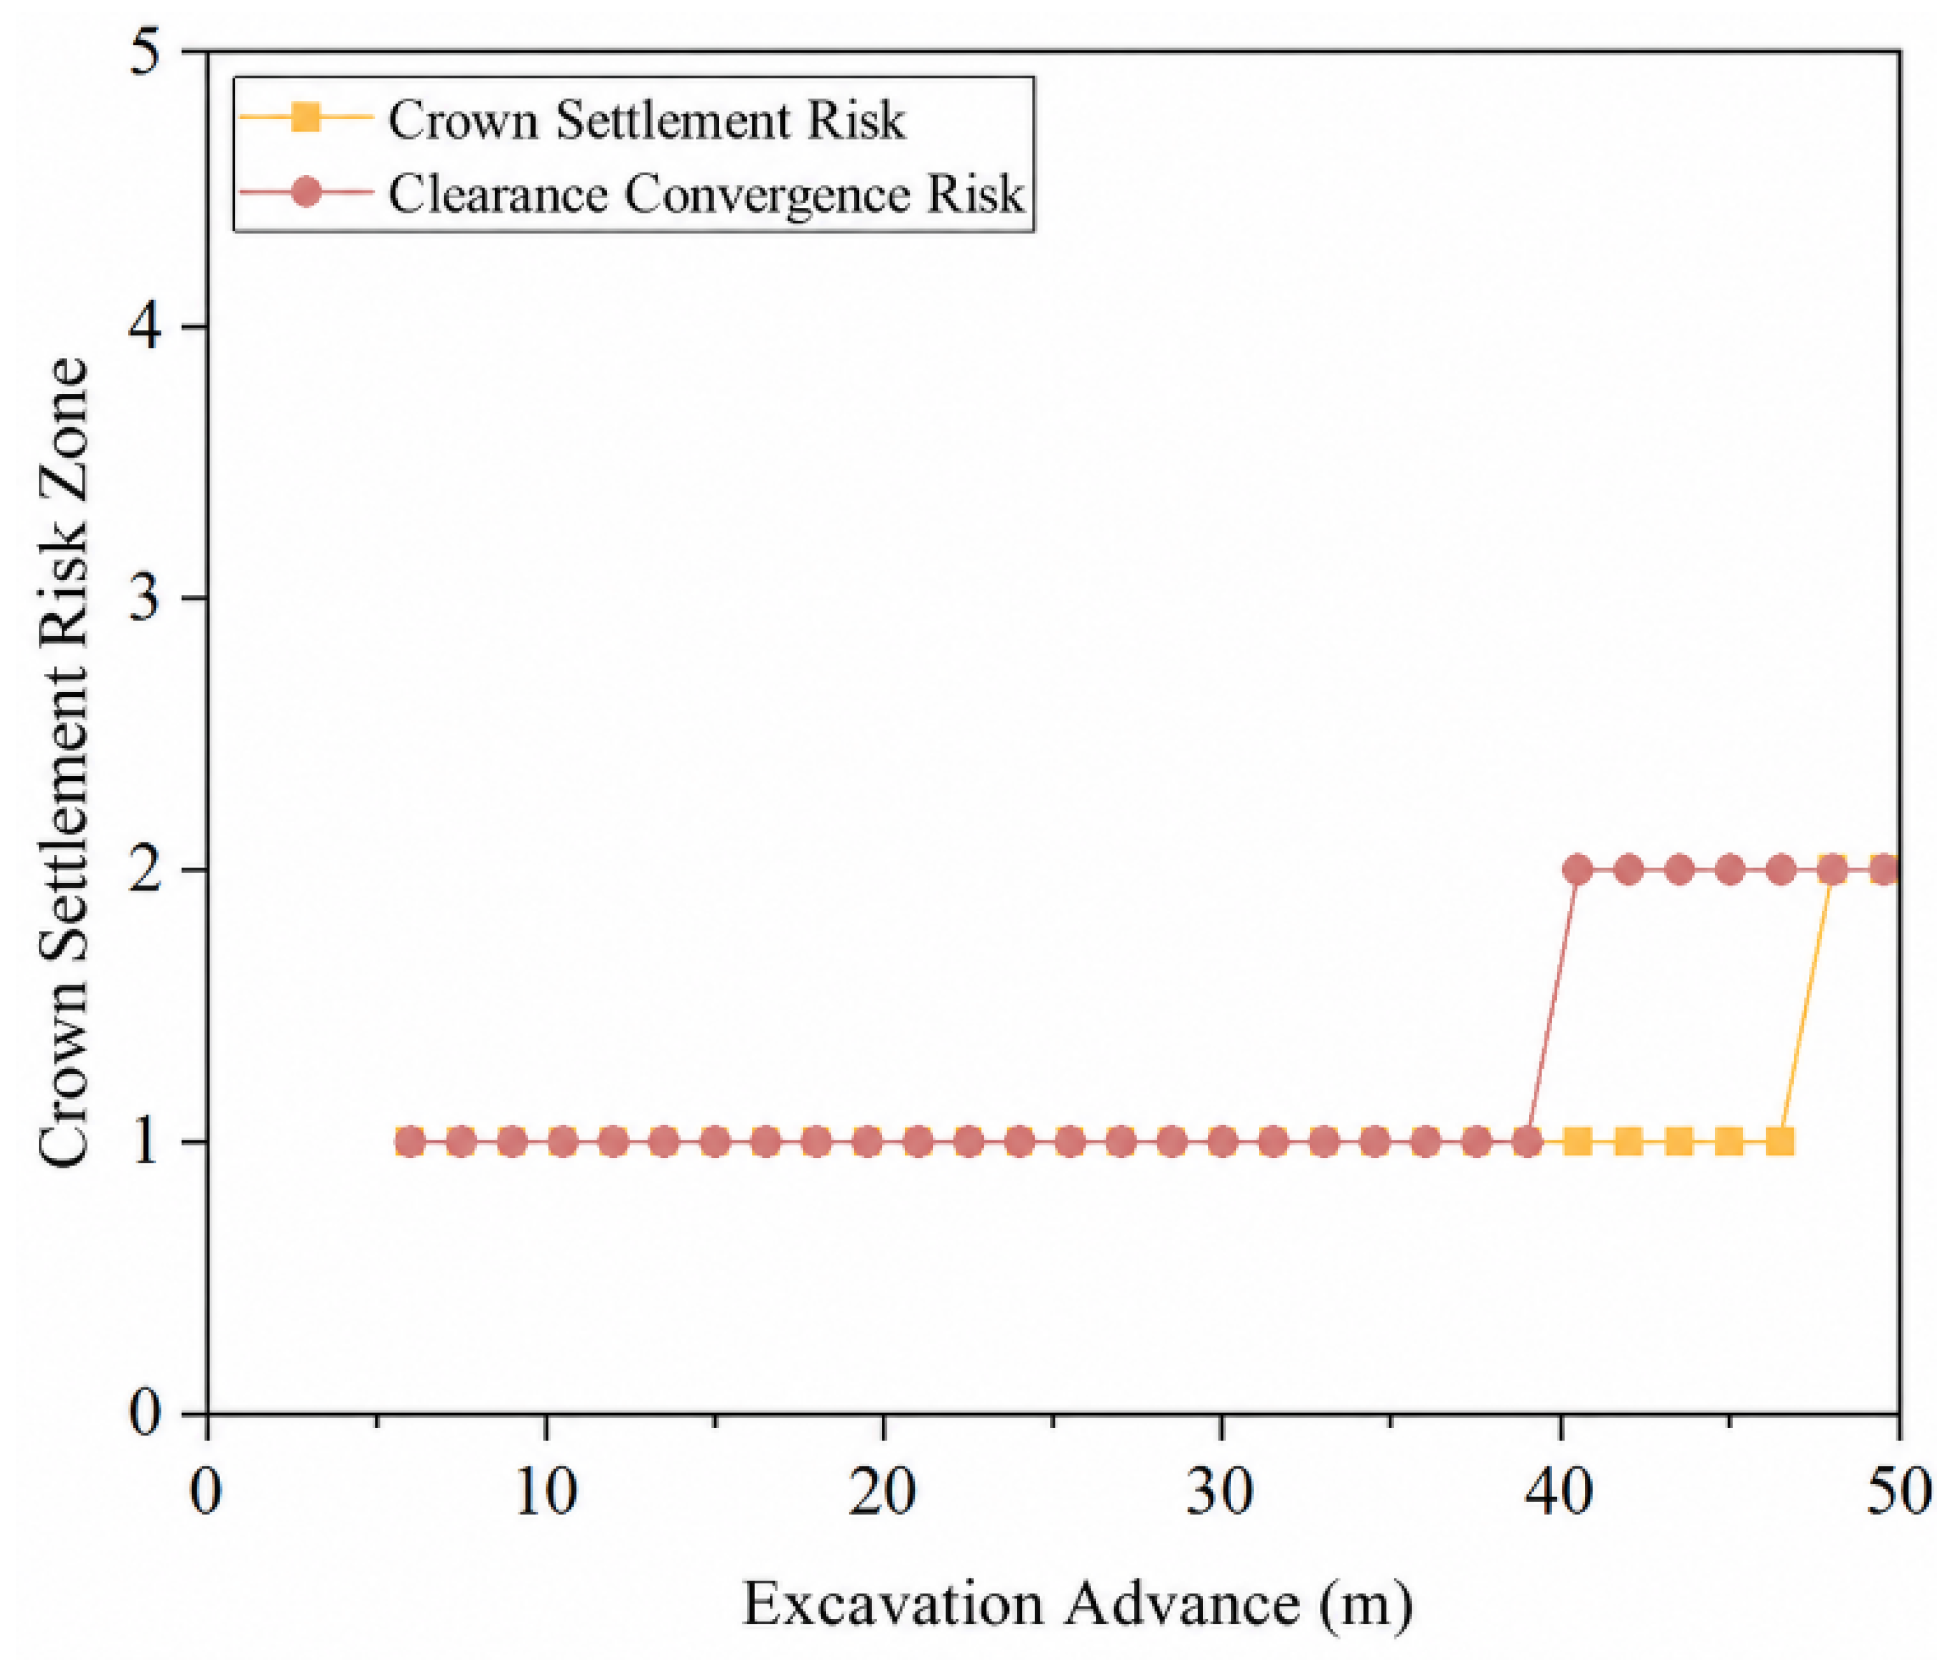
The parameters are input into the forward cloud model for calculation, and risk evaluation cloud diagrams for each excavation stage are obtained. The risk evaluation cloud diagram for the last excavation cycle is shown in Figure 14. The corresponding membership degrees obtained from this assessment window using Equations (6)–(8) are reported in Table 11. The risk grade is determined according to the maximum membership degree, and the variation in risk grade throughout the excavation process is shown in Figure 15. It should be emphasized that these membership degrees are obtained from displacement responses calculated using the defect-weakened numerical model. Therefore, the final risk memberships already incorporate the influence of existing tunnel defects through their effects on structural stiffness and excavation-induced deformation. In other words, the defect condition does not independently determine the risk grade; rather, it modifies the mechanical response that forms the quantitative basis of the subsequent cloud-model assessment. The corresponding deformation responses are presented in Figure 12, while the warning values and risk-grade thresholds are given in Table 7 and Table 8, respectively. Therefore, Figure 15 focuses on the stagewise evolution of the resulting risk grades with excavation advance. Each plotted risk grade is determined from an assessment window containing five consecutive excavation cycles.
Figure 14.
Risk evaluation cloud diagrams: (a) evaluation cloud for crown settlement; (b) evaluation cloud for clearance convergence.
Table 11.
Membership degrees of risk assessment.
Figure 15.
Variation in risk grade during excavation.
For example, in the final assessment window, the five crown-settlement risk scores yielded Ex = 1.763, En = 0.176, and He = 0.068, while the five clearance-convergence scores yielded Ex = 2.238, En = 0.232, and He = 0.107. Their maximum memberships were 0.418 and 0.406, respectively, both corresponding to Grade 2. The membership values in Table 11 are non-normalized certainty degrees independently calculated with respect to each standard risk cloud rather than mutually exclusive probabilities. Therefore, their sum is not required to equal one. Because all risk grades are evaluated using the same membership function, cloud-droplet number, and repeated-sampling procedure, the maximum-membership principle can be used to identify the standard risk cloud most consistent with the evaluation cloud. When the two largest membership values are close, both values should be considered to reflect classification uncertainty.
The numerical stability of the above assessment results was further examined using the final five-cycle assessment window. The hyper-entropy coefficient k, number of cloud droplets n, and number of repeated calculations R were varied within 0.05–0.20, 1000–10,000, and 100–2000, respectively, while the other parameters were kept unchanged. Variations in n and R resulted in changes of less than 0.001 in the dominant Grade-2 membership for both deformation indicators, and both crown settlement and clearance convergence remained consistently classified as Grade 2 under all tested conditions. For the adopted n = 5000 and R = 1000, the standard deviations of the Grade-2 membership over the repeated calculations were 0.0046 and 0.0047 for crown settlement and clearance convergence, respectively. Variation in k over the tested range did not alter the final risk grade. These results indicate that the adopted settings of k = 0.1, n = 5000, and R = 1000 provide sufficiently stable numerical results for the present assessment.
From the calculated risk-grade membership degrees, neither deformation indicator shows membership in the high-risk levels of Grades 4 and 5, indicating that the structural deformation of the tunnel expansion project is generally within a controllable range and that no high-risk hazards exist. The membership degree of crown settlement is highly concentrated in the Grade 2 risk interval, reaching 0.418, which indicates that the risk state of crown settlement is stable and that the current construction method and support system effectively control vertical deformation at the crown. The membership degree of clearance convergence is mainly concentrated in the Grade 2 risk interval, reaching 0.406. Its Grade 1 membership is only 0.013, and its Grade 3 membership is 0.026. Because both indicators were classified as Grade 2 according to the maximum-membership principle, Table 11 alone does not establish an ordinal risk ranking between them. The priority assigned to clearance convergence is instead based on its earlier transition to Grade 2 during excavation and its retained Grade 3 membership of 0.026, indicating that transverse deformation was more sensitive to reconstruction-induced disturbance than crown settlement. In subsequent construction, sidewall support parameters should be optimized in a targeted manner, routine monitoring of clearance convergence should be strengthened, and excavation procedures should be adjusted in time to avoid risk escalation caused by continuous deformation development, thereby ensuring long-term stability of the tunnel structure. To further examine the influence of lining deterioration on the final risk assessment, the deformation responses obtained for the three weakening-coefficient scenarios were evaluated using the same five-cycle assessment window, warning thresholds, and cloud-model calculation procedure described above. For crown settlement, the final risk grade changed from Grade 1 under the intact condition (αE = 1.00) to Grade 2 for both αE = 0.80 and 0.65. For clearance convergence, all three scenarios remained at Grade 2 according to the maximum-membership criterion, although the calculated convergence increased progressively as the lining stiffness decreased. These results indicate that increasing deterioration not only amplifies the deformation response but also shifts the corresponding risk state toward higher grades. Within the deterioration range considered in this study, this effect is more evident for crown settlement, whereas the increase in clearance convergence is not sufficient to cross the next risk-grade boundary.
The dynamic assessment results indicate that both crown settlement and clearance convergence remained below the high-risk levels of Grades 4 and 5 throughout the analyzed excavation process. However, the similar final Grade 2 membership degrees of crown settlement (0.418) and clearance convergence (0.406) should not be interpreted as indicating identical structural responses. Clearance convergence entered Grade 2 earlier during excavation and retained a small Grade 3 membership of 0.026, whereas the membership of crown settlement was more concentrated in Grades 1 and 2. This difference indicates that the transverse deformation response of the traffic-bearing tunnel was more sensitive to the reconstruction disturbance than the vertical crown response.
From a mechanical perspective, reconstruction excavation changes the lateral restraint conditions of the existing tunnel and redistributes the surrounding-rock load. The sidewall region is therefore more susceptible to excavation-induced unloading and support-condition changes, while the crown deformation remains relatively well restrained by the existing support system. The earlier transition of clearance convergence is also related to the staged reconstruction geometry and excavation sequence. Sequential pilot-heading excavation repeatedly changes the lateral restraint around the existing tunnel sidewalls, whereas the crown remains comparatively better confined by the surrounding ground and support system. The reduced equivalent stiffness associated with the existing defects further increases the sensitivity of the transverse deformation response to such excavation-induced unloading. Consequently, the engineering significance of the assessment is not simply that the tunnel remained in a relatively safe state, but that clearance convergence represents the more sensitive indicator for identifying deterioration of the traffic-bearing-side response. During the later excavation stages, monitoring frequency and temporary-support inspection should therefore preferentially focus on transverse convergence. Compared with direct threshold classification, the cloud model does not necessarily change the dominant risk grade in the present case, but provides additional information on the transition between adjacent grades. For example, clearance convergence is predominantly classified as Grade 2 with a membership degree of 0.406, while retaining a Grade 3 membership of 0.026; a deterministic threshold method would only assign a single discrete grade. Therefore, the added value of the cloud model lies mainly in characterizing the uncertainty and gradual migration of the risk state near grade boundaries rather than replacing the engineering thresholds.
4.2. Comparison with Existing Risk Assessment Methods
Conventional multi-criteria decision-making methods, such as AHP, TOPSIS, and ANP, have been widely used in engineering risk assessment because of their relatively simple implementation and their ability to integrate multiple qualitative and quantitative factors [3,4,5]. These methods are particularly useful for identifying and ranking potential risk factors at the project level. However, their assessment results generally depend on the selected indicator system, expert judgment, weighting schemes, and the engineering state at the time of evaluation. Consequently, when applied to tunnel reconstruction, they may have limited capability to directly characterize the continuous evolution of structural mechanical responses caused by staged excavation.
Cloud-model-based approaches provide an alternative means of dealing with the fuzziness and randomness associated with engineering risk. Wang et al. [9], for example, combined weighting methods with a normal cloud model for water-inrush risk assessment during karst tunnel excavation. More recently, cloud models have been further extended to dynamic tunnel construction risk assessment. Sun et al. [11] developed a dynamic risk early-warning system for tunnel construction based on a two-dimensional cloud model. Their framework combines knowledge-driven consequence data with dynamically updated survey, design, construction, and monitoring data to quantify risk probability and update warning states during construction. This approach has the advantage of incorporating continuously changing multi-source construction information and explicitly representing risk uncertainty.
Cloud models have also been integrated with probabilistic causal models. Chen et al. [12] proposed a hybrid trapezoidal cloud model–Bayesian network (TCM-BN) approach for assessing the safety risk of shield tunneling beneath existing tunnels. Twelve risk factors were incorporated into the model, and the Bayesian network enabled forward reasoning, sensitivity analysis, and reverse diagnosis to identify unfavorable and sensitive factors. Such an approach is particularly advantageous when the causal relationships among multiple risk sources need to be explicitly represented and diagnosed.
The present framework differs from these approaches primarily in the mechanism through which existing -tunnel deterioration enters the risk assessment. Rather than directly assigning scores to tunnel defects or constructing probabilistic relationships among numerous risk factors, field-identified defects are first incorporated into a three-dimensional mechanical model through equivalent stiffness degradation. The resulting deformation responses are validated against field monitoring data and are subsequently used as quantitative inputs to the cloud model. Therefore, the proposed framework places greater emphasis on the mechanical transmission of defect effects from structural deterioration to excavation-induced deformation and ultimately to dynamic risk membership.
Each approach has distinct advantages and limitations. AHP-, TOPSIS-, and ANP-based approaches are efficient for multi-factor screening and ranking but are relatively dependent on expert judgment and predefined weights. Dynamic two-dimensional cloud models can integrate multi-source time-varying information and provide probabilistic risk warnings, but they require the establishment and updating of relatively comprehensive risk datasets. TCM-BN methods provide stronger capabilities for causal reasoning, sensitivity analysis, and reverse diagnosis, although their implementation requires the definition of network structures and conditional probability relationships. In contrast, the present method is directly linked to the mechanical response of the existing tunnel and requires fewer subjective risk-factor scores, but its reliability depends more strongly on the accuracy of the numerical model, defect-equivalence scheme, and monitoring-based validation. Therefore, these approaches should be regarded as complementary rather than universally superior to one another.
4.3. Limitations and Applicability
Despite the above advantages, several limitations of the present study should be acknowledged. First, existing lining cracks, looseness, and voids behind the lining exhibit considerable spatial heterogeneity, whereas their combined influence is represented in the numerical model through an equivalent elastic-modulus-weakening coefficient. This treatment is appropriate for characterizing the overall deterioration of structural stiffness but cannot explicitly reproduce local crack opening and propagation, contact separation, or the detailed geometry and local mechanical effects of individual voids. Therefore, the weakening coefficient should be regarded as a project-specific equivalent parameter rather than a universal material property. Although three representative weakening-coefficient scenarios (αE = 1.00, 0.80, and 0.65) were compared, the present analysis does not fully quantify the uncertainty associated with the equivalent stiffness-reduction coefficient.
Second, crown settlement and clearance convergence are adopted as the principal indicators for dynamic risk assessment because they directly reflect the vertical and transverse deformation of the traffic-bearing tunnel and can be continuously obtained during staged excavation. However, structural risk during tunnel reconstruction may also be affected by lining stress, crack development, groundwater response, construction vibration, and vehicle-induced dynamic loading. Incorporating these additional monitoring variables could provide a more comprehensive representation of structural safety, particularly for tunnels subjected to complex coupled disturbances.
Third, the weakening coefficients and deformation warning thresholds used in the proposed framework are related to the structural condition, geological environment, and construction scheme of the investigated project. Directly transferring these parameters to other tunnels with different structural forms, defect patterns, geological conditions, or reconstruction methods may introduce additional uncertainty. Project-specific inspection and monitoring data are therefore required for recalibration when the method is applied elsewhere. The present three-scenario comparison provides a preliminary sensitivity check, while broader uncertainty quantification of the weakening coefficient remains to be investigated in future studies.
Fourth, the present study is based on a single shallow-buried in situ-reconstruction and expansion project. Although the numerical deformation results show good agreement with field monitoring data, broader validation using additional reconstruction projects is still required to assess the general applicability of the proposed framework. Furthermore, uncertainty in geotechnical and structural parameters has not been explicitly propagated through the numerical simulation and cloud-model calculation. Construction blasting vibration, coupled groundwater seepage–stress effects, and long-term vehicle dynamic loads are also not explicitly considered in the present model.
Future research should therefore focus on spatially explicit representation of major defects, integration of multi-source monitoring indicators, probabilistic updating of uncertain model parameters, and validation across tunnels with different structural forms and geological conditions. These developments would further improve the robustness and generalizability of the proposed dynamic risk assessment framework.
5. Conclusions
This study investigated the dynamic safety of the traffic-bearing side during in situ-tunnel reconstruction and expansion while explicitly considering the deterioration of the existing tunnel. The main conclusions are as follows:
(1) Existing tunnel defects influence construction risk primarily through their effects on structural stiffness and deformation response. Lining cracking, looseness, and voids behind the lining reduce the effective restraint and load-sharing capacity of the existing structure. In the proposed framework, the influence of existing defects is first represented by an equivalent degradation of structural stiffness, which subsequently affects the excavation-induced deformation response. The resulting deformation characteristics are then incorporated into the cloud model to determine the corresponding risk membership. In this way, existing defects affect the final risk assessment through their mechanically induced influence on structural response, rather than by being assigned an additional subjective risk score. This establishes a physically interpretable connection between the pre-existing structural condition and the subsequent dynamic risk state.
(2) For the present project, the defect-informed numerical model reproduced the overall trend of the measured deformation evolution with reasonable agreement. At an excavation advance of 47.0 m, the measured and simulated crown settlements of the left main tunnel were 2.40 and 2.73 mm, respectively, corresponding to a relative deviation of 13.75%. Moreover, the differences between simulated and measured responses at more than 80% of the excavation-distance points were within 1 mm. These results provide project-specific engineering support for the adopted equivalent stiffness-degradation treatment, but do not constitute universal validation of the weakening coefficients.
(3) The deformation-based dynamic risk assessment showed that crown settlement and clearance convergence were both predominantly classified as Grade 2, with maximum membership degrees of 0.418 and 0.406, respectively, and neither indicator entered the Grade 4–5 high-risk range. However, clearance convergence entered Grade 2 earlier and retained a Grade 3 membership of 0.026, indicating that transverse deformation was more sensitive to reconstruction-induced disturbance than crown settlement. Therefore, clearance convergence and sidewall deformation should receive priority attention during subsequent monitoring and support control.
(4) The methodological contribution of this study lies in integrating defect-induced stiffness deterioration, excavation-stage mechanical response, field-monitoring validation, and cloud-model-based uncertainty characterization within a unified dynamic risk assessment framework. Compared with risk assessment methods that rely primarily on expert scoring or directly assigned risk-factor ratings, the proposed method introduces existing tunnel deterioration through its mechanically induced deformation response, thereby providing a more physically interpretable basis for dynamic risk evaluation. In engineering practice, the framework can support stage-dependent identification of sensitive deformation indicators and assist in optimizing monitoring and support measures during reconstruction. The general methodological framework has the potential to be extended to other tunnel reconstruction projects; however, the elastic-modulus-weakening coefficients, warning thresholds, geological parameters, and numerical model should be recalibrated and validated using project-specific inspection and monitoring data before application. The conclusions are based on a single shallow-buried reconstruction project and an equivalent modulus-reduction representation of tunnel defects; broader project validation, parameter-sensitivity analysis, and integration of multi-source monitoring indicators are still required before wider application.
Author Contributions
Conceptualization, C.S., X.Z., Y.H., H.X., Y.J., C.J. and H.K.; methodology, H.X., Y.J., C.J. and H.K.; formal analysis, C.S., X.Z.; resources, C.J.; data curation, Y.H., H.X., Y.J.; writing—original draft preparation, C.S., X.Z.; writing—review and editing, C.S.; visualization, C.J.; project administration, C.J. All authors have read and agreed to the published version of the manuscript.
Funding
This research was funded by the Science and Technology Project of Guizhou Road & Bridge Group Co., Ltd., grant number GPTJ-18-QJ-01. The APC was funded by Guizhou Road & Bridge Group Co., Ltd.
Data Availability Statement
The numerical and monitoring data supporting the findings of this study are available from the corresponding author upon reasonable request for non-commercial academic use, subject to approval by the project owner and compliance with applicable confidentiality requirements. The data will remain under embargo for 12 months after publication because the engineering project and related publications are still ongoing.
Conflicts of Interest
Authors Chengjia Sun, Xiangbo Zhou, Yucong Huang, Haibin Xu and Yuefei Jing were employed by the company Shandong Hi-Speed Engineering Construction Group Co., Ltd. Author Huajiang Kuang was employed by the company Guizhou Road & Bridge Group Co., Ltd. The remaining authors declare that the research was conducted in the absence of any commercial or financial relationships that could be construed as a potential conflict of interest. The authors declare that this study received funding from Guizhou Road & Bridge Group Co., Ltd. The funder was not involved in the study design, collection, analysis, interpretation of data, the writing of this article or the decision to submit it for publication.
References
- Bai, Y.; Yang, Z.; Jiang, Z. Key protection techniques adopted and analysis of influence on adjacent buildings due to the Bund Tunnel construction. Tunn. Undergr. Space Technol. 2014, 41, 24–34. [Google Scholar] [CrossRef] [Scilit]
- Song, Z.; Zhang, Z.; Cheng, Y.; Huo, R.; Zhang, Y. Research trends and prospects of reconstruction and expansion technology for existing highway tunnels. Chin. J. Undergr. Space Eng. 2023, 19, 1216–1234. (In Chinese) [Google Scholar] [CrossRef]
- Panchal, S.; Shrivastava, A.K. Landslide hazard assessment using analytic hierarchy process (AHP): A case study of National Highway 5 in India. Ain Shams Eng. J. 2022, 13, 101626. [Google Scholar] [CrossRef] [Scilit]
- Ning, X.; Zhang, H.; Xu, J. Comprehensive safety assessment of energy storage power stations based on improved AHP-TOPSIS. Acta Energiae Solaris Sin. 2024, 45, 251–259. (In Chinese) [Google Scholar] [CrossRef]
- Lyu, H.-M.; Yin, Z.-Y.; Zhou, A.; Shen, S.-L. Sensitivity analysis of typhoon-induced floods in coastal cities using improved ANP-GIS. Int. J. Disaster Risk Reduct. 2024, 104, 104344. [Google Scholar] [CrossRef] [Scilit]
- Zhang, S.; Xu, C.; An, Y. Study on the risk evaluation approach based on cloud model. J. Univ. Electron. Sci. Technol. China 2013, 36, 422–431. (In Chinese) [Google Scholar]
- Liu, C.; Li, D.; Du, Y.; Han, X. Some statistical analysis of the normal cloud model. Inf. Control 2005, 34, 236–239. (In Chinese) [Google Scholar] [CrossRef]
- Yang, Z.; Huang, X.; Fang, G.; Yang, H. Risk assessment method and application of levee engineering based on cloud model. Eng. J. Wuhan Univ. 2019, 52, 572–580. (In Chinese) [Google Scholar]
- Wang, X.; Li, S.; Xu, Z.; Hu, J.; Pan, D.; Xue, Y. Risk assessment of water inrush in karst tunnels excavation based on normal cloud model. Bull. Eng. Geol. Environ. 2019, 78, 3783–3798. [Google Scholar] [CrossRef] [Scilit]
- Yang, S.; Han, X.; Cao, B.; Li, B.; Yan, F. Cloud-model-based method for risk assessment of mountain torrent disasters. Water 2018, 10, 830. [Google Scholar] [CrossRef] [Scilit]
- Sun, H.; Zhu, M.; Dai, Y.; Liu, X.; Li, X. Dynamic risk early warning system for tunnel construction based on two-dimensional cloud model. Expert Syst. Appl. 2024, 255, 124799. [Google Scholar] [CrossRef] [Scilit]
- Chen, H.; Shen, G.Q.; Feng, Z.; Yang, S. Safety risk assessment of shield tunneling under existing tunnels: A hybrid trapezoidal cloud model and Bayesian network approach. Tunn. Undergr. Space Technol. 2024, 152, 105936. [Google Scholar] [CrossRef] [Scilit]
- Qiu, W.; Ma, P.; Peng, Q.; Zhao, L.; Liu, L.; Zhou, F. An evaluation method for multisource information fusion in tunneling water inrush disasters. J. Constr. Eng. Manag. 2024, 150, 04024133. [Google Scholar] [CrossRef] [Scilit]
- Xu, T.; Song, Z.; Fan, S.; Guo, D. Improved risk assessment model using the cloud theory of the existing tunnel in foundation pit construction environment. Eng. Constr. Archit. Manag. 2025, 33, 3737–3760. [Google Scholar] [CrossRef] [Scilit]
- Usman, M.; Galler, R. Long-term deterioration of lining in tunnels. Int. J. Rock Mech. Min. Sci. 2013, 64, 84–89. [Google Scholar] [CrossRef] [Scilit]
- Li, D.; Liu, C.; Gan, W. A new cognitive model: Cloud model. Int. J. Intell. Syst. 2009, 24, 357–375. [Google Scholar] [CrossRef] [Scilit]
- Li, D.; Meng, H.; Shi, X. Membership clouds and membership cloud generators. J. Comput. Res. Dev. 1995, 32, 15–20. (In Chinese) [Google Scholar]
- Huang, M. Tunnel engineering monitoring and safety evaluation based on information-based construction and intelligent management. Highway 2023, 68, 249–255. (In Chinese) [Google Scholar]
- DBJ/T 13-336-2020; Technical Specification for Structural Safety Monitoring during Operation of Urban Rail Transit. Department of Housing and Urban-Rural Development of Fujian Province: Fuzhou, China, 2020.
- JTG/T 3660-2020; Technical Specifications for Construction of Highway Tunnels. Ministry of Transport of the People’s Republic of China: Beijing, China, 2020.
- Han, B.; Jia, W.; Feng, W.; Liu, L.; Zhang, Z.; Guo, Y.; Niu, M. Safety risk assessment of loess tunnel construction under complex environment based on game theory-cloud model. Sci. Rep. 2023, 13, 12249. [Google Scholar] [CrossRef] [Scilit]
- Cui, C.-Q.; Wang, B.; Zhao, Y.-X.; Wang, Q.; Sun, Z.-M. China’s regional sustainability assessment on mineral resources: Results from an improved analytic hierarchy process-based normal cloud model. J. Clean. Prod. 2019, 210, 105–120. [Google Scholar] [CrossRef] [Scilit]
- Wang, D.; Zeng, D.; Singh, V.P.; Xu, P.; Liu, D.; Wang, Y.; Zeng, X.; Wu, J.; Wang, L. A multidimension cloud model-based approach for water quality assessment. Environ. Res. 2016, 149, 113–121. [Google Scholar] [CrossRef] [Scilit]
- Shen, S.-L.; Lin, S.-S.; Zhou, A. A cloud model-based approach for risk analysis of excavation system. Reliab. Eng. Syst. Saf. 2023, 231, 108984. [Google Scholar] [CrossRef] [Scilit]
- Gao, F. An integrated risk analysis method for tanker cargo handling operation using the cloud model and DEMATEL method. Ocean Eng. 2022, 266, 113021. [Google Scholar] [CrossRef] [Scilit]
- Zhang, S.; Xiang, M.; Xu, Z.; Wang, L.; Zhang, C. Evaluation of water cycle health status based on a cloud model. J. Clean. Prod. 2020, 245, 118850. [Google Scholar] [CrossRef] [Scilit]

Disclaimer/Publisher’s Note: The statements, opinions and data contained in all publications are solely those of the individual author(s) and contributor(s) and not of MDPI and/or the editor(s). MDPI and/or the editor(s) disclaim responsibility for any injury to people or property resulting from any ideas, methods, instructions or products referred to in the content. |
© 2026 by the authors. Licensee MDPI, Basel, Switzerland. This article is an open access article distributed under the terms and conditions of the Creative Commons Attribution (CC BY) license.