1. Introduction
Throughout the historical development of the construction industry, the balance between the mechanical performance of building materials and their environmental impact has always been a critical area of research. The high raw material consumption of traditional heavy concrete and masonry bricks, the excessive energy demands in their production processes, and the enormous loads they add to structures have driven modern engineering to seek more sustainable, lightweight, and energy-efficient alternatives [
1,
2]. One of the most successful and widespread results of this pursuit is autoclaved aerated concrete (AAC) technology. First developed in the mid-1920s at the Royal Swedish Institute of Technology by Swedish architects and inventors Johan Axel Eriksson and Henrik Kreüger as a response to the severe energy crises following World War I, this innovative material was patented in 1924 and became a global standard in 1929 when commercial production began in Yxhult [
3,
4].
AAC is an ultra-lightweight, precast building material that can weigh up to one-fifth of standard concrete blocks thanks to its porous structure [
5]. In the context of current building physics standards, the importance of aerated concrete stems from the versatile performance optimization it offers. Superior to most traditional lightweight block types, it boasts an average compressive strength 25% higher than other products of the same density, making it not only an insulation material but also a reliable load-bearing and semi-load-bearing structural element [
6]. From a production efficiency perspective, the volume of a finished AAC product can reach up to five times the volume of the initial raw material, and the final product can contain 70% to 80% air. This high porosity provides resource efficiency against the chronic global shortage of structural raw materials, while also minimizing the environmental footprint of structures [
5].
The correlations between the structural properties and density of the material have been investigated through various studies. Experimental studies have revealed an exponential relationship between the compressive strength and density of AAC, while fracture energy and modulus of elasticity exhibit an almost entirely linear relationship with density [
7]. Tensile properties such as bending strength are negatively affected by moisture content, decreasing with increasing moisture levels, while the fracture energy of the material remains largely independent of the moisture parameter. Furthermore, the eco-mechanical index, defined through the relationship between the material’s density and thermal conductivity, guides engineers in quickly estimating the compressive and tensile strengths of low-density blocks [
8].
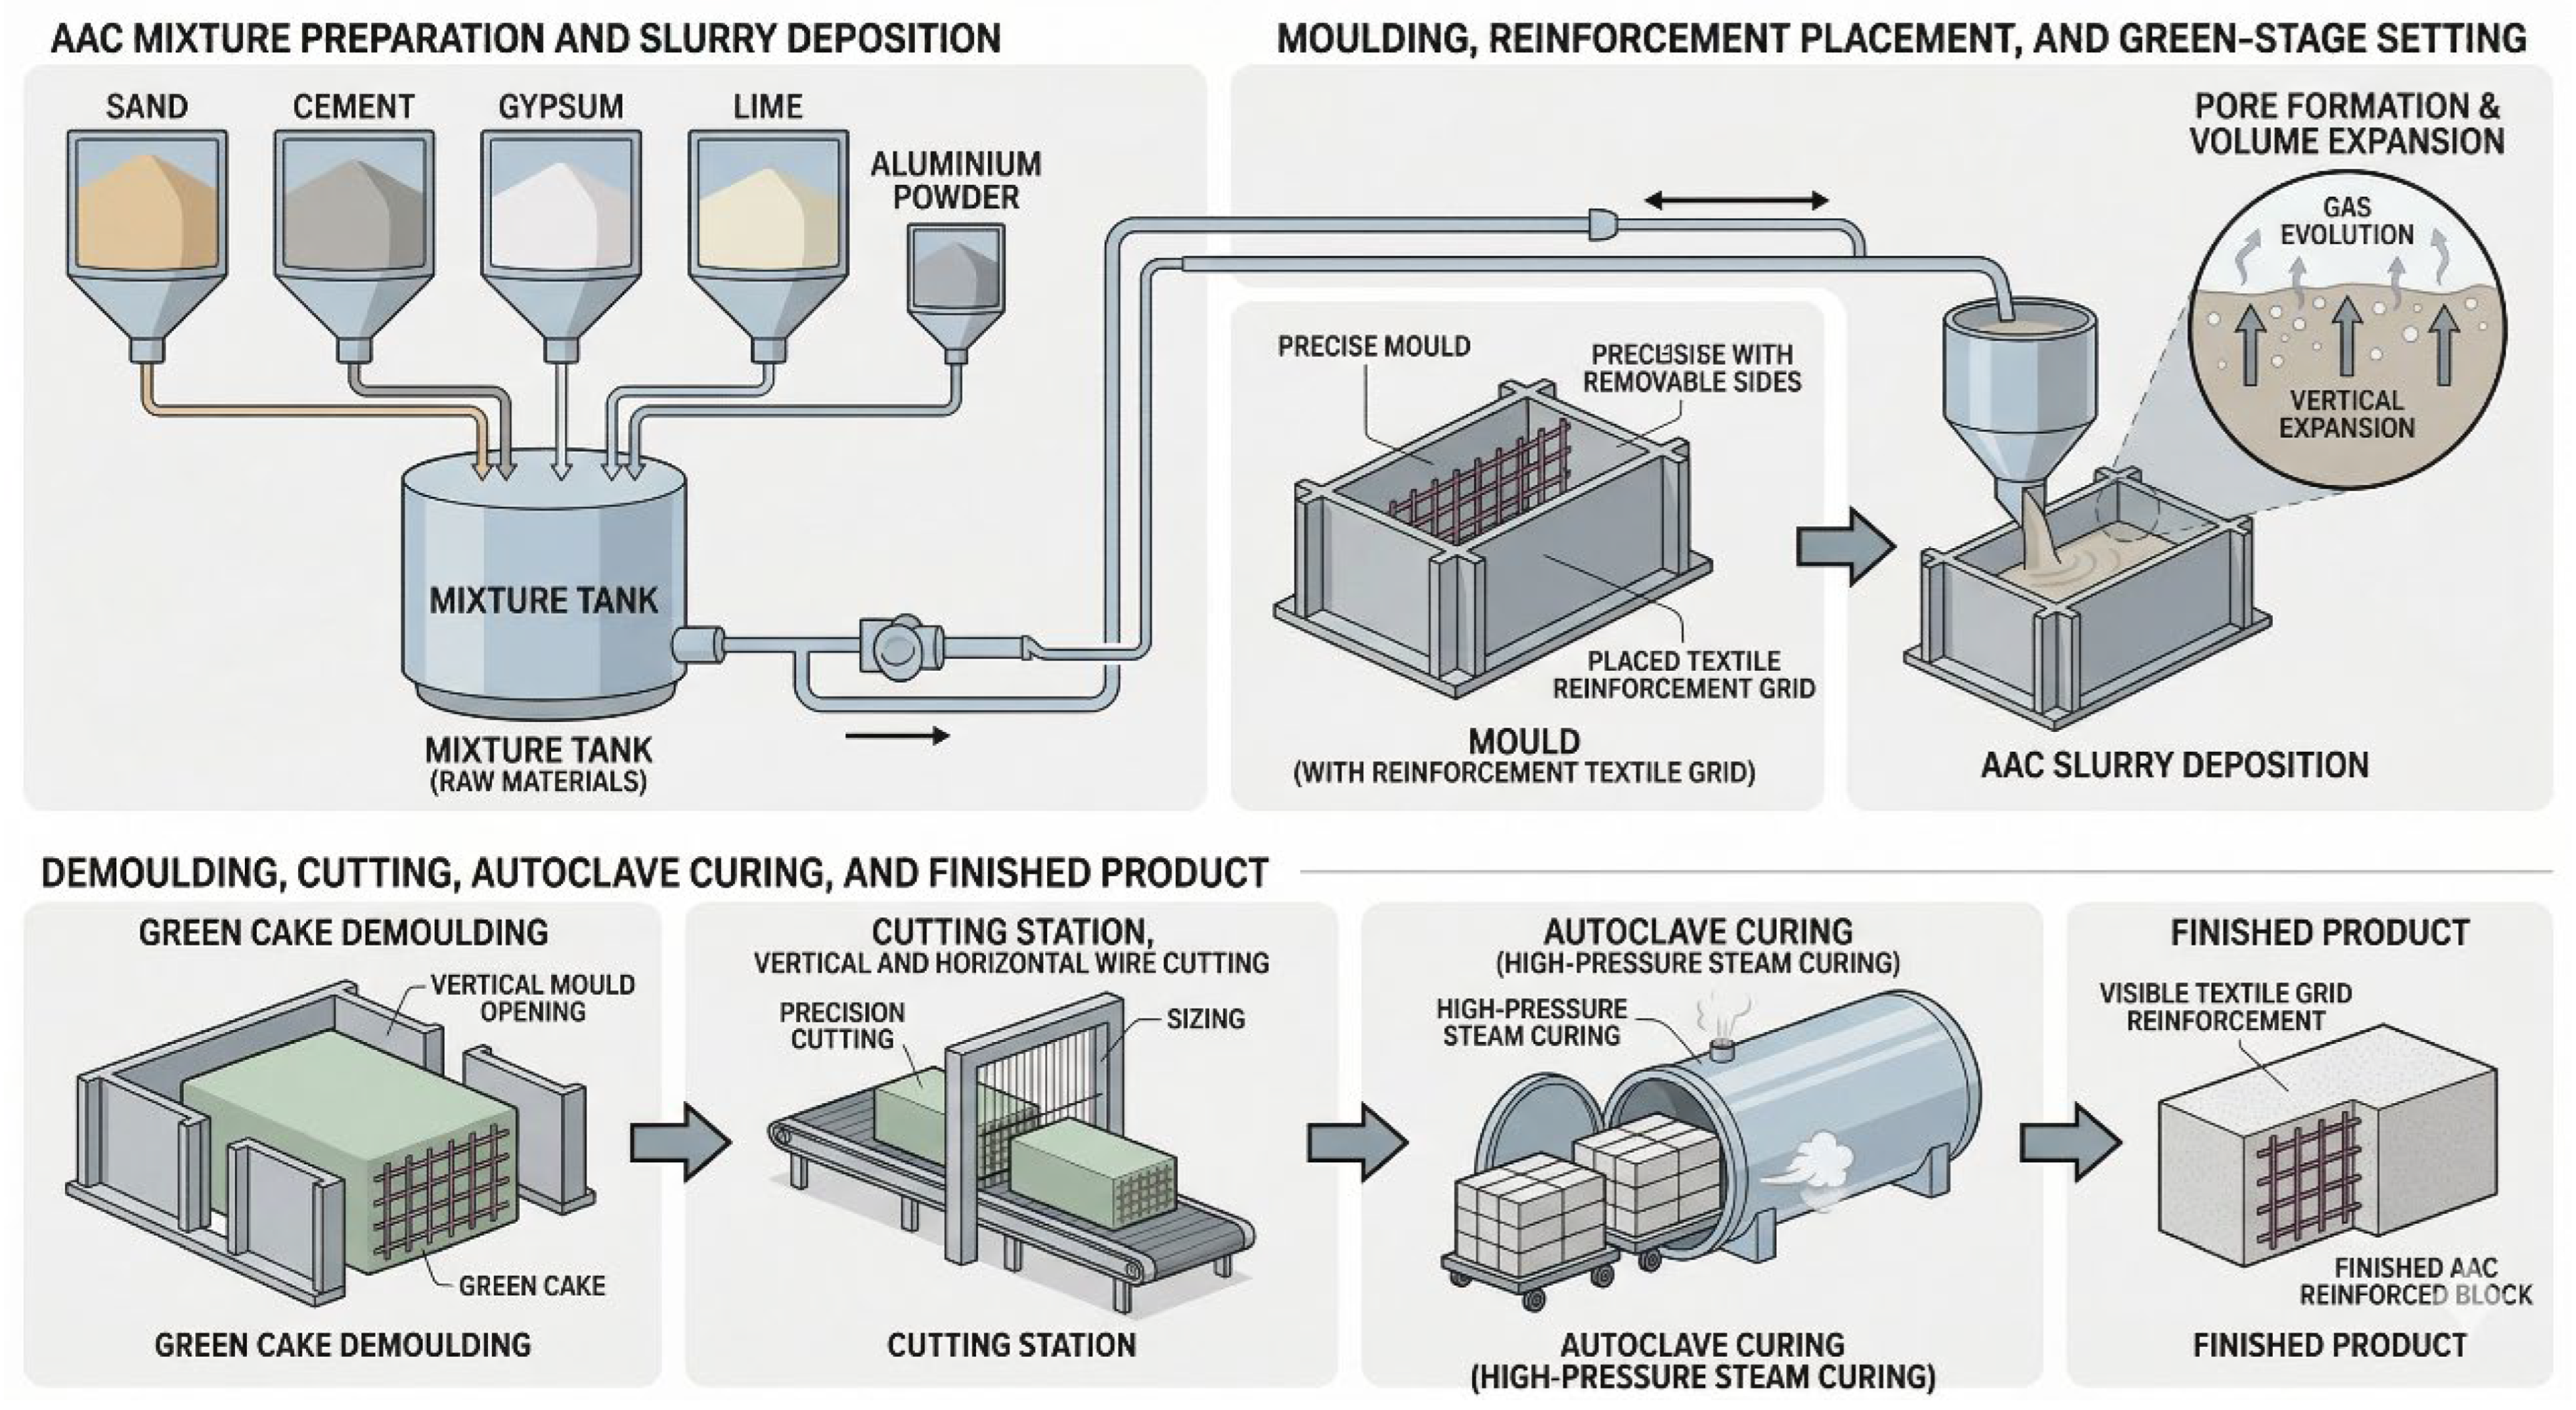
The superior mechanical and physical properties of aerated concrete are based on a very well-calibrated raw material composition and complex hydrothermal reactions. Each stage of the production process, from the processing of mineral raw materials to preheating and autoclaving treatment, directly affects the final quality of the material [
9]. In aerated concrete formulations, silica (silica sand or fly ash) constitutes 60% to 70% by weight. While aerated concrete produced using fly ash exhibits more satisfactory shrinkage properties, the use of high-purity quartz sand ensures the formation of much stronger chemical bonds during the autoclaving phase, maximizing the ultimate compressive strength [
10]. In AAC production, lime (CaO) and cement form the heart of the reaction kinetics. Lime with a purity level of 90% or higher plays three critical roles in the system. First, it combines with silicates and water to form calcium silicate hydrate mixtures responsible for the mechanical strength of the AAC. Second, it reacts with aluminum powder in an alkaline environment, releasing free hydrogen gas and allowing the raw mortar to expand volumetrically. Its third role is to hydrate through an exothermic reaction, generating the internal heat required for the reactions. The Portland cement used in the mixture, by generating heat through hydration, ensures that the green cake reaches a stable early strength [
11]. The pore-forming agent that causes the mortar to expand is aluminum powder or paste, added to the mixture in extremely precise dosages. Hydrogen gas, released as a result of the chemical reaction between the alkaline solution and the aluminum powder during mixing and pre-curing, causes the mortar to expand like dough. After the reaction is complete, the hydrogen gas evaporates, leaving behind an insulating, aerodynamic structure composed of closed cells with approximately 80% porosity [
12]. In standard industrial production, blocks or panels are subjected to steam curing for 8 to 12 h under 12 bar pressure and temperatures between 180 °C and 190 °C. Under hot and humid autoclave conditions, free silica and calcium compounds react to form a highly crystalline “tobermorite” phase. This tobermorite phase is the main source of the material’s compressive strength [
13]. Indeed, studies in which the fine sand content was replaced with recycled AAC powder (AAC-R) confirmed that this modification increased the tobermorite phase, resulting in an additional 16% increase in compressive strength compared to conventional AAC, and directly matching the crystal morphology [
12].
AAC plays a critical role in the construction industry, not only as a structural insulation block but also, when combined with appropriate reinforcement systems, as high-performance precast composite elements such as roof slabs, floor panels, load-bearing wall elements, and lintels. Lintels are horizontal bending elements placed over openings that transfer loads to vertical supports. Unlike wooden or heavy reinforced concrete lintels used since ancient times, aerated concrete lintels (AAC lintels) are modern solutions that do not compromise the insulation integrity of the structure, are lightweight, and do not create thermal bridges [
14,
15]. In aerated concrete masonry buildings, using a different material (e.g., standard reinforced concrete) for lintels leads to shrinkage cracks due to different thermal expansion coefficients between the materials. Therefore, it has become a necessity to use reinforced AAC lintels made from the same material as the aerated concrete structure. Steel-reinforced aerated concrete lintels used in the market and in the European market are produced in two main types according to their design and load-transfer principles: composite lintels and self-supporting lintels [
14,
16].
The bending and shear behavior of reinforced aerated concrete lintels differs significantly from that of conventional heavy reinforced concrete beams due to the cellular nature of the material and the low adhesion between the steel reinforcement and the matrix. Extensive experimental studies have shown that in individual lintel elements, vertical bending cracks initially form in the middle of the span under load, and with increasing load, these cracks transform into diagonal cracks in the shear span region. Due to their brittle structure, ultimate failure occurs with the formation of horizontal adhesion cracks at the steel reinforcement level and the buckling of the stirrup arms within the matrix [
14,
17]. However, when these lintels are tested as a holistic system, together with the aerated concrete masonry walls built on top of them and the reinforced concrete tie beam locking the system from above, the structural performance shows an incredible improvement. The most striking finding is that the load-carrying capacity of the integrated wall system is approximately 4.24 times higher than when the same lintel is tested alone. Furthermore, unlike individual tests, no stirrup arm deformation or buckling was observed in the integrated system. One of the most critical parameters affecting the structural reliability of the lintels is the support conditions; it has been documented that lintels subjected to equal compression along the support region achieve a 30% increase in their total load capacity [
14].
There is still no complete consensus on international specifications regarding the structural modeling of steel-reinforced aerated concrete (RAAC) elements. While regulations in the US appear to calculate the material’s bending capacity excessively conservatively [
18], European standards [
16,
19] are insufficient in terms of practical applicability due to clear formulation deficiencies and unrealistic assumptions. These design ambiguities in the specifications can have devastating consequences that threaten building safety in the real world, as clearly demonstrated by the crisis in the UK in September 2023, where a previously “low-risk” RAAC roof panel suddenly collapsed, leading to the closure of 104 schools [
2,
14].
Although the initial alkaline pore solution provides passivation, the macroporous cellular network and high water absorption capacity of AAC facilitate moisture ingress and progressive atmospheric carbonation over time; this neutralizes matrix alkalinity, degrades protective coatings, and initiates aggressive corrosion of embedded steel. When steel corrodes, its volume expands, cracking the weak matrix and causing the cover to spall [
20,
21]. Another major reason for the incompatibility between steel reinforcement and lightweight aerated concrete matrix is the adhesion problem. While steel reinforcement in general heavy concrete creates excellent mechanical bonding, the porous structure around the reinforcement in lightweight cellular concrete prevents it from finding sufficient contact surface. Tests performed on deep aerated concrete beams with a two-point loading system have shown that major diagonal stress cracks appear in regions near the supports before tensile cracks develop in the bending zone. Although increasing compressive strength improves adhesion, the maximum compressive strength that aerated concrete can achieve is limited by its nature [
17,
22].
In recent years, integration methods in composite material technology have brought to the forefront the concepts of Textile-Reinforced Concrete (TRC) or Textile-Reinforced Mortar (TRM), which are corrosion-resistant and lightweight systems. These textiles, woven into two or three-dimensional networks using materials such as carbon, basalt, and alkali-resistant glass (AR-Glass), are the strongest candidates to replace steel reinforcement due to their high tensile strength and complete resistance to corrosion [
23,
24]. The advantages of textile reinforcements in the construction industry are not only mechanical but also ecological. They eliminate the need for the thick “cover thickness” that is necessarily required to protect steel reinforcement from corrosion. Studies have proven that cover thickness can be safely reduced to levels as low as 30 mm with textile reinforcements. This paves the way for the production of ultra-thin, lightweight, yet high-strength lintel and shell structures with a much lower global warming potential [
25,
26]. From a micromechanical modeling perspective, understanding the constitutive response and stress-transfer mechanisms in such modified cementitious composites requires accounting for internal length scales and interface interactions. Advanced constitutive frameworks, such as granular micromechanics-based formulations developed for ultra-high-performance fiber-reinforced concrete [
27] and nonlinear internal-friction models for modified concrete [
28], emphasize that matrix microstructure, local grain interactions, and internal friction dictate damage evolution and post-cracking load transfer in reinforced cementitious systems.
Although the use of textile reinforcement in general concrete grades has been frequently researched in the literature, the integration of this technology into autoclaved AAC systems is a relatively new and complex field of study [
20]. The macro-pores within AAC prevent full surface contact with textiles, leading to stress concentrations. Special approaches, such as using epoxy resin, have been developed to improve the adhesion of textile networks into the weak tensile zone of cellular concrete. In a notable study in which aerated concrete beams were subjected to bending tests, impregnation of the matrix with only epoxy resin increased the beam capacity by 118%; laminating carbon fabric to the same surface resulted in an astonishing jump in bending strength of 1940% compared to unreinforced AAC [
29].
While textile-reinforced cementitious matrices (TRC/TRM) and non-metallic rebars have been widely investigated in dense mortars and standard concrete, their integration into full-scale, autoclaved aerated concrete elements remains largely unexplored. Most existing studies on composite-modified AAC have focused either on external post-fabrication bonding via organic epoxy resins [
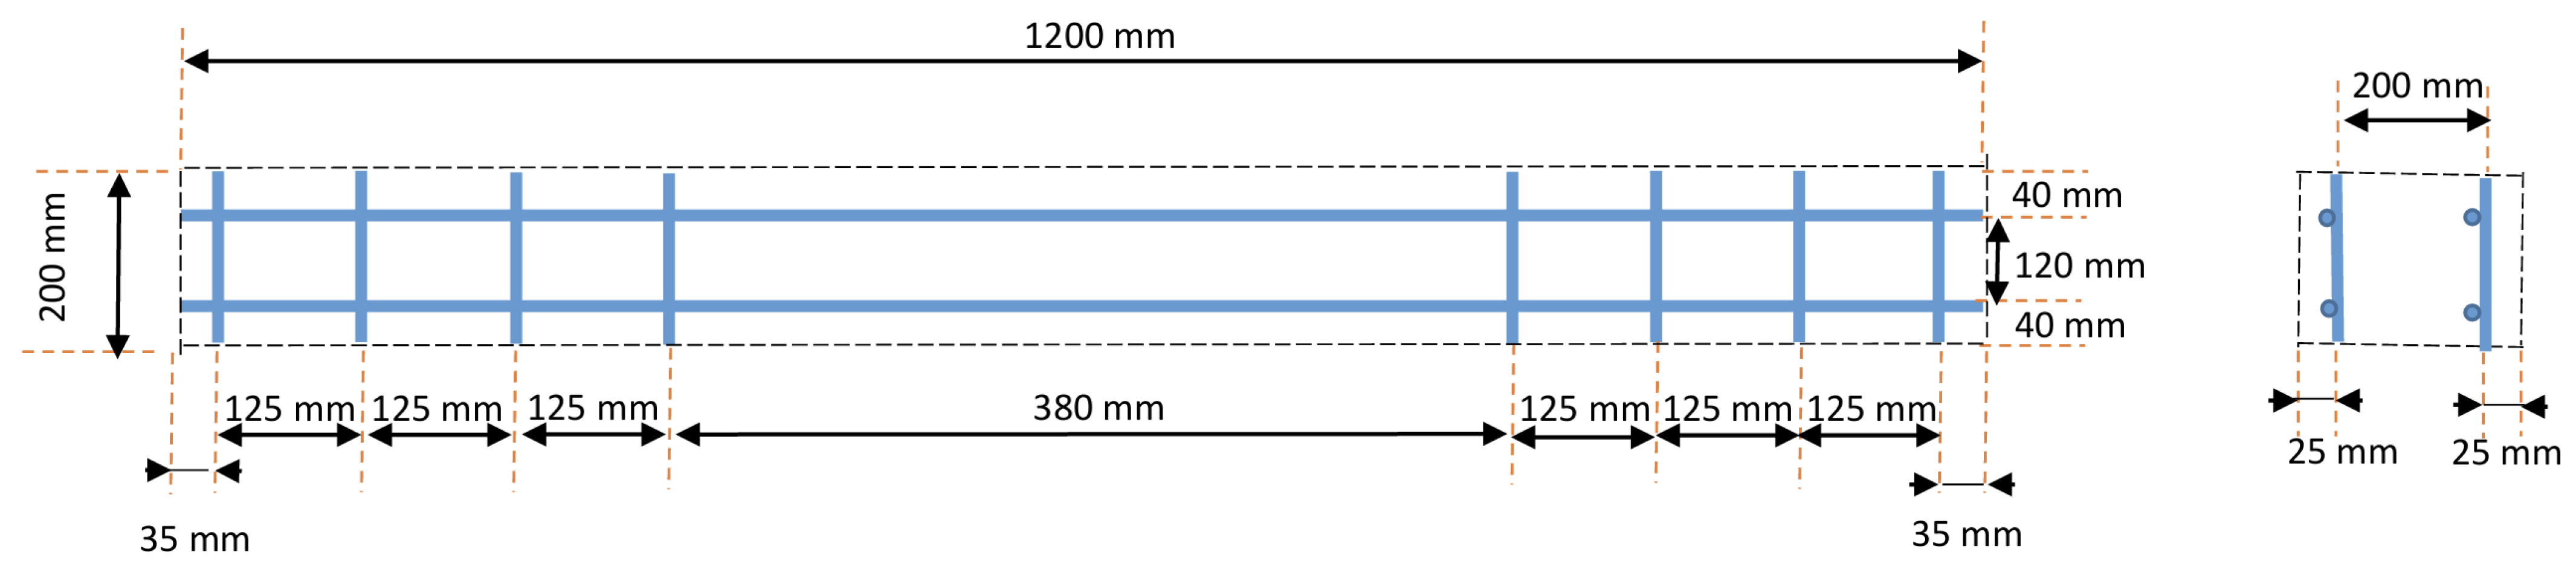
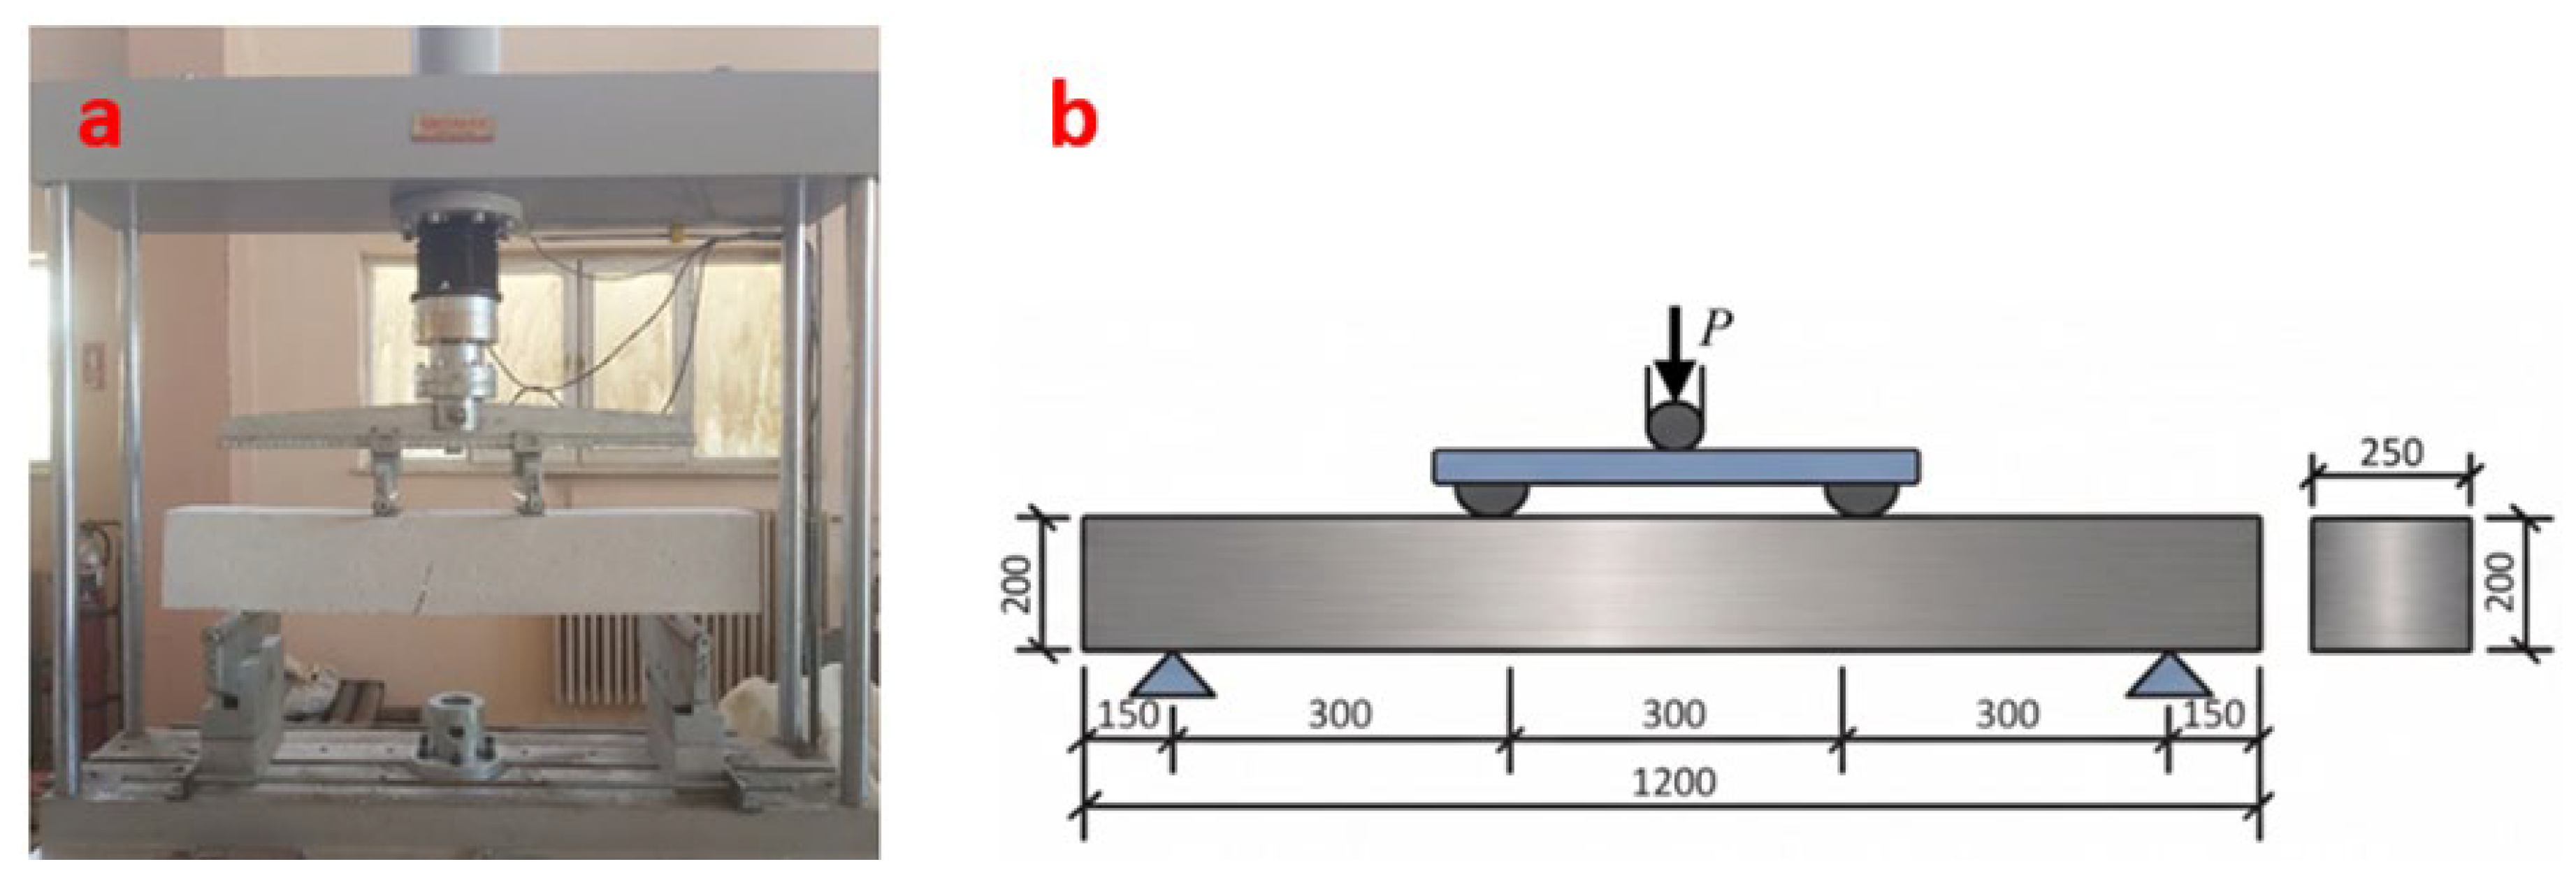
29] or small-scale laboratory coupons, without addressing the severe hydrothermal conditions (190 °C, 12 bar saturated steam) of the industrial autoclaving cycle and the associated matrix–reinforcement interfacial kinematics. To date, a direct, simultaneous comparison of diverse non-metallic reinforcement architectures—specifically, discrete sand-coated GFRP grids, distributed bidirectional AR-glass meshes, and heavy-tow sanded carbon meshes—embedded within full-scale AAC lintels under identical commercial manufacturing and hydrothermal curing conditions is missing in the literature. This study addresses this scientific and technological gap by systematically evaluating the four-point flexural kinematics, crack-propagation mechanisms, and post-cracking load redistribution of full-scale (1200 × 200 × 250 mm) AAC lintels reinforced with these three distinct composite configurations against the standard cold-drawn steel benchmark, integrated with an industrial pre-processing and life-cycle durability evaluation.
3. Results and Discussion
3.1. Peak Flexural Load and Capacity
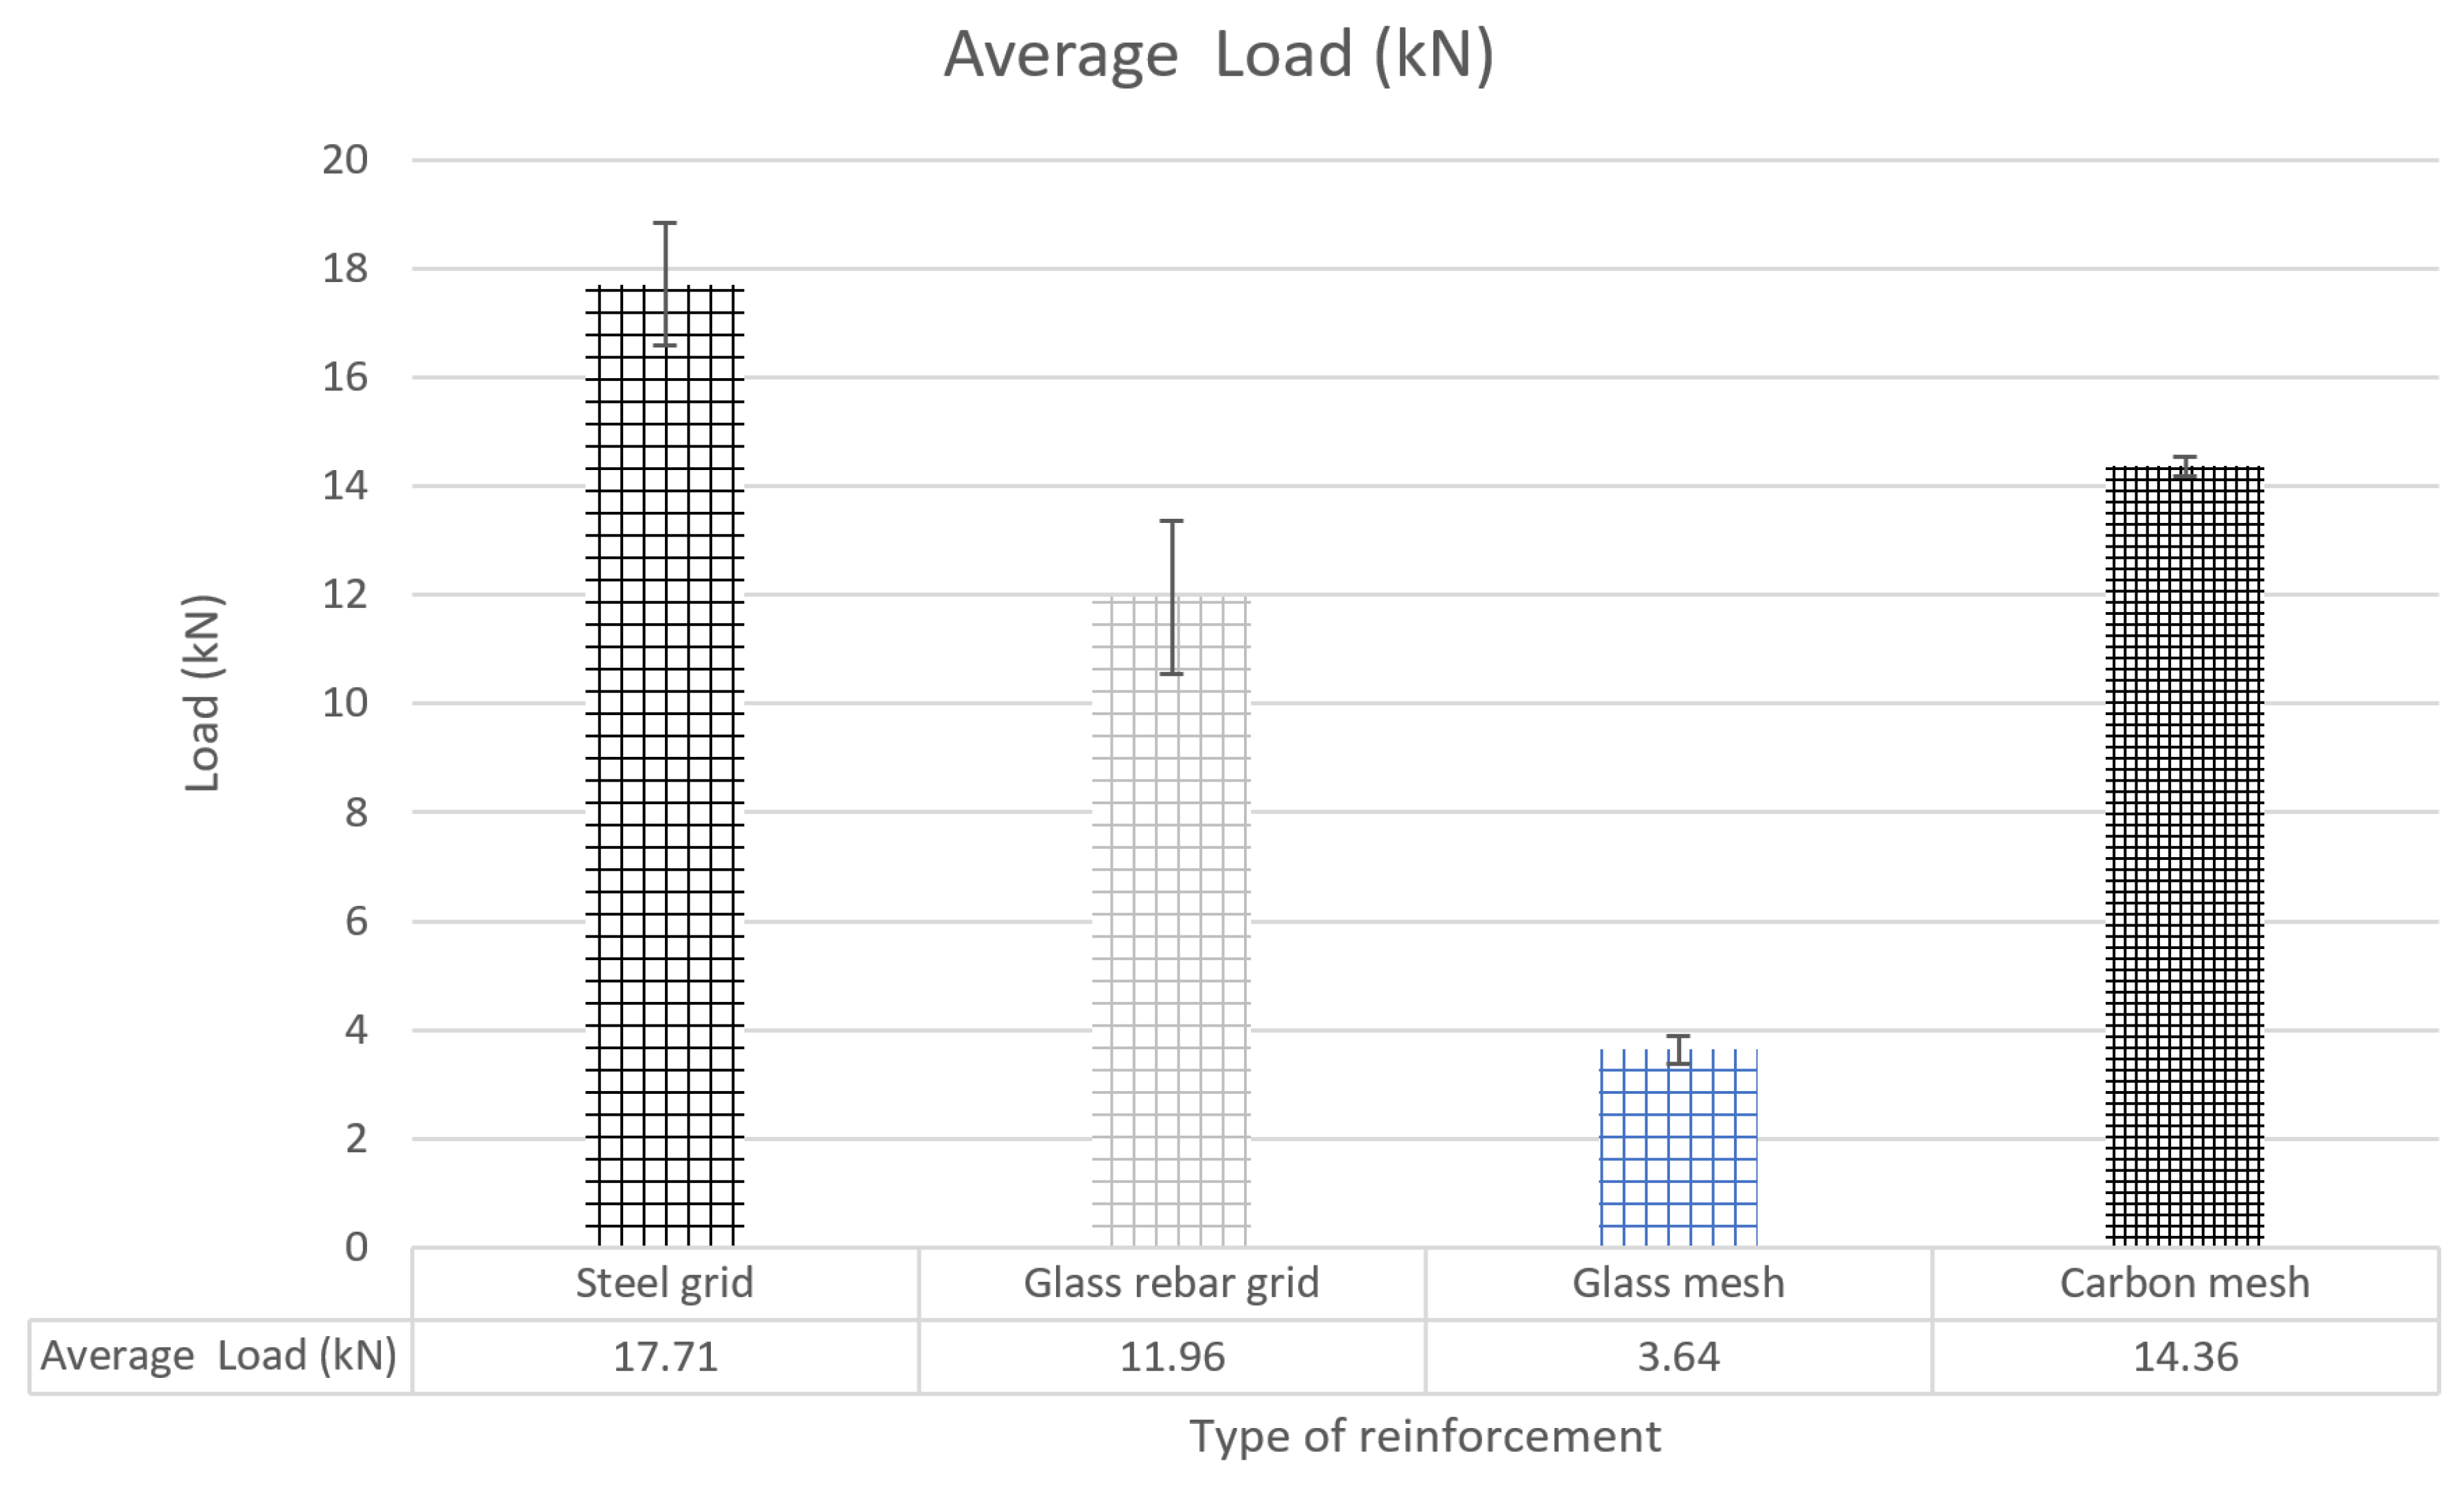
The peak flexural load-carrying capacities for all reinforced AAC lintel configurations are presented in
Figure 11. When the four-point bending test results of the reinforced aerated concrete lintels were evaluated across the experimental replicates (n = 3), it was observed that the reinforcement configuration notably influenced the peak load-carrying capacity and post-cracking response of the samples within the tested reinforcement ratios. The conventional steel-reinforced lintels (Steel Grid), considered as the control group, exhibited the highest peak flexural load, with an average load value of 17.71 kN. Among the alternative composite reinforcements, carbon-based mesh structures (Carbon Grid) were found to have an average load-carrying capacity of 14.36 kN, achieving 81% of the performance of conventional steel-reinforced samples. This high performance exhibited by carbon reinforcement indicates that the high tensile strength of the material provides load transfer compatible with the aerated concrete matrix. Glass rebar reinforcements made from glass fiber-reinforced polymer (GFRP) bars (Glass Rebar Grid) achieved approximately 67% of the peak load capacity of the steel control, with an average load of 11.96 kN. On the other hand, specimens reinforced with fine-structured glass fiber mesh (Glass Mesh) exhibited a low average peak load of 3.64 kN, reaching only ~20% of the steel control’s capacity. This pronounced reduction is governed by two combined mechanisms: first, its substantially lower effective longitudinal reinforcement area (A
s = 19.64 mm
2,
p = 0.039%) compared to the other groups; second, the smooth textile finish of the AR-glass rovings, which fails to generate sufficient mechanical interlock within the macroporous AAC matrix, leading to premature interfacial debonding and fiber pull-out before mobilizing the full tensile capacity of the glass filaments. In contrast, the rough, sanded outer surface of the carbon mesh and the profiled deformations of the glass rebars provide effective micromechanical interlocking, allowing a significantly higher load transfer across the porous matrix interface. The findings reveal that carbon grid reinforcements, in addition to their advantages such as corrosion resistance and lightness, are the strongest alternative to steel in aerated concrete lintels in terms of mechanical performance.
Within the scope of the evaluated test specimens (n = 3 identical replicates per group), the results demonstrated that the reinforcement configuration exerted a notable influence on the peak load-carrying capacity of the AAC lintels. When the statistical dispersion of the test data across the triplicates was evaluated, the Carbon Grid group exhibited the highest consistency, yielding an average peak load of 14.36 ± 0.17 kN, with an exceptionally low coefficient of variation (CV) of 1.17%. The Steel Grid control specimens attained an average capacity of 17.71 ± 1.12 kN (CV = 6.32%), whereas the Glass Mesh specimens reached 3.64 ± 0.26 kN (CV = 7.04%). The Glass Rebar Grid group showed an average load of 11.96 ± 1.40 kN, with a slightly higher dispersion (CV = 11.74%). This variation is primarily attributed to minor manual fabrication tolerances during the wire-tying of the composite bars and localized placement adjustments within the industrial mold.
3.2. Load–Deflection Curve
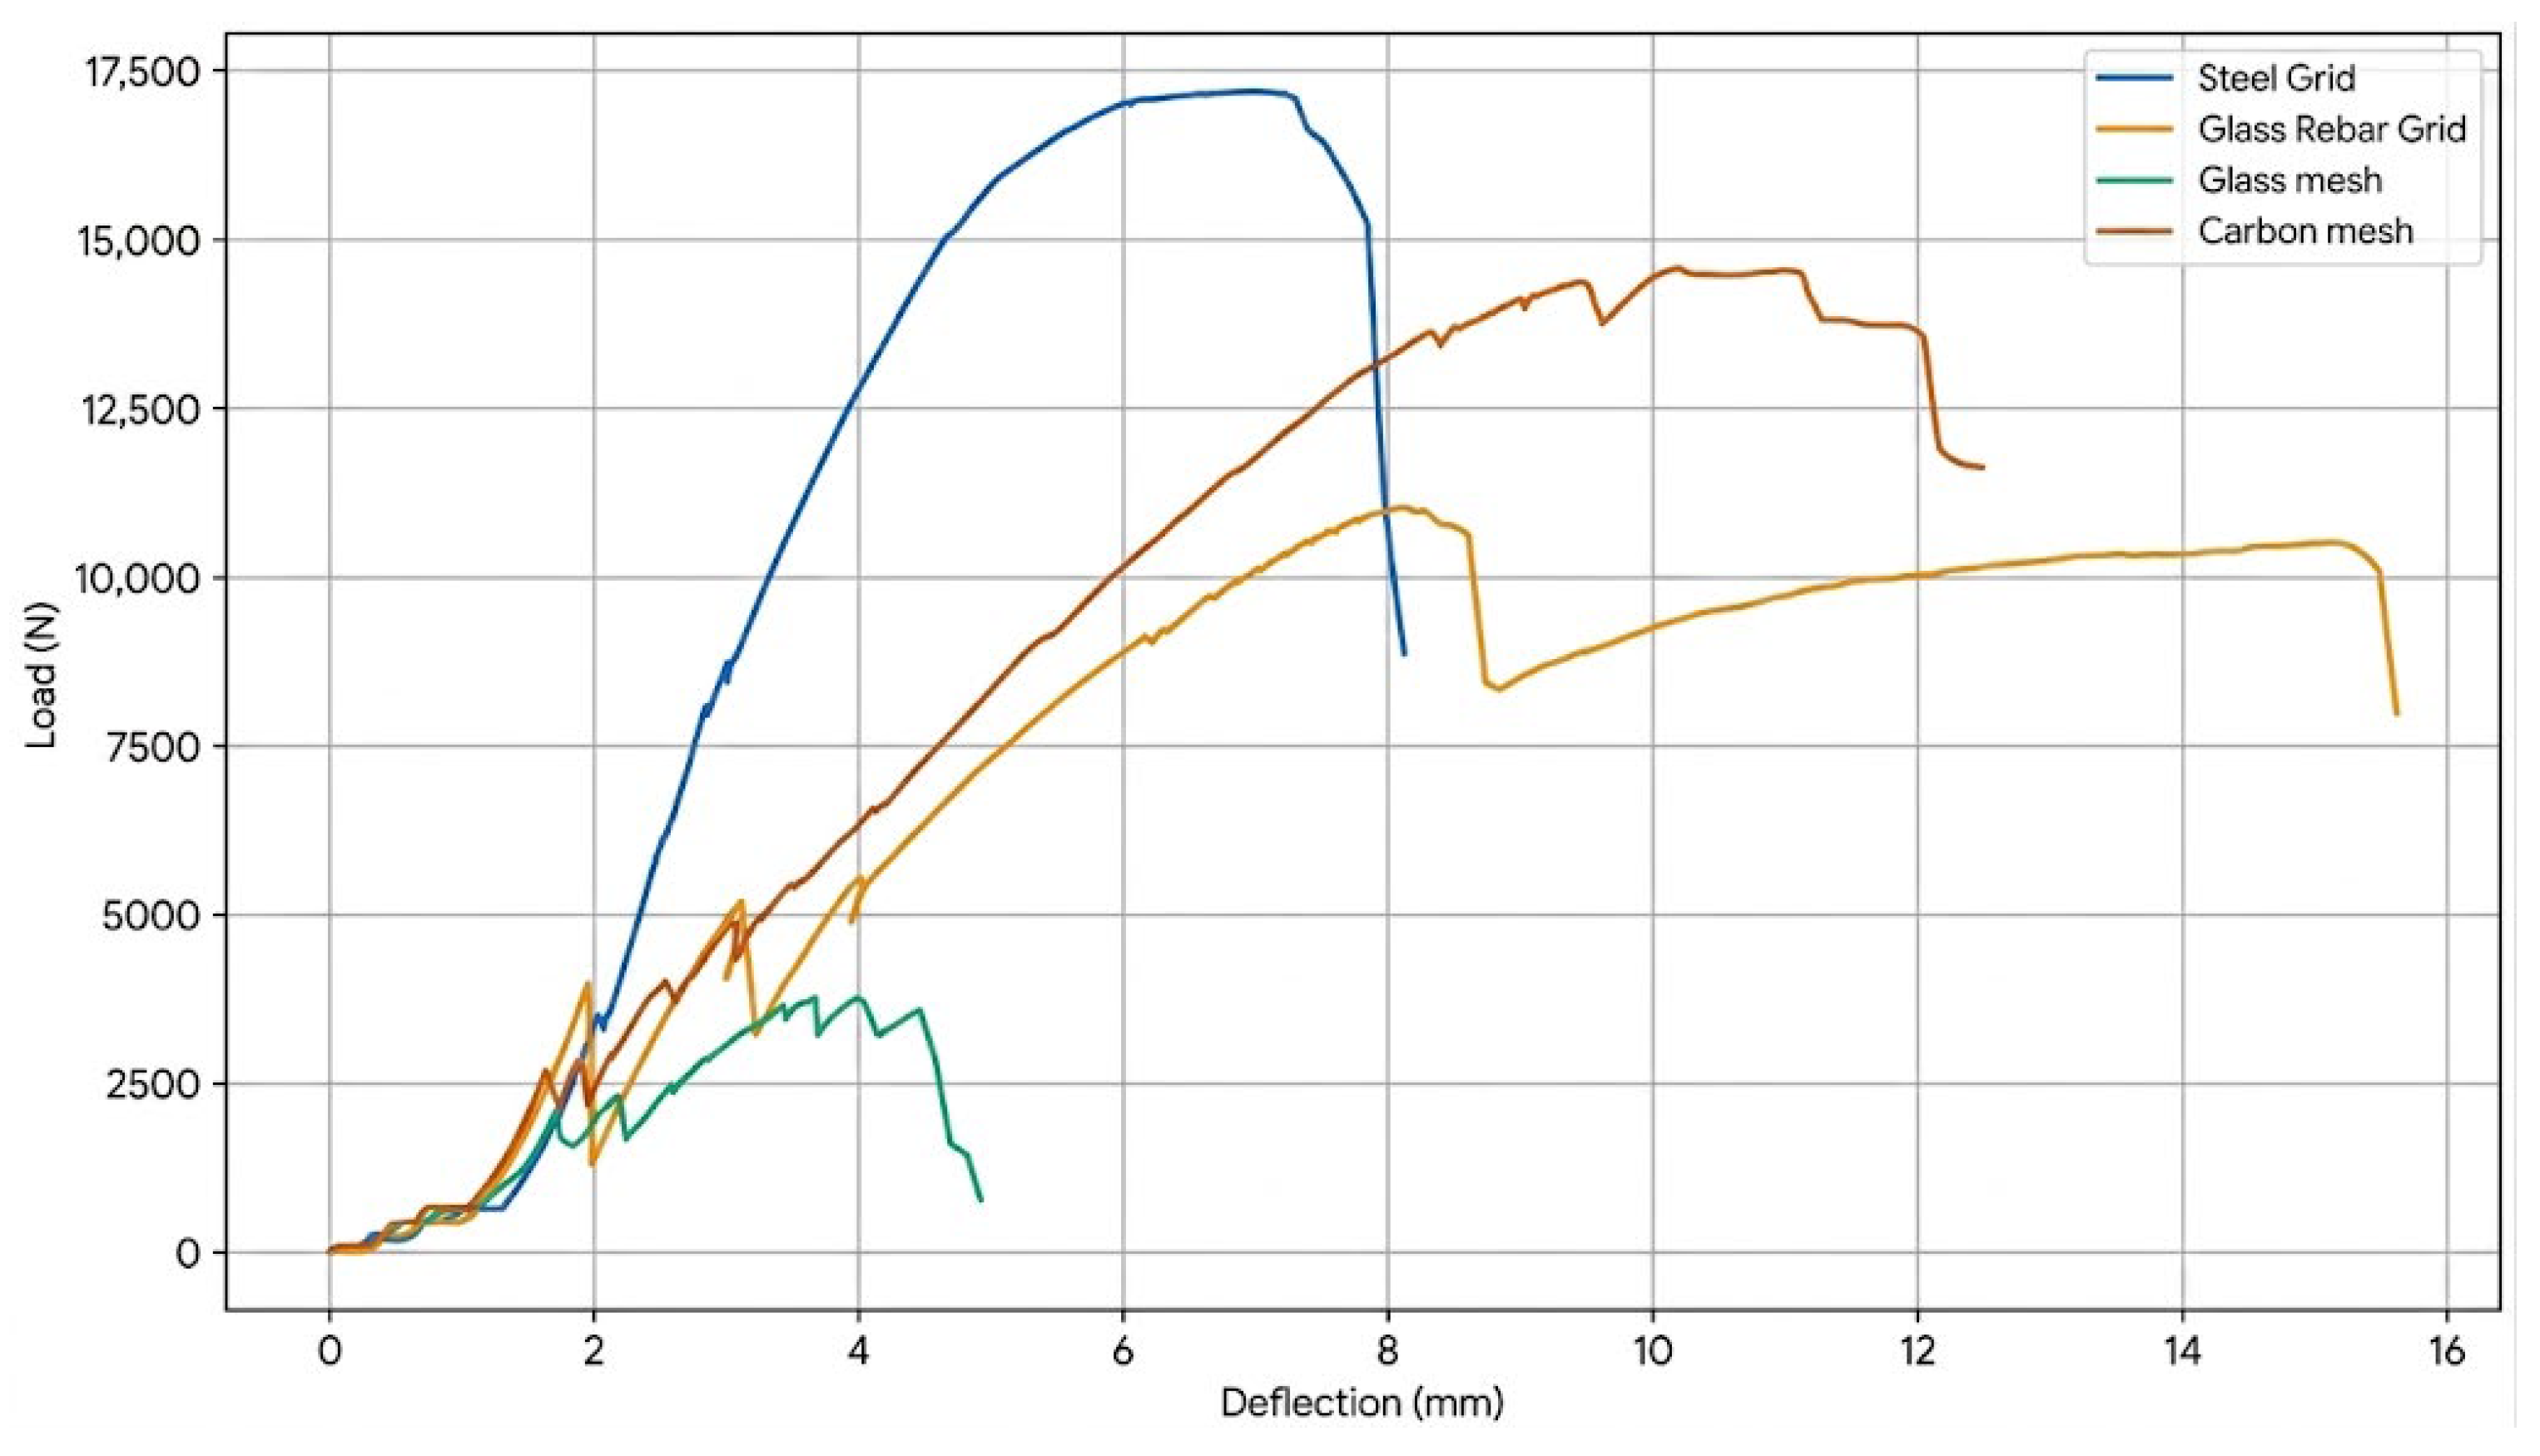
The load–deflection curves of the reinforced aerated concrete lintels produced within the scope of the experimental study under the four-point bending test are presented in
Figure 12. It is observed that all specimens exhibit similar linear-elastic behavior and rigidity at the beginning of loading (up to load levels of approximately 2000 N to 3000 N) in the early stage when macrocracks have not yet formed in the aerated concrete matrix. After exceeding the cracking strength of the matrix, the mechanical responses of the specimens differed significantly depending on the characteristics of the reinforcement type used. The conventional steel-reinforced control specimen (Steel Grid) showed the highest initial rigidity (steepest deflection), reaching a maximum peak load of approximately 17,200 N at a displacement of approximately 7.3 mm; after this peak, however, it exhibited a sudden and sharp decrease in load-carrying capacity, revealing a brittle fracture mode. Post-test physical failure observations indicated that this sudden post-peak loss of capacity in the Steel Grid specimens was primarily triggered by the rupture of the bottom longitudinal tension wires across the localized primary flexural crack, accompanied by localized matrix crushing and cover spalling in the compression zone. No premature buckling of the top compressive rebars was observed prior to the tension-side rupture. Furthermore, the industrial cold-drawing process (Φ5.5 → Φ3.8 mm) induces substantial plastic strain-hardening and dislocation accumulation in the steel wires, which diminishes their uniform plastic elongation capacity and eliminates a classical yield plateau. Under flexure, once the peak load is reached, this reduced wire ductility—coupled with localized matrix spalling around the ribbed bars—restricts plastic stress redistribution and accelerates the observed brittle post-peak drop. In contrast, the carbon mesh-reinforced specimen, despite having a somewhat lower peak load (~14,500 N) compared to steel, exhibited highly advantageous pseudo-ductile behavior by maintaining high load levels in the displacement range of 8 mm to 11 mm; the wavy plateau structure around the peak load indicates the gradual fracture of the fibers within the textile reinforcement and continuous stress redistribution. The most remarkable ductility and displacement tolerance in the experimental setup was observed in the glass rebar grid specimen, with a maximum displacement of approximately 15.5 mm; although this specimen experienced a sudden load drop due to matrix cracking around 8.2 mm, it recaptured the load thanks to the low elastic modulus and crack-bridging mechanism of glass fibers (GFRP) and maintained a stable residual load-bearing capacity of 10,000 N until fracture. Finally, the glass fiber mesh-reinforced specimen (Glass Grid) only reached a peak load of around 3700 N and rapidly exhausted at a displacement of 5 mm; this confirms the insufficient fiber volume ratio or weak interfacial bonding of the lightweight mesh structure within the aerated concrete matrix, indicating that the material is unsuitable for high-load-bearing elements in this form. In summary, while conventional steel reinforcement provides the highest peak load and rigidity, carbon mesh and glass rod alternatives offer the advantage of high energy absorption capacity and ductility, which are valuable for enhancing deformation tolerance, post-cracking ductility, and preventing sudden brittle collapse under localized overloading in structural aerated concrete applications.
While the current baseline evaluation was performed at a standardized quasi-static rate of 1 mm/min to isolate the steady-state load-transfer mechanisms, previous investigations on AAC elements under bending have indicated that dynamic crack propagation and peak capacities can exhibit sensitivity to varying strain rates [
17]. Consequently, evaluating the post-cracking performance and energy absorption of these alternative composite grids under multiple loading rates and cyclic loading regimes constitutes an essential scope for future extended studies. In this context, it is also important to distinguish between monotonic quasi-static flexural behavior and actual seismic performance. Although the pseudo-ductile plateau of carbon mesh and crack-bridging of glass rebars provide notable deformation tolerance under localized gravity overloads, establishing true seismic resilience requires dedicated reversed-cyclic loading and full-scale wall–lintel assembly testing. Furthermore, while the corrosion immunity of non-metallic grids represents a decisive material advantage over degrading steel, long-term environmental exposure testing following hydrothermal autoclaving remains an important objective for future research.
A detailed examination of the load–deflection trajectories (
Figure 12) reveals distinct phenomenological cracking and failure stages across the reinforcement configurations:
Elastic uncracked stage: Up to load levels of approximately 2.0–3.0 kN, all configurations exhibit a linear-elastic response primarily governed by the intact tensile stiffness of the cellular AAC matrix.
Matrix cracking and crack localization: Upon exceeding the matrix tensile strength, a primary flexural crack initiates within the constant moment span. For the Steel Grid control, the rigid matrix–steel interface concentrates stresses into a localized macro-crack, resulting in sudden post-peak load drop and brittle failure at ~7.3 mm deflection.
Post-cracking redistribution and crack-bridging: In contrast, the distributed architecture of the Carbon Mesh encourages stress redistribution across multiple micro-cracks, generating an extended pseudo-ductile plateau between 8.0 mm and 11.0 mm deflection. Similarly, the Glass Rebar Grid exhibits an effective crack-bridging mechanism; following primary matrix cracking at ~8.2 mm, the continuous GFRP bars restrain crack widening and maintain a stable residual load plateau of ~10.0 kN up to 15.5 mm displacement.
3.3. Flexural Toughness
The flexural toughness values of the samples were determined by calculating the area under the curve up to the first main peak points of the load-displacement curves, and the results are presented in
Table 3. According to the findings, carbon mesh-reinforced aerated concrete lintels exhibited the highest flexural toughness value of 81,308 N. Although the peak load of the carbon-reinforced samples (~14,550 N) lagged behind the conventional steel-reinforced control group (17,200 N), maintaining stable load transfer over a wide displacement of 10.30 mm up to the peak resulted in a total energy absorption capacity approximately 18% higher than the steel control group. Although the control group, Steel Grid specimens, achieved a significant toughness value of 68,969 N within a narrow displacement range (7.25 mm) due to their high rigidity and load-carrying capacity, their brittle fracture behavior after the peak load limited their post-peak deformation tolerance and ductility under flexure. Glass rebar grid specimens exhibited a bending toughness of 44,875 N up to the 8.00 mm displacement limit before macro-cracking of the matrix, showing a lower energy absorption performance compared to steel. Finally, Glass Mesh-reinforced specimens yielded the lowest toughness value of 7878 N when calculated according to the 4.00 mm displacement limit, taking the load drop after the first peak as the criterion. These results indicate that lightweight glass fiber mesh structures have limitations in preventing early in-matrix deformations under structural loads, whereas carbon mesh reinforcement does not.
3.4. Production Costs
In the final stage of the experimental study, a unit production cost analysis was conducted to evaluate the direct industrial feasibility of the alternative reinforcement systems. It is important to emphasize that this analysis represents a factory-gate operational cost comparison per single lintel unit (1200 × 200 × 250 mm), rather than a full cradle-to-grave Life Cycle Cost (LCC) or Life Cycle Assessment (LCA) model. The evaluated boundary scope accounts specifically for variable direct raw material procurement (reinforcement bars, textile rolls, anti-corrosion chemical formulations) and reinforcement pre-processing labor/time (wire-drawing, grid cutting, tying, and chemical dip-coating). Fixed industrial overheads common to all specimens (including mold preparation, slurry batching, green-cake handling, and high-pressure autoclave energy) were held constant across all groups and thus excluded from the incremental comparative index. While quantitative 50-year life-cycle modeling (incorporating inspection schedules, electrochemical rust repair, localized component replacement, and financial discount rates) is beyond the primary laboratory scope of this study, the zero-maintenance advantage and complete corrosion immunity of textile grids provide decisive qualitative life-cycle benefits that substantially mitigate the long-term maintenance burdens inherent to steel-reinforced AAC structures.
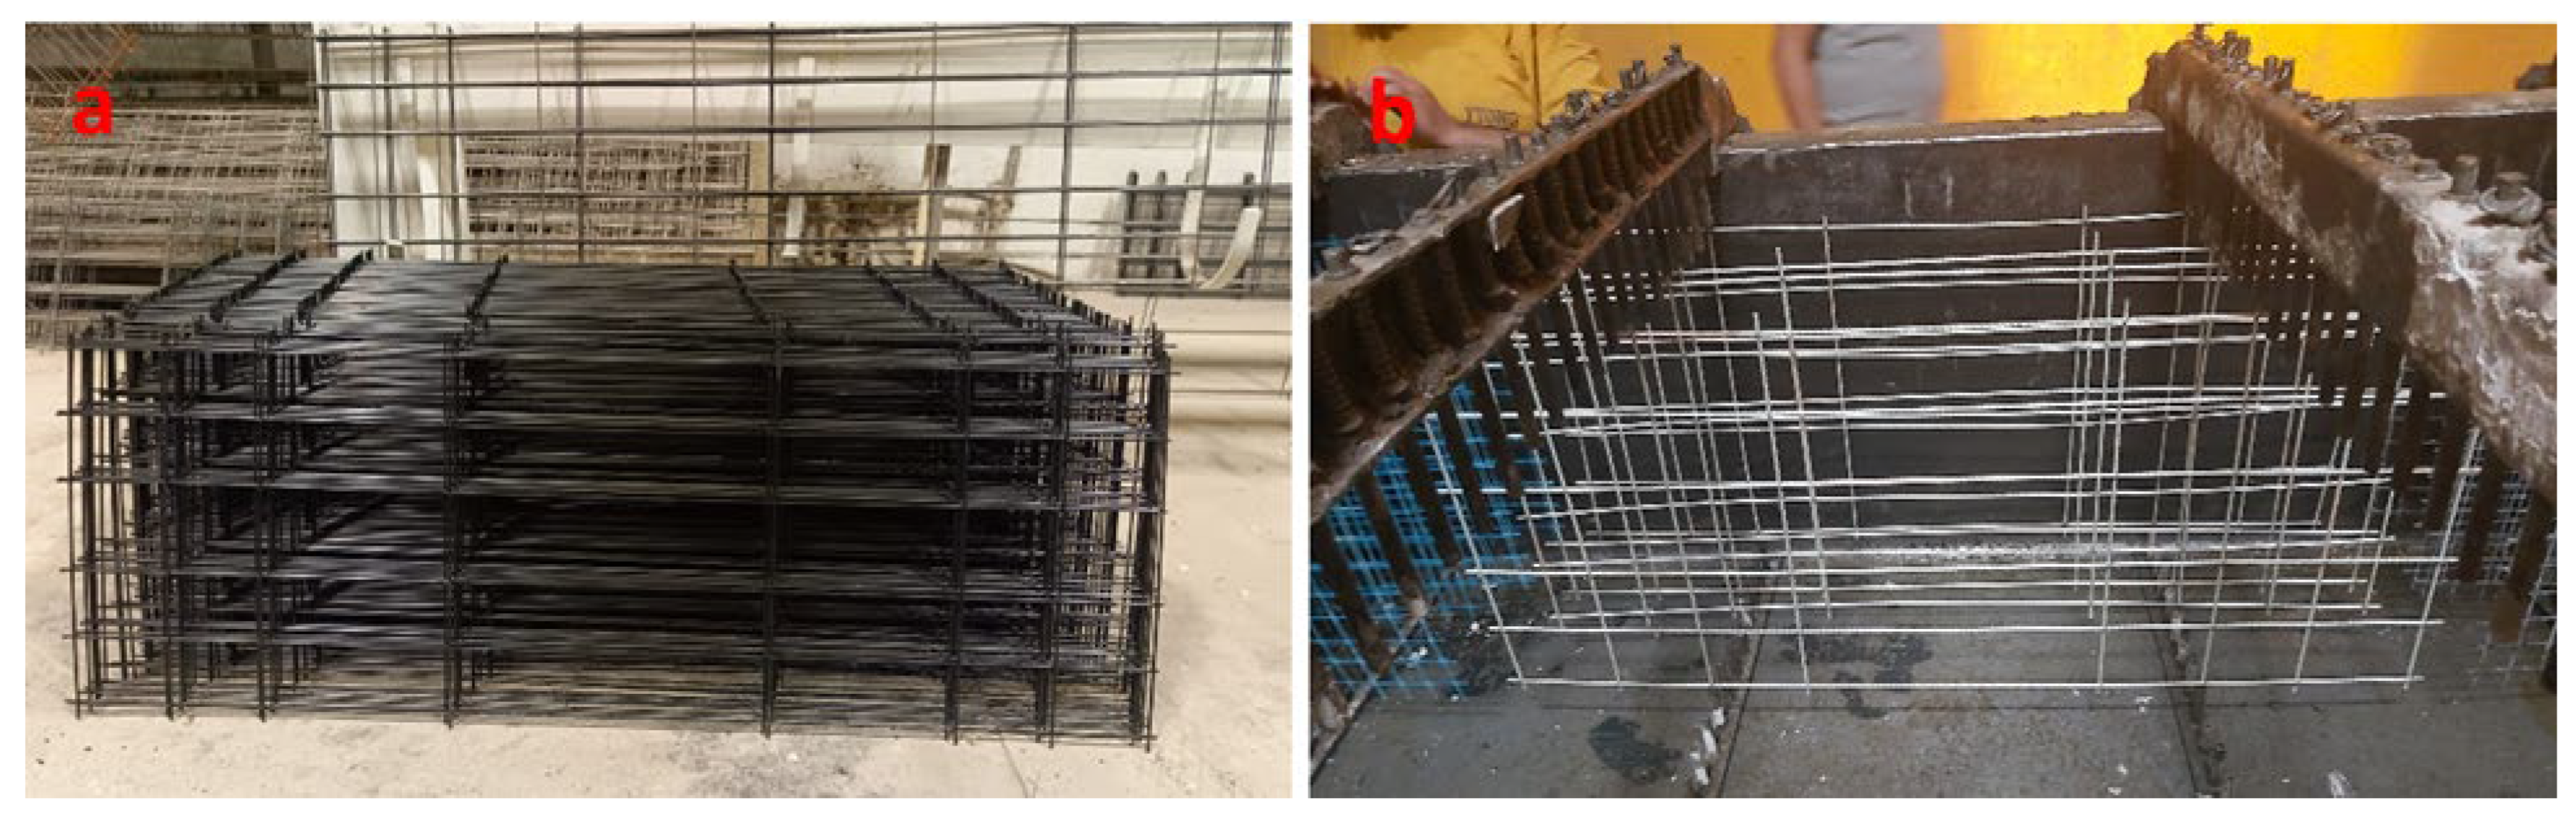
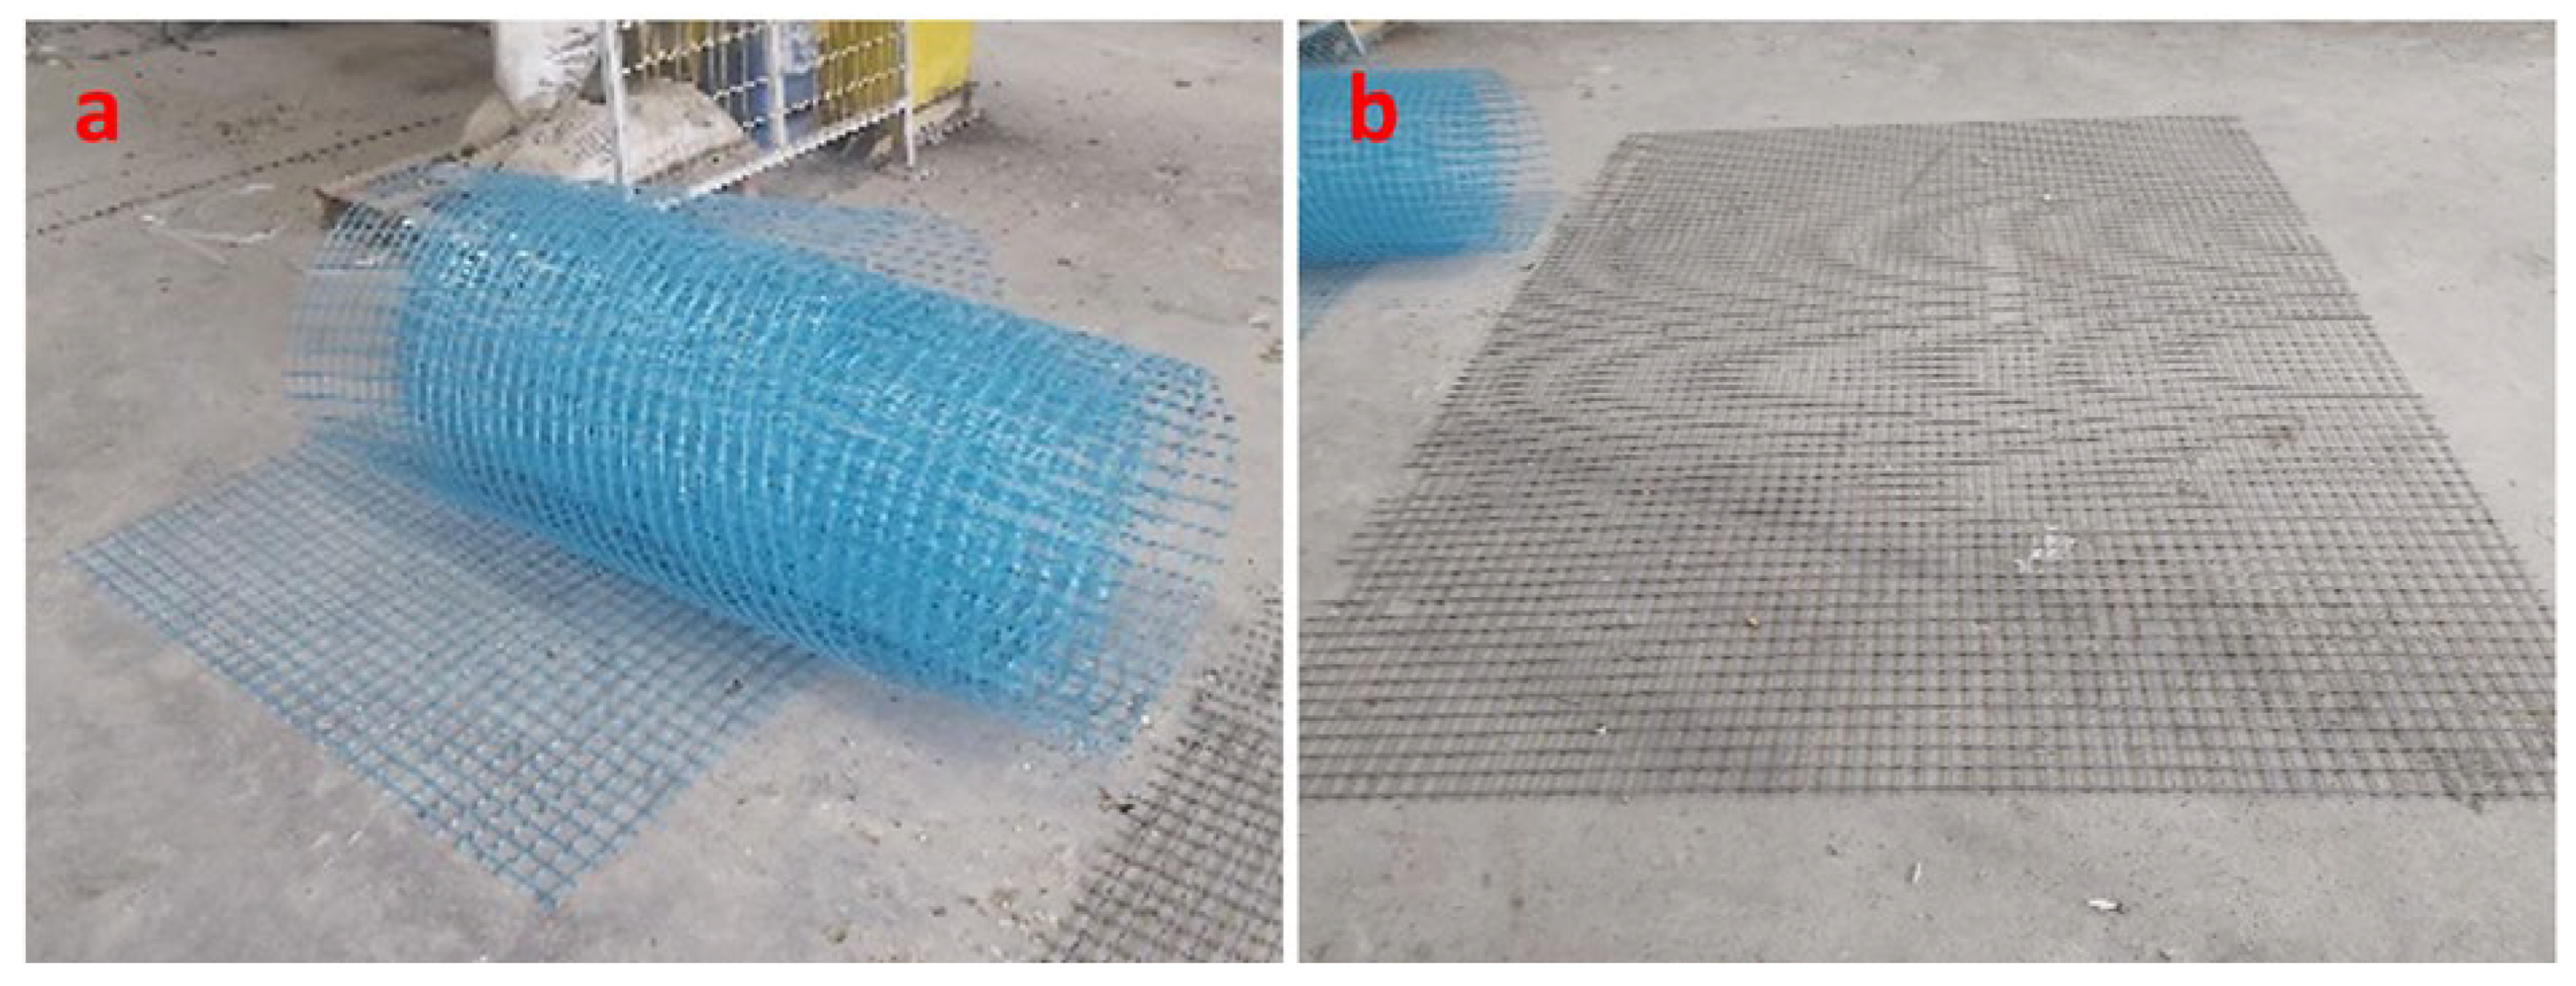
In the production of steel grid, the material is first thinned by drawing to the desired thickness. Then, the steel rebars are joined together according to the specified design and formed into a grid. Finally, the steel grid is coated with an anti-corrosion chemical for corrosion resistance. In the production of a glass rebar grid, the material to be used is cut and joined according to the determined design to form the grid. Because glass and carbon mesh structures can be supplied in ready-made roll form, they are easily prepared by cutting them to the dimensions specified in the design to be made into meshes.
Table 4 shows the variable costs of a single reinforced lintel produced from different reinforcement types, depending on the process steps.
Production costs were calculated in Euros (€) per sample, taking into account direct material (raw materials) and reinforcement pre-treatment processes (steel thinning, corrosion-resistant coating application, mesh preparation, and labor).
Table 4 shows that traditional steel grid lintels have the lowest raw material cost at €0.763; however, the pre-processing operation cost, necessary to protect the steel from high-temperature hydrothermal conditions during autoclaving and subsequent long-term moisture and carbonation ingress through the porous AAC matrix, is the highest at €0.282, raising the total cost to €1.045. In contrast, composite reinforcements in textile form (glass mesh and carbon mesh) do not require additional coating processes due to their natural resistance to corrosion and exhibit a negligible pre-processing/labor cost of only €0.004 because they are supplied ready-made in rolls. Glass rebar grid samples, on the other hand, have a considerably higher raw material cost of €16.400 and a total cost burden of €16.585.
When the mechanical performance data obtained in the experimental study are evaluated together with the cost-performance index, significant conclusions emerge. When evaluating total unit cost alongside mechanical and durability performance, it is evident that carbon mesh involves a higher initial cost (€9.196 vs. €1.045 for steel), which is not fully offset by processing labor savings (€0.004). Furthermore, because lintels are primarily designed for gravity loads rather than severe cyclic energy dissipation, flexural toughness alone does not justify this initial material cost premium. Instead, the decisive technical advantage of carbon reinforcement lies in its inherent corrosion resistance and superior long-term durability. Coated steel reinforcement embedded within the porous AAC matrix remains susceptible to moisture ingress and progressive carbonation over time, which can compromise protective coatings and lead to cover spalling. In contrast, carbon mesh is completely immune to corrosion, offering an extended, maintenance-free service life in aggressive or humid environments. Glass rebar grids, while eliminating corrosion and providing moderate capacity (11.96 kN), present a high unit cost (€16.585) under the evaluated manual assembly conditions. Glass mesh, despite having a lower cost (€4.559), provides insufficient peak load-carrying capacity (3.64 kN), restricting its potential strictly to non-structural or crack-control roles.
To synthesize the experimental and economic findings into a practical engineering selection tool, a multi-attribute decision matrix evaluating the three core engineering dimensions—peak load capacity (P
max), flexural toughness (T), and unit cost (C
unit)—alongside long-term corrosion durability is presented in
Table 5. The normalized performance-to-cost indices quantify the specific trade-offs inherent to each reinforcement configuration.
As quantified in
Table 5, conventional steel reinforcement delivers the lowest unit initial cost per kN (€0.059/kN) and per joule of energy absorption (€0.015/J). Among the non-metallic options, carbon mesh provides the most balanced structural cost-efficiency (€0.640/kN and €0.113/J), where this initial material investment is technically justified by superior flexural toughness (81,308 N·mm) and complete corrosion immunity in aggressive environments. Conversely, the Glass Rebar Grid (€1.387/kN) and Glass Mesh (€1.252/kN) exhibit a significantly higher unit cost per load-bearing capacity, confirming that glass mesh is economically and structurally unviable for primary load-bearing lintels.