


Abstract
Transport infrastructure constitutes an essential component of the built environment, supporting urban accessibility, economic activity, and the long-term functionality of cities and developed areas. The quality of newly constructed pavements is traditionally assessed through compliance with construction specifications, such as layer thickness, material properties, and compaction requirements. However, these parameters do not directly quantify the influence of construction deviations on long-term pavement structural performance. This paper presents a structural capacity-based framework for pavement construction quality assessment that evaluates construction quality according to its expected impact on pavement service life. The proposed methodology integrates ground-penetrating radar measurements, core sampling, laboratory testing, and mechanistic structural analysis to determine the actual structural capacity of the as-built pavement expressed as the allowable number of Design Axle Loads. Based on these results, the Pavement Construction Quality Index (PCQI) is introduced to quantify the combined effects of systematic and localized construction deficiencies. To prevent severe localized defects from being masked by area-weighted averaging, the Critical Local Defect Indicator (CLDI) is proposed as an independent acceptance criterion. The sensitivity parameters of the PCQI formulation were calibrated using mechanistic analysis and HDM-4 deterioration modelling. The proposed framework was demonstrated through a real pavement reconstruction case study and further examined using Monte Carlo simulation to investigate its numerical behaviour over a broad range of construction non-compliance scenarios. The results demonstrate that the proposed methodology provides a continuous and technically consistent evaluation of pavement construction quality while enabling practical engineering interpretation of different quality levels. The framework offers a structured quantitative decision-support tool for pavement acceptance based on structural capacity rather than solely on compliance with construction tolerances, thereby supporting more reliable management of transport infrastructure as part of the wider built environment.
1. Introduction
Transport infrastructure is a fundamental component of the built environment, providing the physical networks required for mobility, accessibility, economic activity, and the functioning of urban and developed areas. Ensuring the long-term performance of these infrastructure assets is therefore an important aspect of sustainable built-environment management. Within this context, quality control during pavement construction is critical, as deviations from design parameters may significantly influence pavement durability, maintenance requirements, and long-term economic performance. Within this process, the quality control system focuses on measuring the characteristics of construction materials and verifying the quality of the placement process itself. This includes monitoring parameters such as material properties, temperature of the asphalt mixture, ambient temperature and humidity, as well as geometric characteristics of the placed layers, including their shape, thickness, and degree of compaction [1,2].
Although compliance with construction specifications is essential, conventional acceptance procedures are generally based on individual material and geometric requirements rather than on their combined influence on pavement structural performance. As a result, construction quality is often evaluated through isolated parameters, while the cumulative effect of deviations on pavement structural capacity and expected service life remains insufficiently quantified. Relatively small deviations in layer thickness, material properties, or construction uniformity may interact and produce a measurable reduction in fatigue life, even when the pavement does not exhibit visible surface defects immediately after construction. Despite standard quality control procedures, deviations from the designed pavement structure may still occur. This may result from the large scale and complexity of construction activities, incomplete implementation of the quality control plan, or human oversight during construction supervision. Consequently, deficiencies in pavement construction quality may remain undetected during the construction phase. Such defects are typically embedded within the pavement structure, invisible to the naked eye, and the pavement may be accepted by the client without awareness of their presence. Their negative effects often become apparent only during the operational phase of the pavement, frequently after the expiration of the warranty period [3,4,5].
One of the methods capable of detecting such hidden deficiencies is non-destructive testing using ground-penetrating radar (GPR). This technique enables the determination of pavement layer thicknesses and the identification of sections where the constructed pavement deviates from the designed structure. In combination with core sampling and laboratory testing of extracted materials, it is possible to determine both the actual layer composition and the mechanical properties of the pavement structure. These data enable a retrospective evaluation of construction quality and provide the necessary input for estimating the structural capacity of the as-built pavement. However, diagnostic information alone does not provide a direct basis for technical acceptance or contractual quality assessment. GPR measurements, core samples, and laboratory tests describe the physical condition of the pavement, but they do not automatically quantify the structural consequences of construction non-compliance. A key practical challenge is therefore to transform the identified deviations into a reproducible engineering indicator that reflects their effect on pavement performance, while also distinguishing between systematic deviations affecting larger pavement areas and localized defects that may represent a critical structural risk [6,7,8,9,10].
Existing research provides several important components for performance-oriented pavement quality assessment. Road asset management frameworks emphasize the need to link technical condition, performance, risk, and life-cycle decision-making. Quality assurance and performance-related specification approaches have also attempted to relate measurable construction quality characteristics to expected pavement performance and acceptance decisions. In parallel, non-destructive pavement diagnostics, particularly ground-penetrating radar, have been widely investigated for pavement layer thickness evaluation, construction quality control, density estimation, moisture assessment, and internal distress detection. Previous studies have also demonstrated that construction tolerances, layer thickness variability, and structural non-uniformity can significantly influence pavement performance and service life. However, these research directions remain only partially integrated. Existing GPR- and core-based diagnostic methods typically identify geometric or material deviations, but they do not provide a direct post-construction acceptance indicator expressing the combined effect of the severity and spatial extent of construction deficiencies on pavement structural capacity. Similarly, existing pavement condition or structural indices are mainly intended for network-level pavement management, maintenance planning, or in-service pavement evaluation rather than for technical acceptance of newly constructed pavements. Therefore, a research gap remains in the development of a practical framework that converts measured as-built construction deviations into a structural capacity-based quality indicator suitable for pavement acceptance procedures. Addressing this gap is relevant not only to pavement engineering but also to the broader management of the built environment, where infrastructure quality, durability, and life-cycle performance directly influence the reliability and sustainability of urban systems. This gap is particularly important when hidden construction deficiencies are detected only after completion of the works and both the client and contractor require an explicit basis for engineering assessment and quality-related claim negotiation [1,2,3,4,5,6,7,8,9,10,11,12,13,14,15].
This paper proposes a structural capacity-based framework for pavement construction quality assessment that shifts the evaluation of construction quality from compliance with individual construction specifications towards assessment of expected structural performance. Unlike established pavement structural design approaches, which primarily use structural capacity for pavement design and long-term performance prediction [16,17,18,19,20,21], the proposed methodology applies structural capacity as a post-construction quality assessment metric. GPR measurements, core sampling, laboratory testing, and structural analysis are integrated to express the quality of the as-built pavement in terms of allowable Design Axle Loads (DAL). Based on these results, the Pavement Construction Quality Index (PCQI) is introduced as a quantitative indicator that combines the severity of structural capacity reduction with the spatial extent of affected pavement areas. From a broader built-environment perspective, the framework represents a performance-oriented approach to infrastructure quality management by linking construction quality directly to expected structural service life and subsequent asset-management decisions.
To prevent severe localized defects from being masked by area-weighted averaging, the proposed framework is complemented by the Critical Local Defect Indicator (CLDI). While the PCQI provides a continuous assessment of overall pavement construction quality, the CLDI identifies localized defects with critically reduced structural capacity that require individual engineering assessment. Together, these two components form a technical acceptance framework intended to support traceable pavement construction quality evaluation, reduce subjectivity in claim negotiations, and provide a technically justified basis for engineering decision-making during pavement acceptance.
2. Research Hypothesis
The research presented in this paper is based on the following hypothesis: Deviations from the designed pavement structure can be consistently quantified and technically evaluated using a framework that combines an area-weighted pavement construction quality index with an independent criterion for identifying critical localized defects.
More specifically, the study assumes that:
- The reduction in pavement structural capacity can be expressed through the ratio between the actual number of design axle loads (DAL) and the designed DAL capacity.
- Localized construction deficiencies have a different impact on pavement performance than systematic deviations affecting the entire pavement structure.
- The overall impact of construction deviations can be expressed as a weighted function of structural capacity reduction and the affected pavement area.
- Sensitivity parameters within the index formulation can be calibrated to reflect the risk associated with different types of structural deficiencies.
- Localized defects with critically reduced structural capacity cannot always be adequately represented by an area-weighted quality index and therefore require an independent acceptance criterion.
Under these assumptions, the proposed methodology combining the Pavement Construction Quality Index (PCQI) and the Critical Local Defect Indicator (CLDI) provides a structured framework for evaluating pavement construction quality. While the PCQI quantifies the overall quality of the delivered pavement, the CLDI ensures that severe localized structural deficiencies are identified and subjected to additional engineering assessment before the pavement is accepted. Consequently, the proposed framework supports transparent contractual acceptance procedures and provides a technically justified basis for quality-related claim negotiations.
3. Materials and Methods
3.1. Research Design
The research presented in this paper represents applied engineering research initiated by the need to verify the quality of pavement construction after completion of a newly constructed road. Although standard quality control procedures were implemented throughout the construction process, additional verification of the as-built pavement structure was required to identify potential hidden deficiencies that could adversely affect the long-term structural performance of the pavement. The research design combines several complementary methodological approaches [1,5,6,15].
First, observational methods were employed through non-destructive testing using ground-penetrating radar (GPR). These measurements enabled continuous evaluation of pavement layer thicknesses and the identification of sections exhibiting significant deviations from the designed pavement structure [6,7,8,9,10].
Second, destructive testing methods were performed at selected locations identified by the GPR survey. Core samples were extracted to determine the actual layer thicknesses, verify material composition, and obtain representative specimens for laboratory testing of the asphalt mixtures [6,7].
Third, analytical methods were applied to evaluate the structural capacity of the pavement based on the measured layer thicknesses and experimentally determined material properties. The structural response of the pavement was analysed using a layered elastic half-space model, allowing the estimation of the cumulative number of design axle loads (DAL) corresponding to structural fatigue failure [16,17,18].
Fourth, numerical simulation methods were employed to investigate the long-term consequences of construction non-compliance. A series of construction non-compliance scenarios was developed by introducing systematic reductions in pavement structural capacity. Their influence on pavement deterioration throughout the service life was subsequently analysed using the HDM-4 version 2.12 pavement performance model [19,20].
Finally, methodological development was carried out through the formulation of a structured pavement construction quality assessment framework. The framework consists of two complementary components: the Pavement Construction Quality Index (PCQI), which quantifies the overall quality of the constructed pavement by combining the severity and spatial extent of structural deficiencies, and the Critical Local Defect Indicator (CLDI), which identifies localized defects requiring individual engineering assessment. The sensitivity parameters of the proposed PCQI were calibrated using HDM-4 deterioration simulations and numerical optimization in Microsoft Excel Solver to establish a relationship between construction deficiencies and their long-term impact on pavement performance.
3.2. Materials and Equipment
The assessment of pavement construction quality requires reliable determination of the as-built pavement structure, material properties, and its resulting structural capacity. For this purpose, the proposed methodology combines non-destructive testing using ground-penetrating radar (GPR), destructive verification by core sampling, laboratory testing of pavement materials, and pavement fatigue life evaluation using a layered elastic half-space model. Together, these methods provide the input data required for determining the structural capacity of the as-built pavement and for subsequent application of the proposed PCQI framework. The following sections briefly describe the equipment and procedures used in this study [6,7,8,9,10,16,17,18,21,22,23,24,25,26].
Ground-Penetrating Radar (GPR)—Ground-penetrating radar by Roadscanners’ Road Doctor® used as the primary non-destructive diagnostic tool for determining the thickness of individual pavement layers. The GPR system operates by transmitting high-frequency electromagnetic waves into the pavement structure and recording the reflected signals from interfaces between layers with different dielectric properties. The analysis of the reflected signals enables the determination of layer thicknesses and the identification of sections where the constructed pavement structure deviates from the design configuration [6,7,24,27]. The measurements were conducted with two types of antennas:
- AC antenna (2.0 GHz), designed for recording bound layers.
- GC antenna (400 MHz), used for capturing unbound layers in the GPR record.
Both antennas were referenced with GPS (Global Positioning System) during the measurement process. The outputs from both antennas were combined into a single dataset, allowing for continuous monitoring of the pavement thickness profile. Separate outputs for the AC and GC antennas are displayed in Figure 1, where the interfaces between individual layers are color-coded for clarity.
Figure 1.
Interpretation of GPR measurements for pavement layer identification.
Core Drilling—Core drilling was carried out at locations where the GPR measurements indicated substantial deviations from the designed pavement structure (Figure 2). Core samples allowed direct verification of pavement layer thicknesses and provided material specimens for laboratory testing. The laboratory tests confirmed that the material properties complied with the design requirements and did not reveal any material-related deficiencies. Therefore, within the scope of this study, the primary purpose of the core samples was to verify the GPR-derived layer thicknesses at critical locations and to confirm the actual pavement structure.
Figure 2.
Core drilling and extracted pavement core used for verification of GPR measurements.
Sample testing—Following core extraction, laboratory testing was performed to determine the physical and mechanical properties of the asphalt mixtures. Layer thickness was measured to verify GPR readings. Bulk density was determined according to EN 12697-6, while binder content and aggregate gradation were evaluated in accordance with EN 12697-1 and EN 12697-2, respectively. Mechanical properties of the asphalt mixtures were assessed by means of the indirect tensile strength test (EN 12697-23) and the indirect tensile stiffness modulus test (IT-CY) according to EN 12697-26. The obtained parameters were subsequently used as input data for the layered elastic half-space model and the estimation of pavement fatigue life [25,26,28,29,30].
The pavement fatigue life evaluation in a layered elastic half-space model—the pavement structure is represented as a system of homogeneous, isotropic, and linearly elastic layers with defined thicknesses, stiffness moduli, and Poisson’s ratios. Traffic loading was simulated by a standard design axle load, and the resulting stress–strain state was calculated at critical locations within the pavement structure. For the analysed semi-rigid bituminous pavement, the decisive response parameter was the radial tensile stress at the bottom of the asphalt-bound layer, as this location is typically associated with the initiation of fatigue cracking. Based on the calculated tensile response and experimentally determined material characteristics, the allowable number of load repetitions was estimated and expressed as design axle loads (DAL) until the end of fatigue life. This procedure enabled direct comparison between the designed pavement structure, the average as-built structures derived from GPR measurements, and the locally weakened structures identified by core drilling [16,17,18].
4. Development of the Pavement Construction Quality Index (PCQI)
The identification of construction deficiencies requires a reproducible method for quantifying their impact on pavement quality and performance. This chapter describes the development of the Pavement Construction Quality Index (PCQI). The requirements for the index are first established, followed by the formulation of the index and its extension to account for both local and global construction deviations through calibratable sensitivity parameters.
4.1. Initial Formulations of the Pavement Construction Quality Index
The development of the Pavement Construction Quality Index (PCQI) was performed iteratively. Several formulations were investigated in order to identify an approach capable of simultaneously reflecting the severity of structural deficiencies and their spatial extent. Three initial formulations were considered.
4.1.1. Simple Weighted Capacity Reduction Index
The first formulation was based on the weighted average reduction in structural capacity, see Equation (1).
where
- DALi is the structural capacity of segment i;
- DALdesign is the design structural capacity;
- wi is the weighting factor corresponding to the spatial extent of segment I, see Equation (2).
For the purposes of the proposed index i, a segment represents a pavement area characterized by a uniform structural capacity (DAL). Segments may correspond to localized defects identified by core sampling or to larger pavement sections represented by GPR measurements.
where
- Ai is the area represented by segment i;
- Atotal is the total pavement area under consideration.
The weighting coefficients reflect the relative spatial significance of each segment within the pavement structure. Unlike conventional weighted-average approaches, the proposed weighting factors are determined with respect to the total pavement area rather than the cumulative area of deficient sections. This approach prevents local defects from being artificially overrepresented and allows the index to reflect both the severity and the actual extent of construction deficiencies.
This formulation represents the average reduction in structural capacity weighted by the affected area. A value of one corresponds to a pavement fully complying with the design, while lower values indicate increasing deviation from the designed structural condition.
However, this formulation exhibits an important limitation. Since the index is based on averaging, localized sections with severe reductions in structural capacity may have only a minor influence on the final value when their spatial extent is relatively small. Consequently, the index tends to underestimate the significance of critical local defects and was therefore considered unsuitable for further development.
4.1.2. Critical Area Index
In this preliminary formulation, an illustrative threshold was adopted for the development of the Critical Area Index. The second formulation was based on the proportion of pavement segments whose structural capacity fell below a predefined threshold value:
where:
- α is the threshold coefficient defining unacceptable structural capacity, see Equation (4).
In this study, a value of
was initially adopted, corresponding to a 30% reduction in structural capacity. This formulation quantifies the proportion of pavement area classified as structurally deficient.
Although this approach provides a simple measure of the spatial extent of unacceptable sections, it suffers from the drawback that all deficient areas are treated equally. Consequently, sections with moderate reductions in structural capacity receive the same contribution to the index as sections exhibiting extremely severe deficiencies. Therefore, this formulation does not adequately represent the severity of structural deterioration and was not pursued further.
4.1.3. Combined Severity–Extent Index
The third formulation attempted to incorporate both the magnitude of structural capacity reduction and the spatial extent of the affected areas:
where
- p represents a sensitivity parameter controlling the relative influence of structural deficiencies.
Compared with the previous formulations, this approach allows severe reductions in structural capacity to be emphasized while simultaneously accounting for the spatial extent of the affected sections. Consequently, the formulation provides considerably greater flexibility and offers the possibility of calibrating the sensitivity of the index according to the level of risk associated with different types of defects.
For these reasons, the combined formulation was selected as the basis for further development of the Pavement Construction Quality Index.
Nevertheless, the initial formulation also exhibited several shortcomings. In particular, it did not distinguish between localized defects identified by core sampling and systematic deviations detected by GPR measurements. Furthermore, the use of a single sensitivity parameter implied identical behaviour for local and global deficiencies, although these two types of deviations may have substantially different consequences for pavement performance. These limitations motivated the subsequent development of an extended formulation of the Pavement Construction Quality Index presented in the following sections.
4.2. Final Formulation of the Pavement Construction Quality Index
The limitations identified in the previous formulations indicated that an appropriate construction quality index should satisfy several requirements. First, the index should simultaneously account for the severity of structural capacity reduction and the spatial extent of the affected areas. Second, the index should distinguish between localized defects and systematic deviations affecting larger portions of the pavement structure. Finally, the sensitivity of the index should be adjustable to reflect the different levels of risk associated with various types of construction deficiencies.
Based on these requirements, the final form of the Pavement Construction Quality Index (PCQI) was formulated as
where:
- DALi is the structural capacity expressed as the number of design axle loads corresponding to a localized defect identified by core sampling;
- DALj is the structural capacity associated with larger pavement sections represented by GPR measurements;
- DALdesign denotes the design structural capacity of the pavement;
- wi and wj are weighting coefficients corresponding to the ratio of the affected area to the total pavement area—to prevent double counting, the evaluated pavement area must be partitioned into mutually exclusive segments. Where a localized core-represented area lies within a broader GPR-represented segment, the corresponding local area is excluded from the GPR segment before the weighting factors are calculated; Consequently, each physical pavement area contributes to the PCQI only once;
- pcore is the sensitivity parameter associated with localized defects;
- pGPR is the sensitivity parameter associated with systematic deviations detected by GPR.
The proposed formulation yields values in the interval
where:
- PCQI = 1 corresponds to a pavement fully complying with the design assumptions;
- increasing values indicate progressively larger deviations from the designed pavement structure;
- PCQI → 0 represents severe construction deficiencies resulting in a substantial reduction in structural capacity.
Unlike the previous formulations, the proposed index enables localized defects and systematic deviations to be treated separately through independent sensitivity parameters pcore and pGPR. This feature allows the index to be calibrated according to the relative importance and risk associated with different types of construction deficiencies.
Furthermore, the formulation is sufficiently flexible to accommodate future calibration based on long-term pavement performance observations, life-cycle cost analysis, or optimization techniques such as genetic algorithms. Consequently, the proposed index provides a transparent quantitative measure of pavement construction quality. The practical interpretation of the index within contractual acceptance procedures is discussed separately through the proposed Critical Local Defect Indicator (CLDI) [15,19,20].
4.3. Calibration of Sensitivity Parameters
This section presents the calibration procedure adopted to determine the sensitivity parameters of the proposed PCQI formulation. The procedure includes the definition of a representative calibration section, generation of construction non-compliance scenarios, evaluation of their structural risk, and numerical optimization of the sensitivity parameters.
4.3.1. Calibration Section and Long-Term Performance Data
The sensitivity parameters pcore and pgpr of the Pavement Construction Quality Index were calibrated using long-term pavement performance simulations performed on a reference flexible pavement section. The calibration section was characterized by known pavement structure, traffic loading, and deterioration characteristics, allowing the evolution of pavement condition to be modelled throughout its service life [15,19,20].
For the reference section, the cumulative traffic loading reached approximately 6.2 million design axle loads (DAL) per lane, corresponding to an expected service life of 20 years under the given traffic and environmental conditions. The deterioration process was simulated using HDM-4, and the resulting pavement performance, including the International Roughness Index (IRI), cracking, rutting, pothole formation, edge deterioration, and texture depth, is shown in Table 1 [22,23].
Table 1.
Pavement life cycle on calibration section.
The reference pavement was defined as a generalized calibration section and was not intended to reproduce the pavement investigated in the subsequent case study. Accordingly, the calibrated pcore and pGPR values should be regarded as demonstration parameters illustrating the proposed calibration procedure rather than as site-specific or universally transferable constants. Practical implementation requires recalibration using representative pavement performance data reflecting the relevant structure, materials, traffic loading, climatic conditions, maintenance strategy, and locally calibrated deterioration models.
IRI was selected as the primary performance indicator for the present demonstration calibration because of its relationship with pavement serviceability and road user costs. Although the HDM-4 simulations also provided cracking, rutting, pothole development, and other deterioration indicators, these were not included in the calibration objective. The resulting sensitivity parameters therefore apply specifically to the adopted IRI-based criterion. Future field-based calibration should employ multi-indicator objectives incorporating structural distress measures in addition to IRI [31].
Consequently, the generalizable contribution of the present study is the proposed calibration procedure and PCQI–CLDI framework rather than the specific numerical values of the sensitivity parameters obtained from the demonstration dataset. Independent validation using long-term monitored pavement sections from different structural and operating conditions is required before specific parameter values are adopted for contractual pavement acceptance.
4.3.2. Development of Construction Non-Compliance Scenarios
The calibration procedure was based on a set of construction non-compliance scenarios representing different levels of deviation between the designed and the as-built pavement structure. Starting from the reference pavement section, successive scenarios were generated by reducing the thicknesses of the asphalt surfacing and base course layers while maintaining constant material properties and subgrade characteristics. Consequently, only the structural number and the corresponding structural capacity of the pavement were affected.
The purpose of these scenarios was to simulate possible deficiencies originating during pavement construction and to evaluate their influence on long-term pavement performance. The resulting evolution of pavement condition indicators over the 20-year analysis period was subsequently modelled using HDM-4 [19,20]. The HDM-4 simulations were performed using climatic conditions representative of a continental, cool semi-arid environment. The adopted climate dataset was characterized by a moisture index of −36, a dry season duration of 7.8 months, mean monthly precipitation of 64.1 mm, mean temperature of 8.8 °C, an average temperature range of 20 °C, approximately 12.1 days per year with temperatures above 32 °C, and a freeze index of 332 °C-days. The pavement class corresponded to the pavement structure subsequently investigated in the case study. No annual traffic growth was applied because the reference pavement represents an access road within an industrial area, where traffic demand is governed primarily by the operational capacity and function of the site rather than by conventional network-level traffic growth. The HDM-4 calibration dataset supplied by the national road network administrator was used for the pavement performance calculations. No separate HDM-4 deterioration coefficients were calibrated for IRI development; instead, the IRI progression was prescribed according to the long-term pavement degradation function previously developed from monitored road data [15]. Routine maintenance consisted of annual crack sealing and pothole patching when required. The critical IRI value used in the calculation of the Risk Impact Value was selected according to national pavement condition criteria corresponding to the emergency condition of local and purpose-built roads.
Two groups of scenarios were considered. The first group, Equation (8), represented moderate reductions in structural capacity ranging from 1% to 10%.
These scenarios were assumed to correspond to systematic deviations detected by GPR measurements, which generally affect larger pavement areas and are characterized by relatively small departures from the design assumptions.
The second group, Equation (9) comprised more severe reductions in structural capacity ranging from 10% to 70%.
These scenarios were considered representative of localized defects identified by core sampling. Such defects are typically associated with substantial reductions in structural capacity and may therefore lead to accelerated pavement deterioration and premature structural failure.
Consequently, separate calibration intervals were adopted for the sensitivity parameters associated with systematic and localized defects:
The evolution of the International Roughness Index obtained for both groups of scenarios is presented in Figure 3 and Figure 4.
Figure 3.
Systematic construction non-compliance scenarios used for calibration of the PCQI formulation.
Figure 4.
Localized construction non-compliance scenarios used for calibration of the PCQI formulation.
4.3.3. Definition of Risk Impact Values and Optimization Problem
The objective of the calibration procedure was to determine the sensitivity parameters of the Pavement Construction Quality Index so that the resulting penalty functions reflect the actual consequences of construction non-compliance on long-term pavement performance. For this purpose, a normalized measure of the impact associated with each construction non-compliance scenario k was introduced in the form of the Risk Impact Value, denoted by RIk.
The calibration procedure links structural capacity and long-term pavement performance in two consecutive steps. First, each construction non-compliance scenario is characterized by its structural capacity, expressed as the allowable number of Design Axle Loads DALk relative to the reference capacity DALdesign. Second, the corresponding pavement deterioration is simulated in HDM-4 and expressed through the development of IRI over the analysis period. The normalized Risk Impact Value RIk therefore represents the long-term performance consequence associated with a given reduction in structural capacity. The PCQI penalty functions are subsequently calibrated against these RIk values so that the structural-capacity ratio used in the PCQI reflects, through the fitted sensitivity parameters, the corresponding long-term deterioration impact. Thus, IRI is not used directly in the PCQI calculation; it serves only as the performance-based calibration target linking structural capacity reduction to the penalty function.
Since the International Roughness Index (IRI) directly affects ride quality and road user costs, it was selected as the primary performance indicator for the calibration procedure. For each scenario, the development of pavement roughness over the entire analysis period was obtained from HDM-4 simulations [29]. The resulting deterioration curves were subsequently transformed into normalized risk impact values according to:
where:
- RIk is the normalized risk impact associated with scenario k;
- IRIk,t is the International Roughness Index of scenario k in year t;
- IRIdesign,t is the roughness progression of the reference pavement;
- IRIcritical is the limiting roughness value corresponding to an unacceptable level of pavement serviceability;
- T is the analysis period.
The resulting risk impact values vary from 0 to 1, where values close to zero indicate behaviour similar to that of the designed pavement structure, whereas values approaching unity correspond to pavement performance close to the limiting serviceability condition. This equation defines the normalized interpretation of the Risk Impact Value within the interval 0–1. In the calibration dataset, however, the two most severe localized scenarios produced raw cumulative impact values exceeding unity (1.20 and 1.32). These values indicate deterioration beyond the adopted critical reference condition and should therefore be interpreted as saturated high-risk scenarios rather than as normalized values within the 0–1 interval.
To reproduce these risk impact values, model penalty functions were introduced for both localized defects and systematic deviations. For a given construction non-compliance scenario k, the model penalty was expressed as Pk(pcore) for localized defects:
where:
- Pk(pcore) is the model penalty corresponding to scenario k for localized defects;
- DALk is the structural capacity associated with scenario k;
- DALdesign is the structural capacity of the reference pavement;
- pcore is the sensitivity parameter associated with localized defects identified by core sampling;
and for systematic deviations:
where:
- Pk(pgpr) is the model penalty corresponding to scenario k for systematic deviations;
- pgpr is the sensitivity parameter associated with systematic deviations detected by GPR measurements.
The sensitivity parameters were determined by minimizing the discrepancy between the model penalties and the corresponding HDM-4-based risk impact values. The function was formulated as the sum of squared errors (SSE):
where:
- SSE is the function representing the total deviation between the model penalty functions and the corresponding risk impact values;
- RIk is the normalized risk impact value obtained from HDM-4 simulations for scenario k;
The first summation term corresponds to localized defects represented by the CORE scenarios; the second summation term corresponds to systematic deviations represented by the GPR scenarios.
The optimization problem was solved by minimizing the value of SSE, thereby obtaining the values of pcore and pgpr.
4.3.4. Determination of the Sensitivity Parameters
The optimization procedure described in the previous section was applied to the construction non-compliance scenarios presented in Figure 3 and Figure 4. For each scenario, the corresponding risk impact value RIk was determined from HDM-4 simulations, while the model penalty functions were evaluated using the relative reduction in structural capacity expressed by the ratio DALk/DALdesign.
Two independent sets of calibration data were considered. The first set represented localized defects associated with severe reductions in structural capacity and corresponding construction non-compliance scenarios ranging from 10% to 70%. These scenarios were used to calibrate the sensitivity parameter pcore. The second set represented systematic deviations associated with reductions in structural capacity ranging from 1% to 10% and served as the basis for calibrating the parameter pgpr.
Table 2.
Calibration input: pcore: sensitivity parameter associated with localized defects.
Table 3.
Calibration input: pgpr: sensitivity parameter associated with systematic deviations detected by GPR.
The optimization problem defined by SSE was solved numerically. The objective was to minimize the total sum of squared errors between the model penalty functions and the corresponding risk impact values obtained from HDM-4. Lower and upper bounds were imposed on both optimization variables in order to ensure physically meaningful values of the sensitivity parameters:
The optimization problem was formulated as subject to the above constraints. The optimization variables were the sensitivity parameters pcore and pgpr. The problem was solved using the Generalized Reduced Gradient (GRG) Nonlinear algorithm. Subsequently, the results were verified using the evolutionary optimization method. Both approaches converged to practically identical values of the function, indicating the stability of the obtained solution. The resulting values of the sensitivity parameters were:
and
The minimum value of the function was
The obtained results indicate that the Pavement Construction Quality Index exhibits greater sensitivity to localized defects than to systematic deviations. The lower value of pcore implies that severe local reductions in structural capacity produce disproportionately larger penalties than moderate deviations distributed over larger pavement sections. This behaviour is consistent with engineering experience, according to which localized construction defects represent a greater risk of premature pavement deterioration than relatively small systematic deviations from the designed pavement structure.
No formal uncertainty or sensitivity analysis of the calibrated parameters was performed in the present study. The resulting values of pcore and pGPR therefore depend on the adopted scenario ranges, parameter bounds, HDM-4 input assumptions, and the selected IRI-based calibration objective. They should consequently be interpreted as demonstration parameters associated with the present calibration setup rather than as statistically characterized or universally transferable constants. Future calibration using larger field datasets should include sensitivity and uncertainty analyses with respect to scenario definition, parameter bounds, pavement characteristics, traffic and climatic inputs, and deterioration-model assumptions.
5. Critical Local Defect Indicator (CLDI)
Although the proposed PCQI provides an overall quantitative assessment of pavement construction quality, its weighted formulation may partially compensate extremely severe localized defects by their relatively small spatial extent. From an engineering perspective, such defects may represent an unacceptable structural risk regardless of their limited size.
For this reason, the Pavement Construction Quality Index should not be used as the sole acceptance criterion. An additional decision criterion, referred to as the Critical Local Defect Indicator (CLDI), is therefore introduced to identify situations where localized construction deficiencies require individual engineering assessment regardless of the overall PCQI value.
The CLDI is defined as
where
- CLDI = 0 indicates that all localized defects satisfy the minimum acceptable structural capacity;
- CLDI = 1 indicates the presence of at least one localized defect with a structural capacity below the critical threshold.
For the boundary condition, a relative structural capacity exactly equal to the adopted threshold (DALcore/DALdesign = 0.300) is considered to satisfy the threshold and therefore results in CLDI = 0. The CLDI is activated only when the relative structural capacity is strictly lower than the adopted threshold. The proposed CLDI is based on the premise that not all construction deficiencies can be adequately represented by an area-weighted quality index. Although the influence of localized defects on the overall PCQI decreases with decreasing affected area, certain defects may reduce the structural capacity to such an extent that they represent an unacceptable risk of premature pavement failure.
Consequently, the acceptance procedure should distinguish between:
- Overall construction quality, represented by the PCQI;
- Critical localized structural deficiencies, represented by the CLDI.
This two-level assessment prevents severe local defects from being masked by otherwise satisfactory pavement quality.
In the present study, a threshold value corresponding to 30% of the design structural capacity was adopted for demonstration purposes. This value should not be interpreted as a mechanistically validated or universally applicable acceptance limit. Its purpose is to demonstrate the operation of the CLDI as an independent safeguard against severe localized structural deficiencies that could otherwise be masked by the area-weighted PCQI.
In practical applications, the critical threshold should be defined according to project-specific reliability requirements, applicable national specifications, contractual acceptance criteria, or calibrated using long-term pavement performance data and probabilistic structural reliability analysis. Consequently, the CLDI concept is independent of the particular threshold value adopted in this demonstration, and the threshold may be adjusted without modifying the underlying PCQI–CLDI framework.
Figure 5 illustrates the proposed technical acceptance framework combining the Pavement Construction Quality Index (PCQI) and the Critical Local Defect Indicator (CLDI). The PCQI is always calculated using all available construction quality measurements and therefore represents the overall quality of the as-built pavement structure.
Figure 5.
Technical acceptance framework for newly constructed pavements based on the Pavement Construction Quality Index (PCQI) and the Critical Local Defect Indicator (CLDI).
The CLDI is subsequently evaluated as an independent acceptance criterion. If no critical localized defect is identified (CLDI = 0), the calculated PCQIas-built represents the final quality assessment of the pavement and may be directly used within contractual acceptance procedures.
If a critical localized defect is detected (CLDI = 1), the calculated PCQIas-built remains valid as a quantitative description of the pavement quality at the time of acceptance. However, the presence of a critically under-designed localized section indicates that the overall index alone is insufficient for the final acceptance decision. In such cases, an engineering assessment is required to determine the appropriate corrective action. Depending on the severity and extent of the defect, this may include localized repair, reconstruction of the affected area, or another technically appropriate remediation measure.
Following completion of the corrective action, the Pavement Construction Quality Index is recalculated to obtain PCQIafter-repair, which represents the quality of the repaired pavement and serves as the basis for the final contractual quality evaluation.
The proposed framework therefore combines two complementary principles. The PCQI provides a continuous quantitative assessment of the overall construction quality, whereas the CLDI acts as a safeguard ensuring that severe localized structural deficiencies cannot be masked by satisfactory average pavement quality.
6. Case Study
This chapter demonstrates the practical application of the proposed methodology using a real pavement reconstruction project. The case study is organized according to the individual steps of the proposed assessment framework. First, the investigated pavement and its structural design are described. Subsequently, the structural capacity of the as-built pavement is determined using GPR measurements, core sampling, and mechanistic analysis. Finally, the proposed PCQI and CLDI framework is applied to evaluate the construction quality and to demonstrate the engineering decision process during pavement acceptance.
6.1. Description of the Case Study
The proposed methodology was verified using a real pavement construction project carried out as part of the modernization of the MHTH Zvolen Combined Heat and Power Plant (MH Teplárenský holding, Zvolen, Slovakia). The analysed pavement forms the main collector road surrounding the industrial complex and provides access to the production, storage, and service facilities within the power plant, see Figure 6.
Figure 6.
Plan view of the investigated pavement section showing the GPR survey lines and core sampling locations.
The original pavement had reached the end of its service life and exhibited significant structural deterioration caused by long-term operation under heavy industrial traffic. Consequently, the existing pavement was reconstructed while preserving the original alignment. The new pavement was designed as a flexible pavement intended to accommodate intensive heavy vehicle traffic associated with the operation of the power plant.
The reconstructed road has a total length of 336 m and a pavement width of 6.0 m. The carriageway consists of 5.5 m of traffic lanes and a 0.5 m paved shoulder. Along the road, the pavement is alternately bordered by either a 2.0 m pedestrian sidewalk or a 2.0 m parking lane constructed from roller-compacted concrete (RCC). The typical cross-section of the reconstructed pavement is presented in Figure 7.
Figure 7.
Typical cross-section of the reconstructed pavement.
The analysed pavement structure corresponds to a semi-rigid bituminous pavement, consisting of asphalt layers placed over granular and stabilized base layers. The structural composition of the pavement is presented in Figure 7 and Table 4; the mechanical characteristics of individual materials are presented in Table 4.
Table 4.
Structural composition of the pavement and the mechanical characteristics of individual materials.
The road serves as the principal internal transport route within the industrial complex. It is primarily used by heavy goods vehicles transporting fuel, technological equipment, construction materials, and maintenance supplies, while also providing access for passenger cars and public service vehicles. Owing to the high proportion of heavy commercial vehicles, the pavement is subjected to substantial axle loading despite the relatively moderate average daily traffic volume. Consequently, structural performance and fatigue resistance constitute the primary design requirements, whereas ride quality and operational reliability are essential to ensure uninterrupted operation of the power plant.
The traffic loading used for pavement design was derived from the expected operation of the industrial facility, see Table 5. Although the total AADT is relatively moderate, the traffic composition is dominated by heavy commercial vehicles associated with fuel supply, technological transport, and maintenance operations. The resulting daily equivalent axle loading was 350.7 EDAL/day, corresponding to approximately 2.56 million design axle loads over the 20-year design period.
Table 5.
Design traffic loading used for pavement structural design.
6.2. Structural Analysis and Service Life Estimation of the Designed Pavement
After completion of the field investigations, the measured pavement layer thicknesses and laboratory-determined material properties were used to evaluate the structural capacity of the investigated pavement. The objective of this analysis was to quantify the influence of construction deviations on pavement fatigue life expressed as the cumulative number of Design Axle Loads (DAL).
The designed pavement and each investigated as-built configuration (GPR1, GPR2, CORE1–CORE4) were analysed under identical loading conditions using the mechanistic–empirical procedure described in Section 3; therefore, differences in calculated structural capacity resulted from the measured pavement layer configurations [16,17,18,19,20,21].
Since the proposed Pavement Construction Quality Index (PCQI) is formulated on the basis of pavement structural capacity expressed as the allowable number of Design Axle Loads (DAL), it was necessary to convert the calculated stress state into the corresponding fatigue life of the pavement. This was achieved using the fatigue relationship presented in Equation (20), which estimates the allowable cumulative number of Design Axle Loads until structural failure as a function of the calculated radial tensile stress [16,17,18].
where:
- δr,i,l—radial stress of bottom layer;
- Ri,l—strength of material on bottom bound layer;
- SN,i—fatigue coefficient, based on a, b fatigue coefficients.
The GPR records were processed using the procedure described in Section 3.2 to determine the as-built pavement layer thicknesses. Figure 8 illustrates the interpreted layer interfaces obtained from the 2 GHz air-coupled and 400 MHz ground-coupled antennas.
Figure 8.
Interpretation of GPR records obtained using the 2 GHz air-coupled (AC) antenna for asphalt-bound layers and the 400 MHz ground-coupled (GC) antenna for unbound pavement layers.
The thickness of each pavement layer was determined from the measured two-way travel time of the reflected electromagnetic wave [24,27]. The conversion from travel time to layer thickness was performed according to:
where
- h—thickness of the investigated pavement layer (m);
- v—propagation velocity of the electromagnetic wave within the material (m/s);
- t—measured two-way travel time of the electromagnetic wave between the transmitting antenna and the reflected interface (s).
The propagation velocity depends primarily on the dielectric properties of the material and is related to the relative dielectric permittivity [21,28], according to:
where
- c—speed of light in vacuum;
- εr—relative dielectric permittivity of the material, see Equation (23).
6.3. Application of the PCQI–CLDI Assessment Framework
The proposed quality assessment framework was applied to the investigated pavement following the procedure presented in Section 5. The evaluation consists of three sequential stages. Initially, the PCQI is determined for the as-built pavement using all measured construction deviations. Subsequently, the Critical Local Defect Indicator (CLDI) is evaluated to identify any localized structural deficiencies requiring corrective action. Finally, the PCQI is recalculated after the assumed repair of the critical defect, illustrating how the proposed framework supports engineering decision-making during pavement acceptance.
6.3.1. Evaluation of Pavement Construction Quality
The GPR survey indicated that the average pavement thickness was generally consistent with the designed structure, although several localized anomalies were identified. Four core samples were intentionally extracted at these locations to provide destructive ground-truth verification of the GPR-derived layer thicknesses. The observed agreement therefore provides point-wise validation of the adopted GPR thickness interpretation at the investigated locations. However, because the verification locations were targeted rather than randomly selected, the cores do not provide a statistical estimate of the overall anomaly-detection uncertainty or of possible false-positive and false-negative GPR indications.
Figure 9 and Figure 10 compare the designed pavement structure with the layer thicknesses obtained from the two GPR survey lines and the four core samples. The GPR measurements indicate relatively small systematic deviations, whereas the cores reveal several localized deficiencies characterized by substantially reduced asphalt-layer thicknesses.
Figure 9.
Comparison of the designed and as-built pavement layer thicknesses determined by GPR measurements and core sampling.
Figure 10.
Comparison of asphalt-bound layer thickness deviations from the designed pavement.
6.3.2. Structural Capacity of the Investigated Sections
Using the measured pavement layer configurations, the structural response of each investigated section was analysed using the layered elastic half-space model. The calculated radial tensile stress at the bottom of the AC22 asphalt layer was subsequently converted into the allowable cumulative number of Design Axle Loads (DAL) using the fatigue relationship presented in Section 3 [16,17,18]. The calculated structural capacities are summarized in Table 6.
Table 6.
Calculated radial tensile stress and structural capacity of the investigated pavement sections.
The calculated results demonstrate two distinct types of construction deviations.
The GPR measurements indicate moderate reductions in structural capacity ranging from approximately 6 to 13% relative to the designed pavement. These deviations represent systematic reductions affecting large portions of the pavement and are therefore expected to influence the overall pavement quality.
In contrast, the core samples reveal localized construction deficiencies resulting in substantially greater reductions in structural capacity. The most severe defect (CORE1) retained only approximately 18% of the designed structural capacity, while the remaining core locations exhibited reductions ranging from approximately 29 to 57%. Although these defects affect only limited pavement areas, they represent locations with a potentially high risk of premature structural failure.
This distinction between systematic and localized construction deficiencies forms the basis for the development of the Pavement Construction Quality Index (PCQI) and the Critical Local Defect Indicator (CLDI), presented in the following sections.
6.4. Calculation of the Pavement Construction Quality Index (PCQI)
The Pavement Construction Quality Index (PCQI) was calculated using the methodology developed in Section 4. Since no corrective actions had been performed at the time of pavement acceptance, the calculated value represents the as-built pavement condition, hereinafter referred to as PCQIas-built.
The calculation incorporates both systematic construction deviations identified by the GPR survey and localized structural deficiencies detected by core sampling. It should be emphasized that the CORE weighting factors do not represent the physical area of the extracted core samples themselves. Each CORE weight represents the spatial extent of the corresponding localized anomalous pavement zone identified by GPR, within which the core sample was extracted for verification and material characterization. The weighting factors were determined according to the relative area represented by each evaluated segment. For the case study, the total evaluated pavement area was 2016 m2, corresponding to a pavement width of 6 m and a length of 336 m. The road consisted of two traffic lanes, and each GPR survey line therefore represented an initial lane area of 1008 m2. The GPR survey identified the spatial extent of four localized anomalous zones, from which the core samples were subsequently extracted. The representative areas assigned to CORE1, CORE2, CORE3, and CORE4 were 112, 49, 77, and 84 m2, respectively. CORE1 and CORE2 were located within the area represented by GPR1, while CORE3 and CORE4 were located within the area represented by GPR2. To prevent double counting, the core-represented areas were subtracted from the corresponding GPR-represented lane areas. Consequently, the effective GPR areas were calculated as 1008 − 112 − 49 = 847 m2 for GPR1 and 1008 − 77 − 84 = 847 m2 for GPR2. The weighting factors were then obtained by dividing each mutually exclusive segment area by the total pavement area of 2016 m2, resulting in weights of approximately 0.420 for each GPR segment and 0.056, 0.024, 0.038, and 0.042 for CORE1–CORE4, respectively. For demonstration of the complete PCQI procedure, the generalized calibration parameters pGPR = 0.75465 and pCORE = 0.347789 were applied to the case study; as discussed in Section 4.3.1, these values should not be interpreted as site-specific calibrated constants.
The Pavement Construction Quality Index was calculated according to the methodology presented in Section 4.2. The calculation incorporates both systematic construction deviations identified by the GPR survey and localized structural deficiencies verified by core sampling. Table 6 summarizes the input parameters together with the intermediate calculation results required for the determination of PCQIas-built. The complete calculation procedure and the corresponding numerical substitution are presented in Table 7 and Equations (24)–(26).
Table 7.
Input parameters and intermediate calculation results for the determination of PCQIas-built.
The calculated value of PCQIas-built = 0.721 represents the overall construction quality according to the proposed severity–extent formulation and indicates a substantial deviation from the reference condition represented by PCQI = 1.000. The PCQI value should not be interpreted as a direct percentage of the remaining structural capacity, because it incorporates nonlinear penalty functions and the spatial extent of the identified deficiencies. Nevertheless, this value alone does not determine the technical acceptability of the pavement. The acceptance decision must also consider the presence of critical localized defects through the Critical Local Defect Indicator (CLDI), presented in the following section.
6.5. Application of the Critical Local Defect Indicator (CLDI)
Although the calculated value of PCQIas-built provides a consistent assessment of the overall structural quality of the constructed pavement, the proposed technical acceptance framework requires an additional evaluation of localized structural deficiencies using the Critical Local Defect Indicator (CLDI).
According to the criterion introduced in Section 5, CLDI is activated whenever the structural capacity of any localized defect identified by core sampling falls below 30% of the designed structural capacity. This additional verification ensures that critically under-designed pavement sections cannot be accepted solely on the basis of satisfactory overall pavement quality. The calculated structural capacities obtained from the core samples are summarized in Table 8.
Table 8.
Evaluation of the Critical Local Defect Indicator (CLDI) for the investigated pavement.
The results indicate that the structural capacity of CORE1 corresponds to only 18.1% of the designed pavement capacity, which is substantially below the acceptance threshold of 30%. Consequently, CLDI = 1 and the pavement cannot be technically accepted without further engineering assessment. It should also be noted that values close to the adopted threshold should not be interpreted as unambiguous pass/fail classifications without consideration of measurement and modelling uncertainty. In the present case study, CORE2 and CORE4 yielded relative structural capacities of 0.312 and 0.302, respectively, and are therefore located very close to the illustrative threshold of 0.300. Small variations in measured layer thicknesses, material properties, or structural model inputs could potentially alter their classification. Consequently, although CORE2 and CORE4 do not activate the CLDI under the adopted illustrative threshold, their proximity to the boundary indicates that these locations should be treated with particular engineering attention.
According to the proposed framework, activation of the CLDI does not invalidate the calculated value of PCQIas-built. Instead, it indicates that the overall quality assessment must be supplemented by an engineering evaluation of the identified critical defect.
In the investigated case, engineering assessment concluded that the localized deficiency represented by CORE1 required corrective action before acceptance of the pavement. Consequently, the defective pavement section was assumed to be repaired, and the Pavement Construction Quality Index was recalculated after excluding the repaired defect from the quality assessment, as seen in Table 9 and Equations (27) and (28).
Table 9.
Input parameters and intermediate calculation results for the determination of PCQIafter−repair.
Following the repair of the critical localized defect (CORE1), the Pavement Construction Quality Index increased from 0.721 to 0.761, representing an improvement of approximately 5.5% in the overall structural quality of the pavement. The increase reflects the elimination of the most severe localized structural deficiency identified by the CLDI while preserving the influence of the remaining construction deviations.
Because CORE1 activated the CLDI criterion, corrective action was required before pavement acceptance. In practical implementation, such a localized repair would normally be carried out under direct construction supervision, allowing the corrective works, restored layer thicknesses, materials, and workmanship to be verified during execution. Therefore, the repaired local defect does not necessarily require repetition of the complete GPR survey and structural-capacity analysis of the entire pavement. In the present framework, the repaired CORE1 area is consequently no longer treated as an independent deficient segment and is reassigned to the surrounding GPR1 area for the calculation of PCQIafter-repair. Additional post-repair GPR or structural verification may be appropriate where numerous localized repairs are required, where the repair extent is substantial, or where the effectiveness of the corrective action cannot be sufficiently verified during construction.
The results demonstrate the complementary roles of the proposed technical acceptance framework. The Critical Local Defect Indicator (CLDI) identifies localized defects that require mandatory corrective action before pavement acceptance, whereas the Pavement Construction Quality Index (PCQI) provides a quantitative assessment of the overall structural quality of the pavement both before and after repair. Consequently, the recalculated PCQIafter-repair represents the structural quality of the pavement at the time of its final technical acceptance.
7. Discussion
The discussion is organized into two complementary sections. Section 7.1 analyses the behaviour of the proposed PCQI formulation using Monte Carlo simulation to examine its response under a wide range of construction non-compliance scenarios. Section 7.2 builds upon these results by proposing an engineering interpretation of the PCQI intervals, providing practical guidance for the application of the proposed methodology during pavement acceptance procedures.
7.1. Behaviour of the Proposed PCQI Formulation
The proposed framework can also be viewed in the broader context of built-environment asset management, where the quality of newly constructed infrastructure influences future maintenance demand, service continuity, resource consumption, and long-term infrastructure resilience. The Monte Carlo simulation [32,33] was not intended to reproduce the statistical distribution of construction defects observed in practice or to provide a probabilistic validation of the proposed framework. Instead, it was used as a numerical stress test to investigate the deterministic response of the PCQI formulation over a broad range of feasible combinations of systematic and localized construction deficiencies. A total of 1000 randomly generated scenarios were evaluated. The generated input combinations were exploratory rather than empirically calibrated probability distributions, and no correlation structure derived from field data was imposed. The analysis was therefore limited to examining the continuity and internal behaviour of the proposed formulation. Future validation should employ empirical construction-quality datasets to define representative distributions, correlations, spatial constraints, and uncertainty ranges.
Across the proposed PCQI intervals, the principal simulated parameters changed progressively. The average GPR penalty increased from approximately 0.02 in the highest quality interval to approximately 0.39 in the lowest, while the contribution of localized defects increased through both their severity and spatial extent. Within the explored numerical domain, decreasing PCQI values were therefore associated with progressively increasing combinations of structural deficiencies.
Table 10 shows that the average structural capacity decreases progressively across the proposed PCQI intervals, while both GPR and CORE penalties increase. This behaviour indicates a smooth numerical response of the PCQI formulation to increasing combinations of systematic and localized deficiencies within the explored simulation domain.
Table 10.
Summary statistics of 1000 simulated construction non-compliance scenarios classified according to the proposed PCQI interpretation intervals.
Figure 11 illustrates the continuous deterministic response of the PCQI formulation to combinations of systematic and localized deficiencies. Each point represents one simulated scenario; the horizontal axis shows the systematic GPR penalty, the vertical axis the resulting PCQI, and the bubble size the corresponding CORE penalty. The absence of abrupt changes indicates numerical continuity within the explored domain. The widening vertical spread with increasing GPR penalty reflects the additional influence of localized deficiencies, meaning that pavements with similar systematic deviations may obtain different PCQI values depending on the severity and spatial extent of localized defects. This behaviour should not be interpreted as empirical validation of the proposed interpretation classes or as evidence of external validity.
Figure 11.
Relationship between systematic construction deficiencies (GPR penalty), localized construction deficiencies (CORE penalty), and the resulting PCQI obtained from the Monte Carlo simulation.
7.2. Engineering Interpretation of PCQI
Although the proposed Pavement Construction Quality Index (PCQI) provides a quantitative measure of pavement construction quality, its practical application requires engineering interpretation. The numerical value of PCQI itself does not prescribe a specific contractual or legal consequence. Instead, it expresses the overall structural quality of the constructed pavement relative to the design assumptions and serves as a reproducible indicator supporting engineering decision-making. The interpretation of individual PCQI intervals should therefore be understood as a recommended engineering framework rather than a mandatory acceptance procedure. The appropriate actions associated with each quality class may vary depending on national legislation, contractual provisions, pavement importance, traffic loading, and the asset management strategy adopted by the road authority. Consequently, the proposed methodology intentionally separates the technical evaluation of construction quality from subsequent contractual decisions.
The Monte Carlo simulation presented in the previous section illustrates how progressively increasing combinations of systematic and localized deficiencies are reflected in decreasing PCQI values. On this basis, the proposed intervals are used as illustrative engineering interpretation classes that facilitate practical interpretation of the continuous PCQI scale. These classes are not statistically derived acceptance thresholds and should therefore be regarded as an engineering interpretation framework rather than empirically validated classification boundaries.
Table 11 summarizes the proposed engineering interpretation of the PCQI intervals. The classes are intended to support engineering judgement during pavement acceptance and are applied only after evaluation of the CLDI. Where CLDI = 1, corrective action and subsequent reassessment are required before final classification.
Table 11.
Proposed engineering interpretation classes of the Pavement Construction Quality Index (PCQI).
The interval between 0.95 and 1.00 represents pavements whose structural capacity is practically identical to the design assumptions. Only negligible systematic deviations and isolated localized deficiencies are expected, and the pavement can generally be considered fully compliant with the intended structural performance.
The interval between 0.90 and 0.95 corresponds to minor construction deviations that are unlikely to produce measurable changes in long-term pavement performance. Such deficiencies may justify increased construction documentation or additional monitoring during the warranty period; however, they do not normally require corrective structural interventions.
The interval between 0.80 and 0.90 indicates moderate construction quality reduction resulting from a combination of systematic and localized deficiencies. Although the pavement is expected to remain structurally functional, measurable reductions in structural capacity may occur. Depending on the contractual framework, this quality level may justify additional technical evaluation, extended warranty obligations, or other forms of contractual compensation.
The interval between 0.70 and 0.80 represents significant structural non-compliance. Pavements within this category exhibit pronounced systematic deficiencies and an increasing extent of localized defects. Additional engineering assessment is recommended to determine whether the remaining structural capacity satisfies the functional requirements of the pavement throughout its intended service life.
The interval between 0.60 and 0.70 indicates severe construction deficiencies that are expected to substantially reduce pavement structural performance. Such cases generally require comprehensive engineering evaluation to determine whether localized corrective measures are sufficient or whether more extensive rehabilitation should be considered.
The interval between 0.60 represents major structural non-compliance. These scenarios correspond to extensive construction deficiencies that significantly depart from the design assumptions. Although the proposed methodology does not prescribe specific contractual consequences, pavements within this category would generally require detailed structural investigation and careful consideration of appropriate corrective measures before final acceptance.
It should be emphasized that the proposed interpretation classes are intended to support engineering judgement rather than replace it. The final decision regarding pavement acceptance, contractual compensation, or corrective actions should always consider the technical importance of the project, traffic loading, applicable contractual provisions, and the requirements of the relevant national regulations.
8. Conclusions
This paper presented a structural capacity-based framework for post-construction pavement quality assessment combining the Pavement Construction Quality Index (PCQI) with the Critical Local Defect Indicator (CLDI). The framework converts measured as-built deviations into structural capacity expressed in Design Axle Loads (DAL), allowing both the severity and spatial extent of construction deficiencies to be incorporated into the quality assessment. The PCQI provides a continuous measure of overall construction quality, while the CLDI prevents severe localized defects from being masked by area-weighted averaging. More broadly, the proposed approach demonstrates how construction-quality information can be translated into performance-based indicators for infrastructure assets within the built environment. By connecting as-built condition with expected structural service life, such approaches can support more informed infrastructure management and contribute to the long-term reliability and sustainability of urban and developed environments.
Application to the investigated pavement demonstrated the practical operation of the framework using GPR measurements, core sampling, laboratory testing, and mechanistic structural analysis. The assessment distinguished systematic deviations affecting larger pavement areas from localized structural deficiencies, while the CLDI identified the critical CORE1 defect that required corrective action before final acceptance. The calibrated sensitivity parameters enabled these two types of deficiencies to be treated separately within the PCQI formulation.
Monte Carlo simulation was used as a numerical stress test to examine the internal behaviour of the PCQI formulation over a broad exploratory range of construction non-compliance scenarios. The results showed a continuous response of the index to progressively increasing combinations of systematic and localized deficiencies. The resulting PCQI intervals are therefore proposed as illustrative engineering interpretation classes rather than statistically derived or empirically validated acceptance thresholds.
Despite these contributions, several limitations should be acknowledged. The proposed methodology was demonstrated using a single pavement structure and a single case study. Although the calibration procedure was based on mechanistic analysis and HDM-4 deterioration modelling, the obtained sensitivity parameters cannot yet be considered universally applicable to all pavement types, climatic conditions or traffic categories. In addition, the proposed CLDI threshold of 30% of the design structural capacity represents an engineering assumption adopted for demonstration purposes and should be further validated using long-term pavement performance observations.
Future research should therefore focus on validating the proposed methodology using larger databases of newly constructed pavements representing different pavement structures, traffic conditions and climatic regions. Particular attention should be devoted to the calibration of the sensitivity parameters using long-term field observations and accelerated pavement testing. Future validation using empirical construction-quality datasets should be used to assess whether the proposed PCQI interpretation intervals correspond to observed pavement performance outcomes and, where appropriate, to recalibrate the class boundaries. Future developments may also investigate probabilistic calibration procedures, optimization techniques based on larger datasets, and integration of the proposed framework into digital quality management systems and pavement management systems.
Overall, the proposed PCQI–CLDI framework provides a structured and reproducible methodology for evaluating pavement construction quality. By linking construction deviations to structural capacity and expected long-term pavement performance, the methodology provides a traceable engineering procedure for supporting pavement acceptance decisions while retaining the need for engineering judgement in the selection of model assumptions, calibration parameters, and acceptance criteria.
However, the numerical sensitivity parameters obtained in this study represent demonstration calibration values and should not be considered universally applicable acceptance parameters. Their practical use requires calibration and independent validation against representative long-term pavement performance data reflecting local pavement structures, materials, traffic loading, climatic conditions, and deterioration-model settings. Accordingly, the proposed framework should currently be regarded as a methodological basis for performance-oriented pavement acceptance rather than as a fully validated universal acceptance model.
By linking construction deviations to structural capacity and expected long-term pavement performance, the methodology provides a traceable engineering procedure for supporting pavement acceptance and infrastructure asset-management decisions within the wider built environment.
Supplementary Materials
The following supporting information can be downloaded at: https://www.mdpi.com/article/10.3390/buildings16173428/s1.
Author Contributions
Conceptualization, Ľ.R. and M.K.; methodology, Ľ.R. and M.K.; software, Ľ.R. and M.K.; validation, Ľ.R., M.K. and L.Ď.; formal analysis, Ľ.R. and M.K.; investigation, L.Ď.; resources, Š.Š. and M.P.; data curation, L.Ď. and M.K.; writing—original draft preparation, Ľ.R. and M.K.; writing—review and editing, Ľ.R., M.K., Š.Š., M.P. and L.Ď.; visualization, Ľ.R., M.K. and L.Ď.; supervision, Ľ.R. and Š.Š.; project administration, Š.Š.; funding acquisition, M.P. All authors have read and agreed to the published version of the manuscript.
Funding
This research was funded by the Slovak Research and Development Agency, grant number APVV-22-0040.
Data Availability Statement
The original contributions presented in this study are included in the article/Supplementary Materials. Further inquiries can be directed to the corresponding author.
Acknowledgments
The authors have reviewed and edited the output and take full responsibility for the content of this publication.
Conflicts of Interest
The authors declare no conflicts of interest.
References
- Burati, J.L.; Weed, R.M.; Hughes, C.S.; Hill, H.S. Optimal Procedures for Quality Assurance Specifications; FHWA-RD-02-095; Federal Highway Administration: McLean, VA, USA, 2003.
- Epps, J.A. Recommended Performance-Related Specification for Hot-Mix Asphalt Construction: Results of the WesTrack Project; NCHRP Report 455; Transportation Research Board: Washington, DC, USA, 2002. [Google Scholar]
- Haggerty, B.; Abdallah, I.; Nazarian, S. Rational estimation of construction impact on pavement performance. Transp. Res. Rec. 2006, 1946, 39–46. [Google Scholar] [CrossRef]
- Sandoval, C.; Orobio, A. Effect of construction tolerance on flexible pavement performance. Rev. Ing. Constr. 2013, 28, 266–277. [Google Scholar] [CrossRef] [Scilit]
- Dalla Valle, P.; Thom, N. Pavement layer thickness variability evaluation and effect on performance life. Int. J. Pavement Eng. 2020, 21, 930–938. [Google Scholar] [CrossRef] [Scilit]
- Al-Qadi, I.L.; Lahouar, S.; Loulizi, A. Successful application of ground-penetrating radar for quality assurance-quality control of new pavements. Transp. Res. Rec. 2003, 1861, 86–97. [Google Scholar] [CrossRef] [Scilit]
- Wang, S.; Zhao, S.; Al-Qadi, I.L. Real-time monitoring of asphalt concrete pavement density during construction using ground penetrating radar: Theory to practice. Transp. Res. Rec. 2019, 2673, 329–338. [Google Scholar] [CrossRef] [Scilit]
- Wang, S.; Yang, M.; Zhang, Y.; Huang, X.; Ma, T.; Wang, D. A comprehensive evaluation of non-destructive density and moisture content measurement of asphalt pavement during construction using ground-penetrating radar. J. Road Eng. 2026, 6, 51–73. [Google Scholar] [CrossRef] [Scilit]
- Fares, A.; Zayed, T.; Faris, N.; Yussif, A.M.; Abdelkhalek, S. Pavement thickness evaluation using GPR and fuzzy logic. Autom. Constr. 2025, 175, 106236. [Google Scholar] [CrossRef] [Scilit]
- Liu, Y.; Zhang, Z.; Yuan, Y.; Zhu, Y.; Wang, K. Quantitative evaluation of internal pavement distresses based on 3D ground penetrating radar. Balt. J. Road Bridge Eng. 2025, 20, 45–69. [Google Scholar] [CrossRef] [Scilit]
- PIARC. Road Asset Management Manual; World Road Association: Paris, France, 2017; Available online: https://road-asset.piarc.org/en (accessed on 15 July 2026).
- Paterson, J.; Rossigny, P. Renewal and Rejuvenation of Aging Infrastructure. Routes/Roads 2022, 394, RR394-048. [Google Scholar]
- Narnoli, V.K.; Suman, S.K. Development of structural condition assessment model for flexible pavement based on LWD and GPR measurements. Int. J. Pavement Res. Technol. 2021, 14, 570–578. [Google Scholar] [CrossRef] [Scilit]
- Shah, Y.U.; Jain, S.S.; Tiwari, D.; Jain, M.K. Development of overall pavement condition index for urban road network. Procedia Soc. Behav. Sci. 2013, 104, 332–341. [Google Scholar] [CrossRef] [Scilit]
- Sedivy, S.; Mikulova, L.; Danisovic, P.; Sramek, J.; Remek, L.; Kozel, M. Long-term monitored road degradation functions as a tool to increase quality of pavement design. Appl. Sci. 2021, 11, 9839. [Google Scholar] [CrossRef] [Scilit]
- Huang, Y.H. Pavement Analysis and Design, 2nd ed.; Pearson Prentice Hall: Upper Saddle River, NJ, USA, 2004. [Google Scholar]
- Shell International Petroleum Company. Shell Pavement Design Manual: Asphalt Pavements and Overlays for Road Traffic; Shell International Petroleum Company: London, UK, 1978. [Google Scholar]
- AASHTO. Guide for Design of Pavement Structures; American Association of State Highway and Transportation Officials: Washington, DC, USA, 1993. [Google Scholar]
- AASHTO. Mechanistic–Empirical Pavement Design Guide: A Manual of Practice; American Association of State Highway and Transportation Officials: Washington, DC, USA, 2008. [Google Scholar]
- National Academies of Sciences, Engineering, and Medicine. Implementation of the AASHTO Mechanistic-Empirical Pavement Design Guide and Software; The National Academies Press: Washington, DC, USA, 2014. [Google Scholar]
- Ministry of Transport of the Czech Republic. TP 170: Navrhování vozovek pozemních komunikací; Ministry of Transport: Prague, Czech Republic, 2025. [Google Scholar]
- Odoki, J.B.; Kerali, H.G.R. HDM-4 Analytical Framework and Model Descriptions; World Road Association: Paris, France, 2000; Volume 4. [Google Scholar]
- Morosiuk, G.; Riley, M.J.; Odoki, J.B. HDM-4 Road Deterioration and Works Effects Models; World Road Association: Paris, France, 2004; Volume 6. [Google Scholar]
- Daniels, D.J. Ground Penetrating Radar, 2nd ed.; The Institution of Electrical Engineers: London, UK, 2004. [Google Scholar]
- EN 12697-6; Bituminous Mixtures—Test Methods—Part 6: Determination of Bulk Density of Bituminous Specimens. European Committee for Standardization: Brussels, Belgium, 2020.
- EN 12697-1; Bituminous Mixtures—Test Methods—Part 1: Soluble Binder Content. European Committee for Standardization: Brussels, Belgium, 2020.
- Topp, G.C.; Davis, J.L.; Annan, A.P. Electromagnetic determination of soil water content: Measurements in coaxial transmission lines. Water Resour. Res. 1980, 16, 574–582. [Google Scholar] [CrossRef] [Scilit]
- EN 12697-2; Bituminous Mixtures—Test Methods—Part 2: Determination of Particle Size Distribution. European Committee for Standardization: Brussels, Belgium, 2015.
- EN 12697-23; Bituminous Mixtures—Test Methods—Part 23: Determination of the Indirect Tensile Strength of Bituminous Specimens. European Committee for Standardization: Brussels, Belgium, 2017.
- EN 12697-26; Bituminous Mixtures—Test Methods—Part 26: Stiffness. European Committee for Standardization: Brussels, Belgium, 2018.
- Sayers, M.W.; Gillespie, T.D.; Queiroz, C.A.V. The International Road Roughness Experiment: Establishing Correlation and a Calibration Standard for Measurements; World Bank Technical Paper No. 45; World Bank: Washington, DC, USA, 1986. [Google Scholar]
- Kroese, D.P.; Taimre, T.; Botev, Z.I. Handbook of Monte Carlo Methods; Wiley: Hoboken, NJ, USA, 2011. [Google Scholar]
- Rubinstein, R.Y.; Kroese, D.P. Simulation and the Monte Carlo Method, 3rd ed.; Wiley: Hoboken, NJ, USA, 2016. [Google Scholar]
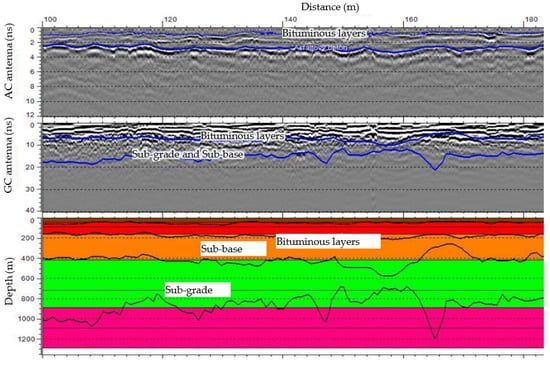
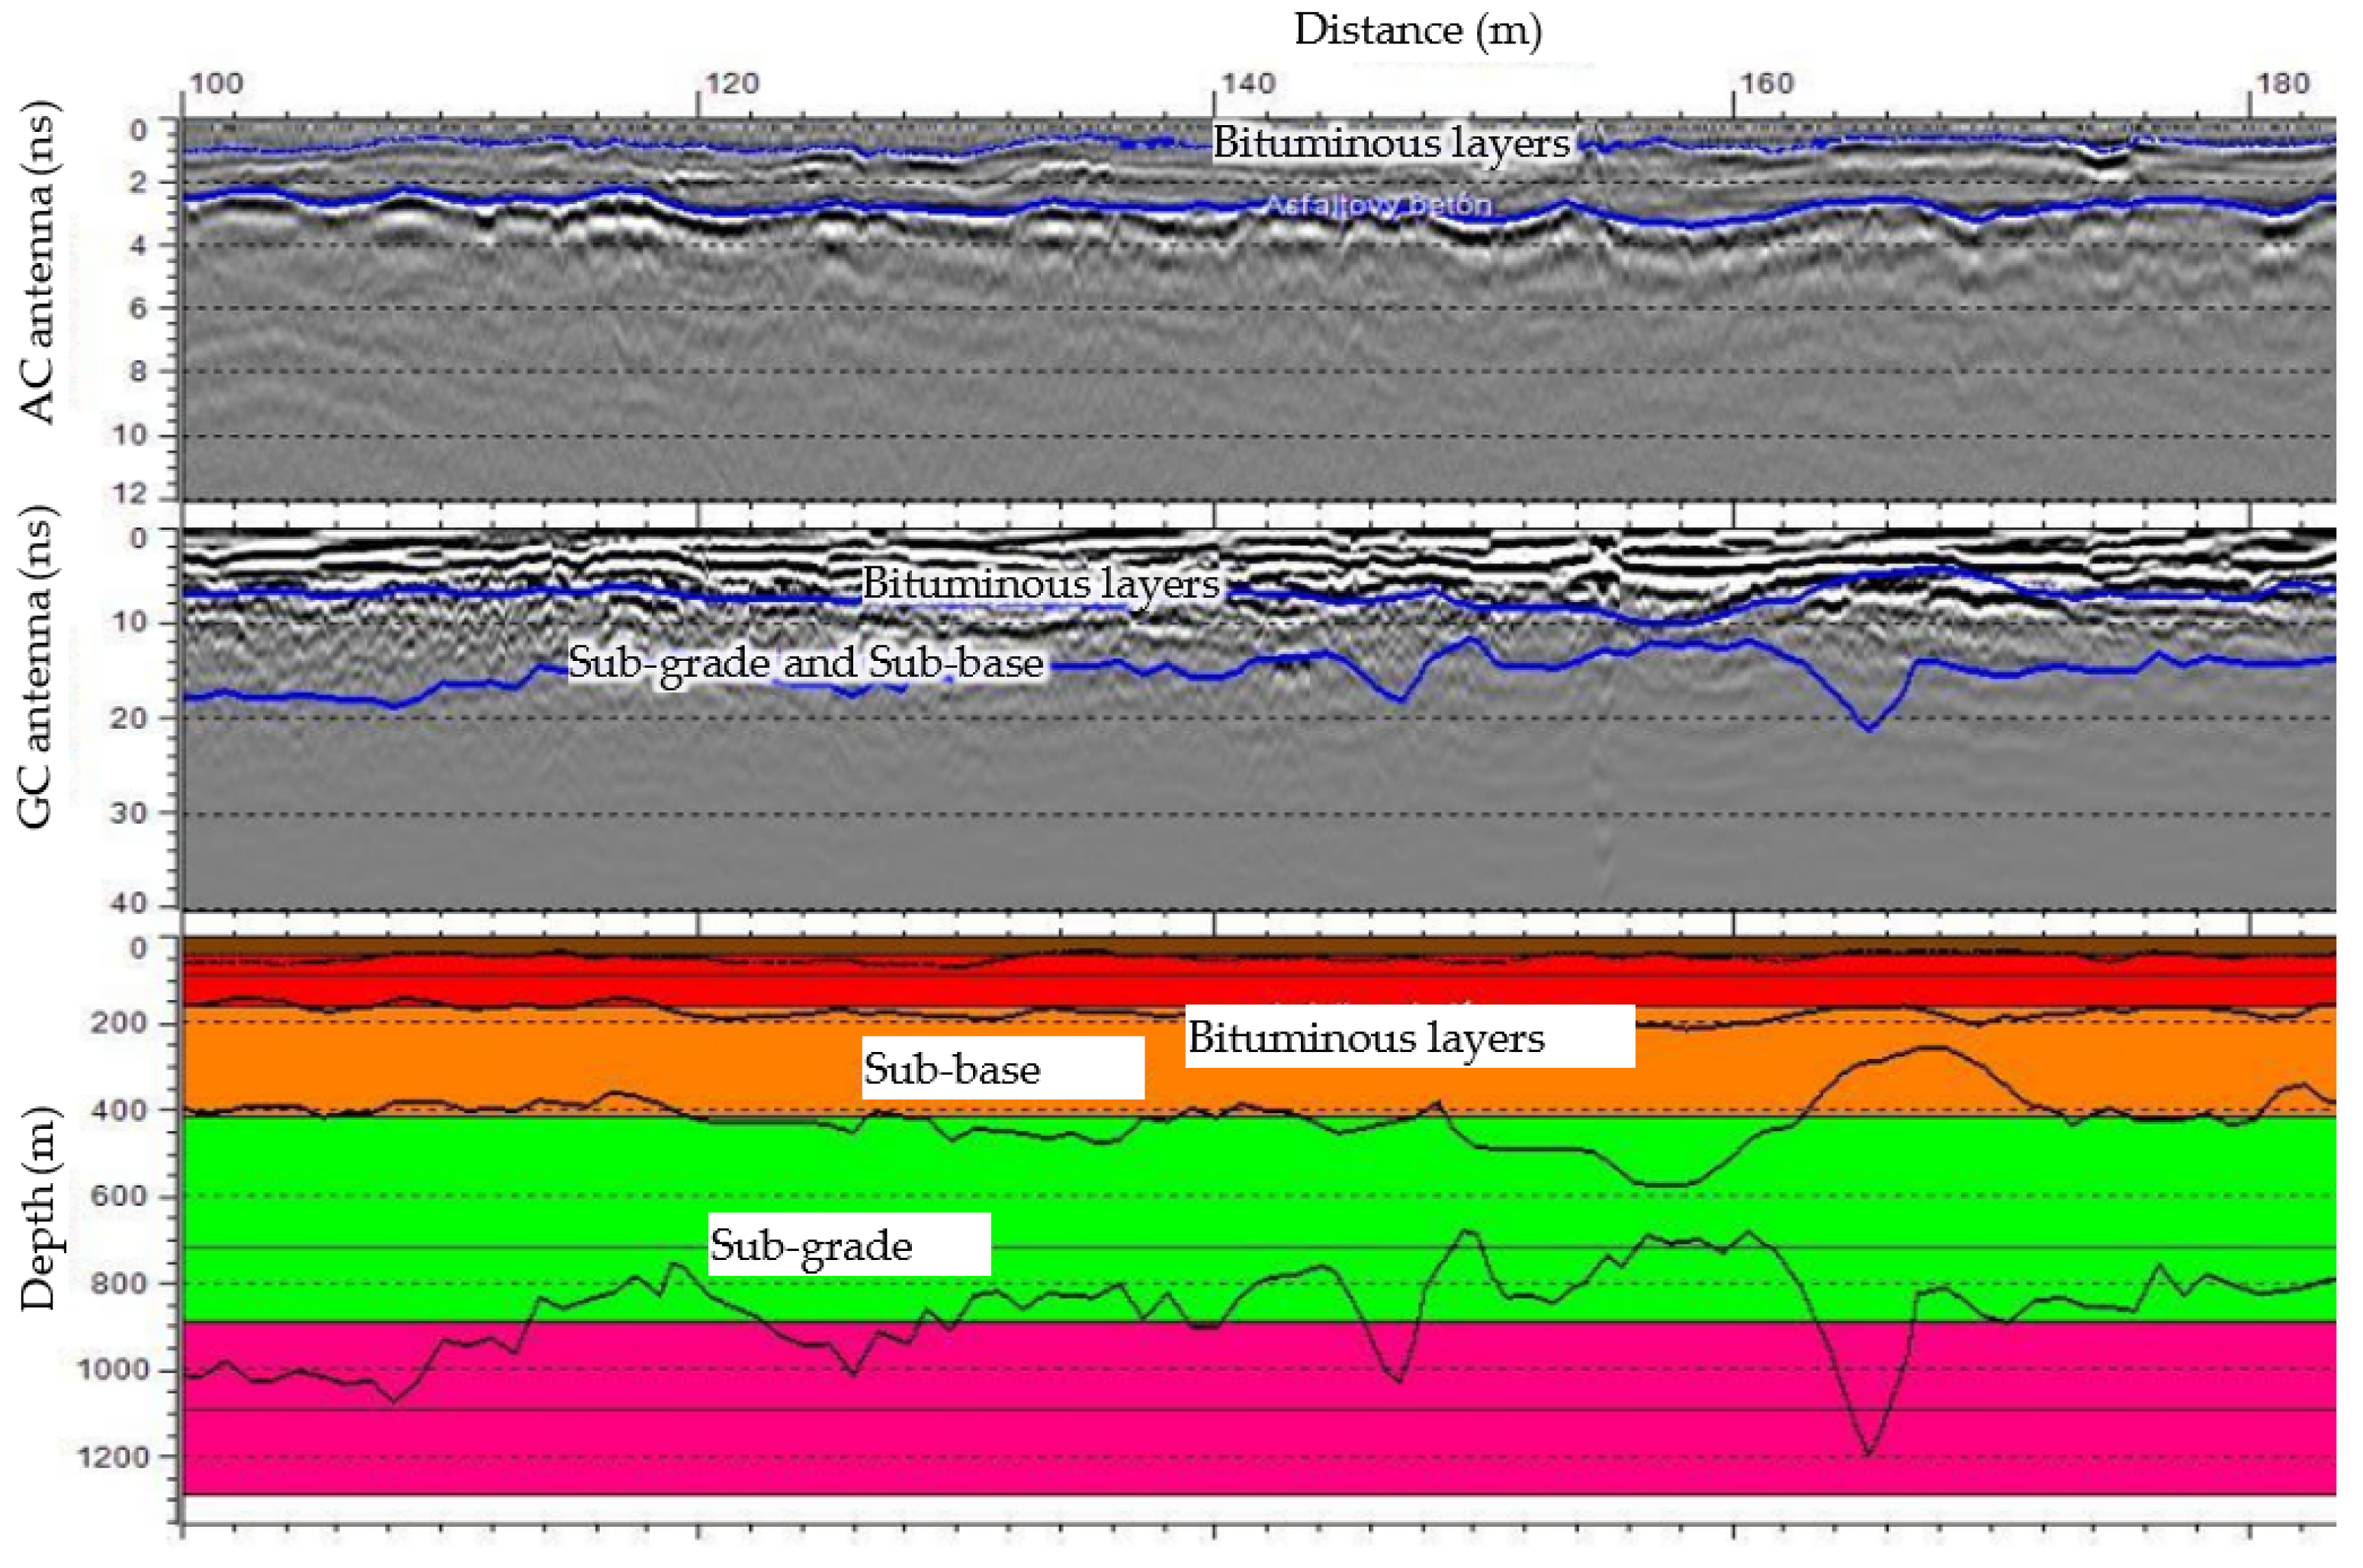
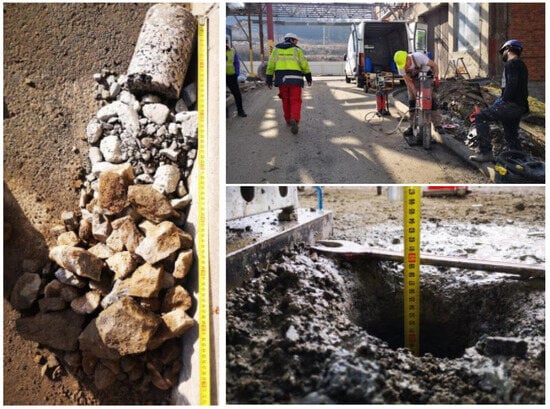
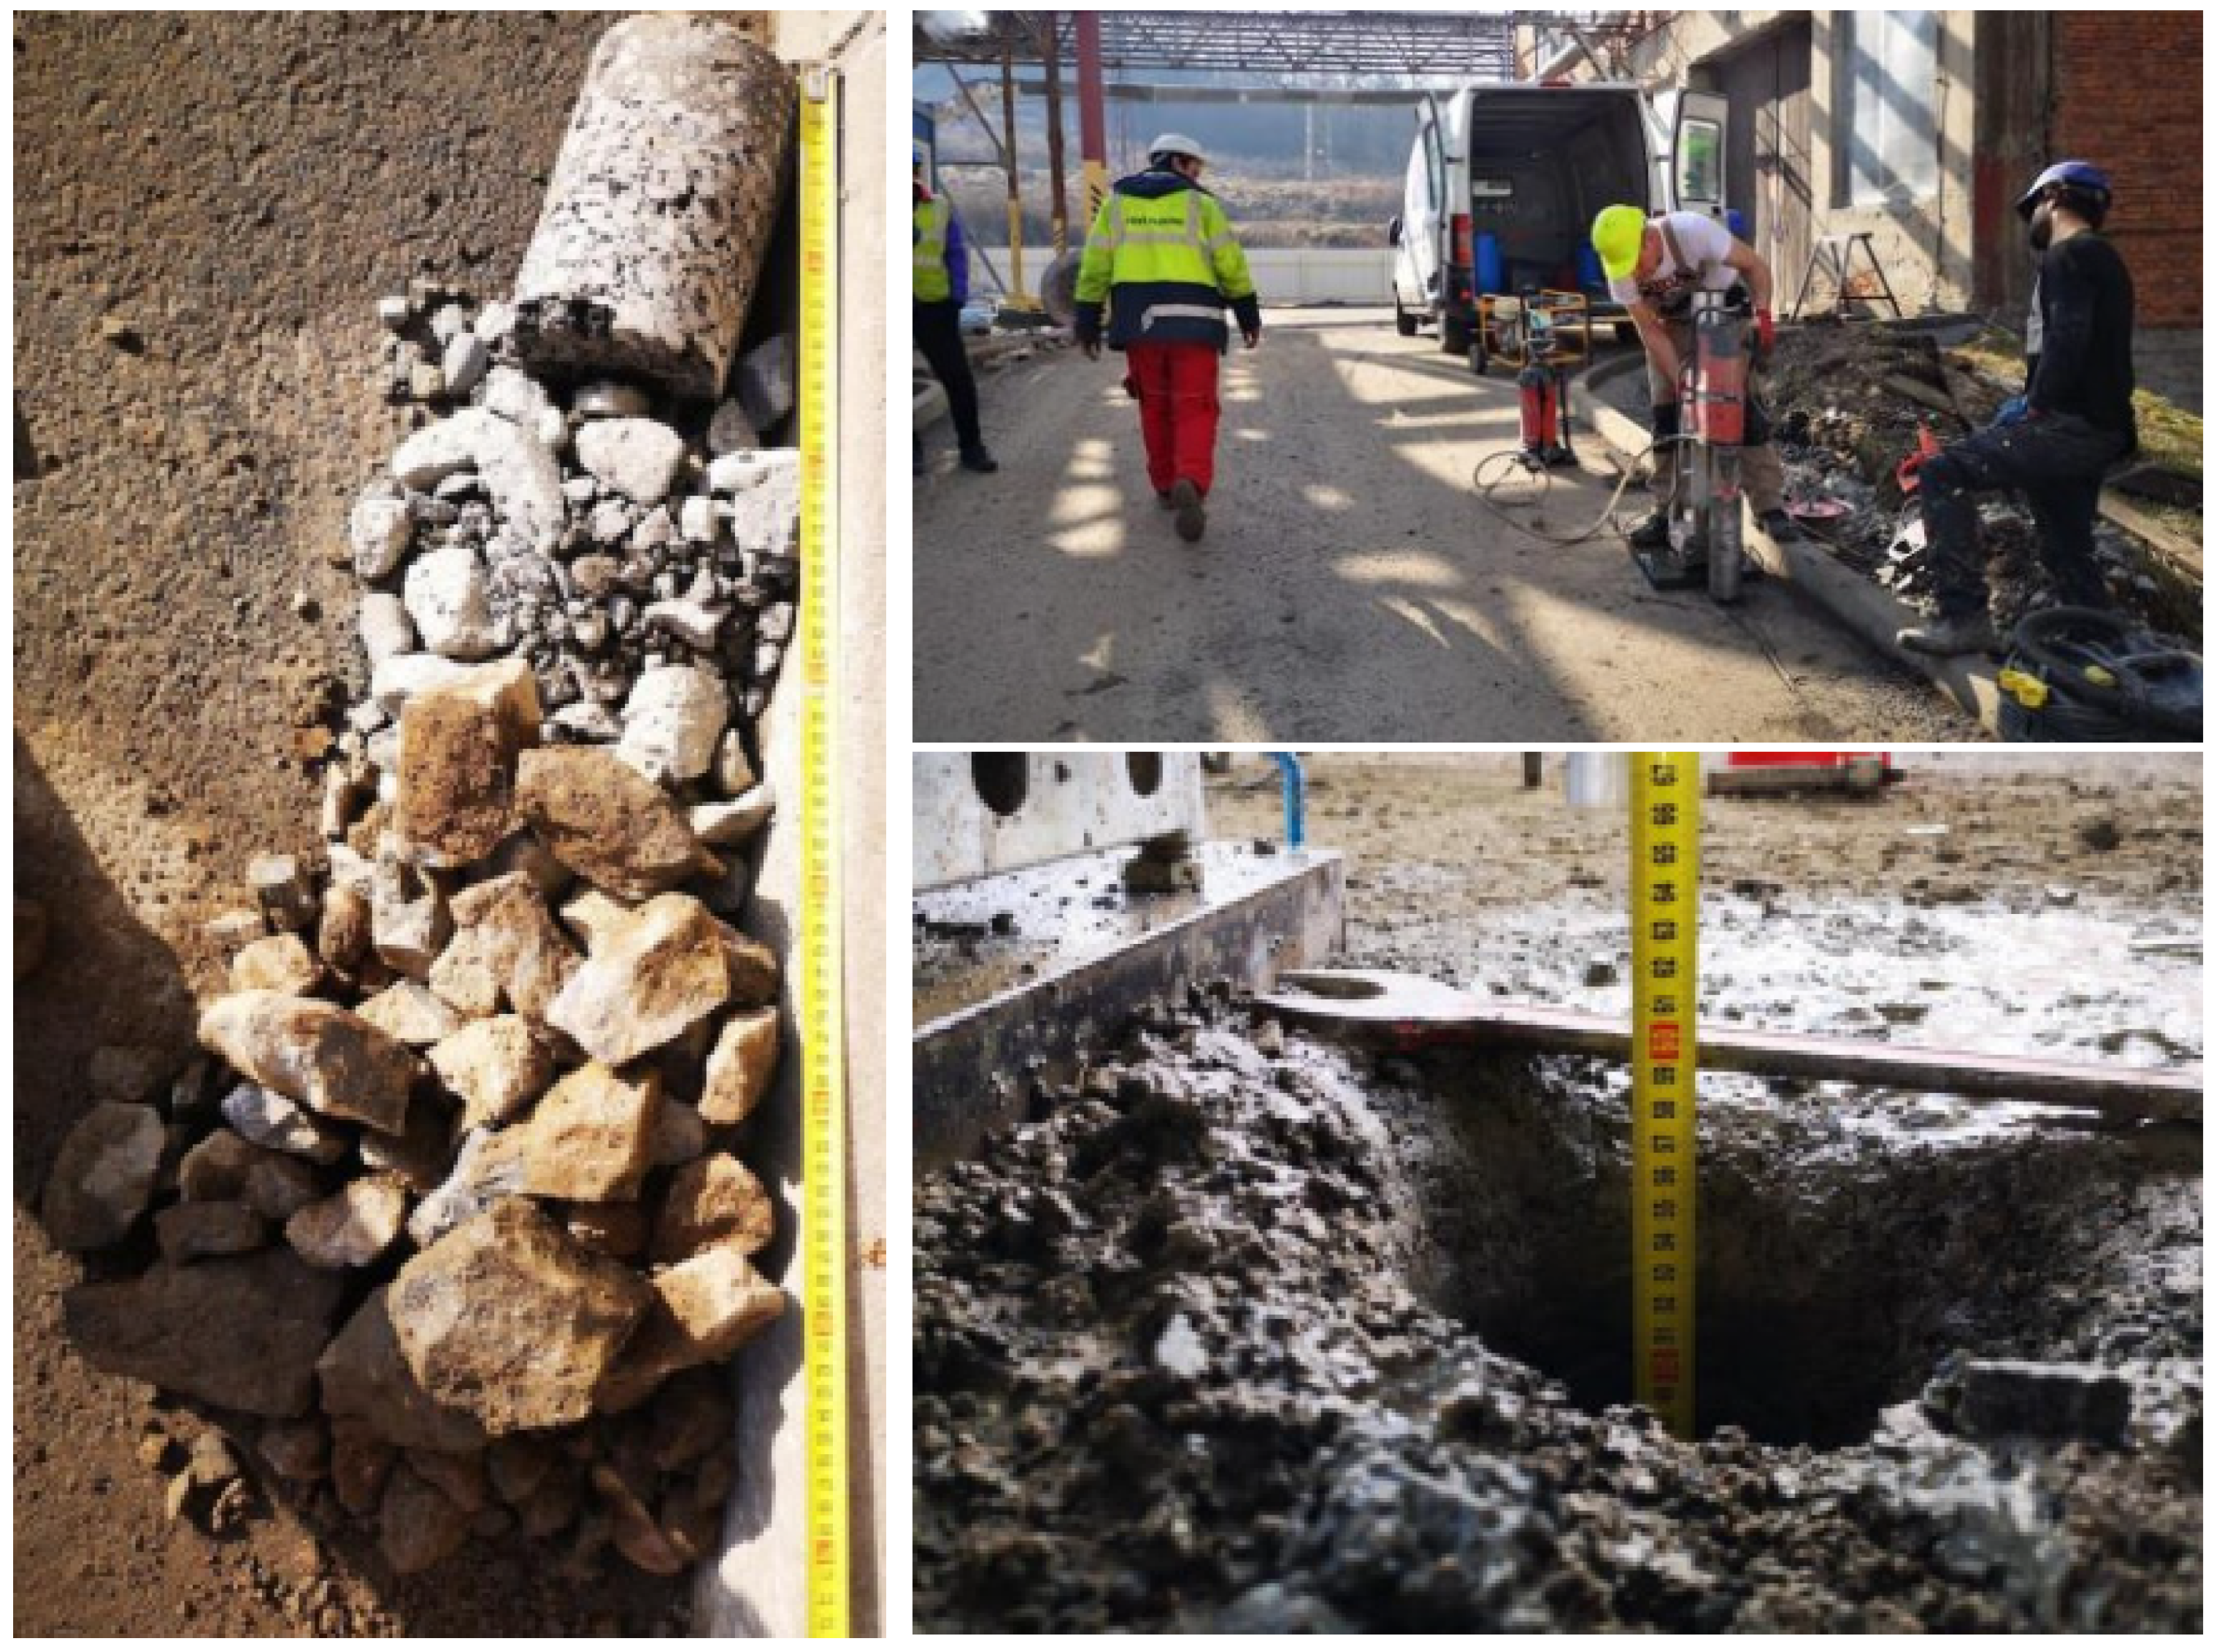
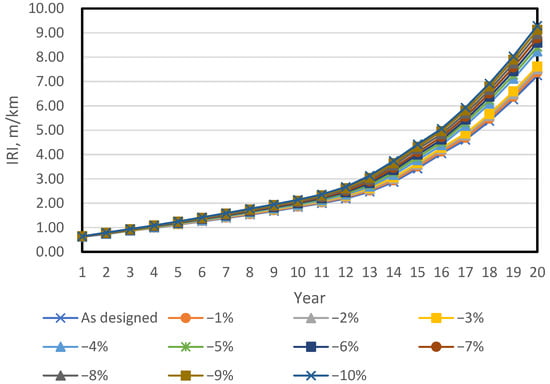
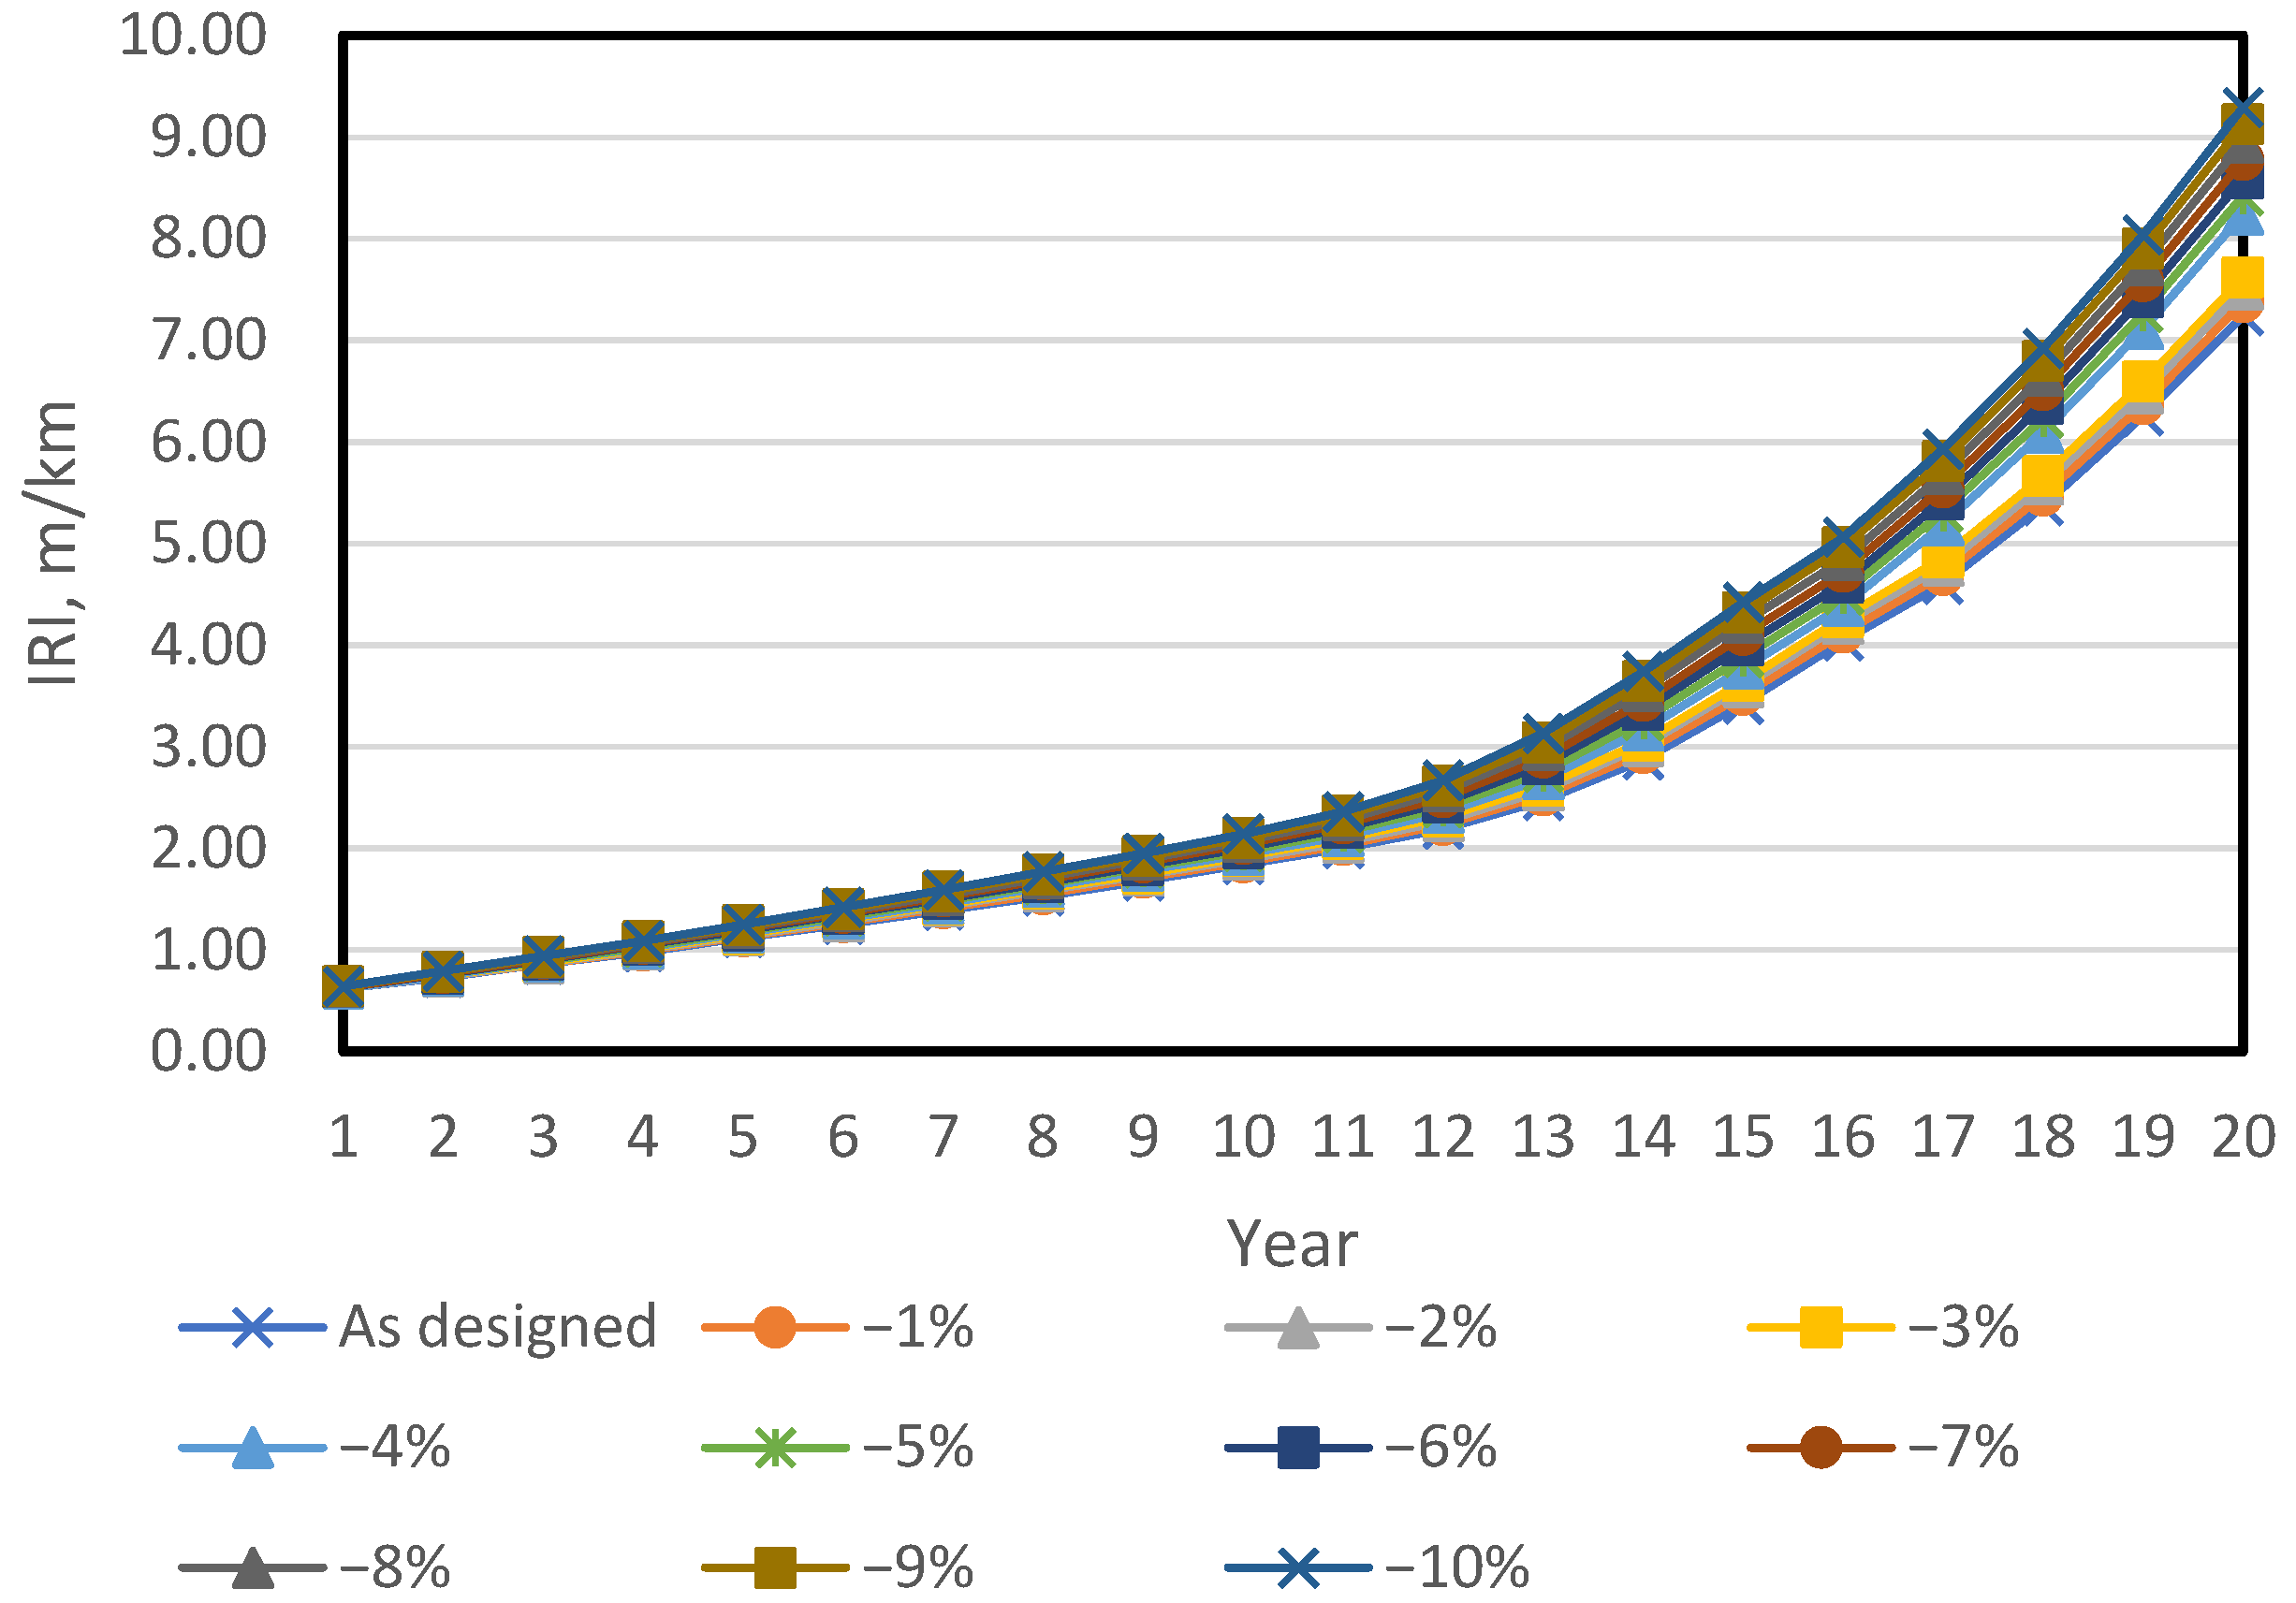
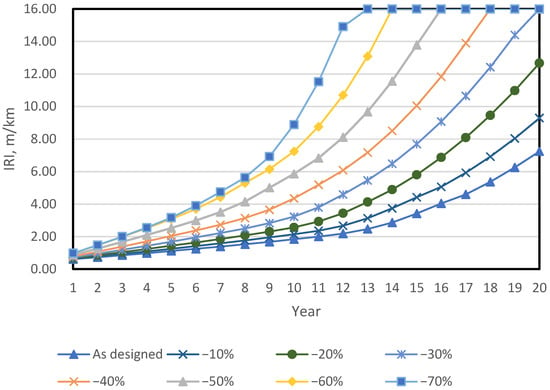
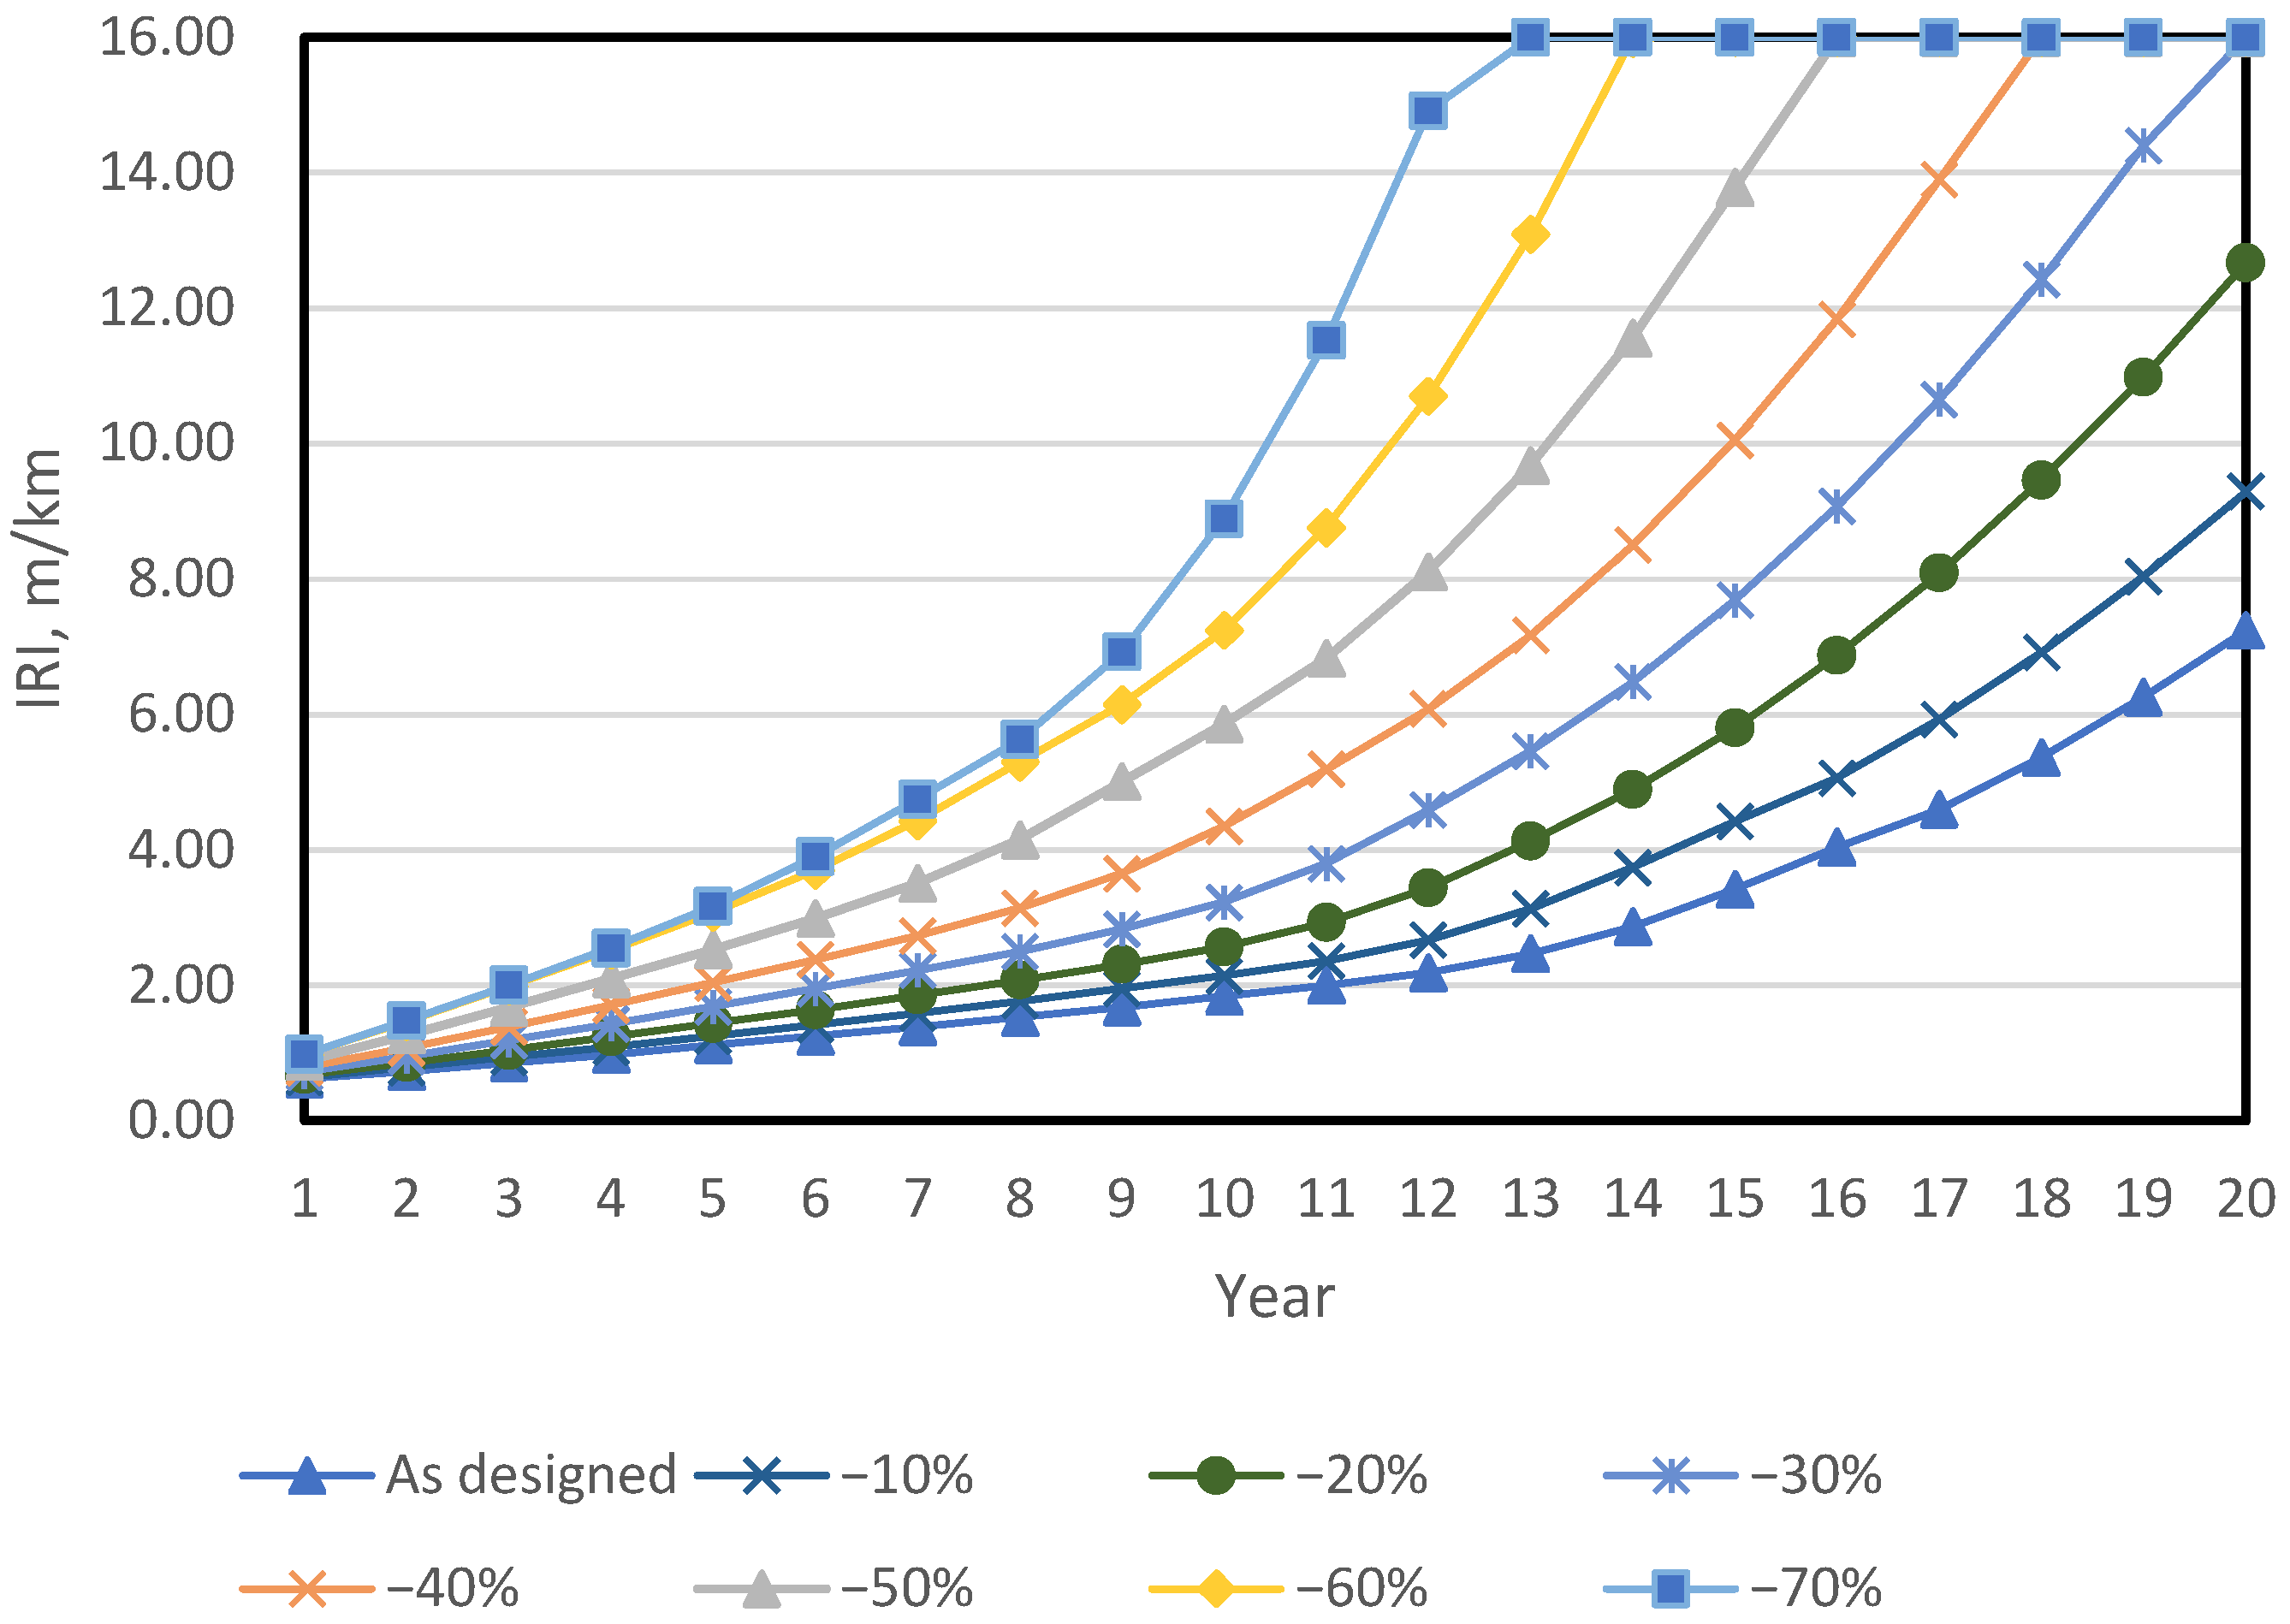
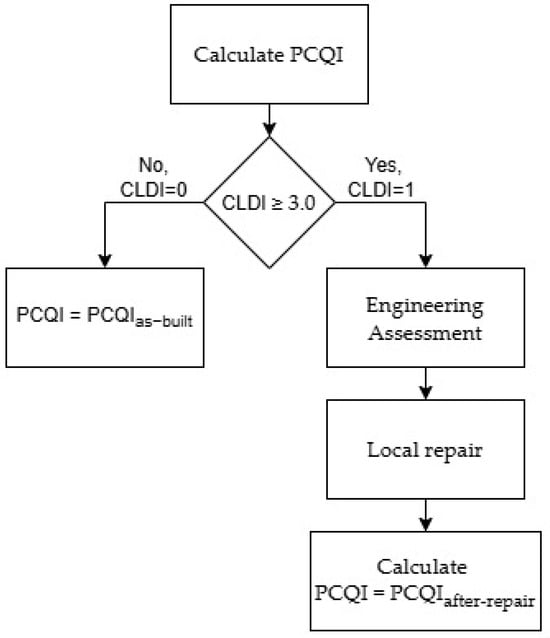
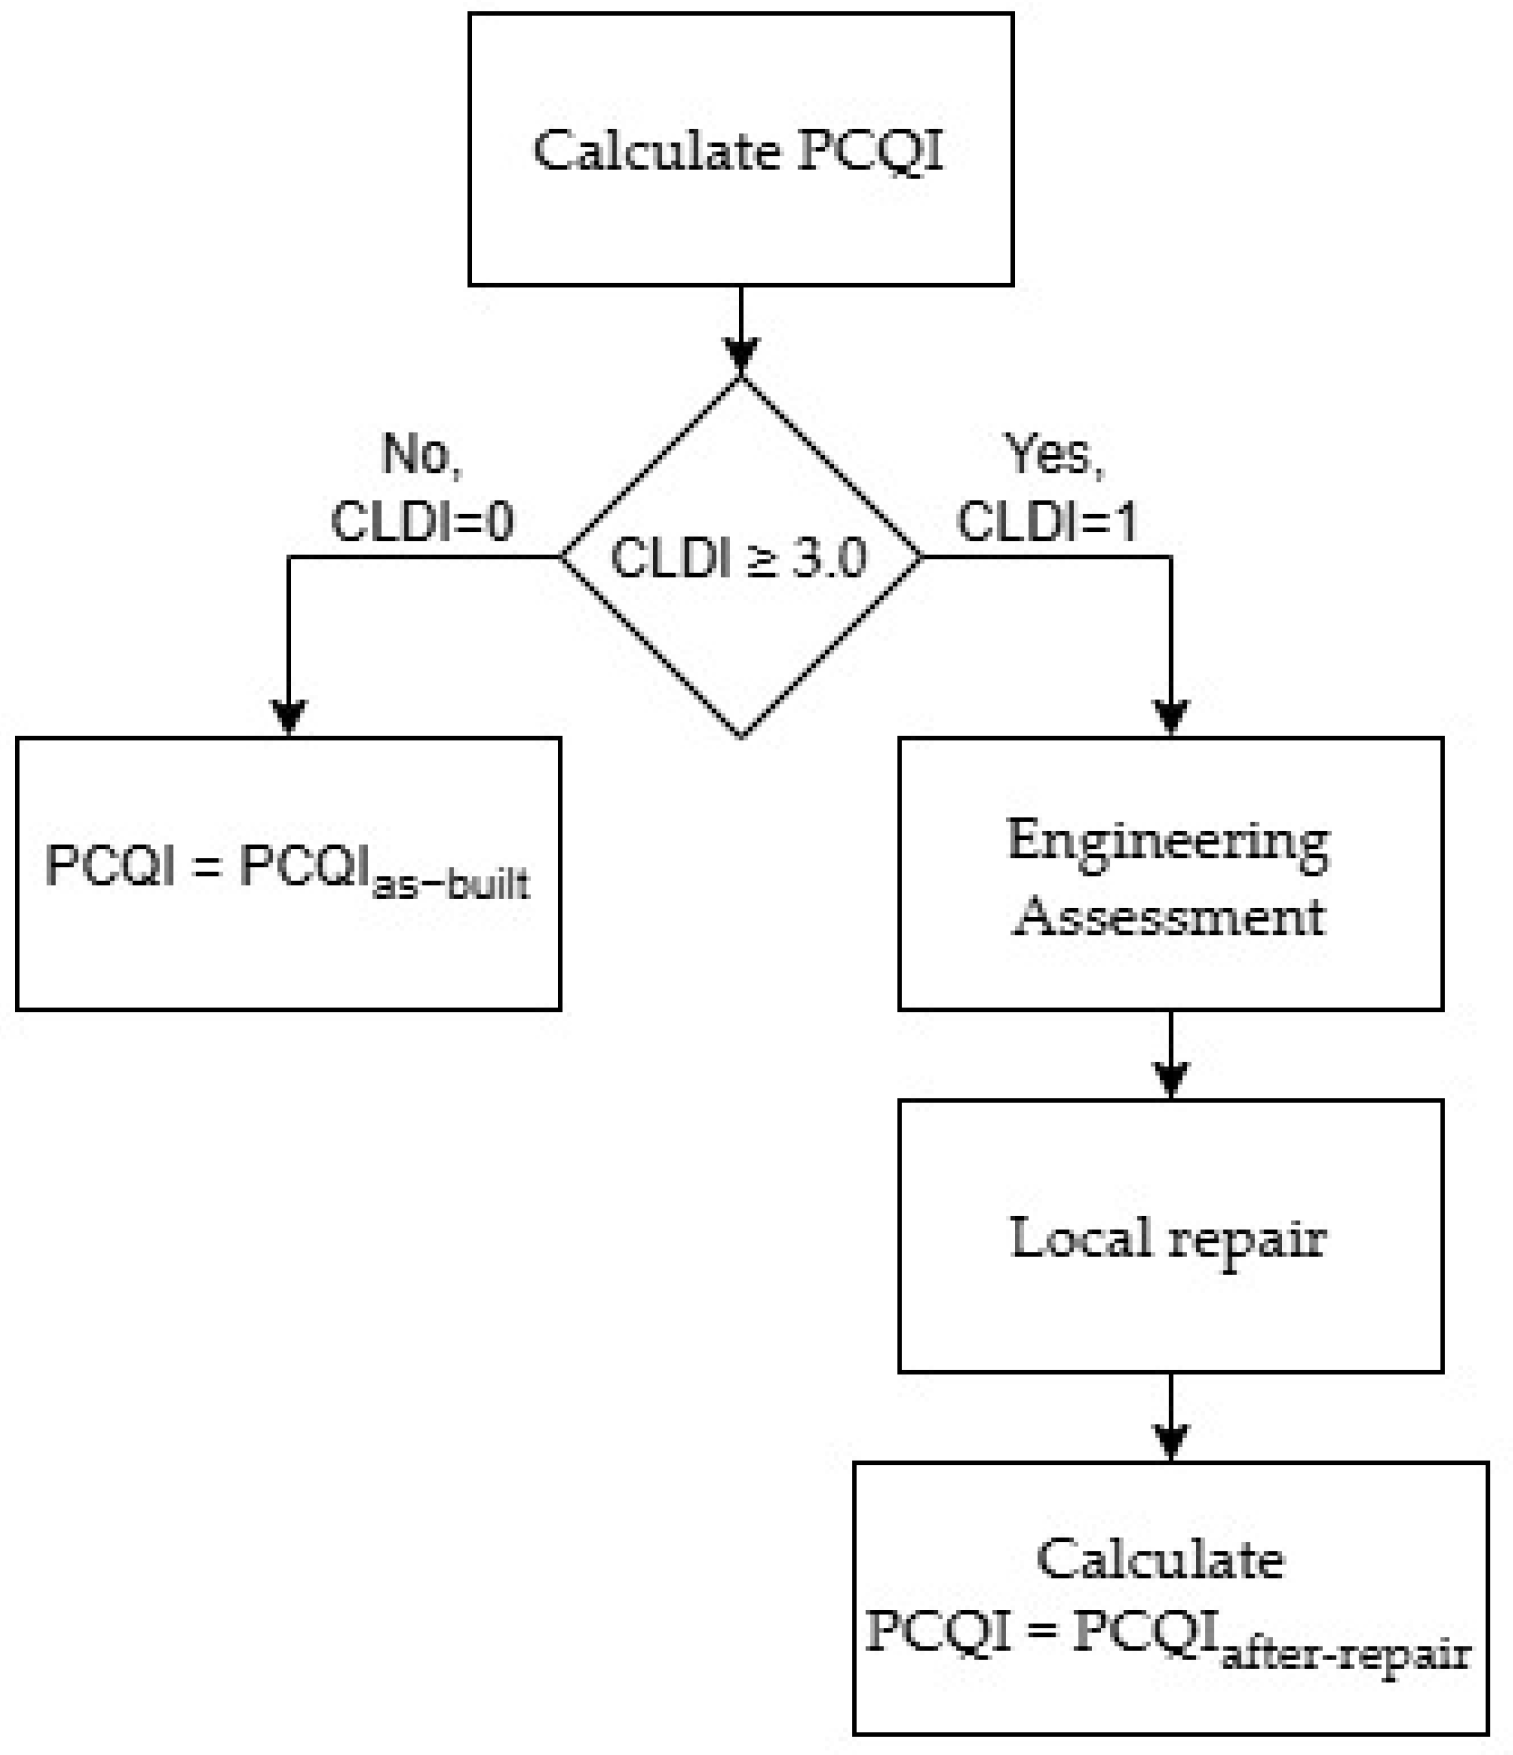
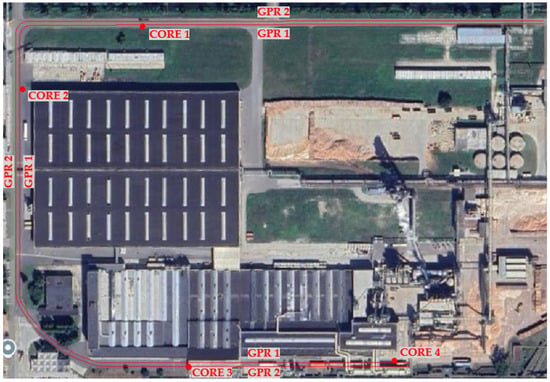
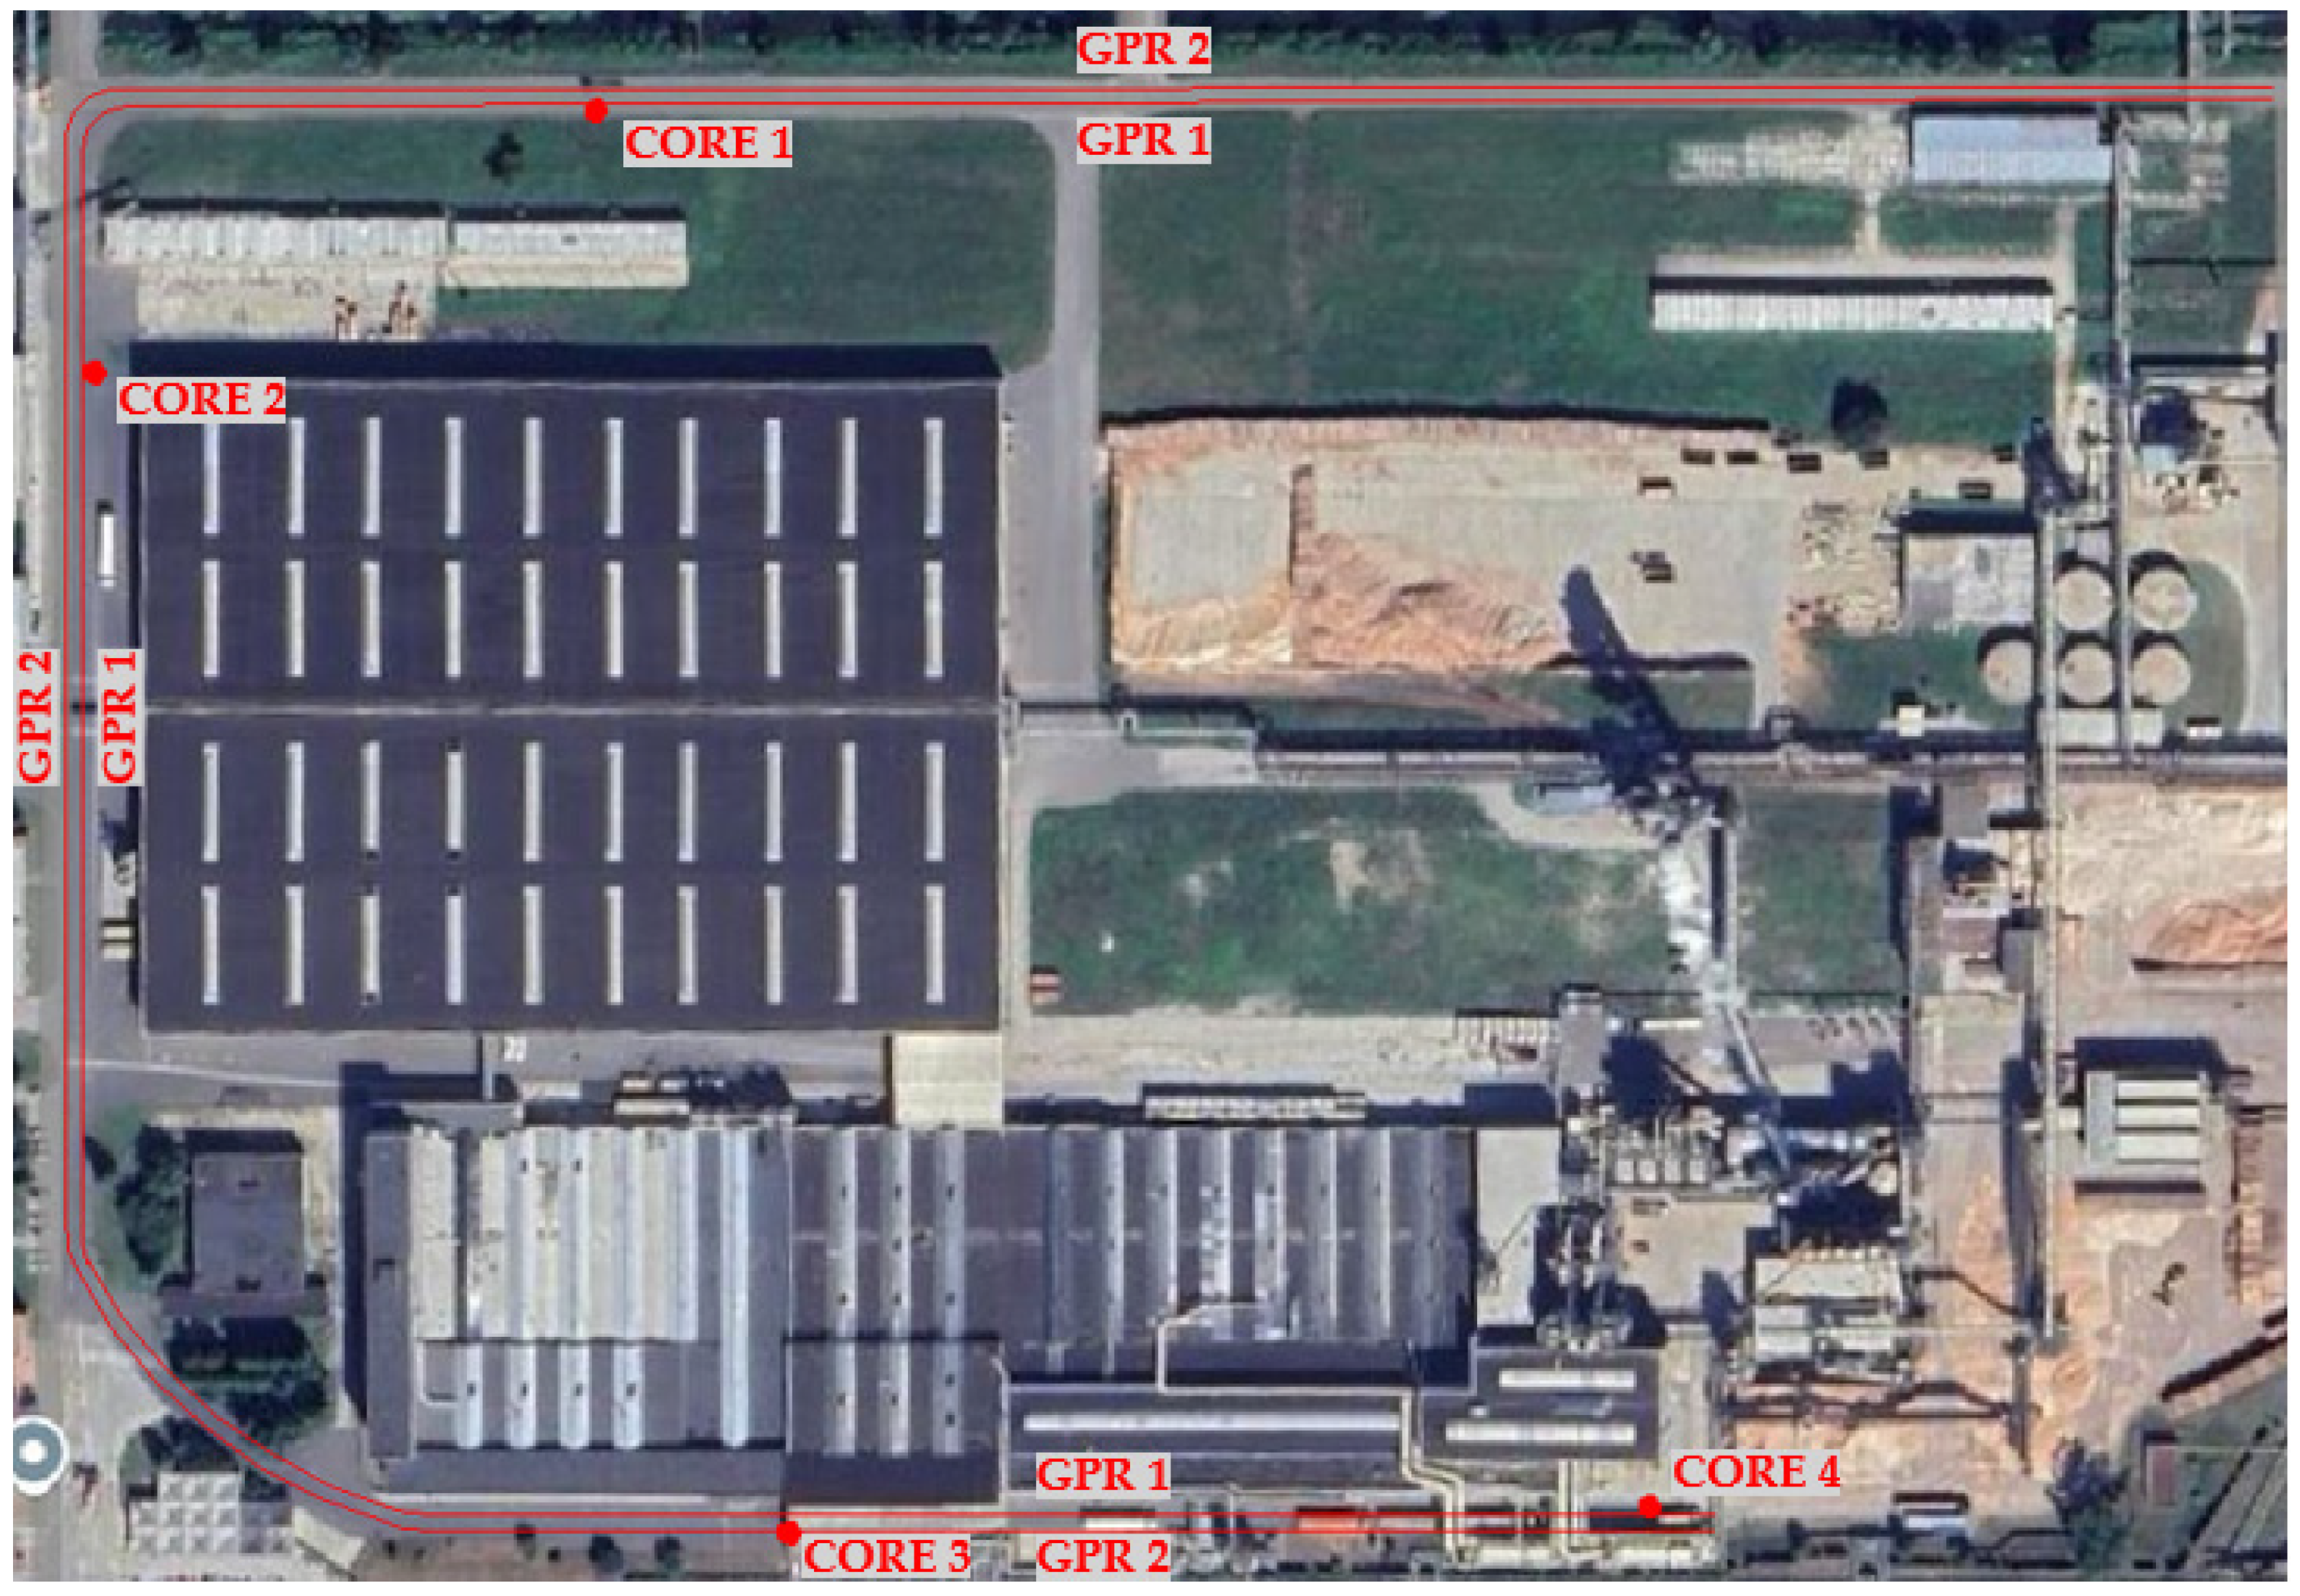
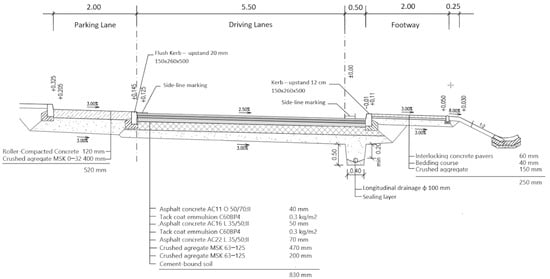
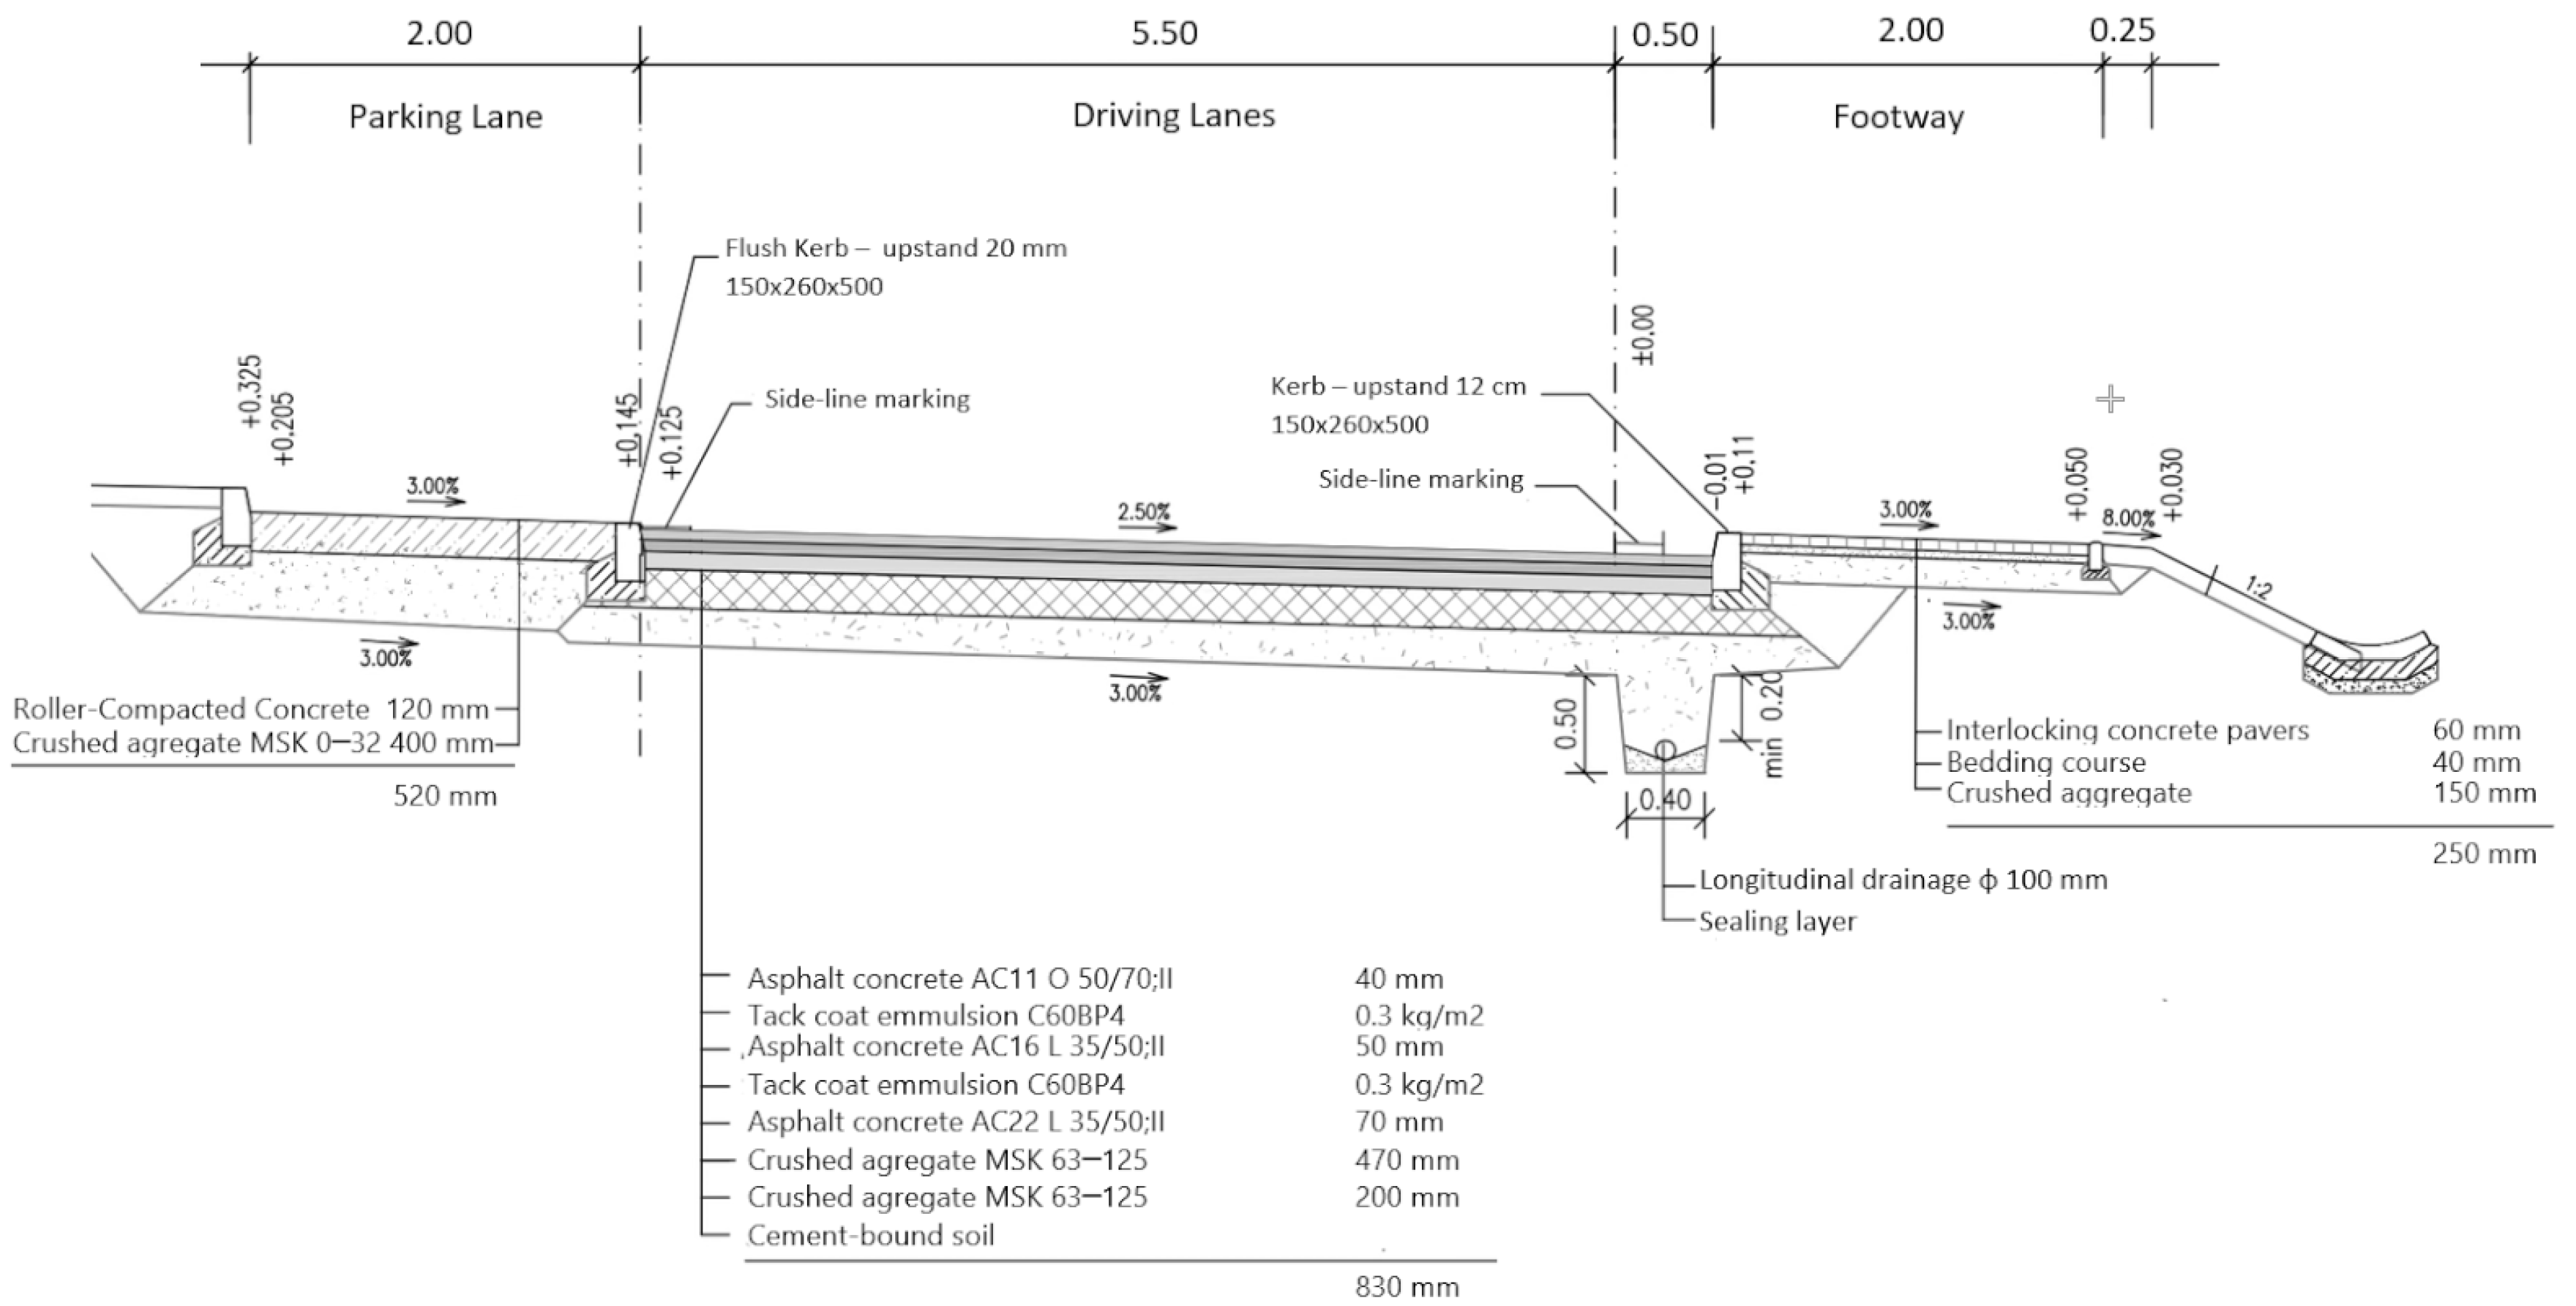
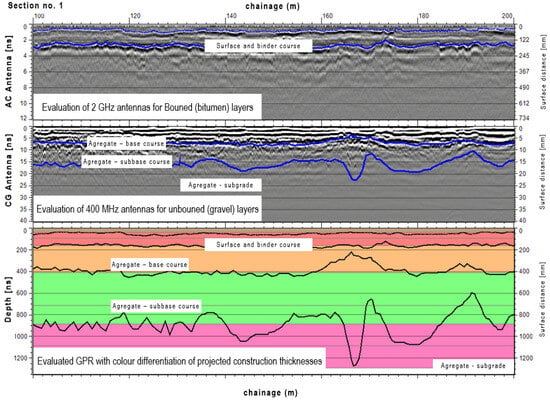
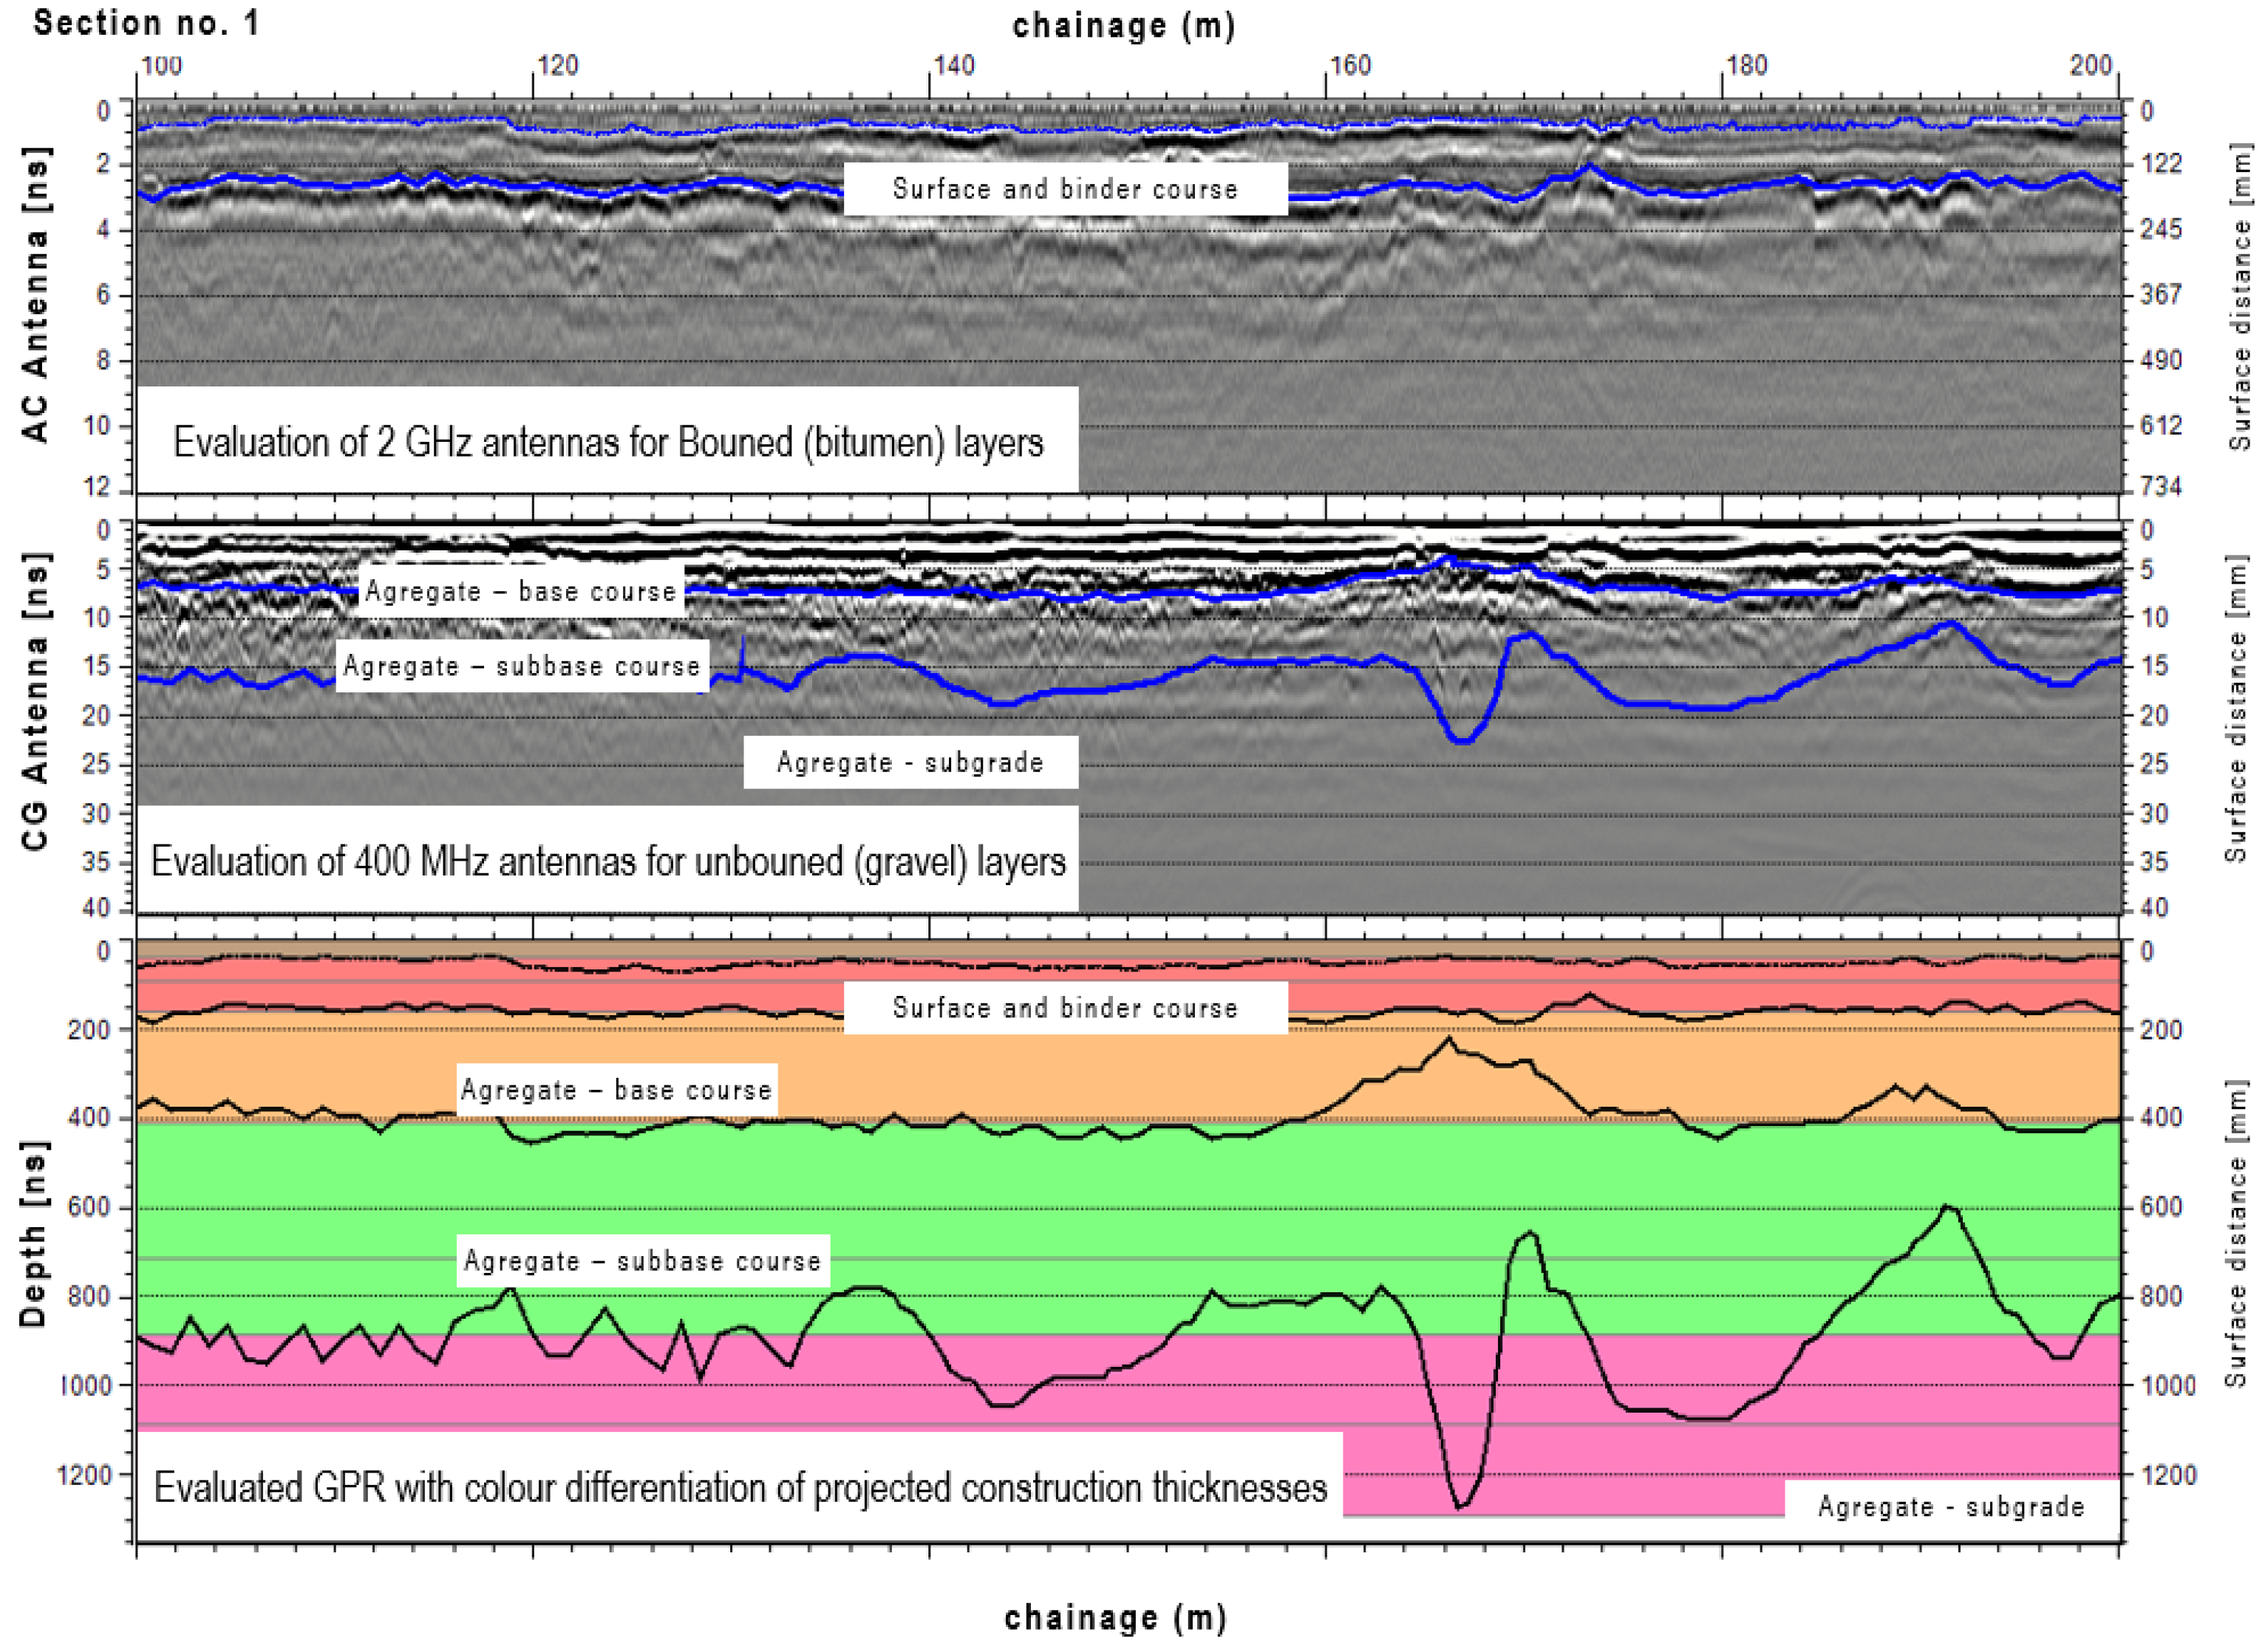
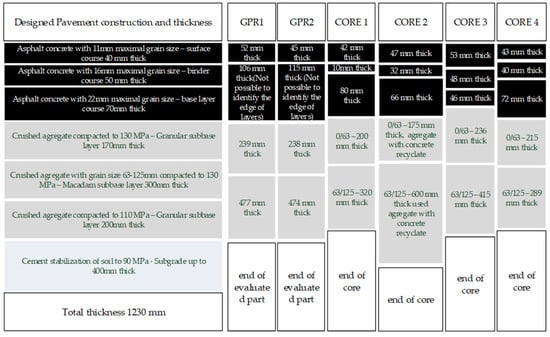
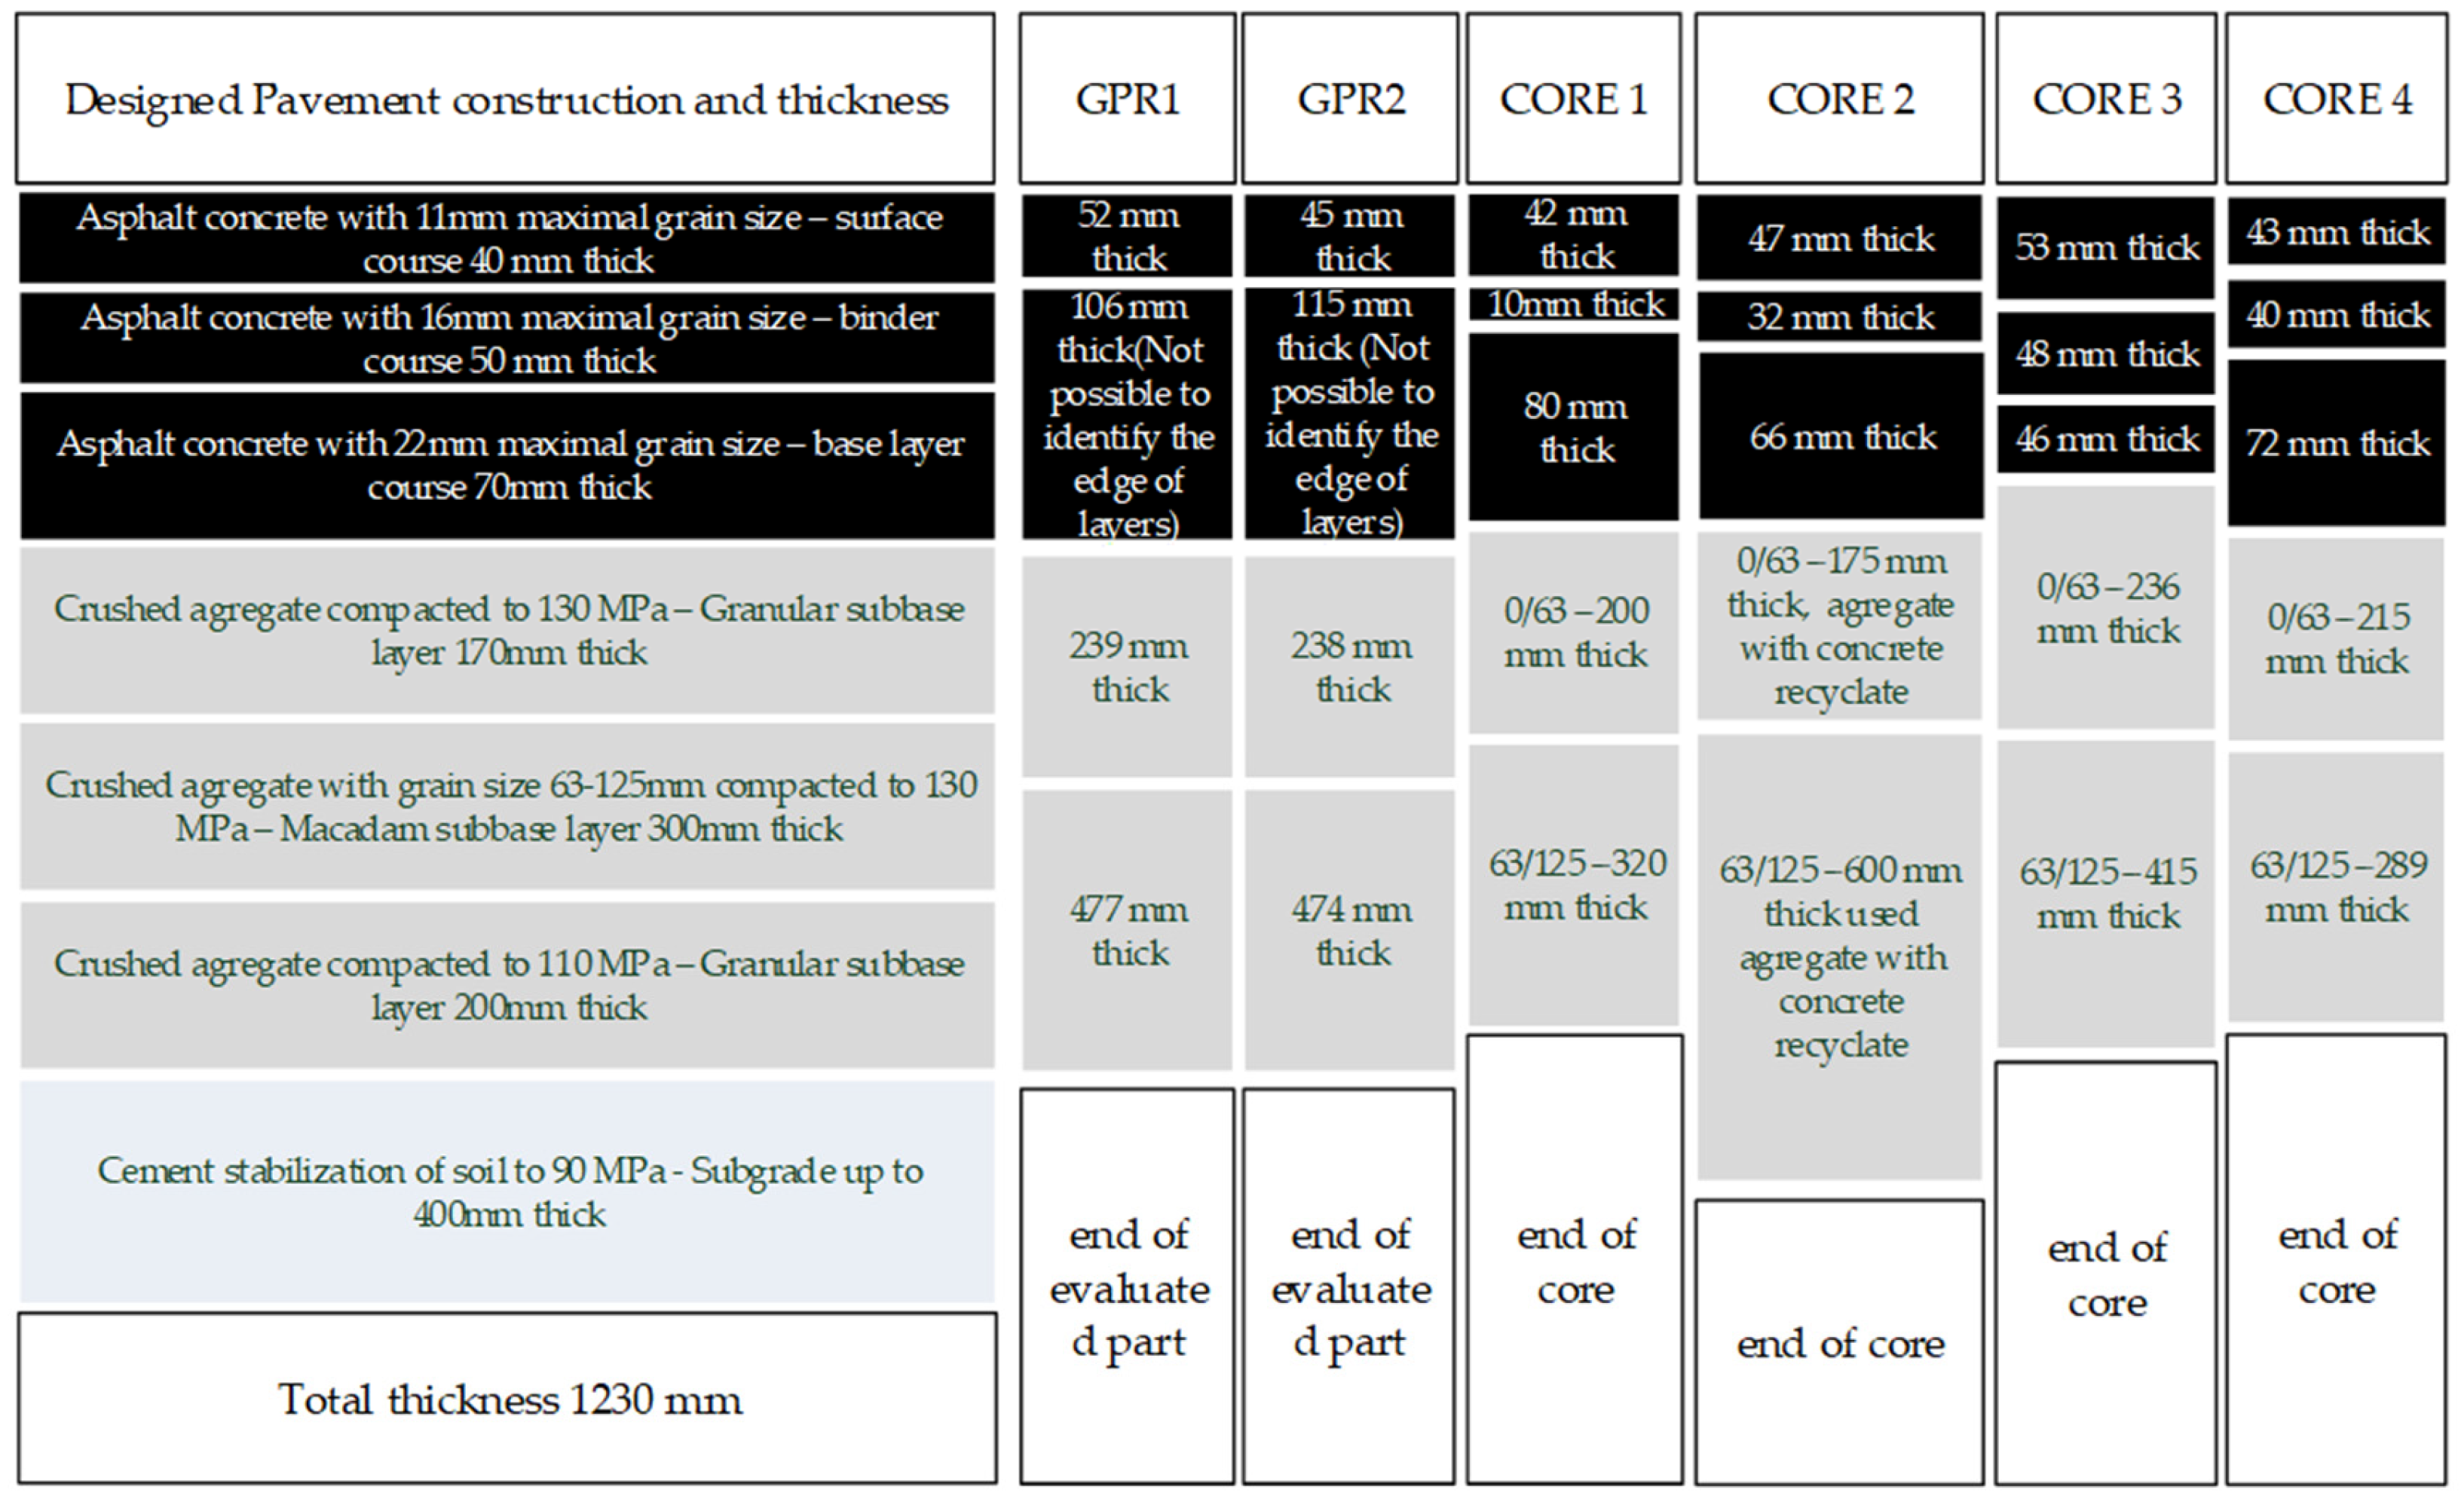
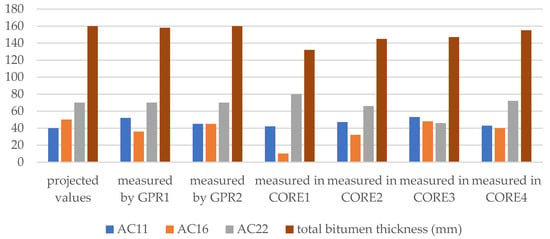
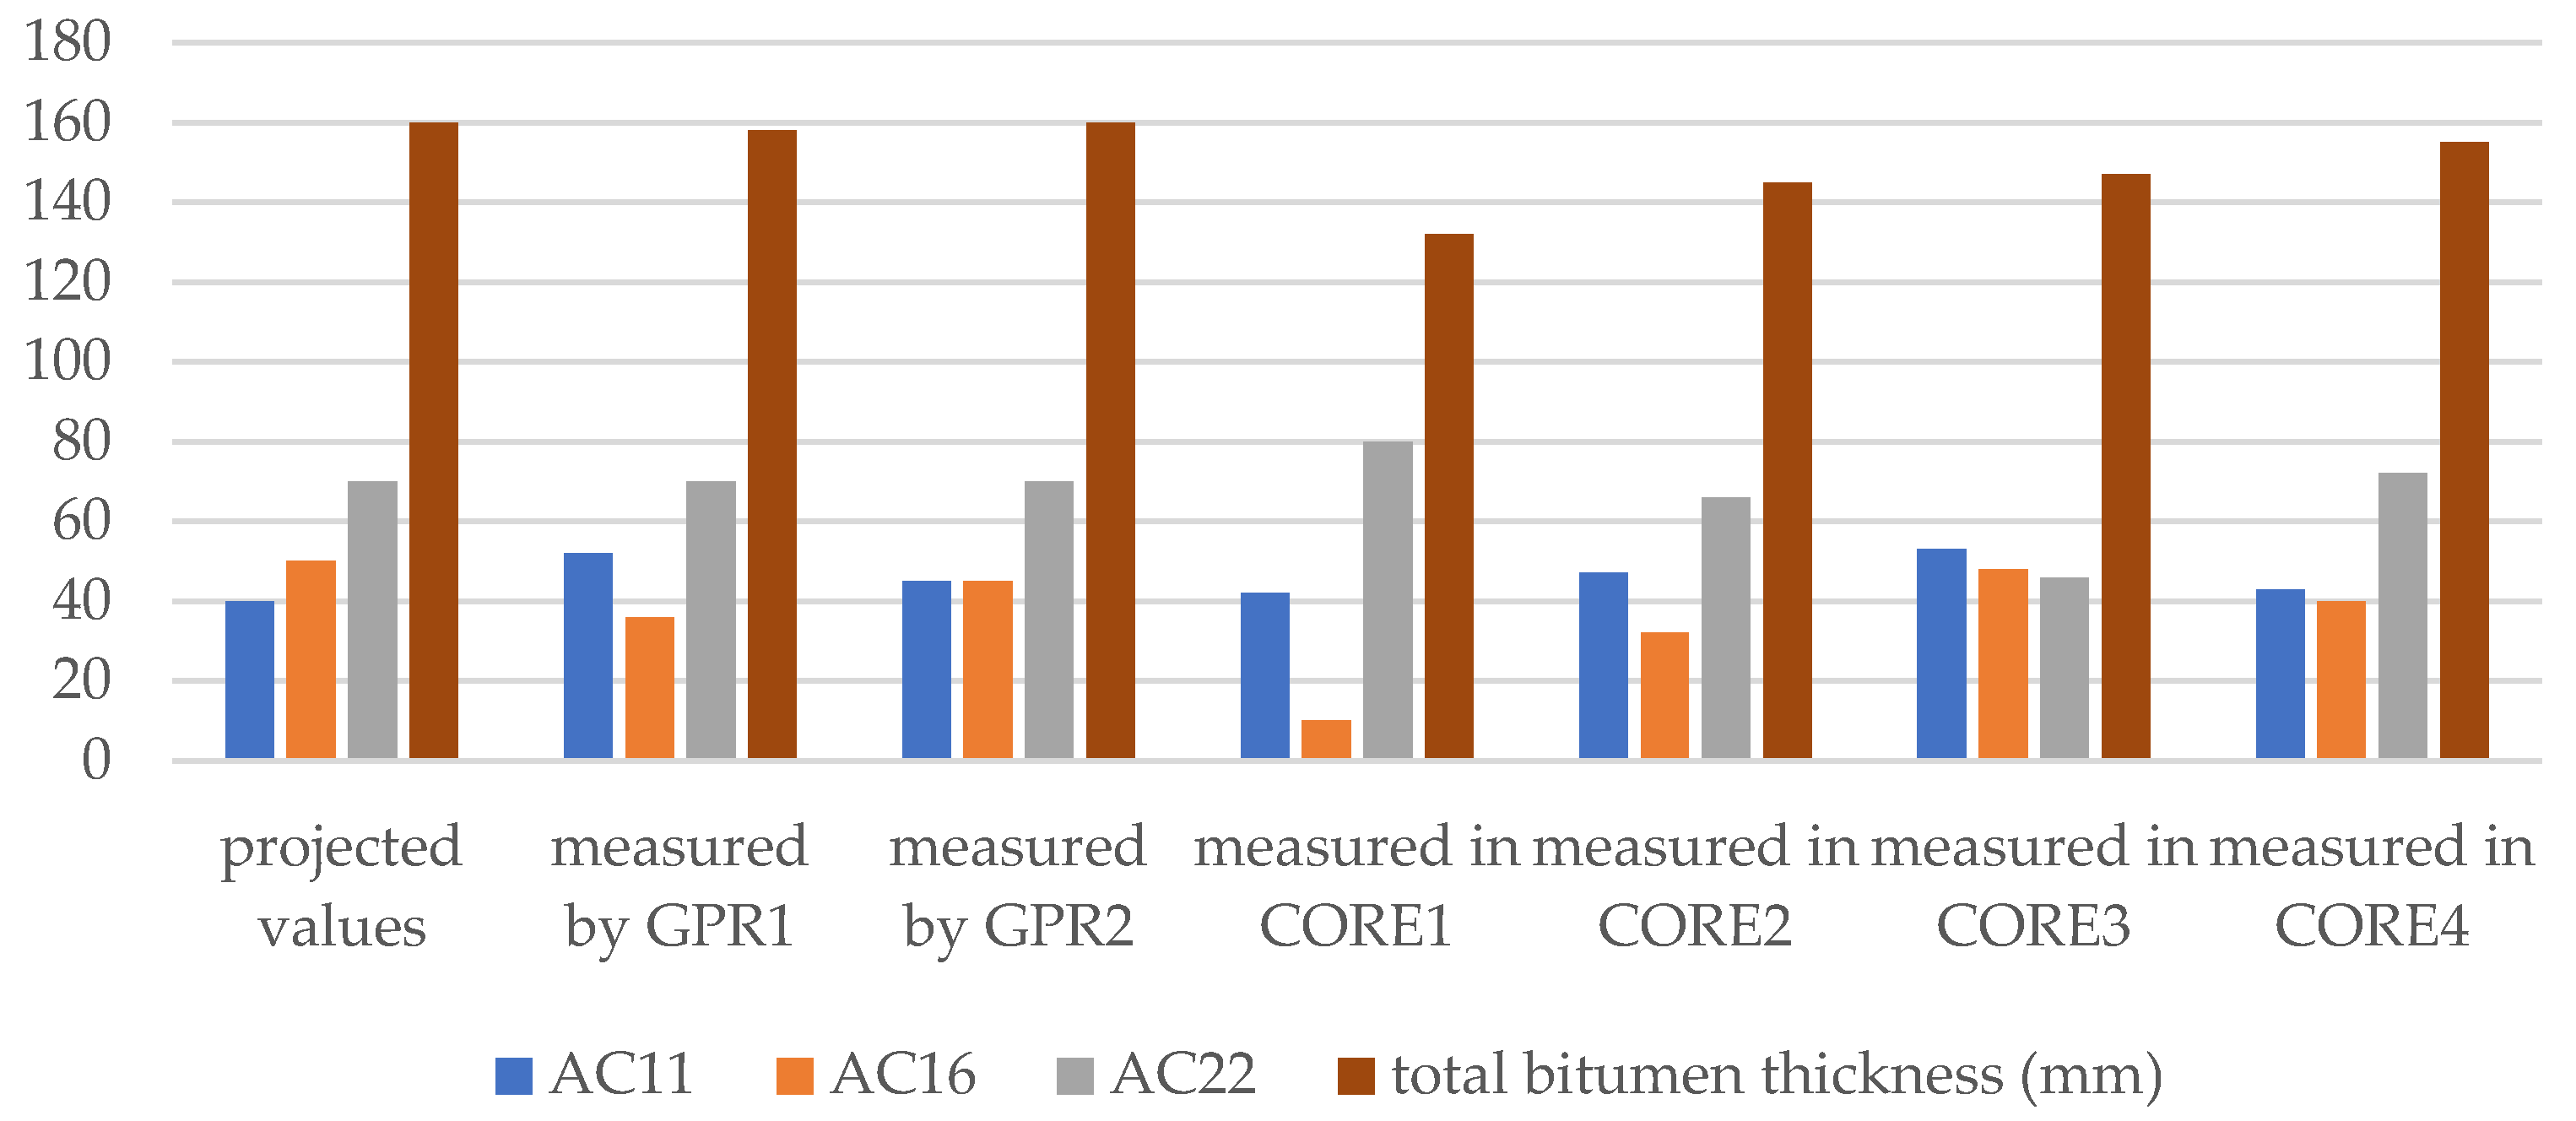
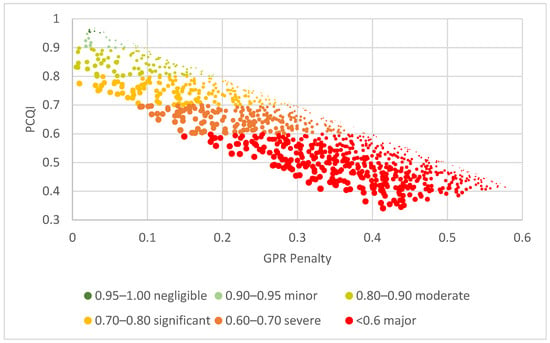
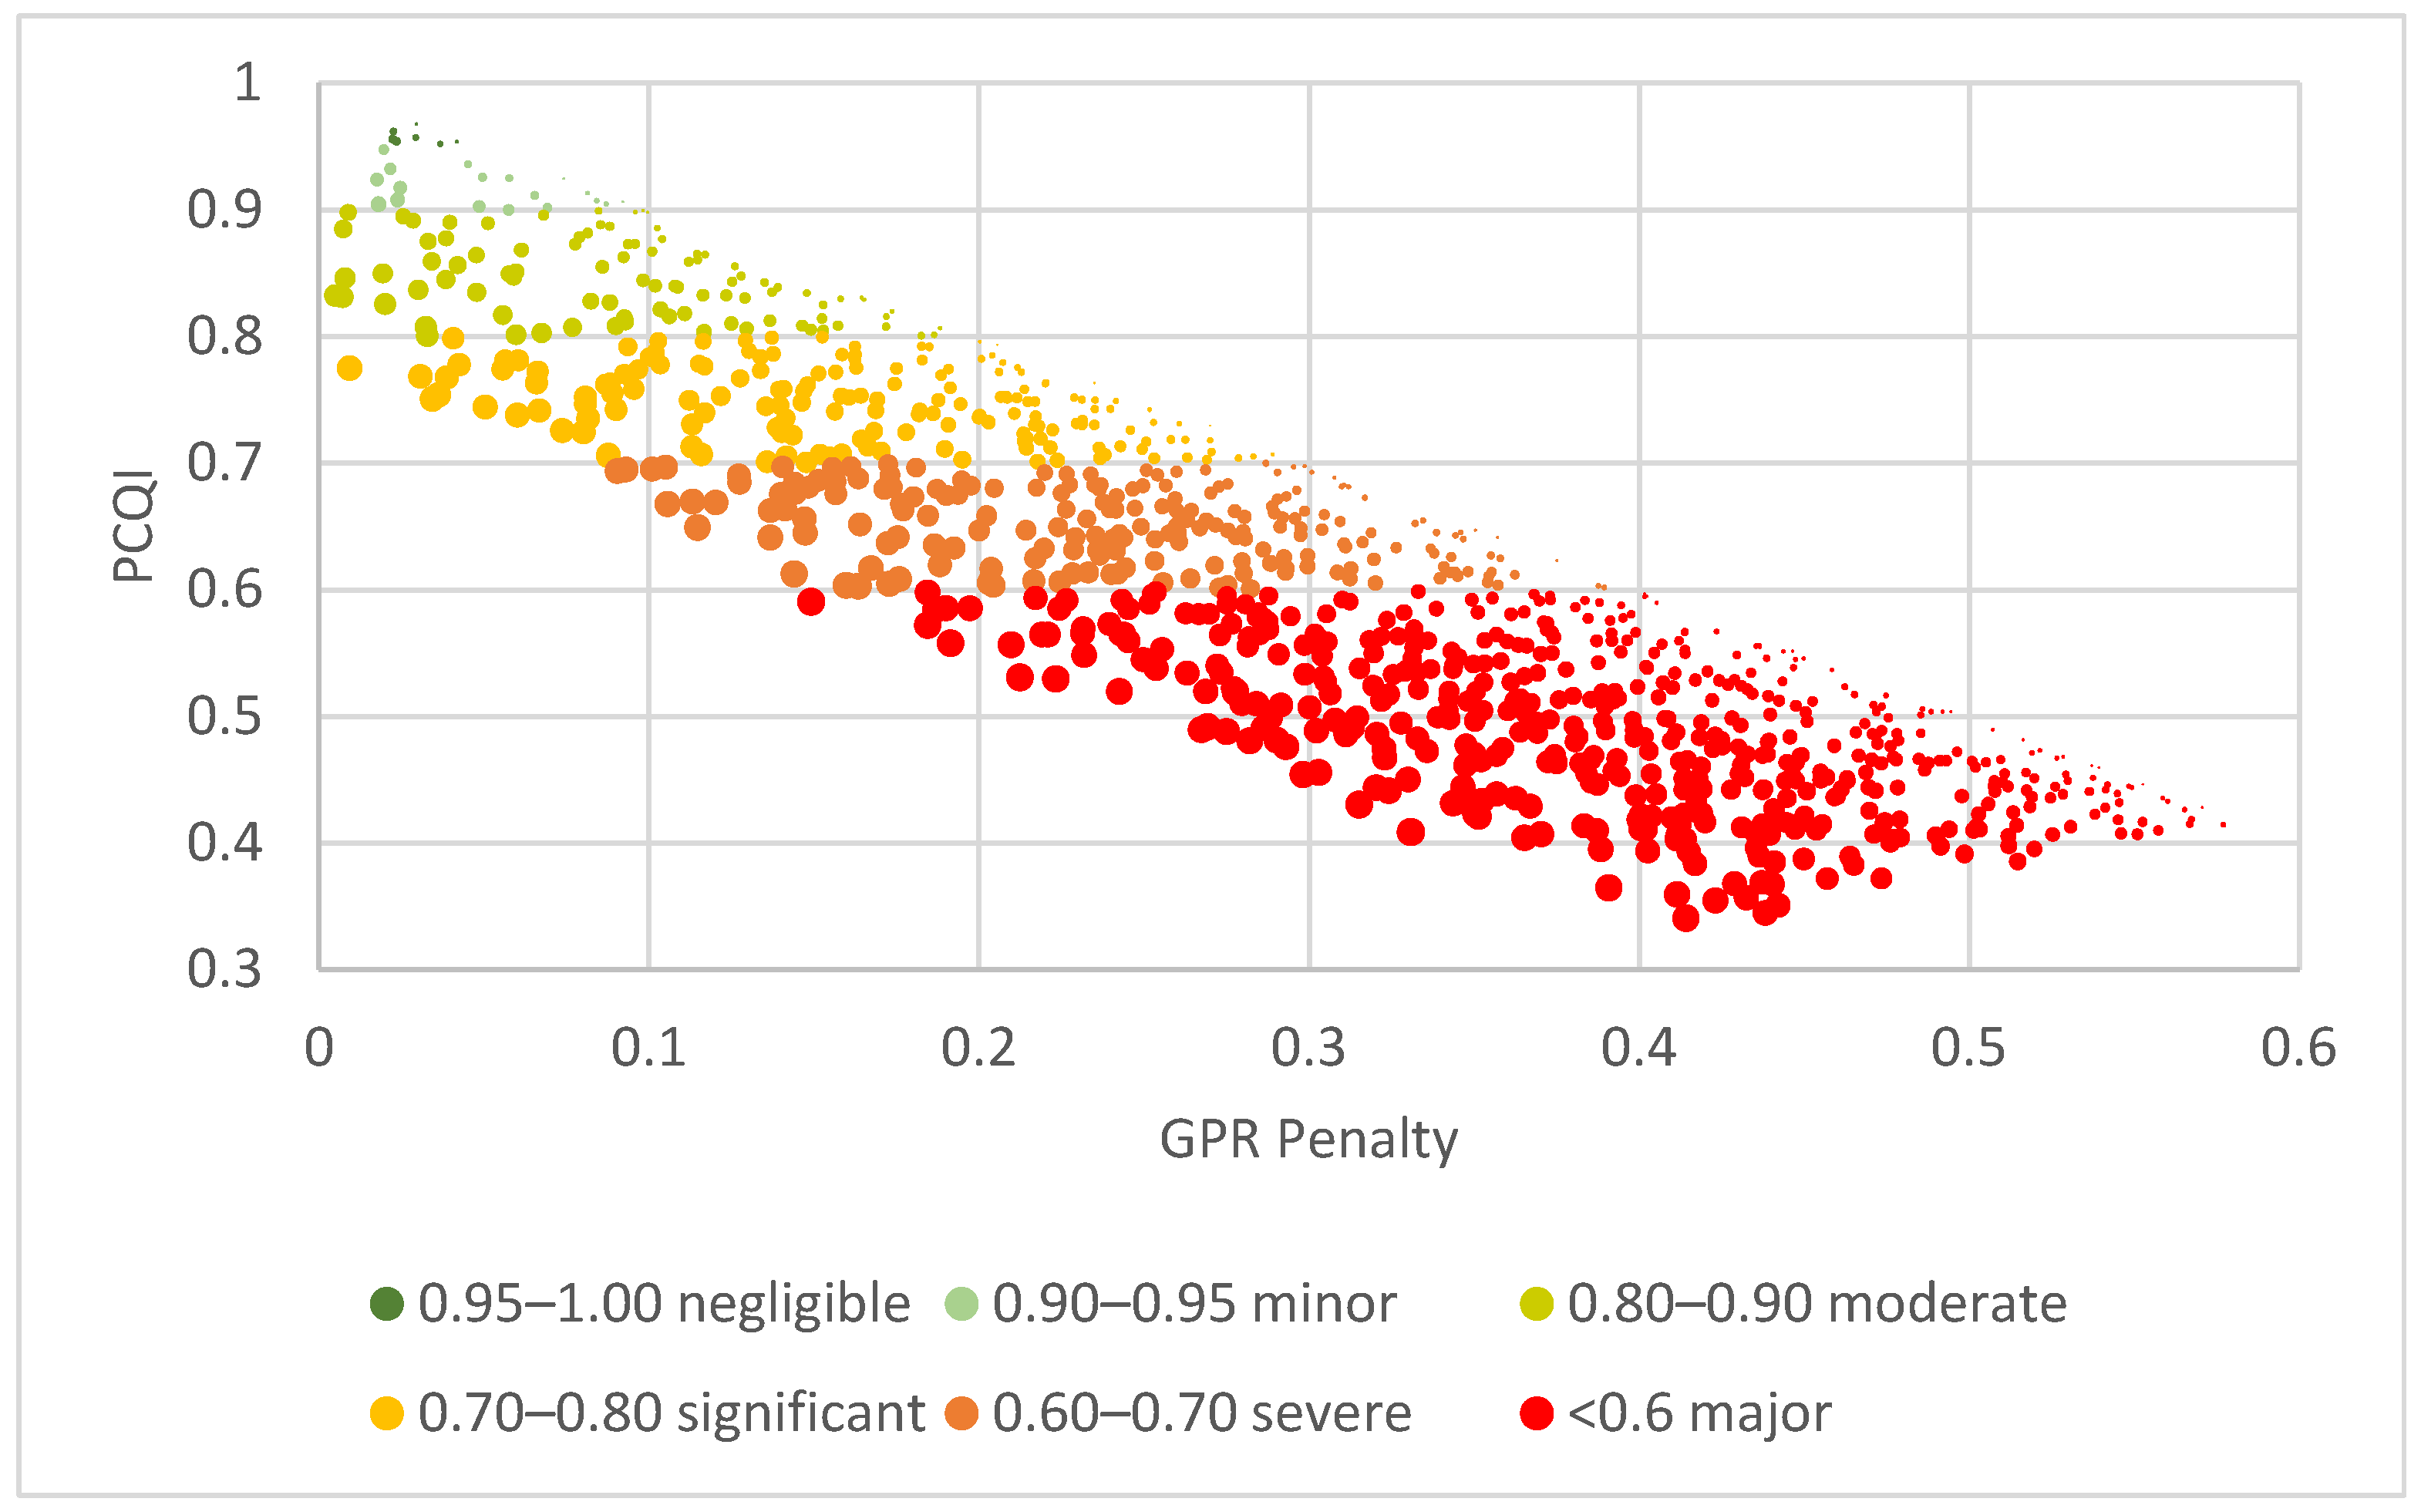

Disclaimer/Publisher’s Note: The statements, opinions and data contained in all publications are solely those of the individual author(s) and contributor(s) and not of MDPI and/or the editor(s). MDPI and/or the editor(s) disclaim responsibility for any injury to people or property resulting from any ideas, methods, instructions or products referred to in the content. |
© 2026 by the authors. Licensee MDPI, Basel, Switzerland. This article is an open access article distributed under the terms and conditions of the Creative Commons Attribution (CC BY) license.