


Abstract
This paper presents an analysis of indoor air quality (IAQ) and occupant perception under different mechanical ventilation operational modes in a university amphitheater. Indoor environmental parameters, including air temperature, relative humidity, indoor air velocity, and CO2 concentration, were measured in accordance with ISO 7726. Ventilation performance and outdoor air supply requirements were evaluated according to BAS EN 16798-1 and ASHRAE 62.1, while thermal comfort interpretation followed ISO 7730. In parallel, a questionnaire survey was conducted to assess occupants’ perceptions of indoor air quality and its influence on concentration under different ventilation operating conditions. The results showed that CO2 concentrations occasionally exceeded 1000 ppm during extended occupancy periods but remained below 800 ppm for more than 60% of the measurement time. According to BAS EN 16798-1, the indoor environment was predominantly classified as Category I based on the indoor–outdoor CO2 concentration difference. Survey responses indicated that most students perceived the indoor air as clean, while 67% reported that IAQ influenced their ability to concentrate. The findings highlight the importance of occupancy-related ventilation control strategies in large educational spaces and demonstrate the potential for balancing indoor air quality and energy efficiency through appropriate ventilation system operation. The presented methodology may support future development of data-driven approaches for optimizing mechanical ventilation performance in university buildings.
1. Introduction
Many studies have shown that indoor air pollution (IAP) has a significant impact on human health and wellbeing [1,2]. These studies are particularly important because people spend an increasing amount of time in different types of buildings, making indoor environmental quality essential for reducing health risks and improving quality of life and working conditions. According to the World Health Organization (WHO) report, in 2000, indoor air pollution was responsible for more than 1.5 million deaths and 2.7% of the global burden of disease [3].
In buildings, occupants are exposed to various physical, chemical, and biological factors that influence indoor air pollution and indoor air quality (IAQ) [4]. In many cases, indoor air contains different pollutants emitted from building materials, consumer products, and human activities and is more contaminated than outdoor air [5]. The quality of indoor air can change over a short period of time depending on indoor and outdoor sources such as gases and/or particles [6]. Good indoor air quality is essential for ensuring occupants’ health, comfort, and productivity. In developed countries, inside all kinds of premises, humans on average spend 80–90% of their time [7,8], which emphasizes the importance of investigating the causes of poor IAQ. Previous studies summarized in [9] reported clear relationships between exposure to indoor air pollution and several health effects, including respiratory diseases, dust mite allergies, and skin and mucous membrane irritation.
Indoor air quality in educational buildings is a multifaceted concept influenced by a broad spectrum of pollutants, including particulate matter, volatile organic compounds, and biological contaminants, in addition to thermo-hygrometric parameters. In this study, carbon dioxide (CO2) concentration is intentionally selected as the primary indicator of indoor air quality, not as a direct pollutant of concern, but as a widely accepted proxy for occupancy-related pollution and ventilation effectiveness. In mechanically ventilated educational spaces, CO2 levels provide direct insight into the balance between occupant density, metabolic activity, and outdoor air supply rates, making them particularly suitable for evaluating ventilation performance and operational control strategies. While other indoor pollutants play an important role in defining overall indoor environmental quality, their detailed assessment lies beyond the scope of the present study and is identified as a relevant direction for future research.
In educational buildings, this topic is of particular importance because, compared to adults, students are more vulnerable to poor air quality [10]. In the UK, pupils spend about 70% of their time inside a classroom during school days [11]. Poor air quality in educational buildings and documented associated health impacts (allergies, asthma, airway hyper-reactivity, and cardiovascular disease) are topics of many studies (e.g., [12,13,14]).
Furthermore, many studies point out the connection between indoor air quality (IAQ) and sick building syndrome (SBS) [8,15,16,17] and to students’ productivity and outcomes [11,18].
Despite the large number of articles presenting the results of indoor air surveys mostly in offices (e.g., [19,20,21]) and education buildings ([11,17,22], etc.), there are still research gaps and dependencies where further studies are needed.
The main objective of this research is to analyze the influence of different mechanical ventilation operational modes on indoor air quality and occupant perception, while identifying opportunities for more energy-efficient ventilation operation.
Rather than re-establishing the well-known relationship between ventilation and indoor air quality, this study evaluates how different operational modes of an existing mechanical ventilation system influence measured CO2 concentrations and occupant perception under real operating conditions in a university building in Bosnia and Herzegovina. These two approaches, when combined, provide a robust basis for supporting systematic future adjustments in real time. Therefore, the study combines questionnaire-based occupant surveys with experimental measurements of indoor environmental parameters and outdoor reference conditions.
This paper presents part of a broader research activity conducted at the University of Banja Luka aimed at assessing indoor environmental quality and energy performance in educational buildings. The analysis focuses on indoor environmental quality in the main amphitheater of the Faculty of Architecture, Civil Engineering and Geodesy and the Faculty of Forestry (FACEG and FF). These studies are conducted within the project Energy Efficiency Retrofitting in UNIBL public buildings HORIZON-WIDERA-2023-ACCESS-02-02 titled ENPOWER—Enhancing Scientific Capacity for Energy Poverty, coordinated by the University of Banja Luka.
Literature Review on Indoor CO2 Concentration and Ventilation Performance in Educational Buildings
Carbon dioxide (CO2) is naturally present in the Earth’s atmosphere. The typical outdoor CO2 concentrations can range from about 300 to 500 ppm [23], and they gradually grow mainly due to the increased anthropogenic activity with changing lifestyles [24]. In indoor environments, human metabolism contributes to an increase in indoor CO2 concentration [23], particularly under reduced ventilation rates associated with energy-saving operation modes. Indoor CO2 concentration is also widely used as an indicator of indoor air quality and ventilation effectiveness. Ventilation with outdoor air is commonly used to reduce indoor CO2 concentration.
The proper determination of outdoor air rate is the key to maintaining indoor air quality. Occupancy-based demand-controlled ventilation can maintain CO2 concentration below predefined set-points while reducing unnecessary energy consumption [25].
Many studies have shown that elevated CO2 concentrations reduce concentration and negatively affect students’ academic performance [13,26,27] and increase absenteeism [28]. School children exposed to elevated CO2 concentrations reported increased upper and lower airway symptoms [16], as well as higher prevalence of indoor air pollution-related and asthma symptoms [29].
Some studies also suggest that the risk of sick building syndrome symptoms decreases significantly when indoor CO2 concentrations remain below 800 ppm [30], while respiratory symptoms among children have been associated with indoor CO2 concentrations higher than 1000 ppm [2].
An important research topic is the relationship between energy performance improvements in existing school buildings and indoor CO2 concentration in naturally ventilated classrooms. Renovation and reconstruction of Korean schools [10] showed negative effects on indoor air quality. The mean CO2 concentrations in the classrooms were relatively high (1347 ppm during summer and 1270 ppm during winter) due to the low air exchange rate.
Numerous studies have also reported high indoor CO2 concentrations in educational buildings across Europe and the United States. The study about the relationship between classroom ventilation rates and academic achievement was conducted in one hundred elementary schools of two school districts in the southwest United States [26]. All studied classrooms had installed locally controlled mechanical HVAC systems. Obtained results showed that 87 out of the 100 classrooms had ventilation rates below the recommended guidelines. In each school, the maximum indoor CO2 concentrations ranged from 661 to 6000 ppm (mean 1779 ppm).
In England, 8 primary schools were monitored for three weeks when the concentrations of CO2 and other parameters were measured in two selected classrooms [11]. The conducted research showed that inadequate classroom ventilation resulted in pupils and teachers being exposed to CO2 concentrations of up to 5000 ppm. Those concentrations were much higher than recommended values (average recommended level of 1500 ppm and the preferred level of 1000 ppm).
Another study conducted in five naturally ventilated primary schools in Serbia during the heating season, located in both rural and urban areas, showed that indoor CO2 concentrations exceeded 1000 ppm during more than 50% of lecture time [22]. The maximum value of CO2 concentration (about 3600 ppm) was reached at the end of the shift.
The SINPHONIE study (a two-year multidisciplinary cross-sectional study) analyzed indoor air quality (IAQ) and sick building syndrome (SBS) in European schools [16]. The study targeted 115 schools in 54 cities of 23 European countries. The SINPHONIE study suggests that in Europe, children are exposed to different air pollutants with levels above the recommended national and international standards at school and various adverse health outcomes among schoolchildren.
Air quality measurement research in Bosnia and Herzegovina was carried out in kindergarten buildings without a ventilation system. The measured CO2 concentrations confirmed that improved building envelope airtightness and occupant behavior (number of users and natural ventilation) significantly affect indoor air quality [31].
A substantial body of literature has addressed indoor air quality and thermal comfort in educational buildings, often through integrated approaches combining objective measurements, comfort models, and occupant perception surveys. International standards, such as EN 16798-1 [32] and ISO 7730 [33], have been available for more than a decade and provide a robust framework for assessing indoor environmental quality in schools and universities. Large-scale field studies and surveys have further contributed to a detailed understanding of ventilation performance, thermal comfort, and occupant satisfaction across different educational contexts.
However, in many public university buildings in Southeast Europe, particularly those constructed or designed under earlier regulatory frameworks, mechanical ventilation systems were frequently omitted due to design assumptions and uncertainties regarding actual occupancy levels, with natural ventilation considered sufficient [34]. Consequently, fewer studies have addressed the combined analysis of real operational modes of mechanical ventilation systems, occupancy-driven CO2 dynamics, and subjective user perception in recently constructed university buildings within this regional context.
Conventional building ventilation systems typically have constant or predetermined ventilation rates based on the needs of the space in that building. The fan usually operates automatically on behalf of the occupants even when the need for ventilation decreases. This may negatively affect thermal comfort and indoor air quality due to uncontrolled ventilation rates, while also resulting in unnecessary energy consumption [35].
Most previous research has focused on IAQ in elementary and secondary schools [36], while only a small number of papers have analyzed IAQ in university classrooms. Research on indoor CO2 concentration in educational buildings remains limited in Bosnia and Herzegovina, highlighting the importance of further investigations in this field. Generally, the CO2 concentration standards and guidelines are different for various countries but are set at 1000–1500 ppm [37]. Regarding the importance of this research, which is also influenced by outdoor air pollution, it should be emphasized that back in 2019, Eurostat, comparing 36 EU countries, identified Bosnia and Herzegovina as the country with the highest value of the impact of air pollution on health [38].
2. Materials and Methods
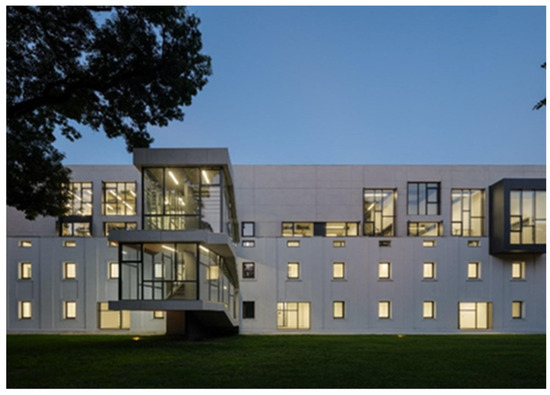
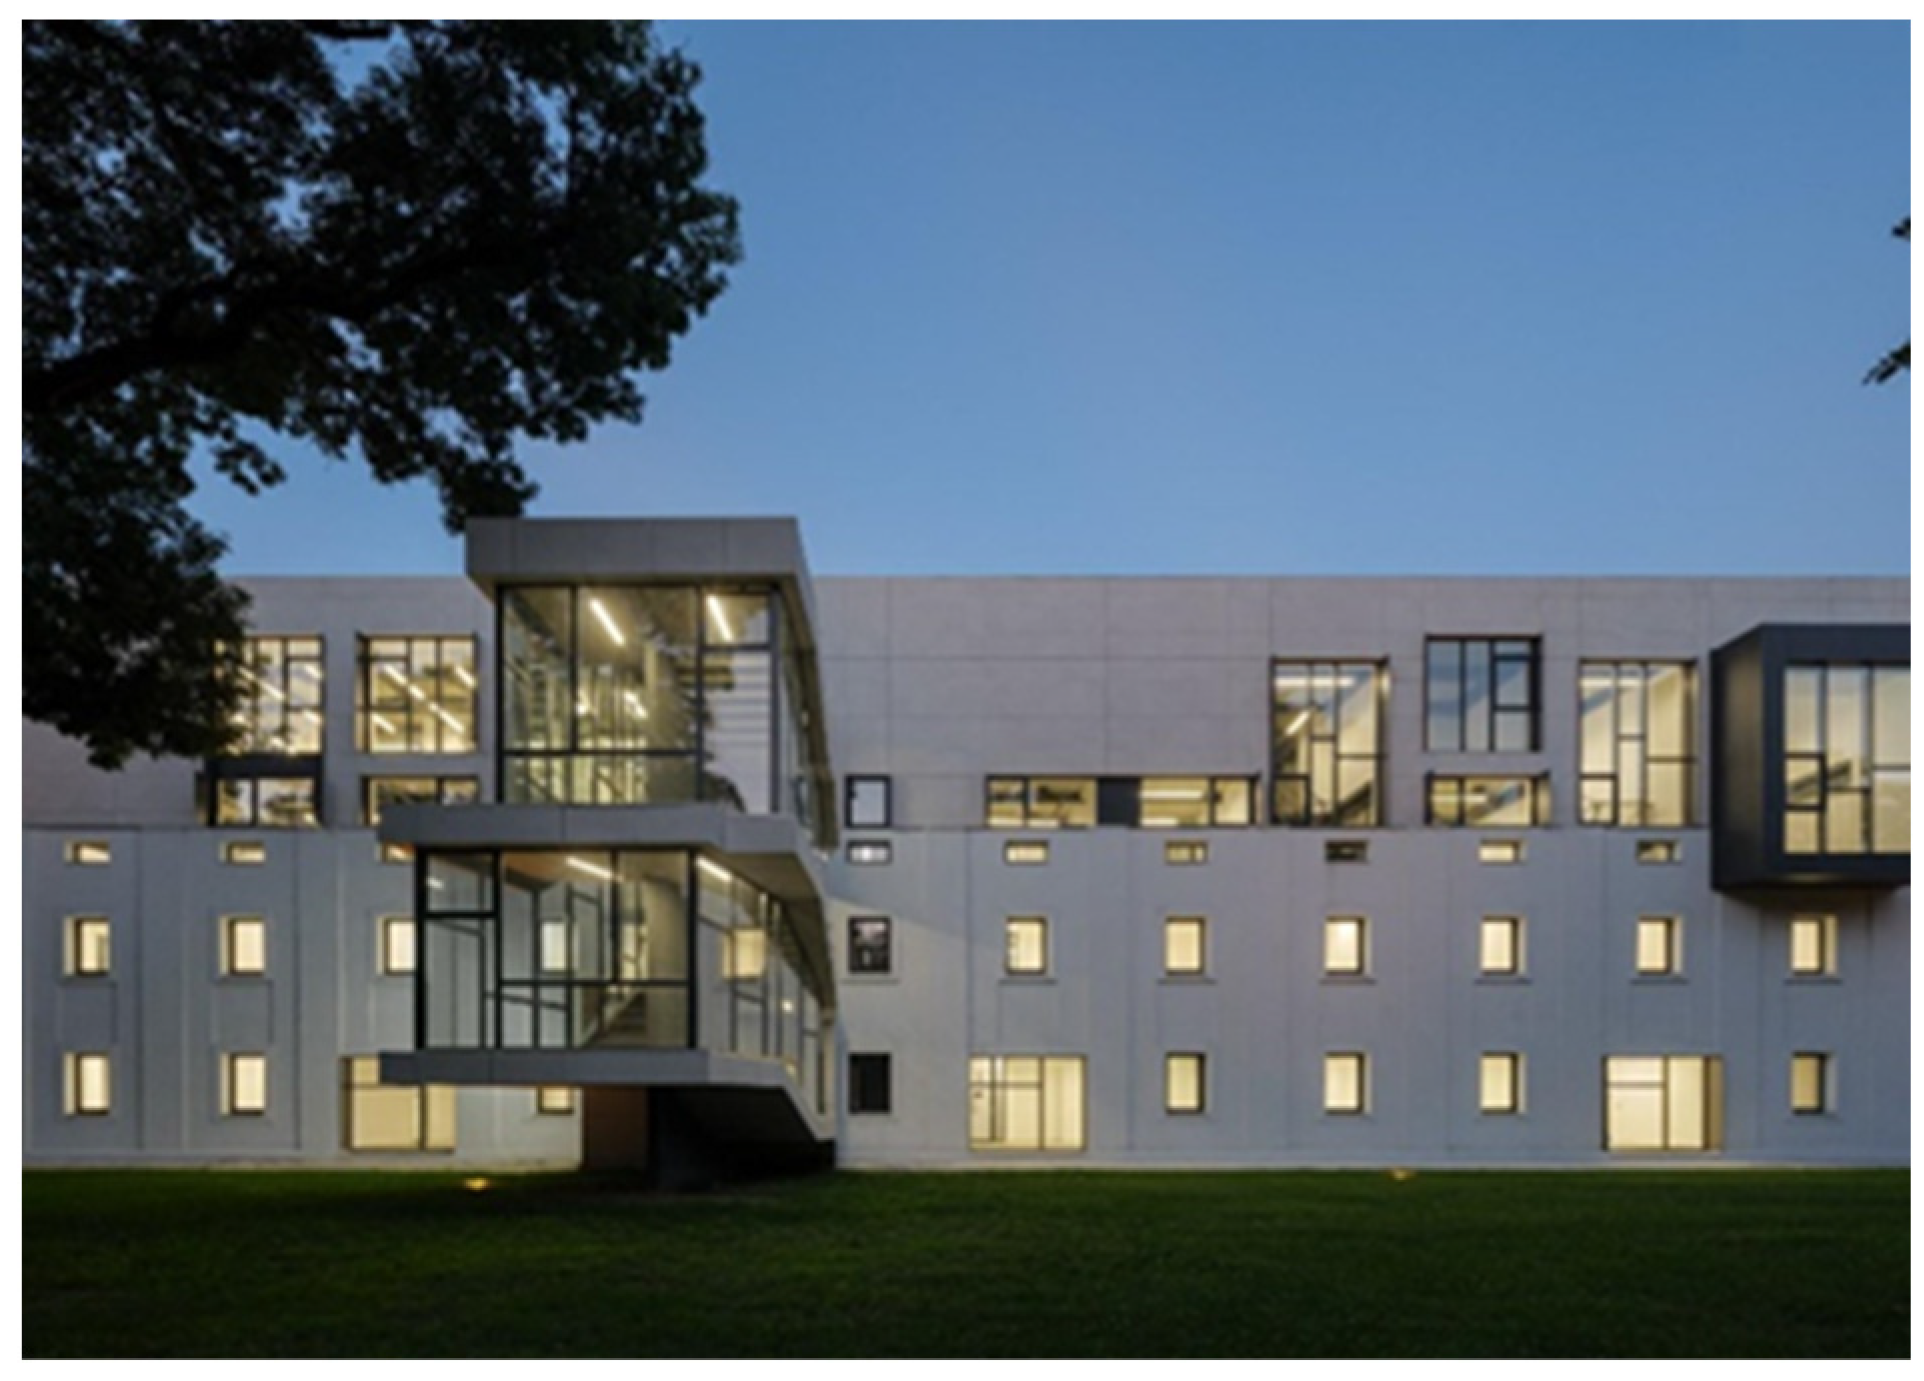
The case study building considered in this research is the recently constructed Faculty of Architecture, Civil Engineering and Geodesy and Faculty of Forestry (FACEG and FF) building at the University of Banja Luka, presented in Figure 1. This building represents an educational facility with a distinctive architectural design, consisting of two interconnected structures linked by a central corridor featuring a curtain wall and roof. One section consists of a two-story Austro-Hungarian period building, fully renovated with an upgraded envelope and an additional two-story steel extension intended for academic and administrative functions. The second section is a newly constructed reinforced concrete building consisting of a basement level with laboratories and auxiliary spaces, a ground floor with the main amphitheater, entrance hall, and lecture halls, and three upper floors containing lecture halls and workshops. The facility serves a total of 1022 individuals across two faculties. Initially, the first project aimed to meet passive building standards, but financial constraints led to its redesign as a low-energy building [39]. The existing structure consists of a massive load-bearing system with solid brick walls and reinforced concrete ribbed ceilings, while the extension is constructed using a steel frame structure. The newly constructed section features a reinforced concrete structural system with mixed load-bearing elements, incorporating thermal-concrete block infill and continuous thermal insulation throughout the building envelope. The thermal transmittance values (U-values) are as follows: exterior walls U = 0.122–0.262 W/m2K, roof U = 0.106–0.191 W/m2K, and ground floor U = 0.123–0.134 W/m2K). It is also equipped with low-energy windows with metal frames and triple-glazed thermal insulation glass (U = 0.96–1.60 W/m2K). The total usable floor area of the building is 7197 m2, with a heated volume of 34,053 m3 and a shape factor of 0.247 m−1.
Figure 1.
Building of the Faculty of Architecture, Civil Engineering and Geodesy and the Faculty of Forestry (FACEG and FF) at the University of Banja Luka.
Transparent elements make up 28.3% of the total building envelope. The required heating energy is approximately 20 kWh/m2 per year, placing the building in energy class “B” according to the current Regulation on Energy Audits and Certification of Buildings in the Republic of Srpska.
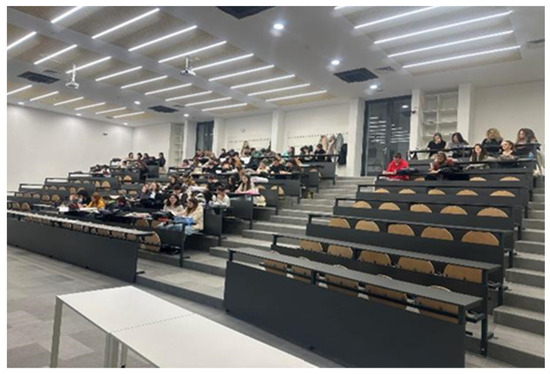
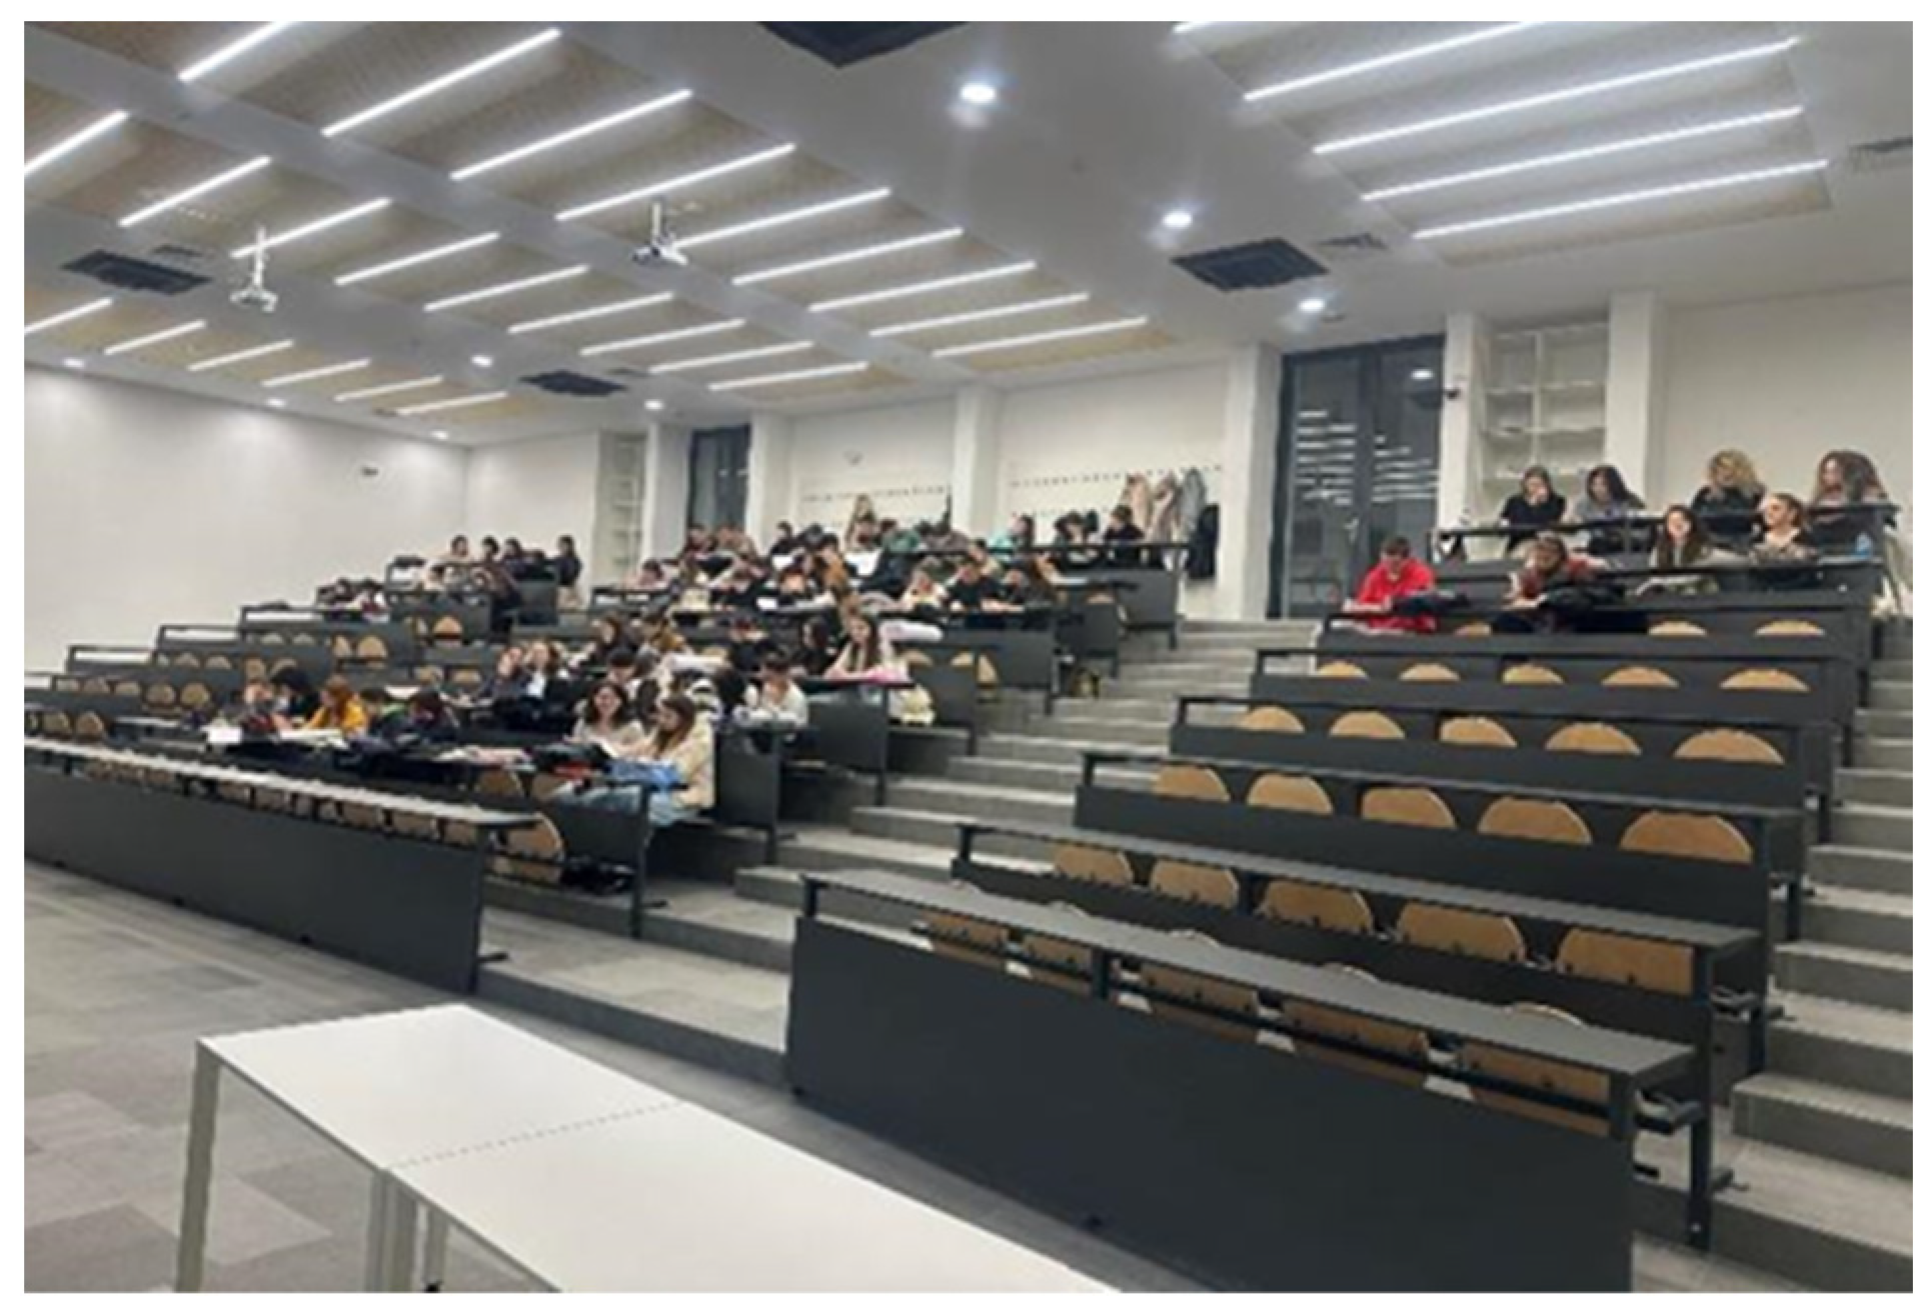
The selected lecture room is the main amphitheater, which is located in the central part of the building. The amphitheater has an area of 241.48 m2 and a volume of 1117.56 m3 (Figure 2). The amphitheater has a maximum seating capacity of 194 occupants and is equipped with a mechanical ventilation system supplying a constant outdoor airflow rate of 4250 m3/h, corresponding to approximately 6.1 L/s per person under full occupancy conditions, in accordance with the requirements of BAS EN 16798-1 and ASHRAE 62.1 [40] for educational buildings. Heating and cooling of the amphitheater are provided by a variable refrigerant volume (VRV) air-conditioning system, while fresh air is supplied through a mechanical ventilation unit equipped with a rotary heat recovery wheel. The building was constructed after 2020 and has been in use since September 2023. The indoor air quality assessment presented in this study is based on experimental measurements, occupant surveys, and characteristic building design parameters.
Figure 2.
Analyzed Amphitheatre at the Faculty of Architecture, Civil Engineering and Geodesy and the Faculty of Forestry at the University of Banja Luka.
2.1. Subjective Assessment of Indoor Air Quality and Occupant Perception
Subjective assessment of indoor air quality and thermal comfort was conducted using structured questionnaires administered during regular teaching activities in the analyzed university amphitheater. The survey was carried out among undergraduate students attending lectures in the monitored space. Basic sample characteristics, including the number of respondents in each survey, gender distribution, and average age, were recorded. The questionnaire included questions related to perceived air freshness, acceptability of indoor air quality, and the perceived influence of indoor air quality on concentration. Responses were collected using ordinal rating scales commonly applied in indoor environmental quality research. To allow comparison between different operational conditions, surveys were conducted under defined ventilation modes, including periods with the mechanical ventilation system turned on and off. The design and administration of the questionnaire followed commonly accepted methodological approaches for comfort-related surveys in indoor environment research, consistent with recommendations reported in recent literature.
Descriptive statistical methods were used for data analysis. The relationships between categorical variables, presented in contingency tables, were examined using the χ2 test with Yates’ correction. Fisher’s Exact Test was applied when expected frequencies in contingency tables were lower than five. A significance level of p = 0.05 was applied. Statistical analysis was performed using SPSS (Statistical Product and Service Solutions), version 22.
2.2. Measurement of Indoor Environmental Parameters
Indoor environmental parameters were measured in accordance with the recommendations of ISO 7726 [41]. Ventilation performance and indoor air quality classification were evaluated according to BAS EN 16798-1 and ASHRAE 62.1. ISO 7730 was used exclusively for the interpretation of thermal comfort conditions.
Air temperature and relative humidity were measured using calibrated digital data loggers positioned at representative locations within the occupied zone of the amphitheater. Measurements were performed at heights corresponding to the seated occupant zone, in accordance with ISO 7726 recommendations. Indoor air velocity was measured at head height (130 cm) in the central part of the occupied zone using a Testo thermal velocity probe (Model 0635 1535). The measurements were performed to characterize the low-air-velocity conditions relevant for thermal comfort assessment in accordance with ISO 7726 rather than to resolve the complete three-dimensional airflow field of the amphitheater.
Carbon dioxide (CO2) concentration was measured using a centrally positioned sensor (S-M4) located 130 cm above floor level, corresponding to the breathing zone of seated occupants. The sensor position was selected to ensure representative measurement of occupancy-related CO2 levels while minimizing the influence of localized air supply and exhaust flows.
Mean radiant temperature was not directly measured during the experimental campaign, and therefore no globe thermometer was used. For the purpose of thermal comfort interpretation, mean radiant temperature was assumed to be approximately equal to air temperature, given the relatively uniform surface temperatures and low air velocity observed during the measurements. Thermal comfort evaluation was performed assuming a metabolic rate of 1.2 met (seated, light activity) and a clothing insulation level of 0.8 clo, selected according to the observed clothing conditions of seated occupants in the heated indoor environment, in accordance with ISO 7730.
The experimental investigation included measurements of indoor air temperature, relative humidity, air velocity, and CO2 concentration inside the amphitheater. In addition, correlations between measured physical parameters and subjective survey responses were analyzed. Indoor air quality was evaluated based on indoor CO2 concentration measurements obtained under occupied conditions, in accordance with BAS EN 16798-1, which defines indoor air quality categories based on the difference between indoor and outdoor CO2 concentrations. When turned on, the mechanical ventilation system continuously supplies fresh air corresponding to the design ventilation rate of approximately 6.1 L/s per person under full occupancy conditions, as described in Section 2.
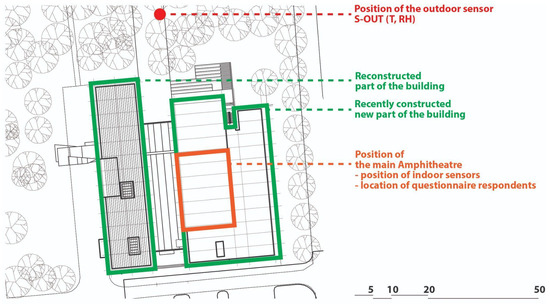
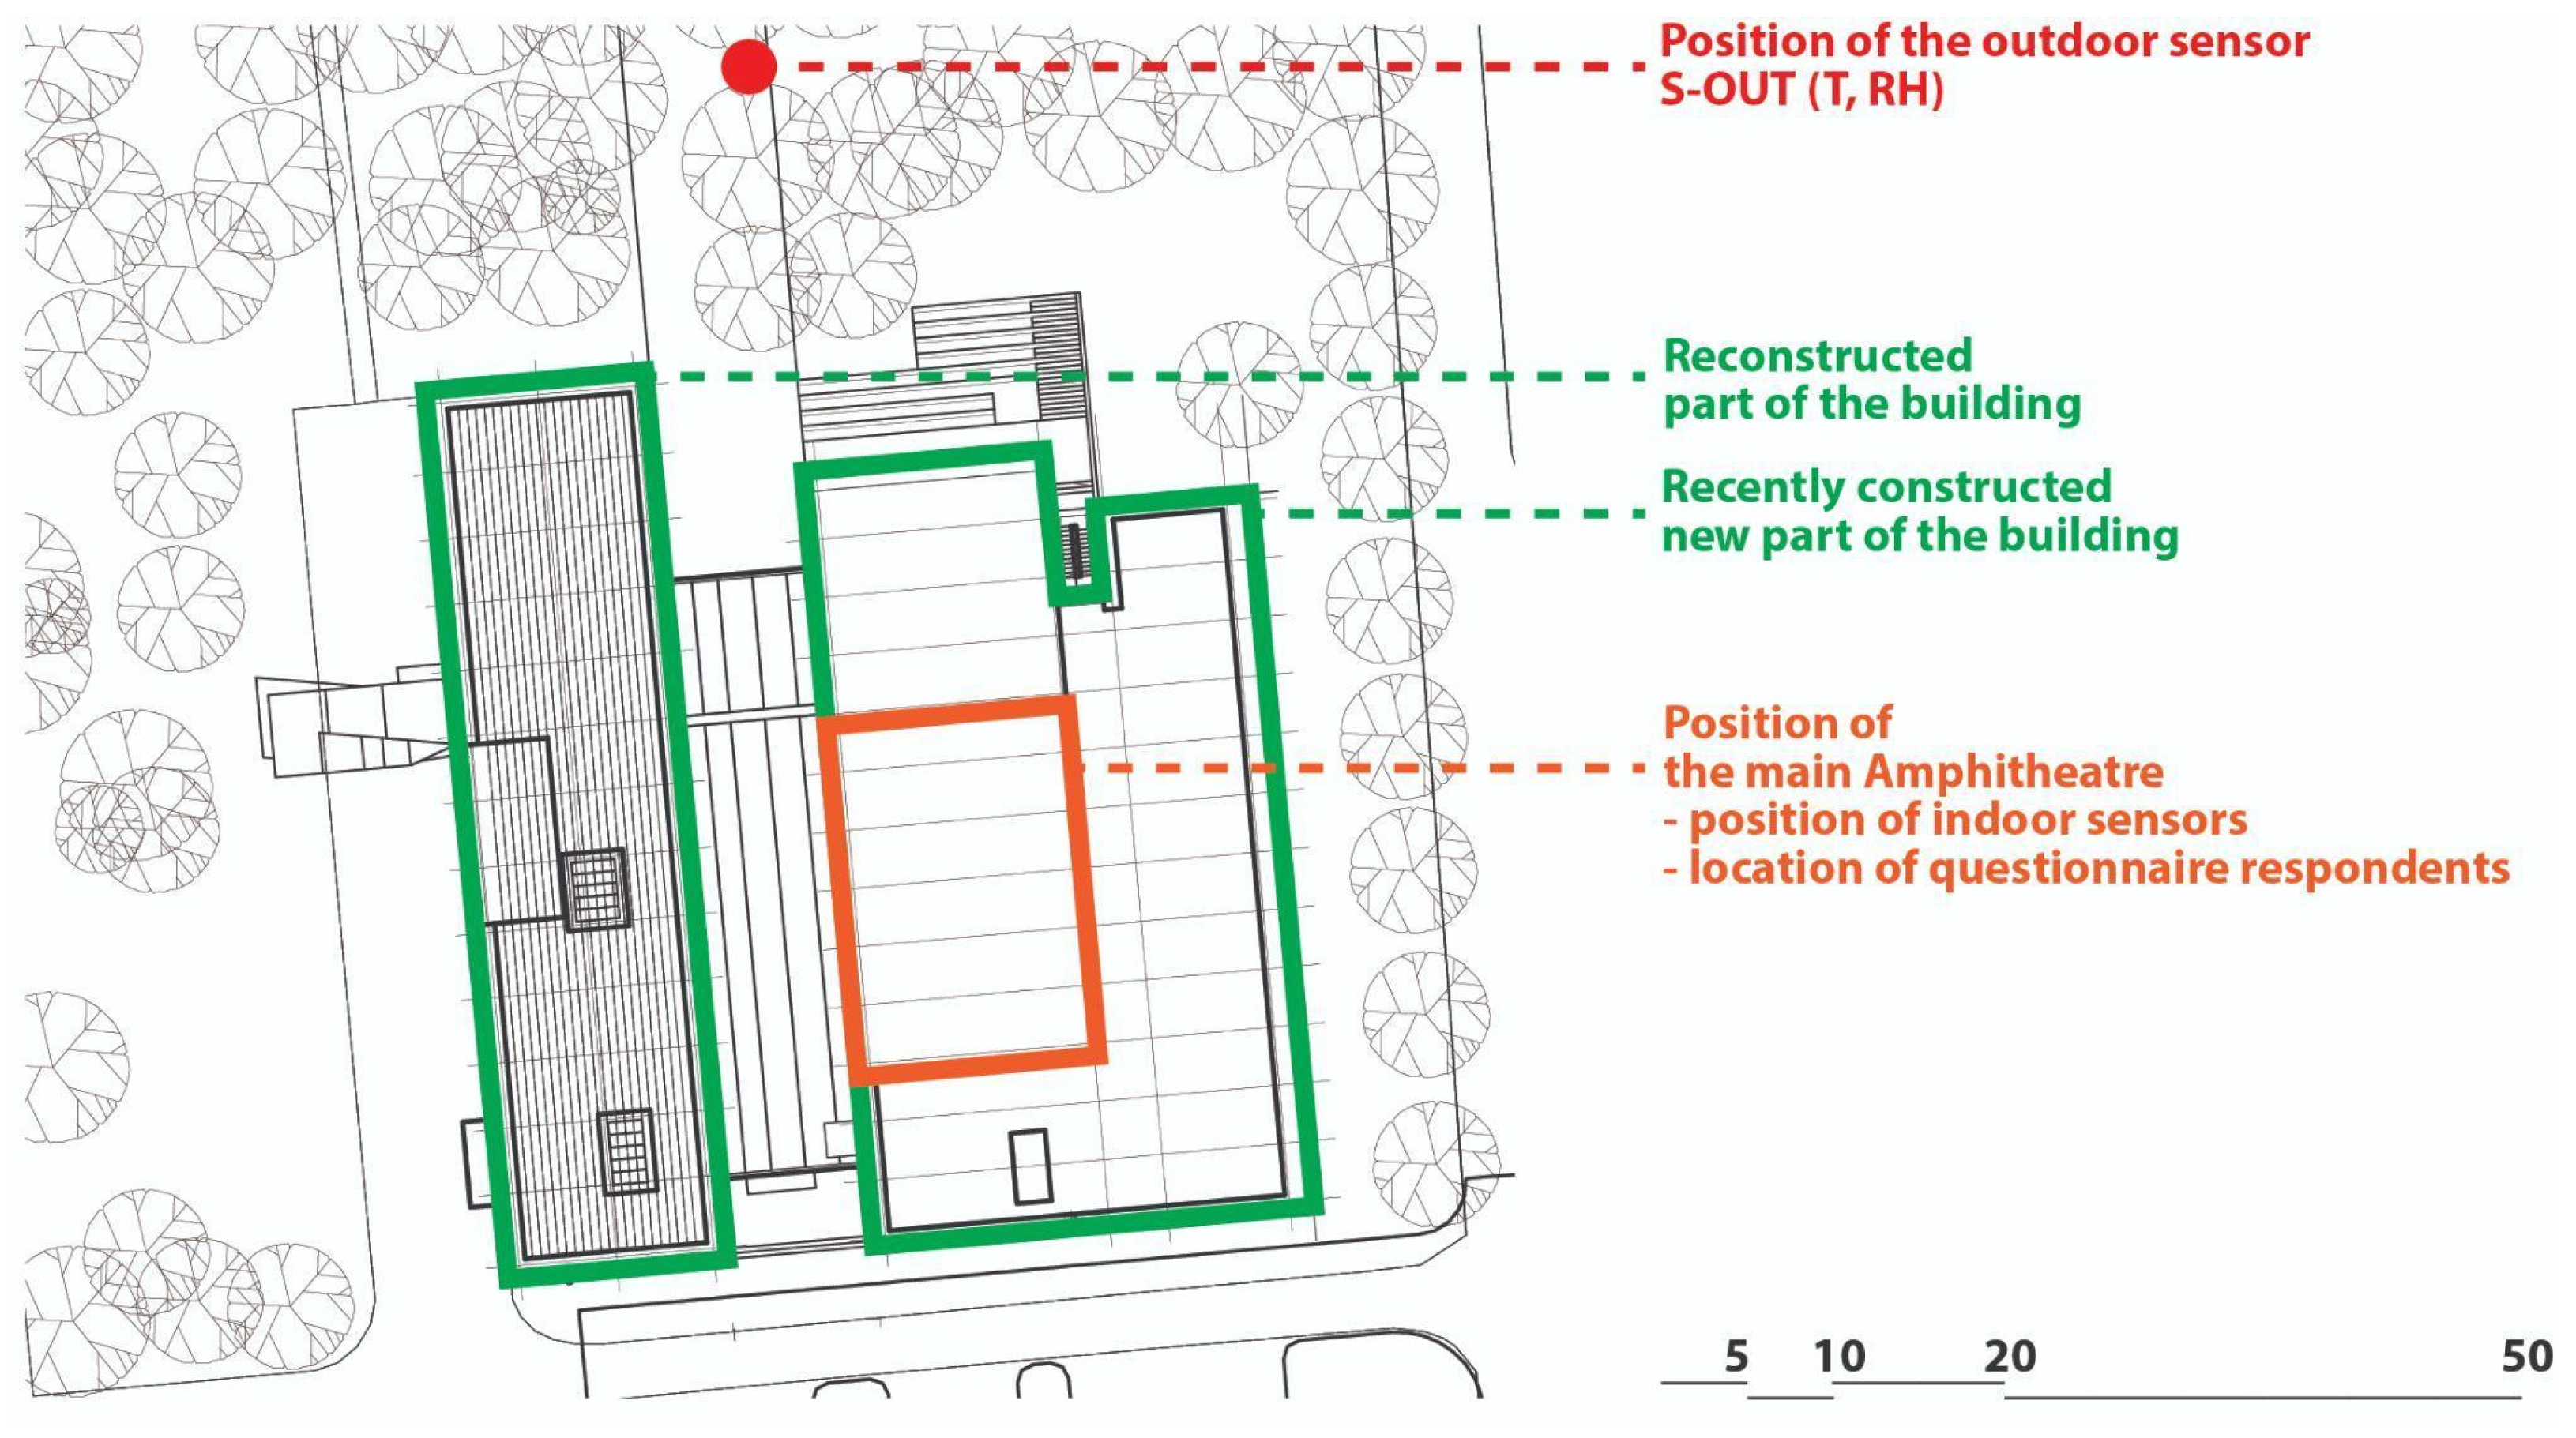
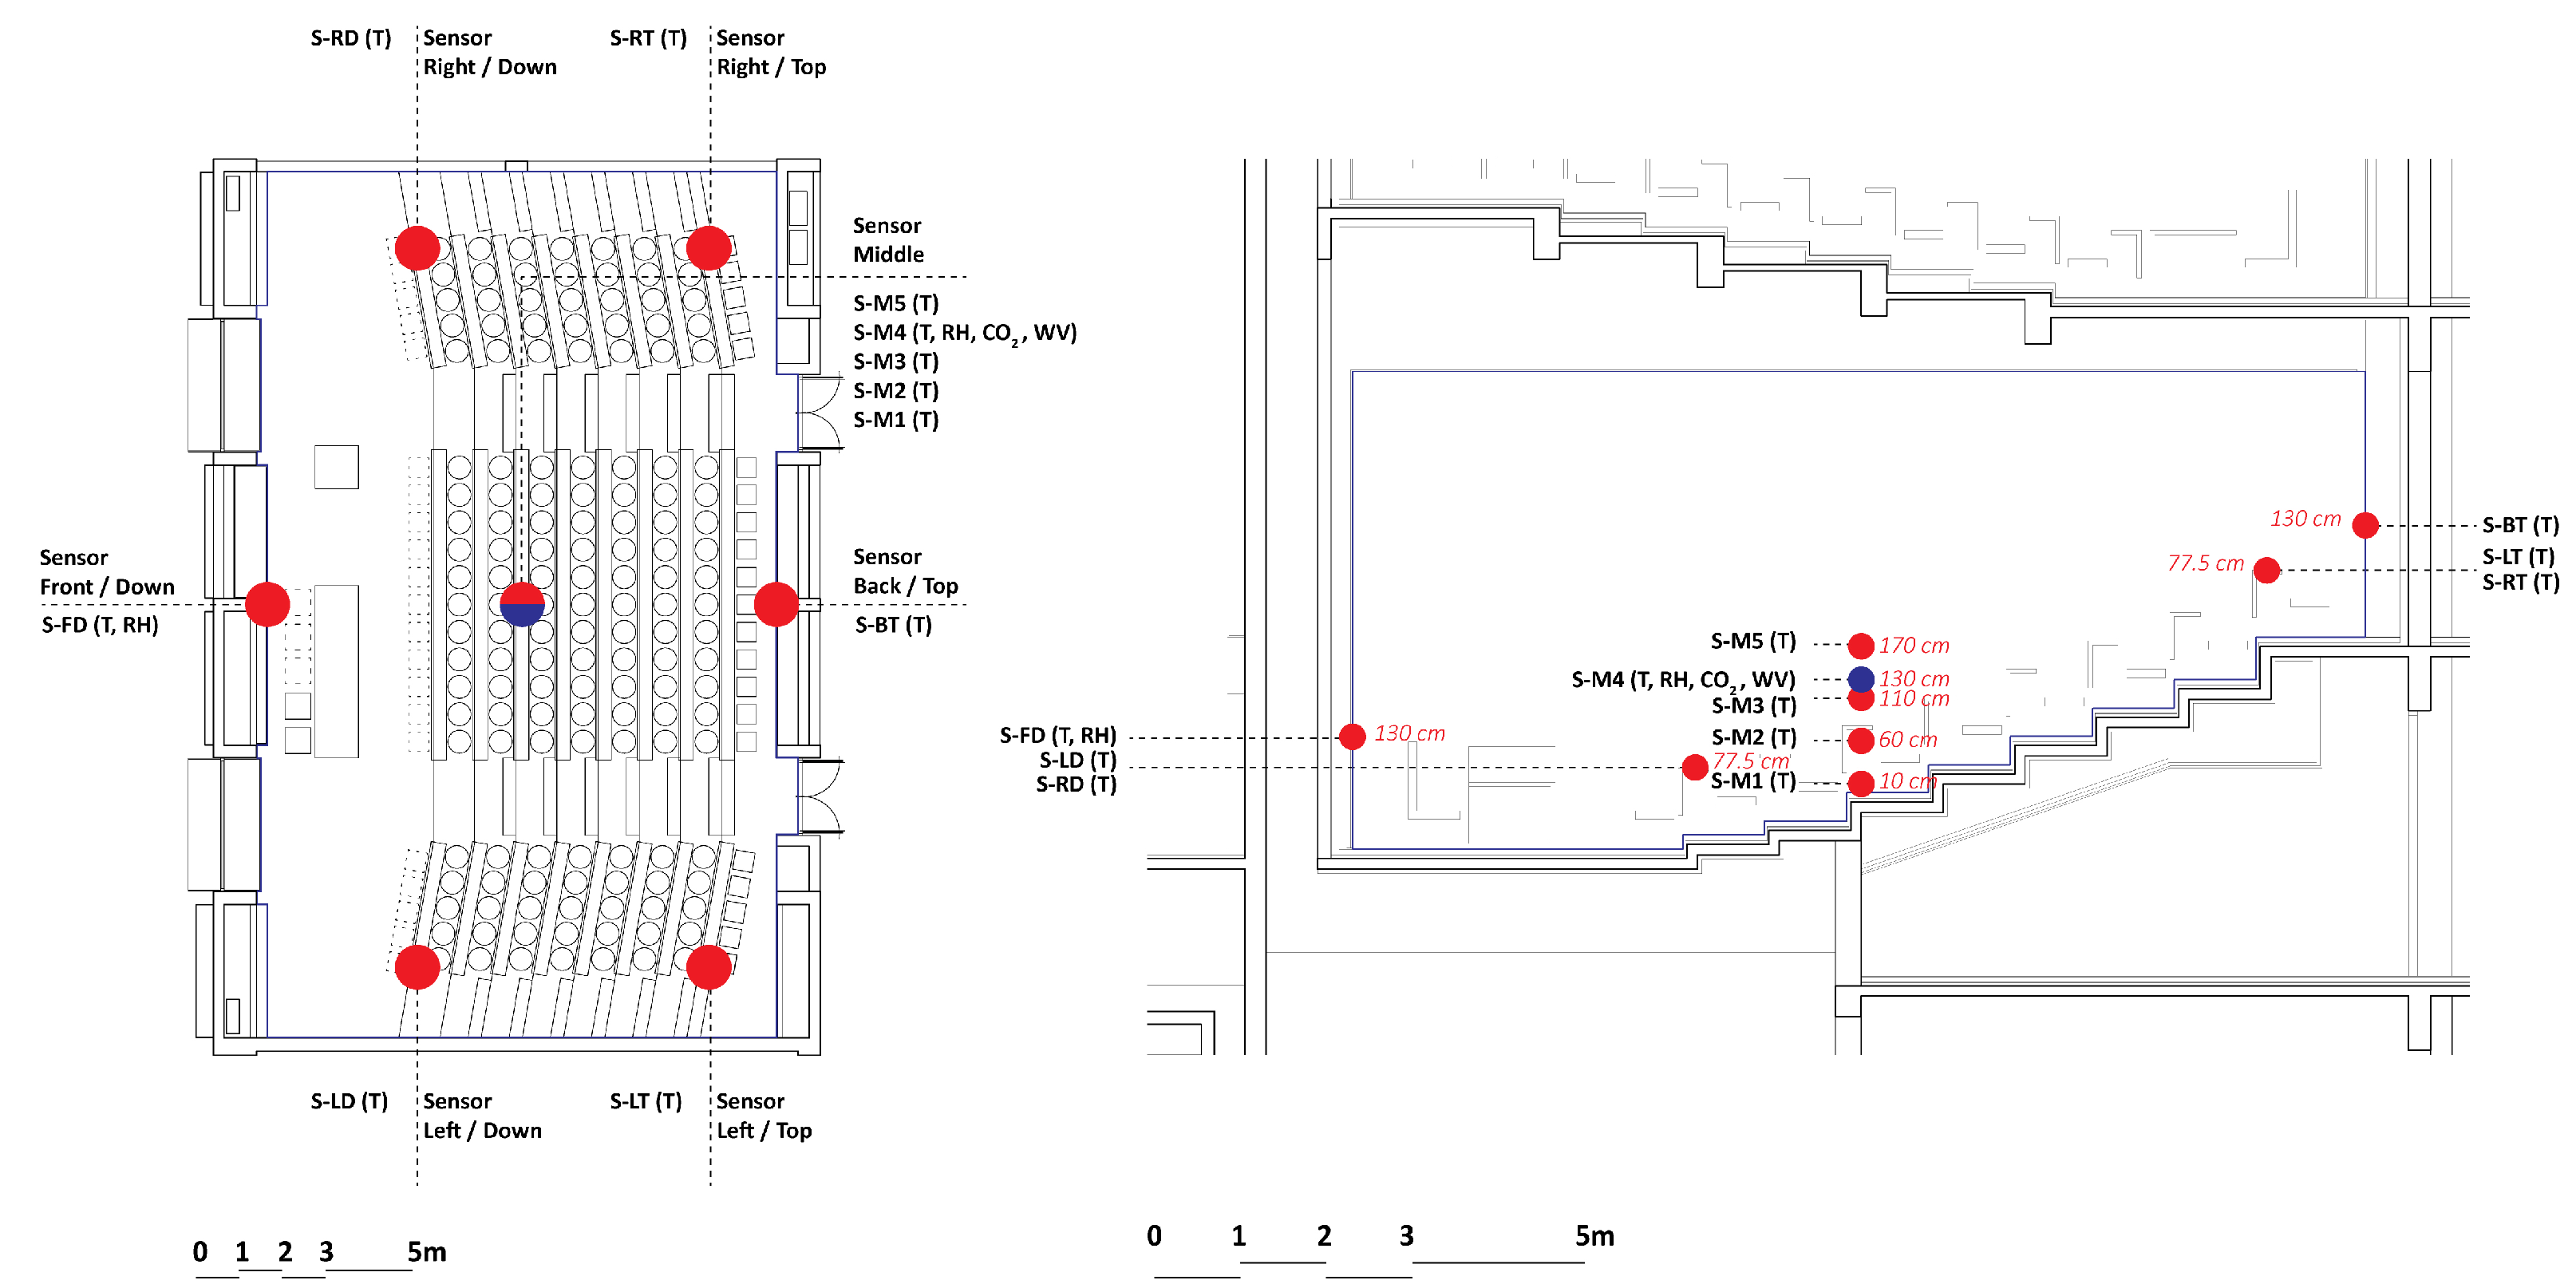
During the experimental campaign, seven indoor measurement locations were defined within the amphitheater to ensure representative spatial coverage of the occupied zone, together with one outdoor reference location. The location of the outdoor sensor is presented in Figure 3, while the distribution of indoor sensors is illustrated in Figure 4.
Figure 3.
Location of the analyzed amphitheater and outdoor measurement point.
Figure 4.
Distribution of indoor sensors in the amphitheater.
Detailed information on sensor positions, measurement heights, and recorded variables is provided in Table 1.
Table 1.
Measurement points and recorded variables.
Sensor selection and positioning were based on ISO 7726 [41] requirements and the geometric characteristics of the space. Temperature and relative humidity were measured using calibrated Testo 174H, 174T, and 175T1 data loggers, while CO2 concentration and air velocity were measured using a Testo 435-2 device equipped with an IAQ probe (Table 2).
Table 2.
Characteristics of measuring instruments.
As shown in Figure 4, the sensors were distributed according to the main geometric characteristics of the amphitheater.
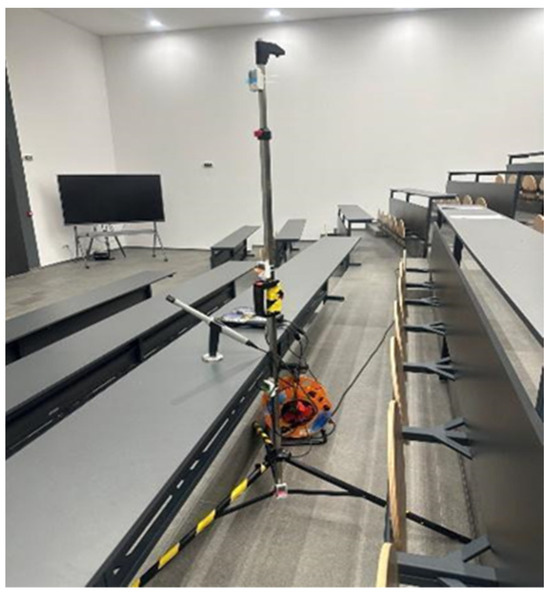
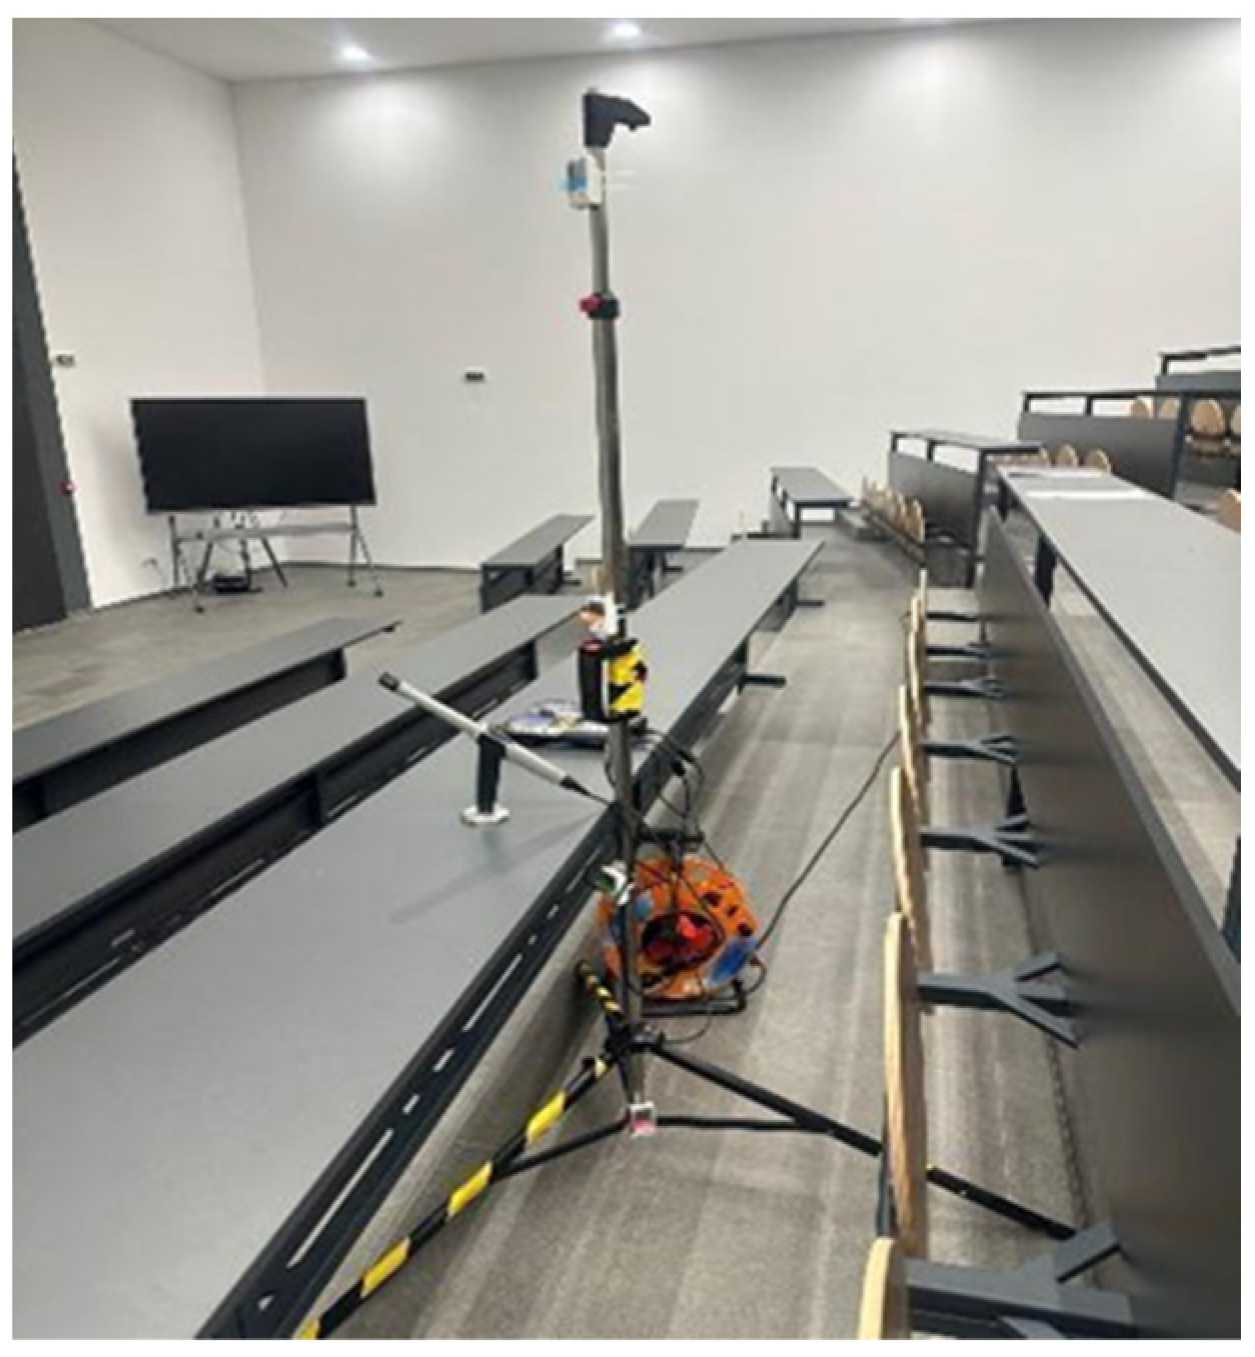
Indoor air velocity was measured at a height of 130 cm in the central part of the amphitheater, at the same location where air temperature and relative humidity were recorded (Figure 5).
Figure 5.
Central measurement position and sensor arrangement in the amphitheater.
The CO2 measurement location was selected to provide representative occupancy-related concentration values while minimizing the influence of localized pollution sources and direct ventilation airflow. Measurements were conducted during the winter season in two periods: from 25 November to 5 December 2024, and from 17 February to 1 March 2025. The sensor position was selected to avoid direct occupant influence and zones with immediate fresh air supply.
Following the installation of measurement sensors, the methodology was structured to include two measurement periods. During both periods, data collection focused on monitoring carbon dioxide (CO2) concentrations, temperature, relative humidity, and indoor air velocity. The experiment accounted for three occupancy scenarios: during lectures (45 min modules), during breaks (15 min between the modules), and during a conference event (held for 4 h and 15 min, without making the breaks). This experimental setup enabled analysis of pollutant accumulation and ventilation effectiveness under different occupancy conditions, including lecture periods and breaks between lecture modules. The measurements also allow for the identification of peak values, correlating with fluctuations in the number and density of occupants during lectures and the conference event.
3. Results and Discussion
Two monitoring campaigns were conducted, including questionnaire surveys and measurements of indoor and outdoor temperature, relative humidity, indoor air velocity, and indoor CO2 concentration.
3.1. Occupant Perception of Indoor Air Quality
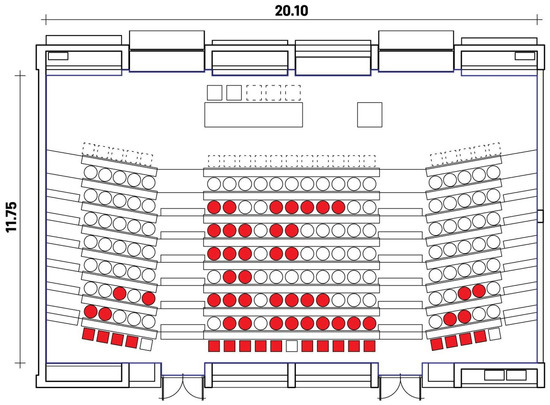
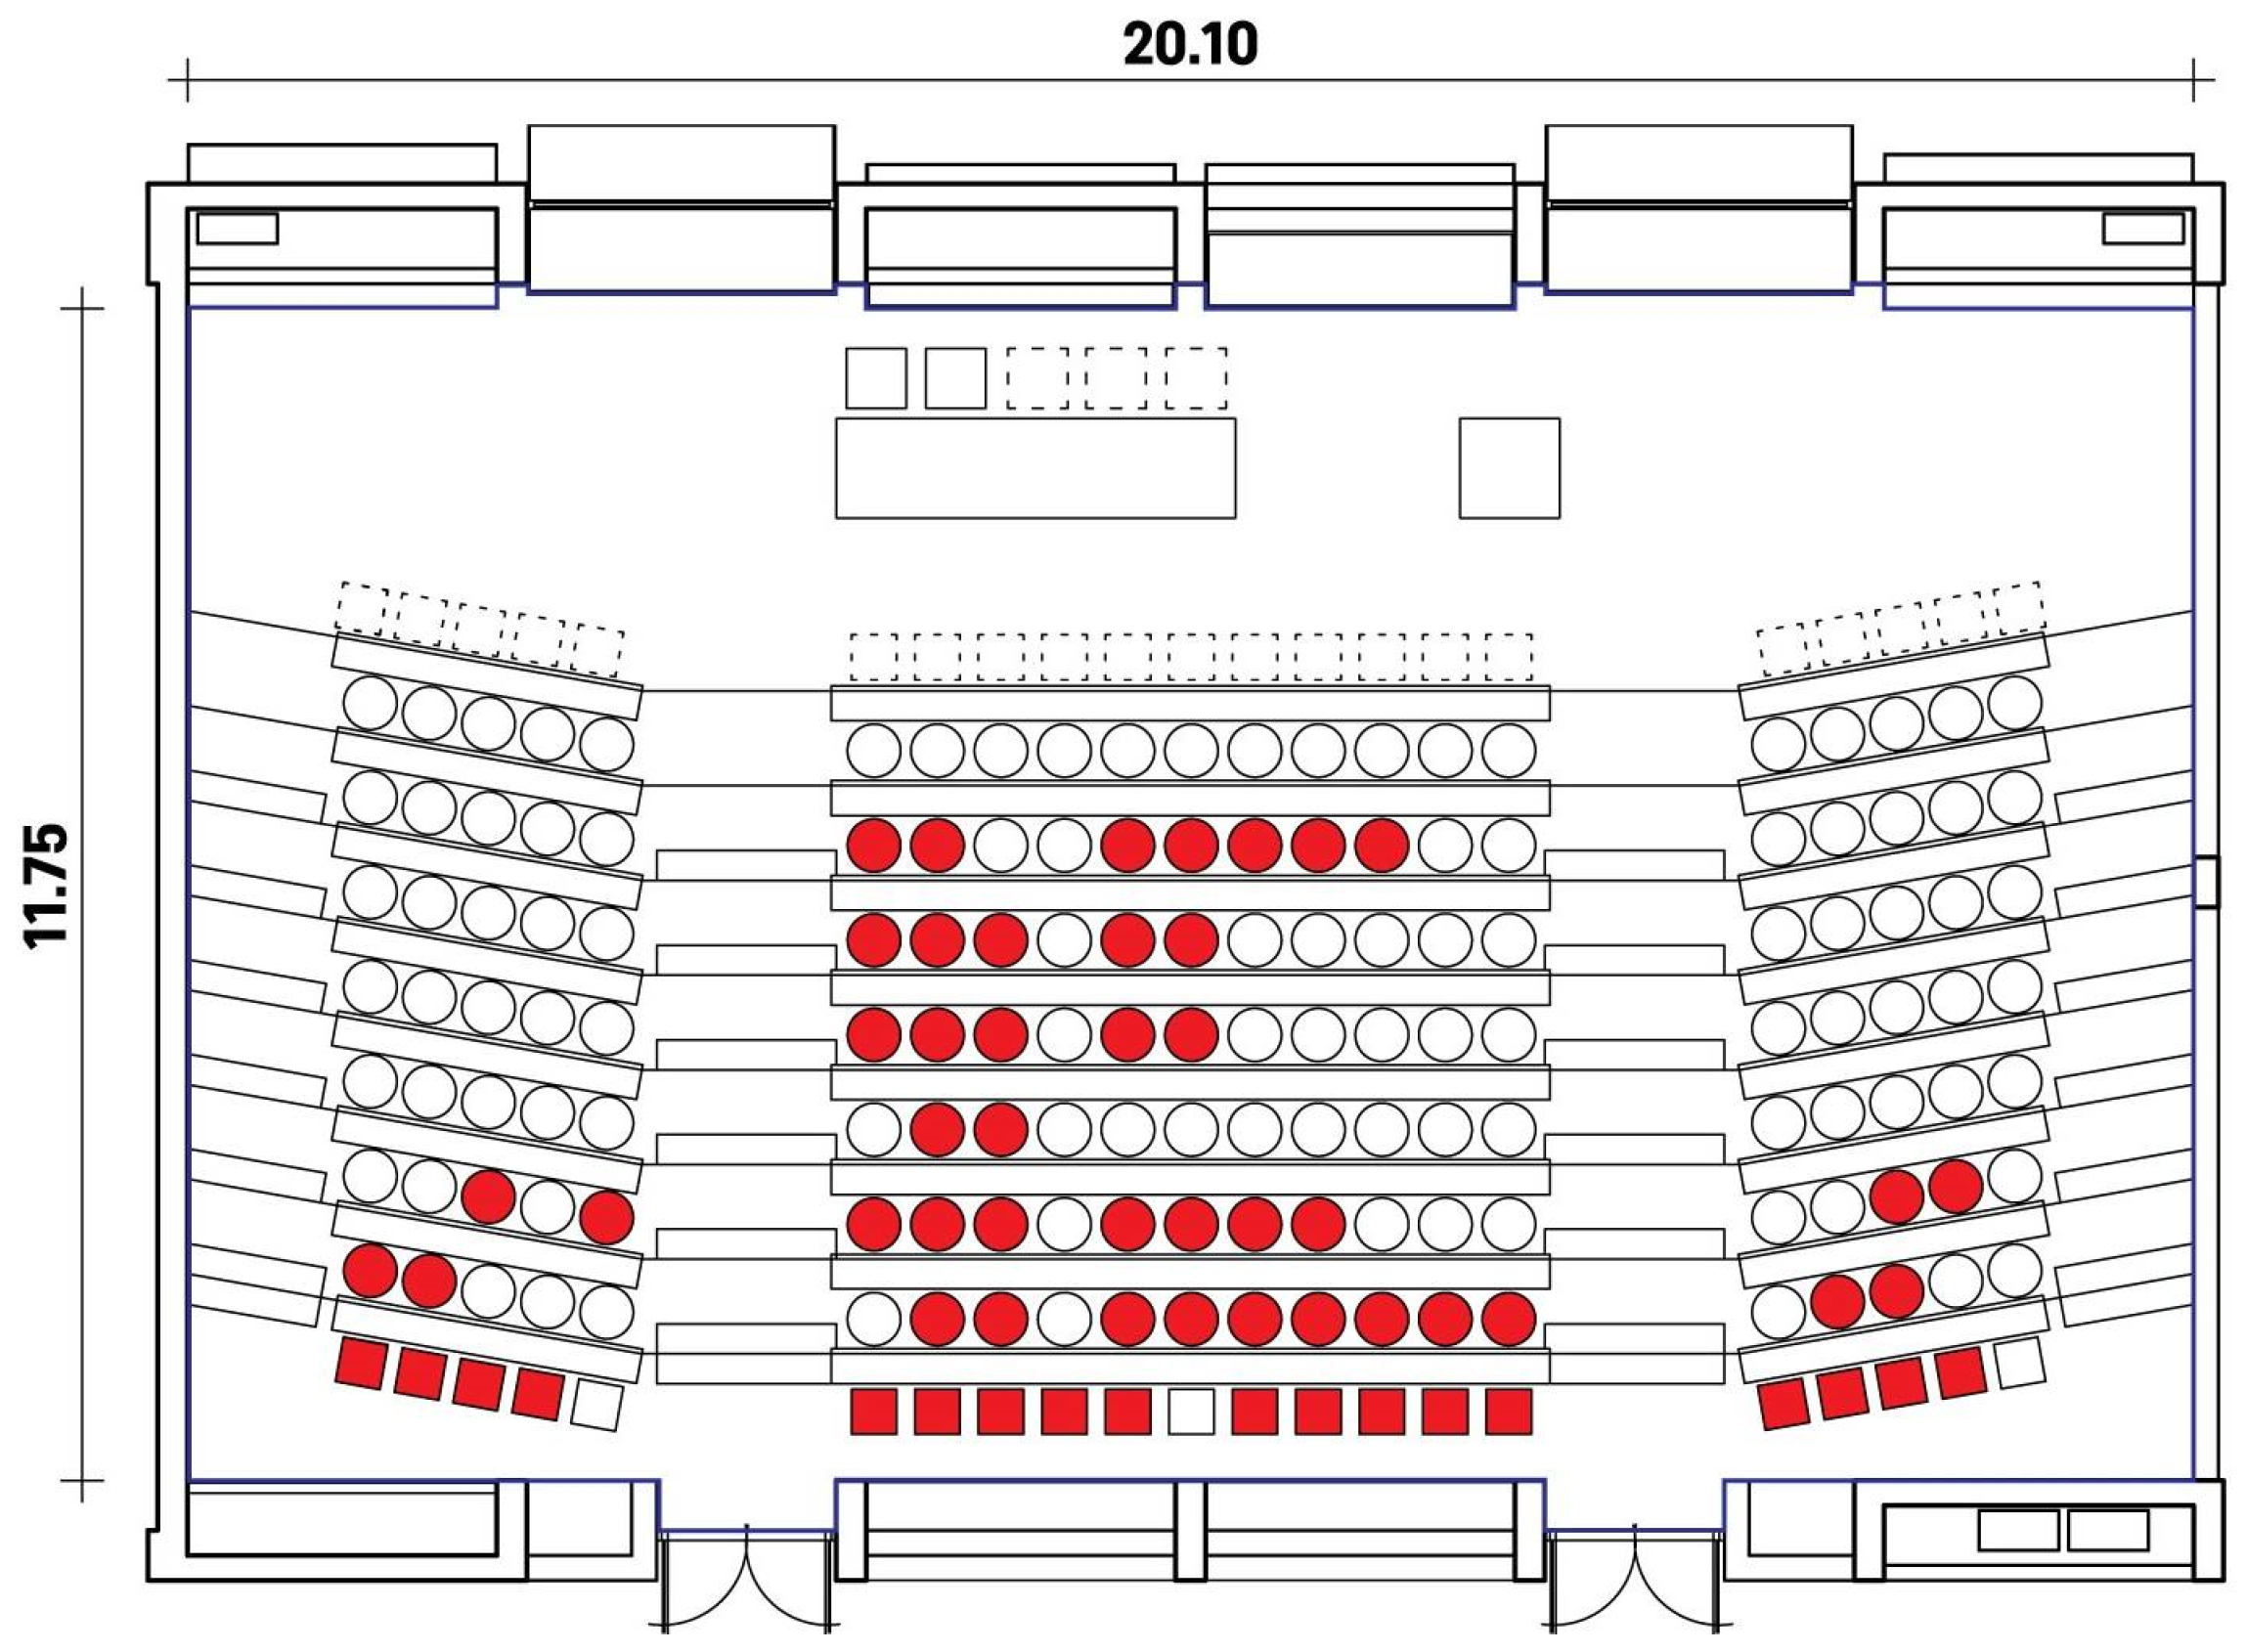
During November of 2024, a total of 62 second-year students from the Architecture study program at the Faculty of Architecture, Civil Engineering and Geodesy, University of Banja Luka, were surveyed. Figure 6 shows the sitting position where the respondents were sitting at the time when the survey was conducted.
Figure 6.
Occupancy distribution during the questionnaire survey.
In the first survey from November 2024, the vast majority (54 or 87.1%) of the surveyed students were female. The average age of the surveyed students was 20.6 years (standard deviation 1.1). An equal number of students (31) stated that they spend either one to four hours or more than four hours in the faculty premises (Table 3).
Table 3.
Characteristics of survey respondents.
Most students perceived indoor air quality as acceptable during both winter and summer conditions (Table 4). Students who spent more than four hours daily in the faculty premises generally reported slightly lower satisfaction levels compared to those with shorter occupancy periods. Increased door opening behavior aimed at improving fresh air supply was more frequently reported during summer conditions. In addition, most respondents indicated that indoor air quality influenced their concentration during lectures.
Table 4.
Subjective assessment of indoor air quality (IAQ).
The vast majority of students stated that, during winter, they opened the door for less than one hour to allow additional fresh air, while staying in the faculty premises for one to four hours (7 or 70%) and more than four hours (8 or 72.7%). During the summer, they opened the door for one to four hours to allow additional fresh air, while spending one to four hours (11 or 84.6%) and more than four hours (7 or 50%) in the faculty premises. A total of 18 students reported experiencing symptoms such as sneezing or coughing without an apparent cause while inside the work area, including 7 students (22.6%) who stayed on the faculty premises for one to four hours and 11 students (35.5%) who stayed for more than four hours. The majority of students stated that air comfort affects their concentration, including 22 students (71%) who stayed for one to four hours and 20 students (64.5%) who stayed for more than four hours.
Statistical analysis showed no significant differences in subjective air quality perception with respect to students’ duration of stay in the faculty premises. Following the initial survey and measurement campaign, it was observed that the operational mode of the mechanical ventilation system was not consistently defined. The operation of the ventilation system depended on occupants’ manual intervention based on subjective perception of indoor air quality. Due to this uncertainty, a second measurement campaign was conducted in February 2025 under comparable occupancy conditions using a predefined ventilation operating regime, allowing a more systematic evaluation of the influence of ventilation operation on indoor air quality and occupant perception.
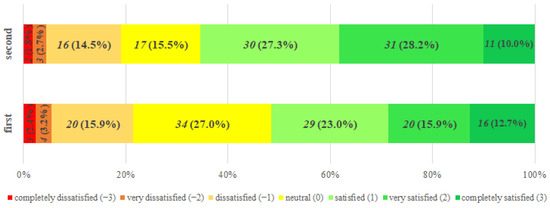
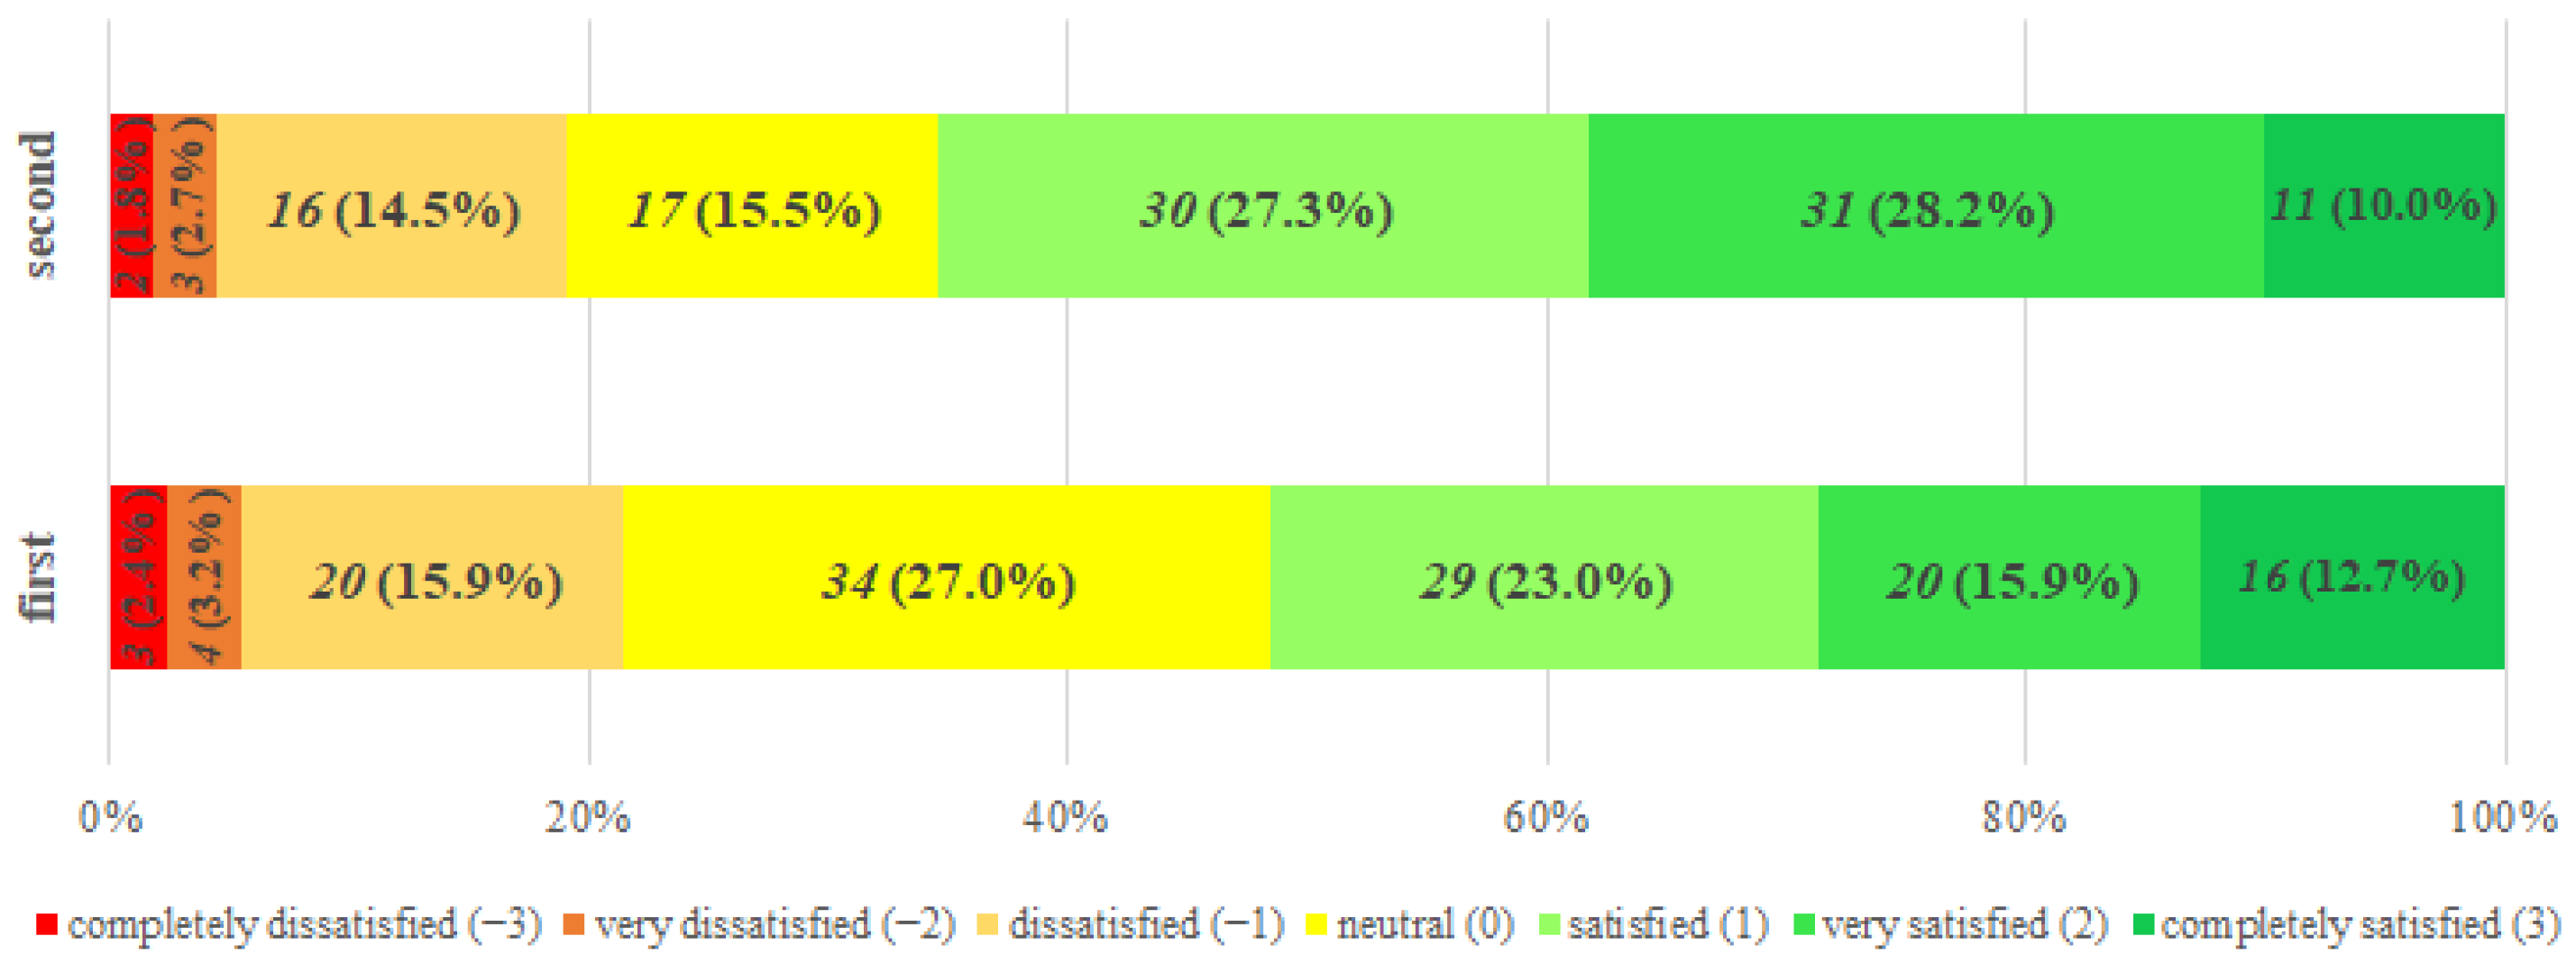
The questionnaires were modified so that students were asked to assess air quality using a seven-point rating scale ranging from −3 (completely dissatisfied) to +3 (completely satisfied). The average rating represents the arithmetic mean value of responses obtained using this seven-point satisfaction scale. A survey regime was established in which the same students were surveyed with the ventilation system turned off and again the following week with the system turned on. During the first survey conducted with the ventilation system turned off, 126 students participated, and the average air comfort rating was 0.63. During the second survey, conducted with the ventilation system turned on, 110 students participated and the average rating increased to 0.88. During the first survey, 65 (51.6%) students were satisfied and 27 (21.4%) were dissatisfied with air comfort, while 34 (27%) students were neutral. During the second survey, 72 (65.5%) students were satisfied, 21 (19.1%) were dissatisfied with air comfort, and 17 (15.5%) students were neutral (Figure 7). Comparison of students’ responses using the applied seven-point rating scale (from −3 completely dissatisfied to +3 completely satisfied) indicates a moderate improvement in perceived indoor air quality during periods with active mechanical ventilation.
Figure 7.
Students’ satisfaction with indoor air quality under different ventilation operating modes.
3.2. Indoor Environmental Measurements
This section presents the results of the microclimatic measurements conducted in the amphitheater under different ventilation operation modes.
A total of 10,490 CO2 measurements were recorded during the two monitoring periods (4686 in the first period and 5804 in the second). During the first measurement campaign, indoor CO2 concentrations ranged from 426.2 to 1398.4 ppm, whereas during the second campaign, values ranged from 392.7 to 2312.7 ppm. The average outdoor CO2 concentration was 406.2 ppm, with recorded values ranging from 392.7 to 419.6 ppm.
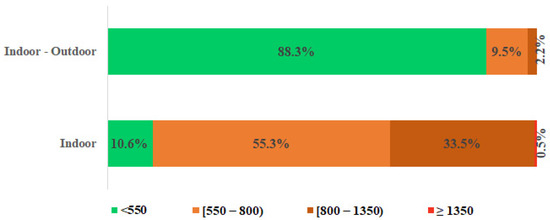
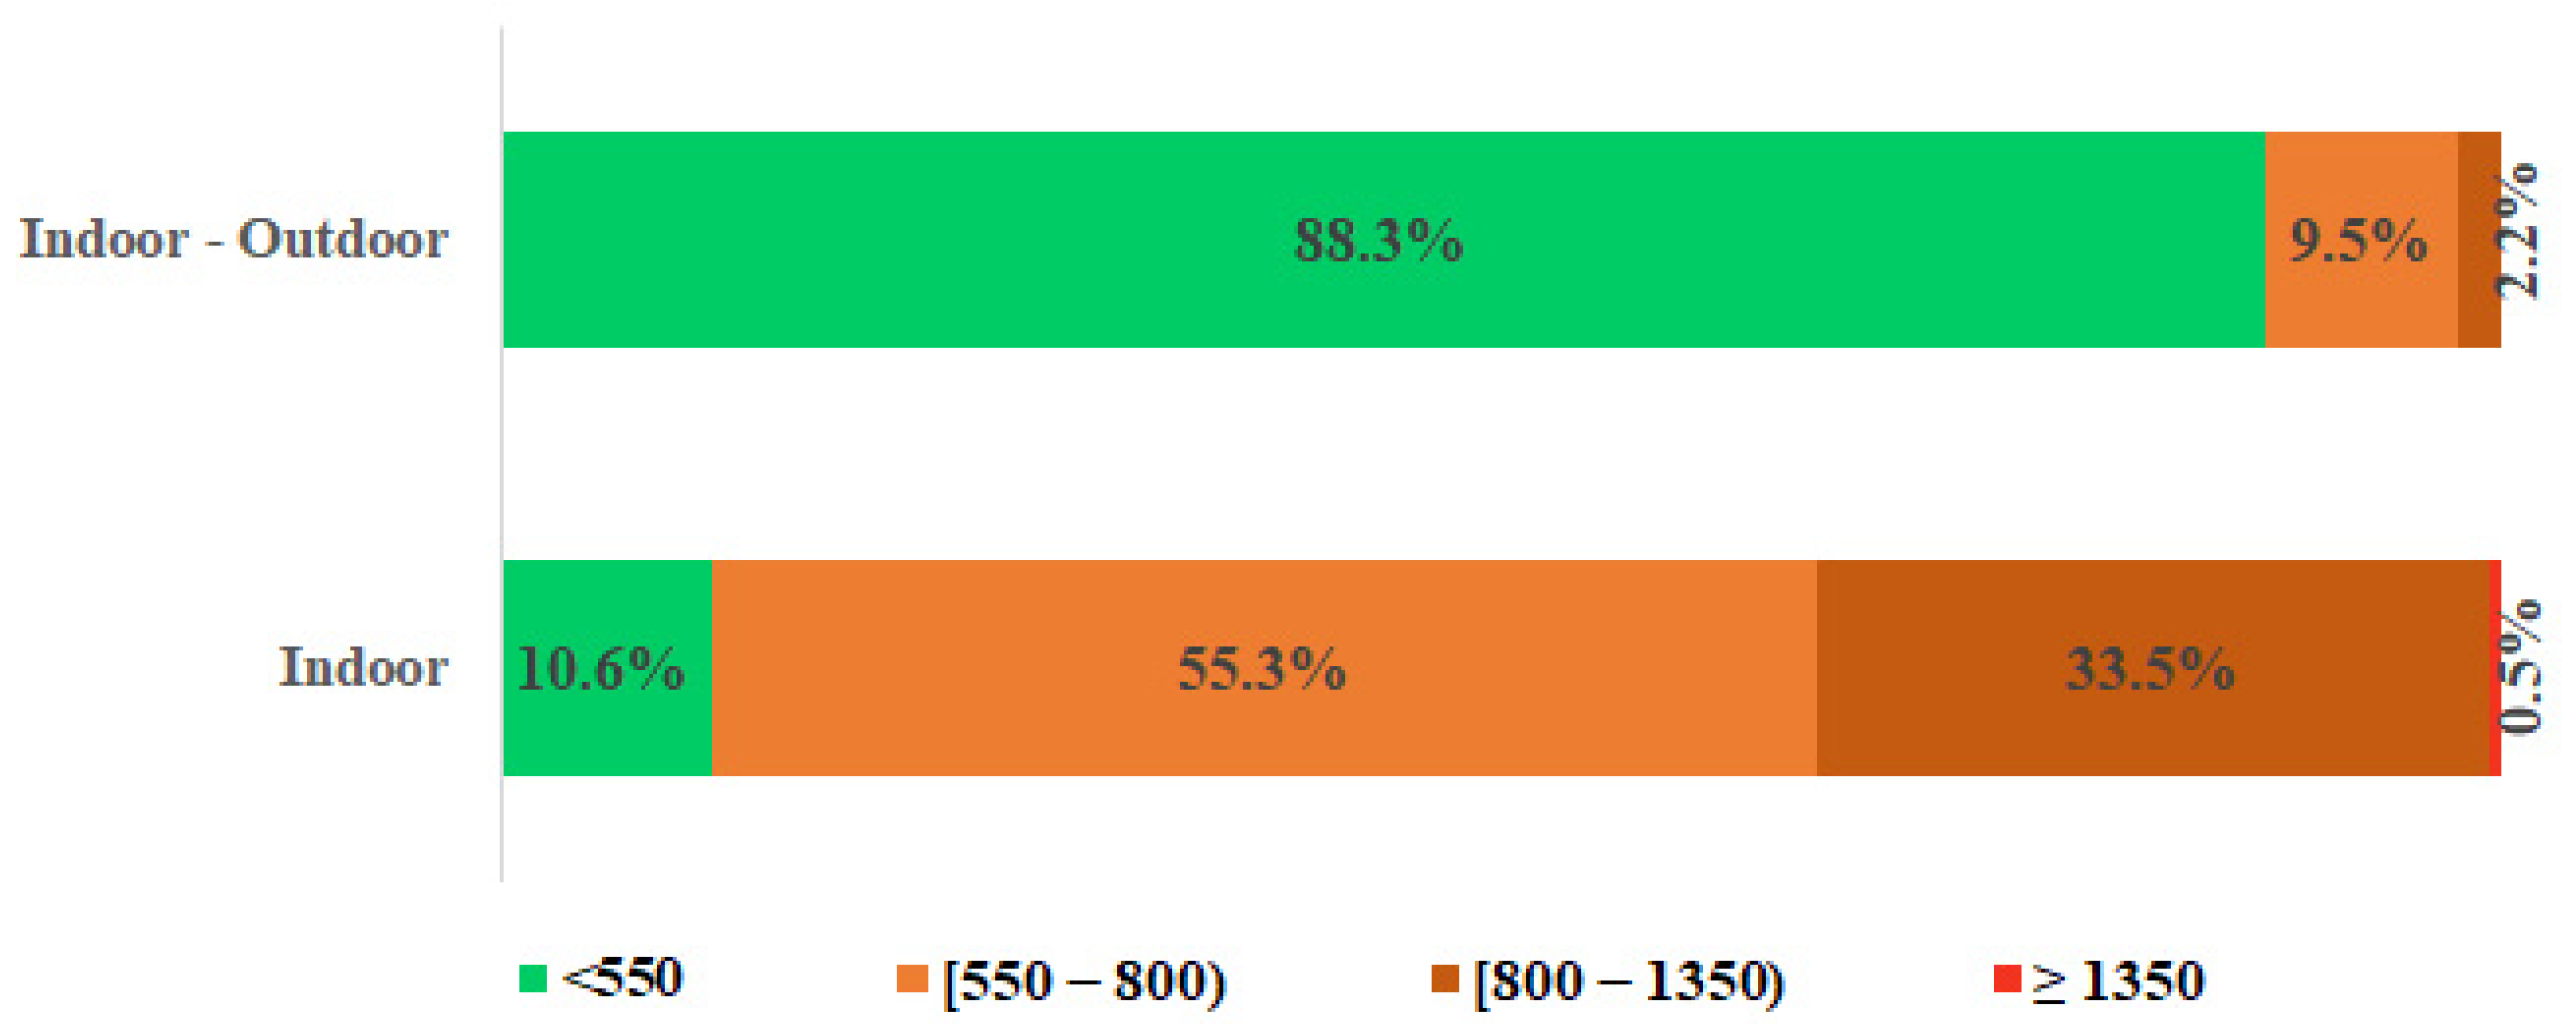
According to BAS EN 16798-1 [32], indoor air quality during the first measurement period was classified predominantly as Category I (88.3%), based on the difference between indoor and outdoor CO2 concentrations (Table 5 and Figure 8).
Table 5.
Indoor CO2 concentration categories during the first measurements.
Figure 8.
Distribution of indoor CO2 concentration categories during the first measurements.
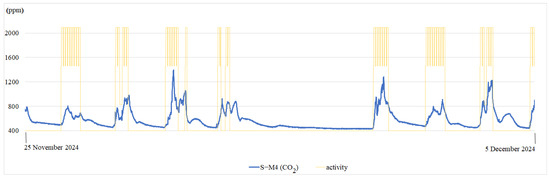
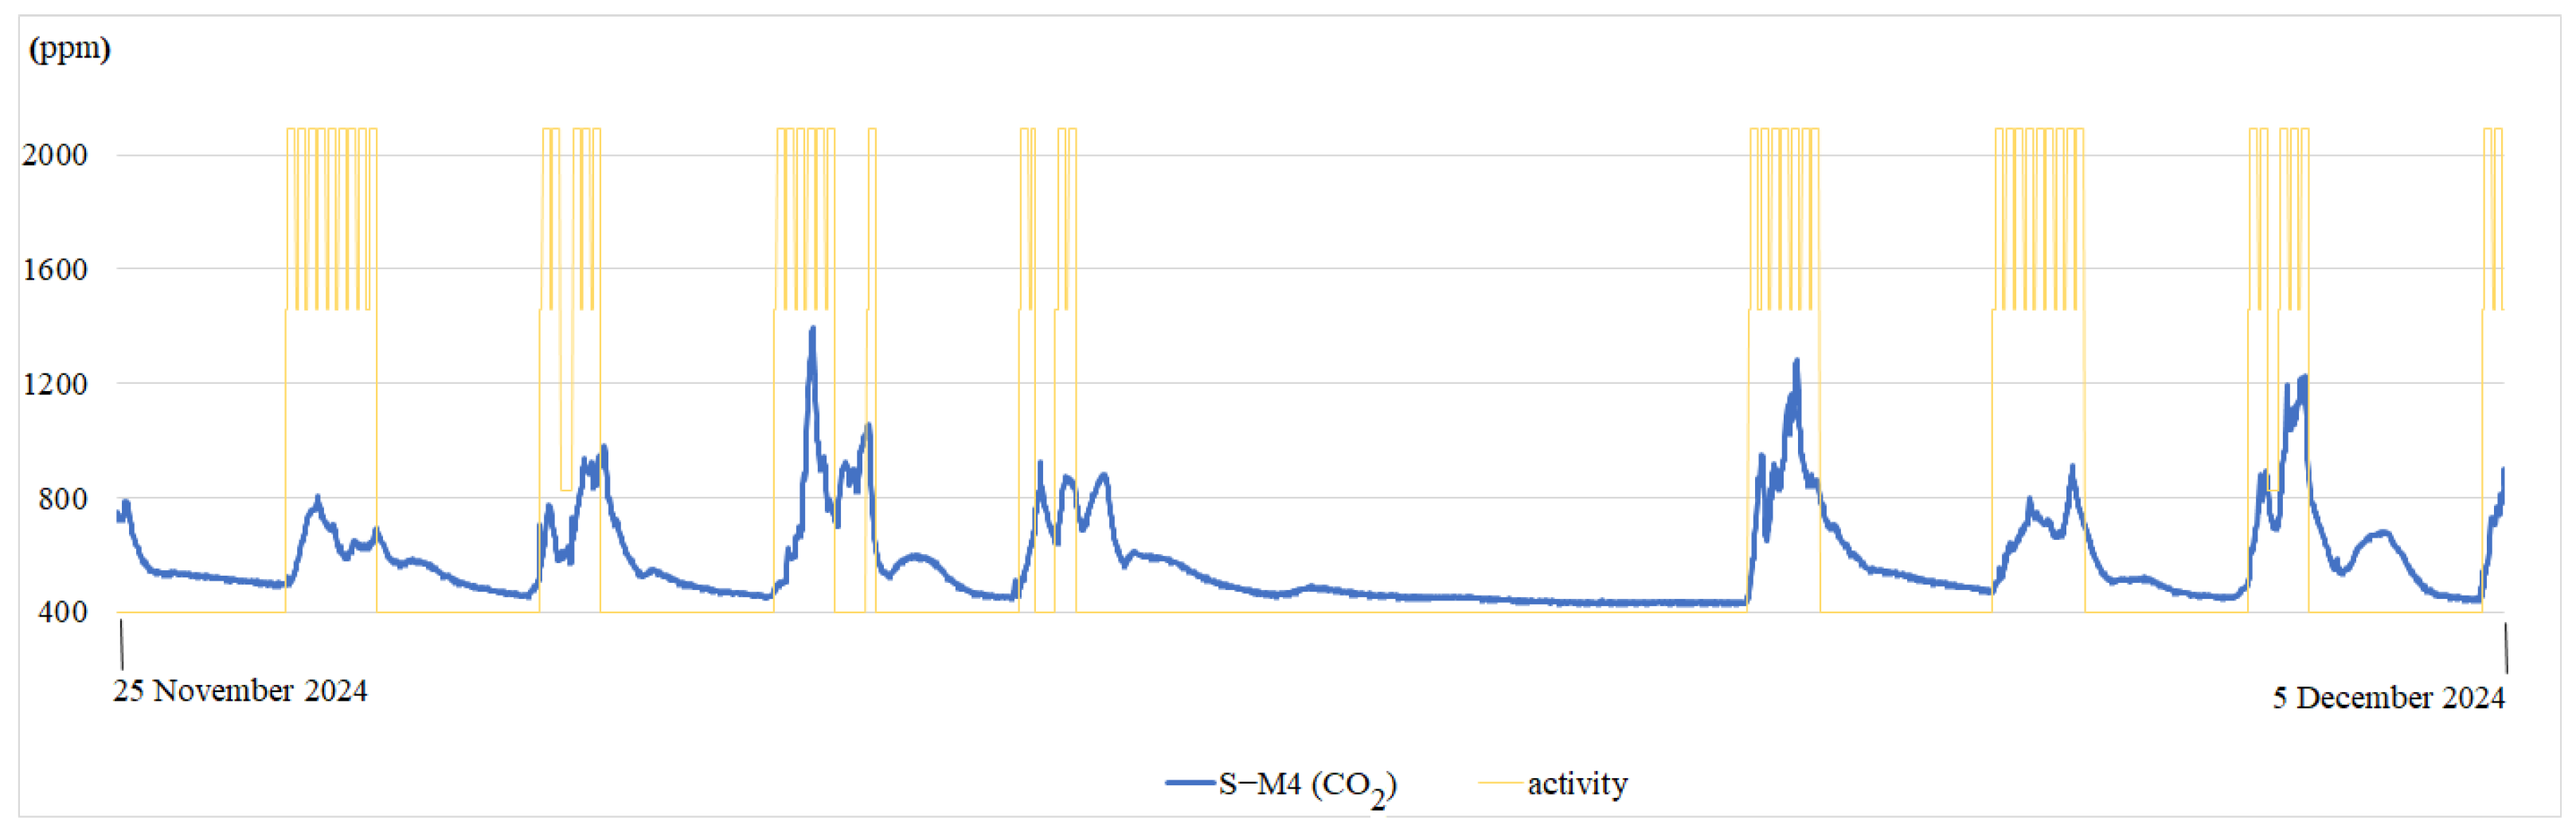
During the first measurement, the operating mode of the ventilation could not be determined. The operation of the ventilation system during the first campaign was not centrally controlled and depended on occupants’ manual intervention based on subjective perception of indoor air quality. Figure 9 represents the results of the CO2 measurements with horizontal lines presenting CO2 thresholds according to ASHRAE 62.1 and EN 16798-1 (green—550 ppm, orange—800 ppm, red—1350 ppm); yellow lines represent the period of activities in the amphitheater (classes—45 min and breaks—15 min); the blue line presents the measured CO2 concentration expressed in ppm (particles per million).
Figure 9.
Indoor CO2 concentration and ventilation operation during the first measurements.
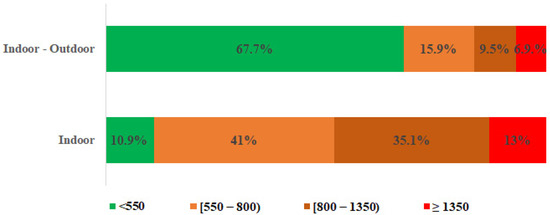
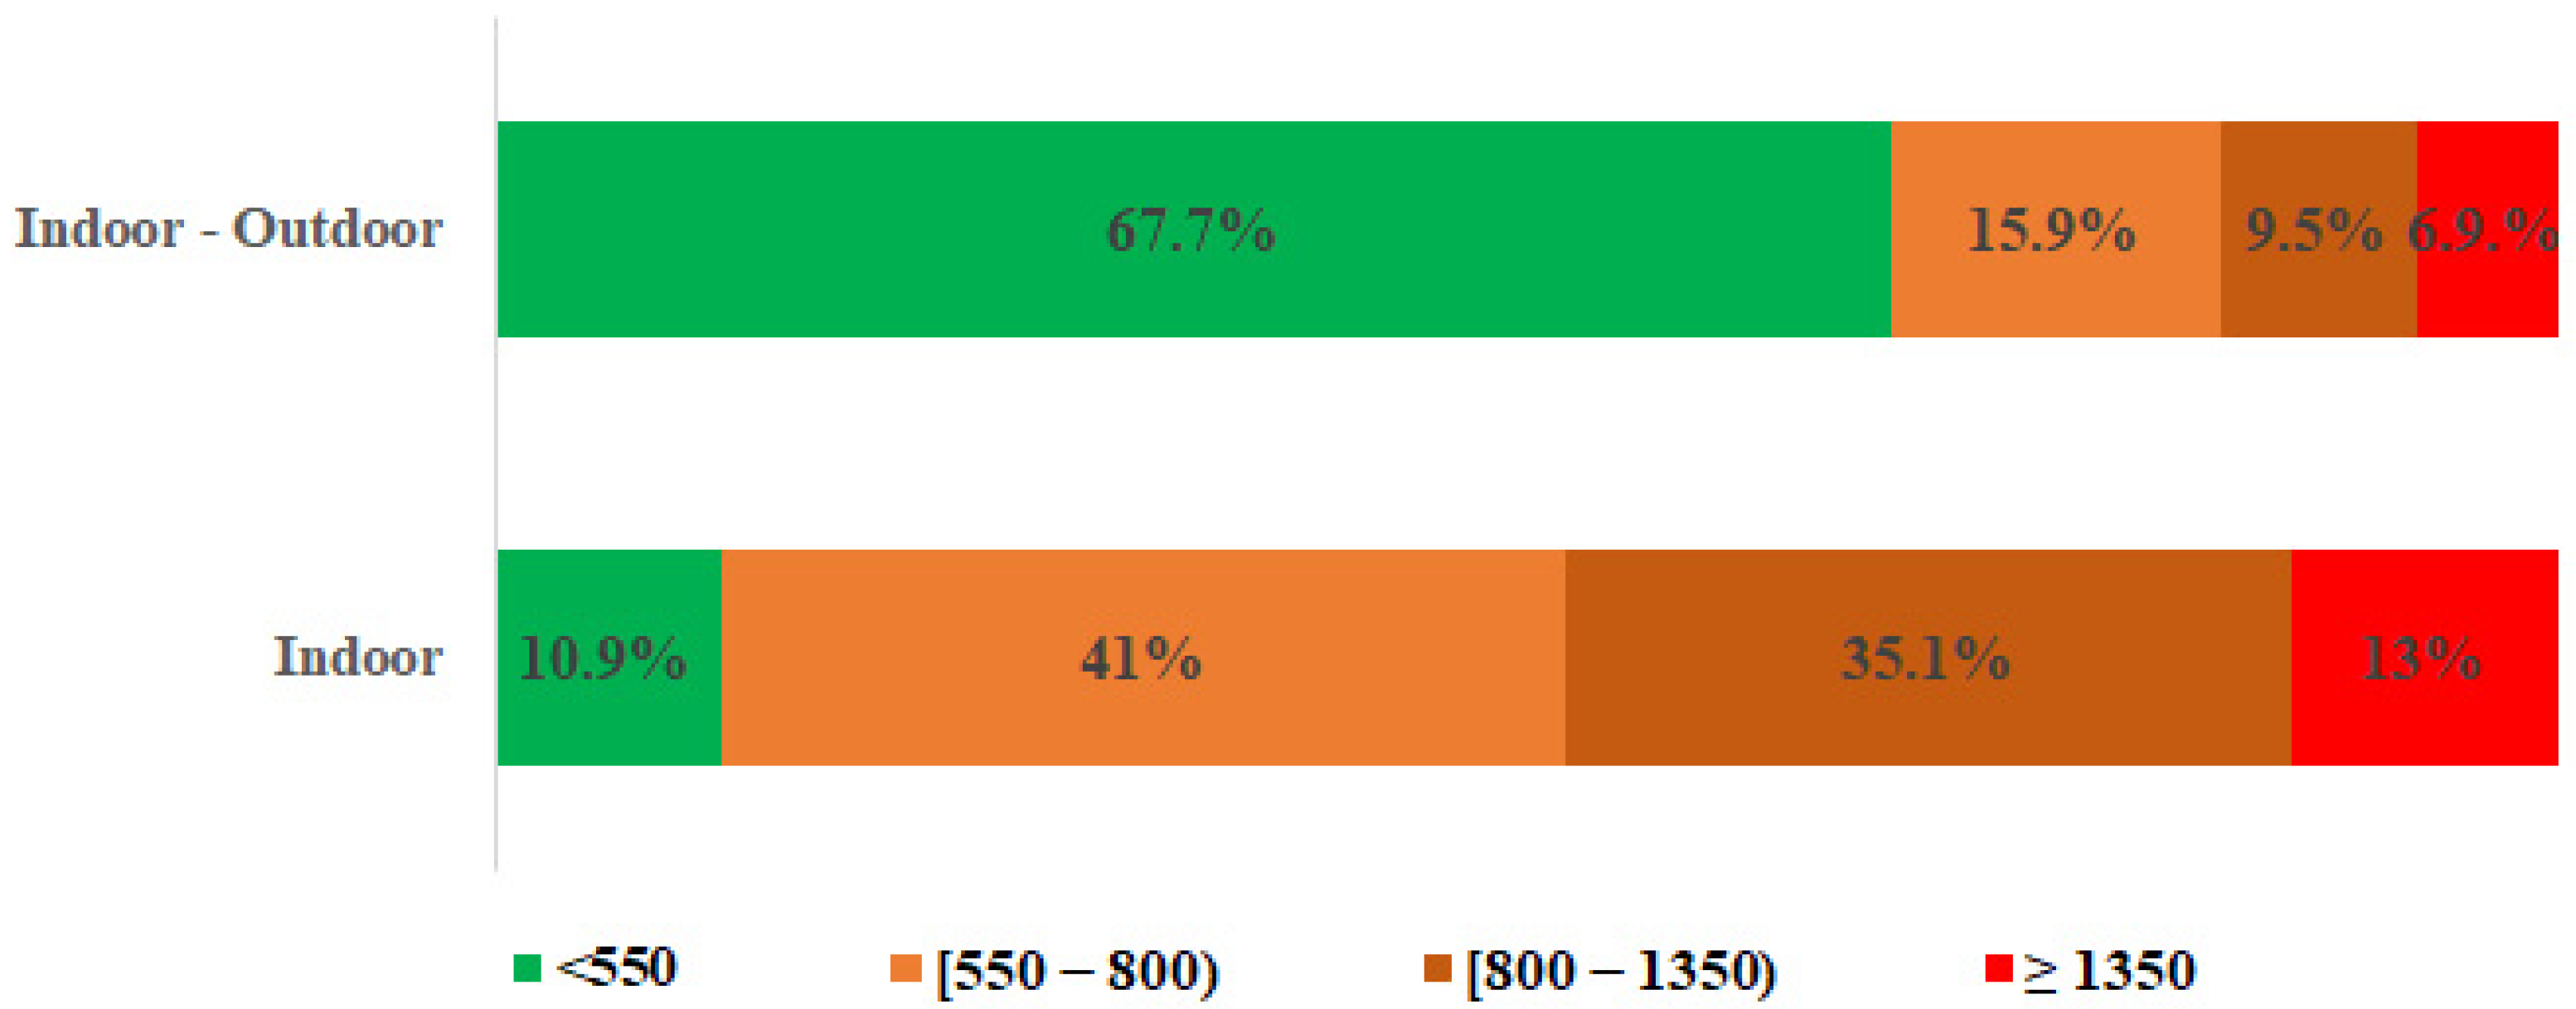
During the second measurement period (from 17 February to 1 March 2025), indoor air quality was predominantly classified as Category I (67.7%) and Category II (15.9%) according to BAS EN 16798-1, while Category III and IV conditions occurred less frequently (Table 6 and Figure 10).
Table 6.
Indoor CO2 concentration categories during the second measurements.
Figure 10.
Distribution of indoor CO2 concentration categories during the second measurements.
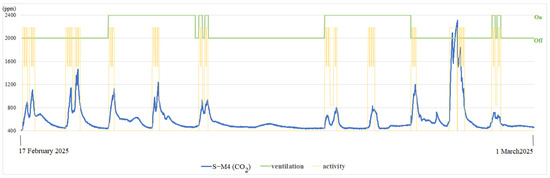
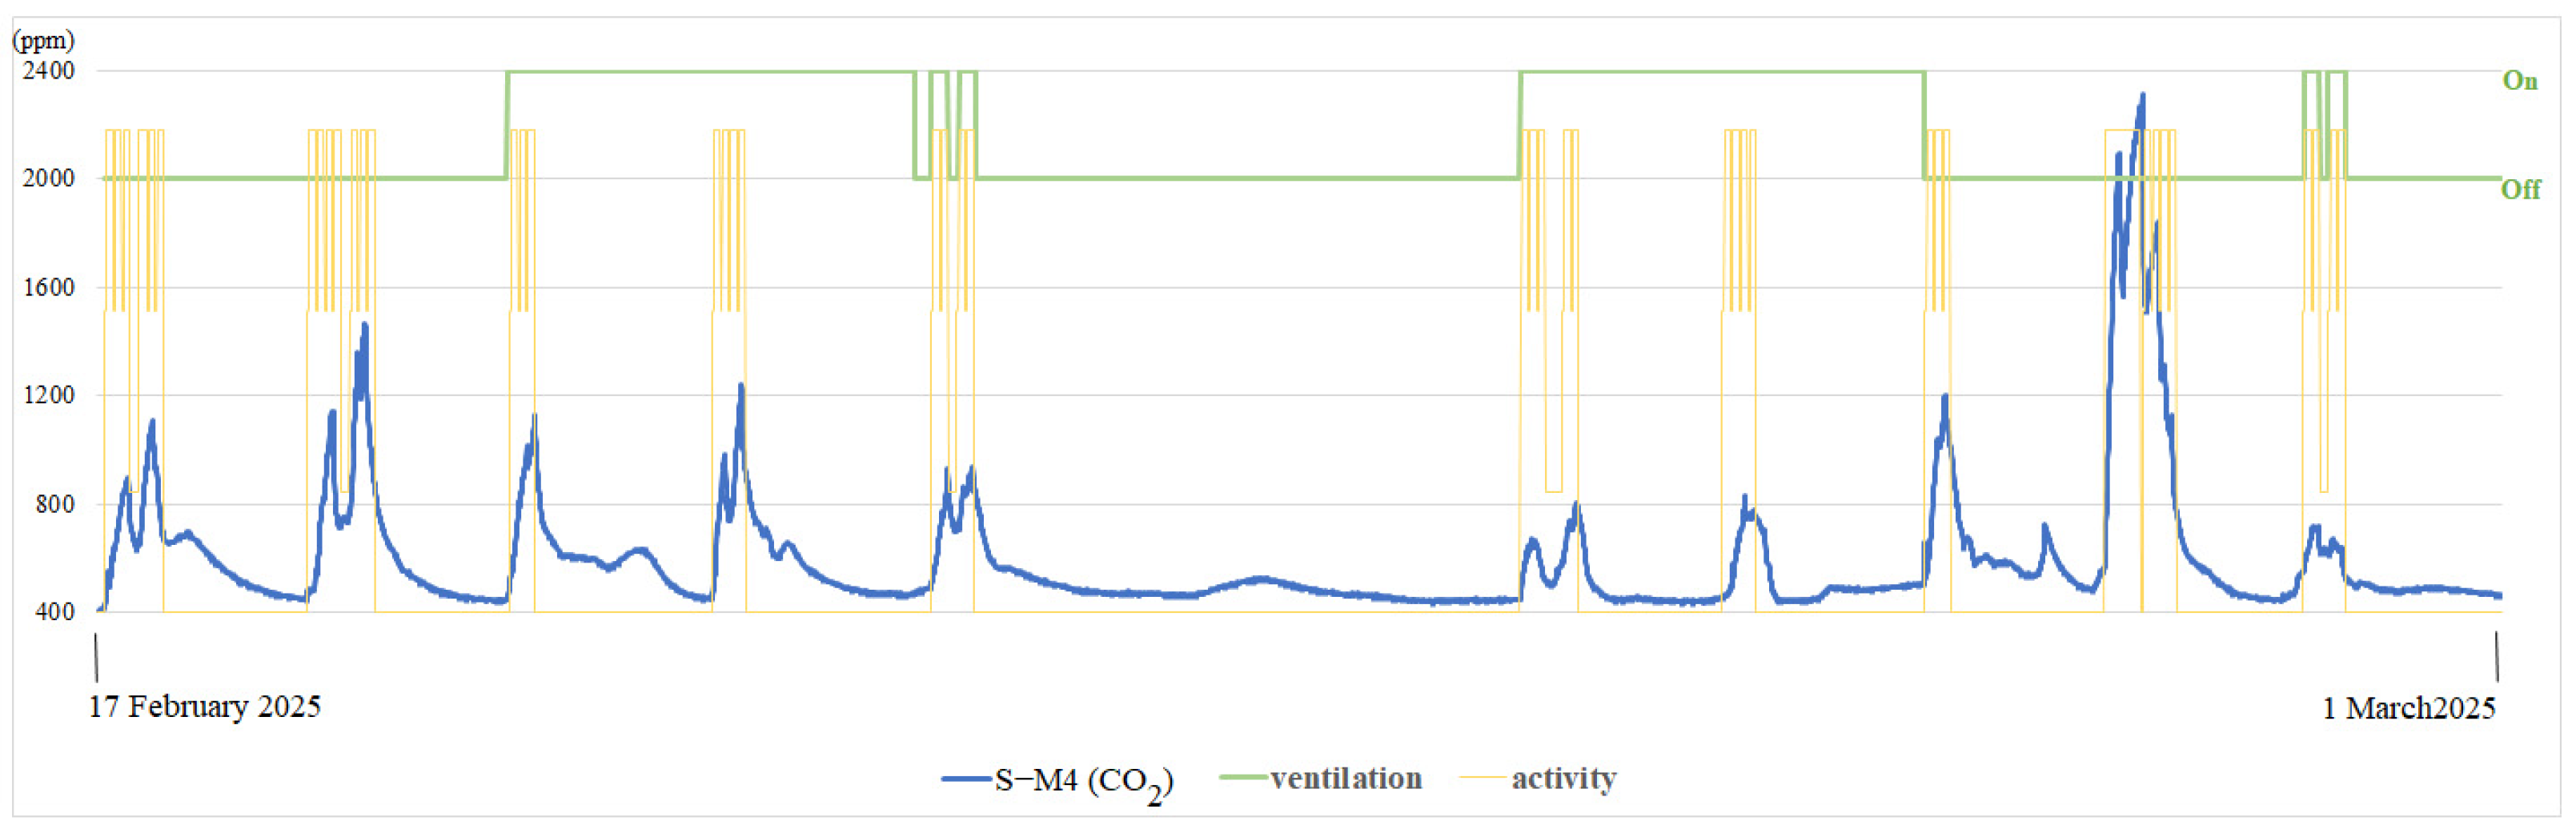
During the second measurement campaign, the ventilation operating mode was predefined. During the first week, the ventilation system was turned off for the first two days, operated continuously during the following two days, and activated only during lectures on the fifth day. During the second week, the ventilation system operated continuously during the first two days, remained turned off during the following two days, and was subsequently reactivated according to the teaching schedule.
According to Figure 11, the ventilation system was not always able to maintain indoor CO2 concentration below 800 ppm during occupied periods. The highest recorded concentration occurred during a seminar held on February 27, 2025, from 10:30 AM to 2:45 PM without scheduled breaks, with 78 occupants present while the ventilation system remained inactive.
Figure 11.
Indoor CO2 concentration and ventilation operation during the second measurements.
To ensure controlled operating conditions during both surveys, one teaching assistant was responsible for operating the ventilation system according to the predefined experimental regime. Door opening during lecture breaks represented the normal operating practice of the amphitheater and was not experimentally controlled, but occurred in a comparable manner during both measurement campaigns. Figure 9 and Figure 11 showed that the internal concentration of CO2 decreased during breaks (15 min breaks between the modules, when the doors were opened), in both cases, when ventilation was turned on and turned off.
Figure 7, Figure 9 and Figure 11 show that under low occupancy, when students spend less than four hours in the amphitheater, the large room volume prevents a significant increase in CO2 concentration. As a result, students’ satisfaction with indoor air quality remains high, indicating that the mechanical ventilation system could be turned off. However, with increasing occupancy, CO2 concentration rises rapidly, and the mechanical ventilation system should be activated. These results indicate that occupancy-based adjustment of the mechanical ventilation system may represent an effective approach for balancing indoor air quality and energy efficiency in large educational spaces [42]. This approach may improve occupants’ satisfaction with indoor air quality while providing the potential for more energy-efficient operation of the mechanical ventilation system.
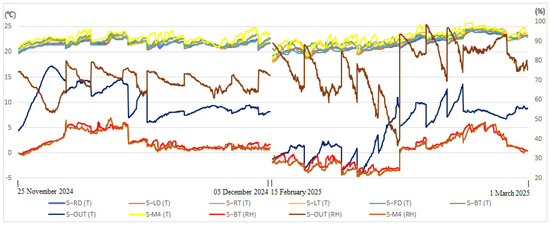
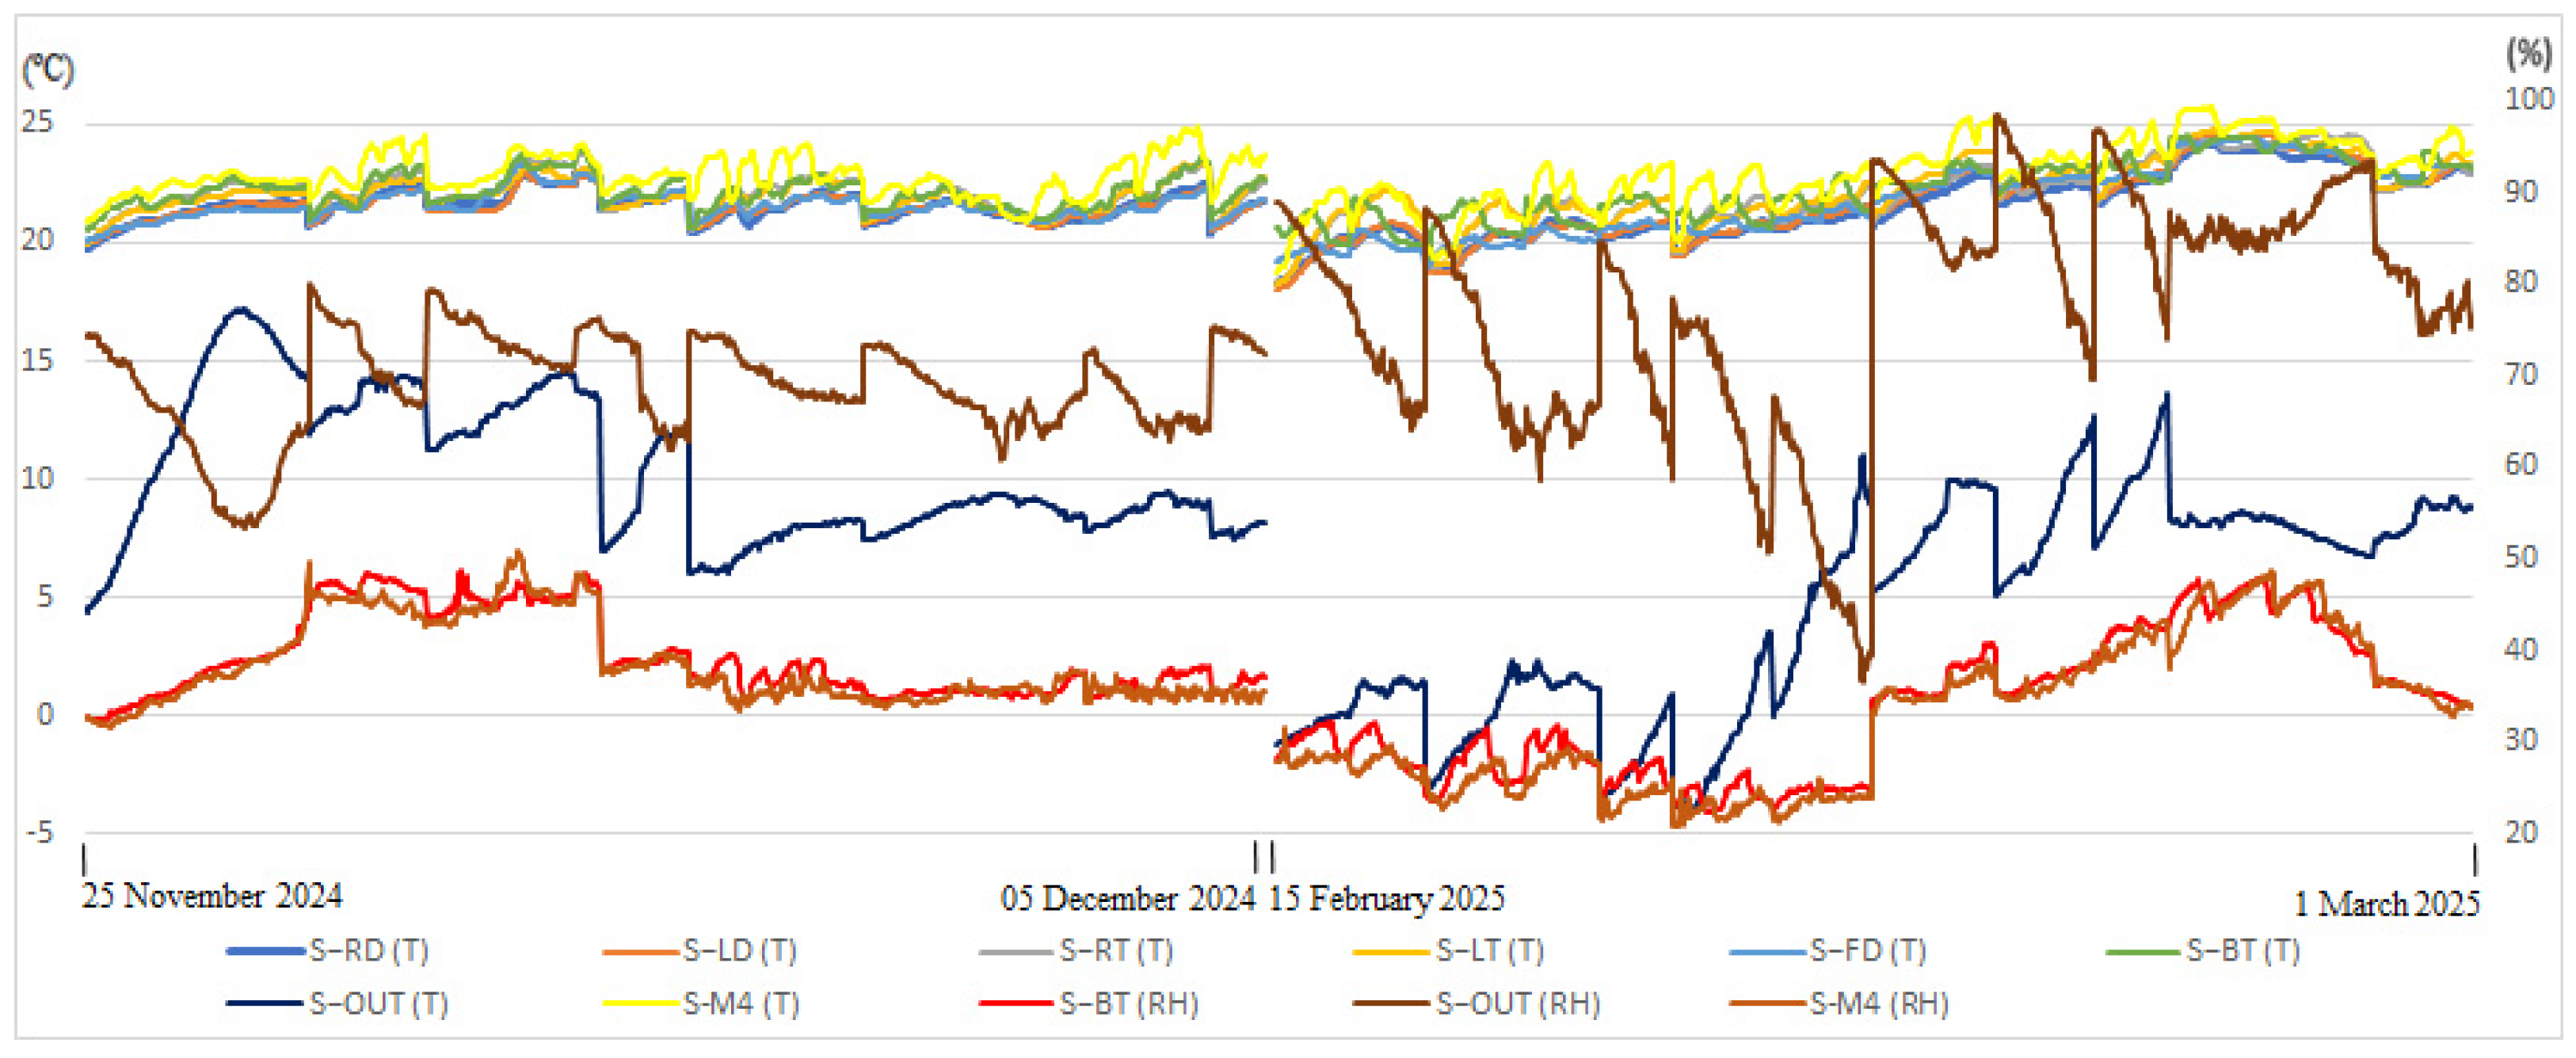
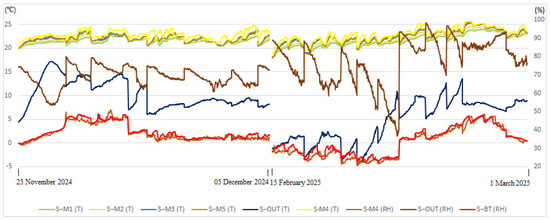
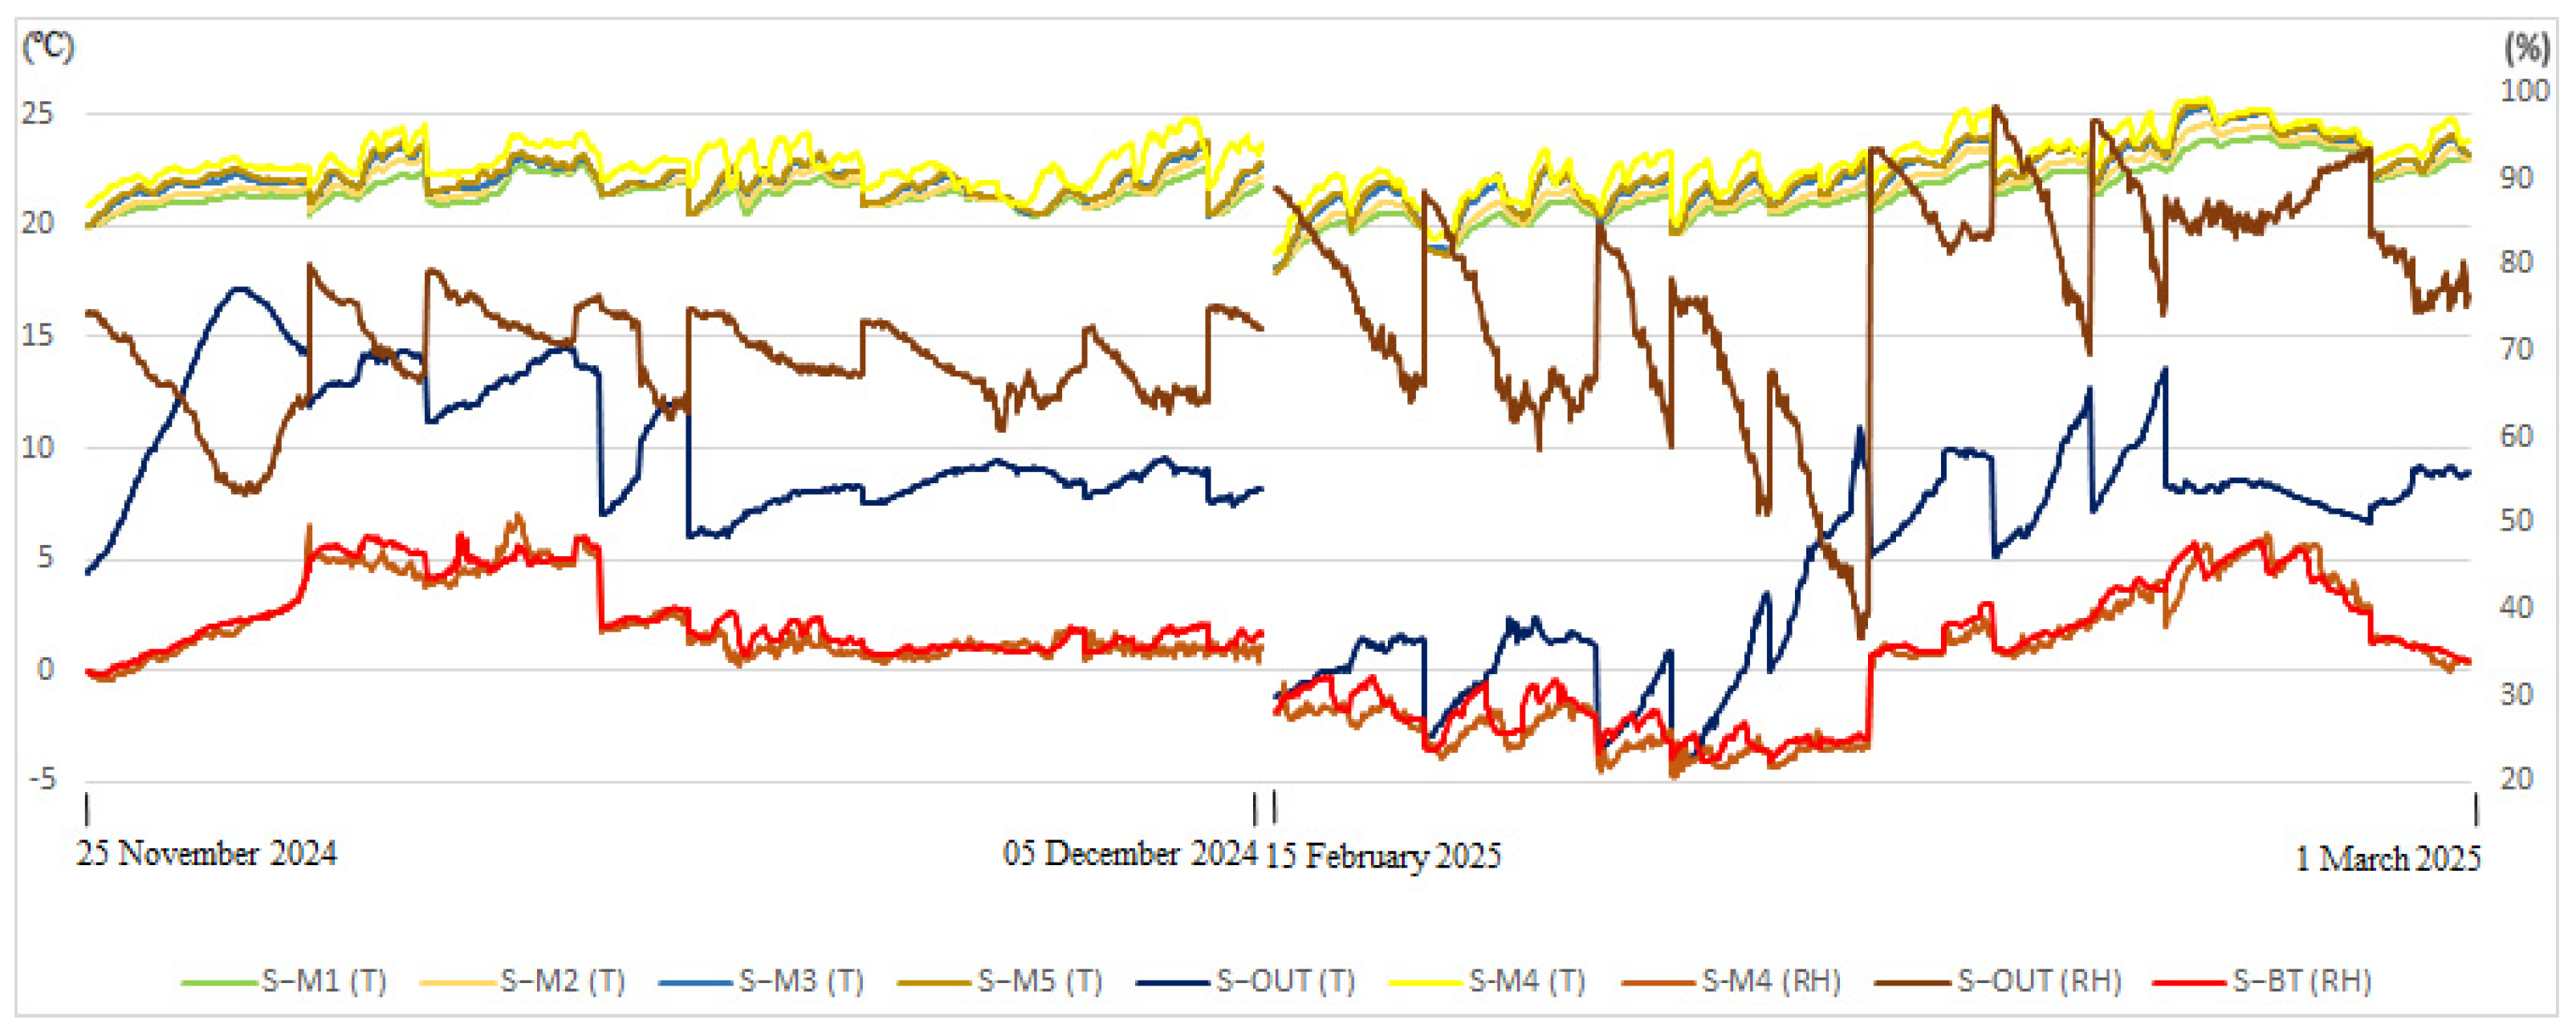
Air temperature was additionally analyzed as an important indicator of indoor environmental conditions. A total of 1921 measurements were made during the occupancy of the amphitheater (lecture modules and lecture breaks). The measured outdoor temperature ranged from −4.8 °C to 17.2 °C, with an average value of 7.29 °C and a median value of 8.1 °C. The highest measured temperature (22.89 °C) was measured in the S-M4 sensor, while the lowest temperature (21.54 °C) was measured on the S-RD sensor (Table 7, Figure 12). The measuring sensors were also put in the middle of the amphitheater, where the highest average temperature (22.25 °C) was measured on sensor S-M5, while the lowest average temperature (21.47 °C) was measured on sensor S-M1 (Table 8, Figure 13). According to the BAS EN 16798-1 standard [32], the measured temperature range of 21.54 –22.89 °C indicates the I category of the indoor environment in the amphitheater.
Table 7.
Air temperature and relative humidity measured at selected positions during the first and second measurements.
Figure 12.
Air temperature (T) and Relative Humidity (RH) changes during measurement, operation of ventilation, and presence of students/users according to Table 7.
Table 8.
Spatial distribution of measured environmental parameters during the occupancy of the amphitheater.
Figure 13.
Air temperature (T) and Relative Humidity (RH) changes during measurement, operation of ventilation, and presence of students/users according to Table 8.
Based on the estimated operative temperature values, the thermal conditions in the amphitheater were generally consistent with the comfort ranges defined for Category I indoor environments.
During the experiment, indoor air velocity was also measured (sensor S-M4); however, no significant values were detected. The values ranged from 0.0 to 0.1 m/s for the first measuring set and from 0.01 to 0.21 m/s for the second measuring set.
The lowest recorded relative humidity value in the amphitheater was 20.6% (sensor S−BT), while the highest recorded value was 50.94% (sensor S-M4). The measured outdoor relative humidity ranged from 36.7% to 98.7%.
Multiple linear regression analysis was performed to evaluate the relationship between indoor CO2 concentration and selected environmental and occupancy-related parameters. Due to a high correlation (>0.9) between the temperatures and relative humidity (RH) measured at S−BT and S−M4, not all variables were included in the regression model.
The regression model was statistically significant (F(4960) = 502.971, p < 0.001) and explained 67.7% of the variance in indoor CO2 concentration.
Among the analyzed variables, indoor air temperature measured at S−M3 showed the strongest association with indoor CO2 concentration, followed by outdoor temperature, relative humidity, and occupancy level.
The linear regression equation is:
CO2 = −4821.725 + 6.932 · number of students + 21.385 · S − M4 (RH) + 221.43 · S − M3 (T) − 70.855 · S − OUT (T)
The unique contribution of each of the four independent variables accounts for a total of 39.92% of the variability in CO2. Specifically, the variables S−OUT (T), S−M3 (T), S−M4 (RH), and the number of students uniquely explain 17.14%, 15.05%, 4.6%, and 3.13% of the variance in the S−M4 (CO2) values, respectively.
4. Conclusions
The main objective of this research was to investigate how different operational modes of a mechanical ventilation system affect indoor air quality and occupant perception in a university amphitheater. The results demonstrated that extended occupancy periods may lead to short-term exceedances of recommended CO2 concentration levels, particularly when the space is continuously occupied for more than four hours. Nevertheless, according to BAS EN 16798-1, the indoor environment was predominantly classified as Category I, with indoor–outdoor CO2 concentration differences remaining below 550 ppm during most of the measurement period.
The conducted surveys indicated that most students perceived the indoor air quality as acceptable under both ventilation operating modes, although user satisfaction was generally higher during periods with active mechanical ventilation. In addition, 67% of respondents reported that indoor air quality influenced their ability to concentrate. The measured temperature range corresponded to Category I indoor environmental conditions according to ISO 7730. Furthermore, the results suggest that, under reduced occupancy conditions, acceptable indoor air quality may also be maintained through natural ventilation by opening the amphitheater doors.
The findings highlight the importance of adapting ventilation operation to actual occupancy conditions in large educational spaces. Based on the findings of this study, ventilation control should combine occupancy information with continuous monitoring of indoor CO2 concentration in order to maintain the desired indoor air quality category according to BAS EN 16798-1 while avoiding unnecessary ventilation rates and associated energy consumption. The presented approach demonstrates the potential of occupancy-related ventilation strategies and demand-controlled ventilation concepts to improve indoor air quality while providing opportunities for more energy-efficient ventilation operation in university buildings. In this context, the study contributes to the growing body of research focused on operational optimization of ventilation systems under real occupancy conditions, particularly in educational buildings located in Southeast Europe.
Finally, several limitations of the present study should be acknowledged. In addition, the questionnaire survey was conducted among students attending a single university course, with a predominance of female respondents, and therefore the subjective perception results should not be generalized to the entire university student population. Mean radiant temperature was not directly measured during the experimental campaign, and operative temperature was therefore estimated based on standardized assumptions. Future studies should therefore include more comprehensive microclimatic monitoring, extended spatial measurements, and advanced thermal comfort assessment methods.
Author Contributions
Conceptualization, D.G., L.P. and M.K.; methodology, D.G. and B.A.; software, L.P. and S.P.; validation, M.P., J.K., D.G., M.K. and L.P.; formal analysis, L.P.; investigation, M.K., D.G.; resources, P.G. and S.Č.; data curation, L.P.; writing—original draft preparation, M.K., D.G. and S.P.; writing—review and editing, S.P. and B.A.; visualization, L.P.; supervision, P.G. and S.Č.; project administration, M.K.; funding acquisition, P.G. All authors have read and agreed to the published version of the manuscript.
Funding
This research was funded by the European Research Executive Agency (REA) under the project “ENPOWER—Enhancing Scientific Capacity for Energy Poverty” (Grant Agreement No. 101160253, HORIZON-WIDERA-2023-ACCESS-02).
Institutional Review Board Statement
The study involved anonymous surveys of adult university students regarding thermal comfort perception in a university amphitheatre. The research was non-invasive and posed minimal risk to participants. No sensitive or identifying personal data were collected. According to the institutional regulations of the University of Banja Luka, this type of minimal-risk, anonymous research does not require formal approval from an institutional ethics committee. All procedures were conducted in accordance with applicable data protection regulations.
Informed Consent Statement
Participants were informed about the purpose and voluntary nature of the study prior to participation. Completion of the anonymous questionnaire was considered as implied informed consent. No identifying personal data were collected, and participants were free to withdraw at any time without consequences.
Data Availability Statement
The original contributions presented in this study are included in the article. Further inquiries can be directed to the corresponding author.
Conflicts of Interest
The authors declare no conflict of interest.
Disclaimer
Funded by the European Union. Views and opinions expressed are, however, those of the authors only and do not necessarily reflect those of the European Union or European Research Executive Agency (REA). Neither the European Union nor the granting authority can be held responsible for them.
References
- Tran, V.V.; Park, D.; Lee, Y.C. Indoor Air Pollution, Related Human Diseases, and Recent Trends in the Control and Improvement of Indoor Air Quality. Int. J. Environ. Res. Public Health 2020, 17, 2927. [Google Scholar] [CrossRef] [Scilit] [PubMed]
- Azuma, K.; Kagi, N.; Yanagi, U.; Osawa, H. Effects of Low-Level Inhalation Exposure to Carbon Dioxide in Indoor Environments: A Short Review on Human Health and Psychomotor Performance. Environ. Int. 2018, 121, 51–56. [Google Scholar] [CrossRef] [Scilit] [PubMed]
- World Health Organization. Indoor Air Pollution: National Burden of Disease Estimates; World Health Organization: Geneva, Switzerland, 2007. [Google Scholar]
- Jones, A.P. Indoor Air Quality and Health. Atmos. Environ. 1999, 33, 4535–4564. [Google Scholar] [CrossRef] [Scilit]
- Mannan, M.; Al-Ghamdi, S.G. Indoor Air Quality in Buildings: A Comprehensive Review on the Factors Influencing Air Pollution in Residential and Commercial Structure. Int. J. Environ. Res. Public Health 2021, 18, 3276. [Google Scholar] [CrossRef] [Scilit] [PubMed]
- Tham, K.W. Indoor Air Quality and Its Effects on Humans—A Review of Challenges and Developments in the Last 30 Years. Energy Build. 2016, 130, 637–650. [Google Scholar] [CrossRef] [Scilit]
- ASHRAE. Guideline 10P: Interactions Affecting the Achievement of Acceptable Indoor Environments, Second Public Review; ASHRAE: Atlanta, GA, USA, 2010. [Google Scholar]
- Sarkhosh, M.; Najafpoor, A.A.; Alidadi, H.; Shamsara, J.; Amiri, H.; Andrea, T.; Kariminejad, F. Indoor Air Quality Associations with Sick Building Syndrome: An Application of Decision Tree Technology. Build. Environ. 2021, 188, 107446. [Google Scholar] [CrossRef] [Scilit]
- Berglund, B.; Brunekreef, B.; Knöppe, H.; Lindvall, T.; Maroni, M.; Mølhave, L.; Skov, P. Effects of Indoor Air Pollution on Human Health. Indoor Air 1992, 2, 2–25. [Google Scholar] [CrossRef] [Scilit]
- Yang, W.; Sohn, J.; Kim, J.; Son, B.; Park, J. Indoor Air Quality Investigation According to Age of the School Buildings in Korea. J. Environ. Manag. 2009, 90, 348–354. [Google Scholar] [CrossRef] [Scilit] [PubMed]
- Bakó-Biró, Z.; Clements-Croome, D.J.; Kochhar, N.; Awbi, H.B.; Williams, M.J. Ventilation Rates in Schools and Pupils’ Performance. Build. Environ. 2012, 48, 215–223. [Google Scholar] [CrossRef] [Scilit]
- Bruce, N.; Perez-Padilla, R.; Albalak, R. Indoor Air Pollution in Developing Countries: A Major Environmental and Public Health Challenge. Bull. World Health Organ. 2000, 78, 1078–1092. [Google Scholar] [PubMed]
- Mendell, M.J.; Heath, G.A. Do Indoor Pollutants and Thermal Conditions in Schools Influence Student Performance? A Critical Review of the Literature. Indoor Air 2005, 15, 27–52. [Google Scholar] [CrossRef] [Scilit] [PubMed]
- Mazurek, J.M.; Filios, M.; Willis, R.; Rosenman, K.D.; Reilly, M.J.; McGreevy, K.; Harrison, R. Work-Related Asthma in the Educational Services Industry. Am. J. Ind. Med. 2008, 51, 47–59. [Google Scholar] [CrossRef] [Scilit] [PubMed]
- Norhidayah, A.; Chia-Kuang, L.; Azhar, M.K.; Nurulwahida, S. Indoor Air Quality and Sick Building Syndrome in Three Selected Buildings. Procedia Eng. 2013, 53, 93–98. [Google Scholar] [CrossRef] [Scilit]
- Baloch, R.M.; Maesano, C.N.; Christoffersen, J.; Banerjee, S.; Gabriel, M.; Csobod, É.; Dewolf, M.C. Indoor Air Pollution, Physical and Comfort Parameters Related to Schoolchildren’s Health: Data from the European SINPHONIE Study. Sci. Total Environ. 2020, 739, 139870. [Google Scholar] [CrossRef] [Scilit] [PubMed]
- Mansor, A.A.; Abdullah, S.; Ahmad, A.N.; Ahmed, A.N.; Zulkifli, M.F.R.; Jusoh, S.M.; Ismail, M. Indoor Air Quality and Sick Building Syndrome Symptoms in Administrative Offices at a Public University. Dialogues Health 2024, 4, 100178. [Google Scholar] [CrossRef] [Scilit] [PubMed]
- Hameen, E.C.; Ken-Opurum, B.; Priyadarshini, S.; Lartigue, B.; Anath-Pisipati, S. Effects of School Facilities Mechanical and Plumbing Characteristics and Conditions on Student Attendance, Academic Performance and Health. In International Conference on Green Building; WASET: Al Ain, United Arab Emirates, 2020; Volume 14, pp. 193–201. [Google Scholar]
- Kozielska, B.; Brągoszewska, E.; Kaleta, D. Investigation of Indoor Air Quality in Offices and Residential Homes in an Urban Area of Poland. Air Qual. Atmos. Health 2020, 13, 131–141. [Google Scholar] [CrossRef] [Scilit]
- Kwon, M.; Remøy, H.; van den Dobbelsteen, A.; Knaack, U. Personal Control and Environmental User Satisfaction in Office Buildings: Results of case studies in the Netherlands. Build. Environ. 2019, 149, 428–435. [Google Scholar] [CrossRef] [Scilit]
- Qiu, Y.; Wang, Y.; Tang, Y. Investigation of indoor air quality in six office buildings in Chengdu, China based on field measurements. Build. Simul. 2020, 13, 1009–1020. [Google Scholar] [CrossRef] [Scilit]
- Turanjanin, V.; Vučićević, B.; Jovanović, M.; Mirkov, N.; Lazović, I. Indoor CO2 Measurements in Serbian Schools and Ventilation Rate Calculation. Energy 2014, 77, 290–296. [Google Scholar] [CrossRef] [Scilit]
- Persily, A.K. Evaluating Building IAQ and Ventilation with Carbon Dioxide. ASHRAE Trans. 1997, 103, 193–204. [Google Scholar]
- Kabir, M.; Habiba, U.E.; Khan, W.; Shah, A.; Rahim, S.; Patricio, R.; Shafiq, M. Climate Change Due to Increasing concentration of carbon dioxide and its impacts on the environment in the 21st century; a mini review. J. King Saud. Univ.—Sci. 2023, 35, 102693. [Google Scholar] [CrossRef] [Scilit]
- Wang, W.; Shan, X.; Hussain, S.A.; Wang, C.; Ji, Y. Comparison of Multi-Control Strategies for the Control of Indoor Air Temperature and CO2 with OpenModelica Modeling. Energies 2020, 13, 4425. [Google Scholar] [CrossRef] [Scilit]
- Haverinen-Shaughnessy, U.; Moschandreas, D.J.; Shaughnessy, R.J. Association between substandard classroom ventilation rates and students’ academic achievement. Indoor Air 2011, 21, 121–131. [Google Scholar] [CrossRef] [Scilit] [PubMed]
- Brink, H.W.; Loomans, M.G.; Mobach, M.P.; Kort, H.S. Classrooms’ indoor environmental conditions affecting the academic achievement of students and teachers in higher education: A systematic literature review. Indoor Air 2021, 31, 405–425. [Google Scholar] [CrossRef] [Scilit] [PubMed]
- Shendell, D.G.; Prill, R.; Fisk, W.J.; Apte, M.G.; Blake, D.; Faulkner, D. Associations between classroom CO2 concentrations and student attendance in Washington and Idaho. Indoor Air 2004, 14, 333–341. [Google Scholar] [CrossRef] [Scilit] [PubMed]
- Norbäck, D.; Björnsson, E.; Janson, C.; Widström, J.; Boman, G. Asthmatic symptoms and volatile organic compounds, formaldehyde, and carbon dioxide in dwellings. Occup. Environ. Med. 1995, 52, 388–395. [Google Scholar] [CrossRef] [Scilit] [PubMed]
- Seppänen, O.A.; Fisk, W.J.; Mendell, M.J. Association of Ventilation Rates and CO2 Concentrations with Health Responses. Indoor Air 1999, 9, 226–252. [Google Scholar] [CrossRef] [Scilit] [PubMed]
- Antunović, B.; Janković, A.; Gajić, D.; Antović, N.; Rašović, J.; Ćurguz, Z.; Popović, M. The First Test of Indoor Air Quality in Kindergartens of the Republic of Srpska. Therm. Sci. 2024, 28, 2565–2578. [Google Scholar] [CrossRef] [Scilit]
- BAS EN 16798-1:2020; Energy Performance of Buildings—Ventilation for Buildings—Part 1: Indoor Environmental Input Parameters for Design and Assessment of Energy Performance of Buildings Addressing Indoor Air Quality, Thermal Environment, Lighting and Acoustics—Module M1-6. European Committee for Standardization: Brussels, Belgium, 2020.
- BAS EN ISO 7730:2010; Ergonomics of the Thermal Environment—Analytical Determination and Interpretation of Thermal Comfort Using Calculation of the PMV and PPD Indices and Local Thermal Comfort Criteria. European Committee for Standardization: Brussels, Belgium, 2010.
- Li, X.; Xiong, J.; Zhang, Q.; Wang, Q. Analysis of Indoor Air Quality and Fresh Air Energy Consumption Based on Students’ Learning Efficiency under Different Ventilation Methods by Modelica. Energies 2024, 17, 4613. [Google Scholar] [CrossRef] [Scilit]
- Berouine, A.; Ouladsine, R.; Bakhouya, M.; Essaaidi, M. Towards a Real-Time Predictive Management Approach of Indoor Air Quality in Energy-Efficient Buildings. Energies 2020, 13, 3246. [Google Scholar] [CrossRef] [Scilit]
- Fisk, W.J. The Ventilation Problem in Schools: Literature Review. Indoor Air 2017, 27, 1039–1051. [Google Scholar] [CrossRef] [Scilit] [PubMed]
- Hattori, S.; Iwamatsu, T.; Miura, T.; Tsutsumi, F.; Tanaka, N. Investigation of indoor air quality in residential buildings by measuring CO2 Concentration and a Questionnaire survey. Sensors 2022, 22, 7331. [Google Scholar] [CrossRef] [Scilit] [PubMed]
- Skiba, M.; Mrówczyńska, M.; Leśniak, A.; Rzeszowska, N.; Janowiec, F.; Sztubecka, M.; Błaszczak-Bak, W.; Kazak, J.K. Implication of the EU Countries’ Energy Policy Concerning Scenarios Affecting the Air Quality Improvement. Energies 2024, 17, 3892. [Google Scholar] [CrossRef] [Scilit]
- Peulić, S.; Janković, A.; Gajić, D.; Čvoro, S.; Antunović, B. Energy performance of the educational building envelope according to a passive and low-energy standard. In Proceedings of International Scientific Conference on Contemporary Theory and Practice in Construction XIII; University of Banja Luka: Banja Luka, Bosnia and Herzegovina, 2018; pp. 179–188. [Google Scholar] [CrossRef]
- ANSI/ASHRAE 62.1-2021; American Society of Heating, Refrigerating and Air-Conditioning Engineers, Ventilation for Acceptable Indoor Air Quality. American Society of Heating, Refrigerating and Air-Conditioning: Peachtree Corners, GA, USA, 2021.
- BAS EN ISO 7726:2010; Ergonomics of the Thermal Environment—Instruments for Measuring Physical Quantities. European Committee for Standardization: Brussels, Belgium, 2010.
- Ferdyn-Grygierek, J.; Grygierek, K. Ventilation Methods for Improving the Indoor Air Quality and Energy Efficiency of Multi-Family Buildings in Central Europe. Energies 2024, 17, 2232. [Google Scholar] [CrossRef] [Scilit]




Disclaimer/Publisher’s Note: The statements, opinions and data contained in all publications are solely those of the individual author(s) and contributor(s) and not of MDPI and/or the editor(s). MDPI and/or the editor(s) disclaim responsibility for any injury to people or property resulting from any ideas, methods, instructions or products referred to in the content. |
© 2026 by the authors. Licensee MDPI, Basel, Switzerland. This article is an open access article distributed under the terms and conditions of the Creative Commons Attribution (CC BY) license.