


Abstract
As urban renewal shifts from expansion-led development toward quality improvement of existing urban areas, the restorative quality of urban village public spaces has become an important concern in high-density human settlements. Existing restorative environment research has focused mainly on parks, green spaces, waterfronts, and other settings with strong natural attributes, while audio–visual studies have often examined environmental perception, restorative appraisal, or physiological response as separate analytical components. Limited evidence therefore exists on how scene-level visual and acoustic characteristics, subjective sensory appraisal, perceived restoration, and short-term physiological responses are related within the same analytical framework in high-density urban village public spaces. This study investigated six selected public spaces in Shenzhen urban villages using a VR-based repeated-measures experiment involving 33 participants and 198 participant–scene observations, together with computer vision indicators, psychoacoustic analysis, subjective evaluation, EDA and HRV monitoring, linear mixed-effects models, and multilevel models of statistical indirect associations. Green view index (B = 0.322, p < 0.001) and color complexity (B = 0.422, p < 0.001) were positively associated with perceived restoration, whereas building enclosure (B = −0.271, p < 0.001) and sound roughness (B = −0.328, p < 0.001) were negatively associated with perceived restoration. Green view index showed a positive indirect association with perceived restoration through visual perception (ab = 0.386, 95% CI [0.304, 0.484]), whereas roughness showed a negative indirect association through soundscape perception (ab = −0.277, 95% CI [−0.385, −0.176]). In the full six-scene models, negative objective interaction estimates were compatible with acoustic constraints on favorable visual associations, but several interaction coefficients were sensitive to scene omission and should be regarded as exploratory; at the subjective level, soundscape perception and visual perception showed a positive interaction (B = 0.095, p = 0.028). Leave-one-scene-out analysis showed that several scene-level main-effect and objective interaction estimates were sensitive to the omission of S5 or S2, whereas the directions of the green-view-index and roughness indirect associations were retained. Perceived restoration was positively correlated with the reversed EDA recovery score (r = 0.416, p < 0.001), whereas HRV showed a negative association with LAeq (B = −0.150, p = 0.008), suggesting different short-term response patterns across subjective and physiological measures. The findings suggest that restorative responses in the examined urban village scenes were associated with both subjective sensory appraisal and audio–visual interactions. The study contributes by integrating scene-level visual and acoustic characteristics, subjective sensory appraisal, perceived restoration, and short-term physiological responses within a high-density urban village context. For renewal practice, the results support the coordinated consideration of adverse sound sources, visible greenness, and visual order; however, the observed relationships should be interpreted as context-specific associations rather than as universal causal mechanisms or validated design thresholds.
1. Introduction
Urban renewal is gradually shifting from expansion-oriented development to the quality improvement of existing built environments. Within this transition, the quality of public spaces in high-density built environments has become an important concern across architecture, urban design, and healthy human settlement research. Public spaces not only support circulation, lingering, social interaction, and leisure but also continuously influence users’ emotional states, stress recovery, and psychological and physiological well-being in everyday use. Urban villages are a distinctive spatial type formed during rapid urbanization and are commonly characterized by high building density, scarce public space, functional mixture, strong population mobility, and highly mixed everyday activities. Although limited in area, their public spaces accommodate circulation, commerce, neighborhood interaction, temporary rest, community identity, and everyday services. Environmental quality in urban village public spaces is therefore not merely a matter of landscape beautification or facility provision; it is closely related to everyday restorative experience and health support in high-density human settlements. More broadly, urban-renewal performance should be assessed not only through physical upgrading but also in relation to liveability, population health, social inclusion, public-space vitality, and access to supportive environments [1,2]. Geospatial assessment, data analytics, computer vision, and simulation can support environmental comparison and scenario testing, but their planning value depends on context-sensitive indicators and validation with residents [3,4]. Within this broader framework, the present study addresses one specific component—short-term audio–visual restorative quality in urban village public spaces—rather than providing a comprehensive assessment of urban liveability or population health. Previous studies on urban village regeneration have mainly addressed informal development, spatial restructuring, policy intervention, and the physical improvement of public spaces [5,6]. These perspectives explain the institutional and spatial conditions of regeneration, but provide limited evidence on whether and how the sensory quality of renewed public spaces supports short-term psychological restoration. Therefore, urban village regeneration needs to be further connected with restorative environment and soundscape research.
Restorative environment theory provides the principal theoretical basis for understanding how environmental exposure may alleviate stress and restore depleted attentional resources. Stress recovery theory (SRT) emphasizes the rapid affective and physiological recovery elicited by positively appraised environmental features, particularly natural elements [7,8]. Attention restoration theory (ART), in contrast, explains restoration through being away, fascination, extent, and compatibility, which allow directed attention to recover [9]. Empirical studies based on these theories have predominantly examined natural or semi-natural environments, including urban green spaces, parks, campuses, and waterfronts, and have associated vegetation, openness, spatial order, and perceived visual quality with restorative outcomes [10,11]. However, these models and their supporting evidence do not explicitly explain situations in which beneficial and adverse stimuli coexist across sensory channels. In high-density urban villages, limited greenery, strong spatial enclosure, visual disorder, intensive everyday activities, and multiple sound sources may occur simultaneously. The limitation is therefore not that ART and SRT are inapplicable, but that their existing applications require contextual extension to mixed-stimulus, high-density built environments. This constitutes the first research gap addressed in this study.
In addition to the visual environment, the acoustic environment is an important influence on restorative experience in public spaces. Traditional environmental-noise research has focused mainly on sound pressure level, equivalent continuous sound level, and exposure control, emphasizing the adverse effects of noise on health and comfort. In recent years, soundscape research has shifted from noise control toward sound-environment experience, emphasizing the roles of sound type, sound source semantics, soundscape pleasantness, eventfulness, and place context in environmental evaluation [12]. Natural sounds such as birdsong and water are generally more likely to be associated with positive restorative experience, whereas traffic, construction, and mechanical sounds may induce annoyance, tension, and attentional distraction [13,14]. Psychoacoustic indicators such as loudness, sharpness, roughness, fluctuation strength, and tonality can supplement sound pressure metrics by characterizing sound quality and helping explain differences in subjective perception within complex acoustic environments [15]. Existing soundscape studies demonstrate that restorative experience depends not only on sound pressure level but also on sound source semantics, psychoacoustic quality, and contextual appraisal. Nevertheless, much of the existing evidence concerns individual sound categories or relatively simplified acoustic settings. Urban village public spaces commonly contain simultaneous human voices, traffic noise, commercial music, construction activity, mechanical equipment, and intermittent natural sounds. Under these conditions, scenes with similar LAeq values may differ substantially in temporal structure, psychoacoustic quality, and perceived appropriateness. Consequently, aggregate noise exposure alone may not sufficiently explain restorative differences among urban village scenes. The unresolved relationship between multisource acoustic overlap, perceptual soundscape quality, and restoration forms the acoustic component of the present research gap.
Public-space experience is not a simple addition of visual and auditory factors; rather, it is shaped by audio–visual interaction. Existing studies have shown that visual landscape can influence evaluation of the acoustic environment. Greening, water, and spatial order may improve soundscape pleasantness, whereas high-intensity noise, mechanical sounds, or sudden sounds may weaken the comfort and restorative value provided by positive visual environments [16,17,18]. Existing audio–visual studies conducted in parks, waterfronts, and general public spaces have shown that visual greenery, water features, spatial openness, and environmental order can improve soundscape evaluation, whereas traffic and construction noise can weaken the positive effects of visual landscapes [19]. These findings confirm that auditory and visual information should not be assessed independently. However, the reviewed studies have largely focused on soundscape appraisal, environmental preference, or perceived quality, with limited integration of objective visual and acoustic characteristics, perceived restoration, and physiological responses. Moreover, urban villages differ from conventional parks and open spaces because of their greater building density, stronger enclosure, intensive everyday activities, and frequent overlap of multiple sound sources. Whether the audio–visual relationships observed in conventional public spaces remain valid under these conditions is therefore uncertain. This constitutes the second research gap.
Methods for evaluating restorativeness have also expanded. Early studies mainly relied on subjective scales, including perceived restorativeness, restorative quality, restorative outcome, and environmental preference measures, to assess users’ subjective judgements of environmental restorative potential [20]. These methods effectively capture psychological experiences such as comfort, pleasantness, fascination, and willingness to revisit. In complex urban environments, however, subjective evaluation and physiological restoration may not be fully synchronized. Users may develop tolerance toward some sounds or spatial stimuli through everyday adaptation, place familiarity, or social atmosphere, while objective noise exposure, dense visual stimulation, and complex sound sources may still influence autonomic regulation. VR experiments and physiological monitoring have consequently been introduced into restorative environment research. VR can present different spatial scenes under relatively controlled and repeatable conditions, reducing disturbances caused by weather, pedestrian flow, and changing activities in field experiments [21]; electrodermal activity and heart rate variability can complement subjective evaluation by reflecting sympathetic arousal and autonomic regulation [22]. The Trier Social Stress Test and its modified forms are also used for laboratory stress induction and psychophysiological research [23]. Virtual built environments, VR urban soundscapes, and multisensory environmental stimuli have been shown to elicit different psychological and physiological restorative responses [24]. Nevertheless, previous VR-based environmental studies have often examined subjective or physiological outcomes separately, and relatively few have linked objective scene characteristics, subjective sensory appraisal, perceived restoration, and physiological recovery within the same analytical framework [16,17,18,19,20]. Taken together, the literature reviewed above comprises three insufficiently connected strands: restorative environment studies emphasizing natural and visual exposure; soundscape and audio–visual studies emphasizing perceptual appraisal; and VR-based studies examining selected psychological or physiological responses. What remains unclear is how visual–spatial conditions, multisource acoustic characteristics, subjective audio–visual appraisal, perceived restoration, and short-term physiological responses covary in high-density urban village public spaces. This constitutes the third research gap.
Taken together, these perspectives support a four-stage conceptual organization rather than a single-sensory stimulus-response model. First, objective visual and acoustic characteristics constitute the physical conditions of environmental exposure. Second, consistent with the soundscape approach, the experiential significance of these conditions is formed through contextual visual and auditory appraisal, including perceived pleasantness, environmental meaning, and overall sensory quality. Third, ART and SRT suggest that favorable environmental appraisals may support psychological restoration by facilitating soft fascination, being away, compatibility, and affective stress reduction. Fourth, EDA and HRV provide complementary short-term indicators of sympathetic arousal and cardiac autonomic regulation. Because subjective appraisal and physiological response can differ in their timing and sensitivity, the final relationship is treated as a hypothesized psychophysiological association rather than as a deterministic causal sequence. Audio–visual interactions may occur at both the objective exposure and subjective appraisal stages.
Accordingly, the present study makes three specific contributions. First, it extends restorative environment research from natural or semi-natural settings to high-density urban village public spaces characterized by restricted greenness, strong enclosure, mixed everyday activities, and overlapping sound sources. Second, it adopts a context-dependent audio–visual perspective by treating visual and auditory conditions as potentially interacting rather than simply additive and by examining statistical indirect-association pathways through visual and soundscape appraisal. Third, it integrates scene-level computer vision and psychoacoustic indicators with repeated subjective evaluations and short-term EDA and HRV responses within a single repeated-measures analytical framework. Existing multimodal environmental perception studies have mainly examined audio–visual effects on soundscape appraisal, environmental preference, perceived quality, or restorative evaluation in conventional public spaces and controlled settings. In contrast, the present study formulates a context-dependent account for high-density urban villages. It examines objective scene characteristics, sensory appraisal, cross-modal interactions, perceived restoration, and short-term physiological responses within the same conceptual structure. Within this account, adverse auditory conditions may constrain favorable visual associations, positive visual and soundscape appraisals may reinforce one another, and psychological and short-term physiological responses are treated as related but non-equivalent outcomes. The theoretical contribution therefore lies in specifying a conditional, appraisal-based audio–visual framework for mixed-stimulus built environments, rather than in claiming a universal causal mechanism or novelty for any individual measurement technique.
In response to these gaps, this study examines six selected urban village public spaces in Shenzhen and develops an analytical framework linking scene-level audio–visual conditions, subjective audio–visual appraisal, perceived restoration, and short-term physiological responses. A VR experiment, questionnaire evaluation, physiological monitoring, computer vision analysis, psychoacoustic analysis, and statistical modeling were used to identify associations underlying audio–visual restorativeness in urban village public spaces. Four questions were addressed: (1) Which objective visual and auditory factors are associated with perceived restoration? (2) Are the relationships between objective environments and perceived restoration statistically consistent with indirect pathways through visual perception and soundscape perception? (3) Do visual and auditory factors interact rather than simply add together? (4) Is subjective restoration consistent with physiological indicators such as the EDA recovery score and HRV?
Based on this theoretical integration, the conceptual framework shown in Figure 1 organizes the proposed relationships into four hypothesis groups. H1: Green view index and color complexity are positively associated with perceived restoration, whereas building enclosure and sound roughness are negatively associated with perceived restoration. H2: Objective environmental characteristics show statistical indirect associations with perceived restoration through visual and soundscape appraisal. H3: Visual and auditory factors show statistical interactions at the objective and subjective levels; specifically, favorable visual factors are expected to have weaker positive associations with perceived restoration under adverse auditory conditions, while visual and soundscape appraisals are expected to show a positive interaction. H4: Perceived psychological restoration is associated with short-term EDA and HRV responses, although the degree of correspondence may differ between physiological indicators. These hypotheses concern theoretically informed statistical relationships and do not, by themselves, establish a deterministic temporal or causal sequence.
Figure 1.
Theory-informed conceptual framework of audio–visual restoration.
2. Materials and Methods
2.1. Preliminary Survey and Scene Selection
This study followed a workflow of field investigation, objective audio–visual data collection, VR experimentation, subjective evaluation, physiological monitoring, and statistical modeling. Urban village public spaces in Shenzhen were selected because the city retains many urban villages formed during rapid urbanization, and their public spaces combine dense building morphology, complex sound source composition, and diverse public activities, making them suitable for examining audio–visual restorativeness in high-density built environments.
To identify existing audio–visual environmental problems and support subsequent scene and variable selection, a preliminary questionnaire survey was conducted. The questionnaire covered user characteristics, perceived sound source types, visual environment perception, audio–visual comfort, and environmental improvement needs. A total of 150 valid responses were collected. Artificial sound sources were frequently perceived; natural sounds were rated as comfortable but were insufficiently perceived; and greening, building interfaces, and spatial order were the main visual concerns. These findings informed the sound source categories, visual environment factors, and restorative-evaluation dimensions examined in the formal experiment.
Based on the preliminary survey, field reconnaissance was conducted in October 2024 across candidate public-space nodes in eight urban villages in the Nanshan and Futian districts of Shenzhen. Satellite-map inspection, field observation, preliminary acoustic measurement, and panoramic image acquisition were used to document spatial scale, greening conditions, pedestrian activity, functional characteristics, and sound source composition. The six experimental scenes (details shown in Table 1) were purposively selected to maximize contrasts in three respects: (1) public-space function, including traditional village squares, recreational spaces, and cultural–commercial spaces; (2) visual characteristics, including spatial scale, vegetation, and building enclosure; and (3) acoustic characteristics, including different combinations of natural, human, traffic, commercial, mechanical, and construction sounds. The selected scenes (shown in Figure 2) consequently covered high-density enclosed space, traditional village public space, large cultural–commercial space, modernized renewal space, highly greened natural-type space, and high-intensity urbanized space. This contrast-oriented selection was intended to cover the principal environmental types observed during the field survey rather than to provide a statistically representative sample of all urban villages in Shenzhen.
Table 1.
Experimental scenes and spatial characteristics.
Figure 2.
Locations of the 10 candidate public-space scenes investigated during preliminary reconnaissance; six scenes were subsequently selected for the formal VR experiment.
2.2. Acquisition of Objective Visual and Auditory Indicators
Visual indicators were derived from 360-degree panoramic images and image analysis. Panoramic images were collected in six typical urban village public spaces between 10:00 and 11:00 under clear weather to control for lighting differences; automatic exposure and daylight white balance were used consistently. Six visual indicators were extracted: green view index, sky view factor, pavement ratio, building enclosure, visual entropy, and color complexity. The green view index was calculated as the number of vegetation-labeled pixels divided by the total number of pixels in the panoramic image and multiplied by 100%. Building enclosure was calculated in the same way using building-labeled pixels; it therefore represents the visual dominance of building façades within the panoramic field of view rather than a three-dimensional geometric enclosure ratio. The pixel classes were obtained primarily using PSPNet semantic segmentation, as illustrated in Figure 3. Visual entropy was calculated from the grayscale histogram using Shannon entropy, , where pι is the proportion of pixels at the gray level. Color complexity was derived from the distributional characteristics of hue, saturation, and value in the HSV color space, with higher values indicating greater color diversity and visual layering.
Figure 3.
Extraction of visual environment indicators.
Auditory data were obtained through on-site sound-level measurement and simultaneous audio recording. Equivalent continuous A-weighted sound level (LAeq) was measured for 3 min using an AWA5636 (Hangzhou, China) multifunctional sound level meter at a height of 1.5 m and at least 1 m from obstacles. Audio was recorded simultaneously using a Zoom H6 portable recorder (Hauppauge, NY, USA) and an omnidirectional condenser microphone at a sampling rate of 48 kHz and a bit depth of 24 bits. Each scene was recorded for 3 min, and one continuous 2 min segment from each recording was used for psychoacoustic analysis. Because a formal quantitative criterion for segment selection was not documented, the segment is not described as statistically representative. Loudness (Zwicker model, sone), sharpness (Aures model, acum), roughness (Daniel–Weber model, asper), fluctuation strength (vacil), and tonality (Aures model, tu) were calculated using the HEAD Acoustics ArtemiS SUITE Version 15.1 (Herzogenrath, Germany). All psychoacoustic indicators were summarized over the selected continuous 2 min segment. Event-based descriptors of isolated sound peaks, event frequency, or temporal intermittency were not calculated. Roughness quantifies the perceptual effect of rapid amplitude modulation; higher roughness values indicate a coarser and more rapidly modulated sound. Psychoacoustic indicators were included because sound intensity, sound quality, and sound source semantics jointly shape experience in urban village sound environments; sound pressure level alone may not fully explain perceived restoration.
The VR audio–visual stimuli were developed from field-collected 360° panoramic materials and corresponding site recordings. Panoramic visual materials were acquired using an Insta360 X3 camera (Shenzhen, China), while the acoustic materials were recorded using the Zoom H6 recording system described above. For each of the six selected spaces, the visual material was paired with the corresponding field-recorded audio to form a site-specific audio–visual stimulus. During exposure, the stimuli were presented using a HTC VIVE Pro Eye (Taoyuan City, Taiwan, China) head-mounted display and its integrated earphones, and participants were allowed to rotate their heads freely to observe the scene in 360°. The corresponding field recording was used as the auditory stimulus during the 2 min VR exposure. The available experimental records did not document headphone calibration to reproduce the field-measured LAeq or amplitude normalization across scenes. Therefore, LAeq was treated as a field-measured scene characteristic rather than as the calibrated ear-level exposure received by participants during VR playback.
2.3. Participants and Experimental Procedure
The formal experiment recruited 33 undergraduate and graduate students from Harbin Institute of Technology through campus recruitment. The sample comprised 18 women (54.55%) and 15 men (45.45%). Thirty participants (90.91%) were aged 18–25 years, and three participants (9.09%) were aged 26–30 years. Before the experiment, participants were asked about their recent hearing and vision status, and individuals reporting evident hearing or vision problems were excluded. Participants were also instructed to obtain adequate sleep and to avoid participating when experiencing extreme fatigue, marked emotional fluctuation, or physical discomfort. The relatively homogeneous young-adult sample was used to reduce age-related variation in EDA and HRV and improve between-participant comparability [25,26]. Each participant completed all six VR scenes, yielding 198 participant–scene observations. Before participant recruitment, an a priori power analysis was conducted using G*Power 3.1 for a one-group repeated-measures within-subject design. Assuming a medium within-subject effect size (f = 0.25, equivalent to partial η2 = 0.059), an alpha level of 0.05, statistical power of 0.80, six repeated measurements, a correlation of 0.50 among repeated measures, and a conservative nonsphericity correction of ε = 0.50, the analysis indicated a minimum required sample size of 29 participants. To allow for approximately 10% attrition, VR discomfort, or invalid psychophysiological recordings, the target sample was increased to 33 participants. The final sample comprised 33 participants, all of whom completed the six experimental scenes. All participants were informed of the experimental procedure and provided written informed consent before participation. The experiment was conducted in a controlled laboratory at approximately 22 ± 2 °C and 50 ± 5% relative humidity. Visual stimuli were presented using a VIVE Pro Eye head-mounted display, auditory stimuli were delivered through the headset earphones, and EDA and HRV were recorded using an ErgoLAB (Beijing, China) wearable wrist sensor at 64 Hz [27,28].
Figure 4 shows the complete experiment lasted approximately 45 min, excluding initial equipment preparation, and consisted of a 3 min resting baseline followed by six experimental cycles. Before the baseline measurement, the researcher explained the experimental procedure, assisted the participant in wearing the equipment, and checked the physiological signals. Participants also completed a brief background questionnaire recording sex, age, environmental familiarity, and current self-reported condition. During the baseline phase, participants remained seated and relaxed while EDA and HRV were recorded. This baseline documented each participant’s initial physiological state; however, the primary recovery scores were calculated relative to the stress-induction phase immediately preceding each VR exposure, as described in Section 2.4. Each subsequent cycle lasted approximately 7 min and consisted of four stages: a 2 min 30 s stress-induction task [29,30], a 2 min VR scene exposure, a 2 min questionnaire evaluation, and a 30 s rest interval. During VR exposure, participants could freely rotate their heads to observe the 360° scene, while EDA and HRV were continuously recorded. After each exposure, the headset was removed, and the participant evaluated perceived restoration, sound source types, soundscape perception, and visual perception. The arithmetic and speech stress-induction tasks were each administered three times across the six cycles [31]. In the present study, these abbreviated arithmetic and speech tasks were used as repeated within-session stress challenges rather than as a complete standardized Trier Social Stress Test. The protocol did not include a separate preparation phase or salivary cortisol or other endocrine sampling. The repeated stress-induction procedure was intended to establish a comparable pre-exposure stress condition before each scene, while the questionnaire and rest interval separated successive exposures. If a participant reported discomfort, the rest interval could be extended. The presentation order of the six VR scenes was independently randomized for each participant to reduce systematic order effects.
Figure 4.
VR experimental protocol.
2.4. Subjective and Physiological Measures
Subjective measures included perceived restoration, soundscape perception, visual perception, and perceived sound source types. Perceived restoration was operationalized using eight items informed by the short-version revised restoration scale (SRRS), covering relaxation, positive affect, interest, attentional fascination, willingness to visit, and willingness to stay [32]. Soundscape perception was informed by the ISO 12913-2:2018 [33] soundscape perceptual-attribute scale and covered perceptual attributes such as pleasantness, relaxation, monotony, annoyance, chaos, eventfulness, and richness [34]. Visual perception comprised five items evaluating greening, openness, building pressure, color, and visual preference. Sound source perception included natural sounds, human sounds, traffic sounds, construction sounds, and music. Agreement items were rated from 1 (completely disagree) to 5 (completely agree), whereas perceived sound source presence was rated from 1 (completely inaudible) to 5 (completely dominant). Negatively worded items were reverse-scored before item screening and composite-score calculation. The final scores were calculated as the arithmetic means of the retained items: SR used GE1, GE2, and GE5–GE8; AP used AR1, AR2, and AR4–AR8; and VP used VR1–VR5. Higher scores therefore indicated greater perceived restoration, a more positive soundscape appraisal, and a more favorable visual appraisal, respectively.
EDA and HRV were recorded using the ErgoLAB wearable wrist sensor at 64 Hz, as described in Section 2.3. EDA was operationalized using mean tonic skin conductance level (SCL Mean), the standard deviation of SCL (SCL Std), the number of skin conductance responses (SCR Count), and mean SCR amplitude (SCR Amp Mean) [35]. HRV was operationalized using RMSSD, SDNN, and SD1, representing short-term vagal modulation, overall heart-rate variability, and instantaneous beat-to-beat variability, respectively [36]. For each participant–scene observation, the change in each indicator was calculated as the mean during the 2 min VR recovery phase minus the mean during the preceding 2 min 30 s stress-induction phase. The resulting change scores were Z-standardized. The four standardized EDA indicators were directionally reversed and averaged to obtain the reversed EDA recovery score, whereas the three standardized HRV indicators were averaged to obtain the HRV composite score. Higher values of both composite scores therefore indicated better physiological recovery.
Before composite scores were calculated, negatively worded items were reverse-scored, and pooled internal consistency and exploratory factorial structure were examined using the 198 participant–scene questionnaires. Reliability was assessed using corrected item–total correlations and Cronbach’s α (Table A1), while factorial suitability was evaluated using the KMO measure and Bartlett’s test, followed by principal component analysis with eigenvalues greater than 1 (Table A2). The initial eight-item perceived-restoration scale showed good internal consistency (Cronbach’s α = 0.884). However, GE3 and GE4 had relatively low corrected item–total correlations (CITC = 0.261 and 0.217, respectively), and deleting either item increased Cronbach’s α to 0.902 and 0.904, respectively. These two items were therefore excluded, and perceived restoration (SR) was calculated using GE1, GE2, GE5, GE6, GE7, and GE8. Using the 198 pooled participant–scene questionnaires, the retained six-item SR scale showed high internal consistency (Cronbach’s α = 0.937). The retained six-item scale had a KMO value of 0.857, and Bartlett’s test of sphericity was significant (χ2 = 1086.001, df = 15, p < 0.001). A single factor was extracted, explaining 76.312% of the cumulative variance, indicating good construct validity.
The initial eight-item soundscape-perception scale also demonstrated good internal consistency (Cronbach’s α = 0.868). AR3 had a CITC value of 0.446, and its deletion slightly increased Cronbach’s α to 0.870. Based on the combined item-screening criteria, AR3 was excluded, and soundscape perception (AP) was calculated using AR1, AR2, AR4, AR5, AR6, AR7, and AR8. The retained seven-item scale had a Cronbach’s α of 0.870 and a KMO value of 0.790, and Bartlett’s test was significant (χ2 = 926.516, df = 21, p < 0.001). Principal component analysis retained two components, together explaining 75.349% of the variance. After rotation, the first component was interpreted as general evaluative quality, including pleasantness, relaxation, annoyance, and chaos, whereas the second primarily reflected eventfulness and richness. Because several items showed cross-loadings and the study was designed to measure overall soundscape appraisal, the seven directionally aligned items were averaged to form AP rather than divided into two independent subscales. AP was therefore treated as a broad composite index, not as a unidimensional latent construct.
The five-item visual-perception scale had a Cronbach’s α of 0.785. The CITC values ranged from 0.433 to 0.707, and deleting any individual item did not improve the overall reliability. Therefore, all five items were retained, and visual perception (VP) was calculated using VR1–VR5. The scale had a KMO value of 0.744, and Bartlett’s test was significant (χ2 = 319.061, df = 10, p < 0.001). A single factor was extracted, explaining 54.279% of the cumulative variance and indicating good construct validity.
2.5. Statistical Analysis
Terminology was used as follows. Restorative quality refers to the general capacity of an environment to support recovery, whereas perceived restoration (SR) refers to the retained six-item self-reported outcome. Objective audio–visual conditions refer to measured or computationally derived scene-level visual and acoustic indicators, not to independently randomized experimental treatments. Association denotes statistical covariation, whereas interaction denotes a product–term relationship in which the association of one predictor varies with another. Statistical indirect association refers to the estimated ab pathway through visual or soundscape appraisal; because temporal order and freedom from unmeasured confounding were not established, it is not interpreted as causal mediation. The term subjective audio–visual synergy is reserved for the positive AP × VP interaction, whereas negative objective interaction terms are described as acoustic constraints. No causal effects are claimed.
Because all 33 participants experienced all six scenes, repeated observations from the same participant did not satisfy the independence assumption. Linear mixed-effects models (LMMs) were therefore used as the core analytical method. Participant ID was specified as a random intercept to control for stable individual differences, while objective audio–visual variables or subjective-perception variables were entered as fixed effects to estimate their associations with perceived restoration [37]. For participant under scene , the primary main-effect model was specified as , where denotes the predictor, is the participant-specific random intercept, and is the conditional residual. Objective environmental predictors were Z-standardized before modeling, whereas subjective composite scores retained their original scale. Conditional on the random intercept, residuals were assumed to be independent with constant variance; the resulting marginal within-participant covariance corresponds to an exchangeable random-intercept structure. Random slopes were not fitted because the participant sample and the six unique scene-level values provided limited support for a more complex random-effects structure. No additional demographic covariates were included because the sample was deliberately restricted to a relatively homogeneous young-adult student population; the reported coefficients should therefore be interpreted as participant-clustered but not demographically adjusted associations. Descriptive statistics and Friedman tests were first used to compare subjective and physiological restoration across scenes. Repeated-measures correlations, scene-level correlations, and collinearity diagnostics were then used to screen candidate variables [38]. Objective visual, objective auditory, subjective-perception, and sound source-type models were estimated separately, followed by audio–visual interaction models. Multilevel path-decomposition models were finally used to estimate statistical indirect associations between scene-level environmental indicators and perceived restoration through visual or soundscape appraisal. For each selected visual predictor V and auditory predictor A, four nested models were compared: . Both lower-order main effects were retained whenever an interaction term was tested. Nested interaction models were compared using maximum-likelihood estimation, small-sample-corrected Akaike information criterion (AICc), and marginal R2. Soundscape perception and visual perception were entered simultaneously in the subjective-perception model, whereas the five perceived sound source variables were entered simultaneously in the sound source model.
Potential multicollinearity was examined using correlations among the six scene-level environmental profiles. For each objective interaction model, variance inflation factors (VIFs) were calculated for the two lower-order terms and their product term. The condition number of the centered and scaled three-predictor matrix was also examined. These diagnostics were calculated from the six unique scene-level environmental profiles rather than treating the 198 repeated participant–scene observations as independent environmental samples (Table A3). Predictor pairs with |r| > 0.80 were not simultaneously entered into the same main-effect model. To limit model overfitting, objective main effects were estimated using single-predictor mixed-effects models, objective interactions were restricted to four theory-informed and collinearity-screened audio–visual pairs, and each indirect pathway was estimated separately. To account for multiple testing, the Benjamini–Hochberg false discovery rate correction was applied separately to the 12 objective main-effect tests and the four objective interaction tests; both unadjusted p-values and adjusted q-values are reported. Objective audio–visual indicators were scene-level variables with only six unique values, whereas subjective and physiological indicators were participant–scene variables with 198 repeated observations. Accordingly, p-values from the LMMs primarily indicate the strength of association between scene-level environmental differences and individual evaluations after controlling for participant random intercepts; they should not be interpreted as strong causal effects based on 198 independent environmental samples. To reduce the risk of pseudo-replication, objective-variable results are reported as single-predictor mixed-effects models. Interpretation integrates six-scene means, scene-level trends, consistency in effect direction, and the indirect-association models. Model convergence and singularity were checked for all fitted LMMs. Conditional residual normality and homoscedasticity were assessed using Q–Q plots and residual-versus-fitted plots, respectively. No material convergence problems or systematic residual-pattern violations were detected.
The a priori power analysis was based on the primary within-subject comparison across the six experimental scenes. It supported the planned participant sample for detecting an overall within-subject effect of the anticipated magnitude, but it did not independently establish statistical power for every fixed-effect coefficient, audio–visual interaction term, or multilevel indirect effect. To avoid treating the 198 repeated observations as independent samples, participant ID was included as a random intercept in all mixed-effects models. Objective environmental predictors were examined primarily using single-predictor mixed-effects models, and indirect effects were evaluated using 5000 cluster-bootstrap resamples by participant ID with 95% confidence intervals. These models estimate statistical indirect associations rather than causal mediation. Although the presentation order of the VR scenes was randomized, the scene-level environmental characteristics were not independently randomized or experimentally manipulated, and subjective sensory appraisal and perceived restoration were assessed after the same scene exposure. Therefore, temporal precedence and the absence of unmeasured mediator–outcome confounding cannot be established. Complex interaction and mediation results were therefore interpreted cautiously, with emphasis on effect estimates, confidence intervals, and consistency across analyses rather than statistical significance alone.
Statistical indirect associations were estimated separately for each prespecified X–M–SR pathway. For participant i viewing scene j, the mediator model was specified as Mij = α0 + aXj + uMi + εMij, and the outcome model was specified as SRij = β0 + c′Xj + bMij + uYi + εYij. The corresponding total-association model was SRij = γ0 + cXj + uCi + εCij. In these equations, Xj denotes a Z-standardized scene-level environmental indicator, Mij denotes the participant–scene visual or soundscape-appraisal score, and uMi, uYi, and uCi denote participant-specific random intercepts. Mediator and outcome composite scores were entered on their original scales, and each X–M–SR pathway was fitted separately. The statistical indirect association was calculated as the product ab. Because the environmental predictors had only six unique scene-level values and the mediator and outcome were measured following the same exposure, these models were treated as multilevel statistical path decompositions rather than as causal mediation models.
For the cluster bootstrap, participants rather than individual participant–scene rows were resampled with replacement, and all six scene observations belonging to a sampled participant were retained in each bootstrap sample. This procedure was repeated 5000 times to obtain 95% confidence intervals for the path estimates and the product ab.
To assess the leverage of individual environmental scenes, a leave-one-scene-out sensitivity analysis was conducted for the principal scene-level main effects, audio–visual interactions, and statistically indirect associations. Each model was re-estimated six times, with all 33 participant observations from one scene excluded in each iteration. Participant ID remained specified as a random intercept, and the original full-sample Z-standardization and model specification were retained to make coefficients comparable across scene omissions. For the indirect-association models, the a and b paths and their product ab were re-estimated. Because each reduced analysis contained only five environmental units, stability was evaluated primarily from coefficient direction and range rather than from p-values.
3. Results
3.1. Audio–Visual Characteristics and Restorative Differences Across Scenes
The six experimental scenes differed substantially in their visual and auditory environments. The objective visual and auditory characteristics of the six scenes are summarized in Table 2 and Table 3, respectively. The green view index ranged from 1.69% in S6 to 58.03% in S5, and building enclosure ranged from 3.44% in S5 to 52.34% in S1. LAeq ranged from 54.566 dB in S6 to 69.007 dB in S3, while roughness ranged from 0.0373 asper in S5 to 0.152 asper in S2. These gradients indicate that the selected scenes covered a broad range of audio–visual environmental conditions. The dominant perceived sound source type did not necessarily correspond directly to LAeq. Although S5 was perceived as dominated by natural sounds, human activity and background traffic may have increased its LAeq; conversely, S6 was perceived as traffic-sound dominated, but the sound pressure level during the measurement period was relatively low. Sound source semantics, sound pressure level, and soundscape perception therefore did not show a simple one-to-one relationship. Friedman tests showed significant differences across scenes in perceived restoration, soundscape perception, visual perception, the reversed EDA recovery score, and HRV. Perceived restoration showed p < 0.001 and Kendall’s W = 0.346; soundscape perception, p < 0.001 and W = 0.423; visual perception, p < 0.001 and W = 0.488; the reversed EDA recovery score, p < 0.001 and W = 0.410; and HRV, p < 0.001 and W = 0.258.
Table 2.
Objective visual indicators for the six scenes.
Table 3.
Objective auditory indicators for the six scenes.
3.2. Associations of Objective Visual and Auditory Factors with Perceived Restoration
As summarized in Table 4, the single-predictor linear mixed-effects models showed that green view index was positively associated with perceived restoration (B = 0.322, SE = 0.057, p < 0.001), as was color complexity (B = 0.422, SE = 0.053, p < 0.001). By contrast, sky view factor (B = −0.217, SE = 0.060, p < 0.001) and building enclosure (B = −0.271, SE = 0.059, p < 0.001) were negatively associated with perceived restoration; pavement ratio and visual entropy were not significant. The negative association of sky view factor should not be interpreted simply as evidence that openness impedes restoration. In small-scale urban village spaces, greater sky visibility may coincide with less greenness or a stronger sense of exposure; the negative coefficient is therefore more likely to reflect the combined effect of a specific audio–visual configuration in high-density settings.
Table 4.
Single-predictor mixed-effects model results for objective variables and perceived restoration.
Among objective auditory factors, neither LAeq nor loudness was directly associated with perceived restoration. In the full-sample model, sharpness was positively associated with perceived restoration (B = 0.214, SE = 0.060, p < 0.001), whereas roughness was negatively associated with perceived restoration (B = −0.328, SE = 0.057, p < 0.001). However, the sharpness coefficient changed direction when S5 was omitted in the leave-one-scene-out analysis, indicating sensitivity to scene composition. A post hoc comparison showed that the scene with the highest sharpness also had stronger perceived natural sounds and higher restoration. This coincidence is compatible with a possible contribution from birdsong or other natural high-frequency sounds, but no sound source-specific spectral decomposition was conducted. The birdsong explanation therefore remains speculative, and the positive coefficient should not be interpreted as evidence that sharpness itself promotes restoration.
3.3. Audio–Visual Interaction Effects
As shown in Table 5, visual and auditory factors did not operate independently. The green view index × roughness interaction improved fit (ΔAICc = −9.147), and the interaction was negative and significant (B = −0.280, p = 0.001). The green view index × LAeq model showed a larger improvement (ΔAICc = −34.897), with another negative and significant interaction (B = −0.747, p < 0.001). The color complexity × roughness interaction was also negative and significant (B = −0.350, p = 0.004). In the full six-scene models, these negative coefficients were consistent with the possibility that adverse auditory conditions constrained favorable visual associations. Their stability was subsequently evaluated using the leave-one-scene-out analysis reported in Section 3.6. The building enclosure × roughness interaction was not significant (B = 0.151, p = 0.153), indicating that the interaction pattern was not consistent across all tested audio–visual combinations. Collinearity diagnostics based on the six unique scene profiles are reported in Table A3. The maximum VIF was below 5 for the green view index × roughness, green view index × LAeq, and building enclosure × roughness models. The color complexity × roughness model showed higher collinearity, with a maximum VIF of 8.363 and an interaction-term VIF of 5.014, although its condition number was 5.689. Together with the direction change observed in the leave-one-scene-out analysis, this interaction was retained for completeness but was not interpreted as a stable finding. More generally, the diagnostics did not remove the uncertainty resulting from the small number of independent environmental scenes.
Table 5.
Comparison of audio–visual interaction models.
3.4. Subjective Perception, Sound Source Types, and Statistical Indirect Associations
At the subjective level, both soundscape perception and visual perception were positively associated with perceived restoration. When entered simultaneously, soundscape perception showed the stronger association (B = 0.605, SE = 0.049, p < 0.001), while visual perception also remained positively associated with perceived restoration (B = 0.332, SE = 0.052, p < 0.001). Sound source-type models showed that perceived natural sounds were positively associated with perceived restoration (B = 0.330, SE = 0.054, p < 0.001), whereas perceived construction sounds were negatively associated with perceived restoration (B = −0.202, SE = 0.044, p < 0.001). Human sounds, traffic sounds, and music showed no significant direct associations. Thus, sound type, semantics, and the relationship between sound and setting may be more important than sound pressure level alone.
As summarized in Table 6, the multilevel models identified statistical indirect associations linking objective environments, subjective perception, and perceived restoration. The green view index was positively associated with visual perception (a = 0.479, 95% CI [0.393, 0.565]), and visual perception was positively associated with perceived restoration (b = 0.805, 95% CI [0.676, 0.941]), producing a positive indirect association (ab = 0.386, 95% CI [0.304, 0.484]). Roughness was negatively associated with soundscape perception (a = −0.351, 95% CI [−0.456, −0.242]), and soundscape perception was positively associated with perceived restoration (b = 0.788, 95% CI [0.679, 0.907]), producing a negative indirect association (ab = −0.277, 95% CI [−0.385, −0.176]). The indirect association between LAeq and perceived restoration through soundscape perception was not significant (ab = −0.007, 95% CI [−0.098, 0.086]). Color complexity showed a positive indirect association through visual perception (ab = 0.287, 95% CI [0.222, 0.360]) and retained a positive conditional direct association (c′ = 0.134, 95% CI [0.047, 0.225]). These results are consistent with perceptual-appraisal pathways but do not establish their temporal or causal ordering.
Table 6.
Multilevel estimates of statistical indirect associations linking scene-level audio–visual indicators, subjective appraisal, and perceived restoration.
The subjective audio–visual interaction model showed a positive interaction between soundscape perception and visual perception. AP was positively associated with SR (B = 0.301, SE = 0.146, t = 2.065, p = 0.040). The AP × VP interaction was also positive and significant (B = 0.095, SE = 0.043, t = 2.214, p = 0.028). The main effect of VP was not significant (B = 0.039, SE = 0.142, t = 0.278, p = 0.781). Thus, when soundscape perception was more positive, the positive association between visual perception and perceived restoration was more readily expressed. In this study, subjective audio–visual synergy refers specifically to this positive AP × VP interaction; the negative objective interaction terms reported in Section 3.3 are interpreted as acoustic constraints rather than synergy.
3.5. Coupling and Divergence Between Psychological and Physiological Restoration
As reported in Table 7, repeated-measures correlations showed that perceived restoration was strongly correlated with soundscape perception (r = 0.832, p < 0.001) and visual perception (r = 0.724, p < 0.001). Perceived restoration was moderately correlated with the reversed EDA recovery score (r = 0.416, 95% CI [0.281, 0.534], p < 0.001), but its correlation with HRV recovery was weaker (r = 0.212, 95% CI [0.061, 0.353], p = 0.006). Soundscape perception and visual perception showed the same pattern, with stronger correlations with the reversed EDA recovery score than with HRV. A further model showed that LAeq was negatively associated with HRV (B = −0.150, SE = 0.056, p = 0.008), while its direct association with perceived restoration was not significant. These findings indicate a degree of psychophysiological divergence: participants’ subjective appraisals and short-term autonomic responses did not show identical patterns across the examined scenes.
Table 7.
Repeated-measures correlations between subjective perception and physiological restoration.
3.6. Leave-One-Scene-Out Sensitivity Analysis
The leave-one-scene-out analysis showed uneven stability among the scene-level results (Table A4). For the main effects, the green-view-index coefficient ranged from −0.298 to 0.404, and the building-enclosure coefficient ranged from −0.522 to 0.115; both changed direction when S5 was omitted. Color complexity (B = 0.214 to 0.490) and roughness (B = −0.400 to −0.121) retained their respective positive and negative directions, although both were attenuated after excluding S5. The green view index × roughness and color complexity × roughness interactions changed direction across scene omissions. The green view index × LAeq interaction remained negative but varied markedly in magnitude (B = −9.271 to −0.704). In contrast, the green view index → visual perception → perceived restoration and roughness → soundscape perception → perceived restoration indirect associations retained their directions across all six omissions (ab = 0.240 to 0.422 and −0.338 to −0.131, respectively). The color-complexity indirect association approached zero when S5 was excluded (ab = 0.009). These results identify S5, and in some interaction models S2, as influential environmental units. The scene-level main effects and objective interaction estimates should therefore be interpreted as exploratory and context-specific.
4. Discussion
4.1. Restorative Associations in High-Density Urban Village Settings
The findings indicate that restorativeness in urban village public spaces cannot be explained by directly applying interpretive frameworks developed for parks, open green spaces, or typical natural environments. Restorative environment research has largely focused on natural landscapes and has emphasized the positive roles of natural exposure, being away, soft fascination, and environmental compatibility in attentional recovery and stress relief. Kaplan’s attention restoration theory proposes that natural environments are more likely to restore attentional resources because they impose lower cognitive demands and provide soft fascination. Research by Ulrich and colleagues suggests that visual exposure to natural landscapes may support emotional and physiological restoration. Consistent with this literature, the present study found that the green view index was positively associated with perceived restoration, indicating that directly perceptible green elements retain restorative value even in small public spaces within high-density urban villages [39]. From the perspective of attention restoration theory, visible greenery may provide soft fascination and a brief sense of being away, while reducing the perceptual dominance of hard-built interfaces and the demand for directed attention. The positive association of color complexity may reflect a related but distinct process: coordinated color diversity can increase visual interest, spatial identity, and perceptual richness without necessarily producing excessive cognitive demand. This interpretation concerns organized visual diversity rather than unstructured clutter and should not be taken to imply that increasing color complexity without limit would improve restoration. However, the leave-one-scene-out analysis showed that the green-view-index coefficient changed direction when S5 was excluded, whereas the color-complexity coefficient remained positive but was attenuated. The visual associations should therefore be interpreted as contrasts among the six selected scenes, with S5 contributing substantial leverage, rather than as stable population-level effects.
Unlike studies of parks, waterfronts, or open green spaces, however, the present study found that sky view factor did not show a stable positive association with perceived restoration. Studies of views in high-density cities have generally suggested that sky visibility and green views can improve restorative experience [40], and research on street environments has also reported positive contributions of sky view and green exposure to streetscape restorativeness [41]. In urban villages, however, these relationships may be jointly conditioned by spatial scale, proximity of buildings, perceived exposure, and safety. In other words, openness does not necessarily equate to restoration in dense, small-scale urban villages with highly mixed everyday activities. When an open space is accompanied by strong traffic exposure, limited shelter, visual disturbance, or poorly defined boundaries, the potential benefit of sky visibility may be weakened. From the perspective of attention restoration theory, visible greenery may provide soft fascination and a brief sense of being away, while reducing the perceptual dominance of hard-built interfaces and the demand for directed attention [5]. The positive association of color complexity may reflect a related but distinct process: coordinated color diversity can increase visual interest, spatial identity, and perceptual richness without necessarily producing excessive cognitive demand. This interpretation concerns organized visual diversity rather than unstructured clutter and should not be taken to imply that increasing color complexity without limit would improve restoration.
The acoustic findings likewise show that the restorative evaluation of urban village public spaces cannot be reduced to sound level alone. ISO 12913-1 [42] defines a soundscape as the acoustic environment as perceived, experienced, or understood by people in context, thereby shifting evaluation from physical sound level toward contextualized perception and experience. LAeq did not significantly predict perceived restoration in this study, whereas roughness and sound source type had greater explanatory value. Roughness captures rapid amplitude modulation rather than overall sound energy. Acoustically coarse and rapidly fluctuating sounds may repeatedly capture attention, increase perceived harshness or unpredictability, and maintain vigilance, thereby interfering with short-term recovery. At the same time, roughness may be coupled with mechanical or construction sound sources; its coefficient should therefore be interpreted jointly with sound source semantics and scene context rather than as an isolated causal effect. Roughness retained a negative coefficient in all six leave-one-scene-out analyses, although its magnitude was attenuated when S5 was excluded. Its direction was therefore more stable than those of several visual indicators, but the estimated magnitude remains dependent on the selected scene set. This pattern is consistent with the shift in soundscape research from noise control toward perceptual quality and sound source semantics [43,44]. Different sound sources, including natural sounds, everyday activity sounds, and traffic sounds, can influence perceived restoration through pleasantness, appropriateness, and place meaning [45]. Soundscape management in urban villages should therefore extend beyond decibel reduction by distinguishing adverse mechanical sounds, acceptable everyday sounds, and positive natural sounds, and by considering temporal structure, roughness, predictability, and contextual fit.
4.2. Audio–Visual Interaction and Divergence in Psychophysiological Restoration
In the full six-scene models, the negative audio–visual interaction coefficients were statistically compatible with acoustic constraints on favorable visual associations; however, they do not establish that adverse auditory exposure mechanistically weakened visual restoration. This finding is consistent with recent studies of audio–visual restorativeness. In audio–visual combination experiments, Hong and Jeon found that natural sounds, road-traffic noise, and visual vegetation jointly influenced environmental preference and soundscape quality in urban streets, and that perceptual dimensions could not be fully explained by noise level [46]. Using VR experiments, Jeon and colleagues further showed that soundscape and landscape experiences jointly influenced psychophysiological restoration, with visual attractiveness, perceived naturalness, and acoustic calmness acting as important restorative factors [27]. Within the full six-scene models, the present results were consistent with similar cross-modal constraints in urban village public spaces. However, the leave-one-scene-out analysis showed that the green view index × roughness and color complexity × roughness coefficients changed direction across scene omissions, whereas the green view index × LAeq coefficient remained negative but varied markedly in magnitude. The objective interaction estimates are therefore interpreted as exploratory and scene-dependent rather than as stable general effects. Collinearity diagnostics additionally indicated elevated VIFs in the color complexity × roughness model. The objective interaction estimates are therefore interpreted as exploratory, scene-dependent statistical relationships rather than as stable generalizable interactions.
This result qualifies prevailing approaches to urban village renewal. Many micro-renewal projects prioritize facade beautification, repaving, murals, and supplementary planting. Although these interventions can improve spatial appearance, sites that remain exposed to persistent traffic noise, construction noise, rough mechanical sounds, or prominent acoustic conflicts may still receive lower perceived-restoration ratings. Visual optimization and soundscape management should therefore not be treated as independent tasks, but should be coordinated as components of an environmental system that jointly shapes perceived restoration.
Perceived restoration was more closely associated with the reversed EDA recovery score, whereas LAeq was associated with HRV but not directly with perceived restoration. This divergence is theoretically plausible because the three outcomes represent different response systems. Perceived restoration is a conscious appraisal that integrates attention, affect, environmental meaning, compatibility, and prior experience. EDA primarily reflects sympathetic arousal and can respond rapidly to salient stimuli; therefore, within the same short exposure period, reduced electrodermal arousal may correspond relatively closely to a reported sense of calm. However, EDA does not independently identify whether arousal is pleasant or unpleasant, and its association with perceived restoration should not be interpreted as a direct physiological equivalent of restoration.
HRV reflects beat-to-beat cardiac variation and autonomic regulation, including vagally mediated processes, and its response may differ from EDA and subjective appraisal in both pathway and timescale. HRV estimates are also sensitive to respiration, posture and movement, recording duration, and baseline autonomic state. Accordingly, the present HRV composite, derived from a 2 min wrist-sensor recording, should be regarded as a short-term experimental indicator rather than as a definitive measure of vagal restoration or longer-term cardiovascular health. Because the 2 min windows were shorter than the conventional 5 min short-term HRV recording, these data were used only as short-term within-session experimental indicators and not for clinical or normative HRV interpretation. Consequently, the weaker correlation between HRV and perceived restoration may reflect differences in response latency and measurement sensitivity rather than an absence of physiological recovery. Similarly, the association between LAeq and HRV indicates that physical sound intensity and consciously reported restoration did not show identical response patterns, but it does not establish a deeper or hidden physiological health effect. Previous research has likewise shown that environmental sounds do not produce uniform changes across subjective, electrodermal, and cardiac indicators [44]. Psychological restoration, short-term sympathetic arousal, and cardiac autonomic regulation should therefore be treated as related but non-equivalent dimensions. No single measure constitutes a complete marker of restoration, and the present findings support triangulation across subjective, EDA, and HRV outcomes rather than substitution among them. The observed relationships among scene-level environmental conditions, subjective perceptions, perceived restoration, and short-term physiological responses are summarized in Figure 5.
Figure 5.
Integrated framework of restorative associations in urban village public spaces.
Viewed through the integrated framework, the findings suggest that the relationship between physical environmental conditions and restoration is not a simple stimulus-response process. The observed indirect associations are consistent with the soundscape view that objective acoustic and visual conditions acquire experiential significance through contextual appraisal. ART and SRT provide complementary explanations for why favorable appraisals may be related to attentional and affective recovery, whereas the non-identical EDA and HRV patterns indicate that physiological responses constitute related but partially independent outcomes. Because temporal precedence across these stages was not directly tested, the proposed sequence should be interpreted as a theory-consistent conceptual organization rather than as a confirmed causal chain.
Taken together, the theoretical contribution of this study is a conditional rather than simply additive account of audio–visual restoration in high-density built environments. Existing multimodal studies have mainly demonstrated that visual context affects soundscape appraisal or that audio–visual combinations influence environmental preference, perceived quality, or restoration [12,13,14,15,23,40]. The present study differs by examining, within one repeated-measures framework, direct environmental associations, statistical indirect associations through sensory appraisal, objective and subjective cross-modal interactions, and divergence among perceived restoration, EDA, and HRV. The findings suggest that adverse auditory conditions may constrain favorable visual associations, positive visual and soundscape appraisals may reinforce one another, and psychological and short-term physiological responses are related but non-equivalent. Because the evidence comes from six selected scenes, this framework remains context-specific and hypothesis-generating rather than universally causal.
4.3. Implications for Coordinated Audio–Visual Micro-Renewal
The design implications are weighted according to the stability of the observed associations. Roughness and color complexity retained their coefficient directions across the leave-one-scene-out analyses, whereas green view index, building enclosure, and the objective interaction estimates were more sensitive to scene omission. Accordingly, the following recommendations are presented as context-specific renewal priorities rather than as universal numerical design thresholds.
Taken together, these context-specific associations suggest a provisional renewal strategy that coordinates the control of adverse acoustic conditions with visual improvement. Perceptible greenness should be increased at frequently used stay nodes, alley intersections, small spaces between buildings, and along pedestrian routes. Because urban villages have limited space for large green areas, more feasible interventions include vertical greening, integrated tree-pit seating, small-scale multilayer planting, facade greening, and pocket greenery, allowing green elements to be seen, approached, and used at a human scale. Green view index measures visible greenery from the pedestrian perspective and is an important street-level indicator of green exposure [47]. Its positive association with perceived restoration suggests that, in urban villages, visible greenness may be more operationally meaningful than a simple increase in total green-space area. At the site scale, planting should be positioned within the principal pedestrian field of view rather than concentrated at inaccessible residual edges. In narrow alleys, vertical and facade greening can preserve pedestrian width, while trees and low planting can define the transition between through-movement and short-stay zones. Seating should be placed beside visible greenery, oriented toward the more visually coherent part of the space, and kept away from traffic-facing edges or exposed mechanical equipment.
Building-interface pressure should also be reduced through ground-floor interface organization, cable and equipment concealment, facade greening, coordinated signage, and visual simplification. In narrow alleys and small squares, enclosure should be managed by maintaining continuous sightlines and avoiding uninterrupted opaque interfaces; where separation is needed, permeable planting or lightweight screens can provide a degree of refuge without further narrowing the perceived space. Facade treatment should coordinate major color ranges and signboard dimensions while retaining a limited number of accent colors for local identity. This approach interprets the positive association of color complexity as support for organized visual richness rather than the indiscriminate addition of colors or decorative elements.
Priority should then be given to controlling rough, mechanical, construction, and traffic-related sound sources. Environmental acoustic burdens can be reduced through equipment vibration isolation, orderly placement of outdoor air-conditioning and exhaust equipment, construction-time management, traffic calming at alley entrances, boundary screening, sound-absorptive surfaces, and planting buffers. Acoustic buffers should be positioned between dominant traffic or equipment sources and pedestrian or short-stay zones. Where space is limited, low screens, planting, and sound-absorptive interface treatments may be combined, while rest seats should be located on the more acoustically sheltered side and through-routes should remain unobstructed. Compared with conventional noise control, soundscape management in urban villages requires greater attention to sound source type and sound quality. Acoustic environments are shaped not only by physical levels such as LAeq but also by sound source type, soundscape pleasantness, eventfulness, and contextual meaning. Rough, sudden, and uncontrollable mechanical or construction sounds should be reduced first. By contrast, sounds associated with neighborhood interaction, street vending, or children’s activities should not be removed indiscriminately because they contribute to everyday life and place identity; spatial zoning, time management, and sound source organization can instead reduce conflicts.
Finally, natural sound cues may be introduced or strengthened to shift public-space renewal from image-oriented improvement toward coordinated audio–visual restorative quality. Birdsong and flowing water are often considered to support attentional and stress recovery, but these benefits are not unconditional; they depend on sound level, background noise, sound source meaning, and audio–visual congruence. In urban villages, small water features, bird-friendly planting, wind chimes, or low-level natural-sound installations may be located near short-stay and seating nodes, provided that their visual and acoustic characteristics remain gentle, predictable, mutually congruent, and contextually appropriate. Such additions should not become simple sound layering: they should follow effective control of adverse sources and should not be used to mask existing acoustic problems.
4.4. Limitations
This study has several limitations. First, only six experimental scenes were included. This number allowed comparison of contrasting association patterns and comparison among scene types, but the objective audio–visual variables were inherently measured at the scene level, leaving a limited environmental sample. The resulting associations should therefore not be overgeneralized as universal causal laws. The leave-one-scene-out analysis conducted in the present study showed that S5 exerted substantial leverage on several visual main-effect estimates and that some objective interaction estimates were also sensitive to S2. Accordingly, the six-scene models should be treated as exploratory and context-specific. Future studies should expand the range of urban village public spaces to include alleys, spaces between buildings, village-entrance squares, commercial street segments, school surroundings, and traffic-facing interfaces, and should apply similar sensitivity analyses to larger and independently sampled sets of environmental scenes. The six scenes constituted a purposive, contrast-oriented sample designed to cover different spatial functions, visual conditions, and sound source compositions rather than a statistically representative sample of all urban villages in Shenzhen. Because all scenes were located in Shenzhen, the observed relationships may also reflect local urban morphology, climatic conditions, activity patterns, and culturally shaped interpretations of everyday sounds and public-space use. The findings should therefore be interpreted in relation to the specific environmental contrasts represented by the selected Shenzhen scenes and should not be assumed to transfer directly to other urban villages in Shenzhen, other Chinese cities, Asian urban villages or comparable high-density settlements, or different cultural contexts. Multi-city and cross-cultural studies using larger and independently sampled sets of environmental scenes are required to test the transferability and stability of the observed relationships.
The pixel-based building-enclosure indicator should also be interpreted narrowly. It quantifies the panoramic visual share of building façades but does not capture façade height, viewing distance, orientation, street width-to-height ratio, interface permeability, or three-dimensional spatial configuration. Consequently, similar building-pixel shares may correspond to configurations that provide refuge in one setting but evoke oppression in another. The observed coefficient therefore concerns façade visual dominance rather than a general three-dimensional enclosure effect. Future studies should combine panoramic semantic segmentation with three-dimensional reconstruction, street-section geometry, and configuration-sensitive spatial indicators.
Similarly, the time-averaged acoustic indicators may smooth brief and intermittent sound events. Scooter horns, drilling, shouting, or passing vehicles may differ substantially from steady background sound even when their average acoustic values are similar. Future studies should combine time-averaged psychoacoustic indicators with event-based and time-varying descriptors, including LAFmax, percentile sound levels, temporal variability, event counts and durations, and sound source event annotation.
Second, participants were mainly young students. This sample improved experimental control but cannot represent all resident groups. Socioeconomic status, migration status, and permanent-residency status were not recorded; therefore, subgroup analyses involving low-income migrant workers or permanent urban village residents could not be conducted. Actual users of urban village public spaces include local residents, migrant tenants, older adults, children, shopkeepers, and short-stay visitors. These groups may differ in their perceptions of safety, everyday sounds, commercial sounds, and natural elements. Future studies should diversify the sample and compare perceived restoration across residential duration, age, and purpose of use. Although the final sample met the a priori requirement for the planned six-condition within-subject comparison, the power calculation was not specifically designed for all coefficients in the mixed-effects, interaction, and multilevel indirect-association models. Small fixed effects, interaction effects, or indirect associations may therefore remain difficult to detect. In addition, the 198 participant–scene observations represent repeated measurements nested within 33 participants rather than 198 independent samples. Replication with a larger and more diverse participant sample and more independent environmental scenes is needed to assess the stability and generalizability of the more complex model estimates.
Third, VR provides strong control and repeatability and can help isolate visual and auditory variables, but it cannot fully reproduce odors, thermal conditions, crowd interaction, weather variation, or long-term exposure at real sites. No thermal, wind-speed, or odor measurements were collected; therefore, the present experiment does not claim to represent complete outdoor comfort or the full multisensory experience of urban village public spaces. Headset-based audio and controlled laboratory exposure may not fully reproduce free-field spatial acoustics, spontaneous bodily movement, multisensory adaptation, or the physiological responses generated during the everyday use of real public spaces. VR can support controlled experiments on urban soundscapes and audio–visual restoration and inform health-oriented environmental design, yet multisensory experience and social context in real settings remain difficult to simulate completely. Future research should combine on-site measurement, mobile physiological monitoring, soundwalk evaluation, and before-and-after comparison to improve ecological validity.
Fourth, although several procedural controls were applied, residual confounding of the physiological outcomes cannot be excluded. Participants were instructed to obtain adequate sleep and to avoid participation under conditions of extreme fatigue, marked emotional fluctuation, or physical discomfort; the laboratory environment was controlled, and an initial resting baseline was recorded. The repeated-measures design, stress-relative change scores, and participant random intercepts also reduced some stable between-participant variation. However, caffeine intake, recent physical activity, respiration, and small movements during permitted head rotation were not formally standardized or continuously recorded. Environmental familiarity and current condition were recorded in the background questionnaire but were not included as covariates, and prior VR experience was not assessed using a standardized measure. Although the randomized presentation order reduced systematic order effects, residual fatigue, habituation, learning, carry-over, or declining physiological responsiveness across the six repeated cycles cannot be completely excluded. Future studies should standardize caffeine intake and recent physical activity, monitor respiration and movement, assess VR and site familiarity, and use longer and preferably ECG-validated recordings for HRV analysis.
Fifth, this study examined short-term responses during 2 min VR exposures and therefore cannot determine how long the observed changes persist, whether repeated exposure produces adaptation or cumulative restorative benefits, or whether they translate into longitudinal health outcomes. The physiological assessment was limited to EDA and HRV and did not capture respiratory, neuroendocrine, central nervous system, blood-pressure, or behavioral responses; these two indicators should therefore not be regarded as a complete representation of physiological restoration. Environmental familiarity was recorded, but prior VR experience and individual differences in sensory sensitivity, environmental preference, and stress reactivity were not comprehensively modeled. In addition, visual perception, soundscape perception, and perceived restoration were collected in the same post-exposure questionnaire, so their associations may be partly affected by common-method variance. Although mixed-effects models, participant random intercepts, multiple-testing adjustment, and cluster-bootstrap confidence intervals were used, estimates from the interaction and indirect-effect models may still depend on the selected predictor set, random-effects structure, and limited number of scene-level environmental configurations. Future studies should employ longitudinal and field-based designs, temporally separated and multi-source measurements, broader physiological and behavioral indicators, and preregistered sensitivity analyses across alternative model specifications. The abbreviated stress-induction procedure also did not establish a fully standardized TSST response because a separate preparation phase and endocrine biomarker confirmation were not included. Future studies should employ a standardized stress-induction protocol and combine autonomic measurements with salivary cortisol or other endocrine markers.
The proposed optimization strategies are preliminary design translations of the observed associations and have not yet been validated through before-and-after evaluation of implemented renewal projects. Future studies should therefore test specific urban village micro-renewal projects by comparing visual indicators, acoustic indicators, soundscape perception, perceived restoration, and physiological restoration before and after intervention to determine whether coordinated audio–visual micro-renewal improves the restorative quality of public spaces in practice.
5. Conclusions
This study examined associations among scene-level audio–visual conditions, subjective sensory appraisal, perceived restoration, and short-term physiological responses in six selected Shenzhen urban village public spaces using field measurements and a VR-based repeated-measures experiment. Four conclusions were drawn. First, restorativeness differed significantly across urban village public-space scenes. These differences were closely associated with greenness, building enclosure, sound quality, and sound source type, indicating that restoration in high-density public spaces cannot be explained by a single visual indicator or sound pressure metric. Second, in the full six-scene models, green view index and color complexity were positively associated with perceived restoration, whereas building enclosure and roughness were negatively associated. The leave-one-scene-out analysis showed that color complexity and roughness retained their respective directions, whereas the green-view-index and building-enclosure coefficients were sensitive to the exclusion of S5. LAeq had limited direct explanatory value for perceived restoration, suggesting that sound quality and sound source semantics may be more informative than sound intensity alone within the examined scenes. Third, the multilevel models identified statistical indirect associations consistent with perceptual-appraisal pathways between objective environments and perceived restoration. Green view index showed a positive indirect association with perceived restoration through visual perception, whereas roughness showed a negative indirect association through soundscape perception. These patterns support the relevance of subjective sensory appraisal but should not be interpreted as evidence of causal mediation. Fourth, the full-sample models identified objective audio–visual interactions, but their coefficients were sensitive to scene omission and should therefore be treated as exploratory. The full-sample results were consistent with possible acoustic constraint of favorable visual associations, but they do not support a stable general moderation effect. At the subjective level, positive soundscape perception and visual perception showed a significant positive interaction. Psychological and physiological restoration also showed different response patterns. The reversed EDA recovery score showed a stronger association with perceived restoration, whereas HRV showed an association with LAeq; these short-term patterns should be interpreted cautiously because the indicators capture different physiological processes and may be affected by residual confounding. Urban village renewal should therefore move beyond visual beautification alone and integrate soundscape management, visual optimization, and psychophysiological evaluation.
Overall, this study extends restorative environment research to a high-density urban village setting and provides an integrated account of how scene-level visual and acoustic conditions, subjective sensory appraisal, perceived restoration, and short-term physiological responses covary across repeated exposures. Its theoretical contribution is a context-dependent and conditional audio–visual account in which adverse auditory conditions may constrain favorable visual associations, positive visual and soundscape appraisals may reinforce one another, and perceived restoration and short-term physiological responses are treated as related but non-equivalent outcomes. The resulting audio–visual framework should be interpreted as context-specific evidence from six selected scenes, not as a universal causal mechanism or a set of validated quantitative design thresholds. Further studies should use multi-city and cross-cultural samples, larger numbers of independently sampled environmental scenes, more diverse participant groups, and field-based exposure to determine whether the observed relationships remain stable across different urban forms, climatic conditions, activity patterns, and cultural interpretations of public-space environments.
Author Contributions
D.Y. contributed to methodology, validation, formal analysis, investigation, data curation, visualization, funding acquisition, and writing—original draft. J.T. contributed to investigation, data curation, and writing—review and editing. Q.M. contributed to investigation, software, supervision, funding acquisition, and validation. Y.A. contributed to conceptualization, formal analysis, supervision, and writing—review and editing. All authors have read and agreed to the published version of the manuscript.
Funding
This work was supported by the National Natural Science Foundation of China (NSFC) (Grant Nos. 52208101 and 52478083).
Data Availability Statement
The raw data supporting the conclusions of this article will be made available by the authors on request.
Acknowledgments
The authors sincerely thank all participants who took part in the virtual reality experiments.
Conflicts of Interest
The authors declare no conflicts of interest.
Abbreviations
The following abbreviations are used in this manuscript:
| VR | Virtual Reality |
| EDA | Electrodermal Activity |
| HRV | Heart Rate Variability |
| VP | Subjective Visual Perception |
| AP | Soundscape Perception |
| SR | Perceived Restoration |
Appendix A
Table A1.
Results of the questionnaire reliability analysis.
Table A2.
Summary of the scale validity analysis.
Table A3.
Collinearity diagnostics for the objective audio–visual interaction models based on the six unique scene profiles.
Table A4.
Leave-one-scene-out sensitivity analysis of the principal scene-level associations.
References
- Chi, Y.L.; Mak, H.W.L. From Comparative and Statistical Assessments of Liveability and Health Conditions of Districts in Hong Kong towards Future City Development. Sustainability 2021, 13, 8781. [Google Scholar] [CrossRef] [Scilit]
- Hong, Y. Resident Participation in Urban Renewal: Focused on Sewoon Renewal Promotion Project and Kwun Tong Town Centre Project. Front. Archit. Res. 2018, 7, 197–210. [Google Scholar] [CrossRef] [Scilit]
- Xia, J.; Zhao, Z.; Chen, L.; Sun, Y. How Urban Renewal Affects the Sustainable Development of Public Spaces: Trends, Challenges, and Opportunities. Front. Environ. Sci. 2024, 12, 1482169. [Google Scholar] [CrossRef] [Scilit]
- Mak, H.W.L.; Koh, K. Building a Healthy Urban Environment in East Asia; Joint Lab on Future Cities (JLFC) Report; JLFC: Hong Kong, China, 2021; pp. 11–13. [Google Scholar]
- Wang, Y.P.; Wang, Y.; Wu, J. Urbanization and Informal Development in China: Urban Villages in Shenzhen. Int. J. Urban Reg. Res. 2009, 33, 957–973. [Google Scholar] [CrossRef] [Scilit]
- Pan, W.; Du, J. Towards Sustainable Urban Transition: A Critical Review of Strategies and Policies of Urban Village Renewal in Shenzhen, China. Land Use Policy 2021, 111, 105744. [Google Scholar] [CrossRef] [Scilit]
- Ulrich, R.S. View Through a Window May Influence Recovery from Surgery. Science 1984, 224, 420–421. [Google Scholar] [CrossRef] [Scilit] [PubMed]
- Ulrich, R.S.; Simons, R.F.; Losito, B.D.; Fiorito, E.; Miles, M.A.; Zelson, M. Stress Recovery during Exposure to Natural and Urban Environments. J. Environ. Psychol. 1991, 11, 201–230. [Google Scholar] [CrossRef] [Scilit]
- Kaplan, S. The Restorative Benefits of Nature: Toward an Integrative Framework. J. Environ. Psychol. 1995, 15, 169–182. [Google Scholar] [CrossRef] [Scilit]
- Peschardt, K.K.; Stigsdotter, U.K. Associations between Park Characteristics and Perceived Restorativeness of Small Public Urban Green Spaces. Landsc. Urban Plan. 2013, 112, 26–39. [Google Scholar] [CrossRef] [Scilit]
- Akpınar, A. How Perceived Sensory Dimensions of Urban Green Spaces Are Associated with Teenagers’ Perceived Restoration, Stress, and Mental Health? Landsc. Urban Plan. 2021, 214, 104185. [Google Scholar] [CrossRef] [Scilit]
- Aletta, F.; Kang, J.; Axelsson, Ö. Soundscape Descriptors and a Conceptual Framework for Developing Predictive Soundscape Models. Landsc. Urban Plan. 2016, 149, 65–74. [Google Scholar] [CrossRef] [Scilit]
- Alvarsson, J.J.; Wiens, S.; Nilsson, M.E. Stress Recovery during Exposure to Nature Sound and Environmental Noise. Int. J. Environ. Res. Public Health 2010, 7, 1036–1046. [Google Scholar] [CrossRef] [Scilit] [PubMed]
- Ratcliffe, E. Sound and Soundscape in Restorative Natural Environments: A Narrative Literature Review. Front. Psychol. 2021, 12, 570563. [Google Scholar] [CrossRef] [Scilit] [PubMed]
- Engel, M.S.; Fiebig, A.; Pfaffenbach, C.; Fels, J. A Review of the Use of Psychoacoustic Indicators on Soundscape Studies. Curr. Pollut. Rep. 2021, 7, 359–378. [Google Scholar] [CrossRef] [Scilit]
- Jeon, J.Y.; Hong, J.Y.; Lavandier, C.; Lafon, J.; Axelsson, Ö.; Hurtig, M. A Cross-National Comparison in Assessment of Urban Park Soundscapes in France, Korea, and Sweden through Laboratory Experiments. Appl. Acoust. 2018, 133, 107–117. [Google Scholar] [CrossRef] [Scilit]
- Liu, J.; Kang, J.; Behm, H.; Luo, T. Effects of Landscape on Soundscape Perception: Soundwalks in City Parks. Landsc. Urban Plan. 2014, 123, 30–40. [Google Scholar] [CrossRef] [Scilit]
- Jeon, J.Y.; Jo, H.I. Effects of Audio-Visual Interactions on Soundscape and Landscape Perception and Their Influence on Satisfaction with the Urban Environment. Build. Environ. 2020, 169, 106544. [Google Scholar] [CrossRef] [Scilit]
- Guo, X.; Liu, J.; Albert, C.; Hong, X.-C. Audio-Visual Interaction and Visitor Characteristics Affect Perceived Soundscape Restorativeness: Case Study in Five Parks in China. Urban For. Urban Green. 2022, 77, 127738. [Google Scholar] [CrossRef] [Scilit]
- Korpela, K.M.; Hartig, T.; Kaiser, F.G.; Fuhrer, U. Restorative Experience and Self-Regulation in Favorite Places. Environ. Behav. 2001, 33, 572–589. [Google Scholar] [CrossRef] [Scilit]
- Jeon, J.Y.; Jo, H.I.; Lee, K. Potential Restorative Effects of Urban Soundscapes: Personality Traits, Temperament, and Perceptions of VR Urban Environments. Landsc. Urban Plan. 2021, 214, 104188. [Google Scholar] [CrossRef] [Scilit]
- Knaust, T.; Felnhofer, A.; Kothgassner, O.D.; Höllmer, H.; Gorzka, R.-J.; Schulz, H. Exposure to Virtual Nature: The Impact of Different Immersion Levels on Skin Conductance Level, Heart Rate, and Perceived Relaxation. Virtual Real. 2022, 26, 925–938. [Google Scholar] [CrossRef] [Scilit]
- Allen, A.P.; Kennedy, P.J.; Dockray, S.; Cryan, J.F.; Dinan, T.G.; Clarke, G. The Trier Social Stress Test: Principles and Practice. Neurobiol. Stress 2017, 6, 113–126. [Google Scholar] [CrossRef] [Scilit] [PubMed]
- Ergan, S.; Radwan, A.; Zou, Z.; Tseng, H.; Han, X. Quantifying Human Experience in Architectural Spaces with Integrated Virtual Reality and Body Sensor Networks. J. Comput. Civ. Eng. 2019, 33, 04018062. [Google Scholar] [CrossRef] [Scilit]
- Shaffer, F.; Ginsberg, J.P. An Overview of Heart Rate Variability Metrics and Norms. Front. Public Health 2017, 5, 258. [Google Scholar] [CrossRef] [Scilit] [PubMed]
- Li, S.; Sung, B.; Lin, Y.; Mitas, O. Electrodermal Activity Measure: A Methodological Review. Ann. Tour. Res. 2022, 96, 103460. [Google Scholar] [CrossRef] [Scilit]
- Jeon, J.Y.; Jo, H.I.; Lee, K. Psycho-Physiological Restoration with Audio-Visual Interactions through Virtual Reality Simulations of Soundscape and Landscape Experiences in Urban, Waterfront, and Green Environments. Sustain. Cities Soc. 2023, 99, 104929. [Google Scholar] [CrossRef] [Scilit]
- Zhao, J.; Xu, W.; Ye, L. Effects of Auditory-Visual Combinations on Perceived Restorative Potential of Urban Green Space. Appl. Acoust. 2018, 141, 169–177. [Google Scholar] [CrossRef] [Scilit]
- Birkett, M.A. The Trier Social Stress Test Protocol for Inducing Psychological Stress. J. Vis. Exp. 2011, 3238. [Google Scholar] [CrossRef] [Scilit] [PubMed]
- Labuschagne, I.; Grace, C.; Rendell, P.; Terrett, G.; Heinrichs, M. An Introductory Guide to Conducting the Trier Social Stress Test. Neurosci. Biobehav. Rev. 2019, 107, 686–695. [Google Scholar] [CrossRef] [Scilit] [PubMed]
- Narvaez Linares, N.F.; Charron, V.; Ouimet, A.J.; Labelle, P.R.; Plamondon, H. A Systematic Review of the Trier Social Stress Test Methodology: Issues in Promoting Study Comparison and Replicable Research. Neurobiol. Stress 2020, 13, 100235. [Google Scholar] [CrossRef] [Scilit] [PubMed]
- Han, K.-T. A Reliable and Valid Self-Rating Measure of the Restorative Quality of Natural Environments. Landsc. Urban Plan. 2003, 64, 209–232. [Google Scholar] [CrossRef] [Scilit]
- Dunbavin, P. ISO/TS 12913-2: 2018—Soundscape—Part 2: Data Collection and Reporting Requirements—What’s It All about. Acoust. Bull 2018, 43, 55–57. [Google Scholar]
- Aletta, F.; Torresin, S. Adoption of ISO/TS 12913-2:2018 Protocols for Data Collection From Individuals in Soundscape Studies: An Overview of the Literature. Curr. Pollut. Rep. 2023, 9, 710–723. [Google Scholar] [CrossRef] [Scilit]
- Cowley, B.; Filetti, M.; Lukander, K.; Torniainen, J.; Henelius, A.; Ahonen, L.; Barral, O.; Kosunen, I.; Valtonen, T.; Huotilainen, M.; et al. The Psychophysiology Primer: A Guide to Methods and a Broad Review with a Focus on Human–Computer Interaction. Found. Trends Hum.-Comput. Interact. 2016, 9, 151–308. [Google Scholar] [CrossRef] [Scilit]
- Laborde, S.; Mosley, E.; Thayer, J.F. Heart Rate Variability and Cardiac Vagal Tone in Psychophysiological Research—Recommendations for Experiment Planning, Data Analysis, and Data Reporting. Front. Psychol. 2017, 8, 213. [Google Scholar] [CrossRef] [Scilit] [PubMed]
- Meteyard, L.; Davies, R.A.I. Best Practice Guidance for Linear Mixed-Effects Models in Psychological Science. J. Mem. Lang. 2020, 112, 104092. [Google Scholar] [CrossRef] [Scilit]
- Bakdash, J.Z.; Marusich, L.R. Repeated Measures Correlation. Front. Psychol. 2017, 8, 456. [Google Scholar] [CrossRef] [Scilit] [PubMed]
- Hartig, T.; Evans, G.W.; Jamner, L.D.; Davis, D.S.; Gärling, T. Tracking Restoration in Natural and Urban Field Settings. J. Environ. Psychol. 2003, 23, 109–123. [Google Scholar] [CrossRef] [Scilit]
- Masoudinejad, S.; Hartig, T. Window View to the Sky as a Restorative Resource for Residents in Densely Populated Cities. Environ. Behav. 2020, 52, 401–436. [Google Scholar] [CrossRef] [Scilit]
- Park, K.; Ergan, S. Quantification of the Impact of Street Design Features on Restorative Quality in Urban Settings. Sustain. Cities Soc. 2025, 121, 106216. [Google Scholar] [CrossRef] [Scilit]
- ISO 12913-1:2014; Acoustics—Soundscape Part 1: Definition and Conceptual Framework. ISO: Geneva, Switzerland, 2014.
- Axelsson, Ö.; Nilsson, M.E.; Berglund, B. A Principal Components Model of Soundscape Perception. J. Acoust. Soc. Am. 2010, 128, 2836–2846. [Google Scholar] [CrossRef] [Scilit] [PubMed]
- Aletta, F.; Oberman, T.; Kang, J. Associations between Positive Health-Related Effects and Soundscapes Perceptual Constructs: A Systematic Review. Int. J. Environ. Res. Public Health 2018, 15, 2392. [Google Scholar] [CrossRef] [Scilit] [PubMed]
- Ratcliffe, E.; Gatersleben, B.; Sowden, P.T. Bird Sounds and Their Contributions to Perceived Attention Restoration and Stress Recovery. J. Environ. Psychol. 2013, 36, 221–228. [Google Scholar] [CrossRef] [Scilit]
- Hong, J.Y.; Jeon, J.Y. Designing Sound and Visual Components for Enhancement of Urban Soundscapes. J. Acoust. Soc. Am. 2013, 134, 2026–2036. [Google Scholar] [CrossRef] [Scilit] [PubMed]
- Li, X.; Zhang, C.; Li, W.; Ricard, R.; Meng, Q.; Zhang, W. Assessing Street-Level Urban Greenery Using Google Street View and a Modified Green View Index. Urban For. Urban Green. 2015, 14, 675–685. [Google Scholar] [CrossRef] [Scilit]
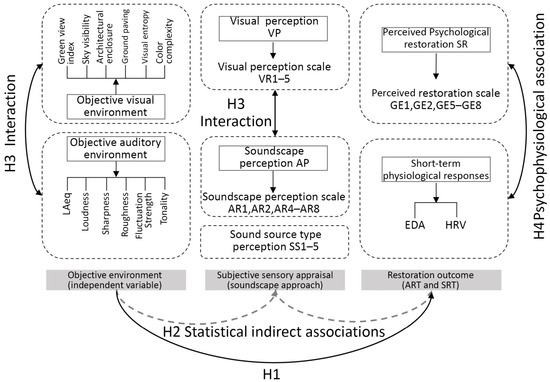
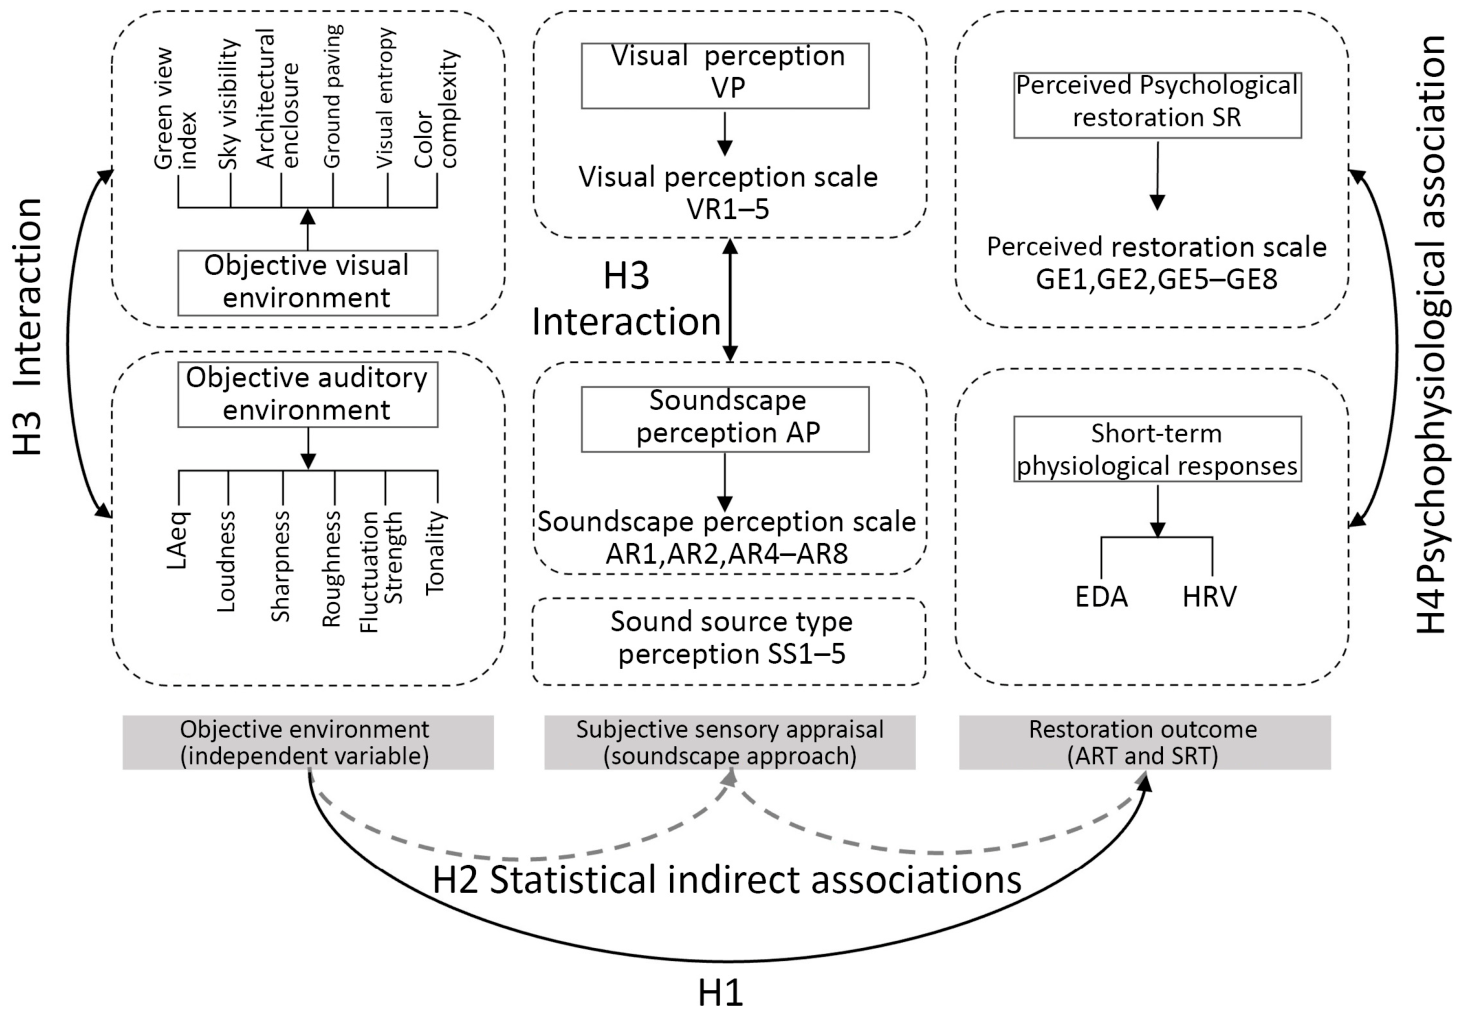
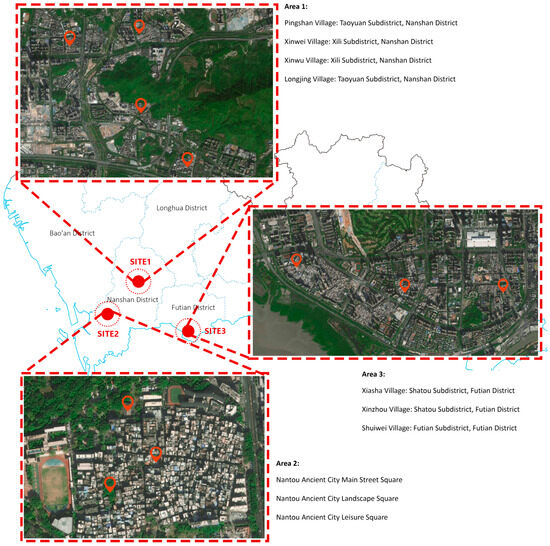
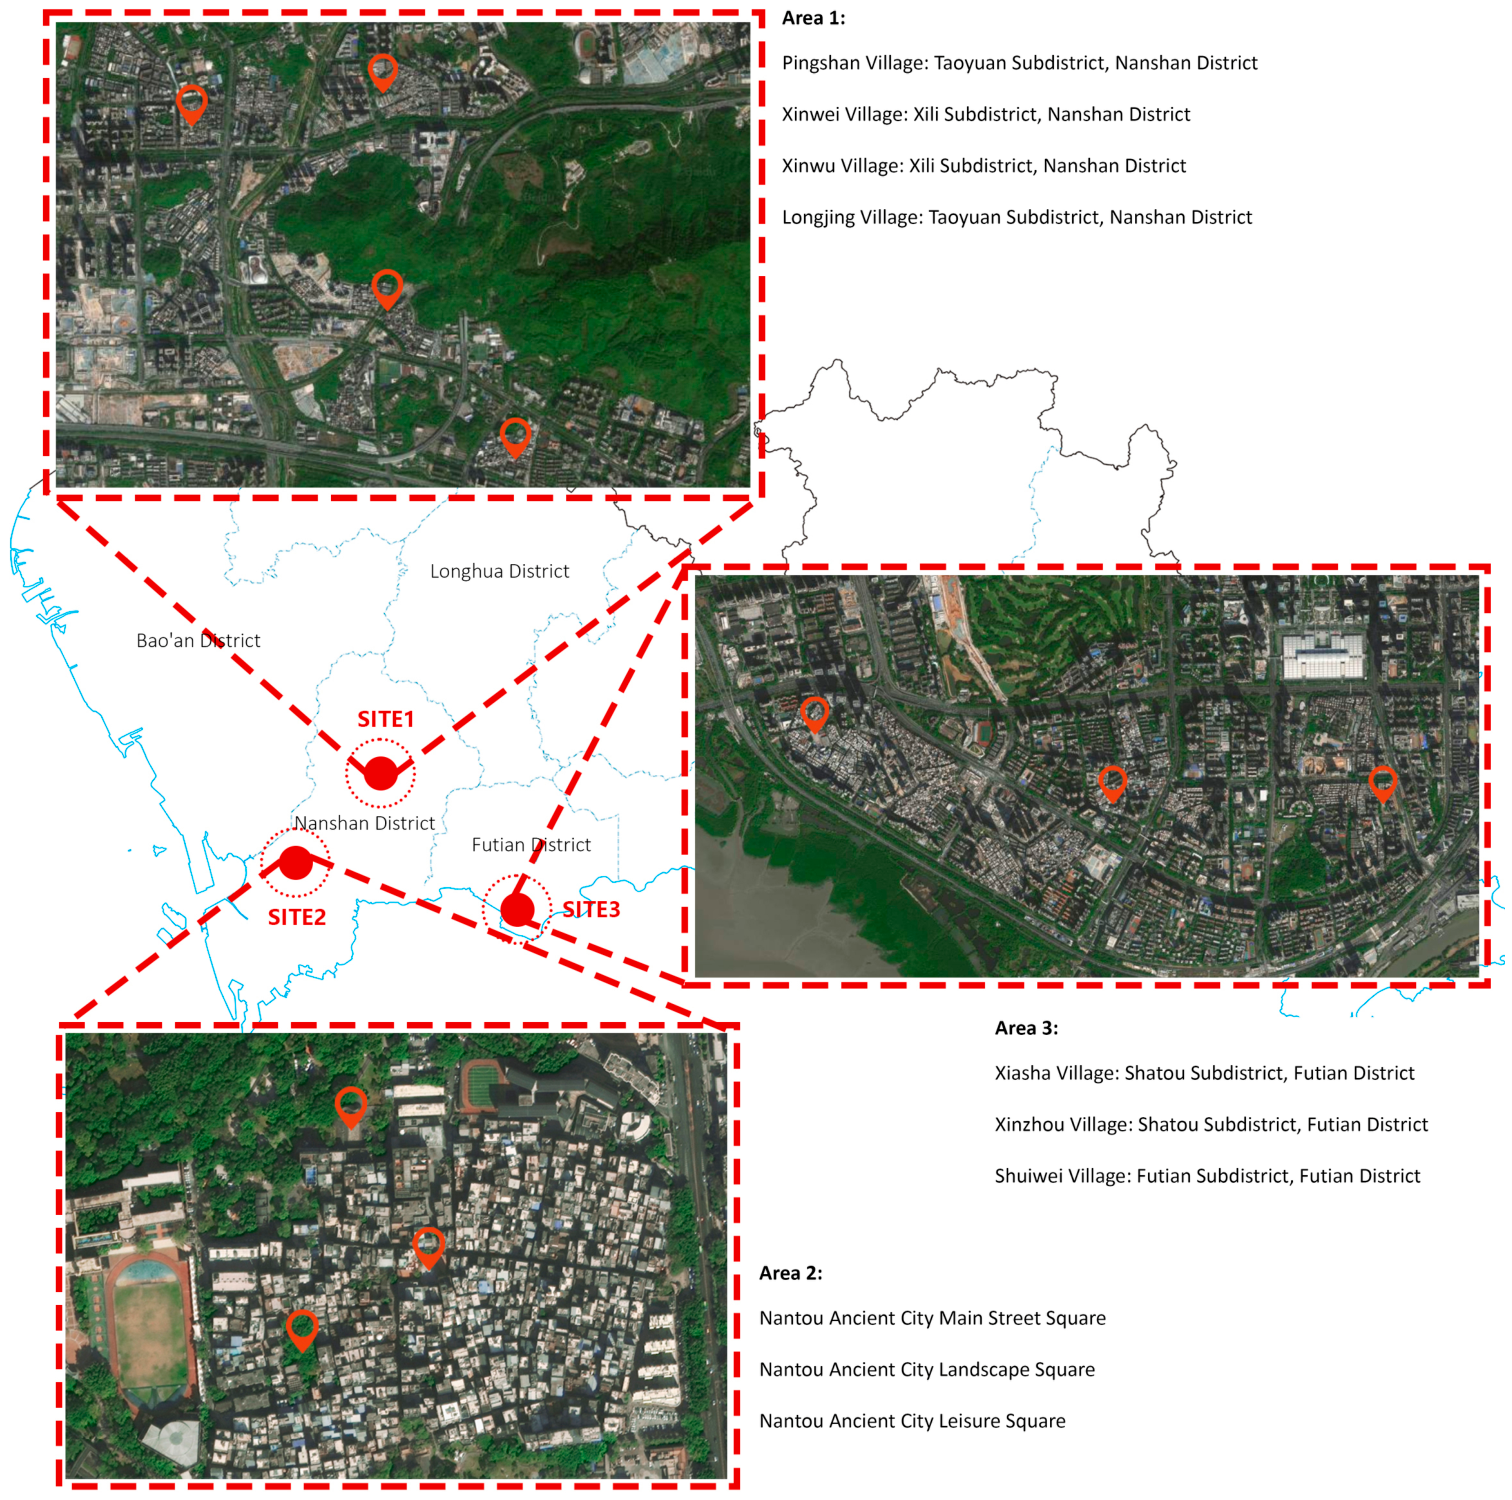
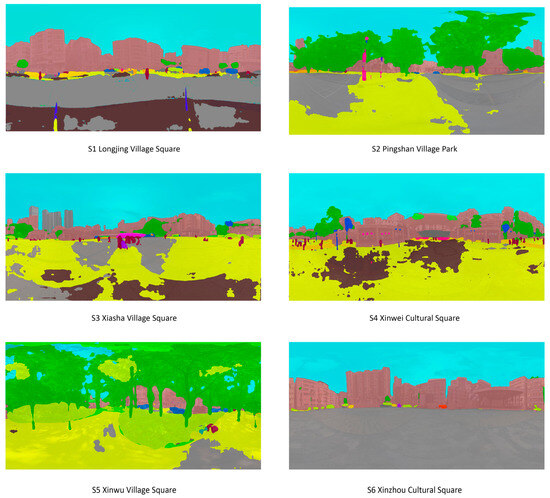
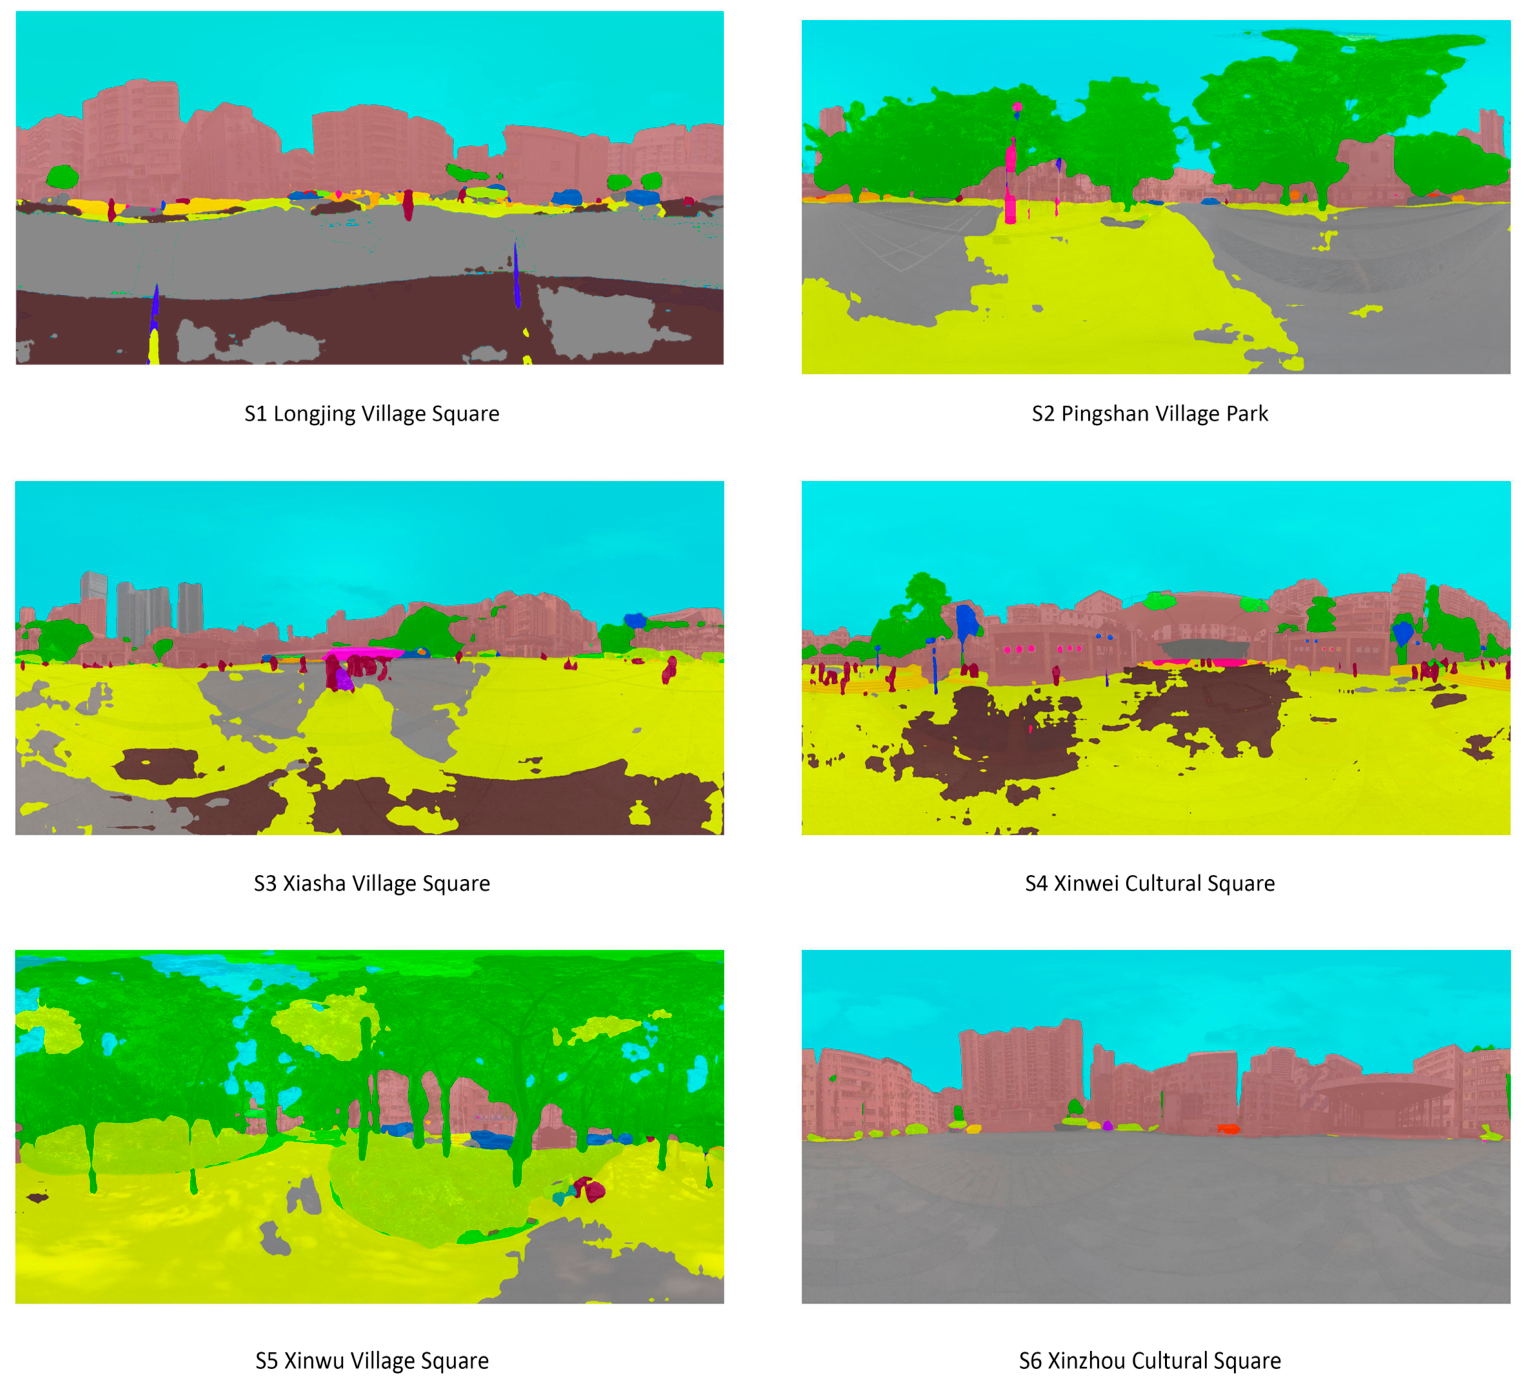
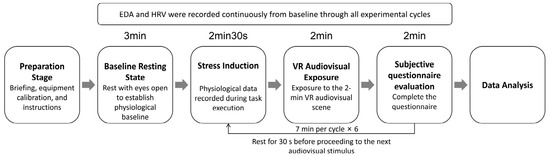
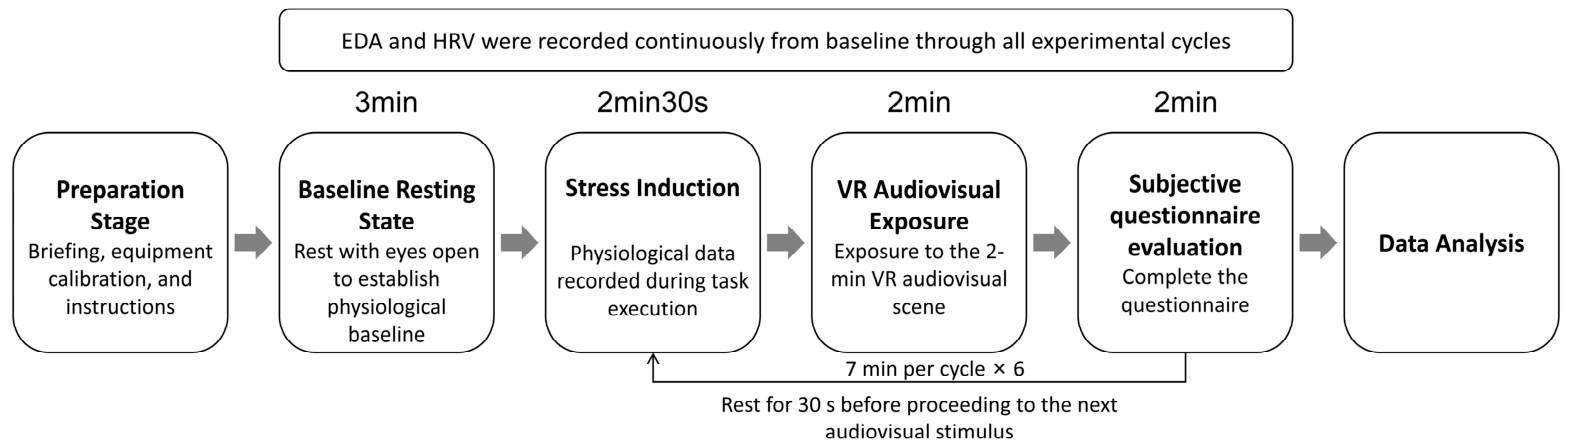
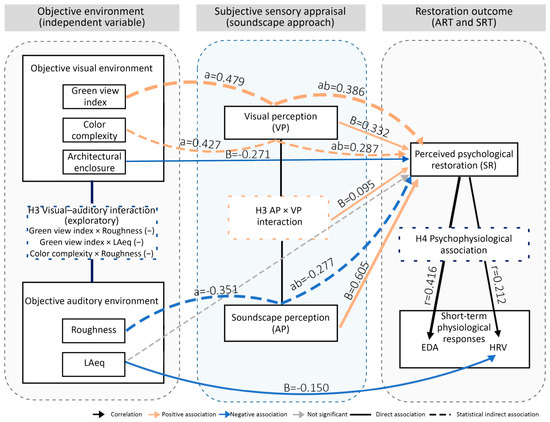
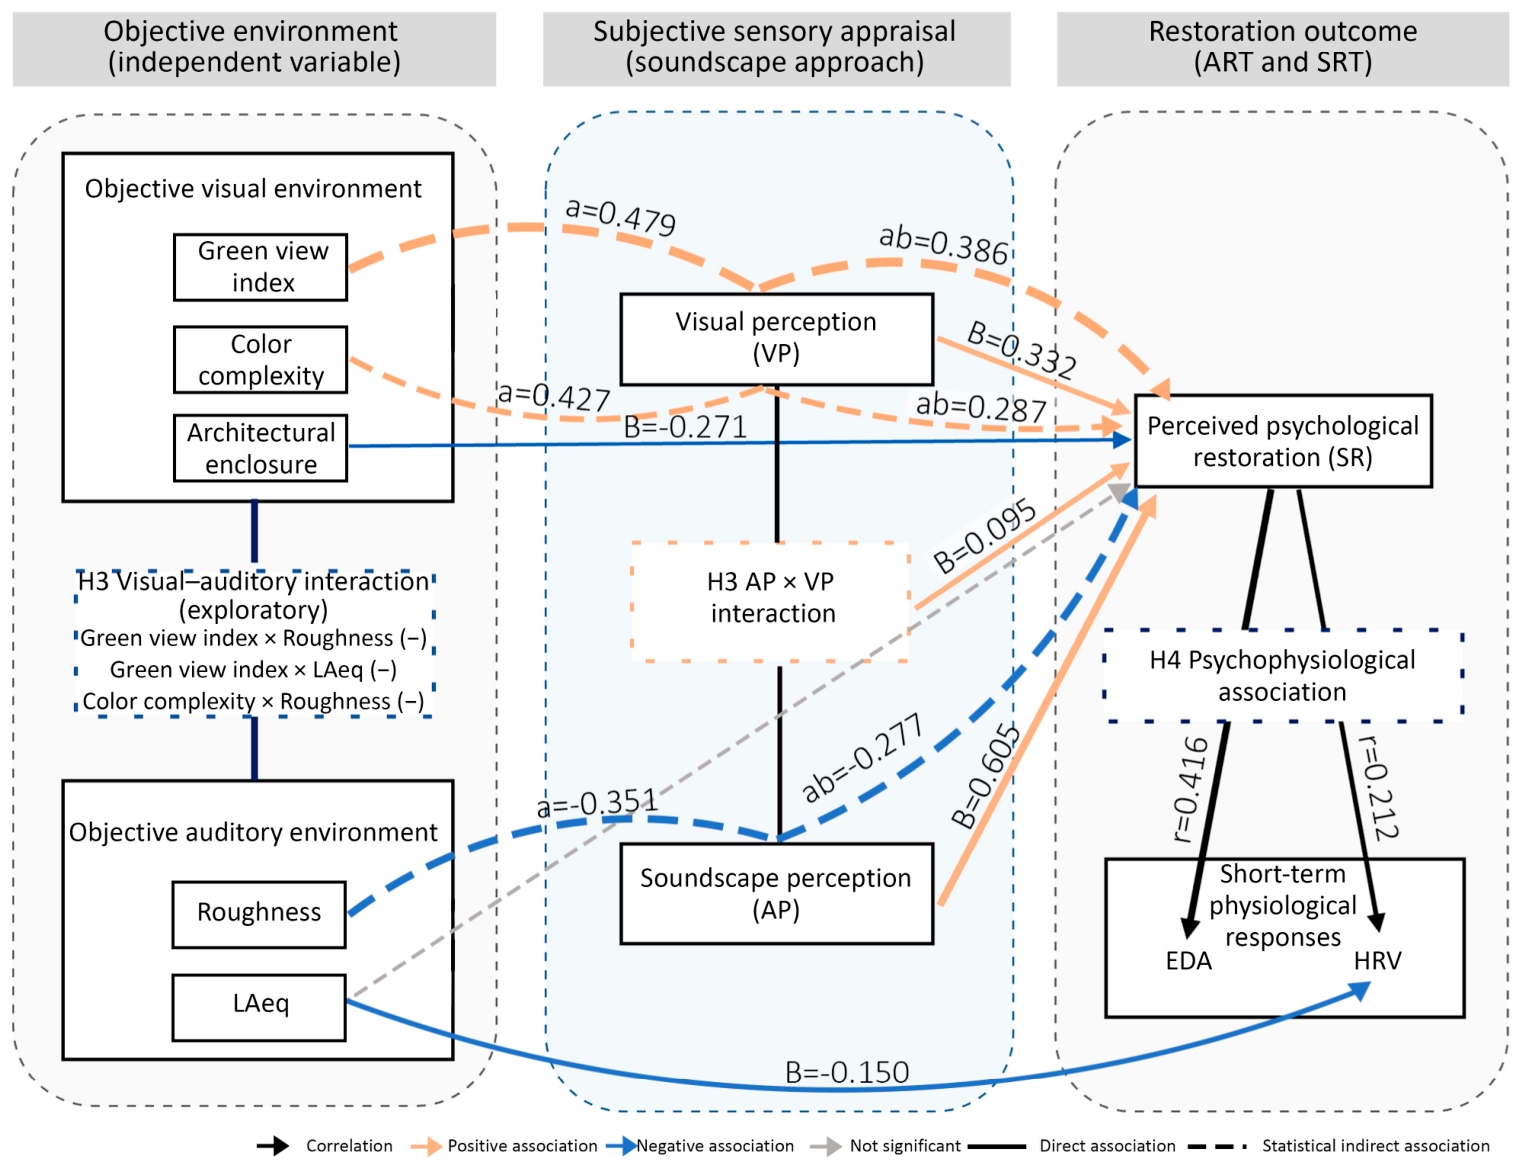

Disclaimer/Publisher’s Note: The statements, opinions and data contained in all publications are solely those of the individual author(s) and contributor(s) and not of MDPI and/or the editor(s). MDPI and/or the editor(s) disclaim responsibility for any injury to people or property resulting from any ideas, methods, instructions or products referred to in the content. |
© 2026 by the authors. Licensee MDPI, Basel, Switzerland. This article is an open access article distributed under the terms and conditions of the Creative Commons Attribution (CC BY) license.