


Abstract
Building information modeling (BIM) based on the Industry Foundation Classes (IFC) standard contains rich geometric and semantic information for representing building structures. However, most IFC viewers focus primarily on three-dimensional visualization and provide limited support for spatial relationship analyses. This paper presents XeoBIM Viewer, an IFC-based BIM viewer that supports spatial analysis through integrated visualization and graph-based representation. The system extracts spaces, boundaries, and openings from IFC data and derives spatial relationships through a geometric analysis of opening-to-space and space-to-space connectivity. These relationships are represented as a graph model, where spaces are nodes and openings are edges, enabling an intuitive analysis of spatial adjacency and connectivity. XeoBIM Viewer integrates a three-dimensional BIM model view, story-based two-dimensional floor plan view, and space relationship graph view within a unified interface. These views are interactively synchronized, enabling users to explore building spatial structures from multiple perspectives. The proposed system was validated using real-world IFC building models with different levels of complexity. The experimental results demonstrate that XeoBIM Viewer can effectively extract spatial information, generate floor plans, construct accurate space connectivity graphs, and provide reliable spatial relationship analysis.
1. Introduction
Building information modeling (BIM) is a key technology for the integrated use of information across the design, construction, and maintenance phases of the construction industry. The Industry Foundation Classes (IFC) standard is widely adopted as a representative open standard to ensure interoperability among BIM data and preserve both geometric and semantic building information [1]. IFC data contain not only geometric information but also semantic information such as spaces, stories, openings (e.g., doors, windows, and curtain walls), and their relationships, enabling the analysis of building spatial structures, circulation paths, and visual characteristics. Recent studies have further demonstrated that IFC serves not only as a neutral data exchange standard but also as a semantic information model supporting intelligent analysis, digital twins, and infrastructure management. For example, Xu et al. proposed a bridge information model-based semantic segmentation framework that integrates multisensor information with infrastructure information models for the semantic interpretation of bridge components [2]. Sharafat et al. developed IFC-based information modeling frameworks for tunnel information modeling and BIM–GIS integration, demonstrating that IFC semantic information can effectively support visualization, interoperability, and infrastructure management [3,4]. Furthermore, Buruzs et al. proposed an IFC semantic enrichment approach that generates IfcSpace entities and accessibility graphs for room classification [5], whereas Zhao et al. presented an IFC-based indoor space extraction method that automatically constructs topological graph models representing connectivity among indoor spaces [6]. These studies highlighted the growing importance of the semantic interpretation and graph-based representation of IFC data.
However, existing IFC-based BIM viewers are primarily designed for three-dimensional (3D) geometric visualization and have limitations in systematically analyzing spatial semantic information such as the adjacency relationships between spaces, access structures, and boundary conditions. In particular, although the opening elements connecting spaces play a critical role in accessibility and circulation analyses, most viewers do not provide intuitive functions for interpreting these relationships from a spatial perspective. Previous studies have explored the extraction of indoor spatial information from IFC data [6], semantic enrichment of IfcSpace entities using graph-based approaches [5], and IFC-based semantic information integration for infrastructure applications [3,4]; however, the capabilities of existing viewer systems remain limited.
This paper proposes XeoBIM Viewer, an IFC-based BIM viewer that can interpret spatial, boundary, and opening information from IFC data and visualize spatial relationships through 3D models, two-dimensional (2D) floor plans, and graph structures. In addition to serving as a simple 3D visualization tool, the proposed system supports spatial analysis and interpretation. Unlike conventional IFC viewers that primarily emphasize geometric visualization, the proposed system integrates semantic interpretation with graph-based spatial representation while preserving IFC entity identifiers, thereby enabling intuitive analyses of adjacency, accessibility, and circulation relationships. Ultimately, this paper aims to establish a foundation for an analysis-oriented BIM viewer that can be applied to architectural design reviews, space utilization assessments, evacuation planning, and circulation analysis.
The proposed XeoBIM Viewer integrates IFC-based spatial information extraction, geometric relationship analysis, graph construction, and multi-view visualization within a unified framework. First, geometric and semantic information is extracted from IFC building models, including spaces, stories, and opening elements such as doors, windows, and curtain walls. Second, story-based sectional boundaries are generated from the extracted geometry, and spatial relationships are identified through geometric analysis, including opening-to-space associations and direct room-to-room adjacency. Third, the identified relationships are transformed into a semantic space–connector graph, where spaces are represented as nodes and opening elements or adjacency relationships are represented as graph edges, enabling an intuitive analysis of spatial connectivity and accessibility. Fourth, the generated information is integrated into a synchronized 3D BIM, 2D floor plan, and graph-based visualization environment, enabling users to explore building spatial structures from multiple perspectives. The proposed system was validated using IFC building models with different levels of complexity; specifically, the processing performance and accuracy of the generated spatial relationship graphs were evaluated. The experimental results demonstrated the effectiveness, robustness, and applicability of the proposed approach for IFC-based spatial analysis and visualization.
2. Literature Review
This section reviews previous studies on BIM-based spatial information representation and analyses. The functionalities and limitations of IFC-based BIM viewers are examined, and spatial network models (SNMs) representing relationships between spaces are discussed.
2.1. IFC-Based BIM Viewers
IFC is widely used as an international standard to support interoperability among BIM data. Based on this standard, various BIM viewers have been developed to visualize and review building models. Existing IFC-based BIM viewers have evolved primarily around functions such as 3D geometry visualization, object property inspection, section generation, and visibility control [7,8]. These functions have been considered effective for fundamental applications such as design reviews and clash detection [9]. In addition, some viewers provide collaborative features, including annotation, issue management, and model comparison, thereby expanding their application scope.
However, most IFC viewers focus on the representation of individual objects and, therefore, have limitations in systematically analyzing the relationships between spaces or the internal spatial structure of buildings. In particular, spaces are typically represented as independent objects or are accessible only through attribute information, whereas structural relationships mediated by opening elements such as doors and windows are not explicitly interpreted. Consequently, the semantic information embedded in IFC data remains largely at the level of visual representation, limiting its use in higher-level applications such as spatial structure and circulation analyses. Furthermore, these viewers often fail to adequately reflect spatial usage characteristics by integrating factors such as connectivity, accessibility, and visual continuity between spaces. These limitations also restrict applications such as evacuation route and user-behavior analyses in complex buildings.
Existing IFC viewers also differ in terms of operating system support and source-code availability. Many commercial viewers are primarily available in Windows-based environments, whereas support for macOS and Linux is often limited [10]. Although several free viewers are available, their licensing terms may restrict functional extensions or modifications to analysis algorithms. Open-source IFC viewers have also been developed; however, most of them focus primarily on visualization and property inspection, and advanced analytical capabilities such as spatial topology analysis and network-based structural interpretation are often insufficiently implemented [11,12]. Consequently, limitations exist in implementing customized analytical functions that satisfy diverse user requirements.
Table 1 presents a comparative analysis of existing desktop-based BIM viewers in terms of platform type, key functionalities, operating system support, licensing conditions, IFC compatibility, and source-code availability. Web-based BIM viewers and cloud collaboration platforms have recently emerged to improve accessibility and collaborative efficiency. However, their capability to quantitatively analyze spatial relationships or represent them as network structures remains limited [10,13]. In addition, technical challenges such as performance degradation when handling large-scale models and the dependence on network-based data transmission remain unresolved.
Table 1.
Types and characteristics of BIM viewers.
2.2. Spatial Network Models and Graph-Based Representation of Spatial Relationships
An SNM is an analytical framework that abstracts and represents individual spaces and their relationships within architectural and spatial systems. It encompasses both graphical and non-graphical representations. The primary objective of SNMs is to simplify complex spatial structures into interpretable forms, enabling a systematic analysis of connectivity, accessibility, and interactions among spaces.
The theoretical foundation of SNMs is graph theory. Graph theory provides a mathematical and visual framework for representing the relationships between objects, where objects are represented as nodes and relationships as edges. This structure enables efficient quantitative analysis [20] and effectively reveals the interactions among components within complex systems. Originating from Euler’s solution to the Königsberg bridge problem [21], graph theory has been widely applied in architecture, urban planning, transportation engineering, and many other engineering disciplines.
Recently, graph-based representations have become an active research topic for analyzing complex 3D models beyond the architectural domain. Ning et al. [22] proposed a dynamic clustering framework based on an inertial feature encoder to automatically organize large repositories of computer-aided design (CAD) models. Their method demonstrated that learned feature representations can effectively support model retrieval and organization without relying solely on manually defined geometric rules. Although this paper focuses on CAD model management rather than BIM analysis, it highlights the increasing importance of structured representations for large-scale 3D model repositories.
Similarly, Wu et al. [2] proposed a graph construction and clustering framework for no-reference point cloud quality assessment. Their method demonstrates that graph structures effectively preserve the structural characteristics of complex 3D point clouds and provide an efficient representation for analyzing geometric relationships. These studies indicated that graph-based representations continue to play an important role in analyzing 3D spatial structures across various application domains.
Unlike CAD models or point clouds, BIM models inherently contain explicit semantic information defined by the IFC schema. Spatial entities, such as IfcSpace, and opening elements, including IfcDoor, IfcWindow, and IfcCurtainWall, explicitly describe the topological relationships among spaces. Consequently, IFC-based graph construction can directly utilize semantic relationships instead of relying solely on geometric similarities or learned feature representations.
In architecture, graph theory has evolved into SNMs that represent the topological relationships between spaces. These models enable the analysis of spatial connectivity, accessibility, and movement flows. One representative example is Space Syntax [18], which represents spaces using axial lines or segments and quantitatively evaluates human movement patterns and spatial usage through measures such as integration.
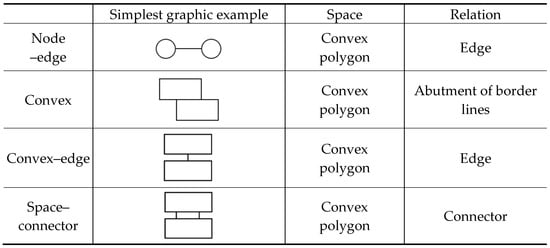
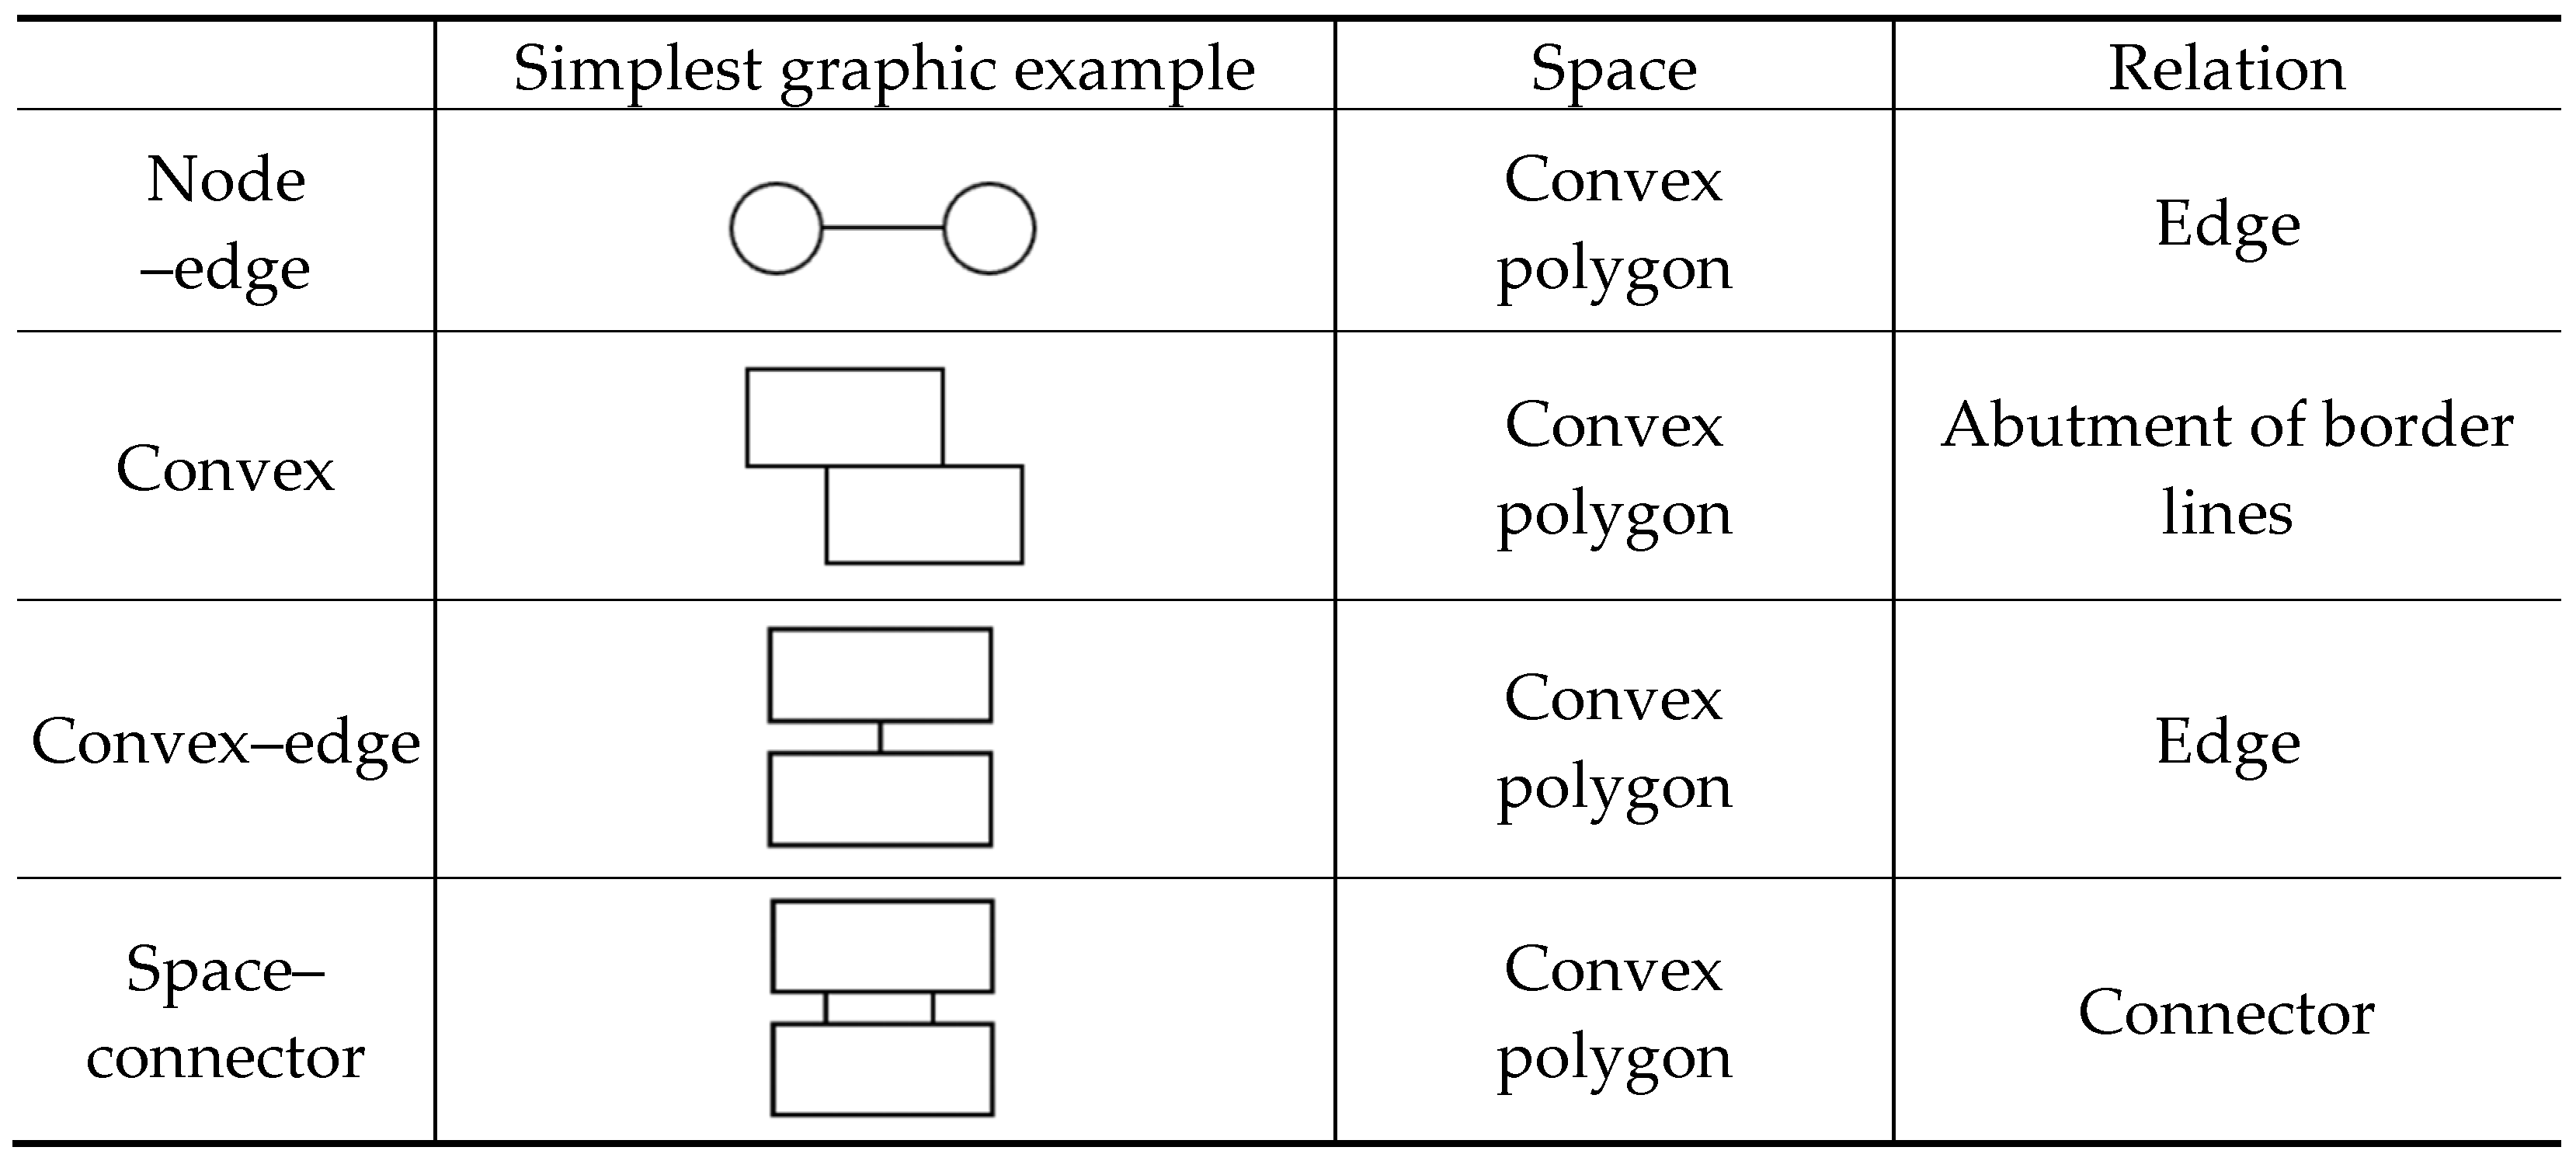
SNMs can be classified into several types according to their representation methods and information levels, as illustrated in Figure 1. The most basic form, the node-edge model, represents spaces as nodes and relationships as edges. This approach offers computational efficiency and structural simplicity but has limited capability to represent geometric characteristics or detailed relationship attributes. The convex model defines spaces as convex polygons and represents relationships based on spatial adjacency, thereby incorporating some geometric characteristics. However, semantic information regarding relationships remains limited. The convex–edge model explicitly represents spatial boundaries as edges to enhance relationship definitions; however, it still has limitations in expressing complex attributes such as opening types and visual connectivity.
Figure 1.
Spatial network models.
The space–connector model [23] was proposed to address these limitations. This model preserves spaces like convex polygons, while defining the connecting elements between spaces, such as doors, windows, and curtain walls, as independent objects. Consequently, it can represent not only the connectivity but also the geometric and visual attributes of openings, including type, size, location, and permeability. Compared with conventional models, the space–connector model provides enhanced representational capability and analytical potential. In particular, it enables a more precise analysis of complex spatial experiences, including mobility, visibility, and spatial openness, and can therefore be regarded as an integrated extension of existing SNMs.
2.3. Review of Previous Studies
Previous studies on IFC-based BIM viewers have primarily concentrated on 3D visualization, property inspection, and model navigation. Although these systems effectively support geometric visualization and basic BIM review tasks, they provide limited functionality for systematically interpreting the semantic-spatial relationships embedded in IFC models, including adjacency, accessibility, circulation paths, and boundary conditions.
Recent BIM studies expanded the application of IFC by extracting spatial semantics, enriching IfcSpace information, and constructing graph-based spatial representations. Studies in related domains have demonstrated that feature learning, graph construction, and clustering techniques are effective for organizing and analyzing large-scale 3D datasets. Nevertheless, these studies primarily focused on model management, semantic enrichment, or analytical methodologies and rarely provide an integrated visualization environment that enables users to interactively explore semantic spatial relationships directly within an IFC-based BIM viewer.
The proposed XeoBIM Viewer addresses these limitations by providing an integrated framework for interpreting spatial, boundary, and opening information directly from IFC data. Spatial–opening relationships are modeled using the space-connector concept and represented through a node–edge graph structure. Furthermore, the system integrates a 3D BIM model, story-based 2D floor plans, and spatial relationship graphs within a unified interface. By enabling synchronized exploration and analysis across multiple representations, XeoBIM Viewer offers a comprehensive BIM viewer environment for spatial structure analysis, which distinguishes it from previous studies.
3. System Architecture
This section presents the architecture of the proposed XeoBIM Viewer and the methodology used to construct semantic spatial relationships from IFC models. This system integrates IFC parsing, geometric processing, spatial relationship identification, graph construction, and visualization into a unified framework. Following an overview of the system architecture, this section describes the geometric procedures for extracting space boundaries, identifying opening-to-space and space-to-space relationships, and generating a semantic space–connector graph for spatial analysis.
3.1. System Overview
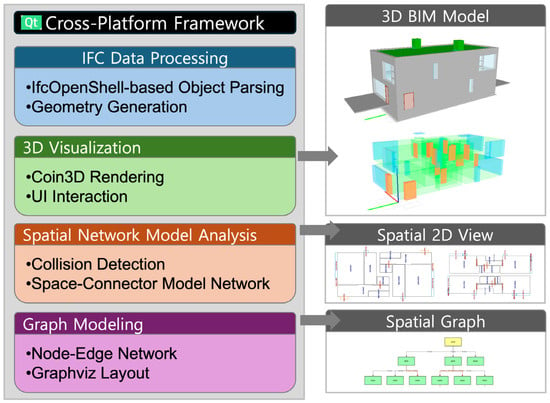
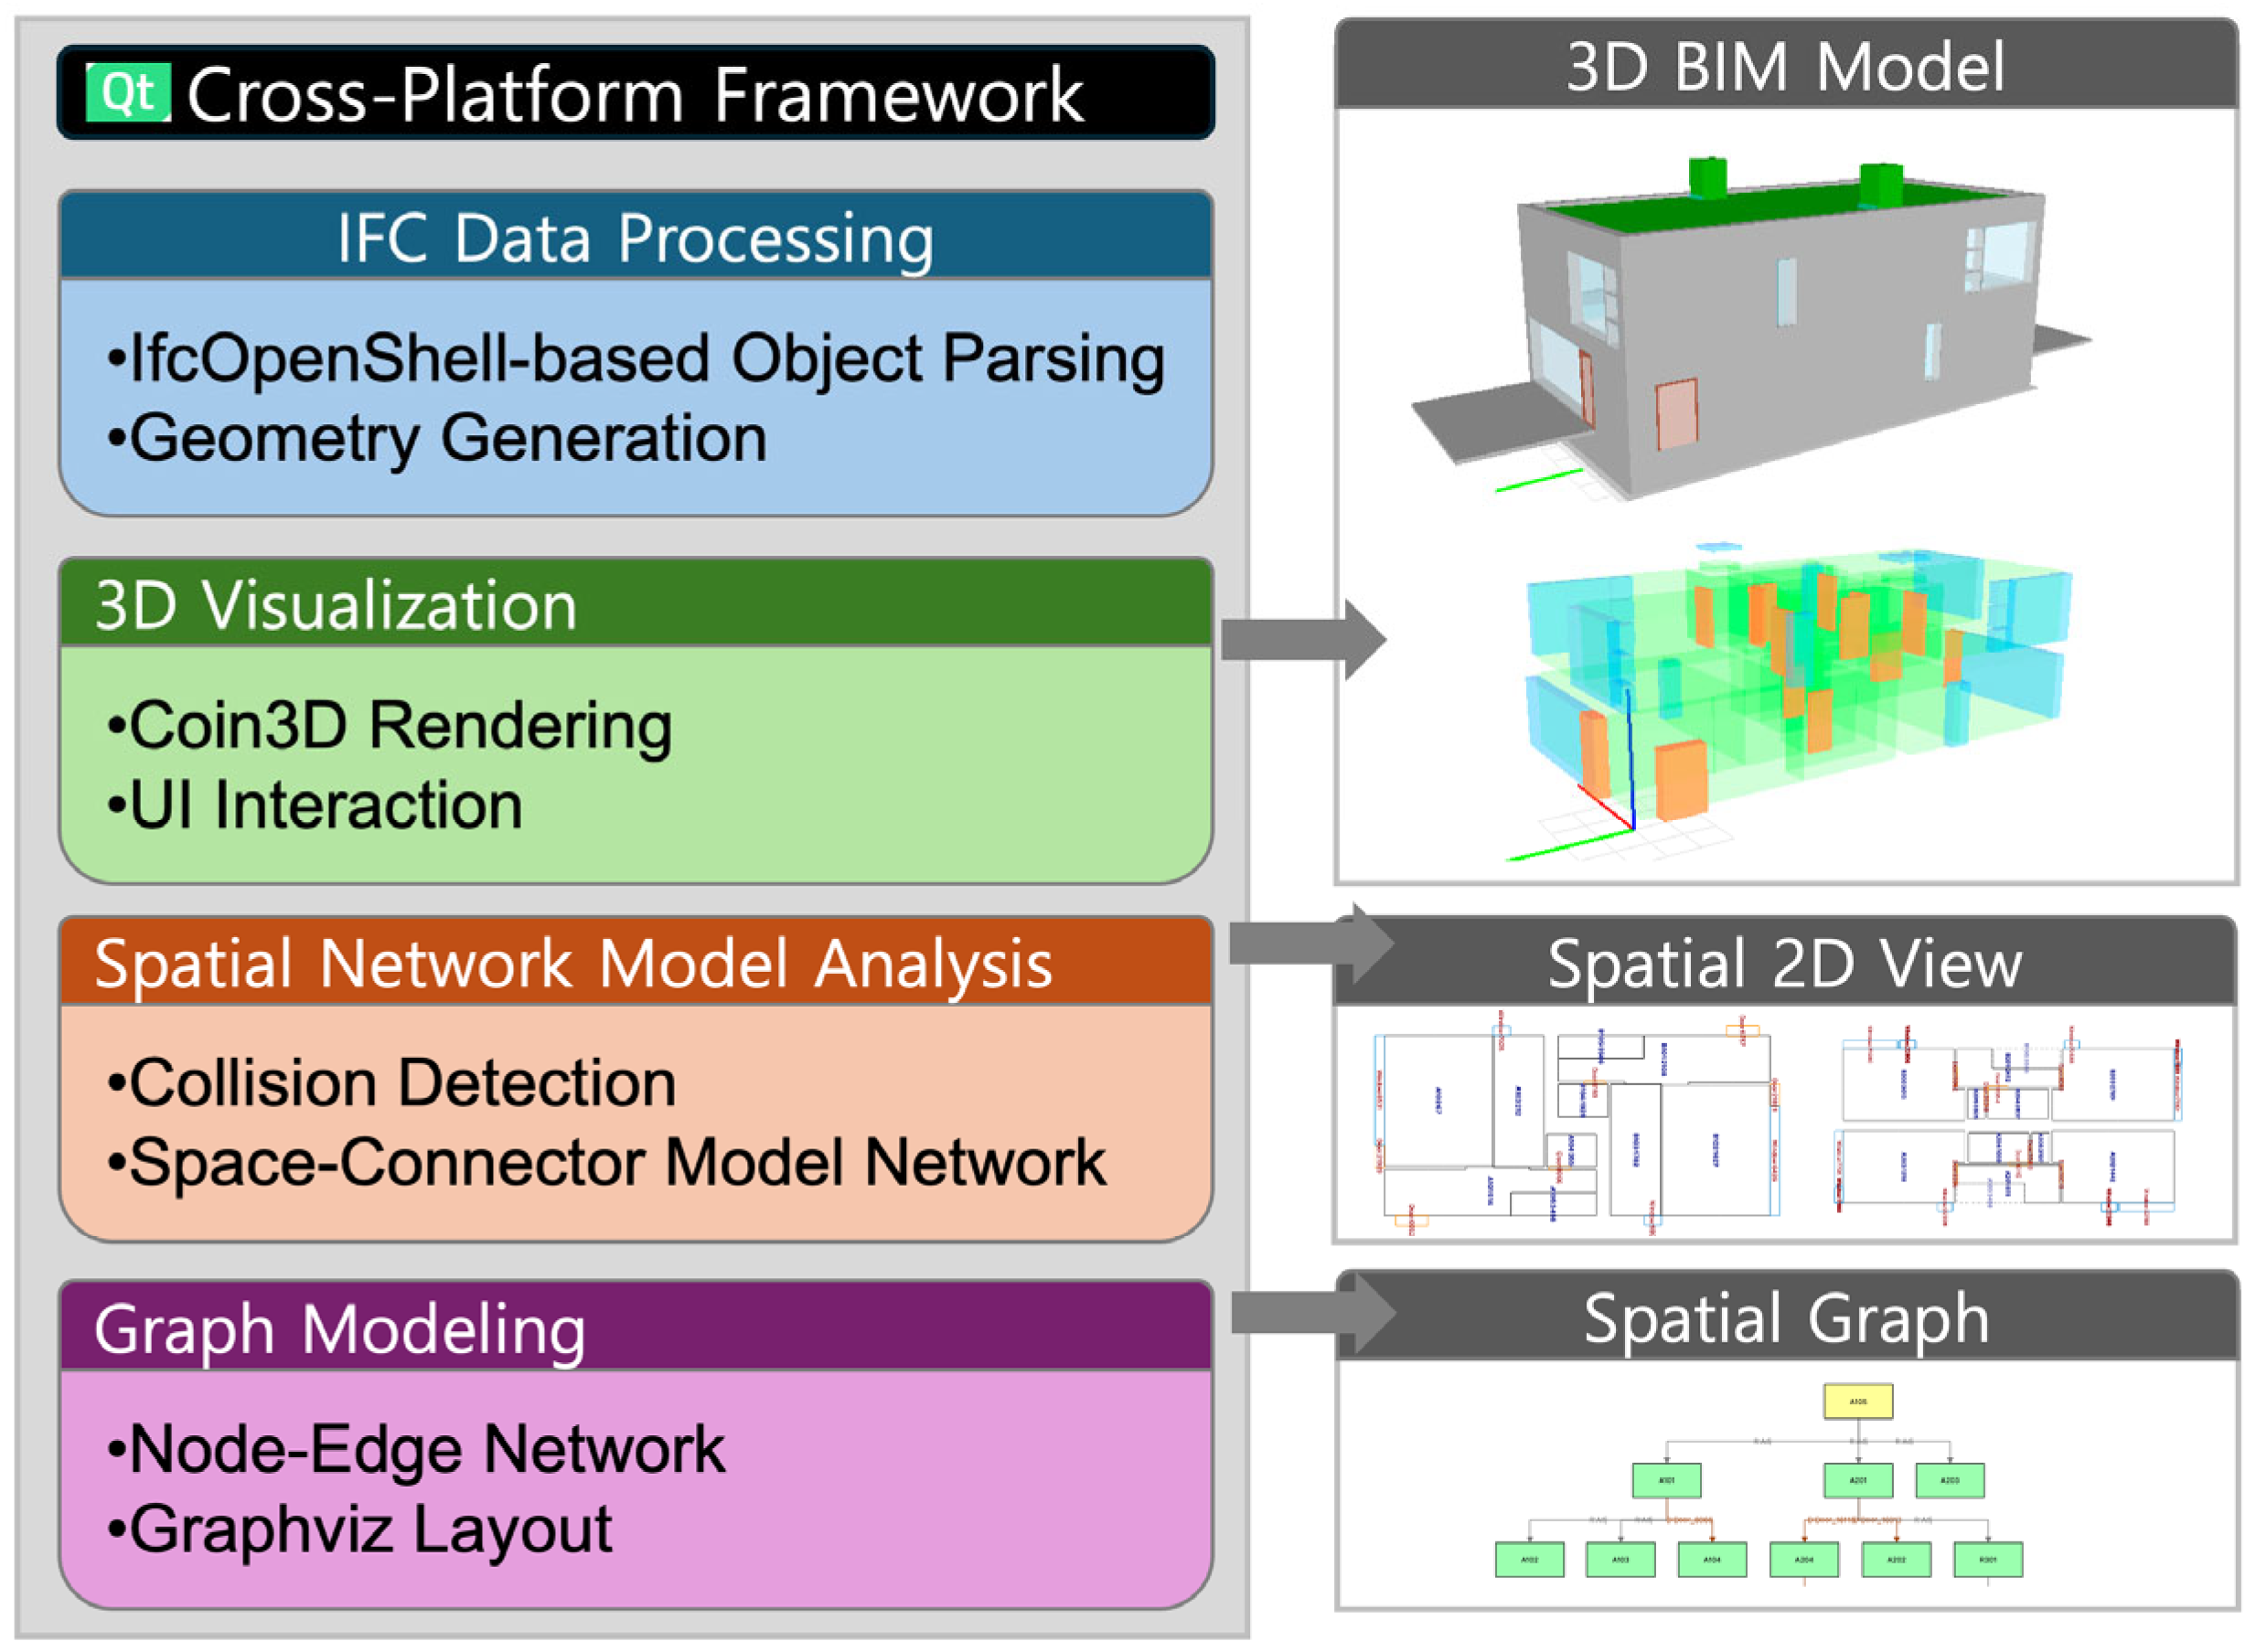
XeoBIM Viewer is an IFC-based BIM viewer system that integrates spatial attribute extraction, relationship analysis, and multi-view visualization, including sectional and spatial relationship representations. Beyond simple 3D model visualization, the system is designed to interpret the structural relationships of architectural spaces and enable intuitive exploration of spatial configurations. As shown in Figure 2, the system consists of three layers: (1) an IFC data processing and geometry generation module, (2) a 3D visualization and user interface module, and (3) a spatial interpretation and relationship analysis module based on BIM data structures and geometric information. Although each module performs its functions independently using open-source technologies, they are interconnected to provide an integrated BIM analysis environment.
Figure 2.
System architecture of XeoBIM Viewer.
The IFC data processing and geometry generation module uses an IFC file selected by the user as input and extracts both geometric and semantic information from the building model. This module uses the open-source library IfcOpenShell [24], which provides functionality for IFC file parsing, object information extraction, geometry generation, and relationship analysis based on the IFC standard. Through this process, not only geometric representations of building elements but also information related to spaces, stories, openings (doors, windows, and curtain walls), and their relationships are extracted.
The geometric information generated from BIM data through IfcOpenShell, including meshes, boundary representations, and bounding boxes, is visualized using Coin3D. Coin3D [25] is an open-source 3D graphics library based on Open Inventor that efficiently manages and renders complex 3D objects through a hierarchical scene graph structure. The geometry generated by IfcOpenShell is converted into Coin3D node structures and organized into scenes representing stories and spatial configurations, enabling users to visually inspect the BIM models.
The relationship information extracted through the IfcOpenShell, including spaces (IfcSpace), stories (IfcBuildingStorey), and openings (IfcDoor and IfcWindow), is typically interpreted using IFC relationship entities such as IfcRelContainedInSpatialStructure, IfcRelSpaceBoundary, and IfcRelConnectsElements. Although this approach clearly defines the logical relationships among objects, it does not fully represent the actual physical adjacency in spaces with complex geometries or across multiple stories. In particular, topological relationships defined in IFC alone may not accurately capture spatial connectivity in irregular spaces or multi-story penetrations.
To address this limitation, we utilize the 3D geometric information (meshes) generated by IfcOpenShell to analyze object collisions, physical contact, and accessibility between spaces. Based on these analyses, spatial relationships are redefined using the space-connector model. This approach complements IFC semantic relationships and more accurately reflects the actual physical adjacency and connectivity.
The logical relationships among the spatial objects are represented as a node–edge graph structure and visualized using the open-source software Graphviz [26] for automated layout and editing. Graphviz automatically arranges spatial relationships as graphs composed of nodes and edges and provides intuitive visualization through various layout algorithms, such as DOT and NEATO. In this paper, each IfcSpace is defined as a node, whereas the relationships between spaces connected through openings, such as IfcDoor, IfcWindow, and IfcCurtainWall, are represented as edges. Furthermore, adjacency relationships derived from mesh-derived section-boundary and bounding-box analyses are incorporated, extending the graph representation to include spatial connectivity that cannot be expressed solely through existing IFC relationship entities.
XeoBIM Viewer is implemented using the Qt framework [27] to ensure cross-platform compatibility and extensibility. Qt provides a C++-based cross-platform application development environment that enables consistent user interfaces and functionalities across multiple operating systems using a single codebase. The system employs Qt for user interface design and event handling, providing a consistent execution environment and user experience across Linux, macOS, and Windows platforms. This cross-platform architecture broadens the applicability of BIM data analysis and visualization tools while improving accessibility and usability across diverse user environments. Table 2 summarizes the major system modules, technologies, and libraries employed in each module and their corresponding core functionalities.
Table 2.
Types and functions of component modules.
3.2. Geometric Extraction of Spatial Boundaries
Geometric relationship analysis begins with the conversion of the IFC building elements into a triangulated geometry. When an IFC file is loaded, IfcOpenShell parses the IFC entities and generates world-coordinate triangular meshes by applying the use-world-coords and TRIANGULATED settings. For each relevant object, the system stores its IFC STEP identifier, object type, story identifier, mesh vertices, triangle indices, and axis-aligned bounding box. The objects considered in the spatial analysis are IfcSpace, IfcDoor, IfcWindow, and IfcCurtainWall.
Story membership is determined before the geometric analysis. Spaces are assigned to building stories primarily through IfcRelAggregates, whereas other building elements are mapped through IfcRelContainedInSpatial Structure. If an element is contained in an IfcSpace rather than directly in an IfcBuildingStorey, the corresponding story can be obtained by tracing the space-to-story relationship. This procedure supports both the IFC4 and IFC2x3 models and provides a consistent story index for the subsequent filtering and graph-generation processes.
For each story, a horizontal section plane is defined as
where is the elevation of the corresponding IfcBuildingStorey and is the user-defined cut-plane height. A space is included in the selected story when it is assigned to the story or when its 3D bounding box crosses the section plane. In the latter case, the space is displayed as a dashed boundary to indicate that it spans multiple stories.
The 2D boundary of each space is derived from a triangular mesh in the section plane. The mesh edges intersecting the plane are converted into planar line segments, spatially coincident vertices are quantized, and the connected segments are assembled into closed boundary loops. The vertex-merging tolerance is supplied to the extraction routine as . In the current application, the routine is called with
This tolerance is used for coordinate quantization and duplicate-vertex suppression rather than for determining room connectivity. When a valid closed-section loop cannot be reconstructed, the XY projection of the bounding box of the object is used as a fallback boundary. The implementation also uses a vertical mesh-selection tolerance of
This 50 mm tolerance accommodates minor discrepancies in mesh coordinates and floor elevations.
3.3. Candidate Selection Using Three-Dimensional Bounding Boxes
To avoid testing every spatial object against every other object using planar polygon operations, the system first applies an axis-aligned bounding-box broad-phase test. Let denote the bounding box of object i. An expanded box is defined as
where ε is a small geometric expansion value. In the current implementation, the graph-generation function is called with
The bounding box of an opening element is expanded by ε, whereas the bounding box of a space can be expanded independently by the parameter . The current interface passes .
An opening-space pair is retained as a candidate when its boxes intersect or when either box geometrically contains the other within an additional numerical tolerance of
This stage is a broad-phase filter. It does not establish a graph edge by itself because bounding-box overlap can occur even when two objects do not share a meaningful spatial boundary.
3.4. Geometric Identification of Spatial Relationships
After candidate filtering, the system determines the spatial association between the opening elements and spaces. Doors are always considered, whereas windows and curtain walls are included according to user-defined analysis options.
For each opening and candidate space , the first extracted plan polyline is used. Before the intersection testing, both polylines are expanded radially from their centroid using
to compensate for small numerical gaps between adjacent boundaries.
The adjusted polygons are converted into planar polygon representations, and their geometric intersection is computed. Because multiple disconnected intersection regions may exist, the algorithm calculates the total perimeter of all connected intersection polygons, defined as
where denotes the -th connected intersection polygon and is its perimeter.
An opening is associated with a space when
where the current threshold is
If polygon data are unavailable, the algorithm returns the AABB candidate result to avoid missing valid spatial relationships in incomplete IFC models.
Therefore, the decision rule is
The procedure is independently applied to IfcDoor, IfcWindow, and IfcCurtainWall, producing an element-to-space mapping
When an opening is associated with two or more spaces, all the unique space pairs are connected to generate graph edges. If only one space is associated, the opening is classified as an external opening; external doors may also be used as graph-traversal roots.
In addition to opening-mediated connections, the system identifies direct room-to-room adjacency. This relationship is represented by the link type RoomAdjacency and is distinguished from accessibility through a door.
For every pair of spaces and within the analysis set, the algorithm first tests their expanded 3D bounding boxes.
When both spaces contain valid plan polylines, each polygon is outwardly offset by
The larger room offset, compared with the 1 mm opening offset, is used to detect boundaries separated by small modeling gaps or wall-line inconsistencies. The adjusted room polygons are intersected, and the pair is accepted as adjacent when
with
3.5. Space–Connector Graph Construction
The geometric analysis results are transformed into an undirected semantic graph , where each node represents an IfcSpace, and each edge represents one or more spatial relationships between a pair of spaces. Each node stores the IFC STEP identifier, space name, boundary type, and story information, whereas each edge stores the connected space identifiers, associated connector information, and corresponding relationship type.
When multiple connectors exist between the same pair of spaces, they are merged into a single graph edge and duplicate relationships are removed to avoid redundancy. Opening-mediated connections and direct spatial adjacencies are represented by different semantic relationship types, enabling multiple relationships between the same pair of spaces to be integrated into a unified graphical representation.
The graph is visualized using Graphviz, where only IfcSpace objects are represented as nodes and spatial relationships are displayed as labeled edges according to their connector types, such as doors, windows, curtain walls, or direct adjacency. When multiple types of relationships exist between the same pair of spaces, they are aggregated into a single edge.
The graph can be generated for either a selected story or an entire building. In story mode, only objects belonging to the selected IfcBuildingStorey are included, whereas all spaces and relationships are retained in the all-story mode. Spaces spanning multiple stories are represented on each intersecting floor by projecting their section boundaries, enabling consistent visualization of double-height spaces and atria.
The current implementation supports story-based filtering and visualization of multistory spaces but does not semantically reconstruct vertical circulation through building elements such as stairs, ramps, or elevators. Consequently, cross-story connectivity is represented only when it can be established through identified spatial relationships.
4. Configuration and Functions of XeoBIM Viewer
This section describes the graphical user interface (GUI) and key functionalities of XeoBIM Viewer, which was implemented based on the system architecture presented in the previous section. The visualization process of the IFC data and integration of the spatial relationship analysis functions are explained from the perspective of the user interface. In addition, the applicability and reliability of the proposed system are evaluated using IFC models with different levels of complexity, and the accuracy of the generated spatial relationship graphs is validated through comparisons with manually prepared reference graphs.
4.1. User Interface
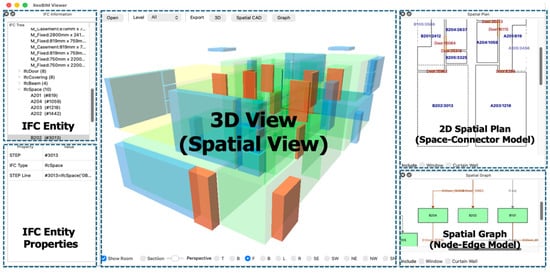
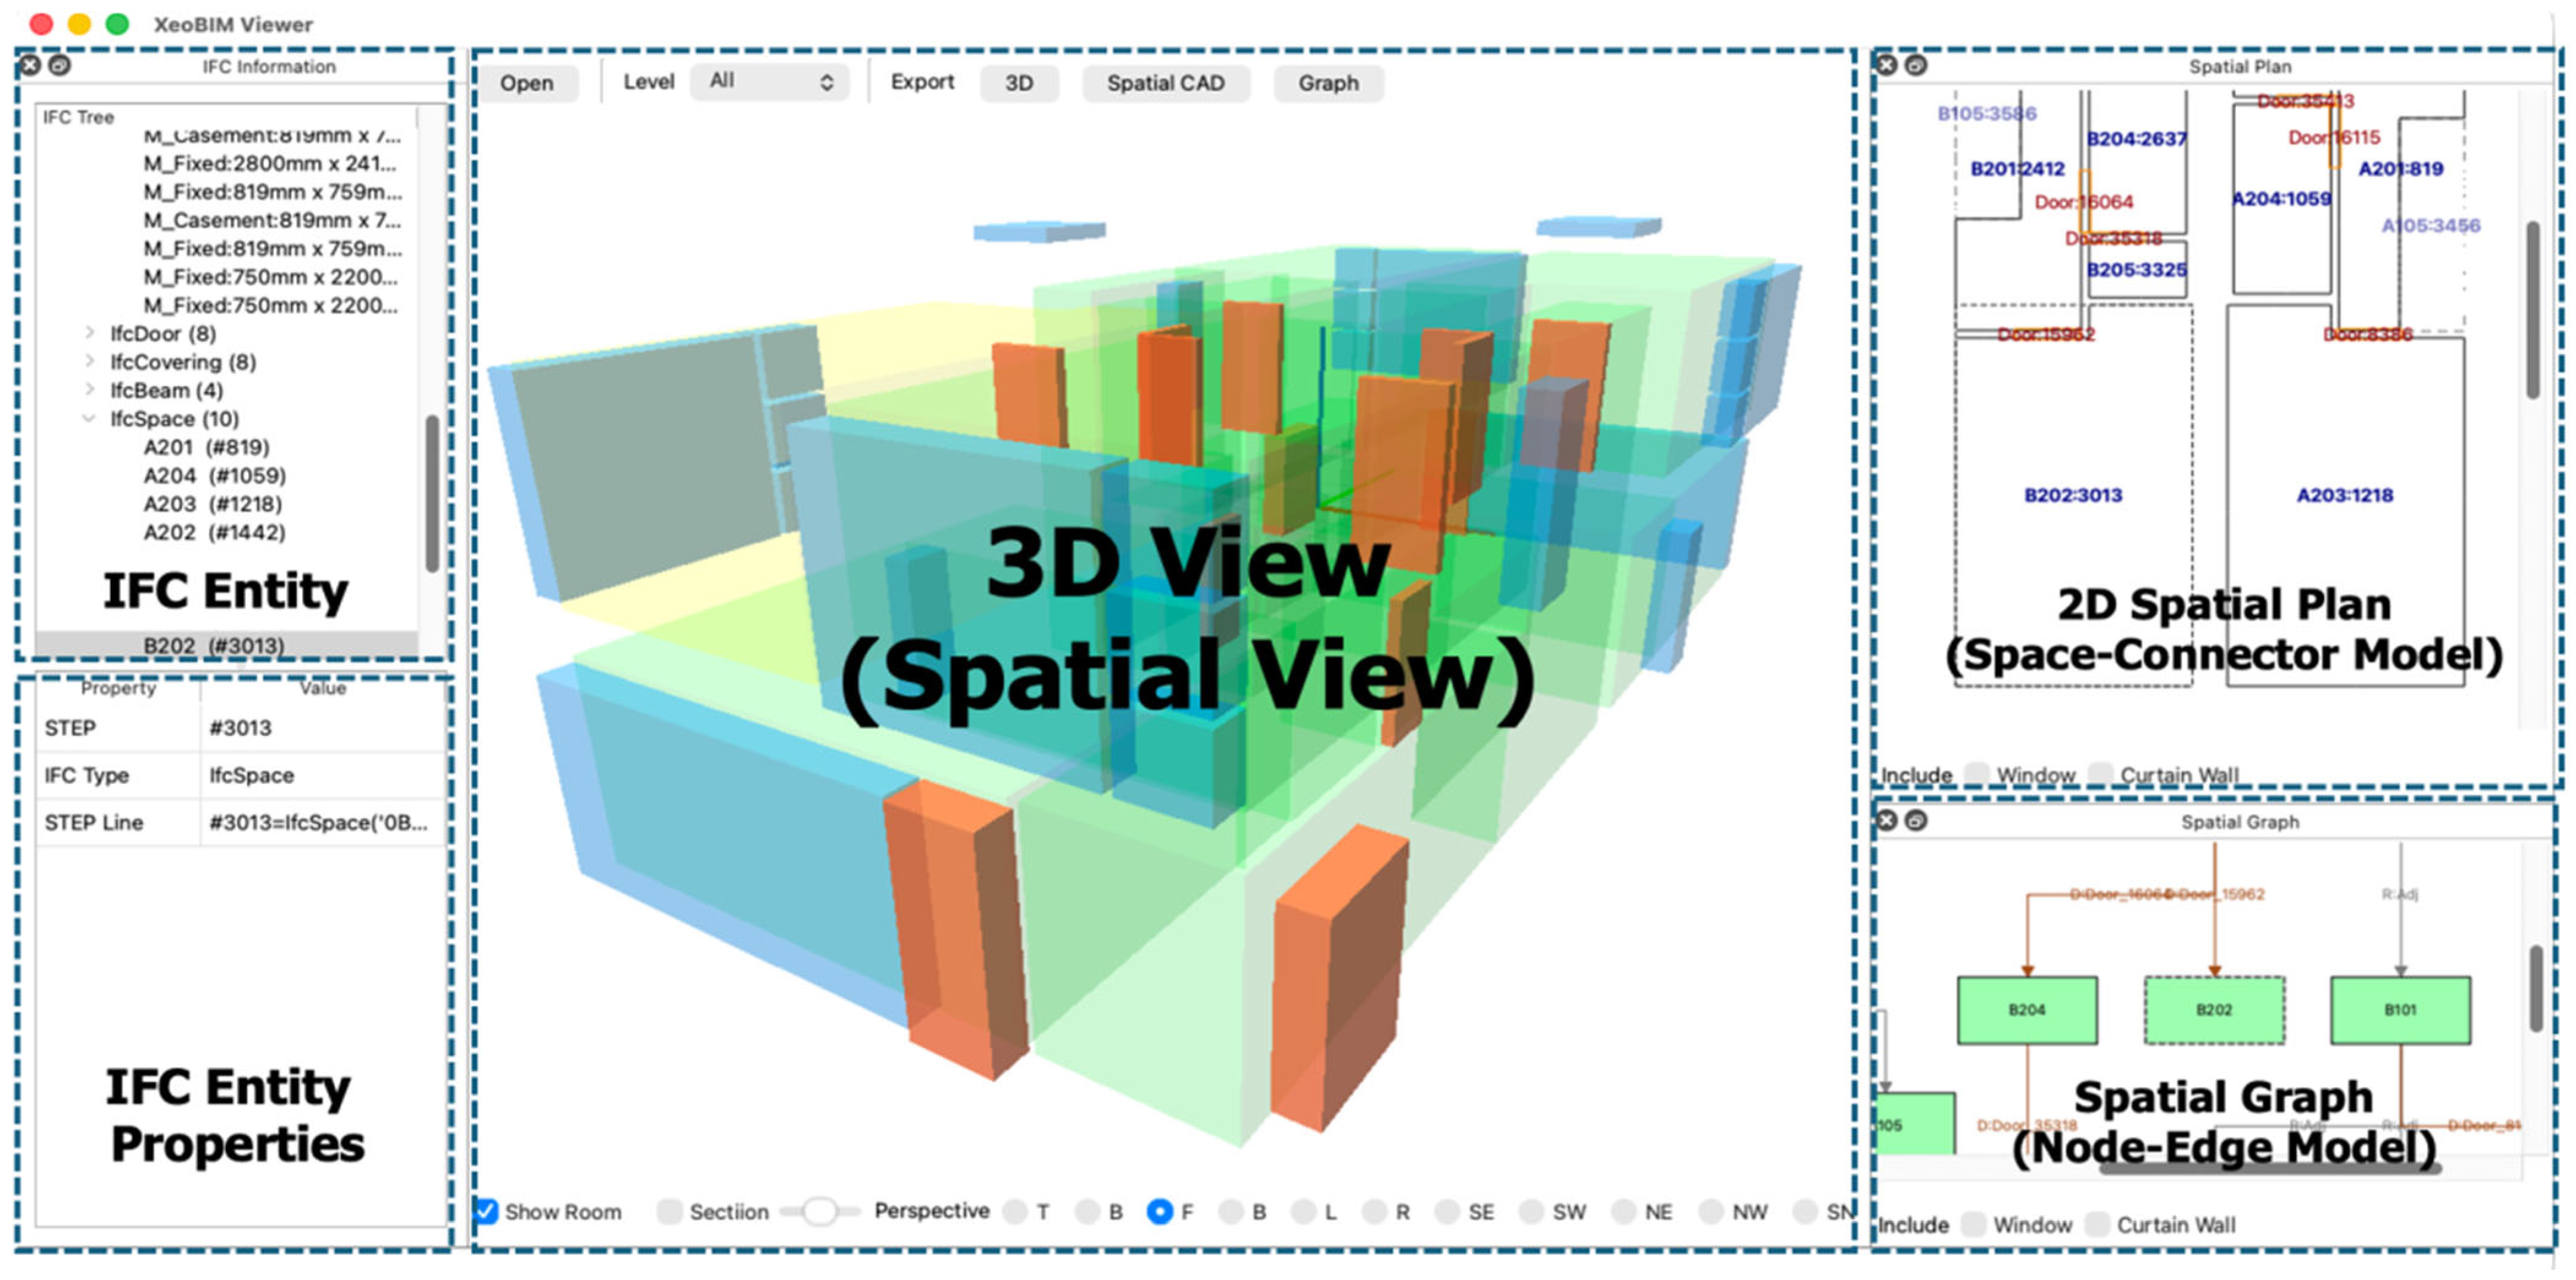
XeoBIM Viewer provides a user interface that integrates multiple visualization views to enable an intuitive analysis of relationships among spaces (IfcSpace) in IFC-based building models. Unlike conventional BIM viewers, which primarily rely on a single visualization view, the proposed system was designed to support the simultaneous analysis of spatial structures from multiple perspectives. To achieve this, we integrated a 3D BIM model view, story-based 2D floor plan view, and spatial relationship graph view into a unified interface, as shown in Figure 3.
Figure 3.
User Interface of the XeoBIM Viewer. Green boxes represent spaces, blue boxes represent windows, red boxes represent doors, and arrows indicate the rela-tionships between spaces.
The left panel of the interface is organized in a hierarchical tree structure that allows users to navigate the IFC data hierarchy. Users can explore building objects, such as IfcBuildingStorey and IfcSpace, in a step-by-step manner. When a specific object is selected, its attribute information, including GlobalId, Name, Type, and STEP data, is displayed in the lower panel. This tree-based structure facilitates the understanding of both the semantic hierarchy of BIM data and the relationships among the building objects.
Each visualization view presents information independently while remaining synchronized with user interactions. When a specific space is selected, the corresponding space is highlighted in a 3D view, its location and adjacency relationships are displayed in a 2D floor plan view, and the associated nodes and edges are emphasized in a spatial graph view. This synchronized interaction enables users to understand spatial connectivity intuitively and effectively analyze complex spatial relationships from multiple perspectives.
The interface also provides various analysis functions, including store-level filtering, object selection, view control (orthographic and perspective projections), and sectioning. The sectioning function facilitates the examination of internal building structures, whereas the selective visualization of specific stories or spaces allows users to efficiently explore complex indoor environments.
The right panel presents a 2D floor plan and a spatial relationship graph based on the space–connector model. Users can selectively control the inclusion of opening elements, such as windows and curtain walls, enabling flexible adjustment of the scope of the spatial connectivity analysis. This functionality plays an important role in analyses using SNMs.
By integrating 3D geometric visualization, 2D spatial representations, graph-based relationship analysis, and IFC attribute inspection within a single environment, the user interface of XeoBIM Viewer provides a comprehensive platform for intuitively exploring and analyzing the structural relationships of architectural spaces.
4.2. Three-Dimensional BIM Model View
The 3D BIM model view serves as the primary visualization environment for examining the overall geometry and spatial arrangement of an IFC model. Users can freely explore building structures using standard navigation functions, such as rotation, panning, and zooming.
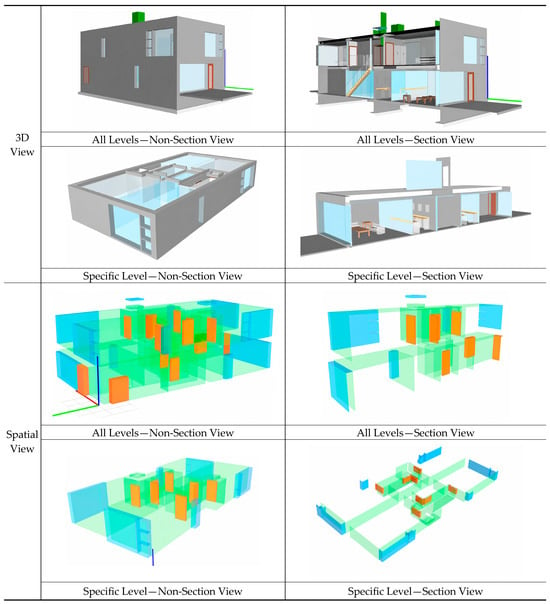
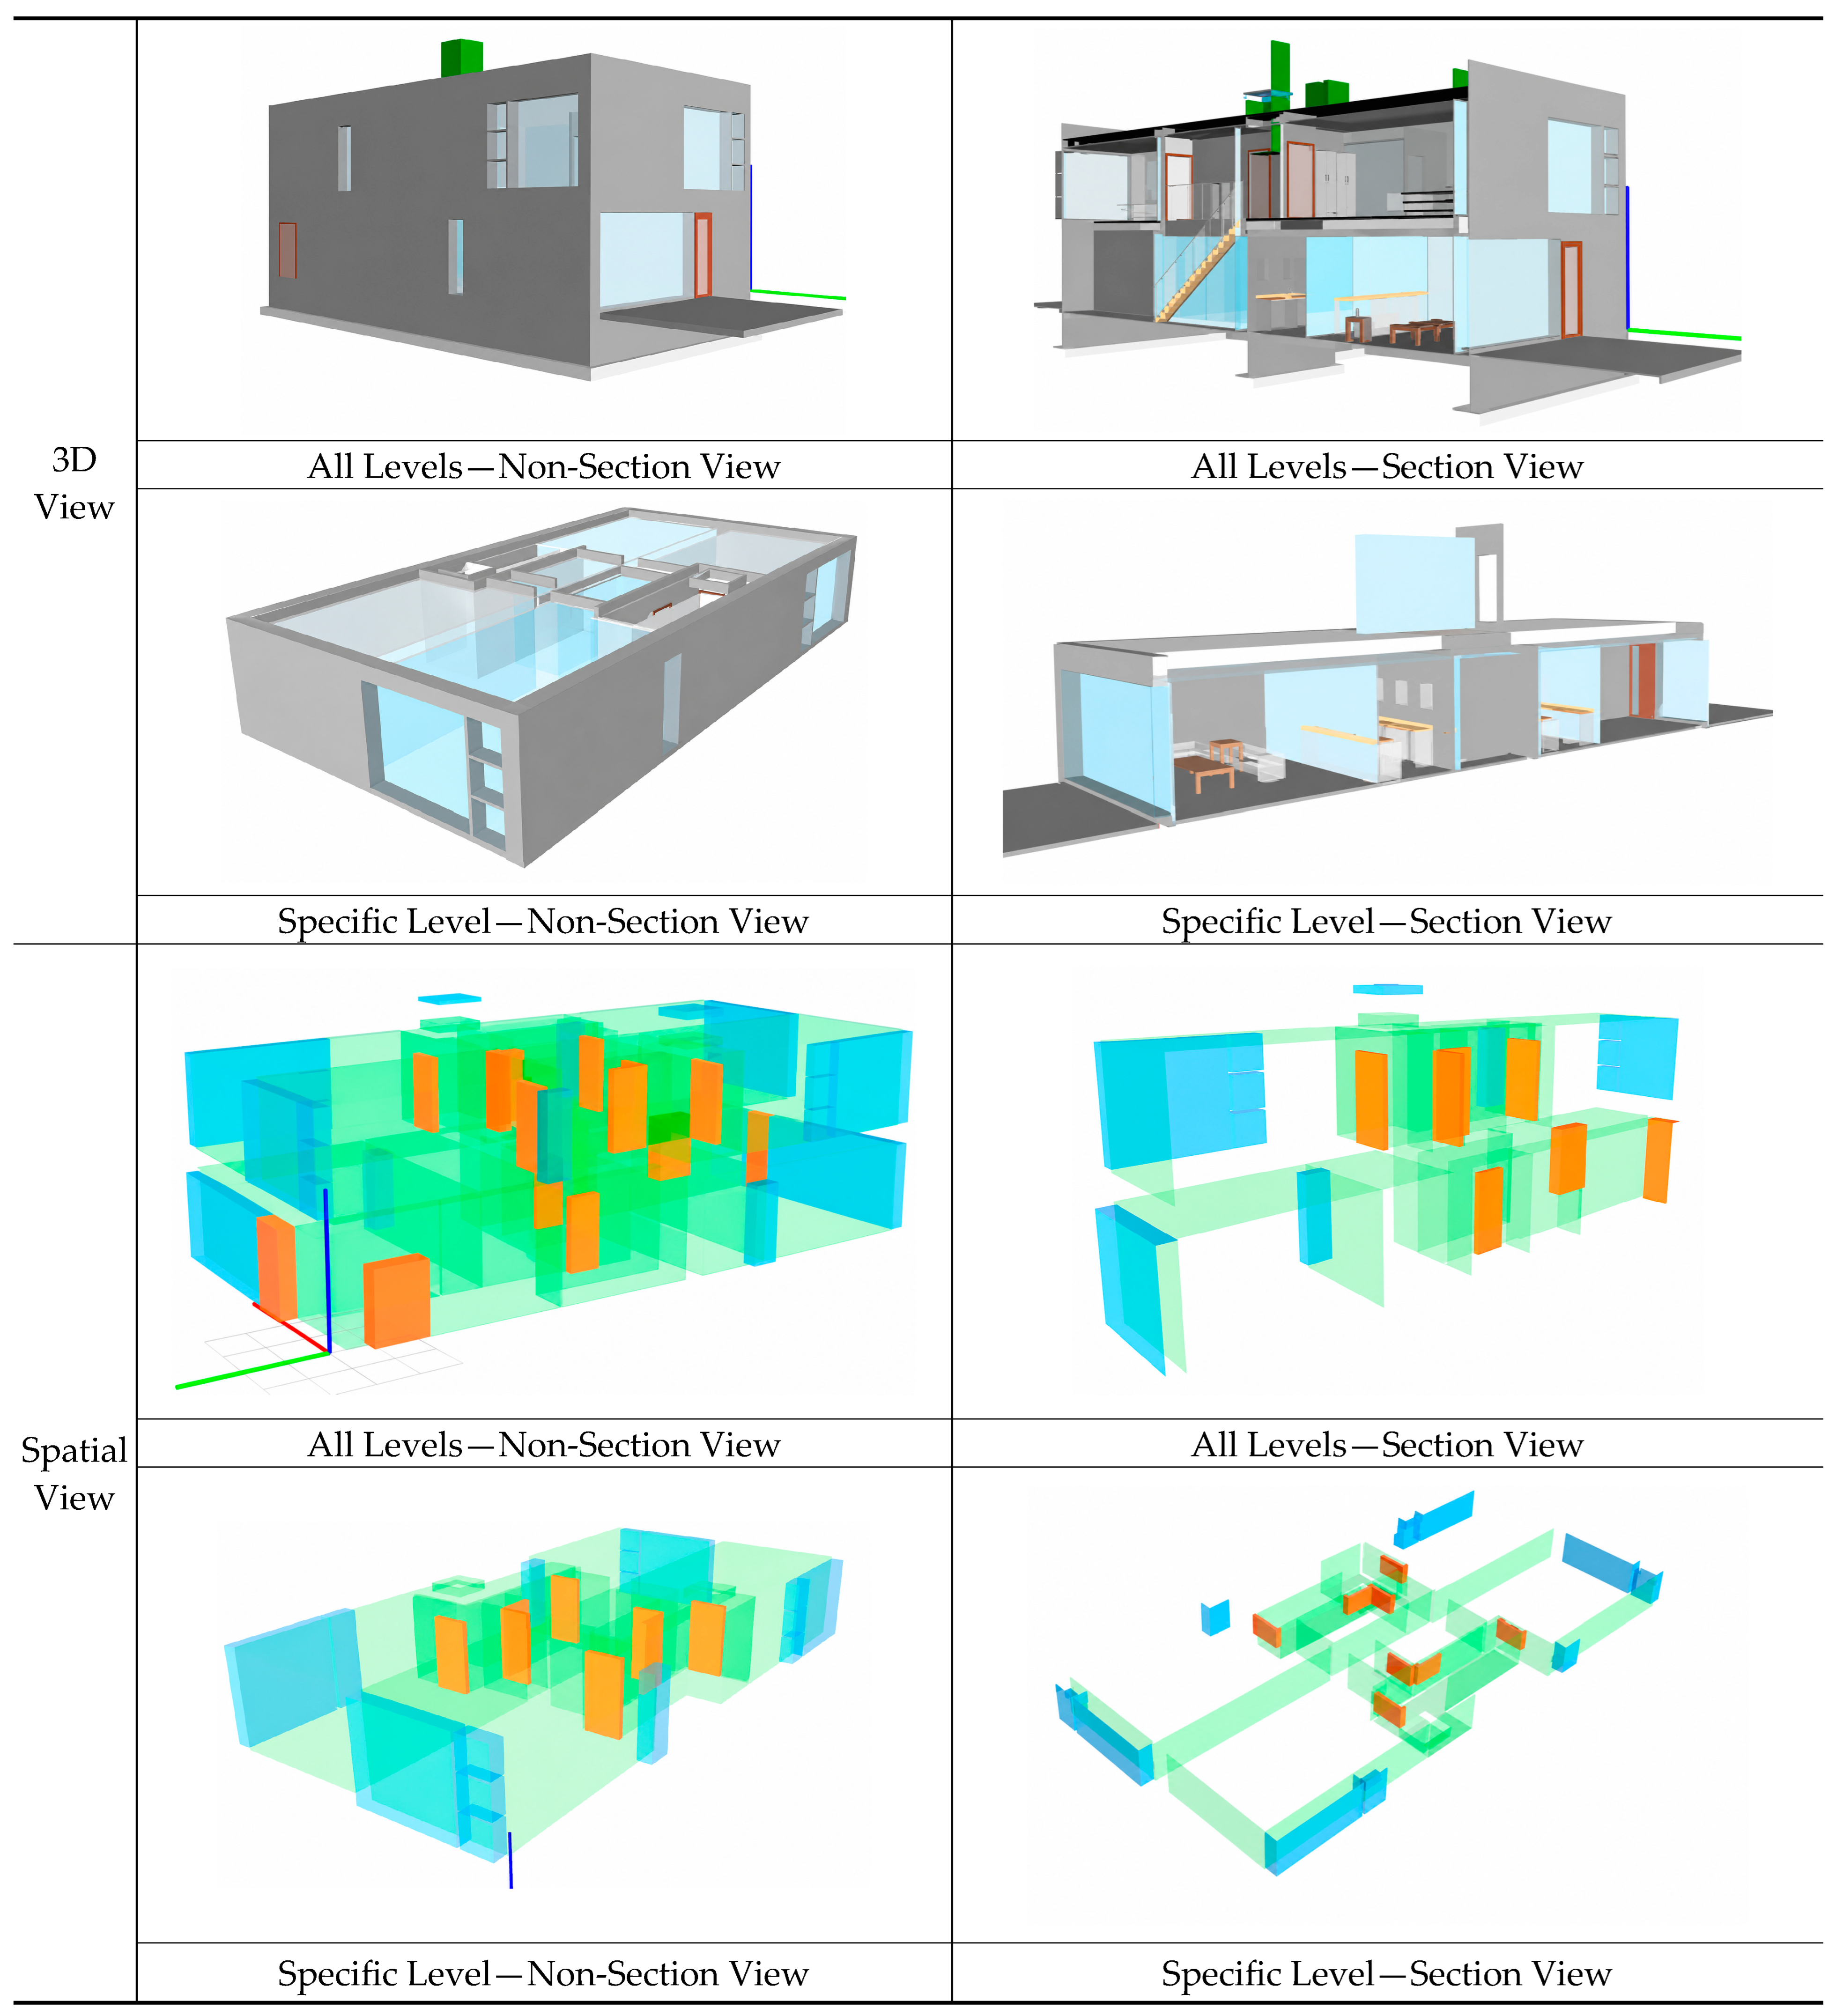
The system provides various viewing modes to support different analytical purposes, as illustrated in Figure 4. The all-levels–non-section view displays the entire building model, enabling users to understand the overall spatial organization and distribution of building elements. The all-levels–section view provides a sectional visualization of the building, enabling users to examine the internal structures and vertical spatial relationships between spaces.
Figure 4.
Types of 3D and Spatial Views.
For analyses focused on a specific story, the specific-level–non-section view clearly presents the spatial configuration of the selected level in a plan form. The specific level–section view enables the examination of the relationships between the selected story and the spaces above and below through sectional visualization.
In addition, the system provides a space-based view for space-level analysis. This view highlights a selected space within either the entire building model or a specific story. Through this functionality, users can intuitively identify the location of a space, its relationship with adjacent spaces, and its connectivity by opening elements such as doors, windows, and curtain walls.
By offering multiple visualization modes at the building, story, and space levels, the 3D BIM model view supports the comprehensive exploration and analysis of architectural spatial structures from different perspectives.
4.3. Spatial Data Transformation
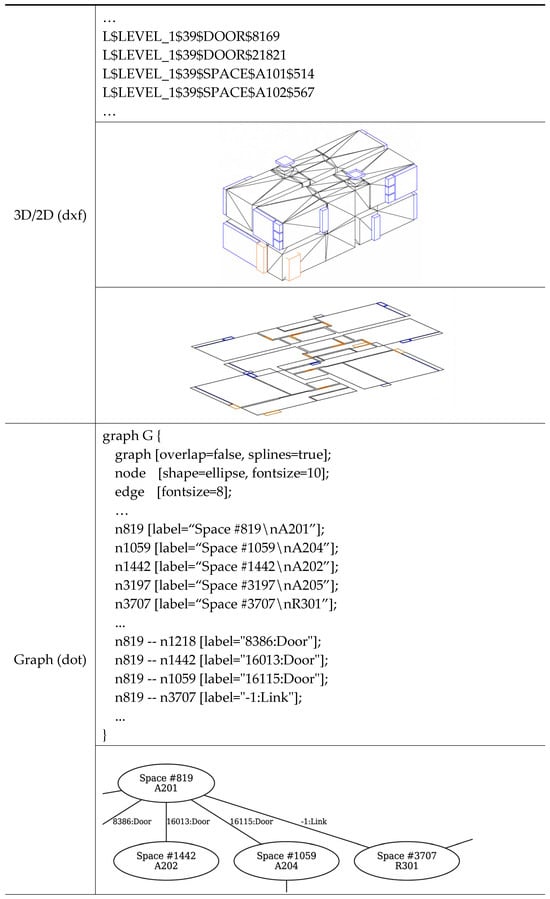
To support the use of space–opening relationships in external analysis applications, XeoBIM Viewer exports the extracted spatial information in 3D DXF, 2D DXF, and DOT formats, as shown in Figure 5. During conversion, IFC entities are not exported solely as geometric primitives. Instead, their story assignments, object types, object names, and IFC entity identifiers are encoded in the output data such that the exported geometry and graph relationships can be traced back to the original IFC model.
Figure 5.
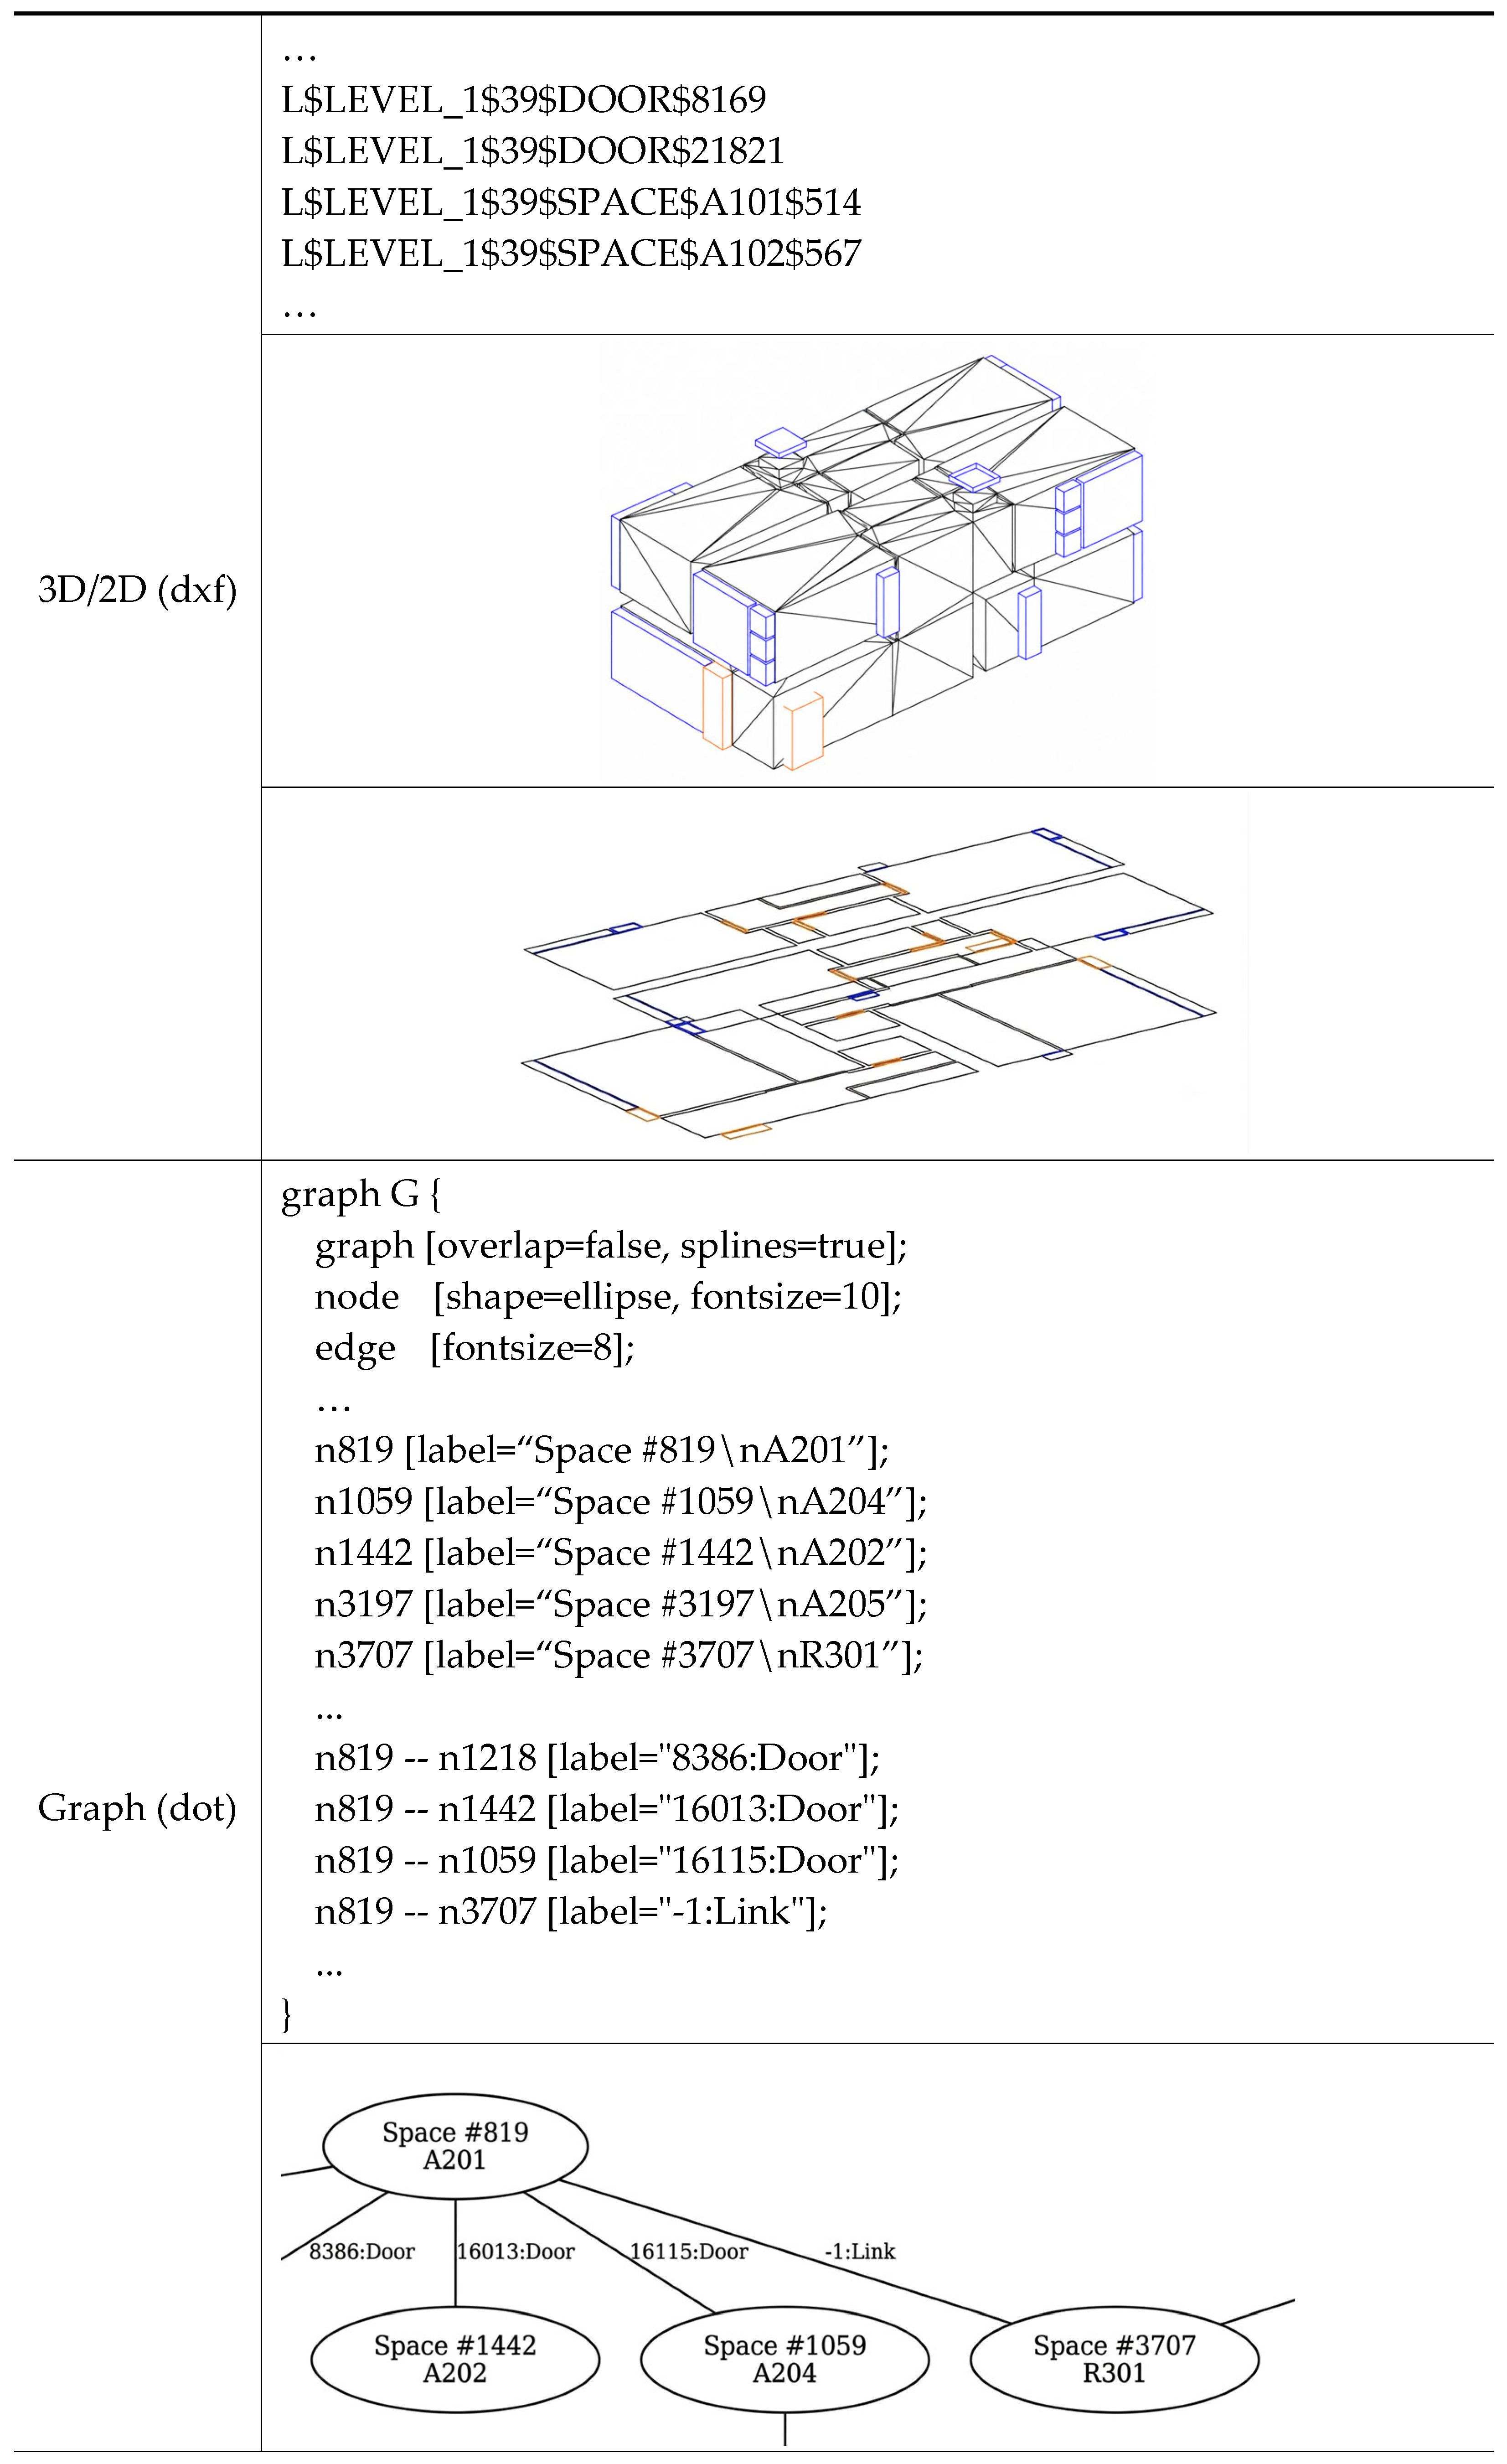
3D/2D spatial data and spatial graph data.
The conversion process begins by parsing spatial entities and their relationships using the IFC model. Each IfcSpace, IfcDoor, IfcWindow, and IfcCurtainWall entity is associated with its contained IfcBuildingStorey using IFC spatial containment relationships. The system then records the object type, object name, and IFC STEP entity identifier, and contains the story information. The IFC STEP identifier is used as the principal internal key because it uniquely identifies each entity within the loaded IFC file and enables consistent matching among the 3D model, 2D floor plan, and spatial graph.
In the DXF output, the object information is preserved through a structured layer and an object-naming convention. The current naming structure follows the following form:
L$<storey_name>$<storey_STEP_ID>$<object_type>$<object_name>$<object_STEP_ID>
For example,
indicates that the exported object is an IfcSpace named A101, assigned to story LEVEL_1, where 39 is the IFC STEP identifier of the story and 514 is the IFC STEP identifier of the space. Similarly,
identifies an IfcDoor entity with STEP identifier 8169 located on the same story. This convention allows the story, entity type, semantic name, and IFC source identifier of each exported object to be recovered directly from the DXF layer or object name without requiring the original viewer.
L$LEVEL_1$39$SPACE$A101$514
L$LEVEL_1$39$DOOR$8169
The 3D DXF output preserves the geometric location and orientation of the spaces and opening elements in the IFC model coordinate system. Spaces and openings are exported as separate geometric objects, whereas their common IFC identifiers and story assignments are retained in the naming convention. Consequently, an opening can be associated with spaces that intersect or contact them during subsequent analysis. This structure is intended to support geometry-based applications, such as visibility analysis, solar radiation analysis, and natural ventilation assessment.
The 2D DXF output is generated by projecting the relevant space boundaries and opening the geometries onto the horizontal plane of each building story. Space boundaries are organized by stories, whereas doors, windows, and curtain walls are placed in object-type-specific layers. The same identifiers used in the 3D DXF file are retained in the 2D output, thereby enabling a direct correspondence between the original IFC entities, 3D geometry, and story-based floor plan. This organization supports space-oriented analyses, such as Space Syntax, isovist analysis, and circulation analysis.
Furthermore, the extracted space–opening relationships are exported in the DOT language format [26], a standard text-based language for representing graph structures through explicit node–edge relationships. A graph is generated after identifying the spaces connected by each opening element. During this process, every IfcSpace is converted into a graph node, and each opening-based spatial relationship is represented as an edge connecting the corresponding nodes. To maintain consistency with the original IFC model, the node identifiers are derived directly from the IFC STEP identifiers in the corresponding spaces.
For example,
represents the space whose IFC STEP identifier is 819 and whose semantic name is A201. Similarly,
indicates that the spaces with STEP identifiers 819 and 1218 are connected through an IfcDoor whose STEP identifier is 8386. In this representation, the two node identifiers preserve the identities of the connected spaces, whereas the edge label stores both the opening identifier and the object type.
n819 [label=“Space #819\nA201”];
n819--n1218 [label=“8386:Door”];
The conversion rules used to preserve the IFC information in the DXF and DOT outputs are summarized in Table 3. By consistently using the same IFC STEP identifiers across the XeoBIM Viewer, DXF outputs, and DOT outputs, the generated graph maintained an explicit correspondence with the original IFC entities and their geometric representations. Consequently, any graph node or edge can be traced directly to an associated IFC object and its spatial geometry. The exported DOT files can be visualized using graph layout tools such as Graphviz and KGraphViewer and can also be imported into graph-analysis libraries for network-based analyses, including centrality analysis, shortest-path analysis, accessibility evaluation, and other graph-based spatial analyses.
Table 3.
Preservation of IFC information during DXF and DOT conversion.
4.4. Validation
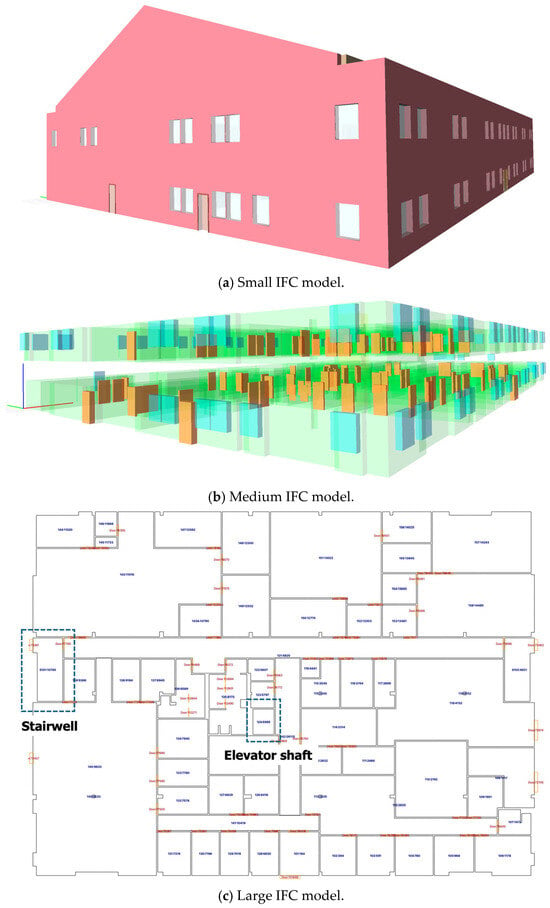
To evaluate the applicability and reliability of the proposed XeoBIM Viewer, the system was validated using the example IFC models presented in Figure 3, Figure 4 and Figure 5, as well as an additional office building IFC model with greater geometric and semantic complexity, including stairwells and elevators (Figure 6).
Figure 6.
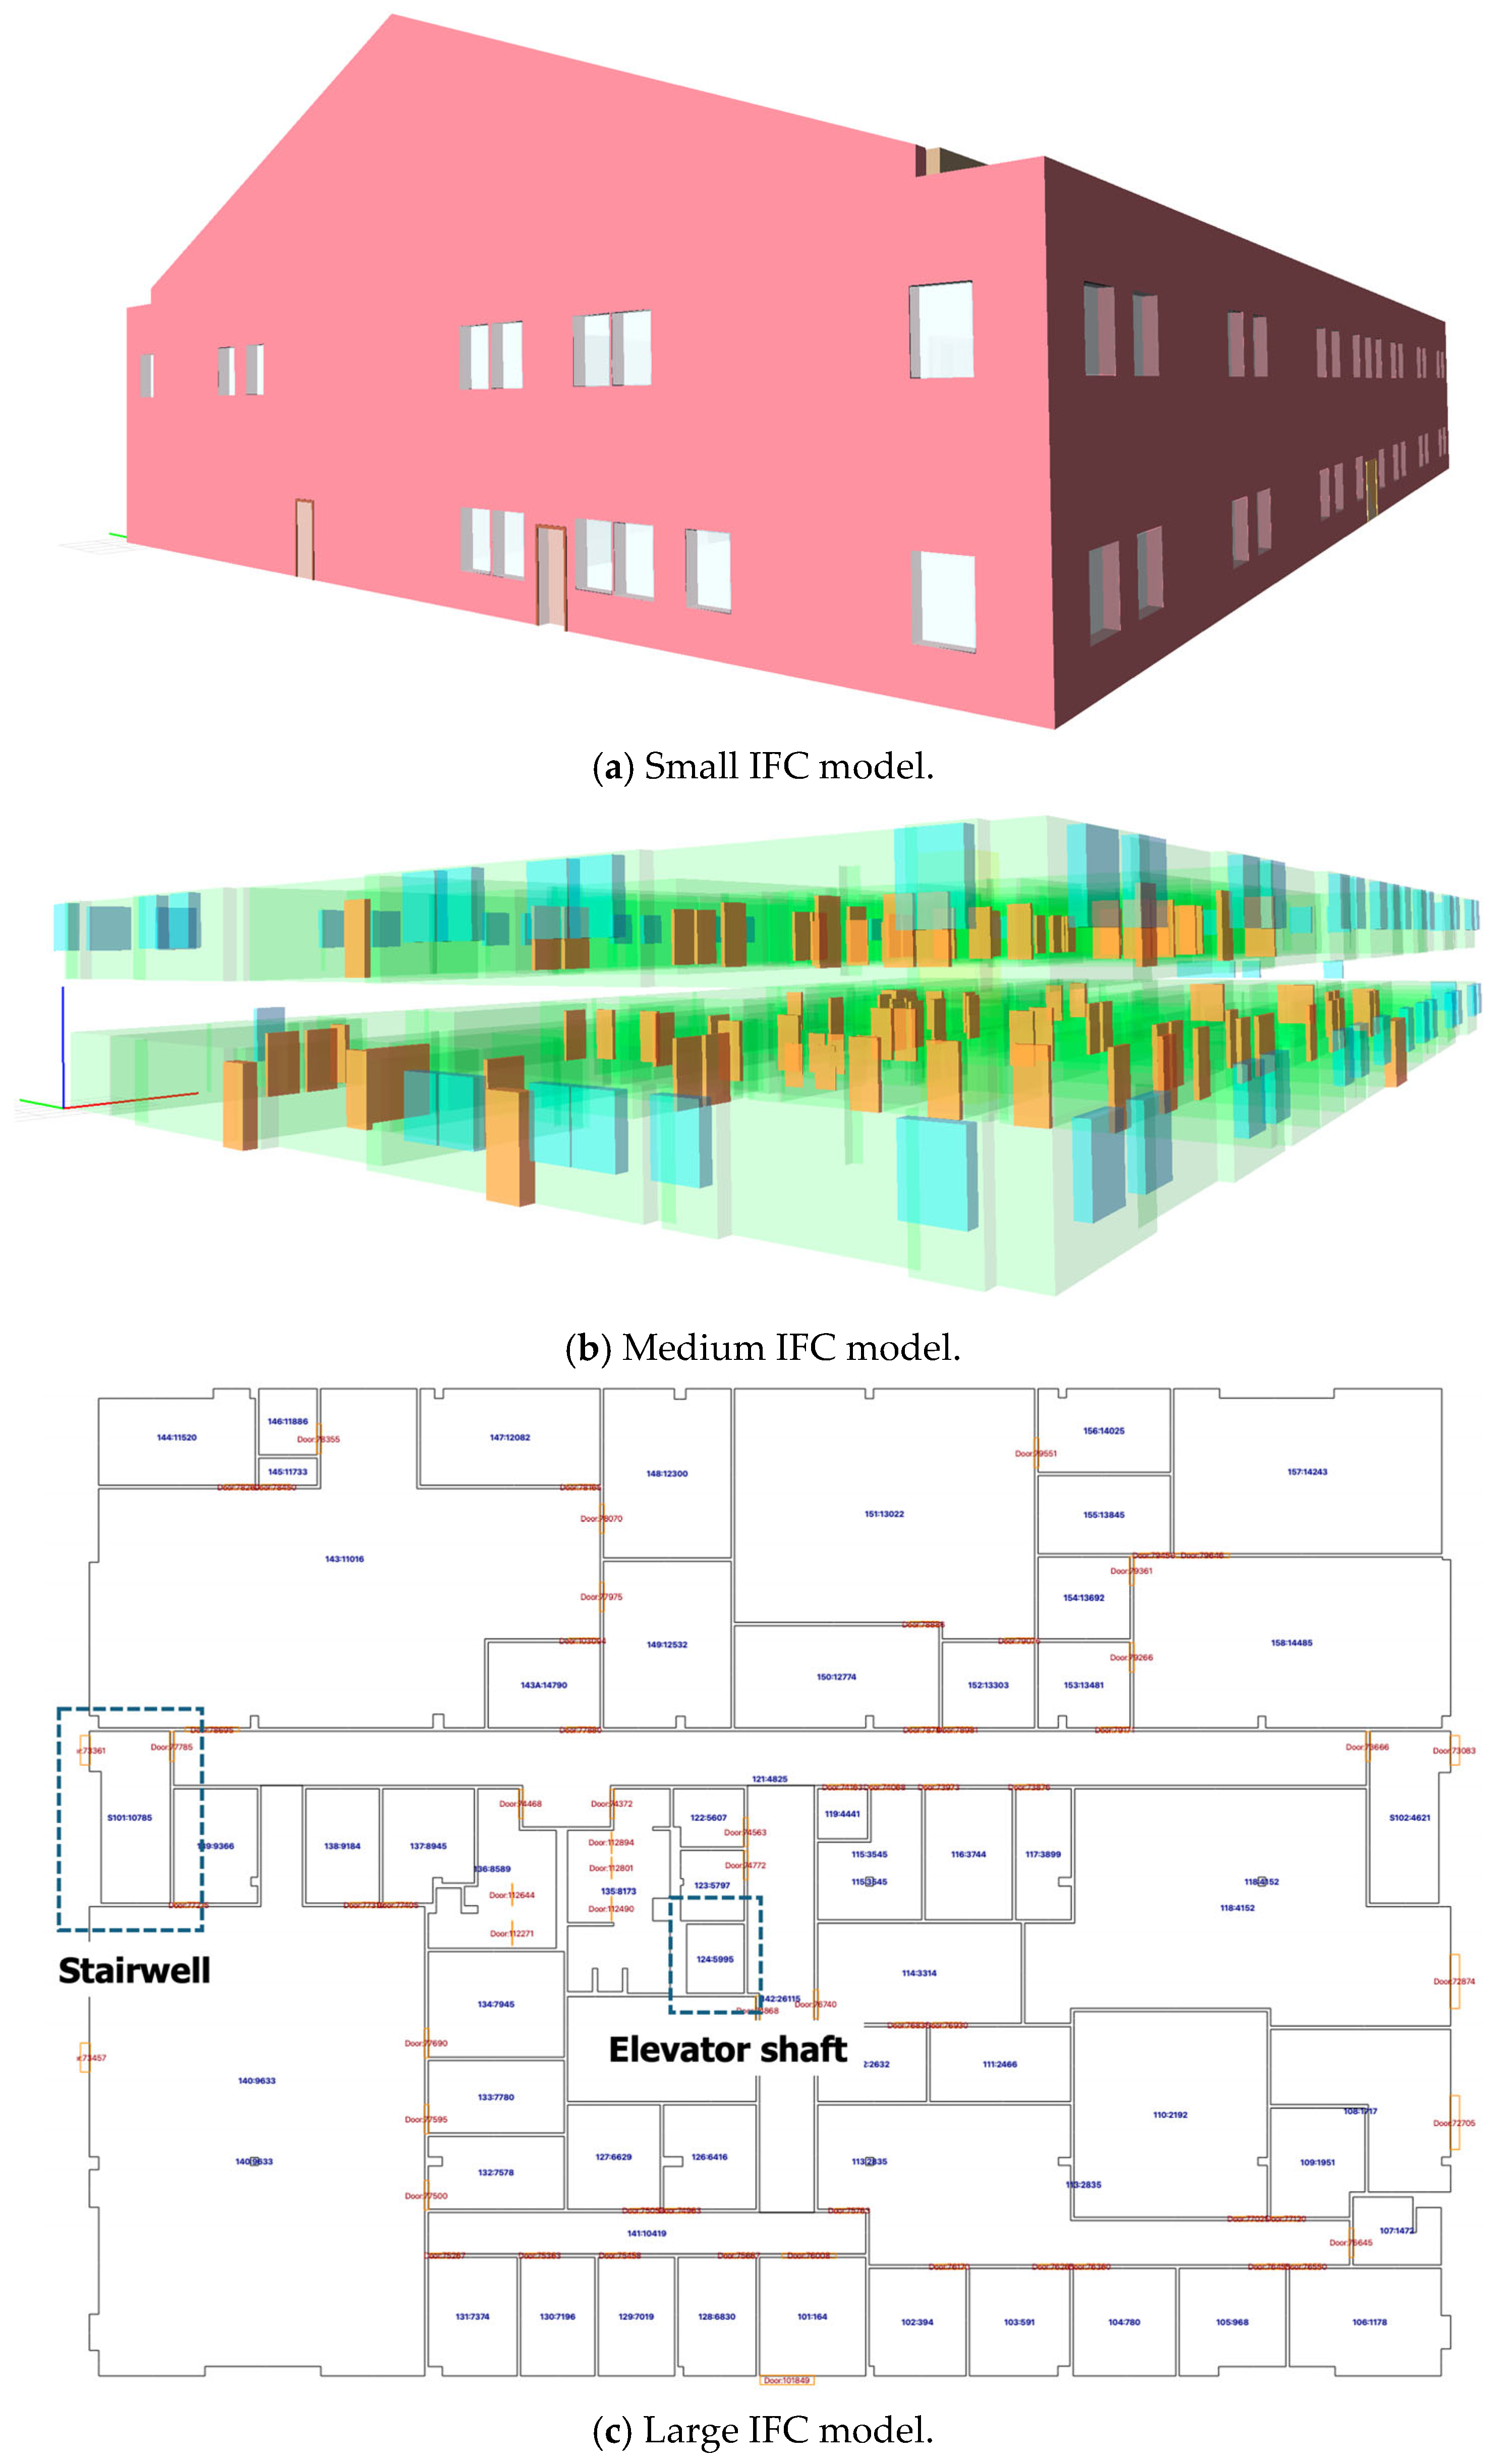
Test IFC models used for validation.
For each model, the following performance indicators were measured:
- Total processing time (including IFC loading and geometry generation, spatial relationship extraction, and graph generation);
- Number of identified spaces;
- Number of identified openings (doors, windows, and curtain walls).
All performance tests were executed on a hardware platform equipped with an Apple M1 Pro processor. As summarized in Table 4, the proposed XeoBIM Viewer successfully processed IFC models with different levels of complexity. The residential building model (2.4 MB) containing 21 spaces and 38 openings was processed in 2046 ms, whereas the more complex office building model (7.2 MB), containing 99 spaces and 171 openings (102 doors and 69 windows), required 3763 ms. These results demonstrate that the proposed system efficiently loads IFC data, extracts spatial relationships, and generates spatial graphs, while maintaining practical processing performance as model complexity increases.
Table 4.
Validation models and processing performance (executed on Apple M1 Pro).
To evaluate the correctness of the generated spatial relationship graphs, the proposed method was validated using the residential building and office building IFC models described in Section 4.4. For each model, the automatically generated spatial relationship graph was compared with the corresponding architectural floor plan and a manually prepared reference spatial relationship diagram. Each detected connection was classified as follows:
- Correctly identified connection;
- Missed connection;
- Incorrectly generated connection,
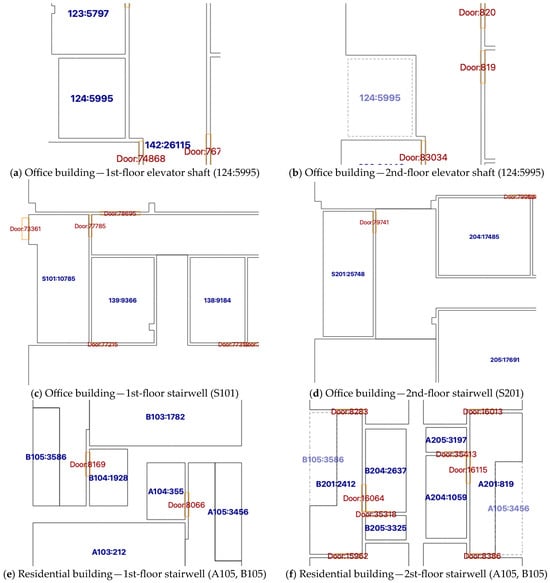
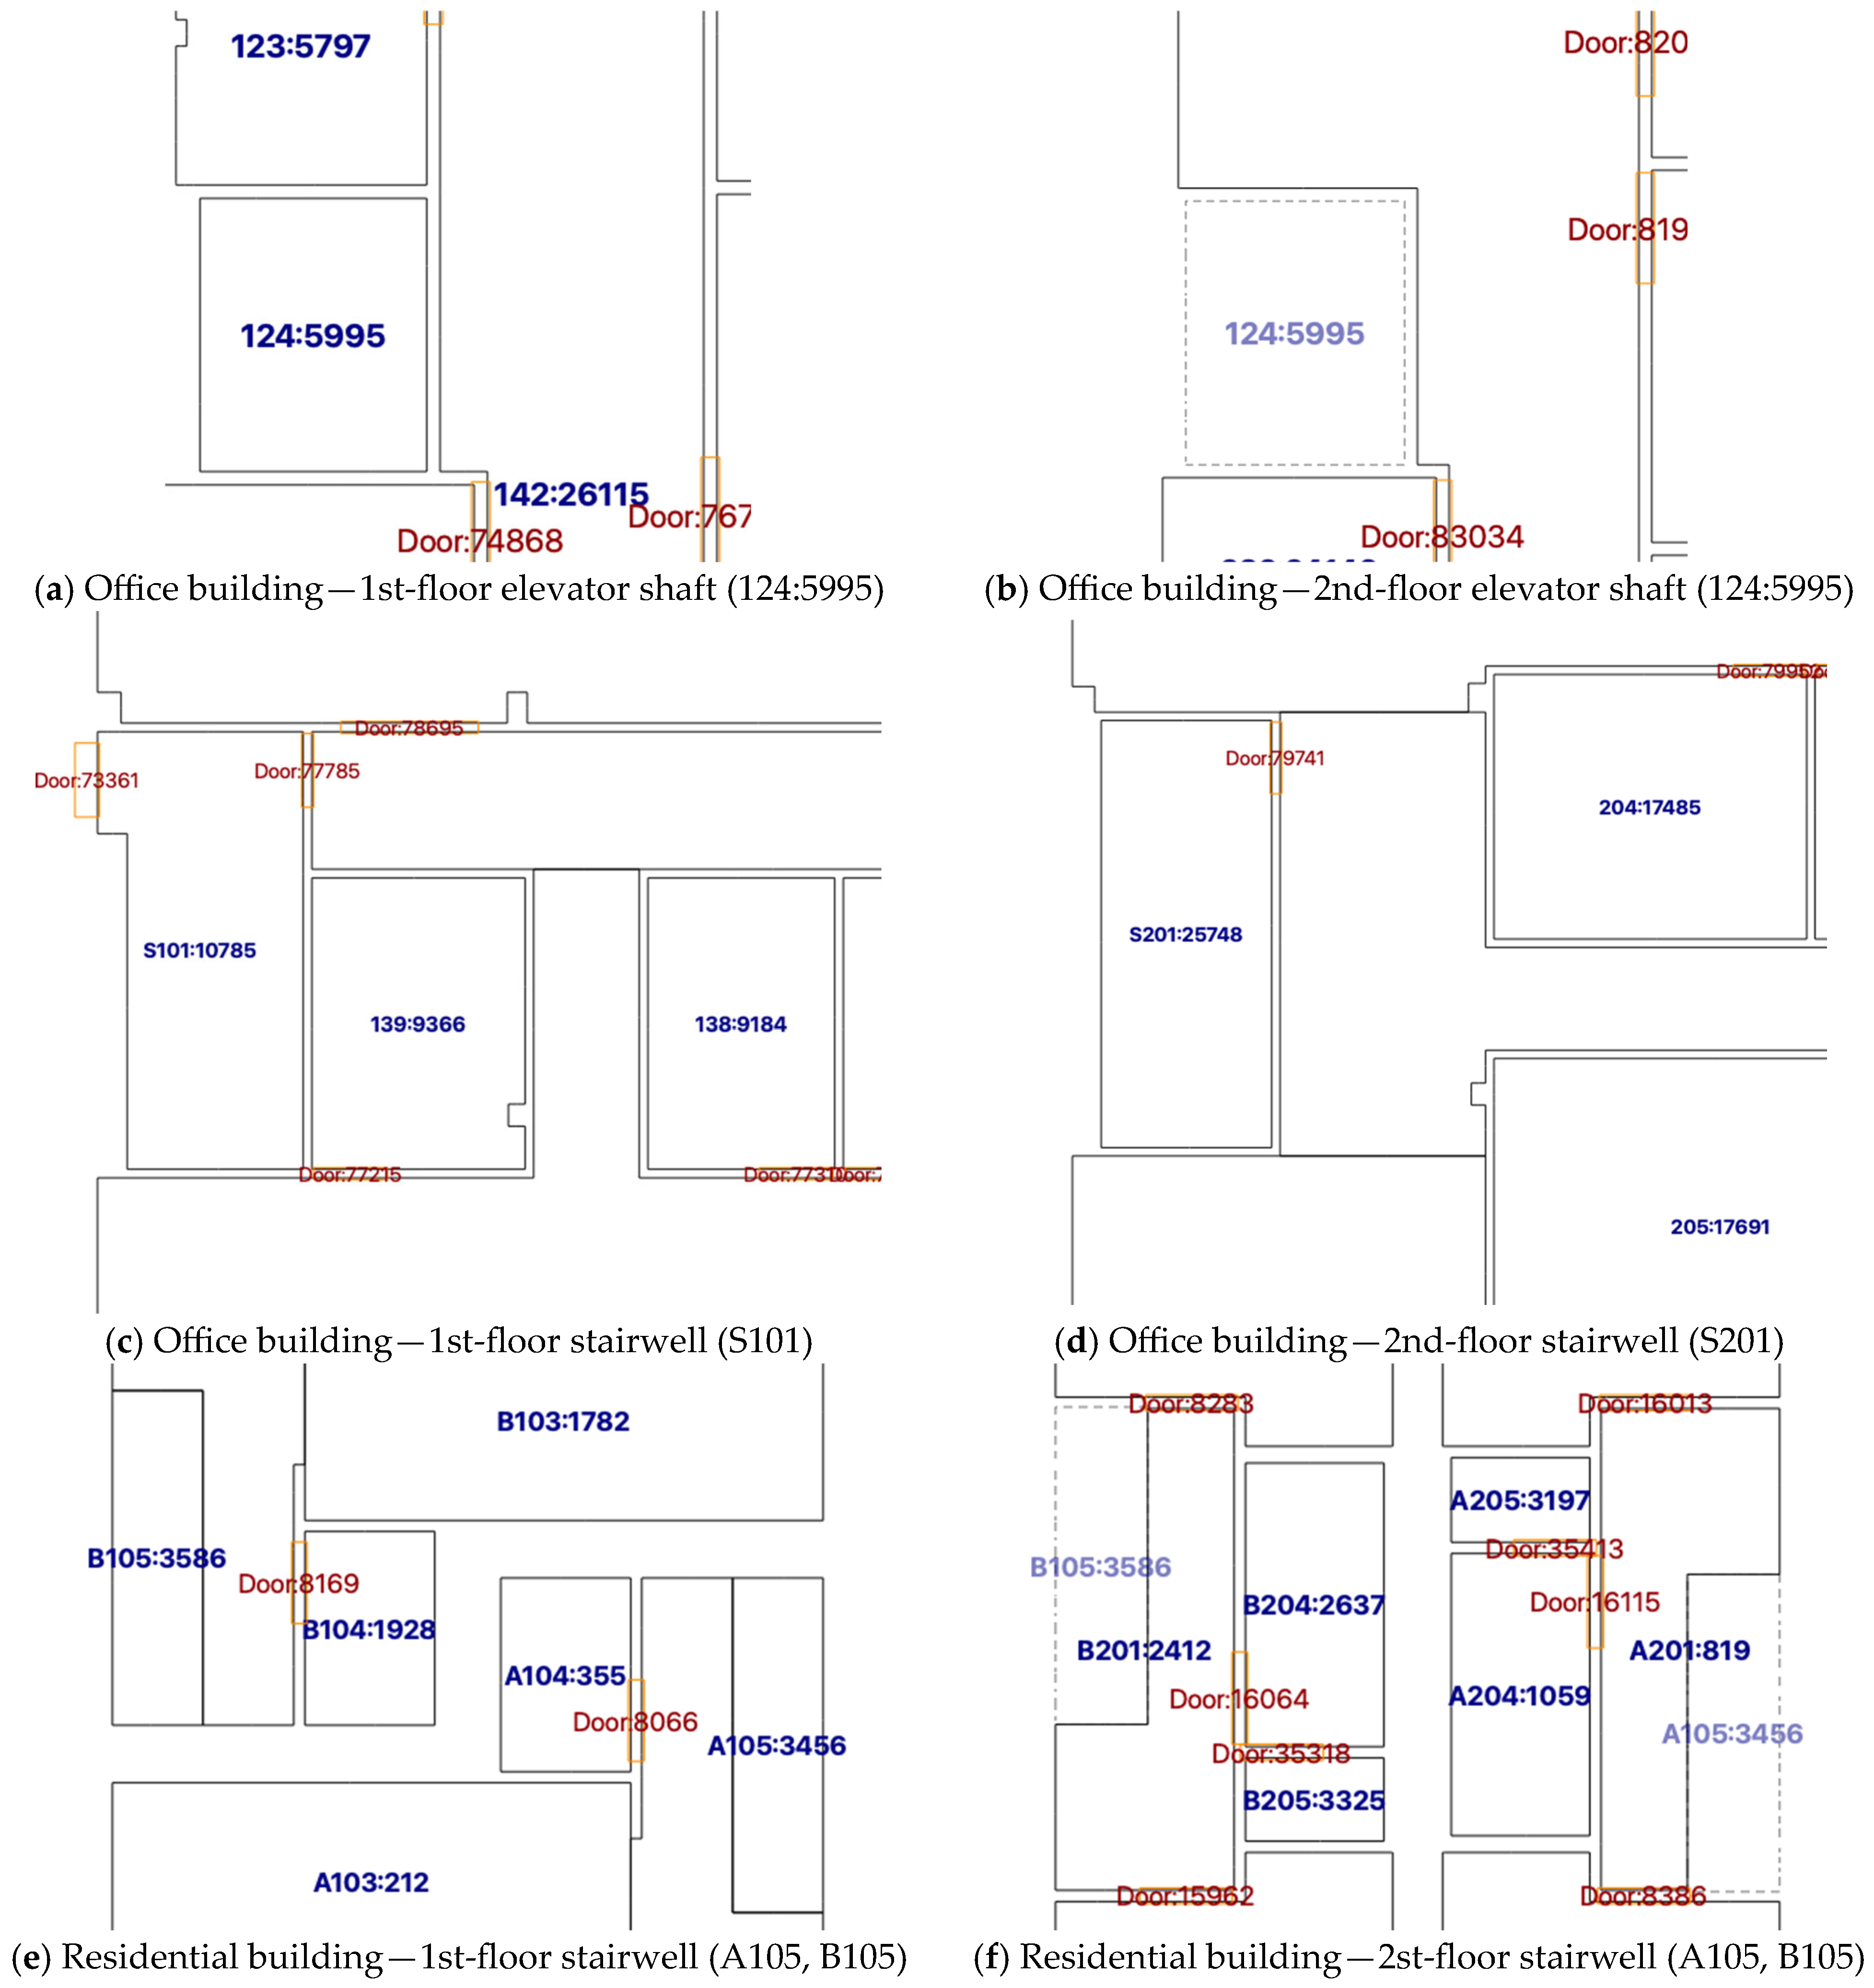
Analysis of the generated spatial relationship graphs showed that, for both the residential building and office building models, the spatial relationships were correctly generated according to the information provided in the IFC models. In the residential building model, no missed connections or incorrectly generated connections were identified. This is because the stairwell spanning the first and second floors was modeled as a single continuous space (Figure 7e,f), enabling the proposed method to correctly establish the vertical spatial relationships between the storeys.
Figure 7.
Spatial relationship issues in vertically connected spaces (stairwells and elevator shafts).Green boxes represent spaces, blue boxes represent windows, red boxes represent doors, and arrows indicate the rela-tionships between spaces.
In contrast, although no incorrectly generated connections were observed in the office building model, several missed connections were identified. These issues were not caused by the proposed XeoBIM Viewer algorithm but rather by the modeling approach used in the source IFC model. Specifically, the stairwell was modeled as two separate spaces on the first and second floors (Figure 7c,d), and no information describing the vertical connectivity between these spaces was defined in the IFC model. Consequently, the proposed method was unable to infer the vertical spatial relationship between the two stairwell spaces. Similarly, although the elevator shaft was modeled as a single continuous space, no door elements connecting the shaft to adjacent spaces were defined (Figure 7a,b). As a result, the corresponding spatial relationships could not be generated.
These findings indicate that the missed connections observed in the office building model originated from the IFC modeling strategy rather than from limitations of the proposed algorithm. Specifically, the absence of explicit vertical connectivity between stairwell spaces and the lack of door elements associated with the elevator shaft prevented the proposed method from establishing the corresponding spatial relationships. Consequently, the accuracy of the generated spatial relationship graph ultimately depends on the completeness and consistency of the input IFC model. Missing opening entities, incomplete space definitions, or inconsistent geometric and semantic representations may reduce the accuracy of the extracted spatial relationships.
Nevertheless, the experimental results demonstrate that, for IFC models with well-defined semantic and geometric information, the proposed approach provides robust and reliable spatial relationship extraction. Therefore, future work should incorporate a mechanism that enables users to manually establish or modify spatial relationships involving vertically connected spaces, such as stairwells and elevator shafts, thereby compensating for missing connectivity resulting from differences in IFC modeling practices.
5. Conclusions
This paper proposes XeoBIM Viewer, an integrated BIM viewer that utilizes IFC-based BIM data to interpret architectural spatial structures and relationships and visualizes them intuitively. Unlike conventional IFC viewers, which primarily focus on 3D geometric visualization and provide limited support for spatial relationship analysis, the proposed system semantically interprets spatial structures based on spaces (rooms) and opening elements, such as doors, windows, and curtain walls. By modeling these relationships using a graph-based approach, the system enables systematic analysis of spatial connectivity, accessibility, and adjacency.
Furthermore, XeoBIM Viewer integrates a 3D BIM model view, a story-based 2D floor plan view, and a spatial relationship graph view within a unified multi-view interface. Through synchronized interactions between these views, users can explore and understand complex architectural spaces from multiple perspectives.
The proposed system was validated using real-world IFC building models with different levels of complexity. The results demonstrate that XeoBIM Viewer can effectively extract spatial and relationship information from IFC data, generate accurate space connectivity graphs, and represent them through synchronized 3D, 2D, and graph-based visualizations. In particular, the multi-view interaction framework improves both spatial understanding and analytical efficiency compared to conventional single-view BIM tools. These findings suggest that BIM viewers can evolve beyond simple visualization tools into analysis-oriented platforms that support spatial interpretation and decision making.
However, several limitations remain. Because spatial boundary interpretation and relationship analysis depend on the quality and level of detail of the IFC models, analytical accuracy may decrease when incomplete or non-standard IFC data are used. Additionally, performance degradation may occur during graph generation and visualization when processing large-scale building models, indicating the need for further optimization for real-time applications.
Future research should focus on extending the graph-based quantitative analysis functions and improving the performance of large-scale model processing. Furthermore, integration with digital twins, XR environments, and robotic path planning systems could enable XeoBIM Viewer to evolve into a BIM-based spatial intelligence platform for advanced architectural and built environment applications.
Funding
This research received no external funding.
Data Availability Statement
The original contributions presented in this study are included in the article, and further inquiries can be directed to the corresponding author.
Conflicts of Interest
The author declares no conflicts of interest.
References
- BuildingSMART International Industry Foundation Classes (IFC); Version 4. Available online: https://standards.buildingsmart.org/IFC/RELEASE/IFC4/FINAL/HTML/ (accessed on 7 May 2026).
- Xu, Z.; Wang, Y.; Fan, J.; Tian, Y.; Shi, Z.; Jin, N. BrIMs-based 3D semantic segmentation of bridge components leveraging multisensor fusion. J. Comput. Civ. Eng. 2026, 40, 04026012. [Google Scholar] [CrossRef] [Scilit]
- Sharafat, A.; Khan, M.S.; Latif, K.; Seo, J. BIM-based tunnel information modeling framework for visualization, management, and simulation of drill-and-Blast Tunneling projects. J. Comput. Civ. Eng. 2021, 35, 04020068. [Google Scholar] [CrossRef] [Scilit]
- Sharafat, A.; Khan, M.S.; Latif, K.; Tanoli, W.A.; Park, W.; Seo, J. BIM-GIS-based integrated framework for underground utility management system for earthwork operations. Appl. Sci. 2021, 11, 5721. [Google Scholar] [CrossRef] [Scilit]
- Buruzs, A.; Šipetić, M.; Blank-Landeshammer, B.; Zucker, G. IFC BIM model enrichment with space function information using graph neural networks. Energies 2022, 15, 2937. [Google Scholar] [CrossRef] [Scilit]
- Zhao, Z.; Chen, W.; Guo, Z.; Jiang, W. IFC-based indoor space extraction with topological graph modeling. In Proceedings of the Sixth International Conference on Civil and Building Engineering Informatics; EasyChair: Stockport, UK, 2025; Volume 22, pp. 770–780. [Google Scholar]
- Datacomp IT sp. z o.o. BIMvision IFC Viewer. Available online: https://bimvision.eu (accessed on 7 May 2026).
- Solibri Solibri Anywhere. Available online: https://www.solibri.com (accessed on 7 May 2026).
- BIMcollab BIMcollab ZOOM. Available online: https://www.bimcollab.com (accessed on 7 May 2026).
- Autodesk. Autodesk Viewer. Available online: https://viewer.autodesk.com (accessed on 7 May 2026).
- xBIM Team XBIM Xplorer. Available online: https://xbim.net (accessed on 7 May 2026).
- BlenderBIM BlenderBIM Add-On. Available online: https://bonsaibim.org/ (accessed on 7 May 2026).
- Trimble Trimble Connect Viewer. Available online: https://connect.trimble.com (accessed on 7 May 2026).
- Open Design Alliance Open IFC Viewer. Available online: https://openifcviewer.com (accessed on 7 May 2026).
- Kisters. 3DViewStation. Available online: https://www.kisters.net/products-services/#item-cad-visualization (accessed on 27 May 2026).
- ACCA. Software UsBIM. Viewer. Available online: https://www.accasoftware.com (accessed on 7 May 2026).
- BIMData BIMData Viewer. Available online: https://bimdata.io (accessed on 7 May 2026).
- Fabian Gerold IfcPlusPlus Viewer. Available online: https://github.com/ifcquery/ifcplusplus (accessed on 7 May 2026).
- Revizto Revizto Viewer. Available online: https://revizto.com (accessed on 7 May 2026).
- Biggs, N.L.; Lloyd, E.K.; Wilson, R.J. Graph Theory: 1736–1936; Clarendon Press: Oxford, UK, 1986. [Google Scholar]
- Euler, L. Mechanica: Sive Motvs Scientia Analytice Exposita: Instar Svpplementi Ad Commentator, Acad. Scient. Imp; Typis Academiae Scientarum: St. Petersburg, Russia, 1736. [Google Scholar]
- Ning, F.; Li, Z.; Lu, J.; Wang, Y.; Niu, Y.; Shi, Y. 3D CAD model dynamic clustering based on inertial feature encoder. Appl. Soft Comput. 2025, 182, 113627. [Google Scholar] [CrossRef] [Scilit]
- Ham, S.; Lee, G. Space-connector model for representing the geometric properties of connections between spaces. Archit. Sci. Rev. 2018, 61, 429–442. [Google Scholar] [CrossRef] [Scilit]
- IfcOpenShell IfcOpenShell: Open Source IFC Toolkit and Geometry Engine. Available online: https://ifcopenshell.org (accessed on 7 May 2026).
- Coin3D Coin3D—Open Inventor API Implementation. Available online: https://coin3d.github.io (accessed on 7 May 2026).
- Gansner, E.R.; North, S.C. An open graph visualization system and its applications to software engineering. Softw. Pract. Exper. 2000, 30, 1203–1233. [Google Scholar] [CrossRef]
- Qt Company Qt Framework. Available online: https://www.qt.io (accessed on 7 May 2026).

Disclaimer/Publisher’s Note: The statements, opinions and data contained in all publications are solely those of the individual author(s) and contributor(s) and not of MDPI and/or the editor(s). MDPI and/or the editor(s) disclaim responsibility for any injury to people or property resulting from any ideas, methods, instructions or products referred to in the content. |
© 2026 by the author. Licensee MDPI, Basel, Switzerland. This article is an open access article distributed under the terms and conditions of the Creative Commons Attribution (CC BY) license.