


Abstract
To address the severe threats posed by stay cable fractures, this study investigates a fatigue fracture of a fork-eye anchor head induced by excessive cable vibrations on a landscape cable-stayed bridge. A comprehensive methodology integrating field monitoring, theoretical analysis, and finite element simulation is employed to reveal the vibration characteristics, fatigue mechanism, and multi-factor coupled effects. Field tests identify wind-induced vibration and parametric resonance as the primary external triggers for fatigue damage. A simplified mechanical model of the fork-eye anchor head is established to evaluate the stress state under combined axial tension and bending moment. Fatigue analysis using the stress–life method elucidates how vibration-induced alternating stress significantly reduces the fatigue life of the connecting screw. The multi-factor coupled fracture mechanism is revealed, and practical mitigation measures including supplementary dampers and regular inspection are proposed. The findings provide a theoretical basis and engineering guidance for the design, maintenance, and safety assessment of similar landscape cable-stayed bridges.
1. Introduction
Cable-stayed bridges are widely adopted in highway engineering, urban construction, and scenic area development due to their outstanding esthetic performance. As primary load-bearing components, stay cables sustain complex high stresses throughout their service life, making them highly susceptible to environmental corrosion and dynamic loads. Under combined fatigue damage and atmospheric corrosion, cable failure triggers internal force redistribution of the entire bridge. Such redistribution further causes structural deflection, cracking, or even collapse, seriously threatening structural safety and durability [1]. Since the application of cable-stayed bridges, frequent accidents induced by stay cable failure have incurred massive economic losses and adverse social impacts [2,3,4,5,6,7,8]. These failures have attracted extensive academic attention and promote systematic investigations into cable fracture from the perspectives of material degradation, environmental effects, construction quality, and vibration fatigue.
Stay cable fractures originate from the coupled effects of four categories of factors: intrinsic material deterioration, external load and environmental actions, fabrication and installation defects, and inadequate design and poor operation management. Intrinsic degradation is an internal cause of cable performance deterioration, arising from physical and chemical changes under long-term environmental exposure [9,10,11,12,13]. Existing studies confirm that corrosion degradation and surface flaws in high-strength steel wires remarkably reduce material toughness [14,15]. The coupling of corrosion and cyclic fatigue loads aggravates damage and significantly shortens the service life of short stay cables [16,17]. External loads and environmental conditions act as direct triggers for excessive vibration, accumulated fatigue damage, and sudden overload failure. Resonance induced by wind and traffic loads substantially decreases cable fatigue life [18,19]. Chloride ingress in marine environments and temperature-humidity cycling in hot, humid regions accelerate the corrosion-fatigue development of stay cables [20,21]. Long-term structural degradation weakens disaster resistance, while multi-hazard coupling elevates fracture risk and increases maintenance difficulty [22,23,24,25,26,27,28,29,30,31]. Fabrication and installation defects introduce initial invisible damage that cannot be easily detected in early operation, and which poses long-term hidden risks [32,33,34]. Uneven cable force distribution, anchorage installation error, and defective protective layers rank as common triggers of premature cable fracture [35]. Furthermore, inadequate design and improper management serve as underlying promoting factors. These non-technical risks persist throughout the full service cycle. They not only produce potential hazards [28,36], but also magnify the destructive effects of material deterioration, environmental erosion, and external loads. Insufficient consideration of multi-hazard coupling and nonlinear vibration in conventional design, outdated design codes, limited manual inspection, and a lack of preventive maintenance further increase cable failure probability. Existing research concludes that the interaction between corrosion and fatigue dominates cable damage evolution; vibration accelerates fatigue accumulation, whereas comprehensive anti-corrosion protection and damping measures effectively delay cable fracture.
Nevertheless, current research exhibits certain limitations. Most investigations into multi-factor coupling remain qualitative, lacking quantitative damage evolution models. Few targeted studies focus on landscape cable-stayed bridges, whose unique architectural layouts restrict cable arrangement and induce complicated dynamic properties. Moreover, relevant research linking vibration source identification to fatigue evaluation remains insufficient. Exploring fracture mechanisms is of great practical significance for early failure prevention. To fill these research gaps, this study combines theoretical derivation with an engineering case study to reveal the cable fracture mechanisms of landscape cable-stayed bridges. An actual landscape cable-stayed bridge is selected as the research object. Fracture morphology analysis preliminarily identifies vibration fatigue as the dominant failure mode. Subsequently, field vibration surveys, in situ frequency measurements, wind-induced vibration analyses, and parametric resonance calculations are conducted to clarify the vibration sources. By integrating mechanical analysis and fatigue calculation, the coupled fatigue fracture characteristics are discussed comprehensively from the perspectives of material, load, construction, and management, particularly within the context of structural health monitoring (SHM) for bridge cables [37,38].
2. Engineering Background
2.1. Bridge Overview
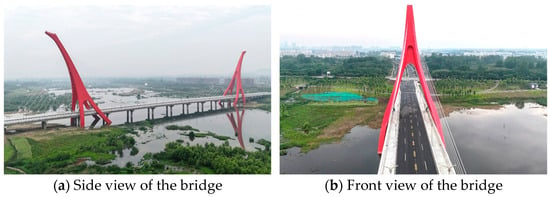
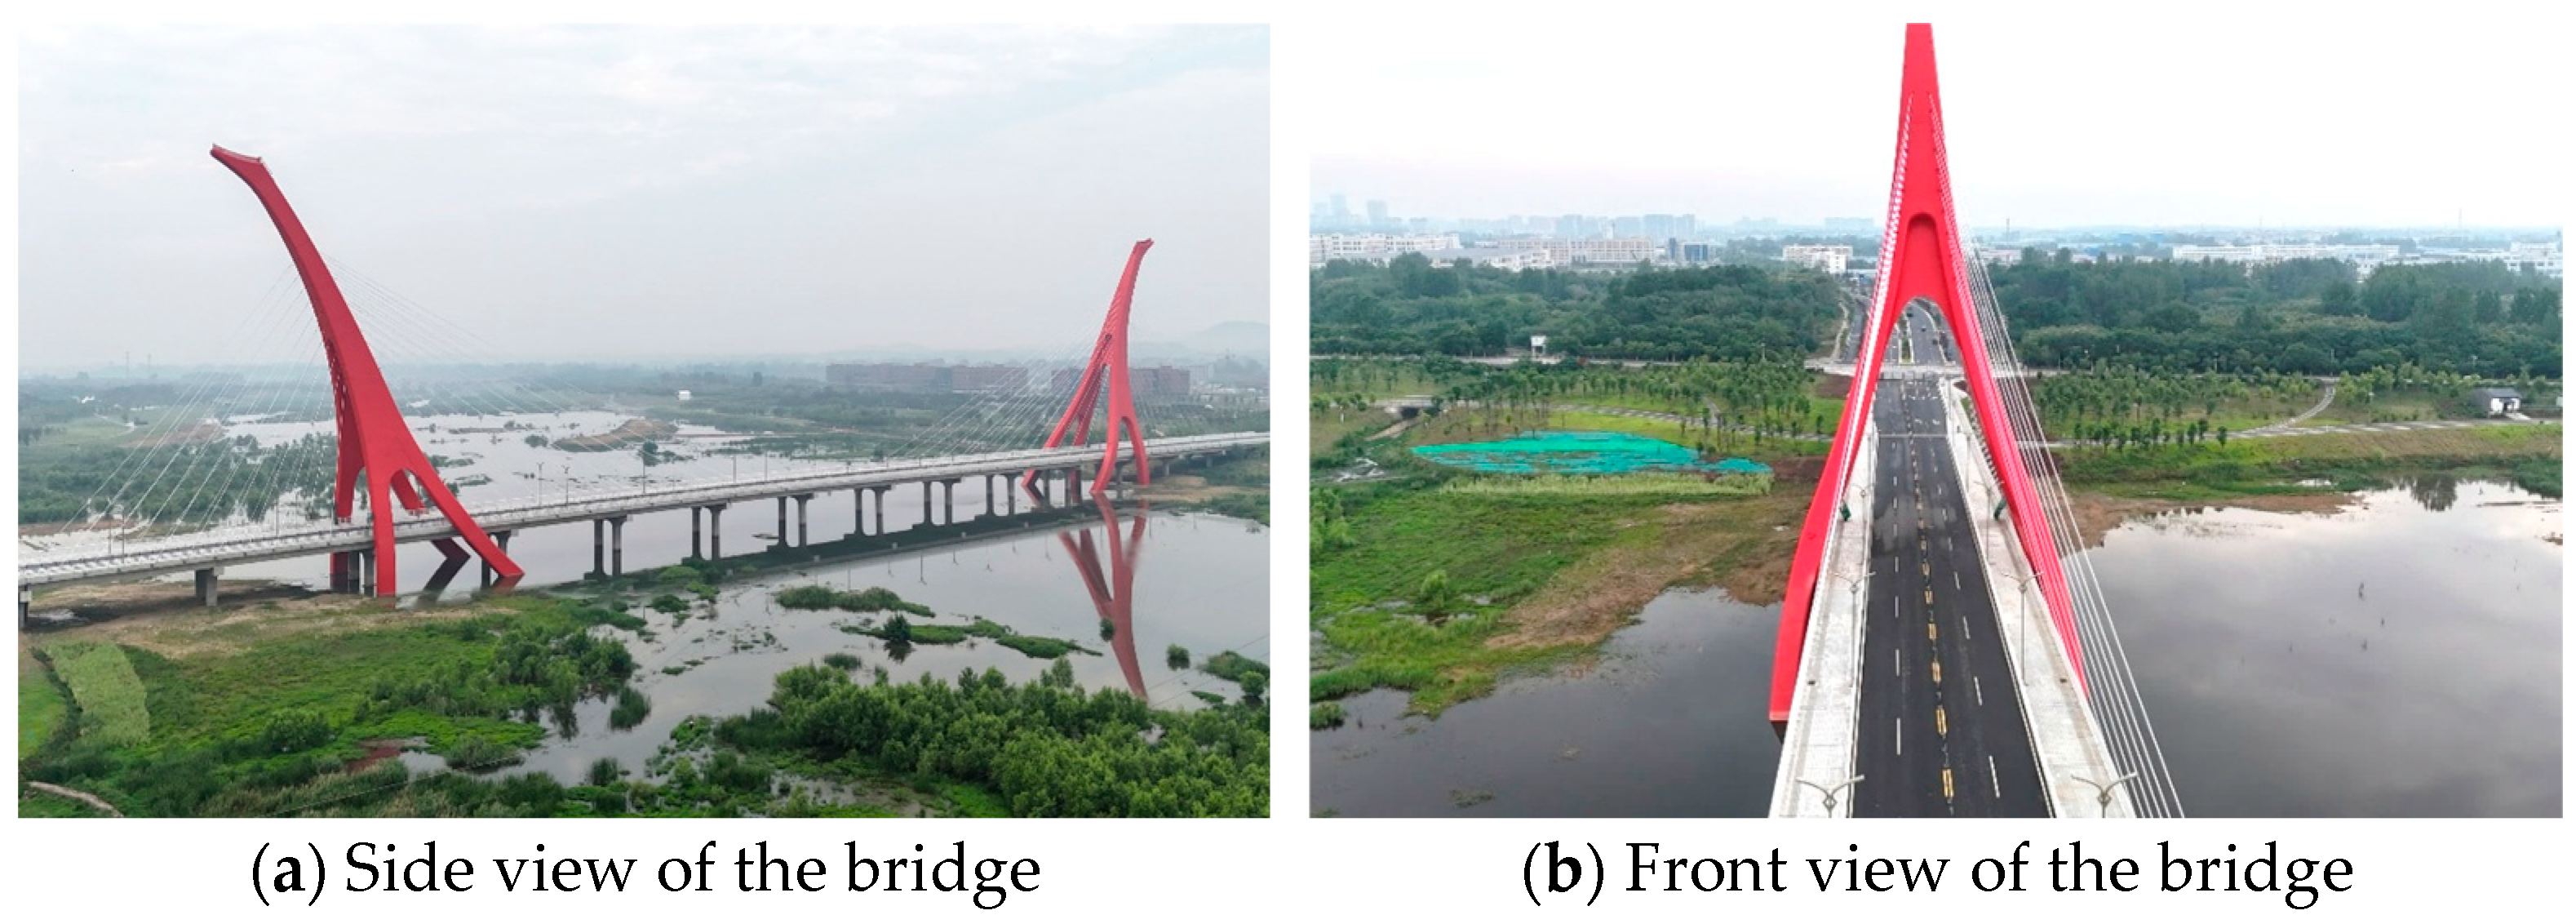
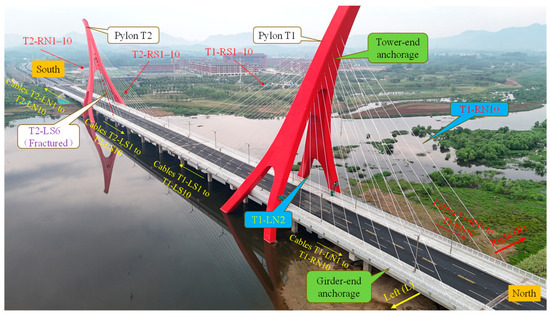
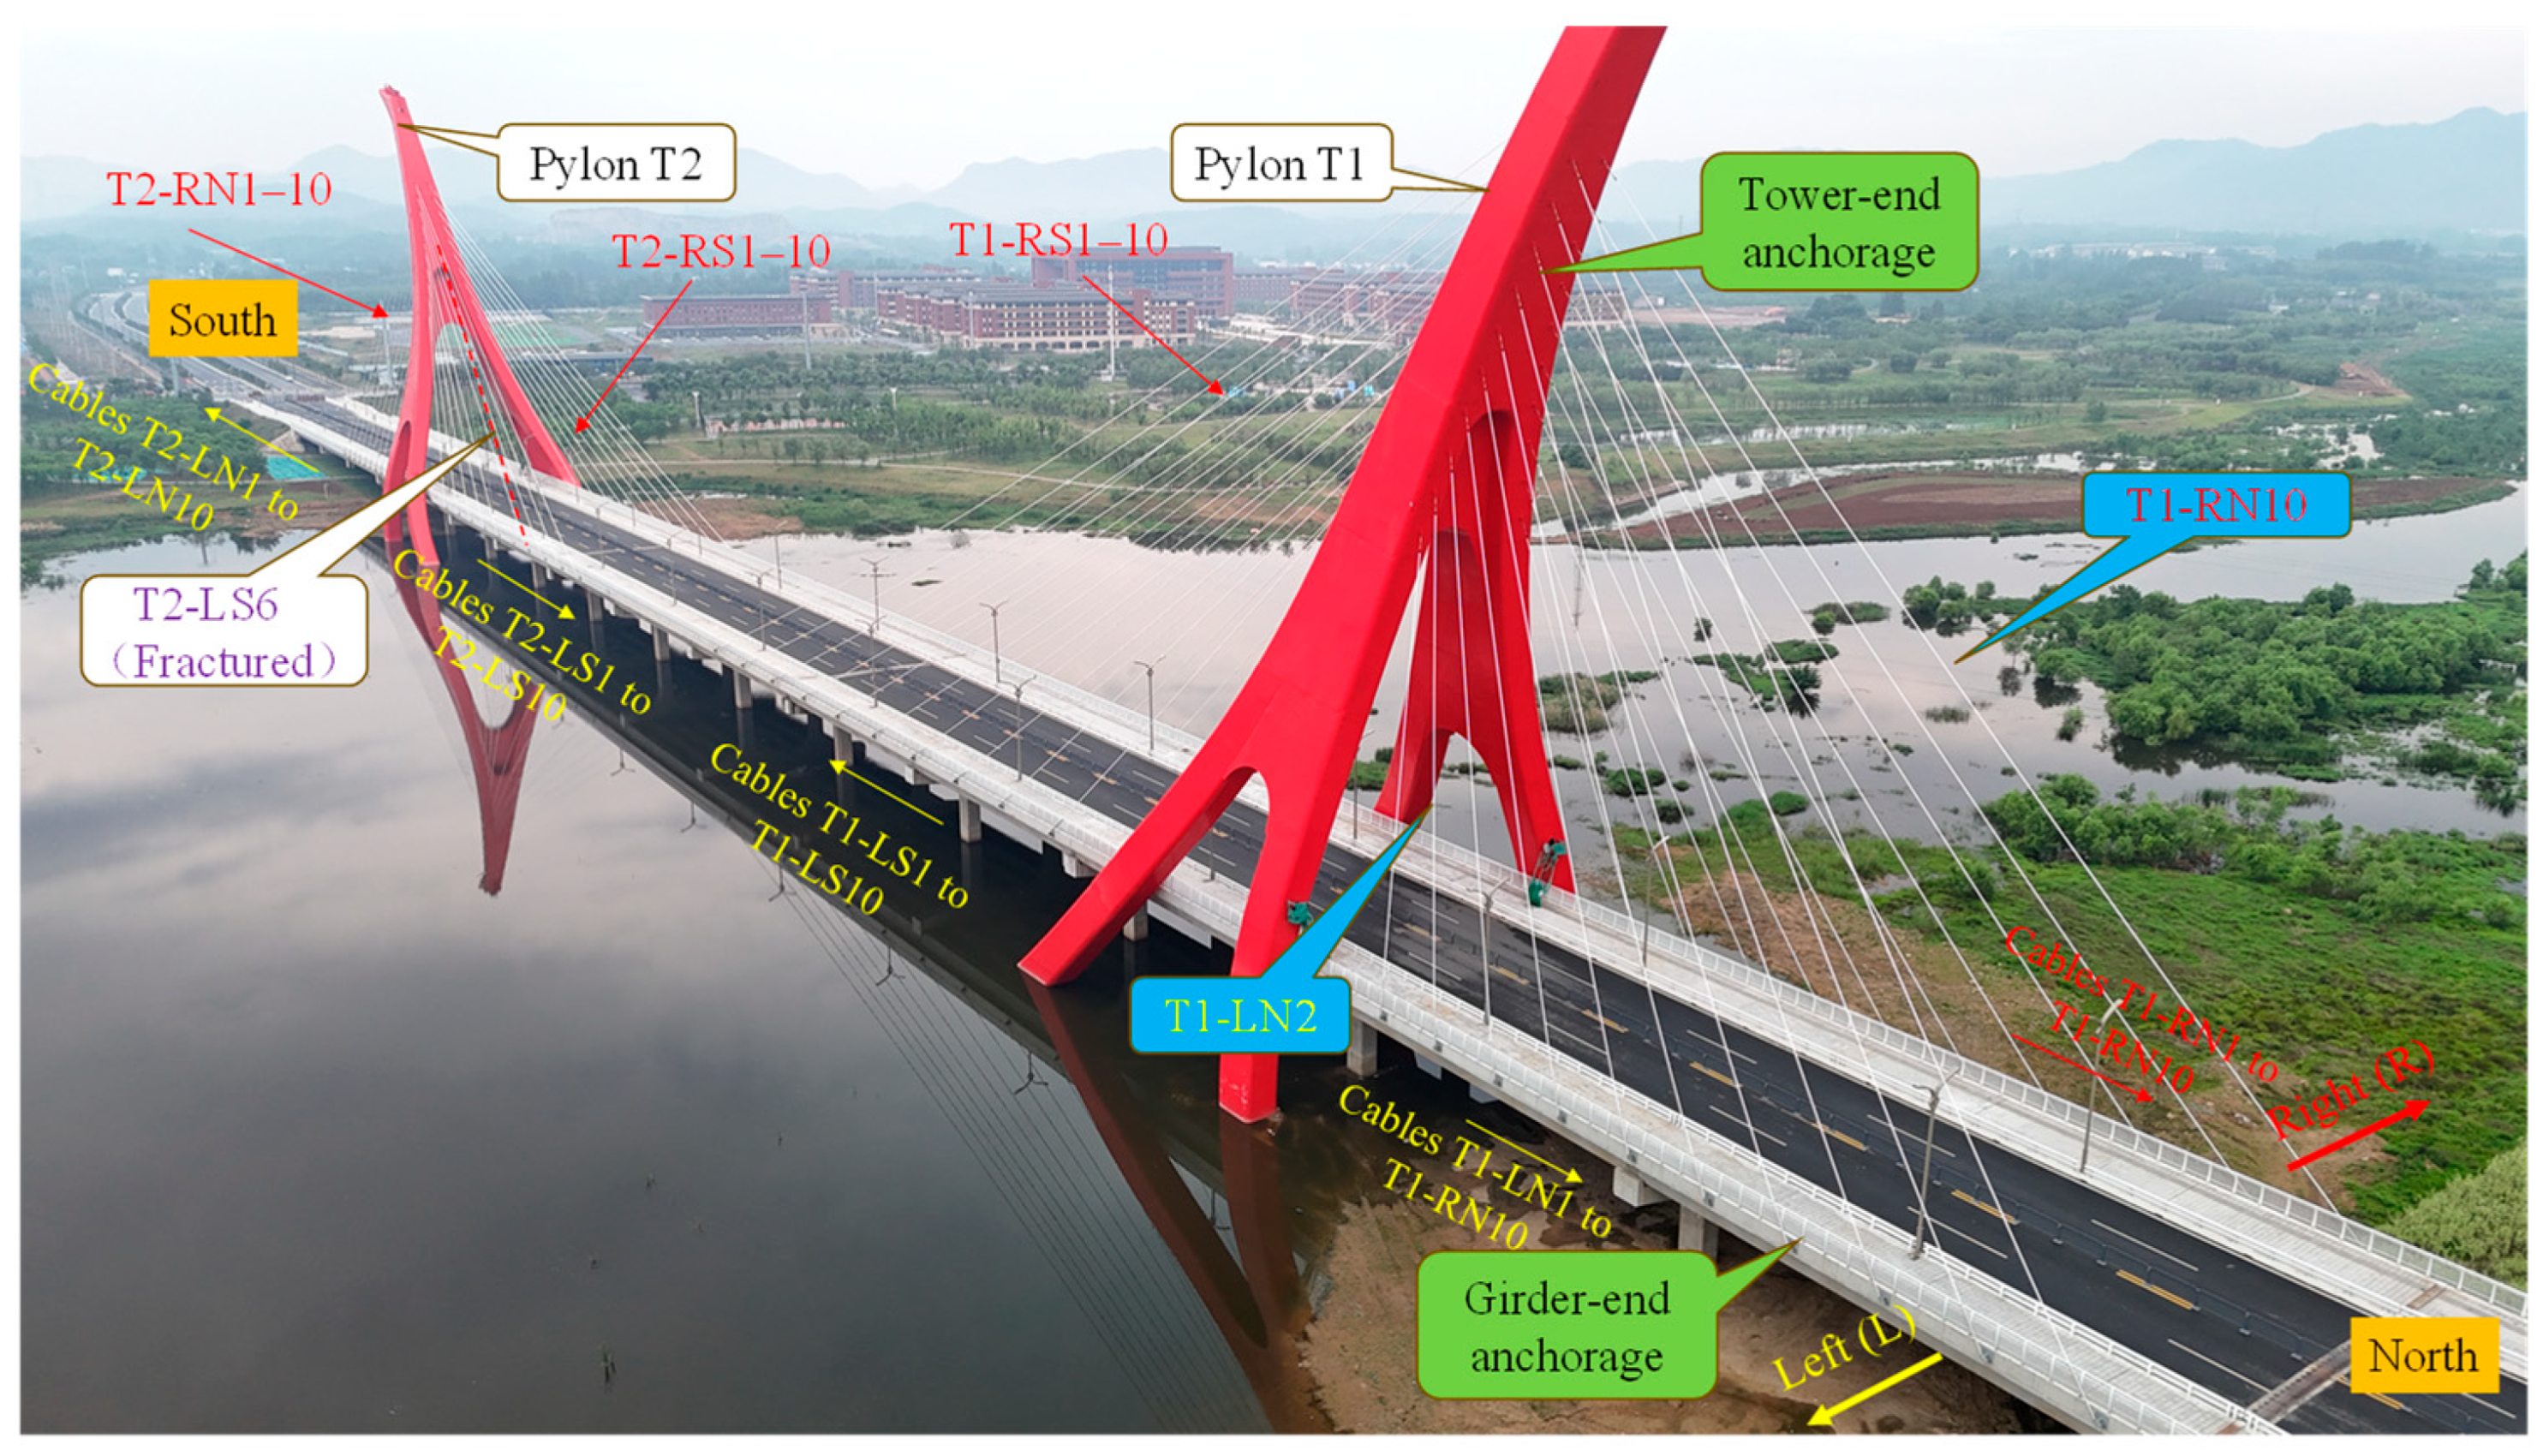
The Chengdong Road Bridge is located in the Pingqiao District of Xinyang City, Henan Province, China, crossing the river with a vertical alignment. The bridge has a total length of 605 m, and its span arrangement consists of five continuous sections with a standard span of 35 m. The first (2 × 35 m), third (3 × 35 m), and fifth (2 × 35 m) sections utilize prefabricated pre-stressed concrete box girders, with the box girders made of C50 concrete. Notably, the second (5 × 35 m) and fourth (5 × 35 m) sections incorporate a distinctive phoenix-shaped pylon cable-stayed structure atop the prefabricated girders, serving as the signature landscape elements, and the pylons are made of Q355C steel. The deck accommodates a two-way, four-lane urban arterial road with a design speed of 50 km/h. The field photos of the bridge are shown in Figure 1.
Figure 1.
Field photos of the landscape cable-stayed bridge.
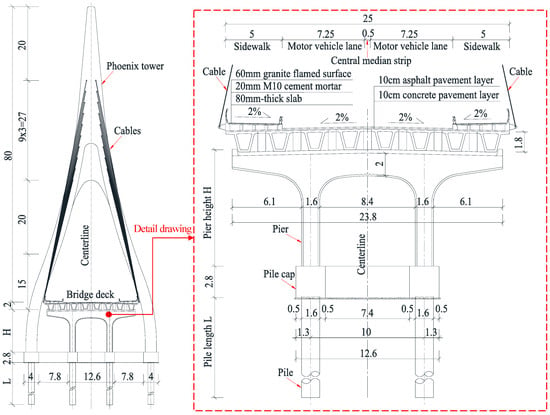
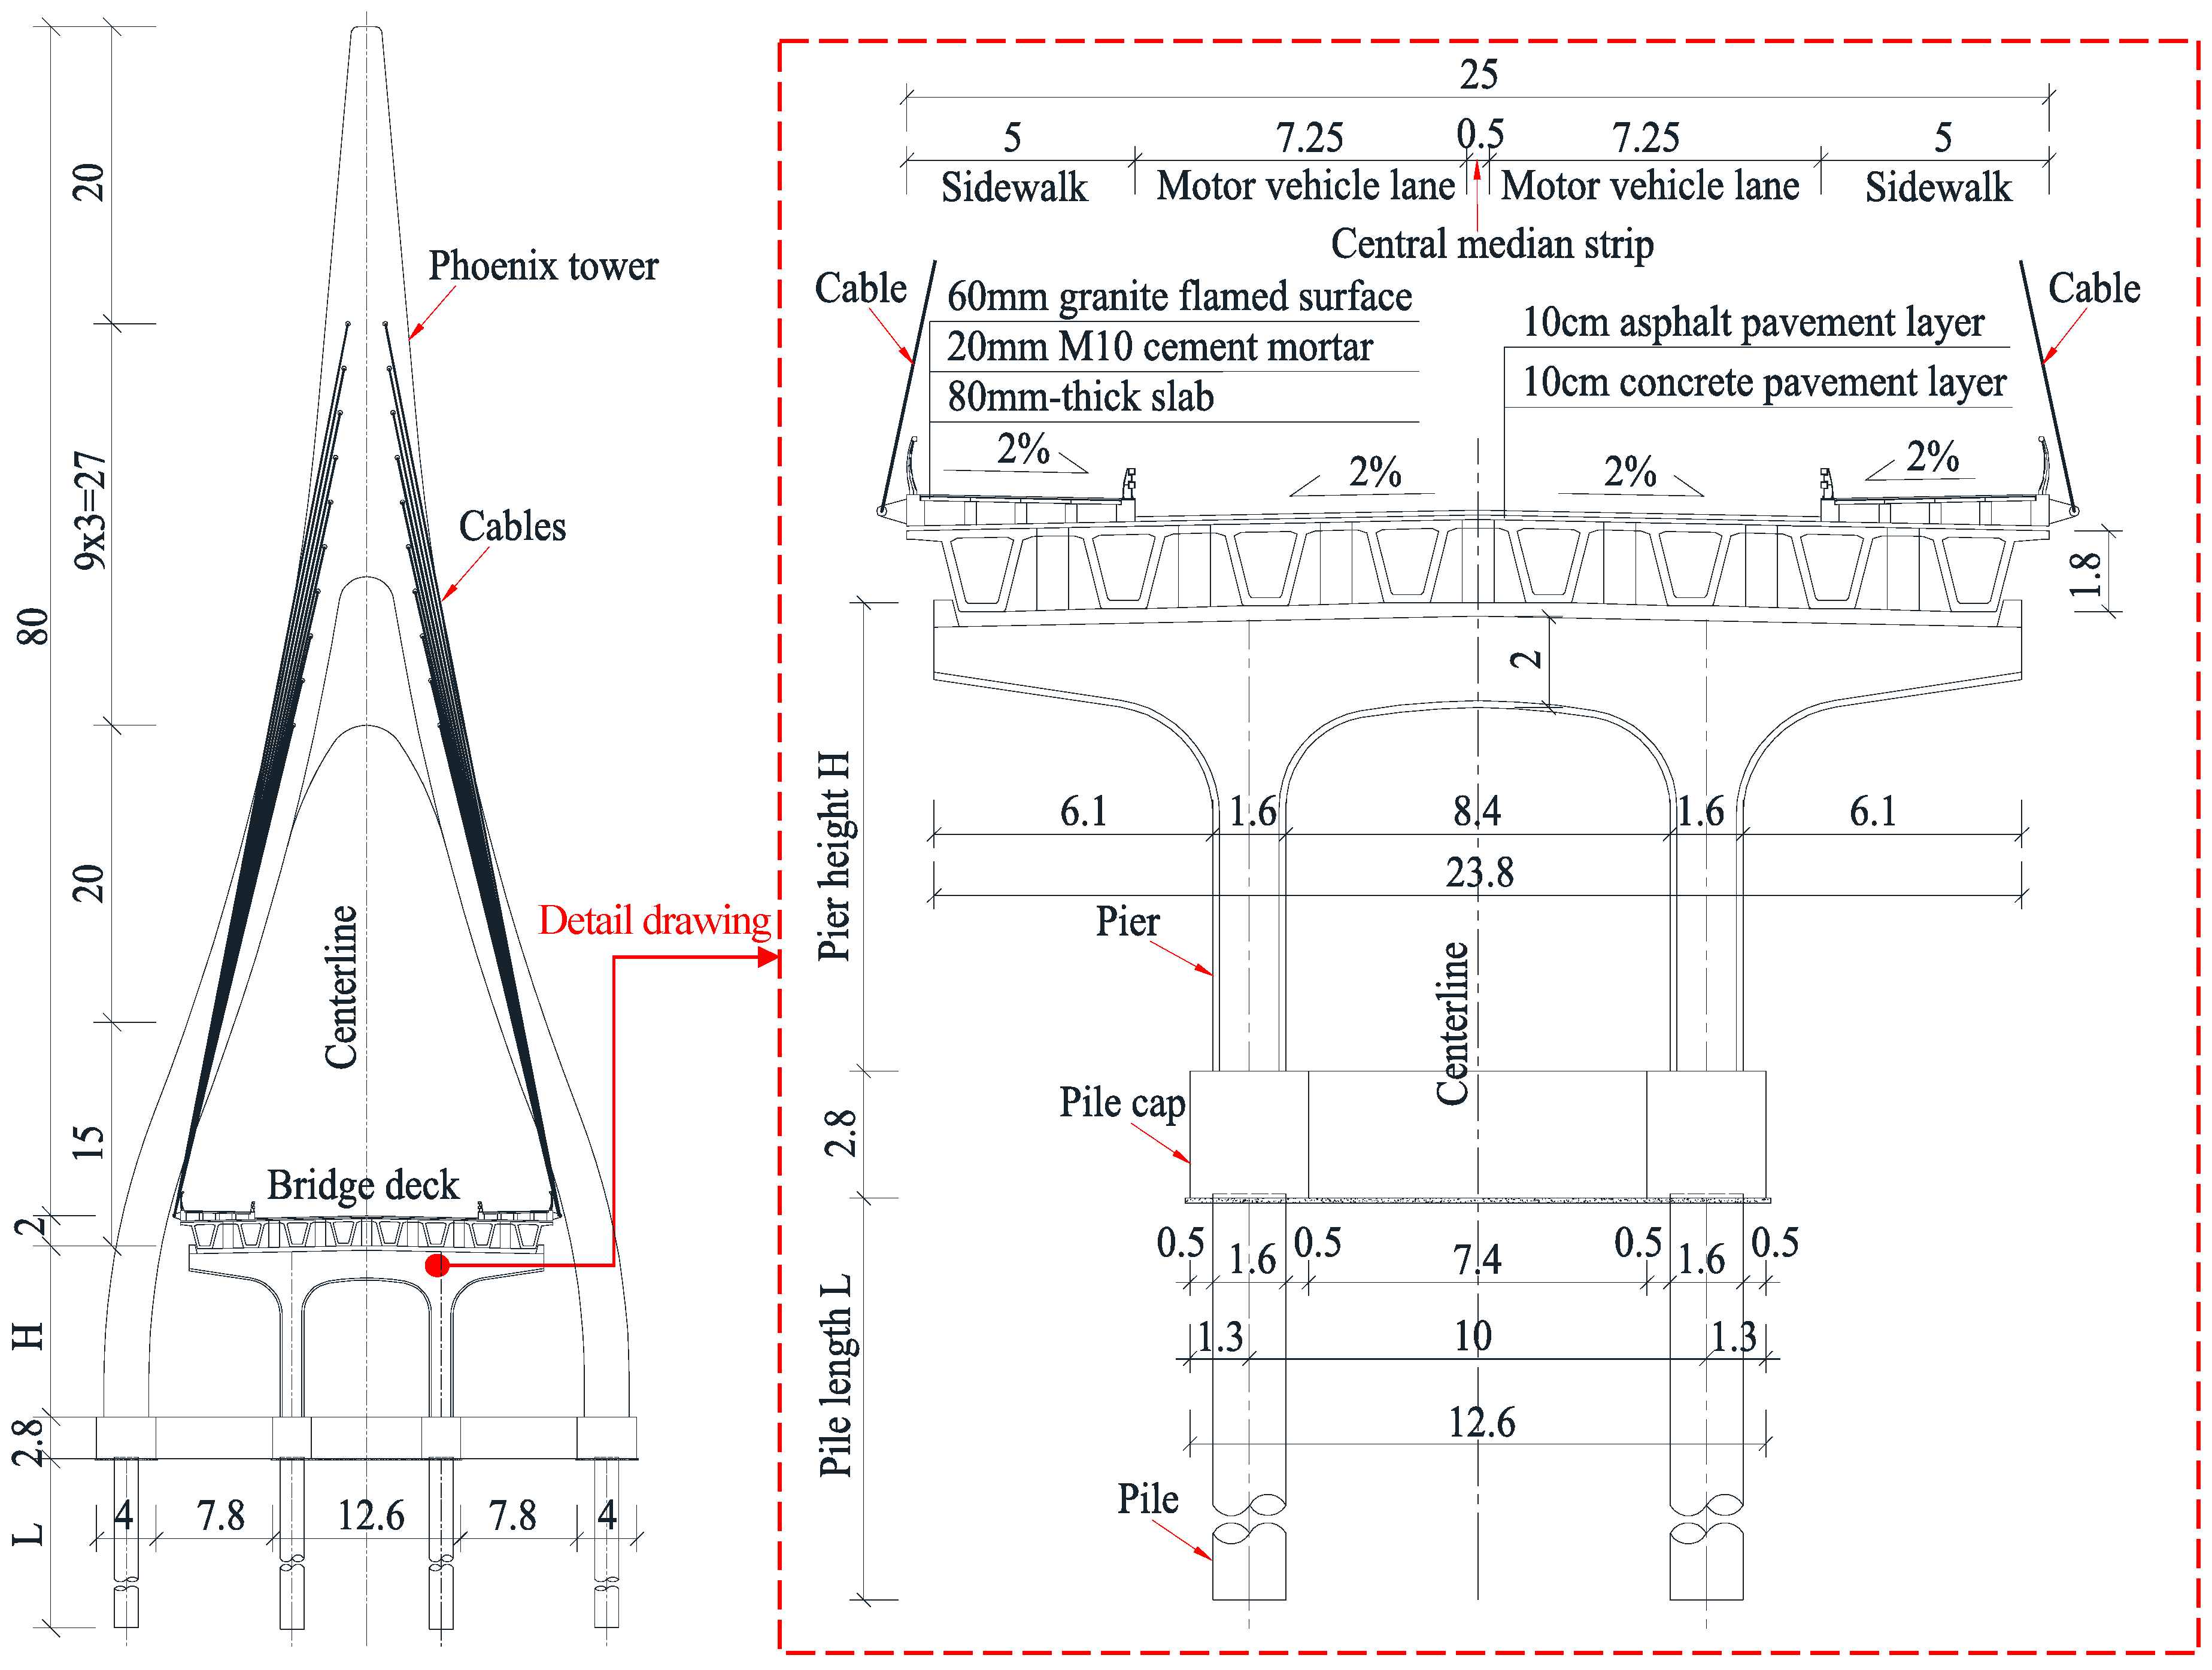
The cross-sectional layout of the bridge is presented in Figure 2. The total width of the bridge is 25 m. The cross-section comprises two sidewalks, each 5 m in width, on both sides, two motor vehicle lanes, each 7.25 m wide, and a central median strip with a width of 0.5 m in the middle. Regarding the deck pavement, the sidewalk area consists of a 60 mm granite flamed surface, a 20 mm M10 cement mortar layer, and an 80 mm-thick sidewalk slab, in sequence; the motor vehicle lane area features a 10 cm asphalt pavement layer and a 10 cm concrete pavement layer, and the transverse slope of the deck is 2%. The total height of the pylon above the deck is 80 m. The cables adopt a spatial double-cable plane fan-shaped arrangement, and the entire bridge is equipped with 40 pairs (80 cables) of stay cables. The vertical spacing of the cable anchorage points at the pylon end is 3 m, and the longitudinal bridge-direction anchorage spacing at the girder end is 6 m (near the bridge head side) or 10 m (near the bridge center side). For the substructure of the bridge, the piers are constructed with C40 concrete, while the pile caps and pile foundations are made of C35 concrete.
Figure 2.
Cross-sectional layout of the bridge (Unit: m).
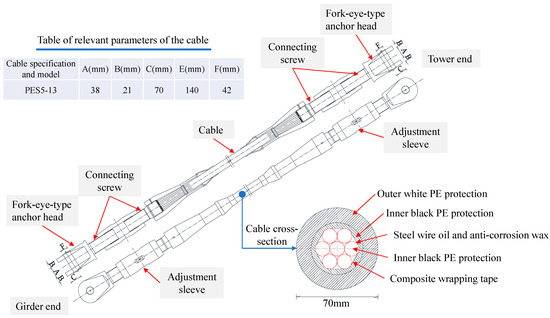
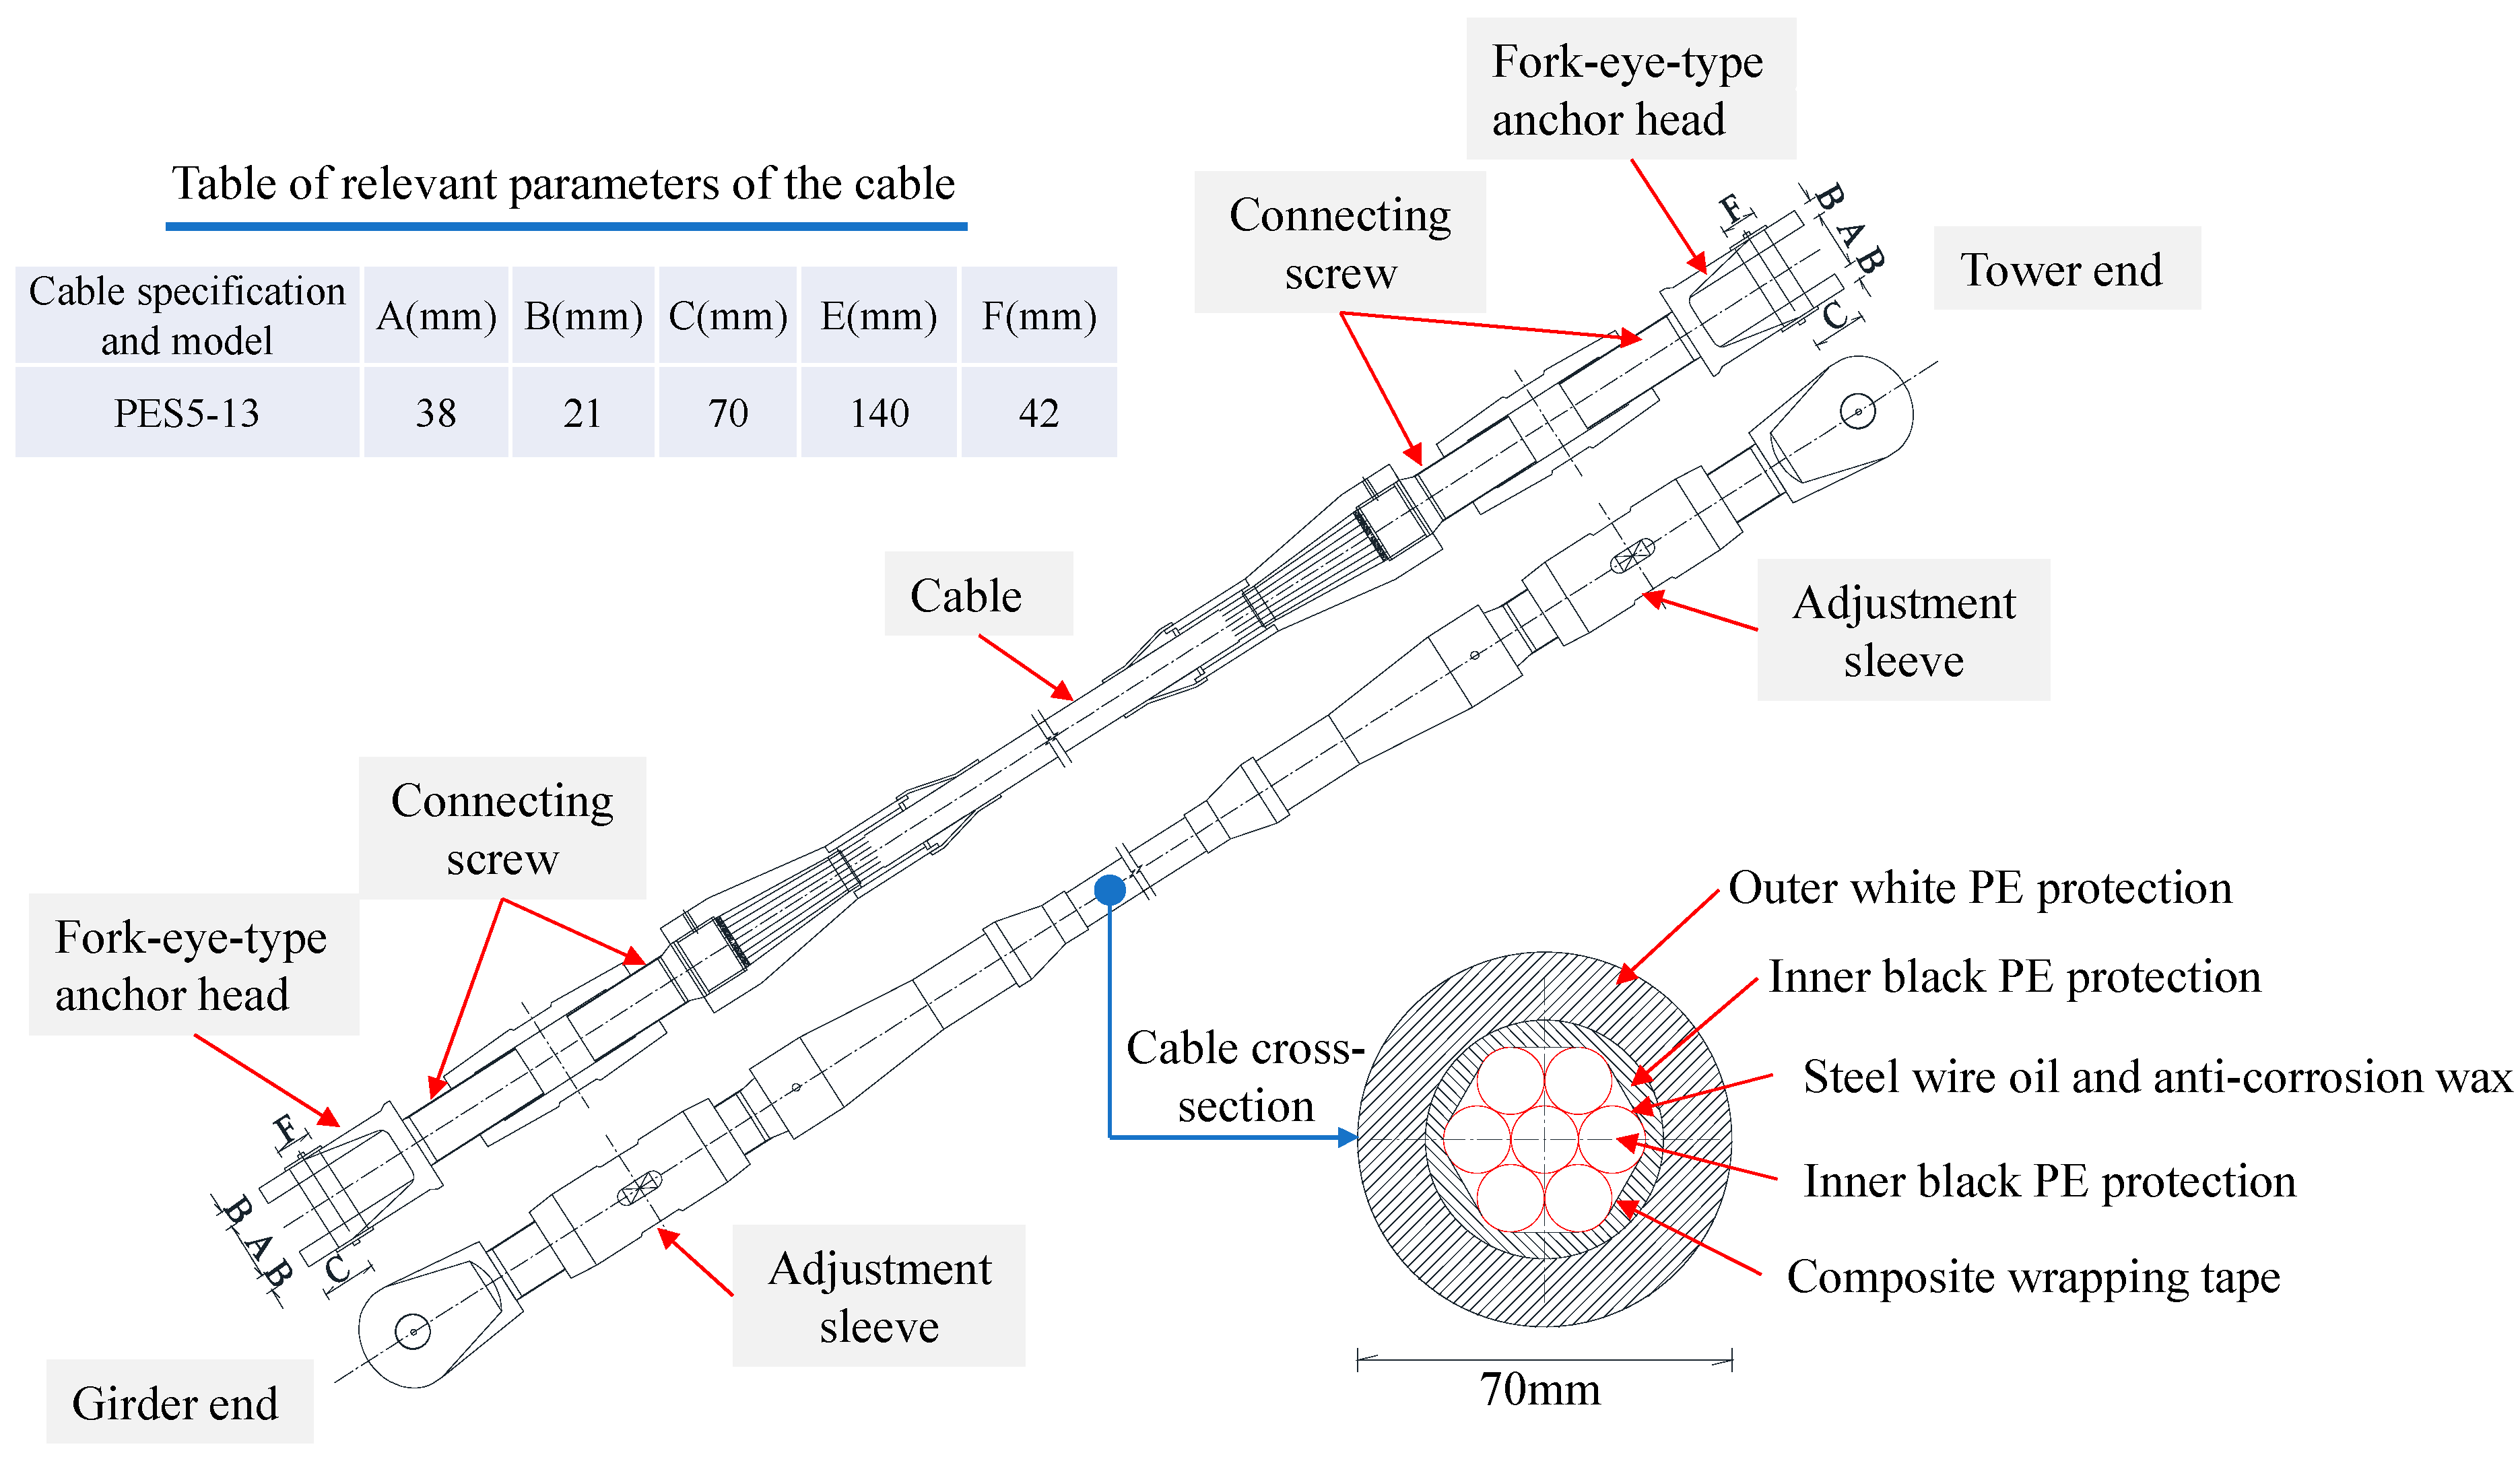
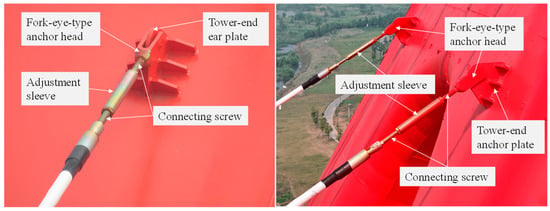
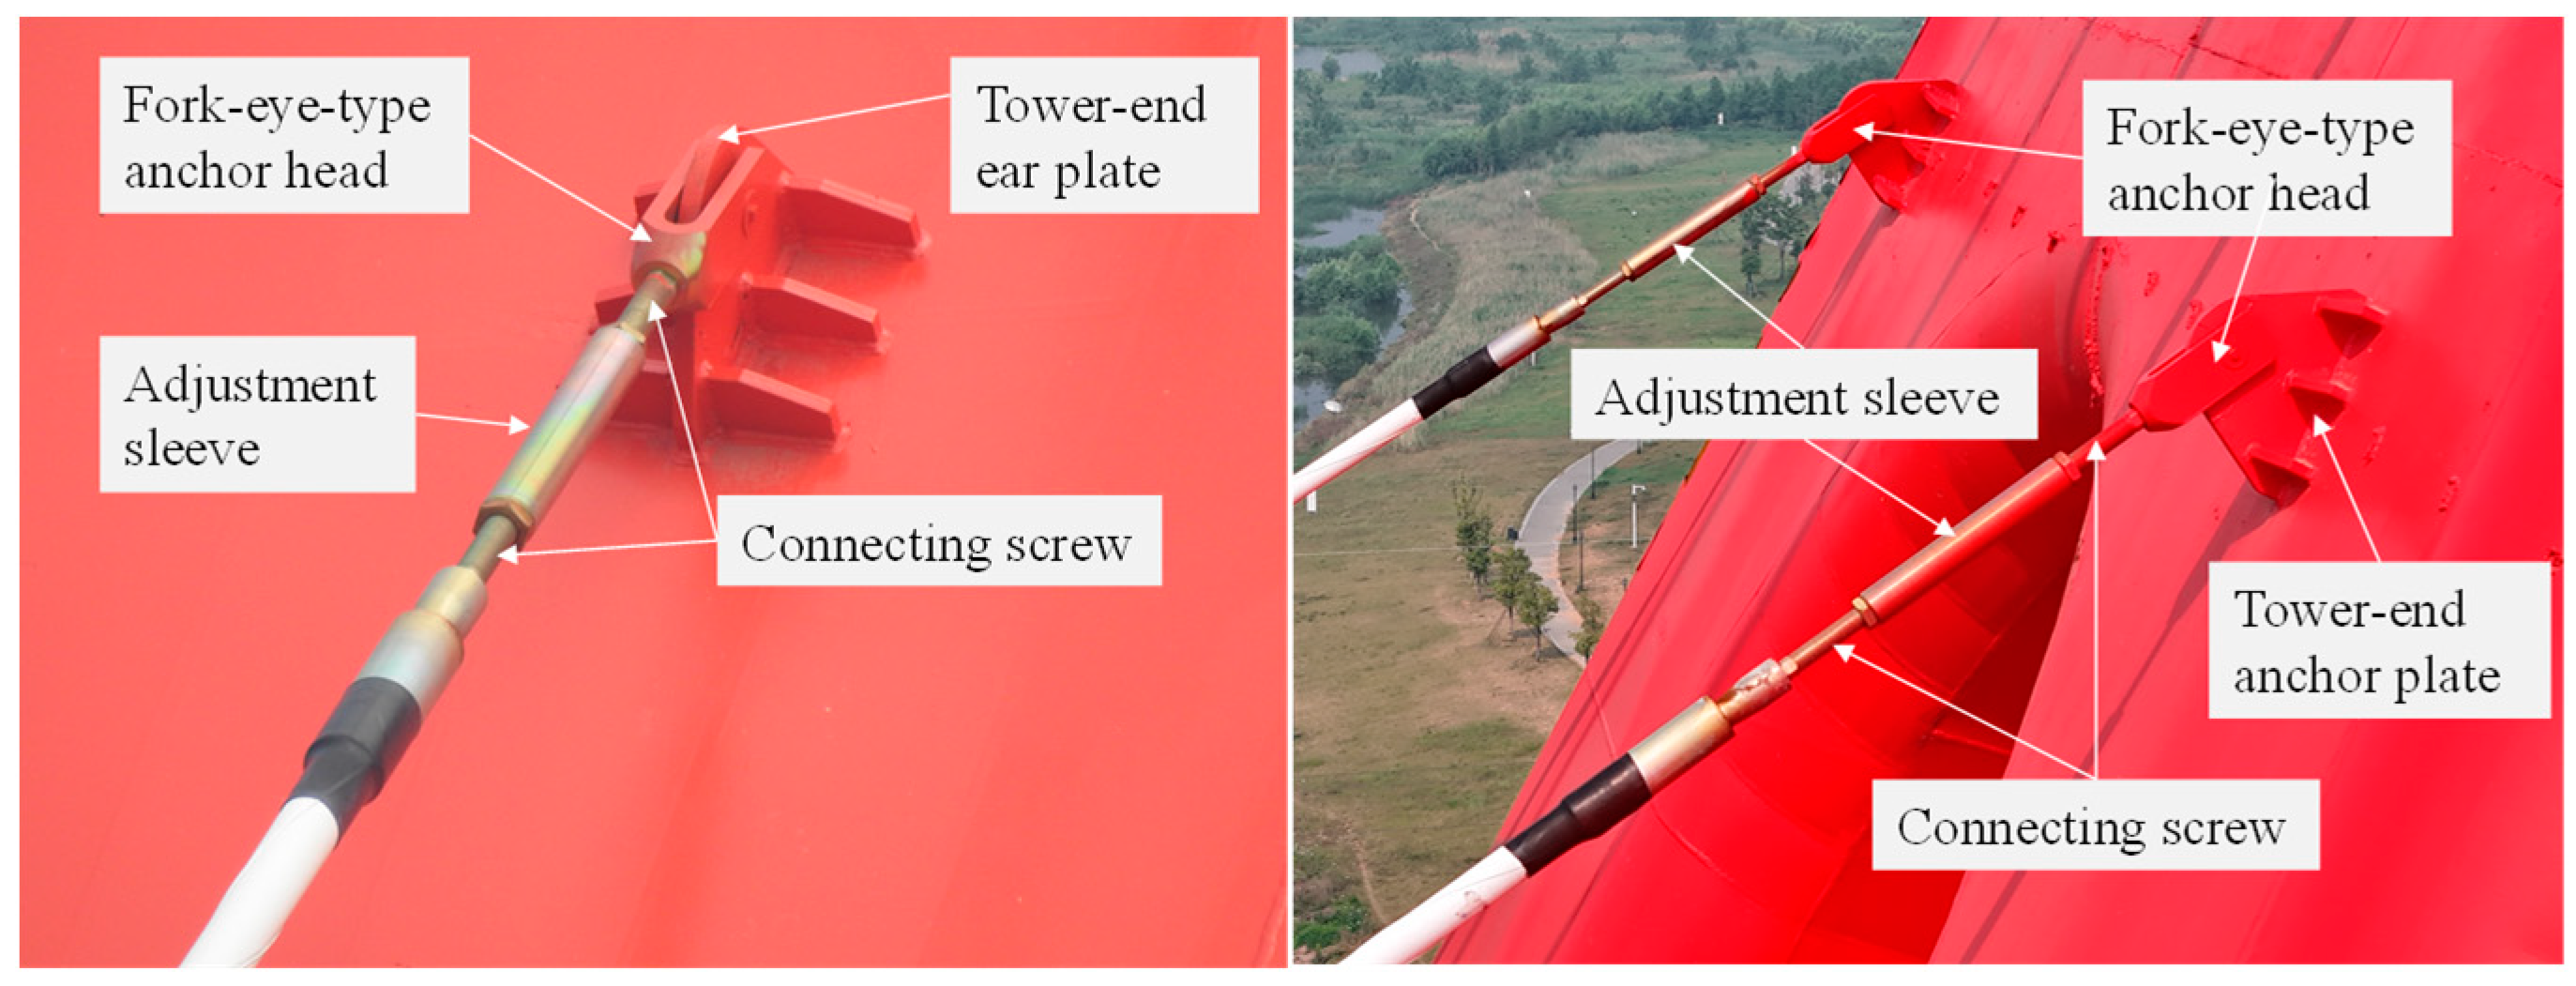
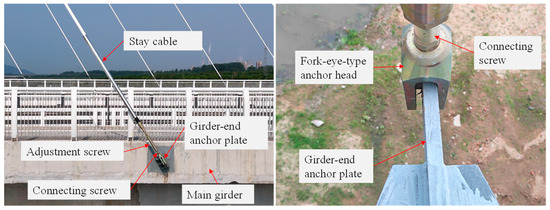
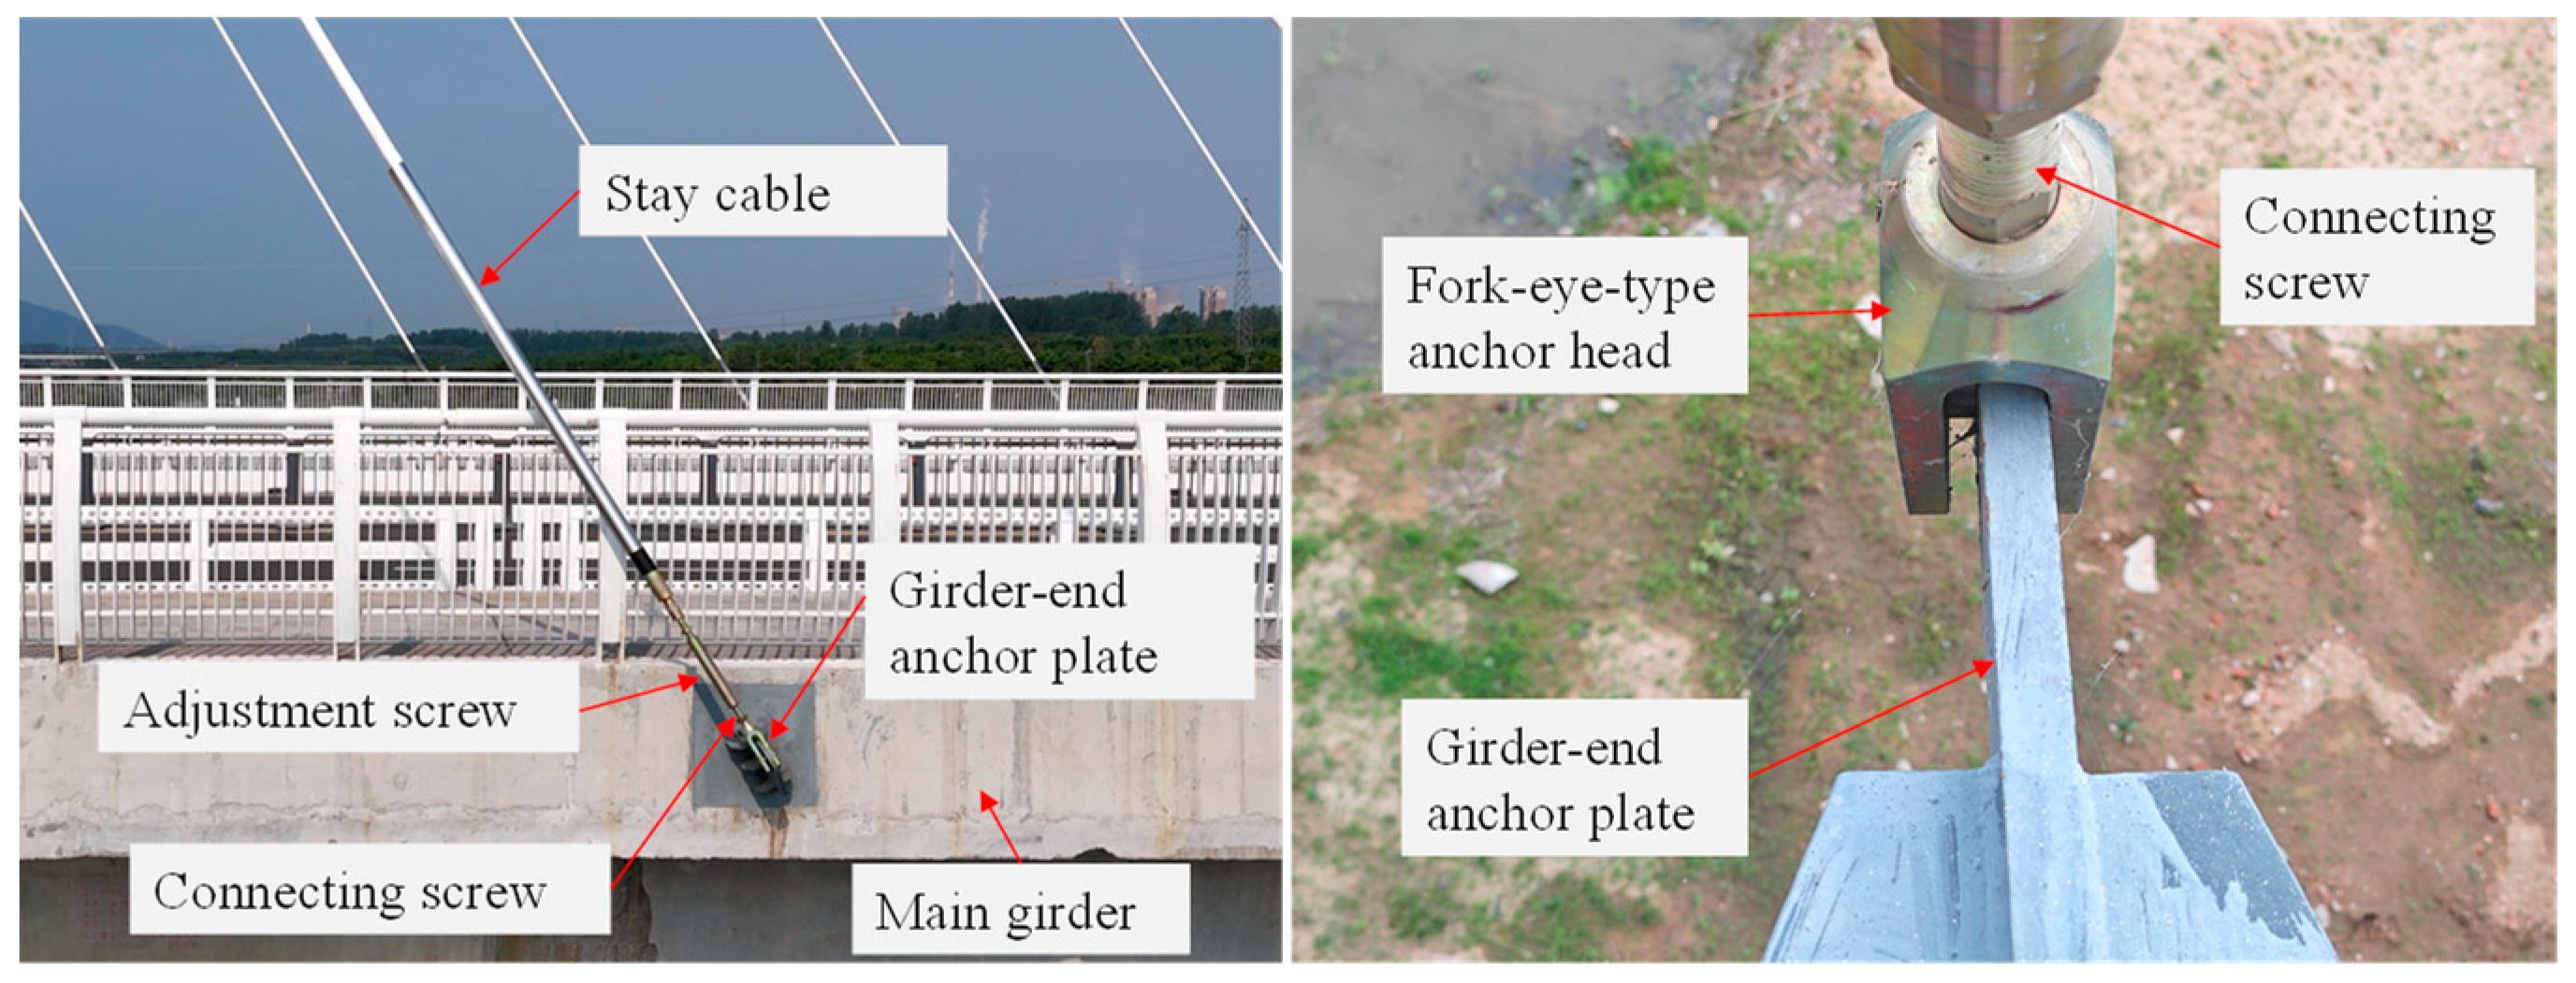
As shown in Figure 3, the stay cables are made of high-strength galvanized parallel steel wires with a diameter of 5 mm, and their standard strength is 1770 MPa. The cable specification is PES5-13, and the corresponding hot-cast anchor specification is PESM5-13. The design fatigue life is over 2 million cycles. The fork-eye-type anchor head has a length of 265 mm, a thickness B of 21 mm, and an inner spacing A of the fork ears of 38 mm. The connecting screw has a length of 295 mm and a specification of M39 × 4. The adjusting sleeve has a length of 420 mm and a diameter of 65 mm. The connecting screw and the adjusting sleeve are connected by threaded connection, and both are made of high-strength alloy steel with an ultimate tensile strength of 632.5 MPa. The stay cables are tensioned at one end, with the tensioning end located at the fork ear of the main girder and the fixed end at the fork ear of the main pylon. The anchorage methods of the cables at the pylon end and the girder end are shown in Figure 4 and Figure 5, respectively. No vibration dampers and energy-dissipating damping devices are installed at either the girder end or the pylon end of the cables.
Figure 3.
Stay cable and anchorage structure diagram.
Figure 4.
Anchorage detail at the pylon end of the stay cable.
Figure 5.
Anchorage detail at the girder end of the stay cable.
The lengths of the 40 pairs (80 cables) of stay cables in the entire bridge are listed in Table 1. The primary design function of the cables is to provide an esthetic effect; therefore, the design cable force is relatively small, and the design cable force for the whole bridge is uniformly set at 80 kN.
Table 1.
Design lengths of stay cables for the whole bridge.
2.2. Fracture Location and Fracture Morphology Analysis
Shortly after the bridge opened to traffic, stay cable T2-LS6 (supported by Pylon T2) fractured abruptly at the connecting anchorage screw near the girder-side fork eye. Due to severe potential structural risks, the administration closed the bridge immediately and launched a systematic investigation into the fracture causes. The global cable layout and fracture location of T2-LS6 are marked in Figure 6.
Figure 6.
Global cable layout and fracture position of cable T2-LS6.
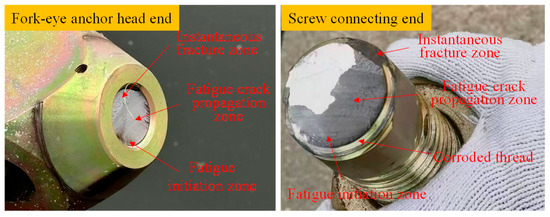
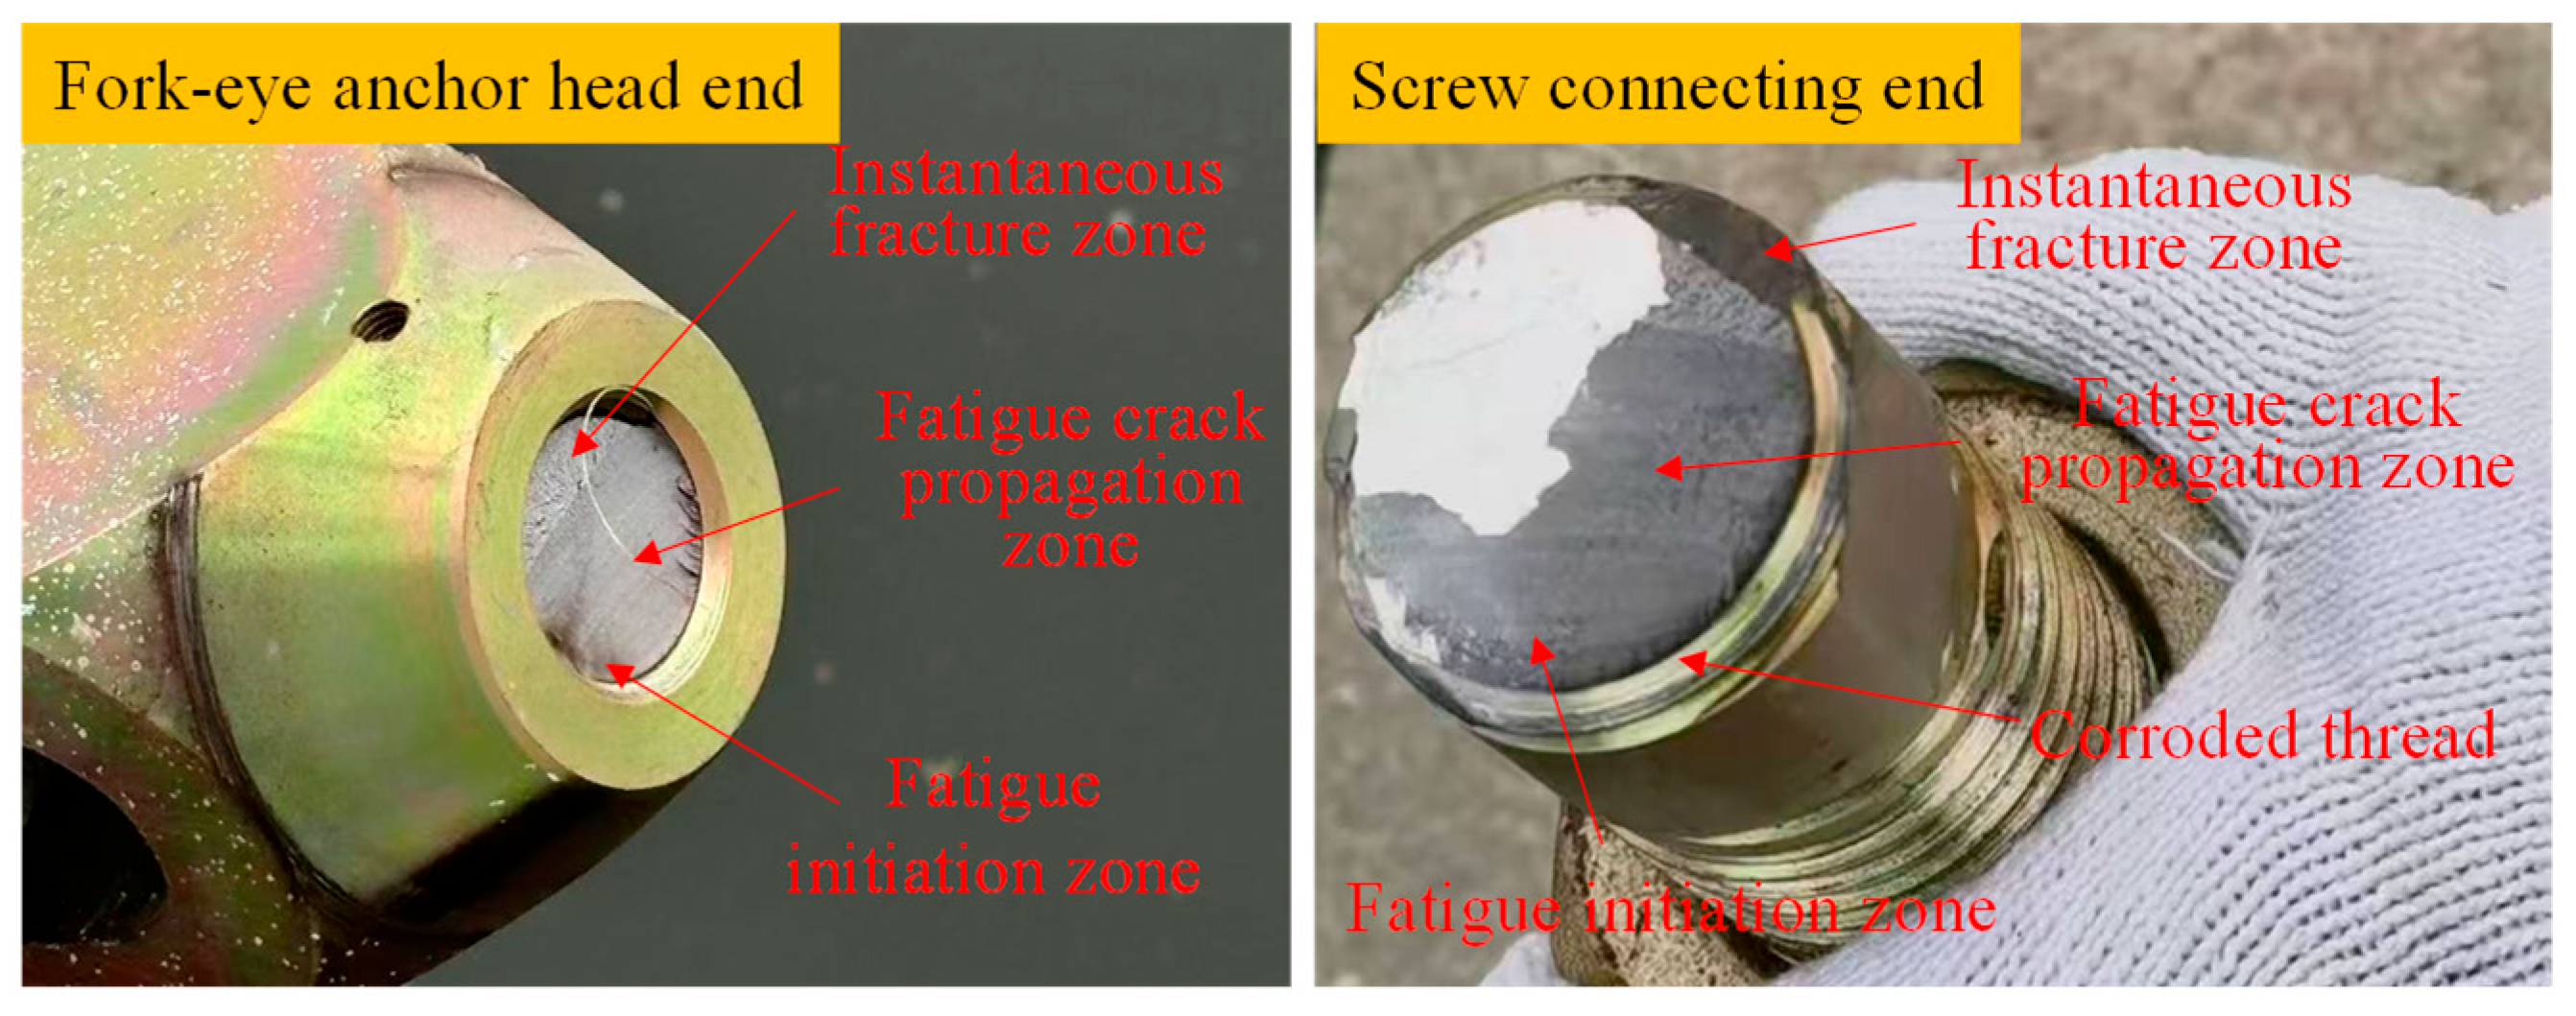
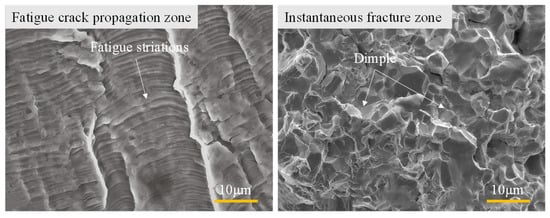
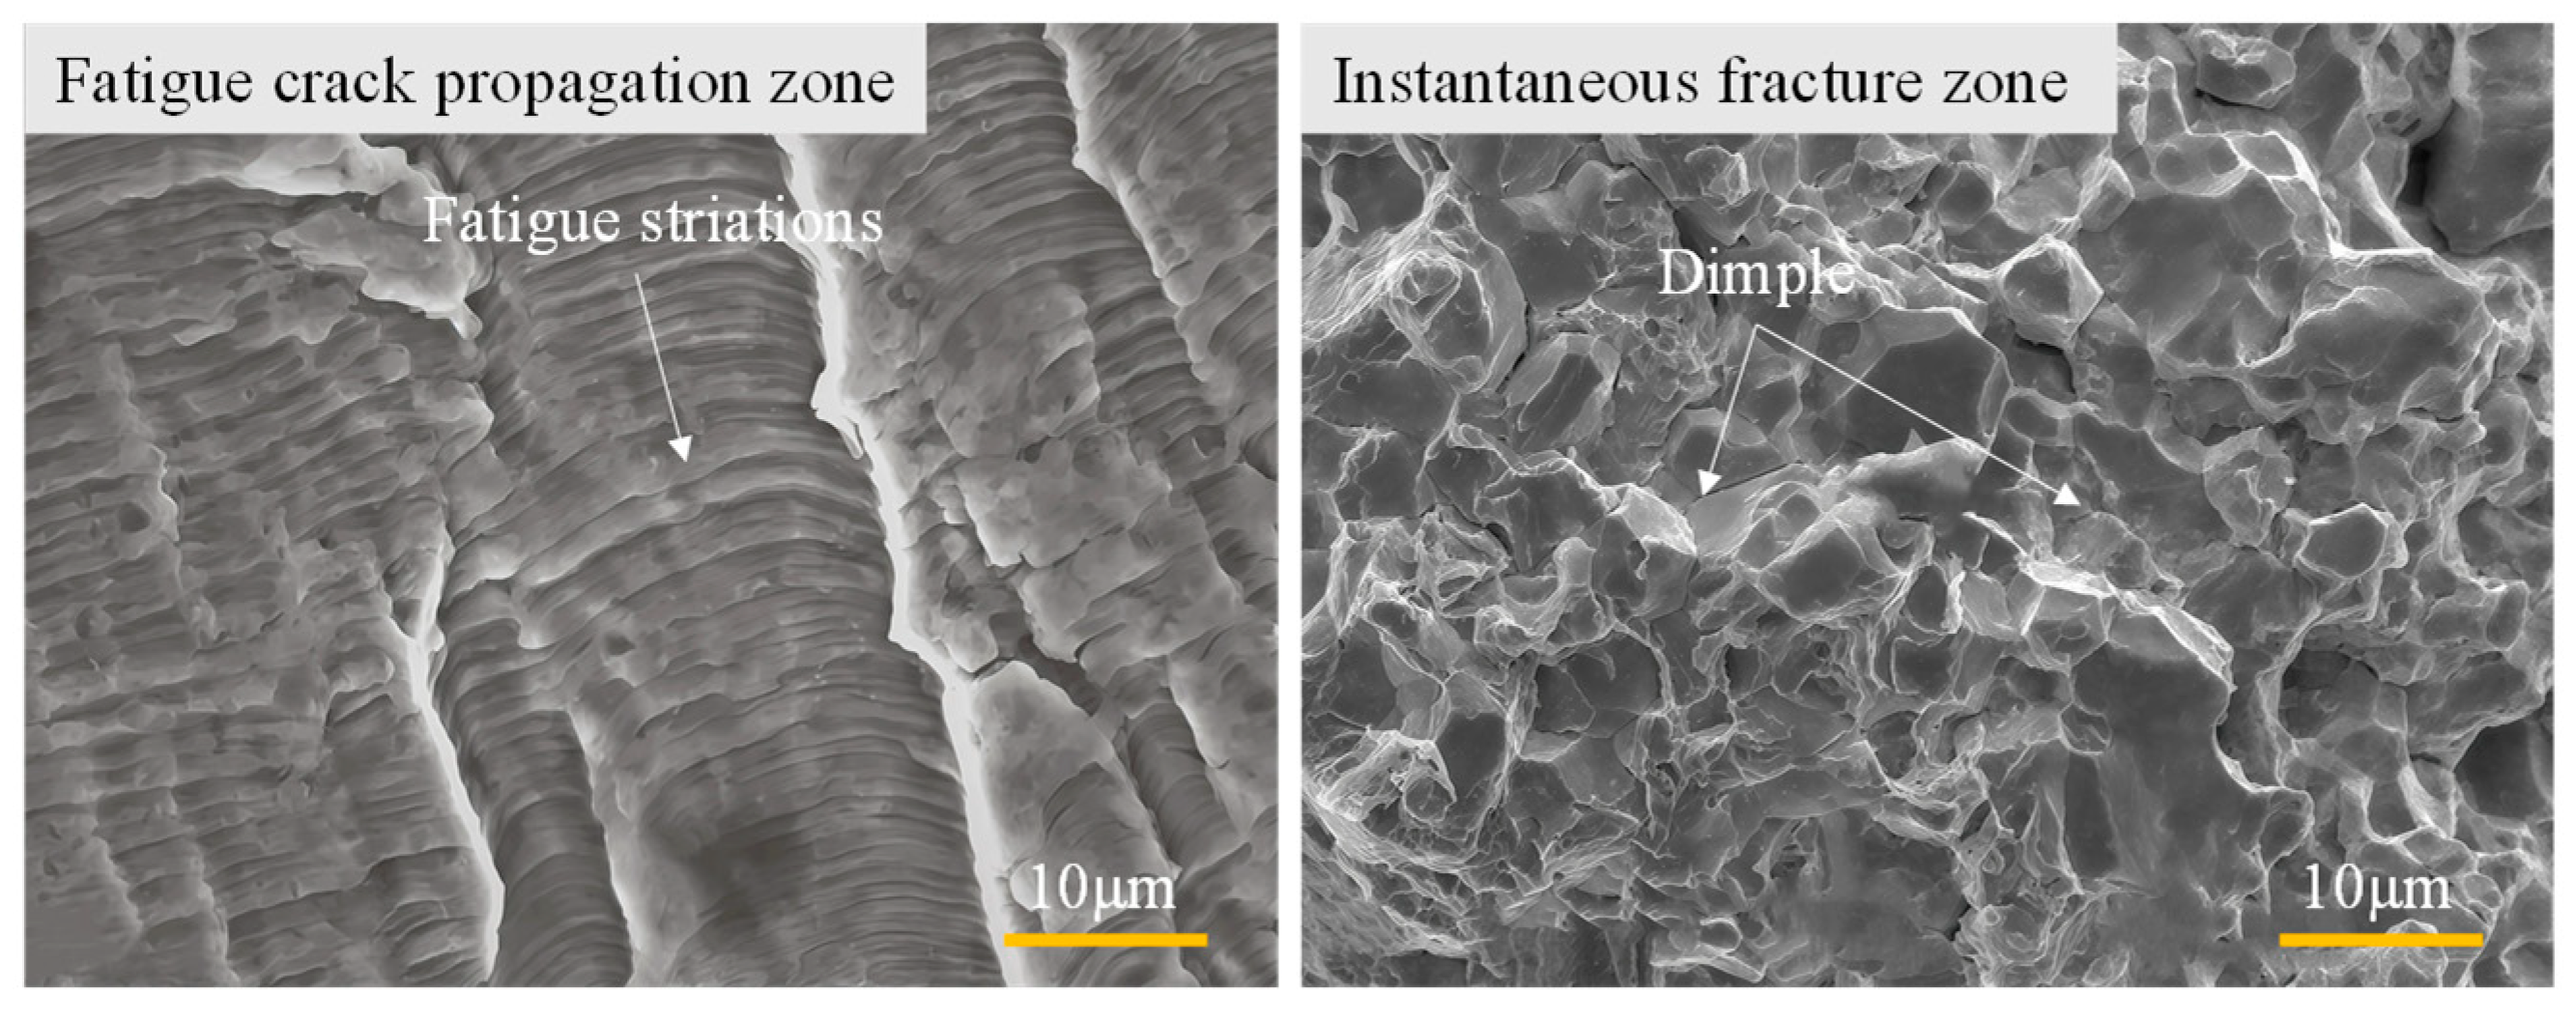
The fracture occurred at the junction between the anchorage screw and fork eye on the girder side, with macroscopic fracture features shown in Figure 7. Scanning electron microscope (SEM) observations, as shown in Figure 8, identify three typical regions on the fracture surface: the fatigue initiation zone, the stable crack propagation zone, and the instantaneous rupture zone, which are consistent with typical fatigue failure characteristics. In addition, obvious corrosion pits were observed on the outer thread of the fractured screw. Sharp notches induced by corrosion cause severe stress concentration and degrade the local fatigue resistance, serving as the dominant trigger for fatigue crack initiation. Accordingly, the fatigue fracture of the cable is mainly attributed to stress concentration originating from thread corrosion notches.
Figure 7.
Macroscopic fracture morphology of cable T2-LS6.
Figure 8.
SEM micrographs of the cable fracture surface.
3. Field Investigation and Frequency Measurement
3.1. Vibration Mode and Law of Stay Cables
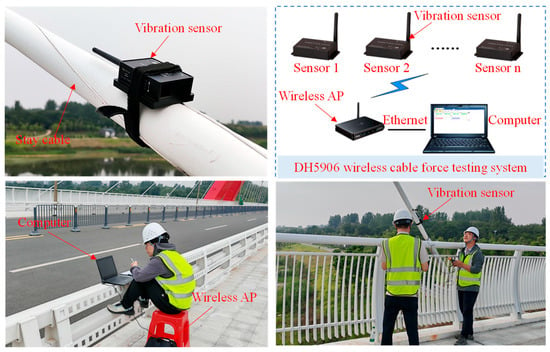
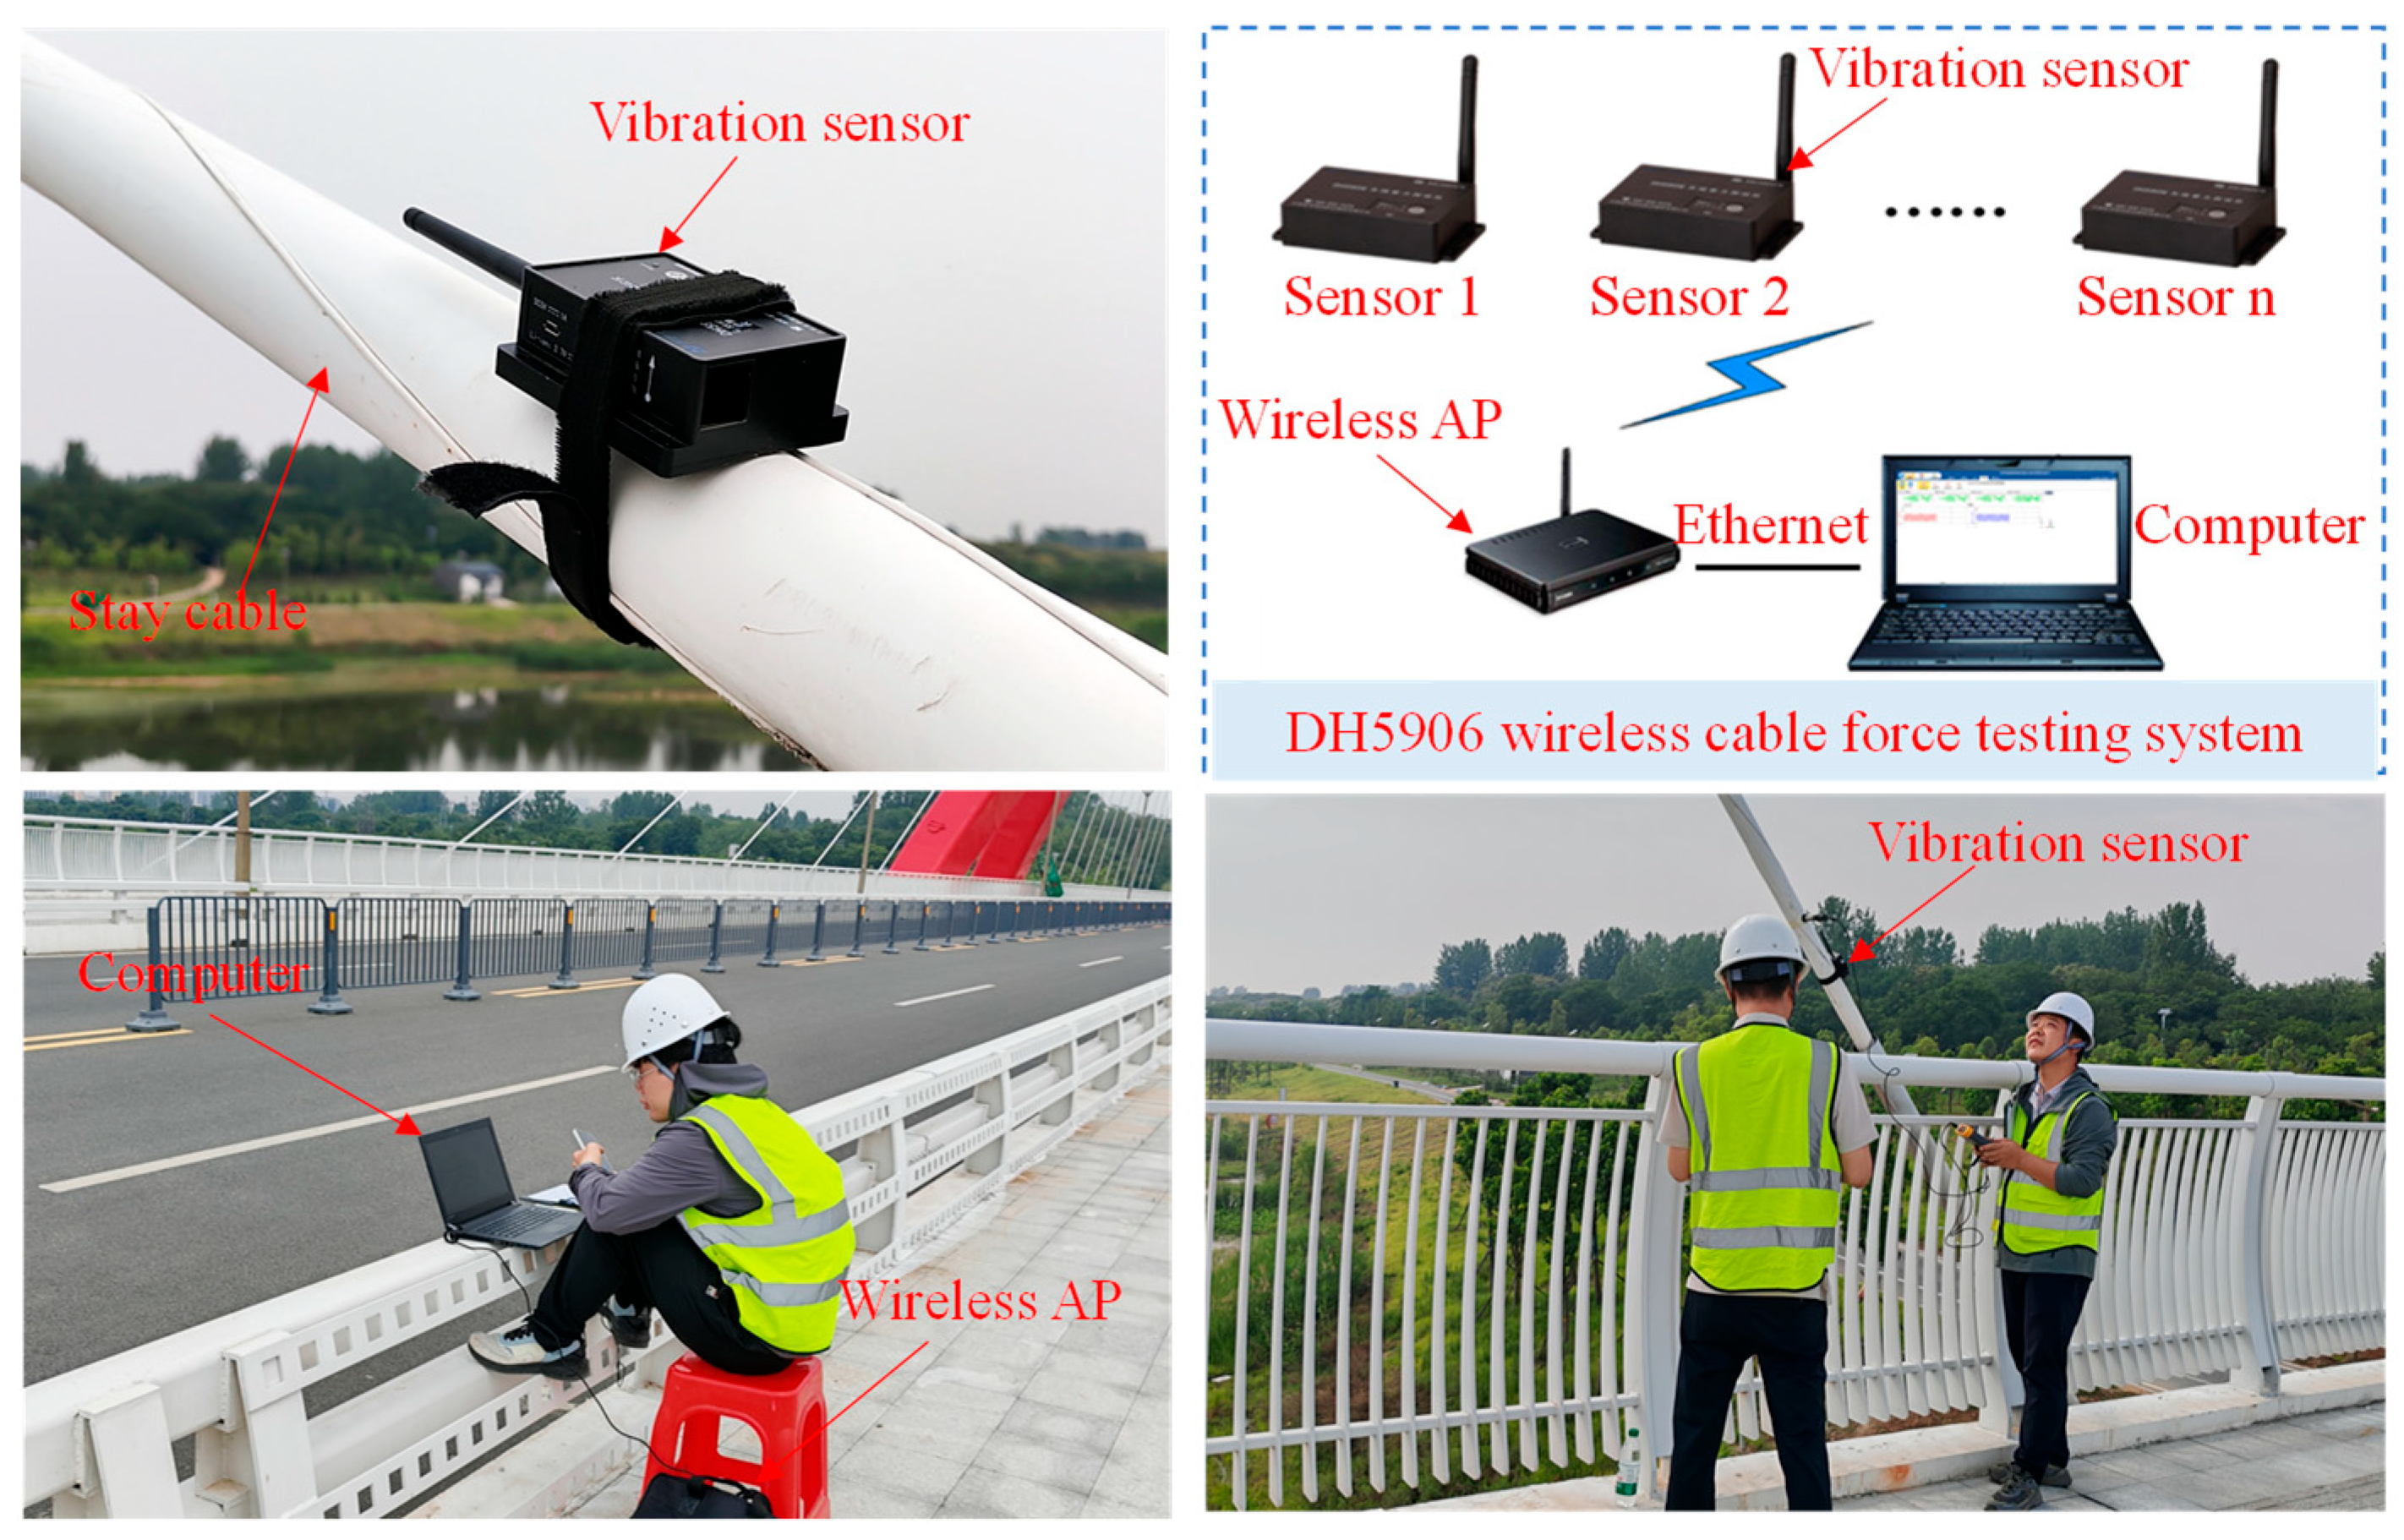
Obvious excessive vibration has been observed on multiple stay cables of this landscape cable-stayed bridge, bringing hidden dangers to normal service. Without a built-in structural health monitoring system, field investigation and measurement are carried out to quantify dynamic performance. The test targets vibration modes and evolution laws, and collects key indicators including vibration amplitude and acceleration, so as to support subsequent mechanical calculation and safety evaluation. As shown in Figure 9, the DH5906 wireless cable-force testing system manufactured by Donghua Testing Technology Co., Ltd. (Jingjiang, China) is adopted to measure cable vibration acceleration, and partial test data are listed in Table 2.
Figure 9.
DH5906 wireless cable-force testing system and field test.
Table 2.
Vibration data and morphological observation results of partial stay cables.
The test conclusions summarize three primary dynamic characteristics:
(1) The cables mainly vibrate vertically in the in-plane direction, while out-of-plane vibration rarely occurs; such excitation mostly originates from wind loads and other external disturbances.
(2) Long stay cables are more sensitive to ambient excitation and produce large amplitudes under low wind speed; short cables present weaker dynamic responses with smaller vibration amplitudes.
(3) Low inherent structural damping leads to slow vibration attenuation. Supplementary artificial restraint near the deck can rapidly suppress ongoing vibrations, which verifies that external dampers can effectively mitigate excessive cable vibration.
The field measurement results presented in this section are subject to certain uncertainties. The DH5906 wireless sensor system used for vibration monitoring has a sampling accuracy of ±0.01 mm/s2 for acceleration. Ambient temperature variations (24–35 °C during testing) may affect the sensor zero drift, which is corrected by pre-test calibration. Wind speed was measured using a handheld anemometer with an accuracy of ±0.5 m/s. To ensure repeatability, measurements for each cable were repeated at least three times, and the coefficient of variation for frequency identification was less than 5%, indicating satisfactory consistency of the test results.
3.2. Measured Frequency Analysis of Stay Cables
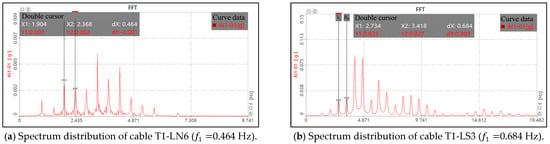
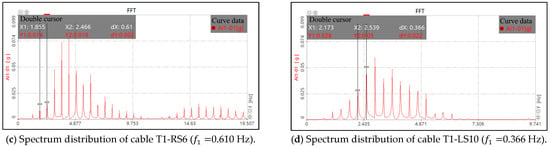
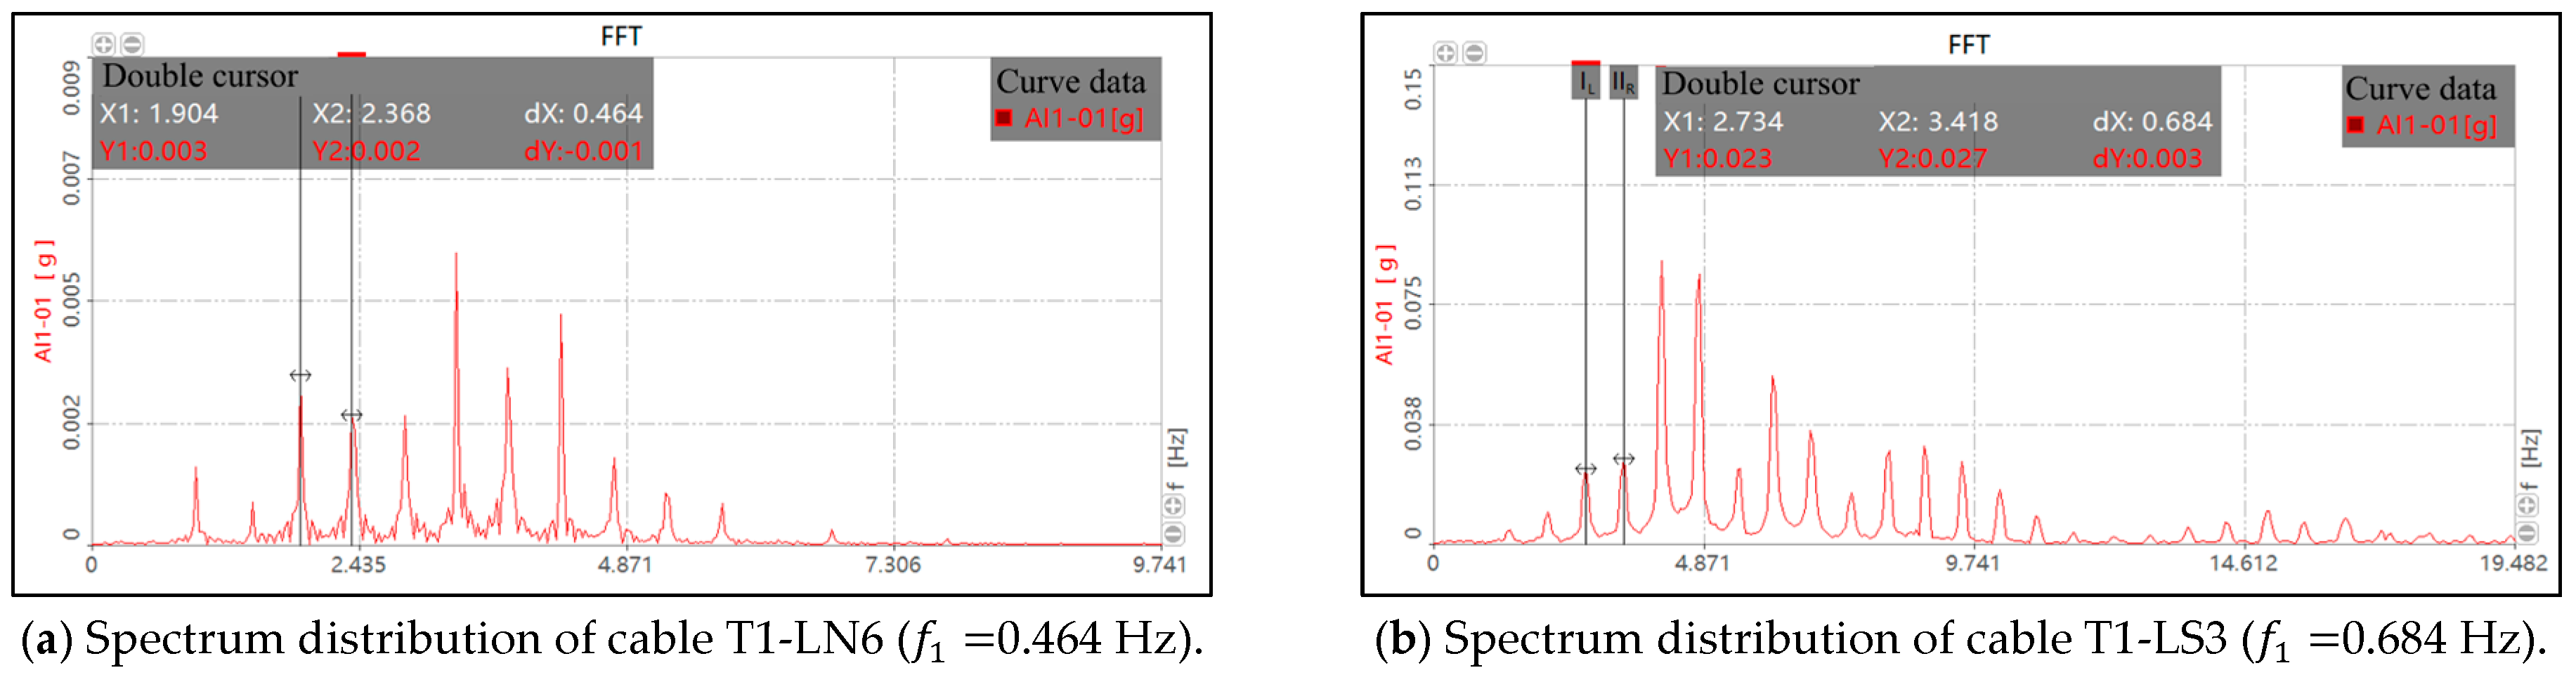
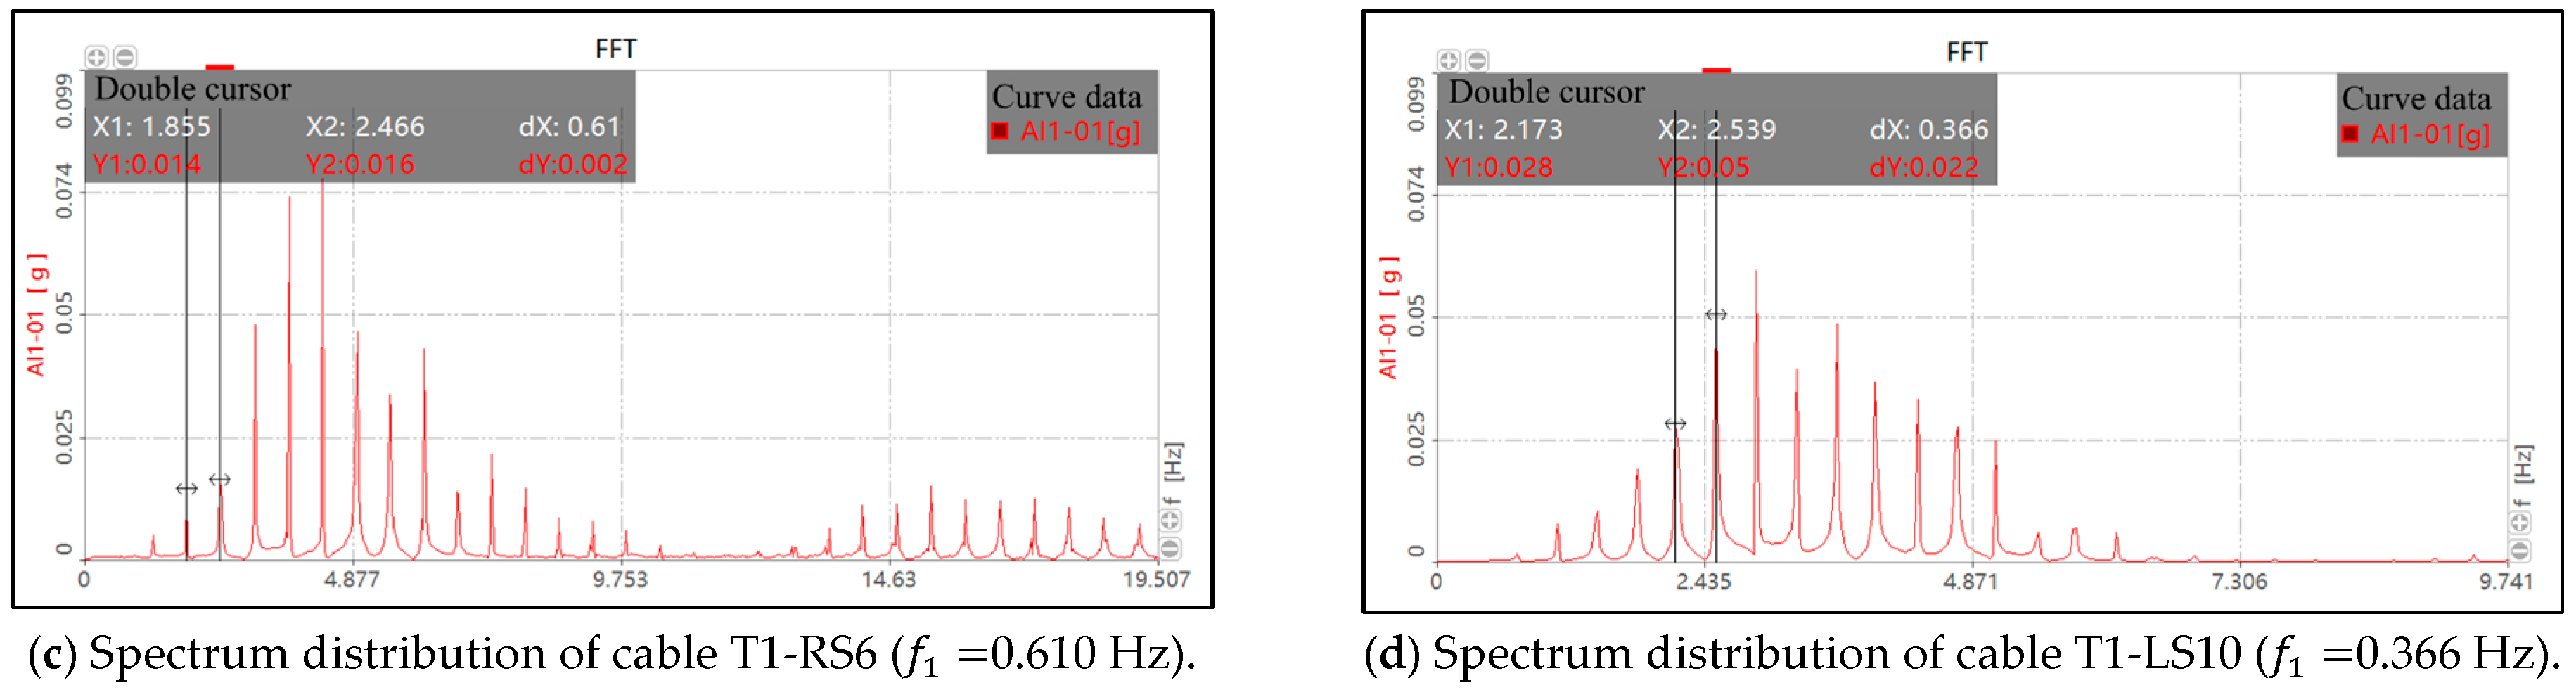
Fast Fourier Transform (FFT) spectrum analysis is performed on 79 intact stay cables (one cable, T2-LS6, had fractured) to extract multi-order natural frequencies. No damping device is equipped for all cables, so their dynamic characteristics comply with the string vibration theory. For an ideal taut string, the n-th order frequency () equals an integer multiple of fundamental frequency . Accordingly, frequency peaks distribute at equal intervals in spectrum curves, and the interval value corresponds to the fundamental frequency. Based on this, the fundamental frequency of each cable was extracted and compared with the theoretical frequency under the design cable force under dead load, and the deviation between the measured and theoretical values was calculated. The results are shown in Table 3 and Table 4. Typical measured spectrum analysis results for some cables are shown in Figure 10.
Table 3.
Comparison of measured and theoretical fundamental frequencies of pylon T1 cables.
Table 4.
Comparison of measured and theoretical fundamental frequencies of pylon T2 cables.
Figure 10.
Spectrum analysis results of partial stay cables.
The calculation results are summarized as follows:
(1) Significant deviations were observed between the measured vibration frequencies and the theoretical values for certain cables. Specifically, 39 cables exhibited deviations exceeding ±10%, accounting for 48.75% of the total. Notably, cable T1-LN6 showed the maximum deviation of −52.72%. This indicates inadequate control of the cable forces under dead load in the completed bridge during construction, suggesting the potential presence of systematic errors in the cable tensioning process.
(2) Measured fundamental frequencies range from 0.350 Hz to 1.990 Hz across all cables. Cables T1 LS9 and T1 RS9 exhibit the minimum fundamental frequency of approximately 0.350 Hz, while cable T1 RN1 reaches the maximum value of 1.990 Hz. Long cables feature a lower fundamental frequency and a dense modal distribution. Resonance and remarkable vibration amplitudes are easily triggered once the external excitation frequency approaches their natural frequency.
(3) The cable spectra show nearly equal frequency intervals, which are basically consistent with the linear rule from string vibration theory. The first 20 modal frequencies of all stay cables vary from 0.350 Hz to 39.80 Hz, with a total frequency span of 39.45 Hz. Such a wide-band frequency distribution greatly increases the matching probability between natural frequencies and wind excitation frequencies, further facilitating typical dynamic responses such as vortex-induced vibration.
4. Wind-Induced Vibration and Parametric Resonance of Stay Cables
Typical wind-induced vibrations of stay cables mainly contain vortex-induced resonance, wake galloping, rain–wind induced vibration, and parametric resonance [39]. To clarify the essential causes of excessive cable vibration on the investigated bridge, the four vibration types are discussed separately in this section.
4.1. Analysis of Vortex-Induced Resonance
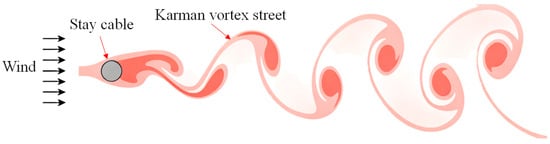
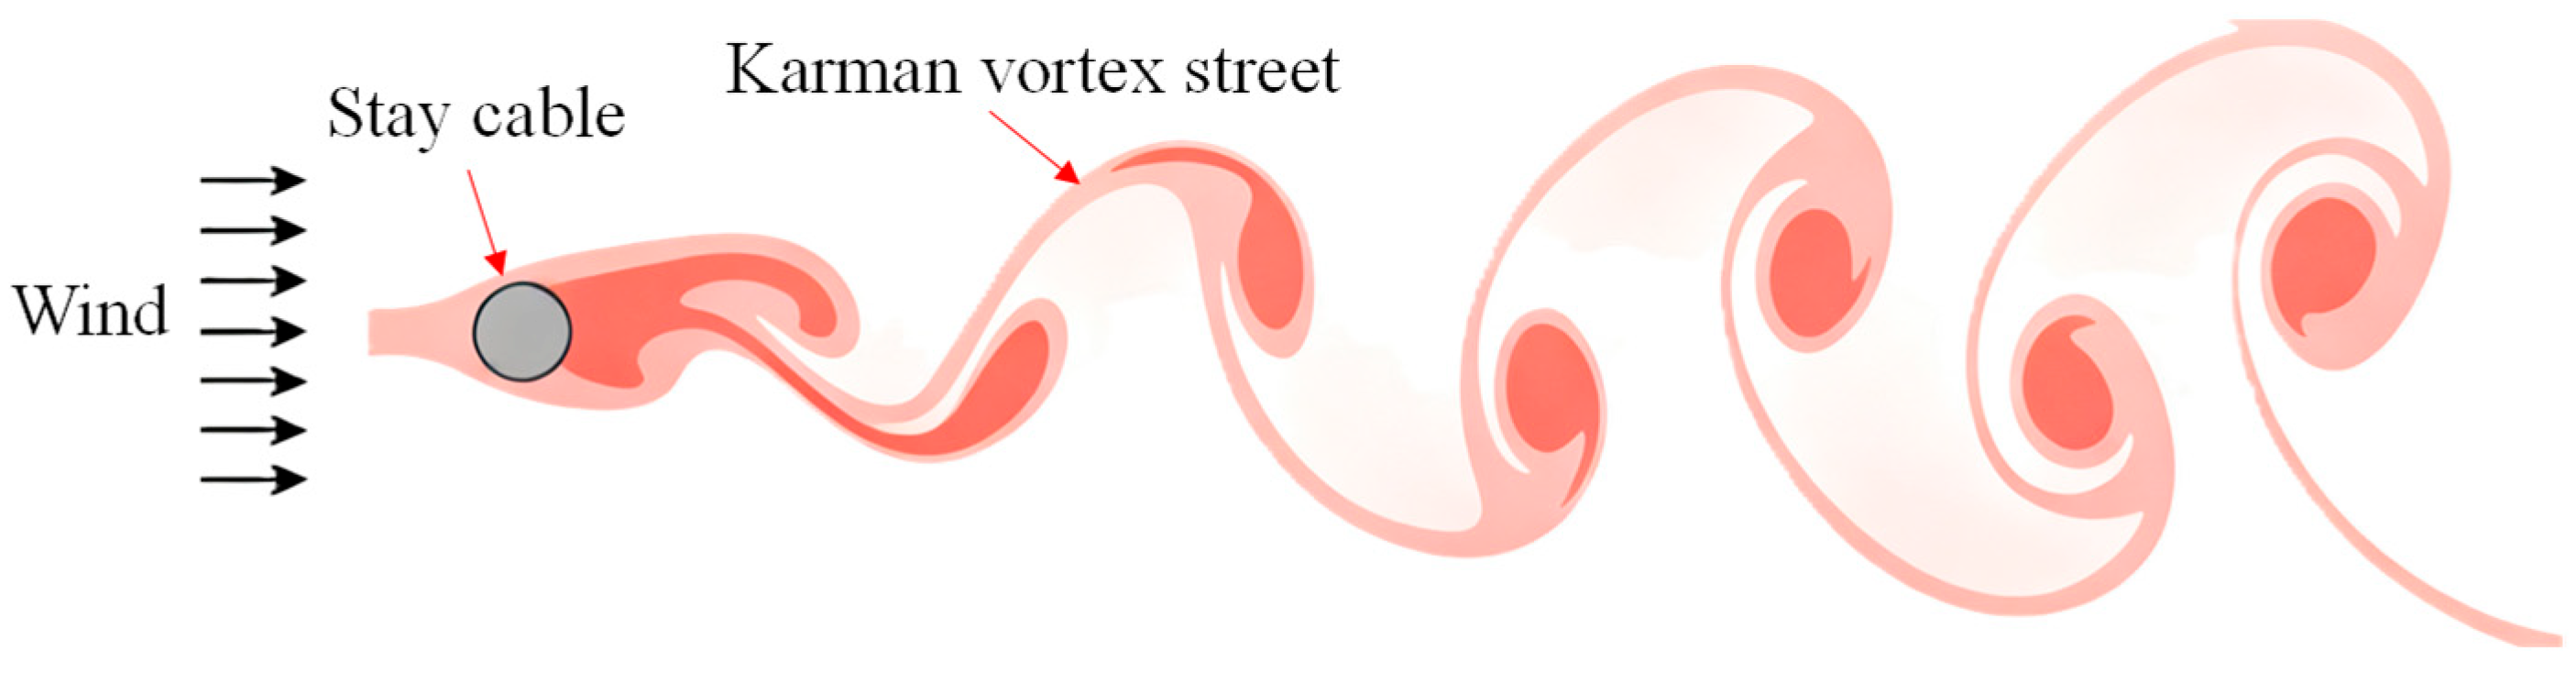
Alternating vortex shedding occurs when airflow passes across stay cables. Vortex-induced vibration is excited by periodic vortex pulsing once the vortex-shedding frequency approaches the natural cable frequency. As illustrated in Figure 11, alternating vortices (Karman vortex street) form on the leeward side of cylindrical cables under incoming wind. The relationship between vortex-shedding frequency , wind speed , and cable diameter is expressed in Equation (1) [39]:
where is the Strouhal number, which varies with the fluid flow regime [40]. Natural wind has obvious turbulent characteristics, and its flow regime is mainly determined by the Reynolds number (Re). For circular cross-sections under subcritical flow regimes, the Strouhal number is generally 0.19–0.20 [41].
Figure 11.
Vortex street formed by vortex shedding around a stay cable.
All cables on the bridge share a uniform diameter of 70 mm. For common wind below Grade 6 with a wind speed of 0.2–13.8 m/s, for the subcritical condition. Substitution into Equation (1) yields the vortex-shedding frequency of 0.571–39.429 Hz. The first 20 measured modal frequencies of full-bridge cables fall within 0.350–39.80 Hz, which basically overlaps the calculated vortex-shedding frequency range under Grade 6 or lower wind. Accordingly, vortex-induced resonance is readily triggered under such wind conditions.
Theoretically, the vortex-shedding frequency changes linearly with wind speed, and resonance only occurs at specific wind speeds matching certain cable natural frequencies. In practical turbulent wind fields, however, fluid–structure interaction strengthens when the shedding frequency is close to a modal cable frequency. Conversely, cable vibration locks the vortex shedding to the natural cable frequency within a wide wind speed interval and broadens the resonant wind speed range [42]. Long cables possess low fundamental frequencies (many below 1 Hz) and easily match low-speed vortex shedding, leading to low-frequency vortex-induced vibration even under gentle wind. Despite relatively higher fundamental frequencies for short cables, frequency coupling and resultant vortex-induced resonance still occur under specific wind speeds.
According to the Specification for Wind Resistance Design of Highway Bridges (JTG/T 3360-01) [39], the maximum amplitude of vortex-induced resonance is approximated by Equation (2):
where is the amplitude of vortex-induced resonance (m); is the Strouhal number, taken as 0.2 for cylindrical members; is the diameter of the stay cable (m); is the standard deviation of the lift coefficient, generally taken as 0.45 for cylindrical members; is the Scruton number, defined as ; is the mass per unit length of the stay cable (kg/m); is the damping ratio of the stay cable; and is the air density (kg/m3), generally taken as 1.25 kg/m3.
The cable diameter of this bridge is 70 mm, and the mass per unit length is 6.15 kg/m. Parallel-wire stay cables without vibration dampers exhibit low damping ratios, typically ranging from 0.1% to 0.3% [43,44,45], yielding a calculated Scruton number () range of 1.00 to 3.01. Substituting the cable design parameters into Equation (4.2), the vortex-induced resonance amplitude of the bridge cables is calculated to reach 2.09–6.27 mm. At such amplitudes, significant vibrations are visually observable, which agrees well with the field observations.
4.2. Analysis of Wake Galloping
Wake galloping is a large-amplitude self-excited vibration induced by aerodynamic instability for downstream cables located inside the unstable wake zone of upstream cables. Its occurrence depends on cable spacing. For multi-parallel stay cables, wake galloping should be checked when the center-to-center distance between adjacent cables is 6–40 ( = upstream cable diameter) and the downstream cable is 2–4 away from the wake center [46]. The cable spacing near pylons is relatively small with uncertain incoming wind direction; hence, critical wind speed calculation is adopted to evaluate the galloping possibility.
The critical wind speed triggering wake galloping is approximated as Equation (3) [47]:
where is the critical wind speed for wake galloping; is the constant related to the spacing between upstream and downstream cables, taken as 25 when the center-to-center distance is 2–6 times the cable diameter, and 80 when it is 10–20 times; is the modal frequency; the first-order modal frequencies of cables in this bridge range from 0.350 Hz to 1.990 Hz; is the mass per unit length of stay cable, which is 6.15 kg/m for this bridge; is the damping ratio of the stay cable; is the air density (kg/m3), generally taken as 1.25 kg/m3; and is the cross-wind projected dimension of the cable, taken as the cable diameter, i.e., 70 mm.
The cable spacing of the studied bridge falls in the range of . For , the calculated critical galloping speed is 28.08–159.52 m/s (above Grade 11 wind); for , the value rises to 48.56–276.24 m/s (above Grade 15 wind). The high critical wind speed indicates extremely low wake-galloping risk for the bridge.
4.3. Analysis of Rain–Wind Induced Vibration
Rain–wind induced vibration is the most violent type of wind-induced cable vibration. First discovered and reported by Hikami in Japan in 1988, similar cases have been documented worldwide, including the over-1 m-amplitude vibration of backstay cables on the Shanghai Yangpu Bridge under simultaneous rain and wind [46,47]. Its formation mechanism remains not fully clarified. Three essential preconditions are summarized from field measurements [46,47]: (1) coexistence of wind and rainfall; water rivulets forming on the cable surface trigger unstable vibration; (2) wind speed within 6–20 m/s; and (3) natural cable frequency between 0.6 Hz and 3.0 Hz.
The Scruton number () serves as an evaluation index without experimental tests: smooth-surface cables avoid rain–wind vibration when >10, and treated-surface cables avoid such vibration when >5. Calculations of the target bridge range from 1.00 to 3.01, far below the critical thresholds. A lower Scruton number implies poorer anti-vibration capacity and higher rain–wind vibration potential.
The bridge site is situated within a subtropical monsoon climate with frequent strong wind and heavy rain in summer, where the wind speed commonly reaches 6–20 m/s, satisfying the wind speed requirement. Water rivulets generally form within 15–30° from vertical on the upper cable surface, altering cross-sectional aerodynamic features and generating abrupt aerodynamic force, which provides necessary environmental excitation.
The first ten modal frequencies of the bridge cables distribute within the range 0.350–19.90 Hz, and most fundamental frequencies fall within the sensitive band of 0.6–3.0 Hz for rain–wind vibration. Frequency matching between wind–rain excitation and low-order cable modes easily induce excessive coupled vibration.
No synchronous rain-and-wind weather was encountered during field measurement, and no rain–wind vibrations were observed. Nevertheless, potential risk cannot be ignored because all prerequisite conditions are satisfied. Furthermore, absent damping devices prevent amplitude suppression once vibration occurs and aggravates structural damage.
4.4. Modal Analysis of Main Bridge and Cable Parametric Resonance
4.4.1. Global Modal Analysis of Bridge Structure
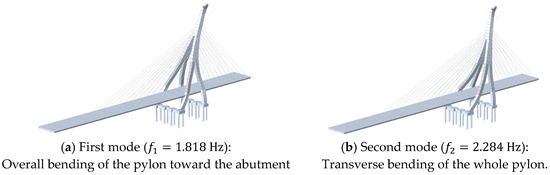
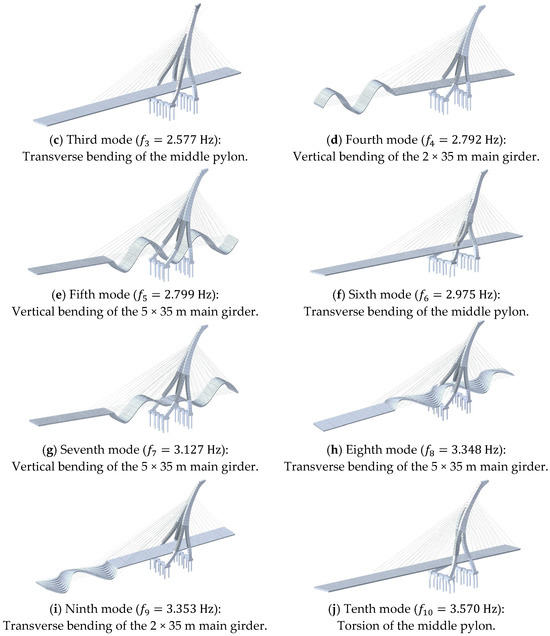
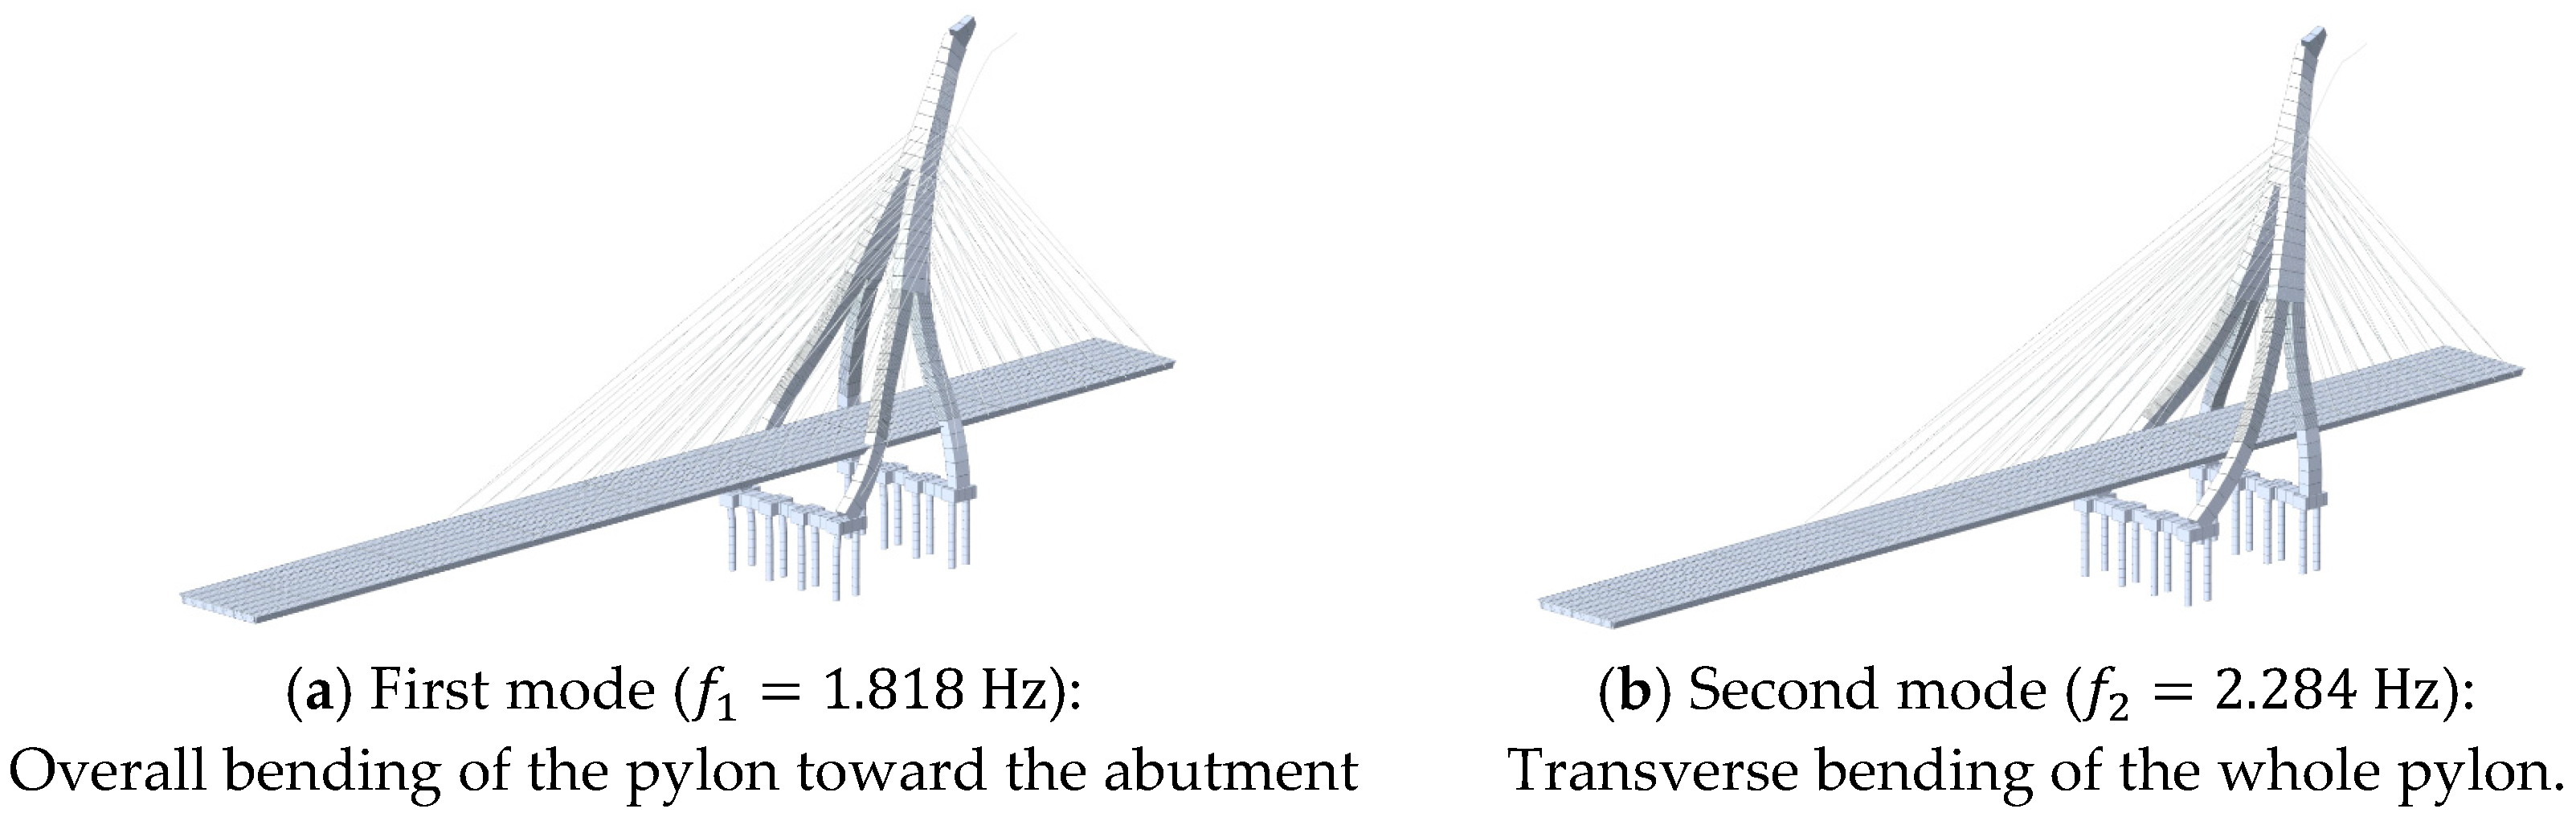
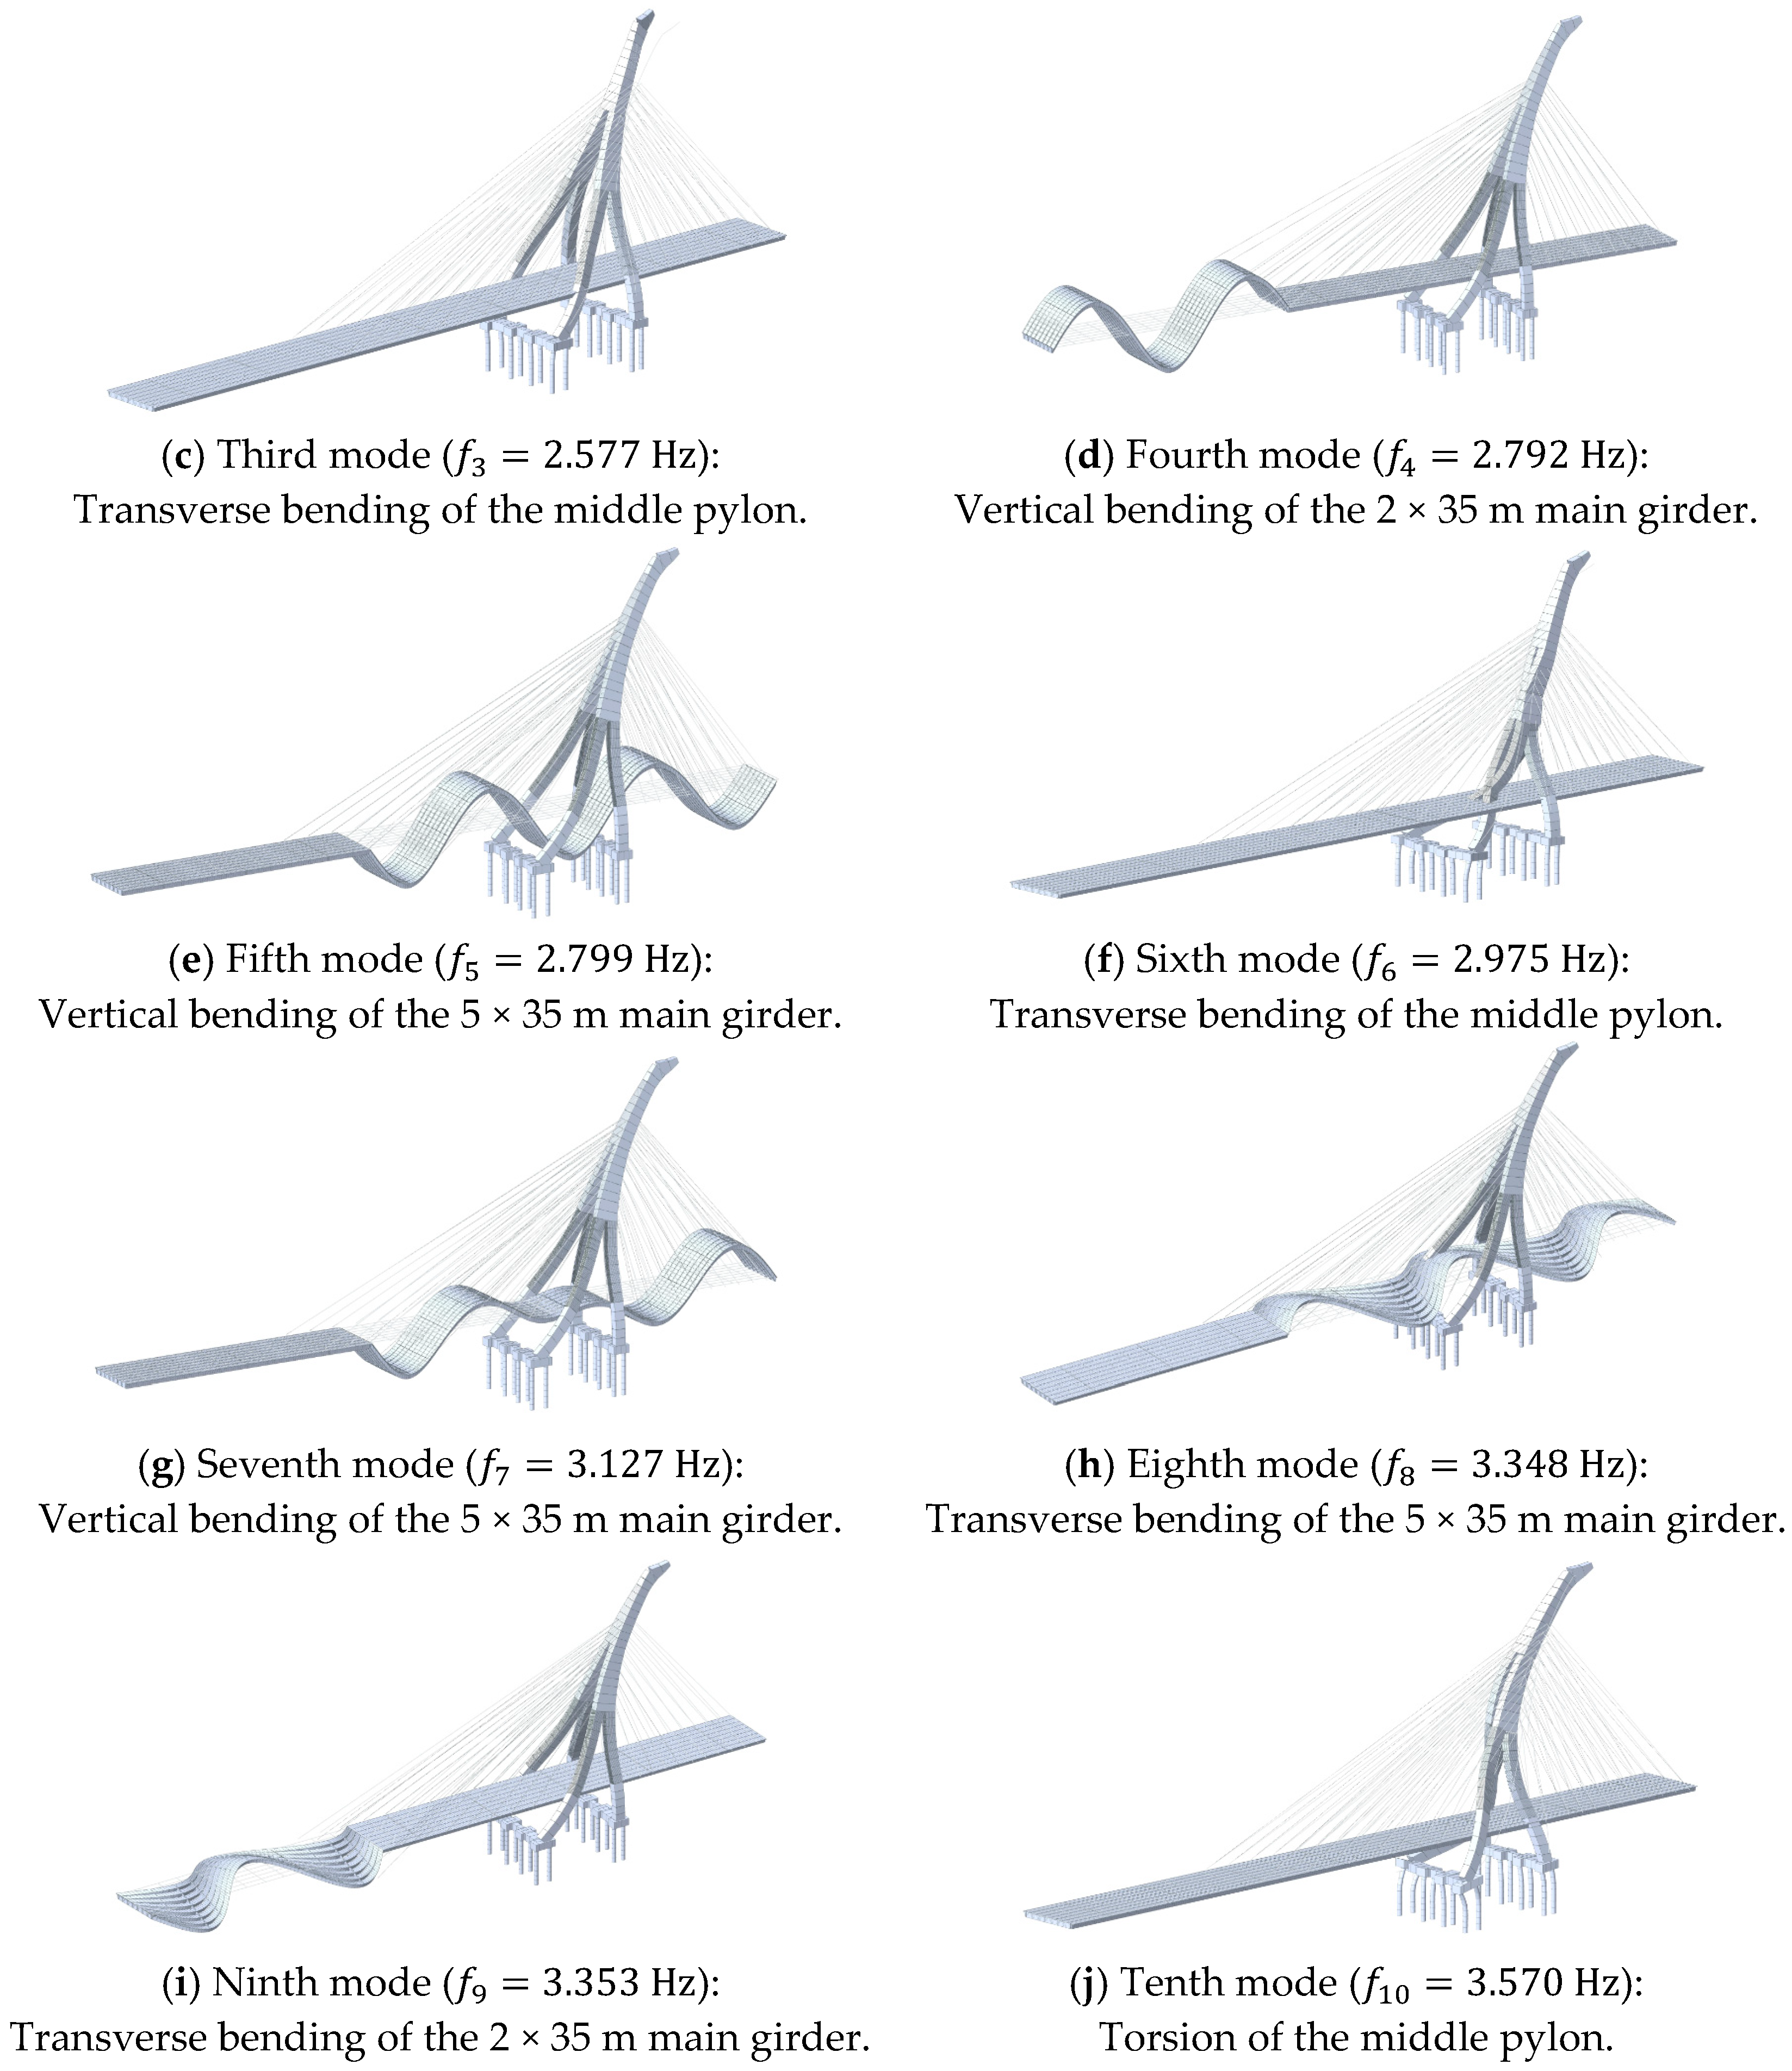
To accurately evaluate the dynamic characteristics, a half-bridge finite element model (FEM) was established using Midas FEA NX (2024R1), leveraging longitudinal symmetry. The main girder and pylon were modeled using 2626 spatial beam elements, while the 40 stay cables were simulated as truss elements incorporating initial dead load forces based on measured frequencies. The model consists of 2459 nodes, with fixed constraints applied at the pylon base and directional constraints at the pier tops. The analysis extracted the first 100 vibration frequencies (Table 5), ranging from 1.818 Hz to 13.832 Hz, with densely distributed low-order modes. Figure 12 illustrates the first ten mode shapes, providing essential data for subsequent resonance analysis.
Table 5.
First 100 orders of vibration frequencies of the bridge.
Figure 12.
First 10 vibration modes of the bridge structure.
4.4.2. Parametric Resonance Analysis of Stay Cables
Parametric vibration denotes large-amplitude cable oscillation triggered by tiny end displacement excitation when the excitation frequency bears a specific proportional relation to the natural cable frequency [39]. Primary resonance occurs under a near 1:1 frequency matching between end excitation and natural cable frequency; primary parametric resonance arises under a near 2:1 matching and leads to large, strong, nonlinear vibrations [48,49]. Severe parametric resonance was reported on the Brotonne Bridge (France) and the Meiko West Bridge (Japan), where excessive amplitude even caused collisions between adjacent cables under calm wind [49].
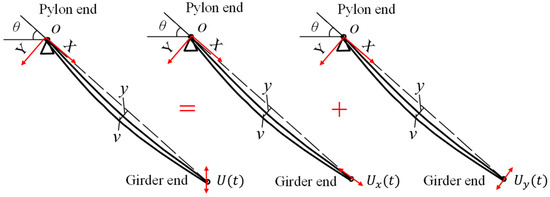
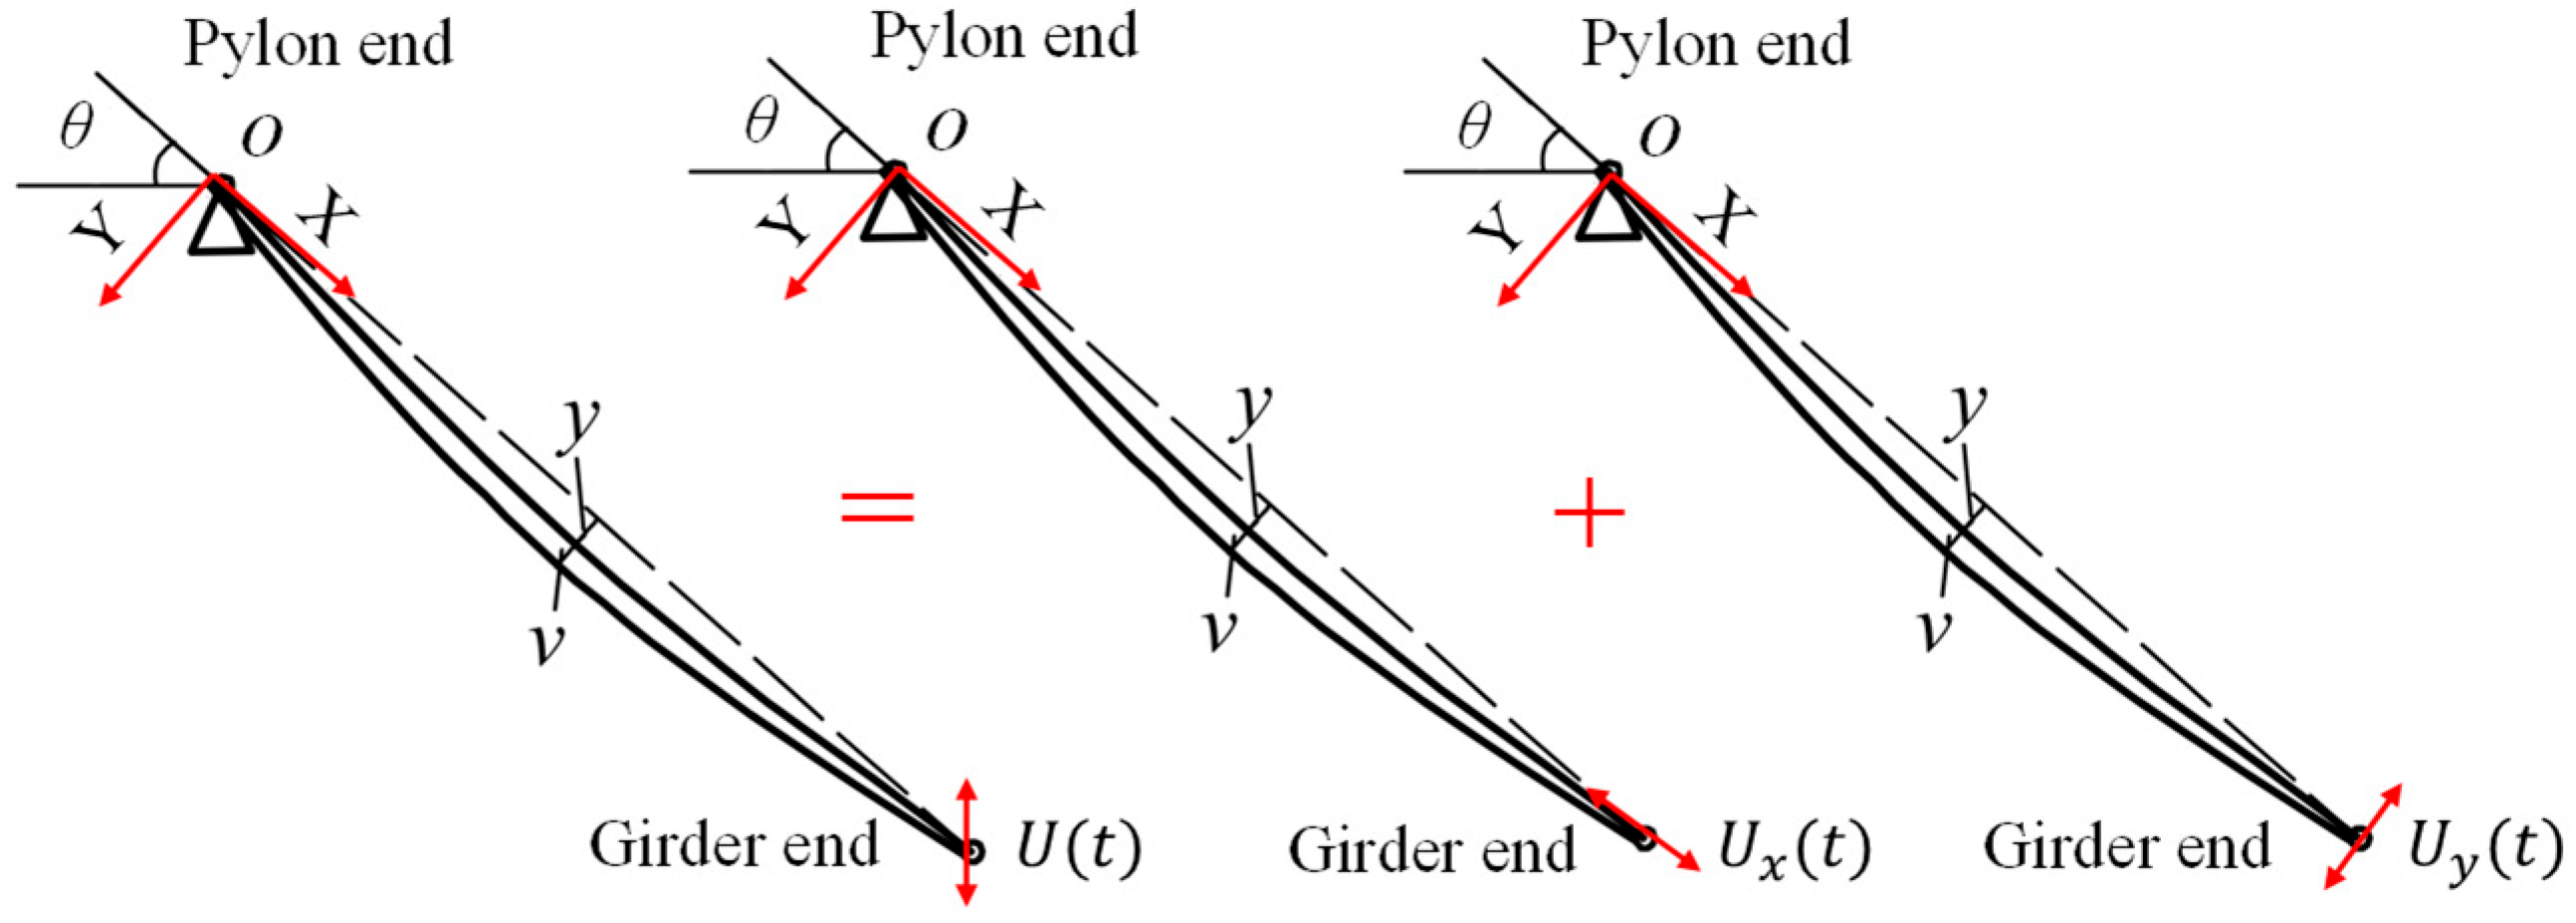
The first 20 measured cable frequencies (0.350–39.80 Hz) fully cover the bridge structural frequency band (1.818–13.832 Hz of the first 100 modes). Multiple pylon and girder vibrations transmit to the cables via anchorages and induce parametric resonance. The mechanical model under girder-end excitation is plotted in Figure 13. End displacement is decomposed into and in the local coordinate system, where dominates the forced cable vibration.
Figure 13.
Analytical model of stay cable under girder-end displacement excitation.
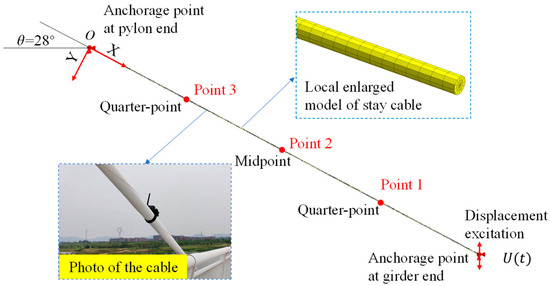
To further investigate the vibration characteristics of cables under end displacement excitation, the finite element model of cable T1-RS6 was established in Midas FEA NX with the following details. The cable was discretized using three-dimensional truss elements with a mesh size of 0.5 m, resulting in a total of 206 elements. The material was modeled as linear elastic with a modulus of elasticity of 195 GPa and a Poisson’s ratio of 0.3. Geometric nonlinearity was considered by adopting the corotational formulation. Rayleigh damping was assigned with a mass proportional coefficient of 0.025 and a stiffness proportional coefficient of 0.00015, corresponding to a damping ratio of approximately 0.2% for the first 20 modes. A direct time integration method (Newmark-beta) was employed for the dynamic analysis, with a time step of 0.001 s and a total simulation duration of 10 s.
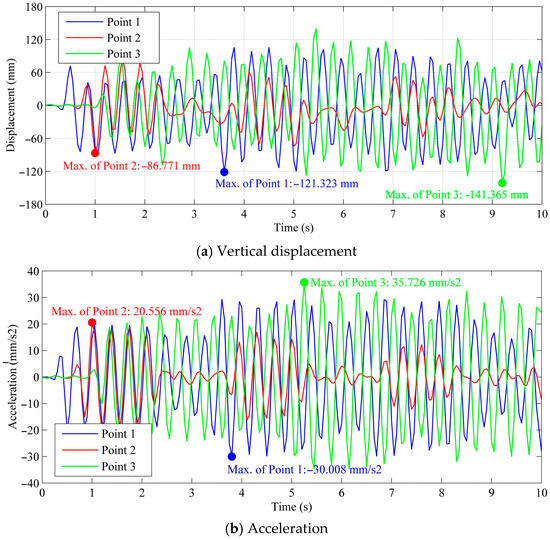
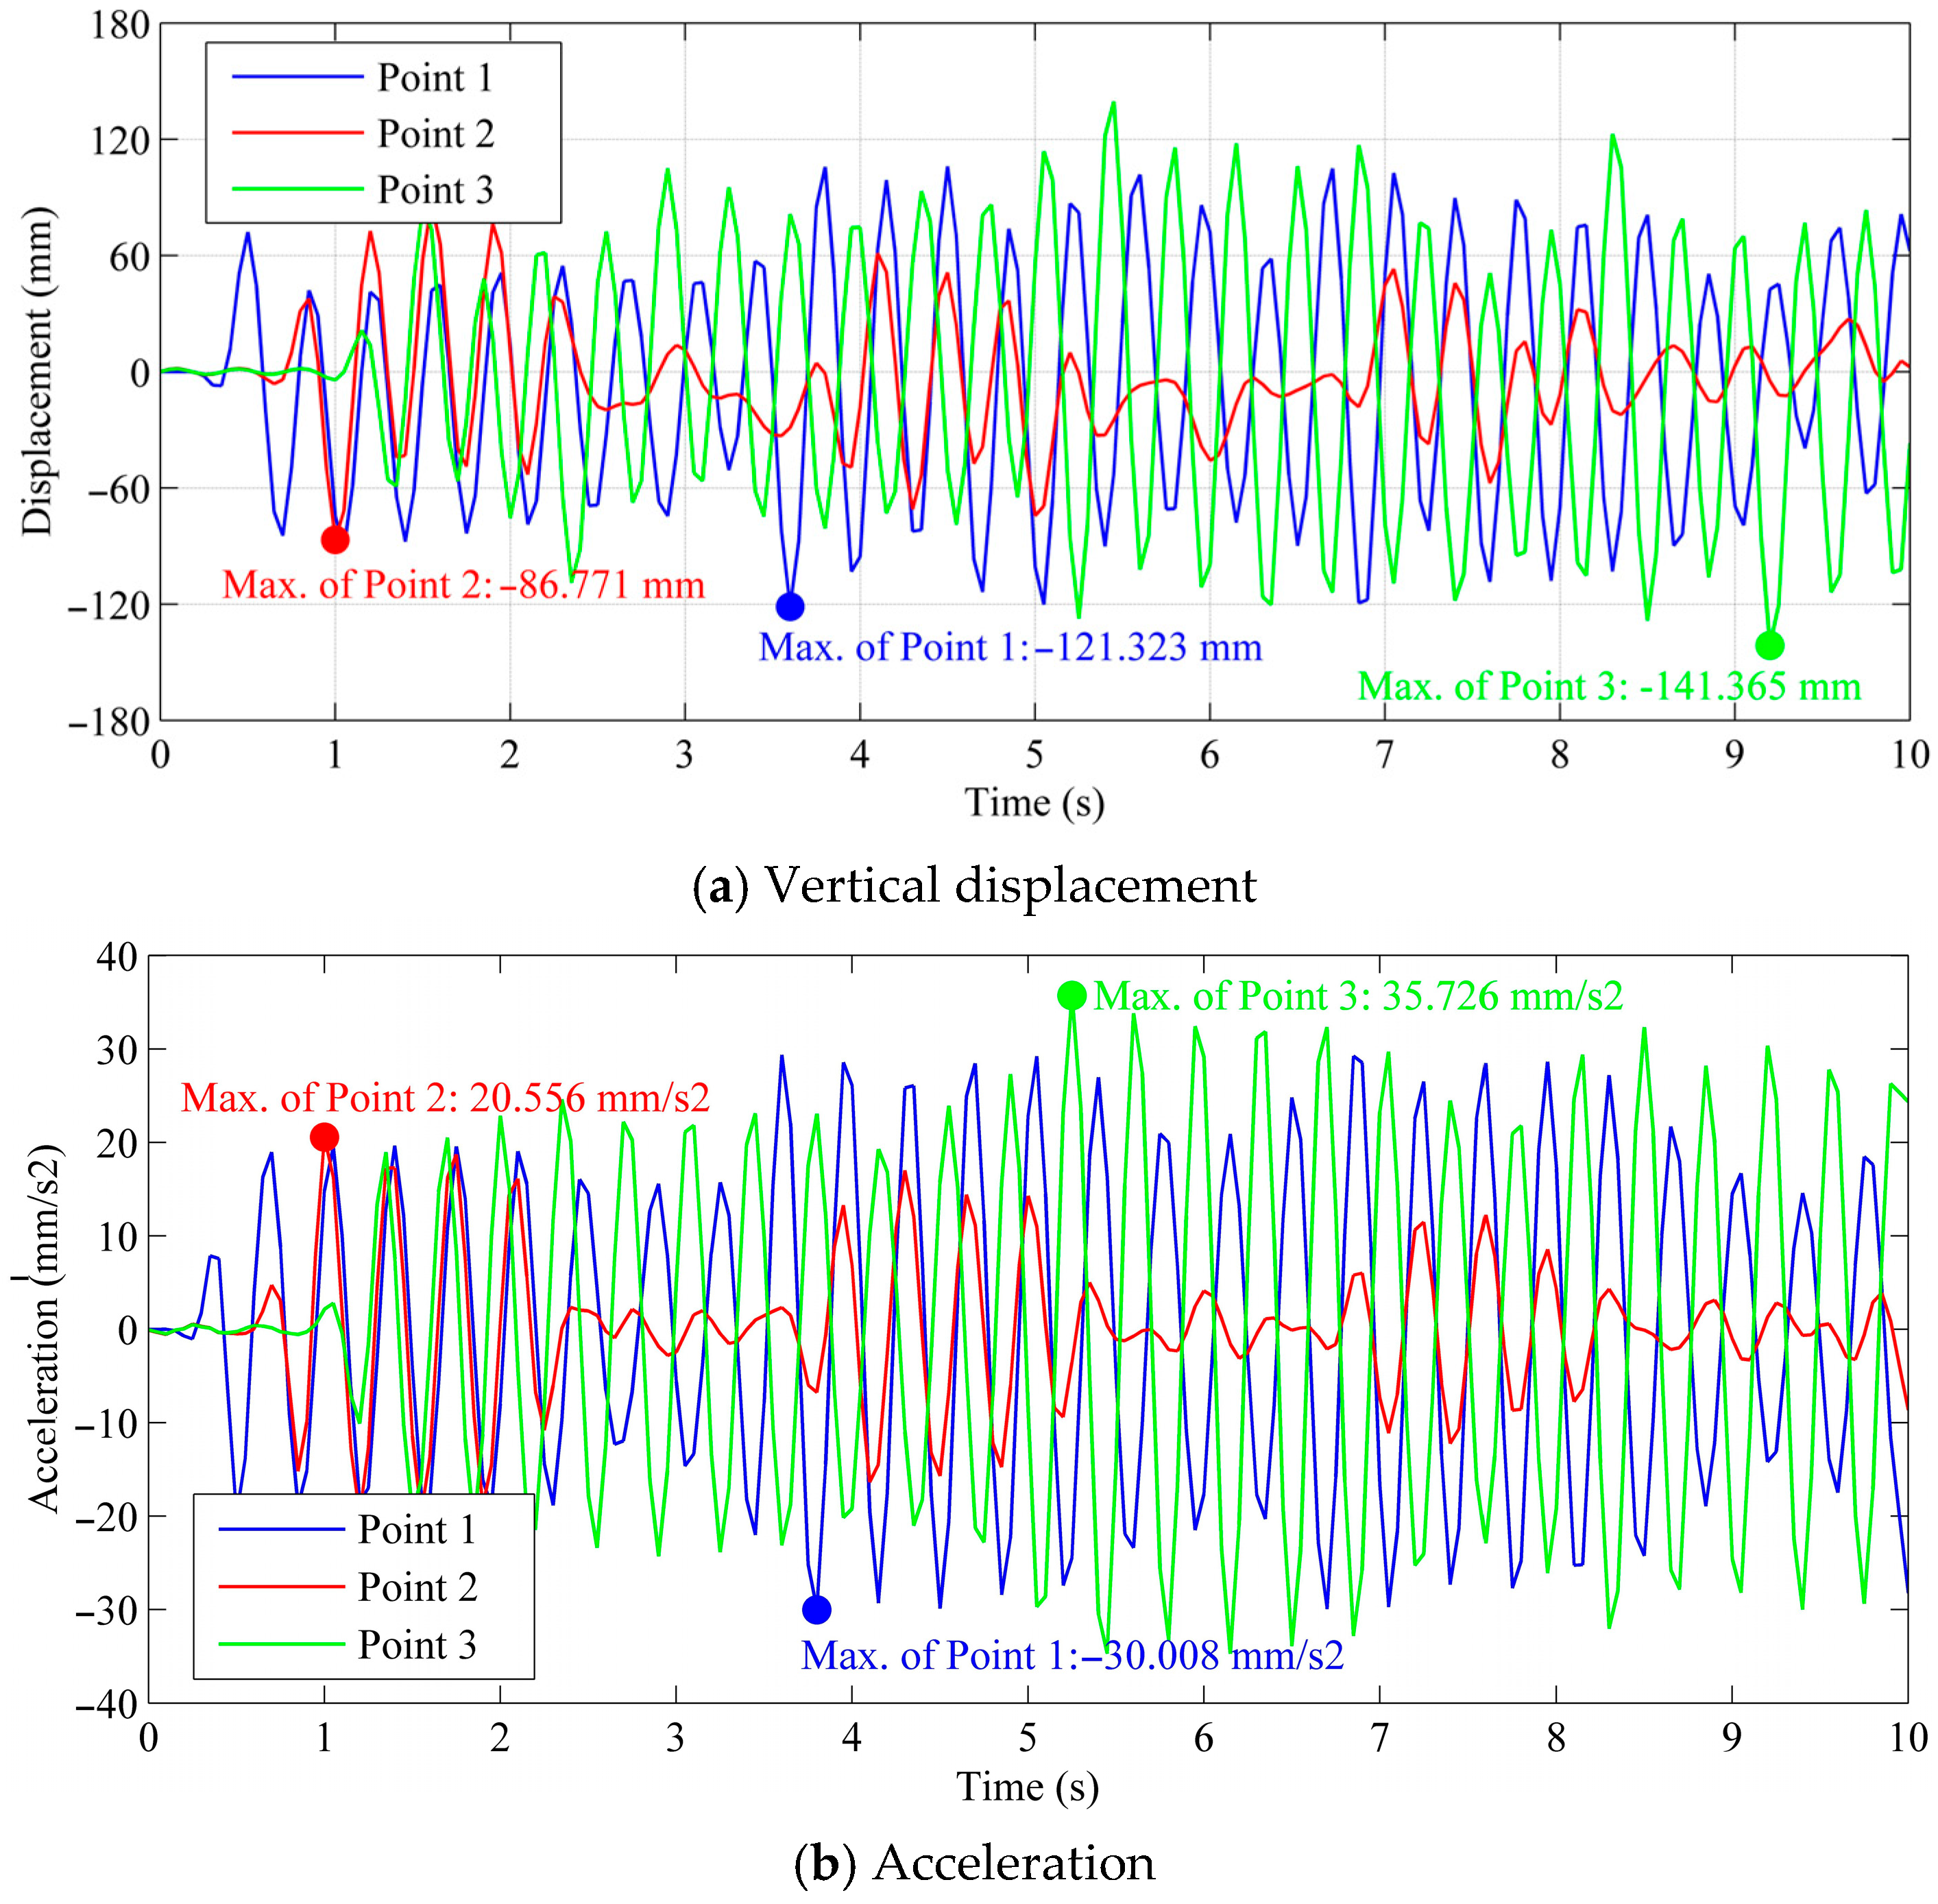
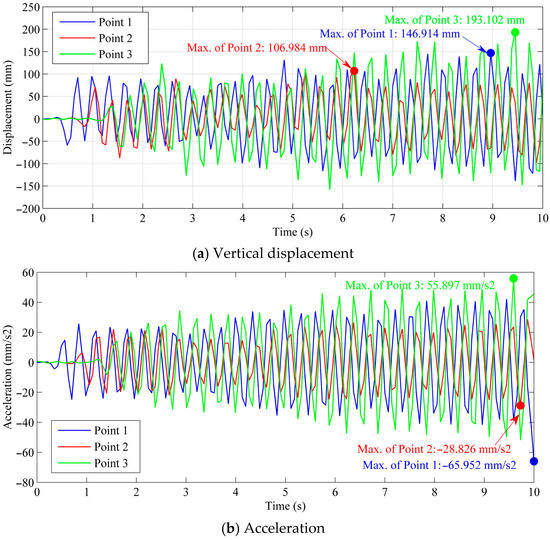
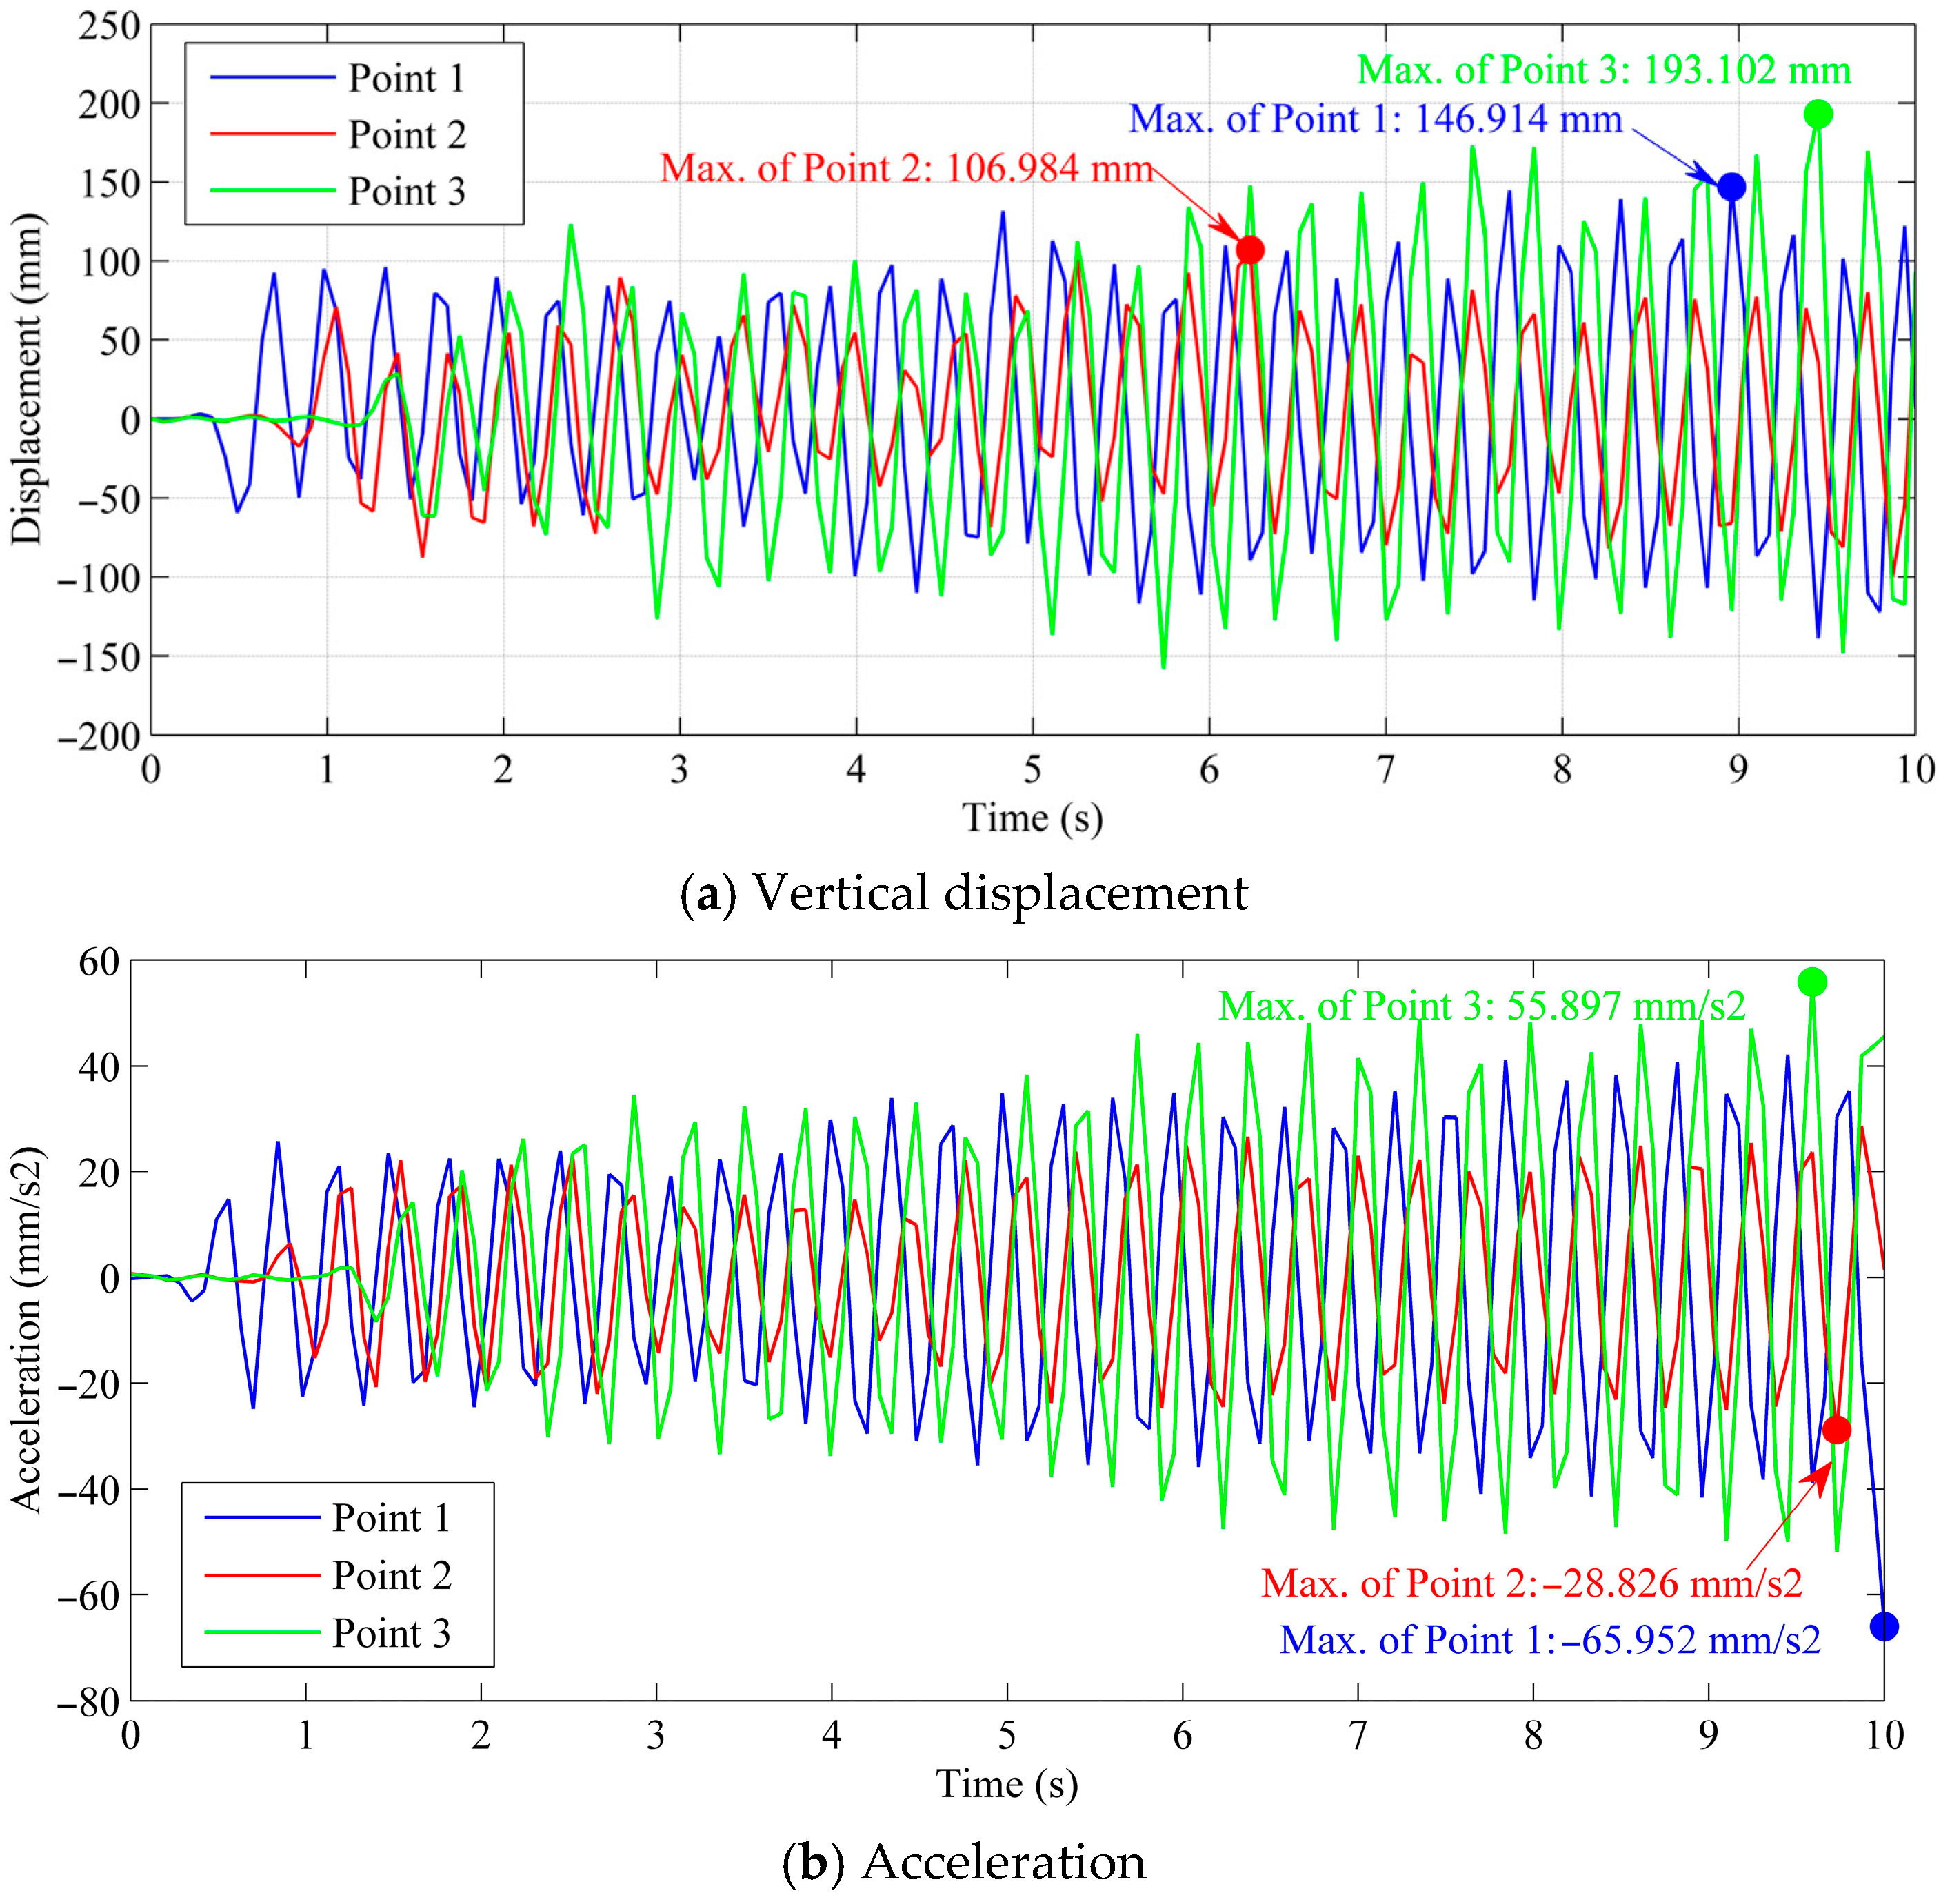
Three characteristic points at the quarter points along the cable length (Points 1, 2, and 3 in Figure 14) were selected for analysis. The vertical displacement and acceleration time-history curves of these points within the first 10 s under the two excitation frequencies are plotted in Figure 15 and Figure 16, respectively. Based on the displacement and acceleration time histories, when the excitation frequency is 2.799 Hz, the absolute values of the maximum amplitude and acceleration are 21.323 mm and 30.008 mm/s2 at Point 1, 86.771 mm and 20.556 mm/s2 at Point 2, and 141.365 mm and 35.726 mm/s2 at Point 3. When the excitation frequency is 3.127 Hz, the corresponding absolute values of the maximum amplitude and acceleration are 146.914 mm and 65.952 mm/s2 at Point 1, 106.984 mm and 28.826 mm/s2 at Point 2, and 193.102 mm and 55.897 mm/s2 at Point 3. For comparison, the field-measured maximum acceleration of cable T1-RS6 is 68.9 mm/s2 (Table 2), which is in good agreement with the maximum absolute value of 65.952 mm/s2 obtained from the numerical analysis.
Figure 14.
Vibration analysis model of cable T1-RS6.
Figure 15.
Vertical displacement and acceleration time histories of characteristic points at 2.799 Hz.
Figure 16.
Vertical displacement and acceleration time histories of characteristic points at 3.127 Hz.
The above results demonstrate that girder-end displacement excitation with a frequency close to one or two times the natural cable frequency can induce primary resonance or parametric resonance in the stay cable. Even a small displacement excitation (25 mm) can generate considerable cable vibration amplitudes. For bridge stay cables, this means that slight structural vibrations can trigger large-amplitude cable resonance via the anchorage points even under calm or light wind conditions, posing a severe threat to structural safety.
4.5. Comparative Analysis of Dominant Vibration Mechanisms
To clarify the dominant vibration mechanism responsible for the observed excessive cable vibration, the characteristics of the four investigated mechanisms are systematically compared. Vortex-induced resonance occurs easily within common wind-speed ranges, producing moderate amplitudes. Wake galloping requires a critical wind speed exceeding 28 m/s, which is rarely reached at the bridge site. Rain–wind induced vibration, although potentially severe, was not observed during the field measurement period. In contrast, parametric resonance can be triggered by girder-end displacement excitation with frequencies close to 1–2 times the natural cable frequency. Given that the measured cable frequencies (0.350–39.80 Hz) fully cover the bridge structural frequency band (1.818–13.832 Hz), parametric resonance is identified as the dominant vibration mechanism for the studied bridge, while vortex-induced resonance is highly susceptible to occur under normal wind conditions.
5. Fatigue and Fracture Mechanism of the Cable Connecting Screw
5.1. Mechanical Analysis with Restricted Anchor Rotation and Cable Deflection
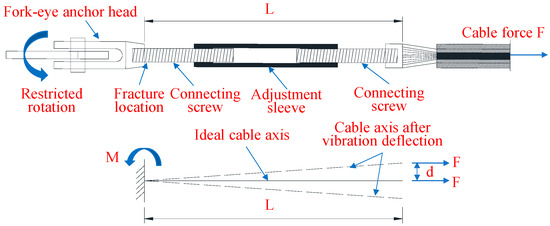
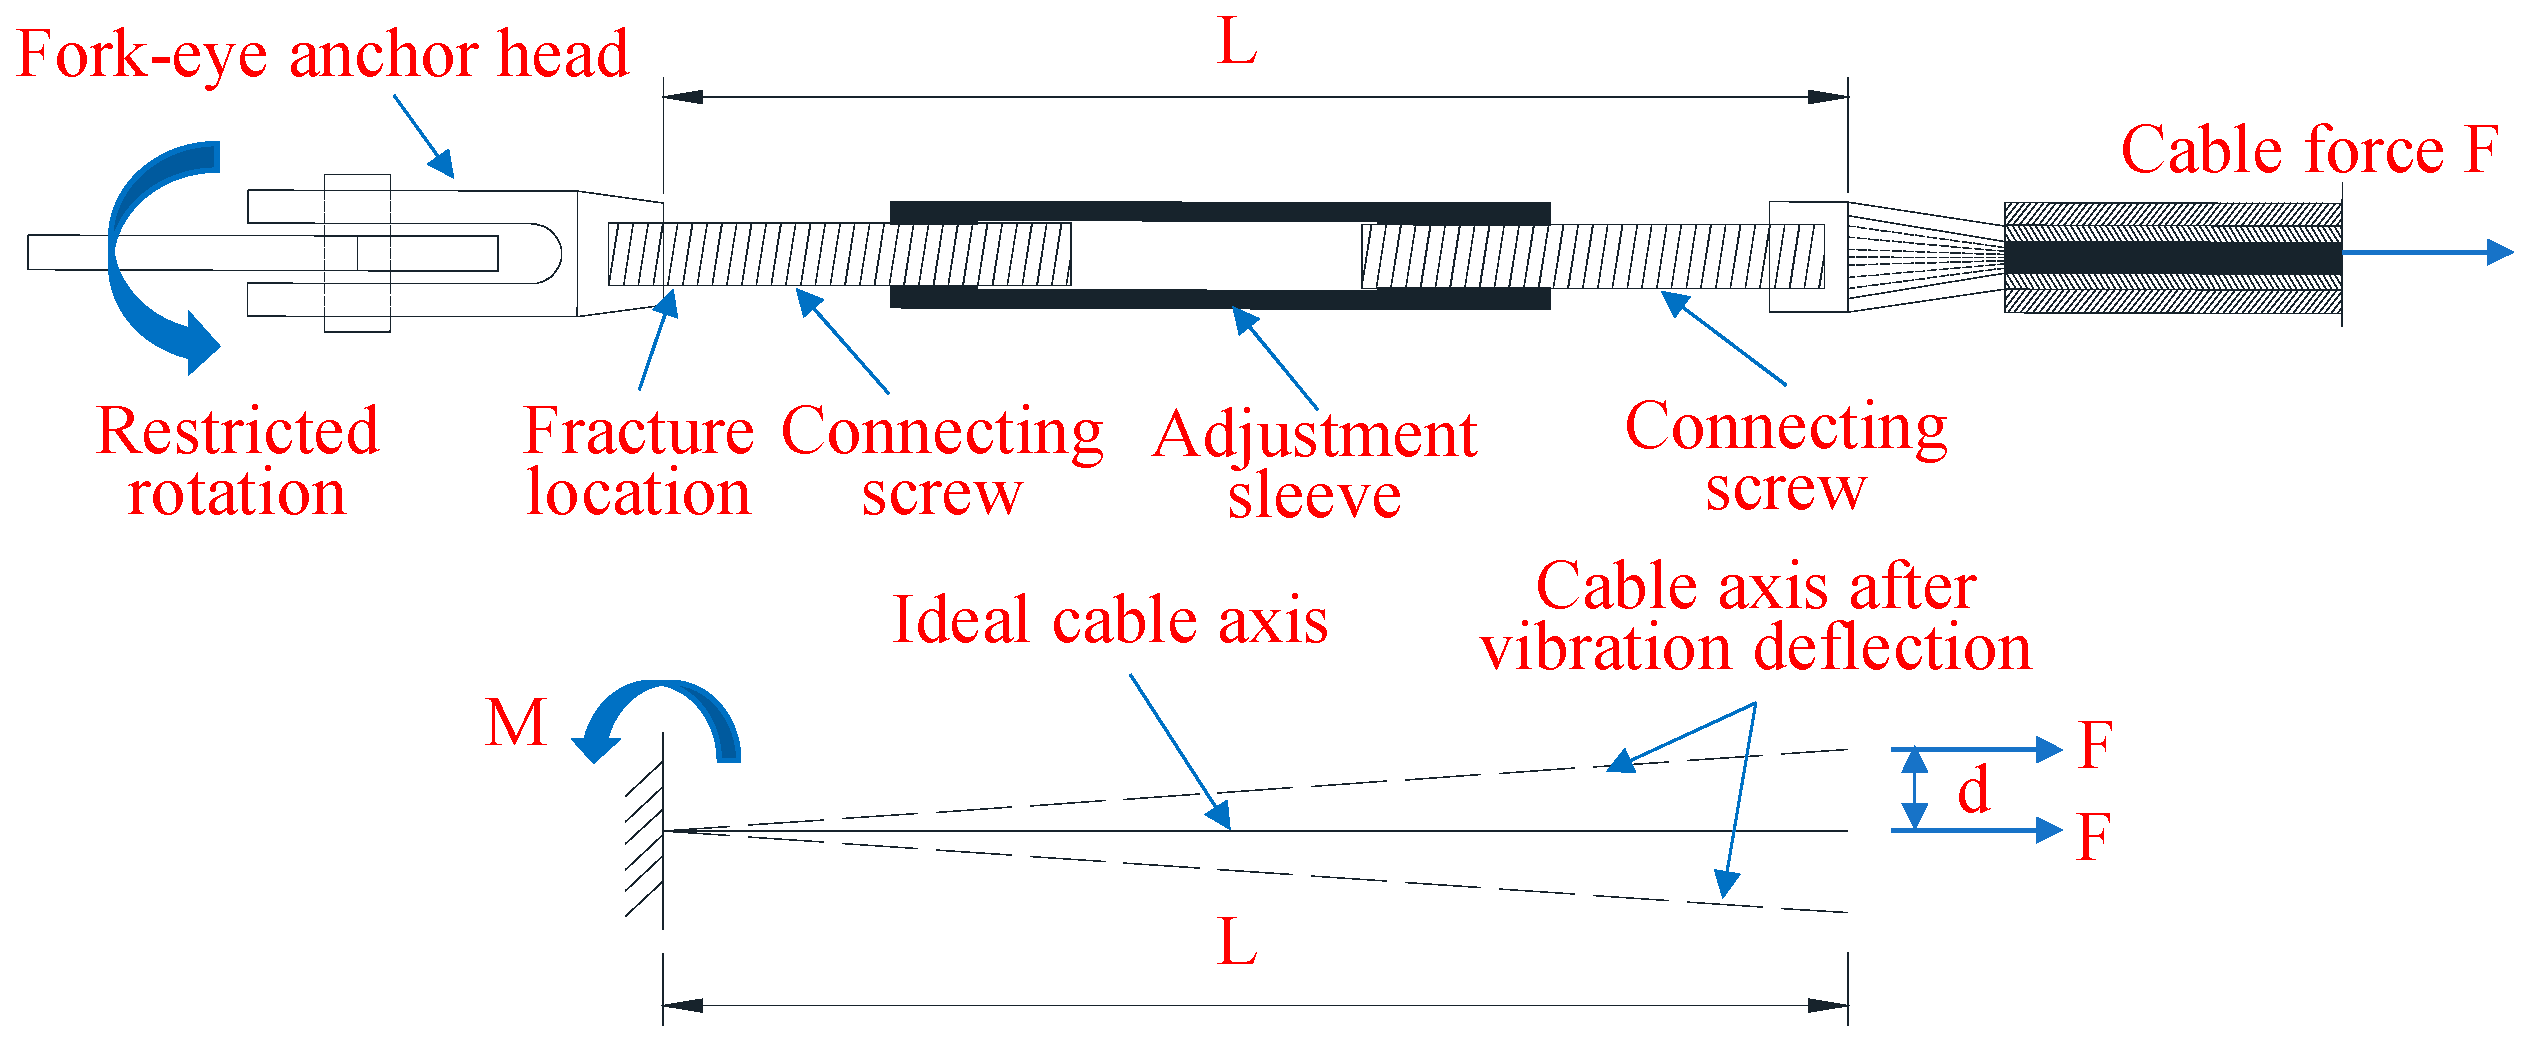
To investigate the fracture of cable T2-LS6 at the joint between the connecting screw and the anchor head fork-eye, the girder-end anchorage system is selected as the research object in this study. Under normal service conditions, the connecting screw is primarily subjected to axial tensile force, and the anchor head permits slight rotation; however, installation errors, cable sag, and vibration effects can restrict the rotation of the anchor head, thereby imposing a rotational constraint on the connecting screw. Given its short length and high stiffness, the connecting screw can be simplified as a cantilever beam model under load, as shown in Figure 17. During cable vibration, the deflection of the cable induces an additional bending moment in the connecting screw. The relationship between this bending moment M, cable force F, and vibration amplitude d can be expressed as M = F × d. Based on the design data and dynamic test results, a design cable force F = 80 kN and an amplitude d = 10 mm are adopted, yielding an additional bending moment of M = 0.8 kN·m. Furthermore, the axial tensile force borne by the connecting screw is 101.2 kN.
Figure 17.
Simplified mechanical model of the end anchor head and connecting screw.
Calculations based on the simplified mechanical model show that under axial force alone, the maximum combined tensile stress of the connecting screw is 105.2 MPa, with a corresponding safety factor of 3.73. This satisfies the requirement in the design code that the safety factor shall not be less than 2.5 under service conditions [46]. However, when the additional bending moment is considered, the maximum combined stress of the connecting screw reaches 295.3 MPa. Although this value is lower than the measured yield strength of the material (392.5 MPa), the safety factor decreases to 1.33, which fails to meet the code requirement of no less than 2.5. Therefore, the additional bending moment induced by cable vibration at the cable end significantly exacerbates the stress condition of the anchorage components.
Several simplifying assumptions were adopted in the establishment of the mechanical model, and their potential influence on the calculation results is discussed as follows. First, the anchor head fork-eye is assumed to be rigidly constrained at the anchor plate, whereas in practice, a small rotational clearance exists, which may reduce the bending moment transmitted to the screw. Second, a quasi-static analytical solution is employed to calculate the combined stress, neglecting the dynamic stress amplification caused by sudden cable tension variations during vibration. Third, the amplitude of girder-end displacement excitation is taken as 2 mm in the parametric resonance analysis, which represents a relatively moderate estimate; larger amplitudes would further intensify fatigue damage. Finally, the finite element model uses a linear elastic material model and does not account for plastic deformation or residual stress at the thread root. While some of these assumptions (such as the rigid constraint) yield conservative estimates, others (like neglecting dynamic amplification) may underestimate the actual stress. Nevertheless, the qualitative conclusions regarding the relative contribution of each factor remain valid.
It should be noted that the analytical model and the finite element model employ different stress evaluation approaches, which explains the apparent discrepancy in the calculated stress values. The analytical model derives the nominal stress at the screw thread root based on a simplified mechanics approach, yielding a maximum combined stress of 295.3 MPa. In contrast, the finite element model captures the local stress concentration at the thread root, with a maximum von Mises stress of 149.1 MPa. The FE result is lower because the actual load transfer in the threaded connection is distributed across multiple threads. The fatigue analysis in this study is based on the FE results, which are considered more representative of the actual stress state.
5.2. Fatigue Analysis of the Cable Connecting Screw
Fatigue refers to the failure phenomenon in structural components where cracks gradually initiate at weak internal zones under alternating stresses and propagate as stress cycles increase, eventually leading to fracture. Fatigue failure is a cumulative process caused by repeated stress applications rather than a single load event. Its occurrence depends not only on the fatigue resistance of the material (e.g., fatigue strength and fatigue limit), but also on factors such as stress concentration effects, size, surface conditions, stress levels, stress amplitude, and the ambient temperature of the component.
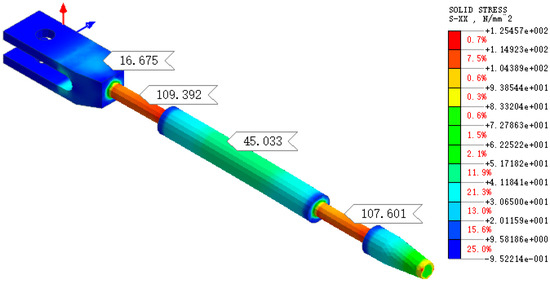
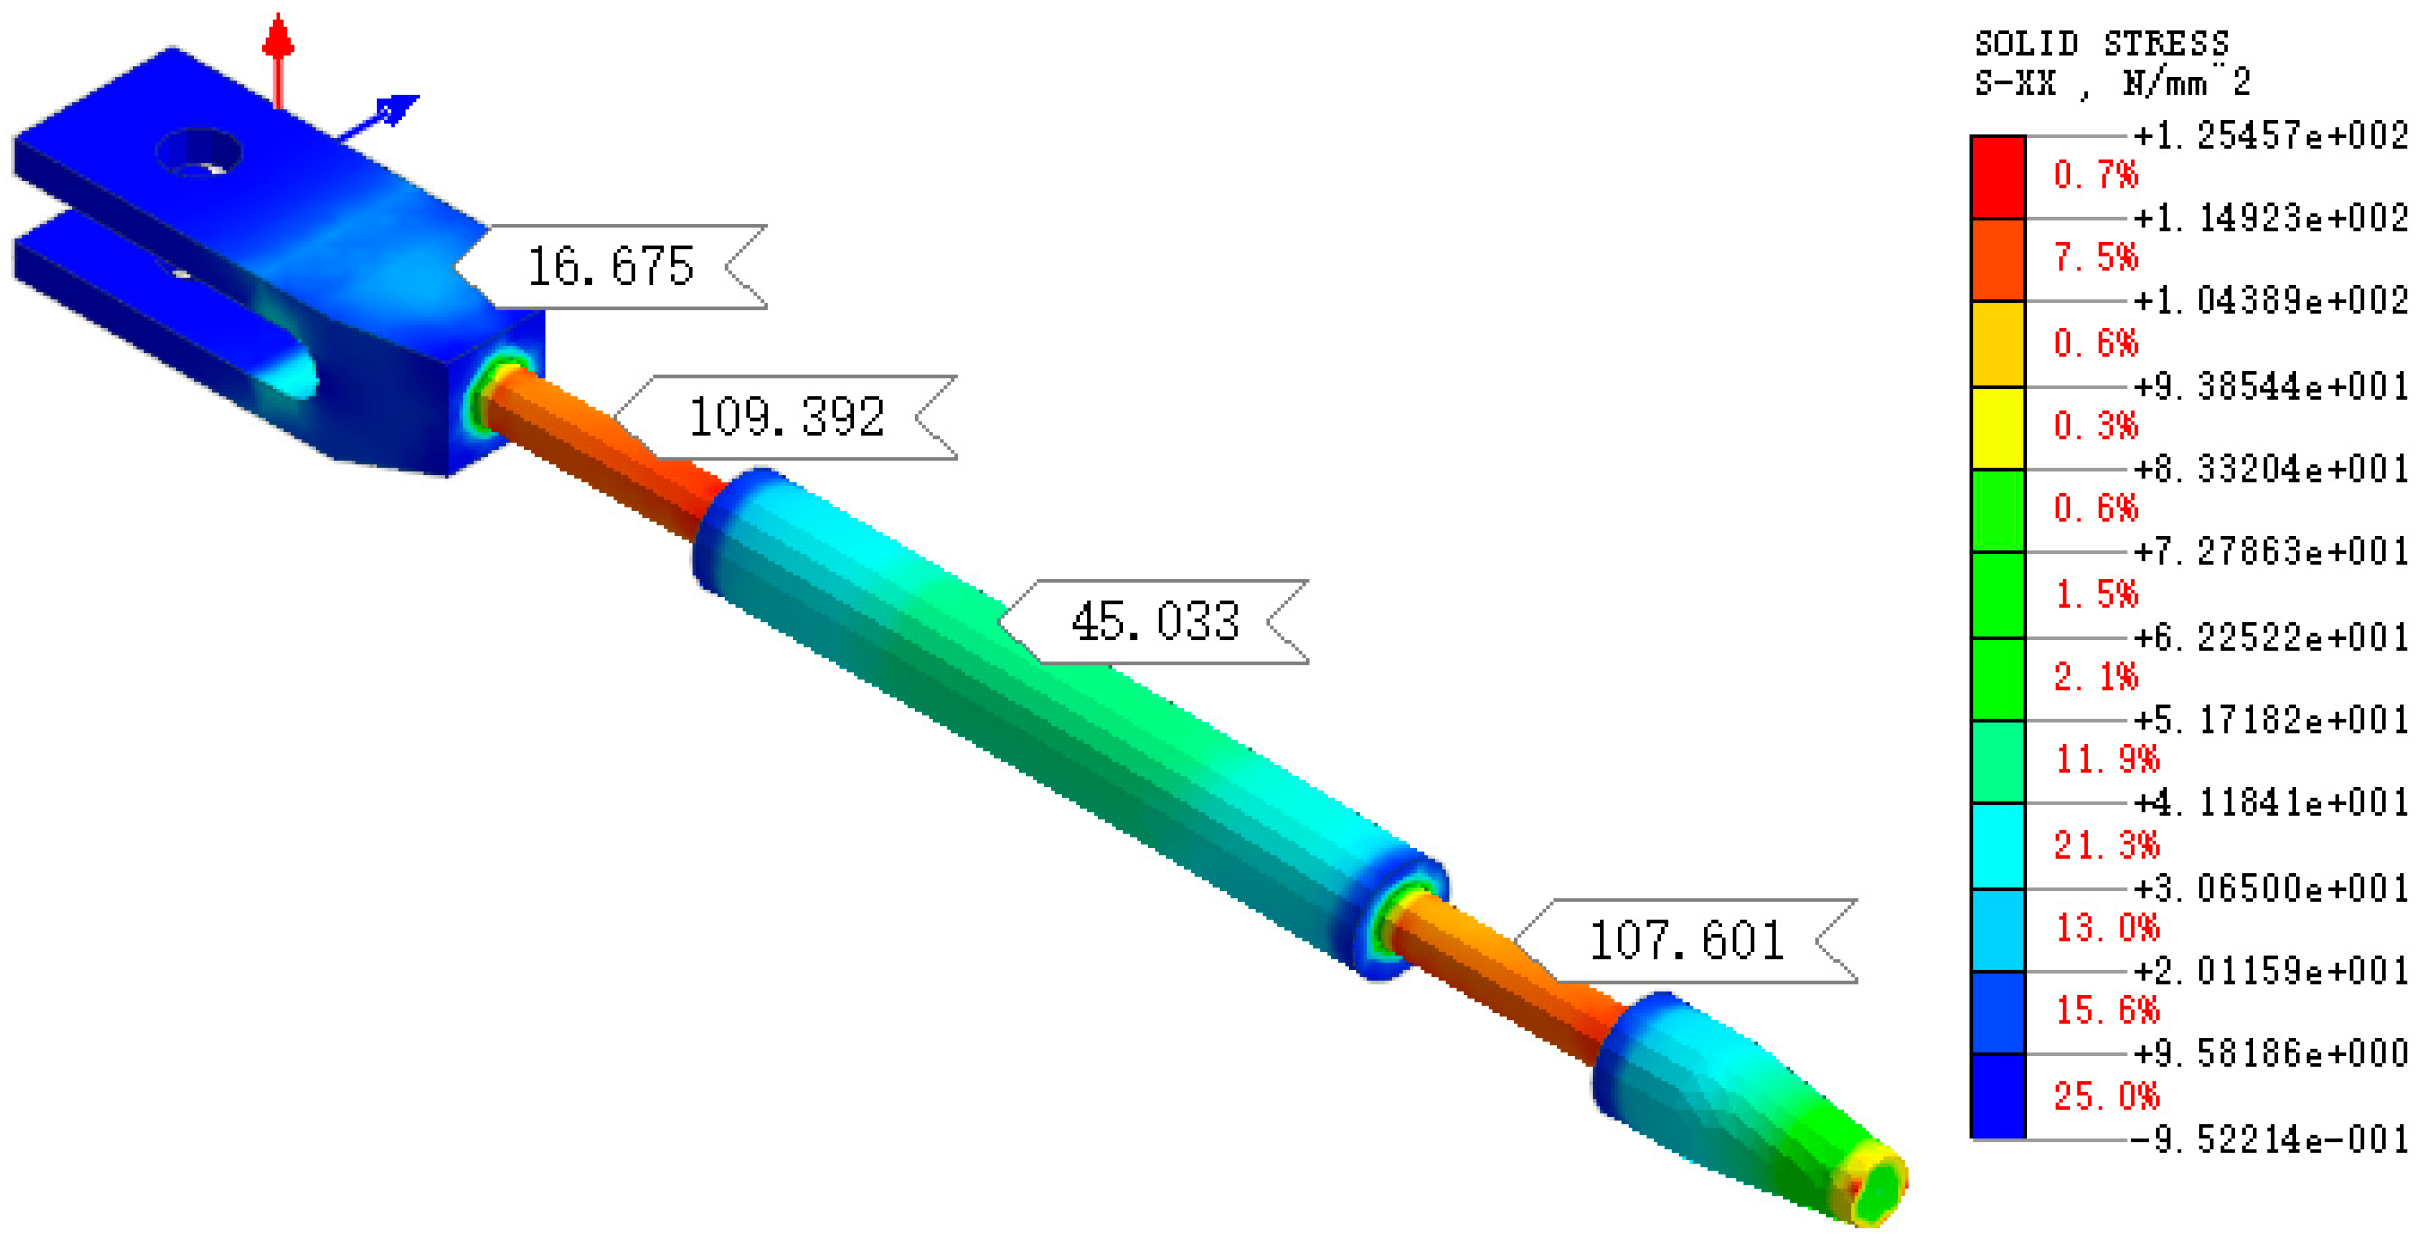
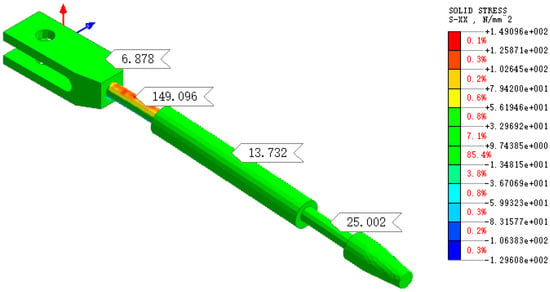
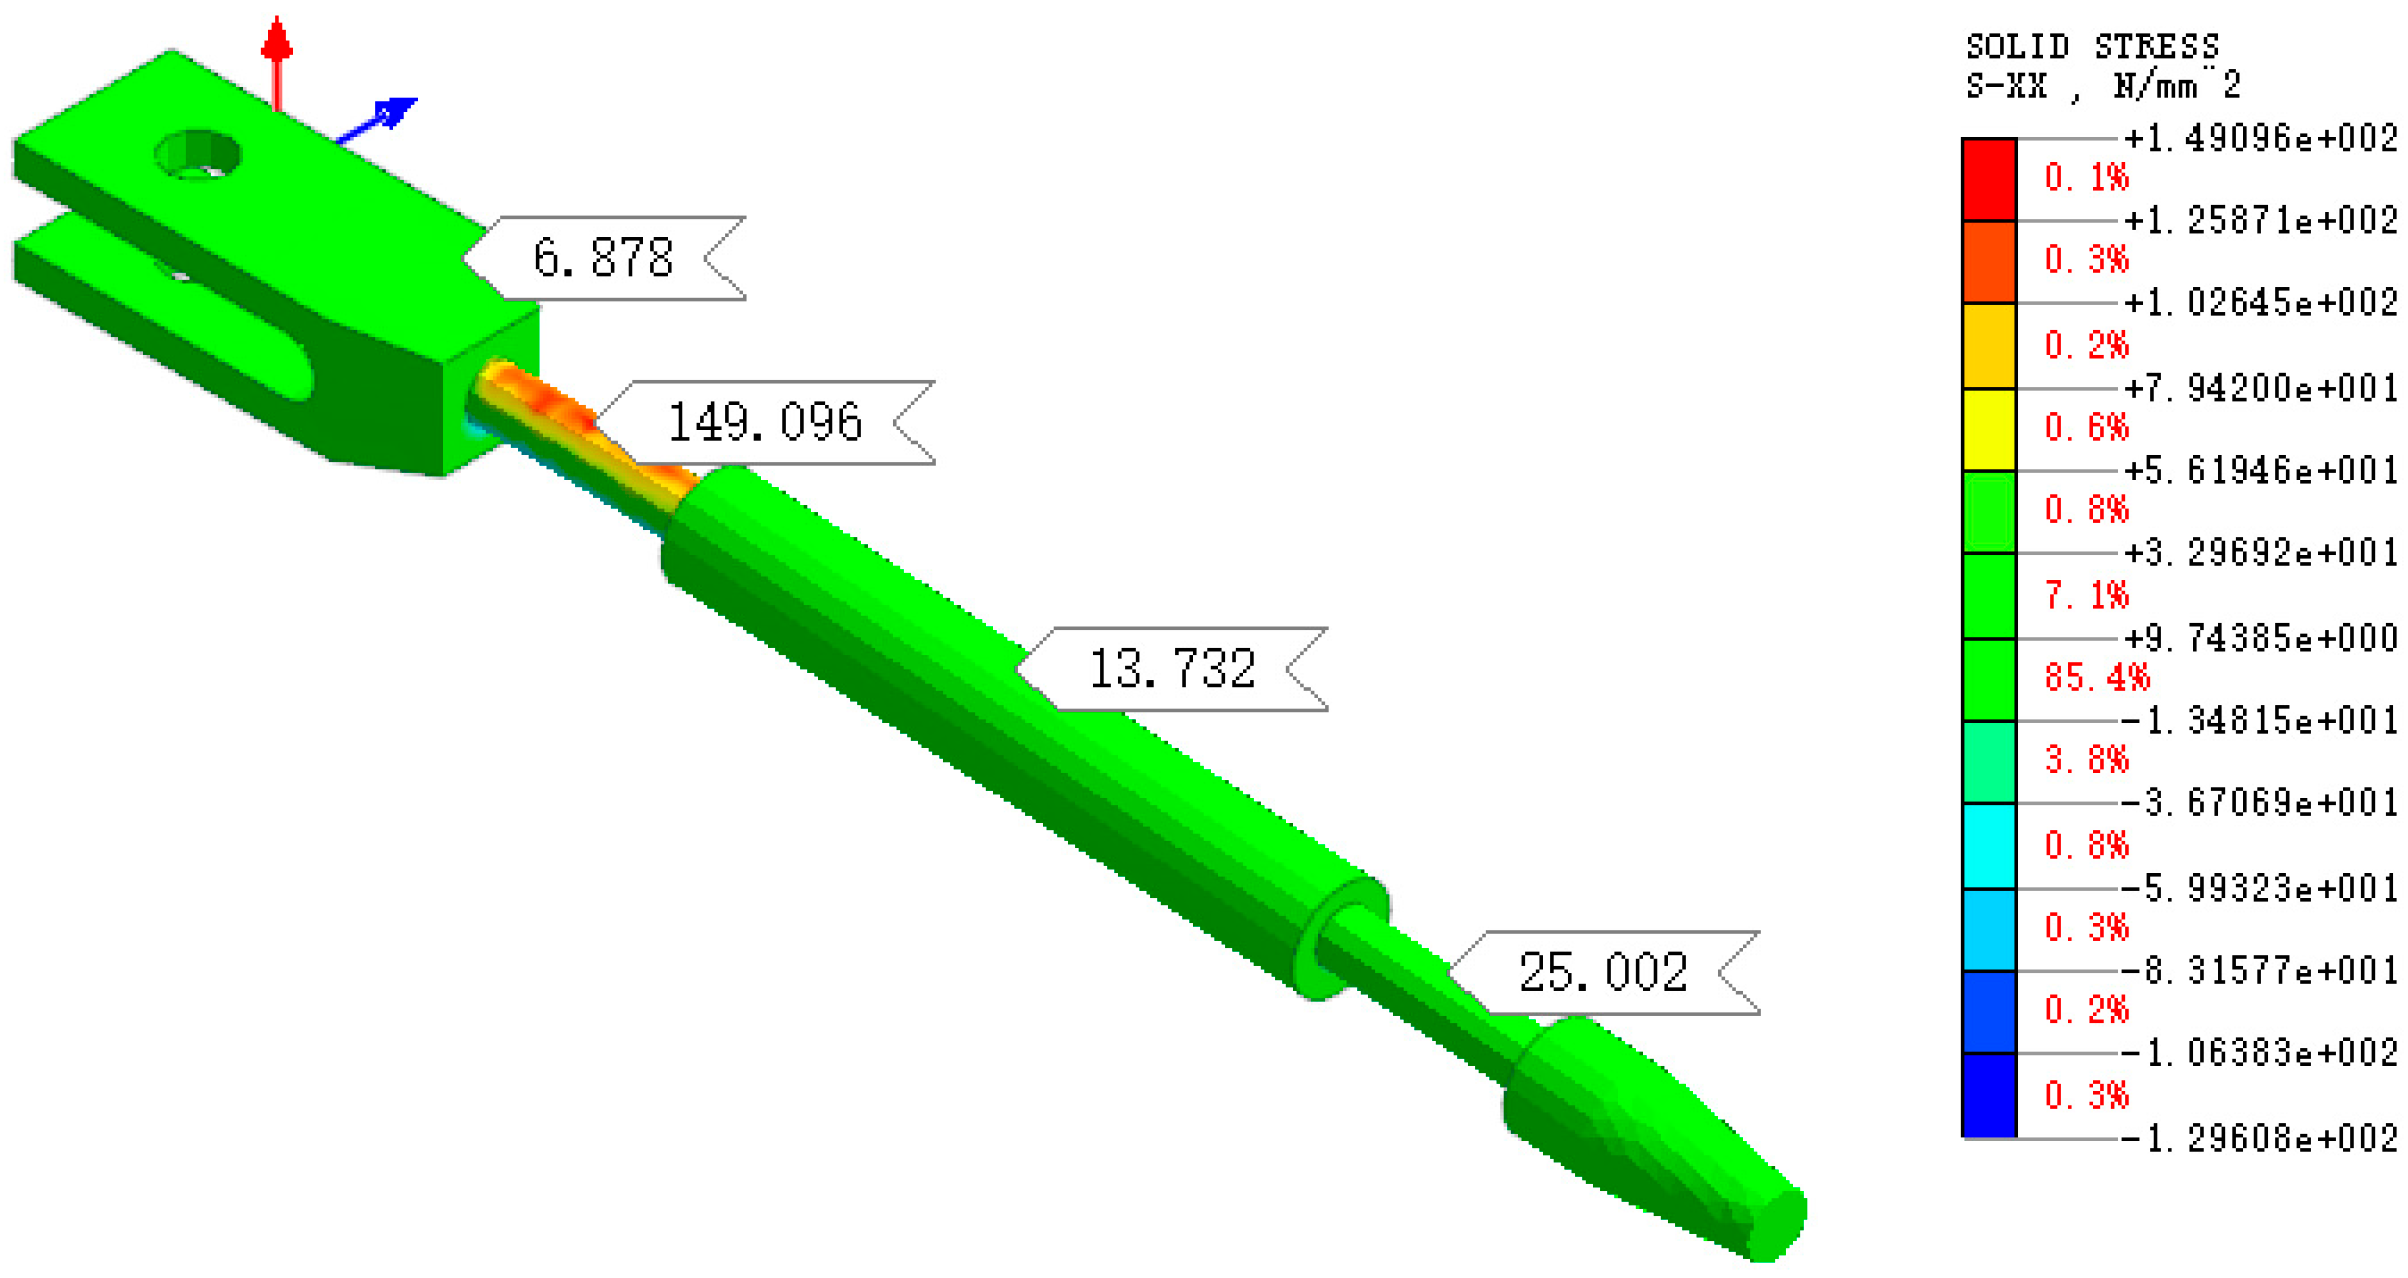
A 3D solid finite element model of the girder-end anchorage segment was established in Midas FEA NX (2024R1). The model was discretized using high-order tetrahedral elements, with local mesh refinement applied to the stress concentration zones, particularly at the threads of the connecting screw. The material was modeled as isotropic linear elastic with an elastic modulus of 206 GPa and a Poisson’s ratio of 0.3, based on the average yield strength of 392.5 MPa and a tensile strength of 632.5 MPa. Surface-to-surface contact pairs with a friction coefficient were defined between the anchor head, connecting screw, and adjustment sleeve to simulate their mechanical interactions, while displacements at the contact interface between the fork-eye and the anchor plate were constrained. The stress contours of the anchor head and connecting screw under pure axial tension and under axial tension combined with the additional bending moment from vibration are plotted in Figure 18 and Figure 19, respectively. Under axial tension alone, the maximum tensile stress in the connecting screw is 109.392 MPa, while the stresses in the anchor head and adjustment sleeve are relatively low. When the additional bending moment is applied, the maximum stress in the connecting screw reaches 149.096 MPa.
Figure 18.
Stress distribution of the girder-end anchorage segment under axial tension.
Figure 19.
Stress distribution of girder-end anchorage under additional bending moment.
Fatigue analysis was performed in Midas FEA NX using the stress–life method combined with S-N curves. The S-N curve describes the relationship between the stress amplitude (S) under constant-amplitude cyclic loading and the number of cycles to failure (N) of the component. In the analysis, the von Mises stress was extracted from the static analysis results to compute the stress amplitude, and the fatigue life or number of cycles was then determined from the S-N curve. According to the Standard for Design of Steel Structures (Ref. [50]), the fatigue strength for a given number of cycles was determined based on the member and connection type, as listed in Table 6. Specifically, the connecting screw is categorized as Detail Category Z11 per Ref. [50]. The FE mesh of the anchorage assembly utilizes four-node tetrahedral elements (CTETRA4) and eight-node hexahedral elements (CHEXA8).
Table 6.
S-N curve parameters of the connecting screw at the cable anchorage end.
To further refine the finite element model for a more accurate fatigue assessment, the following aspects could be considered. First, the detailed thread geometry of the connecting screw should be modeled to capture the actual stress concentration factor at the thread root. Second, the contact interaction between the fork-eye and the anchor plate should be modeled using surface-to-surface contact elements. Third, a submodeling technique can be adopted for a locally refined mesh at the screw thread region. Finally, stress evaluation should use the local strain approach instead of the nominal stress approach.
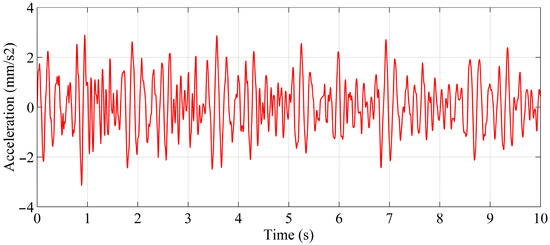
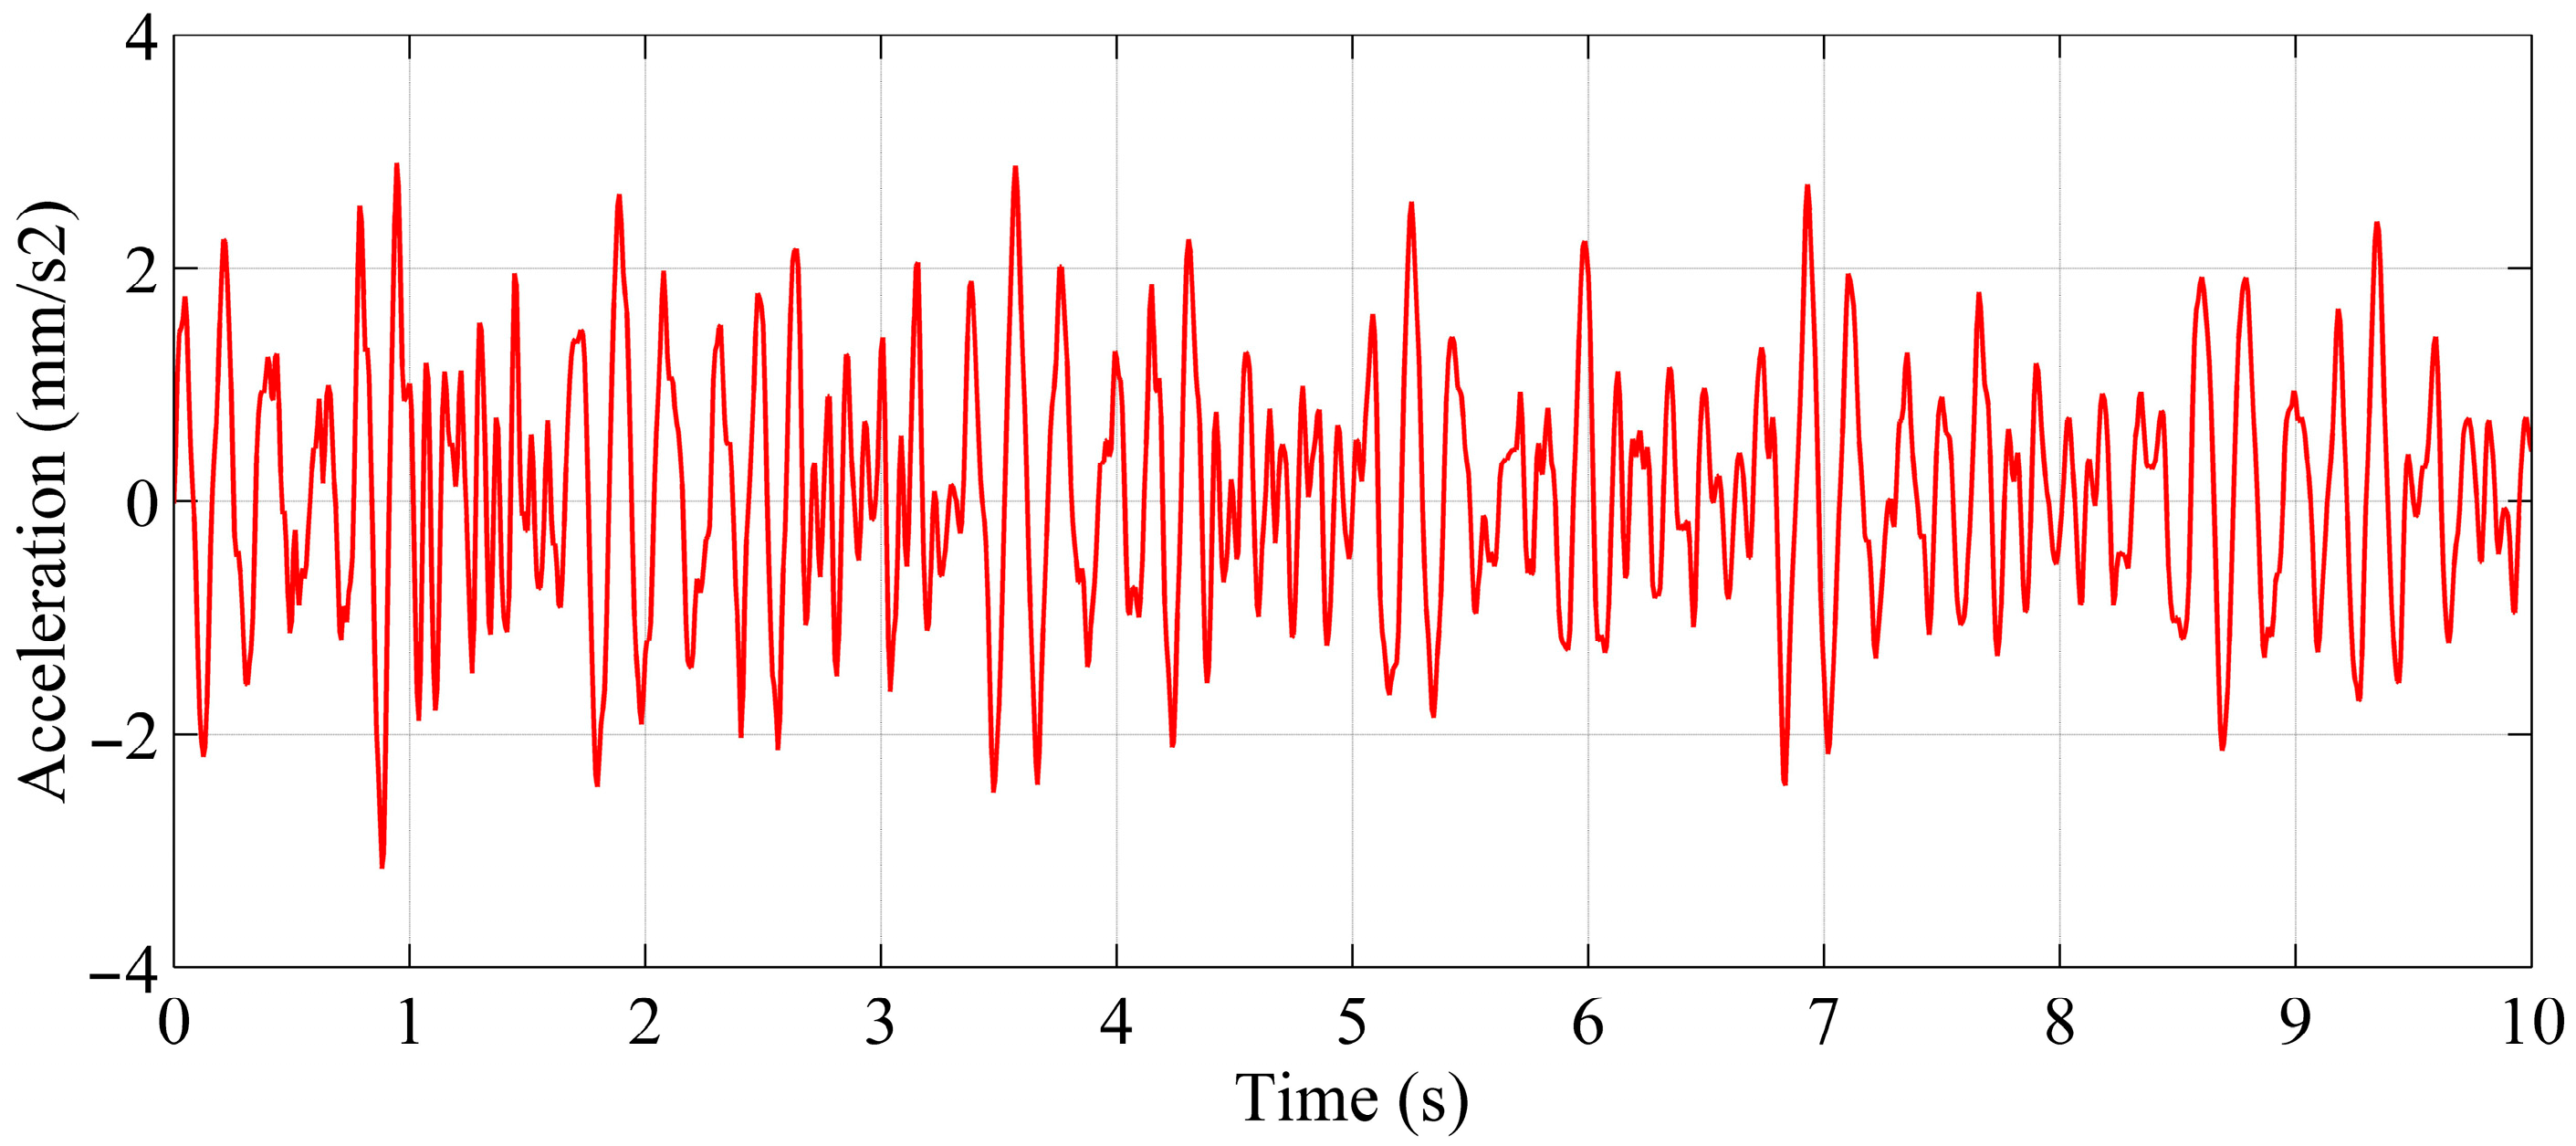
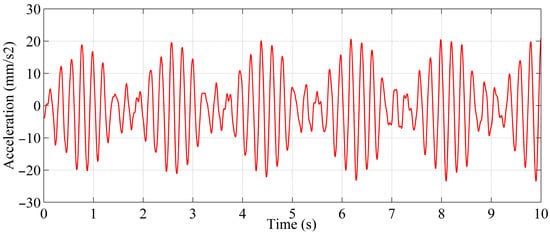
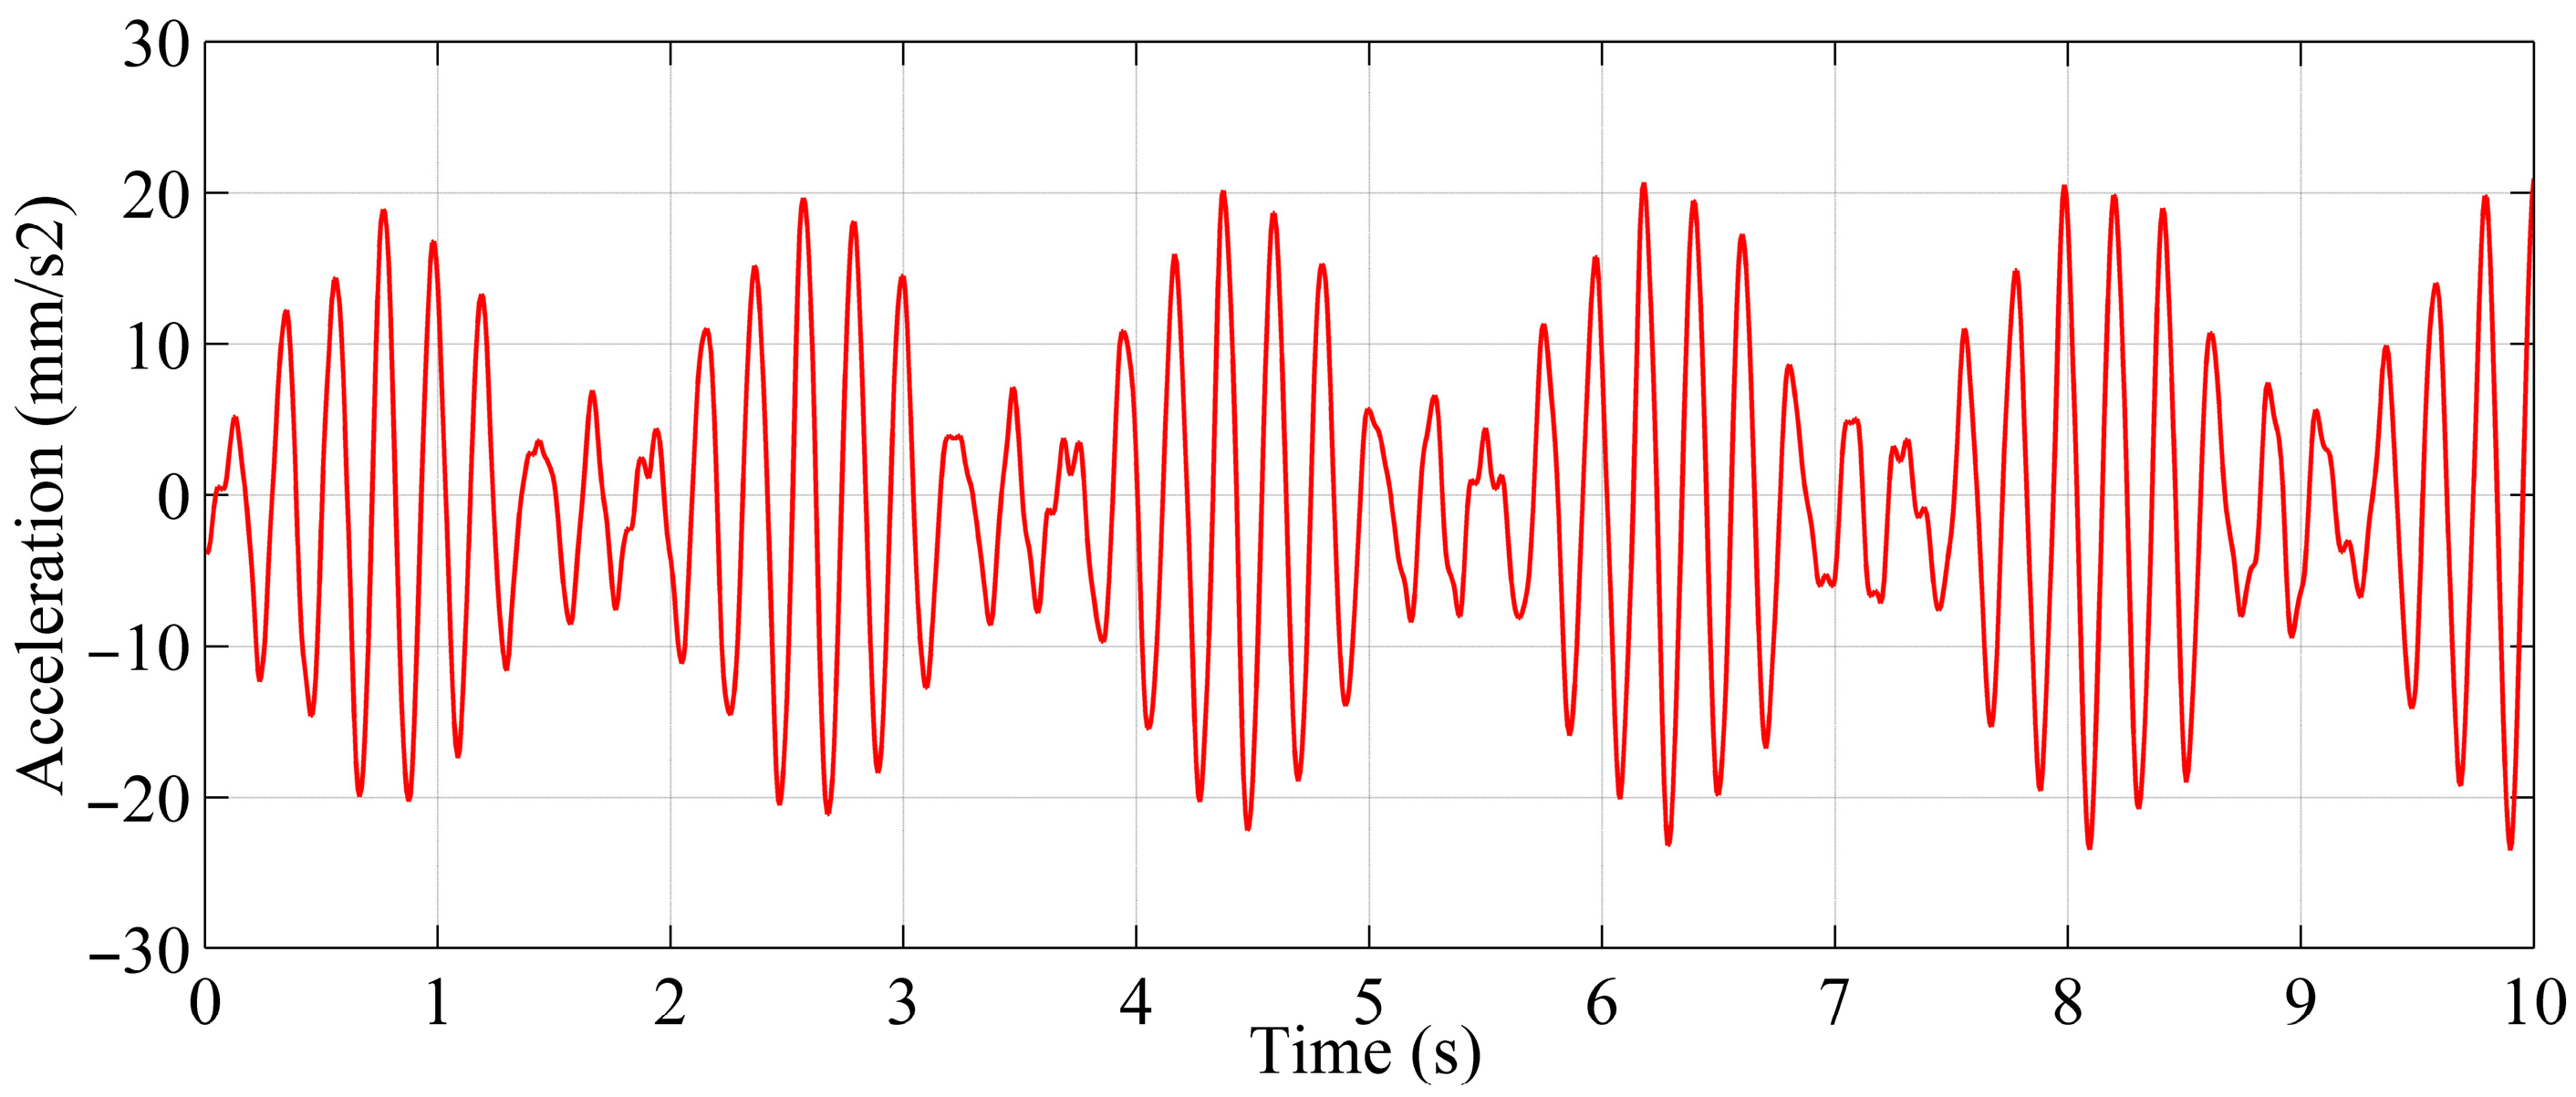
Ten-second sample data were intercepted from the measured vibration data of cables T2-RS6 and T1-LS6, respectively, and used as the input for the fatigue load function (see Figure 20 and Figure 21 for the data curves). The fatigue analysis included two loading states: normal loading and loading with additional bending moment. For the additional bending moment cases, the fatigue performance was analyzed using the measured vibration curves of cables T2-RS6 and T1-LS6 to reflect different vibration characteristics. The analysis parameters for each load case are given in Table 7.
Figure 20.
Vibration time history of cable T2-RS6.
Figure 21.
Vibration time history of cable T1-LS6.
Table 7.
Fatigue parameters of cable girder-end anchorage.
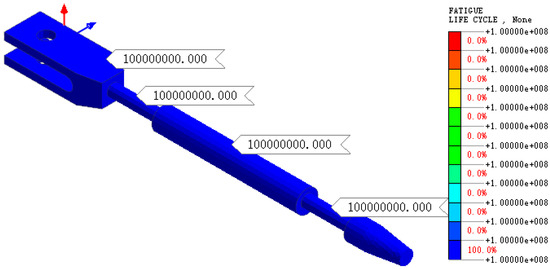
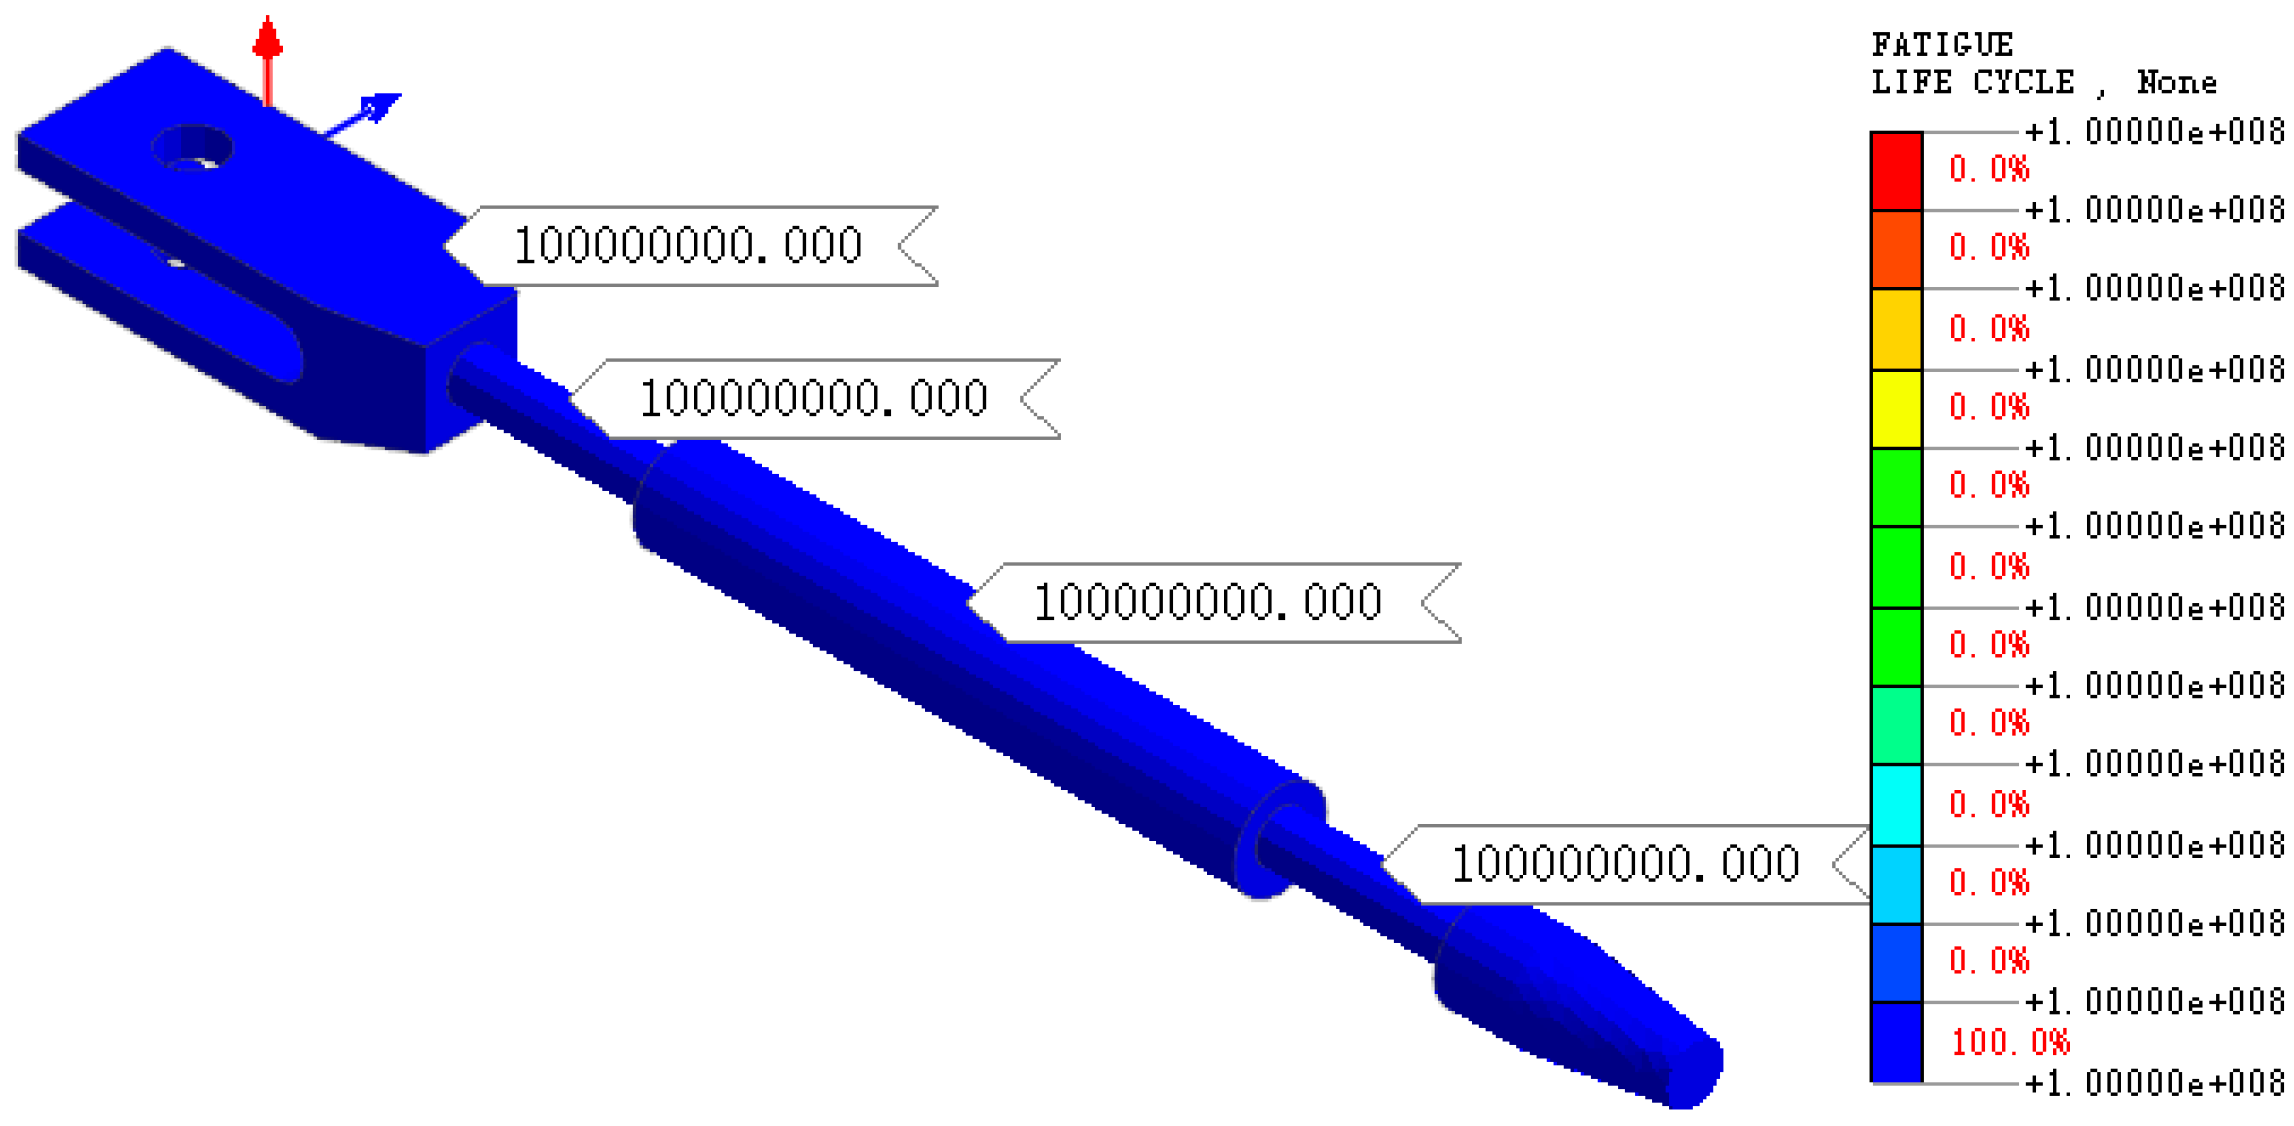
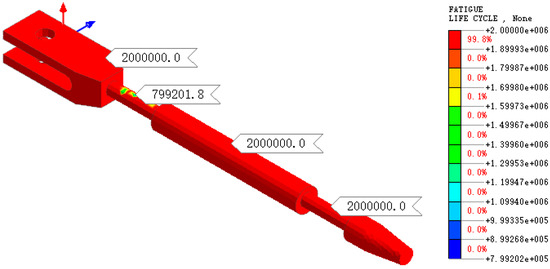
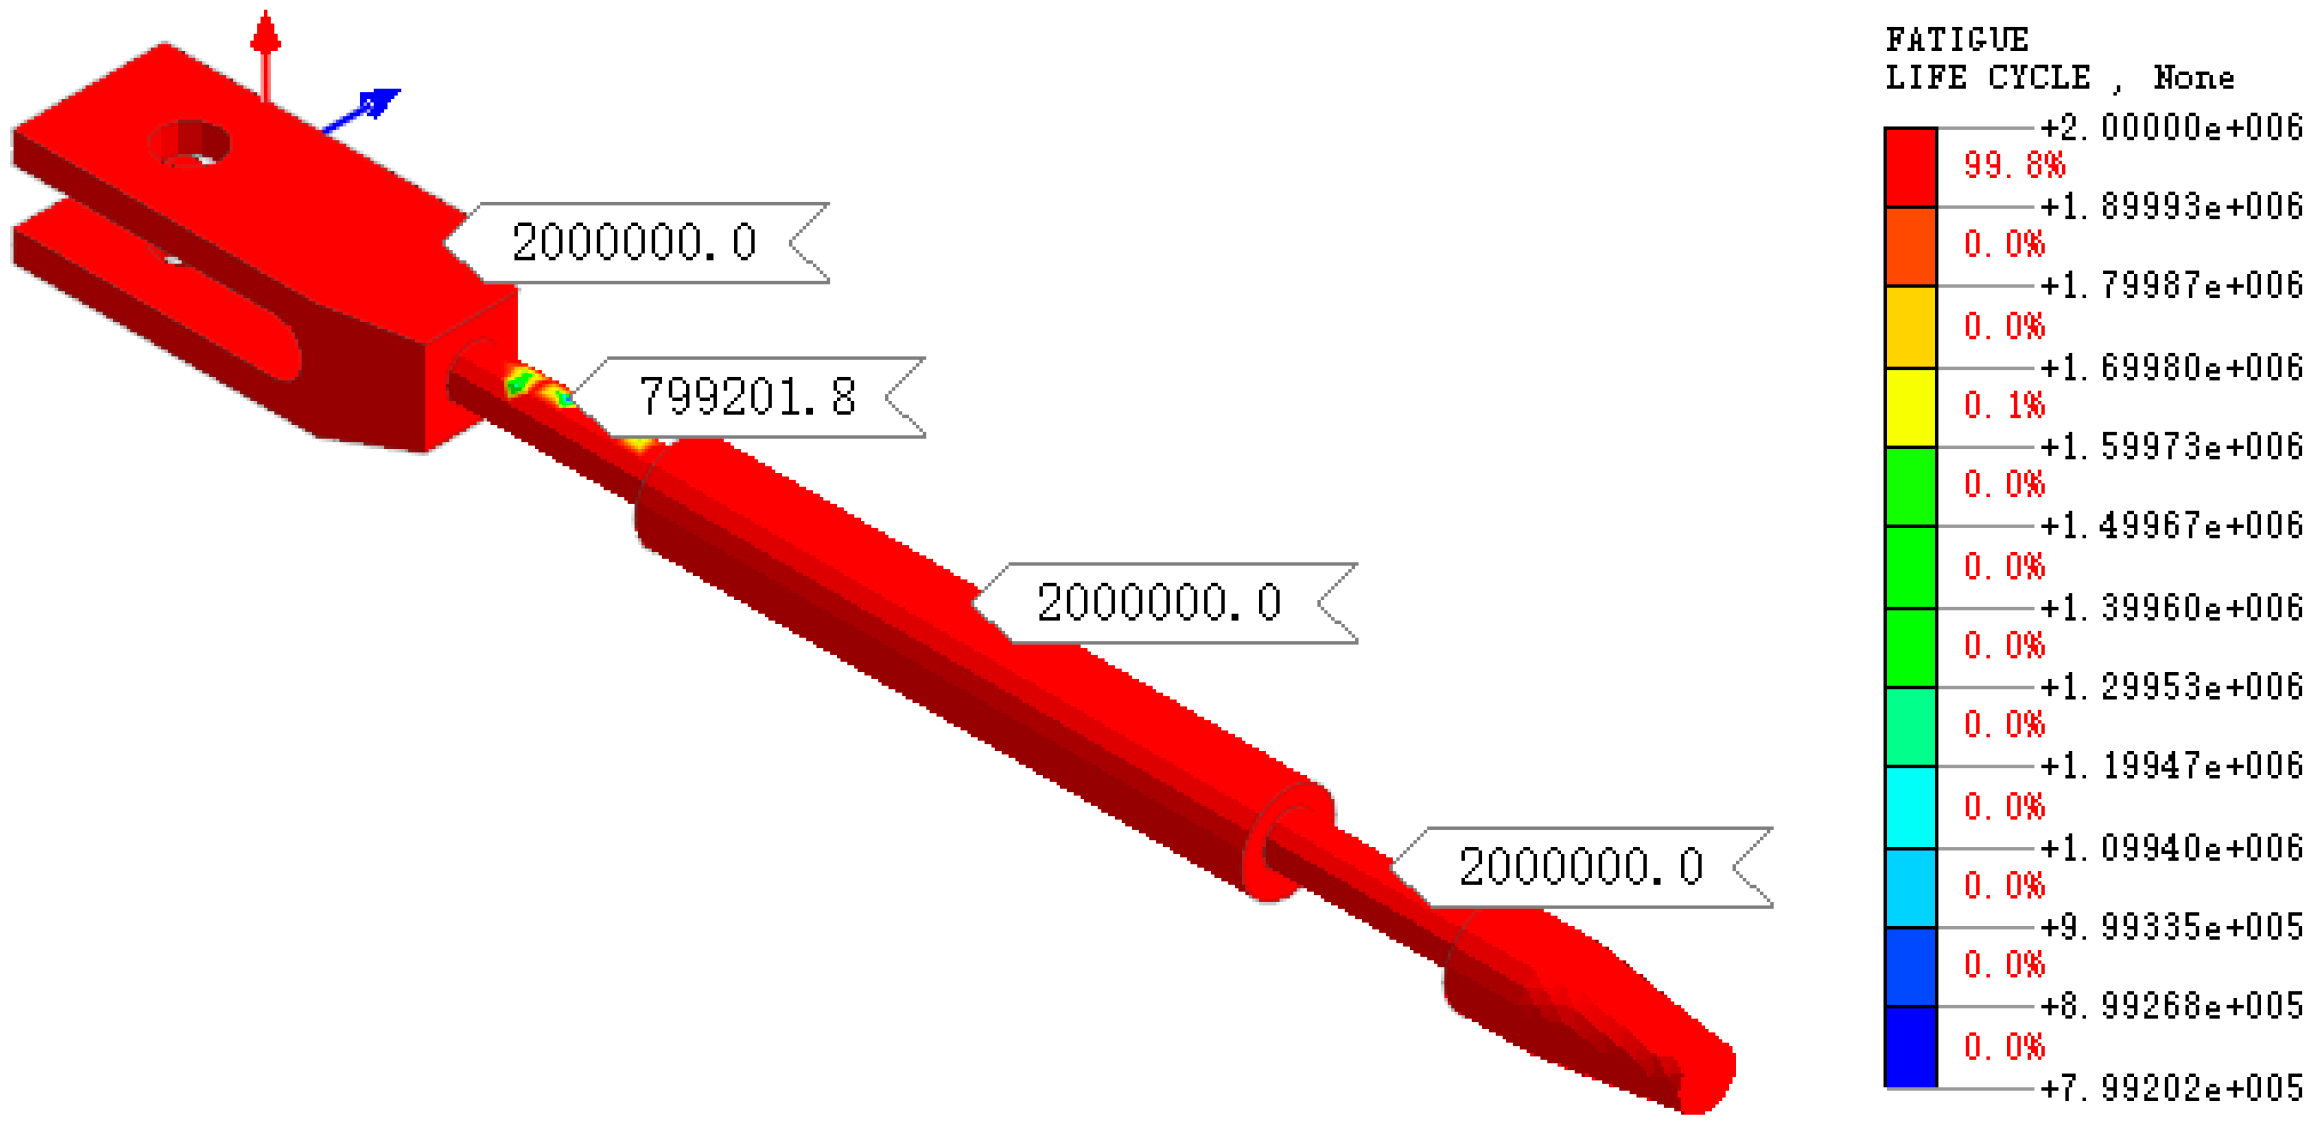
Figure 22 shows the fatigue life contour for Case 1 (normal loading condition). It can be seen that the fatigue life under this case reaches cycles, which is consistent with the code-based fatigue evaluation, indicating that the fatigue performance of the connecting screw satisfies the code requirement under normal loading.
Figure 22.
Fatigue life of the girder-end anchorage segment under Case 1 (normal loading).
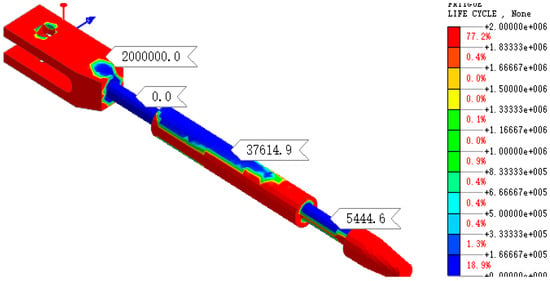
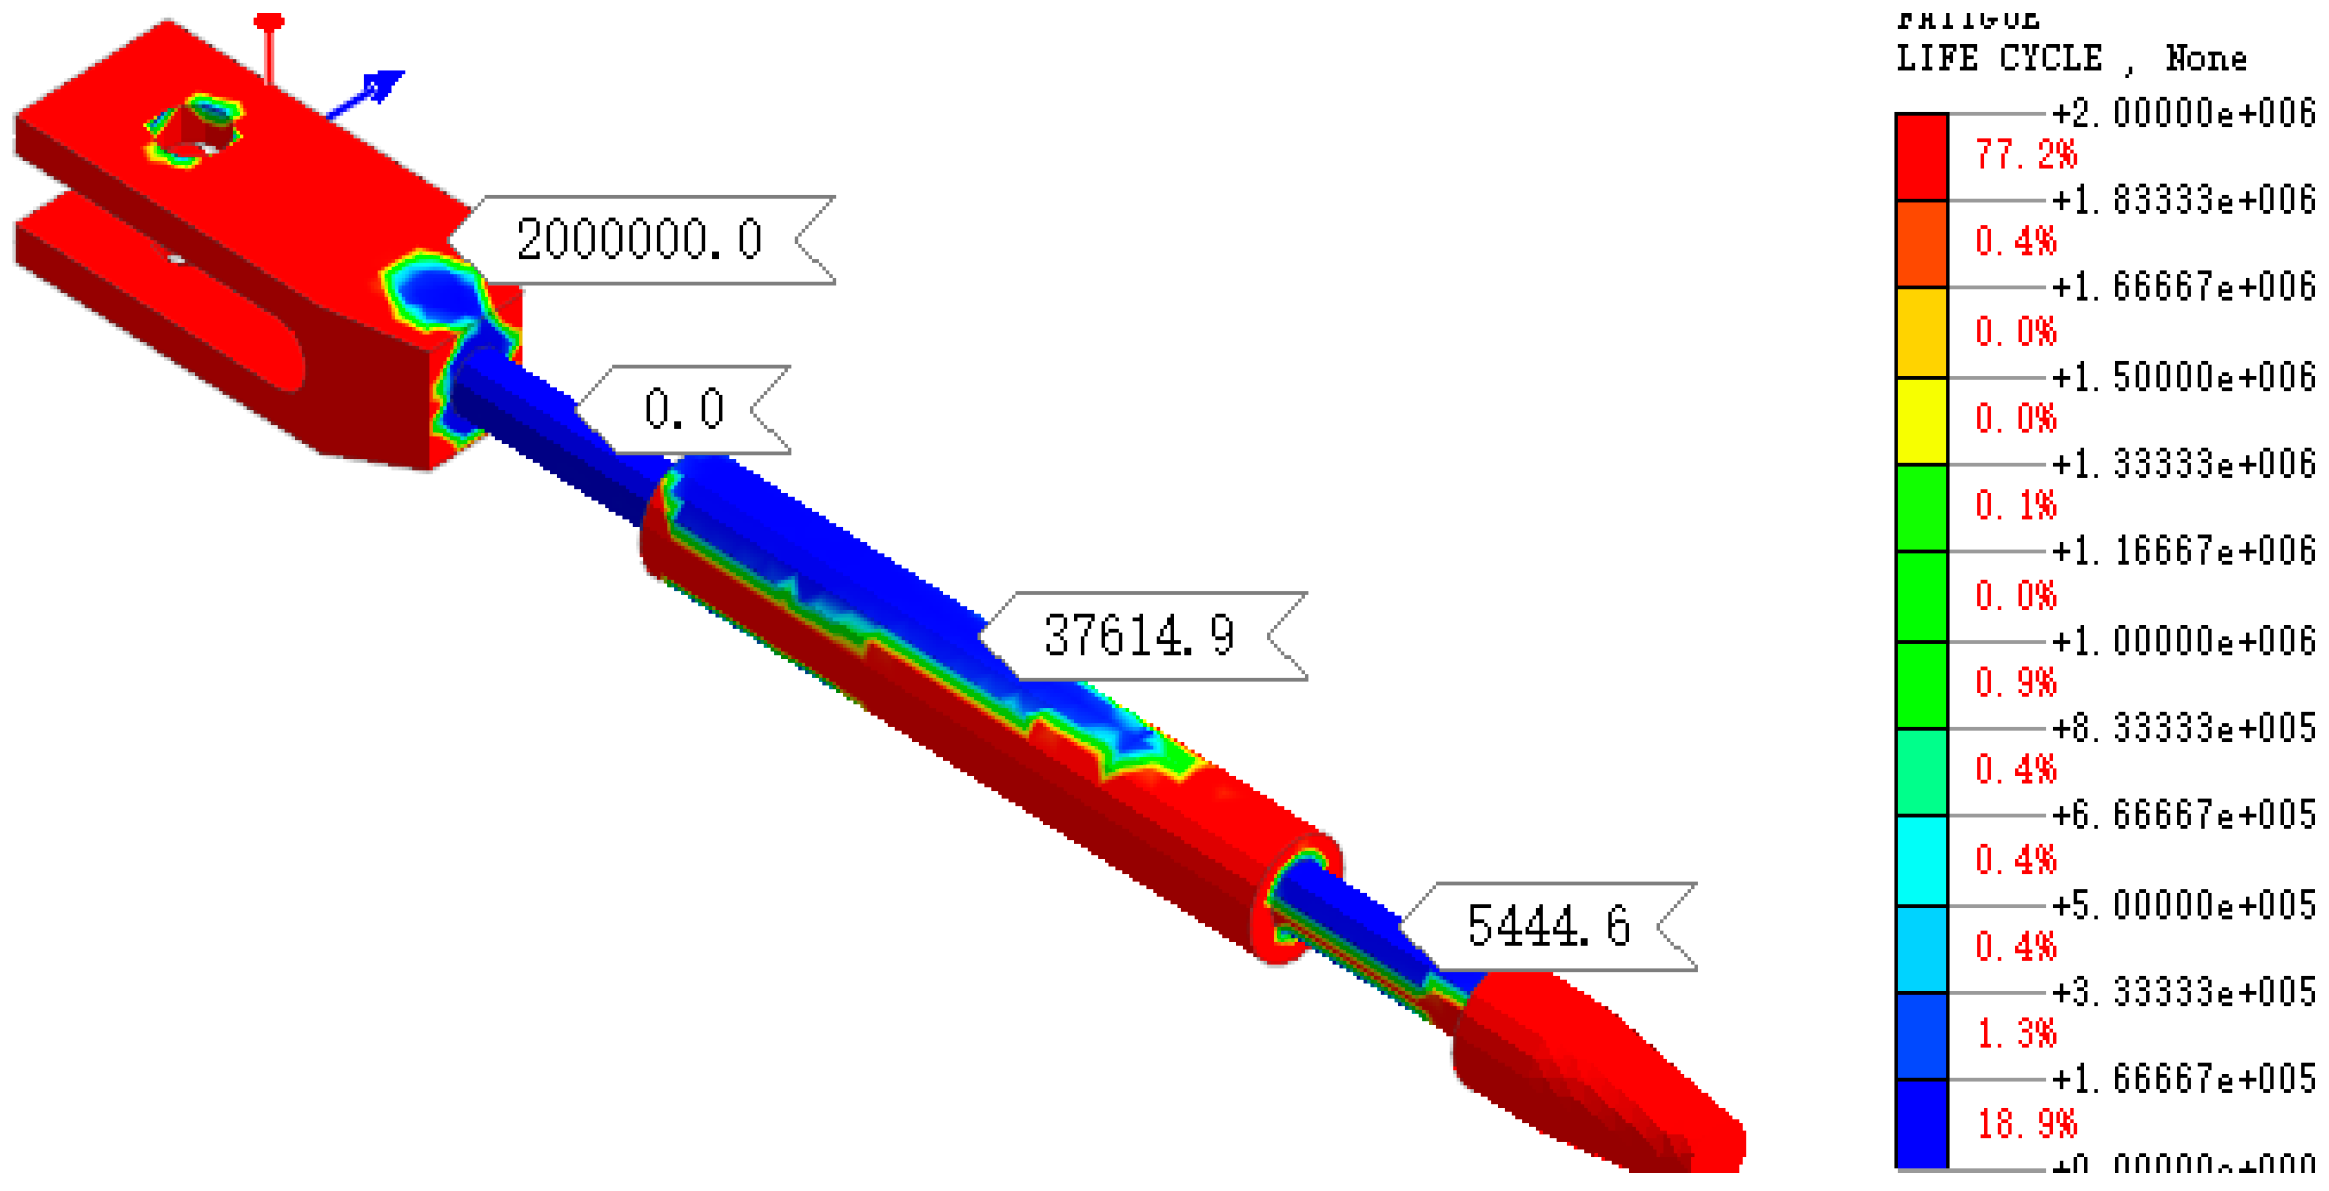
The fatigue life evaluation results for Case 2 and Case 3 (accounting for the additional bending moment from cable vibration) are presented in Figure 23 and Figure 24, respectively. The results indicate that under cable vibration, the fatigue life of the connecting screw in both cases is less than cycles, which means the component’s fatigue strength fails to meet the design requirements. Furthermore, comparing the two cases reveals that as the cable vibration acceleration increases, the region failing to meet fatigue strength requirements gradually expands from the connecting screw to the anchor head and adjustment sleeve. This demonstrates that the cable vibration amplitude has a significant impact on the fatigue performance of the anchorage components.
Figure 23.
Fatigue life under Case 2.
Figure 24.
Fatigue life under Case 3.
6. Discussion on the Fracture Mechanism of Stay Cable T2-LS6
6.1. Material and Intrinsic Component Degradation
The fracture surface of the connecting screw for cable T2-LS6 on this landscape cable-stayed bridge exhibits typical characteristics of high-cycle fatigue failure. Significant corrosion defects exist on the outer thread teeth at the fractured section. This degradation introduces severe stress concentrations and reduces the fatigue strength of the material, acting as the primary trigger for crack initiation. Under external fatigue loading, cracks nucleate at the thread teeth. Under continued cyclic loading, the cracks propagate gradually, eventually resulting in instantaneous fracture when the residual cross-section can no longer sustain the applied load.
6.2. External Load and Environmental Effects
Wind-induced vibration and parametric resonance are the direct external triggers for the fatigue failure of the stay cable. Under wind action, the cable vibration frequency easily synchronizes with the vortex shedding frequency, readily inducing vortex-induced resonance, to which long cables are particularly susceptible due to their low natural frequencies. In addition, multi-order vibrations of the pylon and main girder are transferred to the cables through the anchorage points. When the excitation frequency is close to one or two times the natural cable frequency, primary resonance or parametric resonance is triggered, where even a small displacement excitation can produce large cable amplitudes. The sustained large-amplitude vibrations caused by vortex-induced resonance and parametric resonance provide the cyclic loading conditions necessary for fatigue failure.
6.3. Defects in Manufacturing, Construction, and Installation
Manufacturing and installation defects of the girder-end anchorage system are critical factors that exacerbate fatigue failure. The clearance between the fork-eye and the anchor plate at the cable end is excessively small, severely restricting cable sag and vibration displacement, thereby restricting anchor head rotation and inducing an additional bending moment. This defect causes the actual mechanical state of the connecting screw to resemble a cantilever beam model, which deviates significantly from the ideal design state and causes a sharp increase in the fatigue stress amplitude.
6.4. Insufficient Design and Operation Management
Inadequate design and operational management are the root causes of the cable fracture. No dampers or other vibration mitigation devices were installed on the cable system, resulting in slow vibration attenuation and persistent large-amplitude oscillations. The complexity of the actual mechanical state was not fully considered during the design of the cable anchorage system; this flaw directly led to the generation of additional bending moments. After the bridge was opened to traffic, no structural health monitoring system was established for the cables. Consequently, abnormal cable vibrations could not be identified in time, resulting in missed opportunities for early warning and maintenance.
Ultimately, cable vibrations progressively deteriorated the mechanical performance of the anchorage components, reducing the stress safety factor of the connecting screw to 1.33, which falls significantly below the code requirement of no less than 2.5. Furthermore, the fatigue stress amplitude far exceeded the design-allowable value, leading to severe fatigue strength deficiency and ultimately resulting in sudden fatigue fracture.
7. Conclusions
Taking a practical landscape cable-stayed bridge as the engineering background, this paper investigates a cable fracture accident and reveals the fatigue-dominated failure mechanism induced by excessive stay cable vibration. The main conclusions are summarized as follows:
- Wind-induced vibration and parametric resonance serve as the direct triggers of cable vibration and subsequent fatigue damage. Vortex-induced resonance occurs once the cable’s natural frequency matches the vortex shedding frequency; long cables with low fundamental frequencies are more susceptible to such resonance. Parametric resonance originates from pylon and girder vibrations transferred through anchorages. When the excitation frequency approaches one or two times the cable’s natural frequency, even minor excitations can produce excessive cable vibration. Identification and analysis of these two resonance types clarify the generation mechanism of large-amplitude cable vibration, facilitate resonance risk assessment, and provide a reference for the vibration mitigation of stay cables.
- For stay cables with fork-eye anchorages, insufficient clearance or geometric constraints between the fork-eye and anchor plate restrain the rotational freedom of the anchor head. The connecting screw is thus subjected to cantilever-like bending. Cable deflection under vibration introduces a significant additional bending moment and drastically increases local stress and fatigue stress amplitude. Numerical analysis shows that the additional bending moment reduces the safety factor of the anchorage screw from 3.73 to 1.33, failing to meet the code requirement of a minimum safety factor of 2.5 under service conditions. The resultant fatigue stress amplitude far exceeds the allowable design value of 46.85 MPa, and the fatigue life is shorter than the required loading cycles. Fractographic analysis confirms a high-cycle fatigue-induced fracture. Unlike conventional design simplifications that treat the fork-eye anchorage as an ideal hinge connection, the refined 3D solid finite element model proposed in this paper revises boundary assumptions and quantitatively evaluates the additional bending moment effect. The proposed method overcomes the limitation of traditional calculations failing to capture local high-cycle fatigue damage, and reasonably explains the abnormal fracture phenomenon despite sufficient overall strength margin.
- The fracture analysis of cable T2-LS6 demonstrates that cable failure results from the coupling of multiple influencing factors. Material and component degradation constitutes the intrinsic cause of mechanical performance deterioration. External loads and environmental attacks directly induce dynamic responses and sudden failure of stay cables. Hidden initial damage originating from fabrication and installation defects poses long-term potential safety hazards. Defective design and inadequate maintenance amplify the adverse effects of material degradation, environmental corrosion, and external loads, acting as critical promoting factors for the final fatigue fracture.
From an engineering perspective, the findings of this study highlight the necessity of incorporating vibration control measures into the design of landscape cable-stayed bridges. Supplementary dampers (e.g., viscous or friction dampers) should be installed near the cable anchorages to suppress excessive vibration. Regular inspections of the fork-eye anchorage assembly, particularly the thread roots of the connecting screw, are recommended to detect incipient fatigue cracks. For existing bridges, structural health monitoring systems can be deployed to provide early warnings of abnormal vibration and potential fatigue risks.
This study has several limitations that should be acknowledged. First, the field measurement data were collected over a relatively short period (several days), meaning that long-term monitoring data under various seasonal and environmental conditions are still lacking. Second, the mechanical model simplifies the complex contact relationship between the fork-eye and the anchor plate; future work will incorporate more refined contact analyses. Finally, only one fractured cable (T2-LS6) was available for detailed examination; the investigation of additional fracture cases would enhance the generality of the conclusions.
Future research will focus on three primary directions: (1) the implementation of long-term structural health monitoring for landscape cable-stayed bridges using wireless sensor networks to obtain continuous vibration and fatigue data; (2) the development of more sophisticated numerical models that consider fluid–structure interactions and multi-scale fatigue damage accumulation; and (3) the experimental validation of the proposed fracture mechanism through scaled-model tests or full-scale fatigue testing.
Author Contributions
Conceptualization, M.L., H.L., and J.L.; methodology, M.L. and F.S.; software, F.S.; validation, M.L., F.S., H.L., and J.L.; formal analysis, M.L.; investigation, M.L. and F.S.; resources, H.L. and J.L.; data curation, F.S.; writing—original draft preparation, M.L.; writing—review and editing, H.L. and J.L.; visualization, F.S.; supervision, H.L. and J.L.; project administration, H.L.; funding acquisition, J.L. All authors have read and agreed to the published version of the manuscript.
Funding
This research was funded by the Transportation Science and Technology Planning Project of Henan Province, China (Grant No. 2021J2 and Grant No. 2015X01-2), and Key Scientific Research Project of Higher Education Institutions of Henan Province, 2026 (Project No. 26B560027).
Data Availability Statement
All data, models, and code generated or used in this study are available from the corresponding authors upon request.
Acknowledgments
The authors gratefully acknowledge Pinde Yu and Guang Zhou from Henan Transportation Research Institute Co., Ltd., as well as Jun Luo and Daohong Hao from Zhengzhou University, for their valuable technical guidance and on-site support throughout this research. During the preparation of this manuscript, the authors used auxiliary AI writing tools for English language polishing and manuscript format arrangement. The authors have reviewed and edited the output and take full responsibility for the content of this publication.
Conflicts of Interest
Authors Haikuan Liu and Fenli Song were employed by the company Henan Transportation Research Institute Co., Ltd. The remaining authors declare that the research was conducted in the absence of any commercial or financial relationships that could be construed as potential conflicts of interest.
References
- Park, J.; Yoon, J.; Park, C.; Lee, J. Studying the Cable Loss Effect on the Seismic Behavior of Cable-Stayed Bridge. Appl. Sci. 2023, 13, 5636. [Google Scholar] [CrossRef] [Scilit]
- Tabatabai, H. Inspection and Maintenance of Bridge Stay Cable Systems: A Synthesis of Highway Practice; National Cooperative Highway Research Program: Washington, DC, USA, 2005. [Google Scholar]
- Svensson, H. Cable-Stayed Bridges: 40 Years of Experience Worldwide; Wiley: Hoboken, NJ, USA, 2013. [Google Scholar]
- Dorton, R.A. Cable-Stayed Bridges—Theory and Design. Can. J. Civ. Eng. 1989, 16, 412. [Google Scholar] [CrossRef] [Scilit]
- Li, Y.B. Study on Hazard Induced by Cable Rupture of Long-Span Cable-Stayed Bridges. Master’s Thesis, Chongqing Jiaotong University, Chongqing, China, 2013. [Google Scholar]
- Zhang, Y.; Fang, Z.; Jiang, R.; Xiang, Y.; Long, H.; Lu, J. Static Performance of a Long-Span Concrete Cable-Stayed Bridge Subjected to Multiple-Cable Loss during Construction. J. Bridge Eng. 2020, 25, 04020002. [Google Scholar] [CrossRef] [Scilit]
- Invernizzi, S.; Montagnoli, F.; Carpinteri, A. Very High Cycle Corrosion Fatigue Study of the Collapsed Polcevera Bridge, Italy. J. Bridge Eng. 2022, 27, 04021102. [Google Scholar] [CrossRef] [Scilit]
- Wang, S. Bridge Cable Catches Fire in Hebei, No Injuries Caused. China Daily Global Edition, 6 November 2023.
- Popov, B.N. Corrosion Engineering: Principles and Solved Problems; Elsevier: Amsterdam, The Netherlands, 2025. [Google Scholar]
- Li, S.; Hu, P.; Zhao, X.; Chen, K.; Li, J. Atmospheric Corrosion Performance of Wire Rope Sling in a Sulfur Dioxide-Polluted Environment. Adv. Mech. Eng. 2017, 9, 168781401770747. [Google Scholar] [CrossRef] [Scilit]
- Örnek, C.; Davut, K.; Kocabaş, M.; Bayatlı, A.; Ürgen, M. Understanding Corrosion Morphology of Duplex Stainless Steel Wire in Chloride Electrolyte. Corros. Mater. Degrad. 2021, 2, 397–411. [Google Scholar] [CrossRef] [Scilit]
- Jones, R.H. Stress-Corrosion Cracking: Materials Performance and Evaluation, 2nd ed.; ASM International: Almere, The Netherlands, 2017. [Google Scholar]
- Yao, G.; He, X.; Long, H.; Lu, J.; Wang, Q. Corrosion Damage Evolution Study of the Offshore Cable-Stayed Bridge Anchorage System Based on Accelerated Corrosion Test. J. Mar. Sci. Eng. 2023, 11, 896. [Google Scholar] [CrossRef] [Scilit]
- Li, S.; Xu, Y.; Zhu, S.; Guan, X.; Bao, Y. Probabilistic Deterioration Model of High-Strength Steel Wires and Its Application to Bridge Cables. Struct. Infrastruct. Eng. 2015, 11, 1240–1249. [Google Scholar] [CrossRef] [Scilit]
- Yao, G.; He, X.; Liu, J.; Lu, J.; Guo, Z. Corrosion Fatigue Behavior and Damage Mechanism of the Bridge Cable Structures; IntechOpen: London, UK, 2023. [Google Scholar]
- Liu, Z.; Guo, T.; Ren, H.; Correia, J.; Liu, J.; Feng, M.Q. Corrosion-Fretting Fatigue Analysis of Bridge Cables Based on Multifactor Competition Model and Time-Dependent Reliability. J. Bridge Eng. 2024, 29, 04023106. [Google Scholar] [CrossRef] [Scilit]
- Deng, C.; Ren, Y.; Xu, X.; Fan, Z.; Huang, Q. Real Cable Force Based Time-Varying Degradation and Maintenance Strategy Analysis of Stay Cables. Eng. Struct. 2025, 328, 119730. [Google Scholar] [CrossRef] [Scilit]
- Jiang, C.; Wu, C.; Cai, C.S.; Jiang, X.; Xiong, W. Corrosion Fatigue Analysis of Stay Cables under Combined Loads of Random Traffic and Wind. Eng. Struct. 2020, 206, 110153. [Google Scholar] [CrossRef] [Scilit]
- Yan, C.; Liu, C.; Yu, S. Fatigue Life Prediction of Stay Cables under Vehicle Load Considering Corrosion Variability. Structures 2023, 56, 104879. [Google Scholar] [CrossRef] [Scilit]
- Liu, Z.; Guo, T.; Li, W.; Zhang, Q.; Cheng, B.; Correia, J. Fatigue Behavior and Fracture Surface Analysis of Corroded High-Strength Bridge Cable Wires. Materials 2024, 17, 1724. [Google Scholar] [CrossRef] [Scilit] [PubMed]
- Peng, W.; Fan, W. Experimental Study on Corrosion Development Model and Fatigue Performance of Strand Steel for Coastal Structures. J. Mar. Sci. Eng. 2023, 11, 665. [Google Scholar] [CrossRef] [Scilit]
- Jafari, M.; Hou, F.; Abdelkefi, A. Wind-Induced Vibration of Structural Cables. Nonlinear Dyn. 2020, 100, 351–421. [Google Scholar] [CrossRef] [Scilit]
- Živanović, S. Benchmark Footbridge for Vibration Serviceability Assessment under the Vertical Component of Pedestrian Load. J. Struct. Eng. 2012, 138, 1193–1202. [Google Scholar] [CrossRef] [Scilit]
- Lievens, K.; Lombaert, G.; Nimmen, K.V.; Roeck, G.D.; van den Broeck, P. Robust Vibration Serviceability Assessment of Footbridges Subjected to Pedestrian Excitation: Strategy and Applications. Eng. Struct. 2018, 171, 236–246. [Google Scholar] [CrossRef] [Scilit]
- Lilien, J.L.; da Costa, A.P. Vibration Amplitudes Caused by Parametric Excitation of Cable Stayed Structures. J. Sound Vib. 1994, 174, 69–90. [Google Scholar] [CrossRef] [Scilit]
- Wang, F.; Chen, X.; Xiang, H. Parametric Vibration Model and Response Analysis of Cable–Beam Coupling Under Random Excitation. J. Vib. Eng. Technol. 2023, 11, 2373–2386. [Google Scholar] [CrossRef] [Scilit]
- Wan, H.; Zhang, G.; Ding, Y. A Method for Investigating the Responses of Cable-Stayed Bridge Exposed to Distinctive Tank Truck Fires. Eng. Struct. 2025, 345, 121481. [Google Scholar] [CrossRef] [Scilit]
- Editorial Department of China Journal of Highway and Transport. Review on China’s bridge engineering research: 2024. China J. Highw. Transp. 2024, 37, 1–160. [Google Scholar]
- Wu, Z.; Yang, Y.; Hu, Y.; Liu, F. Response Characteristics of Pre-Stressed Strand Cables Subjected to Low-Velocity Impact: Experiment Test. Buildings 2023, 13, 330. [Google Scholar] [CrossRef] [Scilit]
- Song, Y.; Yeon, J.; Voyiadjis, G. Constitutive Modeling and Numerical Simulations for Dynamic Strain Aging in MMFX Steel at Elevated Temperatures. Int. J. Mech. Sci. 2021, 210, 106743. [Google Scholar] [CrossRef] [Scilit]
- Fereshtehnejad, S. Multi-Hazard Lifecycle Methods for Aging Structures and Infrastructure Systems. Ph.D. Thesis, The Ohio State University, Columbus, OH, USA, 2018. [Google Scholar]
- National Academies of Sciences, Engineering, and Medicine; Transportation Research Board. Inspection and Maintenance of Bridge Stay Cable Systems; National Academies Press: Washington, DC, USA, 2006. [Google Scholar]
- Nikolov, N. Stress and Deformation Analysis of a Twisted Pair of Steel Wires. Appl. Sci. 2025, 15, 9429. [Google Scholar] [CrossRef] [Scilit]
- Horvath, M.; Oberreiter, M.; Stoschka, M. Energy-Based Fatigue Assessment of Defect-Afflicted Cast Steel Components by Means of a Linear-Elastic Approach. Appl. Sci. 2023, 13, 3768. [Google Scholar] [CrossRef] [Scilit]
- Han, H.; Zhu, W.; Yang, X.; Chen, J.; Lv, Z.; Wu, Y.; Zhang, X. Influence of Initial Tension Construction Error of Stay Cables on Asymmetric Curved Cable-Stayed Bridges. Struct. Eng. Int. 2026, 1–14. [Google Scholar] [CrossRef] [Scilit]
- Sun, Z.; Xie, T.; Li, M.; Guo, T. Quasi-Real-Time Prediction and Warning of Stay Cable Vibration Subjected to Typhoon with a Nonlinear Autoregressive Neural Network and KNN. Eng. Struct. 2025, 340, 120661. [Google Scholar] [CrossRef] [Scilit]
- Innocenzi, R.D.; Nicoletti, V.; Arezzo, D.; Carbonari, S.; Gara, F.; Dezi, L. A Good Practice for the Proof Testing of Cable-Stayed Bridges. Appl. Sci. 2022, 12, 3547. [Google Scholar] [CrossRef] [Scilit]
- Zunino, L.; Casas, J.R.; Domaneschi, M. Bridge Damage Assessment under Traffic and Environmental Variability: A Case Study on Yonghe Cable-Stayed Bridge. Eng. Struct. 2025, 343, 120965. [Google Scholar] [CrossRef] [Scilit]
- Ministry of Transport of the People’s Republic of China. Specifications for Wind Resistance Design of Highway Bridges (JTG/T 3360-01); China Communications Press: Beijing, China, 2019.
- Zdravkovich, M.M. Flow Around Circular Cylinders; Oxford University Press: Oxford, UK, 2003. [Google Scholar]
- Simiu, E.; Scanlan, R.H. Wind Effects on Structures: Fundamentals and Applications to Design; American Library Association: Chicago, IL, USA, 1997; Volume 34, pp. 34–3889. [Google Scholar]
- Williams, R.G.; Suaris, W.; Goodman, R.H. A Mathematical Simulation to Synchronization of a Bluff Structure. J. Fluids Struct. 2010, 26, 467–481. [Google Scholar] [CrossRef] [Scilit]
- Shi, X.; Zhu, S. Dynamic Characteristics of Stay Cables with Inerter Dampers. J. Sound Vib. 2018, 423, 287–305. [Google Scholar] [CrossRef] [Scilit]
- Li, Y.; Shen, W.; Zhu, H. Vibration Mitigation of Stay Cables Using Electromagnetic Inertial Mass Dampers: Full-Scale Experiment and Analysis. Eng. Struct. 2019, 200, 109693. [Google Scholar] [CrossRef] [Scilit]
- Sun, L.; Chen, L.; Huang, H. Stay Cable Vibration Mitigation: A Review. Adv. Struct. Eng. 2022, 25, 3368–3404. [Google Scholar] [CrossRef] [Scilit]
- Ministry of Transport of the People’s Republic of China. Code for Design of Highway Cable-Stayed Bridges; China Communications Press: Beijing, China, 2020.
- Chen, Z.Q. Bridge Wind Engineering; China Communications Press: Beijing, China, 2005. [Google Scholar]
- Lu, Y.M. Research on Parametric Vibration and Control of Ultra-Long Stay Cables Based on Finite Element Analysis. Master’s Thesis, Harbin Institute of Technology, Harbin, China, 2021. [Google Scholar]
- Fujino, Y. Vibration, Control and Monitoring of Long-Span Bridges—Recent Research, Developments and Practice in Japan. J. Constr. Steel Res. 2002, 58, 71–97. [Google Scholar] [CrossRef] [Scilit]
- Ministry of Housing and Urban-Rural Development of the People’s Republic of China. Standard for Design of Steel Structures (GB 50017); China Architecture & Building Press: Beijing, China, 2017.

Disclaimer/Publisher’s Note: The statements, opinions and data contained in all publications are solely those of the individual author(s) and contributor(s) and not of MDPI and/or the editor(s). MDPI and/or the editor(s) disclaim responsibility for any injury to people or property resulting from any ideas, methods, instructions or products referred to in the content. |
© 2026 by the authors. Licensee MDPI, Basel, Switzerland. This article is an open access article distributed under the terms and conditions of the Creative Commons Attribution (CC BY) license.