


Abstract
In construction project management, the execution phase relies on deterministic scheduling methods that cannot represent activity-level uncertainty or support quantitative corrective-action testing before physical commitment. This study presents a conceptual framework and proof-of-concept application that addresses this gap by integrating Building Information Modeling (BIM) with the COSMOS Simulator—a construction-specific discrete-event engine benchmarked against industry simulators in prior work. The framework formalizes a semi-automated pipeline from Autodesk Revit through Dynamo BIM to COSMOS via a governed parameter store, converting BIM-derived quantity takeoffs into stochastic simulation inputs. This study makes two contributions: The first is the development of a governed BIM-to-simulation data pipeline in which an identifier-keyed data contract and in-flow validation establish an auditable chain of custody from design element to simulation input. The second is an advancement toward addressing a limitation the engine’s own validation studies identify—execution-phase site–data integration—through a control loop that couples Earned Value Analysis in a 4D BIM environment (Synchro) with iterative COSMOS-based scenario testing, enabling managers to evaluate corrective actions quantitatively before site implementation. Feasibility is demonstrated on an illustrative reinforced concrete building schedule, in which a schedule-performance shortfall triggers the loop and stochastic forecasting exposes an upper-tail completion risk hidden by the deterministic estimate. By establishing a governed pathway from BIM to the previously BIM-isolated COSMOS engine, this work provides a basis from which field-based evaluation of BIM-integrated stochastic project control can proceed.
1. Introduction
1.1. Background and Research Gap
Simulation modeling and Building Information Modeling (BIM) represent significant advancements in the construction industry, providing a risk-free environment for experimentation and system behavior analysis [1,2]. Simulation modeling was first introduced in the construction industry by Halpin in 1977 [3] and is recognized as an analytical tool for optimizing construction time and resources [4], addressing operational challenges [5], and supporting decision-making processes [6]. However, its adoption in routine practice remains limited, being largely restricted to pilot studies or academic settings due to software complexity, lack of integration with existing workflows, and insufficient user training [7].
In contrast, BIM has become mainstream and is considered standard practice in most construction projects [8]. First conceptualized by Nederveen and Tolman in 1992 [9], BIM functions as an integration platform providing comprehensive data on 3D geometry, material specifications, and quantity takeoffs [10,11,12]. It plays a critical role in facilitating collaboration, estimation, coordination, and clash detection [13,14]. Recent studies have explored integrating BIM-derived quantities with process simulation tools to improve construction planning, productivity forecasting, and automated procurement [15,16,17,18,19,20]. However, a critical review of these earlier frameworks reveals two major limitations. First, several rely on deterministic models that do not capture the stochastic nature of actual site operations, and those that do incorporate probabilistic duration modeling remain confined to pre-construction planning (Table 1). Second, these implementations are generally limited to early project stages, lacking automated data pipelines to update simulation parameters dynamically during execution. A significant analytical gap persists: even automated BIM-simulation pipelines are seldom coupled to a governed data contract suitable for stochastic simulation input and are rarely used as proactive control tools to manage real-time construction variability.
To advance construction management toward more integrated and data-driven practices, researchers have introduced the digital twin concept—a dynamic digital representation of physical assets and processes continuously updated using real-time data streams [1,21,22]. While digital twins have seen successful application in sectors like manufacturing, their implementation in construction remains in the early stages. Current applications often emphasize static asset representation—such as optimizing building energy performance [23], visualizing structural behavior [24], or minimizing errors in precast production [25] and enhancing railway system maintenance [26]—rather than enabling dynamic, simulation-driven process control. Furthermore, implementing a fully functional digital twin remains challenging due to fragmented data environments, limited real-time integration, and incompatibility with standard workflows given the open and dynamic nature of construction projects [27,28,29,30,31]. These challenges underscore the need for practical, transitional frameworks that support simulation use during the construction phase in a technically feasible and scalable manner.
This research addresses this deficiency by proposing a construction management framework that supports the broader use of simulation across both the pre-construction and construction phases. The framework leverages the COSMOS Simulator—a domain-specific, discrete-event simulation tool capable of modeling overlapping activities, dynamically progressive tasks, and resource constraints [32,33,34]—and integrates it with standard tools such as Autodesk Revit, Dynamo BIM, and Synchro. This semi-automated workflow facilitates (a) structured data exchange, minimizing manual entry errors via automated extraction scripts; (b) stochastic modeling, propagating operational uncertainty through probabilistic duration modeling; and (c) proactive control, enabling Earned Value Analysis (EVA) and iterative scenario testing for schedule recovery. By demonstrating the applicability of this framework through a practical case study, this work provides a technically feasible path toward digital twin implementation, supporting a transition from static asset representation toward dynamic, simulation-driven process control [35].
1.2. Research Contributions and Scientific Novelty
While the integration of BIM and simulation has been explored in the existing literature, efforts have varied in their treatment of uncertainty and interoperability; several were confined to deterministic scheduling logic, while others relied on complex, rigid data ontologies that hinder industry-wide adoption (Table 1). Furthermore, achieving a fully functional digital twin demands capital-intensive, real-time IoT sensor networks, which presents a significant barrier for many enterprises. To address these methodological and practical gaps, this study makes two principal contributions to construction management research. The first is a governed BIM-to-simulation data pipeline. At the Dynamo–Excel boundary, the framework enforces an identifier-keyed data contract—binding each quantity to its Revit UniqueId, WBS code, and SI unit—together with in-flow validation of field presence, unit conformance, value ranges, and identifier uniqueness before hand-off. This establishes an auditable chain of custody from design element to simulation input. Automated, rule-validated BIM data-extraction pipelines exist for deterministic quantity takeoff and model quality control [36,37] (Section 5.1). This research extends this governance to stochastic simulation inputs for a construction-specific discrete-event engine. The pipeline feeds the construction-specific discrete-event engine (COSMOS), which was benchmarked in prior studies against Arena, MicroCYCLONE, and PROMODEL [32,33,34] and natively models overlapping activities, resource queuing, and crew constraints [32,33,34] that generic engines do not. This study’s second contribution is an execution-phase proactive control loop—advancing toward a limitation the chosen engine’s own validation studies identify—that couples spatially resolved EVA within a 4D BIM environment with iterative COSMOS-based scenario testing. Because the COSMOS engine has been benchmarked against industry simulators but, according to its own validation record, operates in isolation from BIM, this coupling establishes a governed BIM-to-COSMOS pathway not present in the reviewed literature, providing a foundation on which the field-based evaluation of BIM-integrated stochastic control can proceed. Stochastic duration modeling (triangular distributions, Monte Carlo sampling) serves as the uncertainty propagation mechanism within the pipeline. The framework is positioned as a transitional architecture for organizations without IoT sensor infrastructure, enabling simulation-driven project control at a lower implementation cost than full digital twin deployment. Beyond these contributions, the practical example illustrates a structural property of execution-phase forecasting. Because activity duration varies as the reciprocal of productivity and parallel work paths converge at shared milestones, the expected completion date exceeds the deterministic critical-path estimate—a schedule risk that is exposed by re-simulation-based forecasts but concealed by conventional Schedule-Performance-Index extrapolation. This pattern is consistent with the broader finding that deterministic network estimates are systematically optimistic relative to stochastic simulation [38,39], arising in this case specifically from productivity’s reciprocal relationship to duration and the convergence of parallel paths at shared milestones.
To substantiate the gap identified above, Table 1 compares the proposed framework against representative studies that each share at least one of its three defining structural elements: BIM–simulation coupling, stochastic duration modeling, and an execution-phase control loop. These studies were purposively selected to illustrate the pattern of partial coverage across recently published BIM–simulation and digital-twin studies. The pattern indicates that, although each element is individually well-established, none of the reviewed studies integrate all three at the mechanism level required for execution-phase process control. Where the three elements do co-occur at a descriptive level—for example, coupling 4D BIM with Monte Carlo duration sampling and schedule generation [20,40]—data transfer between tools remains manual, uncertainty is propagated by sampling durations over a fixed network rather than by resource-constrained process simulation, and the control step flags at-risk activities rather than evaluating corrective interventions before implementation (Table 1).
Table 1.
Positioning of the proposed framework relative to representative BIM–simulation and BIM–control studies.
This pattern holds for the chosen engine: COSMOS has been validated for construction-specific stochastic process accuracy [32,33,34,44,45,46], yet its validation record does not report coupling to a governed BIM data pipeline or an EVA-based execution-control loop—a gap consistent with the broader pattern evident in Table 1, where no reviewed study combines all three elements. The proposed framework provides this coupling, extending the engine’s applicability to BIM-native execution-phase control.
2. Materials and Methods
2.1. Research Methodology
In this study, a design-oriented research methodology is applied to develop and apply a semi-automated construction management framework. The process is divided into four primary phases.
- (1)
- Conceptual Framework Design
The research began with a synthesis of prior studies on simulation, BIM, and digital twin technologies to define the framework’s scope. The core premise leverages BIM outputs to support process simulation not only during early planning but also during the construction phase as an active project control tool.
- (2)
- System Development
A unified digital workflow was implemented by integrating domain-specific and industry-standard software. These platforms were interconnected to form a streamlined workflow that enables improved construction scheduling, progress monitoring, and the evaluation of alternative corrective plans. The key roles and functions of each platform integrated into this framework are summarized below:
- Autodesk Revit 2024 (Autodesk, Inc., San Francisco, CA, USA), for virtual building model—executing BIM, visualization, and construction material quantity estimation.
- COSMOS Simulator 2026.7 (research software developed by the corresponding author, Thailand), for virtual construction model—facilitating construction process modeling, simulation, optimization, and scheduling.
- Synchro 4D Pro 2023 (Bentley Systems, Inc., Exton, PA, USA), for 3D construction management—managing planning and scheduling, visualization, and construction control.
- Dynamo BIM 2.19.3 (Autodesk, Inc., San Francisco, CA, USA), for linkage—extracting BIM information to spreadsheets, creating custom scripts, and automating workflows.
- Microsoft Excel for Microsoft 365 (Microsoft Corporation, Redmond, WA, USA), for linkage, databases, and analysis—interfacing process information to a virtual construction model, recording and storing information, and analysis.
- (3)
- Case Study Implementation
To demonstrate the applicability of the framework, it was implemented in a case study construction project. This implementation demonstrated the framework’s functions across both the pre-construction and construction phases. During the pre-construction phase, Autodesk Revit was used to extract structural material quantities, which were subsequently transformed into stochastic inputs for the COSMOS Simulator to allocate resources and establish a baseline schedule. During the execution phase, the system monitored actual progress and evaluated project status using EVA within Synchro. Furthermore, when schedule deviations were detected, the COSMOS Simulator was employed to iteratively test and analyze corrective measures using updated site information. The implementation steps and framework architecture are presented in Section 3.
- (4)
- Comparative Evaluation with Conventional Construction Management Approach:
To assess the framework’s practical applicability, a comparative evaluation against conventional construction management practices was designed. The following key dimensions were established as evaluation criteria: data integration, workflow automation, schedule planning and optimization, monitoring and control, and scalability and usability. A detailed discussion of these outcomes is presented in Section 4 and Section 5.
2.2. Validation and Practical Applicability of the COSMOS Simulator
The simulation engine used in this study, the COSMOS Simulator, has been independently validated across various construction scenarios and benchmarked against established industry-standard simulation software [32,34]. Previous comparative analyses have consistently demonstrated its high degree of accuracy.
- Comparison with Arena: In simulations involving concrete placement and tunnel excavation earthmoving operations, the results from COSMOS demonstrated strong consistency with those from Arena. Statistical hypothesis testing confirmed no significant differences in key performance metrics, and in the case of tunnel excavation, the total process duration from both simulators matched precisely [44].
- Comparison with MicroCYCLONE: When evaluating an Auger Horizontal Earth-Boring (HEB) process, COSMOS was tested against the domain-specific MicroCYCLONE software. The deterministic simulations yielded identical completion times (1107 min), while stochastic simulations across 40 independent runs produced statistically equivalent mean durations (1096 min for COSMOS versus 1092 min for MicroCYCLONE) [34].
- Comparison with PROMODEL: In modeling complex concreting and waste-handling operations, COSMOS exhibited a minimal deviation of only 0.6% in resource utilization rates when compared to PROMODEL. By incorporating advanced COSMOS-specific resource allocation elements—such as headers, buffers, and end arcs—this deviation was further reduced to just 0.1% [34].
Beyond theoretical validation, the practical applicability of the COSMOS Simulator has been demonstrated in complex real-world projects [45,46]. For instance, it was successfully deployed to optimize supply train operations in a 5.5 km tunnel-boring project, effectively preventing deadlocks and determining the optimal number of trains based on track lengths [45]. Additionally, it was used to optimize resource management in a concrete-placing operation for a gas separation plant, establishing an optimal balance between ready-mixed concrete trucks and daily placement volumes to eliminate inefficiencies [46].
These validations confirm that the COSMOS Simulator not only effectively replicates the accuracy of both general-purpose (e.g., Arena, PROMODEL) and domain-specific (e.g., MicroCYCLONE) tools but also provides an intuitive, Petri Net-based methodology tailored specifically to capturing the dynamic complexities of construction workflows.
The engine’s own validation record identifies the incorporation of real-time site data as an opportunity for development [32]. The present framework advances in this direction through a structured, threshold-triggered feedback mechanism, which is detailed in Section 3.1.3 and Section 3.1.4.
3. Proposed Framework and Illustrative Application
3.1. Proposed Framework
The proposed framework is structured around three core operational pillars: (1) stochastic planning and scheduling, which leverages BIM data and discrete-event simulation to generate resource-feasible project baselines; (2) continuous monitoring and evaluation, which uses EVA and simulation-based forecasting to track actual site performance; and (3) proactive construction control, where the system assesses deviations and formulates corrective actions through scenario modeling. The schematic illustration of the system applications and the system architecture are illustrated in Figure 1 and Figure 2, respectively.
Figure 1.
Schematic illustration of the system’s applications.
Figure 2.
System architecture of the proposed framework.
These three pillars are realized through four sequential sections: formation and the project baseline facilitate delivering stochastic planning and scheduling (Pillar 1); project monitoring and evaluation enable continuous monitoring (Pillar 2); and project control consists of proactive construction control (Pillar 3).
3.1.1. Formation
This section reports system requirements and the data required for subsequent analyses. It comprises the following subsections: data gathering, building model development, and construction model creation.
Subsection 1.1: Data gathering—the system requirements and data needed for subsequent analyses are specified. It involves creating Dynamo BIM and Microsoft Excel files in the designated formats and collecting project information to create building and construction models, as well as the necessary database. The database encompasses information such as construction productivity, manpower, and equipment costs.
Subsection 1.2: Building model development—a virtual model of the building is developed within the platform. This process uses the BIM platform, Autodesk Revit, which allows for the integration of BIM features into the system. The resulting building model serves as a digital representation of the physical building, providing information such as the quantity of construction materials and 3D visualization.
Subsection 1.3: Construction model creation—a virtual model of the construction operations for the building is generated. This construction model is based on simulation modeling and facilitates network analysis features within the system. Incorporating relevant information into the construction model contributes to the analysis and design of construction processes using the simulation platform COSMOS Simulator.
This section describes how the system is established by integrating building and construction models developed in previous subsections. This integration is accomplished through linkage platforms, namely Dynamo BIM and Microsoft Excel, enabling the exchange of information between them. Dynamo BIM extracts information, such as construction materials, from the building model, while Microsoft Excel uses these data to analyze inputs for the construction model, including productivity rates. The resulting model is the foundation for the subsequent analyses and investigations described in the following sections.
3.1.2. Project Baseline
The purpose of the project baseline is to develop a resource-feasible schedule for the construction project in terms of cost and time. The necessary analysis can be conducted using the information collected in the previous stage. The outcomes serve as the construction project’s foundation, encompassing the following components: assessing, simulating, integrating, and the baseline.
Figure 2 traces the data flow across these four sections. At the formation stage, quantities extracted from the Autodesk Revit building model pass through Dynamo BIM and Microsoft Excel into the COSMOS construction model. At the project baseline stage, COSMOS converts these quantities into stochastic activity durations and a resource-feasible schedule, which is combined with cost data in Synchro to form the 5D baseline. During project monitoring and evaluation, actual progress is captured in Microsoft Excel, evaluated against the baseline through EVA in Synchro, and fed back to update the models (twinning). Finally, in the project control stage, detected deviations trigger re-simulation in COSMOS to test corrective scenarios before the schedule is revised. The boxes in Figure 2 labeled “Subsection X.Y” correspond to the numbered subsections described below.
Subsection 2.1: Assessing—the workload and duration of each construction activity are evaluated. The workload is determined based on the required construction materials, extracted using the BIM features within the building model. The duration of construction activities is calculated by considering the workload and productivity of the designated construction resources. These parameters are critical for construction planning and scheduling and are executed using simulation modeling methods.
Subsection 2.2: Simulating—simulations of the construction operations are run to determine improved resource allocation during the construction phase. These resources are then used to develop the construction schedule and baseline budget. The simulation takes place within the construction model, using simulation modeling software.
Subsection 2.3: Integrating—the BIM model is imported into Synchro to create a 5D BIM model incorporating both time and cost information. The time information is derived from the results of the construction simulation model, while cost information is obtained from collected data. This model serves as the baseline BIM model during project execution and control.
Subsection 2.4: Baselines—the project cost and construction schedule baselines are developed. The construction schedule baseline is based on the results obtained from the simulation. The project cost baseline encompasses the cost of construction materials and other construction resources. The cost of construction materials is estimated based on the quantity of materials extracted from the building model. The cost of other construction resources is evaluated using the resource allocation determined through simulation modeling.
3.1.3. Project Monitoring and Evaluation
Project monitoring and evaluation comprises the approach to monitoring and evaluating the construction project using the system. This process is continuous throughout the construction period and comprises the following: monitoring, evaluating, and twinning.
Subsection 3.1: Monitoring—actual construction performance data are gathered during the construction period. These data are recorded and stored in the form of a construction progress report, which contains essential information for updating the model and conducting further analysis. Further analysis includes determining time and cost deviation and evaluating the project status.
Subsection 3.2: Evaluating—the project status is evaluated against the baseline by applying Earned Value Analysis. This evaluation compares the construction progress to the baseline and identifies any deviations. The result is then applied for project control purposes in the subsequent section.
Subsection 3.3: Twinning—a connection between the construction project and its digital twin model is established by updating the building and construction models with actual progress information. This connection is made possible using linkage platforms, namely Dynamo BIM and Microsoft Excel. The update reflects the latest status of the construction project, enabling evaluation and control of the project using the system features.
In summary, the process begins with collecting construction data, such as the number of installed piles, measuring the productivity rates, evaluating project progress, and updating the digital twin models with this information.
3.1.4. Project Control
This section describes the approach to controlling the construction project. Project control is conducted continuously throughout the construction period and comprises the following aspects: determining countermeasures for deviations and estimating the impacts.
Subsection 4.1: Countermeasure determination—a simulation modeling approach is used to determine appropriate actions in response to any deviation during construction. By using the COSMOS Simulator and input data, such as construction progress and resource productivity rates, corrective and preventive plans can be determined. This subsection maintains project progress by ensuring deviations are addressed promptly.
Subsection 4.2: Impact estimation—cost and schedule impact assessments are used to gauge the potential outcomes of implementing the identified countermeasures. This is achieved by comparing the cost and schedule baselines with the actual figures. Based on the outcome of this evaluation, adjustments to the project activities, including task dependencies, resource allocation, and timeframes, may be necessary.
3.2. Illustrative Application
The applicability of this framework is demonstrated through an illustrative case study involving a three-story reinforced concrete building project, as shown in Figure 3. The implementation is executed and detailed across three management stages: baseline scheduling, progress monitoring, and proactive control.
Figure 3.
Illustration of the building model in Autodesk Revit.
The illustrative application concerns a representative three-story reinforced concrete building with a gross floor area of approximately 1800 m2, initiated under a traditional design–bid–build arrangement, with a baseline schedule of 227 working days and an assumed BIM maturity of Level 2. The building is of low structural complexity on a representative urban site, with an indicative contract value of approximately THB 12.04 million (about USD 0.35 million) and stakeholders comprising the owner, the main contractor, and a design consultant. The illustrative implementation spans the planned 227-working-day schedule. The software environment comprised Autodesk Revit 2024, Dynamo 2.19.3, Microsoft Excel (Microsoft 365), the COSMOS Simulator 2026.7, and Synchro 4D Pro 2023. These are representative parameters selected to demonstrate the workflow rather than measurements from a monitored construction project.
3.2.1. Formation and Baseline Scheduling (Pre-Construction Phase)
The framework begins with establishing a quantitative link between the building design and the construction process. The implementation of this process involves three main steps.
- Creating the building and construction models
Autodesk Revit and the COSMOS Simulator were used to develop the building and construction models, respectively. The building model was developed in compliance with the project case study, a three-story reinforced concrete building project, as illustrated in Figure 3. Structural components, such as reinforced concrete columns, beams, and slabs, were modeled using Revit’s structural tools. To ensure that the model was suitable for accurate quantity takeoff, which is later used to derive construction durations, Revit’s basic visualization tools were used to preliminarily evaluate modeling accuracy. The model underwent standard BIM quality checks—geometric review, clash detection, and categorical consistency verification—before quantity extraction, ensuring the source data feeding the governed pipeline were complete and coordinated. Later, information in the model, including the bill of materials, is extracted for construction scheduling and resource optimization. Filters and sorting functions in Autodesk Revit were applied to organize the data by categories like floors or building sections. The schedules were then exported to Microsoft Excel for easier sharing and integration into construction planning workflows. The Revit building model serves as a reference for developing the construction model using the COSMOS Simulator, ensuring alignment between design and execution.
The project construction model was developed using the COSMOS Simulator, based on typical building construction sequences. The development process followed three key steps.
- (1)
- Activity decomposition—the construction process was divided into discrete activities: site preparation, excavation, foundation work, and column and beam construction.
- (2)
- Sequencing—logical sequences and dependencies between tasks were defined to reflect real-world construction workflows. This ensured that each task was accurately linked to its predecessors and successors, creating a coherent and realistic sequence of activities.
- (3)
- Duration definition—the duration of each construction activity was determined using quantity data extracted from Autodesk Revit (e.g., concrete volume, rebar weight, and formwork area) combined with predefined productivity rates. Durations were modeled as either deterministic values or probabilistic distributions, depending on the nature of the productivity inputs.
The calculated activity durations were then entered into the COSMOS Simulator to define the schedule logic, enabling dynamic scenario-based analysis beyond the capabilities of conventional static scheduling methods. This process established a quantitative link between the building and construction models, ensuring alignment between design data and simulation inputs. The construction model was then used to perform construction scheduling and resource optimization analysis within the COSMOS Simulator.
To accommodate varying levels of analytical detail, the simulation model is structured hierarchically. As illustrated in Figure 4, the architecture consists of two interrelated layers: a macro-level outlining the overall construction phases, and a micro-level containing sub-models for specific tasks. To demonstrate this micro-level logic, Figure 5 concentrates on the foundation work simulation, detailing the discrete-event interactions and resource constraints within that specific operational segment. In the COSMOS notation, rectangles denote work tasks, circles denote queues of resources or work units, and arrows denote the direction of flow between elements; filled circles indicate queues that are initialized with available resources. Colors are used for visual grouping only and carry no additional meaning.
Figure 4.
Illustration of the construction model simplified from the COSMOS Simulator.
Figure 5.
Foundation work simulation model in the COSMOS Simulator, a part of the construction model.
- 2.
- Determining the construction activity duration
The duration of construction activities was calculated based on the quantity of construction materials and the assumption of productivity rates. Material quantities were extracted from Autodesk Revit and exported to Microsoft Excel in a designated format using the ‘Export-to-Excel’ function in Dynamo BIM. Figure 6a illustrates a sample script used for this purpose.
Figure 6.
Example Dynamo BIM script. (a) Example of a script for exporting data from Dynamo BIM to Microsoft Excel. (b) Example of a script for organizing data in preparation for exporting from Dynamo BIM to Microsoft Excel.
Dynamo BIM was also used to organize the data prior to its extraction and import into Microsoft Excel. Figure 6b provides an example of a script and a brief explanation for organizing the material quantity data of the foundation. The process involves several key steps: first, the relevant building structure category (e.g., structural foundations) is selected. Next, all elements within the selected category are filtered based on specific parameters, such as material type or element name. These filtered elements are then categorized according to their type, ensuring a structured data format. Finally, the organized data is prepared for export and linked to an external file, such as Microsoft Excel, for further analysis or reporting.
Activity durations were obtained by transforming BIM-derived quantities into time through productivity-based stochastic modeling. Let Q denote the activity quantity extracted from BIM, assumed to be deterministic, and let productivity P be modeled as a random variable to represent operational uncertainty. Under a deterministic assumption, the activity duration is given by D = Q/P. For example, an excavation activity with Q = 100 m3 and a fixed productivity of P = 10 m3/h yields a deterministic duration of D = 10.00 h.
To explicitly account for uncertainty in productivity arising from variability in equipment performance, site conditions, and operational practices, productivity was modeled using a triangular probability distribution bounded by 8 and 12 m3/h, with a mode of 10 m3/h. The parameters of this distribution are representative values drawn from published work-rate ranges and expert judgement. The triangular distribution was selected for three reasons. First, it is bounded by finite minimum and maximum values, which suits construction productivity, where physically plausible rates fall within a limited range rather than extending to the unbounded tails of distributions such as the normal. Second, it is defined by only three parameters (minimum, mode, and maximum) that can be elicited directly from expert judgement and field records without the larger datasets required to fit more complex distributions. Third, it is a common choice in construction process simulation for representing activity durations when empirical data are limited. As the distribution parameters are illustrative values elicited from expert judgement and published work-rate ranges rather than fitted to a project-specific productivity dataset, no formal goodness-of-fit test was performed; statistical calibration and comparison against alternative distributions (such as the PERT-beta or lognormal) using field-observed productivity records are avenues for future research. Given the nonlinear relationship between productivity and duration, uncertainty propagation was performed using Monte Carlo sampling. In each trial, a productivity value P was randomly sampled from the specified distribution, and the corresponding activity duration was computed as D = Q/P. For the same Q = 100 m3, a sampled productivity of P = 8 m3/h yields D = 100/8 = 12.50 h; P = 10 m3/h yields D = 100/10 = 10.00 h; and P = 12 m3/h yields D = 100/12 ≈ 8.33 h.
Repeating this sampling–transformation process over 1000 Monte Carlo trials yields a set of duration realizations {D}, from which an empirical probability density function (PDF) of activity duration is numerically approximated. The number of iterations was fixed at 1000, with a fixed random seed (42) so that the sampling procedure is reproducible. This sample size is sufficient for the empirical duration distribution of a bounded triangular input to stabilize, and convergence was checked by confirming that the estimated mean and dispersion remained stable under repeated sampling and did not change materially when the number of iterations was increased further. These values illustrate that the uncertainty-propagation mechanism operates as intended and do not constitute empirical validation of the framework. The Monte Carlo procedure used direct random sampling without variance-reduction techniques; each 1000-iteration run was completed in under one second on a standard desktop workstation, and 95% confidence intervals for the mean activity duration were obtained directly from the empirical realizations. This procedure propagates productivity uncertainty into stochastic activity durations suitable as inputs for discrete-event simulation. The resulting duration distributions capture variability that is typically neglected in conventional deterministic estimation and static scheduling approaches. This enhanced representation enables more realistic simulation-based analysis of construction processes and resource utilization.
The COSMOS Simulator was used for implementation, as it was specifically developed to support dynamic time modeling and stochastic inputs. The software allows users to define activity durations using standard probability distributions rather than single static values. In this study, the parameters of the derived duration PDFs (e.g., the calculated minimum, mode, and maximum duration values) were input directly into the duration properties of the corresponding activities within the COSMOS interface. During the simulation run, the engine dynamically samples a duration value from these specified distributions for each task instance, ensuring that the process variability is accurately captured in the schedule analysis.
This methodology formalizes the transformation of static BIM-based quantity takeoffs and empirical productivity data into dynamic, probabilistic simulation inputs. By capturing complex activity interactions, resource constraints, and process variabilities that are typically oversimplified in deterministic methods, the resulting duration models provide a foundation for subsequent construction process design and resource optimization.
- 3.
- Developing the construction plan and schedule.
The construction plan and schedule were derived from the COSMOS Simulator by executing discrete-event simulation scenarios to dynamically model activity interactions and resource constraints. In this context, optimization refers to the iterative adjustment of construction sequences and resource allocations to achieve improved operational efficiency under specific project conditions, rather than formal mathematical optimization seeking an absolute optimum [12,13,14]. This simulation-based analysis ultimately generated a resource-feasible baseline encompassing both the construction cost and timeline. Readers interested in the detailed methodologies and algorithms underlying these optimization techniques may refer to these and related works for further understanding.
Subsequently, the optimized construction schedule was exported to Microsoft Excel for integration with the Revit building model (3D model). Synchro was then used to link the two: the Revit building model was imported, the Microsoft Excel schedule was loaded, and activities were mapped to corresponding 3D elements to produce a 4D construction sequence. Synchro automatically generated a time-based simulation of the construction sequence by assigning start and end dates to these components, as illustrated in Figure 7.
Figure 7.
Screenshot of the integration of construction schedule and 3D objects in Synchro.
3.2.2. Project Monitoring and Evaluation (Construction Phase)
Construction progress monitoring and evaluation were conducted continuously during the construction phase. The main steps are described below.
- Monitoring construction progress
Project performance data were monitored and recorded in a designated Microsoft Excel template throughout the construction period. The recorded data included actual work progress, incurred costs, and realized productivity rates. This empirical data served as the basis for assessing project status and forecasting future progress.
- 2.
- Determining project progress and status
Synchro was employed to evaluate the project’s performance and status through the EVA technique, using an updated construction schedule and progress data imported from Microsoft Excel, as illustrated in Figure 8. The evaluation process commenced with the importation of this actualized data into Synchro. Specific schedule activities were then mapped to their corresponding 3D model components to ensure a clear visual representation of the construction sequence. Synchro’s EVA function was used to compare planned versus actual progress, automatically computing key performance indicators such as Schedule Performance Index (SPI) and Cost Performance Index (CPI).
Figure 8.
Screenshot of the EVA function in Synchro.
- 3.
- Forecasting project status
The COSMOS Simulator was employed to forecast the project’s future performance based on revised assumptions, including actualized productivity rates, equipment and labor availability, and material supply. The forecasting process involved integrating updated project data into the construction model and recalibrating key simulation parameters such as task durations, resource constraints, and potential risks. Probabilistic iterations were executed to evaluate various scenarios, dynamically adjusting for changes in resource availability or task dependencies. The simulation outputs included detailed performance forecasts, identifying potential delays, bottlenecks, or inefficiencies. These insights were subsequently used to formulate control plans, incorporating corrective or preventive measures to safeguard project objectives.
3.2.3. Proactive Construction Control
Construction control protocols were implemented throughout the construction period to maintain adherence to the project baseline. The main steps are described below.
The proactive control loop operates through four structured steps. Step 1—trigger: EVA results from Synchro are reviewed at a weekly control meeting. If the SPI falls below a defined threshold (in this application, SPI < 0.90) or a discrete event such as equipment failure is recorded, the loop is activated. Step 2—re-simulation: updated productivity data, resource availability, and progress are entered into COSMOS, which is re-run to produce a revised schedule forecast. Step 3—scenario evaluation: Alternative corrective strategies are modeled as named scenarios, each with explicit assumptions and quantitative outputs (revised completion times, resource utilization, queue times). Step 4—decision and update: The preferred scenario is selected and the revised schedule is exported to Synchro, updating the 4D model and EVA baseline for the next cycle. This structure differs from conventional Critical Path Method (CPM)-based control, where corrective actions are assessed qualitatively without resource-feasibility checking.
- Identifying countermeasures for deviations
In a scenario involving equipment failure, the simulator assessed options such as rescheduling less equipment-dependent tasks to earlier dates, reallocating available equipment to critical tasks, or prioritizing rapid repairs and sourcing rental equipment—quantifying each option’s impact on project timelines and resource utilization to identify the most effective countermeasure.
- 2.
- Estimating the impacts and rescheduling
After identifying countermeasures, Microsoft Excel was used to quantify their impacts on the construction resources and project timeline. The process began with updating the Excel sheets to reflect the adjusted resource allocations, task durations, and sequence changes derived from the COSMOS Simulator. These updates were analyzed to evaluate potential consequences, including cost implications and schedule revisions.
Upon quantification, the revised schedule was developed in Microsoft Excel, including any necessary adjustments to task start and end dates. This revised schedule was then exported to Synchro, where the integration of 3D model data with the updated schedule provided enhanced project visibility. Synchro allowed the team to visualize the revised construction sequence and ensure that the adjustments aligned with overall project objectives. The synergistic application of COSMOS Simulator, Microsoft Excel, and Synchro established a structured control mechanism, facilitating proactive decision-making and mitigating potential delays.
3.2.4. Platform Interconnection and Data Lineage
To operationalize the framework, data exchange across the selected platforms follows the pipeline detailed in Section 3.2.1, Section 3.2.2 and Section 3.2.3 (Table 2). Data transfer across the pipeline is semi-automated: extraction from Autodesk Revit through Dynamo BIM to Microsoft Excel is script-driven and completes within seconds for the case-study model, whereas the transfer of Excel-based inputs into the COSMOS Simulator and the mapping of activities to 3D elements in Synchro remain manual by design to preserve engineer oversight. This division keeps the automated boundaries fast and auditable while confining manual effort to steps that benefit from expert judgement. Table 2 summarizes the information transferred during this process.
Table 2.
Summary of data transfer between platforms.
4. Results
4.1. Analytical Evaluation of Data Integration Capabilities
The implemented data pipeline established an auditable progression from design elements to simulation inputs and 4D control views. At the Dynamo–Excel boundary, a compact data contract was enforced comprising Revit UniqueId, Category, Type/Family, Quantity, SI Unit, Level, and the schedule-facing work breakdown structure (WBS) Code (with a project-specific zone shared parameter where applicable). Upstream data normalization in Dynamo BIM filtered categories, converted Autodesk Revit internal units to SI, and executed validity checks prior to hand-off. By using Microsoft Excel as a versioned parameter store, edits to productivities, calendars, and progress entries were concentrated while preserving provenance through simple check-in/out procedures.
In practice, these protocols eliminated post hoc reconciliation across discipline spreadsheets. Changes to structural volumes or reinforcement quantities could be traced unambiguously to the corresponding activities and costs.
4.2. Workflow Automation and Quality Assurance
Automation was applied at the edges of familiar tools rather than through bespoke middleware. Dynamo BIM produced standardized, structured exports that matched the predefined data schema; the Microsoft Excel template enforced required columns and embedded validation logic (field presence, unit conformance, plausible value ranges, and identifier uniqueness). Because checks occur during preparation, not as a separate audit gate, issues are corrected at the source and propagated consistently downstream.
Two qualitative effects were observed in the case study: (i) repeatability, as different team members using the same script/template obtained identically shaped inputs for the simulation and 4D stages; and (ii) dependable hand-offs, where downstream tools received validated inputs, minimizing rework. Manual overrides remain possible but are confined to the parameter store and are versioned, sustaining transparency required for project controls and later review.
4.3. Overcoming Deterministic Constraints Through Stochastic Simulation
The COSMOS Simulator provided a domain-specific, discrete-event representation of construction operations, capturing sequences and overlaps, queuing effects, and resource constraints. Operational constraints, such as formwork reuse cycles, crane time windows, crew calendars, and temporary capacity, were encoded through explicit model logic or resource calendars. Within this structured environment, the project team explored operational strategies typical of weekly control meetings.
Each scenario produced a feasible alternative plan (revised start/finish dates, resource usage, and queue times) grounded in specific assumptions and constraints that justified it. Capturing these runs as a scenario playbook converted ad-hoc discussion into structured, evidence-based decision-making. Each scenario produced an output that the project team could accept, reject, or modify before any physical commitment was made. A practical finding regarding granularity was that keeping activities and resources at a level sufficient to influence decisions—without inducing model complexity that slows updating—is essential for sustaining the control loop across the project duration. This balance determines whether simulation remains an active control tool or becomes a planning-only artifact.
4.4. Monitoring and Proactive Control Outcomes
The application of EVA within the 4D BIM environment (Synchro) established a common operating picture for project control meetings. Rather than discussing aggregate percentages, deviations in schedule and cost (reflected in SPI and CPI metrics) were localized to specific zones or components directly on the linked model elements. This spatial visualization reduced ambiguity when selecting corrective actions.
Furthermore, the resulting control loop—comprising progress capture, 4D EV review, simulation-based scenario testing in COSMOS, and revised sequence publication—provided a structured path from signal to action. Decisions were recorded alongside the affected elements, improving accountability and simplifying hand-offs to site teams. This arrangement aligns with the framework’s emphasis on semi-automated, practical workflows and leverages tools already used in standard practice.
To illustrate the operation of the proactive control loop, a worked example is presented. Table 3 reports an Earned Value snapshot—Planned Value (PV), Earned Value (EV), and Actual Cost (AC)—at three successive data dates. At Week 12, the Schedule Performance Index falls to 0.85, below the 0.90 threshold, triggering the loop. At each data date, observed productivity rates from site progress are fed back into the COSMOS model, and the remaining activities are re-simulated over 1000 runs so that the forecast reflects actual performance rather than the original plan. Re-simulation in COSMOS produces the forecast in Table 4: the deterministic estimate projects completion at Day 259, whereas the stochastic forecast (1000 Monte Carlo runs) yields a P50 of Day 264 and a P80 of Day 271, exposing roughly fifteen days of tail risk that the deterministic estimate conceals. Five corrective scenarios are then compared before site commitment. These values are illustrative and demonstrate that the loop produces decision-relevant quantitative outputs.
Table 3.
Illustrative Earned Value snapshot at three data dates (THB million).
Table 4.
Illustrative forecast and corrective-scenario comparison at Week 12 (baseline = Day 227).
The baseline schedule is 227 working days, making the Day-259 estimate—a 32-day slip (14% overrun)—of the same order as the 15% schedule-performance variance, which is less pessimistic than a naive SPI extrapolation (approximately Day 267) because only the affected remaining activities carry the reduced productivity. The stochastic median exceeds the deterministic estimate, mainly because parallel activity paths converging at shared milestones make the expected completion date later than the deterministic critical path (schedule merge bias). Separately, the right skew of the quantity-to-duration relationship (duration varies as the reciprocal of productivity) widens the upper tail.
The Deterministic row shows single-value point estimates, whereas scenario rows S0–S3 report the stochastic median (P50). Added cost combines the prolongation cost (proportional to delay) and intervention cost (crews, equipment, and shift premiums); under S0, the cost is entirely due to prolongation, whereas active scenarios trade intervention cost for reduced prolongation. The Deterministic forecast is not assigned a cost, as it represents a projection rather than a corrective decision. Costs are reported in THB; at the exchange rate used in Section 3.2 (THB 12.04 million ≈ USD 0.35 million), the added-cost range corresponds to approximately USD 0.007–0.055 million.
The four scenarios allow a manager to weigh time recovery against cost—S1 recovers eleven days for THB 0.24 million, whereas S2 recovers nineteen days for THB 0.64 million. Each scenario is a computed catch-up strategy spanning the full spectrum from accepting delay to full recovery. Full recovery to the baseline is achievable (S4, Day 227) but requires roughly three times the intervention cost of S2, achieved with multi-shift working and additional crews—an intensity that also elevates coordination and quality risk. The manager therefore selects S2 as the economically rational choice: eliminating the final eighteen days entirely would cost about five times the delay’s own daily rate, so a bounded overrun is preferable to full crash acceleration. Presenting this explicit trade-off across a full range of catch-up options is the framework’s core execution-phase contribution. This capacity to evaluate corrective actions quantitatively prior to physical execution is not possible with deterministic CPM control and constitutes the framework’s principal execution-phase contribution.
To assess how the forecast depends on the assumed level of productivity uncertainty, the triangular spread was varied while holding the mode constant; the results are summarized in Table 5.
Table 5.
Illustrative sensitivity of the week-12 forecast to the productivity-uncertainty assumption (baseline = day 227).
The median forecast (P50 ≈ Day 264) is essentially insensitive to the assumed spread, whereas the upper-tail estimates grow markedly as productivity uncertainty widens—the P80 buffer above the median increases from two to ten days. The framework’s central estimate is therefore robust, while the schedule-risk exposure it quantifies is sensitive precisely where risk-based control decisions are made. A deterministic estimate, which ignores this spread, would understate that exposure under all three assumptions. Together, Table 3 (detection), Table 4 (response), and Table 5 (robustness) trace the control loop from deviation to corrective decision.
5. Discussion
5.1. Comparative Analysis with Recent BIM Integrations in the Built Environment
To position the proposed integrated BIM-simulation framework within the current academic landscape, it is essential to contextualize it within recent advancements in BIM applications. Recent scholarship demonstrates a marked shift from standalone BIM utilization toward integrated, data-driven ecosystems. For instance, recent studies report successful integration of BIM with Bayesian Belief Networks (BBNs) for probabilistic cash flow forecasting [41], linking of BIM with Internet of Things (IoT) and logistic chains for real-time material management [47,48], and the combination of BIM with 3D laser scanning for dynamic as-built documentation [49]. While these integrations effectively address specific financial, logistical, and spatial monitoring challenges, only Madihi et al. [41] incorporated probabilistic modeling—oriented toward cost rather than execution-phase schedule control—while the remainder of researchers relied on deterministic treatment of the scheduling dimension. The framework proposed in this study directly addresses this methodological gap by focusing on the operational uncertainty of construction activities. By coupling BIM with the COSMOS Simulator, the transition from static 4D BIM is advanced toward dynamic, stochastic schedule adjustment, enabling project managers to account for inherent productivity variabilities. A related but distinct research direction has automated the validation of BIM-extracted data itself: Dynamo-based systems have been developed to check quantity-takeoff accuracy against design intent [36] and to verify parameter completeness and naming consistency across disciplines against BIM Execution Plan requirements [37], each reporting substantial reductions in data inconsistencies on real construction projects. These systems establish that automated, rule-based validation of BIM data is achievable at scale; however, their outputs remain deterministic quality control reports rather than governed inputs to stochastic process simulation, leaving the specific coupling addressed in this study unexplored.
Furthermore, a recurring challenge highlighted in the recent literature is the heterogeneous nature of BIM data and the complexities of cross-model interoperability. Some studies have emphasized the need for robust semantic mapping and standardized workflows to enable scalable data integration across disciplines [42], while others have explored collaborative process modeling (such as exCPM) to manage iterative BIM-based coordination tasks [43]. The proposed framework aligns with these efforts by formalizing a lightweight, semi-automated data pipeline (from Autodesk Revit through Dynamo BIM and Microsoft Excel to the COSMOS Simulator). Rather than relying on computationally heavy ontologies or complex application programming interfaces (APIs) that often hinder industry adoption [42,47], this study adopts a pragmatic, rule-guided parameter extraction method. This approach ensures transparent data lineage and replication, bridging the interoperability gap for small- to medium-sized enterprises (SMEs) without requiring prohibitive software investments.
5.2. Scalability and Usability
The framework proposed in this study assembles widely used tools via scripts and templates rather than bespoke middleware, enabling implementation without custom development and supporting modular, staged adoption across project types and sizes. In practice, adoption proceeds from data readiness (agree on a data contract, export Autodesk Revit data via Dynamo, and maintain a versioned Microsoft Excel parameter store for productivities, calendars, costs, and progress) to introduce 4D EV views in Synchro for spatially explicit control meetings, finally incorporating COSMOS scenarios with a curated scenario playbook once hand-offs are stable.
Sustained use relies on lightweight governance, with alignment of the level of detail and identifiers with the WBS and version scripts and the parameter store and the assignment of stewardship roles—a data steward (schema/IDs), a model steward (COSMOS level of detail/constraints/calendars), and a meeting owner (4D-EV storyboard and decision log).
Discipline interfaces are defined explicitly (e.g., reinforcement via dedicated rebar schedules/parameters with documented weight conversions). COSMOS input/output remains manual/semi-manual by design to preserve transparency and engineer control, and the approach presumes routine BIM access and agreement on the data contract; where inputs are fragmented, an initial harmonization step is required.
Overall, scalability is achieved by organizing process flow and accountability between existing tools, ensuring simulation remains an active component “in the loop” without disrupting established software ecosystems or meeting cadence.
5.3. Comparison with Current Practices
To highlight the capability differences concisely, the proposed framework is compared against baseline practices across three key dimensions, as summarized in Table 6.
Table 6.
Process mapping (baseline vs. framework).
These granular comparisons collectively reflect three structural gaps in baseline practice—fragmented data coherence, implicit assumptions and decision logic, and the absence of simulation-driven behavioral analysis—each addressed by the corresponding element of the proposed framework.
Unlike deterministic CPMs, the proposed framework enables the use of stochastic activity durations, generating schedule behaviors that reflect productivity variability. This capability supports a recurring monitoring-and-control loop, where deviations are not merely tracked but analyzed via simulation to evaluate the efficacy of corrective or preventive actions prior to implementation. To isolate the contribution of stochastic modeling, the worked example (Table 4) is examined under two interpretations of the same activity network. A deterministic interpretation—using single-point durations, as conventional CPM tools such as Primavera P6 or Microsoft Project produce in their default configuration—yields a single completion estimate (Day 259) with no schedule-risk information. The stochastic forecast, by contrast, exposes a P80 of Day 271—twelve days beyond the single-point estimate—while additionally enforcing resource feasibility and enabling quantified corrective-action testing.
5.4. Lessons Learned from Framework Implementation
These results (Section 4.1, Section 4.2, Section 4.3 and Section 4.4) carry three practical implications: the governed data pipeline reduces reconciliation effort, the domain-specific engine supports resource-feasible planning beyond precedence logic, and the control loop enables evaluation of corrective responses before implementation (discussed below). Two of the implementation lessons that emerged that were not anticipated at the design stage. First, the value of the governance layer became apparent specifically at the Dynamo–Excel boundary, where unvalidated identifier mismatches—rather than simulation logic—were the dominant source of rework; enforcing the data contract upstream removed a class of errors that would otherwise surface only late in the pipeline. Second, the semi-automated design proved a deliberate strength rather than a shortcoming: retaining manual checkpoints at model hand-offs preserved engineering oversight at precisely the steps where automated propagation of an early error would be most costly to reverse.
5.5. Managerial Implications for Project Management
From a managerial perspective, the framework shifts the basis of weekly control meetings from reactive, experience-based discussion toward structured, simulation-supported review, with decisions grounded in quantitative outputs alongside, not instead of, professional judgment. As shown in Section 4, this capability is structurally feasible within this illustrative application; its effect on decision quality in practice requires empirical evaluation across real projects. Three managerial implications follow: First, the spectrum of catch-up options reframes control meetings from debating whether recovery is possible to selecting which recovery is justified, moving the discussion toward explicit cost–risk trade-offs. Second, for resource-constrained firms, the approach lowers the entry barrier to quantitative control, delivering scenario-based decision support without the sensor infrastructure a full digital twin requires. Third, the principal adoption barrier is organizational rather than computational: the forecast is only as reliable as the productivity data reported from the site, so disciplined and timely progress capture is a precondition for the method to deliver value.
5.6. Limitations and Future Research Directions
Despite its practical benefits, the proposed conceptual framework exhibits certain interoperability limitations. In large-scale projects with highly heterogeneous BIM data, the semi-automated, spreadsheet-mediated extraction may require manual intervention for data mapping and model preparation that becomes a procedural bottleneck.
A further limitation concerns software dependency and interoperability. The framework relies on a specific combination of proprietary applications—Autodesk Revit, Dynamo, Synchro, Microsoft Excel, and the COSMOS Simulator—each carrying licensing costs and version-compatibility requirements that may constrain adoption, particularly for small and medium-sized enterprises. Data exchange between these tools is currently mediated through intermediate spreadsheets rather than a neutral, open exchange standard. Although BIM data can, in principle, be transferred through the IFC schema, the present pipeline has not been tested for IFC-based interoperability, and round-tripping quantity and identifier data through IFC may introduce mapping or granularity issues. Establishing and validating an IFC-based exchange path is therefore a necessary step toward broader, vendor-neutral applicability, alongside the platform-interconnection priorities discussed below.
A related consideration concerns the robustness of the data-driven components of the pipeline against uncertainty and noise in the underlying data. Because BIM-derived quantities and site-progress records carry measurement and estimation errors, the reliability of downstream simulation inputs depends on how well this variability is represented. Recent work on digital-twin-oriented monitoring has shown that probabilistic models fusing prior physical information can retain stable predictive accuracy even under substantial input noise [50], underscoring the value of principled uncertainty modeling in such pipelines. In the present study, uncertainty is represented by illustrative triangular distributions; replacing these with data-driven distribution fitting calibrated to field-observed productivity—following approaches such as [50]—is identified as a direction for strengthening both the robustness and the empirical grounding of the framework.
The worked example in Section 4 illustrates the operation of the control loop rather than a reproducible production model; full activity-level reproducibility—including the complete COSMOS network structure, resource calendars, and productivity-distribution calibration against measured site data—forms part of the field evaluation identified below.
To evolve this semi-automated framework into a fully integrated digital ecosystem, future research should prioritize platform interconnection automation. Establishing standardized data formats, protocols, and APIs is critical to ensuring reliable data exchange across modeling, simulation, and scheduling tools without human error. Furthermore, future studies should explore advanced technologies such as artificial intelligence and machine learning to automate semantic reconciliation and decision-making processes. If coupled with the IoT for real-time progress sensing and feedback, these advancements would eliminate the need for manual progress logging and enable a fully autonomous, predictive digital twin. Finally, broader real-world implementations and field trials across a wider range of construction project types and scales are essential. Transferability to infrastructure and mega-projects, where activity counts, resource interactions, and spatial zoning are substantially larger, remains to be tested and may require additional model-management strategies. Such empirical testing will uncover practical constraints, refine the framework’s user interfaces, and enhance its overall resilience for industry-wide adoption.
A further perspective concerns the interpretability of the components that generate the framework’s decision support. For an engineering tool to be trusted and adopted, the reasoning that links its inputs to a recommended action must remain inspectable by the engineers and managers who act on it. The proposed framework is interpretable by construction: activity durations follow from explicit, BIM-traceable quantities through documented productivity relationships and stated probability distributions, and the discrete-event COSMOS model makes the underlying sequences, resource logic, and queuing behavior visible, so a manager can trace why a given forecast or corrective scenario arose rather than accept an opaque output. This transparency is a deliberate design choice, consistent with evidence that parametric, physically meaningful models can approach the predictive accuracy of deep neural networks while retaining interpretability [51]. It is, however, a property that must be actively preserved as the framework is extended with the artificial intelligence and machine learning components noted above. Favoring interpretable or explanation-capable models over black-box predictors will be necessary to retain the reasoning that links inputs to recommended actions, inspectable as the system grows in capability.
6. Conclusions
This study presents a conceptual framework and proof-of-concept application integrating BIM with the COSMOS Simulator within an execution-phase proactive control loop. Two contributions are demonstrated at the level of structural feasibility. First, a governed BIM-to-simulation pipeline—an identifier-keyed data contract with in-flow validation—provides an auditable path from design quantities to the inputs of the construction-specific engine (COSMOS [32,33,34]), extending the automated data-validation demonstrated for deterministic BIM contexts [36,37] to the requirements of stochastic simulation input—a coupling not demonstrated in the studies reviewed (Table 1). Second, the execution-phase proactive control loop couples spatially resolved EVA with iterative simulation-based scenario testing, enabling quantitative evaluation of corrective actions before physical commitment. This combination is not demonstrated in the prior studies reviewed. The framework operates without IoT infrastructure, reducing implementation barriers for organizations in the early stages of digital construction adoption. The application is illustrative rather than empirically validated: conclusions are bounded to structural feasibility, and field validation remains the primary direction for future research, alongside interoperability testing with IFC-based workflows and sensitivity analysis of productivity distribution assumptions. Framed this way, delivering the first governed BIM-to-COSMOS integration establishes the precondition for the empirical validation of BIM-integrated stochastic control, defining it as the well-scoped next step that this work makes possible.
Author Contributions
Conceptualization, B.V.; writing—original draft preparation, B.V.; writing—review and editing, J.D.; supervision, J.D. All authors have read and agreed to the published version of the manuscript.
Funding
This research received no external funding.
Data Availability Statement
The Dynamo scripts, Microsoft Excel parameter-store template, and COSMOS model files underlying the illustrative case study are available from the corresponding author upon reasonable request.
Conflicts of Interest
The authors declare no conflicts of interest.
References
- Visartsakul, B.; Damrianant, J. A review of Building Information Modeling and simulation as virtual representations under the Digital Twin concept. Eng. J. 2023, 27, 11–27. [Google Scholar] [CrossRef] [Scilit]
- Torres, K.; Sánchez, O.; Castañeda, K.; Noguera, M.; Carrasco-Beltrán, D.; Vidal-Méndez, S.; Lozano-Ramírez, N.E. Exploring the knowledge structure of building information modeling (BIM) adoption in construction scheduling: A bibliometric analysis from 2008 to 2024. Ain Shams Eng. J. 2025, 16, 103446. [Google Scholar] [CrossRef] [Scilit]
- Halpin, D.W. Cyclone—Method for modeling of job site processes. J. Constr. Div. 1977, 103, 489–499. [Google Scholar] [CrossRef] [Scilit]
- Ahmed, T.; Hossain, S.M.; Hossain, M.A. Reducing completion time and optimizing resource use of resource-constrained construction operation by means of simulation modeling. Int. J. Constr. Manag. 2021, 21, 404–415. [Google Scholar] [CrossRef] [Scilit]
- Bokor, O.; Florez, L.; Osborne, A.; Gledson, B.J. Overview of construction simulation approaches to model construction processes. Organ. Technol. Manag. Constr. 2019, 11, 1853–1861. [Google Scholar] [CrossRef] [Scilit]
- Rafid, M.F.; Hague, S.; AbouRizk, S.; Stroulia, E. Simulation as a decision-support tool in construction project management: Simphony-Dynamic-as-a-Service. Autom. Constr. 2025, 175, 106198. [Google Scholar] [CrossRef] [Scilit]
- Abdelmegid, M.A.; González, V.A.; Poshdar, M.; O’Sullivan, M.; Walker, C.G.; Ying, F. Barriers to adopting simulation modelling in construction industry. Autom. Constr. 2020, 111, 103046. [Google Scholar] [CrossRef] [Scilit]
- Cheng, J.C.P.; Lu, Q. A review of the efforts and roles of the public sector for BIM adoption worldwide. J. Inf. Technol. Constr. 2015, 20, 442–478. [Google Scholar]
- Nederveen, G.A.; Tolman, F.P. Modelling multiple views on buildings. Autom. Constr. 1992, 1, 215–224. [Google Scholar] [CrossRef] [Scilit]
- Alsofiani, M.A. Digitalization in infrastructure construction projects: A PRISMA-based review of benefits and obstacles. arXiv 2024. [Google Scholar] [CrossRef] [Scilit]
- Eastman, C.; Teicholz, P.; Sacks, R.; Liston, K. BIM Handbook: A Guide to Building Information Modeling for Owners, Managers, Designers, Engineers, and Contractors; John Wiley & Sons: Hoboken, NJ, USA, 2011. [Google Scholar]
- Pishdad, P.; Onungwa, I.O. Analysis of 5D BIM for cost estimation, cost control and payments. J. Inf. Technol. Constr. 2024, 29, 525–548. [Google Scholar] [CrossRef] [Scilit]
- Khosrowshahi, F. Building Information Modelling (BIM) a paradigm shift in construction. In Building Information Modelling, Building Performance, Design and Smart Construction; Springer: Cham, Switzerland, 2017; pp. 47–64. [Google Scholar] [CrossRef] [Scilit]
- Kumar, S.S.; Cheng, J.C.P. A BIM-based automated site layout planning framework for congested construction sites. Autom. Constr. 2015, 59, 24–37. [Google Scholar] [CrossRef] [Scilit]
- Liu, H.; Al-Hussein, M.; Lu, M. BIM-based integrated approach for detailed construction scheduling under resource constraints. Autom. Constr. 2015, 53, 29–43. [Google Scholar] [CrossRef] [Scilit]
- Osorio-Sandoval, C.A.; Tizani, W.; Pereira, E.; Ninić, J.; Koch, C. Framework for BIM-Based Simulation of Construction Operations Implemented in a Game Engine. Buildings 2022, 12, 1199. [Google Scholar] [CrossRef] [Scilit]
- Oliveira, E.; Júnior, C.F.; Correa, F. Simulation of Construction Processes as a Link Between BIM Models and Construction Progression On-site. In Advances in Informatics and Computing in Civil and Construction Engineering; Springer: Cham, Switzerland, 2019. [Google Scholar] [CrossRef] [Scilit]
- Jeong, W.; Chang, S.; Son, J.; Yi, J. BIM-integrated construction operation simulation for just-in-time production management. Sustainability 2016, 8, 1106. [Google Scholar] [CrossRef] [Scilit]
- Wu, C.; Jiang, R.; Li, X. Integration of BIM and computer simulations in modular construction, a case study. In Proceedings of the 2016 MOC Summit, Edmonton, AB, Canada, 29 September–1 October 2016. [Google Scholar] [CrossRef] [Scilit]
- Wang, W.; Weng, S.; Wang, S.; Chen, C. Integrating building information models with construction process simulations for project scheduling support. Autom. Constr. 2014, 37, 68–80. [Google Scholar] [CrossRef] [Scilit]
- Hosamo, H.H.; Imran, A.; Cardenas-Cartagena, J.; Svennevig, P.R.; Svidt, K.; Nielsen, H.K. A Review of the Digital Twin Technology in the AEC-FM Industry. Adv. Civ. Eng. 2022, 2022, 2185170. [Google Scholar] [CrossRef] [Scilit]
- Nguyen, T.D.; Adhikari, S. The role of BIM in integrating Digital Twin in building construction: A literature review. Sustainability 2023, 15, 10462. [Google Scholar] [CrossRef] [Scilit]
- Lydon, G.P.; Caranovic, S.; Hischier, I.; Schlueter, A. Coupled simulation of thermally active building systems to support a digital twin. Energy Build. 2019, 202, 109298. [Google Scholar] [CrossRef] [Scilit]
- Angjeliu, G.; Coronelli, D.; Cardani, G. Development of the simulation model for Digital Twin applications in historical masonry buildings. Comput. Struct. 2020, 238, 106282. [Google Scholar] [CrossRef] [Scilit]
- Kosse, S.; Betker, V.; Hagedorn, P.; König, M.; Schmidt, T. A semantic digital twin for the dynamic scheduling of Industry 4.0-based production of precast concrete elements. Adv. Eng. Inform. 2024, 62, 102677. [Google Scholar] [CrossRef] [Scilit]
- Kaewunruen, S.; Lian, Q. Digital twin aided sustainability-based lifecycle management for railway turnout systems. J. Clean. Prod. 2019, 228, 1537–1551. [Google Scholar] [CrossRef] [Scilit]
- Sacks, R.; Brilakis, I.; Pikas, E.; Xie, H.S.; Girolami, M. Construction with digital twin information systems. Data-Centric Eng. 2020, 1, E14. [Google Scholar] [CrossRef] [Scilit]
- Yang, Z.; Tang, C.; Zhang, T.; Zhang, Z.; Doan, D.T. Digital Twins in Construction: Architecture, Applications, Trends and Challenges. Buildings 2024, 14, 2616. [Google Scholar] [CrossRef] [Scilit]
- Liu, X.; Antwi-Afari, M.F.; Li, J.; Zhang, Y.; Manu, P. BIM, IoT, and GIS integration in construction resource monitoring. Autom. Constr. 2025, 174, 106149. [Google Scholar] [CrossRef] [Scilit]
- Sepasgozar, S.M.E.; Khan, A.A.; Smith, K.; Romero, J.G.; Shen, X.; Shirowzhan, S.; Li, H.; Tahmasebinia, F. BIM and Digital Twin for Developing Convergence Technologies as Future of Digital Construction. Buildings 2023, 13, 441. [Google Scholar] [CrossRef] [Scilit]
- Tuhaise, V.V.; Tah, J.H.M.; Abanda, F.H. Technologies for digital twin applications in construction. Autom. Constr. 2023, 152, 104931. [Google Scholar] [CrossRef] [Scilit]
- Damrianant, J.; Meklersuewong, S. Features, practical applications, and validation of COSMOS Simulator: A construction-process simulation tool. Int. J. Adv. Softw. 2025, 18, 36–50. [Google Scholar]
- Meklersuewong, S.; Damrianant, J. COSMOS Simulator: A software tool for construction-process modelling and simulation. In Proceedings of the 16th International Conference Advances in System Modeling and Simulation (SIMUL 2024), Venice, Italy, 29 September 2024. [Google Scholar]
- Meklersuewong, S.; Damrianant, J. Evaluating the COSMOS Software Ecosystem for Domain-Specific Construction Process Simulation. Int. Rev. Model. Simul. 2022, 15, 179–188. [Google Scholar] [CrossRef] [Scilit]
- Boje, C.; Guerriero, A.; Kubicki, S.; Rezgui, Y. Towards a semantic construction digital twin: Directions for future research. Autom. Constr. 2020, 114, 103179. [Google Scholar] [CrossRef] [Scilit]
- Valinejadshoubi, M.; Moselhi, O.; Iordanova, I.; Valdivieso, F.; Bagchi, A. Automated system for high-accuracy quantity takeoff using BIM. Autom. Constr. 2024, 157, 105155. [Google Scholar] [CrossRef] [Scilit]
- Valinejadshoubi, M.; Moselhi, O.; Iordanova, I.; Valdivieso, F.; Shakibabarough, A.; Bagchi, A. The Development of an Automated System for a Quality Evaluation of Engineering BIM Models: A Case Study. Appl. Sci. 2024, 14, 3244. [Google Scholar] [CrossRef] [Scilit]
- Pajares, J.; López-Paredes, A. An extension of the EVM analysis for project monitoring: The Cost Control Index and the Schedule Control Index. Int. J. Proj. Manag. 2011, 29, 615–621. [Google Scholar] [CrossRef] [Scilit]
- Acebes, F.; Pajares, J.; Galán, J.M.; López-Paredes, A. A new approach for project control under uncertainty. Going back to the basics. Int. J. Proj. Manag. 2014, 32, 423–434. [Google Scholar] [CrossRef] [Scilit]
- Ayman, H.M.; Mahfouz, S.Y.; Alhady, A. Integrated EDM and 4D BIM-Based Decision Support System for Construction Projects Control. Buildings 2022, 12, 315. [Google Scholar] [CrossRef] [Scilit]
- Madihi, M.H.; Tafazzoli, M.; Shirzadi Javid, A.A.; Nasirzadeh, F. Probabilistic Cash Flow Analysis Considering Risk Impacts by Integrating 5D-Building Information Modeling and Bayesian Belief Network. Buildings 2025, 15, 1774. [Google Scholar] [CrossRef] [Scilit]
- Zhao, T.; Na, R. Semantic Mapping and Cross-Model Data Integration in BIM: A Lightweight and Scalable Schedule-Level Workflow. Buildings 2026, 16, 1347. [Google Scholar] [CrossRef] [Scilit]
- Shim, J.-H.; Ham, N.-H.; Kim, J.-J. Collaborative BIM-Based Construction Coordination Progress Modeling Using Extended Collaborative Process Modeling (exCPM). Buildings 2024, 14, 358. [Google Scholar] [CrossRef] [Scilit]
- Suri, N.; Damrianant, J. Comparing construction process simulation between the Arena and COSMOS programs. Eng. J. Res. Dev. 2019, 30, 89–104. (In Thai) [Google Scholar]
- Damrianant, J. Optimisation of supply trains in tunnel boring operation using tunnel boring machines. In Proceedings of the Sixth International Conference on Advances in Civil, Structural and Mechanical Engineering (CSM 2018), Zurich, Switzerland, 28–29 April 2018; Institute of Research Engineers and Doctors (IRED): New York, NY, USA, 2018; pp. 8–12. [Google Scholar]
- Damrianant, J.; Panrangsri, T. Resource management using COSMOS modelling and simulation system to lessen concrete-placing duration. Thai J. Sci. Techol. 2018, 7, 553–566. (In Thai) [Google Scholar] [CrossRef]
- Liu, L.; Huang, Y.; Jiang, Y.; Gao, Z. Integrating Building Information Modeling with Logistic Chain: A Case Study of a Material Management System for Modular Construction. Buildings 2026, 16, 1064. [Google Scholar] [CrossRef] [Scilit]
- Chen, Y.; Arif, M.A.; Zhang, L.; Nazim, N. Assessing Stakeholder Readiness for IoT-Enhanced BIM Safety Systems: Empirical Evidence from Pakistan Based on an Integrated TAM–TOE Model. Buildings 2026, 16, 2017. [Google Scholar] [CrossRef] [Scilit]
- Sadeghineko, F.; Lawani, K.; Tong, M. Practicalities of Incorporating 3D Laser Scanning with BIM in Live Construction Projects: A Case Study. Buildings 2024, 14, 1651. [Google Scholar] [CrossRef] [Scilit]
- Zhang, X.; Ding, Y.; Zhao, H.; Yi, L.; Guo, T.; Li, A.; Zou, Y. Mixed Skewness Probability Modeling and Extreme Value Predicting for Physical System Input–Output Based on Full Bayesian Generalized Maximum-Likelihood Estimation. IEEE Trans. Instrum. Meas. 2024, 73, 2504516. [Google Scholar] [CrossRef] [Scilit]
- Zhao, H.; Zhang, X.; Ding, Y.; Guo, T.; Li, A.; Soh, C.-K. Probabilistic mixture model driven interpretable modeling, clustering, and predicting for physical system data. Eng. Appl. Artif. Intell. 2025, 160, 112069. [Google Scholar] [CrossRef] [Scilit]
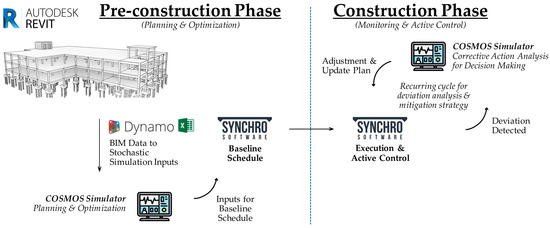
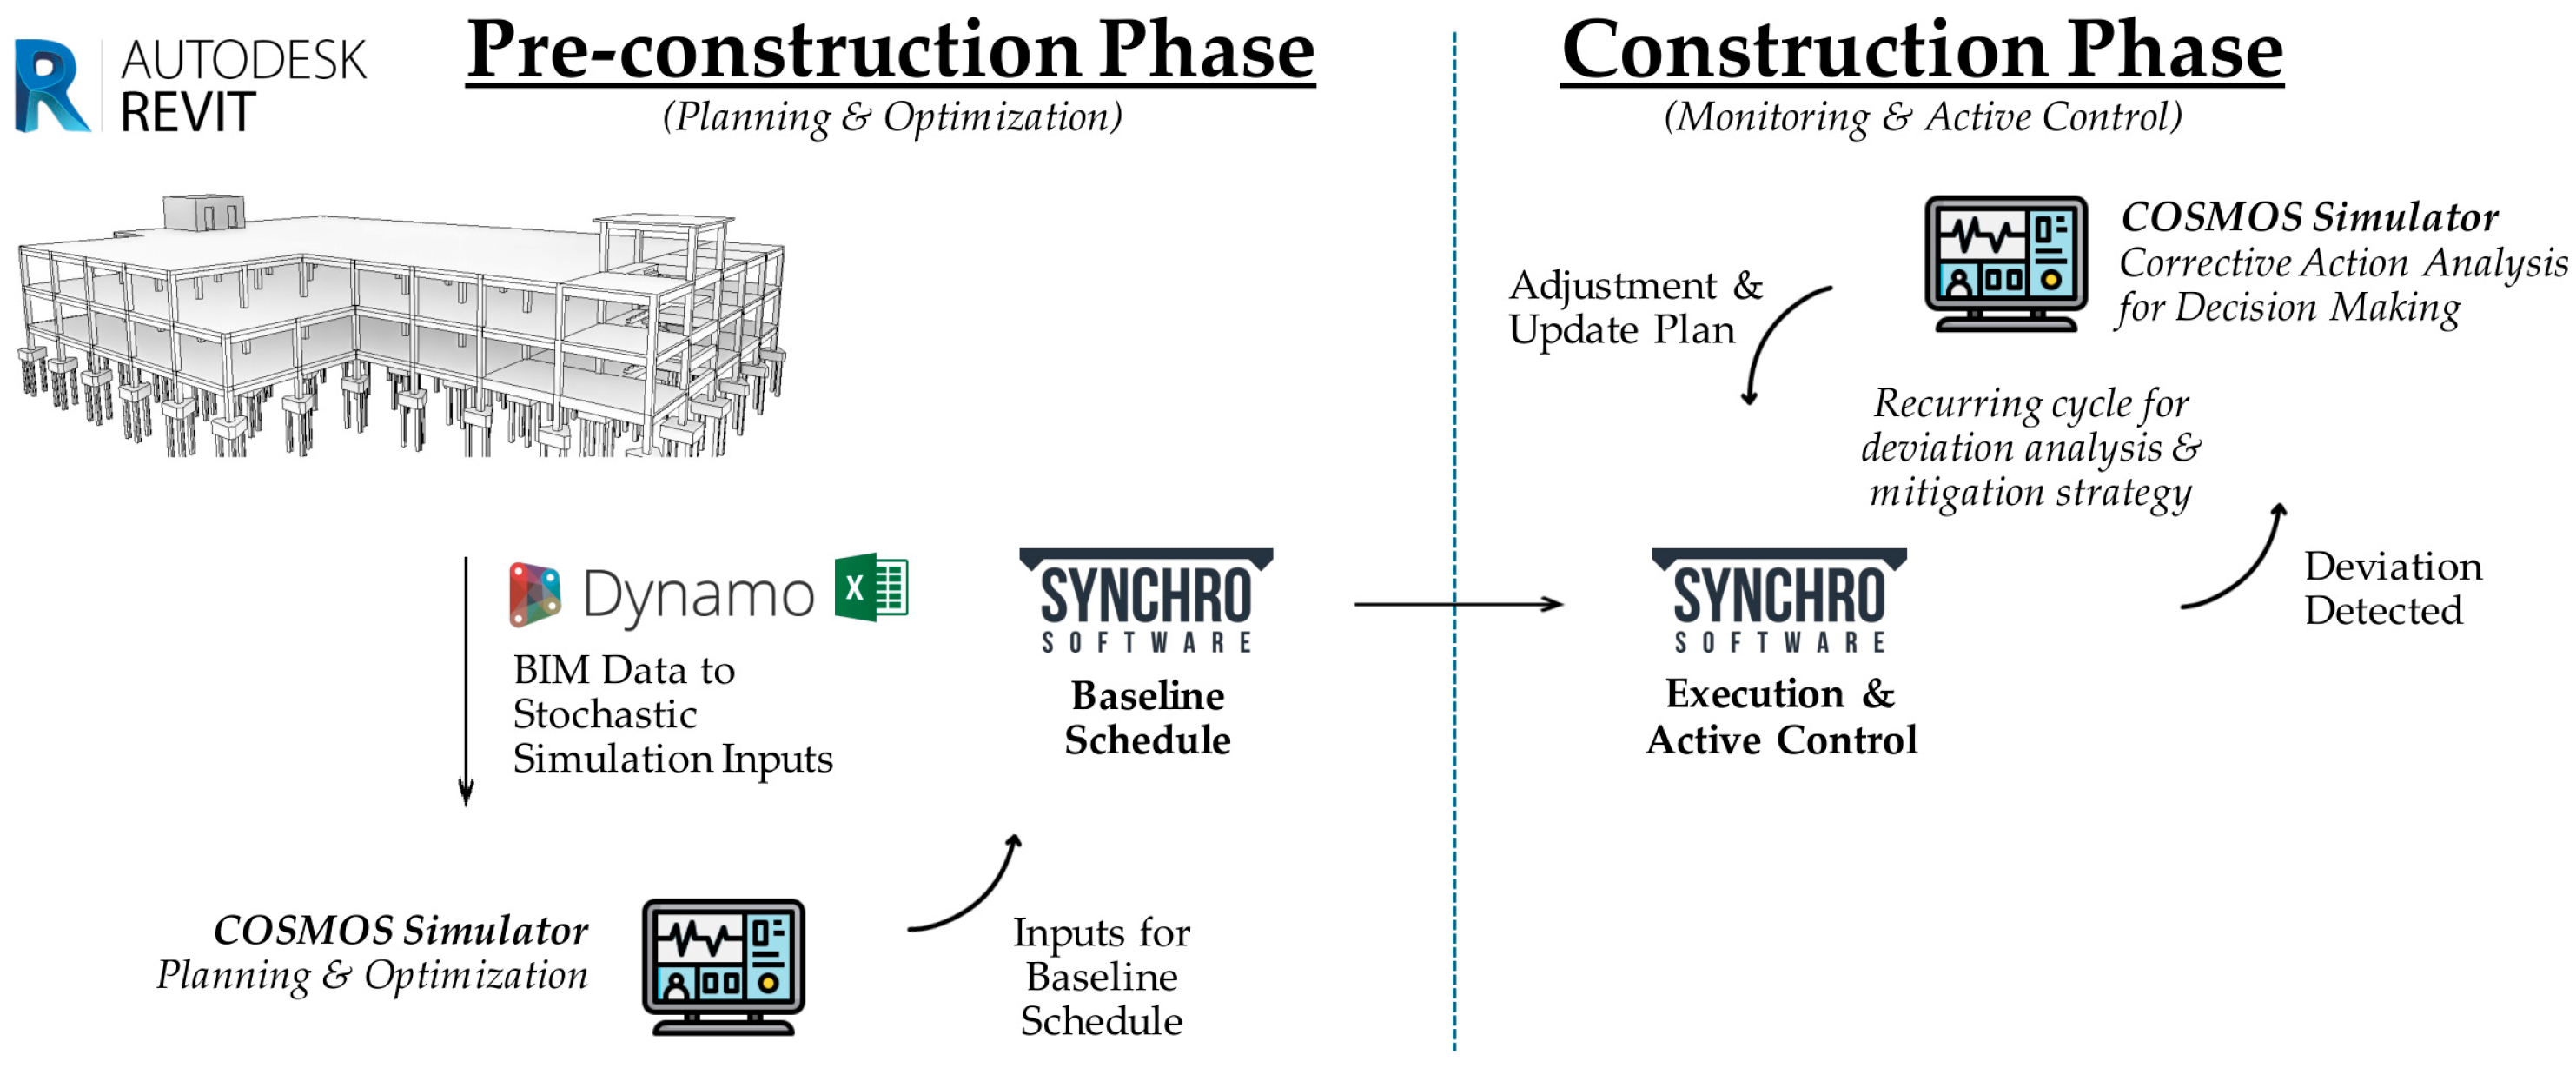
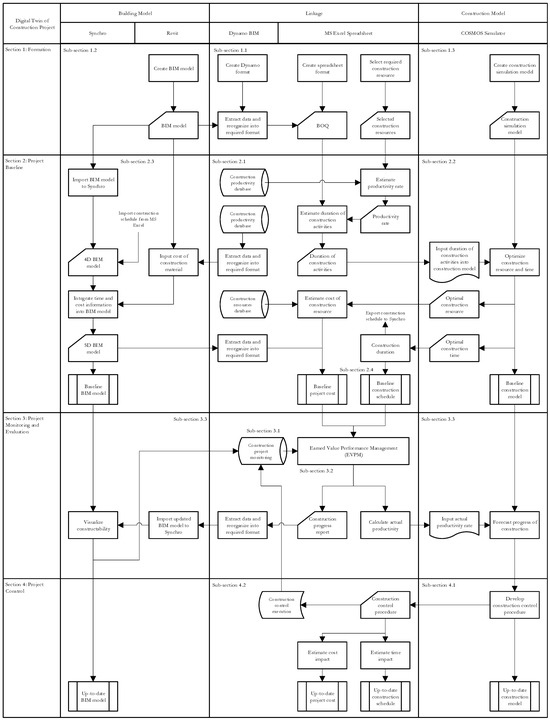
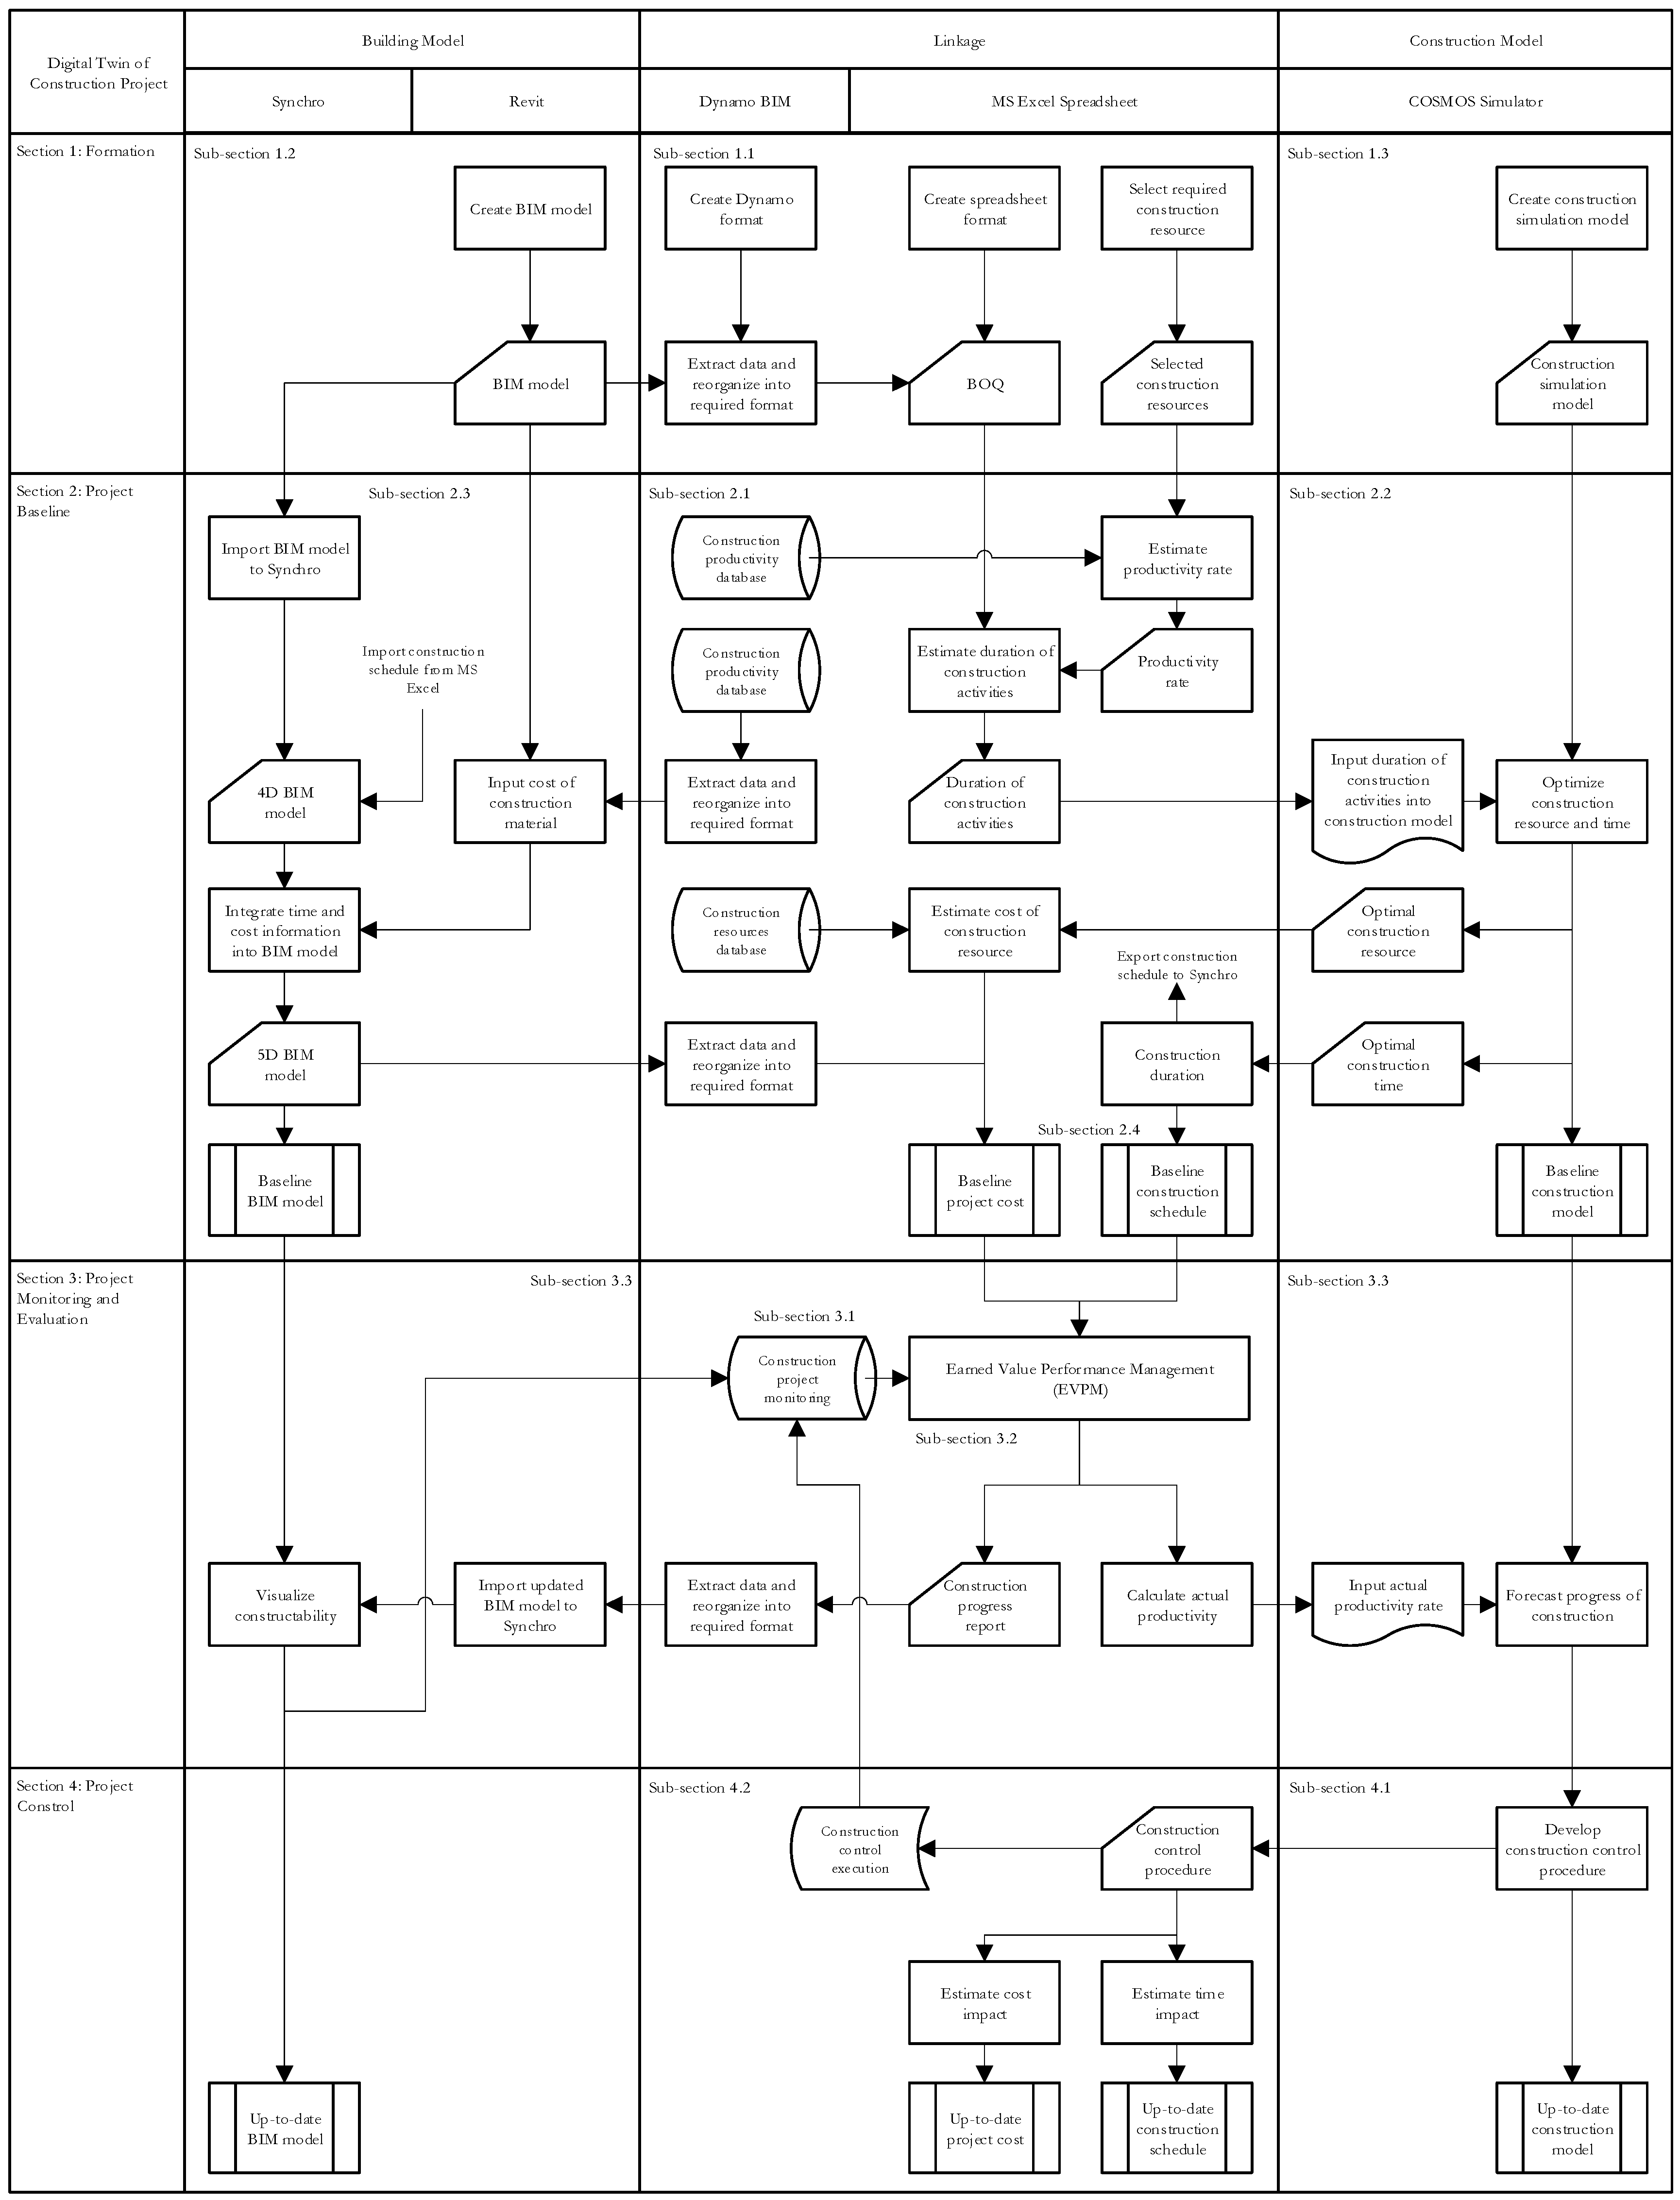
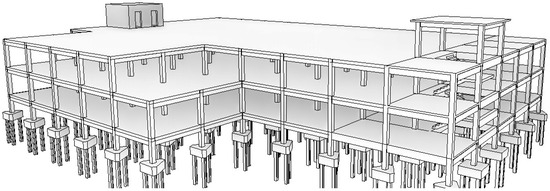
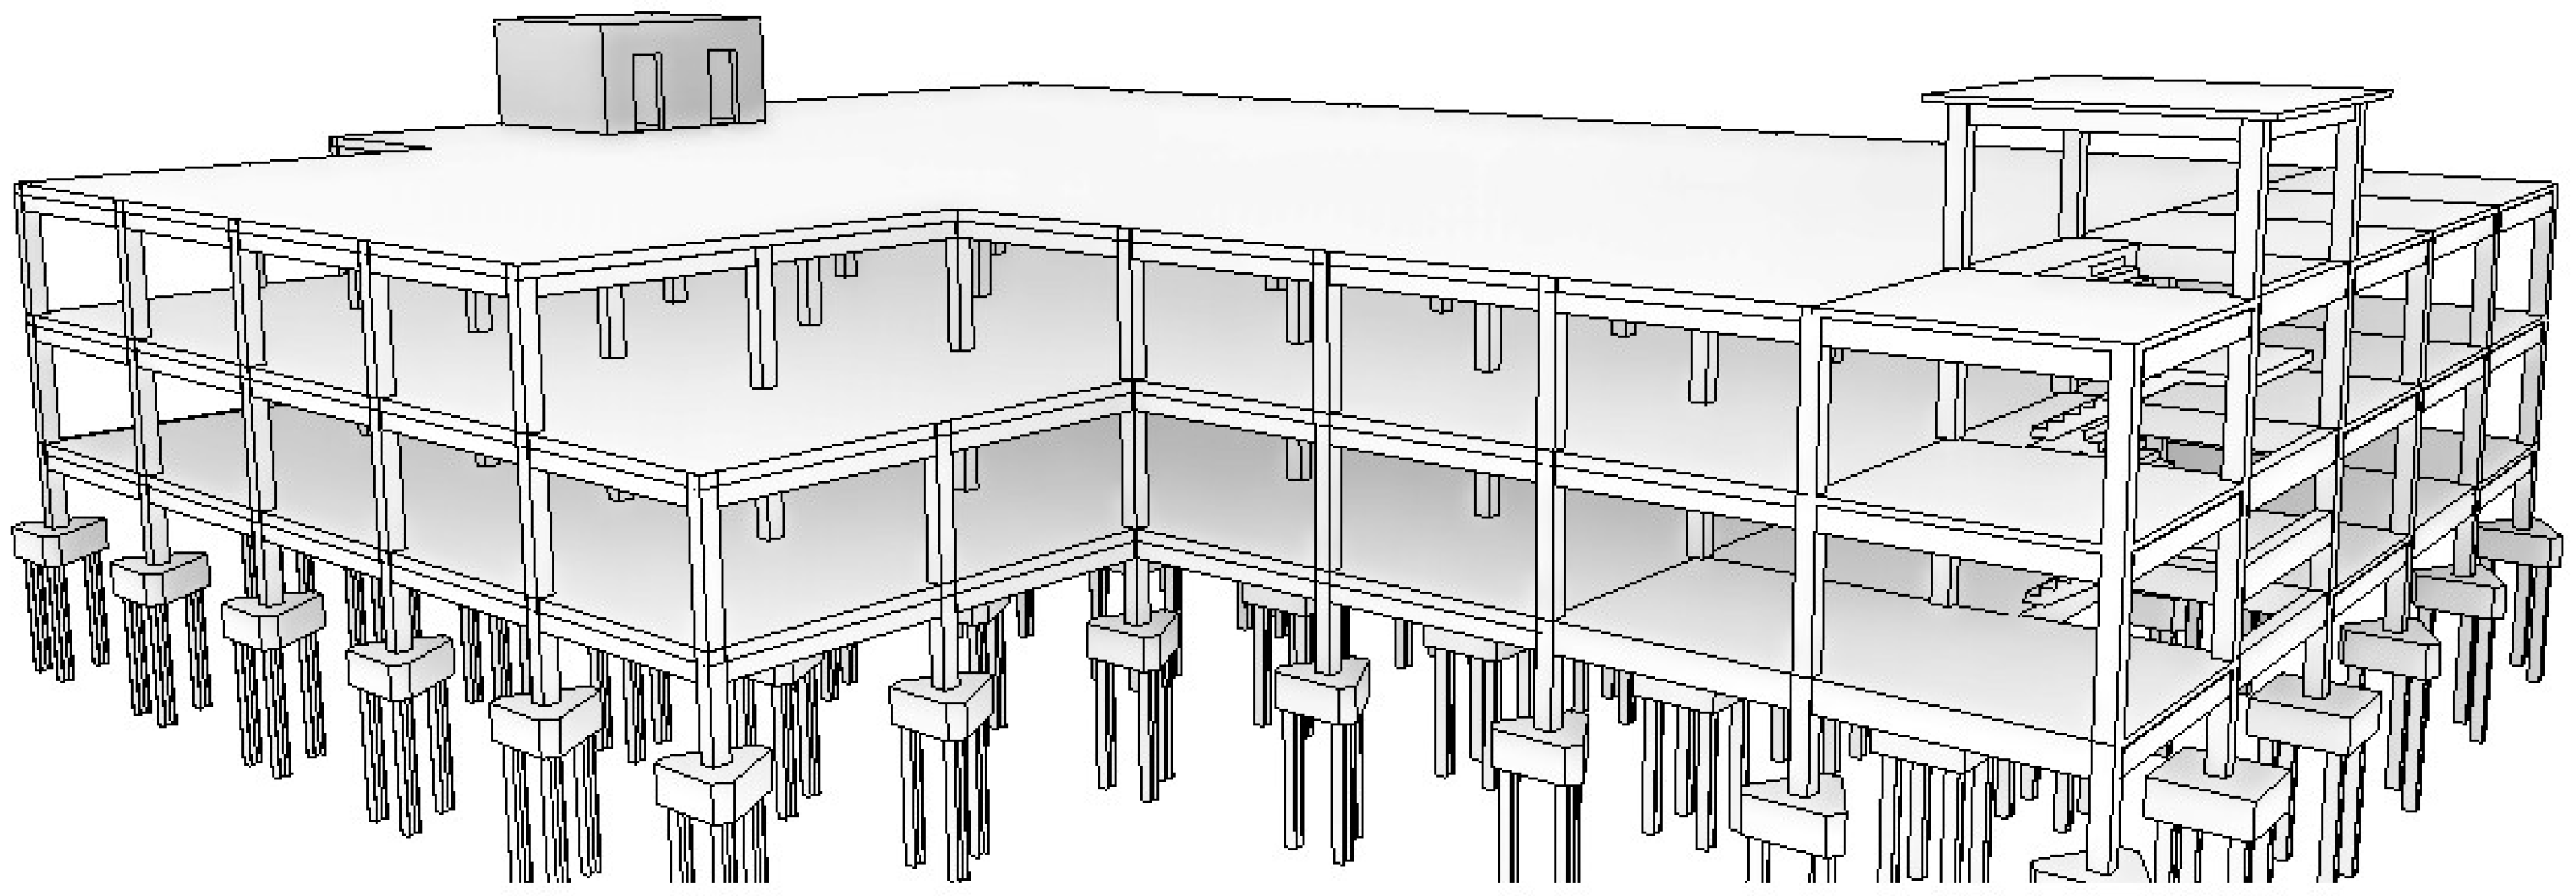
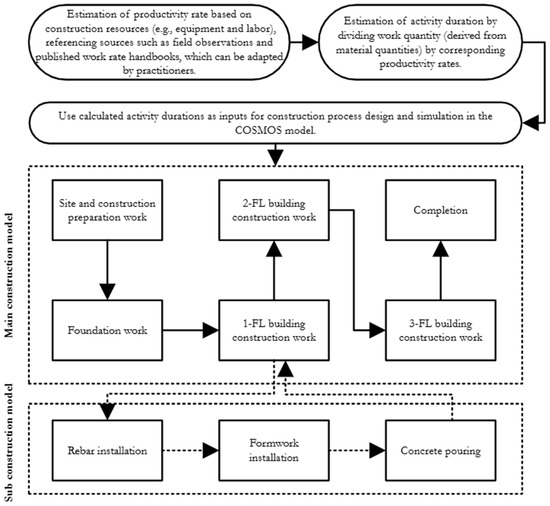
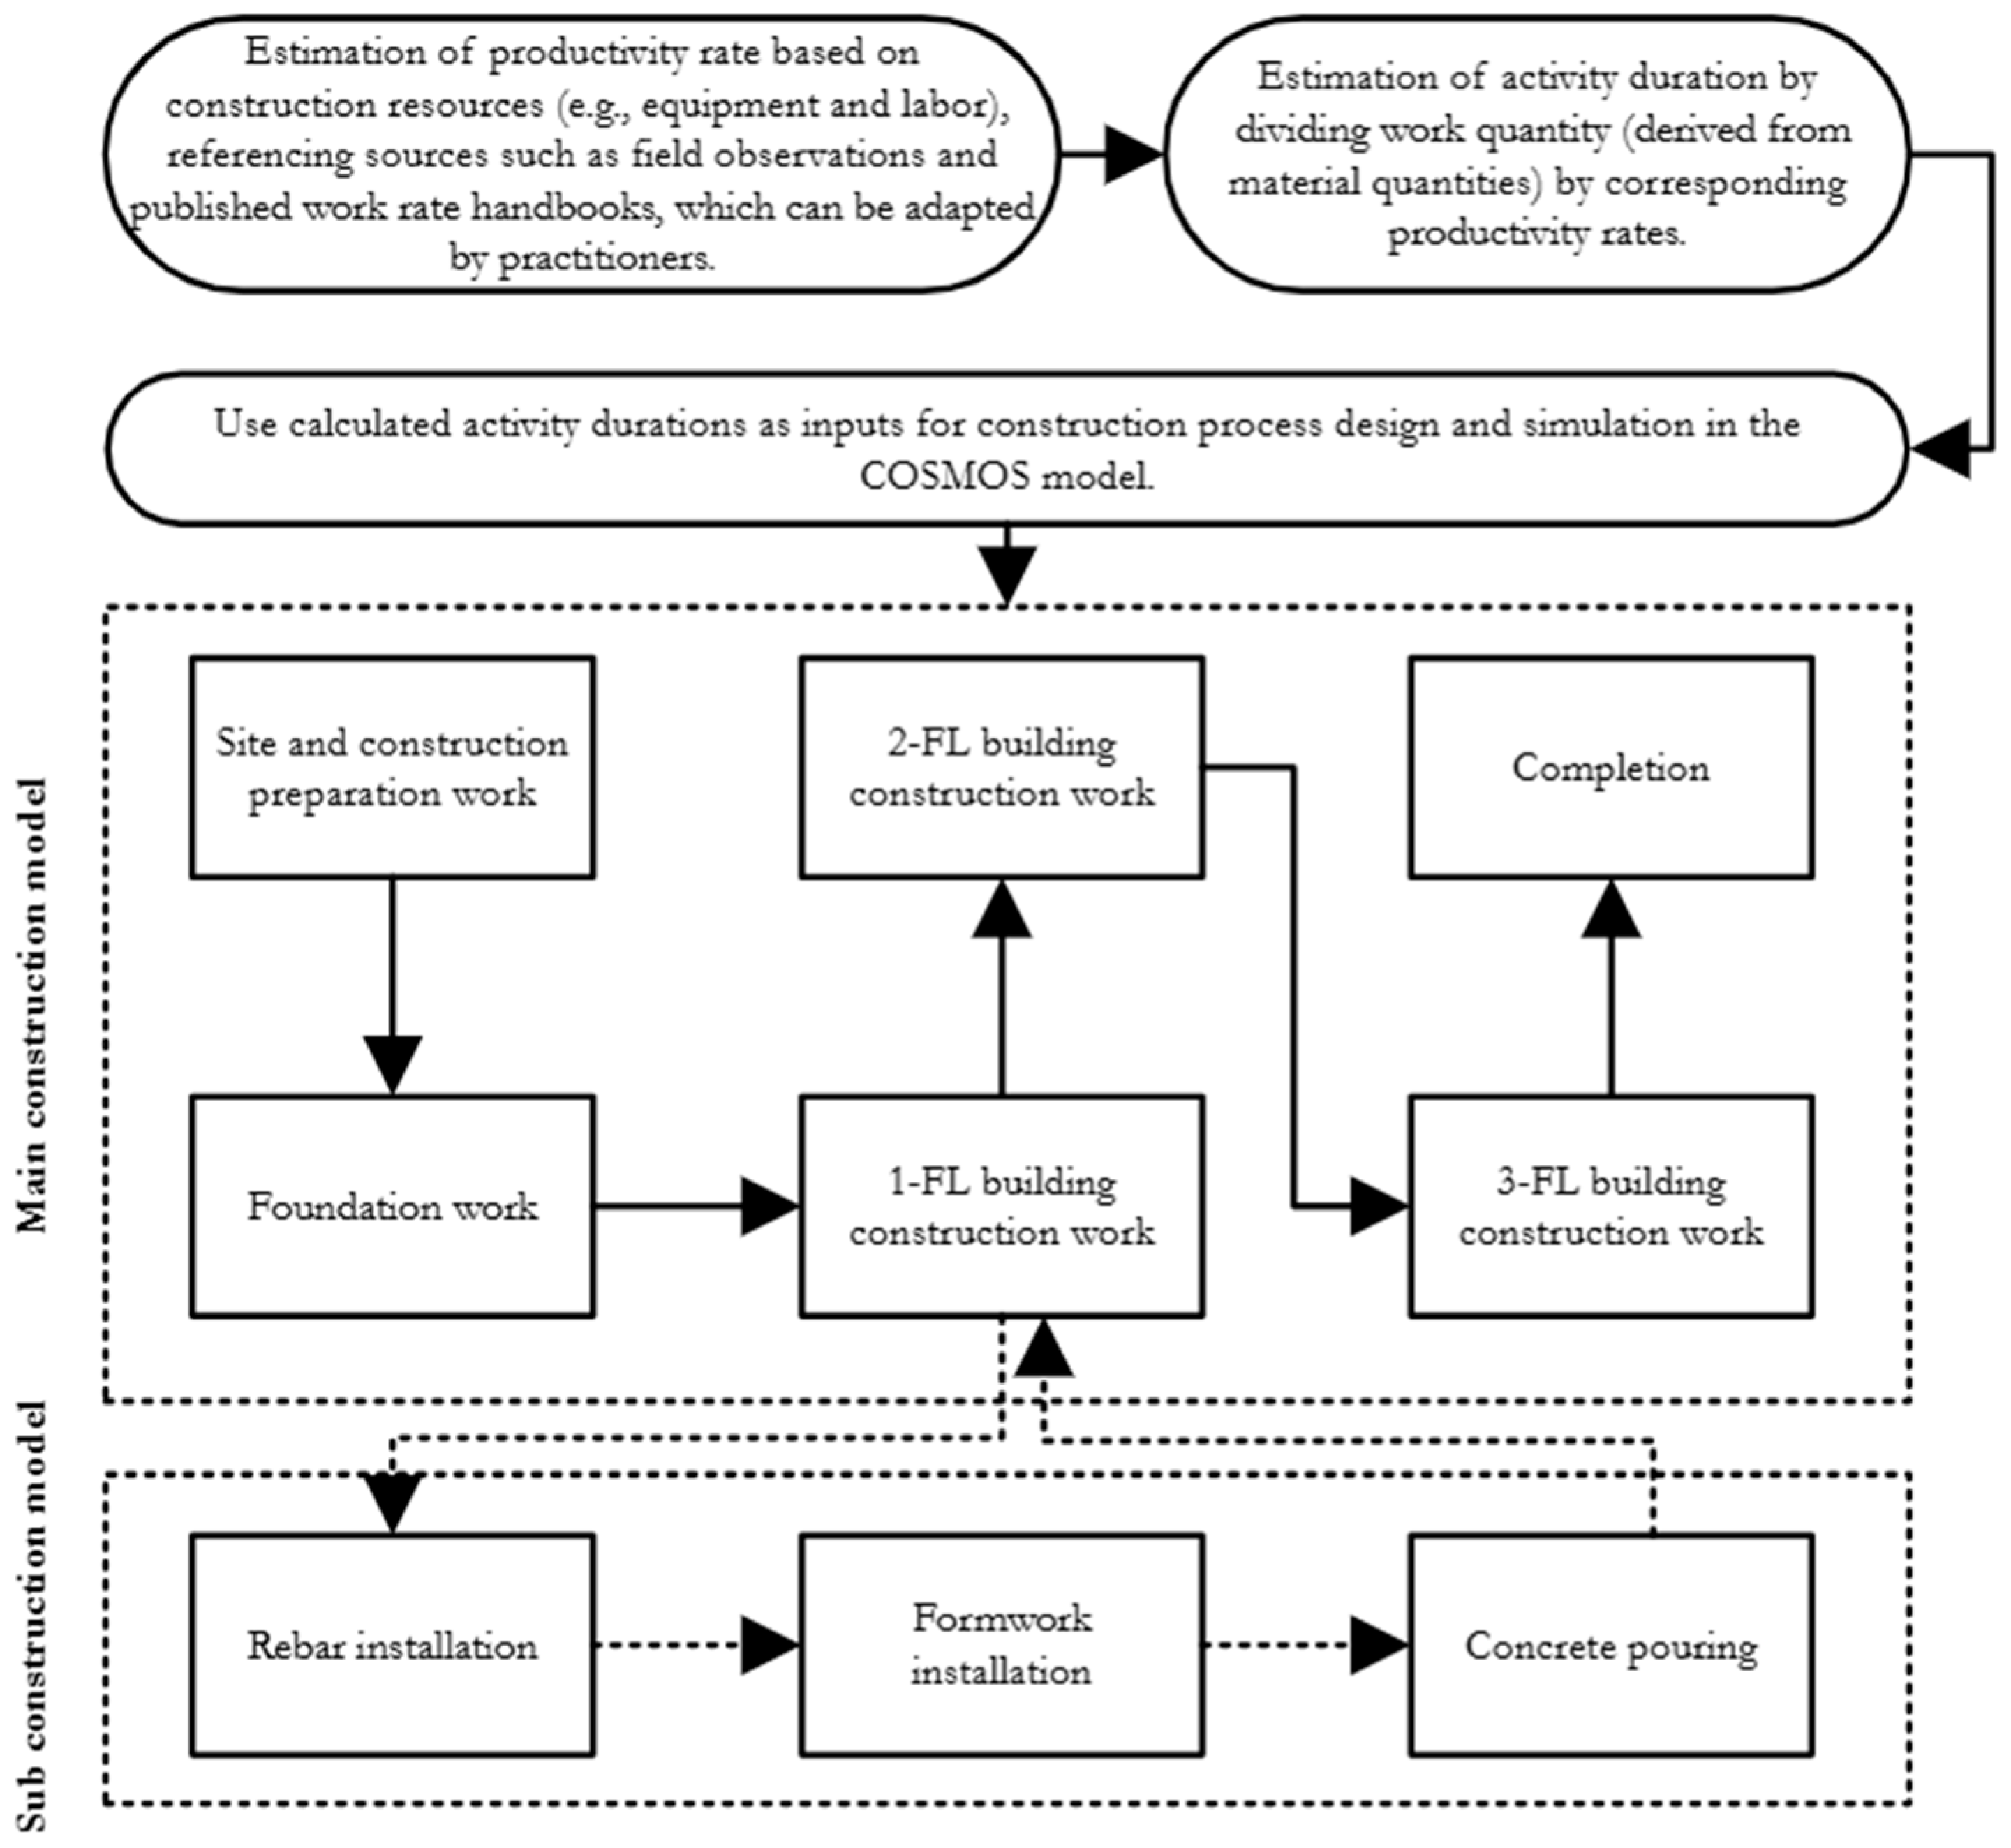
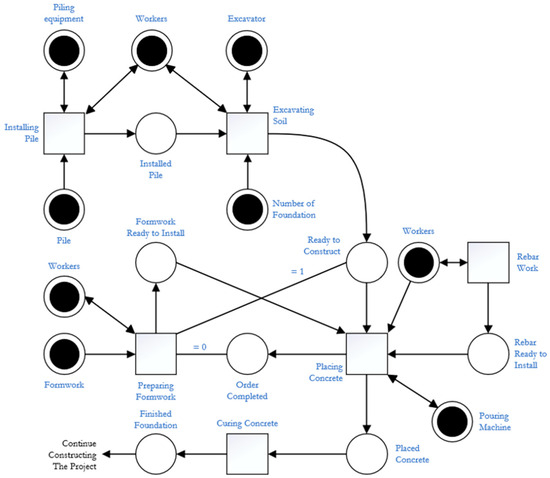
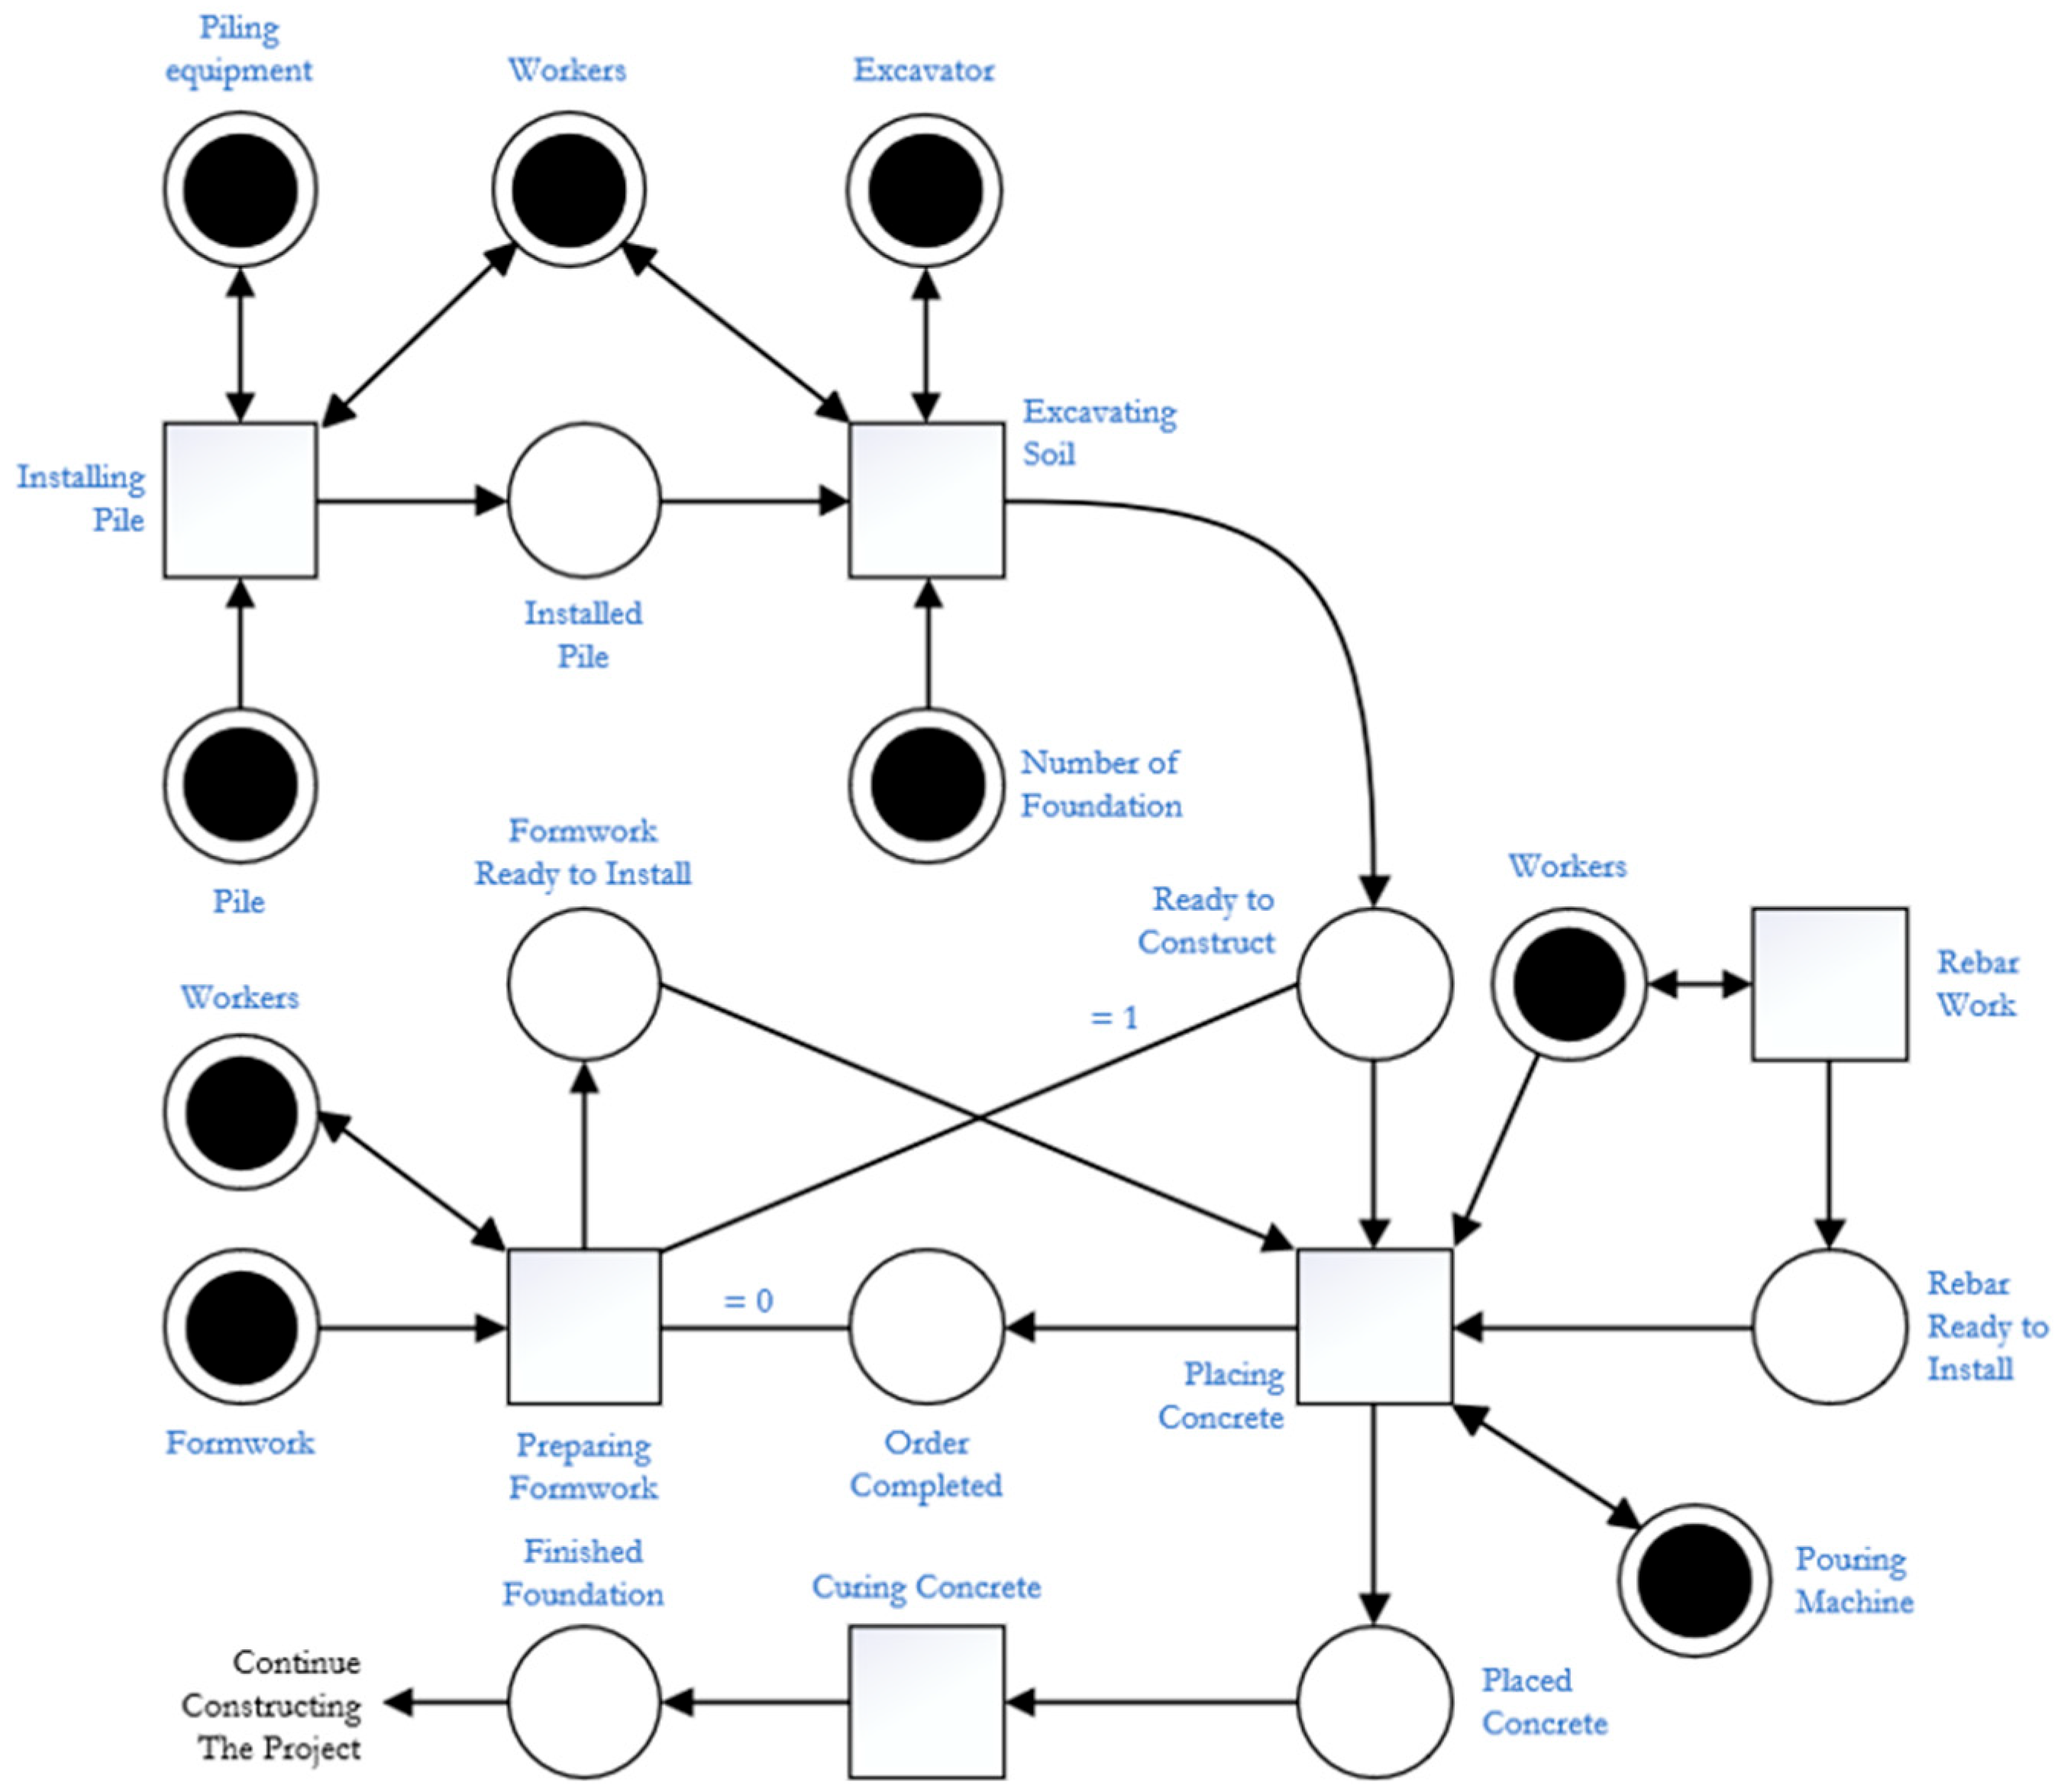
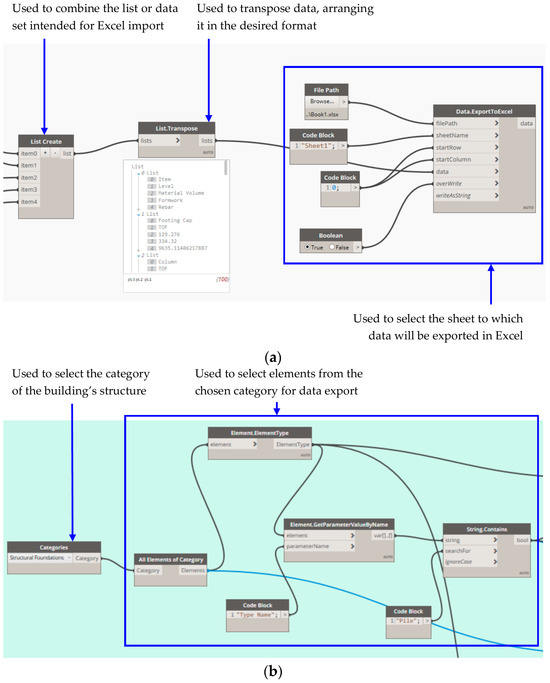
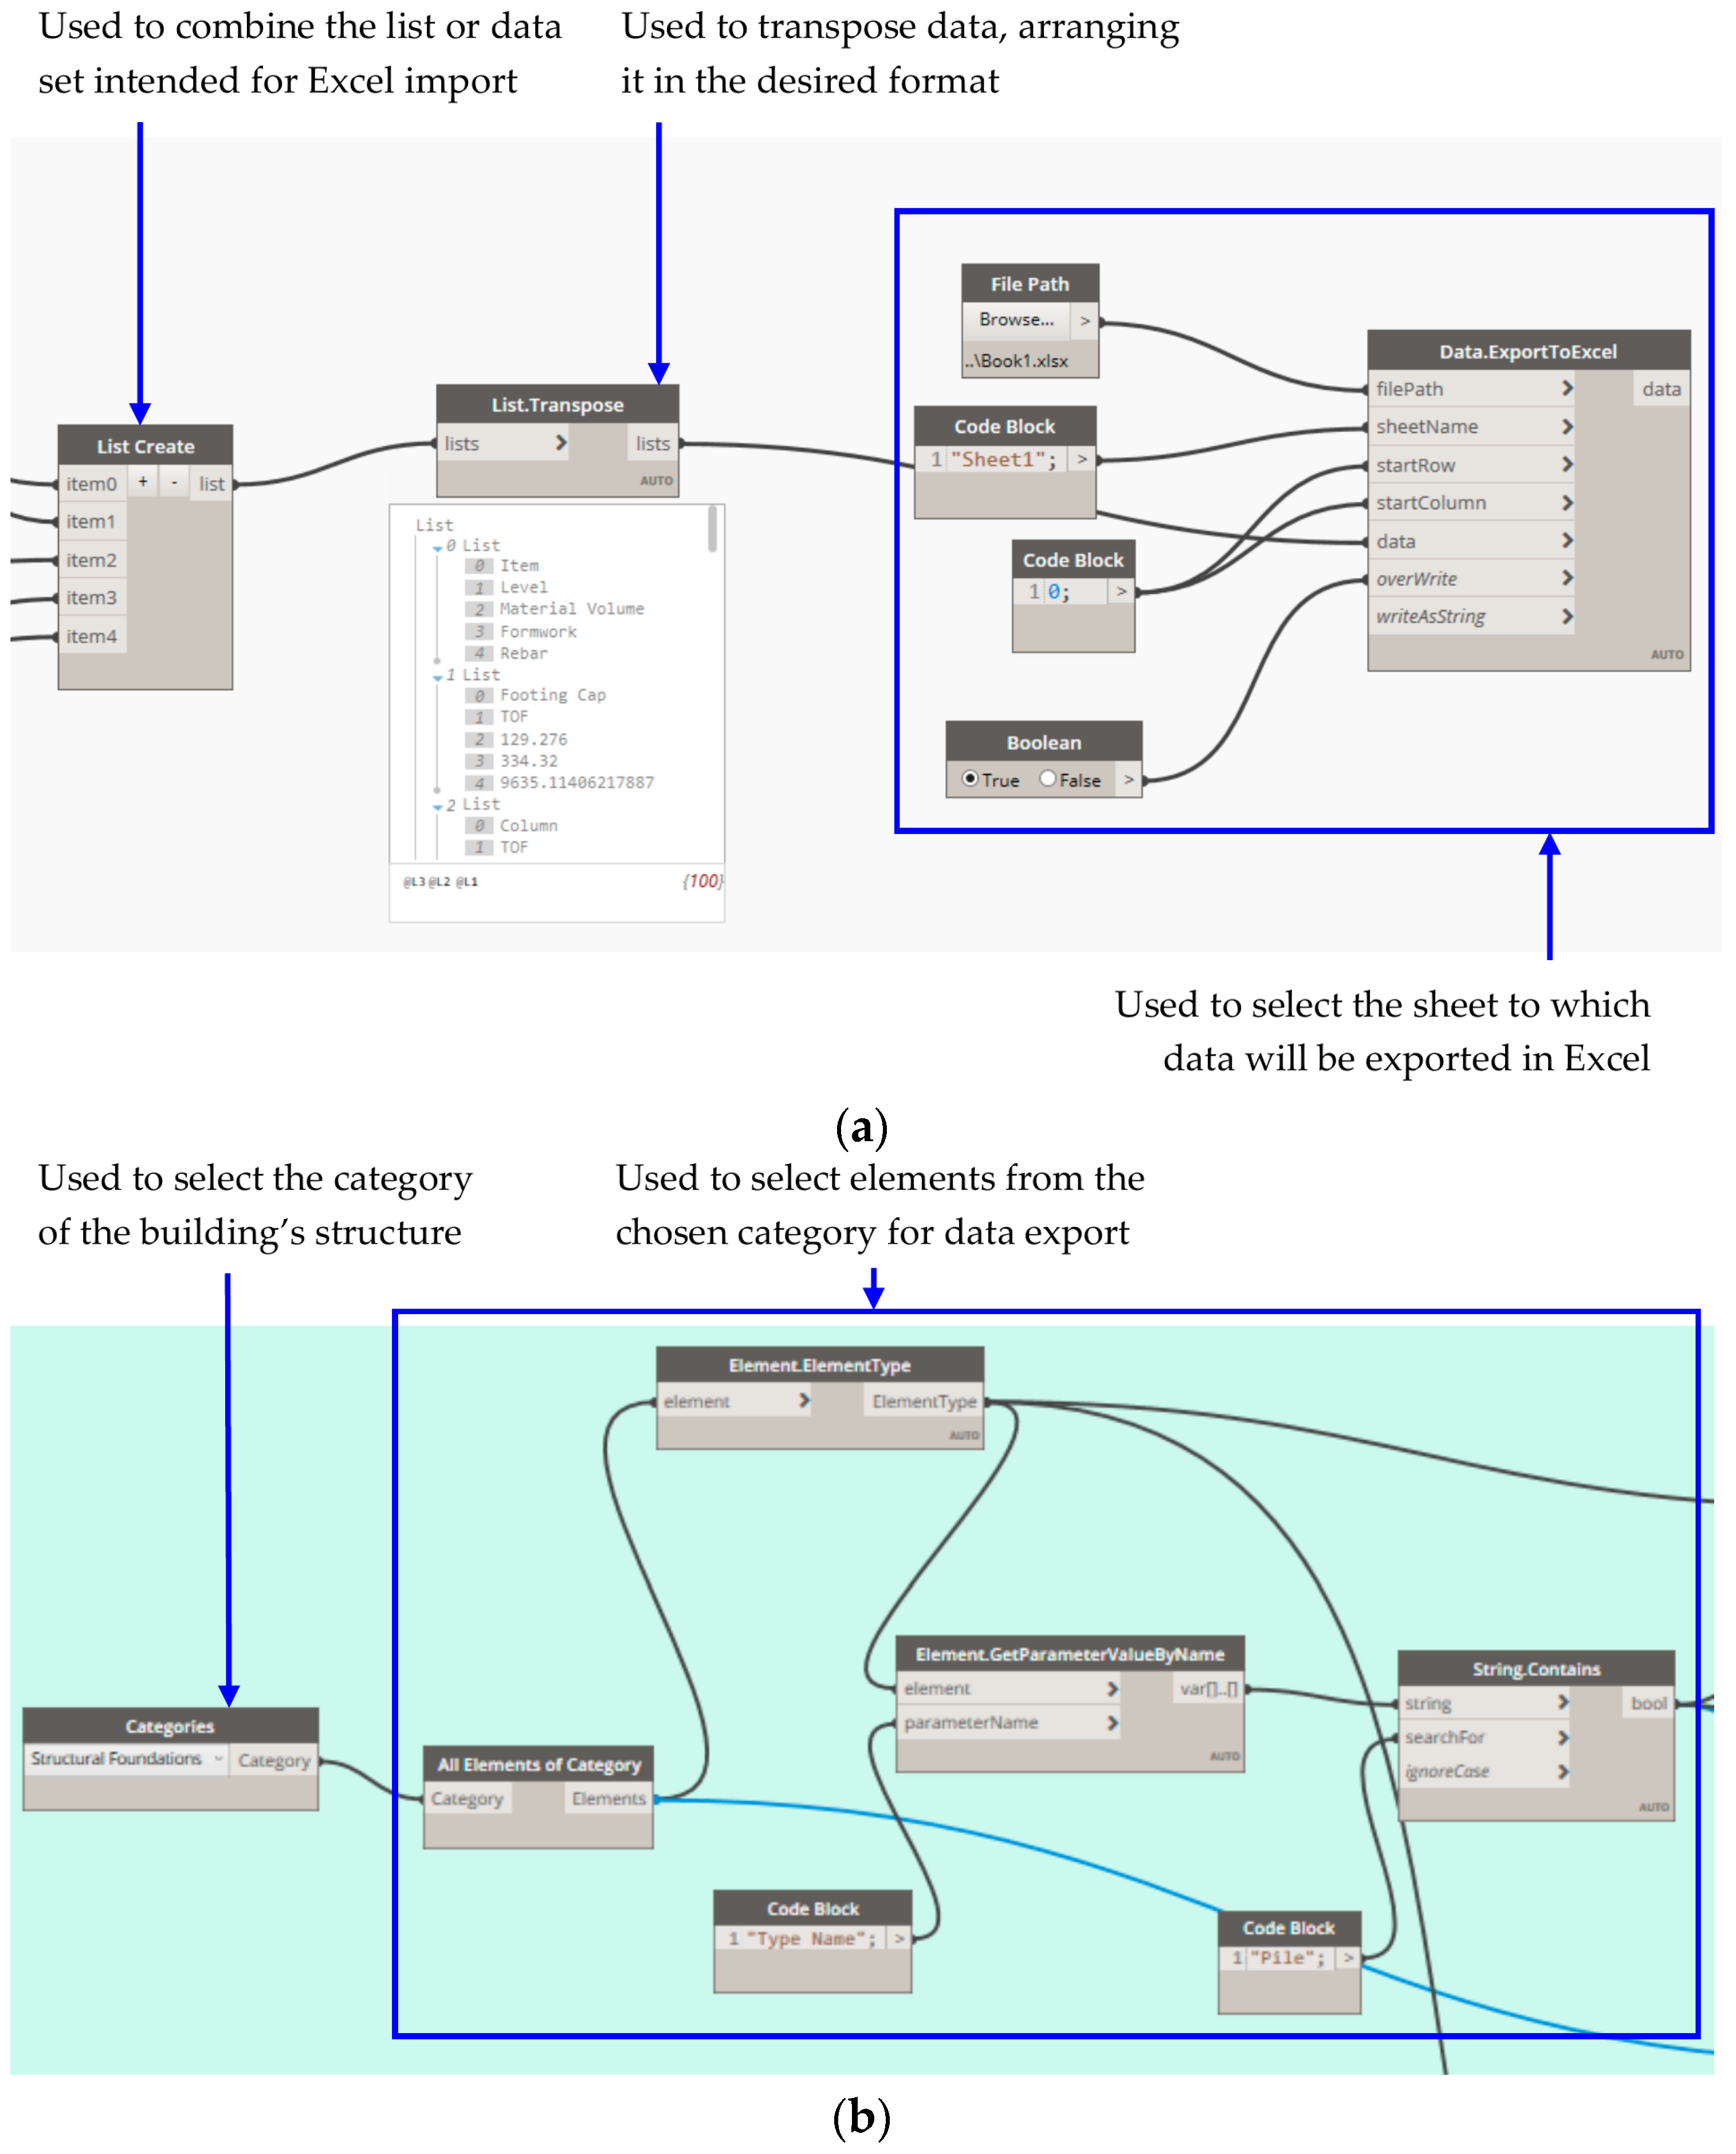
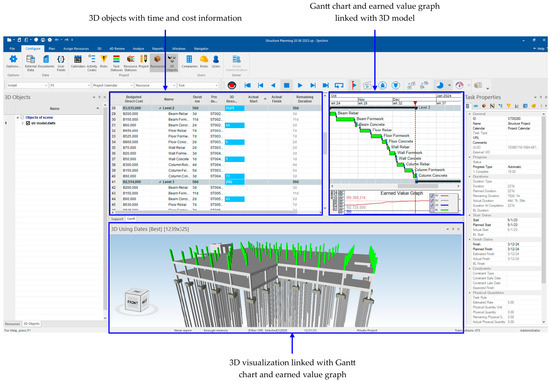
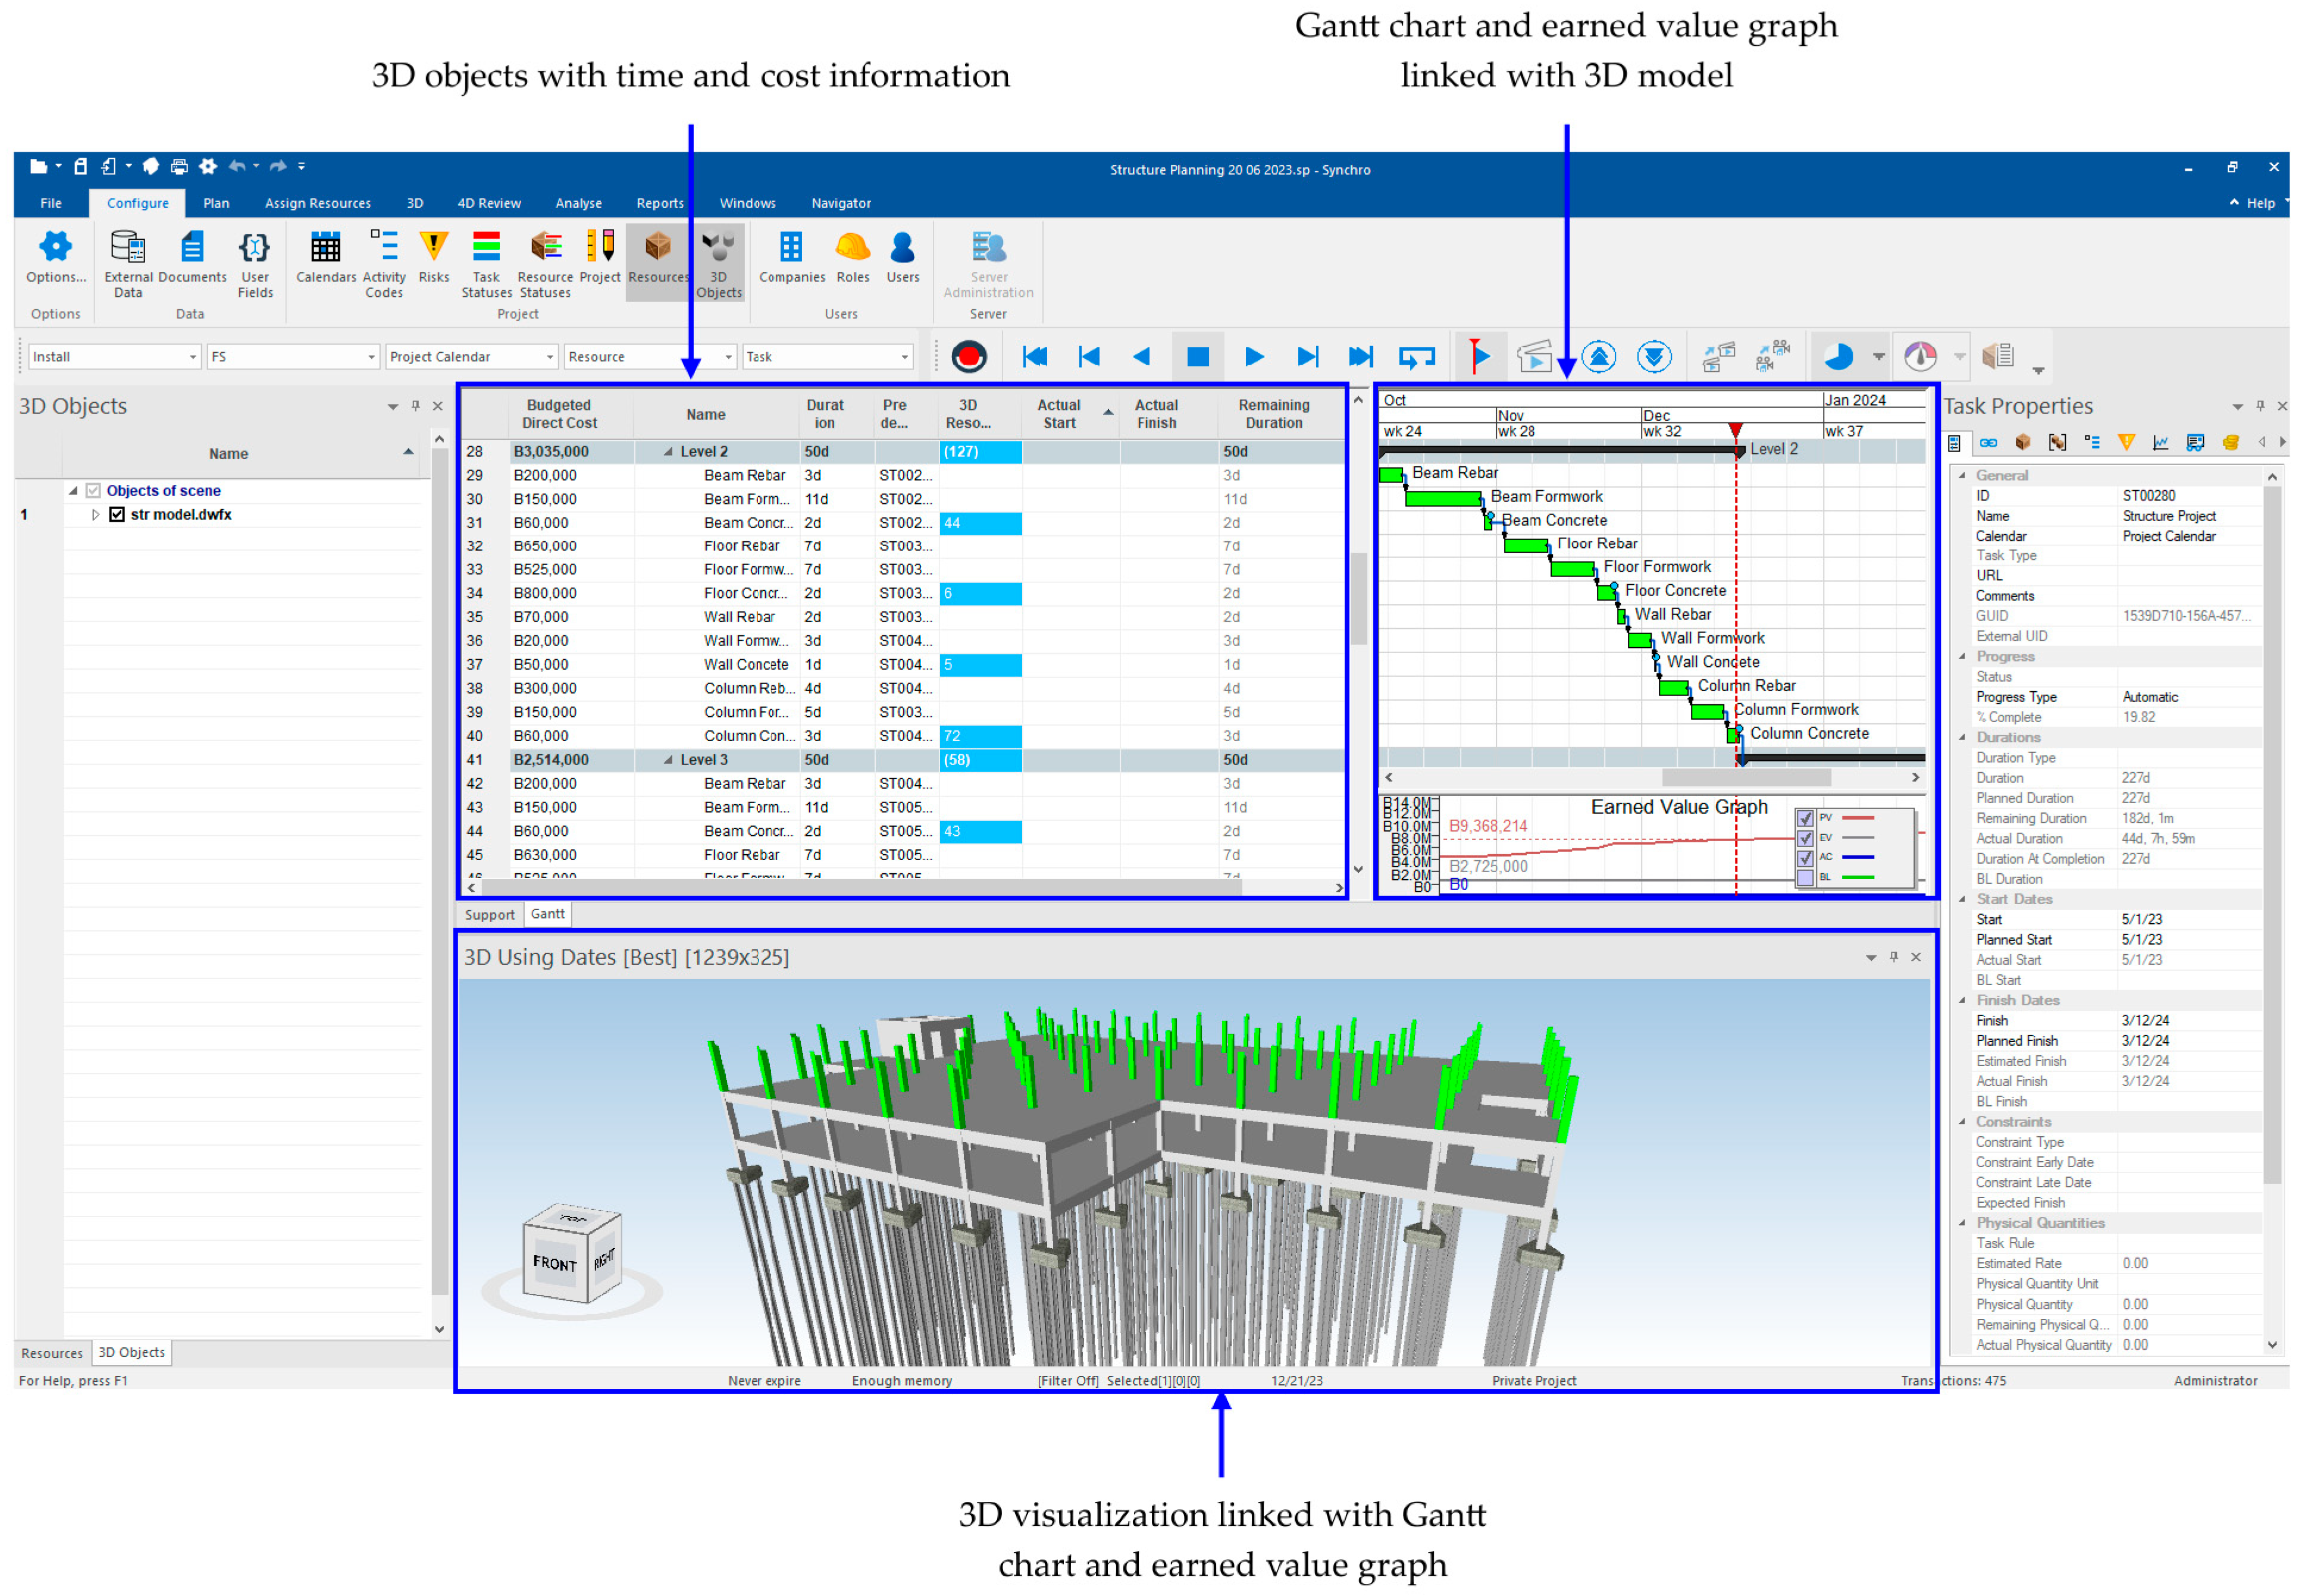
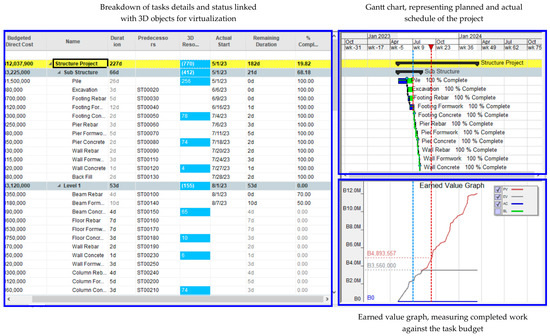
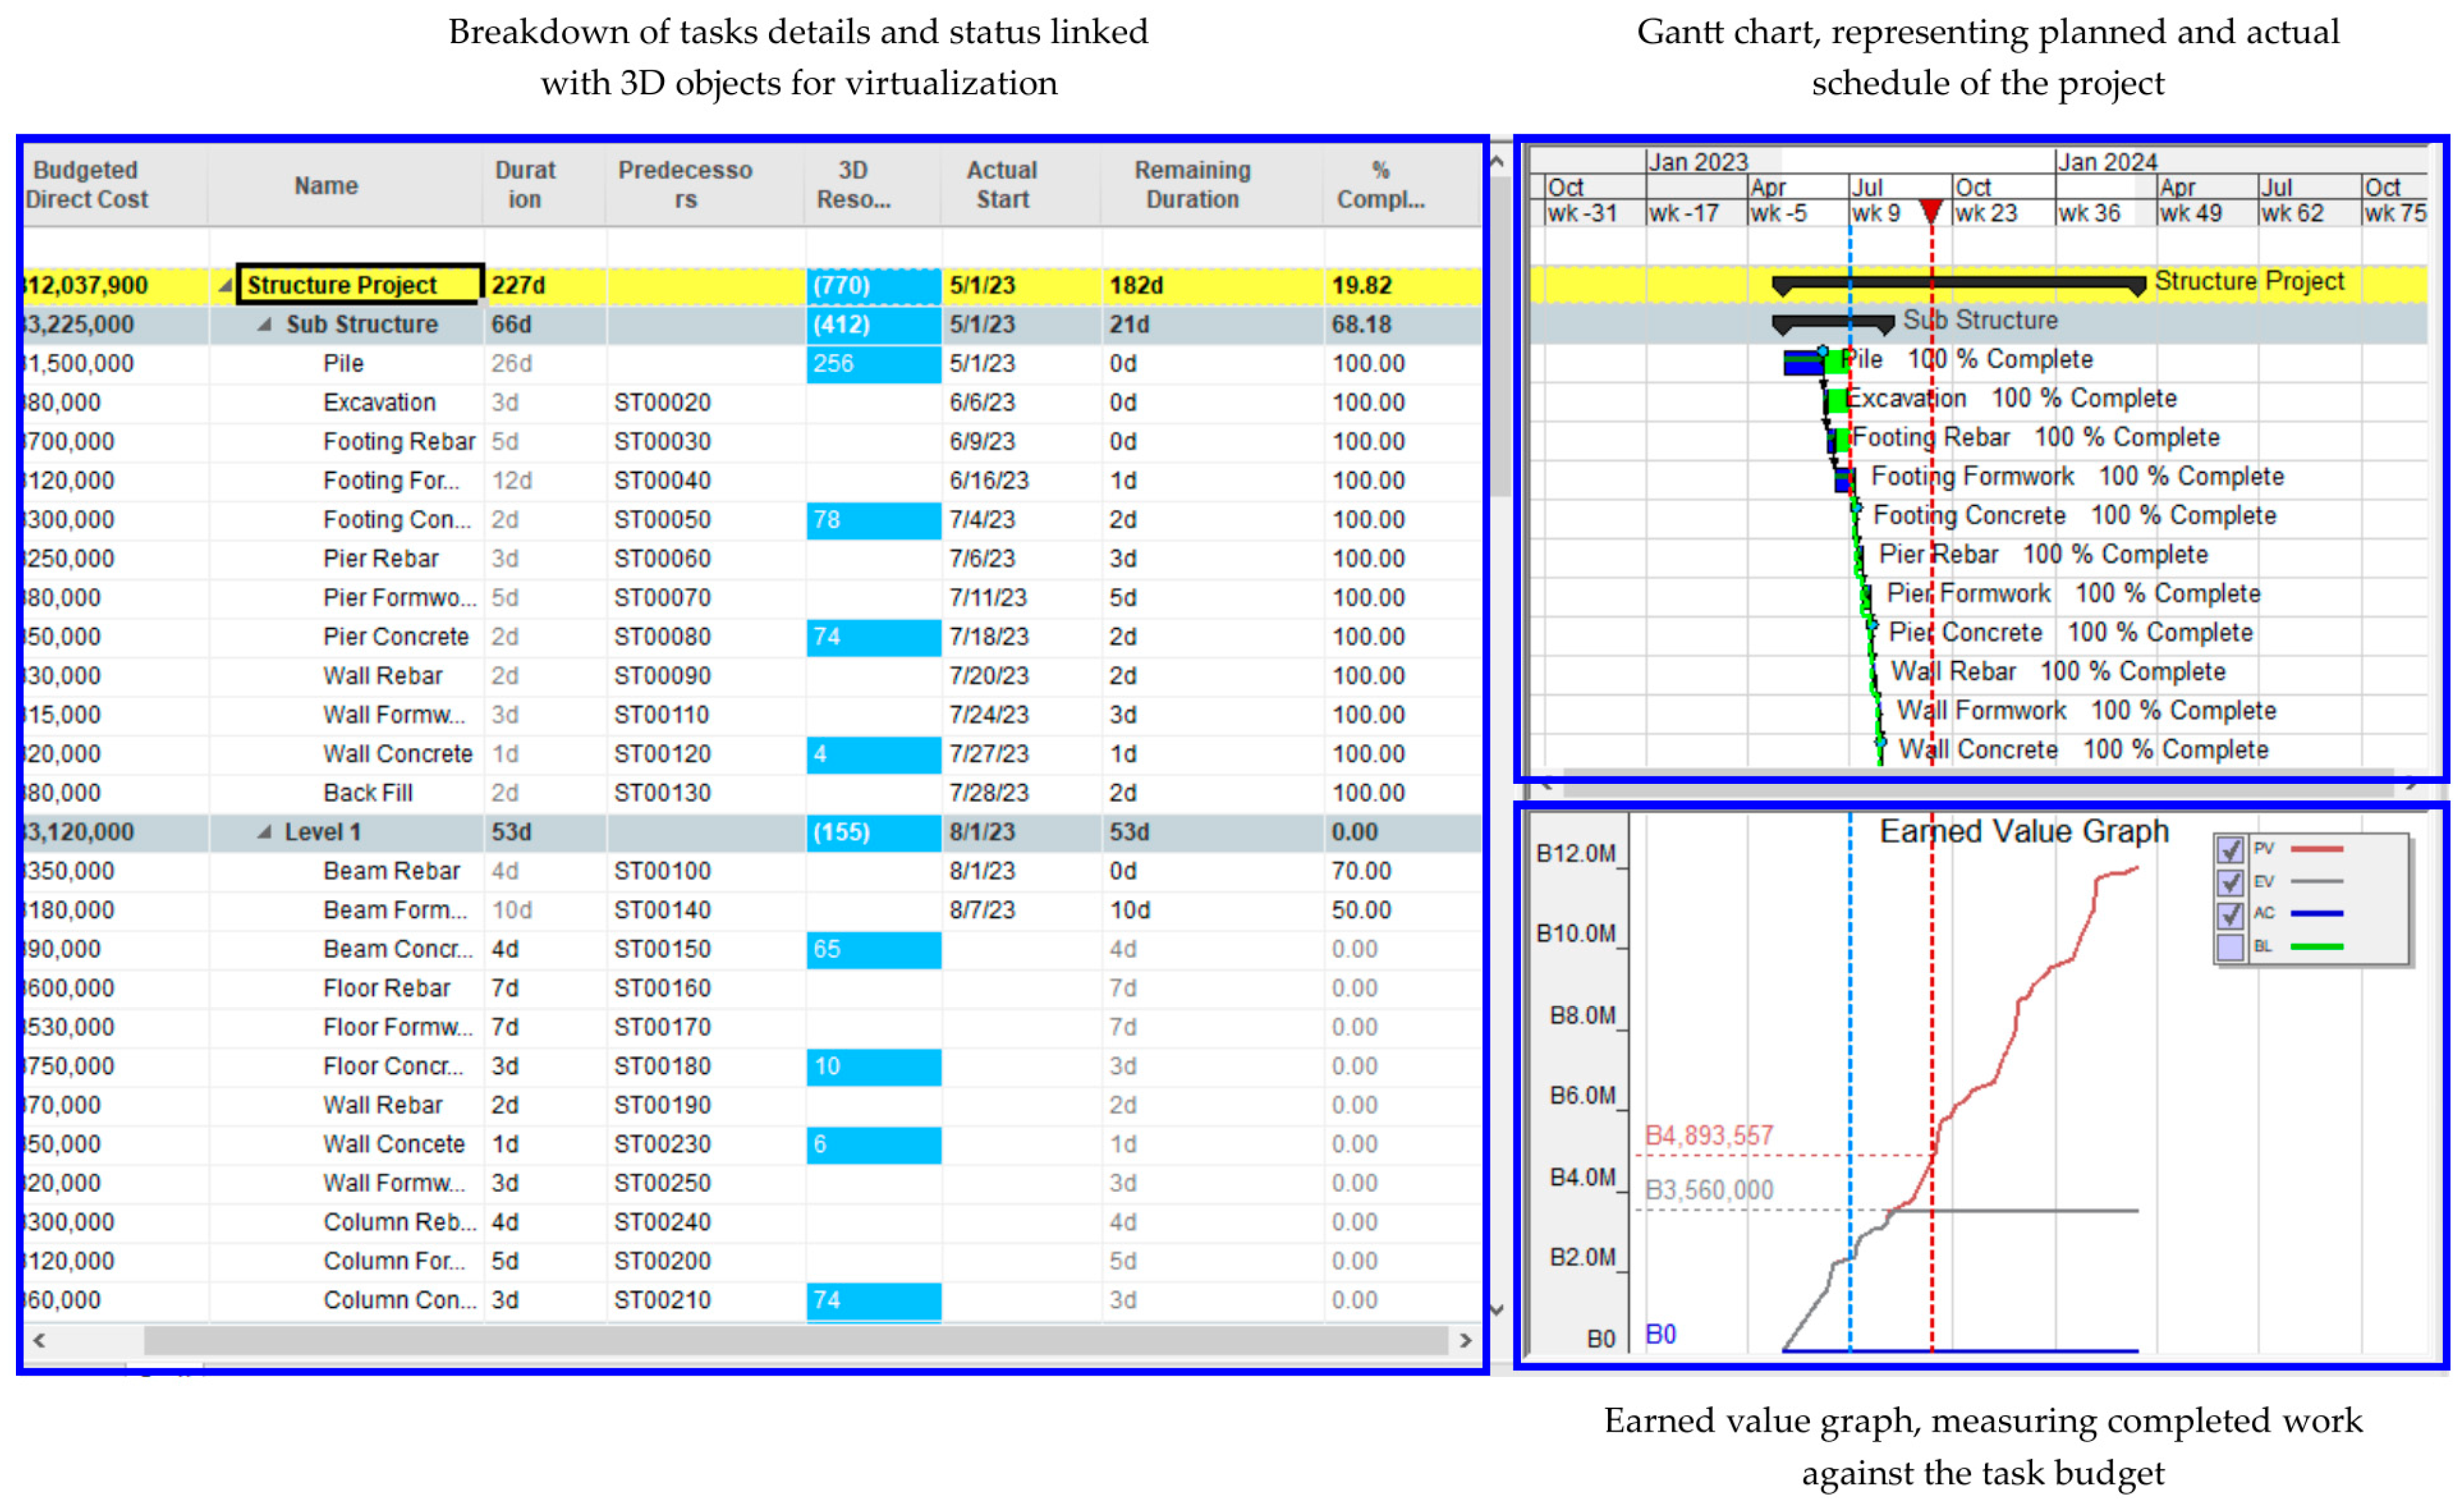

Disclaimer/Publisher’s Note: The statements, opinions and data contained in all publications are solely those of the individual author(s) and contributor(s) and not of MDPI and/or the editor(s). MDPI and/or the editor(s) disclaim responsibility for any injury to people or property resulting from any ideas, methods, instructions or products referred to in the content. |
© 2026 by the authors. Licensee MDPI, Basel, Switzerland. This article is an open access article distributed under the terms and conditions of the Creative Commons Attribution (CC BY) license.