Article

Effects of Coated Infiltrating Organic Silicone in Preventing Microbial Corrosion of Concrete

1
School of Traffic and Environment, Shenzhen University of Information Technology, Shenzhen 518172, China
2
College of Civil and Transportation Engineering, Shenzhen University, Shenzhen 518172, China
3
School of Materials Science and Engineering, Tianjin Chengjian University, Tianjin 300384, China
4
State Key Laboratory of Hydraulic Engineering Intelligent Construction and Operation, Tianjin University, Tianjin 300350, China
5
College of Biological and Environmental Engineering, Tianjin Vocational Institute, Tianjin 300410, China
6
China Construction Eighth Engineering Division Co., Ltd. (North China), Tianjin 300452, China
*
Author to whom correspondence should be addressed.
Buildings 2026, 16(15), 3011; https://doi.org/10.3390/buildings16153011
Submission received: 22 June 2026 / Revised: 22 July 2026 / Accepted: 27 July 2026 / Published: 29 July 2026
(This article belongs to the Special Issue Advances in Composite Structures for Sustainable Building Solutions)

Abstract

This study evaluated the effectiveness of a penetrating organosilicon treatment in mitigating microbiologically induced concrete corrosion (MICC) during 240 d of exposure to sewage containing sulfur-oxidizing bacteria (SOB). The environmental sewage variation, morphology inspection, mineral composition, surface roughness, erosion rate, mass change and mechanical performance were systematically investigated for both coated and uncoated samples under half- and fully immersed corrosion conditions, respectively. The infiltrating organic silicone coating would act as the barrier for delaying the intrusion of sulfate ions generated by sulfur-oxidizing bacteria (SOB) and promoting the hydration process within the mortar, thus enhancing the protection of cementitious materials in the aspects of both microscopic and macroscopic measurement.

1. Introduction

Concrete corrosion in sewer systems was initially attributed primarily to harmful chemicals in wastewater. However, a series of research revealed that the concentration of these chemicals was inadequate to cause concrete corrosion [1,2,3]. Under comparable conditions, microbial attack produced a corrosion depth of 0.8 mm, compared with 0.4 mm under chemical attack [1]. Microbial corrosion of concrete would normally result in surface mortar detachment [4], exposure of aggregates [5], cracking of structures [6,7], and corrosion of reinforcement steels [8,9], thus significantly reducing the service life of concrete structures. Studies have shown that MICC would normally occur due to various factors such as microorganisms present in the sewage [10], nutrients such as carbon [11], nitrogen [12], and phosphorus [13], low pH levels [14], and high sulfuric acid concentrations [15]. A combination of these factors can lead to the proliferation of bacteria, which would produce sulfuric acid [16], leading to the degradation of concrete. Moreover, the type of bacteria can also impact the rate of microbial corrosion [17]. The economic impact of MICC could be significant. For instance, approximately 10% of sewage pipelines in Los Angeles exhibit obvious signs of corrosion, of which the repairment was estimated at around 400 million euros [2]. In Germany, it would cost around 100 billion euros to repair entirely destroyed sewage systems each year [18]. In Flanders, the economic loss caused by MICC on sewage pipelines could reach approximately 5 million euros, accounting for approximately 10% of the total sewage cost [19]. Therefore, effective and practical methods are needed to mitigate MICC.
Various methods have been proposed to release the microbial corrosion in concrete structures [20,21,22,23]. Currently, research on the protection against MICC mainly involves the addition of biocides (biocide enhancers) [24,25], mineral admixtures [26], and surface coatings [27]. The antimicrobial agents could restrain the microbial reproduction in sewage, thus reducing the generation of sulfuric acid [22,28]. Additionally, considerable research has been conducted on the addition of mineral admixtures to enhance concrete durability. The presence of mineral admixtures could lower the detrimental effects of acids on concrete [26]. For instance, it has been experimentally verified that hematite is chemically active upon acid exposure, improving a short-term increase in acid neutralization capacity [29]. Although these methods could provide some protection, they do not completely solve the problem caused by MICC. The utilization of coatings could prevent the penetration of sewage and the growth of bacteria on the concrete surface, providing a direct solution for restraining MICC. The effectiveness of surface coating is affected by the condition of concrete substrate, the mode of application, the coverage rate and texture of the substrate [30]. As for the types of coatings, it was experimentally observed that polyurethane and epoxy-based concrete surface coatings performed better than other generic types of coatings [31]. The chloride resistance of infiltrating coatings gradually exceeds that of the organic film coatings with the aging process, thereby exhibiting longer protection for concrete structures [32], thus providing the feasibility in the prevention of MICC in the long term. Penetrating silane-based organosilicon treatments have been extensively studied for conventional concrete durability. Previous investigations have demonstrated their ability to decrease capillary water absorption and retard chloride transport, including during long-term exposure [33,34,35]. Nevertheless, these findings have been obtained primarily under water or chloride related deterioration conditions and cannot be directly extrapolated to MICC, which involves coupled microbial colonization, sulfur oxidation, sulfate transport, and cement-matrix alteration. Systematic long-term investigations of penetrating organosilicon treatments under SOB sewage, particularly under different immersion conditions, remain limited.
This study investigated the effectiveness of infiltrating organosilicon treatment in mitigating MICC. Coated and uncoated mortar specimens were exposed under semi-immersion and full-immersion conditions. The exposure-medium pH and sulfate concentration, macroscopic and microscopic morphology, phase composition, surface roughness, mass change and compressive strength were evaluated using SEM, XRD, ultra-depth-of-field microscopy, and mechanical testing. The main aim of this research is to provide a practical solution for the prevention and control of the sewage pipelines.

2. Materials and Methods

2.1. Materials and Samples Preparation

The OPC 42.5 (Chinese standard) from Shunxin Cement Co., Ltd. in Tangshan City was used with natural river sand in a fineness modulus of 2.8 and clean tap water. The mortar specimens with dimensions of 40 mm × 40 mm × 160 mm were prepared and cured for 28 days with the water:cement:sand set as 0.5:1.0:2.0. The wastewater was taken from the primary sedimentation tank of the wastewater treatment plant, of which the composition index is shown in Table 1. The wastewater culture medium for sulfur-oxidizing bacteria (SOB) contained Na2HPO4 1.2 g/L, KH2PO4 1.8 g/L, (NH4)2SO4 0.1 g/L, CaCl2 0.03 g/L, FeCl3 0.02 g/L, MgSO4 0.1 g/L, MnSO4 0.02 g/L and Na2S2O3 10 g/L. The SILRES® BS CREME C paste product from Wacker Company (Munich, Germany) was used as infiltrating organic silicone with the main composition of (2,4,4-trimethylpentyl) triethoxy silane.

2.2. SOB Corrosion Test

After 28 days of curing, the samples were placed in an oven at a constant temperature of 60 °C for 5 h to dry. Then, the surface dust and impurities were cleaned by a soft brush. Sample tests were divided into a protection group and a control group. In both groups, SOB was cultivated to the fourth generation and added to sterilized sewage culture medium, supplemented with 10 g/L sodium thiosulfate. The corrosive solution was replaced every 15 d throughout the 240 d experimental period. In the protection group, all the surfaces, except for the test surface, were sealed with paraffin wax and left to dry for 12 h at room temperature. Infiltrating organic silicone coating was then applied uniformly to the reserved test surface for 5 to 7 times in one direction with a soft brush. After the application, the sealed samples were put in air seasoning for 7 days to ensure adequate bonding with the silicone.
The coating process is shown in Table 2, where “One 200” and “Two 100” represent the coating for one time with an application amount of 200 g/m2 and 100 g/m2 (6 h interval) respectively. The penetration depth of the infiltrating organic silicone was measured using a hydrophobic indication method. After silicone application, the specimens were naturally cured for 7 d, with all surfaces except the treated surface sealed using paraffin wax. The specimens were then fractured by a flexural test and dried at 60 °C for 24 h. Water was sprayed onto the freshly exposed fractured side surface. The untreated region absorbed water and darkened, whereas the silicone-penetrated region remained non-wetted, producing a distinct boundary between the water-absorbing and non-water-absorbing zones. The perpendicular distance from the treated surface to this boundary was measured. The penetration depth was calculated as the arithmetic mean of measurements taken at 8 to 10 locations on the same fractured surface, and the results for the different application procedures are listed in the final column of Table 2. Under the single coated method, the infiltrating organic silicone penetrated the mortars’ pores and combined to form a waterproof organosilicon resin. When the coating amount is less than 250 g/m2, the organosilicon can fully bond with the concrete, of which the main influencing factor is the usage. When the coating amount is greater than 250 g/m2, the excess liquid fails to reach the optimal usage neither, of which the penetration depth was similar to the usage of 200 g/m2. Under the double coated method, the first coating application would normally not achieve the optimal organosilicon usage. When the second coating was applied after a 6 h interval, the formed waterproof organosilicon resin hindered its penetration. In addition, the second coating application might damage the organosilicon resin formed during the first coating. In conclusion, the optimal usage of infiltrating organic silicone was adopted as 250 g/m2 for one application, which would be used in the following experimental parts. By way of contrast, the control group consisted of concrete samples without the infiltrating organic silicone coating. The infiltrating organic silicone treatment samples are labeled as follows: SB240 and SQ240 denote the uncoated control group with a semi-immersion age and a full-immersion at the age of 240 days, respectively; YSB240 and YSQ240 represent the coated protection group with a semi-immersion age and a full-immersion at the age of 240 days, respectively. One independent mortar specimen was tested for each combination of coating condition and immersion mode under various corrosion ages.
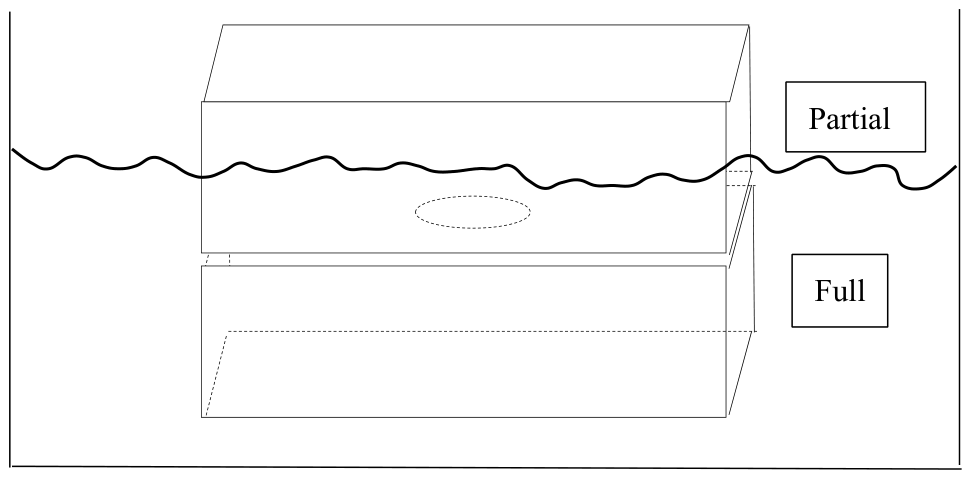
Seven corrosion age periods were selected for the experimental observation and testing: the time when the surface roughness or color began to change, 30 d, 60 d, 90 d, 120 d, 180 d and 240 d. Considering that the most of MICC occurs at the gas–liquid interface [36,37,38] due to fluctuating water levels [36,39], turbulent flow [40,41], and drying-wetting cycles [42] in concrete structures such as sewage pipes, primary sedimentation tanks and secondary sedimentation tanks, two immersion methods were adopted to simulate the corrosion damage caused by SOB, namely the partial and full immersion, which are schematically represented in Figure 1. Sample tests were divided into a corrosion group and a control group. In the corrosion group, SOB was cultivated to the fourth generation and added to sterilized sewage culture medium, supplemented with 10 g/L sodium thiosulfate. The corrosive solution was replaced every 15 d throughout the 240 d experimental period.

2.3. Medium Variation

In order to analyze the environmental variation with SOB, nutrients (Na2S2O3) and sewage culture medium by coatings during MICC process, the pH and SO42− concentration were tested by pH test strips and ICS-1500 Ion Chromatography (CA, USA), respectively.

2.4. Microstructures Observation

For the microstructure analysis, samples were coated with gold by JEC-3000FC Auto Fine Coater, followed by the microscopic observation under a JSM-7800F scanning electron microscope (SEM, Tokyo, Japan).

2.5. Mineral Composition Analysis

The mineral composition was conducted with a X-ray diffractometer (XRD, Ultima IV, Tokyo, Japan), with a starting angle of 5°, an ending angle of 90° and a scanning step of 0.02° with the speed of 8°/s for the distinguishment before and after MICC.

2.6. Surface Roughness Variation

An ultra-depth of field microscope (VHX-6000, Osaka, Japan) was utilized to photograph the corrosion samples and calculate their surface roughness. The degree of corrosion was characterized by evaluating the roughness changing rate, which is calculated by the following formula:
R = R a 1 R a 0 R a 0 × 100 %
where R, Ra0 and Ra1 are the roughness change rate, the roughness value before corrosion (μm) and the roughness value after corrosion (μm).

2.7. Mass Change

The mass change was measured for evaluating the degree of corrosion in the form of mass loss rate:
L = m 0 m 1 m 0 × 100 %
where L, m0 and m1 are the mass loss rate, the mass of mortar samples before corrosion (g) and the mass of mortar samples after corrosion (g).

2.8. Mechanical Performance Evolution

The compressive strength of mortar samples was conducted under the GBT 50081-2019 (Chinese standard) with the loading speed of 0.6 MPa/s.

3. Results and Discussion

3.1. pH Value and SO42− Concentration

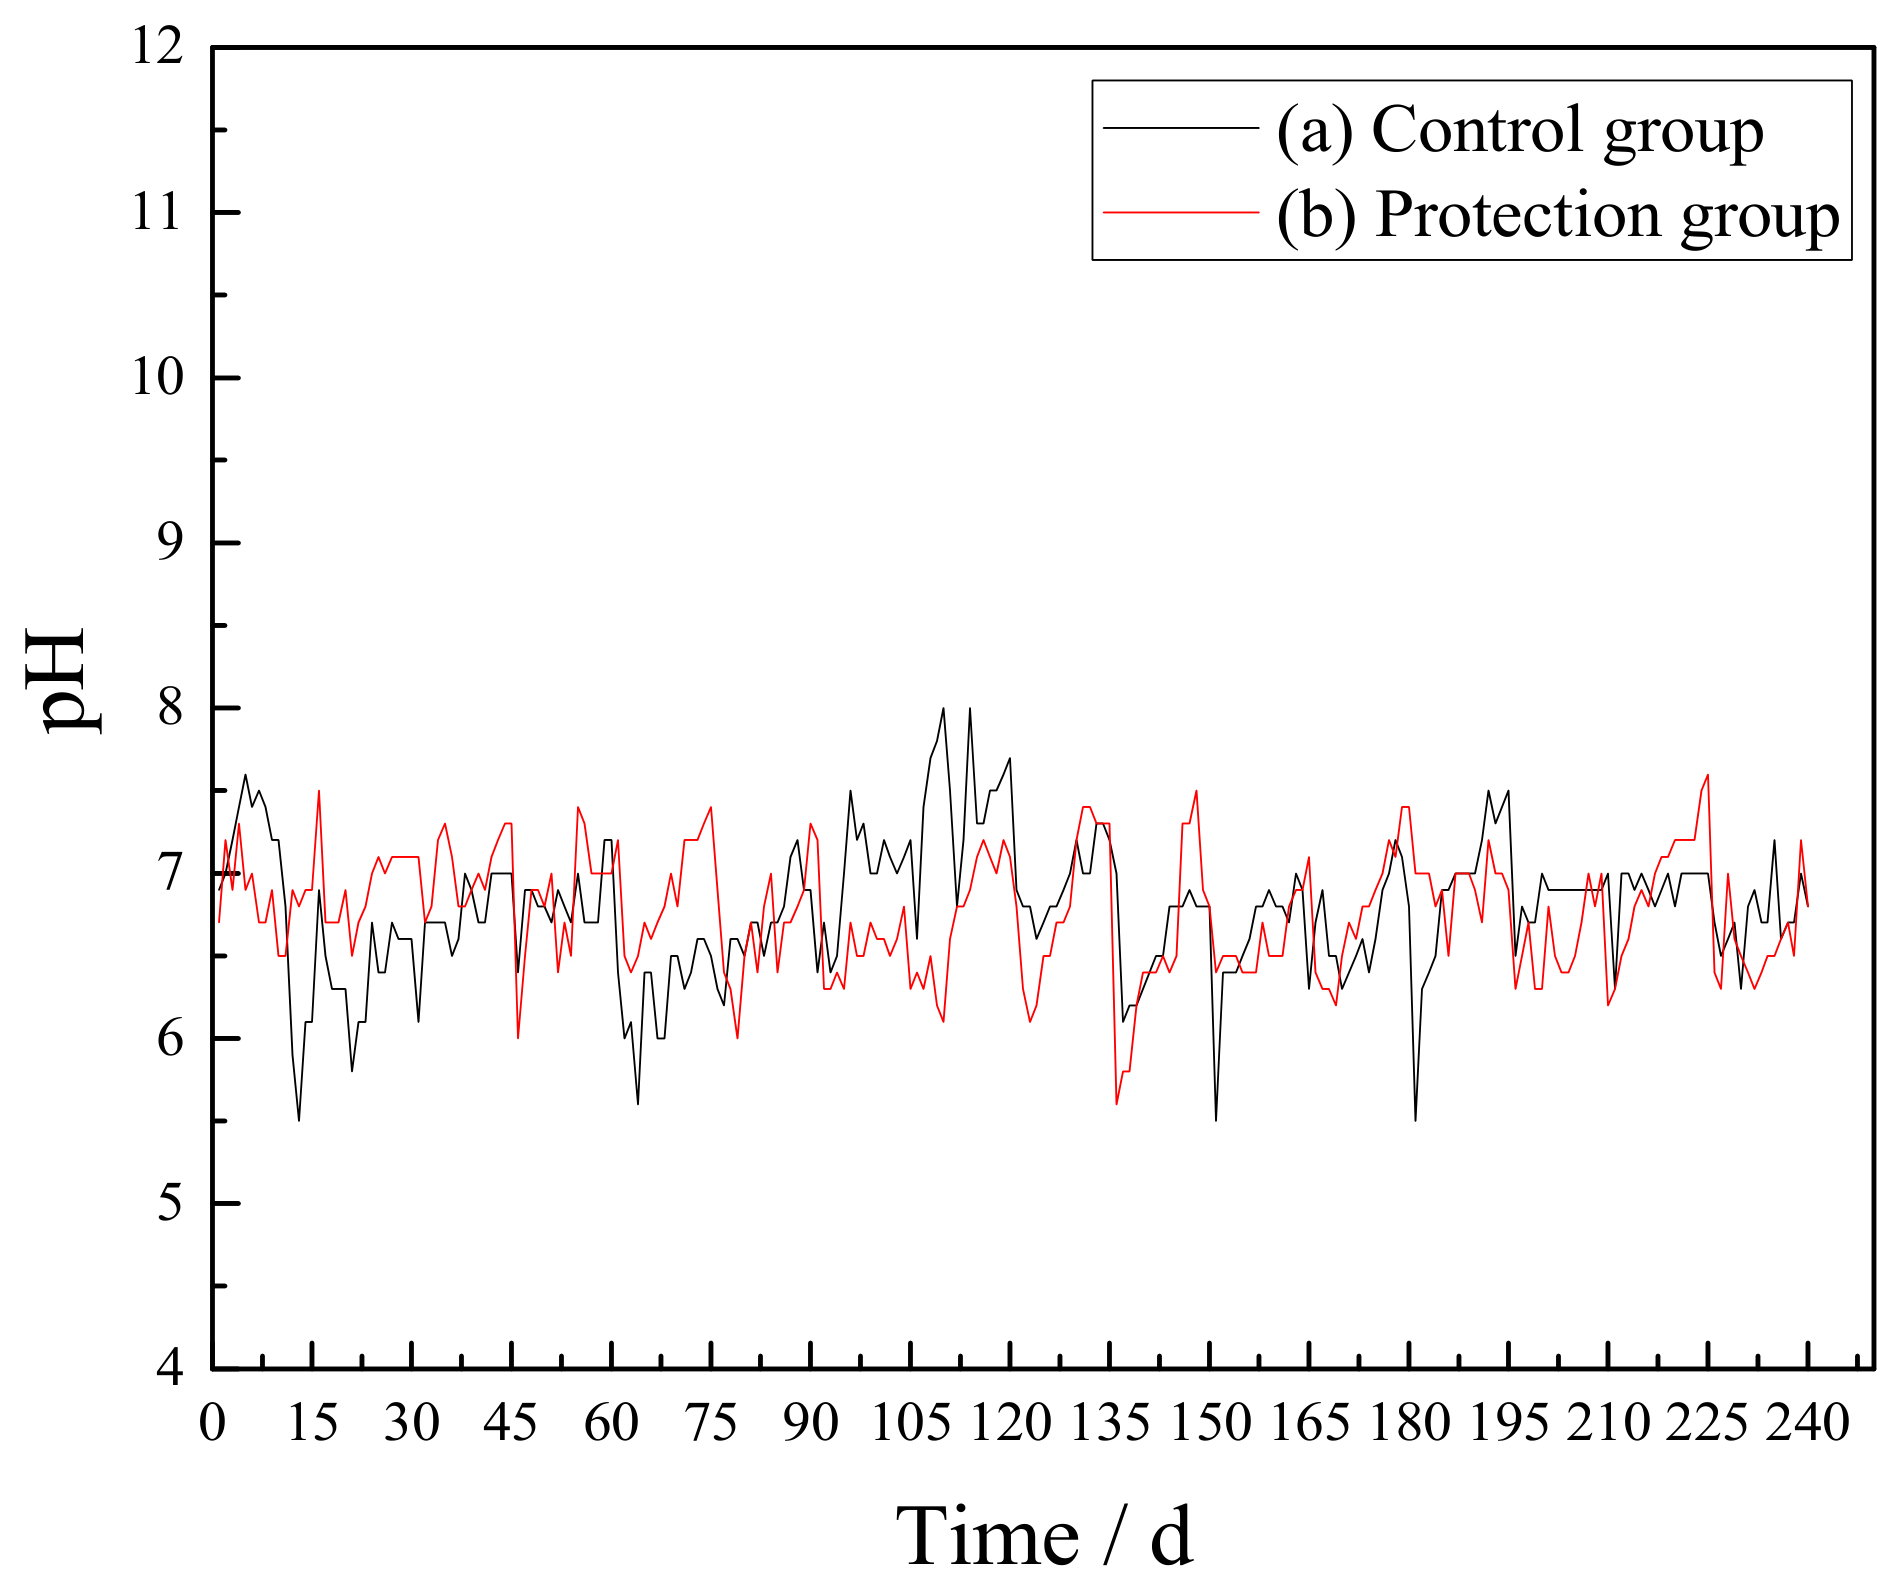
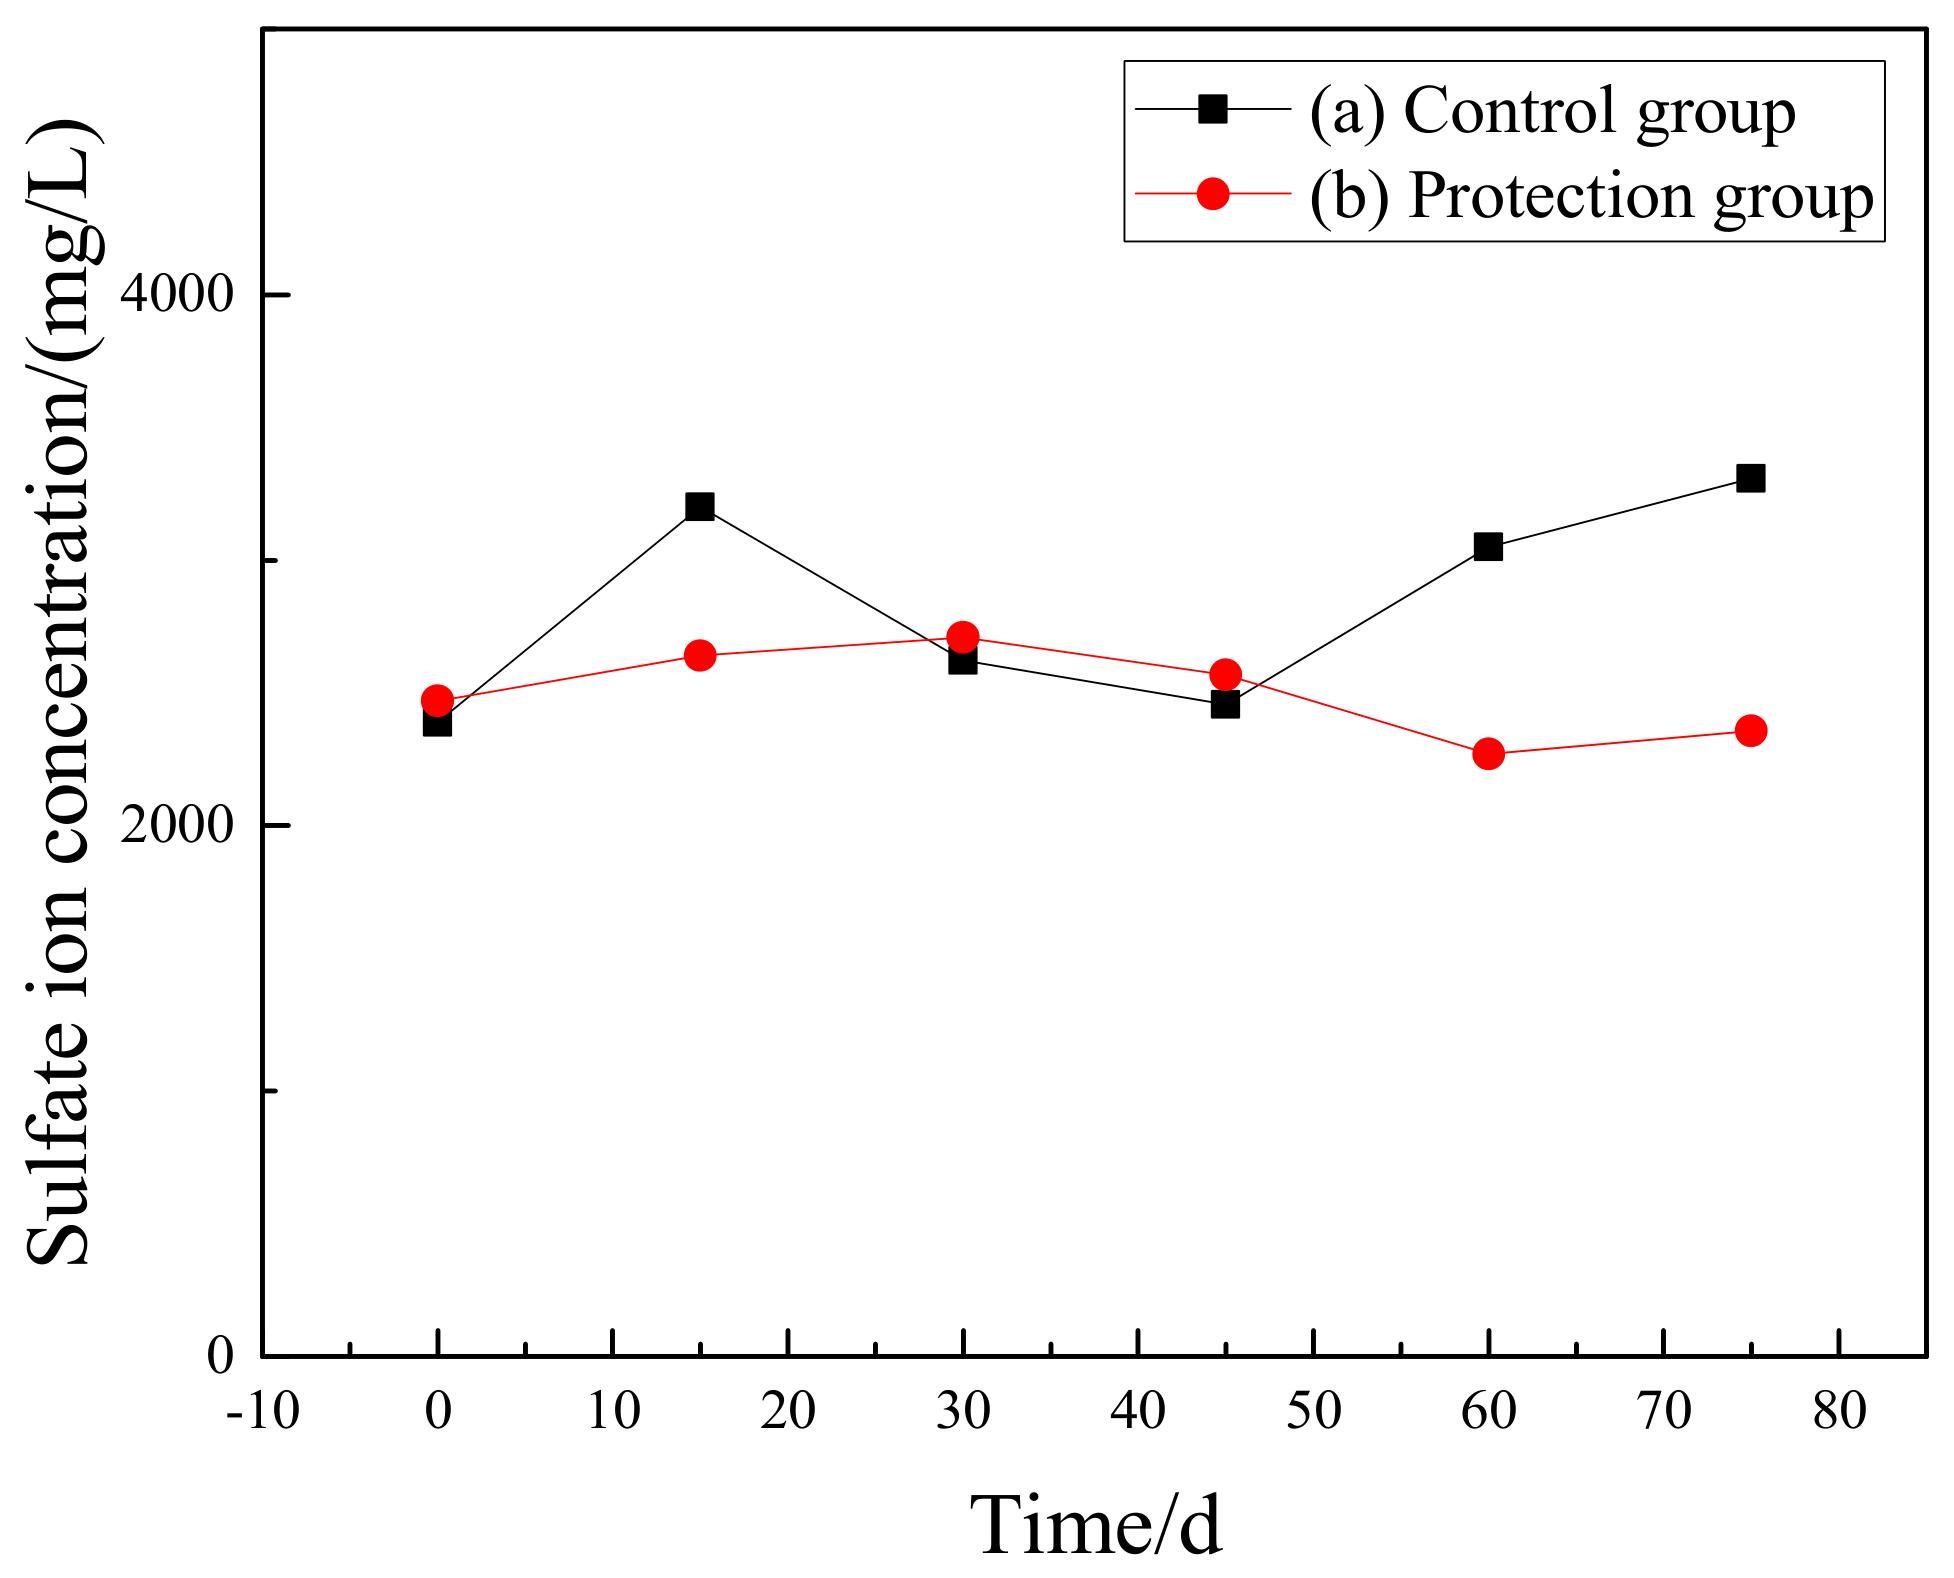
The pH values of the solutions were measured every day, as shown in Figure 2, where the total amount of infiltrating organic silicone used in the protection group is 250 g/m2 (Figure 2 (b). The pH values of both solutions remained around 7.0 in the whole corrosion process, indicating that the application of infiltrating organic silicone on the mortar surface would not affect the transformation of sodium thiosulfate by SOB in generating the sulfuric acid and reducing the pH value [16,43,44]. The SO42− concentration in the solutions after 0 d, 15 d, 30 d, 45 d, 60 d, and 75 d of samples’ immersion was presented in Figure 3. It is noted that the sulfate ion concentration is 459.45 mg/L when Na2S2O3 is not added to the sterilized sewage. Namely, the sodium thiosulfate was converted into sulfate ions under the action of SOB without the influence of infiltrating organic silicone. The difference in sulfate ion concentration between the two groups was negligible with the addition of equal amounts of sodium thiosulfate, from which we can deduce that the sodium thiosulfate in the sewage environment of the samples underwent the same reaction process whether infiltrating organic silicone was applied or not. Since the variation in SO42− concentrations tested were not significant, further testing was not conducted.

3.2. Appearance Observation

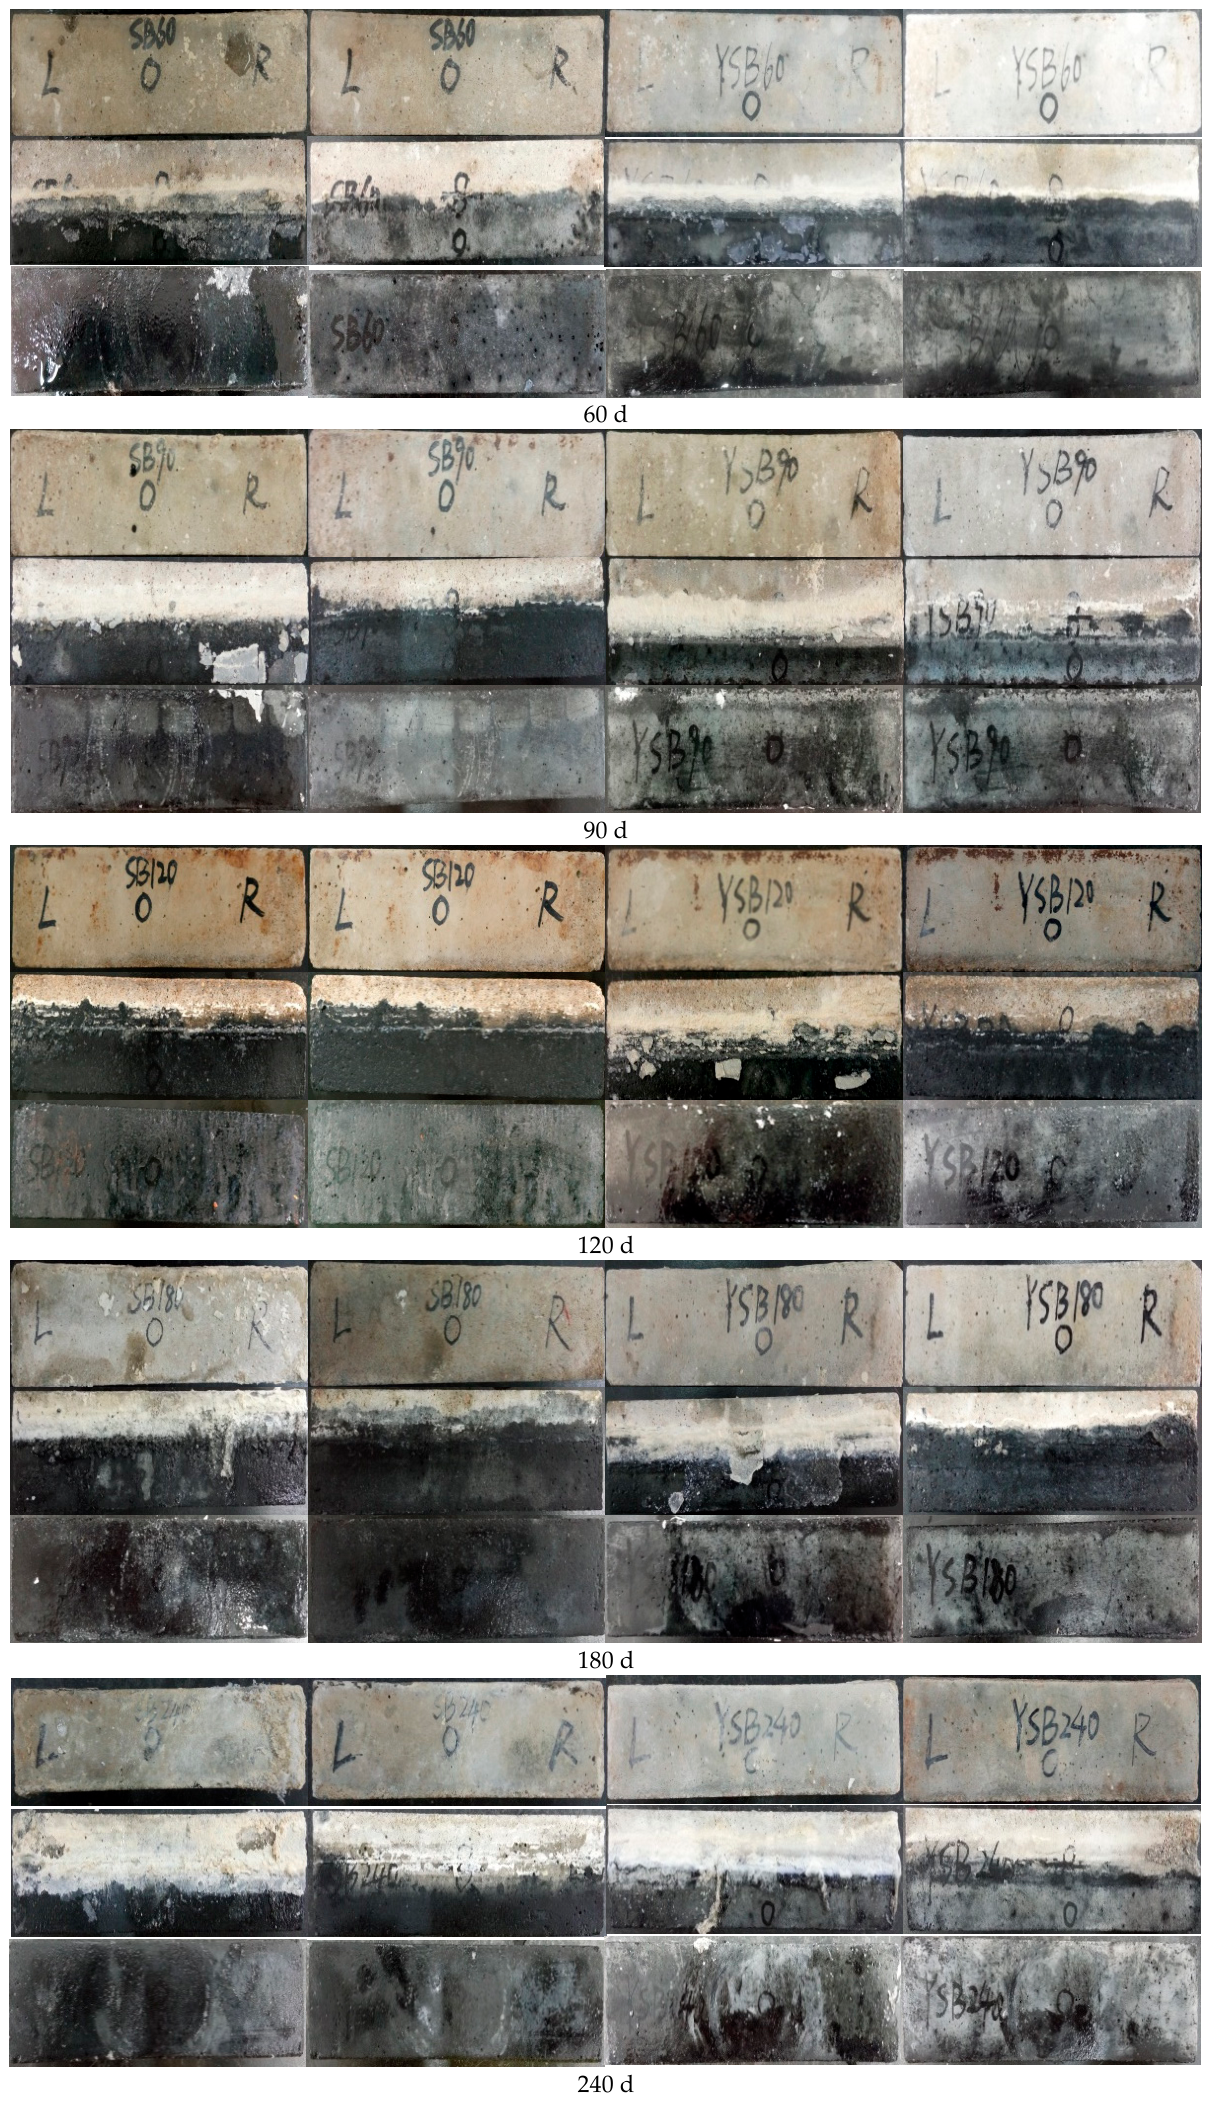
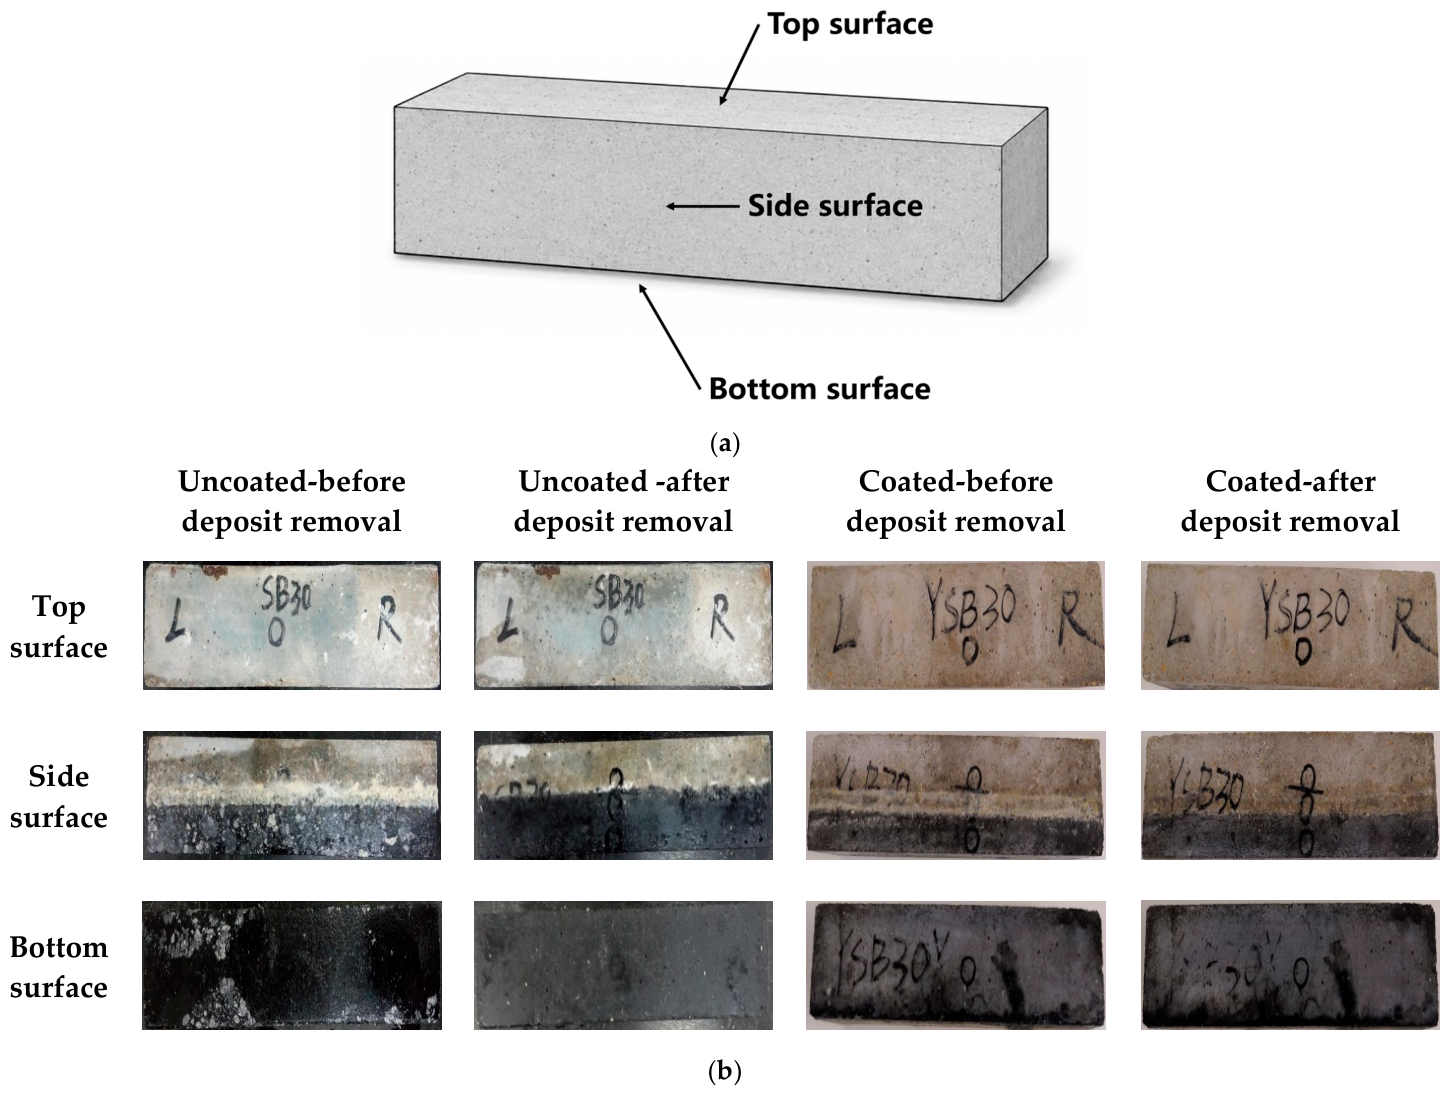
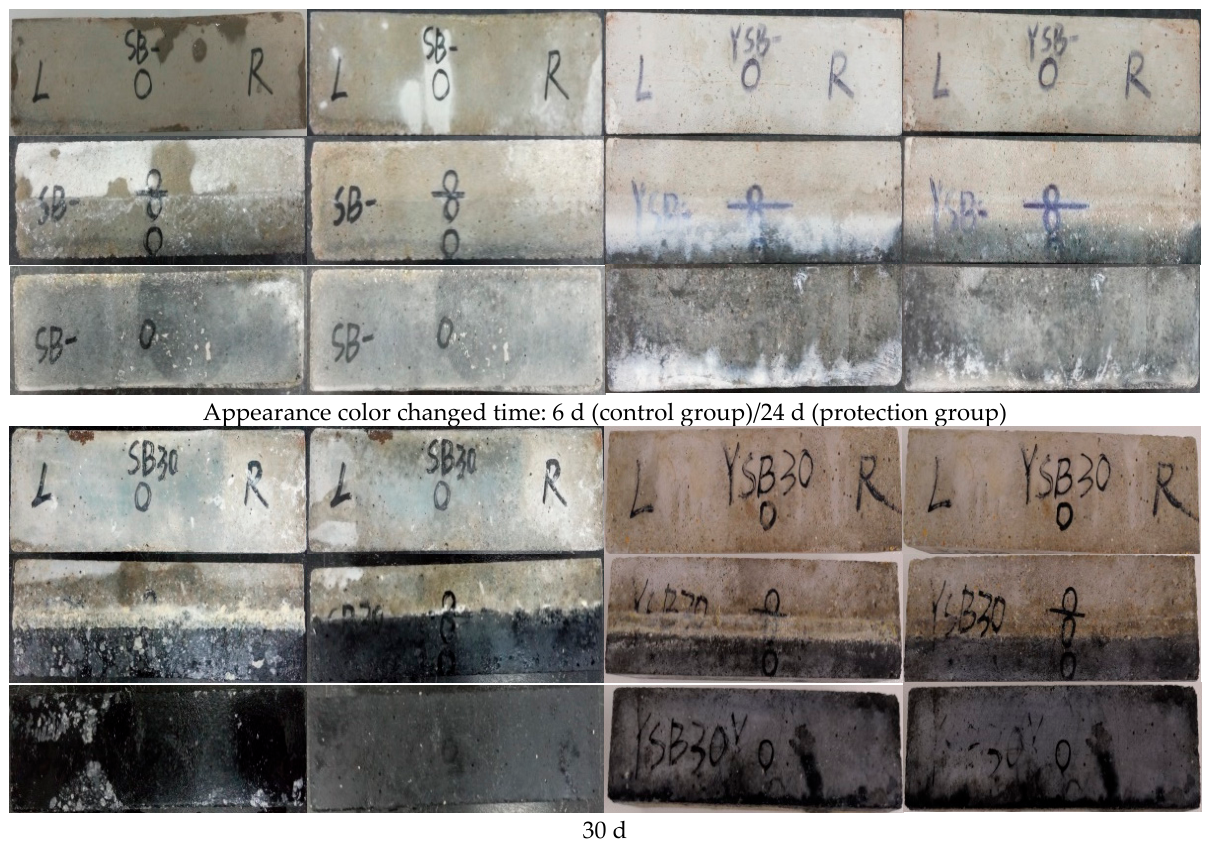
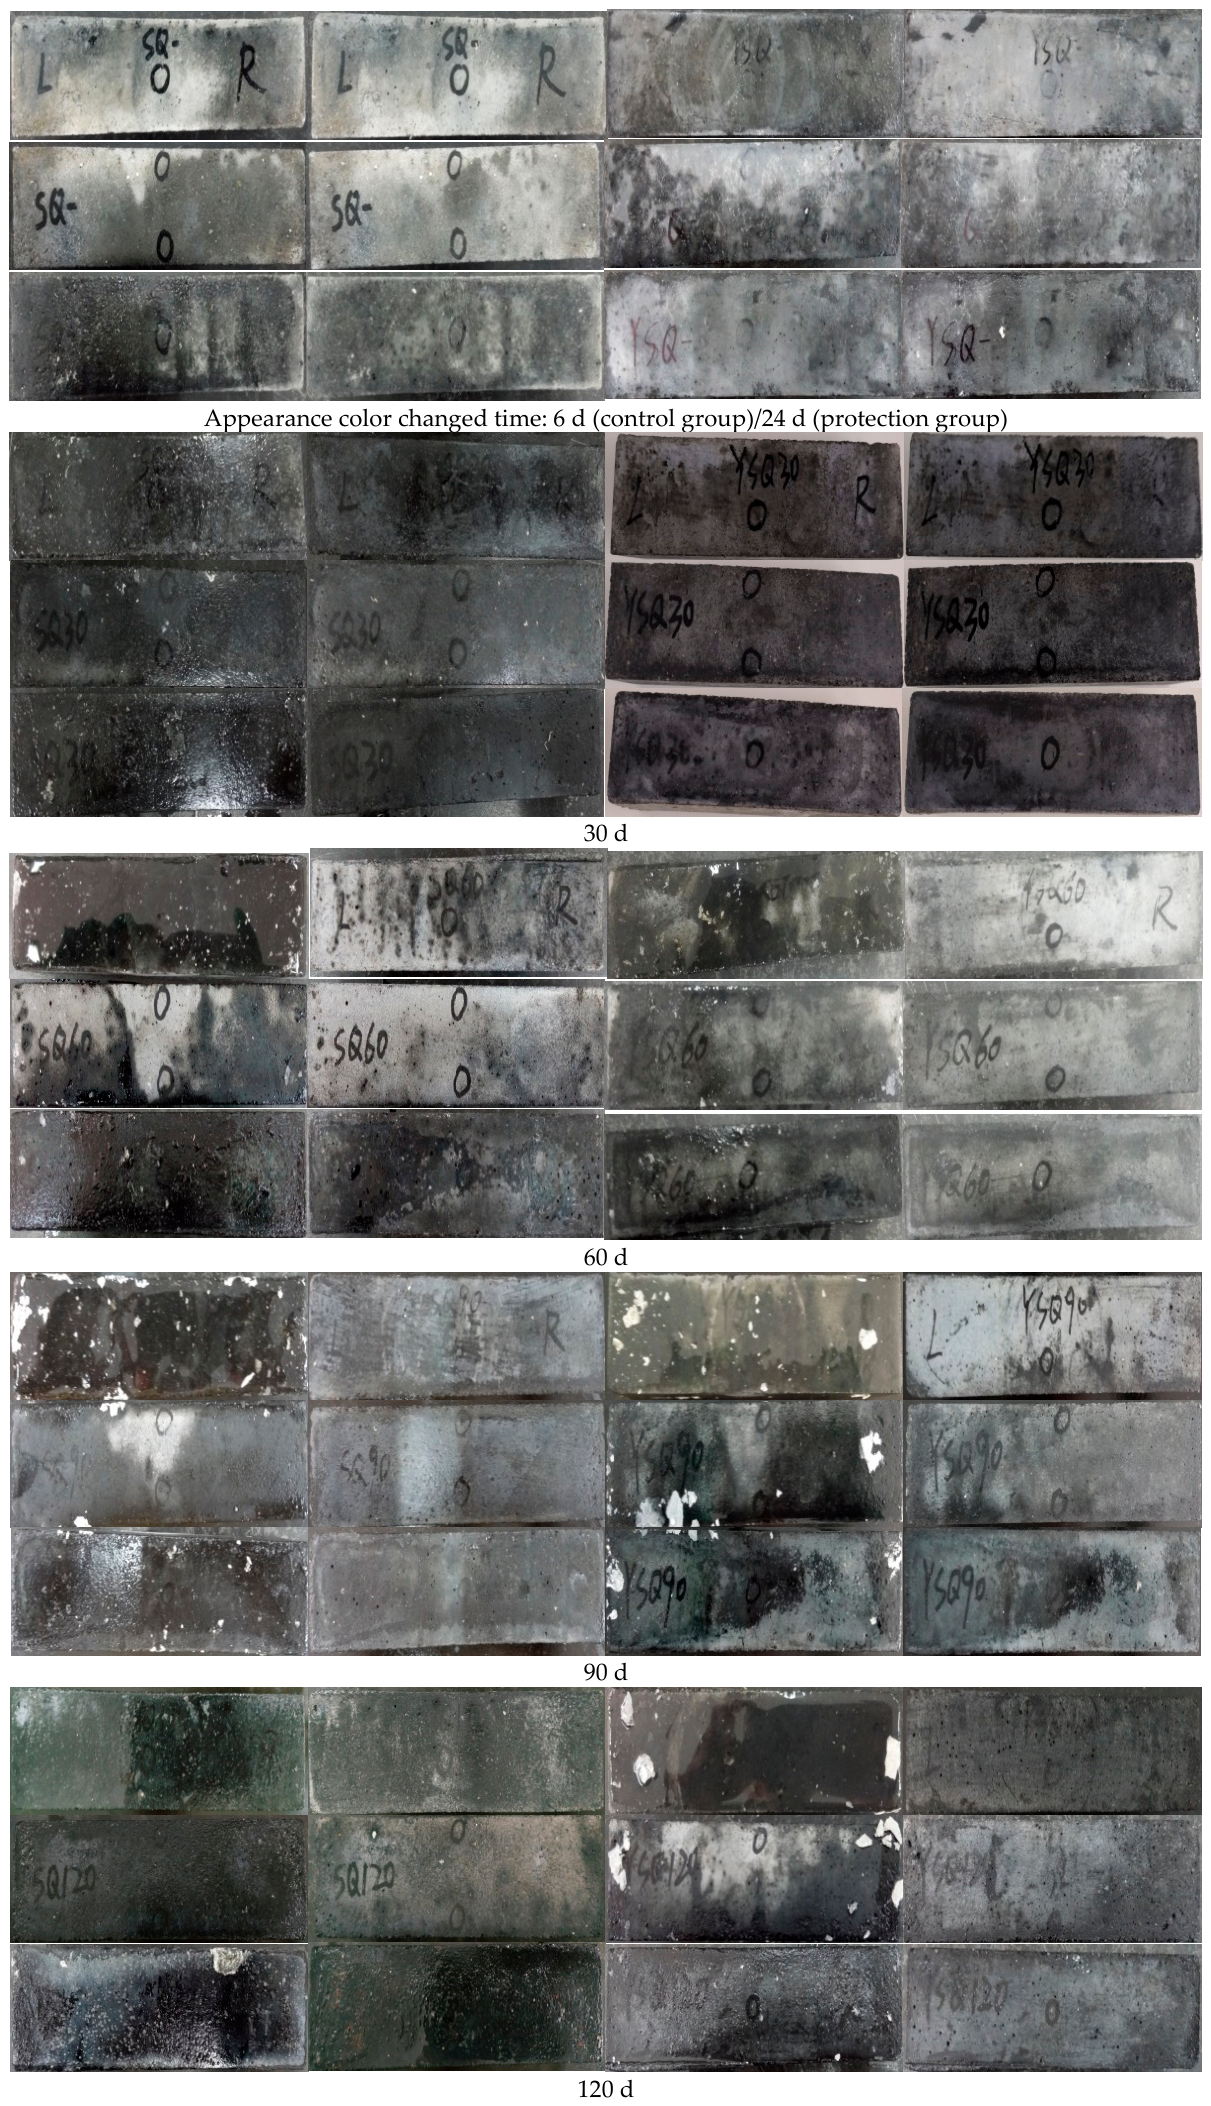
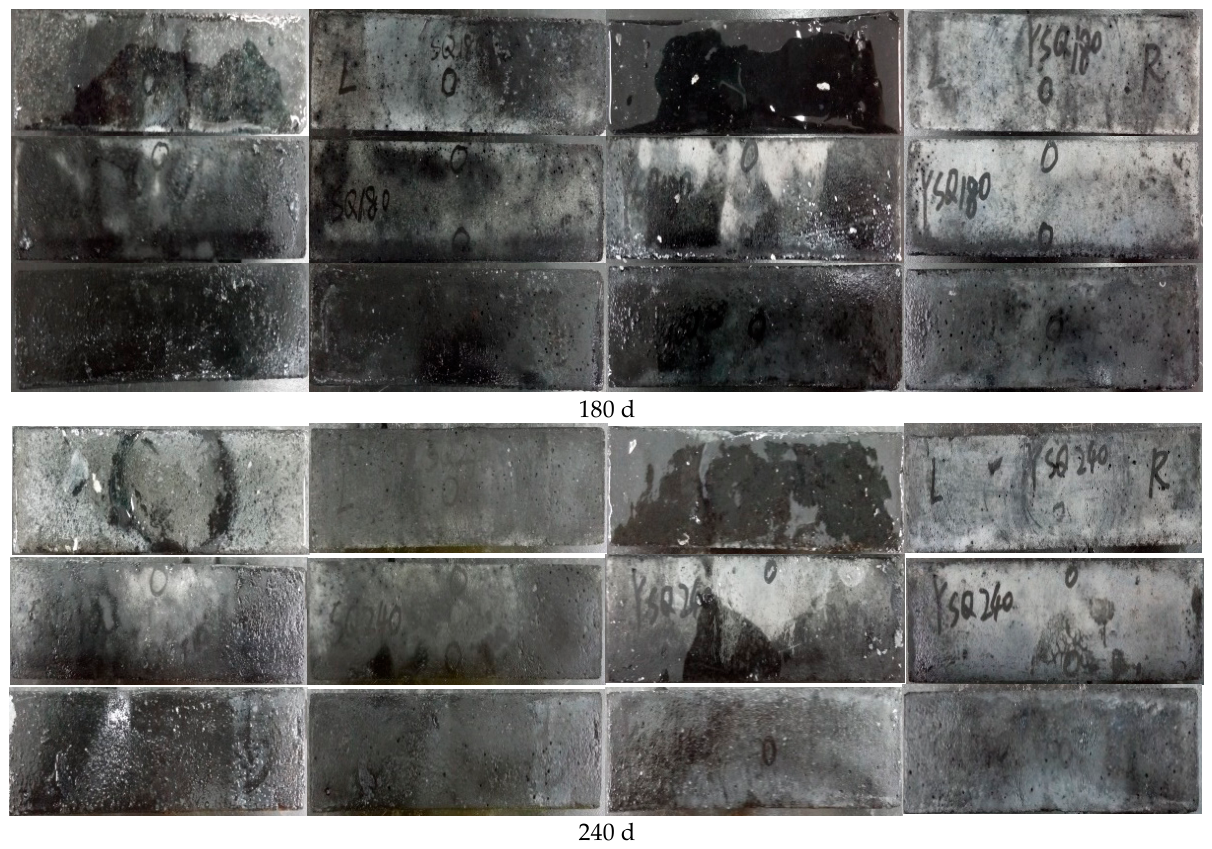
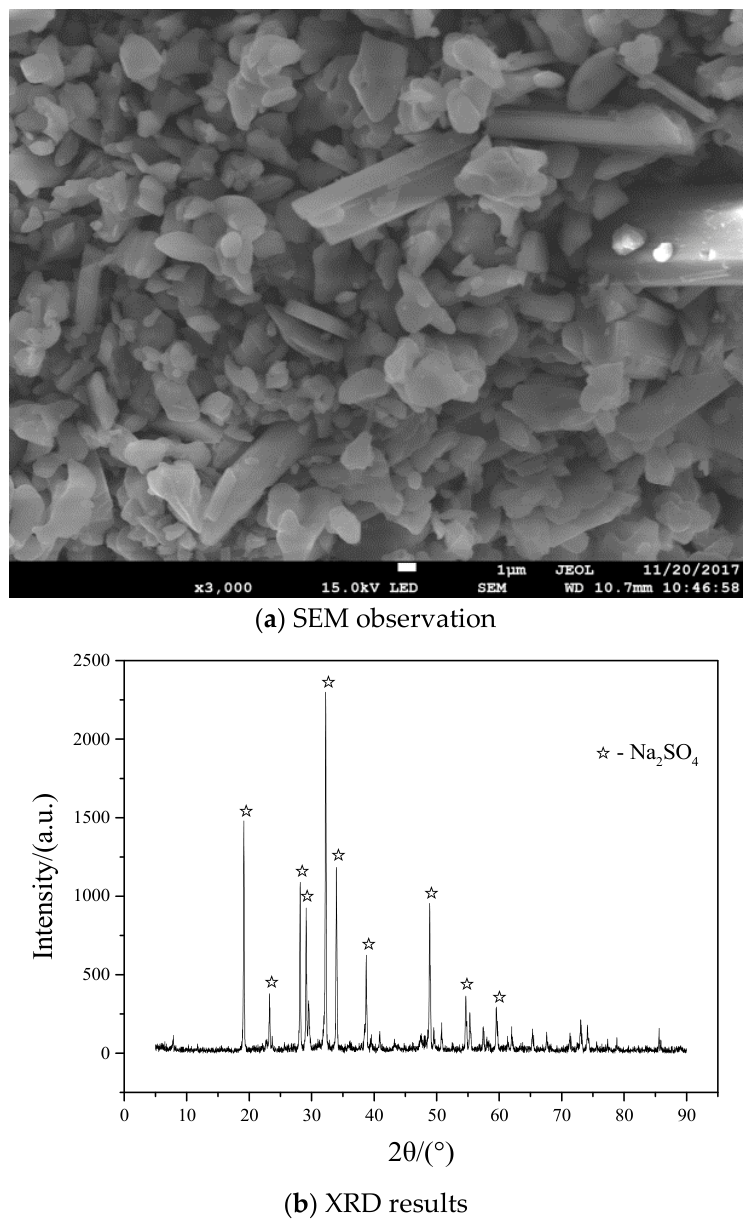
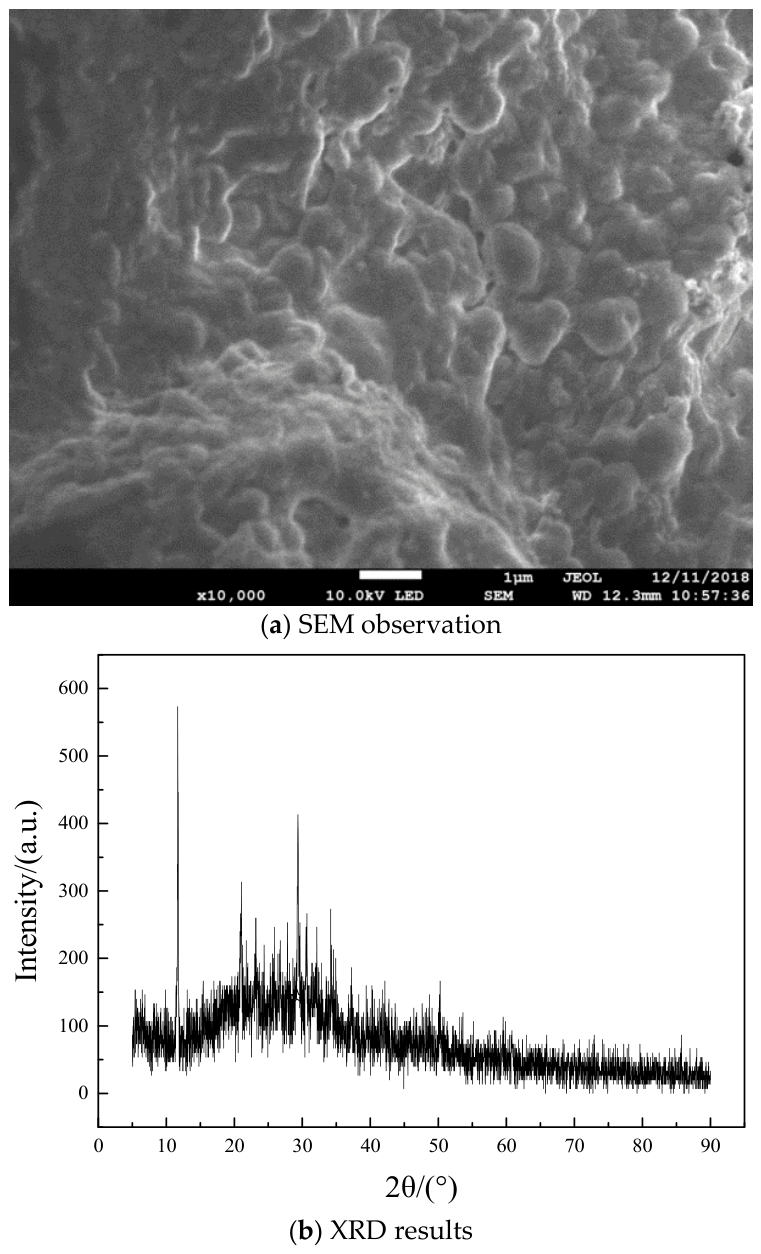
Figure 4, Figure 5, Figure 6, Figure 7 and Figure 8 present a connected sequence for evaluating the macroscopic surface evolution and representative surface products of the specimens. Figure 4 provides the layout guide used to interpret the photographic matrices in Figure 5 and Figure 6. Figure 5 and Figure 6 subsequently show the chronological appearance evolution of the semi-immersed and fully immersed specimens, respectively. Based on these macroscopic observations, two representative surface features were selected for further characterization. The white crystalline deposits observed on the top surface of the uncoated semi-immersed specimen at 240 d were analyzed by SEM and XRD in Figure 7, whereas the film-like layer observed on the top surface of the fully immersed specimens was examined in Figure 8. The SEM image presents the morphology of the collected deposit, whereas the XRD pattern provides phase information for the collected material as a whole. Thus, Figure 7 and Figure 8 represent follow-up analyses of the characteristic surface features identified in Figure 5 and Figure 6.
The schematic view for appearance view under various corrosion times and immersion types is illustrated in Figure 4, with each age having three rows representing the top surface, side surface and bottom surface for control group with surface coverage, control group with surface coverage removed, protection group with coatings and the protection group with coatings removed, respectively. The appearance changes in semi and full immersion specimens at different corrosion ages are presented in Figure 5 and Figure 6, respectively. The macroscopic appearance photographs presented in Figure 5 and Figure 6 show the complete longitudinal surfaces of these specimens; therefore, each photographed surface corresponds to an actual area of 40 mm × 160 mm. These photographs are used to qualitatively compare discoloration, surface deposits, peeling and substance formation. It could be found that both groups exhibited color changes at different corrosion ages, which is due to the consumption of dissolved oxygen (DO) by the facultative anaerobic microorganisms used in this experiment through respiration, preventing the oxidation of FeS and MnS and thereby causing coloration [38,45,46]. There was surface color change at 6 d for the control group (based on the complete color change in the control group’s fully immersed samples), while the protection group exhibited color changes at 24 d, indicating that the infiltrating organic silicone coatings could delay the initial corrosion for mortar samples on the surface. From the appearance changes in the semi-immersed samples in Figure 5, no damage was found on one of the surfaces in both control and protection group before 180 d. However, at 240 d, the semi-immersed samples in the control group showed significant peeling on the top surface, with the white crystals assembling on the mortar surface. With the assistance of the SEM and XRD analysis (Figure 7) the XRD pattern of the collected material in Figure 7b contains diffraction peaks assigned to Na2SO4, which was due to the sulfate ions and sodium ions hydrolyzing by thiosulfate in the solution and the condition that the partial immersion method was suitable for the physical crystallization of sodium sulfate [47]. It can be estimated that sulfate and sodium ions in the solution entered the concrete and crystallized, precipitating sodium sulfate crystals. While the samples in the protection group did not exhibit this phenomenon and the top, side, and bottom surfaces remained intact, indicating that samples coated with infiltrating organic silicone could stably exist in corrosive solutions without being damaged. In Figure 6, there were film-like substances that appeared on the top surface of fully immersed samples in control group at 60 d, which was gradually observed at 180 d in protection group. The microbial cells’ microscopic morphology (Figure 8a) and dispersed diffraction peaks of the composition (Figure 8b) can cautiously estimate the existence of an SOB-associated biofilm-like surface layer. Its later appearance on the coated specimen suggests that the hydrophobic organosilicon-treated surface delayed the development of the visible film-like layer. In conclusion, the infiltrating organic silicone coatings would stably work in the corrosive sewage and act as a barrier for delaying the corrosion process and repelling the adhesion of SOB on the surface.

3.3. Microstructures

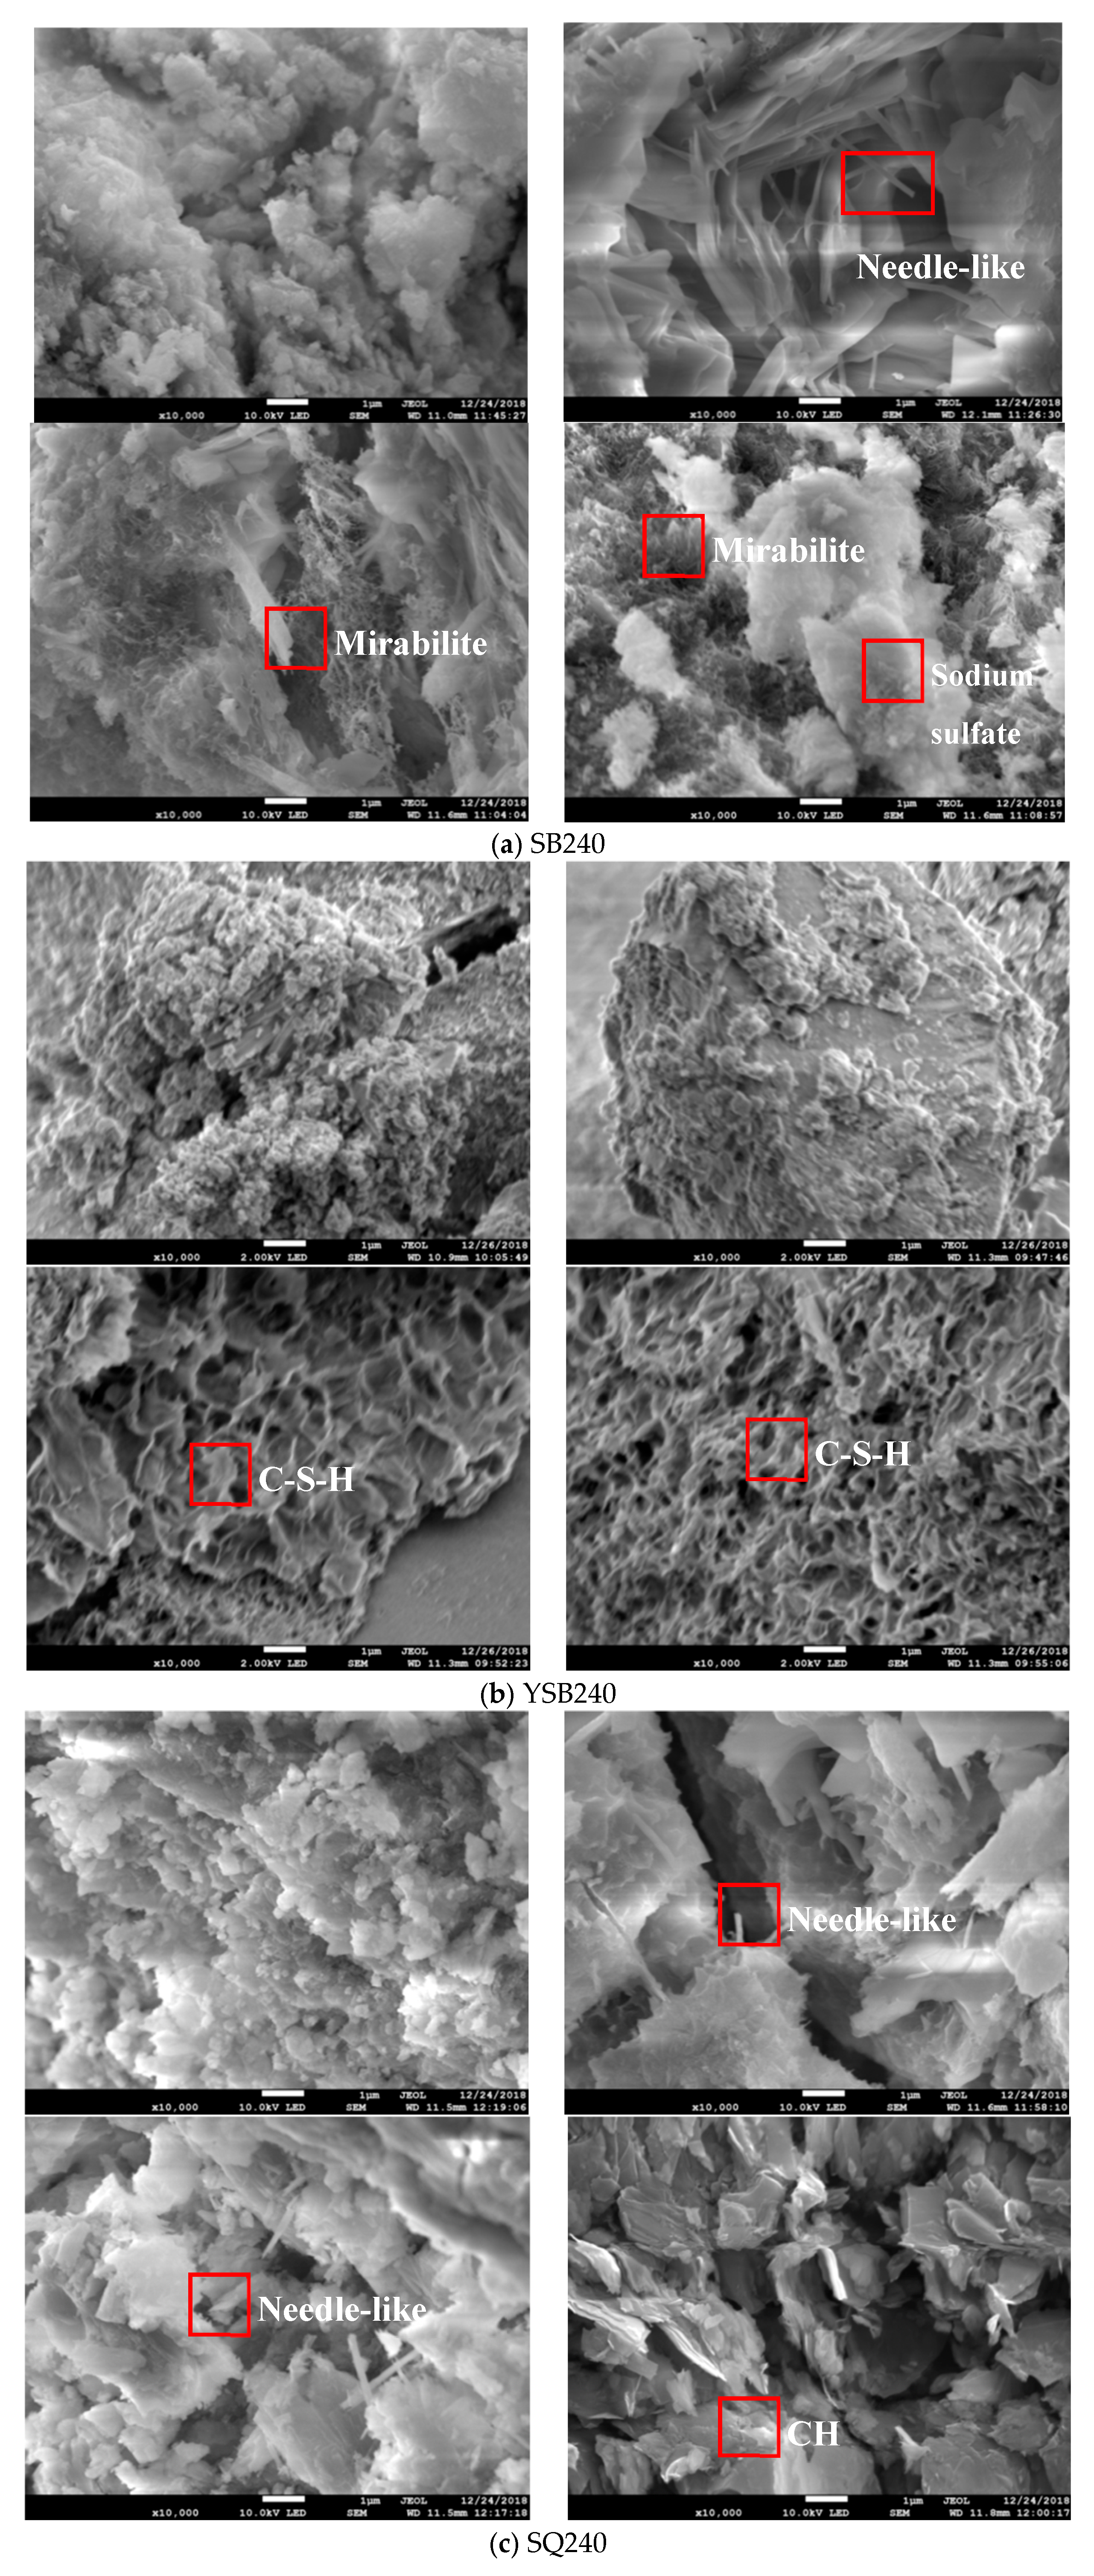
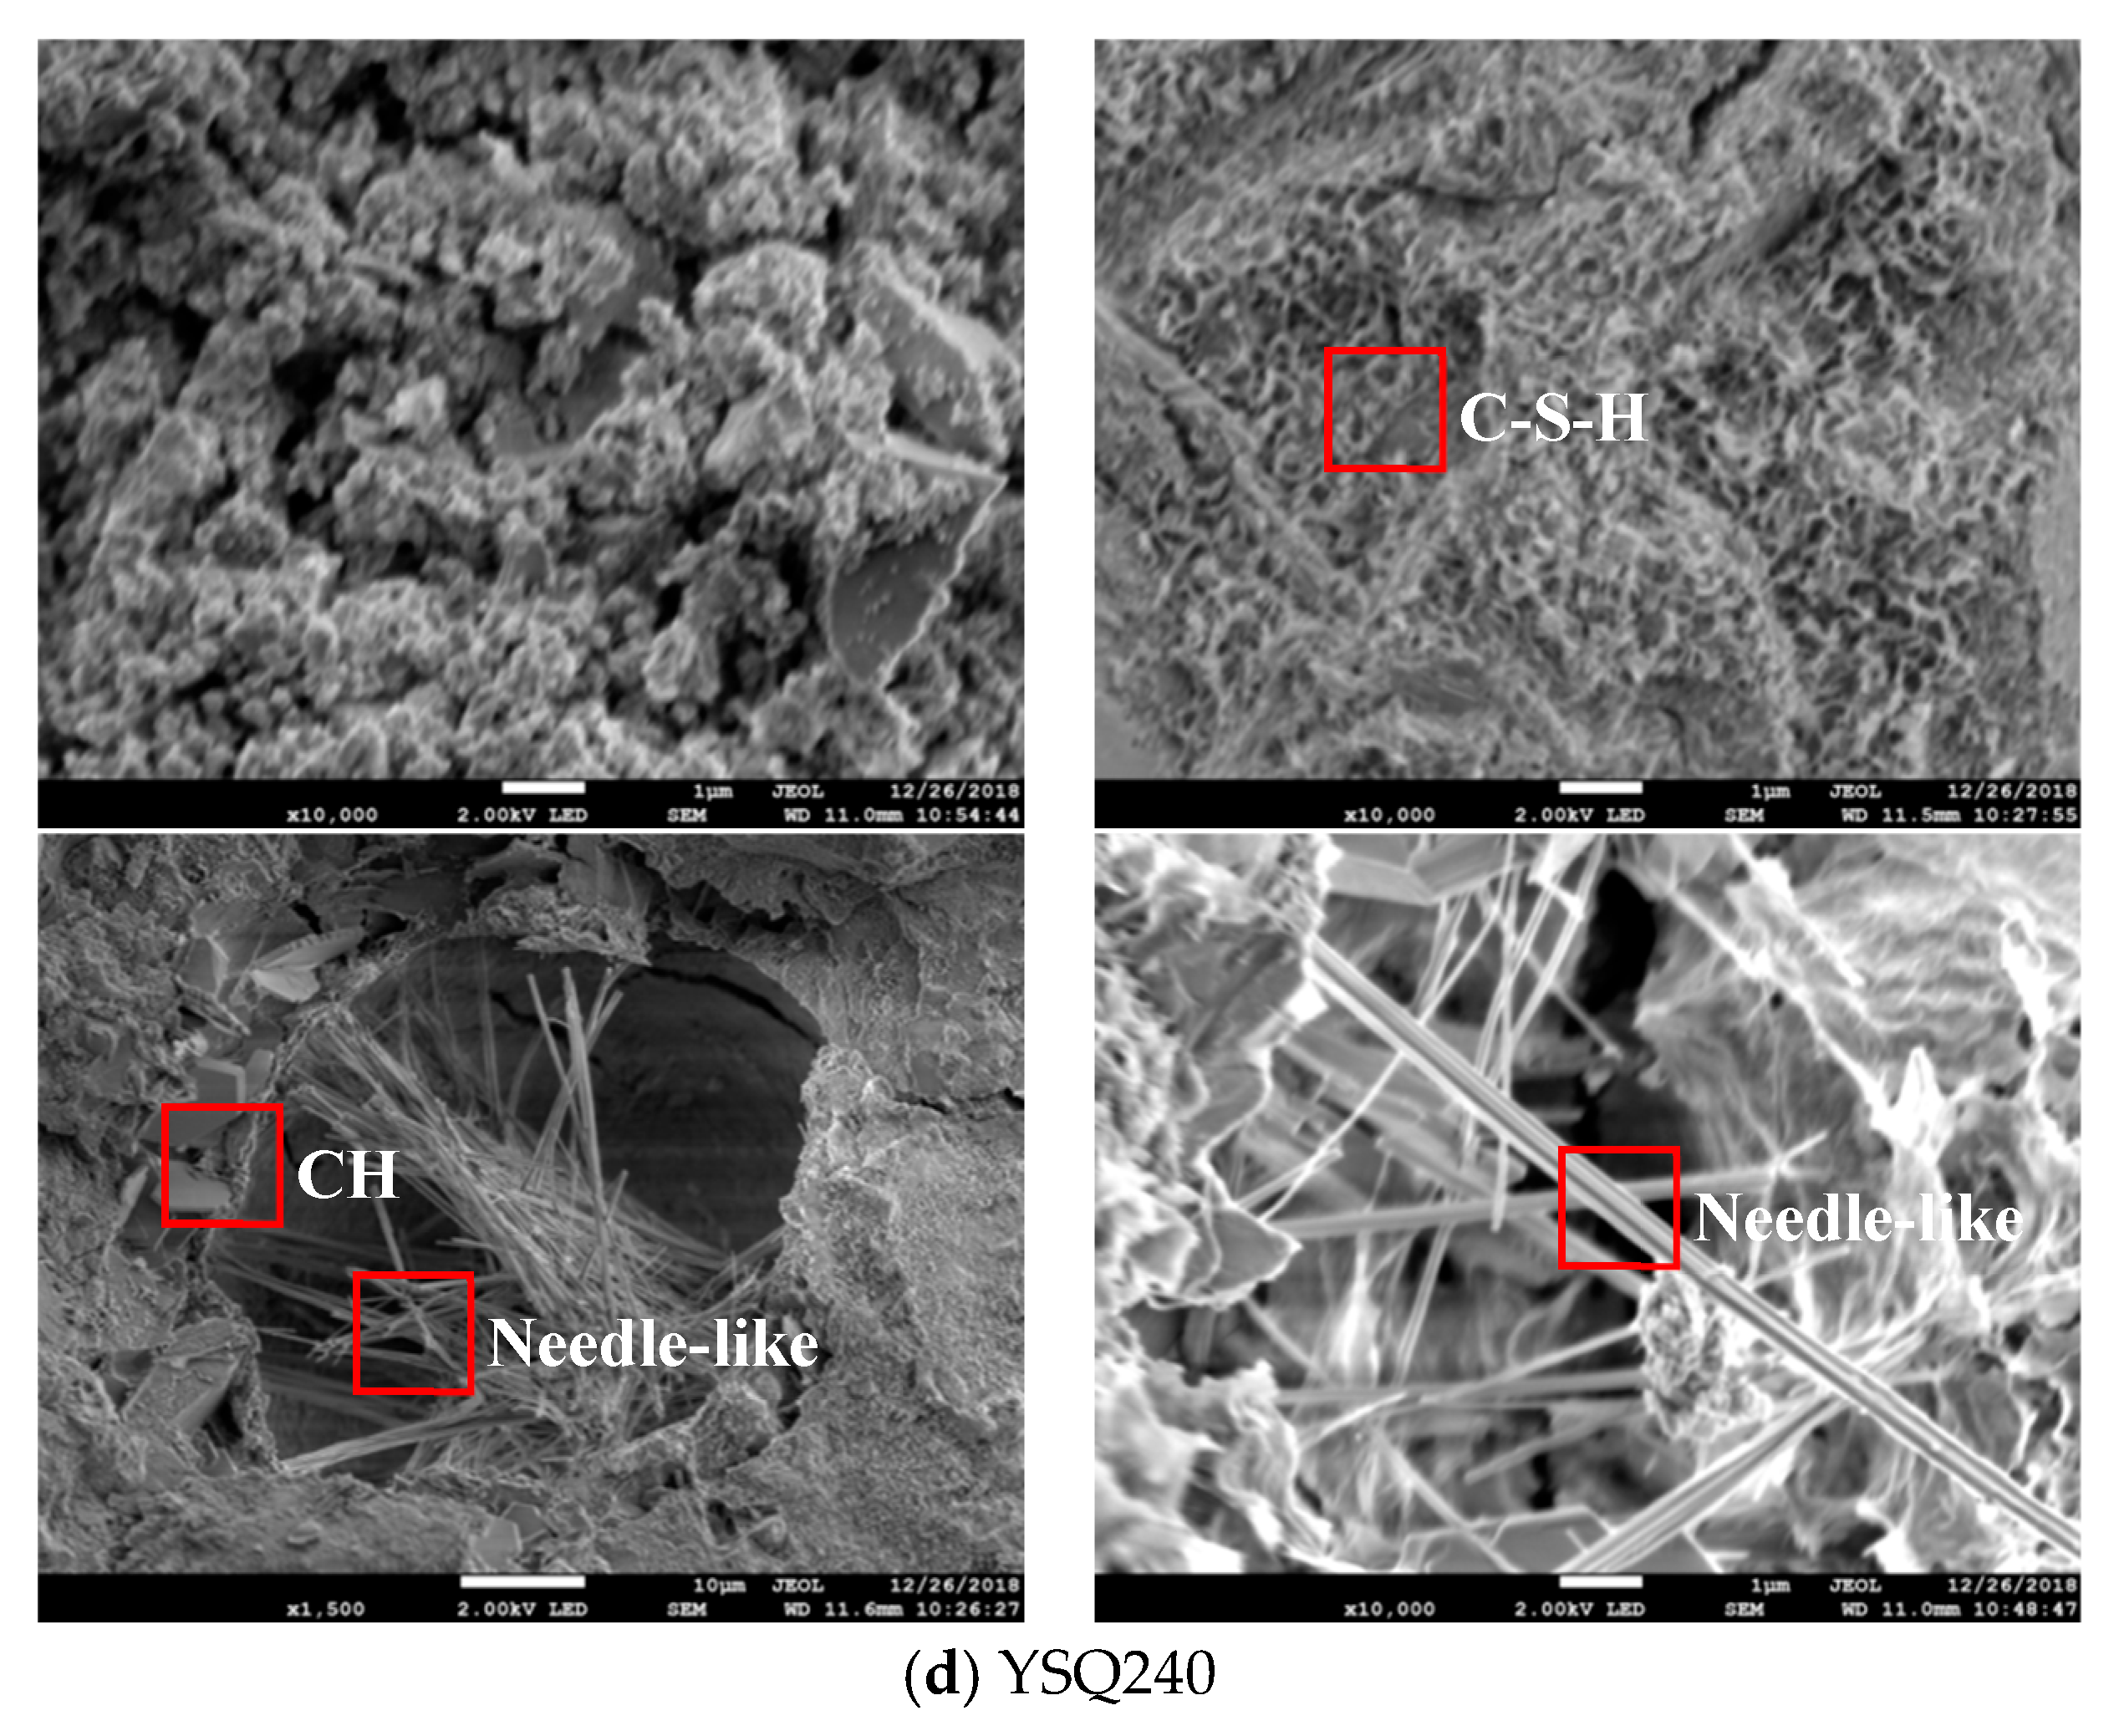
The SEM results for SB240, YSB240, SQ240, and YSQ240 are shown in Figure 9. In Figure 9a it was revealed that the control group’s half-immersed samples had a relatively looser structure with the internal C-S-H gel being damaged [48]. In addition, needle-like products (maybe ettringite and gypsum), as well as other hydration products, were observed, along with sodium sulfate and flocculent mirabilite crystals [18,49]. There were dense internal structures even after 240 d of corrosion in Figure 9b, exhibiting a tight bond with the aggregates. A large number of honeycomb-like C-S-H gels were found within the samples, indicating the further hydration process and relatively intact composition compared with Figure 9a. For fully immersed samples, SEM results of SQ240 in Figure 9c were similar to that in Figure 9a. C-S-H, a small amount of needle-like ettringite AFt and layered calcium hydroxide (CH) were formed in Figure 9d, demonstrating the application of coated infiltrating organic silicone would hinder the entrance of sulfate ions into the mortar, promoting further hydration process. The generated C-S-H during the hydration process increased the binding and compactness of the microstructures. In contrast, the uncoated specimens underwent ion exchange directly with the solution, producing expansive corrosion products such as ettringite and gypsum.

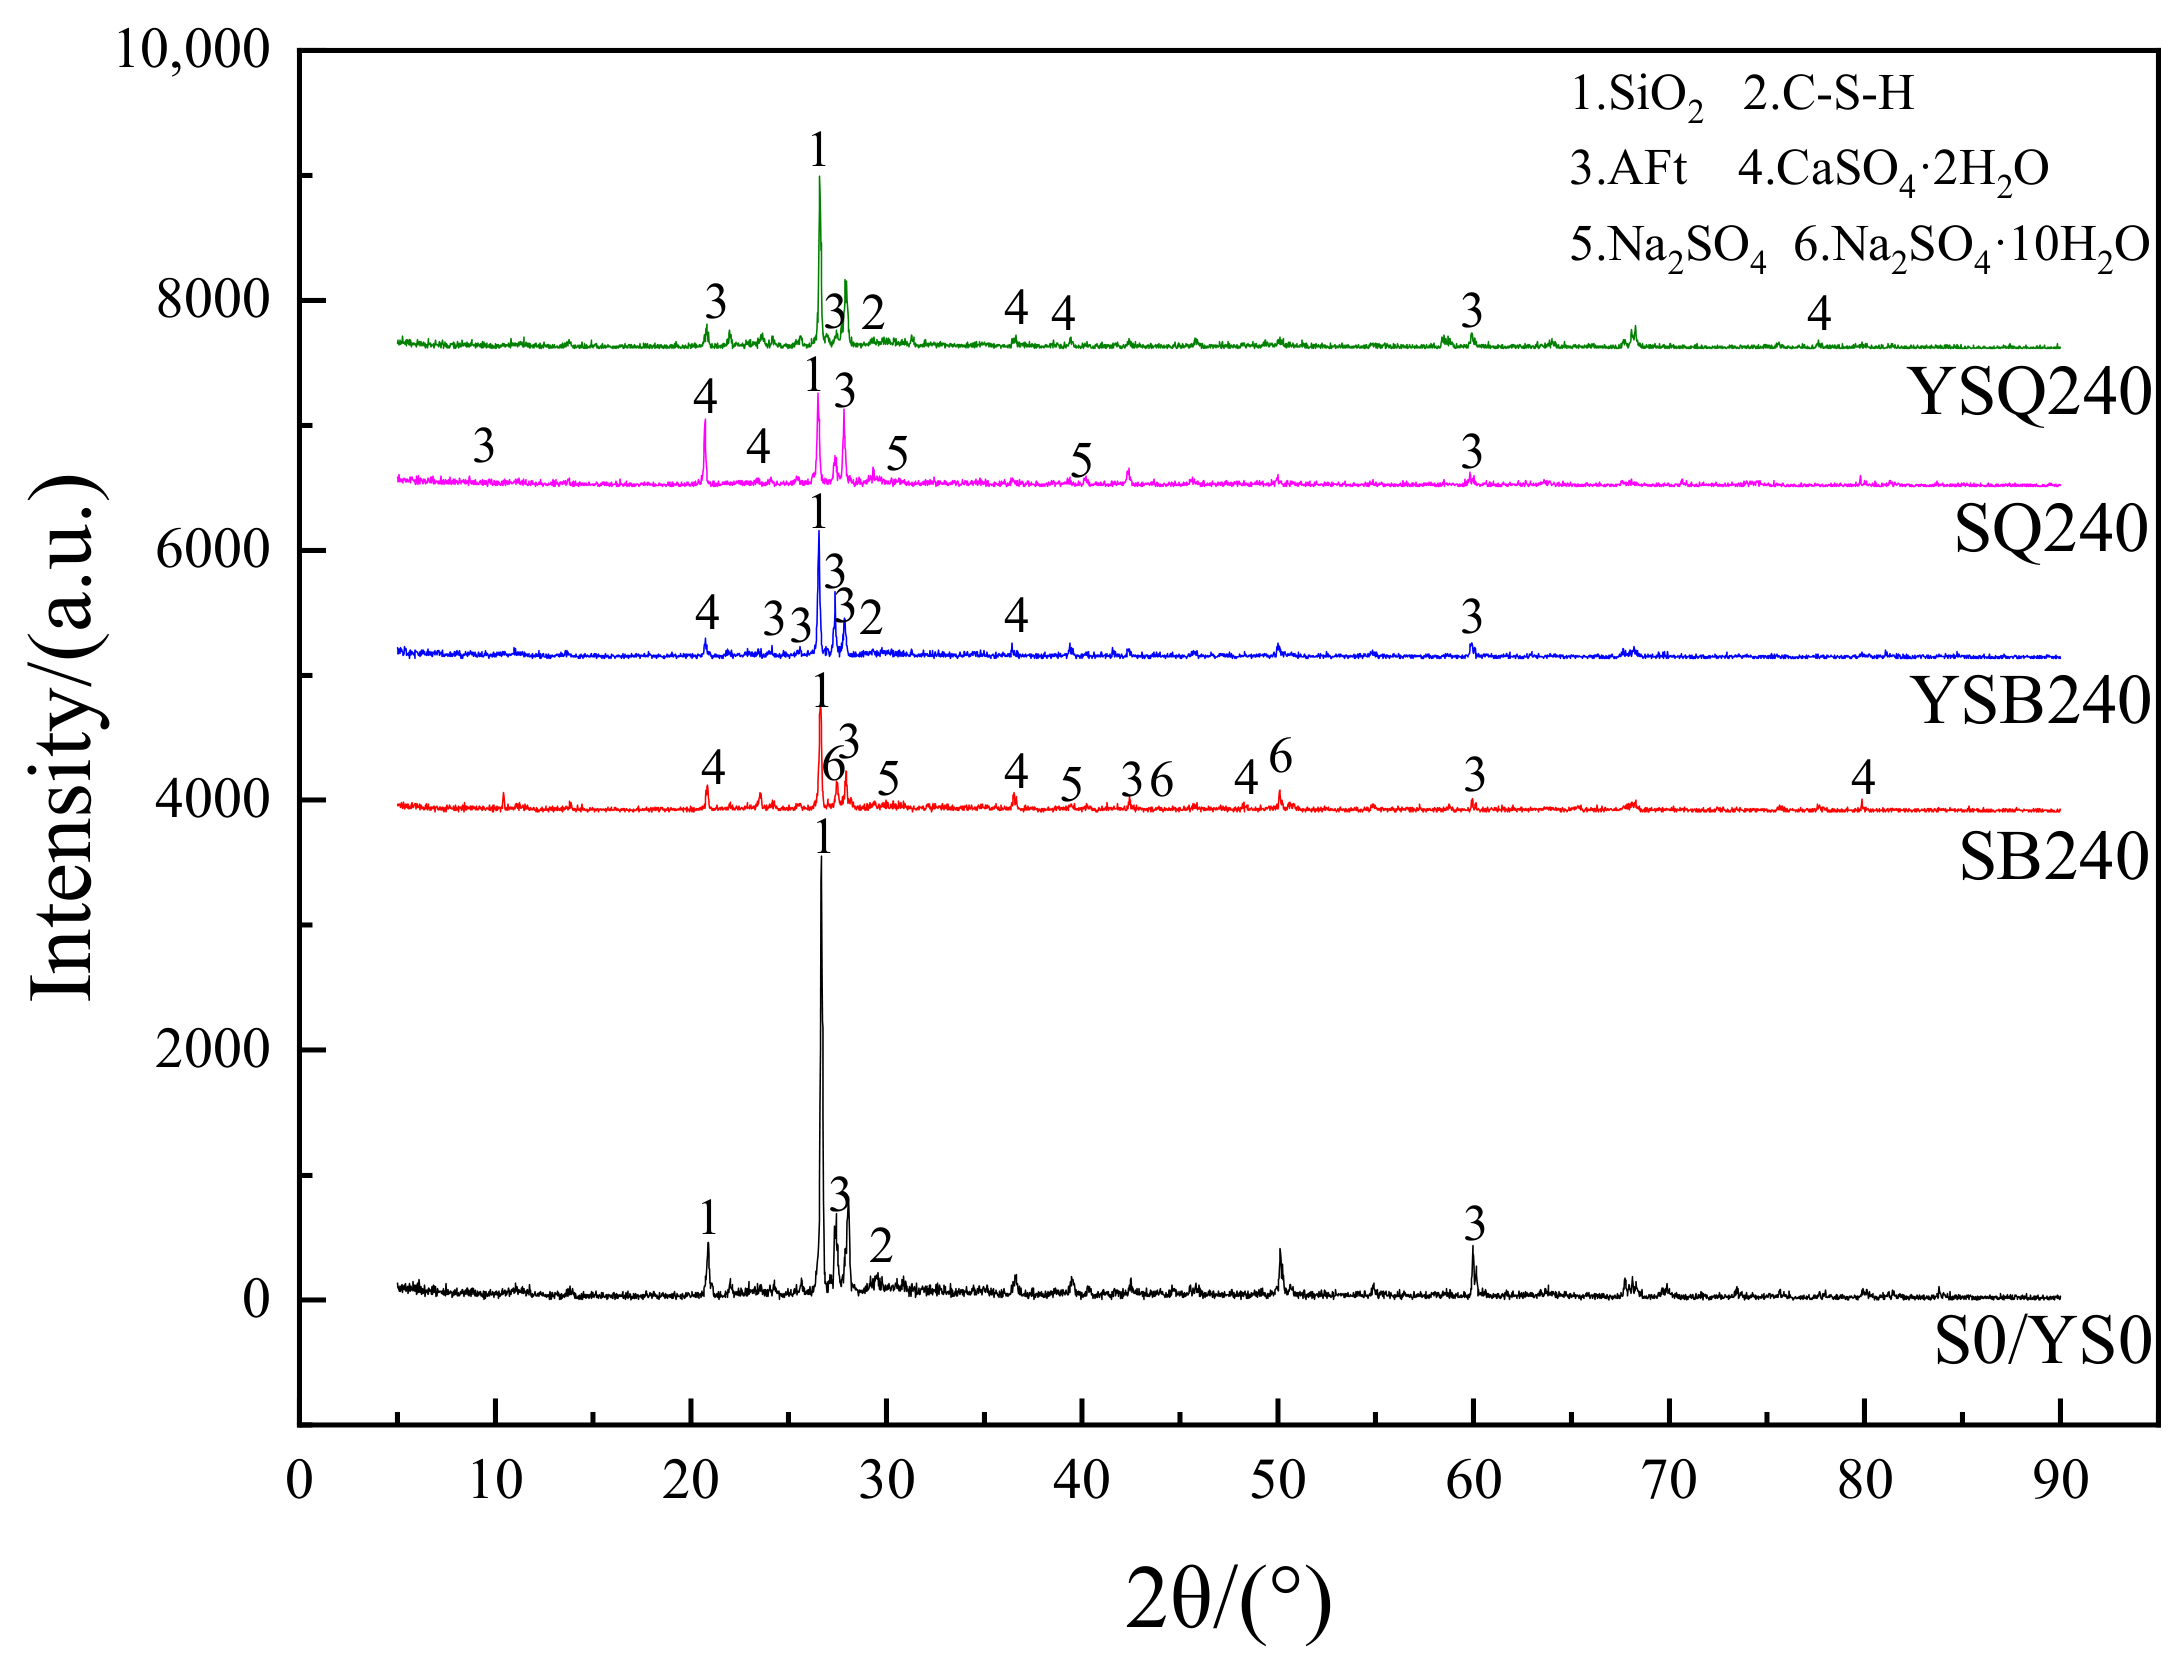
3.4. Mineral Composition

To further investigate the protective mechanism of infiltrating organic silicone against MICC, mineral composition analysis was conducted on samples at a depth of 0 to 5 mm from the surface at a corrosion age of 240 d (Figure 10). In general, a small amount of thenardite and mirabilite crystals were found in control groups at 240 d, which were not detected in both half and fully immersed protection groups. Under the hydrolysis of sodium thiosulfate in the solution, the produced sulfate ions entered the mortar samples and induced physical salt crystallization reactions. In addition, thenardite was only detected in the half-immersed control group, which was probably caused by the accelerating corrosion effects of MICC in the air-liquid interface [38]. On the other hand, for the half-immersed specimens in the protection group, there was a small amount of ettringite in along with the diffraction peaks of C-S-H gel, which was due to the isolation effects by the silicone coatings, promoting the degree of hydration of cementitious materials within the mortar. For the fully immersed samples, C-S-H gel and a small amount of ettringite were detected in the protection group, the reason for which was similar to the isolation effects in the half-immersed samples. Furthermore, there were ettringite and gypsum in the control group, of which the diffraction peaks of ettringite are sharper compared to the protection group. This was because the sulfate ions generated by SOB reacted with the calcium hydroxide in the uncoated concrete, forming ettringite and gypsum under fully immersed conditions.
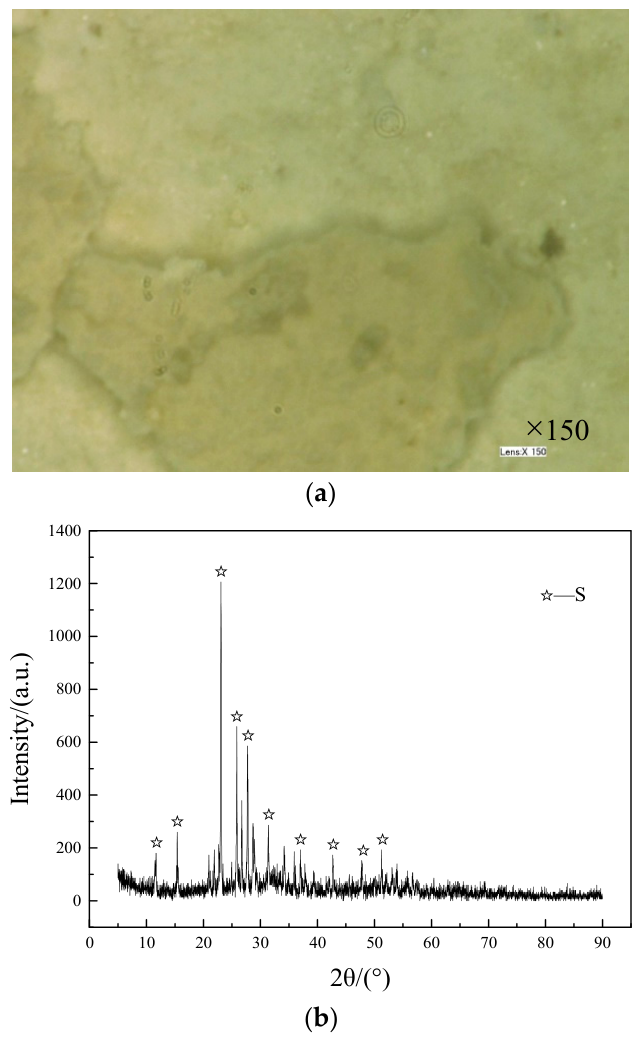
Another finding was that yellow plate-like substances were observed on the surface of the solutions in both groups (Figure 11a), of which the composition was analyzed with XRD (Figure 11b). From the close appearance observation and XRD investigation [50,51], considering its yellow appearance and formation under ambient aqueous exposure conditions, the crystalline phase was most likely α-S8. The formation of crystalline elemental sulfur was consistent with the microbial transformation of reduced sulfur compounds in the SOB-containing medium. The initial transformation of thiosulfate can be expressed as follows: S2O32− + 0.5H2O + 0.25O2→0.5S4O62− + OH [52] Then, SOB further metabolized the S4O62− into SO42− with elemental sulfur converted [53,54].

3.5. Roughness Analysis

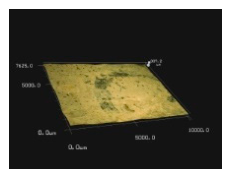
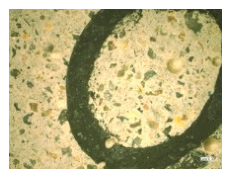
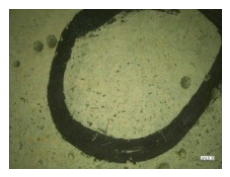
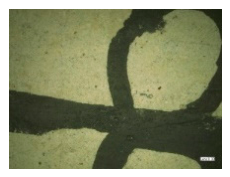
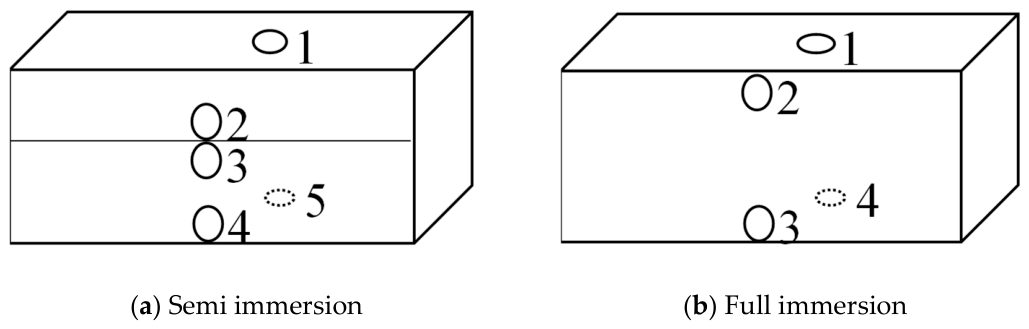
Figure 12 illustrates the schematic representation of sample markings at different positions under these two immersion conditions. Surface roughness was measured at five predefined locations on each semi-immersed specimen and at four predefined locations on each fully immersed specimen. In order to quantitatively investigate the detachment and aggregate exposure caused by MICC, 30× ultra-depth of field microscopic view was utilized to acquire the surface data from mortar specimens. Then, image processing techniques combined with least square method were adopted for the determination of roughness values (Ra, calculated as Ra = V/S, where V represents the volume enclosed between the measured surface and the reference plane, and S represents the projected area of the analyzed surface.) for different sample positions, which is shown in Table 3, including 30× ultra-deep-field images before corrosion, 3D images before corrosion, surface roughness values before corrosion (B Ra), 30× ultra-deep-field images after corrosion, 3D images after corrosion, and surface roughness values after corrosion (A Ra), respectively.
The roughness changing rates were calculated based on Equation (1) for each position and the overall roughness changing rate (the average values at all the selected positions) for the entire samples. The results for specimens at the various ages are presented in Table 4. It should be noted here that the symbol “-” in the table indicates that the sample became denser after corrosion. In order to exclude the influence of adhering film-like surface material and salt crystal precipitation in both Figure 5 and Figure 6, which were primarily captured before 180 d, the roughness change rate at a corrosion age of 240 days was chosen for analysis in reducing other side effects. In the semi-immersion experiment, the surface of the protection group became denser at a corrosion age of 240 days, which might be due to the retardation by the coated infiltrating organic silicone, slowing down the entry of sulfate ions from the solution into the concrete. Therefore, the cement inside the samples could further hydrate and make the surface of the half-immersed samples denser. The densification of the half-immersed samples in the control group were mainly caused by the hydrolysis of sodium thiosulfate in the solution, generating sulfate ions and sodium ions, which entered the mortar pores and formed thenardite and mirabilite crystals, filling the internal pores of the samples in small amounts. On the other hand, the mortar surface of fully immersed samples in the protection group became denser at a corrosion age of 240 d, which was possibly due to the similar principles in the half-immersed samples. In contrast, the fully immersed samples in the control group became rougher at 240 d, which were mainly caused by the chemical reaction between the sulfate ions produced by the hydrolysis of sodium thiosulfate and the calcium hydroxide inside the mortar, forming expansive products such as ettringite and gypsum, thus loosening the fully immersed samples’ surfaces in the control group to increase the porosity and surface roughness. Another reason for this was that the formation of a biofilm on the sample surface might cause an uneven surface and might not be entirely removed during the cleaning process.

3.6. Erosion Rate

The XRD qualitative analysis indicated that there were ettringite, gypsum, mirabilite and thenardite formed within the mortar specimens. Quantitative analysis was performed on samples at the corrosion age of 240 d at different depths (0–5 mm, 5–10 mm, and 10–15 mm), of which the results are shown in Table 5. In general, the proportions of ettringite and gypsum in coated groups for both half and fully immersed samples were higher than those in the control groups in various detection depths, proving the buffer functions and the promotion in the degree of hydration by the coatings. For half-immersed specimens in the control group, more mirabilite and thenardite were formed in the depths of 0 to 5 mm in position 1, compared with the positions 2, 3 and 4 where the depths from 5 mm to 10 mm gathered more, indicating that the liquid environment would accelerate the intrusion of sulfate ions produced by SOB, especially in the air-liquid interface like position 2 and 3. For fully immersed specimens, more thenardite was found in the deeper location of SQ240 compared with YSQ240, further implying the coating effects in delaying ions intrusion from the mortar surface. In conclusion, the infiltrating organic silicone coatings would act as the protection barriers for both half-immersed and fully immersed samples.

3.7. Variation in Mass and Compressive Strength

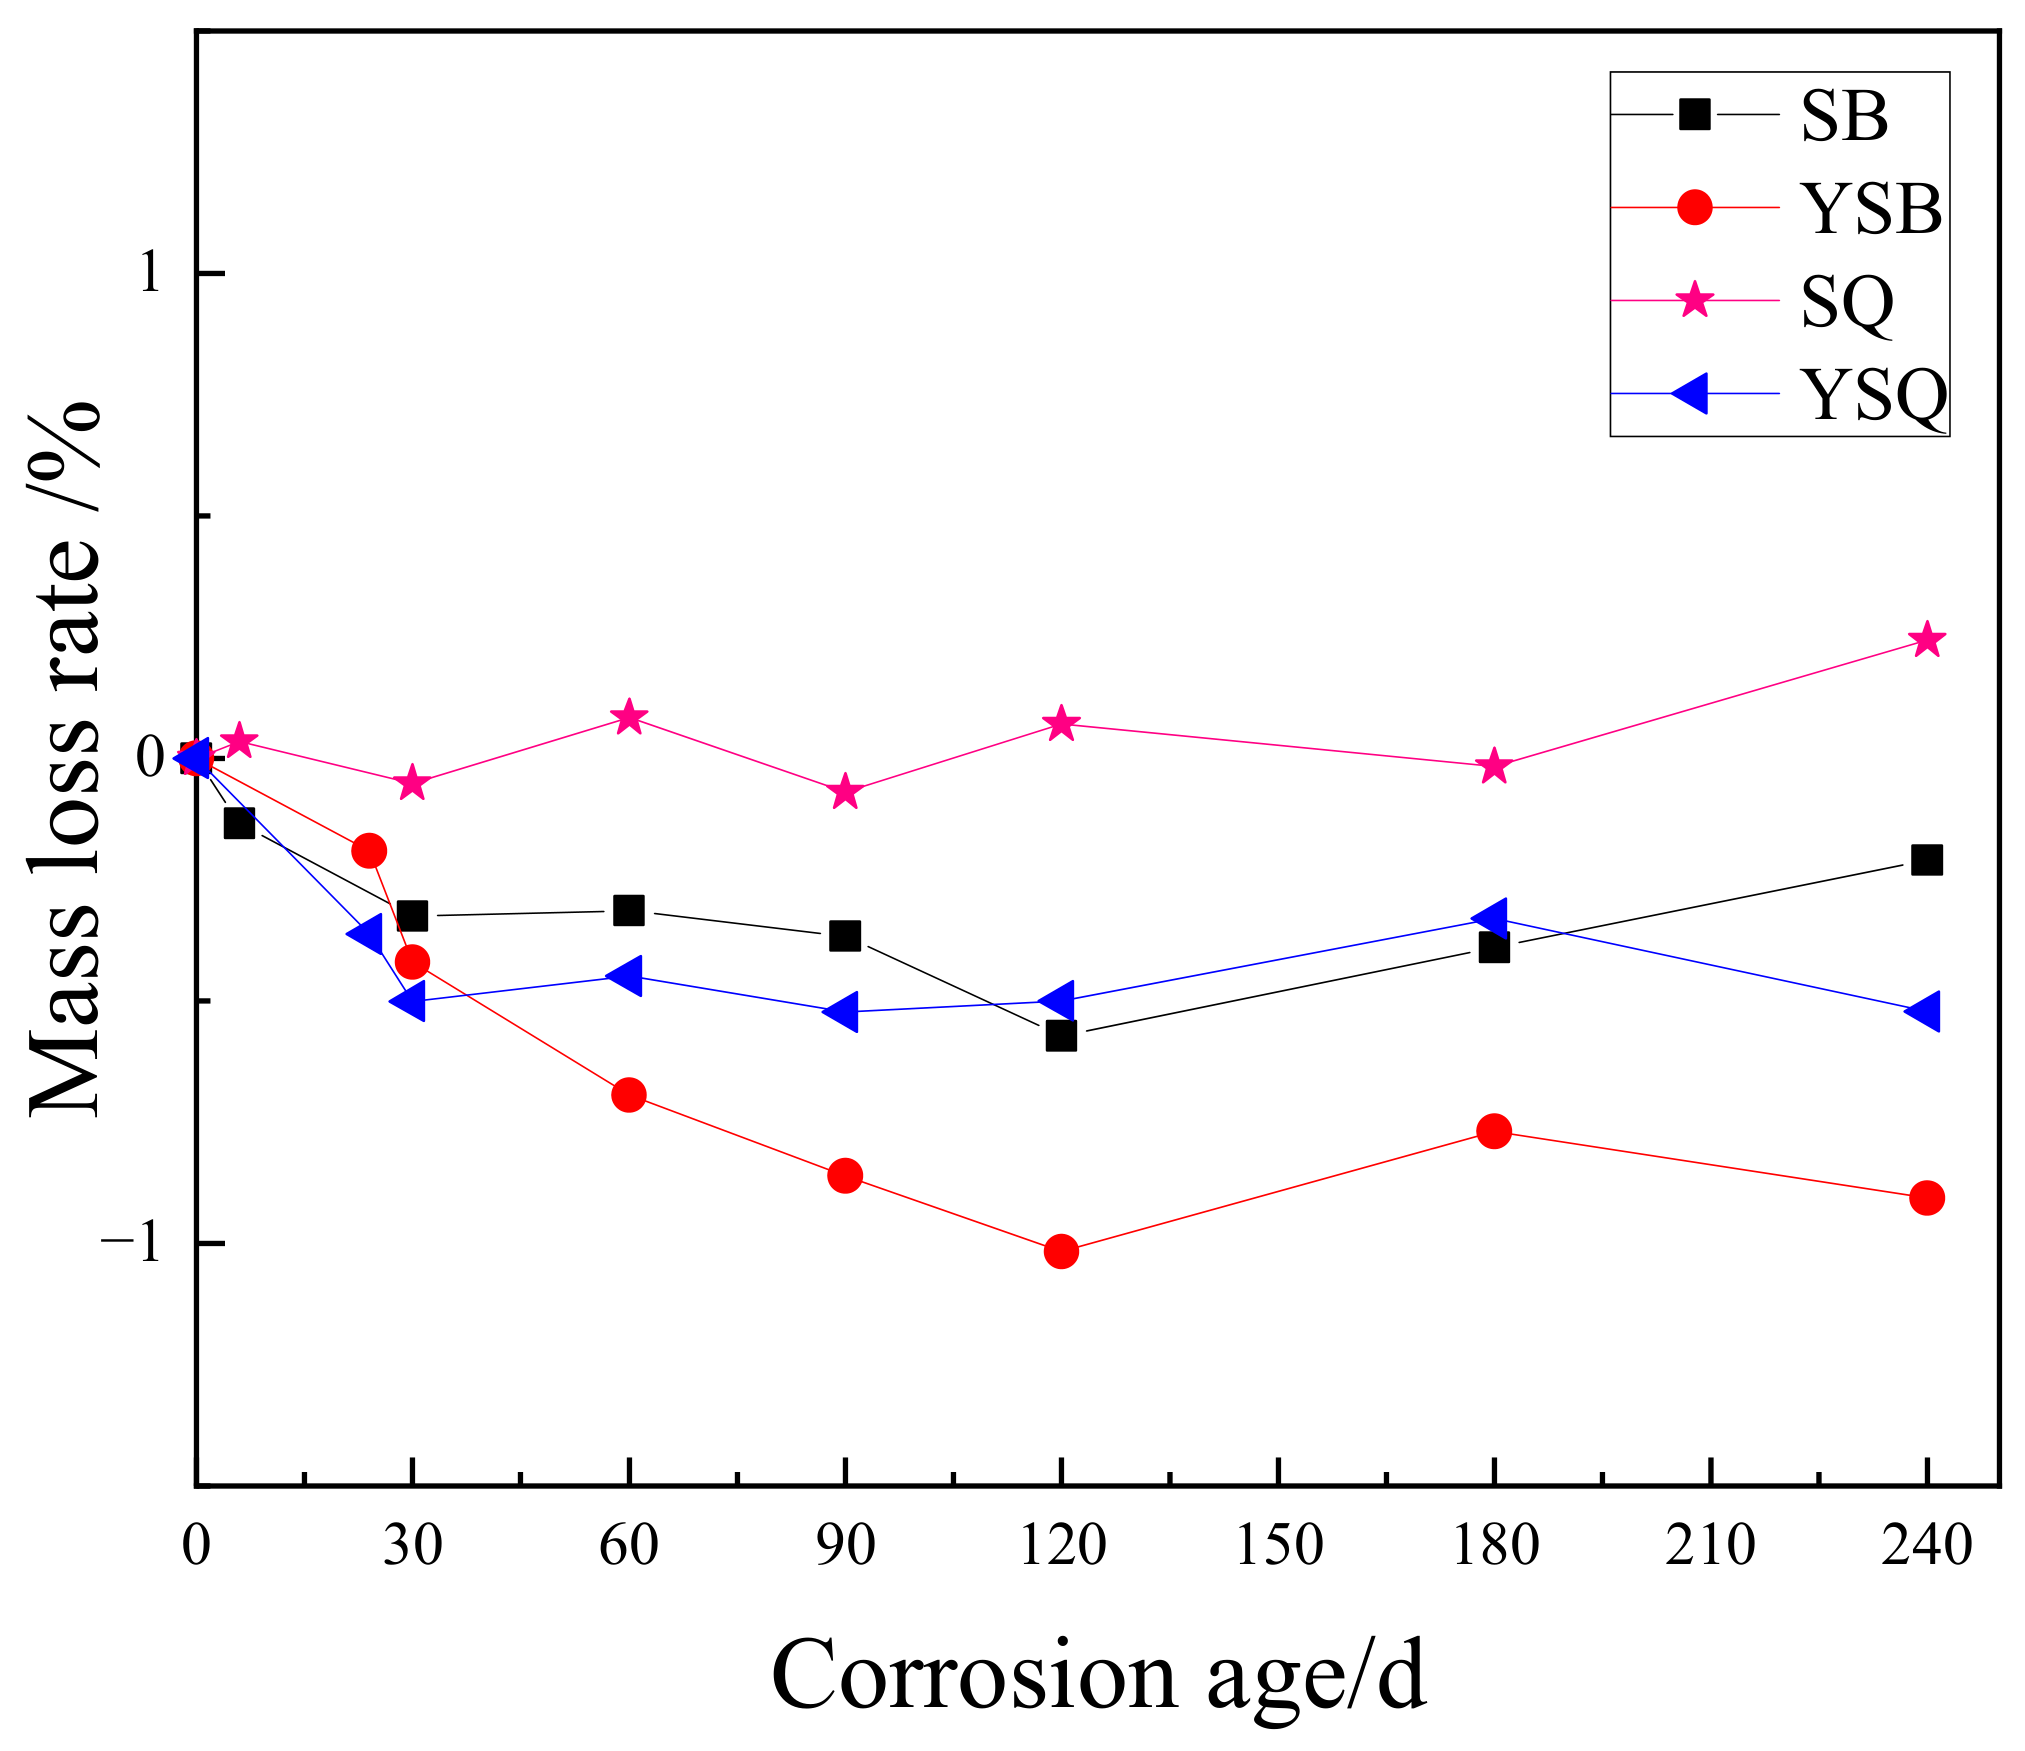
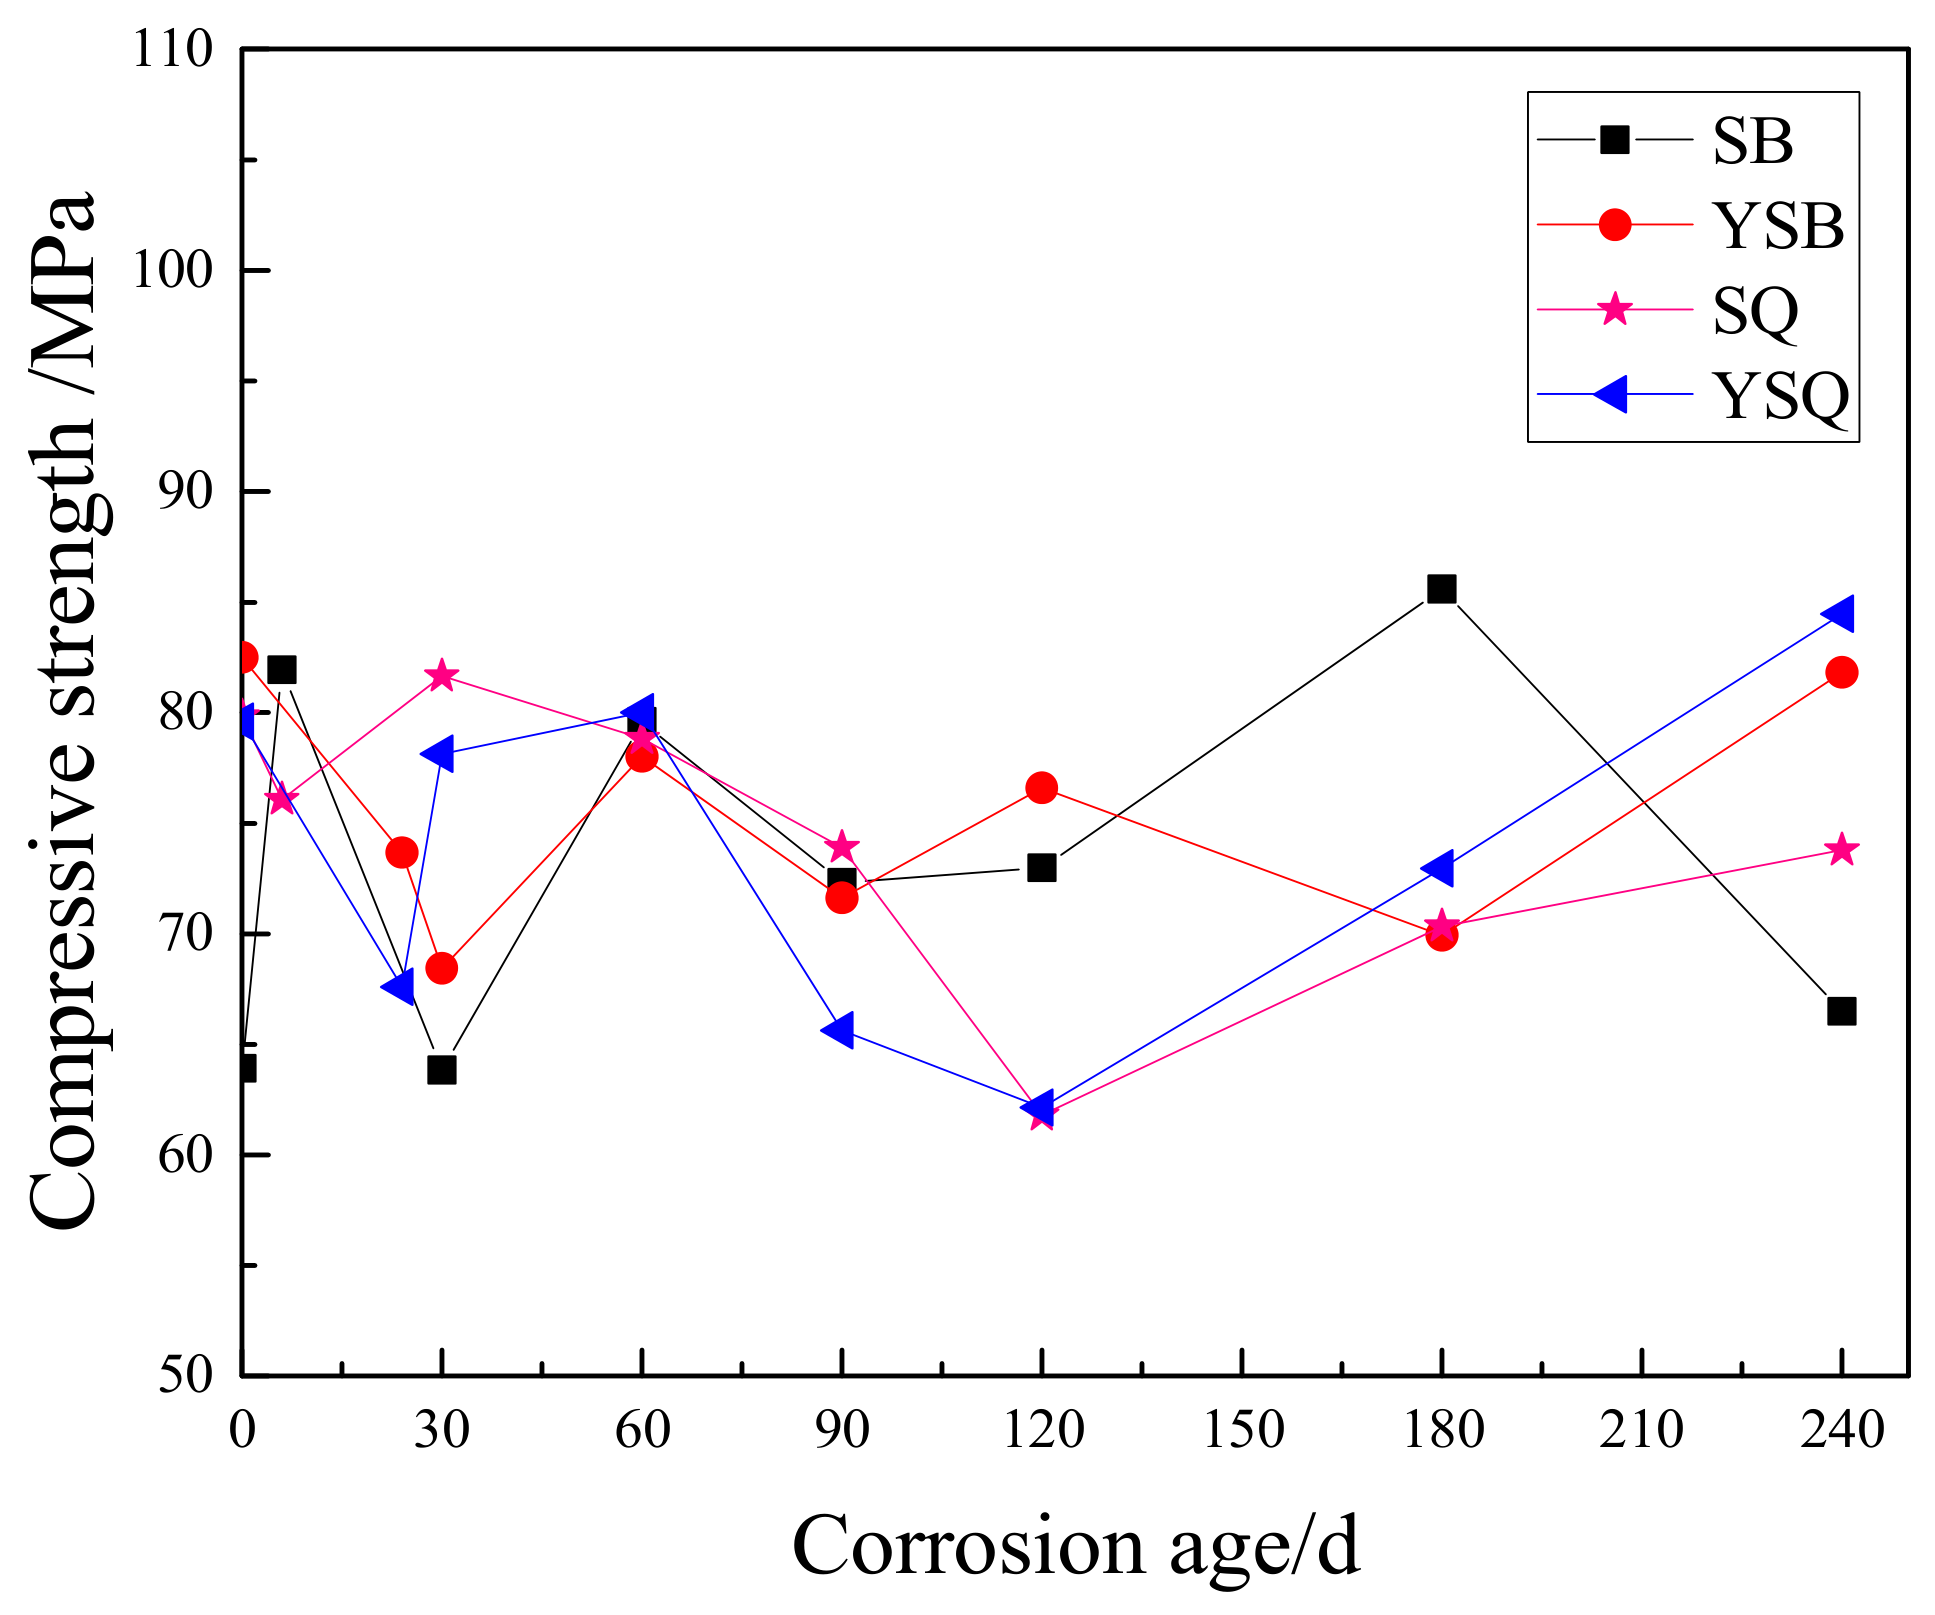
Figure 13 and Figure 14 present the mass loss rate and compressive strength evolution patterns for mortar samples in both the control and the protection group for evaluating the macroscopic characteristics influenced by the coatings, respectively. At the corrosion age of 240 d of half-immersed groups, the samples in the coated protection group exhibited a 350% increase in mass compared to the control group samples, and 81.8 MPa in compressive strength, which was approximately 23% higher than the 66.5 MPa in the control group. On the other hand, in the fully immersed groups, the samples in the protection group showed a 314% increase in mass and a 14% higher in compressive strength compared with the control group. Similar to the retardation effects of coated infiltrating organic silicone, the sulfate ions within the solution were delayed to access into the mortar, allowing further hydration and densification of the cement paste. While in the control group, sodium thiosulfate in the solution generated sulfate ions under the action of SOB, which would form a small amount of corrosive products such as sodium sulfate, mirabilite crystals, ettringite and gypsum [55], resulting in a looser structure composition. Combined with the scour and dissolution effects of the solution, the specimens in the control group exhibited a lower mass and compressive strength.

4. Conclusions

In this paper, the mortar samples coated with a single layer of 250 g/m2 infiltrating organic silicone were selected to study their effects on the prevention and control of MICC. The performance of mortar specimens with the application of coated organosilicon was investigated by analyzing the pH value, SO42− concentration, the macroscopic morphology, microstructures, mineral composition, surface roughness, erosion rate, mass change and mechanical variation. The following conclusions could be drawn:
(1)
The application of organosilicon did not cause changes in the environmental medium’s pH and SO42− concentration. In the uncoated concrete samples, sulfate ions entered the concrete and went through a physical salt crystallization reaction, forming corrosive products such as sodium sulfate and mirabilite. In the coated samples, the formation of hydrophobic Si-O-Si bonds on the surface and within the pores slowed down ion intrusion.
(2)
The surface color transformation into dark green for both protection groups was delayed to 24 d compared with 6 d in the control group, proving the prevention effects of organosilicon coating in delaying microbiological corrosion in the macroscopic view.
(3)
The application of infiltrating organic silicone would delay the intrusion of sulfate ions generated by SOB and restrain the adhesion of biofilms to the surface, reducing the production of mirabilite and promoting the generation of cohesive products like C-S-H compared with the uncoated groups.
(4)
The surface roughness of the protection groups decreased at 240 d, which was mainly due to the continuous hydration within the cementitious materials with the assistance of surface coatings. While the surface roughness for the control groups was mainly decided by the corrosion stage of MICC, which would decrease or increase the roughness values.
(5)
The worst degree of MICC usually occurred at the air-liquid interface for the half-immersed mortar specimens without coatings, implying that the surface coatings in these areas would improve the protection’s efficiency.
(6)
After 240 d, the coated specimens retained greater mass and higher compressive strength than the corresponding uncoated specimens, consistent with reduced solution ingress and continued hydration.
(7)
Among the six coating application procedures, a single application of 250 g/m2 produced the greatest penetration depth of 3.50 mm. The single applications of 200 and 300 g/m2 both resulted in 2.88 mm, while the two-stage applications produced lower penetration depths of 1.41–2.25 mm. Therefore, a single application of 250 g/m2 was selected as the most suitable procedure among the tested methods for the subsequent MICC exposure experiment.

Author Contributions

Conceptualization, M.S. and H.R.; methodology, M.S. and Y.W.; software, M.S.; validation, F.X. and T.L.; formal analysis, X.Y.; investigation, H.Y.; resources, Y.W.; data curation, T.L.; writing—original draft preparation, M.S.; writing—review and editing, M.S.; visualization, F.X.; supervision, H.R.; project administration, H.R.; funding acquisition, M.S. and X.Y. All authors have read and agreed to the published version of the manuscript.

Funding

This research was funded by the National Nature Science Foundation of China (grant number 52308271, 52578316 and 52578311) and Shenzhen Natural Science Foundation (grant number JCYJ20230807114401002).

Data Availability Statement

The original contributions presented in this study are included in the article. Further inquiries can be directed to the corresponding author.

Conflicts of Interest

Author Haishen Yu was employed by the company China Construction Eighth Engineering Division Co., Ltd. (North China). The remaining authors declare that the research was conducted in the absence of any commercial or financial relationships that could be construed as a potential conflict of interest.

References

  1. De Belie, N.; Monteny, J.; Beeldens, A.; Vincke, E.; Van Gemert, D.; Verstraete, W. Experimental research and prediction of the effect of chemical and biogenic sulfuric acid on different types of commercially produced concrete sewer pipes. Cem. Concr. Res. 2004, 34, 2223–2236. [Google Scholar] [CrossRef]
  2. Grengg, C.; Mittermayr, F.; Ukrainczyk, N.; Koraimann, G.; Kienesberger, S.; Dietzel, M. Advances in concrete materials for sewer systems affected by microbial induced concrete corrosion: A review. Water Res. 2018, 134, 341–352. [Google Scholar] [CrossRef] [PubMed]
  3. Basista, M.; Weglewski, W. Micromechanical modeling of sulphate corrosion in concrete: Influence of ettringite forming reaction. Theor. Appl. Mech. 2008, 35, 29–52. [Google Scholar] [CrossRef]
  4. Soleimani, S.; Ormeci, B.; Isgor, O.B. Growth and characterization of Escherichia coli DH5α biofilm on concrete surfaces as a protective layer against microbiologically influenced concrete deterioration (MICD). Appl. Microbiol. Biotechnol. 2013, 97, 1093–1102. [Google Scholar] [PubMed]
  5. Berndt, M.L. Evaluation of coatings, mortars and mix design for protection of concrete against sulphur oxidising bacteria. Constr. Build. Mater. 2011, 25, 3893–3902. [Google Scholar] [CrossRef]
  6. Ahmad, S. Reinforcement corrosion in concrete structures, its monitoring and service life prediction––A review. Cem. Concr. Compos. 2003, 25, 459–471. [Google Scholar] [CrossRef]
  7. Kong, L.; Zhao, W.; Xuan, D.; Wang, X.; Liu, Y. Application potential of alkali-activated concrete for antimicrobial induced corrosion: A review. Constr. Build. Mater. 2022, 317, 126169. [Google Scholar] [CrossRef]
  8. Cwalina, B. Biodeterioration of concrete, brick and other mineral-based building materials. Underst. Biocorros. 2014, 66, 281–312. [Google Scholar] [CrossRef]
  9. Kanwal, M.; Khushnood, R.A.; Adnan, F.; Wattoo, A.G.; Jalil, A. Assessment of the MICP potential and corrosion inhibition of steel bars by biofilm forming bacteria in corrosive environment. Cem. Concr. Compos. 2023, 137, 104937. [Google Scholar] [CrossRef]
  10. Roberts, D.J.; Nica, D.; Zuo, G.; Davis, J.L. Quantifying microbially induced deterioration of concrete: Initial studies. Int. Biodeterior. Biodegrad. 2002, 49, 227–234. [Google Scholar] [CrossRef]
  11. Rajala, P.; Carpén, L.; Vepsäläinen, M.; Raulio, M.; Huttunen-Saarivirta, E.; Bomberg, M. Influence of carbon sources and concrete on microbiologically influenced corrosion of carbon steel in subterranean groundwater environment. Corrosion 2016, 72, 1565–1579. [Google Scholar] [CrossRef]
  12. Joshi, S.; Goyal, S.; Reddy, M.S. Influence of nutrient components of media on structural properties of concrete during biocementation. Constr. Build. Mater. 2018, 158, 601–613. [Google Scholar] [CrossRef]
  13. Jiang, L.; Pettitt, T.R.; Buenfeld, N.; Smith, S.R. A critical review of the physiological, ecological, physical and chemical factors influencing the microbial degradation of concrete by fungi. Build. Environ. 2022, 214, 108925. [Google Scholar] [CrossRef]
  14. Grengg, C.; Mittermayr, F.; Baldermann, A.; Böttcher, M.E.; Leis, A.; Koraimann, G.; Grunert, P.; Dietzel, M. Microbiologically induced concrete corrosion: A case study from a combined sewer network. Cem. Concr. Res. 2015, 77, 16–25. [Google Scholar] [CrossRef]
  15. House, M.; Cheng, L.; Banks, K.; Weiss, J. Concrete resistance to sulfuric acid immersion: The influence of testing details and mixture design on performance as it relates to microbially induced corrosion. Adv. Civ. Eng. Mater. 2019, 8, 544–557. [Google Scholar] [CrossRef]
  16. Huber, B.; Hilbig, H.; Drewes, J.E.; Müller, E. Evaluation of concrete corrosion after short-and long-term exposure to chemically and microbially generated sulfuric acid. Cem. Concr. Res. 2017, 94, 36–48. [Google Scholar] [CrossRef]
  17. Wu, M.; Wang, T.; Wu, K.; Kan, L. Microbiologically induced corrosion of concrete in sewer structures: A review of the mechanisms and phenomena. Constr. Build. Mater. 2020, 239, 117813. [Google Scholar] [CrossRef]
  18. Satoh, H.; Odagiri, M.; Ito, T.; Okabe, S. Microbial community structures and in situ sulfate-reducing and sulfur-oxidizing activities in biofilms developed on mortar specimens in a corroded sewer system. Water Res. 2009, 43, 4729–4739. [Google Scholar] [CrossRef] [PubMed]
  19. Williamson, C.H.D.; Jain, L.A.; Mishra, B.; Olson, D.L.; Spear, J.R. Microbially influenced corrosion communities associated with fuel-grade ethanol environments. Appl. Microbiol. Biotechnol. 2015, 99, 6945–6957. [Google Scholar] [CrossRef] [PubMed]
  20. Noeiaghaei, T.; Mukherjee, A.; Dhami, N.; Chae, S.-R. Biogenic deterioration of concrete and its mitigation technologies. Constr. Build. Mater. 2017, 149, 575–586. [Google Scholar] [CrossRef]
  21. Jonkers, H.M.; Thijssen, A.; van Breugel, K. Bacteria mediated remediation of concrete structures. In 2nd International Symposium on Service Life Design for Infrastructures; RILEM Publications SARL: Champs-sur-Marne, France, 2010; pp. 833–840. [Google Scholar]
  22. Li, X.; Jiang, G. Mitigation of Microbially Influenced Corrosion of Concrete Sewers Using Nitrite. In Biotechnological Innovations for Environmental Bioremediation; Springer: Berlin/Heidelberg, Germany, 2022; pp. 119–135. [Google Scholar]
  23. Lv, T.; Zhang, J.; Hou, D.; Zhao, Q.; Dong, B.; Ma, H. A review on the utilization of dredged sludge as a promising low-carbon supplementary cementitious material: Activation, properties and microstructure. J. Sustain. Cem.-Based Mater. 2026, 15, 1502–1526. [Google Scholar]
  24. Wang, T.; Wu, K.; Kan, L.; Wu, M. Current understanding on microbiologically induced corrosion of concrete in sewer structures: A review of the evaluation methods and mitigation measures. Constr. Build. Mater. 2020, 247, 118539. [Google Scholar] [CrossRef]
  25. Little, B.J.; Blackwood, D.J.; Hinks, J.; Lauro, F.M.; Marsili, E.; Okamoto, A.; Rice, S.A.; Wade, S.A.; Flemming, H.C. Microbially influenced corrosion—Any progress? Corros. Sci. 2020, 170, 108641. [Google Scholar] [CrossRef]
  26. Goyal, S.; Kumar, M.; Sidhu, D.S.; Bhattacharjee, B. Resistance of mineral admixture concrete to acid attack. J. Adv. Concr. Technol. 2009, 7, 273–283. [Google Scholar] [CrossRef]
  27. Zhu, Z.; Chu, H.; Jiang, S.; Guo, M.-Z.; Xu, Y.; Liang, Y.; Jiang, L. Improvement in the microbially induced corrosion resistance of concrete sewers using electrodeposition. Cem. Concr. Compos. 2022, 134, 104803. [Google Scholar] [CrossRef]
  28. De Muynck, W.; De Belie, N.; Verstraete, W. Effectiveness of admixtures, surface treatments and antimicrobial compounds against biogenic sulfuric acid corrosion of concrete. Cem. Concr. Compos. 2009, 31, 163–170. [Google Scholar] [CrossRef]
  29. Gevaudan, J.P.; Santa-Ana, B.; Srubar, W.V., III. Iron mineral admixtures improve the sulfuric acid resistance of low-calcium alkali-activated cements. Cem. Concr. Compos. 2021, 116, 103867. [Google Scholar] [CrossRef]
  30. Ho, D.W.S.; Harrison, R.S. Influence of surface coatings on carbonation of concrete. J. Mater. Civ. Eng. 1990, 2, 35–44. [Google Scholar] [CrossRef]
  31. Almusallam, A.A.; Khan, F.M.; Dulaijan, S.U.; Al-Amoudi, O.S.B. Effectiveness of surface coatings in improving concrete durability. Cem. Concr. Compos. 2003, 25, 473–481. [Google Scholar] [CrossRef]
  32. Li, G.; Yang, B.; Guo, C.; Du, J.; Wu, X. Time dependence and service life prediction of chloride resistance of concrete coatings. Constr. Build. Mater. 2015, 83, 19–25. [Google Scholar] [CrossRef]
  33. Yang, C.-C.; Wang, L.; Weng, T. Using charge passed and total chloride content to assess the effect of penetrating silane sealer on the transport properties of concrete. Mater. Chem. Phys. 2004, 85, 238–244. [Google Scholar] [CrossRef]
  34. Valix, M.; Zamri, D.; Mineyama, H.; Cheung, W.H.; Shi, J.; Bustamante, H. Microbiologically induced corrosion of concrete and protective coatings in gravity sewers. Chin. J. Chem. Eng. 2012, 20, 433–438. [Google Scholar] [CrossRef]
  35. Kong, L.; Fang, J.; Zhou, X.; Han, M.; Lu, H. Assessment of coatings for protection of cement paste against microbial induced deterioration through image analysis. Constr. Build. Mater. 2018, 191, 342–353. [Google Scholar] [CrossRef]
  36. Song, Y.; Tian, Y.; Li, X.; Wei, J.; Zhang, H.; Bond, P.L.; Yuan, Z.; Jiang, G. Distinct microbially induced concrete corrosion at the tidal region of reinforced concrete sewers. Water Res. 2019, 150, 392–402. [Google Scholar] [CrossRef] [PubMed]
  37. Cayford, B.I.; Jiang, G.; Keller, J.; Tyson, G.; Bond, P.L. Comparison of microbial communities across sections of a corroding sewer pipe and the effects of wastewater flooding. Biofouling 2017, 33, 780–792. [Google Scholar] [CrossRef] [PubMed]
  38. Sun, M.; Xu, W.; Rong, H.; Chen, J.; Yu, C. Effects of dissolved oxygen (DO) in seawater on microbial corrosion of concrete: Morphology, composition, compression analysis and transportation evaluation. Constr. Build. Mater. 2023, 367, 130290. [Google Scholar] [CrossRef]
  39. Jiang, G.; Keller, J.; Bond, P.L.; Yuan, Z. Predicting concrete corrosion of sewers using artificial neural network. Water Res. 2016, 92, 52–60. [Google Scholar] [CrossRef] [PubMed]
  40. Grengg, C.; Kiliswa, M.; Mittermayr, F.; Alexander, M. Microbially-induced Concrete Corrosion-A worldwide problem. Microorg.-Cem. Mater. Interact. 2016, 1–19. [Google Scholar]
  41. House, M.; Weiss, W.J. Review of microbially induced corrosion and comments on needs related to testing procedures. In Proceedings of the International Conference on Durability of Concrete Structures, West Lafayette, IN, USA, 24–26 July 2014. [Google Scholar]
  42. Lu, C.; Ge, H.; Li, Z.; Zheng, Y. Effect evaluation of microbial mineralization for repairing load-induced crack in concrete with a cyclic injection-immersion process. Case Stud. Constr. Mater. 2022, 17, e01702. [Google Scholar] [CrossRef]
  43. Huber, B.; Hilbig, H.; Mago, M.M.; Drewes, J.E.; Müller, E. Comparative analysis of biogenic and chemical sulfuric acid attack on hardened cement paste using laser ablation-ICP-MS. Cem. Concr. Res. 2016, 87, 14–21. [Google Scholar] [CrossRef]
  44. Rana, K.; Rana, N.; Singh, B. Applications of sulfur oxidizing bacteria. In Physiological and Biotechnological Aspects of Extremophiles; Elsevier: Amsterdam, The Netherlands, 2020; pp. 131–136. [Google Scholar]
  45. Maruthamuthu, S.; Muthukumar, N.; Natesan, M.; Palaniswamy, N. Role of air microbes on atmospheric corrosion. Curr. Sci. 2008, 94, 359–363. [Google Scholar]
  46. Groysman, A. Corrosion for Everybody; Springer Science & Business Media: Berlin/Heidelberg, Germany, 2009. [Google Scholar]
  47. Mehta, P.K.; Monteiro, P.J.M. Concrete: Microstructure, Properties, and Materials; McGraw-Hill Education: Columbus, OH, USA, 2014. [Google Scholar]
  48. Benavente, D.; del Cura, M.A.G.; Garcıa-Guinea, J.; Sánchez-Moral, S.; Ordóñez, S. Role of pore structure in salt crystallisation in unsaturated porous stone. J. Cryst. Growth 2004, 260, 532–544. [Google Scholar] [CrossRef]
  49. Cardell, C.; Benavente, D.; Rodríguez-Gordillo, J. Weathering of limestone building material by mixed sulfate solutions. Characterization of stone microstructure, reaction products and decay forms. Mater. Charact. 2008, 59, 1371–1385. [Google Scholar] [CrossRef]
  50. Moon, J.; Kalb, P.D.; Milian, L.; Northrup, P.A. Characterization of a sustainable sulfur polymer concrete using activated fillers. Cem. Concr. Compos. 2016, 67, 20–29. [Google Scholar] [CrossRef]
  51. Shahsavari, M.H.; Karbala, M.M.; Iranfar, S.; Vandeginste, V. Martian and lunar sulfur concrete mechanical and chemical properties considering regolith ingredients and sublimation. Constr. Build. Mater. 2022, 350, 128914. [Google Scholar] [CrossRef]
  52. Cheng, L. Microbial Biofilm Development on and Degradation of Concrete Surfaces. Ph.D. Thesis, Purdue University, West Lafayette, IN, USA, 2014. [Google Scholar]
  53. Whaley-Martin, K.; Marshall, S.; Nelson, T.E.C.; Twible, L.; Jarolimek, C.V.; King, J.J.; Apte, S.C.; Warren, L.A. A mass-balance tool for monitoring potential dissolved sulfur oxidation risks in mining impacted waters. Mine Water Environ. 2020, 39, 291–307. [Google Scholar] [CrossRef]
  54. Rujisangvittaya, K.; Phoolphundh, S. Sulfur Oxidizing Bacterial Biofilter for Removal of Hydrogen Sulfide (H2S) from Biogas. J. Sustain. Energy Environ. 2015, 6, 71–74. [Google Scholar]
  55. Vupputuri, S.; Fathepure, B.Z.; Wilber, G.G.; Sudoi, E.; Nasrazadani, S.; Ley, M.T.; Ramsey, J.D. Isolation of a sulfur-oxidizing Streptomyces sp. from deteriorating bridge structures and its role in concrete deterioration. Int. Biodeterior. Biodegrad. 2015, 97, 128–134. [Google Scholar] [CrossRef]
Figure 1. Schematic diagram of modes for partial immersion and full immersion.
Buildings 16 03011 g001
Figure 2. Solution pH variation of the sewage medium from 0 d to 240 d under SOB exposure: (a) uncoated control group; (b) silicone-coated protection group (One 250).
Buildings 16 03011 g002
Figure 3. SO42− concentration variation: (a) uncoated control group; (b) silicone-coated protection group (One 250).
Buildings 16 03011 g003
Figure 4. Schematic illustration for appearance photographs in Figure 5 and Figure 6 under various corrosion times and immersion types: (a) illustration for surface location, (b) example of appearance evolution of half immersed specimens at 30 d.
Buildings 16 03011 g004
Figure 5. Appearance evolution of half immersed specimens at different corrosion ages.
Buildings 16 03011 g005aBuildings 16 03011 g005b
Figure 6. Appearance evolution of fully immersed specimens at different corrosion ages.
Buildings 16 03011 g006aBuildings 16 03011 g006b
Figure 7. Test for the white crystals observed on the top surface of the semi-immersed control specimen at 240 d: (a) SEM image, (b) XRD pattern.
Buildings 16 03011 g007
Figure 8. Tests for the film-like substances observed on the top surface of fully immersed specimens: (a) SEM image, (b) XRD pattern.
Buildings 16 03011 g008
Figure 9. SEM observations of specimens after 240 d of SOB exposure: (a) SB240, semi-immersed uncoated specimen, (b) YSB240, semi-immersed coated specimen, (c) SQ240, fully immersed uncoated specimen, (d) YSQ240, fully immersed coated specimen.
Buildings 16 03011 g009aBuildings 16 03011 g009b
Figure 10. Mineral composition of the specimen at a depth of 0–5 mm from the surface.
Buildings 16 03011 g010
Figure 11. Test for yellow plate-like substances leached from both groups at the liquid surfaces. (a) View in ultra-depth of field microscope; (b) XRD results.
Buildings 16 03011 g011
Figure 12. Schematic diagram of marks at different positions of immersed samples.
Buildings 16 03011 g012
Figure 13. Mass loss rate.
Buildings 16 03011 g013
Figure 14. Compressive strength.
Buildings 16 03011 g014
Table 1. Sewage composition index.
Water Quality IndexCOD
(mg/L)
BOD
(mg/L)
SS
(mg/L)
pHNH3-H
(mg/L)
TP
(mg/L)
Value2401802487.2272.0
Table 2. Coating process.
Coating
Method
Total Amount of
Coating/(g/m2)
Once Coating
Amount/(g/m2)
Coating Interval Time/hPenetration Depth/mm
Marking
Blank0000
One 20020020002.88
One 25025025003.50
One 30030030002.88
Two 10020010061.41
Two 12525012562.25
Two 15030015062.00
Table 3. Roughness value of sample with age of 240 days.
Sample/
Location
30-Fold Image Before Corrosion3D Image Before CorrosionB Ra/
μm
30-Fold Image After Corrosion3D Image After CorrosionA Ra/
μm
SB1Buildings 16 03011 i001Buildings 16 03011 i002105.6Buildings 16 03011 i003Buildings 16 03011 i00471.0
2Buildings 16 03011 i005Buildings 16 03011 i00642.7Buildings 16 03011 i007Buildings 16 03011 i00821.1
3Buildings 16 03011 i009Buildings 16 03011 i010126.8Buildings 16 03011 i011Buildings 16 03011 i01252.4
4Buildings 16 03011 i013Buildings 16 03011 i01477.8Buildings 16 03011 i015Buildings 16 03011 i01612.0
5Buildings 16 03011 i017Buildings 16 03011 i01866.2Buildings 16 03011 i019Buildings 16 03011 i02033.2
YSB1Buildings 16 03011 i021Buildings 16 03011 i02265.9Buildings 16 03011 i023Buildings 16 03011 i02448.3
2Buildings 16 03011 i025Buildings 16 03011 i02675.7Buildings 16 03011 i027Buildings 16 03011 i02834.3
3Buildings 16 03011 i029Buildings 16 03011 i03079.9Buildings 16 03011 i031Buildings 16 03011 i03263.2
4Buildings 16 03011 i033Buildings 16 03011 i03471.3Buildings 16 03011 i035Buildings 16 03011 i03615.8
5Buildings 16 03011 i037Buildings 16 03011 i038111.5Buildings 16 03011 i039Buildings 16 03011 i040113.3
SQ1Buildings 16 03011 i041Buildings 16 03011 i04252.5Buildings 16 03011 i043Buildings 16 03011 i04468.5
2Buildings 16 03011 i045Buildings 16 03011 i04642.6Buildings 16 03011 i047Buildings 16 03011 i04877.7
3Buildings 16 03011 i049Buildings 16 03011 i05048.4Buildings 16 03011 i051Buildings 16 03011 i05293.2
4Buildings 16 03011 i053Buildings 16 03011 i05430.5Buildings 16 03011 i055Buildings 16 03011 i05655.2
YSQ1Buildings 16 03011 i057Buildings 16 03011 i05854.6Buildings 16 03011 i059Buildings 16 03011 i06014.7
2Buildings 16 03011 i061Buildings 16 03011 i06263.1Buildings 16 03011 i063Buildings 16 03011 i06449.6
3Buildings 16 03011 i065Buildings 16 03011 i06667.8Buildings 16 03011 i067Buildings 16 03011 i06893.1
4Buildings 16 03011 i069Buildings 16 03011 i07097.3Buildings 16 03011 i071Buildings 16 03011 i072101.9
Table 4. Roughness change rate.
  SampleSBYSBSQYSQ
 Roughness
Change Rate
 
Age/d  
Change2.848.593.2−4.0
30−44.6104.9−31.4−19.8
6057.5−76.231.6−85.2
9014.7−0.913.8−0.5
12022.07.6−9.716.8
180−10.418.5−8.684.3
240−55.3−35.771.7−13.1
Table 5. XRD quantitative analysis of samples at different depths at 240 d of corrosion.
SampleLocation/Depth(mm)Ettringite
AFt
Gypsum
CaSO4·2H2O
Mirabilite
Na2SO4·10H2O
Thenardite
Na2SO4
SB00–586.92.94.26.0
5–1070.911.69.18.4
10–1572.512.15.99.5
SB24010–563.815.713.17.4
5–1092.82.21.13.9
10–1588.22.11.97.8
20–595.91.50.81.8
5–1094.82.02.90.3
10–1553.56.73.836.0
30–594.00.12.53.4
5–1089.90.00.39.8
10–1591.40.00.48.2
40–589.20.00.710.1
5–1085.510.62.61.3
10–1583.72.08.75.6
50–564.90.13.032.0
5–1078.90.111.59.5
10–1592.90.00.26.9
YSB24010–592.20.03.04.8
5–1093.00.10.76.2
10–1578.40.27.813.6
20–582.20.23.014.6
5–1069.117.53.69.8
10–1584.93.95.16.1
30–590.60.12.27.1
5–1084.00.18.37.6
10–1590.37.41.90.4
40–592.63.33.70.4
5–1077.20.114.18.6
10–1582.60.17.69.7
50–592.30.14.03.6
5–1086.80.17.65.5
10–1587.03.14.05.9
SQ24010–5778.46.18.5
5–1080.110.48.51
10–1585.40.1311.5
20–581.60.17.311
5–1084.40.12.513
10–15903.35.31.4
30–591.44.23.90.5
5–1086.52.664.9
10–1584.40.12.513
40–594.20.15.30.4
5–1086.67.74.51.2
10–1584.83.24.67.4
YSQ24010–590.10.15.04.8
5–1080.10.26.013.7
10–1594.81.52.21.5
20–594.02.31.62.1
5–1077.26.79.17.0
10–1586.83.61.77.9
30–570.37.73.218.8
5–1084.60.11.813.5
10–1591.70.12.55.7
40–588.26.22.43.2
5–1091.70.12.55.7
10–1590.50.04.64.9
Disclaimer/Publisher’s Note: The statements, opinions and data contained in all publications are solely those of the individual author(s) and contributor(s) and not of MDPI and/or the editor(s). MDPI and/or the editor(s) disclaim responsibility for any injury to people or property resulting from any ideas, methods, instructions or products referred to in the content.