


Abstract
Fracture in concrete is inherently a multi-stage process, yet traditional three-stage frameworks do not explicitly distinguish between micro-crack development and macro-crack propagation, particularly under varying ligament length conditions. The influence of ligament length (notch-to-depth ratios of 0.0, 0.2, 0.3, 0.4, and 0.5) on the crack propagation characteristics in notched concrete beams under three-point bending is investigated. Three-dimensional digital image correlation (3D DIC) was employed to monitor full-field displacement and strain, enabling the evaluation of key fracture parameters including horizontal displacement, crack mouth opening displacement (CMOD), horizontal strain, fracture process zone (FPZ) length, macro-crack length, and total fracture zone length. A high-magnification industrial camera (100×) was simultaneously used for real-time observation of the notch tip. Based on the evolution of these parameters, the fracture process was divided into four distinct stages: linear elastic stage, micro-crack initiation and propagation stage, macro-crack initiation and propagation stage, and complete failure stage. The industrial camera observations confirmed macro-crack initiation at approximately 60% of the post-peak load, validating the proposed four-stage division. Quantitative results show that increasing the notch depth ratio from 0.0 to 0.5 reduces the peak load by approximately 30–40% and decreases the nominal stress proportionally. The FPZ was found to be fully developed at the 60% post-peak load threshold, after which it diminished as macro-crack propagation dominated. Aggregate bridging, crack deflection, and crack branching were consistently identified as the primary toughening mechanisms governing the ligament effect. The crack propagation mechanisms in the four stages are controlled by the combined effects of front free boundary effect, stress concentration effect, ligament effect, and back free boundary effect. These findings provide a refined understanding of concrete fracture that can inform the safety assessment and design of concrete bending members in infrastructure construction.
1. Introduction
The fracture behavior of quasi-brittle materials such as concrete is a fundamental research topic in structural engineering, as it directly governs the load-carrying capacity and long-term durability of concrete components [1,2,3]. Unlike metallic materials that undergo considerable plastic flow prior to rupture, concrete typically exhibits a nonlinear response under mechanical loading, characterized by progressive internal damage, strain localization, and post-peak softening [4,5]. These inelastic features are largely attributable to the evolution of a fracture process zone (FPZ) that develops ahead of the crack tip. Within this region, distributed micro-cracks initiate, propagate, and eventually coalesce into a continuous macro-crack [6,7]. The FPZ significantly influences the overall fracture performance of concrete by affecting key parameters such as fracture energy, crack growth stability, and specimen size effects [8]. Consequently, a thorough understanding of FPZ evolution and the associated crack growth mechanisms is a prerequisite for reliable fracture prediction and safety assessment of concrete structures [9,10].
Considerable research efforts have been dedicated over the past few decades to characterizing the fracture response of quasi-brittle materials through both experimental and numerical approaches [11]. A range of experimental techniques have been developed and applied to investigate the complex cracking processes in concrete. These include acoustic emission (AE), scanning electron microscopy (SEM), X-ray computed tomography (CT), and digital image correlation (DIC) [12,13,14]. Among these methods, DIC has gained particular recognition as a powerful measurement tool owing to its non-contact operation, high measurement precision, and ability to capture full-field kinematic data [15]. Both two-dimensional and three-dimensional DIC systems have been successfully employed in concrete fracture studies. Typical applications include the detection of crack initiation and growth, the quantification of FPZ dimensions, and the analysis of strain localization in concrete beams under flexural loading [16,17,18]. Furthermore, DIC enables the identification of critical fracture parameters such as crack opening displacements, the location of the crack tip, and the spatial extent of the FPZ—information that is generally inaccessible through conventional pointwise measurement techniques.
Despite the progress made in understanding concrete fracture, a number of issues remain unresolved [19]. Among these, the stage-wise progression of the cracking process is of particular significance [20]. Given the central importance of FPZ evolution in concrete fracture, a rational stage-wise description of the cracking sequence is necessary for accurate characterization of FPZ development. The conventional three-stage framework—consisting of crack initiation, stable growth, and unstable propagation—has been widely employed in the literature [21]. However, this framework does not draw a clear distinction between the phase of micro-crack development and the subsequent phase of macro-crack propagation [22]. It is well established that concrete fracture begins with the formation of micro-cracks in the vicinity of the notch tip. These micro-cracks then accumulate and merge into a single macro-crack, which proceeds to grow until complete separation occurs [23]. The mechanical response of a concrete beam differs markedly before and after the emergence of a macro-crack, particularly in terms of load resistance, internal stress redistribution, and the rate of crack opening [24]. It is therefore necessary to establish a refined stage classification that explicitly captures the transition from distributed micro-cracking to localized macro-cracking, so as to better represent the underlying failure mechanisms.
The ligament length, defined as the distance from the notch tip to the back face of the beam, is another key parameter influencing the fracture response of concrete [25]. This geometric dimension directly governs the stress field ahead of the notch, the severity of stress concentration, and the extent of FPZ development [26]. Although size effects and variations in fracture energy with specimen geometry have been investigated in previous studies [27], the specific role of ligament length in the stage-wise cracking process has received comparatively little attention. In the present work, the ligament length is systematically varied by adopting notch-to-depth ratios (a0/H) of 0.0, 0.2, 0.3, 0.4, and 0.5, corresponding to ligament lengths of 100, 80, 70, 60, and 50 mm, respectively. A systematic examination of how ligament length influences the initiation and growth of both micro-cracks and macro-cracks, as well as the transitions between successive fracture stages, is essential for a more comprehensive understanding of concrete fracture behavior.
Recent investigations have extended fracture studies beyond plain concrete beams to reinforced concrete beams and beams with non-uniform cross-sections along the working section [28,29,30]. In reinforced concrete beams, longitudinal reinforcement and stirrups modify the stress field ahead of the notch and impede macro-crack propagation through crack bridging [31,32,33]. In beams with non-uniform cross-sections, variations in concrete composition or layer configuration along the section height introduce additional complexity to crack trajectories and fracture process zone development [34,35]. These findings confirm that fracture behavior is not solely governed by ligament length but is also significantly influenced by reinforcement and cross-sectional heterogeneity [36]. While the present study deliberately focuses on plain concrete beams to isolate the ligament length effect, the ligament length remains a fundamental geometric parameter common to all notched beams. Consequently, the results obtained from this simplified configuration, including the four-stage fracture classification and the associated load thresholds, can serve as a baseline reference for future investigations into reinforced beams and beams with non-uniform sections, where reinforcement and material variations introduce further complexities.
In addition to ligament length, the mesoscale heterogeneity of concrete also plays an important role in determining crack propagation paths [12,37]. Concrete is a composite material consisting of coarse aggregates embedded in a cementitious matrix, with a weak interfacial transition zone (ITZ) surrounding each aggregate particle [38]. This inherent heterogeneity gives rise to complex crack trajectories that are influenced by aggregate size, shape, and spatial distribution [39,40]. Crack deflection, aggregate bridging, and crack branching are recognized as the primary toughening mechanisms that enhance the overall fracture resistance of concrete [41,42]. Characterization of these mesoscale mechanisms demands high-resolution experimental techniques capable of resolving crack evolution at the microscopic scale.
To address the research gaps identified above, the present study establishes a refined four-stage classification of the fracture process in notched concrete beams under three-point bending, quantifies the ligament length effect on key fracture parameters (including peak load, nominal stress, and fracture energy), and identifies the underlying toughening mechanisms, namely, aggregate bridging, crack deflection, and crack branching, that govern the ligament effect.
The proposed four-stage classification defines the fracture process as follows: the linear elastic stage, the micro-crack initiation and propagation stage, the macro-crack initiation and propagation stage, and the complete failure stage. The transition from micro-cracking to macro-cracking is identified at approximately 60% of the post-peak load, based on direct observations from a high-magnification industrial camera. This threshold corresponds to the point at which the cohesive stress ahead of the notch tip is exhausted and a distinct macro-crack becomes visible. The proposed four-stage division is therefore not arbitrary but is grounded in observable cracking events. Quantitative distinction between stages is achieved through analysis of crack mouth opening displacement (CMOD) and horizontal strain evolution, while the industrial camera observations serve to validate the proposed stage boundaries. In addition, the influence of ligament length on crack propagation characteristics—including peak load, nominal stress, and fracture energy—is systematically investigated. The underlying mechanisms responsible for the ligament effect, such as aggregate bridging and crack deflection, are also discussed.
The remainder of this paper is organized as follows. Section 2 describes the experimental program, including the mixed-proportion design, specimen preparation, material parameter determination, and experimental setup for fracture tests using 3D DIC and the industrial camera. Section 3 presents the experimental results and analyses, covering load–displacement responses, crack propagation paths, CMOD and horizontal strain evolution, and the definition of the four fracture stages. Section 4 discusses the fracture characteristics for the four stages of crack propagation based on the 3D DIC monitoring results. Section 5 addresses the crack propagation mechanisms governing the four stages. Section 6 summarizes the main conclusions drawn from this study.
2. Experimental Program
Two complementary experimental techniques are employed in this study. The three-dimensional digital image correlation (3D DIC) method is used to monitor full-field displacement and strain throughout the entire loading process, enabling the evaluation of key fracture parameters such as FPZ length, macro-crack length, and fracture zone length. In parallel, a high-magnification industrial camera (100×, Hikrobot, Hangzhou, Zhejiang, China) is positioned near the notch tip to capture real-time deformation and to precisely identify the moment of macro-crack initiation. The combination of these two techniques allows for a comprehensive characterization of the fracture process, from the onset of micro-cracking to complete failure.
2.1. Mix Proportion Design and Specimen Preparation
Concrete mixtures were prepared with ordinary Portland cement 42.5R (CEM I 2 42.5R, Shunlong, Meizhou, Guangdong, China) and coarse aggregates (crushed basalt) with maximum size of 19.5 mm. The coarse aggregate consisted of crushed basalt with two size fractions: 4.75–9.5 mm and 9.5–19.5 mm. The fine aggregate used was river sand of maximum size not greater than 4 mm. The specific gravities of the cement, the coarse aggregate and the fine aggregate were 3.15, 2.67 and 2.78, respectively. The mix proportion of the concrete was shown in Table 1. The water-to-cement ratio was equal to 0.42. A small quantity of superplasticizer (0.5% of cementitious material) was used to improve the workability of the fresh concrete.
Table 1.
Concrete mixture proportion.
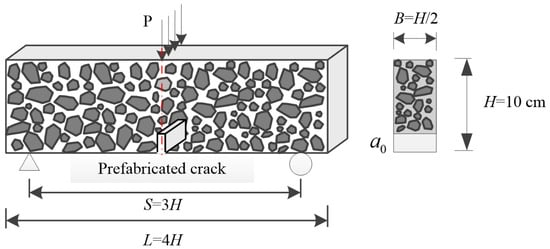
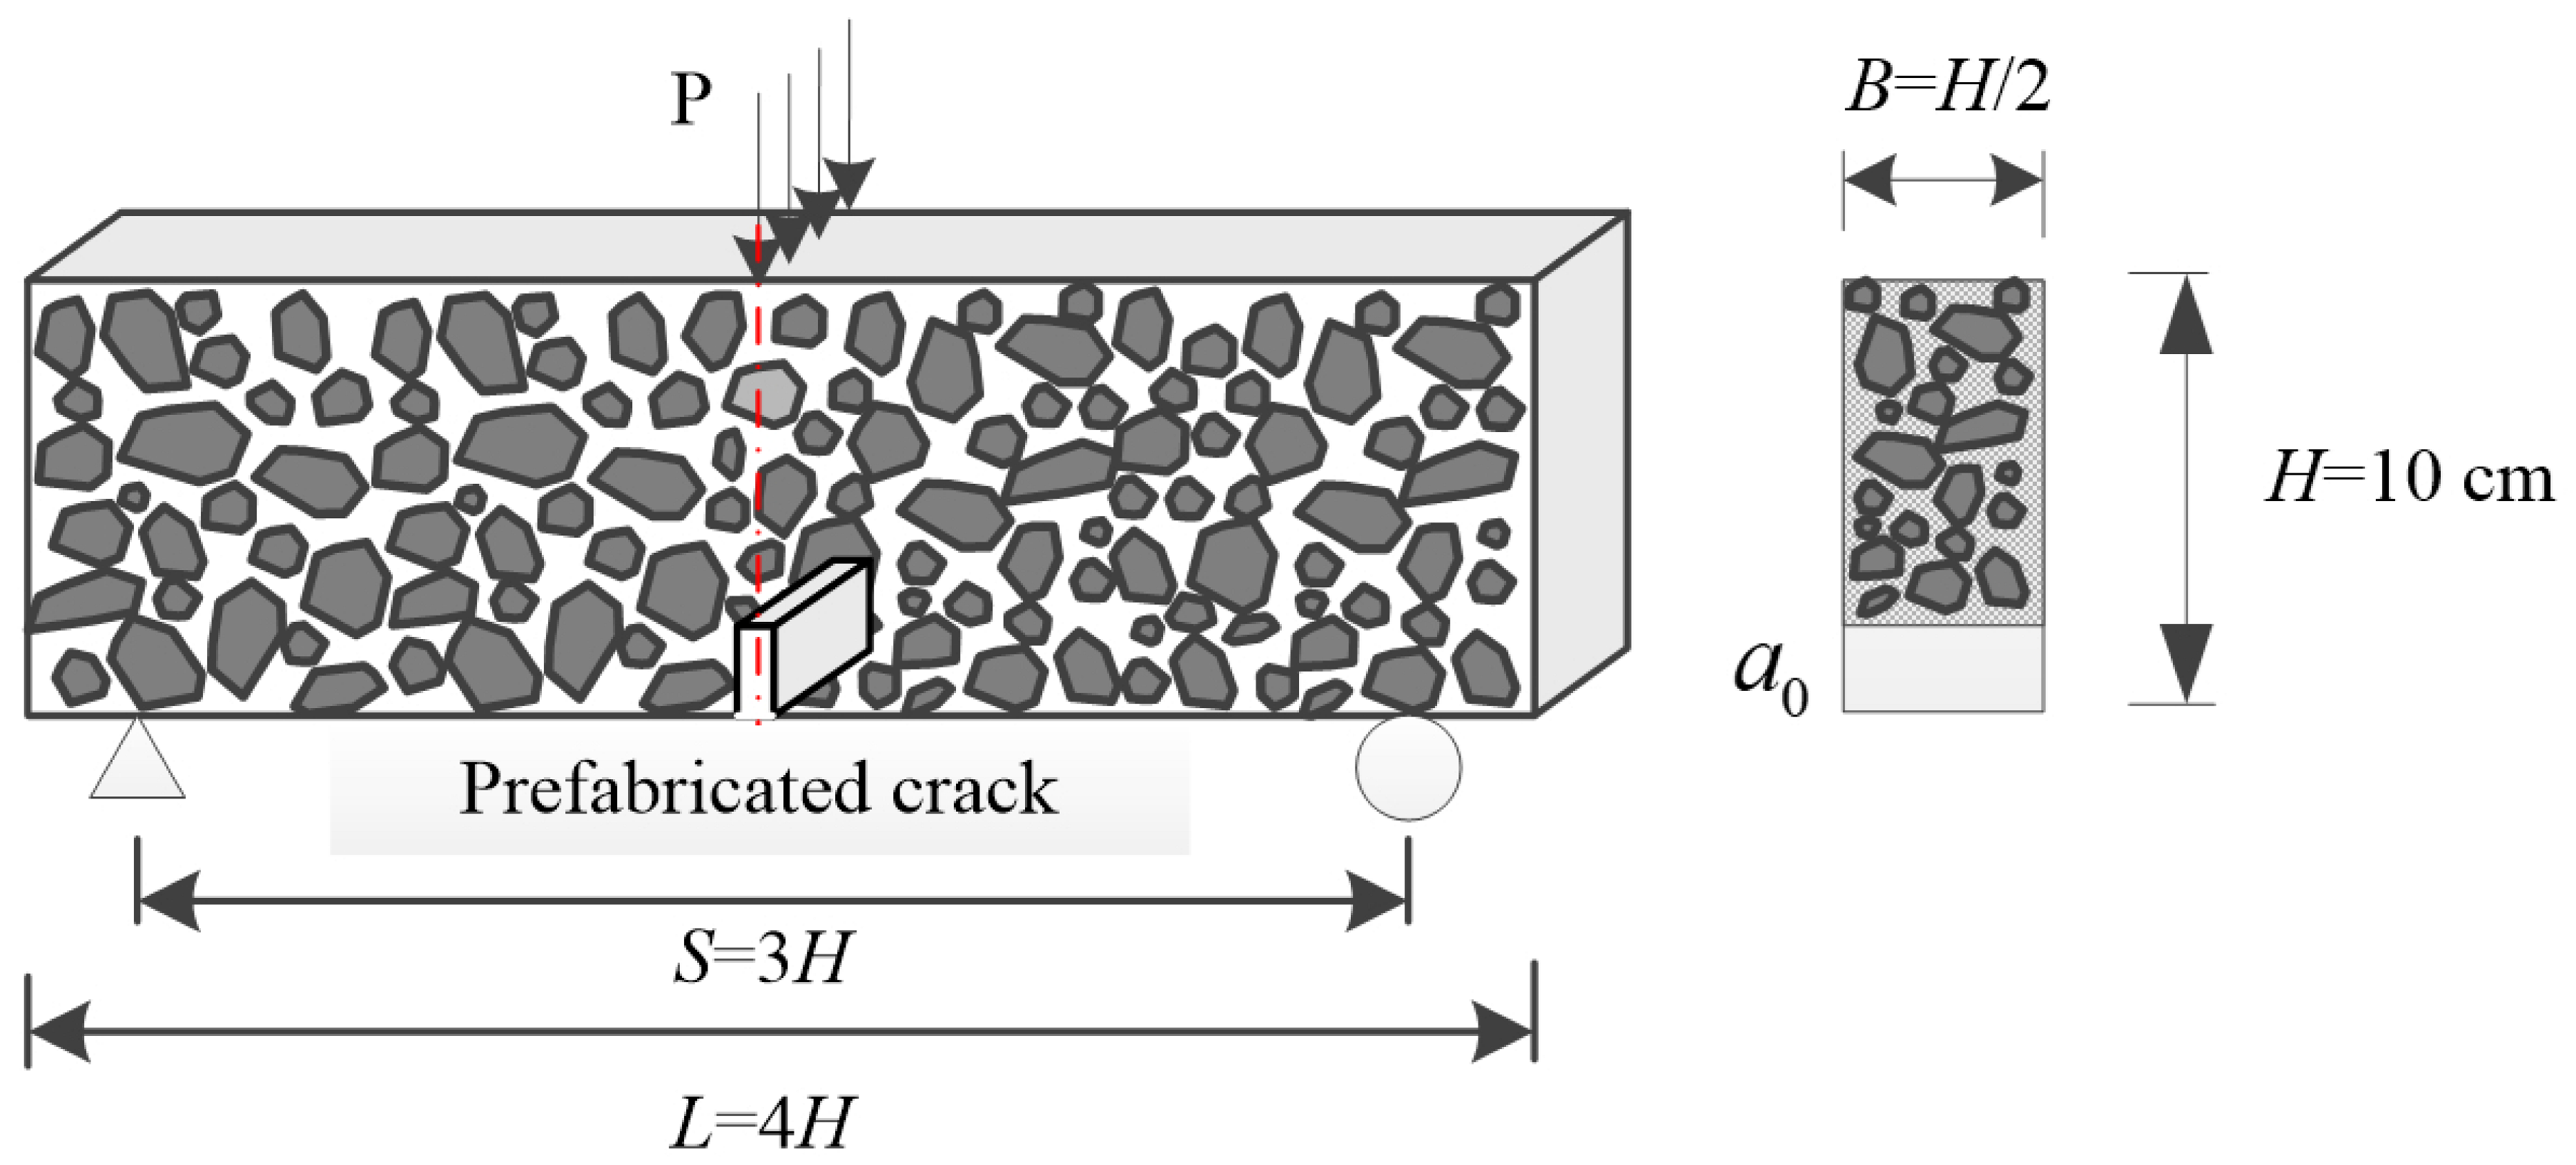
Specimens with a span to depth ratio of 3:1 were prepared. The geometry of a typical TPB beam is presented in Figure 1; a notch with a width of 2 mm was prefabricated in advance using a rigid iron strip of 2 mm thickness. The iron strip was removed with care after an initial curing period of 24 h at 20 °C and a relative humidity of 95%. Before performing the fracture tests, the specimens were kept submerged for 28 days under the same curing condition.
Figure 1.
Specimen geometry of a typical TPB beam.
A span-to-depth ratio of 3:1 was adopted in this study, which follows the recommendations of RILEM TC-50 for three-point bending fracture tests on concrete. This ratio is widely used in fracture mechanics studies on concrete beams as it ensures a sufficiently large bending moment at the notch section while avoiding potential shear-dominated failure, thus guaranteeing pure mode I fracture conditions.
All specimens were prepared, cured, and tested in accordance with Chinese standard GB/T 50081-2019 [43] (Standard for Test Methods of Concrete Physical and Mechanical Properties) and RILEM TC-50 recommendations for three-point bending fracture tests. The iron strip used for notch formation was removed after an initial curing period of 24 h at 20 °C and 95% relative humidity. Subsequently, the specimens were kept submerged for 28 days under the same curing conditions before performing the fracture tests.
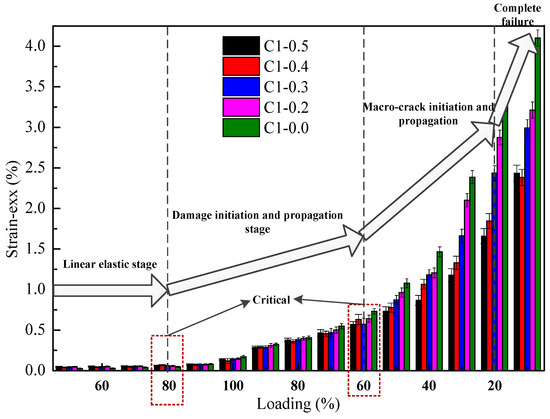
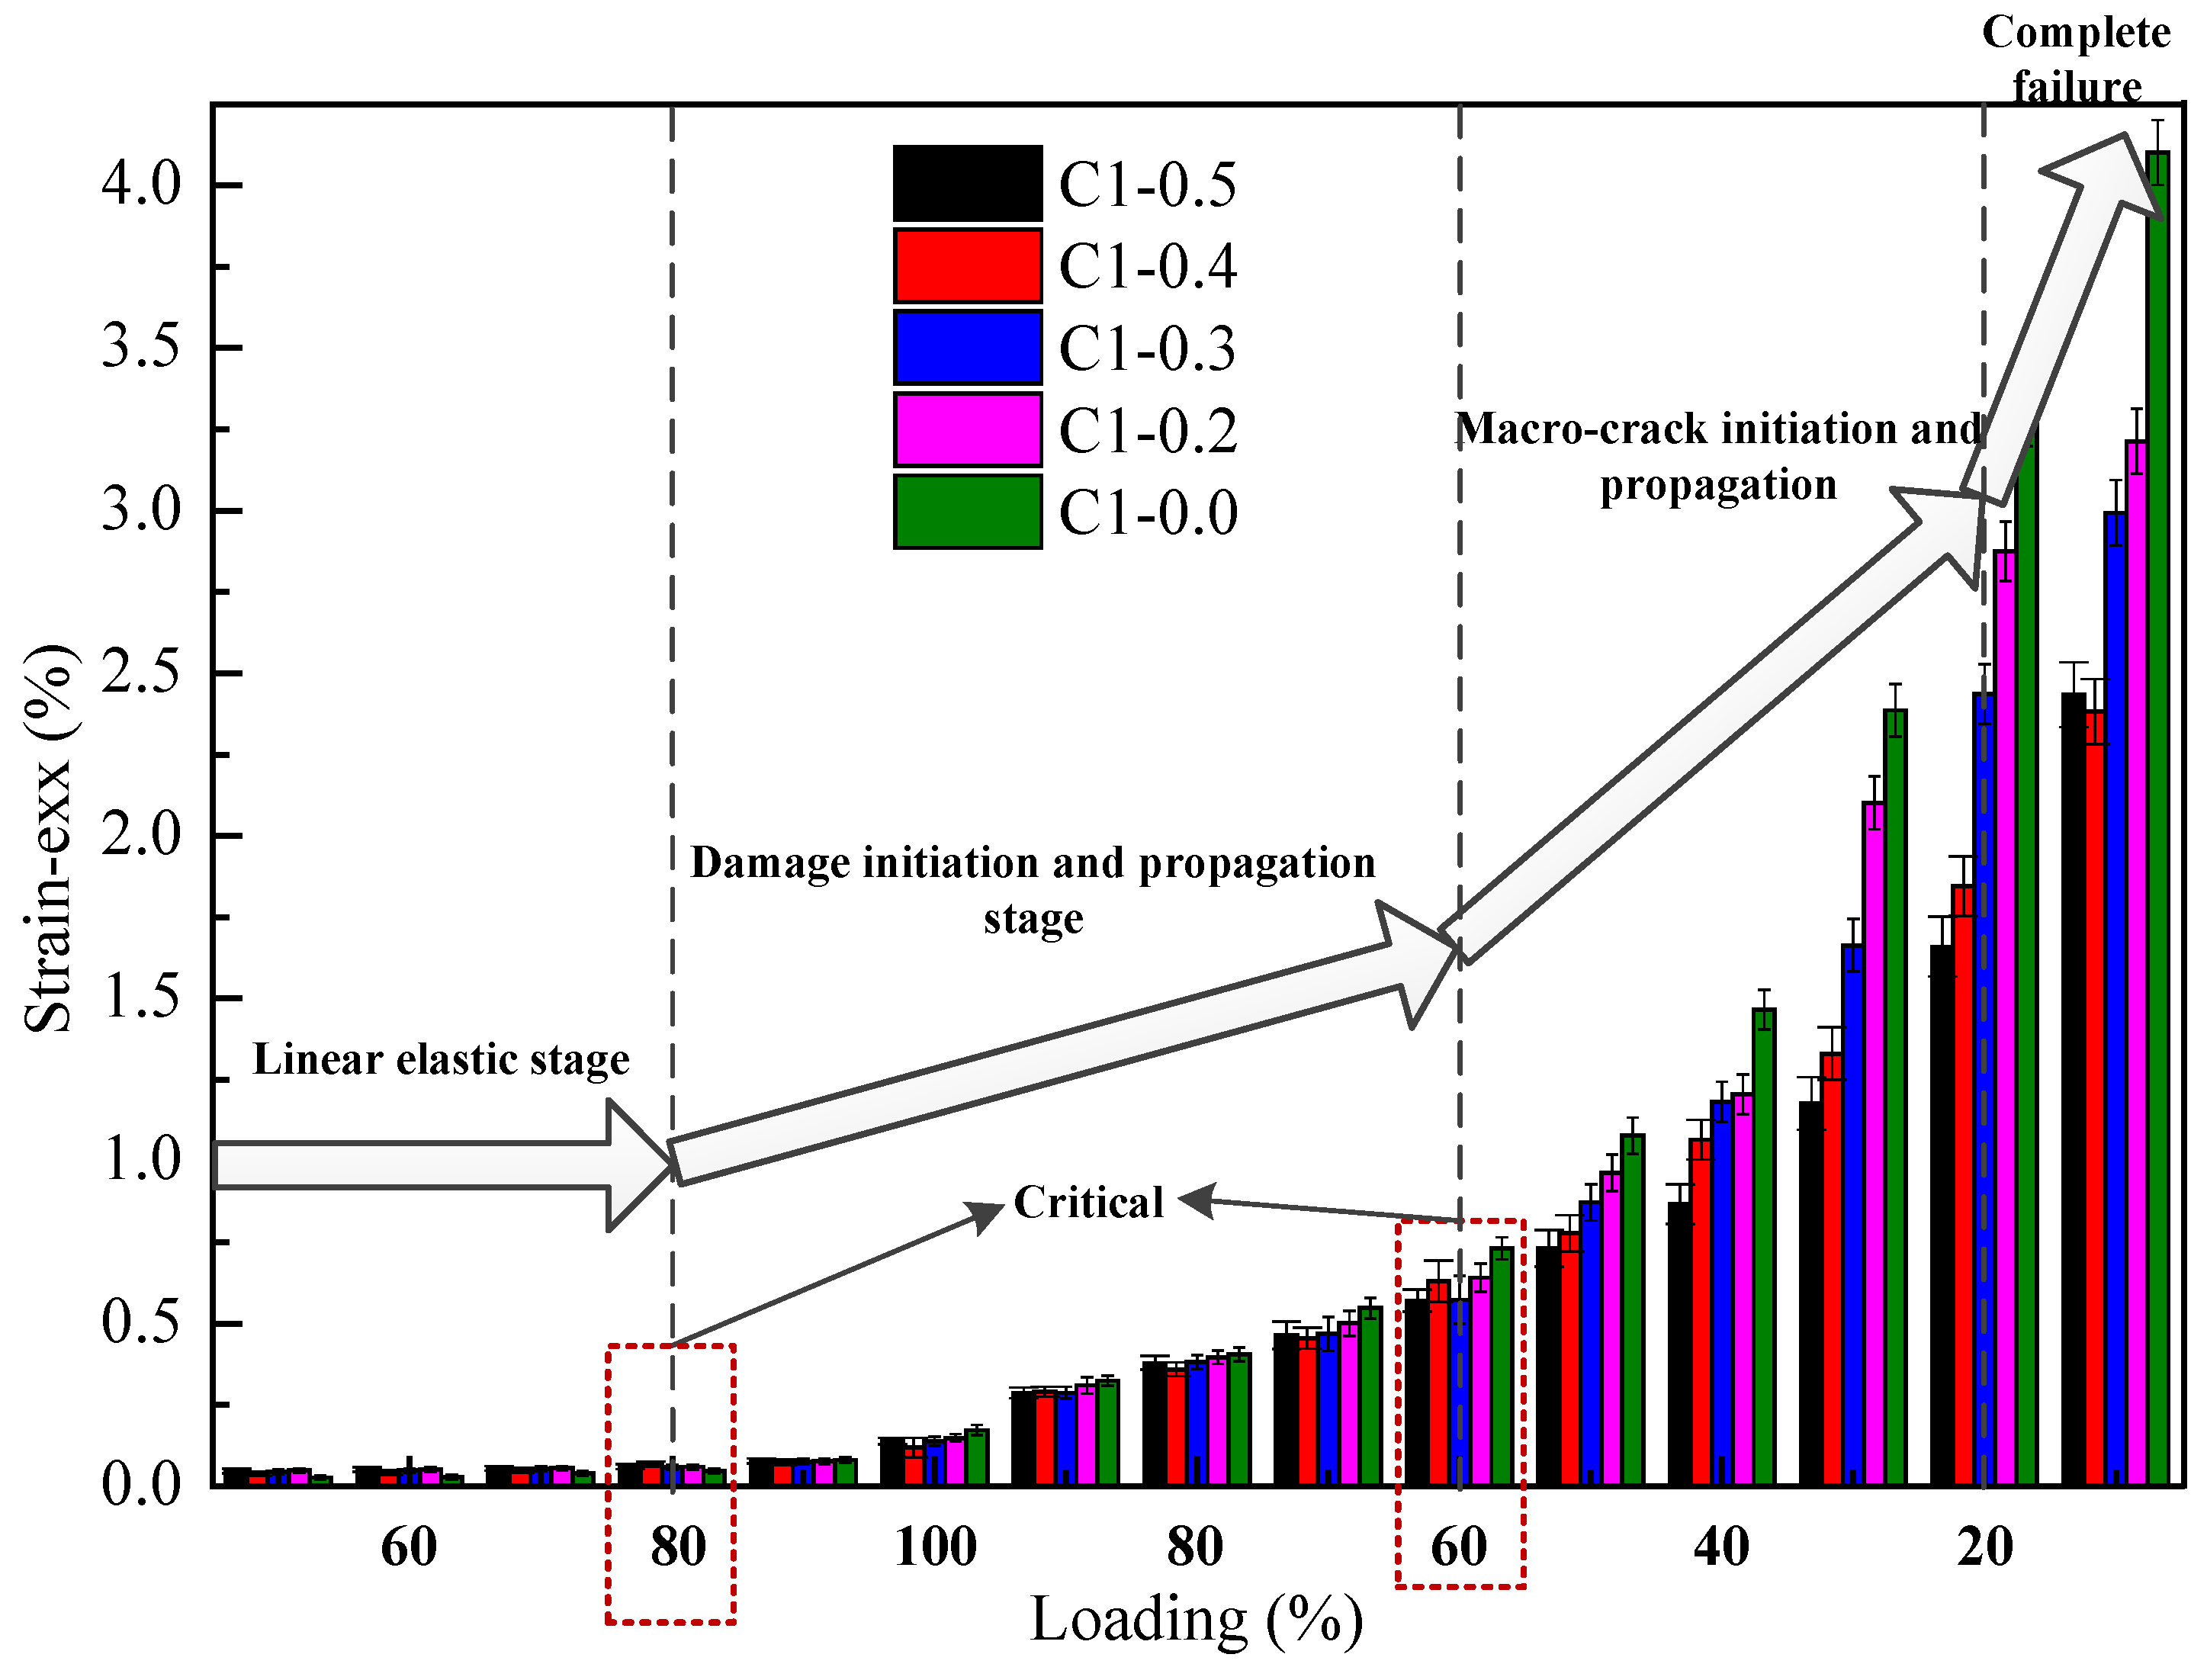
To study the influence of the ligament length on the crack propagation characteristics, the notch-to-depth ratios were selected as 0.0, 0.2, 0.3, 0.4, and 0.5. According to the notch-to-depth ratio, the specimens were classified into five series. They were designated as: C1-0.0 (without pre-crack), C1-0.2, C1-0.3, C1-0.4, and C1-0.5.
The notch-to-depth ratios (a0/H) were selected as 0.0, 0.2, 0.3, 0.4, and 0.5. This range was chosen to systematically cover a broad spectrum of ligament lengths, from the uncracked condition (0.0) to a relatively deep notch (0.5), which is the upper limit commonly adopted in previous fracture studies on concrete to avoid instability of the remaining ligament and to ensure stable crack propagation. The selected ratios also enable a comprehensive investigation of the ligament effect on fracture parameters.
2.2. Material Parameters Determination
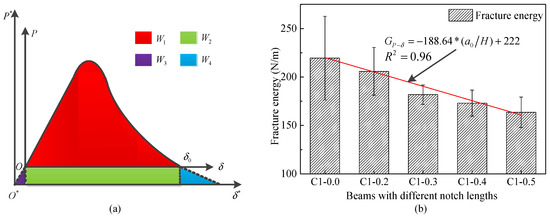
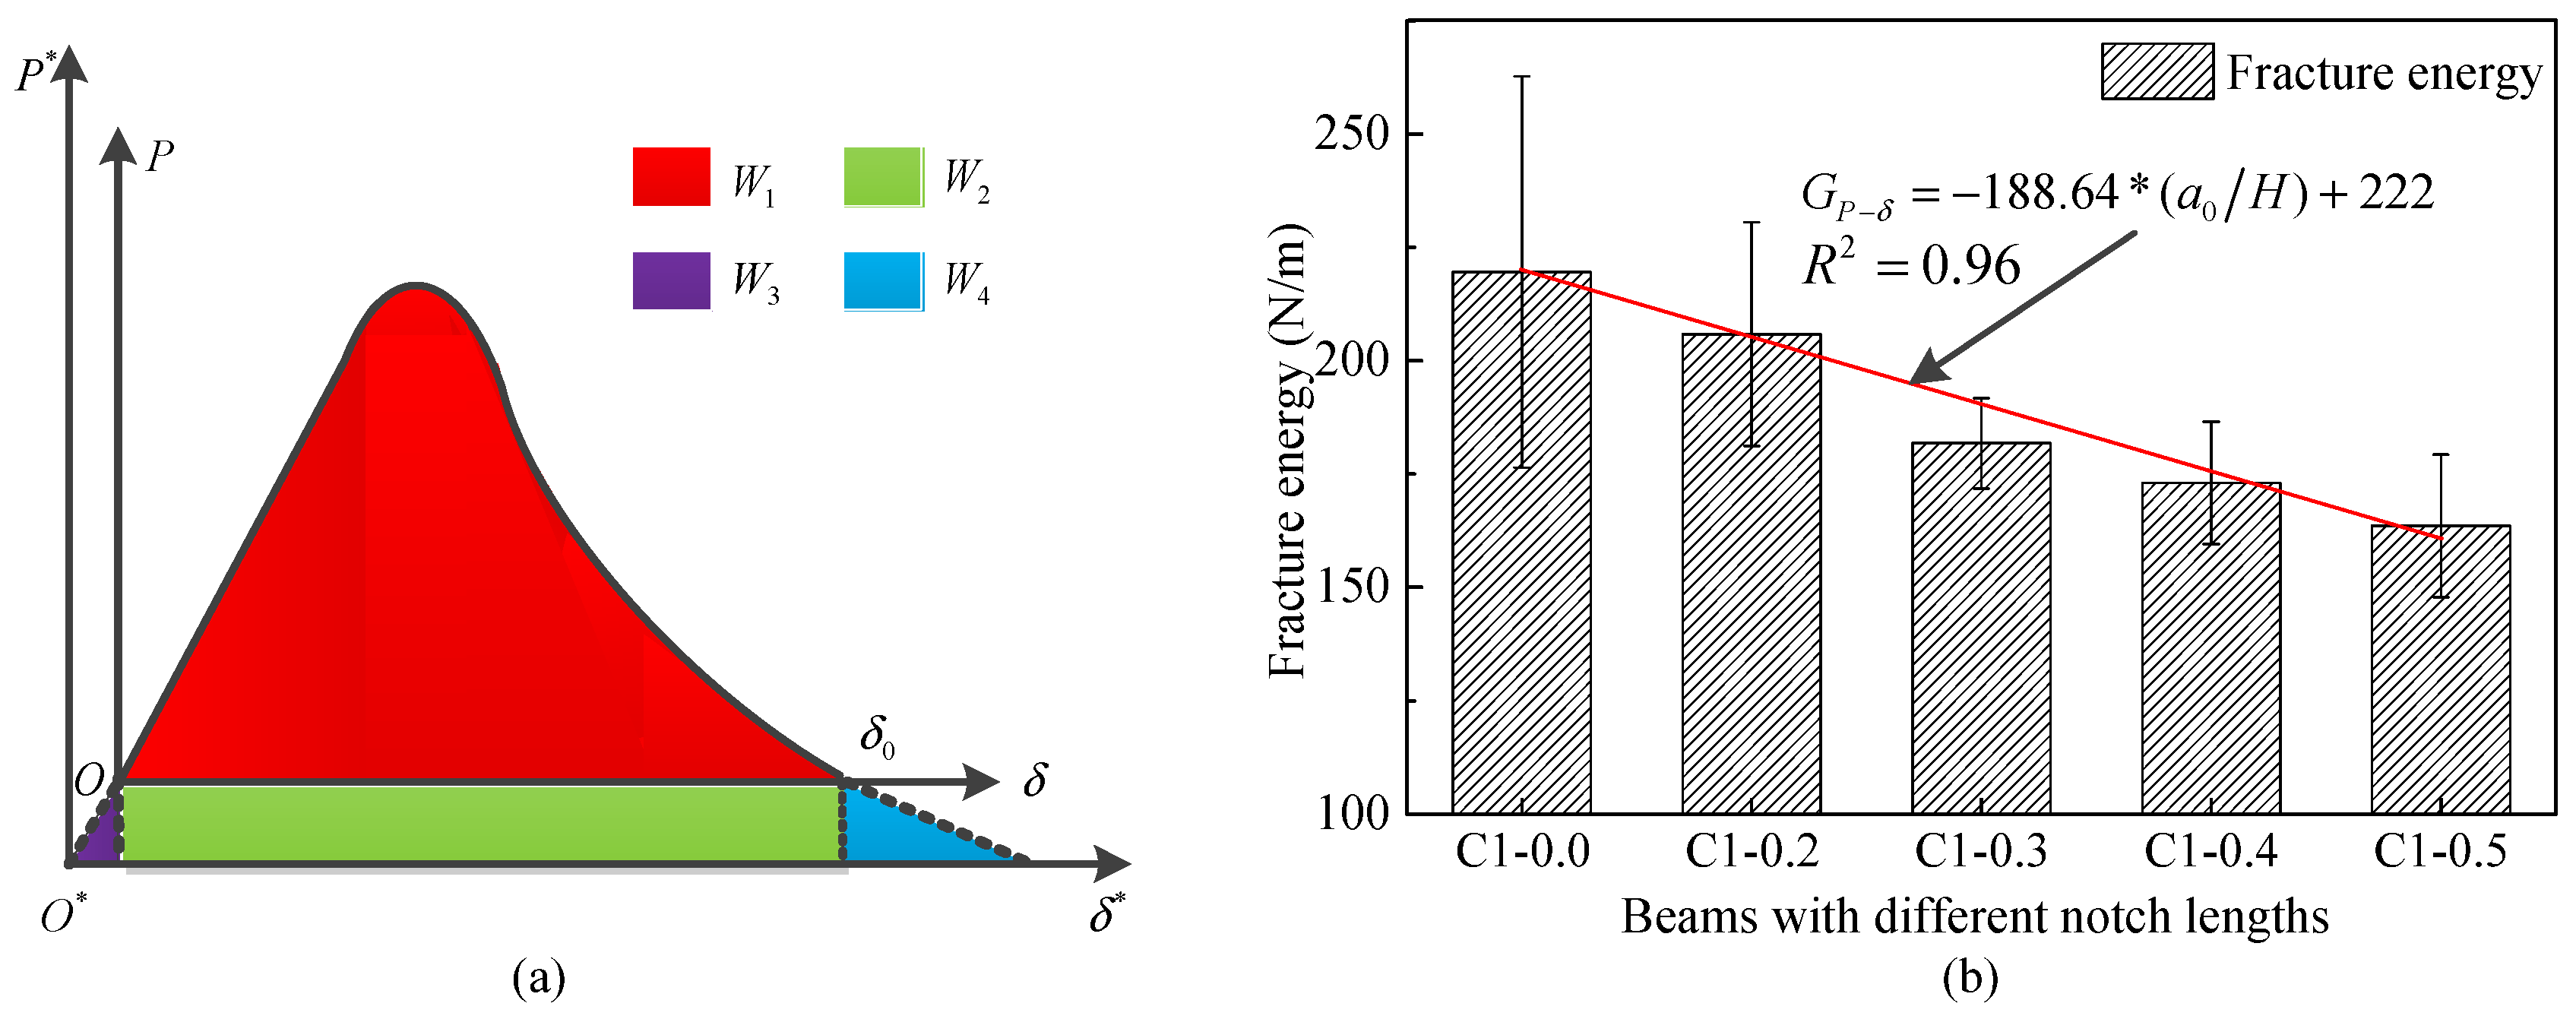
Material parameters such as compressive strength, split tensile strength and elastic modulus were measured and summarized in Table 2. Fracture energies of concrete beams were measured applying the work-of-fracture method based on the load–displacement curve, as shown in Figure 2a. The results are presented in Figure 2b. The size effect of the fracture energy can be observed in Figure 1, and was in good agreement with the previous research results [1,44,45,46].
Table 2.
Material parameters of the mixture.
Figure 2.
Test method and test results of fracture energy: (a) work-of-fracture method; (b) the results of fracture energy.
All mechanical property tests were conducted in accordance with the Chinese standard GB/T 50081-2019. For each property, three specimens were tested and the average values are reported. Specifically, three 150 mm × 150 mm × 150 mm cubes were used for compressive strength determination, three 150 mm × 150 mm × 150 mm cubes were used for split tensile strength determination, and three 150 mm × 150 mm × 300 mm prisms were used for elastic modulus measurement. The corresponding standard deviations and coefficients of variation are presented in Table 2.
2.3. Experimental Set-Up for Fracture Tests
The fracture tests were performed in three-point bending with a closed-loop universal testing machine of capacity 250 kN according to the RILEM-TMC50 recommendations. The beam was simply supported, which restricted vertical and horizontal displacements of the beam on the left support, and only vertical displacement was restricted on the right beam support, as shown in Figure 3a. Fracture tests were controlled by displacement mode with a constant rate of 0.06 mm per minute.
Figure 3.
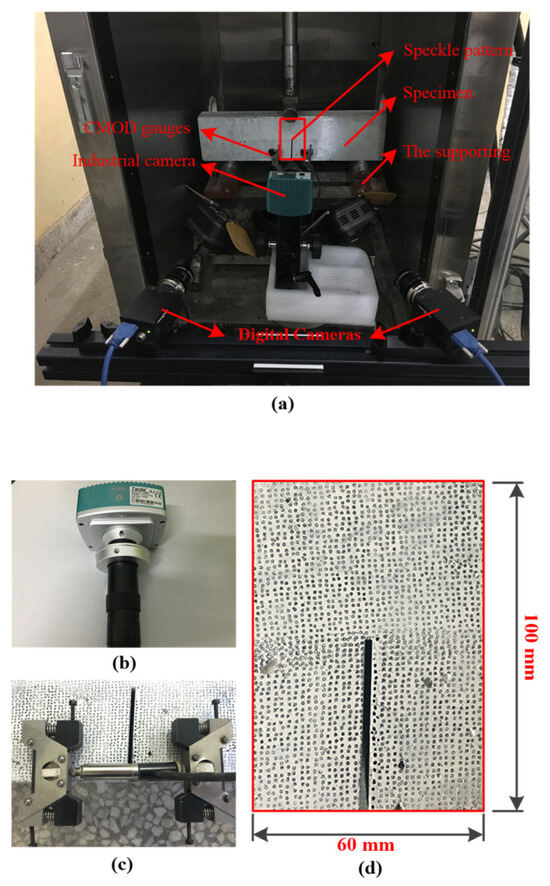
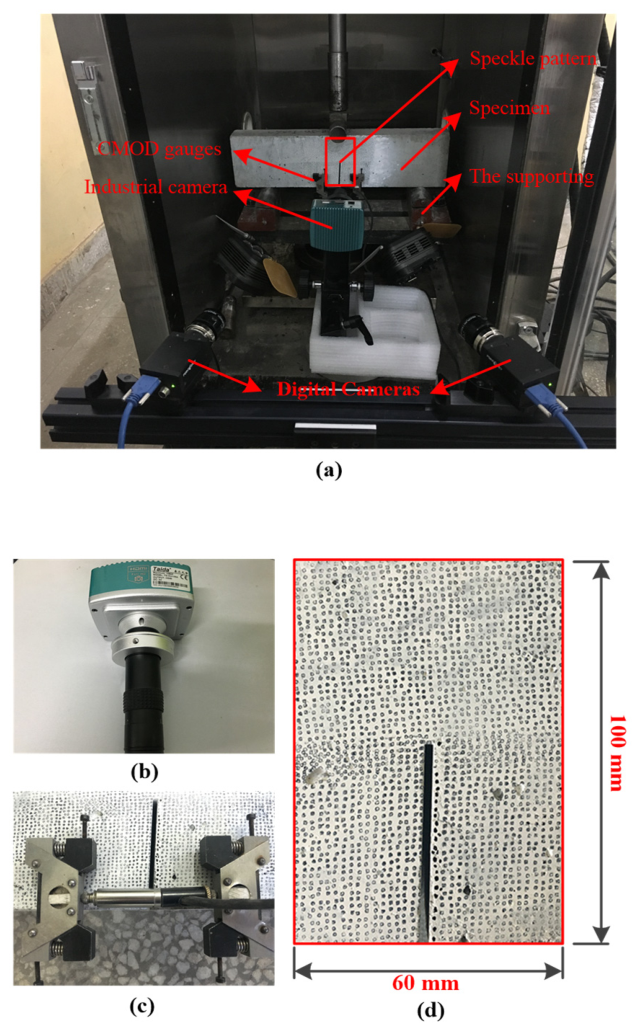
Experimental set-up for the TPB test: (a) three-point bending test set-up; (b) industrial camera; (c) CMOD gauges; (d) typical speckle pattern.
The displacement at mid-span was automatically measured using an LVDT (Sentech, Shenzhen, Guangdong, China). An industrial camera with a magnification of 100 times was installed at the horizontal distance of 10 cm from the notch tip, as shown in Figure 3b. It was applied to constantly monitor the tiny deformations in the notch tip and to catch the initiation of the macro-crack. The clip gauges (Shenzhen Chengyi Technology Co., Ltd., Shenzhen, Guangdong, China) were attached at the bottom face of the beam to measure CMOD, as shown in Figure 3c. The digital image correlation (DIC) method was employed to monitor the displacement and strain fields of the specimen constantly during the whole test process.
The DIC method is an optical and non-contact measurement method to capture surface displacements and strain fields through the successive post-processing of digital images taken with a constant time between frames from professional digital cameras. It has been widely used for concrete under bending. In this study, 3D DIC was used to measure the disparity between stereo images. It required two sets of images of the object, taken from separate camera angles at the same time. The system must be calibrated to define the 3D space in which the event or process to be studied will occur. The results of this calibration process were then used to correlate the images from the two cameras to enable the determination of the studied deflection and strain of the material. The advantages of the 3D DIC method are that it can be used to monitor large surface areas and detect unexpected phenomena occurring on the surface, such as strain localization and crack formation, which might be difficult or impossible to identify and measure using traditional techniques.
A high-quality speckle pattern made by black and white paint was sprayed onto the surface of an object of interest to achieve effective correlation, as shown in Figure 3d. It was concluded that the speckle pattern was non-repetitive and isotropic with high contrast. The digital images were acquired at a rate of one image per second for each camera during the test process. Each digital camera has a resolution of 1040 × 1392 pixels and gives 256 levels of gray output. In order to capture the notch opening, strain localization, and initial crack profile, the cameras were mounted to image an area of mid-span including the notch of the specimen. The area was approximately 60 × 100 mm, as shown in Figure 3d. At this resolution, one pixel in the image represents approx. 35 square on the specimen, which proved to be sufficient to determine a displacement measurement with 2 accuracy [44,47]. The size of the subset used for 3D DIC was determined to be 31 pixels. After acquiring the digital images, they were analyzed by the commercial software Vic 3D (version 11).
The subset size for 3D DIC analysis was set to 31 pixels. This value was determined based on a parametric study recommended by Xing et al. [48], which suggests that a subset size of approximately 30–35 pixels provides an optimal balance between spatial resolution and measurement accuracy for concrete fracture applications. A smaller subset size would introduce excessive measurement noise, while a larger subset size would reduce the spatial resolution and potentially smooth out local strain gradients near the crack tip. The chosen size of 31 pixels corresponds to a physical size of approximately 31 × 35 μm ≈ 1.1 mm on the specimen surface, which is sufficient to capture the strain localization phenomena associated with FPZ development.
3. Results and Discussion
3.1. Load–Displacement Curve
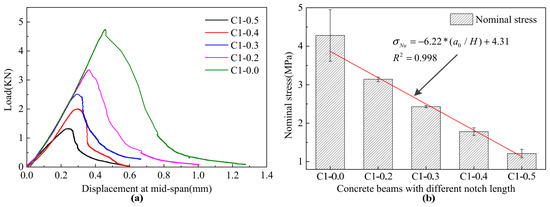
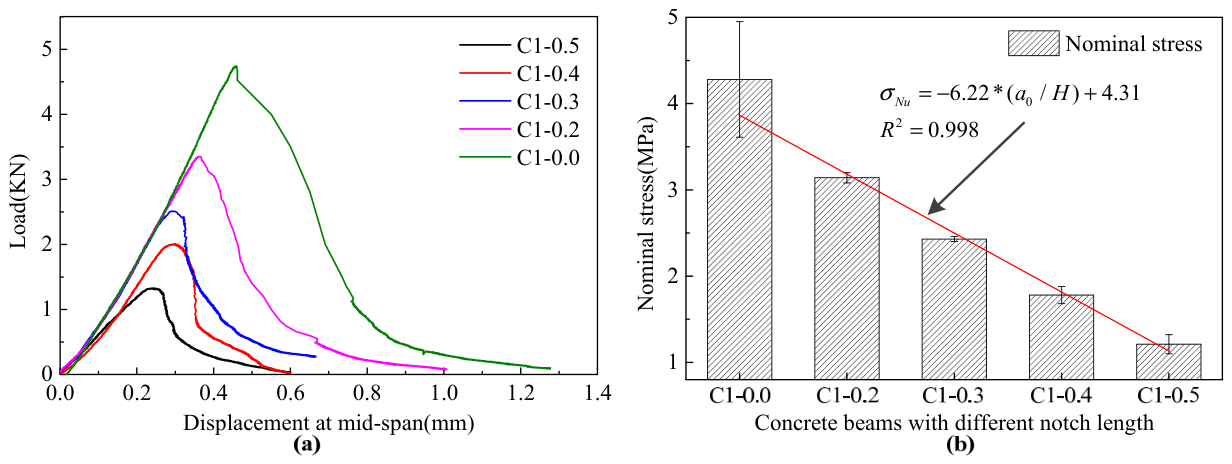
Figure 4a presents the average load–displacement curves for the specimens with five notch lengths. The nominal stresses () were calculated based on the peak load () and the ligament length (), which was given by Equation (1). The results of nominal stresses are summarized in Figure 4b.
where represents the nominal stress, is the peak load, is the specimen height, is the initial notch height, is the ligament length, and S = 3H, B = H/2.
Figure 4.
Load–displacement curves and nominal stresses for the specimens with five notch lengths: (a) load–displacement curves; (b) nominal stresses.
It is found from Figure 4a,b that, with the notch length increased, the peak load, the maximum deflection and the nominal stress all show a decreasing trend. An obvious size effect is exhibited regardless of the peak load, the maximum deflection or the nominal stress, which fits well with the test results of the fracture energy. In this study, the size effect is also called the ligament effect.
3.2. Crack Propagation Path
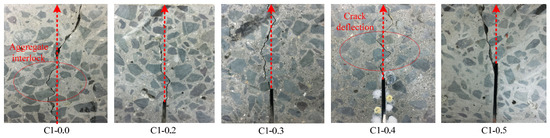
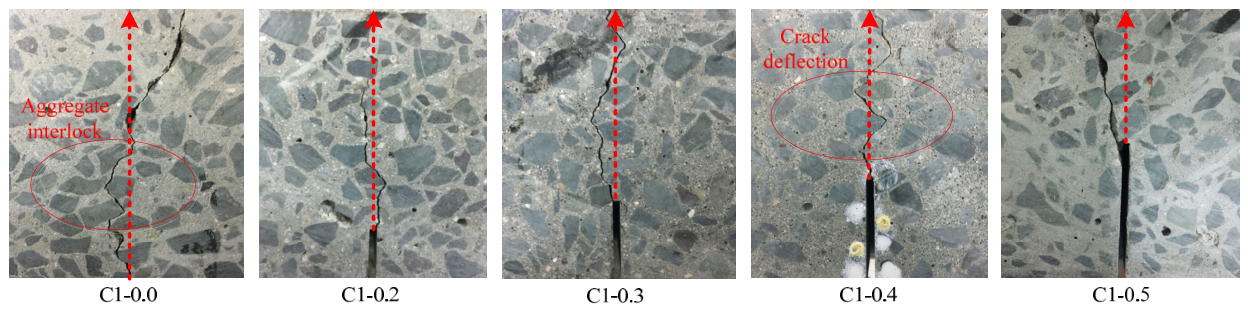
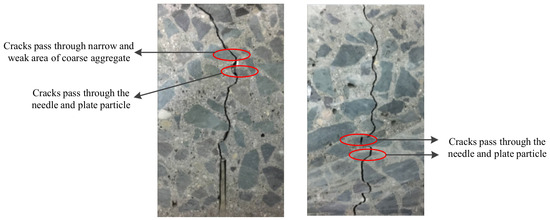
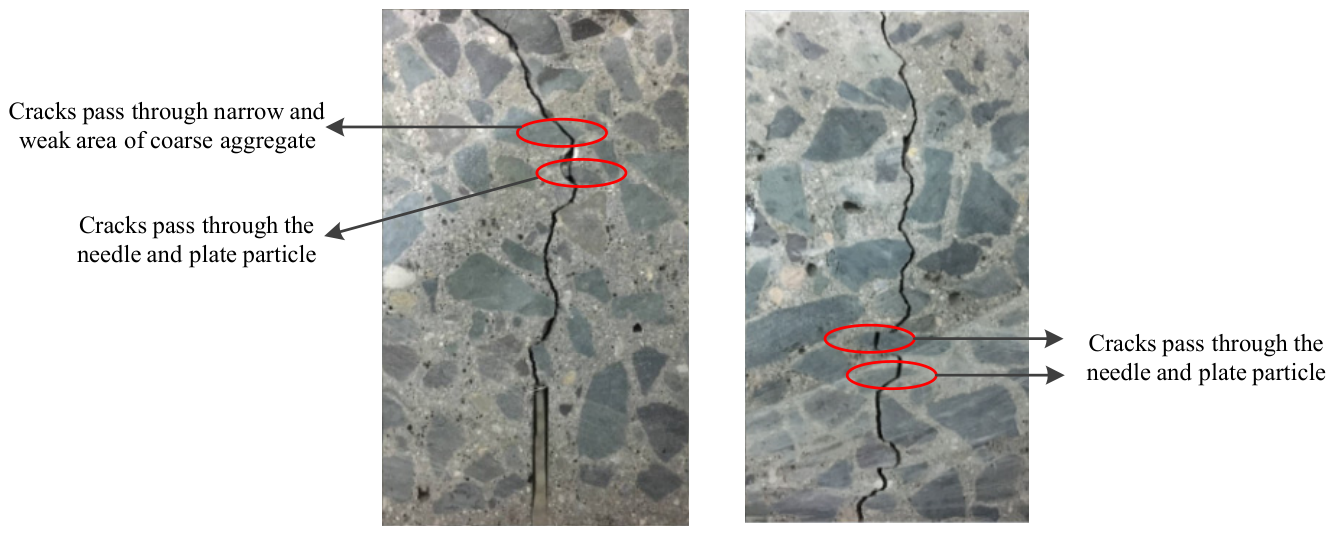
The ligament effect described above could be illustrated by the crack initiation and crack propagation paths. Figure 5 shows the typical crack propagation paths and the distribution of macro-cracks for pure mode I fracture. It could be pointed out from Figure 5 that the crack propagation path is affected by the aggregate random distribution; it is tortuous and not unique. The crack is first initiated around the notch tip; then, the crack is expanded upward to the closest coarse aggregate. As the crack is expanded to the coarse aggregate, because of the aggregate interlock and bridging effect, the crack is deflected and expanded continuously along the interface between this coarse aggregate and its mortar until the crack bypasses the coarse aggregate. The specimen is completely fractured following the above crack propagation law. This phenomenon could be interpreted as toughening mechanisms, such as aggregate bridging and crack deflection. In a few cases, the crack is propagated through flat particles or a weak aggregate area due to a higher stress state, as shown in Figure 6. This suggests that the flat particle content affects the crack propagation path and the fracture properties of concrete: the higher the flat particle content is, more brittleness the material shows.
Figure 5.
Typical crack propagation paths and the distribution of macro-cracks.
Figure 6.
The cracks pass through the needle and plate particle or narrow and weak areas of coarse aggregates.
3.3. CMOD and Horizontal Strain Acquisition
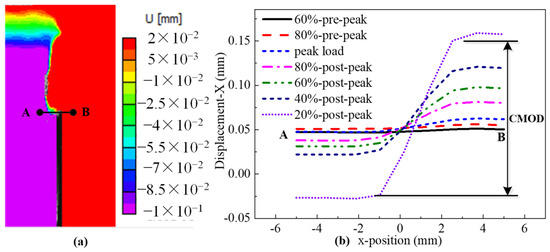
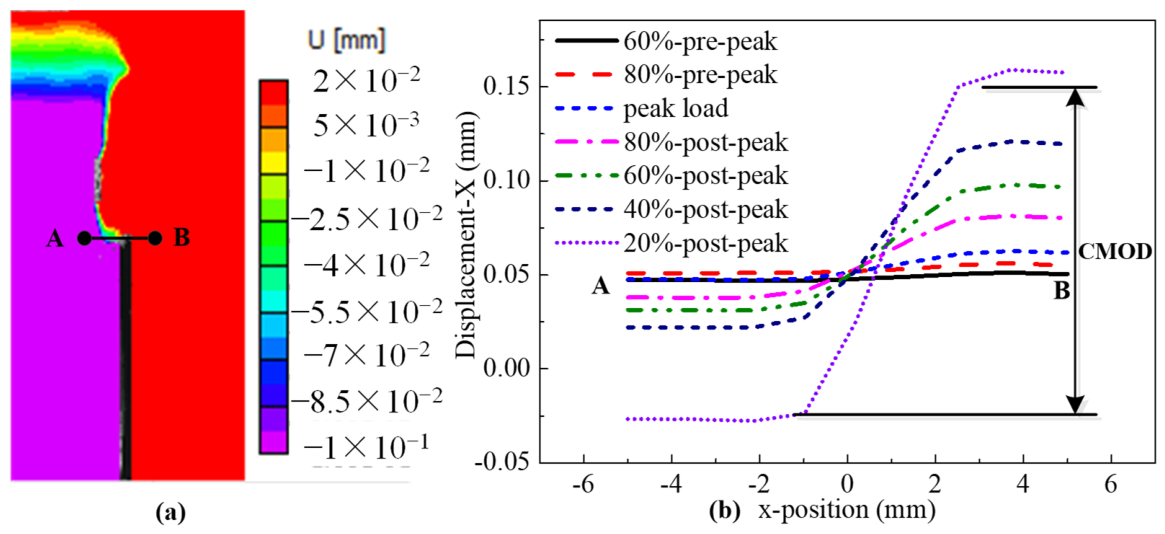
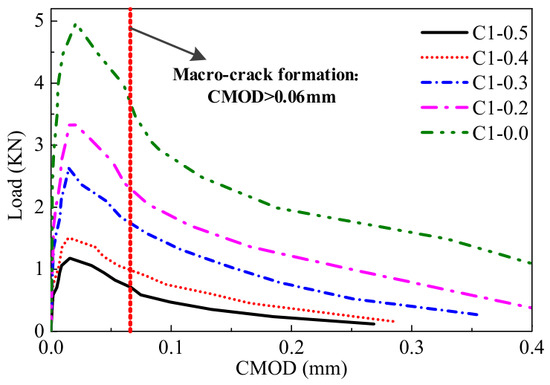
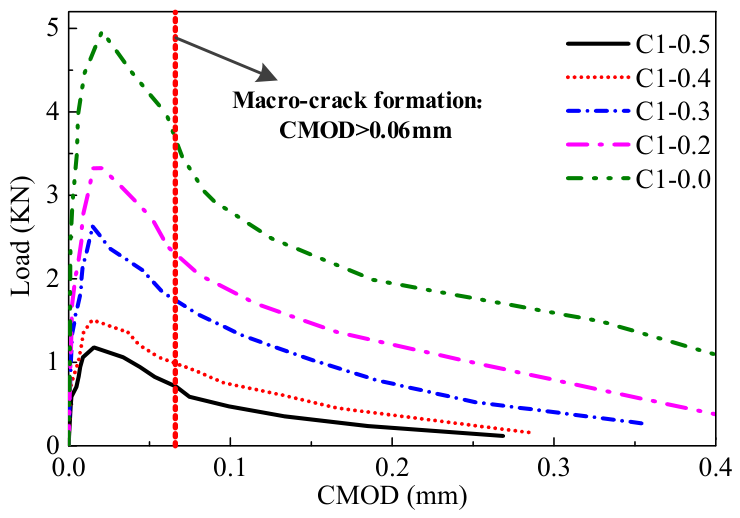
Using the previous research [44,49], the crack opening displacement measured from DIC method was compared with the results from clip gauge, and it was proved to measure the crack opening displacement accurately and effectively. In this study, the crack opening displacement of the notch tip was acquired through extracting horizontal displacement along line AB using the commercial software Vic 3D, as shown in Figure 7a (taking C1-0.5 as an example). Figure 7b shows that the horizontal displacement was almost gentle at the early stage of the load curve, whereas an abrupt jump in the horizontal displacement was induced in the peak load and post-peak load ranges. The sudden jump in the horizontal displacement values ahead of the notch tip was defined as the crack mouth opening displacement (CMOD). The load–CMOD curves for five classes of specimens with different notch lengths are presented in Figure 8. Figure 8 shows that the results obtained from the load–CMOD curves were in good agreement with the results obtained from the load–displacement curves, which all showed an obvious ligament effect.
Figure 7.
Horizontal displacement around notch tip: (a) Horizontal displacement analyzed from commercial software-Vic 3D, (b) Horizontal displacement distribution alone line AB with different load percentages.
Figure 8.
Load–CMOD curves for five classes of specimens with different notch lengths.
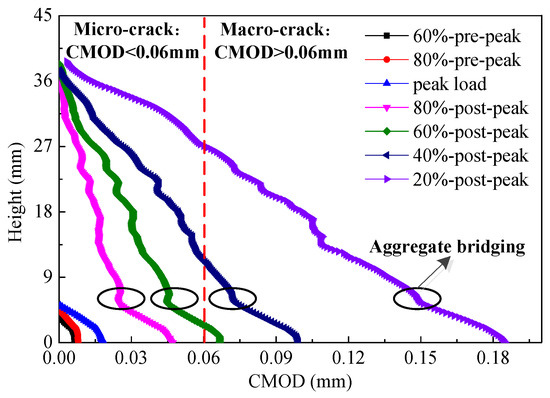
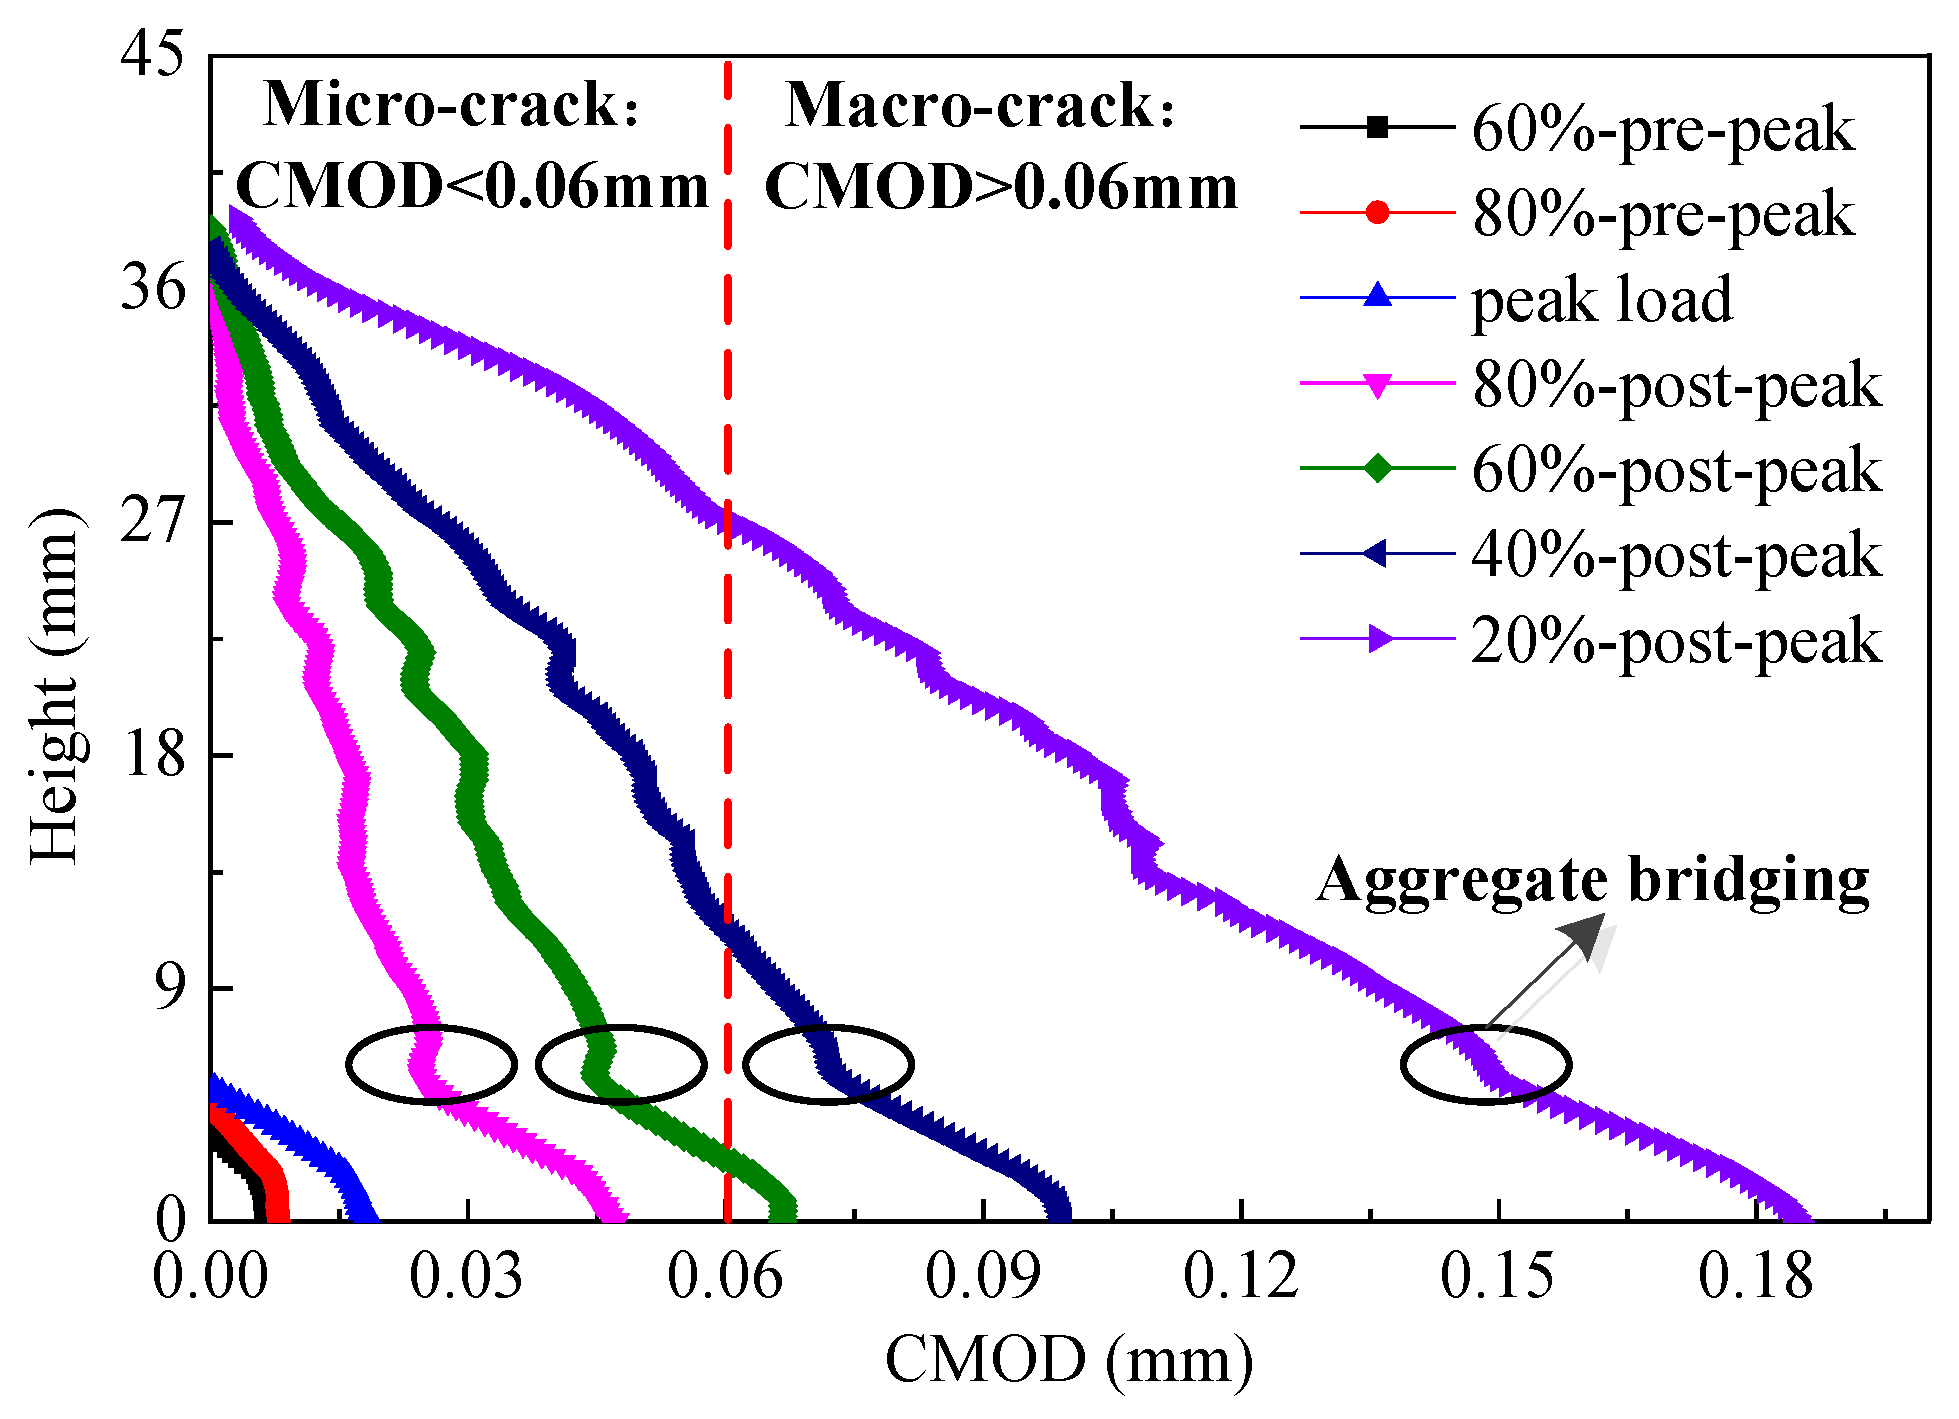
The distribution of the CMOD along the height of the beam at different loading stages were investigated, taking C1-0.5 as an example; the results are presented in Figure 9. In Figure 9, the distribution of the CMOD along the height of the beam is basically linear. In the pre-peak region, a very small increase in the crack opening at the notch tip was observed, while a significant increase in crack opening displacement (in the range of 0–60 μm) was observed at about 60% of post peak load. This critical point could be considered as the macro-crack initiation, which further validated the four stages of fracture process for the TPB beams. Also, in Figure 9, an obvious aggregate bridging phenomenon can be found.
Figure 9.
Crack opening profiles at different loading stages for C1-0.5 specimen.
The traditional method to calculate strains was post-processed from displacement fields based on the standard continuum mechanics assumption. However, when a discontinuity such as a crack appears in the material, strains in the area near the crack are inaccurate, since the standard digital image correlation formulations were based on the use of functional bases containing only the continuous part, and the standard continuum mechanics assumptions are no longer valid. Therefore, many enhanced strategies to calculate strains have been proposed, which can take the discontinuity in the material into account near the crack tip. These enhanced strategies greatly improved the accuracy of the measurement close to the crack tip but are not mandatory when information is captured far away from the discontinuity. Grégoire developed the extended image correlation technique to evolve discontinuities in dynamic crack localization in an analogy to the extended finite element method (XFEM) based on the partition of unity method. More details can be found in References [50,51,52].
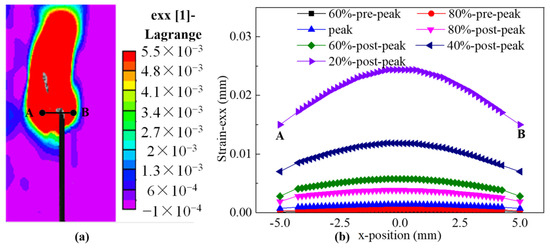
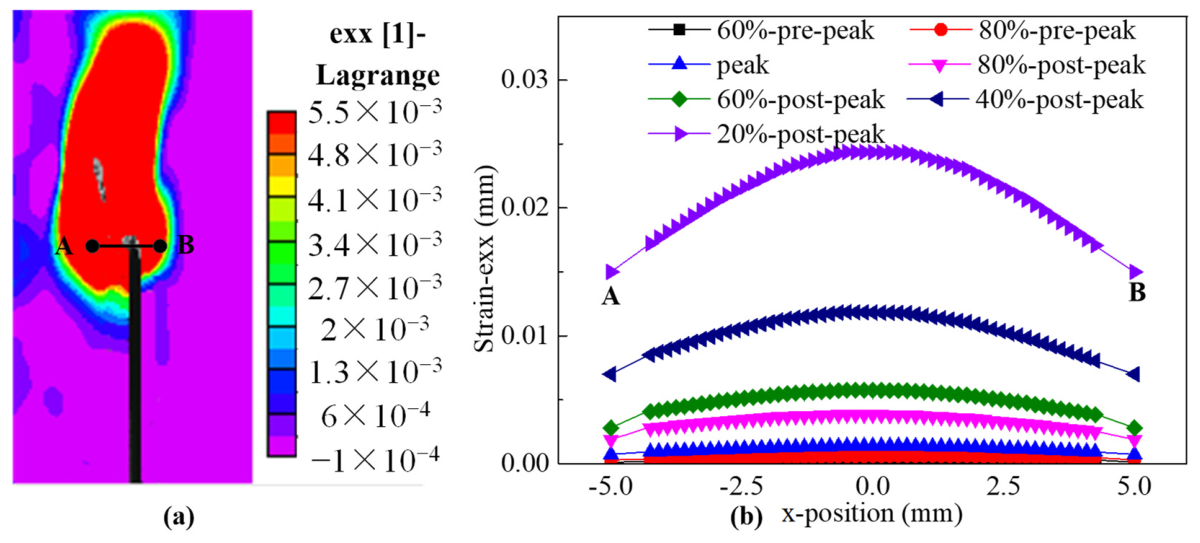
The maximum horizontal strain of notch tip was calculated and analyzed according to References [50,51,52]. The results taking specimen C1-0.5 as an example are presented in Figure 10. Figure 10b shows that the maximum horizontal strain was induced at the notch tip due to the stress concentration effect. The maximum horizontal strain first increased slowly in the pre-peak region, while it increased rapidly in the post-peak region, which is consistent with the evolution of the CMOD.
Figure 10.
Horizontal strain around notch tip: (a) horizontal strain analyzed from commercial software-Vic 3D; (b) horizontal strain distributions along line AB with different load percentages.
3.4. Definition of the Four Stages of the Crack Propagation
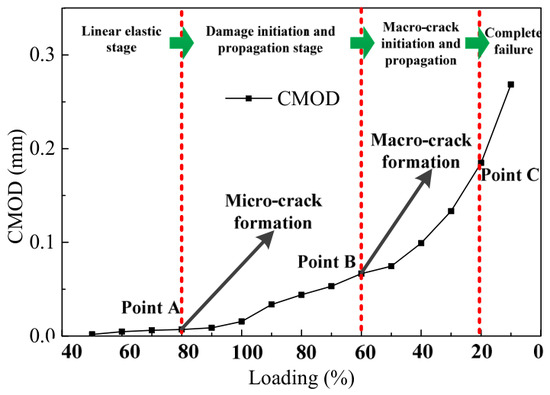
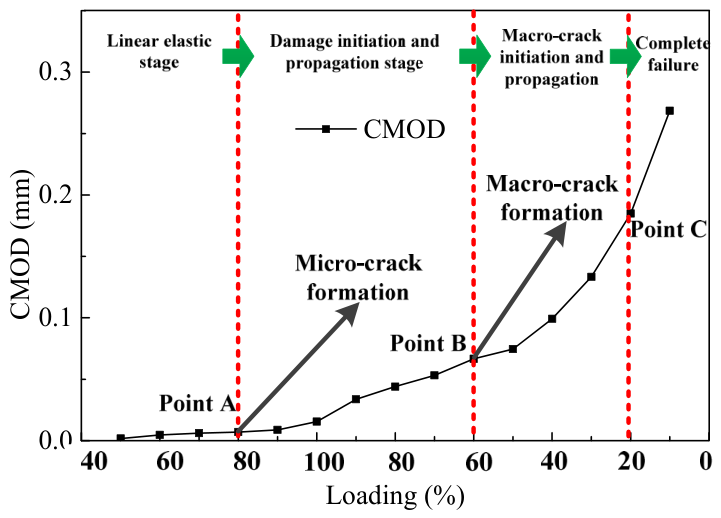
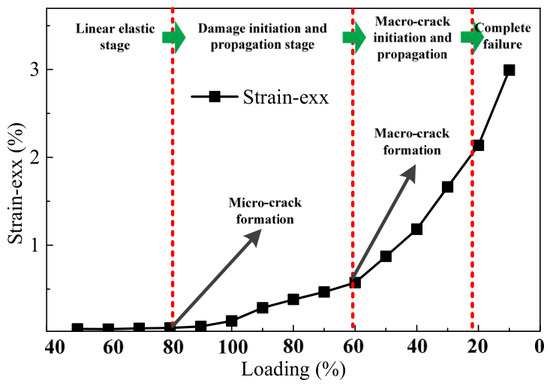
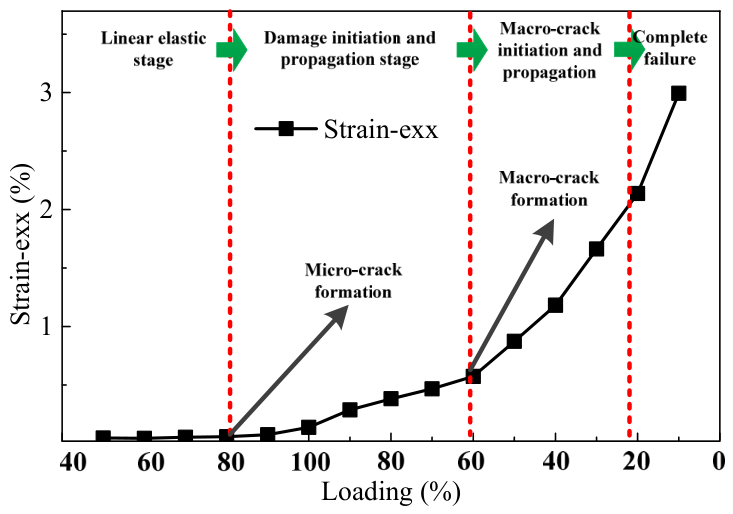
In order to analyze the cracking process from the crack opening displacement and horizontal strain, the evolutions of the CMOD and maximum horizontal strain with load percentages are presented in Figure 11 and Figure 12. Figure 11 shows that the evolution of CMOD with load steps showed obvious four-stage characteristics; the same tendency was observed from the evolution of the maximum horizontal strain with load steps, and the resulting four stages of crack propagation for the TPB beam are defined and described in detail as follows.
Figure 11.
Evolution of the CMOD calculated from commercial software-Vic 3D with load percentages (C1-0.5).
Figure 12.
Evolution of the maximum horizontal strain calculated from commercial software Vic 3D with load percentages (C1-0.5).
In Figure 11 and Figure 12, the first stage ended at about 80% of the peak load in the pre-peak region. At this stage, the CMOD and horizontal strain changed slowly with load steps. No damage or macro-cracks were induced until the maximum tensile stress reached the ultimate tensile stress; this stage is defined as the linear elastic stage. The second fracture stage began at about 80% of the peak load in the pre-peak region and ended at about 60% of the post-peak load. At the second fracture stage, the CMOD and horizontal strain started to increase relatively fast, which indicated that isolated micro-cracks may have reached nucleation near the notch tip, micro-cracks continued to accumulate, and cohesive stress at the notch tip disappeared, finally resulting in macro-cracks. This stage was defined as the micro-crack initiation and propagation stage. The third stage started at 60% of the post-peak load and ended at 20% of the post-peak load. At this stage, the CMOD and horizontal strain started to increase rapidly, which indicated that macro-cracks formed and quickly propagated upwards to the back free boundary of the beam; thus, this stage was defined as the macro-crack initiation and propagation stage. The stage from 20% of the post-peak load to complete rupture was defined as the complete failure stage. In this stage, a severe CMOD ahead of the notch tip was induced, as well as a huge macro-crack. This indicated that the macro-crack propagated to the back free boundary of the beam.
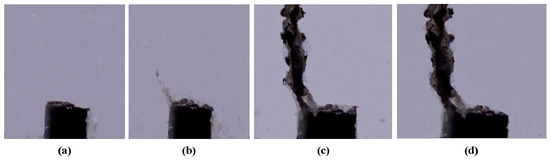
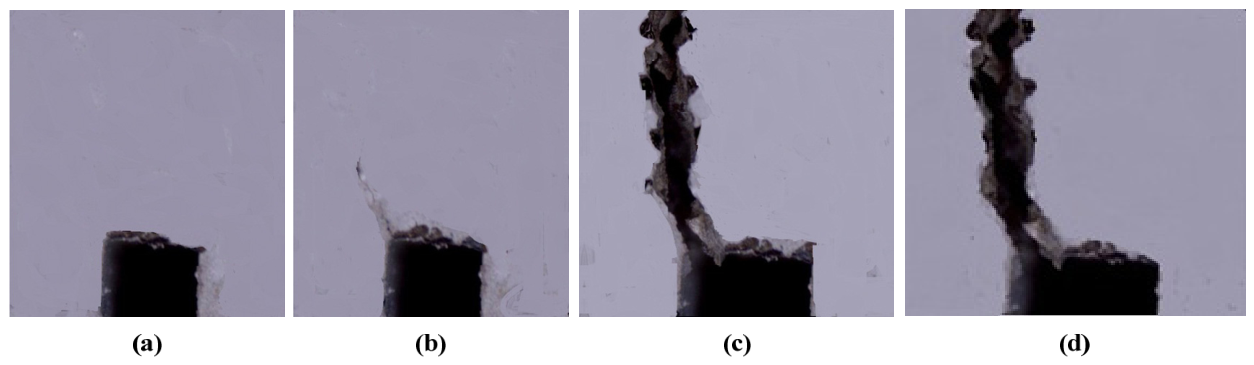
In order to validate the rationality of the four stages of the crack propagation, an industrial camera with a magnification of 100 times was applied for the real-time detection and tracking of the notch tip. Images of the notch tip monitored by the industrial camera at different critical points are presented in Figure 13. No macro-cracks were found ahead of the notch tip at 80% pre-peak load in Figure 13a, while a macro-crack was induced ahead of the notch tip at 60% post-peak load, as shown in Figure 13b, while an obvious macro-crack ahead of notch tip was observed at 20% post-peak load and the complete failure point is shown in Figure 13c,d, all of which validated the rationality of the four stages of the crack propagation.
Figure 13.
Images of the notch tip monitored by the industrial camera at different critical points: (a) Point A, (b) Point B, (c) Point C, (d) and complete failure point.
4. Fracture Characteristics for the Four Stages of the Crack Propagation
According to the analyses above, the fracture process of the TPB beam was divided into four stages. Section 5 discusses the fracture characteristics in the different phases of rupture based on the 3D DIC monitoring results, including evolutions of the horizontal displacement, the CMOD, the horizontal strain, the , the , and the .
4.1. Evolution of the Horizontal Displacement and the CMOD
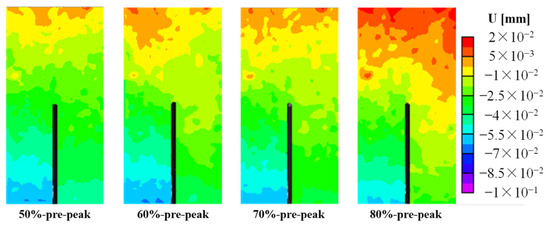
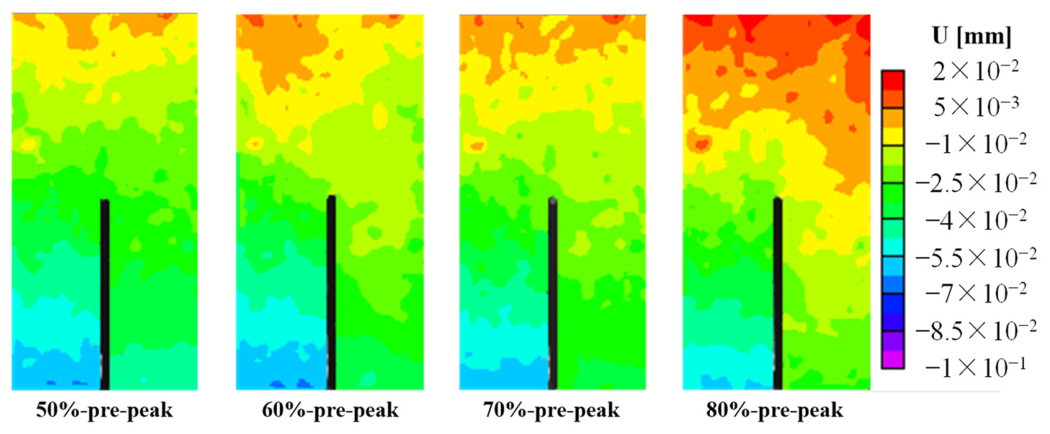
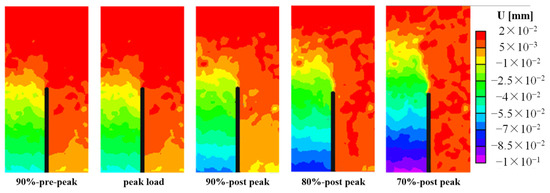
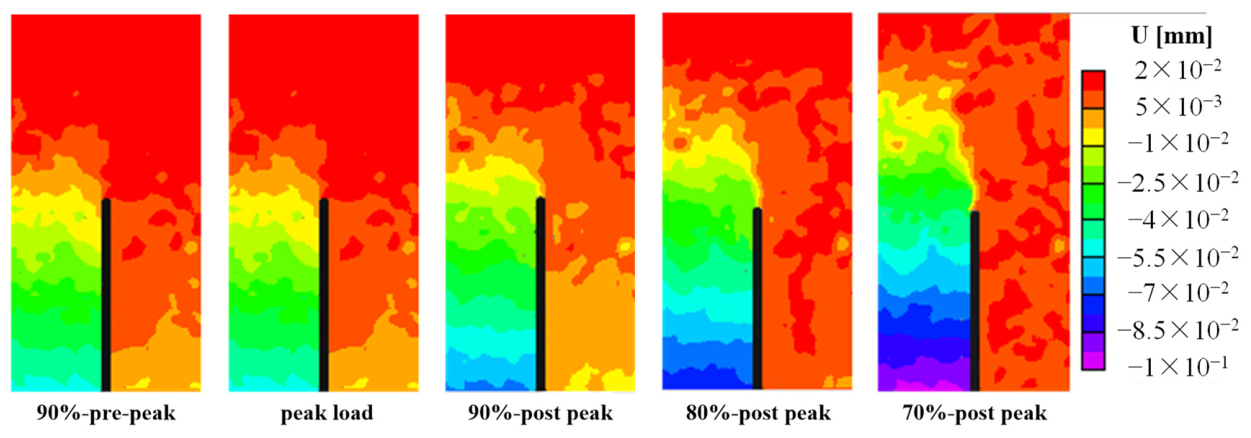
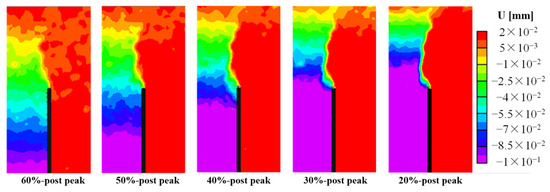
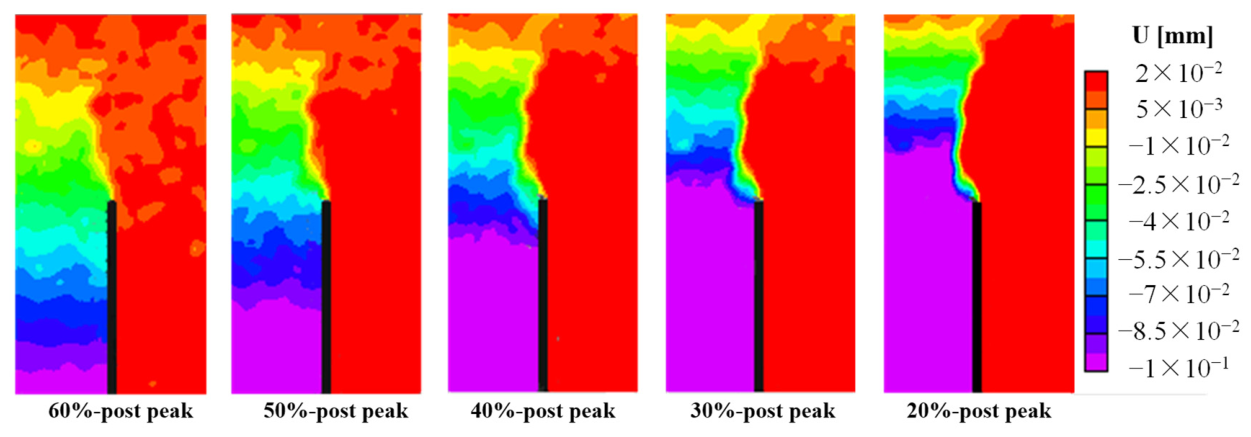
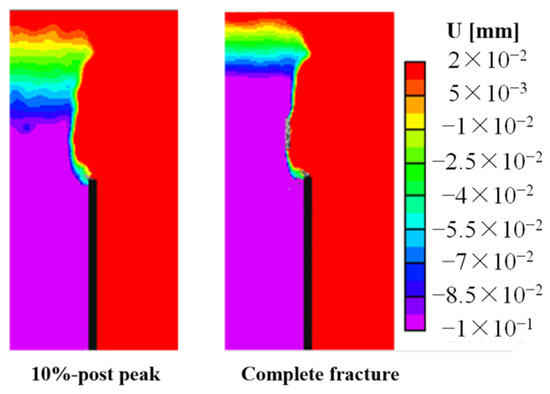
Figure 14, Figure 15, Figure 16 and Figure 17 illustrate the evolutions of the horizontal displacement from linear elastic to complete failure stage (taking C1-0.5 as an example). It can be observed from Figure 14 that the horizontal displacement distribution around the notch tip was almost completely continuous. This meant that the crack opening displacement of the notch tip was quite small. At this stage, the beam behaved in a linear elastic manner, governed by Hooke’s Law. A weak discontinuity of the horizontal displacement distribution ahead of the notch tip was observed in the pre-peak region from Figure 15; this could be interpreted as micro-crack initiation ahead of the notch tip. However, an apparent horizontal displacement gradient ahead of the notch tip was induced in the post-peak region, and this discontinuity was expanded upward to the top surface of the beam due to the accumulation of multiple micro-cracks. A large number of research results pointed out that no macro-crack appeared at this stage due to the existence of FPZ in front of the crack tip. The FPZ was considered a virtual crack with cohesive stress, and the cohesive stress prevented the crack extension. A clear crack path is observed in Figure 16, with a sudden jump in the displacement values was observed ahead of the notch; this represents a discontinuity (macro-crack) in the concrete beam. The tortuous macro-crack gradually expanded upwards to the back free boundary of the beam. It was proved that the 3D DIC method was an effective strategy to monitor the evolution law of macro-cracks for TPB beams. In Figure 17, an apparent macro-crack that completely expanded to the back free boundary of the beam was observed, leading to loss of carrying capacity and the complete rupture of the beam.
Figure 14.
Evolution of the horizontal displacement in the first stage of crack propagation.
Figure 15.
Evolution law of the horizontal displacement in the micro-crack initiation and propagation stage.
Figure 16.
Evolution of the horizontal displacement in the macro-crack initiation and propagation stage.
Figure 17.
Evolution of the horizontal displacement in the complete failure stage.
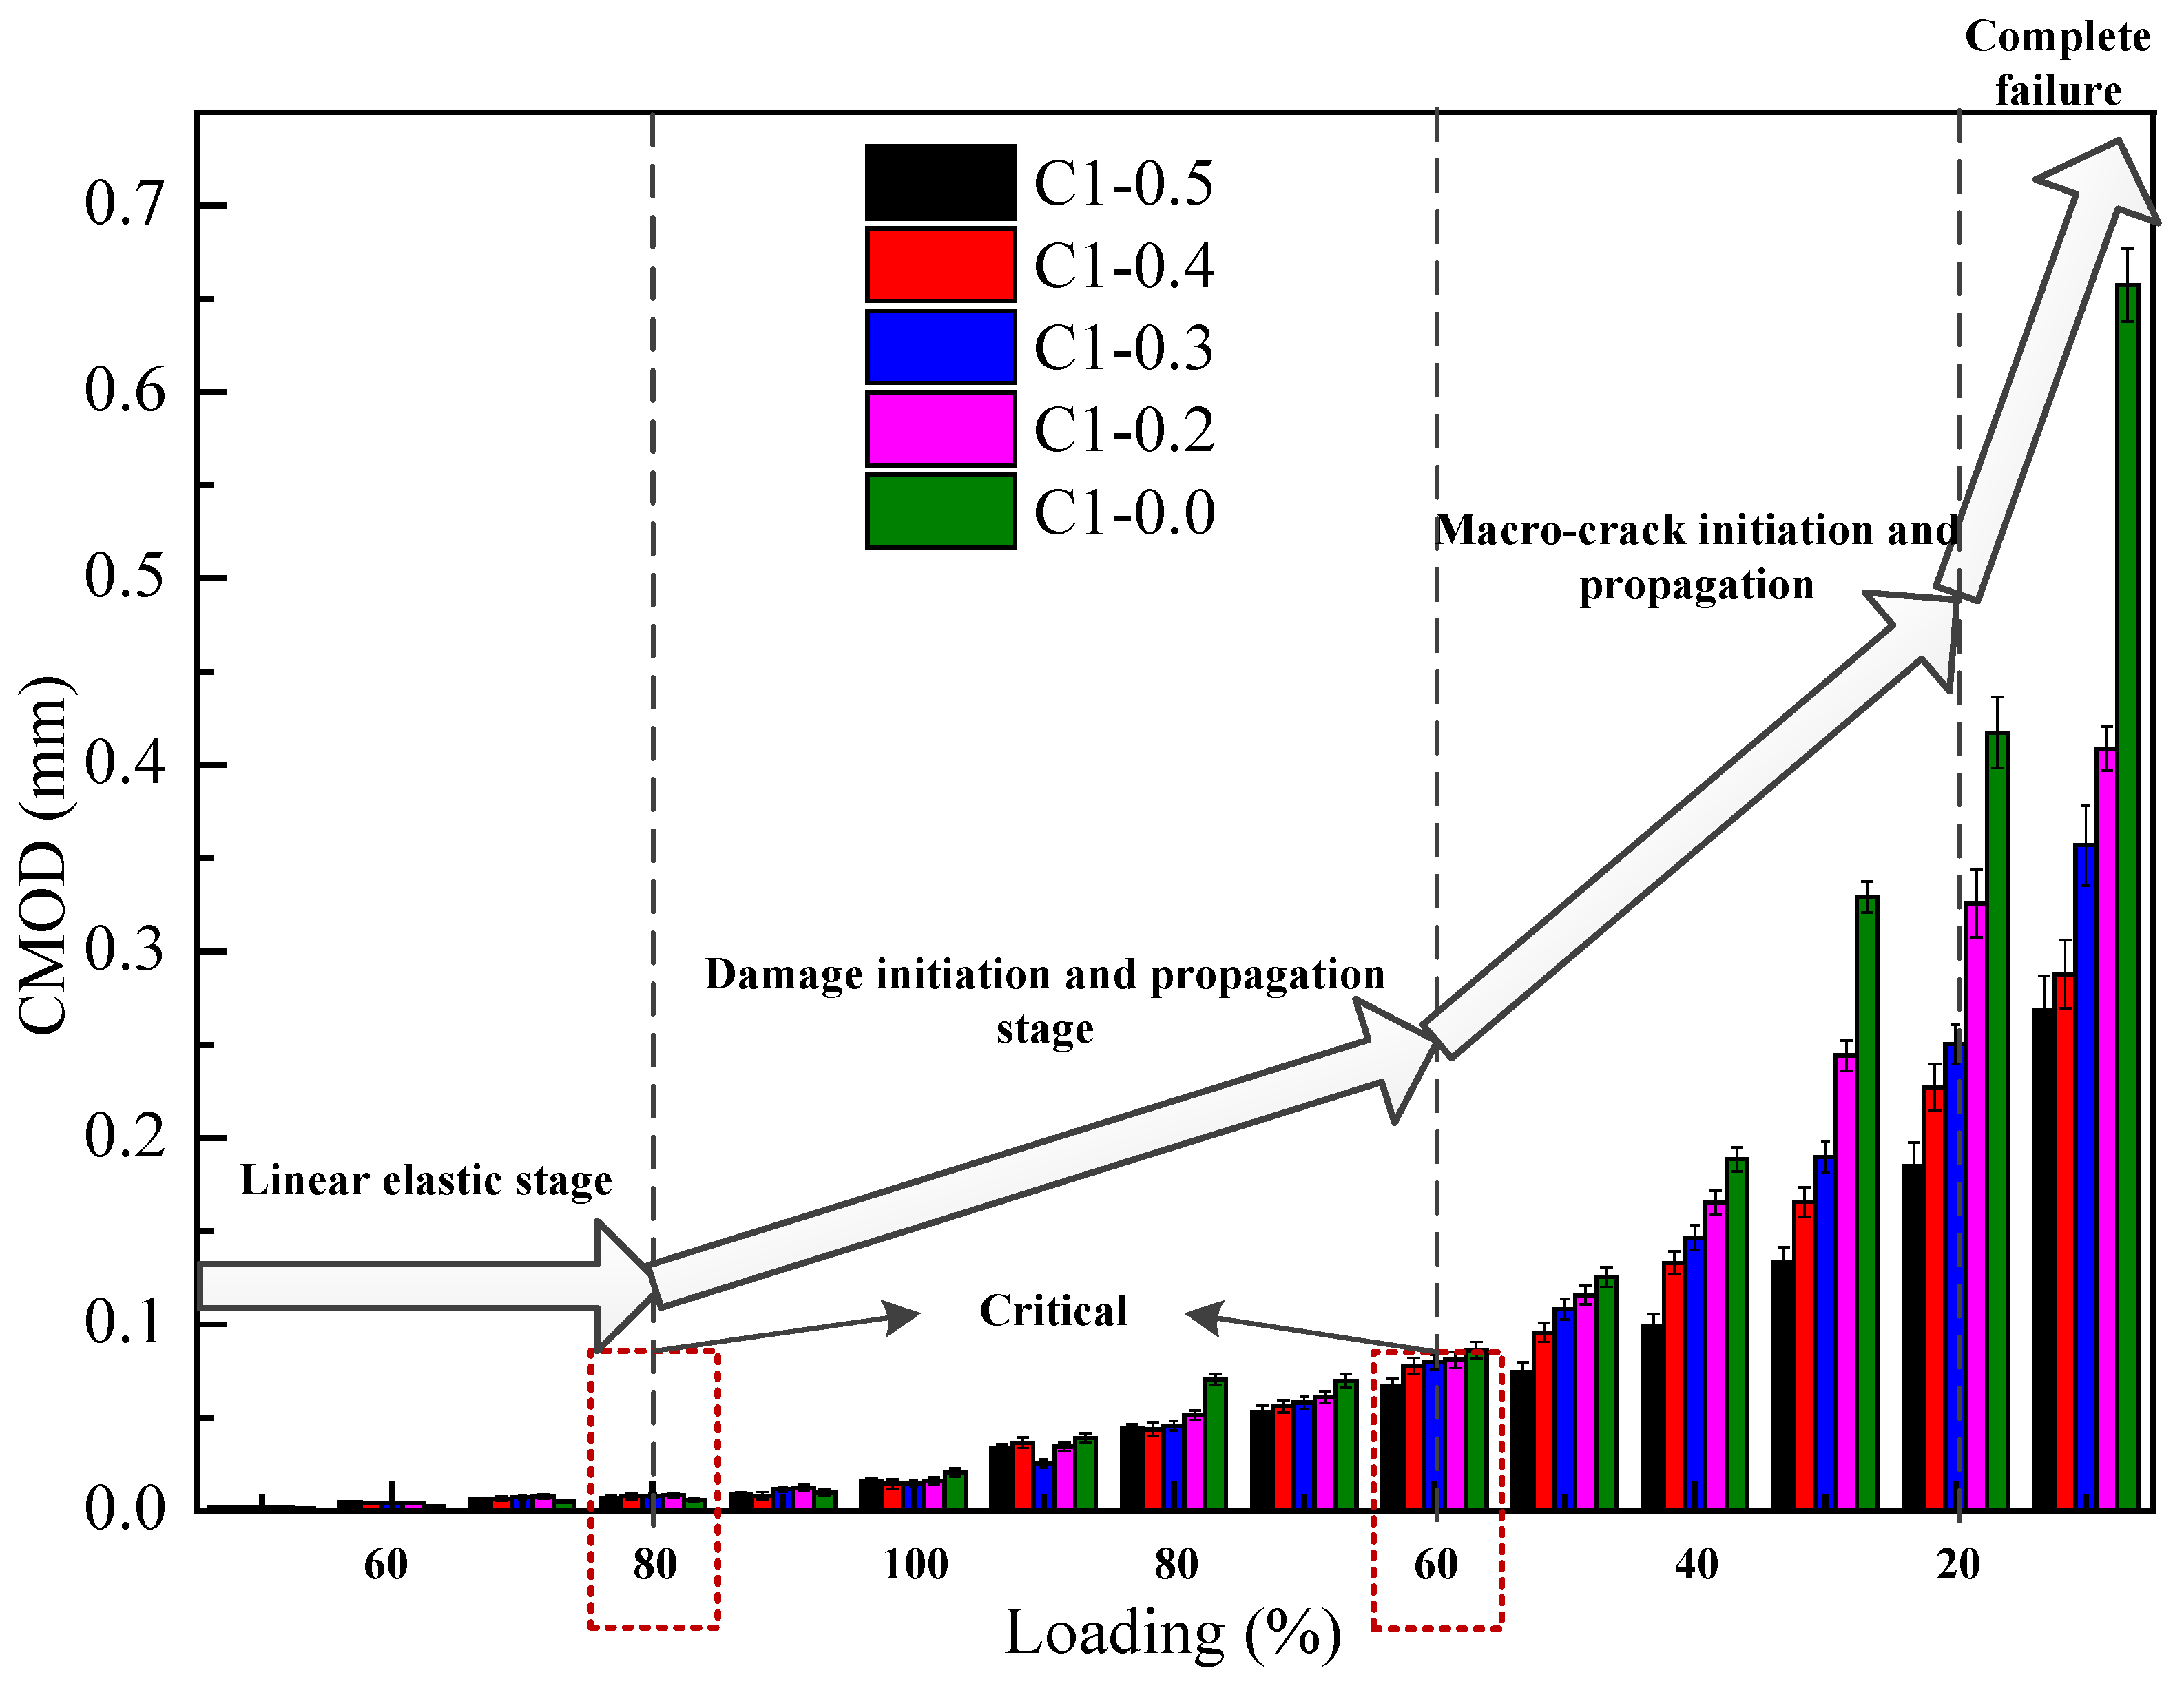
The influence of the notch length on the evolution of the CMOD was presented in Figure 18. In Figure 18, the CMOD was relatively small in the early pre-peak stage regardless of the notch length. This is because the mechanical behavior of the beam in the linear elastic stage is governed by Hooke’s law. After the load reached 90% of the peak load in the pre-peak region, the CMOD increased gradually. A small difference in the CMOD was observed, at the same loading percent condition, the longer the notch length was, the smaller the acquired CMOD value, which could be due to the influence of the ligament effect. At this moment, micro-cracks began to initiate in the interfacial transition zone between aggregate and the bulk cement paste near the notch tip; the micro-cracks advanced and accumulated as the loading increased. However, those micro-cracks were invisible in the digital images, until a macro-crack formed due to a rapid increase in the CMOD. After the initiation of the macro-crack, it was found that the CMOD continued to increase at a higher rate, which indicated that macro-crack continued to propagate rapidly. The influence of notch length on the CMOD became more profound, since the macro-crack propagation length depended on the ligament effect. Figure 18 also shows that the magnitudes of the CMOD were almost more than 0.2 mm in the final load stages. A remarkable difference in the CMOD was observed for specimens with different notch lengths. The beam without pre-crack overcame more external work and absorbed more energy in the crack propagation process compared with the pre-cracked TPB beam. As a result, when the beam was completely ruptured, the former induced a larger crack opening displacement.
Figure 18.
Evolution of the maximum crack opening displacement with load steps for all five notch lengths.
4.2. Evolution of the Horizontal Strain
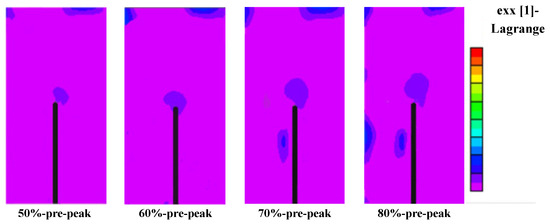
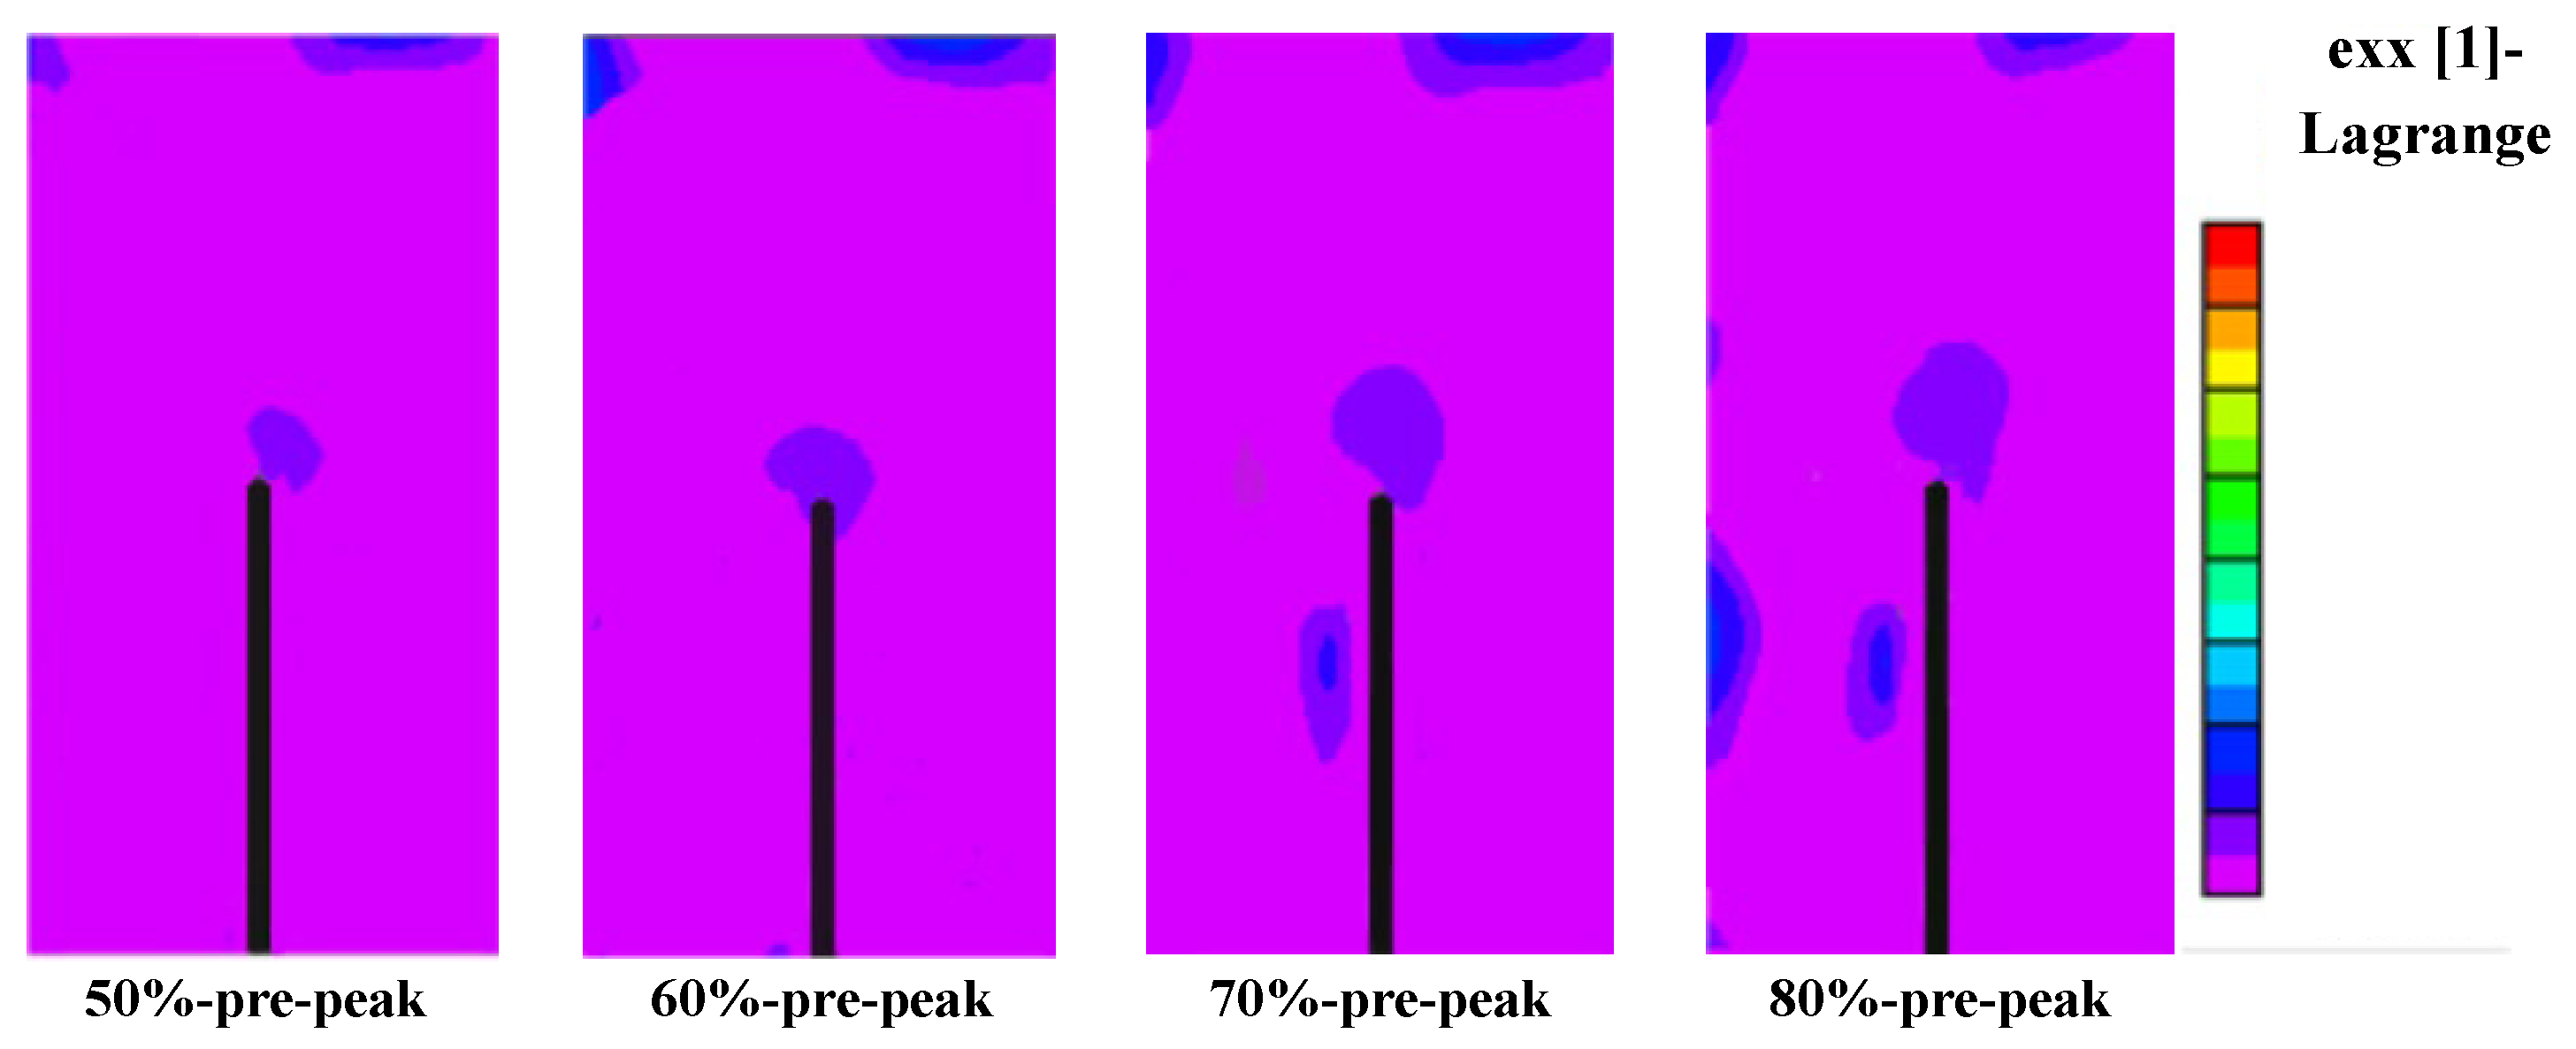
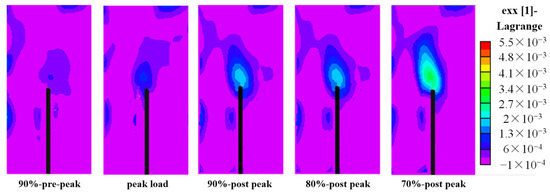
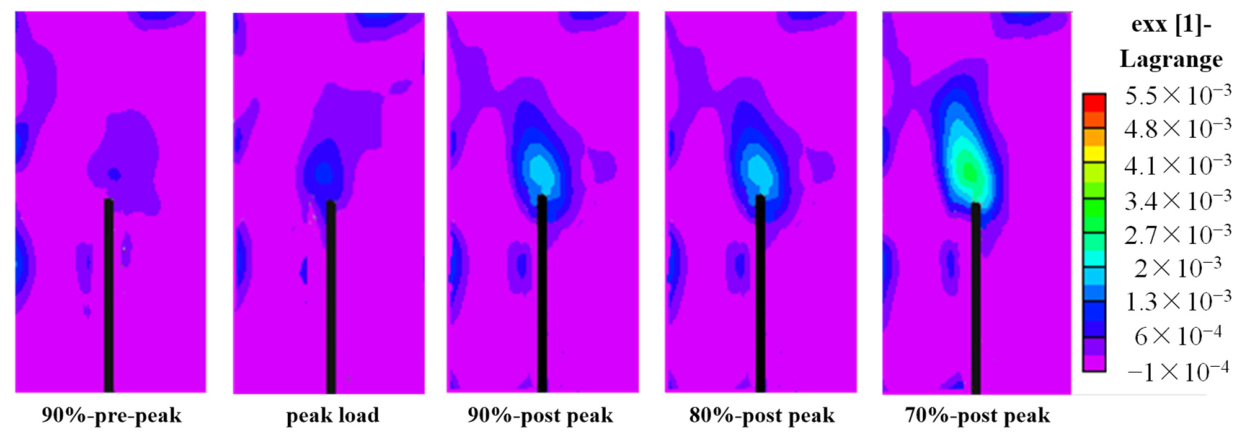
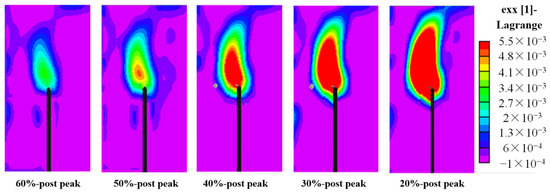
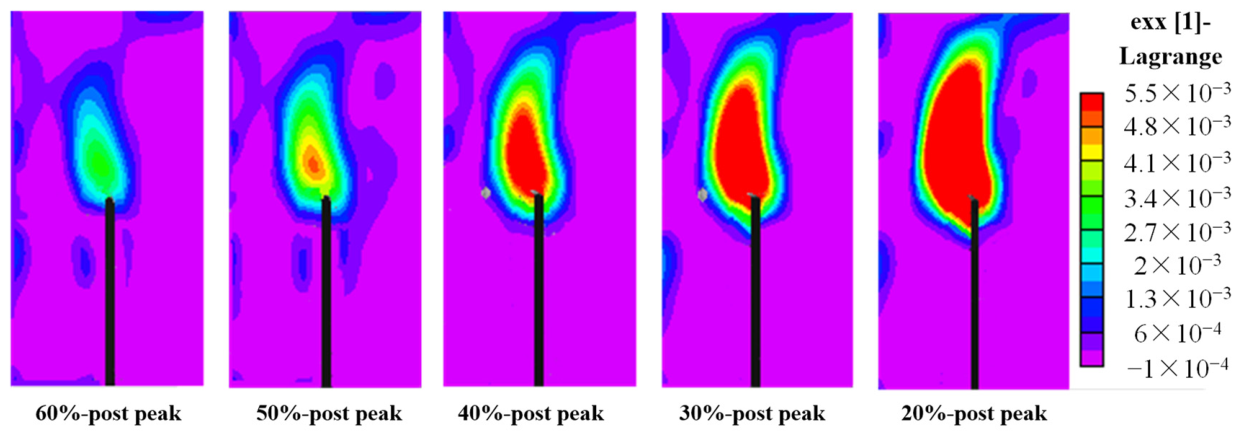
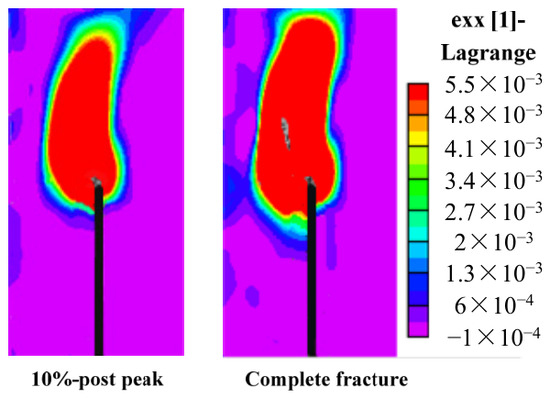
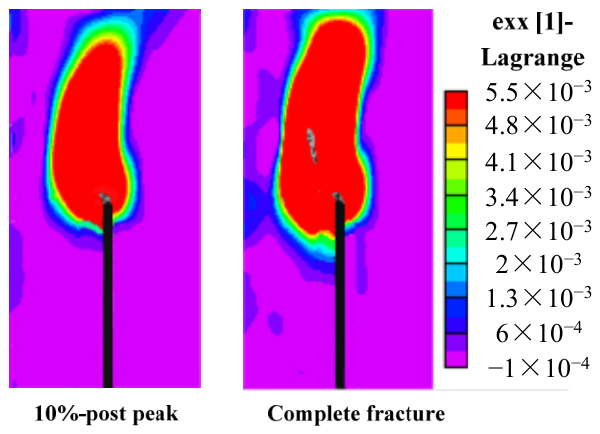
The evolution of the horizontal strain from the linear elastic stage to complete failure stage (taking C1-0.5 as an example) is presented in Figure 19, Figure 20, Figure 21 and Figure 22. In Figure 19, the evolution law of the horizontal strain distribution fitted the evolution law of the horizontal displacement distribution well. For up to 70% of the peak load in the pre-peak region, the horizontal strain ahead of notch tip was relatively small, without obvious local deformation. As the load increased continuously, a bigger horizontal strain was induced and gradually concentrated at the notch tip due to the stress concentration effect. Figure 20 shows that after the load reached 90% of the peak load in the pre-peak region, the beam showed apparent nonlinear mechanical behavior, characterized by the local strain concentration at the notch tip. The local strain concentration phenomenon became more and more evident, and the local strain concentration area was gradually enlarged in this stage, as shown in Figure 20. Combining the horizontal strain distribution with the horizontal displacement distribution, the obvious strain localization zone indicated the formation of the micro-cracks at front of the notch tip. The enlargement of the local strain concentration region indicated that the micro-cracks started to coalesce on the localized zone until the formation of macro-cracks. In Figure 21, it can be observed that the horizontal strain was localized into a narrow band, which indicated that the macro-crack was initiated in this narrow band. The narrow band gradually expanded upwards to the back free boundary of the beam, from 60% of post-peak to 20% of post-peak, which indicated that the macro-crack was advancing upwards in this specimen. It was concluded that the crack propagation regularities observed from the horizontal strain profiles were in good agreement with the crack propagation regularities obtained from the horizontal displacement profiles. In Figure 22, it can be observed that strain concentration region completely expanded to the back free boundary of the beam, which further validated that the macro-crack was fully developed in the complete failure stage.
Figure 19.
Evolution of the horizontal strain in the first stage of crack propagation.
Figure 20.
Evolution of the horizontal strain in the micro-crack initiation and propagation stage.
Figure 21.
Evolution of the horizontal strain in the macro-crack initiation and propagation stage.
Figure 22.
Evolution of the horizontal strain in the complete failure stage.
The influence of the notch length on the maximum horizontal strain was also investigated. The evolution of the maximum horizontal strain with load steps for the specimens with five notch lengths is presented in Figure 23.
Figure 23.
Evolution of the maximum horizontal strain with load steps for the specimens with five notch lengths.
Comparing Figure 23 with Figure 18, the influence of the notch length on the maximum horizontal strain was almost consistent with the influence of the notch length on the CMOD. The notch length has little influence on the maximum horizontal strain in the linear elastic stage. However, a relatively large impact of the notch length on the maximum horizontal strain was observed both in the micro-crack initiation and propagation stage and in the macro-crack initiation and propagation stage because of the nonlinear elastic mechanical behavior due to the existence of the FPZ and the ligament effect law. In the complete failure stage, a large difference in the horizontal strain was observed: the longer the notch length was, the smaller the maximum horizontal strain that was induced. This further validated the ligament effect for the pre-cracked TPB beam.
4.3. Evolution of LFPZ
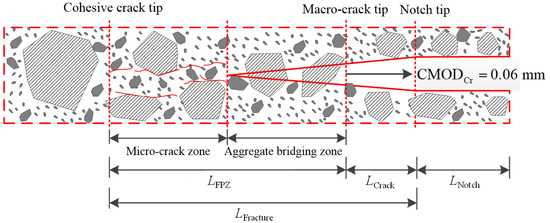
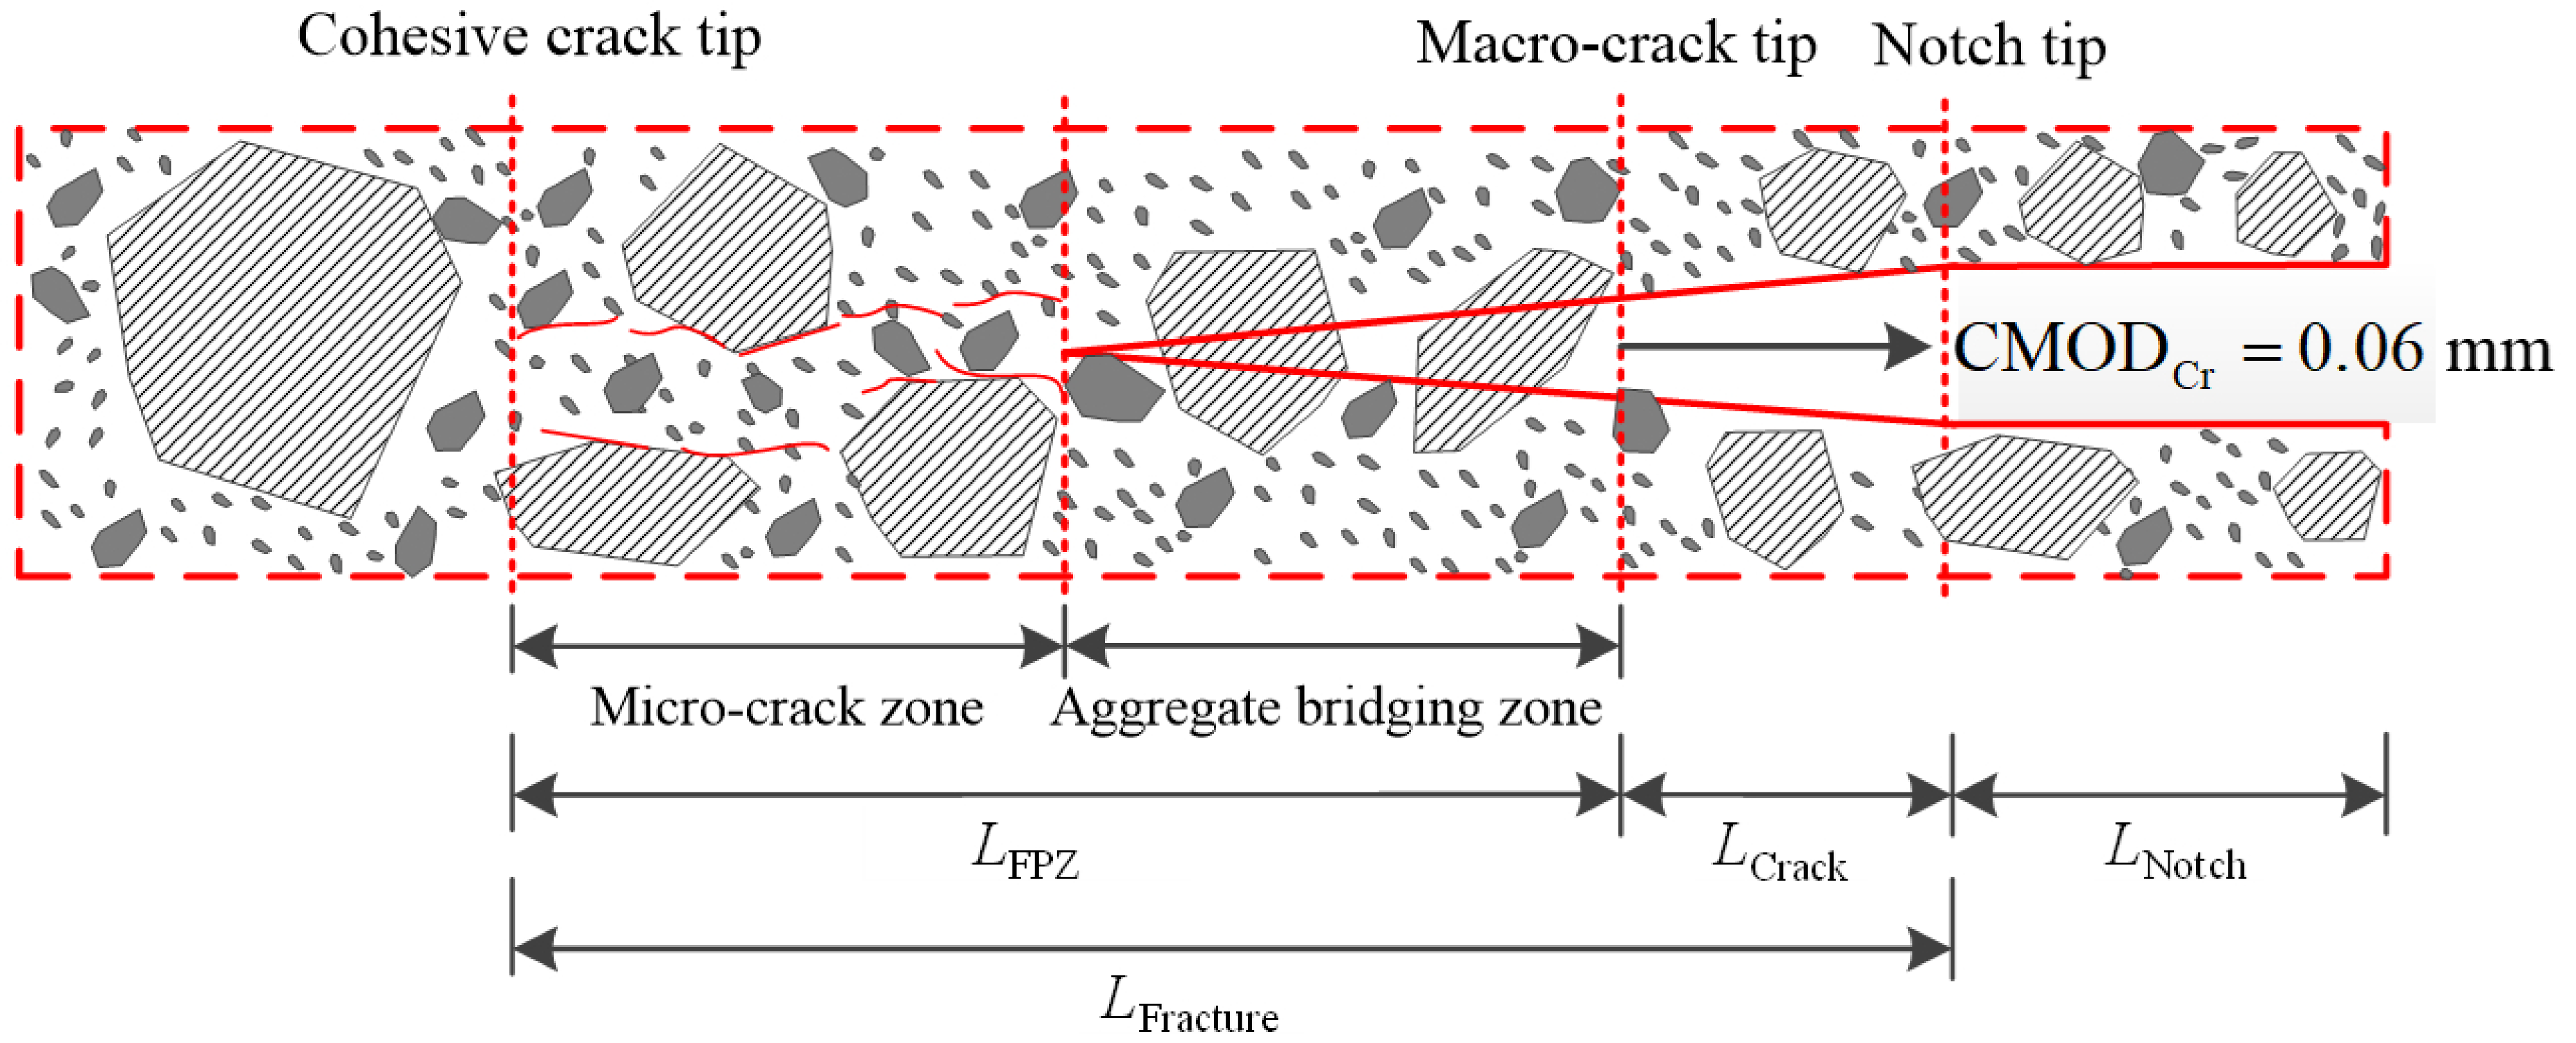
Based on the analyses in Section 4.2, macro-cracks formed as the crack opening displacement at the notch tip reached to 0.06 mm. According to this definition, the length of the FPZ () was determined to be the distance between the cohesive crack tip and the macro-crack tip, while the length of the macro-crack () was designated as the distance between the notch tip and the macro-crack tip. The fracture length () was composed of the and the , as shown in Figure 24.
Figure 24.
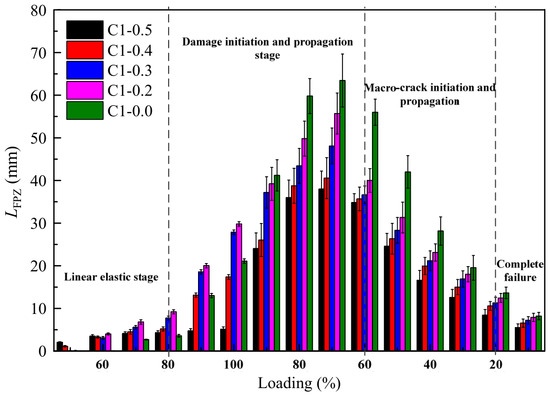
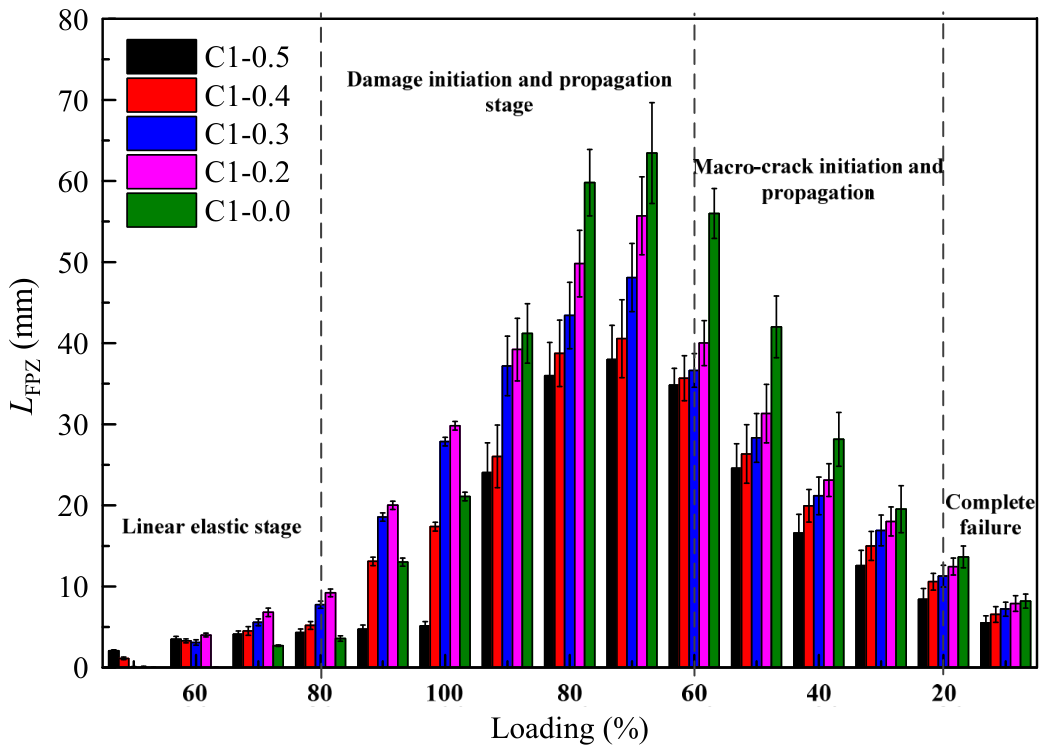
Definitions of the , and .
The evolution of the with load percentages for the specimens with five notch lengths was determined. The result is presented in Figure 25. Figure 25 shows that, in the linear elastic stage, the was extremely small and could be ignored. Generally speaking, in the linear elastic stage, the notch tip exhibited complete elasticity without formation of FPZ. The minor acquired in this stage, shown in Figure 25, could easily be explained based on the definition of the in this study due to the stress concentration effect at the front of the notch tip. After the load reached 80% of the peak load in the pre-peak region, the developed gradually; this was the main reason that the beam exhibited nonlinear elastic behavior. It could also be observed that, when affected by the front free boundary, the developed relatively slowly for the beam without pre-cracks during the early damage initiation and propagation stage. However, the developed relatively quickly for the beams without pre-crack; this phenomenon was due to the ligament effect law. The was fully developed at about 60% of the post-peak load for all specimens. It was proved that as soon as the was fully developed, the macro-crack was induced, which was in good agreement with the results observed by the industrial camera. After the was fully developed, the FPZ ahead of the notch tip firstly developed into a macro-crack; simultaneously, the FPZ continued to expand upwards until the FPZ expanded to the back free boundary of the beam. The former played a dominant role, leading to the reduction in . Also, an obvious ligament effect was observed due to the influence of the notch length. The decreased rapidly, and the FPZ almost disappeared in the complete failure stage, which indicated that the macro-crack was fully developed.
Figure 25.
Evolution of the with load percentages for the specimens with five notch lengths.
4.4. Evolution of LCrack
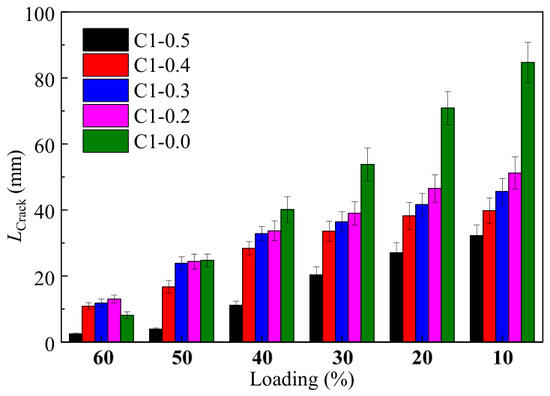
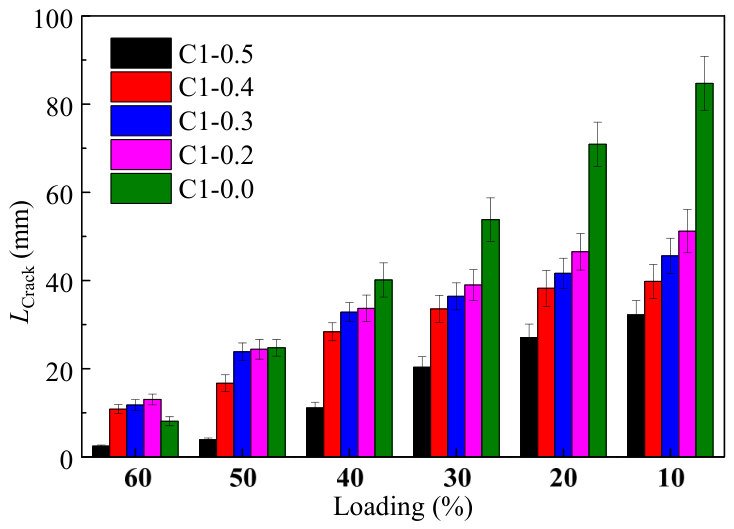
Figure 26 presents the evolution of the macro-crack length with the load percentages for five series of specimens in the macro-crack initiation and propagation stage and the complete failure stage. It could be concluded from Figure 26 that the macro-crack was initiated and developed at about 60% of the peak load in post-peak load region, then it developed upwards at a steady speed, depending on the notch length. The macro-crack finally extended to the back free boundary of the beam.
Figure 26.
Evolution of the with load percentages for the specimens with five notch lengths.
4.5. Evolution of LFracture
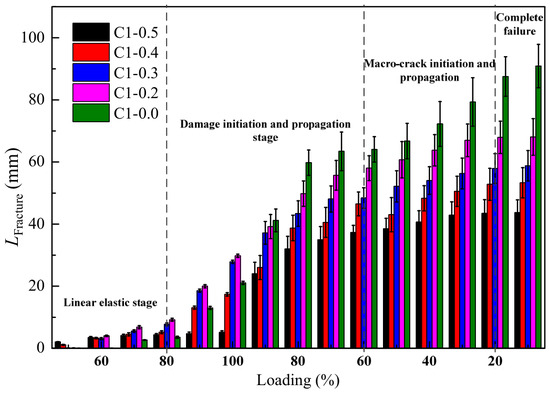
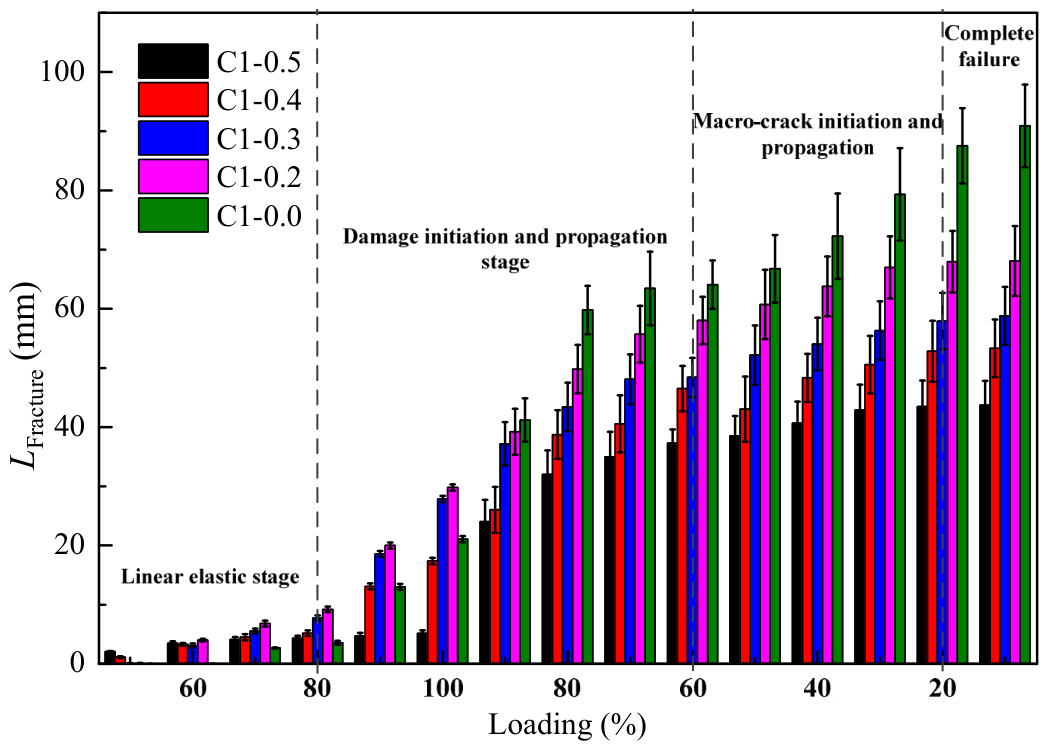
Figure 27 presents the evolution of the with load percentages for the specimens with five notch lengths. In Figure 27, the evolution of is in good agreement with the evolution of the CMOD, the horizontal strain and the . In the early pre-peak stage (up to 80% of the peak load), the was relatively small; at this stage, the beam showed a linear elastic mechanical behavior without any damage and micro-cracks. After the load reached 80% of the pre-peak load, the developed quickly due to the formation of micro-cracks in the interfacial transition zone between the aggregate and bulk cement paste ahead of the notch tip. The micro-cracks started to coalesce; after the load dropped to 60% of peak load in the post-peak region, a rapid increase in was observed due to the formation of a macro-crack ahead of the notch tip. Then, in the final loading stages, due to the back free boundary effect, the fracture length extension became relatively slower until the specimen completely failed.
Figure 27.
Evolution of the with load percentages for the specimens with five notch lengths.
5. Crack Propagation Mechanisms
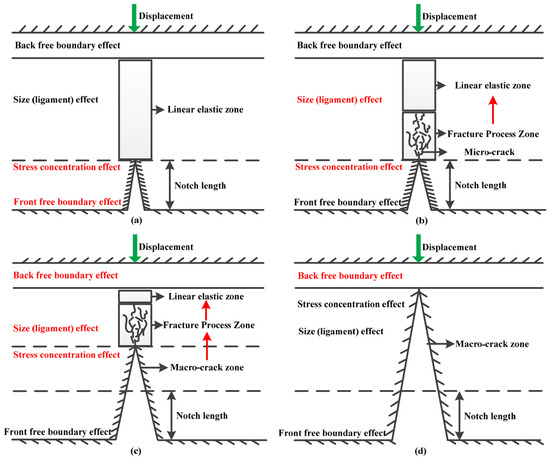
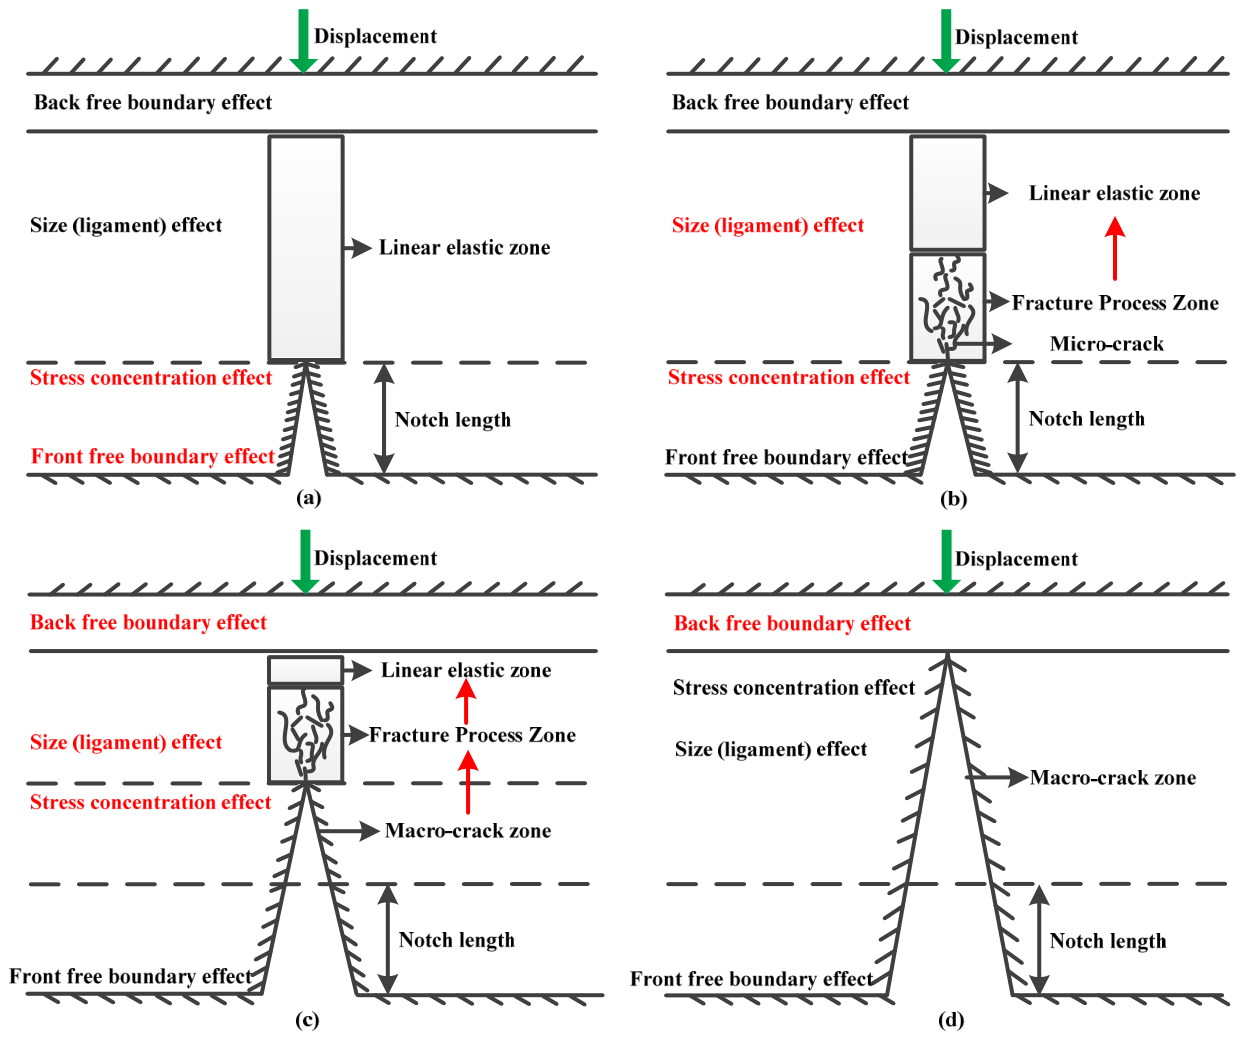
Based on the above analyses, the crack propagation mechanisms for the four stages are schematically summarized in Figure 28, which integrates the roles of the front free boundary effect, stress concentration effect, ligament effect, and back free boundary effect throughout the entire fracture process.
Figure 28.
Crack propagation mechanism of the four stages of fracture process for the TPB beam: (a) linear elastic stage, (b) damage initiation and propagation stage, (c) macro-crack initiation and propagation stage, and (d) complete failure stage.
The mechanism of crack propagation in the linear elastic stage is presented in Figure 28a, showing that, in the early pre-peak stage, the concrete ahead of the notch tip exhibited a linear elastic mechanical behavior, which obeys the generalized Hooke’s Law. In this stage, the mechanical behavior of the TPB beam was affected by the front free boundary effect and the stress concentration effect. For the beams without pre-crack, the obvious front free boundary effect occurred, which manifested as a delay in the formation of the FPZ. A distinct stress concentration effect was induced ahead of the notch tip due to an initial defect in the pre-cracked TPB beam, leading to advance micro-crack initiation.
Figure 28b presents the mechanism of crack propagation in the micro-crack initiation and propagation stage. In this stage, micro-cracks were first initiated ahead of the notch tip as the stress intensity ahead of the notch tip reached the ultimate tensile strength of the concrete due to the severe stress concentration effect. As a result, the FPZ was formed and developed, and it continued to expand along the linear elastic zone. The development of the FPZ was affected by the ligament length and showed an apparent ligament effect, and the characteristics of the FPZ were fully developed until the cohesive stress ahead of the notch tip entirely vanished. In this process, the external work was used to overcome the cohesive stress and induce nucleation and coalescence among micro-cracks.
Figure 28c presents the mechanism of crack propagation in the macro-crack initiation and propagation stage. In Figure 28c, the mechanism of crack propagation in this stage was composed of two components: (1) macro-crack propagation; (2) FPZ development. As soon as the cohesive stress ahead of the notch tip vanished entirely, the macro-crack was induced, and the macro-crack gradually expanded towards the FPZ. Meanwhile, the FPZ constantly developed along the beam height direction until it extended to the back free boundary of the beam. The former was affected by the stress concentration effect and the ligament effect, while the latter was influenced by the ligament effect and the back free boundary effect. The external work was used for forming new FPZ and extending the macro-crack in this stage.
The mechanism of crack propagation in the complete failure stage is presented in Figure 28d. After the macro-crack extended to the back free boundary of the beam, the crack propagation became relatively slow due to the back free boundary effect until the rupture of the beam.
6. Conclusions
An experimental investigation into the ligament length effect on crack propagation characteristics in notched concrete beams under three-point bending was conducted using three-dimensional digital image correlation (3D DIC) and a high-magnification industrial camera (100×). The following conclusions are drawn:
Scientific Contributions:
- (1)
- The 3D DIC method enables accurate detection of macro-crack formation, crack opening displacement, and strain localization throughout the entire fracture process. The industrial camera with 100× magnification effectively captures real-time macro-crack initiation, providing reliable validation for the fracture stage division.
- (2)
- Based on the evolution of horizontal displacement, crack mouth opening displacement (CMOD), horizontal strain, fracture process zone length macro-crack length , and total fracture zone length , the fracture process is divided into four distinct stages: the linear elastic stage, micro-crack initiation and propagation stage, macro-crack initiation and propagation stage, and complete failure stage. Industrial camera observations confirm that macro-crack initiation occurs at approximately 60% of the post-peak load, supporting the validity of the proposed four-stage division.
- (3)
- In the linear elastic stage, the beam behavior is governed by Hooke’s law, with minimal CMOD and negligible . In the micro-crack initiation and propagation stage, micro-cracks form ahead of the notch tip due to stress concentration, and gradually develops, reaching full development at approximately 60% of the post-peak load. In the macro-crack initiation and propagation stage, a macro-crack initiates as cohesive stress vanishes, with and increasing rapidly. In the complete failure stage, the macro-crack extends to the back free boundary, leading to loss of load-carrying capacity.
Applied Implications:
- (4)
- The crack propagation mechanisms in the four stages are governed by the combined effects of the front free boundary effect, stress concentration effect, ligament effect, and back free boundary effect. Aggregate bridging, crack deflection, and crack branching are identified as the primary toughening mechanisms governing the ligament effect.
- (5)
- The ligament length significantly influences the fracture behavior of concrete beams. Increasing the notch depth ratio from 0.0 to 0.5 reduces the peak load by approximately 30–40% and decreases the nominal stress proportionally. This quantitative relationship provides a reference for evaluating the load-carrying capacity of concrete members with pre-existing notches or defects.
- (6)
- The identified threshold of macro-crack initiation at 60% of the post-peak load, along with the proposed four-stage framework, offers a potential basis for early warning of structural deterioration in plain concrete elements and for calibrating the fracture models used in structural safety assessment.
Future Work and Limitations
The ligament length effect on the four-stage fracture process and propagation mechanisms in notched concrete beams under three-point bending was systematically investigated using 3D DIC and a high-magnification industrial camera. A primary limitation is that the experiments were conducted under monotonic quasi-static loading, which does not capture the fracture behavior under fatigue or dynamic loading conditions commonly encountered in service structures. Additionally, the proposed four-stage fracture classification and the identified mechanisms (front free boundary effect, stress concentration effect, ligament effect, and back free boundary effect) are derived from surface measurements, leaving the three-dimensional internal fracture characteristics unexplored.
Future work should extend the investigation to cyclic and dynamic loading regimes to evaluate the applicability of the four-stage framework under varying loading conditions. Complementary techniques such as X-ray micro-computed tomography (μCT) should be integrated to reveal internal crack evolution and validate the proposed mechanisms in three dimensions. Furthermore, meso-scale numerical simulations incorporating aggregate distribution and interfacial transition zone properties would enable a deeper understanding of the toughening mechanisms, including aggregate bridging, crack deflection, and crack branching, that govern the ligament effect.
In addition, the presence of reinforcement introduces additional toughening and damage mechanisms, such as steel–concrete interaction, bond-slip behavior, and reinforcement yielding, which would provide new insights into the fracture behavior of practical structural members. This extension would also help bridge the gap between fundamental fracture mechanics studies and real-world structural design and safety assessments. Moreover, systematic comparisons with existing experimental data on reinforced and plain concrete beams, potentially in the form of a summary table, would help to position the current findings within a broader context and further highlight the novelty of the proposed four-stage framework.
Author Contributions
Conceptualization, Y.F. and X.X.; Methodology, Y.F.; Software, C.Z.; Validation, C.Z. and X.C.; Formal analysis, Y.F.; Investigation, B.L. and Z.F.; Resources, B.L. and C.Z.; Data curation, B.L.; Writing—original draft, Y.F.; Writing—review and editing, X.X.; Visualization, X.C.; Supervision, X.X.; Project administration, Y.F.; Funding acquisition, Z.F. and X.X. All authors have read and agreed to the published version of the manuscript.
Funding
This research was funded by National Natural Science Foundation of China [grant number: 52508490], Guangdong Basic and Applied Basic Research Foundation [grant number: 2024A1515110192], Guangdong University Student Science and Technology Innovation Cultivation Special Fund [grant number: pdjh2025bk233], and National Key Research and Development Program of China [grant number: 2024YFE0216800].
Data Availability Statement
The original contributions presented in this study are included in the article. Further inquiries can be directed to the corresponding author.
Conflicts of Interest
Author Yongkang Fu and Bo Lin were employed by the Poly Changda Overseas Engineering Co., Ltd. And author Chao Zhao was employed by the Guangzhou Pearl River Huangpu Bridge Construction Co., Ltd. The remaining authors declare that the research was conducted in the absence of any commercial or financial relationships that could be construed as a potential conflict of interest.
References
- Saucedo, L.; Yu, R.C.; Ruiz, G. Fully-developed FPZ length in quasi-brittle materials. Int. J. Fract. 2012, 178, 97–112. [Google Scholar] [CrossRef] [Scilit]
- Yu, K.L.; Qing, L.B.; Hu, Y. The effects of specimen size and aggregate on the evolution of the fracture process zone in concrete: A mesoscale investigation. Compos. Struct. 2025, 355, 118852. [Google Scholar] [CrossRef] [Scilit]
- Xiong, X.T.; Meng, A.X.; Lu, J.; Tan, Y.Q.; Chen, B.; Tang, J.M.; Zhang, C.; Xiao, S.Q.; Hu, J.Y. Automatic detection and location of pavement internal distresses from ground penetrating radar images based on deep learning. Constr. Build. Mater. 2024, 411, 134483. [Google Scholar] [CrossRef] [Scilit]
- Joshi, S.; Das, N.; Nanthagopalan, P. Fracture of Ultra-High-Performance Fiber-Reinforced Concrete: Energy scaling, Process zone evolution and Toughness criteria. Theor. Appl. Fract. Mech. 2026, 142, 105394. [Google Scholar] [CrossRef] [Scilit]
- Xiong, X.; Tan, Y.; Huang, Z.; Chen, B.; Huang, Q. Automatic NDT of semi-rigid base cracks within asphalt pavement based on 3D-GPR and deep learning. Int. J. Pavement Eng. 2025, 26, 2538791. [Google Scholar] [CrossRef] [Scilit]
- Li, X.; Zhang, Y.; Chen, Y.W.; Yuan, Y.; Feng, J.L. Influence of coarse aggregate volume fraction on the fracture process zone in concrete: An integrated experimental and theoretical study. Theor. Appl. Fract. Mech. 2026, 142, 105393. [Google Scholar] [CrossRef] [Scilit]
- Lyu, Y.H.; Pathirage, M.; Nguyen, H.T.; Bazant, Z.P.; Cusatis, G. Dissipation mechanisms of crack-parallel stress effects on fracture process zone in concrete. J. Mech. Phys. Solids 2023, 181, 105439. [Google Scholar] [CrossRef] [Scilit]
- Guo, Y.Z.; Chen, X.D.; Liu, J.X.; Chen, T.; Wu, J. Effect of interface roughness on fracture energy and fracture process zone of rock-concrete specimens. Fatigue Fract. Eng. Mater. Struct. 2023, 46, 574–589. [Google Scholar]
- Hu, X.Z.; Li, Q.B.; Wu, Z.M.; Yang, S.T. Modelling fracture process zone width and length for quasi-brittle fracture of rock, concrete and ceramics. Eng. Fract. Mech. 2022, 259, 108158. [Google Scholar] [CrossRef] [Scilit]
- Tang, Y.X.; Chen, H.N.; Xiao, J.Z. Size effects on the characteristics of fracture process zone of plain concrete under three-point bending. Constr. Build. Mater. 2022, 315, 125725. [Google Scholar] [CrossRef] [Scilit]
- Pei, L.Y.; Qin, L.; Shi, F.F.; Yang, X.D.; Chu, X.X.; Feng, L.; Li, S.T.; Guo, C.C. Fracture mechanisms of filling layer self-compacting concrete before and after polymer repair in CRTS-III: Insights from the perspective of AE and DIC. Measurement 2026, 257, 118757. [Google Scholar] [CrossRef] [Scilit]
- Liu, Y.; Zhou, R.X.; Lu, Z.T.; Cheng, C.Z.; Wang, W. Mesoscale modelling on the evolution of the fracture process zone in concrete using a unified phase-field approach: Size effect study. Theor. Appl. Fract. Mech. 2023, 128, 104110. [Google Scholar] [CrossRef] [Scilit]
- Ahmed, W.; Lim, C.W. Production of sustainable and structural fiber reinforced recycled aggregate concrete with improved fracture properties: A review. J. Clean. Prod. 2021, 279, 123832. [Google Scholar] [CrossRef] [Scilit]
- Ji, X.; Joo, H.E.; Li, Z.J.; Takahashi, Y.; Fujishima, M.; Miura, T. Mechanism exploration of crack orientation influence on compression fracture behavior of ASR-affected concrete under multiaxial restraint using DIC analysis. Cem. Concr. Compos. 2026, 166, 106402. [Google Scholar] [CrossRef] [Scilit]
- Aliha, M.R.M.; Ghoreishi, S.M.N.; Shaker, H.; Jafari, F.; Bazoobandi, P.; Sadowski, T.; Choupani, N. Characterizing the properties of asphalt concrete (AC) at different testing conditions and loading modes by different testing methods and samples (SCB, ENDB and DCT): A comparative review of fracture parameters. Constr. Build. Mater. 2025, 474, 141148. [Google Scholar] [CrossRef] [Scilit]
- Barbhuiya, S.; Das, B.B.; Kanavaris, F. A review on fracture propagation in concrete: Fundamentals, experimental techniques, modelling and applications. Mag. Concr. Res. 2023, 76, 482–514. [Google Scholar] [CrossRef] [Scilit]
- Xu, Y.J.; Chen, H.N.; Tang, Y.X. Study on fracture parameters and fracture process zone of manufactured-sand recycled aggregate concrete. Constr. Build. Mater. 2022, 361, 129613. [Google Scholar] [CrossRef] [Scilit]
- Li, S.; Chen, D.F.; Lu, Y.Y.; Liu, Z.Z. Fatigue fracture characteristics of normal concrete and high ductility geopolymer bonding based on DIC technique. Thin-Walled Struct. 2024, 196, 111469. [Google Scholar] [CrossRef] [Scilit]
- El-Abbasy, A.A. Tensile, flexural, impact strength, and fracture properties of ultra-high-performance fiber-reinforced concrete—A comprehensive review. Constr. Build. Mater. 2023, 408, 133621. [Google Scholar] [CrossRef] [Scilit]
- Li, X.; Ma, F.H.; Chen, X.D.; Hu, J.; Wang, J.M. Fracture behavior investigation of self-compacting rubberized concrete by DIC and mesoscale modeling. J. Clean. Prod. 2023, 384, 135503. [Google Scholar] [CrossRef] [Scilit]
- Li, S.T.; Fan, X.Q.; Chen, X.D.; Liu, S.S.; Guo, Y.Z. Development of fracture process zone in full-graded dam concrete under three-point bending by DIC and acoustic emission. Eng. Fract. Mech. 2020, 230, 106972. [Google Scholar] [CrossRef] [Scilit]
- Zeng, Y.Q.; Lei, D.; He, J.T.; Zhou, K.Y.; Wang, D. Deep learning-based classification of concrete crack evolution stages with reference to the double-K fracture criterion. J. Build. Eng. 2026, 119, 115176. [Google Scholar] [CrossRef] [Scilit]
- Yan, X.Q.; Su, H.Z.; Ai, L.; Soltangharaei, V.; Xu, X.Y.; Yao, K.F. Study on stage characteristics of hydraulic concrete fracture under uniaxial compression using acoustic emission. Nondestruct. Test. Eval. 2024, 39, 1315–1344. [Google Scholar]
- Pandermarakis, Z.G.; Sotiropoulou, A.B. The Identification of a Hidden Long-Term Plastic Damage Stage During Splitting Tensile Loading of Concrete: A Fracture Mechanics Approach. Strain 2010, 46, 538–549. [Google Scholar] [CrossRef] [Scilit]
- Sun, Y.; Roubin, E.; Shao, J.F.; Colliat, J.B. Meso-scale Finite Element modeling of the Fracture Process Zone evolution for concrete. Theor. Appl. Fract. Mech. 2023, 125, 103869. [Google Scholar] [CrossRef] [Scilit]
- Shin, H.Y.; Lawrence, C.; Kota, K.R.; Thamburaja, P.; Srinivasa, A.; Lacy, T.E.; Reddy, J. Experimental, theoretical and numerical studies on plain concrete fracture in the low-strain rate regime—A state-of-the-art review. Mech. Adv. Mater. Struct. 2022, 29, 7115–7159. [Google Scholar] [CrossRef] [Scilit]
- Mauludin, L.M.; Oucif, C. Computational modeling of fracture in concrete: A review. Front. Struct. Civ. Eng. 2020, 14, 586–598. [Google Scholar] [CrossRef] [Scilit]
- Lu, H.; Chen, Q.; Gu, Z.; Wen, X.; Huang, Z.; Ding, T. Experimental study on flexural behavior of hybrid fiber-reinforced concrete beams based on DIC technology. Structures 2026, 85, 111084. [Google Scholar] [CrossRef] [Scilit]
- Bai, G.; Guan, J.; Wang, L.; Li, Z.; Ma, G. Bending performance of 3D printed ultra high-performance concrete composite beams. Addit. Manuf. 2024, 89, 104298. [Google Scholar] [CrossRef] [Scilit]
- Dziomdziora, P.; Smarzewski, P. Reinforced Concrete Beams with FRP and Hybrid Steel–FRP Composite Bars: Load–Deflection Response, Failure Mechanisms, and Design Implications. Materials 2025, 18, 4381. [Google Scholar] [CrossRef] [Scilit] [PubMed]
- Wang, Y.; Zhang, C.; Liu, Z.; Li, S. Sustainable self-healing asphalt mixture with microcapsules: Self-healing behavior and indicators analysis. J. Clean. Prod. 2026, 538, 147430. [Google Scholar] [CrossRef] [Scilit]
- Zhai, C.; Wu, W.; Xiao, Y.; Zhang, J.; Zhai, M.; Wu, Y. A geometry-based secure robust switched control strategy for a straight-curved mixed road lattice hydrodynamic model with jerk dynamics and cyber-attacks. Chaos Solitons Fractals 2026, 208, 118056. [Google Scholar] [CrossRef] [Scilit]
- Li, S.; Tan, Y.; Luo, W.; Xu, H.; Han, M.; Li, J.; Xiao, S. Novel Oil-Absorbing Organogel for Asphalt Pavement: VOC Reduction, Mechanical Properties, and Environmental and Economic Influence. ACS Sustain. Chem. Eng. 2026, 14, 6879–6892. [Google Scholar] [CrossRef] [Scilit]
- Cakir, F.; Aydin, M.R.; Acar, V.; Aksar, B.; Akkaya, H.C. An experimental study on RC beams shear-strengthened with intraply hybrid U-jackets composites monitored by digital image correlation (DIC). Compos. Struct. 2023, 323, 117503. [Google Scholar] [CrossRef] [Scilit]
- Li, H.; Shi, L.; Li, J.; Ma, T.; Tan, Y.; Chen, W.; Lin, Y. Durability influencing factors and attenuation characteristics of composite modified asphalt anti-skid surface layer. Constr. Build. Mater. 2026, 516, 145631. [Google Scholar] [CrossRef] [Scilit]
- Shi, L.; Hu, Z.; Li, H.; Lin, B.; Tan, Y.; Deng, Y. Influence of RAP content on the mesostructure and mechanical response of recycled asphalt mixtures. Particuology 2026, 516, 145631. [Google Scholar]
- Murali, G.; Abid, S.R.; Vatin, N.I.; Amran, M.; Fediuk, R. Influence of height and weight of drop hammer on impact strength and fracture toughness of two-stage fibrous concrete comprising nano carbon tubes. Constr. Build. Mater. 2022, 349, 128782. [Google Scholar] [CrossRef] [Scilit]
- Fan, X.Q.; Liu, S.; Wei, D.; Ge, F. Fracture characteristics and damage evolution of early-age concrete under cyclic loading: Insights from AE and DIC techniques. Eng. Fract. Mech. 2025, 330, 111685. [Google Scholar] [CrossRef] [Scilit]
- Golewski, G.L. Evaluation of fracture processes under shear with the use of DIC technique in fly ash concrete and accurate measurement of crack path lengths with the use of a new crack tip tracking method. Measurement 2021, 181, 109632. [Google Scholar] [CrossRef] [Scilit]
- Xiong, X.; Huang, Q.; Cai, X.; Fan, Z.; Li, H.; Huang, Y. Factors Affecting Dielectric Properties of Asphalt Mixtures in Asphalt Pavement Using Air-Coupled Ground Penetrating Radar. Appl. Sci. 2025, 15, 12852. [Google Scholar] [CrossRef] [Scilit]
- Golewski, G.L. An extensive investigations on fracture parameters of concretes based on quaternary binders (QBC) by means of the DIC technique. Constr. Build. Mater. 2022, 351, 128823. [Google Scholar] [CrossRef] [Scilit]
- Guo, T.F.; Liu, K.W.; Wang, H.Q.; Si, X.F.; Rui, Y.C.; Pu, C.Z.; Zhang, Y.; Yuan, C.X. Mechanical characteristics and fracturing behavior of rock-concrete composite specimens with two pre-existing parallel flaws under uniaxial compression based on AE and DIC systems. Theor. Appl. Fract. Mech. 2025, 136, 104866. [Google Scholar] [CrossRef] [Scilit]
- GB/T 50081-2019; Standard for Test Methods of Concrete Physical and Mechanical Properties. Ministry of Housing and Urban Rural Development: Beijing, China, 2019.
- Alam, S.Y.; Loukili, A.; Grondin, F. Monitoring size effect on crack opening in concrete by digital image correlation. Eur. J. Environ. Civ. Eng. 2012, 16, 818–836. [Google Scholar] [CrossRef] [Scilit]
- Fan, X.; Liu, S.; Ge, F. Fracture properties of early-age concrete based on digital image correlation technique. Eng. Fract. Mech. 2025, 315, 110847. [Google Scholar] [CrossRef] [Scilit]
- Galouei, M.; Fakhimi, A. Size effect, material ductility and shape of fracture process zone in quasi-brittle materials. Comput. Geotech. 2015, 65, 126–135. [Google Scholar] [CrossRef] [Scilit]
- Guo, M.; Alam, S.Y.; Bendimerad, A.Z.; Grondin, F.; Rozière, E.; Loukili, A. Fracture process zone characteristics and identification of the micro-fracture phases in recycled concrete. Eng. Fract. Mech. 2017, 181, 101–115. [Google Scholar] [CrossRef] [Scilit]
- Xing, C.; Tan, Y.; Liu, X.; Anupam, K.; Scarpas, T. Research on local deformation property of asphalt mixture using digital image correlation. Constr. Build. Mater. 2017, 140, 416–423. [Google Scholar] [CrossRef] [Scilit]
- Skarżyński, Ł.; Tejchman, J. Experimental Investigations of Fracture Process Using DIC in Plain and Reinforced Concrete Beams under Bending. Strain 2013, 49, 521–543. [Google Scholar] [CrossRef] [Scilit]
- Grégoire, D.; Maigre, H.; Morestin, F. New experimental techniques for dynamic crack localization. Eur. J. Comput. Mech./Rev. Eur. Méc. Numér. 2009, 18, 255–283. [Google Scholar] [CrossRef] [Scilit]
- Grégoire, D.; Loh, O.; Juster, A.; Espinosa, H.D. In-situ AFM experiments with discontinuous DIC applied to damage identification in biomaterials. Exp. Mech. 2011, 51, 591–607. [Google Scholar] [CrossRef] [Scilit]
- Zhou, Y.; Chen, Y.Q. Propagation function for accurate initialization and efficiency enhancement of digital image correlation. Opt. Lasers Eng. 2012, 50, 1789–1797. [Google Scholar] [CrossRef] [Scilit]

Disclaimer/Publisher’s Note: The statements, opinions and data contained in all publications are solely those of the individual author(s) and contributor(s) and not of MDPI and/or the editor(s). MDPI and/or the editor(s) disclaim responsibility for any injury to people or property resulting from any ideas, methods, instructions or products referred to in the content. |
© 2026 by the authors. Licensee MDPI, Basel, Switzerland. This article is an open access article distributed under the terms and conditions of the Creative Commons Attribution (CC BY) license.