


Abstract
To address the existing gap in quantitative evaluation regarding the integrated visual effect of spring water landscapes and street spaces within Historical and Cultural Neighborhoods of Spring Zone, the Jinan Mingfu City area is selected as a typical case for this research. A quantitative framework for street view aesthetic perception based on deep learning is constructed. ResNet-101 predicts aesthetic scores using 6796 Street View Images (SVIs), while DeepLabV3+ extracts visual elements. A four-dimensional design quality system is established, including Traffic Safety, Street Vitality, Spatial Comfort, and Living Convenience. Clustering and regression analysis reveal the relationship between aesthetic perception and design quality. Results show: (1) the Water Blue View Index (WBVI) is the primary predictor of street aesthetic scores (β = 0.419), confirming the visual dominance of the “spring water” element; (2) WBVI, Green View Index (GVI), and Sky View Factor (SVF) constitute a “Natural Perception Triangle (NPT)” as the ecological comfort foundation; (3) streets are categorized into six types with significant design quality variations; (4) the proposed “Street Perception Optimization Matrix (SPOM)” provides differentiated renewal strategies for Spring Zone. This research presents a framework for visual quality assessment and refined renewal of Historical and Cultural Neighborhoods of Spring Zone.
1. Introduction
Historical and Cultural Neighborhoods function as significant carriers of cultural heritage, with their unique cultural atmosphere and local life experiences as distinguishing features. These characteristics have gradually turned them into a focal point for tourism consumption [1,2]. Dual contexts, heritage protection and tourism revitalization, exert a shaping influence on the function of street space. Street space is not only the primary medium for commercial activities and cultural experiences but also recognized as the main interface. Through this interface, tourists’ perceptions of place and aesthetic judgments are formed [3,4]. Distinctive natural and cultural attributes of historical neighborhoods in different regions are frequently leveraged to cultivate unique tourism appeal [5]. Jinan is often cited as a typical case, where “spring water” acts as the city’s most significant identity marker. Regarded as more than just a natural landscape, this spring water is also a cultural symbol that has been intricately woven into the urban fabric. Jinan Mingfu City, located in the core area of the ancient city, exemplifies the traditional imagery described by the phrase “Springs flow by every house, willows droop at every door” [6]. Its street network is closely connected with the spring water system, thus forming a characteristic landscape that is typical of a Spring Zone [7]. Nevertheless, questions have been raised by the ongoing processes of tourism development and neighborhood renewal. These questions focus on two aspects: the adequacy of the spring water landscape’s visual representation at the street level and its perceptibility to tourists. No systematic quantitative assessment has been carried out for these factors so far [8,9]. Consequently, the critical question of how to scientifically evaluate neighborhoods’ visual aesthetic quality is to be addressed in this study. For the purpose of this study, we define “integrated visual effect” as the combined visual impact of spring water landscapes and street spaces, which shapes the overall aesthetic quality of the Historical and Cultural Neighborhoods of Spring Zone.
Studies on street aesthetic have been abundant, and the quality of street design is measured by perceptual indicators such as the GVI, SVF, Interface Enclosure, and Visual Complexity [10,11]. Ki et al. [12] proposed a new walkability index to provide urban planners with a more holistic assessment instrument. Six perceptual qualities were incorporated into an objective framework to evaluate streetscape perception and exhibited a better explanatory power in predicting housing prices than objective pixel-level indicators extracted from SVIs [13]. Li et al. [14] identified four primary urban landscape indicators based on three-dimensional space: greenness, grayness, openness, and crowdedness. By integrating the urban context with two-dimensional landscape indicators, they forecasted the socioeconomic characteristics of cities. Wei et al. [15] developed a model to evaluate the friendliness of street-walking environments, incorporating greenness, walkability, safety, imageability, enclosure, and complexity. In recent years, mainstream approaches to assessing street-level visual perception have primarily included: objective measurement methods based on single indicators, such as the GVI, and holistic aesthetic scoring models leveraging SVIs and deep learning. Representative studies include Zhang et al. [16], who focused on GVI, and Liu et al. [17], who employed deep learning for street aesthetic evaluation. However, when applied to historic districts with distinctive regional cultural characteristics, these approaches exhibit notable limitations: weak interconnectivity among indicators, which fails to account for the synergistic interactions among multiple natural elements and limited applicability and explanatory power of generic aesthetic models in such culturally and ecologically specific contexts, due to their omission of locally salient features like “visible springs.” Consequently, there remains a critical gap in the literature: the absence of an assessment framework that simultaneously integrates regional cultural attributes and quantifies the synergistic effects of multidimensional natural elements, particularly springs, in shaping street-level visual perception. To address this gap, this study proposes the Natural Perception Triangle (NPT) model and the Street Perception Optimization Matrix (SPOM), along with the conceptualization of “Historical and Cultural Neighborhoods of Spring Zone” as a new analytical category. This concept refers to a unique type of hydro-cultural heritage street environment, where spring water is not merely a scenic backdrop but a fundamental structuring component that actively shapes street morphology, everyday life practices, cultural identity, and visual perception. As a natural-cultural composite unit, the integrity of the Spring Zone is emphasized by this concept, which in turn establishes clear boundaries for future research. Furthermore, this research aligns with SDG 11 (Sustainable Cities and Communities), specifically Target 11.4, by providing a quantitative framework to safeguard the cultural and natural heritage of historical neighborhoods.
Traditional research on aesthetic perception has predominantly depended on questionnaire surveys and small-scale experiments, which are constrained by limited spatial coverage and sample representativeness [18,19]. The integration of SVIs and Deep Learning has created new opportunities for large-scale, high-precision visual assessments of urban streets [20]. Deep learning algorithms have been used to identify streetscape elements and measure design quality, walkability, and safety [21]. In emotional perception, the “PlacePulse” project gathered emotional indicators via streetscape comparison and voting mechanisms, thus improving the ability to extract emotional responses from SVIs [22]. In the context of the Chinese urban setting, Yao et al. [23] proposed a human–machine adversarial approach and built a street view emotion database. Ordonez et al. [24] extensively sampled SVIs in four urban areas and predicted and evaluated public subjective perceptions by combining support vector machines and linear regression models, and a strong correlation was shown between the predicted results and the field survey data. Poriz et al. [25] applied convolutional neural networks to extract feature information from Google SVIs, with the core goal of predicting perceived safety. Automated extraction of objective indicators has been enabled by recent advances in semantic segmentation technology. This technical progress has laid a fundamental basis for large-scale research focusing on subjective perception [26]. On the basis of this existing research foundation, ResNet-101 deep learning is adopted in the present study to improve the modeling capacity for complex visual semantics [27]. In addition, DeepLabV3+ is used to realize pixel-level recognition of various elements, including water bodies, vegetation, and sky. On this basis, an aesthetic perception evaluation framework centered on Spring Zone heritage streets is constructed.
In summary, this study is designed with two core research priorities. The first is to explore the intrinsic relationship between Street View Aesthetics and objective design quality within historical neighborhoods of the Spring Zone. The second is to identify aesthetic variations across different street types and put forward tailored design optimization strategies accordingly. More specifically, three key research questions are addressed in this study. First, in what ways do visual indicators—represented by the WBVI—exert an influence on subjective aesthetic evaluations? Second, what typical street types can be distinguished in the Jinan Mingfu City area, and what differences exist in terms of their aesthetic perception and design quality? Third, how can quantitative analysis provide guidance for developing differentiated design optimization strategies for various street types? This study presents three main innovations. For one thing, it introduces the Spring Zone as a central explanatory variable in the aesthetic analysis of heritage streets, thereby constructing a quantitative evaluation framework that centers on regional cultural characteristics. For another, it proposes the “WBVI–GVI–SVF” NPT as a foundational ecological comfort model. Finally, it establishes the SPOM for design guidance. While validated in the context of Jinan Mingfu City, both the NPT and SPOM are conceived as transferable analytical frameworks that can be adapted to other water-related historic urban areas to assess and enhance their visual quality.
2. Materials and Methods
2.1. Research Procedure
The research framework adopted in this study is outlined as follows (Figure 1).
Figure 1.
Research Framework.
First, a total of 6796 valid SVIs were obtained via the Baidu Map open platform and manual collection. 300 images were selected from this image pool through a 100 m × 100 m grid sampling method to form the dataset for training the streetscape aesthetic quality prediction model. At the same time, the ResNet-101 deep learning model was applied to predict aesthetic scores for the full set of images. Second, a semantic segmentation model was applied to extract visual features from all collected images. A four-dimensional evaluation index system, which consists of Traffic Safety, Street Vitality, Spatial Comfort, and Living Convenience, was constructed to quantify street design quality. Third, 2048-dimensional feature vectors were extracted from SVIs using the ResNet-101 model, and the K-means clustering method was adopted to classify the obtained streetscape feature vectors. Uniform Manifold Approximation and Projection (UMAP) was then used to visualize the final clustering results. Fourth, multiple linear regression analysis was conducted to investigate the correlation between Street View Aesthetics and street design quality in the Spring Zone of Jinan Mingfu City. The variation of this correlation across different street types was also examined in this analysis. Finally, a design method for the SPOM, specially developed for Historical and Cultural Neighborhoods, was proposed, with a targeted focus on the aesthetic design of Spring Zone streets.
2.2. Study Area and Data Collection
This study takes the Mingfu City area in Jinan City, Shandong Province, as the research site (Figure 2), covering an area of approximately 4.43 km2. Street view images were collected using a Python 3.10.12–based web crawler that interfaces with the Baidu Maps API. The data acquisition procedure consisted of the following steps: (1) Vector road network data for the Daming Lake area of Jinan were obtained from OpenStreetMap and imported into ArcGIS 10.8.2, where they were reprojected to WGS_1984_UTM_Zone_50N. (2) The raw road network was cleaned and simplified. Sampling points were then generated at 30-m intervals along the road segments using the densification tool. These points were exported using the “Feature Vertices to Points” tool. Then the “Calculate Geometry” function was applied to calculate and export the latitude and longitude coordinates of each sampling point. (3) A Python script was developed to access the Baidu Street View API. Four images (resolution: 1024 × 800 pixels) were taken at each sampling point with camera headings in the 0°, 90°, 180°, and 270° directions, respectively. The four images were then combined to form a panoramic representation (Figure 3). Manual coordinate marking was adopted for areas inaccessible to street view vehicles. 1085 supplementary SVIs were captured from the aforementioned four horizontal directions using a digital single-lens reflex camera equipped with a GPS logger. Camera parameters were set to fully match those of the Baidu Street View perspective. All image acquisition work was carried out between October and November 2025, within the 9:00–15:00 time window on eight non-consecutive days. Every collected image was annotated and geotagged after acquisition.
Figure 2.
(a) China regional map. (b) Shandong regional map. (c) Jinan area map. (d) Jinan Mingfu City map.
Figure 3.
Schematic Diagram of Street View Collection.
Spatial bias potentially caused by random sampling must be mitigated, and the spatial balance and global representativeness of the sample need to be guaranteed. To meet these two core requirements, a scientific spatial sampling scheme combining 100 m × 100 m grid-based stratification with road network matching was adopted in this study. The whole procedure was implemented on the ArcGIS platform, in which a trade-off was achieved between the randomness of sampling and the spatial uniformity. The screening of the selected SVIs was rigorous so as to ensure the quality and reliability of the selected images according to the following specific rules: (1) to ensure uniform temporal features, images with inconsistent capture seasons or time periods were excluded; (2) incomplete or blurry images were deleted; (3) duplicate images were deleted. The last screening yielded 6796 SVIs, which are the study dataset.
2.3. Prediction of Street View Aesthetic Quality Scores
To conduct aesthetic evaluation for all images, a dataset based on manual scoring was established for this study, and the ResNet-101 model was fine-tuned to predict the aesthetic quality of urban streetscapes with scientific accuracy. The ResNet-101 architecture was selected for the aesthetic prediction task due to its proven effectiveness in capturing complex, high-level visual semantics from images, which is crucial for modeling subjective aesthetic judgments. While simpler models like ResNet-50 or traditional machine learning approaches were considered, ResNet-101 offers a superior balance between model capacity and generalization ability for this specific task, as evidenced by its widespread success in large-scale image recognition benchmarks. 200 volunteers were recruited for the evaluation work. The demographic profile of the participants is as follows: 107 males and 93 females; age groups were distributed as 18–25 (n = 58), 26–35 (n = 62), 36–45 (n = 45), 46–60 (n = 35); among them, 112 were local residents of Jinan, while 88 were non-local visitors or students; 76 had a background in architecture, urban planning, or landscape design (professional), and 124 came from other disciplines (non-professional); regarding familiarity with the Mingfu City area, 92 participants reported being very familiar, 73 were somewhat familiar, and 35 had little to no prior knowledge. These participants were asked to assess 300 sample images by responding to the question “How beautiful do you think this streetscape is?” (Figure 4). The rating scale used ranged from 1 (not at all beautiful) to 6 (extremely beautiful) [28]. To eliminate the potential influence of factors such as age and gender, each SVI was evaluated at least 10 times. The exclusion of 42 invalid samples was based on the following criteria: (1) images with severe blurriness or overexposure that hindered clear visual judgment; (2) responses where a participant failed to complete the rating for more than 20% of the assigned images; and (3) individual rating records identified as outliers through statistical analysis. After this screening process, 258 valid images remained, and 20% of these images were set as the test set. After this screening process, a final dataset of 258 valid images was established. To ensure a robust assessment and mitigate overfitting risks associated with our limited sample size, we implemented a strict data partitioning protocol. The dataset was randomly split into three independent subsets: 70% for training (n = 180), 10% for validation (n = 26), and 20% for the final hold-out test (n = 52). The training set was used for weight updates, while the validation set guided hyperparameter tuning (e.g., learning rate, early stopping). The test set was reserved for a single, final evaluation to report unbiased performance metrics.
Figure 4.
Schematic Diagram of Aesthetic Scoring.
An aesthetic evaluation model was developed using ResNet-101, which autonomously scores all SVIs through deep learning of image features. The formula is as follows:
where and represent the weight matrices of the convolutional layers, b1 and b2 are the bias terms, and ω denotes the ReLU activation function. To assess the impact of various pixel categories on the scoring, the SHAP (SHapley Additive exPlanations) method was utilized to perform an interpretability analysis of the model’s predictions. This method is grounded in the Shapley value concept from cooperative game theory [29]. The Shapley value provides an axiomatic and uniquely equitable allocation method that complies with several core “fairness” conditions. Its fundamental premise is that the payoff each participant deserves matches the weighted average of their marginal contributions across all possible coalitions. With this logic applied, the model’s classification decisions can be clearly interpreted. The interpretation is based on individual pixels or feature regions within an image. Pixels highlighted in red represent a positive contribution to the decision, while those in blue stand for a negative contribution. The specific calculation is as follows:
where denotes the Shapley value of the i-th feature, representing its contribution to the model’s prediction output. When evaluating a subset S, v(S) can be understood as the model’s output result.
2.4. Quantification of Street Design Quality
As a basic element of urban life, street space has a great influence on urban vitality, social interaction and sustainable development through its visual quality. The establishment of a scientific evaluation index system for street space is the basis for refined management and optimization of the living environment. In recent years, the combination of urban design, environmental psychology, computer vision, and geographic information science has made it possible to transition from a single aesthetics-oriented approach to a multi-dimensional, subjective-objective collaborative comprehensive experience assessment in evaluating street space [30,31]. This evolution is evident both in the dimensions of evaluation and in the technical routes used.
In the evaluation dimension, research has moved past the traditional landscape aesthetics and included safety, vitality, comfort, and convenience. Campbell et al. [32] contend that Traffic Safety now encompasses walking accessibility and the degree to which motor vehicles intrude. Street Vitality is a method to quantify the potential of social interaction by measuring the density of crowds and the richness of facilities [23]. Spatial Comfort highlights the mood-regulating effects of natural elements [33]. Finally, Living Convenience emphasizes the accessibility of service facilities and the diversity of ground-floor commercial activities [34].
The integration of artificial intelligence and remote sensing technologies has significantly improved the efficiency and precision of evaluations. Deep learning algorithms, including CNN and DeepLabV3+, have been extensively utilized for the automatic extraction and classification of streetscape elements from SVIs, facilitating the large-scale quantification of objective parameters [35]. Verma et al. [36] established a multi-source heterogeneous spatial database by means of the integration of street view platforms, UAV aerial photography, and satellite remote sensing imagery. The gathering of subjective data becomes more diversified where the users’ perceptual preferences and behavioral responses are captured with better fidelity with methods such as crowdsourcing platforms, eye-tracking and VR interaction.
This research background lays a foundational understanding for street space evaluation. However, for Historical and Cultural Neighborhoods of Spring Zone, further exploration is essential. The focus should be placed on the visual presence of Spring Water Landscape and their influence on aesthetic perception. This study constructs a four-dimensional design quality system, comprising Traffic Safety, Street Vitality, Spatial Comfort, and Living Convenience, grounded in established urban design and environmental psychology literature and adapted to the unique cultural attributes and functional positioning of Jinan’s Mingfu City historic district. The system is operationalized through a set of specific, quantifiable indicators derived from SVI analysis (Table 1).
Table 1.
Street Aesthetic Evaluation System for the Jinan Mingfu City Area.
- (1)
- Traffic Safety
Traffic safety is essential for preserving the continuity of the visitor experience and the vibrancy of street spaces [37]. A dimension of Traffic Safety evaluation for Historical and Cultural Neighborhoods was established. WFI and MLI were identified as two key indicators of this dimension. These indicators are founded on the opposing dimensions of the availability of pedestrian infrastructure and the intensity of motor vehicle activity, which together express the degree to which streets can counteract the prevalence of vehicles and promote the dominance of pedestrians. They offer a quantitative foundation and practical guidance for traffic calming design in heritage neighborhoods, such as the Jinan Mingfu City area [38].
- (2)
- Street Vitality
Street vitality is deeply reflected in the intricate interplay between the daily lives of local residents and the cultural experiences of tourists. Street spaces in the Jinan Mingfu City area serve multiple core functions: preserving community memory, stimulating public social interaction, and supporting cultural tourism consumption. The vitality of these spaces does not stem from high-intensity development. It is derived from the continuous and organic dialogue between humans and environments. In this study, a microperceptual approach is adopted using SVIs, where CCI and SEI are the two main research parameters. These two parameters together characterize the ability of streets in the Jinan Mingfu City area to facilitate the behavioral sequence of “staying-interacting-experiencing.” They also provide a visual and quantifiable approach to assess how neighborhoods can enhance social vitality while maintaining their authenticity [39].
- (3)
- Spatial Comfort
Spatial Comfort finds expression in individuals’ perceptual connection to the quality of traditional living environments. With SVIs as the core data source, a Spatial Comfort evaluation dimension adapted for historical neighborhoods is constructed in this study. This dimension focuses on three core indicators: GVI, WBVI, and SVF. Taken together, these indicators capture the natural affinity and cultural immersion created by the streets of the Jinan Mingfu City area at a three-dimensional visual level. This framework provides a quantifiable visual analysis for evaluating how heritage neighborhoods can enhance public psychological comfort through micro-environmental optimization [40].
- (4)
- Living Convenience
Living Convenience is centered on the need to ensure enough support for basic living needs of the residents and experiential demands of the tourists. Such support should be provided together with the protection of traditional features and urban fabric. The present study creates a concise and focused dimension of evaluation for Living Convenience, consisting of two major indicators, SFI and BRI. These indicators, taken together, reflect the basic service capability of historical neighborhood streets in supporting daily community life and enhancing cultural tourism experiences, thereby providing a measurable basis for the evaluation of their composite functions [41].
To calculate these indicators scientifically and effectively, the DeepLabV3+ model was utilized for semantic segmentation of the collected images [42]. Compared to the FCN model, the DeepLabV3+ model has been widely applied in road extraction, urban landscape analysis, traffic condition assessment, and related tasks, demonstrating higher segmentation accuracy and efficiency [43,44].
The proper dataset selection depends on the performance of the model in recognition. This study uses the ADE20K dataset from Massachusetts Institute of Technology. The dataset has more than 20k images with fine-pixel annotations covering a wide range of indoor and outdoor scenes. It is considered as one of the most complete and authoritative datasets for scene parsing and semantic segmentation [45]. Numerous studies have shown that models trained on this dataset exhibit exceptional segmentation capabilities across various applications [46,47], Yuan et al. [48] particularly excelling in tasks such as urban spatial quality assessment and complex environmental element recognition [49].
2.5. Street View Images Clustering
The aesthetic quality of urban street landscapes shows significant spatial heterogeneity. It is also deeply shaped by regional culture and historical heritage. In spring-centered historic districts, spring water itself acts as the core cultural element. The interaction between its visual presentation and street space is the key to understanding aesthetic differentiation. To systematically evaluate the streetscape aesthetic characteristics in Jinan’s Mingfu City area, an unsupervised clustering method based on deep learning is adopted in this study. This method is applied to objectively identify the inherent streetscape typology of the region.
First, the ResNet-101 deep convolutional neural network was used to extract high-dimensional features from SVIs covering the entire study area (Figure 5). ResNet-101 can well capture the multi-level features from low-level texture to high-level scene semantics due to its deeper residual architecture and pre-training on large-scale visual datasets [50]. It produces a 2048-dimensional feature vector for every image which is a more discriminative feature basis for further analysis [51]. Second, the K-means clustering algorithm is employed to conduct an exploratory analysis of the high-dimensional feature space [52]. The algorithm works on the assumption that clusters are distributed in a convex way. This premise notwithstanding, it has high computational efficiency and stable analysis results. It can be effectively used to determine the optimal number of clusters in combination with the elbow rule or the kurtosis coefficient. This approach does not depend on previous labels being available. It identifies multiple street scene categories with typical visual characteristics within the Mingfu City district. This process avoids subjective biases in classification. It also provides quantitative evidence and spatial visualization support for understanding the coupling mechanisms among heritage conservation, tourism experiences, and street scene aesthetics in the Historical and Cultural Neighborhoods of Spring Zone.
Figure 5.
ResNet-101 Feature Extraction Architecture Diagram. (Input: a 224 × 224 × 3 SVI. Following convolution, pooling, and four residual stages, a 2048-dimensional feature vector is produced. This feature vector is then utilized for K-means clustering and UMAP visualization analysis).
3. Results
3.1. Aesthetic Quality Prediction and Spatial Distribution
To predict the aesthetic quality of street scenes, a street scene aesthetic prediction model based on ResNet-101 was adopted in this study. After 500 training iterations (Figure 6), the model reached an accuracy of 0.835. This level of accuracy makes the model suitable for predicting the aesthetic quality of urban street scenes. The SHAP method was also applied to visualize the model’s prediction focus. This process further explains the influence of each street scene element on the model’s prediction results [53]. The analysis reveals the relative contributions of various environmental factors to aesthetic evaluations (Figure 7). Notably, the “water” feature exhibits the highest mean |SHAP value|, indicating it is the most influential element in the model’s decision-making process. This finding provides a visual validation for our proposed indicators and strongly corroborates the results of our multiple linear regression, where the WBVI emerged as the strongest predictor of aesthetic scores (β = 0.419). This consistency between the deep learning model’s internal logic and our statistical analysis reinforces the conclusion that the visual presence of spring water is the primary driver of aesthetic perception in the Spring Zone.
Figure 6.
Training Graph of the Aesthetic Scoring Model. The horizontal axis denotes the number of training epochs (total epoch = 500), while the left vertical axis illustrates the variation in the loss value. The right vertical axis reflects the change in accuracy for each training round. The red dashed line represents an average accuracy of 0.835.
Figure 7.
Contribution of Each Factor to the Aesthetic Score.
The aesthetic quality of the remaining 6543 SVIs was predicted using the trained model. Subsequently, the distribution of aesthetic quality scores across all sampling points was visualized (Figure 8). High aesthetic quality is mainly concentrated in the northern, southern, and southwestern parts of Jinan Mingfu City area. Among these regions, the Baotu Spring, and Five Dragon Pool area (Location A, mean aesthetic score = 4.975) stood out with the highest aesthetic quality. Similarly, the areas around Black Tiger Spring and Daming Lake also achieved relatively high aesthetic scores. In contrast, the Mingfu residential area (Location C, mean aesthetic score = 1.861) had the least aesthetic quality among all the studied areas. The sheer concentration of aging buildings, tightly packed together, and the gradual decay of the street environment took much away from the overall visual appeal of this area. On the other hand, areas with moderate aesthetic quality were mostly located in the north-west part of the city. Refined components of streetscape design were absent in newly constructed residential communities, but they still maintained a certain level of aesthetic charm (Location B, mean aesthetic score = 3.098). Finally, the prediction results of the nine street design quality indicators were presented with spatial maps.
Figure 8.
Distribution Map of Street View Aesthetics. (Left: Points are colored from blue to red to indicate the aesthetic quality of various locations. Right: Samples of SVIs categorized by aesthetic quality: (A) high aesthetic quality, (B) medium aesthetic quality, and (C) low aesthetic quality).
The high aesthetic scores of areas like Baotu Spring and Five Dragon Pool are usually a result of the combination of several high-quality design elements, including water features, greenery, traditional architectural interfaces, and effective maintenance. Therefore, the high standardized coefficient of WBVI should be interpreted as evidence that it is the strongest visual predictor of aesthetic scores in the present sample, not that water bodies by themselves determine the aesthetics of streets.
3.2. Visual Quality Analysis of Street Space
After the construction of the visual evaluation system, the semantic segmentation was performed on the images of each sampling point and the visual elements were aggregated. The spatial distribution of various landscape indices in the Jinan Mingfu City area was significantly heterogeneous and had inherent correlations [54].
In the Traffic Safety dimension, the WFI values showed a spatial distribution pattern of “low in the center, high in the north and south” (Figure 9a), and the highest values were mainly concentrated around Quancheng Square. The areas around Daming Lake and along the city moat had relatively high WFI values due to the good continuity of roads and the developed sidewalks, among which Baihuazhou and the historical neighborhood area formed a pedestrian-friendly core. In contrast, relatively low WFI values were found in the urban fringe and along some branch roads, suggesting problems related to network fragmentation and poor connectivity within the slow-traffic system [55]. The MLI values were much higher near the Daming Lake and the city moat (Figure 9b), especially the high-value clusters along the main roads, for example, Daminghu Road and Quancheng Road. In the historical districts, such as Baihuazhou and Furong Street, the level of motorization was relatively low, constrained by the density of building and the scale of space. Most of the traffic pressure in the area was concentrated on Daminghu Road, Minghubei Road and Luoyuan Street, which indicated the more developed road transportation system. The relatively low MLI values on routes running from south to north imply that current road planning may not have fully accounted for tourist flows along arterial roads extending from east to west.
Figure 9.
Distribution of the Nine Secondary Indicator Values. (a) WFI; (b) MLI; (c) CCI; (d) SEI; (e) GVI; (f) WBVI; (g) SVI; (h) SFI; (i) BRI.
The CCI values in the dimension of Street Vitality showed high-value clusters in the Daming Lake Scenic Area, Baihuazhou Historical and Cultural Neighborhoods, Quancheng Road Commercial Street, and the Black Tiger Spring group (Figure 9c). In particular, commercial and cultural nodes such as Furong Street and Kuanhouli showed notable hotspots, indicating that these areas have strong attractiveness and potential for public activity. In addition, the CCI values of areas with rich landscape resources such as Five Dragon Pool and the Number One Spring Scenic Area were relatively high, showing that both natural and cultural landscapes have a significant impact on pedestrian flow. Instead, places such as Quancheng Square were at risk of crowd density and overload of spatial carrying capacity, which would affect comfort and safety. The SEI values exhibited a complex spatial pattern (Figure 9d). The relatively low building heights and the abundance of open space along the city moat and around Daming Lake led to a relatively low SEI value, resulting in a visually permeable open interface. In contrast, the SEI values in the historical neighborhood such as Baihuazhou and Furong Street increased significantly, resulting from the traditional courtyard style layout and dense building clusters. However, the northwestern residential area with high building density had no continuous enclosure structure which caused a large fluctuation of SEI values and reflected the problem of spatial scale incoordination.
In the Spatial Comfort dimension, the GVI, and SVF values exhibited a negative correlation (Figure 9e,f). It is important to note that the increase in the GVI improves the feeling of comfort. However, a too high GVI with a low Sky View Factor can produce an excessive enclosed visual perception, thus leading to feelings of oppressiveness. WBVI was significantly high in the vicinity of Daming Lake and spring groups such as Baotu Spring (Figure 9g), and significantly low in the middle of the historical neighborhoods. Studies have shown that viewing waterscapes can significantly lower cortisol levels, slow heart rate, and improve mood [56]. Therefore, for the Historical and Cultural Neighborhoods of Spring Zone, “channeling springs into lanes” strategies should be adopted to effectively improve the waterscape visibility. This would reduce the psychological stress of dense building clusters and reinforce the cultural identity of the “City of Springs.”
High SFI values in the Living Convenience dimension were mainly distributed around scenic areas and Quancheng Square, and other areas were more evenly distributed (Figure 9h). Such an overly concentrated distribution may lead to waste of resources and overcrowding of public spaces. Even if the indicators are evenly distributed, the presence of only one type of service facility can be problematic. Areas with high SFI, such as those close to the provincial government, were rich in facilities, but the concentration of these facilities and the lack of typological diversity may lead to uneven utilization of resources. Therefore, a comprehensive statistical analysis of facility categories is needed to improve accessibility and user experience. High values of BRI are found in the surrounding areas of Daming Lake, Quancheng Road Commercial Street, Baihuazhou Historical and Cultural Neighborhoods, and Kuanhouli (Figure 9i). In particular, the BRI values of Furong Street and Quanlefang Pedestrian Street were significantly higher than those of surrounding areas, indicating their strong attraction and lasting vitality as urban consumption centers.
3.3. Classification of Characteristic Scenes
Hierarchical cluster analysis of landscape features was performed to determine the basic streetscape types of the Jinan Mingfu City area. The overall decreasing trend of the clustering distance was shown in the picture (Figure 10).
Figure 10.
Determination of the Optimal Number of Clusters.
It decreased rapidly when the number of clusters increased from 2 to 5, increased significantly after reaching 5, and then decreased again after 6. The within-cluster sum of squares was reduced by 32%, 21%, 15%, and 9% as the number of clusters increased from 2 to 5, using the elbow method, and the reduction rate fell below 5% after k = 5. The k = 6 was associated with a silhouette coefficient of 0.32, which was an improvement over the 0.28 for k = 5, and ultimately chosen as the best number of clusters. Thus, it can be concluded that the streetscape of the Jinan Mingfu City area is composed of six main categories (Figure 11). The dendrogram reveals the six-cluster structure. Based on empirical analysis and expert recommendations, each cluster was named, and it illustrates representative streetscape samples for each category [57,58] (Figure 12).
Figure 11.
Hierarchical Clustering Diagram.
Figure 12.
Typical Street View Samples by Cluster.
The study conducted image segmentation on the classified scenes, calculated landscape indices for each scene category and standardized the data (Table 2). To intuitively display the differences among the categories, the data were visualized (Figure 13). The results indicate that each scene category exhibits unique values for the evaluation indicators.
Table 2.
Landscape Indices of the Classified Scenes.
Figure 13.
Classification Indicator Display.
Major Traffic Street, as an important component of the urban transportation system, exhibit the largest MLI (0.823), the smallest WFI (0.241), and low CCI (0.153) and SEI (0.121) values. They also have a relatively high SVF (0.627) but a very low WBVI (0.057). The SFI (0.385) is at an average level, but the lack of walkability and ecological elements reveals disruption and degradation of the traditional street fabric by modern transportation.
Residential Street and Commercial Street are functionally distinct. The former has a relatively high WFI (0.512) and CCI (0.754), indicating a good community living atmosphere, but the MLI is low (0.124), and GVI is also low (0.116), indicating a lack of systematic greening planning within residential areas. Commercial Street, on the other hand, show strong consumption-oriented characteristics, with high rankings for MLI (0.453), CCI (0.714), and BRI (0.581), but the GVI is only 0.235, with strong spatial enclosure and low ecological value. This situation is a reflection of the excessive pursuit of economic efficiency in contemporary urban commercial spaces, at the expense of the quality of the living environment.
Spring Water Landscape and Greenway Promenade are important components of urban green infrastructure with great ecological and recreational value. The former has a high GVI of 0.377 and a WBVI of 0.589 with a SVF reaching a high of 0.835 resulting in a desirable visual corridor. The latter has the highest GVI among all scenes with 0.857, showing strong ecological restoration potential. However, their WFI values are 0.452 and 0.654 respectively. The values are above most scenes but still have room for improvement. The lowest BRI value (0.051) is obtained in Spring Water Landscape, which may be due to the absence of functional amenities around them. In further designs, the connection between greenways and adjacent functional zones should be improved for better accessibility and attractiveness.
In addition, the scenes of the Historic and Cultural Building also have a certain spatial hybridity. The WFI of 0.351 is moderately high and the CCI of 0.614 is remarkable, indicating strong attractiveness and vitality as public spaces. In contrast, the relatively high GVI (0.436) and WBVI (0.227) values indicate a good integration of natural ecological elements into the traditional landscape fabric. However, the BRI is relatively low at 0.221, suggesting that there is scope for improvement. Generally, these spaces can enhance heritage interpretation and service functions by improving supporting facilities such as rest areas and guided tour facilities.
3.4. Correlation Analysis of Indicators
This study constructed a Pearson correlation network for the nine core indicators to elucidate the intrinsic relational structure among the street design indicators (Figure 14). The network shows the strength of linear correlation between pairwise variables and suggests possible functional groupings of the indicators by the application of a clustering layout. From the perspective of network topology, the nine indicators are naturally divided into three highly cohesive subgroups.
Figure 14.
Pearson Correlation Network of Street Indicators (Nodes represent the nine objective indicators. The color and thickness of the edges reflect the magnitude and direction of the correlation coefficients: warm colors indicate positive correlations, while cool colors signify negative correlations; edges that are redder and thicker correspond to larger absolute values of |r|).
Ecological Comfort Cluster: GVI, WBVI, and SVF were strongly and positively correlated with each other, forming a tight NPT. This statistically significant co-occurrence pattern provides the primary empirical validation for the NPT as an integrated perceptual unit. Its theoretical robustness is thus established through data-driven evidence, demonstrating that these elements function synergistically rather than in isolation. This finding suggests that the ecological comfort basis of the streets in the Jinan Mingfu City area is likely to be the combination of vegetation, water bodies, and open sky.
Vitality and Convenience Cluster: CCI, BRI and SFI were highly positively correlated, indicating that high vitality areas tend to be associated with high convenience.
Traffic Safety Cluster: WFI and MLI were very negatively correlated, which was an intuitive confirmation of the fundamental spatial conflict between “vehicle dominance” and “pedestrian friendliness.” Also, WFI and SEI were found to be moderately positively correlated, showing that continuous, sheltered interfaces improve the walking experience.
Street Vitality, the network’s central node, was associated with almost all other indicators but with very different connection properties. There was a significant positive correlation with CCI, BRI, and SFI, showing that it reflects socioeconomic vitality. Moreover, it was moderately and positively correlated with GVI, WBVI, and SVF, indicating that vitality is not only a result of commercial activities but also encouraged by a supportive ecological environment. In addition, the strong negative correlation with MLI highlighted the importance of prioritizing pedestrians in the development of vitality [59].
3.5. Relationship Between Key Indicators and Design Quality
Among the investigated indicators, GVI, WBVI, and SVF showed significant influence on the aesthetic environment of Jinan Mingfu City area. The specific effects of the independent variables (SVF, GVI, and WBVI) on the dependent variable, aesthetic quality, were examined using a multiple linear regression analysis in IBM SPSS Statistics 26 (Table 3, Table 4 and Table 5). Results indicated that (1) the overall model was significant (F = 51.23, p < 0.001) and the adjusted R2 = 0.232; this means that 23.2% of the variance in SCORE was explained by the independent variables; (2) all three variables had significant positive effects on SCORE (p < 0.01), with WBVI having the largest standardized effect (β = 0.419), followed by GVI (β = 0.136) and SVF (β = 0.114); and (3) all VIF values were below 1.2, suggesting no multicollinearity issues. The results prove the statistically significant effect of the three indicators on the aesthetic quality.
Table 3.
Regression Model Summary (Predictors: SVF, GVI, WBVI; Dependent Variable: SCORE).
Table 4.
Multiple Linear Regression Coefficient Estimation Results (Dependent Variable: SCORE).
Table 5.
ANOVA Test of the Three Indicators (Dependent Variable: SCORE; Predictors: SVF, GVI, WBVI).
4. Discussion
4.1. Interpretation of Key Findings
The relatively low adjusted R2 of the regression model is consistent with the general trend of research in the field of environmental perception, where subjective aesthetics are highly dependent on cultural cognition, personal experience, and context. This variability makes it difficult for any single model to fully account for these perceptions. Therefore, the finding that WBVI is the strongest predictor should be understood as a relative and context-specific insight, rather than a definitive or universally applicable claim about its absolute importance. Other key findings of the study include:
4.1.1. WBVI as the Strongest Aesthetic Predictor in the Current Model
In the particular case of the Jinan Mingfu City area, Historical and Cultural Neighborhoods, WBVI was the only visual indicator with the highest predictive power in the current model (standardized coefficient β = 0.419). This finding underscores the significance of spring water as the essence of culture in Jinan. Aesthetic evaluations of streets by tourists and residents are not based on universal attributes such as greenery or open space, but are directly and strongly correlated with the visual accessibility of spring water. WBVI was weakly positively correlated with SEI, which is contrary to the traditional logic of modern waterfront landscape design that emphasizes unobstructed panoramic views. The framing effect of traditional buildings on both sides in the historical streets and alleys of the Jinan Mingfu City area did not detract from the charm of spring water. But this effect greatly improved the visibility and perceivability of the spring water by limiting sightlines and creating visual depth. This special “lane-spring” relationship is a distinctive aesthetic feature that differentiates the Jinan Mingfu City region from other historic neighborhoods.
The central historic neighborhoods, which are the cultural core of the region, including the inner parts of Furong Street and Baihuazhou, generally had low WBVI values. In contrast, the high WBVI values mostly occurred in the large open scenic areas such as Daming Lake and Baotu Spring. This difference might imply that the dispersed nodes of spring water, which reflect the cultural essence of the Jinan Mingfu City area, have not been sufficiently integrated through the street network. This has resulted in their failure to provide a coherent and immersive visual experience.
4.1.2. The “Water-Green” Spatial Co-Occurrence Relationship Shapes Spatial Comfort
Further analysis shows that the Spatial Comfort of streets is not determined by a single factor, but is jointly driven by the WBVI, the SVF, and the GVI with a significant synergistic effect. These three indices form a tight NPT in the network of Pearson correlation and collectively constitute the basis of the ecological comfort of streets. The influence of these indicators can be further interpreted through their physical effects on the visual environment. For instance, the SVF acts as a proxy for daylight availability; a moderate opening allows sufficient natural light to illuminate the street, avoiding the oppressiveness of a canyon-like feel while maintaining spatial definition. Similarly, the strong impact of the WBVI is attributed not only to the color itself but also to the optical properties of water. Water surfaces enhance perception through dynamic light reflection and luminance contrast, creating visual focal points that enliven the streetscape. This optical and spatial synergy acquires particular significance in places with a history of springs. In such contexts, the aesthetic value of water extends beyond its ecological regulatory functions to encompass cultural identity and sensory delight.
Consequently, simply adopting generic “greening” strategies is insufficient to optimize street comfort. Instead, a careful combination of “water-green” elements and spatial organization is essential to create micro-environments with local characteristics that satisfy both the physiological mechanisms of visual comfort and the psychological needs of modern people.
4.2. Street Design Strategies for the Jinan Mingfu City Area
Based on the above findings, this study proposes a SPOM aimed at providing scientific guidance for the differentiated revitalization of the Mingfu City area and similar spring heritage sites. The matrix uses “commercial revitalization vs. heritage conservation” as the horizontal axis and “Spatial Comfort vs. Street Vitality” as the vertical axis, with the WBVI serving as the core regulatory variable. The proposed strategies, particularly the enhancement of the NPT, directly contribute to SDG 3 (Good Health and Well-being) by creating restorative environments that alleviate psychological stress. In this matrix, GVI and WBVI constitute the two pillars, exhibiting significant synergistic effects. This indicates that, in spring heritage sites, the visual presentation of water bodies itself constitutes an independent form of comfort capital, whose value transcends ecological functions and directly relates to cultural identity and sensory pleasure.
Based on the clustering results in Section 3.3, the six street categories were reclassified using comfort and vitality as criteria. Comfort was defined as the sum of WBVI, GVI, and SVF; vitality was defined as the average of CCI, BRI, and SFI. The classification results are shown in Table 6, and the distribution of each indicator is shown in the photography (Figure 15), with Quadrant I representing the ideal street environment.
Table 6.
Street Quadrant Classification.
Figure 15.
Street Perception Optimization Matrix. (I) Ideal Spring—City Living Scene; (II) Historic Cultural Quiet Zone; (III) Traffic and Regeneration Zone; (IV) Modern Commercial Dynamic Zone.
The validity of the SPOM framework is demonstrated by its ability to successfully map all six empirically derived street typologies (from Section 3.3) onto its four strategic quadrants, thereby translating complex data into actionable design logic. This direct linkage between empirical classification and strategic prescription confirms its practical effectiveness as a planning and design tool. Based on the above quadrant classification and the synergistic relationship between WBVI and GVI, this study proposes three differentiated design strategies for the Spring Zone:
- Focused on “channeling springs into lanes,” the design incorporates micro-spring landscapes and resting nodes.
For the historical and cultural tranquil zone (Quadrant II), the core emphasis of design should go beyond mere static preservation and stylistic control. Priority should be given to the activation of spatial perceptual layers through the integration of immersive resting nodes via the coordinated layout of water features and greenery. A low-disturbance atmosphere must be maintained throughout the entire design process [60]. For the landscape construction of this zone, more targeted design interventions can be adopted. At key vantage points—including street corners and courtyard entrances—micro-artesian spring installations or bluestone spring pools can be arranged with strategic layout planning. These installations can be paired with traditional framing elements such as window lattices and tracery windows, creating a sequential spatial experience of “framing the view, drawing the eye inward, and inviting pause.” This design approach fully respects the tranquility of the heritage entity while also avoiding the pitfalls of vacant preservation. In this way, sustainable vitality can be deeply infused into the street space.
- 2.
- The “blue-green thread” strategy aims to incorporate micro-spring landscapes at a low cost.
Substantial quality improvement through the principle of “small interventions yielding substantial gains” should be set as the core design focus for the traffic and renewal-pending zone (Quadrant III). This target can be achieved by embedding targeted micro-landscape designs and elevating the visual comfort threshold, all with limited financial investment. Appropriately scaled micro-spring features should be systematically introduced into urban “grey spaces”. These spaces include road medians, under-bridge areas, and long-neglected corner plots. Such design interventions are characterized by low cost and high implementation efficiency. They can swiftly alleviate the existing visual monotony and ecological degradation in street sections. Meanwhile, these interventions provide essential environmental support for subsequent functional revitalization of the zone, and effectively address the development challenges faced at the current stage.
- 3.
- Use “translation of spring imagery” as a means to soften hard surfaces and balance the hustle and bustle of commercial activity.
For modern commercial districts (IV), the core design priority should be assigned to two key tasks in high-intensity usage areas: integrating WBVI elements and softening hard surfaces. This design aims to strike a balance between bustling commercial atmospheres and the sensory load placed on pedestrians. In high-contact areas, including outdoor dining zones, pedestrian walkways, and plaza paving, a “water feature + greenery” design combination can be adopted. Meanwhile, small misting fountains or mirrored water feature walls can be installed at storefront setbacks, so as to form dynamic visual buffer zones for street spaces. These “soft intervention” measures can effectively mitigate the urban heat island effect and relieve visual fatigue. They allow high-vitality streets to develop into “warm and memorable” high-quality public spaces, with the commercial efficiency of the streets fully preserved throughout the process.
4.3. Limitations and Opportunities for Future Research
4.3.1. Limitations in Data Collection Time and Perspective
Baidu Street View data is adopted as the core data source for this study, and this dataset presents inherent limitations in both temporal and spatial dimensions. For one thing, SVIs are mainly captured within specific time windows on fixed dates. While this shooting arrangement ensures consistent lighting conditions, it cannot reflect the impacts of different seasons, weather conditions, and diurnal variations on the aesthetic perception of streets. Although our data collection was restricted to October–November 2025 (9:00–15:00) to control for season and time of day, we did not explicitly exclude or balance images based on specific weather conditions (e.g., sunny, cloudy, or overcast) or shadow intensity. This oversight may introduce bias into the calculation of key aesthetic indicators. For instance, cloudy conditions can reduce color saturation, potentially leading to underestimation of GVI and WBVI by the semantic segmentation model; strong shadows or backlighting can obscure details, affecting the accuracy of CCI and MLI; and low sky-ground contrast on overcast days can impair SVF calculation. For another, clear constraints are brought by the vehicle-mounted image collection method. The perspective of SVIs is predominantly centered on the road centerline, which leads to insufficient coverage of sidewalk details, backstreets, and high-rise facades. Meanwhile, the images are highly susceptible to interference from temporary obstructions. All these factors may affect the identification accuracy of key metrics, including the GVI. To address these limitations, field surveys or multi-source image fusion can be integrated in subsequent research, so as to enhance the representativeness of the research data.
4.3.2. Subjectivity and Cultural Universality of Aesthetic Evaluation Models
It must be acknowledged that our labeled dataset (n = 258) is relatively small, which inevitably raises concerns about model robustness and generalizability. Furthermore, the absence of a comparative analysis with alternative model architectures makes it challenging to fully assess the relative strength of the reported performance. Regarding the sensitivity of the results to the specific training sample, we adopted a strict data partitioning protocol (70% training, 10% validation, and 20% hold-out test) to minimize overfitting and ensure that performance metrics reflect the model’s ability to generalize to unseen data within this specific context. Additionally, the training labels were aggregated from 200 volunteers with diverse backgrounds (including local/non-local and professional/non-professional groups), which helps mitigate the bias that might arise from a homogeneous sample. However, given the sample size, the reported performance metrics and the identified importance of indicators (such as WBVI) should be interpreted with caution. They reflect the aesthetic preferences embedded in this specific group rather than a universal standard. Future work will benefit from larger, multi-city annotated datasets to verify the stability of these findings. For the aesthetic prediction models developed in this study, the sample data adopted for model training are sourced from 200 volunteers. The aesthetic preferences of this group are likely to be significantly shaped by regional cultural factors. Meanwhile, the definition of “beauty” held by this group cannot fully represent the universal perceptions of the wider population. In addition, aesthetic ratings generated by deep learning models including ResNet-101 are essentially an approximation of the preferences embedded in the training dataset. Such models fail to fully capture the unique, deep-seated cultural values inherent in historical and cultural heritage sites.
4.3.3. Simplification of the Street Indicator System
In this study, a comprehensive evaluation system is constructed, which contains four core dimensions. The key indicators are mainly computed based on two-dimensional pixel proportions of SVIs. It does not fully integrate elements of the multisensory experience such as 3D spatial scale, acoustic environments, and odours [61]. In correlation analysis, we have also detected correlations between some of the indicators. However, the existing models are not capable of performing a deep quantitative analysis of the complex non-linear interaction among different design elements.
5. Conclusions
The effectiveness of the evaluation framework has been preliminarily validated in this study, with the Jinan Mingfu City area selected as the core research case. Nevertheless, the inherent limitations of single case study design must be clearly acknowledged. The Jinan Mingfu City area presents unique social, cultural, and natural attributes. For this reason, the applicability of the research findings may be restricted when extended to other regions with vastly different socio-cultural contexts or environmental conditions. For the enhancement of the generalizability of these findings, a wider range of heritage areas should be covered in subsequent research. These selected areas need to represent diverse geographical locations and varying stages of development. Multi-case comparative studies can be carried out to fulfill two key research functions. On one hand, the universality of the proposed method can be systematically assessed. On the other hand, the specific impacts of different landscape types on visual quality indicators can be further clarified.
This study offers direct practical value for stakeholders managing heritage areas. For urban planners and local authorities, the SPOM provides a clear, data-driven tool to implement targeted renewal strategies, balancing tourism and conservation. For conservation practitioners, our finding that WBVI is the strongest aesthetic predictor (β = 0.419) quantitatively validates “spring water” as the core cultural asset, guiding efforts to enhance its visual integration. Broadly, this work contributes to urban design by linking objective qualities to perception, to heritage conservation by quantifying culturally specific elements, and to smart-city planning by offering an AI-driven, context-sensitive tool. Ultimately, by balancing heritage conservation with urban renewal, this research offers practical implications for building inclusive and sustainable human settlements in line with the 2030 Agenda for Sustainable Development.
Author Contributions
L.C.: Resources, Conceptualization, Methodology, Formal Analysis, and Writing—Original Draft. L.L.: Software, Data Curation, Visualization, Investigation, and Writing—Original Draft. Z.L.: Methodology, Visualization, Review, Editing and Funding acquisition. All authors have read and agreed to the published version of the manuscript.
Funding
This research was funded by Youth Innovation Team Program for Higher Education of Shandong Province, grant number 2023KJ325, Shandong Province Key Art Project, grant number ZD202008273, and Shandong Provincial Fund of Key Advantageous Discipline (Architecture).
Data Availability Statement
The original contributions presented in this study are included in the article. Further inquiries can be directed to the corresponding author.
Conflicts of Interest
The authors declare that they have no known competing financial interests or personal relationships that could have appeared to influence the work reported in this paper.
Abbreviations
The following abbreviations are used in this manuscript:
| SVIs | Street View Images |
| NPT | Natural Perception Triangle |
| SPOM | Street Perception Optimization Matrix |
| SHAP | SHapley Additive exPlanations |
| WFI | Walkability Feasibility Index |
| MLI | Motorization Level Index |
| CCI | Crowd Concentration Index |
| SEI | Spatial Enclosure Index |
| GVI | Green View Index |
| WBVI | Water Blue View Index |
| SVF | Sky View Factor |
| SFI | Service Facility Index |
| BRI | Bottom Retail Index |
References
- Cao, Z.; Mustafa, M.; Isa, M.H.M. Balancing priorities: An importance-performance analysis of architectural heritage protection in China’s historical cities. Front. Archit. Res. 2025, 14, 928–945. [Google Scholar] [CrossRef] [Scilit]
- Xiang, L.; Feng, C.; Liu, Y.; Wang, Y. Space and culture acculturation: Exploring urban regeneration in historic conservation areas, Yangmeizhu Street in Beijing, China. Front. Archit. Res. 2025, 14, 1274–1290. [Google Scholar] [CrossRef] [Scilit]
- Huang, Y.; Zhang, F.; Wu, L.; Liu, Y. Measuring urban physical environments using image deep features. Cities 2025, 166, 106196. [Google Scholar] [CrossRef] [Scilit]
- Liu, Y.; Li, Z.; Tian, Y.; Gao, B.; Wang, S.; Qi, Y.; Zou, Z.; Li, X.; Wang, R. A Study on Identifying the Spatial Characteristic Factors of Traditional Streets Based on Visitor Perception: Yuanjia Village, Shaanxi Province. Buildings 2024, 14, 1815. [Google Scholar] [CrossRef] [Scilit]
- Long, Y.; Ye, Y. Human-Scale Urban Form: Measurements, Performances, and Urban Planning & Design Interventions. South China Archit. 2016, 41–47. [Google Scholar] [CrossRef]
- Hu, H.W. A Study on Tourism Development of Furong District in JINAN Based on Image Theory. Master’s Thesis, East China Normal University, Shanghai, China, 2011. [Google Scholar]
- Tian, Z.N. Research on the Participation of Multiple Stakeholders in the Renewal of Historical and Cultural Districts: A Case Study of the Jinan Mingfu City Area. Master’s Thesis, Shandong University, Jinan, China, 2023. [Google Scholar] [CrossRef]
- Ali, S.; Xu, H.; Ahmed, W.; Ahmad, N.; Solangi, Y.A. Metro design and heritage sustainability: Conflict analysis using attitude based on options in the graph model. Environ. Dev. Sustain. 2020, 22, 3839–3860. [Google Scholar] [CrossRef] [Scilit]
- Qi, Z.Y.; Li, J.Y.; He, Z. The Influence of Urban Streetscape Color on Tourists’ Emotional Perception Based on Streetscape Images. J. Geo-Inf. Sci. 2024, 26, 514–529. [Google Scholar]
- Liang, X.; Zhao, T.; Biljecki, F. Revealing spatio-temporal evolution of urban visual environments with street view imagery. Landsc. Urban Plan. 2023, 237, 104802. [Google Scholar] [CrossRef] [Scilit]
- Ewing, R.; Handy, S. Measuring the Unmeasurable: Urban Design Qualities Related to Walkability. J. Urban Des. 2009, 14, 65–84. [Google Scholar] [CrossRef] [Scilit]
- Ki, D.; Chen, Z.; Lee, S.; Lieu, S. A novel walkability index using google street view and deep learning. Sustain. Cities Soc. 2023, 99, 104896. [Google Scholar] [CrossRef] [Scilit]
- Qiu, W.; Li, W.; Liu, X.; Zhang, Z.; Li, X.; Huang, X. Subjective and objective measures of streetscape perceptions: Relationships with property value in Shanghai. Cities 2023, 132, 104037. [Google Scholar] [CrossRef] [Scilit]
- Li, W.; Sun, R.; He, H.; Yan, M.; Chen, L. Perceptible landscape patterns reveal invisible socioeconomic profiles of cities. Sci. Bull. 2024, 69, 3291–3302. [Google Scholar] [CrossRef] [Scilit] [PubMed]
- Wei, Z.; Cao, K.; Kwan, M.-P.; Jiang, Y.; Feng, Q. Measuring the age-friendliness of streets’ walking environment using multi-source big data: A case study in Shanghai, China. Cities 2024, 148, 104829. [Google Scholar] [CrossRef] [Scilit]
- Zhang, F.; Zhang, D.; Liu, Y.; Lin, H. Representing place locales using scene elements. Comput. Environ. Urban Syst. 2018, 71, 153–164. [Google Scholar] [CrossRef] [Scilit]
- Liu, R.; Neisch, P. Measuring the effectiveness of street renewal design: Insights from visual preference surveys, deep-learning technology, and eye-tracking simulation software. Landsc. Urban Plan. 2025, 256, 105291. [Google Scholar] [CrossRef] [Scilit]
- Hosany, S.; Gilbert, D. Measuring tourists’ emotional experiences toward hedonic holiday destinations. J. Travel Res. 2010, 49, 513–526. [Google Scholar] [CrossRef] [Scilit]
- Qi, Z.; Li, J.; Yang, X.; He, Z. How streetscape shapes affect visitor emotions: An experimental analysis based on large-scale street view images in Xi’an, China. Cities 2026, 168, 106424. [Google Scholar] [CrossRef] [Scilit]
- Zhang, F.; Salazar-Miranda, A.; Duarte, F.; Vale, L.; Hack, G.; Chen, M.; Liu, Y.; Batty, M.; Ratti, C. Urban visual intelligence: Studying cities with artificial intelligence and street-level imagery. Ann. Am. Assoc. Geogr. 2024, 114, 876–897. [Google Scholar] [CrossRef] [Scilit]
- Wang, R.; Yuan, Y.; Liu, Y.; Zhang, J.; Liu, P.; Lu, Y.; Yao, Y. Using street view data and machine learning to assess how perception of neighborhood safety influences urban residents’ mental health. Health Place 2019, 59, 102186. [Google Scholar] [CrossRef] [Scilit] [PubMed]
- Naik, N.; Philipoom, J.; Raskar, R.; Hidalgo, C. Streetscore-predicting the perceived safety of one million streetscapes. In Proceedings of the IEEE Conference on Computer Vision and Pattern Recognition Workshops; IEEE: New York, NY, USA, 2014; pp. 779–785. [Google Scholar] [CrossRef] [Scilit]
- Yao, Y.; Liang, Z.; Yuan, Z.; Liu, P.; Bie, Y.; Zhang, J.; Wang, R.; Wang, J.; Guan, Q. A human-machine adversarial scoring framework for urban perception assessment using street-view images. Int. J. Geogr. Inf. Sci. 2019, 33, 2363–2384. [Google Scholar] [CrossRef] [Scilit]
- Ordonez, V.; Berg, T.L. Learning high-level judgments of urban perception. In Proceedings of the European Conference on Computer Vision; Springer: Cham, Switzerland, 2014; pp. 494–510. [Google Scholar]
- Porzi, L.; Rota Bulò, S.; Lepri, B.; Ricci, E. Predicting and understanding urban perception with convolutional neural networks. In Proceedings of the 23rd ACM International Conference on Multimedia; ACM: New York, NY, USA, 2015; pp. 139–148. [Google Scholar] [CrossRef] [Scilit]
- Lin, Q.; Zhou, Y.; Quan, S.J.; Guan, C. Analyzing seasonal and nonlinear built environment-energy dynamics using street view imagery in New York City. Sustain. Cities Soc. 2026, 143, 107325. [Google Scholar] [CrossRef] [Scilit]
- He, K.; Zhang, X.; Ren, S.; Sun, J. Deep residual learning for image recognition. In Proceedings of the IEEE Conference on Computer Vision and Pattern Recognition; IEEE: New York, NY, USA, 2016; pp. 770–778. [Google Scholar] [CrossRef] [Scilit]
- Wang, R.; Jiang, W.; Lu, T. Landscape characteristics of university campus in relation to aesthetic quality and recreational preference. Urban For. Urban Green. 2021, 66, 127389. [Google Scholar] [CrossRef] [Scilit]
- Gauriat, C.-M.; Pencolé, Y.; Ribot, P.; Brouillet, G. On a Method to Measure Supervised Multiclass Model’s Interpretability: Application to Degradation Diagnosis (Short Paper). In Proceedings of the 35th International Conference on Principles of Diagnosis and Resilient Systems (DX 2024); Schloss Dagstuhl—Leibniz-Zentrum für Informatik: Wadern, Germany, 2024; pp. 27:1–27:14. [Google Scholar] [CrossRef]
- Huang, J.; Liang, J.; Yang, M.; Li, Y. Visual Preference Analysis and Planning Responses Based on Street View Images: A Case Study of Gulangyu Island, China. Land 2023, 12, 129. [Google Scholar] [CrossRef] [Scilit]
- Qing, Y.; Wu, H.; Qi, K.; Gui, Z.; Liu, Y.; Li, Z.; Li, R. Integrating street-view imagery and points of interest for refining population spatialization: A case study in Wuhan City. Sustain. Cities Soc. 2024, 115, 105883. [Google Scholar] [CrossRef] [Scilit]
- Campbell, A.; Both, A.; Sun, Q.C. Detecting and mapping traffic signs from Google Street View images using deep learning and GIS. Comput. Environ. Urban Syst. 2019, 77, 101350. [Google Scholar] [CrossRef] [Scilit]
- Yue, H.; Xie, H.; Liu, L.; Chen, J. Detecting people on the street and the streetscape physical environment from Baidu street view images and their effects on community-level street crime in a Chinese city. ISPRS Int. J. Geo-Inf. 2022, 11, 151. [Google Scholar] [CrossRef] [Scilit]
- Han, X.; Wang, L.; Seo, S.H.; He, J.; Jung, T. Measuring perceived psychological stress in urban built environments using google street view and deep learning. Front. Public Health 2022, 10, 891736. [Google Scholar] [CrossRef] [Scilit] [PubMed]
- Xu, F.; Jin, A.; Chen, X.; Li, G. New data, integrated methods and multiple applications: A review of urban studies based on street view images. In Proceedings of the 2021 IEEE International Geoscience and Remote Sensing Symposium IGARSS; IEEE: New York, NY, USA, 2021; pp. 6532–6535. [Google Scholar] [CrossRef] [Scilit]
- Verma, D.; Mumm, O.; Carlow, V.M. Assessing visual similarity of neighbourhoods with street view images and deep learning techniques. J. Urban Des. 2024, 30, 520–531. [Google Scholar] [CrossRef] [Scilit]
- Iamtrakul, P.; Le Phuc, T.; Hoang Le Nam, H.; Pham Minh, T.; Kantavat, P.; Raungratanaamporn, I.s. Utilizing street-level imagery for advanced evaluation of active mobility performance: A case study of urban tourism patterns in Phuket, Thailand. City Territ. Archit. 2025, 12, 38. [Google Scholar] [CrossRef] [Scilit]
- He, Y. Study on the Measurement and Quantitative Evaluation of Street Space Quality in Harbin Based on Street View Pictures. Master’s Thesis, Northeast Forestry University, Harbin, China, 2023. [Google Scholar] [CrossRef]
- Yang, Y.R. Evaluation and Optimization of Street Space Quality Based on Street View Image and Machine Learning: A Case Study of the Old City of Guangzhou. Master’s Thesis, South China University of Technology, Guangzhou, China, 2022. [Google Scholar]
- Park, K.; Ergan, S. Quantification of the impact of street design features on restorative quality in urban settings. Sustain. Cities Soc. 2025, 121, 106216. [Google Scholar] [CrossRef] [Scilit]
- Lan, S. Evaluation and Optimization Strategies for Pedestrian Space Quality of Living-Oriented Streets: A Case Study of Coastal Residential Districts in Qingdao. Master’s Thesis, Qingdao University of Technology, Qingdao, China, 2025. [Google Scholar] [CrossRef]
- Chen, L.-C.; Zhu, Y.; Papandreou, G.; Schroff, F.; Adam, H. Encoder-decoder with atrous separable convolution for semantic image segmentation. In Proceedings of the European Conference on Computer Vision (ECCV); Springer: Cham, Switzerland, 2018; pp. 801–818. [Google Scholar] [CrossRef] [Scilit]
- Mahmud, M.N.; Osman, M.K.; Ismail, A.P.; Ahmad, F.; Ahmad, K.A.; Ibrahim, A. Road Image Segmentation using Unmanned Aerial Vehicle Images and DeepLab V3+ Semantic Segmentation Model. In Proceedings of the 2021 11th IEEE International Conference on Control System, Computing and Engineering (ICCSCE), Penang, Malaysia, 27–28 August 2021; pp. 176–181. [Google Scholar] [CrossRef] [Scilit]
- Lei, Y.; Zhou, H.; Xue, L.; Yuan, L.; Liu, Y.; Wang, M.; Wang, C. Evaluating and comparing human perceptions of streets in two megacities by integrating street-view images, deep learning, and space syntax. Buildings 2024, 14, 1847. [Google Scholar] [CrossRef] [Scilit]
- Zhou, B.; Zhao, H.; Puig, X.; Xiao, T.; Fidler, S.; Barriuso, A.; Torralba, A. Semantic understanding of scenes through the ade20k dataset. Int. J. Comput. Vis. 2019, 127, 302–321. [Google Scholar] [CrossRef] [Scilit]
- Xu, J.; Liu, Y.; Liu, Y.; An, R.; Tong, Z. Integrating street view images and deep learning to explore the association between human perceptions of the built environment and cardiovascular disease in older adults. Soc. Sci. Med. 2023, 338, 116304. [Google Scholar] [CrossRef] [Scilit] [PubMed]
- Zhang, T.; Wang, L.; Hu, Y.; Zhang, W.; Liu, Y. Measuring urban green space exposure based on street view images and machine learning. Forests 2024, 15, 655. [Google Scholar] [CrossRef] [Scilit]
- Yuan, Y.; Wang, R.; Niu, T.; Liu, Y. Using street view images and a geographical detector to understand how street-level built environment is associated with urban poverty: A case study in Guangzhou. Appl. Geogr. 2023, 156, 102980. [Google Scholar] [CrossRef] [Scilit]
- Sediqi, K.M.; Lee, H.J. A novel upsampling and context convolution for image semantic segmentation. Sensors 2021, 21, 2170. [Google Scholar] [CrossRef] [Scilit] [PubMed]
- Song, M.; Xiao, Y. Does streetscape color matter for urban perceptions? A deep learning approach to street view images. Land Use Policy 2025, 155, 107581. [Google Scholar] [CrossRef] [Scilit]
- Shabir, A.; Ahmed, K.T.; Kanwal, K.; Mehmood, A.; Abdel Samee, N.; Naseem, M.T.; Ashraf, I. Advanced multilevel feature fusion framework for enhanced image retrieval using convolutional neural network and benchmark datasets. J. Big Data 2025, 12, 240. [Google Scholar] [CrossRef] [Scilit]
- Yang, J.C.; Zhao, C. Survey on K-Means Clustering Algorithm. Comput. Eng. Appl. 2019, 55, 7–14+63. [Google Scholar]
- Wu, S.; Wang, W.; Zhang, C.; Zeng, Q.; Wang, H.; Lin, J.; Li, S. Exploring Multimodal Large Language Models’ Potential in Simulating Human Perception of Urban Cycling Environments: A Street-View Perspective. Inf. Geogr. 2025, 2, 100037. [Google Scholar] [CrossRef] [Scilit]
- Yap, W.; Chang, J.-H.; Biljecki, F. Incorporating networks in semantic understanding of streetscapes: Contextualising active mobility decisions. Environ. Plan. B Urban Anal. City Sci. 2023, 50, 1416–1437. [Google Scholar] [CrossRef] [Scilit]
- Danish, M.; Labib, S.; Ricker, B.; Helbich, M. A citizen science toolkit to collect human perceptions of urban environments using open street view images. Comput. Environ. Urban Syst. 2025, 116, 102207. [Google Scholar] [CrossRef] [Scilit]
- Gao, M.; Zhu, X.; Zhang, Y. Nature and health: Kaplan’s attention restoration theory. In Proceedings of the 2020 Annual Conference of the Chinese Society of Landscape Architecture, Chengdu, China, 21–23 November 2020. [Google Scholar] [CrossRef]
- Xiao, Y.; Tang, Y. Can ChatGPT-4o assess the perceptions of streetscape change? Evidence from Shanghai, China. Sustain. Cities Soc. 2025, 130, 106674. [Google Scholar] [CrossRef] [Scilit]
- Xu, J.; Ye, Z.; Wang, D.; Huang, S.; Liu, Y.; Xiang, Y. Data-Driven Urban Color Governance for Digital City Planning: A Machine Learning-Assisted Framework Using Street View Images in Jiading District, Shanghai. Buildings 2026, 16, 2009. [Google Scholar] [CrossRef] [Scilit]
- Jiang, Y.; Yan, J.; Zhou, H.Z. Research on Route Selection and Design of Urban Slow Corridor in Yichang City Supported by Multi source Data. Chin. Landsc. Archit. 2024, 40, 79–85. [Google Scholar] [CrossRef]
- Qi, X. Jinan Spring Settlements Space Environment and Landscape Design Research. Master’s Thesis, Shandong Jianzhu University, Jinan, China, 2015. [Google Scholar] [CrossRef]
- Zhuang, Y.; Kang, Y.; Fei, T.; Bian, M.; Du, Y. From hearing to seeing: Linking auditory and visual place perceptions with soundscape-to-image generative artificial intelligence. Comput. Environ. Urban Syst. 2024, 110, 102122. [Google Scholar] [CrossRef] [Scilit]
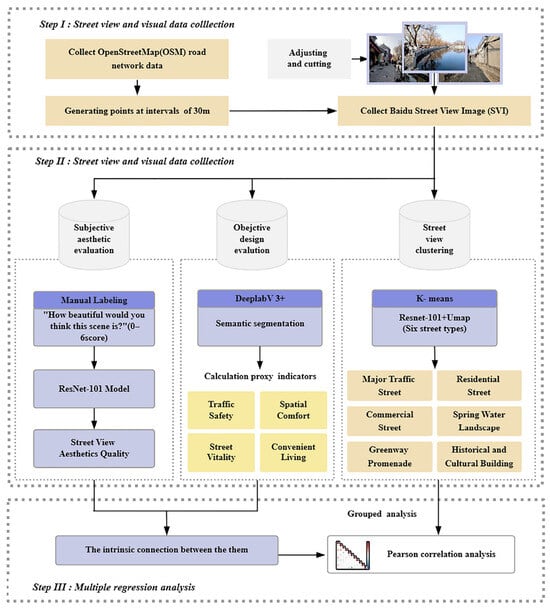
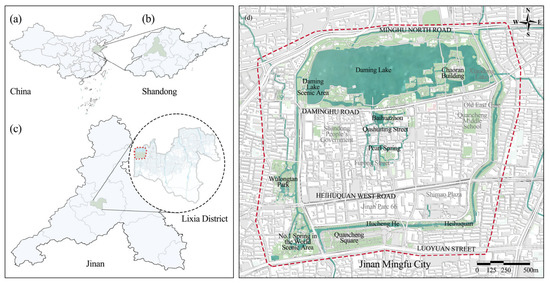
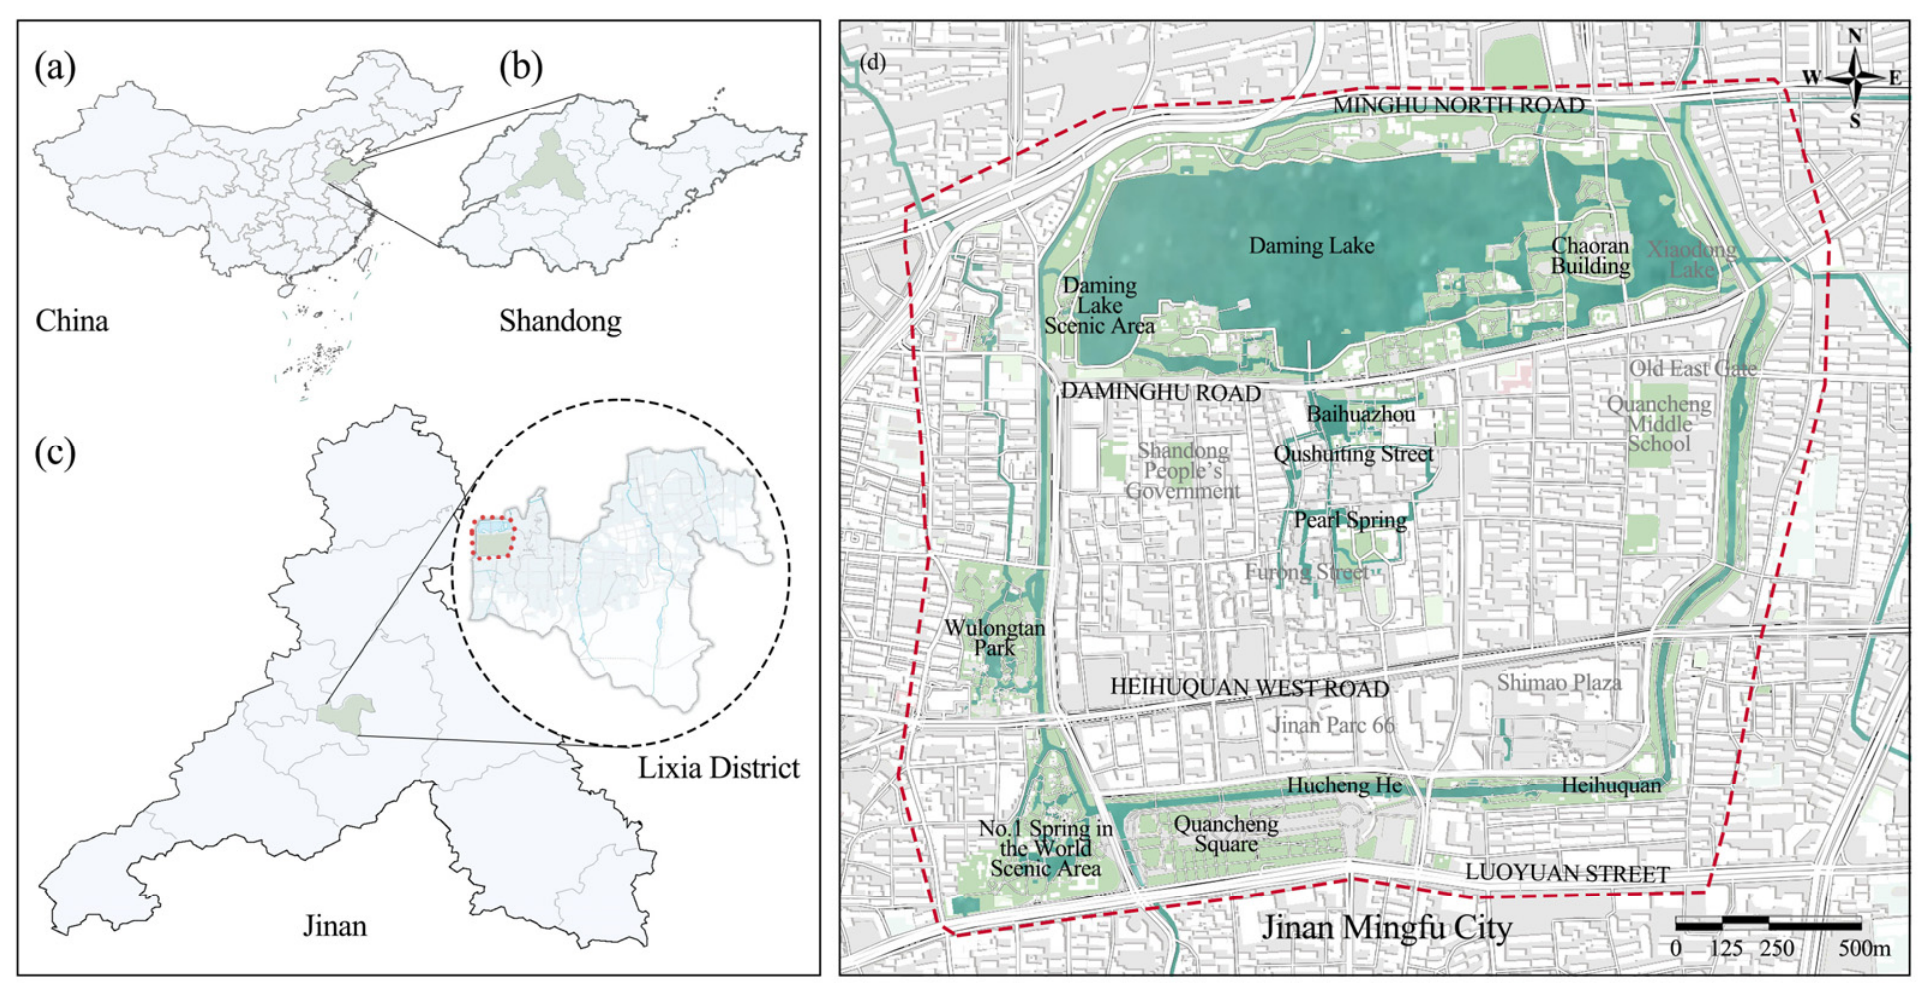
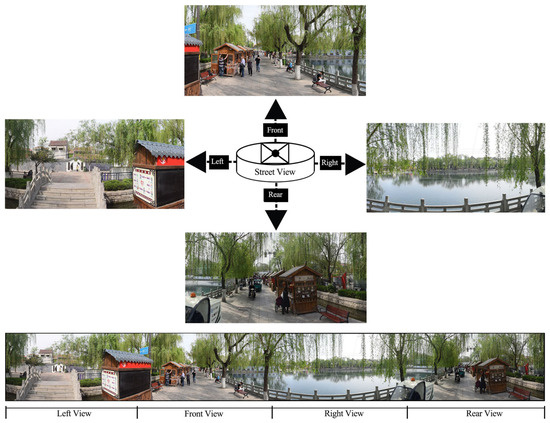
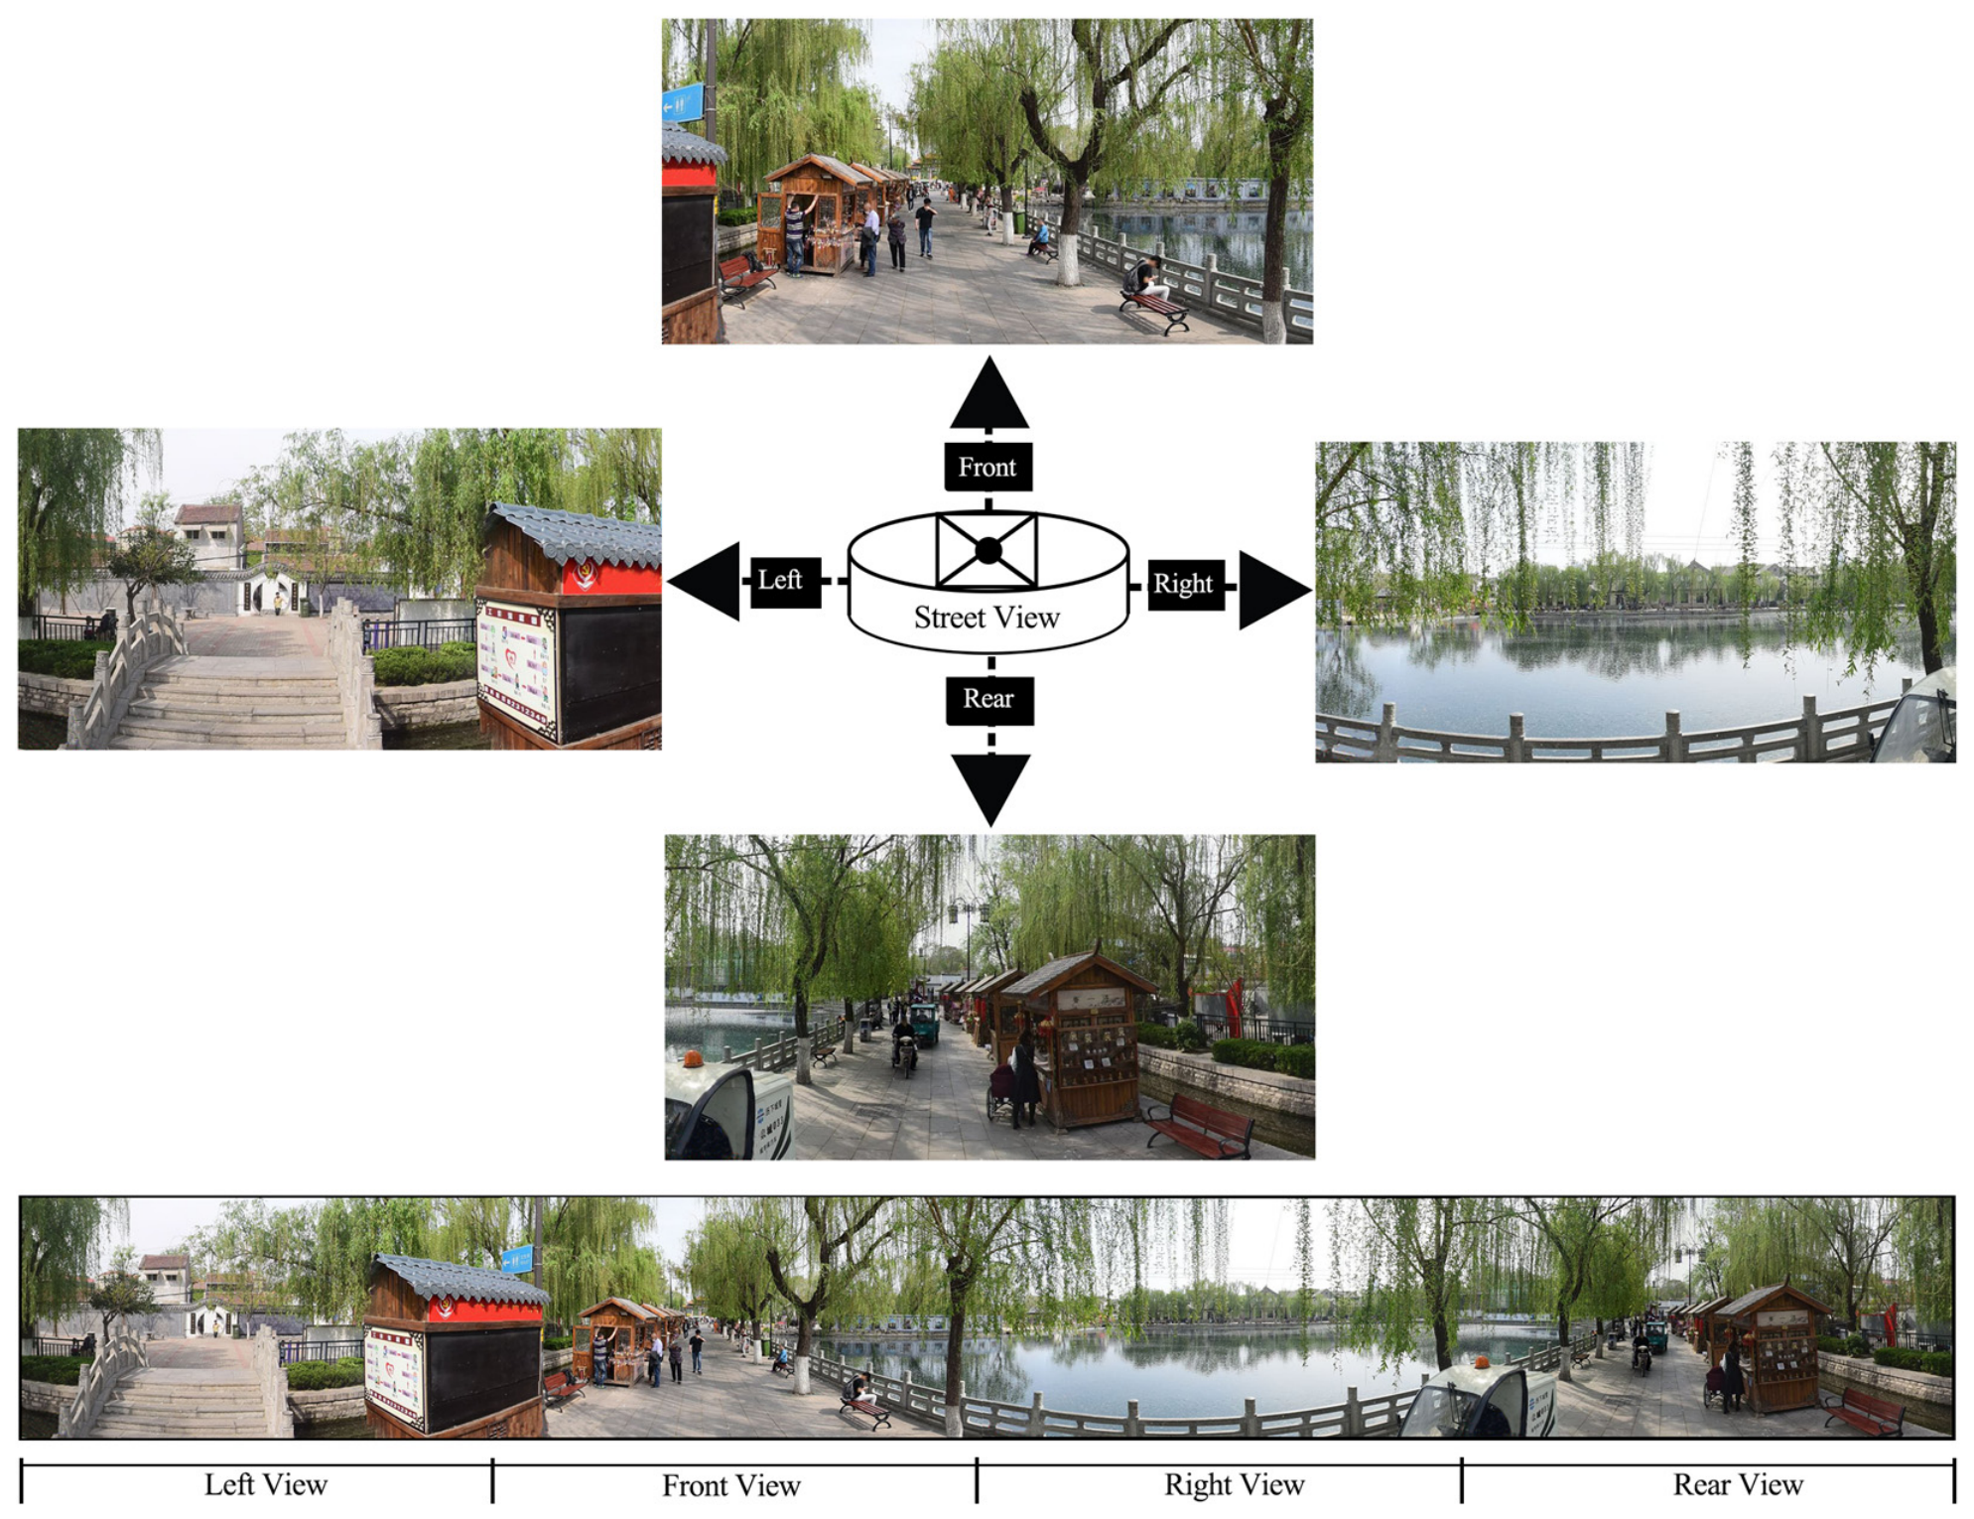
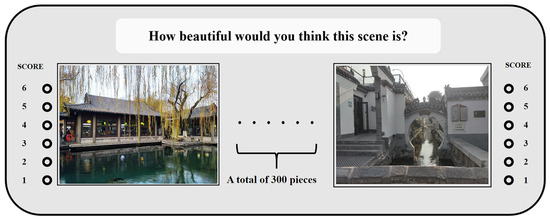
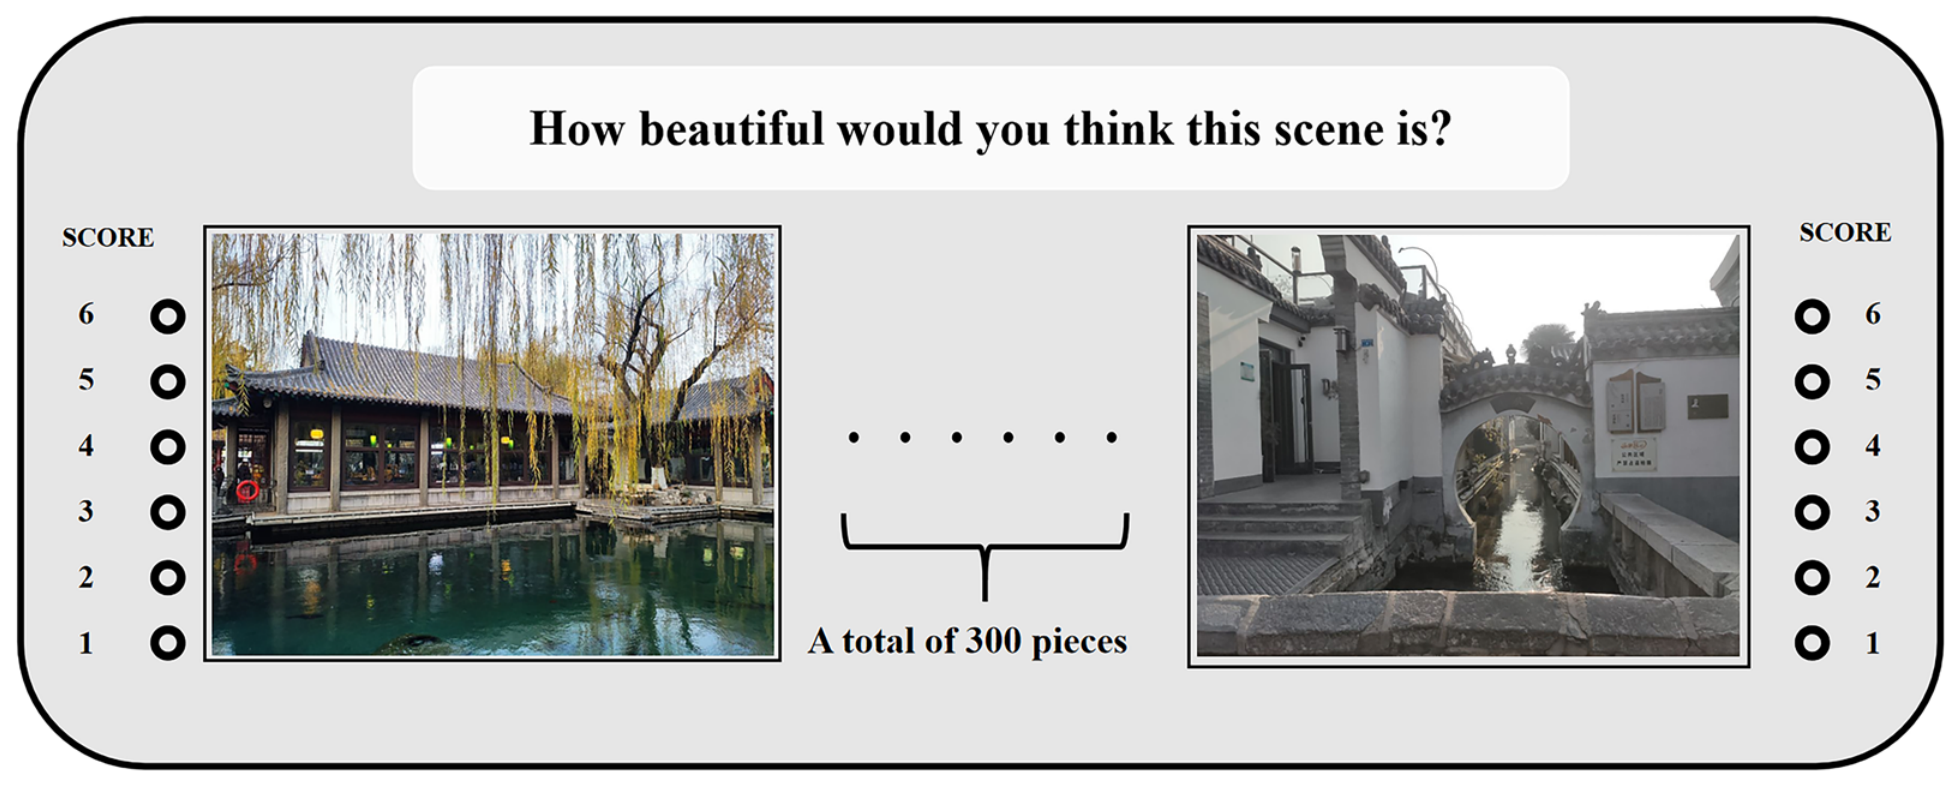
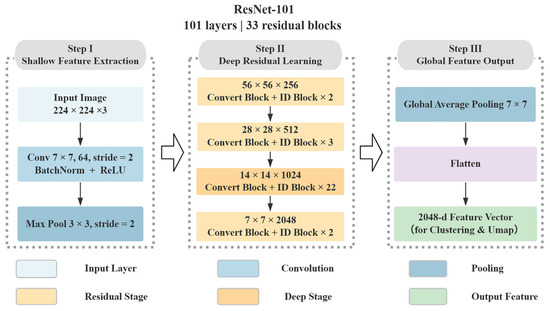
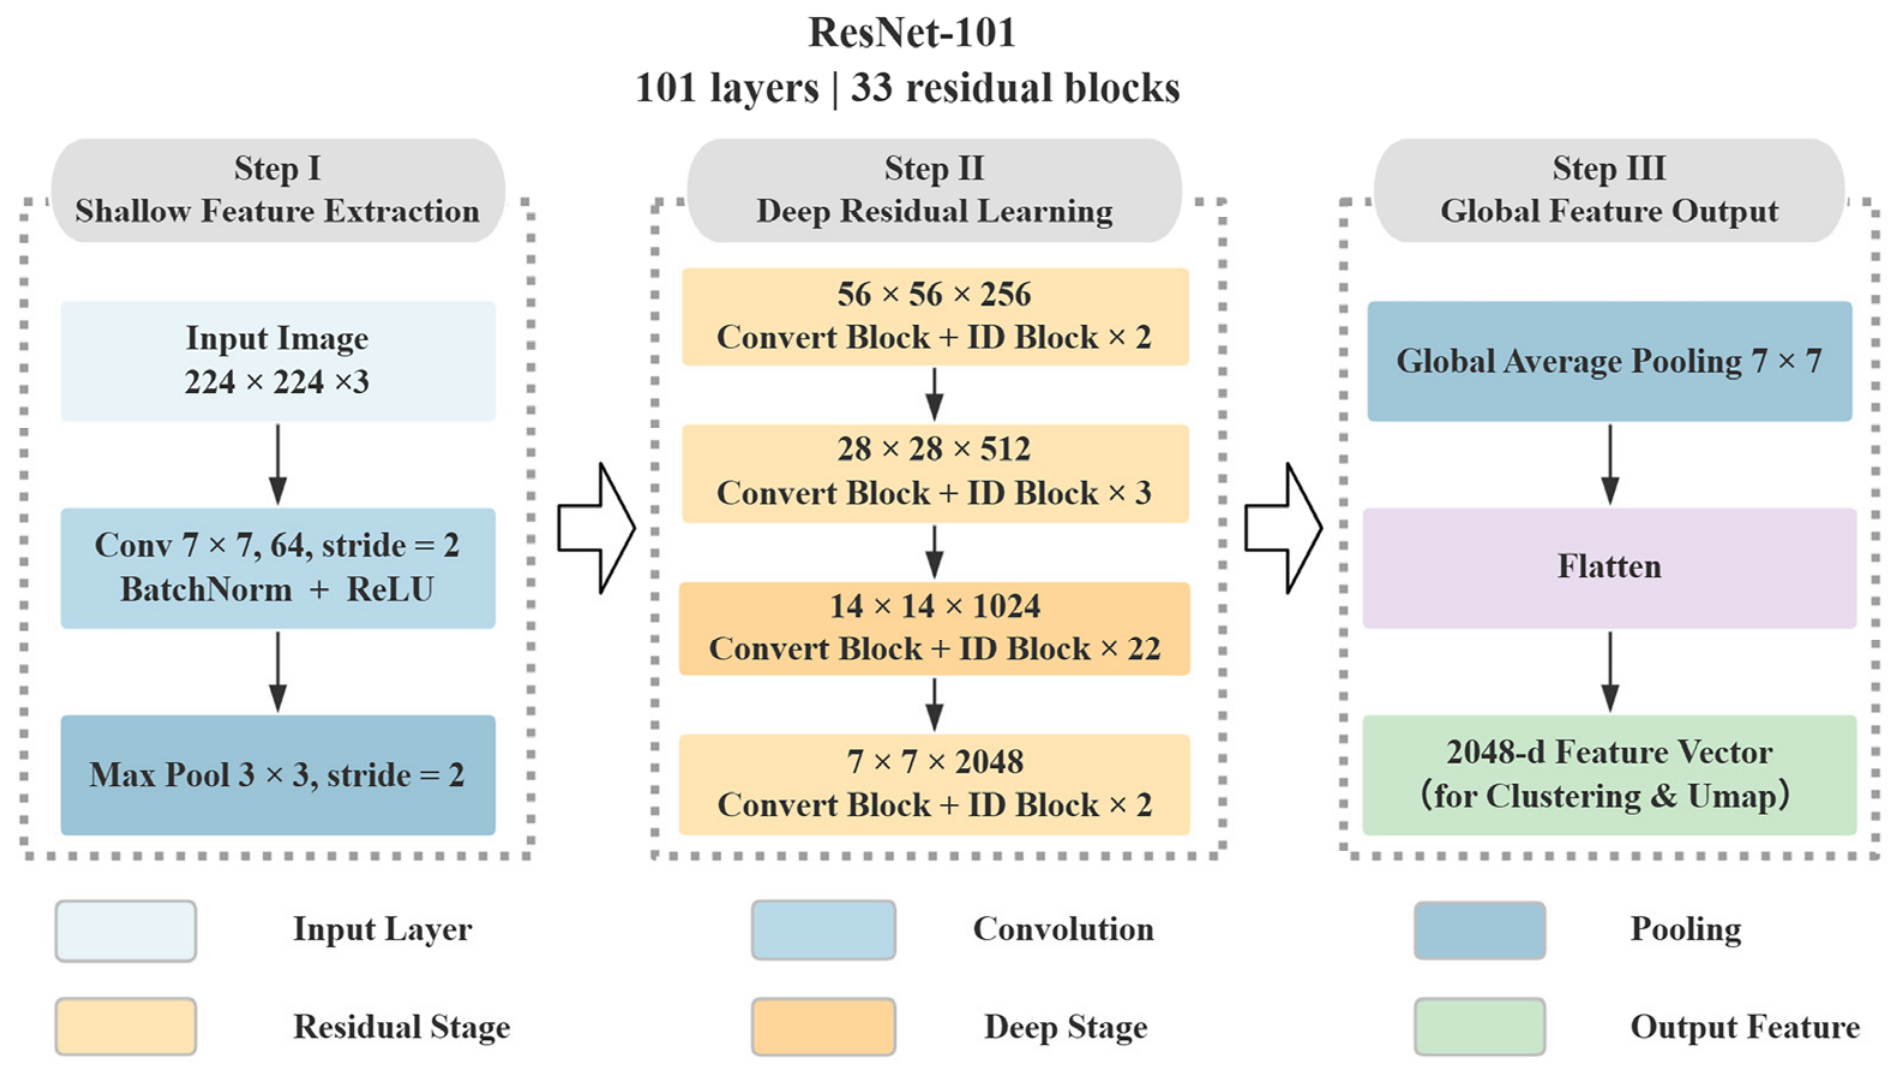
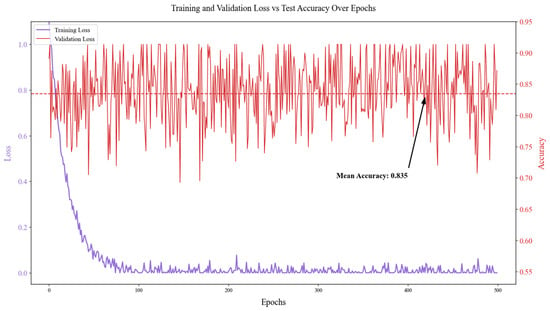
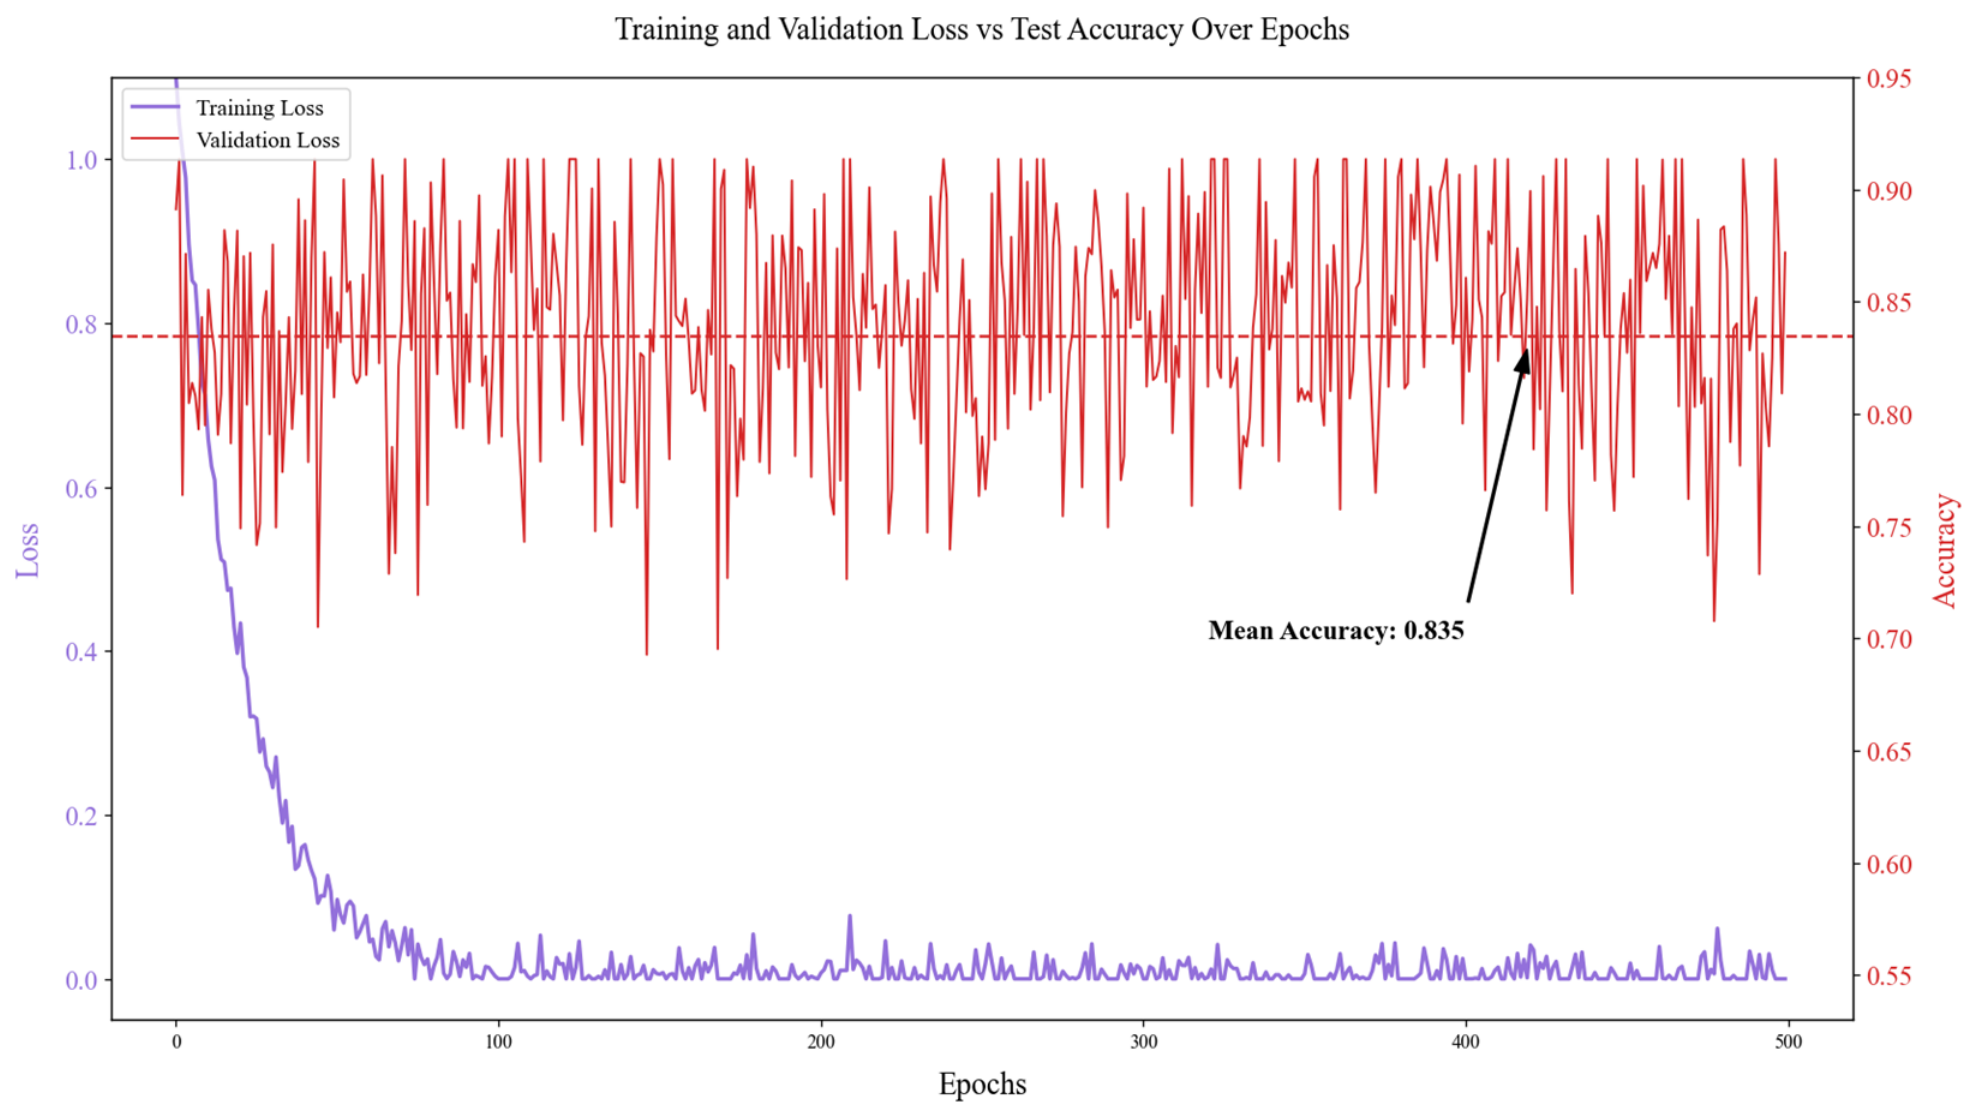
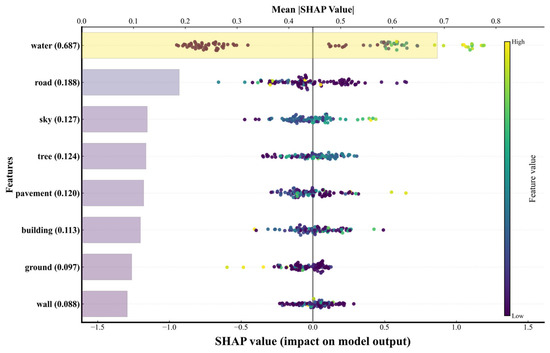
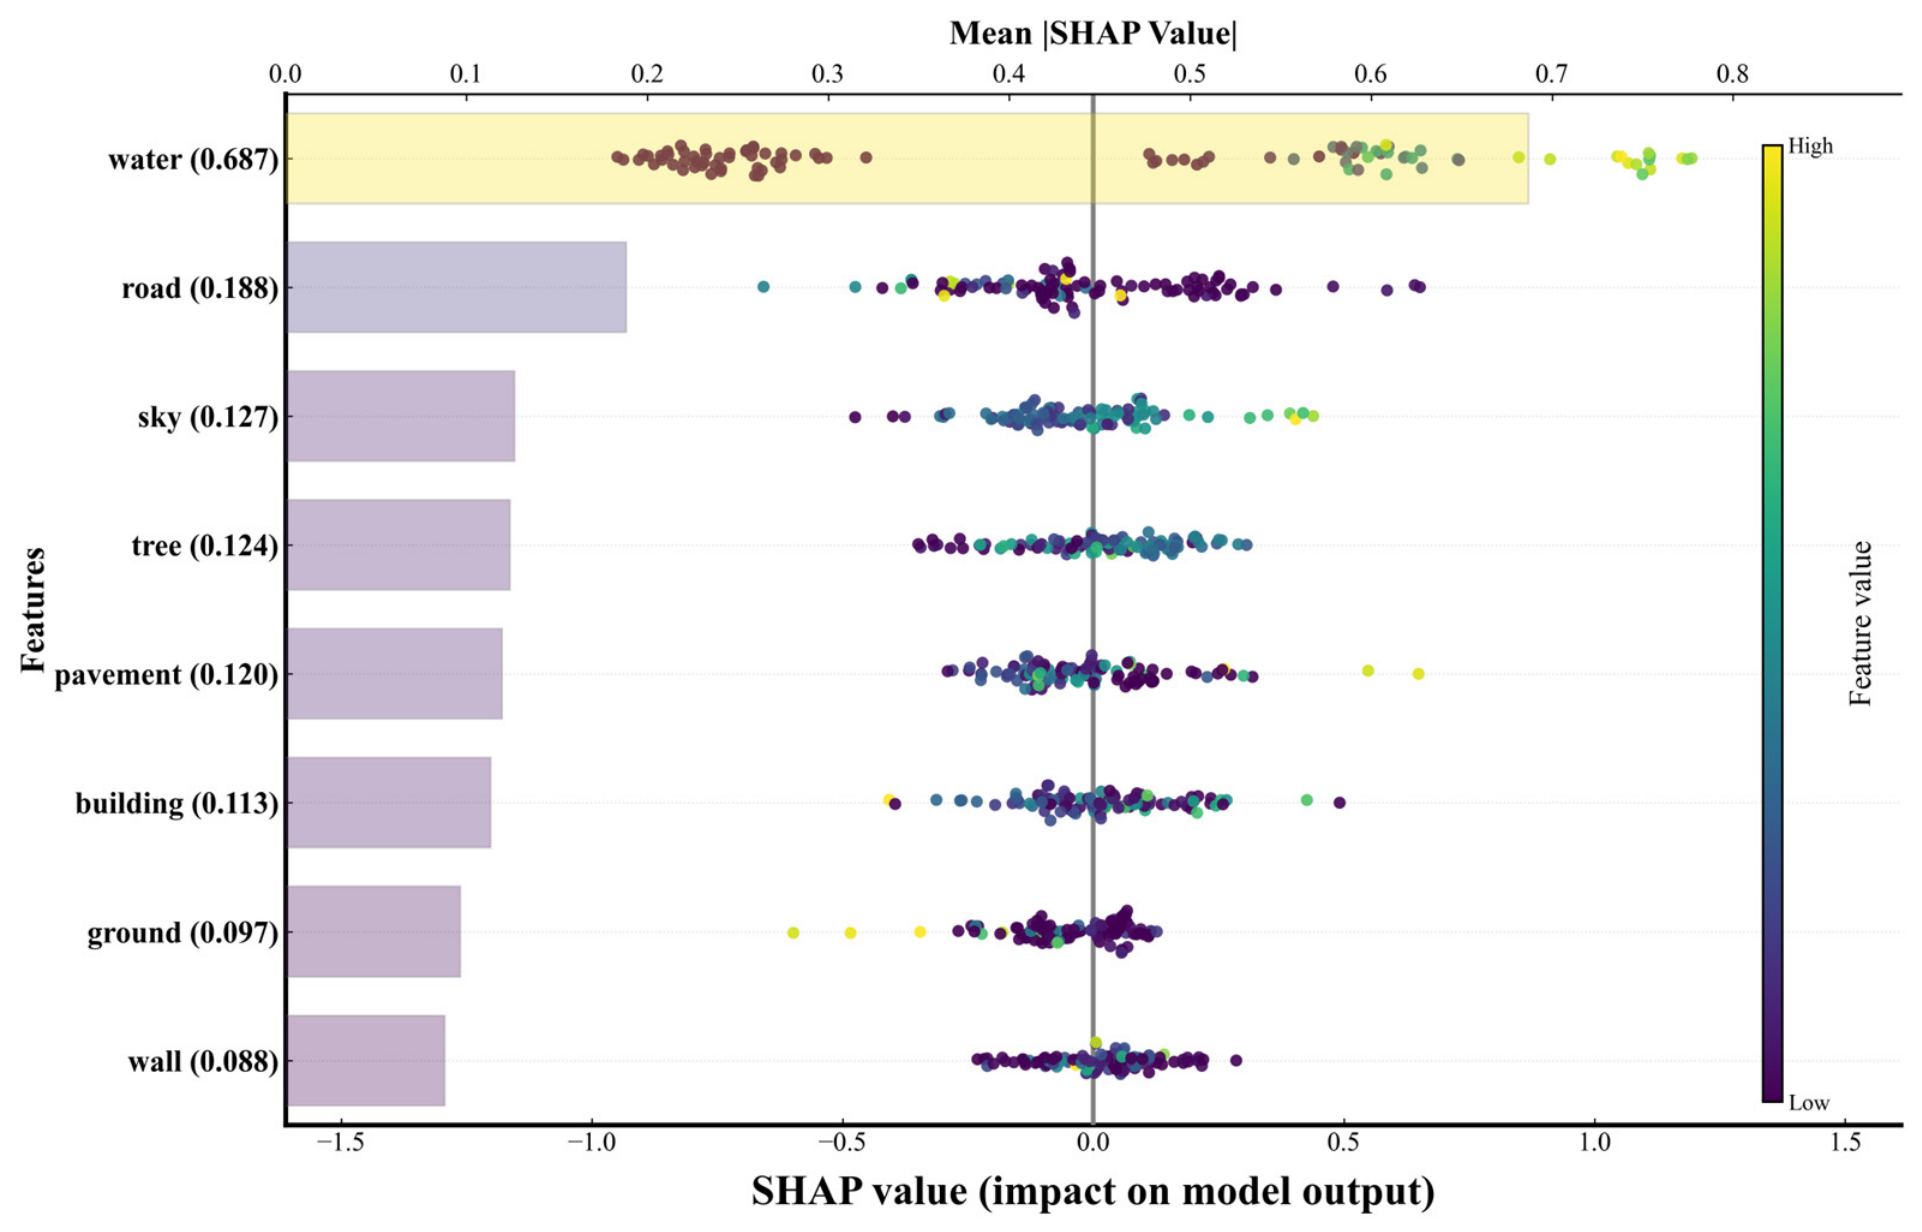
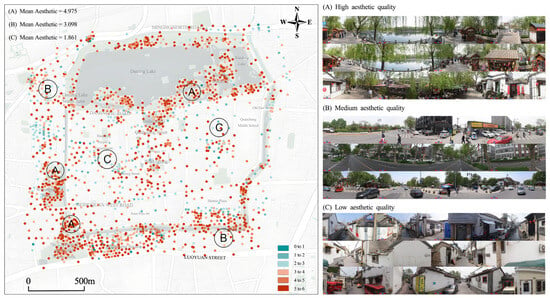
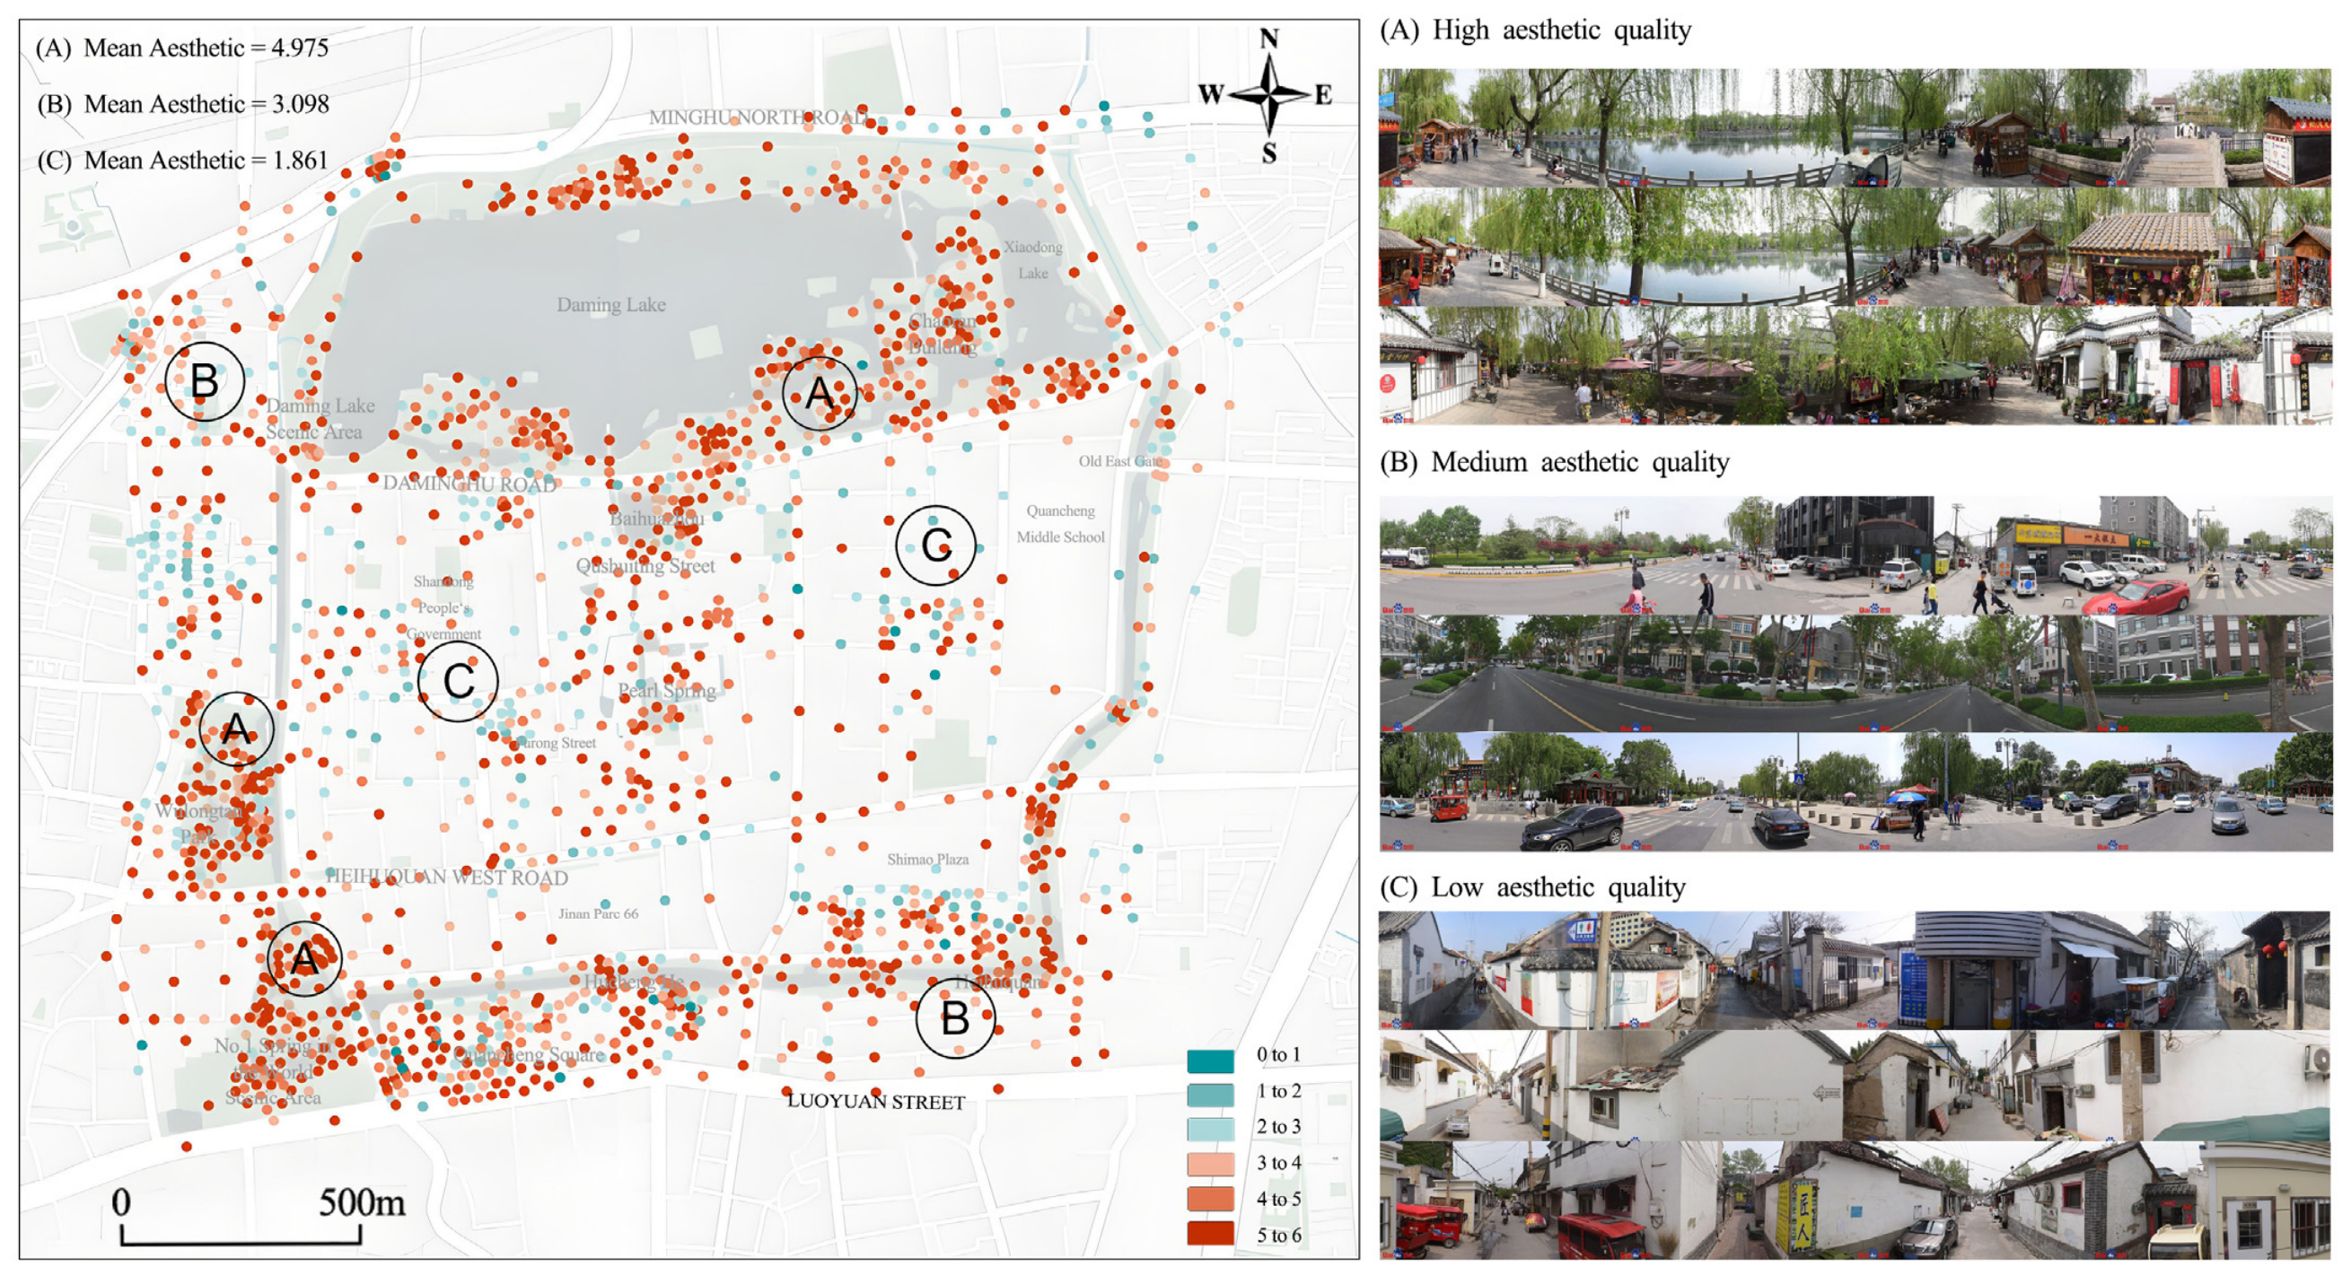
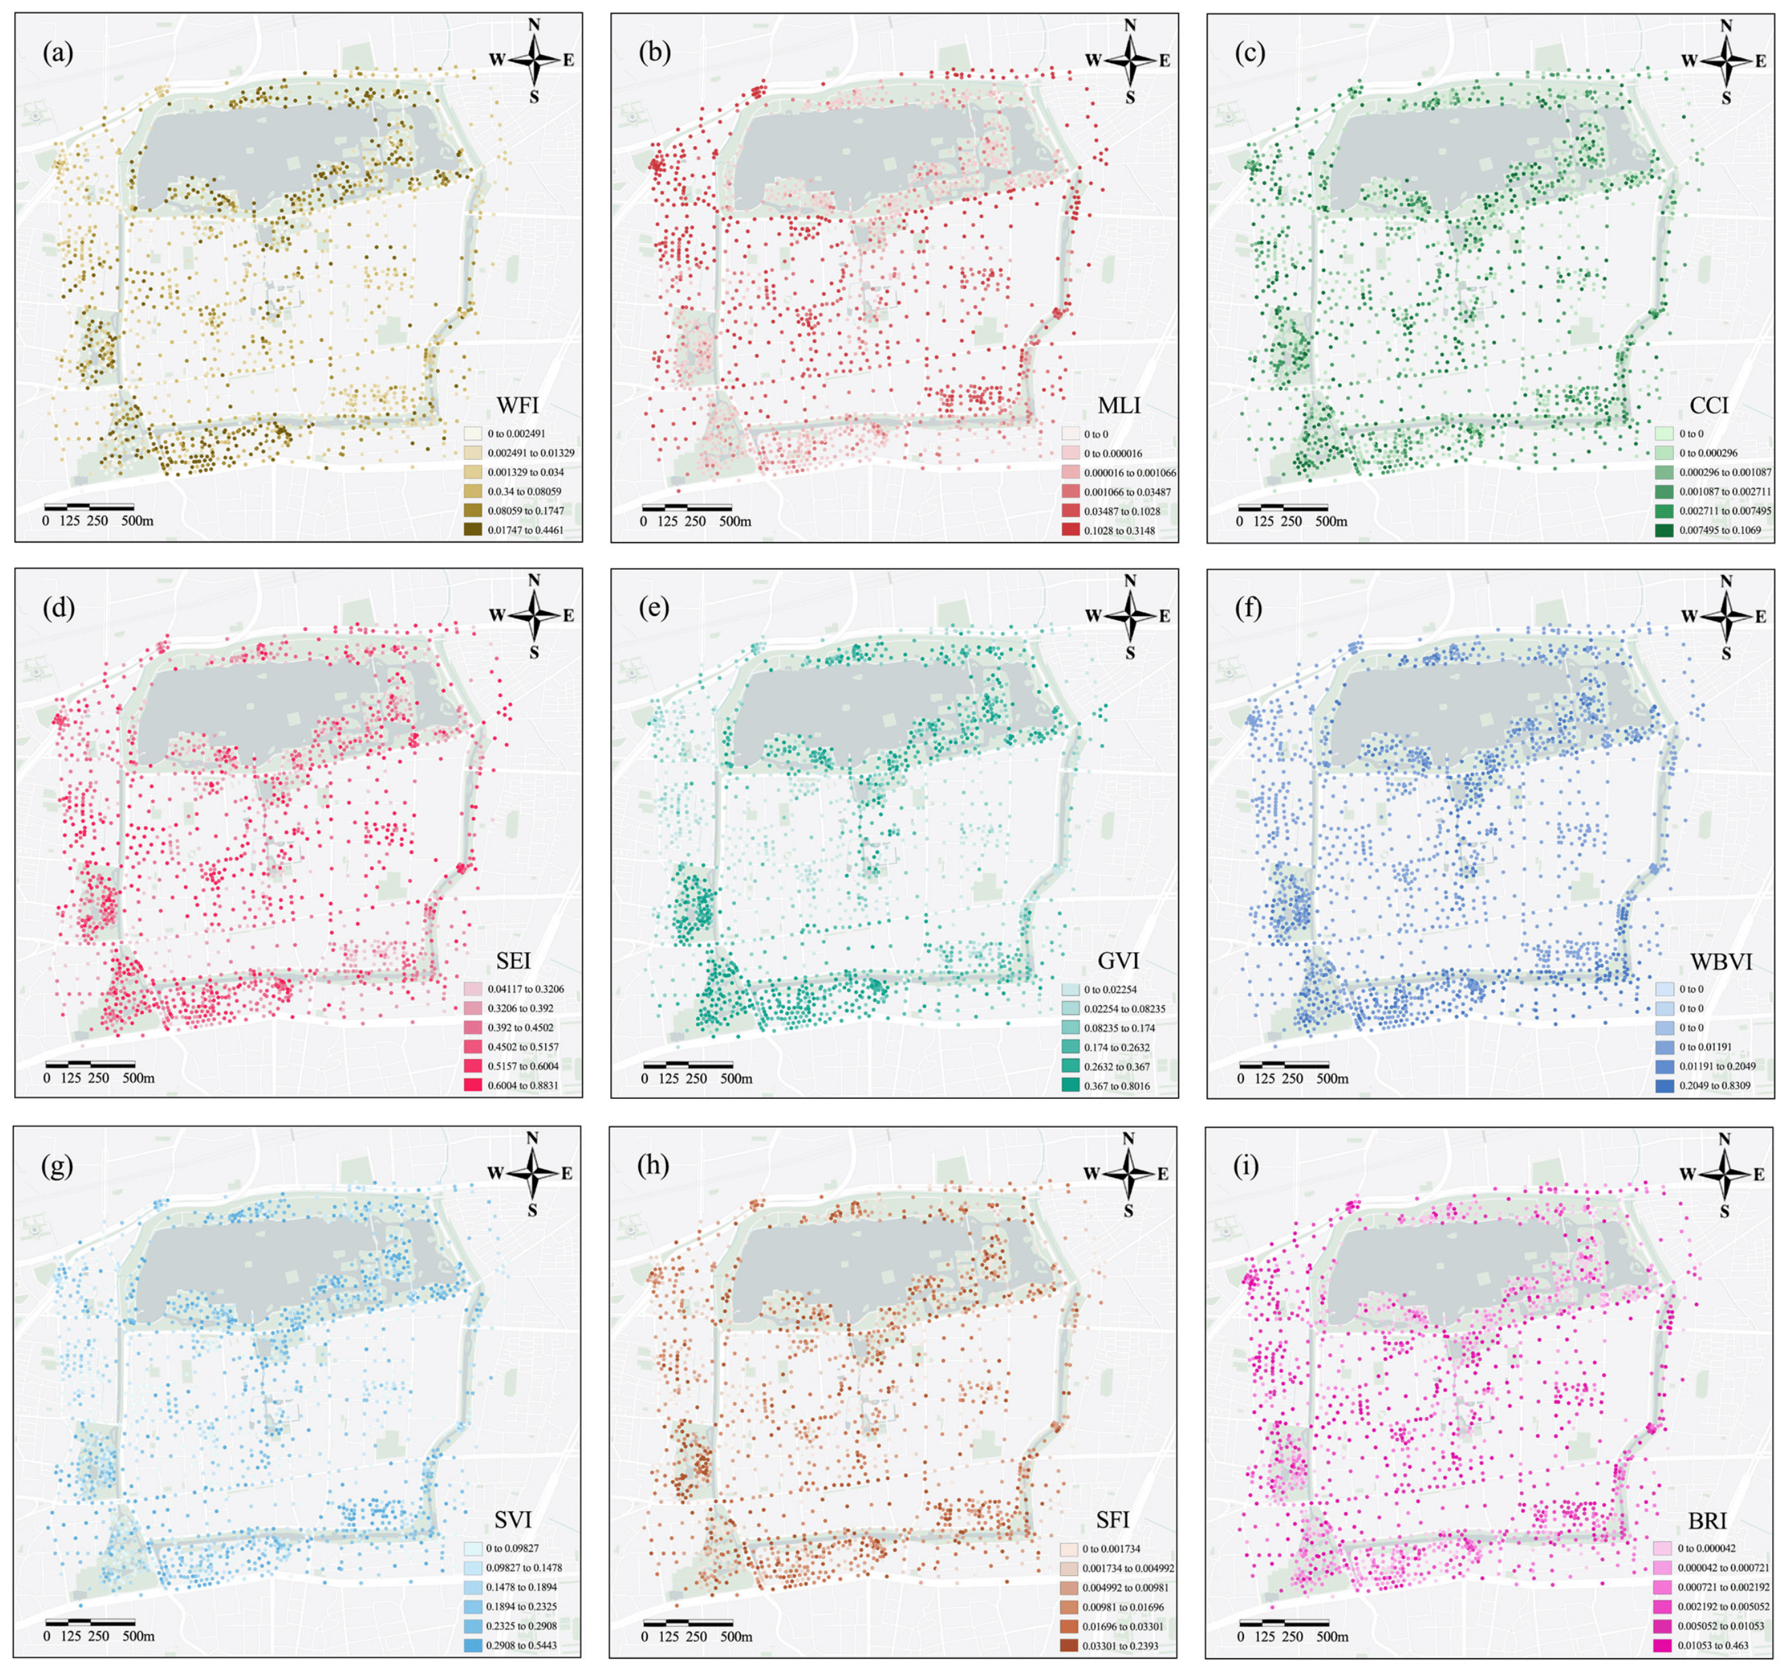
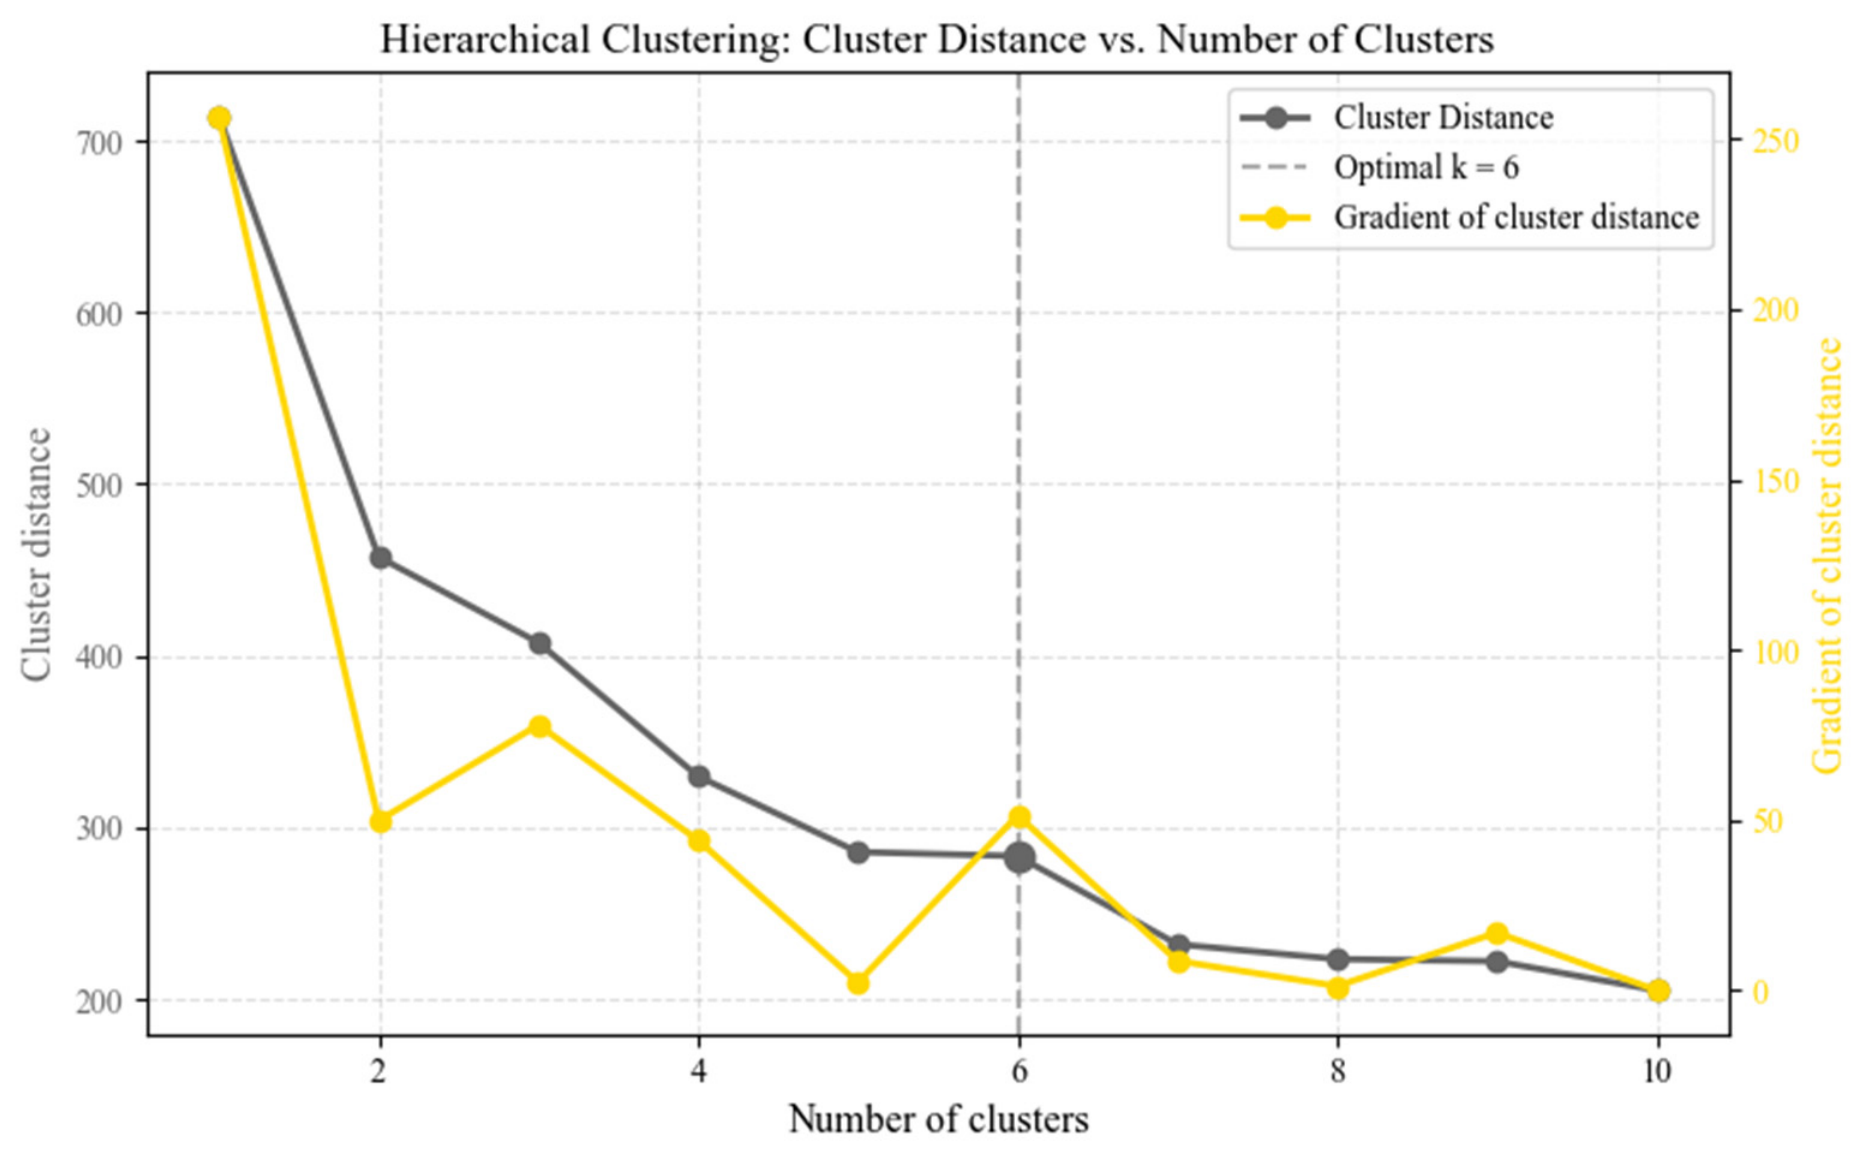
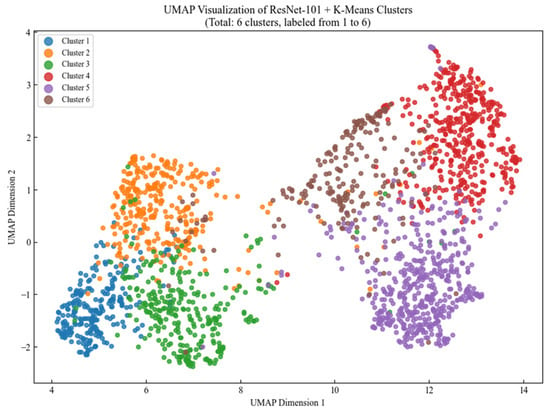
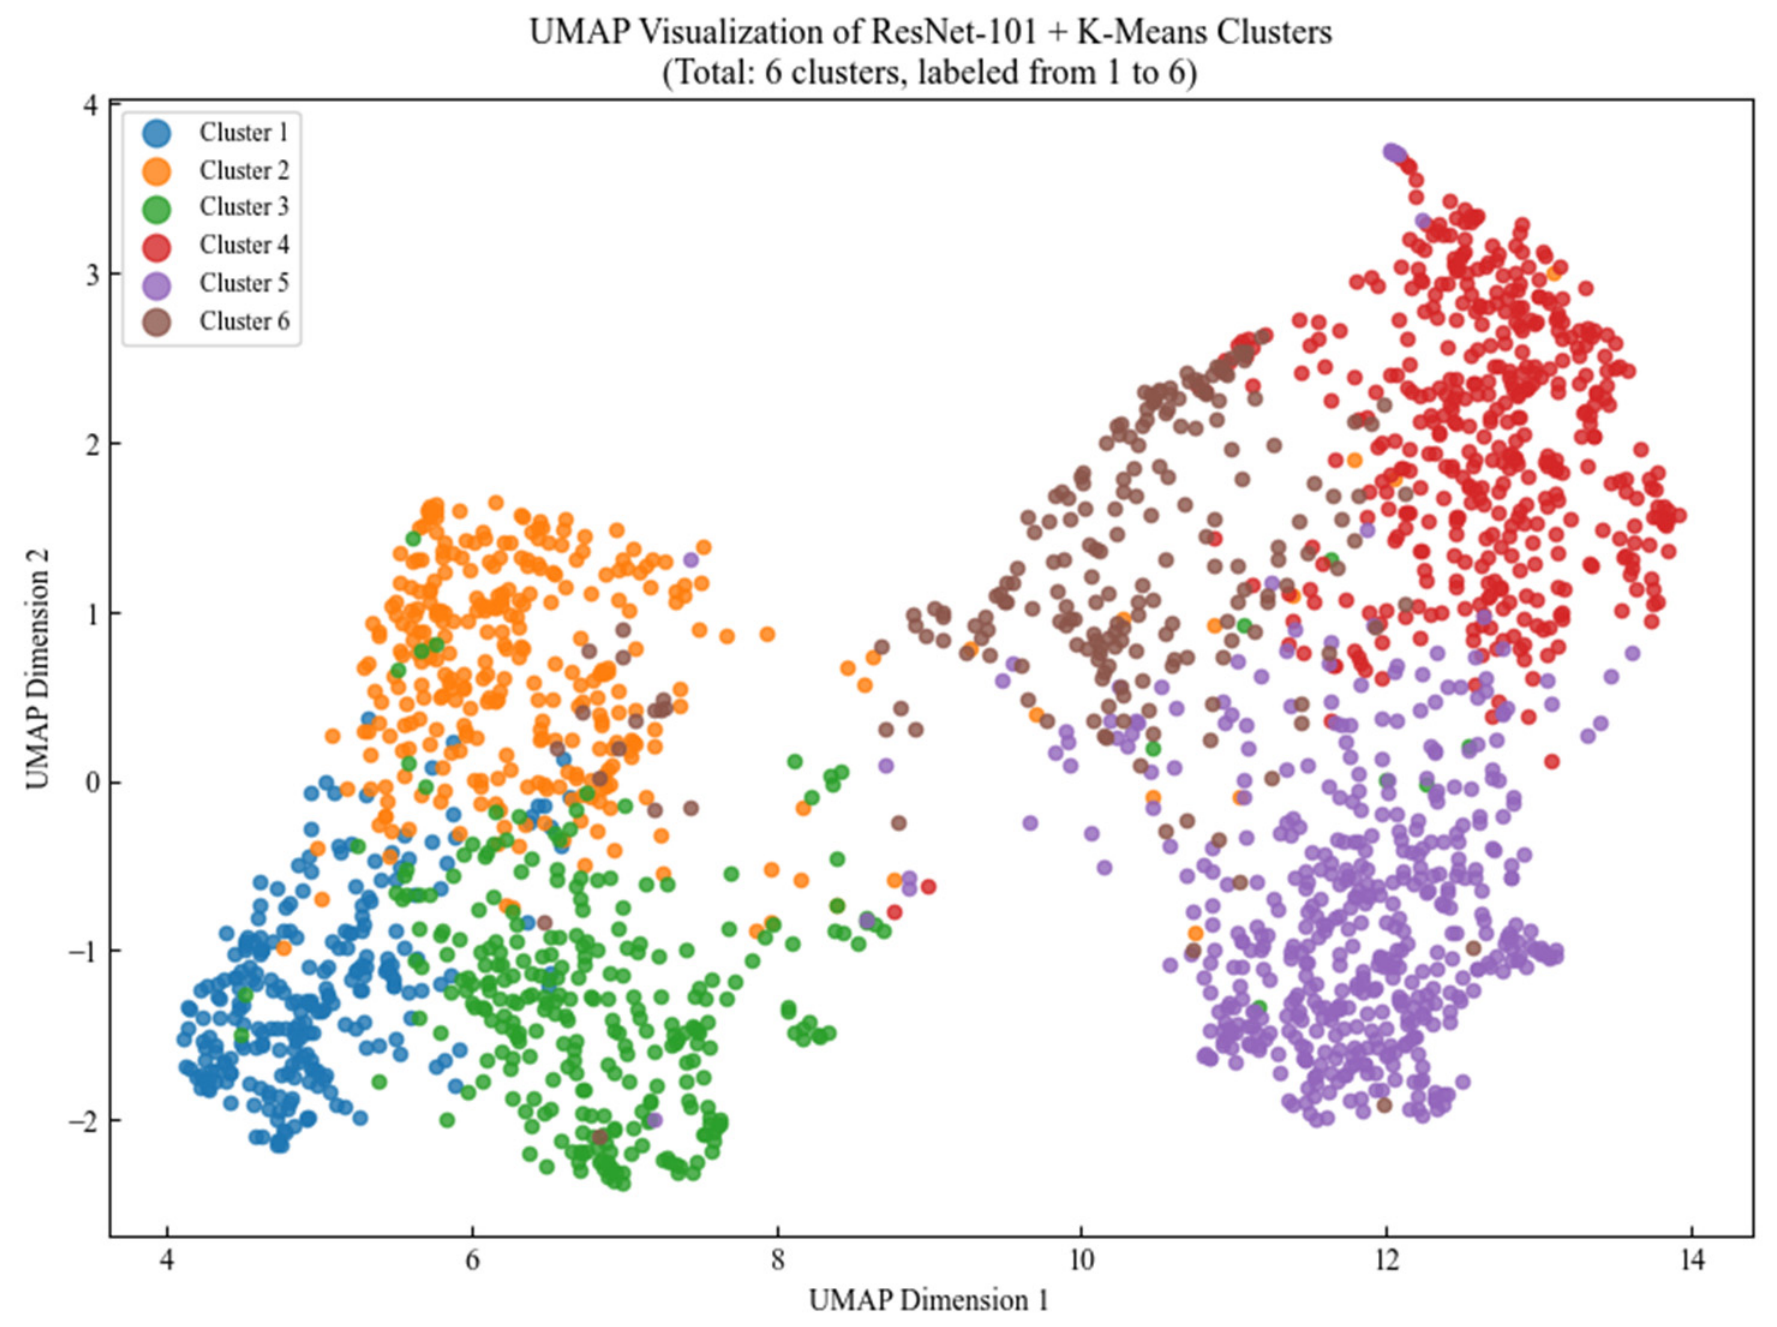
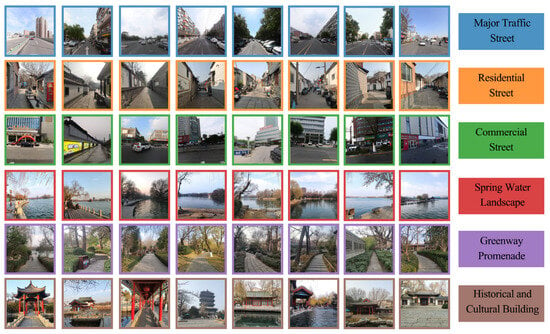
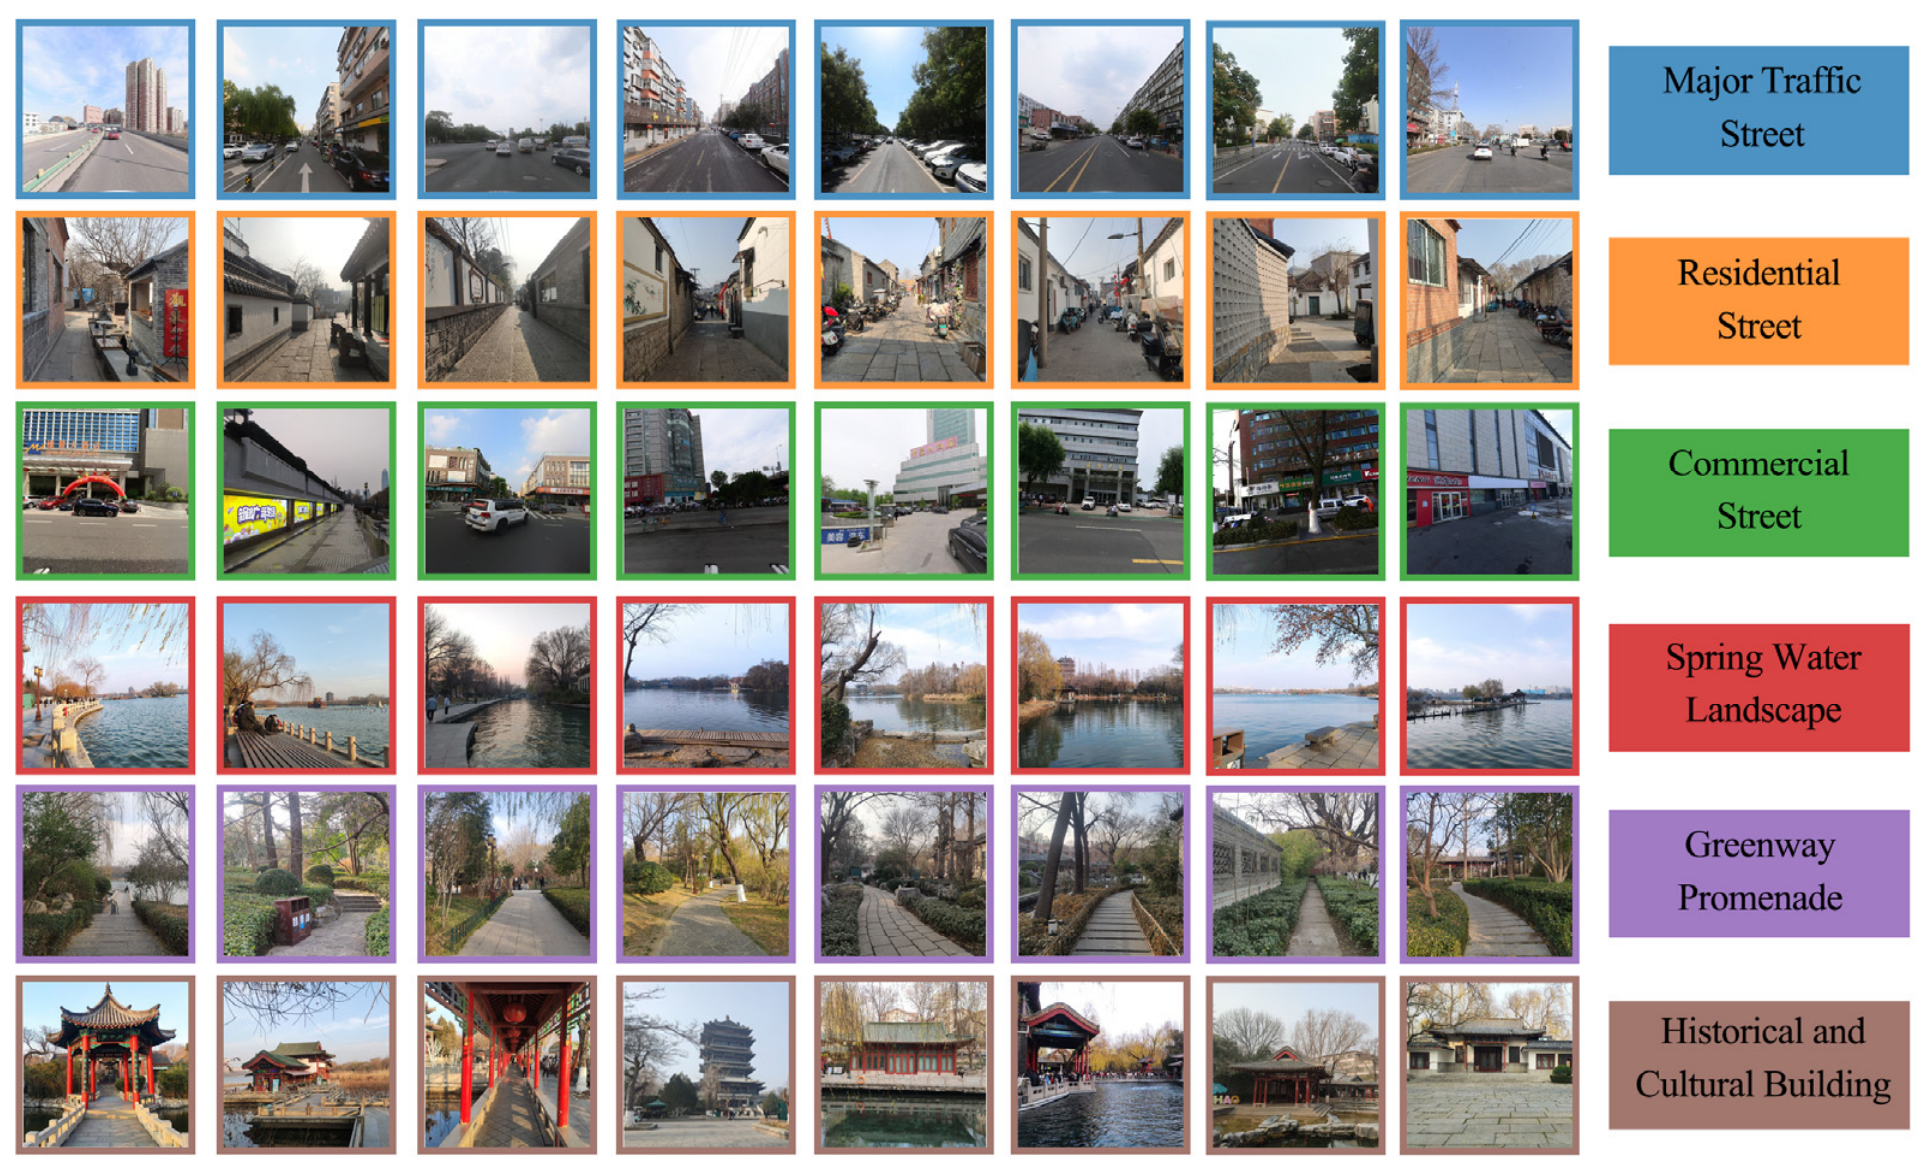
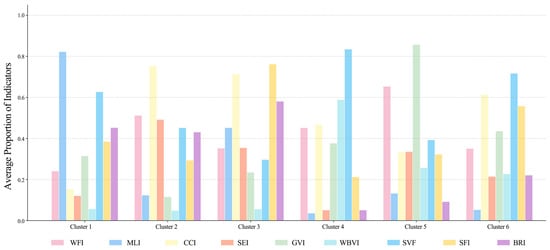
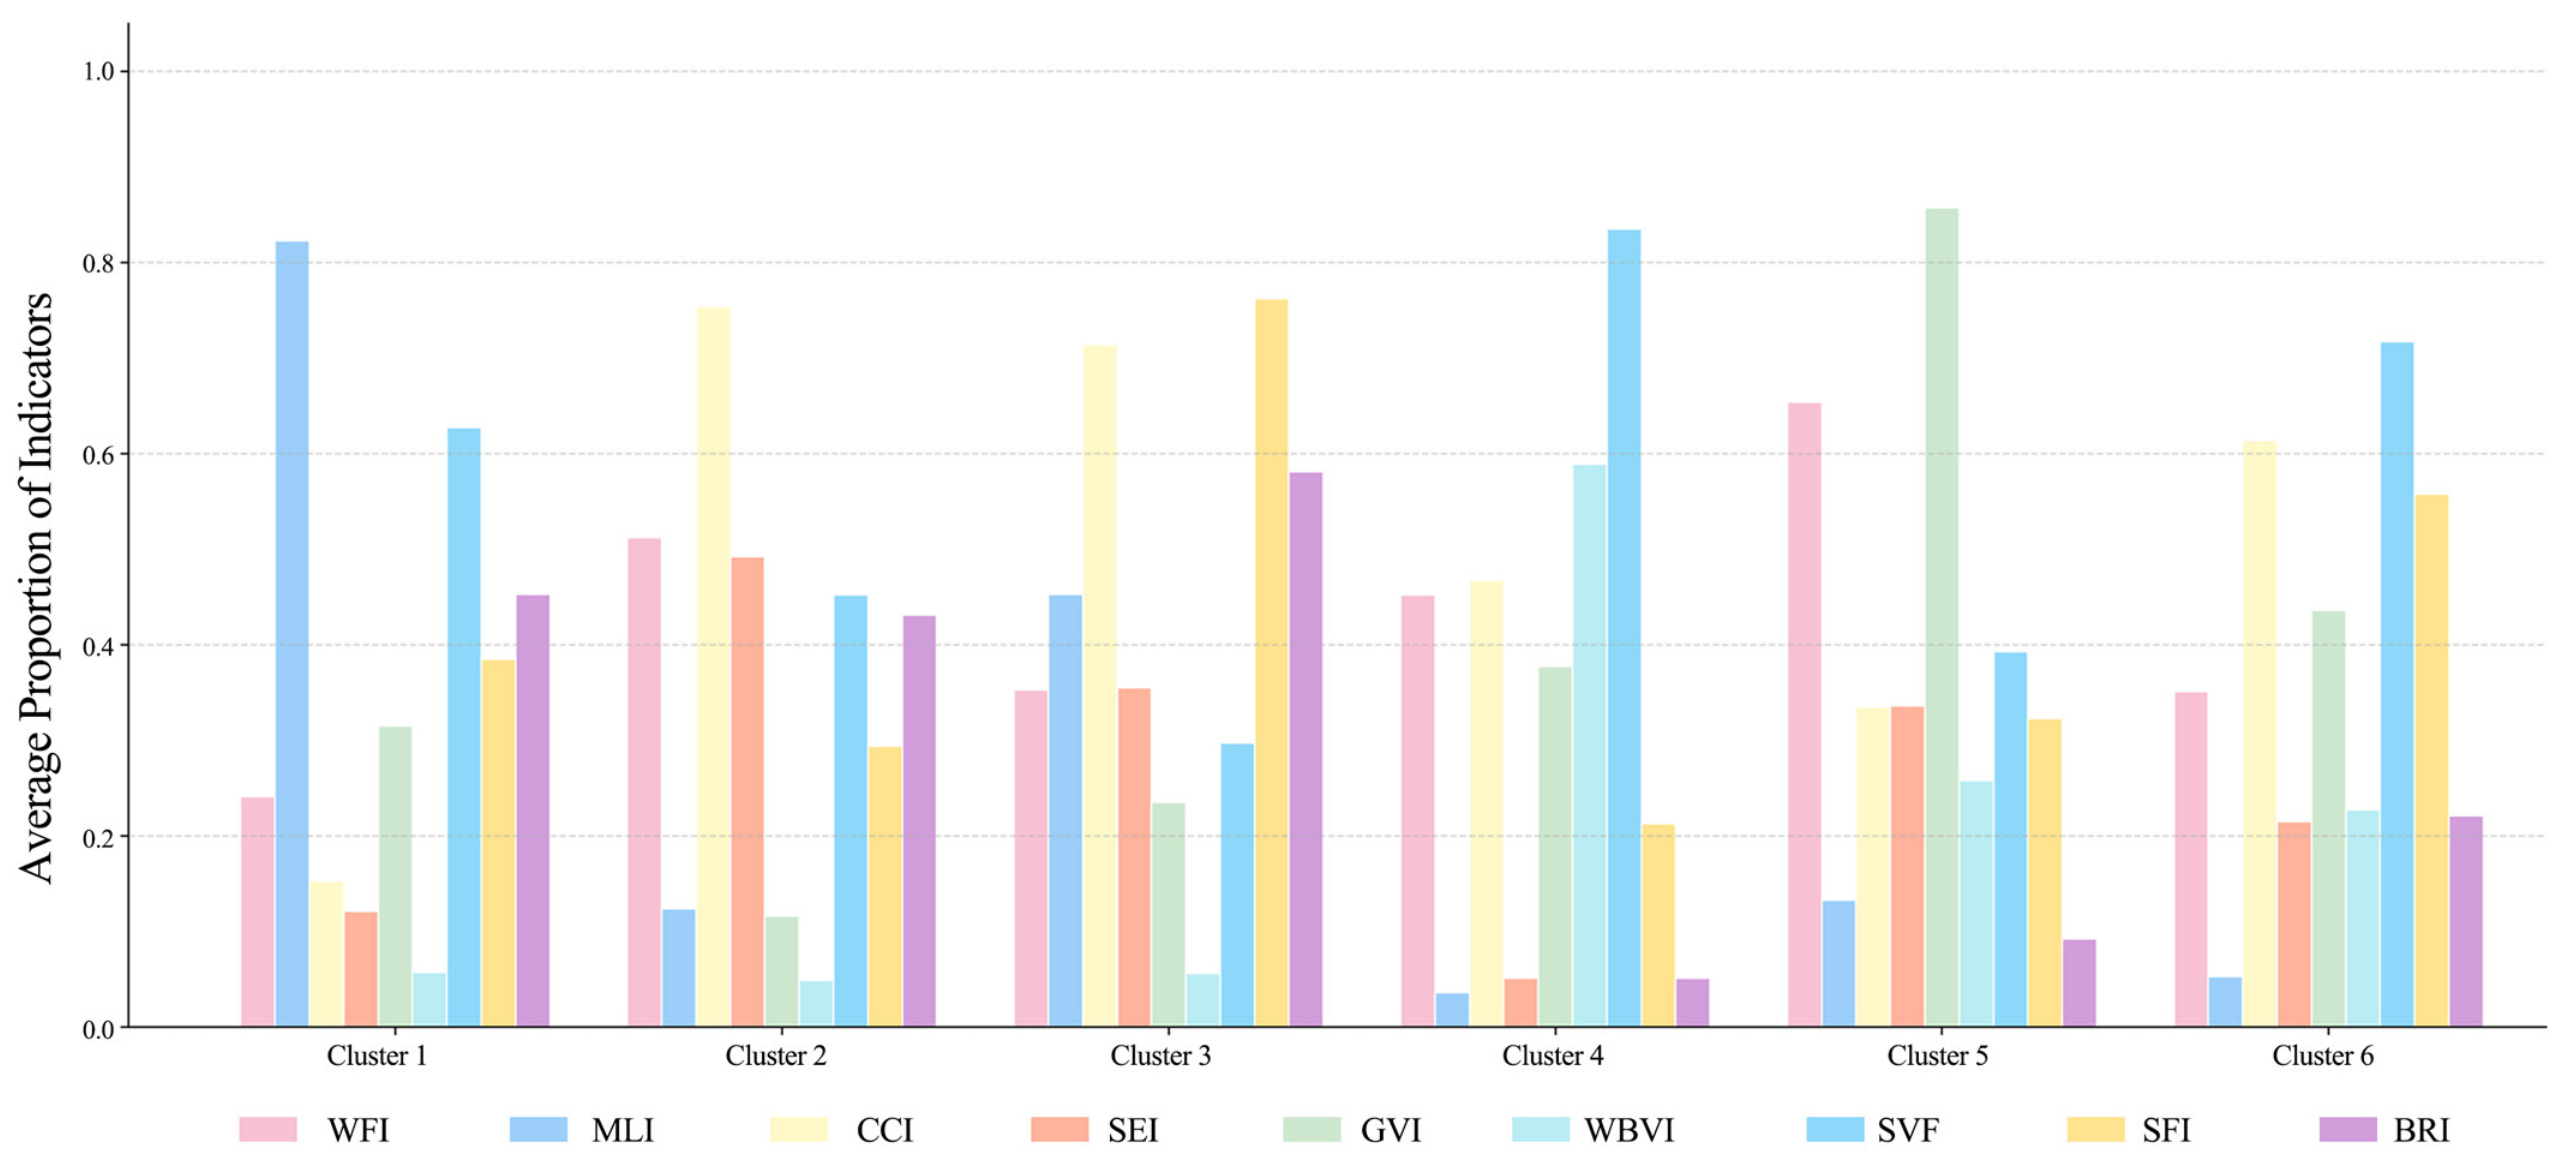
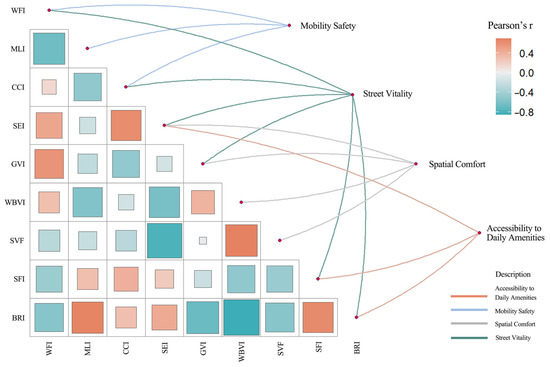
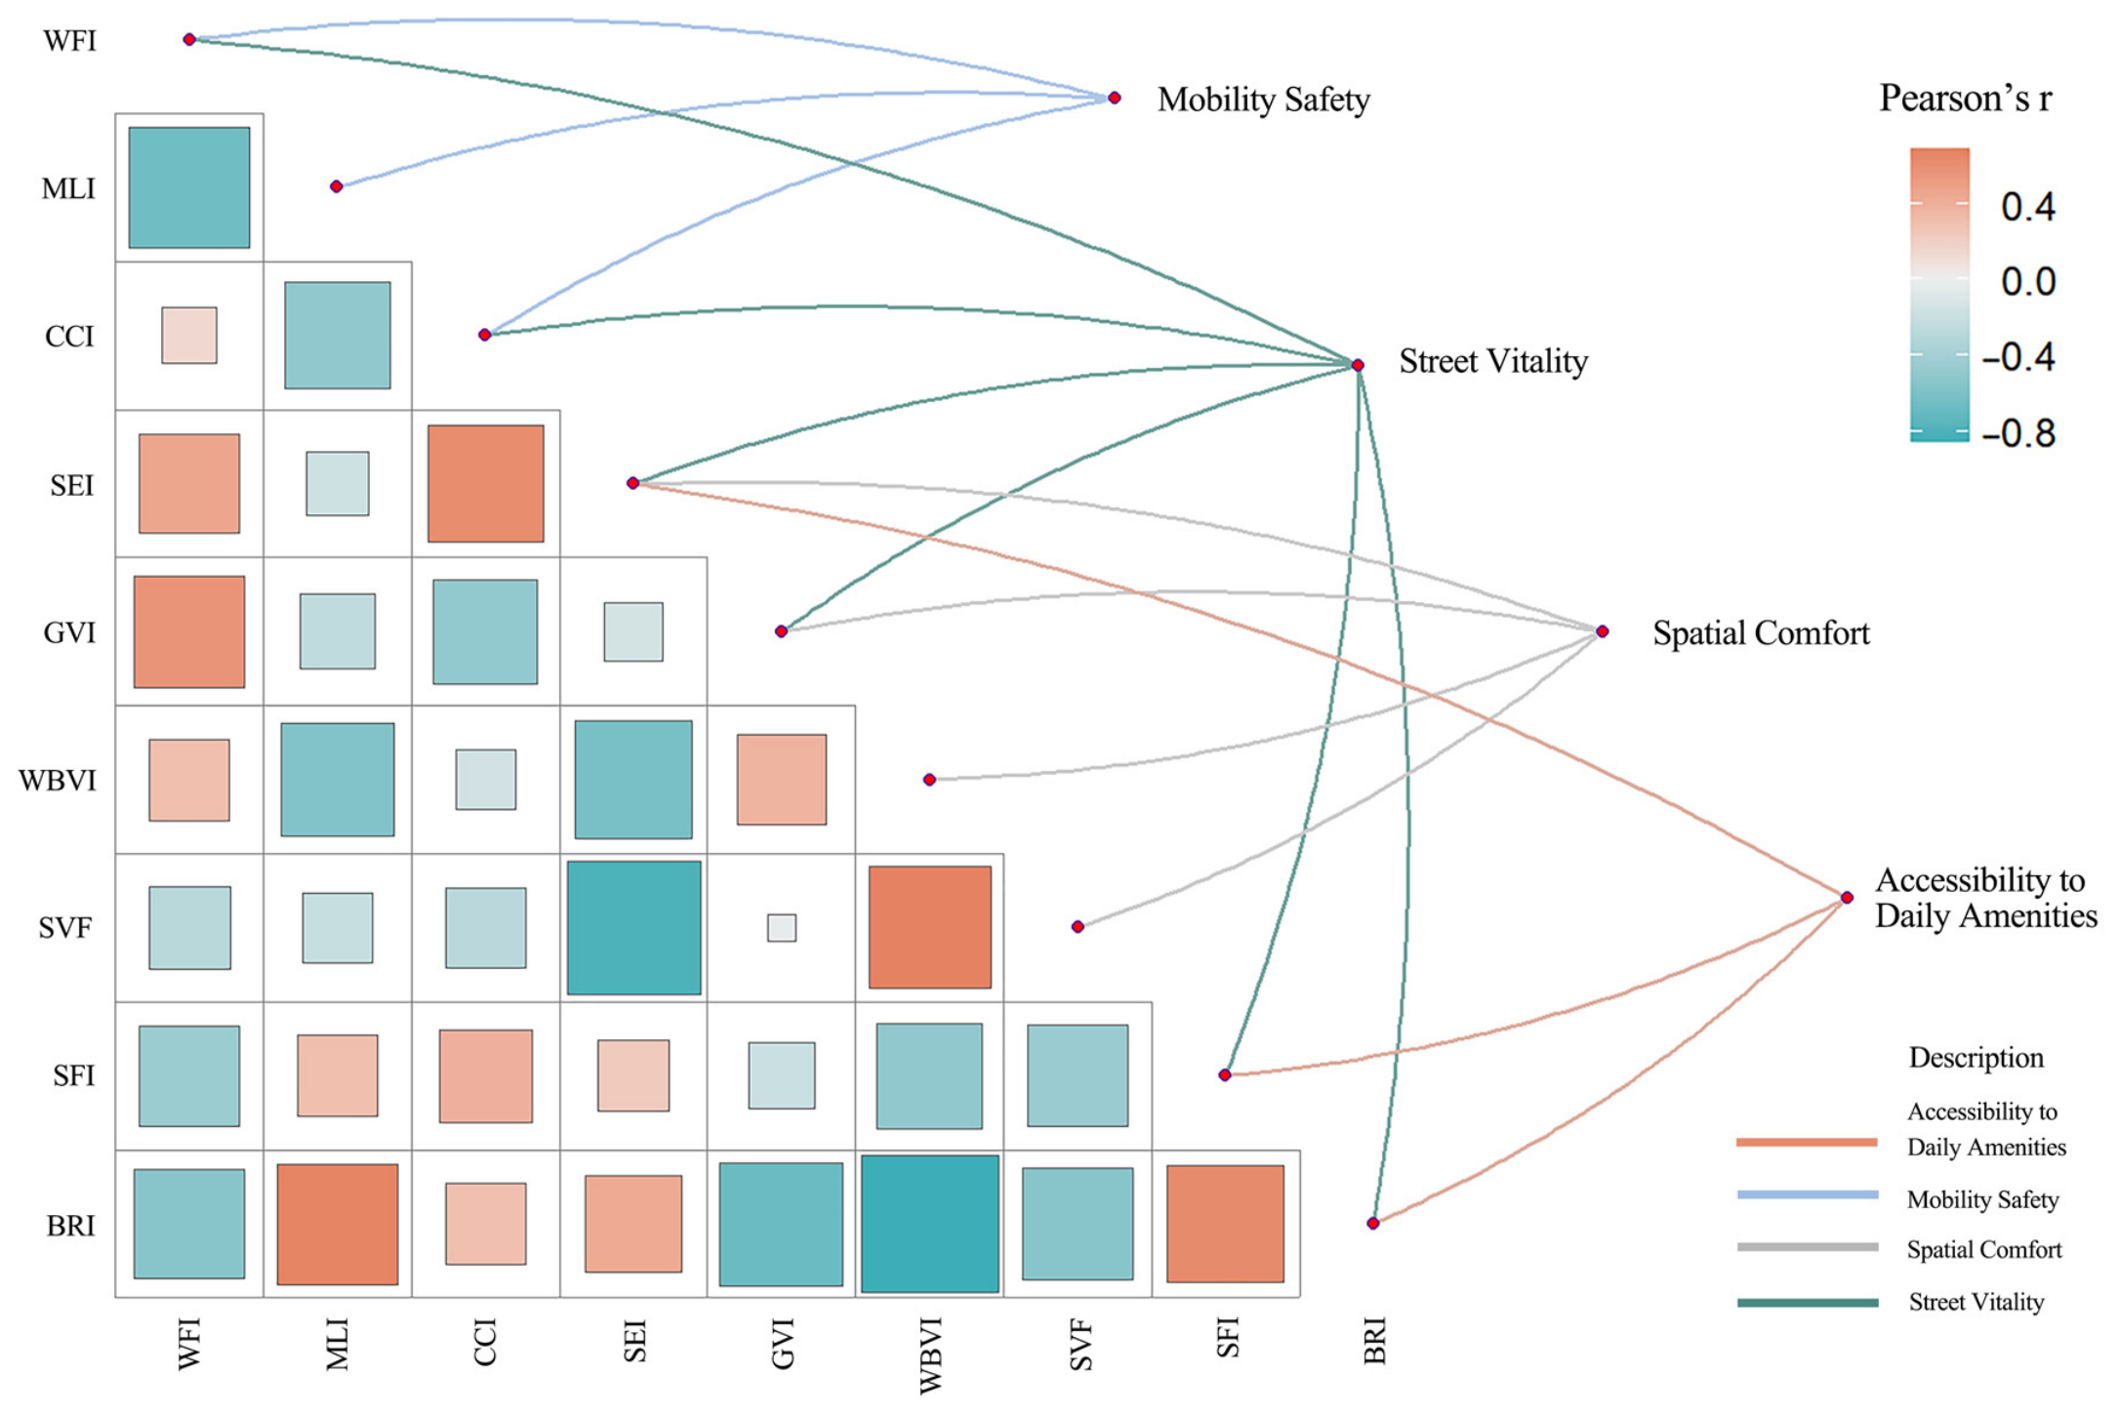
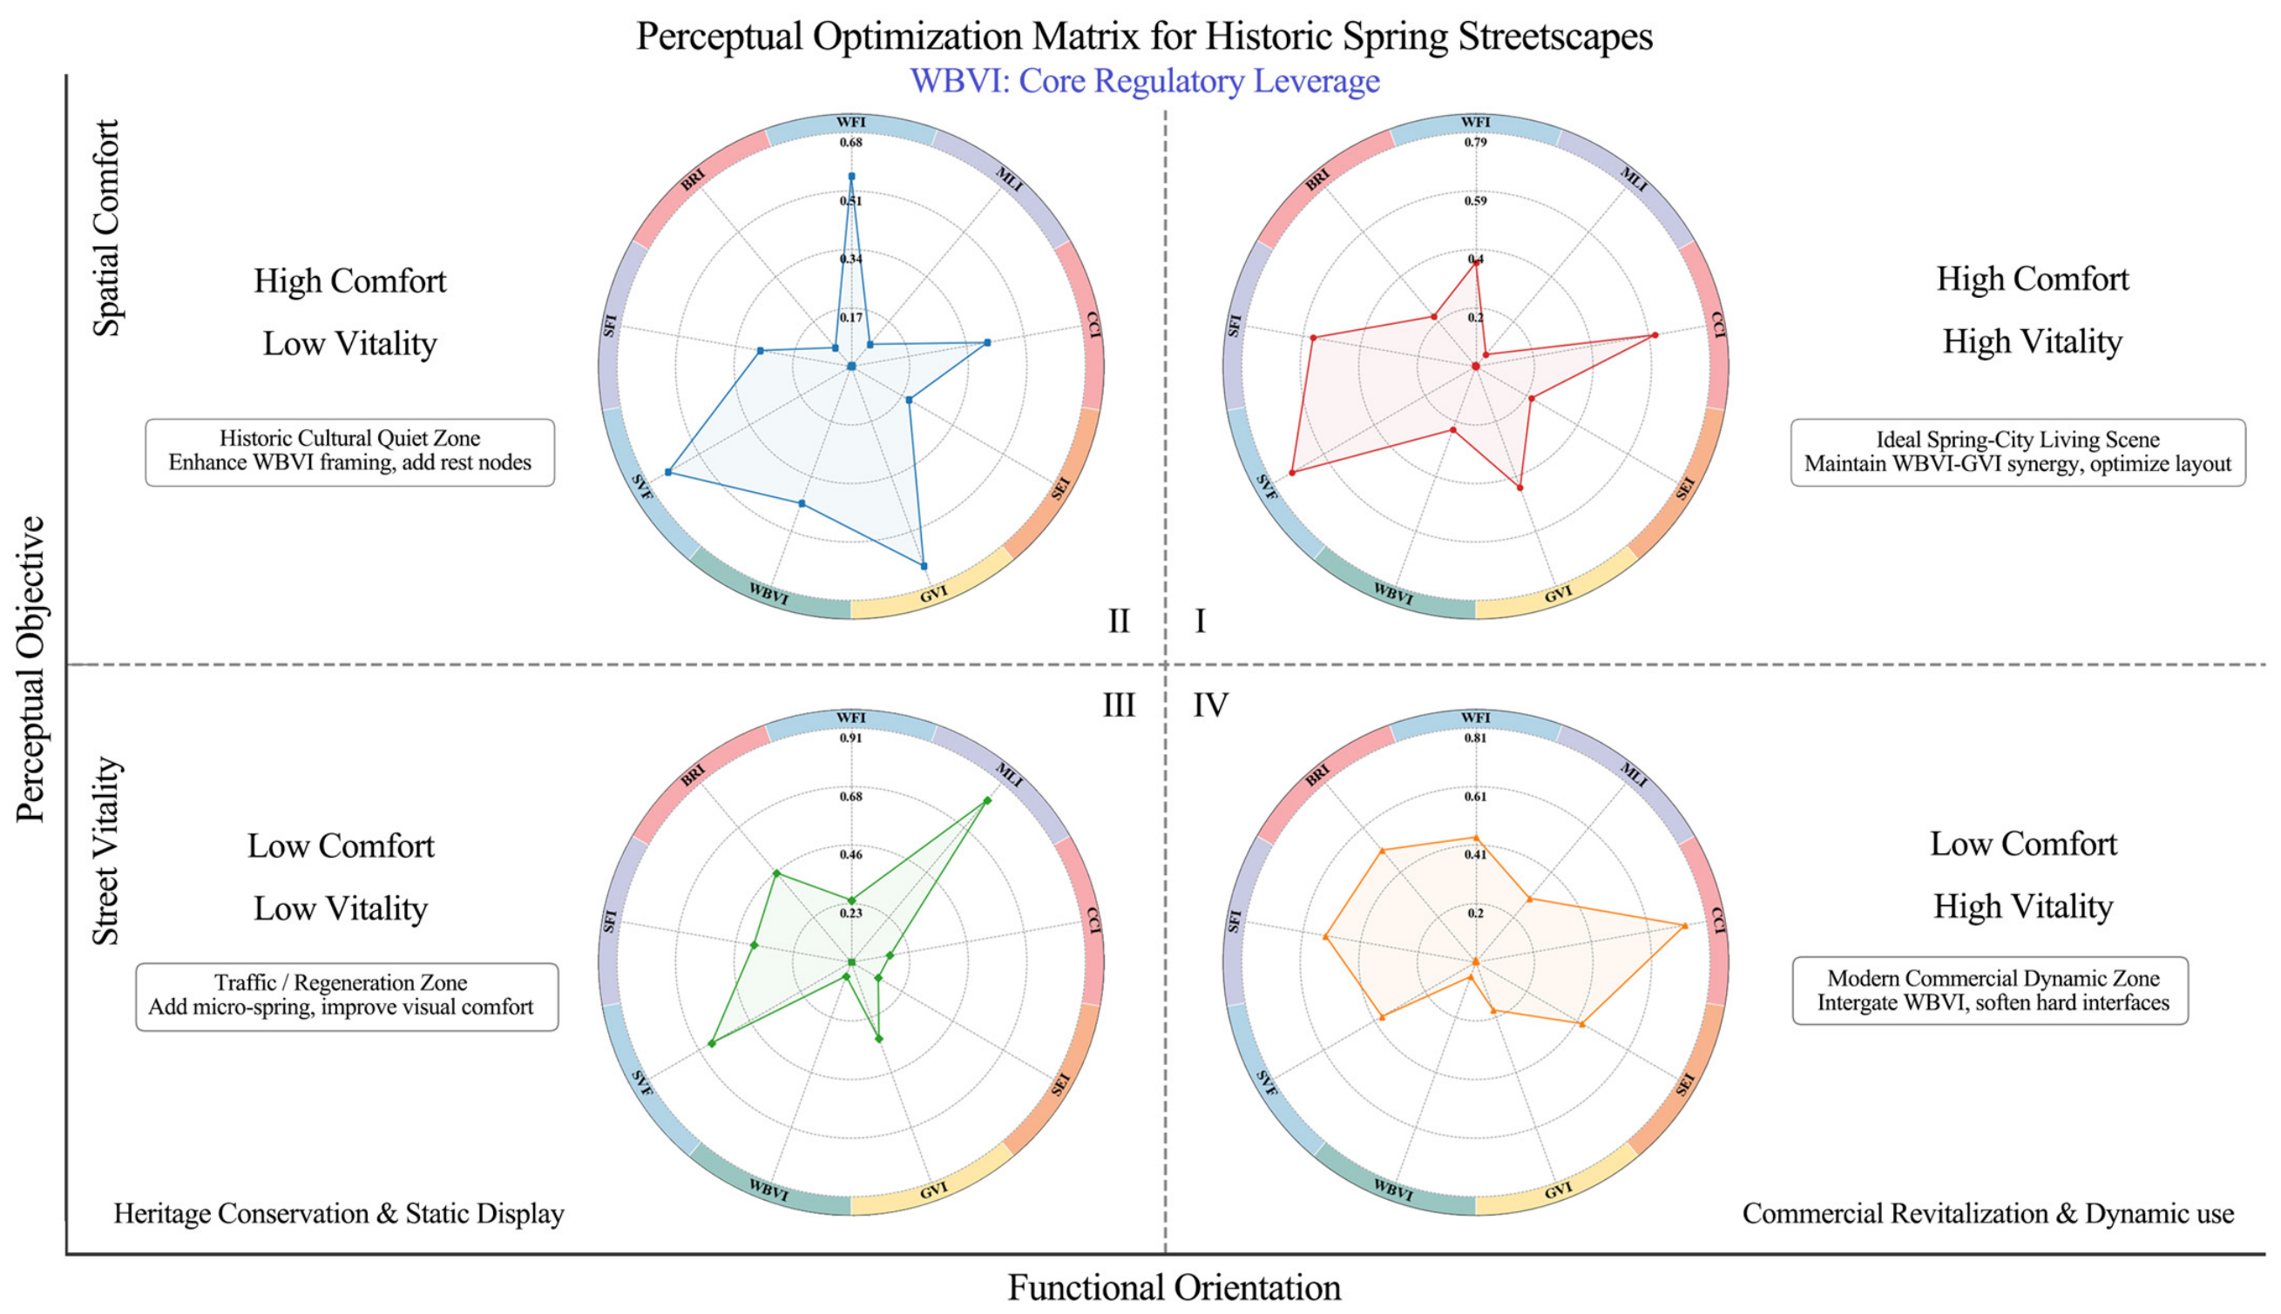

Disclaimer/Publisher’s Note: The statements, opinions and data contained in all publications are solely those of the individual author(s) and contributor(s) and not of MDPI and/or the editor(s). MDPI and/or the editor(s) disclaim responsibility for any injury to people or property resulting from any ideas, methods, instructions or products referred to in the content. |
© 2026 by the authors. Licensee MDPI, Basel, Switzerland. This article is an open access article distributed under the terms and conditions of the Creative Commons Attribution (CC BY) license.