


Abstract
The relationship between urban waterfront spaces and health is widely recognized. However, the relative importance and nonlinear associations of specific attributes with residents’ physical health remain unclear. Drawing on survey data from 375 users across seven waterfront parks in Changchun, this study uses a Gradient Boosting Decision Tree model to examine how 37 perceived attributes of waterfront recreation spaces contribute to self-assessments of physical health, focusing on their relative contributions and nonlinear associations. The aim is to provide exploratory evidence for the empirical accumulation of the relationship between waterfront spaces and health. The results show that waterfront walkways and plaza lighting had high relative importance in the prediction model, at 8.8% and 8.2%, respectively. These findings suggest that spatial connectivity and around-the-clock accessibility may play a fundamental role in creating health-supportive environments. Plant landscapes, seating, pet-friendly facilities, waterside platforms, and open lawns for public access constitute secondary dimensions, with relative contributions ranging from 3.1% to 5.4%. The partial dependence plots of most attributes exhibit nonlinear associations. The pet-friendly facilities are presented in a two-step pattern in the partial dependence plot. This study proposes a conceptual reference framework for planning and offers exploratory proposals for waterfront recreation spaces.
1. Introduction
As China’s urbanization enters a phase focused on stock renewal and high-quality development, demand for high-quality recreational spaces among urban residents has steadily increased [1,2,3]. Against this backdrop, waterfront recreation spaces, as a key component of urban blue infrastructure, are now widely recognized as being related to health. They not only contribute to better physical health and promote social interaction [4], but also help relieve stress and improve mental well-being [5,6]. On this basis, many cities have invested in upgrading waterfront spaces, such as improving walkways, adding sports courts, and creating pet-friendly zones in the hope of capturing health co-benefits [7,8,9,10,11]. Yet despite growing investment, our understanding of two fundamental questions remains limited: which specific perceived attributes of waterfront recreation spaces are most closely associated with residents’ physical health, and whether these associations follow a linear pattern or exhibit a nonlinear association?
Existing studies have individually examined the relationships between diverse attributes of waterfront recreation spaces and health outcomes. Waterfront walkways and waterside platforms are associated with increased physical activity levels [12,13]. Perceived attributes such as seating, lighting, plant landscapes, and open lawns for public access have also been linked to various health outcomes, including social interaction, nighttime accessibility, and psychological restoration [7,8,12,14,15]. While these findings are valuable, they remain largely fragmented. Existing studies predominantly focus on single or a limited number of attributes, whereas quantitative research that clarifies the relative importance of a comprehensive set of perceived attributes remains scarce. For planners facing multiple improvement options, empirically identifying which attributes are more strongly associated with health is a prerequisite for evidence-based prioritization, yet such comparative evidence remains scarce.
More critically, much of the current literature implicitly rests on a linearity assumption, namely, that higher levels of an environmental attribute invariably translate into greater health benefits [16,17,18]. However, this assumption has rarely been systematically tested in the waterfront context [11,17,19]. In many environmental and health domains, moving from “very poor” to “basically usable” often involves a relatively significant positive change, while further improvement beyond a certain level, the additional benefits may sharply decline or even approach zero [16,17]. Ignoring potential nonlinear relationships may lead to deviation in resource allocation. However, it is unclear empirically within which range of perception scores of attributes of waterfront recreation spaces the correlation with physical health level tends to level off. Therefore, a focused empirical question remains to be addressed: do perceived attributes of waterfront recreation spaces exhibit nonlinear associations with physical health, and if so, at what perceived-score levels do these associations reach thresholds?
To break through the above limitations, this study introduces the Gradient Boosting Decision Tree (GBDT) model. Based on survey data from 375 users of seven major waterfront parks in Changchun, China, we systematically evaluate 37 perceived attributes of waterfront recreation spaces, aiming to answer: (1) what is the relative importance ranking of these attributes in predicting residents’ physical health, and (2) what are the bivariate association patterns between each attribute and physical health, and do any nonlinear patterns exist?
This study makes two contributions. First, it provides a comparative ranking of perceived attributes of waterfront recreation spaces by their predictive strength, serving as exploratory evidence for subsequent research prioritization. Second, by examining nonlinear patterns, it identifies the most significant perceived score ranges of attributes of waterfront recreation spaces related to physical health. These findings are expected to inform the design and evaluation framework of future interventions, while offering conceptual guidance for waterfront recreation spaces planning.
This paper is organized as follows. Section 2 introduces the study area, data sources, and the GBDT modelling approach. Section 3 reports the relative importance of the ranking of attributes of waterfront recreation spaces and the partial dependence plots (PDPs) results. Section 4 discusses the findings in the context of existing literature and tentatively advances a conceptual reference framework for planning. Section 5 summarizes the core conclusions and outlines directions for future research.
2. Materials and Methods
2.1. Data and Variables
The data used in this study came from a three-page self-administered survey completed by users of waterfront recreation spaces in Changchun. Changchun is the capital of Jilin Province, located in northeastern China. The city includes seven urban districts and one county, and also has jurisdiction over three county-level cities. It covers an area of 24,744 square kilometres, and the city had a population of 9,085,100 as of the end of 2024.
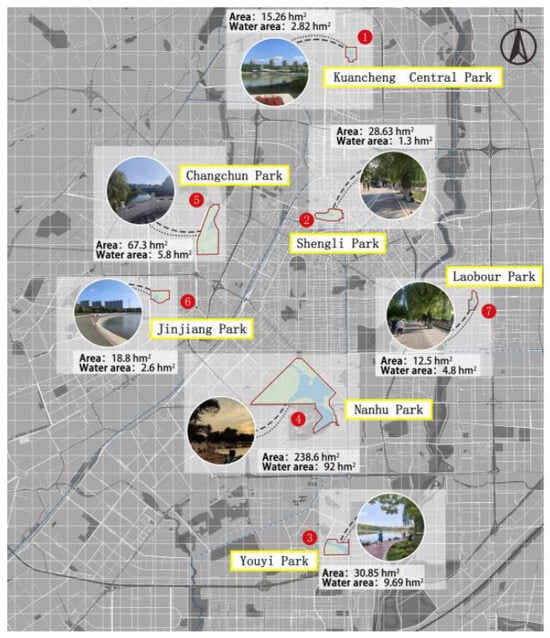
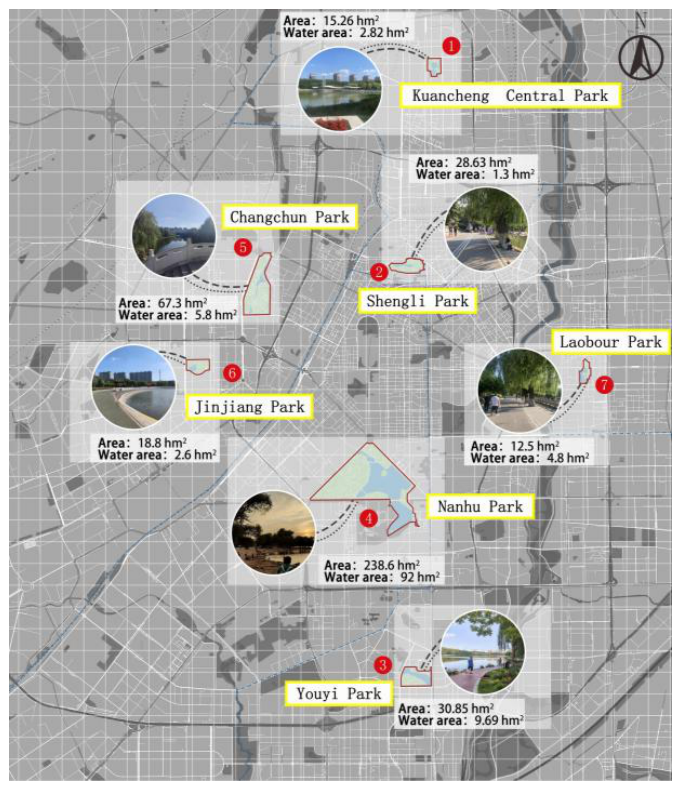
As living standards in Changchun have improved, residents’ health awareness and their willingness to participate in leisure activities have both increased. To examine the relationship between waterfront recreation spaces and residents’ health, this study selected parks in central urban districts of Kuancheng, Nanguan, Chaoyang, and Lüyuan as the research areas. Data on these spaces and residents’ physical health were collected using observational methods, questionnaire surveys, and field surveys. Since the observation method is less suitable for spaces that are either excessively large or small, candidate parks were pre-screened based on their size. The specific selection criteria were: (1) presence of a large water body as the core landscape feature; (2) classification as an integrated urban park without a single dominant theme; (3) sufficient diversity of spatial attributes (paved plazas, walkways, planting, seating, lighting, waterside platforms, etc.) to allow comparative analysis across the 37 perceived attributes; (4) reasonable accessibility for residents; and (5) variation in size, location, and user demographics to capture different contexts. The waterfront recreation spaces of Kuancheng Central Park, Shengli Park, Youyi Park, Nanhu Park, Changchun Park, Jinjiang Park and Laobour Park were initially selected as sample areas for this study. Given that Nanhu Park is the most representative park in Changchun with diverse waterfront recreation spaces, it was also included in the sample to enhance representativeness. Figure 1 presents the environmental conditions of the selected waterfront recreation spaces. The seven parks were selected using a purposive sampling strategy designed to capture a broad range of waterfront recreation space typologies and user groups in Changchun.
Figure 1.
Geographic location of the sampled waterfront recreation spaces in Changchun.
The survey was pre-tested by users of waterfront recreation spaces and revised based on their feedback. It was conducted by three postgraduate students. Within three hours, these students were trained in how to recruit respondents and administer the surveys. During survey administration, the students also shared their survey experiences with each other periodically to improve recruitment and management strategies. The survey was conducted from August to September 2024, covering typical working days (Tuesday to Thursday) as well as rest days (Saturday and Sunday). The daily survey period was divided into three time slots: morning (8:00–11:00), afternoon (13:00–16:00), and evening (18:00–20:00), with equal effort allocated to each slot to avoid time-of-day bias. The students recruited respondents around the waterfront recreation spaces using a convenience sampling method and conducted face-to-face interviews. The surveys were collected on-site. We distributed 390 questionnaires, and the final number of valid questionnaires was 375 (Kuancheng Central Park: n = 47; Shengli Park: n = 56; Youyi Park: n = 54; Nanhu Park: n = 54; Changchun Park: n = 50; Jinjiang Park: n = 57; Laobour Park: n = 57), yielding a validity rate of 96.2%. In recruiting respondents, we tried to balance gender and age distributions. The sample had a balanced gender distribution. Among the respondents, 20.8% were aged over 60 and 21.1% held a bachelor’s degree or higher. Employees of enterprises and public institutions accounted for 27.5%, self-employed persons for 22.1%, and retired persons for 24%. Respondents with a total annual household income of RMB 30,000 to 80,000 were the largest group (30.4%), followed by those with an income of RMB 80,000 to 120,000 (26.9%). The nuclear family was the most common family structure (61.3%), while 38.40% of respondents owned one private car, as shown in Table 1.
Table 1.
Descriptive statistics of respondents’ socio-demographic characteristics.
During the survey, respondents were asked to rate 37 items based on their experiences while using waterfront recreation spaces. These 37 items were selected based on the item pool and conceptual framework of the Environmental Assessment of Public Recreation Spaces (EAPRS) tool, as originally developed by Saelens et al. [20], and drew on earlier studies covering waterfront landscape design, urban planning perspectives, the relationship between waterfront spaces and health, and how perceived characteristics in such settings are measured [3,7,10,11,12,13,14,15,16,18,21,22]. The items covered a variety of waterfront recreation spaces dimensions, including paved plazas, roads and pathways, service facilities, landscape features, lighting, waterside design, recreational and sports areas, planting design, and cultural elements (Table 2). Respondents rated each of the 37 indicators on the Likert five-point scale, with scores ranging “very poor” (1), “poor” (2), “average” (3), “good” (4), and “very good” (5).
Table 2.
Description of perceived attributes of waterfront recreation spaces.
Respondents also rated their health using the 12-Item Short Form Health Survey Version 2 (SF-12). The SF-12 has 12 items that cover eight main dimensions: physical functioning (PF), bodily pain (BP), vitality (VT), social functioning (SF), mental health (MH), role limitations due to physical health (RP), general health (GH), and role limitations due to emotional problems (RE). Ware et al. [23] provide detailed scoring and calculation procedures.
First, raw responses to the 12 items were recorded and aggregated into the eight domain scores according to the SF-12 scoring manual. Second, each domain score was standardized using the general population mean and standard deviation (the reference population) to produce a z-score. Third, the Physical Component Summary (PCS) was calculated as:
where w_i are the component score coefficients derived from principal component analysis with orthogonal rotation (forcing the physical and mental components to be uncorrelated), and z_i are the standardized domain scores [23,24]. The resulting PCS is a T-score metric with a population mean of 50 and a standard deviation of 10, where scores above 50 indicate better-than-average health relative to the general population, and scores below 50 indicate lower perceived physical health [23,24].
The standard SF-12 has been validated as valid and equivalent for Chinese populations [25,26,27]. In a study of 2410 Chinese adults in Hong Kong, the SF-12 indicated strong criterion validity [28]. More recently, the SF-12 was specifically validated for Chinese older adults (n = 1000, including both community-dwelling and institutional care settings), demonstrating Cronbach’s α of 0.81 for PCS, with a two-factor structure jointly accounting for 68.50% of variance and acceptable goodness-of-fit indices (GFI = 0.98, CFI = 0.98) [29]. Among Chinese adolescents (n = 19,428), the SF-12 demonstrated good reliability and validity in the cross-sectional study [30]. Furthermore, a study by Zhao et al. [31] applied the SF-12 in a general population in Chengdu, China, and confirmed its satisfactory validity. These findings confirm the reliability and validity of the SF-12 as a health-related quality of measure for Chinese populations across different age groups and care settings.
After processing the scores, we obtained the PCS [24]. The mean PCS score in our sample was 43.11 (SD = 4.85), with a range of 28.31 (min = 30.21, max = 58.52). Internal consistency for the PCS was acceptable (Cronbach’s α = 0.72). The distribution was roughly symmetric and approximated normality. This is notably below the norm-based mean of 50, which can be attributed to the composition of our sample: a considerable proportion of retired individuals (24%), self-employed persons (22.1%), and older adults (20.8% aged 60+), who tend to report somewhat lower physical health than the general population. The survey also collected information on a range of demographic characteristics, including gender, age, educational background, occupation, household structure, annual household income, and number of private cars owned.
2.2. Analysis Approach
In this study, we applied the Gradient Boosting Decision Tree (GBDT) model. This model reveals nonlinear relationships between waterfront recreation spaces and residents’ physical health, and quantifies the relative importance of each spatial attribute. Earlier studies often relied on generalized linear models to account for nonlinearity, but machine learning methods such as GBDT generally perform better owing to their ability to capture complex, irregular nonlinear patterns [32]. Over the past few years, GBDT has been widely adopted to examine the nonlinear relationships between micro-scale built environments and people’s behavior and perceptions [33,34,35].
GBDT belongs to the family of ensemble learning algorithms. It improves prediction performance by combining multiple decision trees [36] and is also effective at identifying key variables. Unlike traditional ensemble methods, such as AdaBoost, GBDT is trained in a forward stagewise manner, where each new tree learns from the residuals of the combined predictions made by all the previous trees. The model assesses the relative importance of each independent variable by quantifying its contribution to predicting the outcome relative to the other variables in the model [37]. This provides exploratory evidence for policymakers prioritizing interventions, which is particularly critical under resource constraints [38,39]. For the mathematical details of the model, see Ding et al. [40].
Compared with linear regression, the GBDT model offers several advantages. First, it does not presuppose specific variable relationships, allowing it to capture complex nonlinear associations. Second, it generally provides higher predictive accuracy and makes fewer assumptions about the data [41]. Third, the model can better handle multicollinearity and account for interactions among variables [42]. Fourth, it performs robustly even with small sample sizes [43,44]. However, the GBDT model also has limitations. First, it does not provide p-values for traditional statistical inference. Second, it is susceptible to overfitting. To mitigate overfitting in this study, we employed a five-fold cross-validation procedure.
We built the GBDT model using the “gbm” package (v2.1.8) in R (v4.3.1). First, we preprocessed the data, which included handling missing values. Cases with missing values on the dependent variable (PCS) were removed via listwise deletion. Missing values in continuous independent variables were imputed using the median, while nominal and ordinal variables were imputed using the mode. After imputation, the dataset contained no missing values. In the preprocessing stage, one-hot encoding was performed on all nominal variables, and ordinal variables were assigned values in the order of integers. The continuous variables were not subjected to scaling transformation and were directly used in the model with their original values, resulting in the modeling dataset. Subsequently, the data were randomly divided into training and test sets in an 8:2 ratio. The training set was employed for model training and parameter fitting, while the test set served to evaluate the model’s generalization performance. Based on literature and pre-experiments, we specified the candidate learning rates as {0.1, 0.05, 0.01, 0.005, 0.001}, and the candidate tree depths as {3, 5, 7, 10, 12}. On the training set, 5-fold cross-validation was performed, and grid search was conducted using RMSE (Root Mean Square Error) as the indicator. The results showed that a learning rate of 0.01 or lower led to smoother convergence, and a tree depth of 10 exhibited less overfitting on the validation set than a depth of 12. Considering the model capacity and computational efficiency, the learning rate was set to 0.001, and the maximum depth of a single tree was set to 10. To ensure sufficient optimization space and avoid premature termination, the maximum number of iterative trees was set to 5000. Using the early stopping strategy combined with the cross-validation results, the iterative tree number with the best RMSE and stable performance was selected, and the final determined model iterative tree number was 922. The RMSE of the model on the test set is 3.46, and the coefficient of determination R2 is 0.17.
To verify the robustness of the model and ensure that its results are not dependent on a specific sample division method, we repeated the 5-fold cross-validation process 10 times. In each iteration, the training and test sets were re-divided in an 8:2 ratio. The 10-repetition mean RMSE and R2 values on the test set closely matched those from a single 5-fold cross-validation, indicating that the performance evaluation is robust to random data partitioning. To assess the stability of the ranking of variable importance, in each fold of the 5-fold cross-validation, the relative importance ranking of each variable was recorded, and the Spearman rank correlation coefficient between all folds was calculated. The results showed that the average rank correlation coefficient was 0.92, indicating that the ranking of variable importance was highly consistent across different folds. To verify the effectiveness of the GBDT model, under the same experimental framework, a comparison was further conducted among the three models: multiple linear regression, random forest, and XGBoost. A 5-fold cross-validation was uniformly adopted for parameter optimization and performance evaluation. The results showed that the GBDT model outperformed or was on par with the alternative models in terms of RMSE and R2. Therefore, the GBDT model was ultimately selected for this study.
We derived the relative importance of each waterfront leisure space variable affecting physical health and drew partial dependence plots (PDPs) of the important variables. This study evaluated the robustness of the PDPs. During 10 repetitions of the 5-fold cross-validation, the GBDT model was retrained for each fold’s training set, and PDPs of the important variables were drawn. For each variable, the mean value and 95% confidence interval of 50 PDP curves at each value point were calculated. The results show that the 95% confidence band width of all variables is less than 15% of the total amplitude of the curve, and the basic trend of the curves is highly consistent among different models. Therefore, the PDPs presented below are robust in their estimated association patterns.
3. Results
3.1. Ranking of Perceived Attributes of Waterfront Recreation Spaces by Relative Contribution
The GBDT model fitting results show that the relative contributions of variables to PCS prediction vary considerably across all included perceived waterfront space attributes and sociodemographic covariates. Table 3 provides the relative contribution values and their corresponding rankings for each variable.
Table 3.
Relative contribution of independent variables to physical health.
The waterfront walkways rank first among all spatial attributes, with the highest relative contribution of 8.8%. As a linear feature connecting the main nodes of waterfront recreation spaces, it not only gives residents the basic conditions for moving around easily and comfortably, but also shows its value in guiding healthy behavior through the unique materials and textures it uses.
The relative contribution of plaza lighting ranks is second only to that of waterfront walkways, at 8.2%, highlighting the important role of nighttime environments in health support. For most office workers, the evening hours after a full day of work represent the main available time for leisure activities. Well-designed lighting not only enhances the nighttime accessibility and safety of public plazas but also provides spatial support for residents’ health-related activities and social interactions. In addition, it enhances the perceived attractiveness of waterfront parks after dark, thereby extending the duration of health-promoting activities.
Plant landscapes show a relative contribution of 5.3%. The variety of plant species, combined with their seasonal dynamics and changing arrangements, creates a living landscape that helps reduce visual fatigue and evoke a sense of connection to the natural environment, offering residents a temporary escape from stressful conditions [21,45]. Seating accounted for 4.0% of the total feature importance in the model. By helping residents recover from the physical tiredness associated with prolonged walking during recreational activities, seating indirectly extends the time they spend in waterfront settings and encourages more sustained engagement in health-related behaviors [46].
Open lawns for public access (3.1%) and waterside platforms (4.0%) serve as the spatial foundation for green recreation and water-oriented interaction, respectively. The former makes the waterfront park more accessible, while the latter allows residents to engage more directly with the water, thereby enhancing the vitality and appeal of the water’s edge.
Pet-friendly facilities represent a gathering space for pet owners, with a relative contribution of 4.0%. Shared hobbies can enhance the sense of belonging and social support in recreational spaces, bringing residents pleasure and relaxation, and may increase residents’ engagement in healthy activities [47].
3.2. Nonlinear Associations Between Key Perceived Attributes and PCS
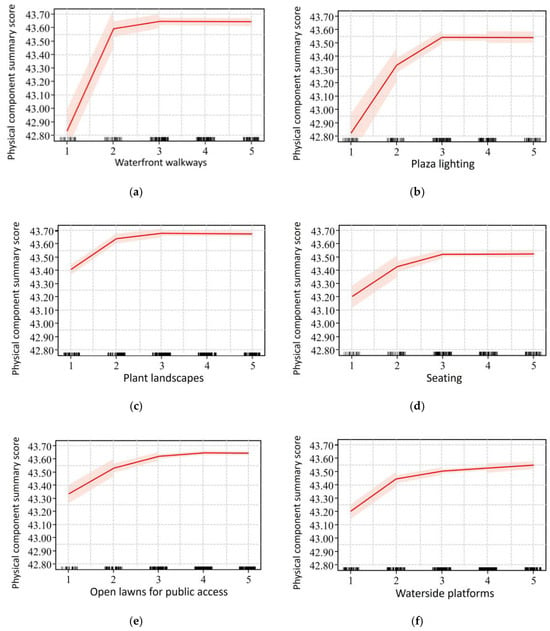
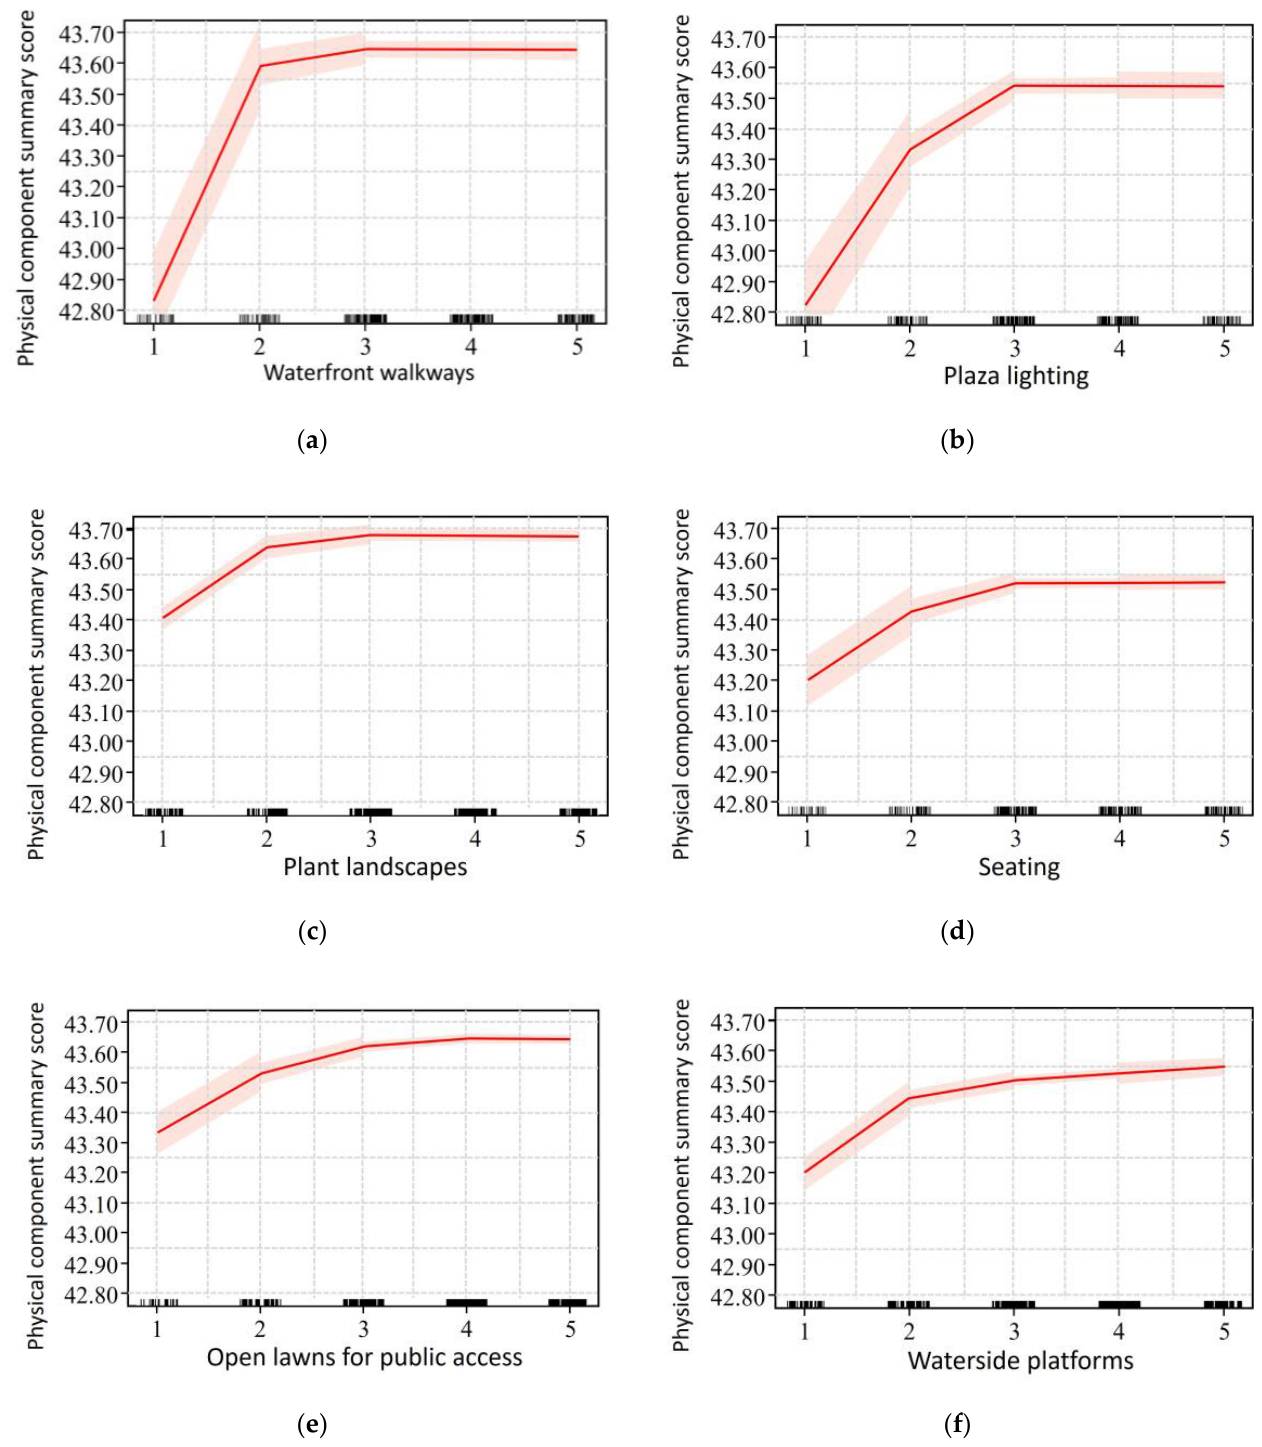
To illustrate the association patterns between important perceived variables and PCS across different score ranges, this study generated PDPs using the GBDT model. PDPs show the marginal contribution of a target variable to the predicted outcome at different values, while holding the average contributions of all other variables in the model constant. Figure 2 presents the PDPs for the six perceived waterfront recreation spaces variables with the highest relative contributions. The x-axis represents the perceived scores on a five-point scale, reflecting respondents’ subjective evaluations of each perceived attribute of waterfront recreation spaces. The y-axis shows the marginal predicted PCS values. The shape of each PDP’s curve thus reveals the statistical association between perceived scores and PCS.
Figure 2.
The relationships of perceived waterfront recreation spaces with residents’ physical health. (a) Waterfront walkways; (b) Plaza lighting; (c) Plant landscapes; (d) Seating; (e) Open lawns for public access; (f) Waterside platforms. Note: The x-axis represents the perceived scores for each item, measured on a 5-point Likert scale (1 = very poor to 5 = very good). The y-axis indicates the marginal predicted PCS values, where higher values reflect better self-rated physical health. The solid curves were generated as PDPs from a Gradient Boosting Decision Tree (GBDT) model (R package “gbm”), which was trained on an 8:2 split with 5-fold cross-validation repeated 10 times. Optimal hyperparameters were: learning rate = 0.001, tree depth = 10, and the number of trees = 922 (determined by early stopping with RMSE as the criterion). The test set performance was RMSE = 3.46 and R2 = 0.17. The shaded ribbons represent the 95% bootstrap confidence intervals. The narrow CI widths (≤15% of the total curve variation) confirm the robust stability of the nonlinear association shapes.
A positive nonlinear association was observed between the perceived scores of waterfront walkways and residents’ physical health (Figure 2a). When the perceived rating improved from “1” (very poor) to “2” (poor), the marginal PCS value rose from 42.8 to 43.6. As the rating moved from “2” (poor) to “3” (average), the PCS value increased only slightly, from 43.6 to 43.7. Beyond the “3” (average) level, the curve flattened out, with no further notable change in the marginal predicted PCS values.
The curve for plaza lighting shows a pattern similar to that of waterfront walkways. As the perceived score increased from “1” to “3”, the marginal PCS value rose from 42.8 to 43.5, after which it plateaued beyond “3” (Figure 2b). A consistent pattern was observed for plant landscapes, seating, waterside platforms, and open lawns for public access (Figure 2c–f): the marginal PCS values tended to increase as perceived scores moved from low levels toward the average level (score 3) and then leveled off beyond that range.
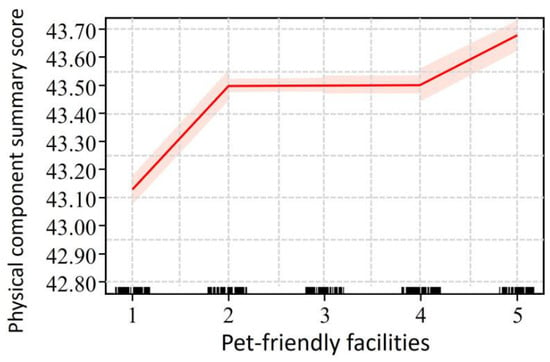
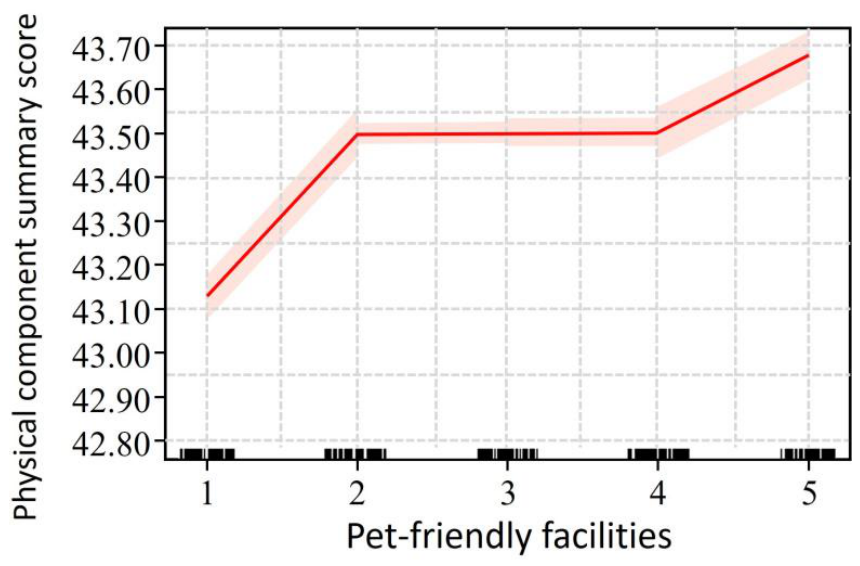
The PDPs curve for pet-friendly facilities exhibited a unique pattern (Figure 3). When perceived scores rose from “1” to “2”, the marginal PCS value increased from approximately 43.1 to 43.5. Between scores of “2” and “4”, the curve remained relatively stable. From “4” to “5”, the marginal PCS value rose again, from about 43.1 to 43.5.
Figure 3.
The relationships of perceived Pet-friendly facilities with residents’ physical health. Note: The x-axis represents the perceived scores for Pet-friendly facilities, measured on a 5-point Likert scale (1 = very poor to 5 = very good). The y-axis indicates the marginal predicted PCS values, where higher values reflect better self-rated physical health. The solid curves were generated as PDPs from a Gradient Boosting Decision Tree (GBDT) model (R package “gbm”). The shaded ribbons represent the 95% bootstrap confidence intervals.
In the PDP curves described above, the change in marginal PCS values ranged from approximately 0.8 to 0.9 points—modest in absolute terms. The practical value of such improvements lies mainly in their cumulative population-level impact: small absolute gains, when distributed across a large number of urban residents, may be associated with meaningful public health outcomes. Furthermore, the flattening of the marginal PCS curves beyond the average level (score 3) suggests that investment in waterfront recreation spaces might be more effectively directed toward bringing substandard facilities up to a basic usable level, rather than pursuing further upgrades on features that are already adequate.
This study seeks to uncover the nonlinear association between perceived scores and PCS, and to rank the relative contributions of key attributes. Accordingly, it provides empirical evidence on the health-related implications of waterfront spaces and offers reference-oriented suggestions for planning waterfront recreation spaces.
4. Discussion
By applying the GBDT model, this study uncovers a complex nonlinear relationship between perceived attributes of waterfront recreation spaces and residents’ physical health, pushing back against the conventional linear thinking that has long shaped research in this area. Our findings not only offer a new lens for understanding human-environment interactions but also provide a preliminary empirical basis for future causal research and the development of evidence-based planning tools. In the following sections, we discuss the results from three perspectives: an exploratory interpretation of key perceived attributes, planning recommendations for health-oriented waterfront spaces, and methodological reflections and limitations.
4.1. Nonlinear Associations Between Perceived Attributes of Waterfront Recreation Spaces and Physical Health: Exploratory Evidence Beyond the Linear Assumption
The core finding of this study is that perceived attributes of waterfront recreation spaces exhibit nonlinear associations with physical health scores. Specifically, when perceived scores are in the lower range, changes in attribute scores show a stronger relationship with health scores; however, once perceived scores exceed a certain range, further positive changes are associated with minimal additional health variation. This pattern was observed for waterfront walkways, plaza lighting, plant landscapes, seating, waterside platforms, and open lawns for public access. For a long time, research on health-oriented environmental interventions has largely been guided by a linear thinking assumption—that continued improvements to a given element will necessarily translate into continued health gains [48,49]. When this assumption is applied to policy, it tends to result in two typical forms of resource allocation failure. One is overinvestment, channeling funds into beautifying and upgrading facilities that have already met standards, well beyond the point where health returns begin to decline. The other is delayed identification and correction, failing to recognize and address underperforming attributes that fall below acceptable standards in a timely manner. The PDPs in this study illustrate the statistical association patterns between perceived scores of perceived attributes of waterfront recreation spaces and physical health scores. These patterns suggest that planners should pay attention to perceived shortcomings in waterfront recreation spaces. For attributes that have already reached moderate or higher perceived levels, further improvements in perceived scores are associated with relatively limited additional health variation.
Waterfront walkways (with the highest contribution of 8.8%) and plaza lighting (the second highest at 8.2%) showed the strongest associations with physical health scores. This finding aligns with previous research emphasizing the fundamental role of pathway connectivity and lighting in facilitating physical activity [15,50]. On the one hand, the waterfront walkways are a linear structural element and a key venue for physical activity within waterfront spaces, with their core value lying in connectivity and guidance [22]. It effectively links various functional nodes, encourages prolonged walking, and forms the material basis for promoting diverse health behaviors. Several existing studies corroborate the association between walkways and health. For example, Gardsjord et al. [51] emphasized the importance of sidewalks and trails for youth physical activity; Donahue et al. [15] identified trails as a key factor in urban park visits; and Zhai et al. [46] found that flat sidewalks are preferred by and influence the physical activity of older adults. On the other hand, plaza lighting directly expands the operational hours of waterfront spaces, catering to the after-hours leisure, social, and recreational needs of working professionals and others. This addresses a critical “time deficit” and is essential for developing a truly 24/7 healthy city. Furthermore, viewed through the lens of environmental psychology’s Stimulus-Organism-Response (SOR) framework, such environmental features act as stimuli. To effectively elicit a positive psychological state that leads to health-promoting behaviors, the stimulus must achieve an intensity threshold. The dim square lighting (a weak stimulus) fails to stimulate the willingness to engage in nighttime activity; once a baseline level of illumination is provided, a person’s sense of security (organism) is bolstered, the possibility of night activities (response) significantly increases; beyond this threshold, the association between more elaborate lighting designs and healthy behaviors is no longer significant. Therefore, for both the waterfront walkways and plaza lighting, the foremost planning objective should be to achieve this fundamental performance threshold, rather than to pursue aesthetic or luxurious refinement.
Pet-friendly facilities showed a distinctive association with physical health scores. Two noticeable positive changes in health scores were observed—one when perceived scores improved from “very poor” (1) to “poor” (2), and another when they moved from “good” (4) to “very good” (5). In contrast, changes in the middle range (from 2 to 4) were relatively modest. Previous studies have confirmed the positive impact of pet-friendly environments on physical health [47,52], which supports our findings. Wood et al. [53] found that owning a dog is associated with greater social engagement, especially through meeting new people while out walking. Similarly, Garrett et al. [54] found a significant association between dog walking and improved well-being. These findings suggest that pet-friendly spaces are not merely functional facilities but also serve as important social catalysts [53,54]. The two-step pattern observed in this study between perceived pet-friendly environments and physical health scores may be partly attributable to social interaction, although this interpretation remains speculative and provides a direction for future research. Future research could incorporate direct measures of social interaction to formally test this hypothesis. If confirmed, low-cost, highly inclusive pet-friendly design would not only function as a facility-based intervention but could also serve as an effective policy tool for repairing social networks and alleviating social isolation—offering high cost-effectiveness and strong social returns compared to large-scale medical investments.
4.2. From Exploratory Evidence to a Conceptual Framework: A Planning Proposal for Health-Oriented Waterfront Spaces
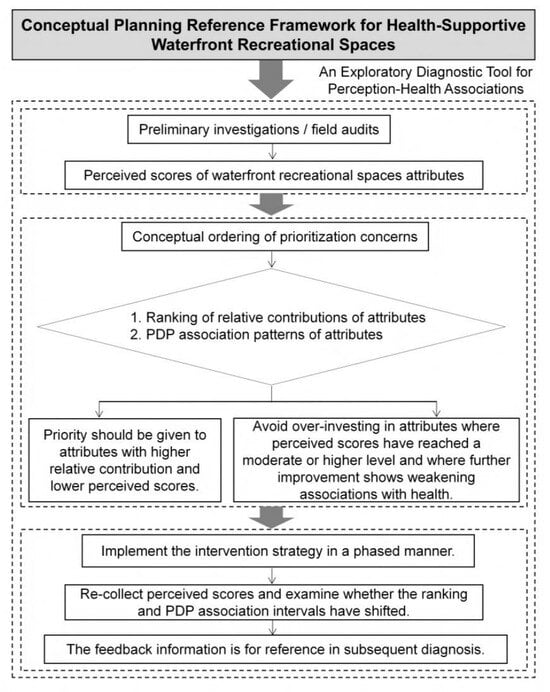
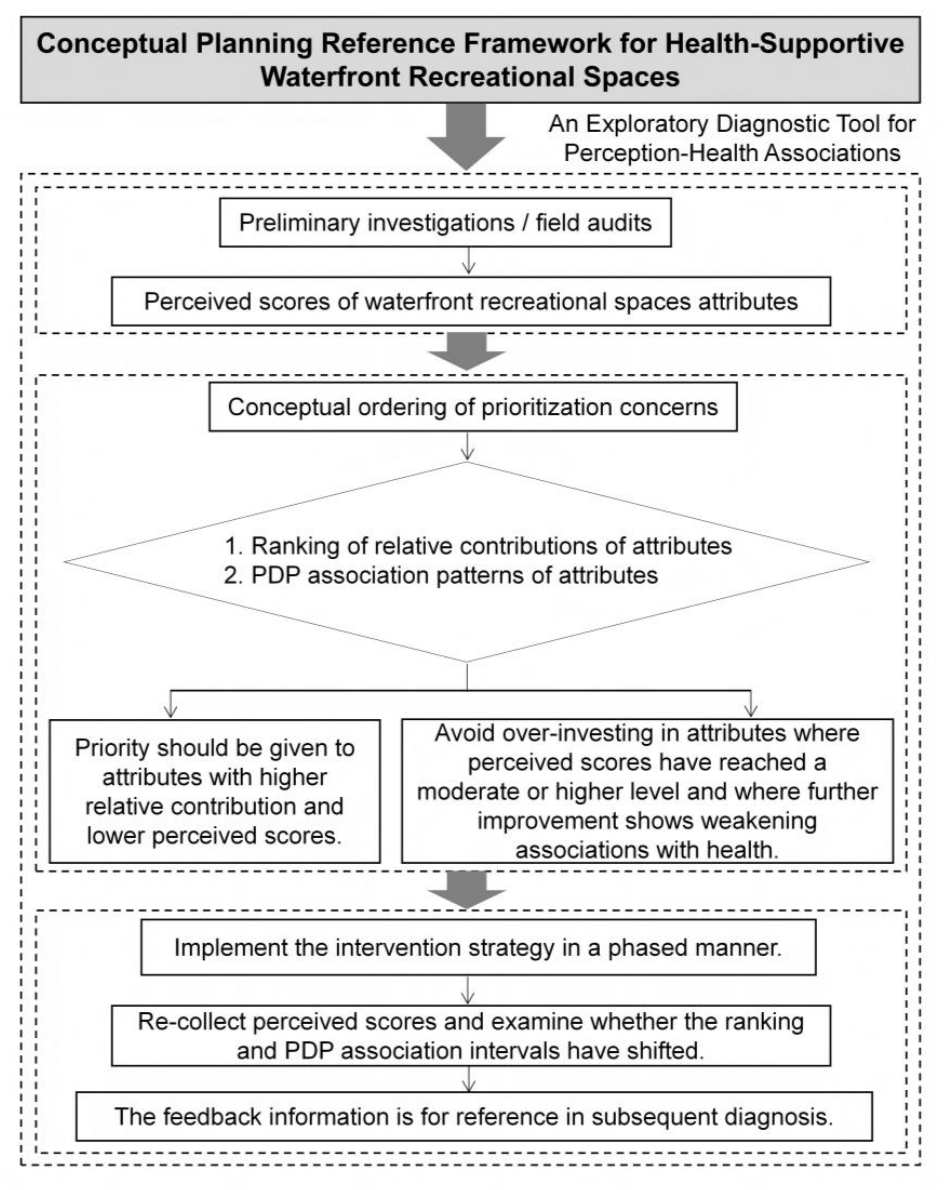
The exploratory findings of this study offer a preliminary conceptual framework for thinking about health-oriented governance of waterfront spaces. This framework follows a closed-loop logic: diagnosis of health-relevant attributes → potential prioritization → reference for planning guideline revision → post-evaluation recommendations, as illustrated in Figure 4. The core logic of this framework lies in using resident perception surveys to identify perceived shortcomings in spatial attributes, and then combining these with the element–health correlation patterns to generate a preliminary ranking of which shortcomings warrant priority attention. This ranking can then serve as a reference for subsequent project selection and design comparison.
Figure 4.
Conceptual planning reference framework for health-supportive waterfront recreation spaces. Note: This framework is constructed based on cross-sectional perceived data and illustrates statistical associations among variables. The descriptions in each module are conceptual proposals. PDPs stand for Partial Dependence Plot.
First, the conceptual framework can be connected with land use planning procedures. During the revision of regulatory detailed plans or the planning phase of urban renewal units, the GBDT model from this study could serve as a foundational support for a perceived environment and health assessment module. Planning institutions could conduct rapid surveys to obtain residents’ perceived scores for various spatial attributes. By cross-referencing these scores with the relative contribution rankings and PDPs’ association patterns between each element’s perceived score and health outcomes, a preliminary priority ordering can be generated. This process upgrades conventional qualitative situation analysis into quantitative gap diagnosis, offering basic support for the preparation of sections in planning documents related to problem identification and key intervention priorities. This framework primarily provides planners with an analytical structure and a set of priority assumptions; actual decisions must also incorporate cost-effectiveness and social needs.
Second, the conceptual planning reference framework can be aligned with cross-departmental collaborative governance mechanisms. Waterfront space management typically involves multiple agencies, including water affairs, landscaping, urban management, and sports, and the usual division between them often leads to fragmented and scattered resources. The perceived attributes we identified in this study, such as round-the-clock accessibility (plaza lighting), highlight the limitations of approaching planning from a single department’s perspective. Take improving plaza lighting, for example: it is not just a landscaping issue; it sits at the crossroads of the night-time economy and public safety. For this reason, it is advisable for local governments to incorporate the key perceived attributes identified in this study as reference items for guiding provisions when drafting waterfront planning and design guidelines, and to use them as a basis for packaging cross-departmental projects.
4.3. Methodological Strengths and Limitations
This study confirms the clear strengths of machine learning models in capturing complex relationships between the environment and health. Unlike traditional linear regression, GBDT does not require pre-defined relationship structures and can visually present association patterns between variables through PDPs. A capability that conventional parametric models struggle to achieve [55]. This methodological feature enables the identification of potential threshold patterns between perceived scores and health outcomes with relatively few prior assumptions, offering promising hypotheses for subsequent research.
This methodological advance has important implications for evidence-based decision-making in healthy city research, as it provides more granular insights for policy design [33,56]. Future research should further strengthen the policy simulation capacity of data-driven approaches. For example, by combining multi-source geospatial big data with machine learning methods for causal inference, such as causal forests and dual machine learning, the health benefits of waterfront renewal projects can be evaluated on a more refined spatiotemporal scale. Alternatively, an urban digital twin platform could be developed that incorporates the models in this study, enabling dynamic pre-evaluation of health performance for different planning scenarios and facilitating the comparison and selection of optimal design schemes.
This study has several limitations that warrant attention in future research.
A causal identification limitation of the cross-sectional design. This study employed cross-sectional survey data, and while the GBDT model captures associations, it cannot establish strict causal relationships. The model’s R2 of 0.17 indicates modest exploratory utility but limited explanatory power. Accordingly, the findings should be interpreted as exploratory rather than definitive. For practical planning, they should be complemented by local data and qualitative insights. Future studies could employ natural experiments or longitudinal cohort designs, combined with difference-in-differences (DID) or regression discontinuity designs.
Potential interference from park-level heterogeneity and nested data structure. The respondents in this study were drawn from seven distinct waterfront parks in Changchun, which differ objectively in terms of spatial location, site size, maintenance conditions, frequency of use, surrounding population density and socioeconomic composition, as well as public transport accessibility. While this multi-site sampling strategy enhances the representativeness of the sample, it also introduces potential between-group heterogeneity. Future studies could incorporate park-level random effects as control variables to isolate the influence of macro-level factors such as management practices and location.
Common method bias and insufficient integration of subjective and objective measurements. This study focused on residents’ subjective perceptions. Respondents’ individual traits, current psychological states, frequency of waterfront use, and even past health experiences may all influence their environmental evaluations. Although we controlled for socio-demographic variables such as age, gender, income, and occupation, which partially mitigated the influence of stable individual characteristics, we were unable to capture dynamic factors such as transient emotions or usage frequency. The theoretical premise of the Stimulus-Organism-Response (SOR) framework, that perceptions, as mediating variables, explain health differences better than objective measures, provides the conceptual rationale for adopting perceptual measures in this study. However, this does not imply that subjective perceptions should be equated with objective conditions. Future research could develop a dual-dimensional indicator system that incorporates both perceived and objective measures, and employ multilevel modeling or structural equation modeling to clarify the chain mediating pathways linking objective environment, subjective perception, and health outcomes.
Health-related confounding factors were not sufficiently controlled. Residents’ physical health is influenced by a range of factors, including exercise habits, smoking behavior, dietary quality, history of chronic diseases, and other baseline health behaviors and clinical indicators, as well as actual frequency of waterfront space use. Although this study adjusted for conventional covariates such as age and income, it did not collect information on the above key health behaviors or prior health status. The observed associations between perceived attributes of waterfront recreation spaces and physical health may partly reflect a self-selection effect, whereby healthier or more health-conscious individuals tend to use waterfront spaces more frequently and evaluate them more positively. Future studies could incorporate items such as the short form of the International Physical Activity Questionnaire (IPAQ), smoking and alcohol consumption habits, a self-reported checklist of chronic conditions, and weekly visit frequency, to more thoroughly tease out confounding influences in the analysis.
In summary, as an exploratory analysis based on cross-sectional perception data, the value of this study lies in being the first to systematically falsify the linearity assumption in the field of waterfront spaces and health, while providing quantifiable evidence on the relative importance of key perceived attributes. These findings offer clear hypotheses and prioritization directions for subsequent causal research. We encourage future studies to adopt more rigorous causal designs, incorporate multi-source objective data, include comprehensive health-related behavioral variables, and draw on cross-regional comparative samples, so as to further validate and refine the results, moving health-oriented waterfront governance from evidence-based suggestion toward causal substantiation.
5. Conclusions
This study takes waterfront recreation spaces in Changchun as an empirical case and employs the Gradient Boosting Decision Tree (GBDT) model to systematically quantify the relative contributions and nonlinear associations of 37 perceived spatial attributes on residents’ physical health. It further explores the relative contributions of each perceptual attribute to predicting the health score and their potential nonlinear associations with the physical health score. This will provide testable hypotheses and conceptual analytical ideas for subsequent research on health-oriented waterfront spaces.
First, the relative contributions of perceived attributes of waterfront recreation spaces show a clear gradient. In this dataset, waterfront walkways (8.8%) and plaza lighting (8.2%) are the two perceived attributes most strongly associated with PCS, with relative contributions higher than those of other waterfront recreation space variables included in this study. Plant landscapes (5.3%), seating (4.0%), pet-friendly facilities (4.0%), waterside platforms (4.0%), and open lawns for public access (3.1%) constitute a secondary tier. This gradient suggests that, among different types of perceived attributes of waterfront recreation spaces, foundational attributes related to spatial connectivity and round-the-clock usability may occupy a more prominent position in their association with health.
Second, most perceived attributes show nonlinear associations with PCS. The PDPs reveal that as perceived scores rise from lower levels toward a moderate level (around score 3, i.e., “average”), the marginal predicted PCS values tend to increase. Beyond this range, however, the curves level off. This pattern was observed for waterfront walkways, plaza lighting, plant landscapes, seating, waterside platforms, and open lawns for public access. In contrast, the PDPs curve for pet-friendly facilities exhibits a distinctive pattern. Two noticeable rises in marginal PCS values were identified—one when perceived scores improved from 1 to 2, and another from 4 to 5. This two-step pattern offers a mechanistic hypothesis worth pursuing in future research.
Third, this study puts forward a conceptual analytical framework. Building on the empirical findings above, we propose a closed-loop analytical logic—“diagnosis of health-relevant attributes → potential prioritization → reference for planning guideline revision → post-evaluation recommendations”—with the aim of offering a testable conceptual reference for planning suggestions in future research.
In summary, this study uncovers the likely nonlinear association patterns between perceived attributes of waterfront recreation spaces and self-reported physical health, and offers an initial ranking of the relative contributions of these perceived attributes. It introduces a new analytical paradigm for healthy city research and provides testable directions for hypothesis development. A conceptual framework is proposed, offering iterative theoretical support for translating environment–health association studies into planning practice, and yielding exploratory policy implications for diagnosing current conditions and identifying renewal priorities in urban waterfront spaces.
Author Contributions
Conceptualization, Y.L. and J.L. (Jinna Li); methodology, Y.L. and J.L. (Jinna Li); software, Y.L. and J.L. (Jiajun Liao); validation, J.L. (Jiajun Liao) and H.Z.; formal analysis, Y.L. and X.J.; investigation, J.L. (Jinna Li) and X.J.; resources, H.Z. and X.J.; data curation, Y.L. and J.L. (Jiajun Liao); writing—original draft preparation, Y.L. and J.L. (Jinna Li); writing—review and editing, J.L. (Jiajun Liao) and H.Z.; visualization, X.J.; supervision, H.Z.; project administration, Y.L.; funding acquisition, Y.L. and X.J. All authors have read and agreed to the published version of the manuscript.
Funding
This research was funded by the National Natural Science Foundation of China, grant number 52508063; the Education Department of Jilin Province, grant number JJKH20251003KJ; the Department of Housing and Urban–Rural Development of Jilin Province, grant number 2025-k-17; and the Key Project of the 14th Five-Year Plan for Educational Science of Jilin Province (2024), grant number ZD24038.
Data Availability Statement
The data presented in this study are available on request from the corresponding author due to privacy/ethical restrictions.
Conflicts of Interest
Author Jiajun Liao is employed by Changchun Jingyue Design Group Co., Ltd. The remaining authors declare that the research was conducted in the absence of any commercial or financial relationships that could be construed as a potential conflict of interest. The company had no involvement in the study design, collection, analysis, interpretation of data, the writing of this article, or the decision to submit it for publication.
References
- Chen, C.; Feng, X.; Yao, J.; Xiong, X. Perceived leisure service benefits of peri-urban community green spaces: Impact of visual environment during day and night. Landsc. Urban Plan. 2025, 259, 105338. [Google Scholar] [CrossRef] [Scilit]
- Mishra, H.S.; Bell, S.; Roberts, B.R.; White, M.P. Theory-based design for promoting positive behaviours in an urban blue space: Pre-and-post observations of a community co-created intervention in Plymouth, United Kingdom. Landsc. Urban Plan. 2023, 233, 104708. [Google Scholar]
- Du, H.; Zhou, F.; Cai, Y.; Li, C.; Xu, Y. Influence of features of green spaces on health and well-being: Case study of Shanghai, China. J. Urban Plan. Dev. 2021, 147, 04021008. [Google Scholar] [CrossRef] [Scilit]
- de Bell, S.; Graham, H.; Jarvis, S.W.; White, P.C.L. The importance of nature in mediating social and psychological benefits associated with visits to freshwater blue space. Landsc. Urban Plan. 2017, 167, 118–127. [Google Scholar] [CrossRef] [Scilit]
- Vert, C.; Gascon, M.; Ranzani, O.; Márquez, S.; Triguero-Mas, M.; Carrasco-Turigas, G.; Arjona, L.; Koch, S.; Llopis, M.; Donaire-Gonzalez, D.; et al. Physical and mental health effects of repeated short walks in a blue space environment: A randomised crossover study. Environ. Res. 2020, 186, 109812. [Google Scholar] [CrossRef] [Scilit]
- Jakstis, K.; Dubovik, M.; Laikari, A.; Mustajärvi, K.; Wendling, L.; Fischer, L.K. Informing the design of urban green and blue spaces through an understanding of Europeans’ usage and preferences. People Nat. 2023, 5, 162–182. [Google Scholar]
- Sugiyama, T.; Leslie, E.; Giles-Corti, B.; Owen, N. Associations of neighbourhood greenness with physical and mental health: Do walking, social coherence and local social interaction explain the relationships? J. Epidemiol. Community Health 2008, 62, e9. [Google Scholar]
- Wu, W.; Zheng, T.H. Establishing a “dynamic two-step floating catchment area method” to assess the accessibility of urban green space in Shenyang based on dynamic population data and multiple modes of transportation. Urban For. Urban Green. 2023, 82, 127893. [Google Scholar] [CrossRef] [Scilit]
- Bocarro, J.N.; Floyd, M.F.; Smith, W.R.; Edwards, M.B.; Schultz, C.L.; Baran, P.; Moore, R.A.; Cosco, N.; Suau, L.J. Social and environmental factors related to boys’ and girls’ park-based physical activity. Prev. Chronic Dis. 2015, 12, E96. [Google Scholar] [CrossRef] [Scilit]
- Sallis, J.F.; Cerin, E.; Conway, T.L.; Adams, M.A.; Frank, L.D.; Pratt, M.; Salvo, D.; Schipperijn, J.; Smith, G.; Cain, K.L.; et al. Physical activity in relation to urban environments in 14 cities worldwide: A cross-sectional study. Lancet 2016, 387, 2207–2217. [Google Scholar] [CrossRef] [Scilit] [PubMed]
- Wang, L.; Sani, N.M. The impact of outdoor blue spaces on the health of the elderly: A systematic review. Health Place 2024, 85, 103168. [Google Scholar] [CrossRef] [Scilit] [PubMed]
- Völker, S.; Matros, J.; Claßen, T. Determining urban open spaces for health-related appropriations: A qualitative analysis on the significance of blue space. Environ. Earth Sci. 2016, 75, 1067. [Google Scholar] [CrossRef] [Scilit]
- Zhao, J.; Xu, W.; Ye, L. Effects of auditory-visual combinations on perceived restorative potential of urban green space. Appl. Acoust. 2018, 141, 169–177. [Google Scholar] [CrossRef] [Scilit]
- Li, P.C.; Wu, W.; Yin, Y.C. Enhanced accessibility to park cooling services in developed areas: Experimental insights on the walkability in large urban agglomerations. Build. Environ. 2025, 272, 112665. [Google Scholar] [CrossRef] [Scilit]
- Donahue, M.L.; Keeler, B.L.; Wood, S.A.; Fisher, D.M.; Hamstead, Z.A.; McPhearson, T. Using social media to understand drivers of urban park visitation in the Twin Cities, MN. Landsc. Urban Plan. 2018, 175, 1–10. [Google Scholar] [CrossRef] [Scilit]
- Han, L.; Yu, B.; Fang, H.; Jiang, Y.; Yang, Y.; Qiu, H. Deciphering the Impact of Waterfront Spatial Environments on Physical Activity Through SHAP: A Tripartite Study of Riverfront, Lakeshore, and Seafront Spaces in Shenzhen. Land 2025, 14, 2424. [Google Scholar] [CrossRef] [Scilit]
- Smith, N.; Georgiou, M.; King, A.C.; Tieges, Z.; Webb, S.; Chastin, S. Urban blue spaces and human health: A systematic review and meta-analysis of quantitative studies. Cities 2021, 119, 103413. [Google Scholar] [CrossRef] [Scilit]
- Cheng, L.; De Vos, J.; Zhao, P.; Yang, M.; Witlox, F. Examining non-linear built environment effects on elderly’s walking: A random forest approach. Transp. Res. D 2020, 88, 102552. [Google Scholar]
- Gascon, M.; Zijlema, W.; Vert, C.; White, M.P.; Nieuwenhuijsen, M.J. Outdoor blue spaces, human health and well-being: A systematic review of quantitative studies. Int. J. Hyg. Environ. Health 2017, 220, 1207–1221. [Google Scholar] [CrossRef] [Scilit] [PubMed]
- Saelens, B.E.; Frank, L.D.; Auffrey, C.; Whitaker, R.C.; Burdette, H.L.; Colabianchi, N. Measuring physical environments of parks and playgrounds: EAPRS instrument development and inter-rater reliability. J. Phys. Act. Health 2006, 3, S190. [Google Scholar] [CrossRef] [Scilit] [PubMed]
- Sun, D.; Zhou, F.; Lin, J.; Yang, Q.; Lyu, M. A study on landscape feature and emotional perception evaluation of waterfront greenway. Environ. Res. Commun. 2024, 6, 095015. [Google Scholar] [CrossRef] [Scilit]
- Völker, S.; Kistemann, T. Developing the urban blue: Comparative health responses to blue and green urban open spaces in Germany. Health Place 2015, 35, 196–205. [Google Scholar] [CrossRef] [Scilit] [PubMed]
- Ware, J.E.; Kosinski, M.; Keller, S.D. SF-12: How to Score the SF-12 Physical and Mental Health Summary Scales, 2nd ed.; The Health Institute, New England Medical Center: Boston, MA, USA, 1995. [Google Scholar]
- Ware, J.E.; Kosinski, M.; Keller, S.D. A 12-Item Short-Form Health Survey: Construction of scales and preliminary tests of reliability and validity. Med. Care 1996, 34, 220–233. [Google Scholar] [PubMed]
- Weden, M.M.; Carpiano, R.M.; Robert, S.A. Subjective and objective neighborhood characteristics and adult health. Soc. Sci. Med. 2008, 66, 1256–1270. [Google Scholar] [CrossRef] [Scilit] [PubMed]
- Gao, M.; Ahern, J.; Koshland, C.P. Perceived built environment and health-related quality of life in four types of neighborhoods in Xi’an, China. Health Place 2016, 39, 110–115. [Google Scholar] [PubMed]
- Lak, A.; Khodakarim, S.; Myint, P.K.; Baradaran, H.R. The influencing factors of elder-friendly public open spaces promoting older adults’ health in deprived urban neighborhoods: Partial least square structural equation modeling approach. Front. Public Health 2023, 11, 1143289. [Google Scholar] [CrossRef] [Scilit] [PubMed]
- Lam, C.L.K.; Gandek, B. Is the standard SF-12 Health Survey valid and equivalent for a Chinese population? Qual. Life Res. 2005, 14, 539–547. [Google Scholar]
- Su, S.-W.; Wang, D. The reliability and validity of Short Form-12 Health Survey Version 2 for Chinese older adults. Iran. J. Public Health 2019, 48, 1014. [Google Scholar] [PubMed]
- Lin, Y.; Yu, Y.; Zeng, J.; Zhao, X.; Wan, C. Comparing the reliability and validity of the SF-36 and SF-12 in measuring quality of life among adolescents in China: A large sample cross-sectional study. Health Qual. Life Outcomes 2020, 18, 360. [Google Scholar] [CrossRef] [Scilit] [PubMed]
- Zhao, L.C.; Yang, Z.; Hu, X. Equivalence of SF-12v2 and SF-36v2 in Assessing Health Related Quality of Life in a General Population in Chengdu. J. Sichuan Univ. (Med. Sci. Ed.) 2018, 49, 87–92. [Google Scholar]
- Cao, J.; Tao, T. Using machine-learning models to understand nonlinear relationships between land use and travel. Transp. Res. D 2023, 123, 103930. [Google Scholar] [CrossRef] [Scilit]
- Dong, W.; Cao, X.; Wu, X.; Dong, Y. Examining pedestrian satisfaction in gated and open communities: An integration of gradient boosting decision trees and impact-asymmetry analysis. Landsc. Urban Plan. 2019, 185, 246–257. [Google Scholar] [CrossRef] [Scilit]
- Fan, L.; Cao, J.; Hu, M.; Yin, C. Exploring the importance of neighborhood characteristics to and their nonlinear effects on life satisfaction of displaced senior farmers. Cities 2022, 131, 103605. [Google Scholar]
- Sun, S.; Guo, L.; Yang, S.; Cao, J. Exploring the contributions of Ebike ownership, transit access, and the built environment to car ownership in a developing city. J. Transp. Geogr. 2024, 116, 103834. [Google Scholar] [CrossRef] [Scilit]
- Friedman, J.H. Greedy function approximation: A gradient boosting machine. Ann. Stat. 2001, 29, 1189–1232. [Google Scholar] [CrossRef] [Scilit]
- Zhan, Z.L.; Guo, Y.Y.; Noland, R.B.; He, S.Y.; Wang, Y.C. Analysis of links between dockless bikeshare and metro trips in Beijing. Transp. Res. A Policy Pract. 2023, 175, 103784. [Google Scholar] [CrossRef] [Scilit]
- Zhang, W.J.; Zhao, Y.J.; Cao, X.Y.; Lu, D.L.; Chai, Y.W. Nonlinear effect of accessibility on car ownership in Beijing: Pedestrian-scale neighborhood planning. Transp. Res. Part D 2020, 86, 102445. [Google Scholar] [CrossRef] [Scilit]
- Li, W.; Cao, X.; Hou, Q.; Wei, Y. Which matters to commuting-related CO2 emissions? Parking, population suburbanization, or employment decentralization? Transp. Res. Part D 2025, 139, 104461. [Google Scholar]
- Ding, C.; Cao, X.; Wang, Y. Synergistic effects of the built environment and commuting programs on commute mode choice. Transp. Res. Part A Policy Pract. 2018, 118, 104–118. [Google Scholar] [CrossRef] [Scilit]
- Ding, C.; Cao, X.; Liu, C. How does the station-area built environment influence metrorail ridership? Using gradient boosting decision trees to identify non-linear thresholds. J. Transp. Geogr. 2019, 77, 70–78. [Google Scholar]
- Ding, C.; Cao, X.; Næss, P. Applying gradient boosting decision trees to examine non-linear effects of the built environment on driving distance in Oslo. Transp. Res. Part A Policy Pract. 2018, 110, 107–117. [Google Scholar] [CrossRef] [Scilit]
- Isıkhan, S.Y.; Karabulut, E.; Alpar, C.R. Determining cutoff point of ensemble trees based on sample size in predicting clinical dose with DNA microarray data. Comput. Math. Methods Med. 2016, 2016, 6794916. [Google Scholar] [CrossRef] [Scilit]
- Yang, P.; Yang, Y.H.; Zhou, B.B.; Zomaya, A.Y. A review of ensemble methods in bioinformatics. Curr. Bioinform. 2010, 5, 296–308. [Google Scholar] [CrossRef] [Scilit]
- Zhou, X.; Cen, Q.; Qiu, H. Effects of urban waterfront park landscape elements on visual behavior and public preference: Evidence from eye-tracking experiments. Urban For. Urban Green. 2023, 82, 127889. [Google Scholar] [CrossRef] [Scilit]
- Zhai, Y.; Li, D.; Wu, C.; Wu, H. Urban park facility use and intensity of seniors’ physical activity: An examination combining accelerometer and GPS tracking. Landsc. Urban Plan. 2020, 205, 103950. [Google Scholar]
- Kaivalya, M.L.; Crozier, A.J.; Nottle, C.; Young, J. More than dog walking: Pets as physical activity and social connection facilitators in the lives of retirement village residents. Hum.-Anim. Interact. 2023, 11, 2–10. [Google Scholar]
- Yan, T.; Leng, H.; Yuan, Z. Construction of the “Full Path” of restorative effects on older adults’ mental health in parks under seasonal differences: Taking Changchun as an example. Front. Public Health 2024, 12, 1269249. [Google Scholar] [CrossRef] [Scilit] [PubMed]
- Du, H.Y.; Zhou, F.Q.; Fu, Y.R. Impact of urban waterfront green spaces on public health and well-being based on user perspectives. J. Urban Plan. Dev. 2025, 151, 04024062. [Google Scholar] [CrossRef] [Scilit]
- Zhang, R.; Wulff, H.; Duan, Y.P.; Wagner, P. Associations between the physical environment and park-based physical activity: A systematic review. J. Sport Health Sci. 2019, 8, 10. [Google Scholar] [CrossRef] [Scilit]
- Gardsjord, H.S.; Tveit, M.S.; Nordh, H. Promoting youth’s physical activity through park design: Linking theory and practice in a public health perspective. Landsc. Res. 2014, 39, 70–81. [Google Scholar]
- Hamasaki, H. Dog ownership: Is it beneficial for physical activity, cardiovascular disease, and diabetes? AIMS Med. Sci. 2020, 7, 311–327. [Google Scholar] [CrossRef] [Scilit]
- Wood, L.; Giles-Corti, B.; Bulsara, M. The pet connection: Pets as a conduit for social capital? Soc. Sci. Med. 2005, 61, 1159–1173. [Google Scholar] [CrossRef] [Scilit] [PubMed]
- Garrett, J.K.; White, M.P.; Elliott, L.R.; Grellier, J.; Bell, S.; Bratman, G.N.; Economou, T.; Gascon, M.; Lõhmus, M.; Nieuwenhuijsen, M.; et al. Applying an ecosystem services framework on nature and mental health to recreational blue space visits across 18 countries. Sci. Rep. 2023, 13, 6129. [Google Scholar] [CrossRef] [Scilit]
- Shao, Q.; Zhang, W.; Cao, X.; Yang, J.; Yin, J. Threshold and moderating effects of land use on metro ridership in Shenzhen: Implications for TOD planning. J. Transp. Geogr. 2020, 89, 102878. [Google Scholar] [CrossRef] [Scilit]
- Cao, J.; Hao, Z.; Yang, J.; Yin, J.; Huang, X. Prioritizing neighborhood attributes to enhance neighborhood satisfaction: An impact asymmetry analysis. Cities 2020, 105, 102854. [Google Scholar] [CrossRef] [Scilit]

Disclaimer/Publisher’s Note: The statements, opinions and data contained in all publications are solely those of the individual author(s) and contributor(s) and not of MDPI and/or the editor(s). MDPI and/or the editor(s) disclaim responsibility for any injury to people or property resulting from any ideas, methods, instructions or products referred to in the content. |
© 2026 by the authors. Licensee MDPI, Basel, Switzerland. This article is an open access article distributed under the terms and conditions of the Creative Commons Attribution (CC BY) license.