1. Introduction
Reinforced concrete frame structures (RCFSs) are widely used in school buildings, office buildings, residential buildings, and public facilities because of their flexible layout, mature construction techniques, and favorable cost-effectiveness. However, post-earthquake investigations have shown that RCFSs are vulnerable to beam–column joint cracking, column-end concrete crushing, concrete cover spalling, reinforcement exposure, inter-story drift concentration, residual deformation, and even global instability under strong seismic excitations [
1,
2,
3,
4]. Such vulnerability is more pronounced in exterior-corridor teaching buildings, soft-story frames, buildings on sloped sites, and structures with irregular infill-wall layouts, where stiffness, mass, and load-transfer paths are unevenly distributed [
5,
6,
7,
8,
9,
10,
11,
12]. The widespread damage observed in RC school and public buildings during the 2008 Wenchuan earthquake provides a representative engineering background for examining the deterioration of RCFSs under strong seismic excitation. In particular, many exterior-corridor teaching buildings and irregular RCFSs exhibited damage features such as beam–column joint cracking, column-end crushing, concrete cover spalling, reinforcement exposure, residual deformation, and partial instability. Some severely damaged RCFSs did not collapse immediately after the earthquake, but remained in a metastable condition with serious local damage and significantly degraded global stability. This critical transitional condition is defined in this study as the semi-ruin state of RCFSs.
The semi-ruin state denotes a critical transitional stage during which an RCFS evolves from severe damage toward global structural collapse following a strong earthquake. This state is typically featured by extensive crack penetration, concrete cover spalling, reinforcement exposure, considerable residual deformation, and substantial degradation of local load-bearing capacity. Although the structure can still sustain temporary geometric equilibrium at this stage, its lateral stiffness and resistance against incidental secondary disturbances are significantly degraded. Accordingly, structures in such a condition face a prominent secondary collapse risk triggered by aftershocks, rescue and construction-related disturbances or supplementary imposed loads [
13,
14]. Similar problems of residual instability and post-event collapse risk have also been reported after major earthquakes in other seismic regions, such as the 2011 Christchurch earthquake in New Zealand, the 2015 Gorkha earthquake in Nepal, the 2017 Puebla–Mexico City earthquake in Mexico, and the 2023 Turkey–Syria earthquakes. Hence, precise identification of the evolution law and quantitative features of the semi-ruin state of RCFSs is essential for post-earthquake structural hazard assessment, emergency rescue routing, secondary collapse risk evaluation, and reconstruction planning of seismically damaged building clusters.
In recent years, extensive studies have improved the understanding of seismic damage and collapse behavior of RCFSs. Shaking table tests, refined numerical simulations, fragility analysis, and post-earthquake damage assessment have been used to investigate dynamic response, stiffness degradation, residual deformation, inter-story drift concentration, joint failure, collapse probability, and seismic vulnerability of RC structural systems [
15,
16,
17,
18,
19,
20,
21,
22,
23,
24,
25,
26,
27,
28]. In addition, machine-learning-based approaches have recently been introduced to predict seismic damage states of RCFSs using structural response parameters and nonlinear analysis results [
29]. These studies provide valuable insights into the damage evolution and seismic risk of RCFSs. Nevertheless, most existing research focuses mainly on component damage, global seismic response, collapse limit states, or vulnerability assessment, while the critical transition from severe damage to the metastable semi-ruin state remains insufficiently quantified.
Meanwhile, rapid advances in computer vision, deep learning, image processing, and DIC have provided new tools for structural damage detection and full-field deformation measurement [
30,
31,
32,
33,
34,
35]. Image-based methods have been successfully applied to crack detection, damage localization, post-disaster building inspection, and visual damage quantification, while DIC can capture continuous displacement, strain, crack initiation, crack propagation, and local deformation fields. Compared with conventional discrete sensors such as accelerometers, displacement transducers, and strain gauges, DIC provides richer spatial information for identifying localized damage. The integration of DIC-based visual damage quantification with shaking table testing is still limited for RCFSs, especially for tracking the full-process evolution from local cracking to through-crack penetration, concrete cover spalling, residual deformation accumulation, and semi-ruin-state formation [
36,
37,
38].
However, a quantitative local-to-global understanding of how RCFSs evolve from severe damage to a metastable semi-ruin state remains insufficient. In particular, the coupling relationship between local visual damage, such as crack accumulation, through-crack penetration and concrete cover spalling, and global deformation responses, such as inter-story drift and residual inclination, has not been clearly established. To address this gap, this study takes a typical seismically damaged exterior-corridor RC frame building observed in the 2008 Wenchuan earthquake as the prototype, carries out a scaled shaking table test on an RCFS specimen, and employs DIC technology to realize full-field visual monitoring of the full structural failure process. By establishing a multidimensional damage index system consisting of crack line density, through-crack ratio, crack propagation rate, concrete cover spalling ratio, and inter-story drift ratio, this study aims to reveal the progressive evolutionary mechanism of RCFSs subjected to severe seismic excitations, whereby structures evolve from local cracking and through-crack development to concrete cover spalling, global deformation accumulation, and eventual formation of the semi-ruin state. This study not only overcomes the limitations of conventional discrete measurement methods for synchronous characterization of local damage and global deformation, but also provides a quantitative basis for experimental identification of the semi-ruin state of RCFSs, post-earthquake damage classification, and secondary collapse risk assessment. The main contributions of this study are as follows:
(1) The staged damage evolution of an RCFS toward the semi-ruin state is experimentally revealed through a scaled shaking table test.
(2) DIC-based local damage indices are established to quantify crack line density, crack propagation rate, through-crack ratio, and concrete spalling ratio, thereby characterizing the spatial evolution of local damage.
(3) A multi-index identification framework is proposed by integrating local damage indices with the inter-story drift ratio, providing a basis for identifying the transition from severe damage to the semi-ruin state.
The remainder of this paper is organized as follows.
Section 2 describes the test model, shaking table setup, ground motions, and DIC monitoring method.
Section 3 presents the dynamic responses of the RCFS.
Section 4 quantifies the DIC-based damage evolution.
Section 5 identifies the semi-ruin state using multi-index criteria. Finally,
Section 5 summarizes the main conclusions.
3. Results
3.1. Observations of the Complete Structural Failure Process
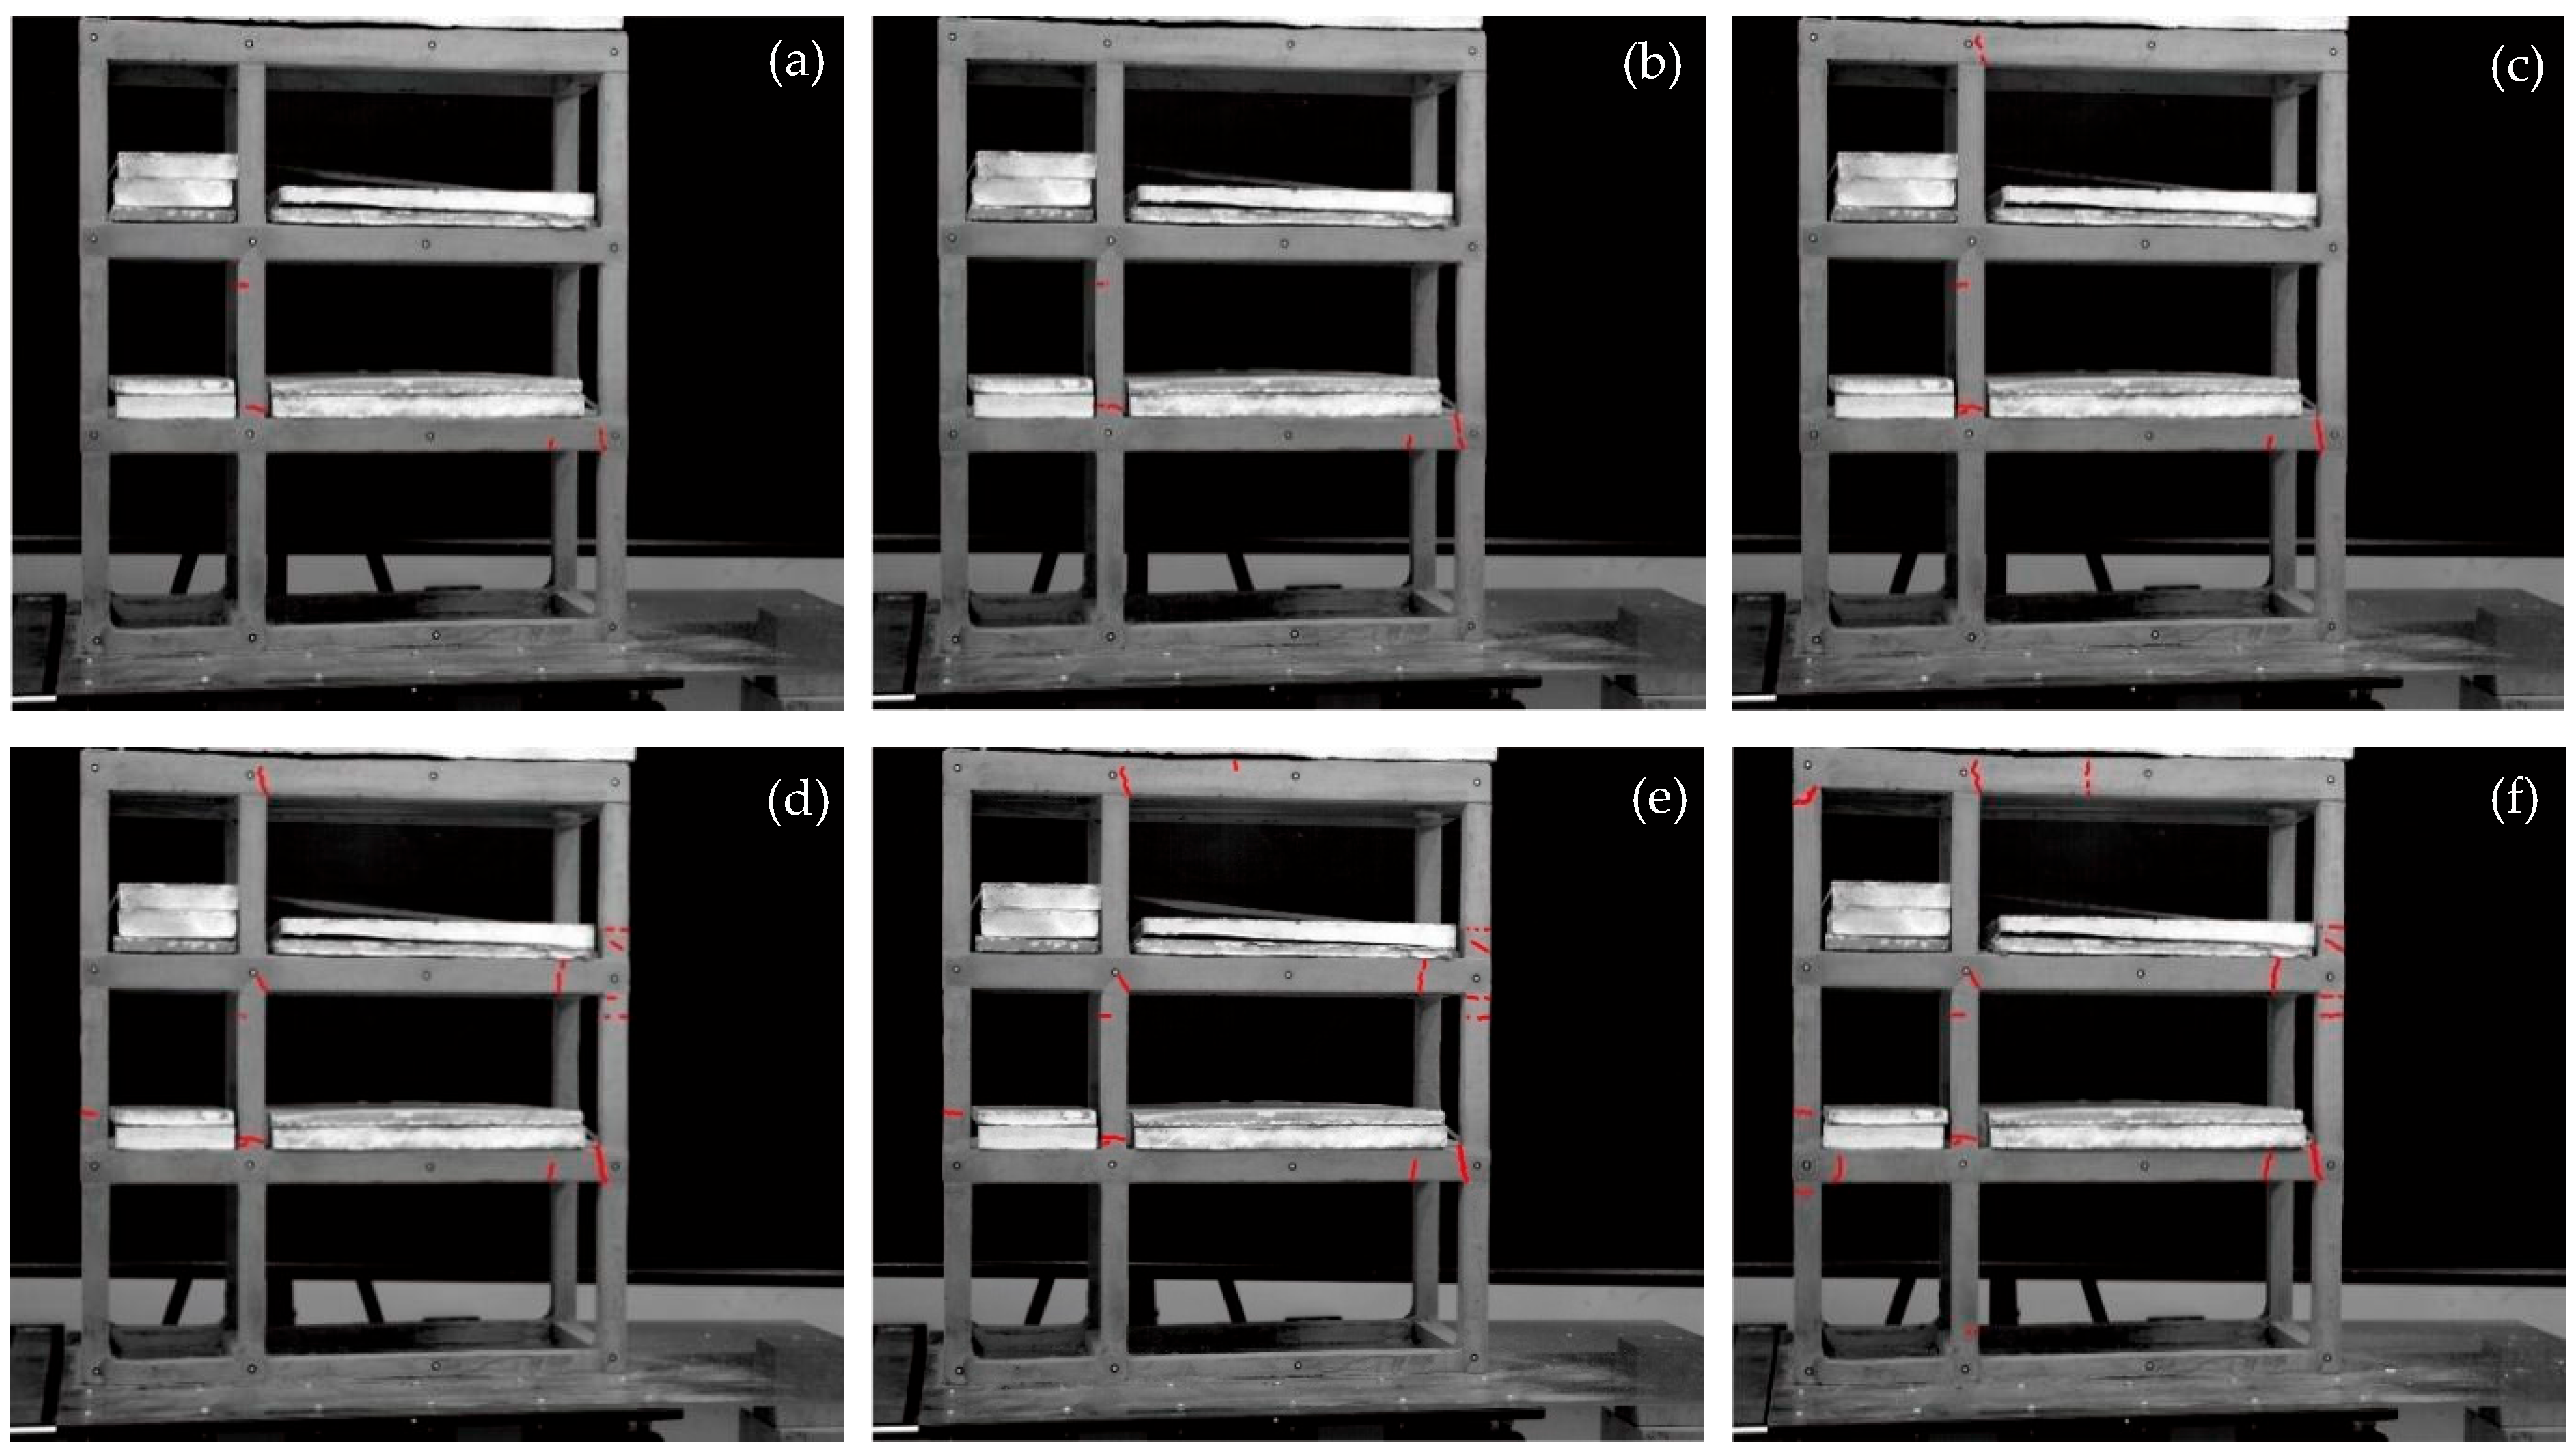
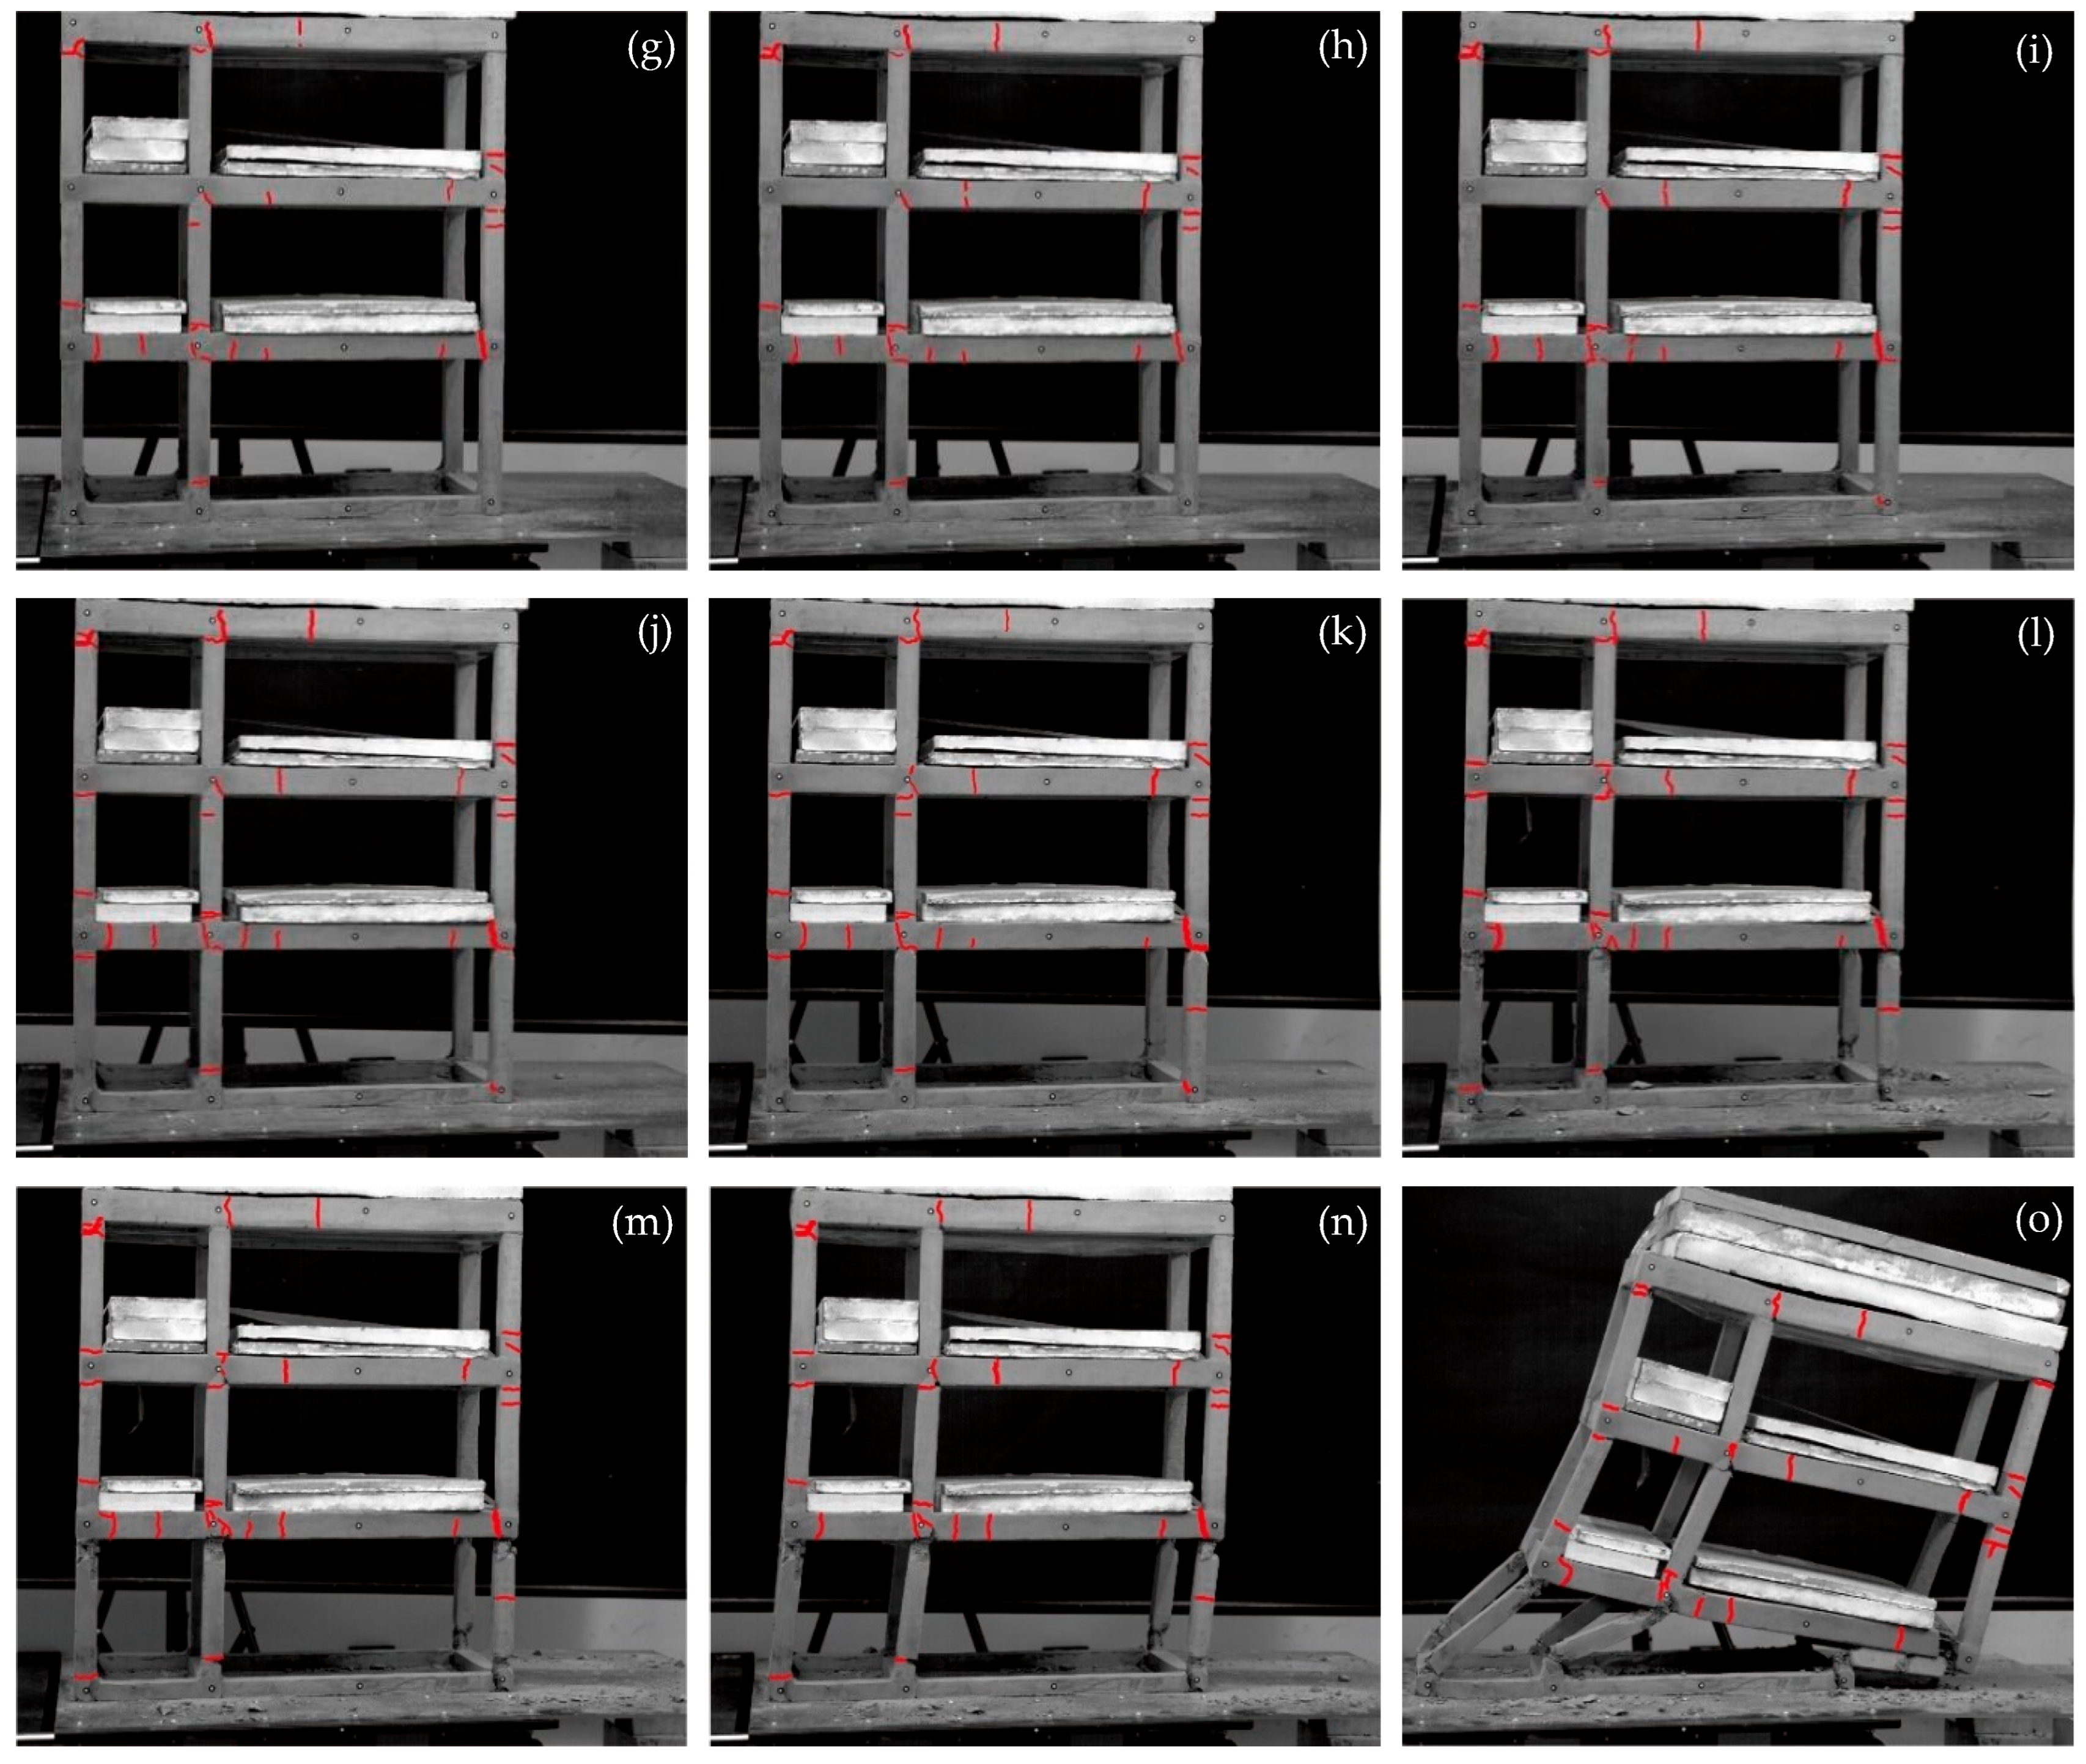
Incremental-amplitude shaking table tests with rising PGA excitations were performed, whereby the RCFS specimen experienced a full damage evolution from an intact elastic condition through incipient and severe damage to the eventual semi-ruin state, as illustrated in
Figure 5.
At low excitation levels with PGA < 0.3 g, the specimen exhibited negligible global dynamic responses, and no visible cracks were detected on beams, columns or floor slabs, implying the structural system stayed within the elastic working range. Upon PGA rising to 0.3 g, fine hairline cracks initiated at slab peripheries and beam-column joint zones (
Figure 5a). Further PGA amplification up to 0.8 g triggered prominent structural vibration accompanied by a sharp rise in crack density, with dense crack networks concentrated primarily at beam-column joints (
Figure 5g). When PGA reached 1.2 g, existing cracks propagated inwards, minor concrete cover spalling emerged at the bottom of first-floor columns, and measurable stiffness degradation commenced for the tested frame (
Figure 5j). At PGA = 1.5 g, progressive damage accumulation drove through-section crack formation; substantial concrete cover spalling occurred at the ground-floor and first-floor joints, with the maximum detached concrete fragment measured around 42 mm (
Figure 5l). A PGA of 1.7 g induced remarkable residual deformation, obvious reduction in global structural stability and drastically enlarged inter-story drift ratios, accompanied by visible structural tilting (
Figure 5n). Once PGA was elevated to 1.8 g, the specimen arrived at its critical limit state featured by pervasive through cracks, severe concrete cover spalling, exposed reinforcing steel and evident inter-layer dislocation; prominent global inclination of upper floors marked the onset of the semi-ruin state (
Figure 5o).
The full seismic damage-to-collapse evolution of the tested RCFS follows a typical path from localized component deterioration toward overall structural instability and can be categorized into six successive stages:
(i) Crack initiation and propagation: Fine fractures first nucleate at beam–column joints and slab peripheries before fast extension along critical stress paths.
(ii) Reinforcement yielding and stiffness degradation: Longitudinal steel yielding induces progressive reduction in lateral stiffness, accompanied by accelerated nonlinear accumulation of inter-story drift ratios.
(iii) Concrete cover spalling: Cover concrete peels off at critical beam and column zones with gradual exposure of reinforcing bars, resulting in degraded local load-carrying capacity.
(iv) Severe localized component damage: Through-thickness cracks and substantial concrete spalling concentrate at vulnerable locations including bottom ends of ground-floor columns and beam terminals.
(v) Component failure and incipient global destabilization: Structural deformation concentrates across discrete floors, remarkable residual displacement emerges at upper levels, and the frame progressively loses its overall stability.
(vi) Development of the semi-ruin state: Widespread cracking, concrete cover spalling and exposed reinforcement are extensively distributed over the specimen. Despite the absence of full structural collapse, the frame suffers obvious global tilting accompanied by drastic deterioration in residual bearing capacity.
Such progressive evolution clarifies the residual load-bearing performance and underlying failure mechanism of RCFS subjected to strong ground motions, and further supplies fundamental experimental support for the construction of post-quake emergency rescue scenarios.
3.2. Crack Evolution Characteristics
3.2.1. Quantitative Evaluation Indices for Structural Damage
Cracking is the most intuitive and representative visual damage feature of RCFSs subjected to seismic loading. The spatial distribution, propagation path, and evolutionary characteristics of cracks can directly reflect tensile damage, stiffness degradation, force redistribution, and the development of local plasticity in structural members. In addition, concrete cover spalling is generally associated with severe local compression failure, degradation of confinement efficiency, reinforcement exposure, and loss of local bearing capacity. Therefore, visual damage features extracted from DIC and image-processing techniques can provide an objective basis for quantitative post-earthquake damage assessment.
Previous studies have demonstrated that DIC is capable of detecting crack initiation, monitoring crack width, and capturing full-field deformation responses of reinforced concrete members. Image-processing-based methods have also been widely used to extract crack length, crack width, crack orientation, and crack areal density for damage assessment of RC components [
41,
42,
43]. Furthermore, post-earthquake damage evaluation guidelines for RC buildings commonly use visible damage characteristics, including cracking, concrete cover crushing, spalling, and reinforcement exposure, to classify member damage and estimate residual seismic capacity [
44,
45]. On this basis, four quantitative damage indices are proposed in this study to characterize the full-range damage evolution of RCFSs from the intact state to the semi-ruin state, namely crack line density (CLD), through-crack ratio (TCR), crack propagation rate (CPR), and concrete spalling ratio (CSR). These indices describe different dimensions of structural damage, including crack accumulation, integrity loss of load-transfer paths, rapid crack propagation, and concrete cover failure.
(i) CLD quantifies the surface distribution density of structural cracks and serves as a critical indicator for evaluating macroscopic damage severity, as defined in Equation (2).
where L is the total crack length and A represents the monitored surface area. With the amplification of seismic excitation, CLD increases continuously, reflecting the progressive deterioration of the structure from localized crack initiation to global damage accumulation.
(ii) TCR evaluates the structural integrity of primary load-transfer paths and quantifies the damage degree of the load-bearing skeleton, as expressed in Equation (3).
where N
p denotes the number of through-cracks that fully penetrate the cross-sectional height or thickness of structural components, and N
t is the total number of cracks. A higher TCR value signifies severe damage to the load-bearing system and substantial degradation of seismic resistance. Accordingly, TCR provides a reliable criterion for judging the damage state of RCFSs.
(iii) CPR characterizes the dynamic evolution rate of cracks under incremental seismic loading, as defined in Equation (4).
where ΔL is the incremental total crack length between adjacent loading stages, and ΔPGA is the corresponding increment of peak ground acceleration. This index effectively identifies the critical excitation interval for rapid crack propagation and offers a quantitative basis for determining the nonlinear behavioral transition of structures.
(iv) CSR characterizes the transition of RCFSs from minor damage to the semi-ruin state. It is defined as the area ratio of concrete spalling regions to the total exposed component surface, as shown in Equation (5).
where A
s is the spalling area of concrete cover and A
t is the total surface area of the component. CSR intuitively reflects the degree of concrete cover failure and further indicates the degradation of steel confinement efficiency and local bearing capacity. Therefore, this index can quantitatively distinguish structural damage grades, ranging from repairable minor damage and severe damage to the critical semi-ruin state.
3.2.2. Evolution of Crack Distribution with Excitation Intensity
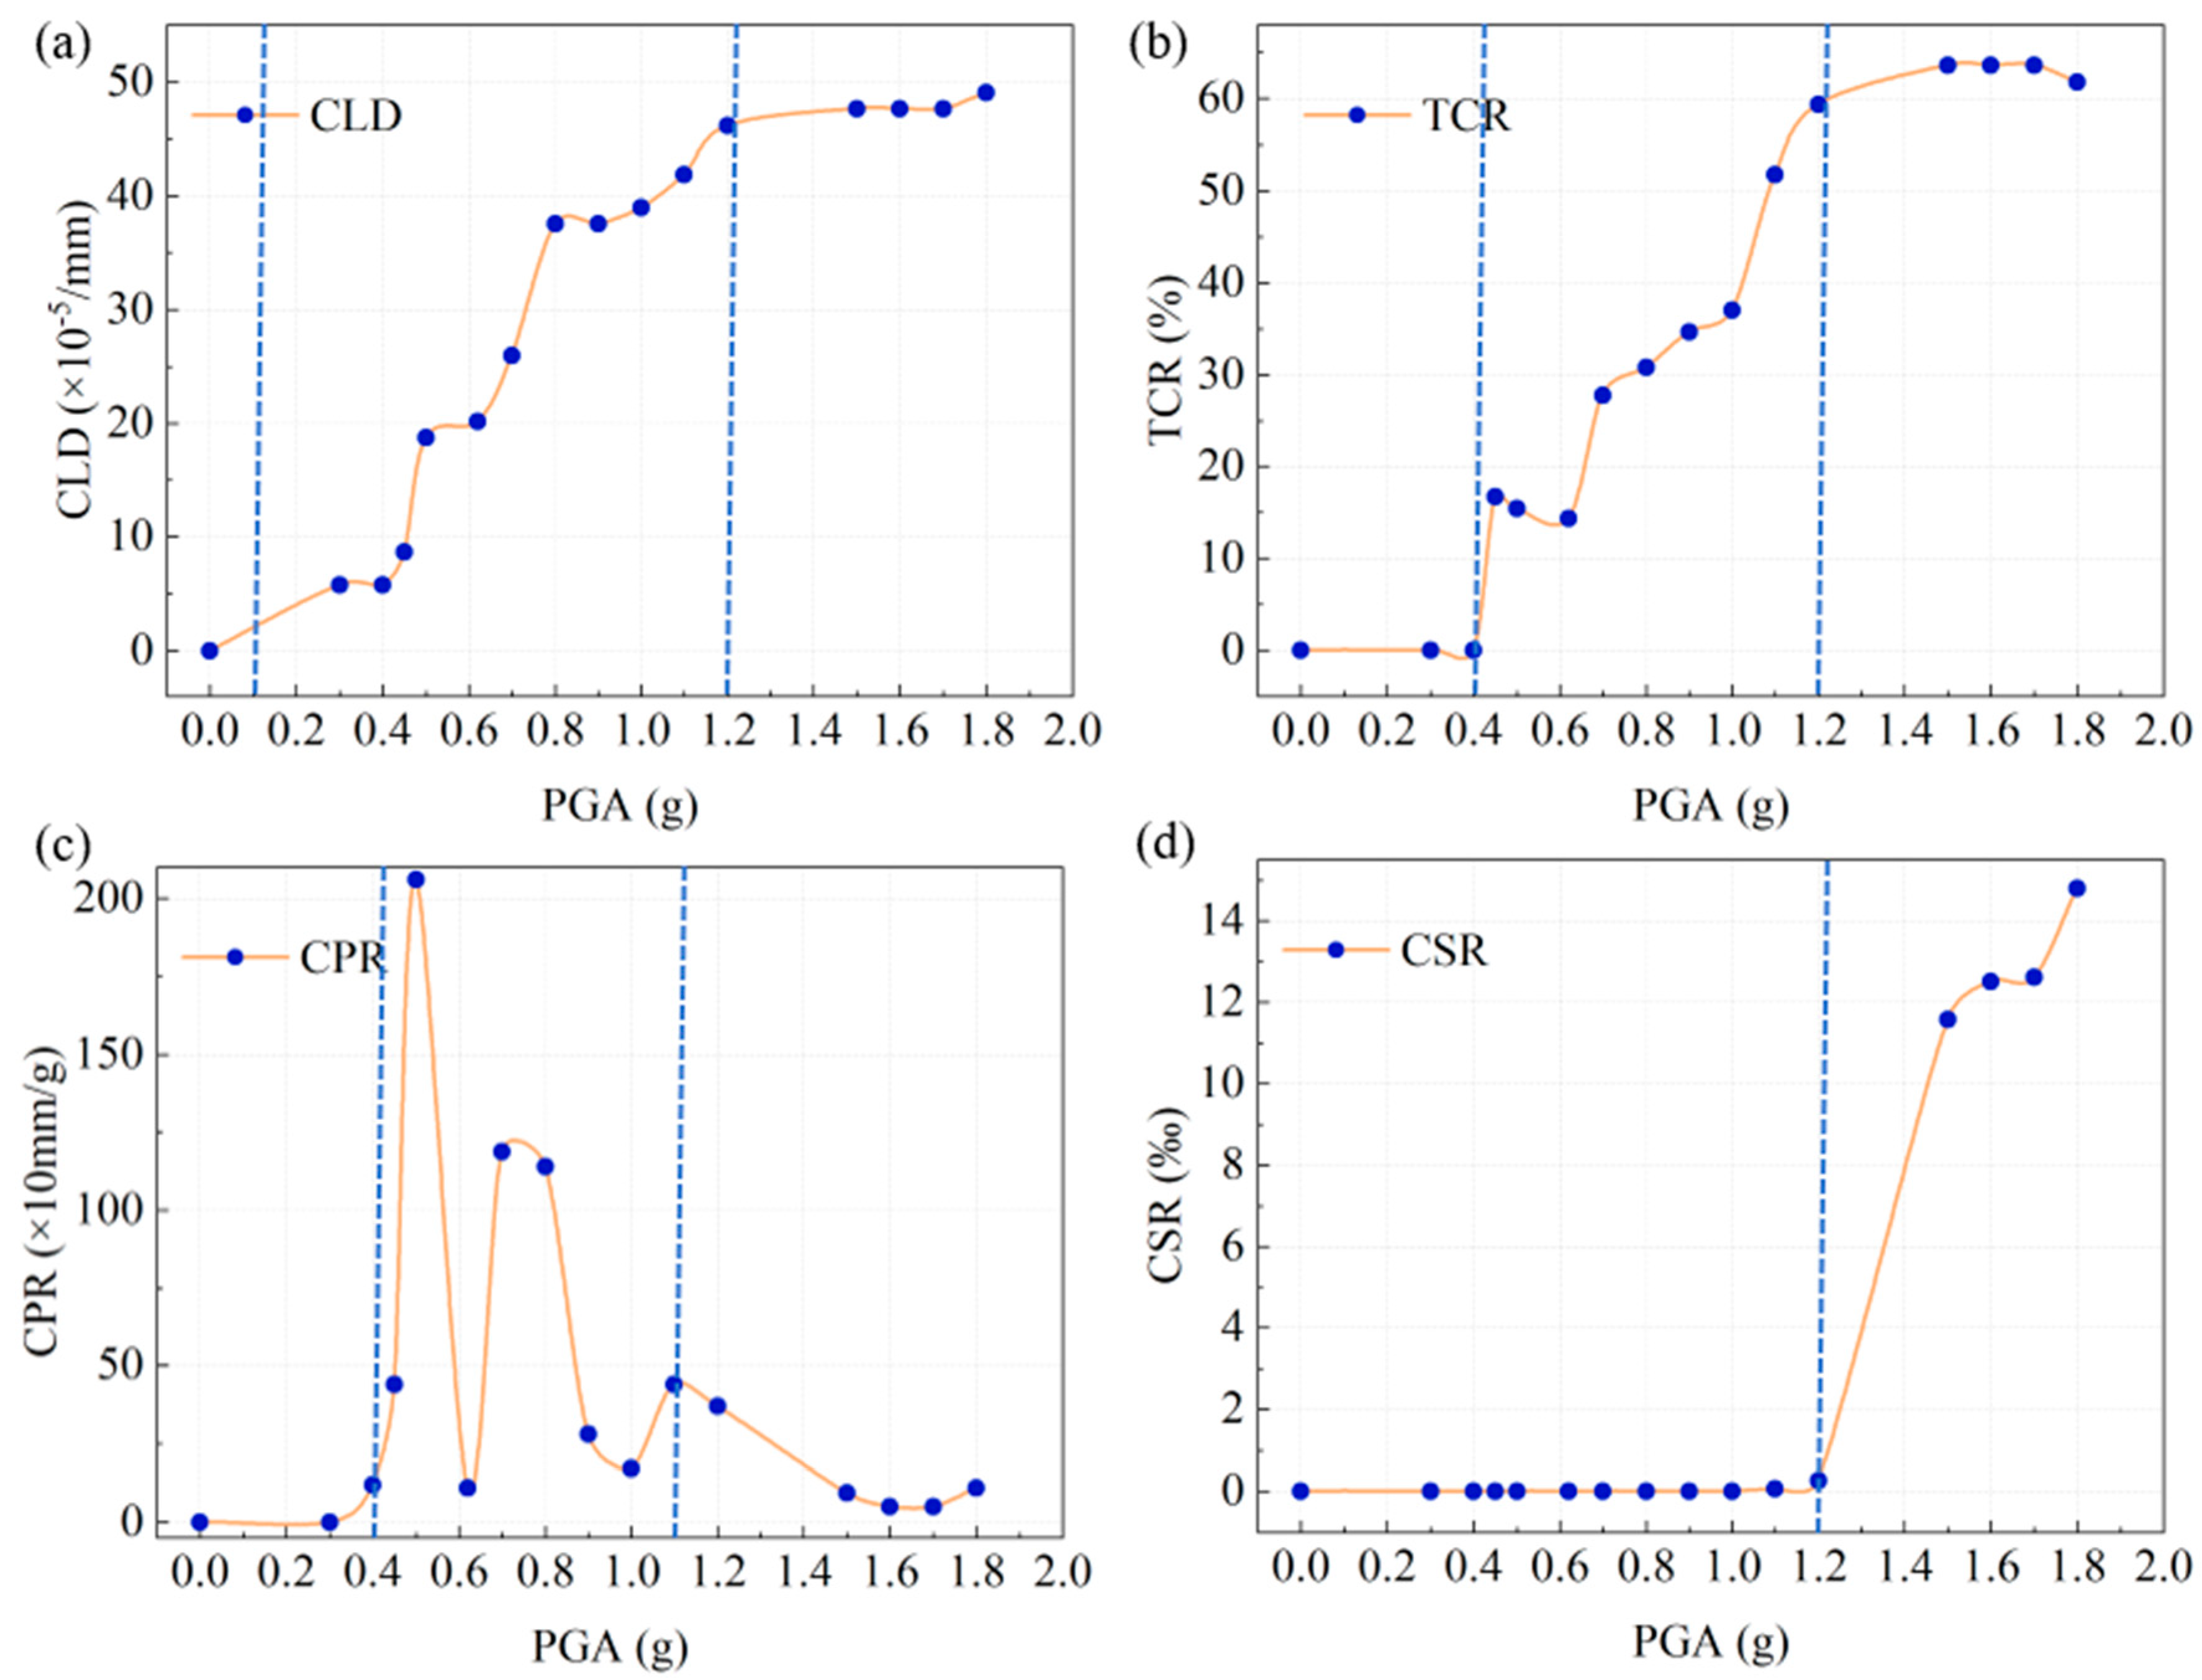
Stepwise PGA amplification induces regular variations in the quantity, length and spatial distribution of cracks within the tested RCFS specimen. At low excitation levels (PGA ≤ 0.45 g), only sporadic cracks emerge across structural components, with fewer than six cracks in total and an overall crack length below 0.1 m; the corresponding crack line density stays at the magnitude of 10
−5. Neither through-cracks nor concrete cover spalling is captured in this loading phase (
Figure 6). For moderate excitation ranging from 0.5–1.0 g, crack quantities grow from 13 to 26 alongside a total crack length of 0.443 m, while CLD rises to 3.9 × 10
−4 and TCR reaches 37.04%. The CPR peaks at 1187.5 mm/g (0.7 g) and 1140 mm/g (0.8 g), which marks the onset of accelerated crack propagation and nonlinear structural response.
Under high-level excitations of 1.1–1.5 g, the total crack count gradually converges toward saturation, whereas TCR rises drastically to a maximum of 63.6%. Meanwhile, total crack length accumulates to 0.552 m and CLD approaches 4.8 × 10⁻⁴, accompanied by the first occurrence of concrete cover spalling. Once PGA exceeds 1.2 g, CPR drops sharply to 93.3 mm/g, implying suppressed initiation of new cracks; existing fractures keep expanding and trigger progressive concrete spalling.
At the ultimate loading range of 1.6–1.8 g, both crack quantity (33–34 cracks) and CLD stabilize, and TCR is maintained around 63%. The cumulative spalling area expands to 1026 mm2 with CSR reaching 0.015. Crack evolution shifts from quantitative crack accumulation to qualitative structural degradation: dense crack distribution further develops into through-section fractures and concrete cover spalling, driving the structure from severe damage toward the predefined semi-ruin state.
In general, the full-range crack evolution follows the path of “initiation–propagation–saturation–spalling” under incremental seismic excitation. Crack multiplication dominates at moderate excitation levels, while the growth of TCR and CSR governs structural deterioration under intensive loading. Such evolutionary law demonstrates the inherent damage progression of RCFSs from an intact elastic state to the semi-ruin state.
3.3. Evolution Characteristics of IDR
The inter-story drift ratio (IDR) is a critical indicator to quantify global deformability and overall stability of RCFSs under seismic excitation, which can trace the full damage progression from intact condition toward the semi-ruin state, as defined in Equation (6). According to China’s Code for Seismic Design of Buildings, the allowable IDR thresholds for frame structures are specified as 1/550 for elastic performance and 1/50 for elastoplastic limit, while the ultimate collapse-related IDR generally ranges from 0.045–0.065.
where ΔU denotes the relative lateral displacement between the top and bottom of adjacent floors, and h
s represents the corresponding story height.
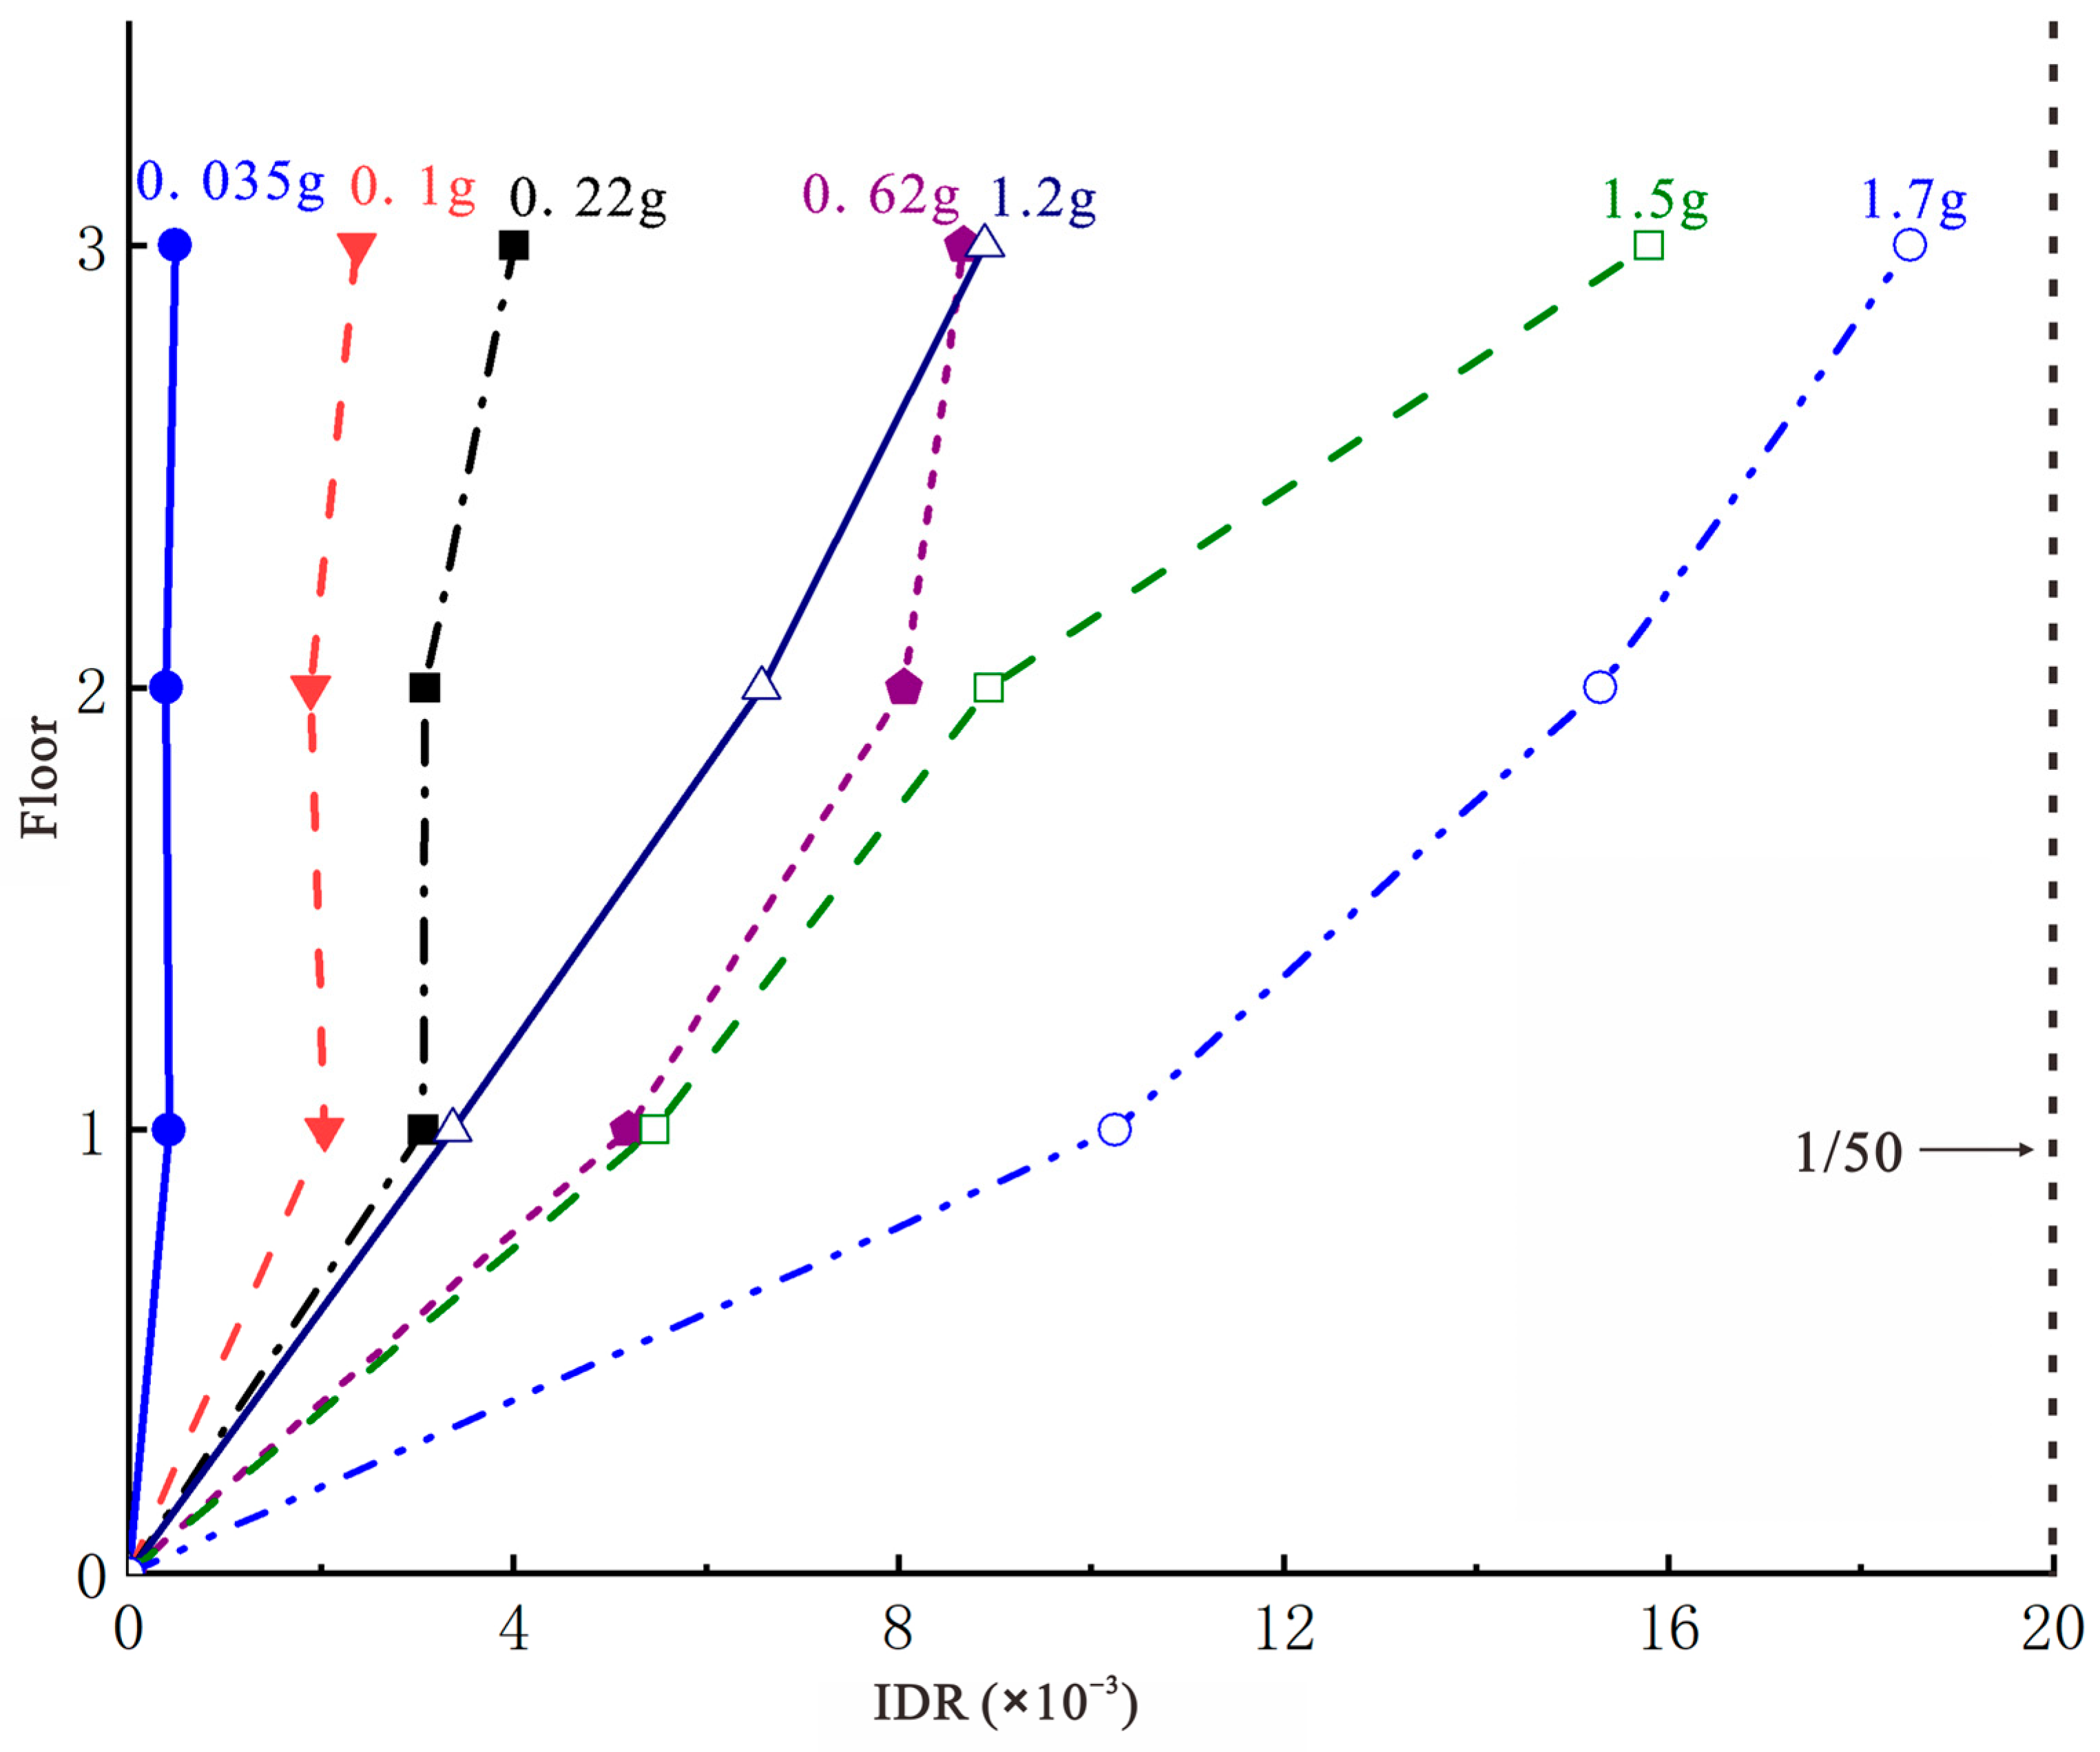
IDR curves of the tested specimen are derived from displacement measurements at arranged monitoring points (
Figure 7). The RCFS specimen presents distinctive deformation evolution under stepwise amplified excitations. At low PGA levels of 0.035 g and 0.1 g (corresponding to frequent and intermediate earthquakes of Grade 7 seismic intensity, respectively), IDR at all floors remains low and complies with the code-specified elastic and elastoplastic limits of 1/550 and 1/250; the frame behaves predominantly elastically without evident localized deformation concentration. When the input PGA rises to 0.22 g (rare earthquake of Grade 7), overall IDR increases remarkably, and upper floors exhibit faster displacement growth than lower counterparts, implying preferential deformation accumulation at upper structural regions.
Further excitation elevation up to 0.62 g and 1.2 g triggers a steep rise in IDR curves, signifying remarkable global stiffness degradation and accelerated plastic deformation accumulation. In this loading phase, lateral displacement mainly concentrates on the second and third floors, revealing a typical weak-story effect and the inherent tendency of upper-floor damage localization for RCFSs under intensive seismic loads. At higher PGA of 1.5 g and 1.7 g, IDR grows continuously, with the peak value of the third floor approaching the code-defined elastoplastic limit of 1/50; such response puts the specimen at a critical status of severe damage and incipient collapse. This deformation law coincides well with the experimental damage observation: structural deterioration initiates at beam–column joints and local members and gradually spreads over the whole frame, eventually evolving into the semi-ruin state accompanied by global instability.
Overall, IDR evolution precisely reflects the full structural deterioration sequence spanning elastic response, progressive damage accumulation and ultimate limit state. The developing tendency of peak IDR matches well with the experimentally captured failure patterns, verifying the capability of IDR as a reliable quantitative metric for seismic performance assessment and critical semi-ruin-state discrimination of RCFSs.
3.4. Correlation Analysis of Quantitative Indices
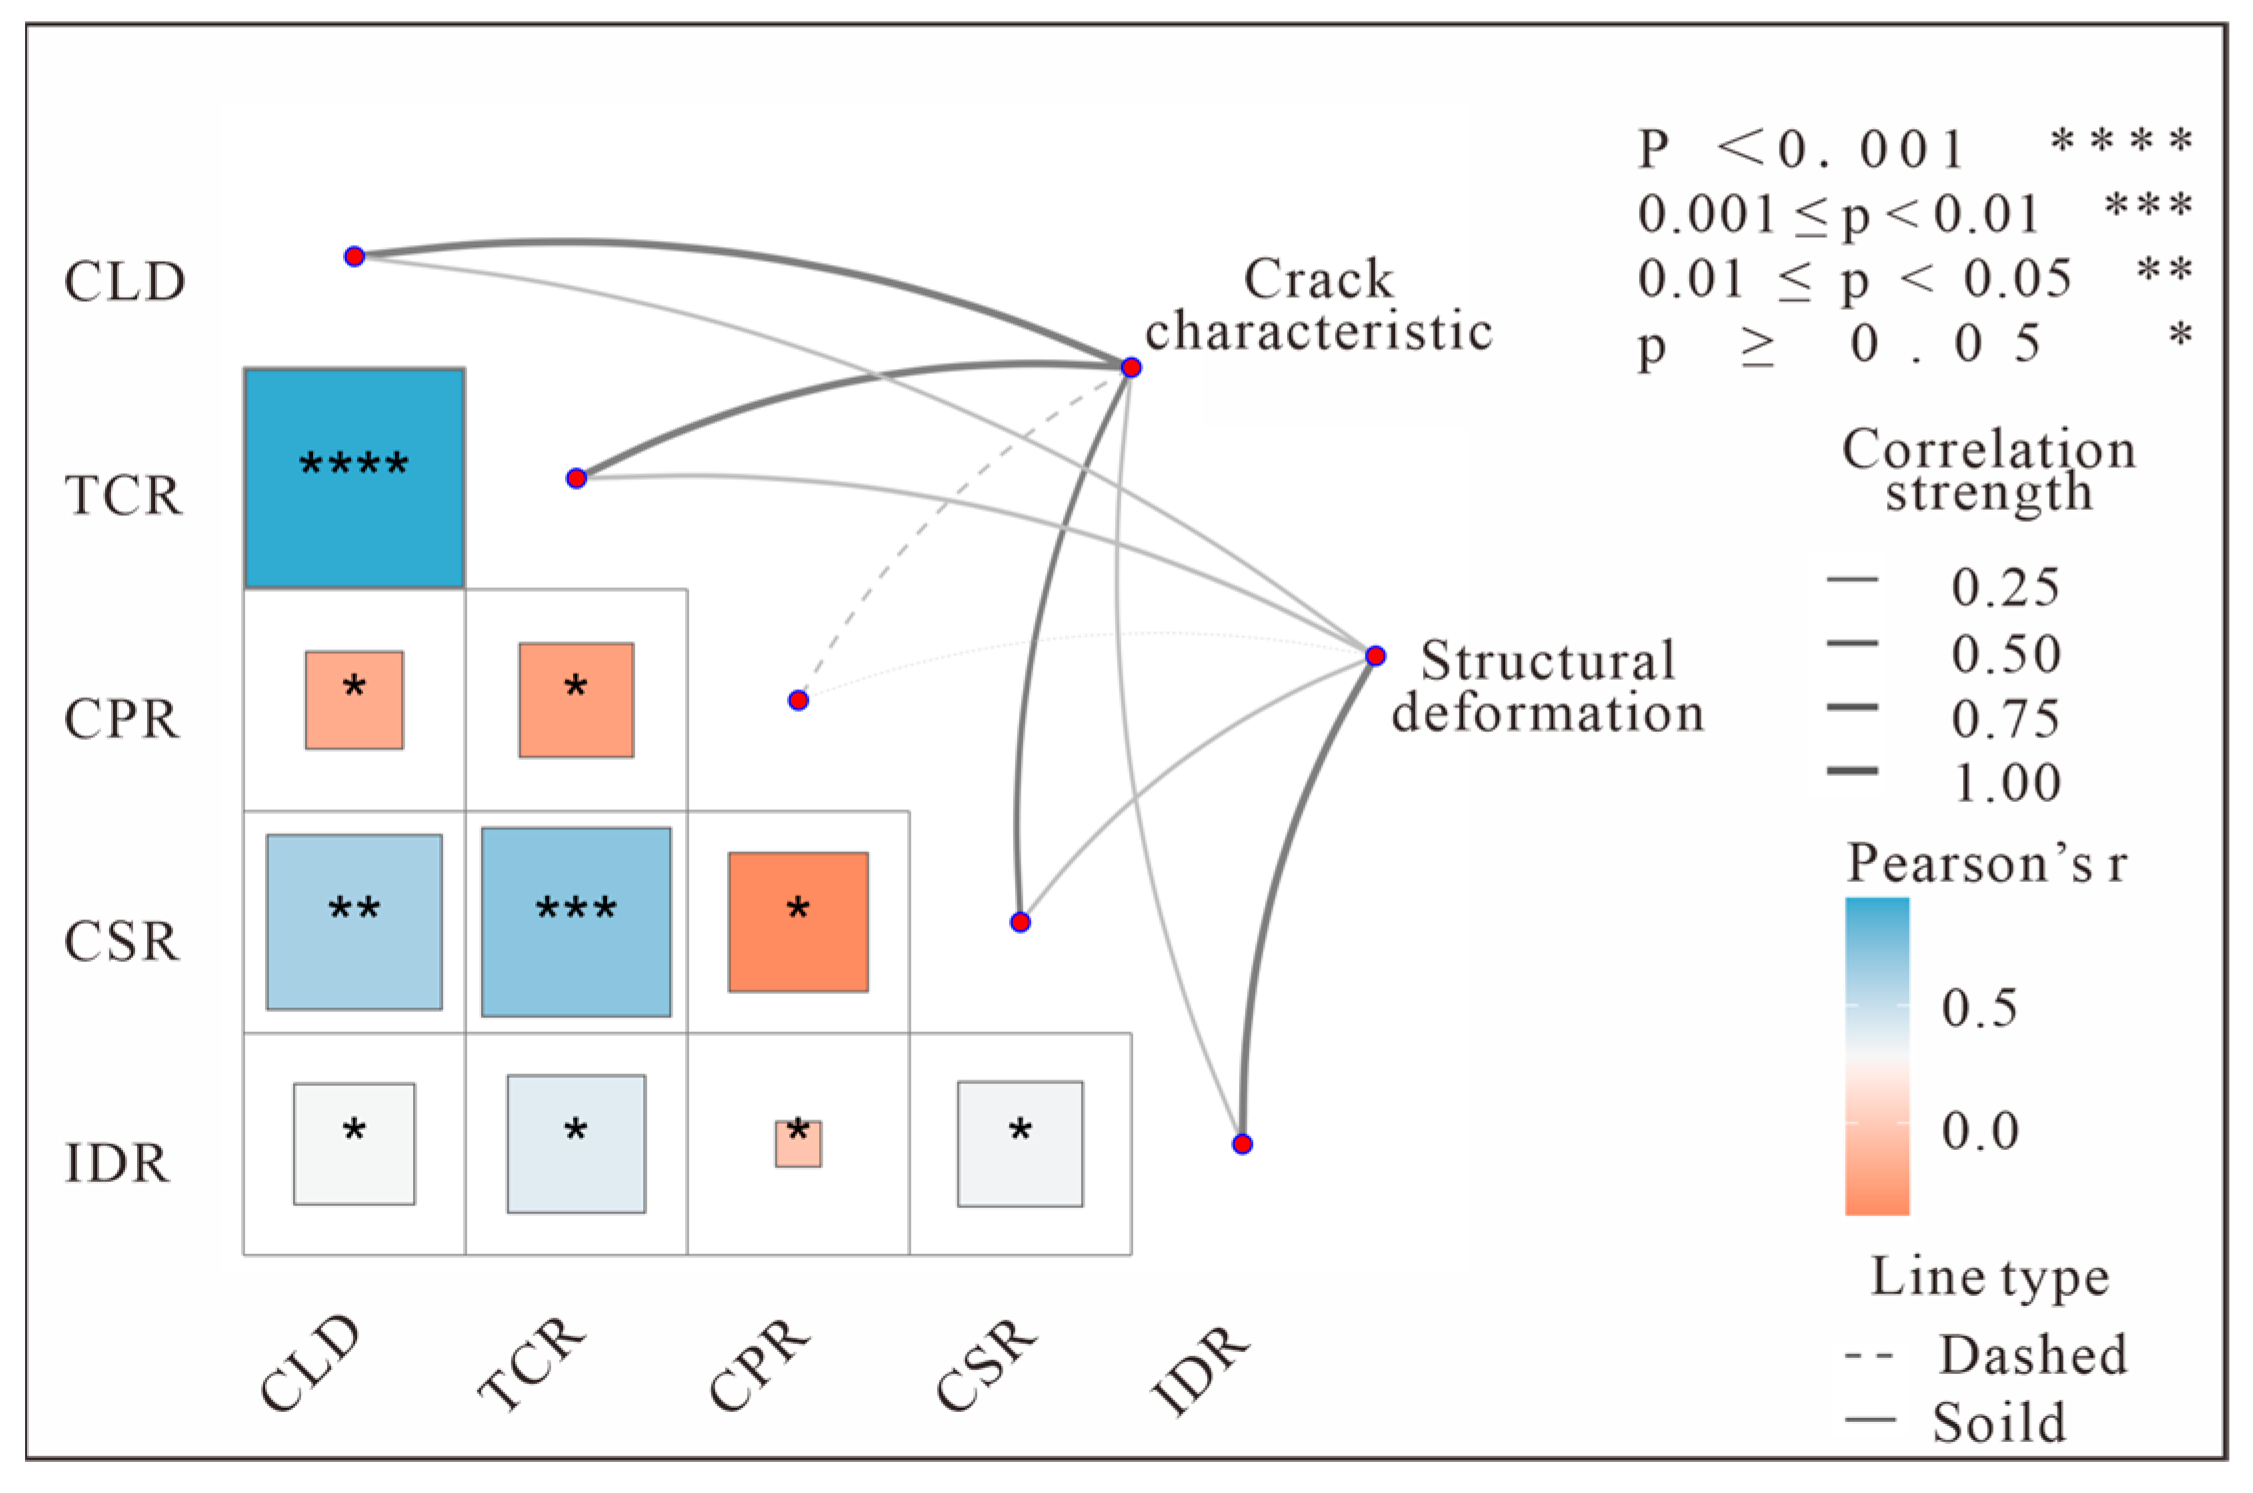
To explore the coupled damage and failure mechanism of RCFSs under seismic excitation, correlation analysis was performed for five quantitative damage indices, including CLD, TCR, CPR, CSR, and IDR, as illustrated in
Figure 8. The results show that the correlation coefficient between CLD and TCR reaches 0.96, demonstrating a strong positive correlation. This high correlation characterizes the progressive transition of crack distribution from discrete isolated fractures to interconnected crack networks. Moderate to strong positive correlations are also identified between crack-related indices and CSR, with correlation coefficients of 0.62 and 0.72, revealing that continuous crack propagation substantially accelerates concrete cover spalling. In contrast, CPR presents moderate negative correlations with the above damage indices, with coefficients ranging from −0.49 to −0.57. Such negative correlation indicates that CPR is highly sensitive to minor damage at the early loading stage, whereas its variation gradually diminishes as structural damage accumulates in later loading stages. Furthermore, the correlation coefficients between IDR and other local damage indices are merely 0.13–0.26, suggesting a weak correlation. This discrepancy essentially originates from different physical connotations of the indices: IDR dominantly reflects global structural deformation responses, while crack-based indices and CSR quantify local component deterioration. Accordingly, single-type indices cannot fully describe the multi-scale damage evolution. The collaborative utilization of global deformation indices and local damage indicators is essential to comprehensively characterize the full-range failure process of RCFSs from an intact elastic state to the semi-ruin state.
4. Discussion
4.1. Coupling Between Local-to-Global Degradation
The seismic degradation of RCFSs under severe seismic excitations is a progressive local-to-global deterioration process. In this process, local damage accumulation gradually affects the deformation pattern, stiffness characteristics, and overall seismic performance of the structure. Conventional shaking table tests commonly rely on accelerometers, displacement transducers, strain gauges, and video records to characterize structural responses. These techniques are effective for measuring acceleration responses, inter-story displacement demands, and strain variations at selected locations. However, because most of these measurements are obtained from discrete points, they have limited capability to continuously capture spatially nonuniform damage processes, including crack initiation, crack propagation, crack coalescence, through-crack formation, and concrete spalling. This limitation becomes particularly important when the structure enters semi-ruin state, in which the global response is increasingly affected by the deterioration of critical local regions rather than by global deformation demand alone. Previous studies have also indicated that structural damage and collapse risk are not governed solely by the inter-story drift ratio, but are closely related to member strength degradation, residual deformation, and local failure mechanisms [
46,
47].
DIC provides an effective approach for interpreting such local-to-global damage evolution by obtaining continuous full-field displacement and deformation information on structural surfaces through grayscale correlation analysis [
48,
49,
50]. Beyond its non-contact and full-field measurement capability, DIC is particularly useful for damage analysis because it improves the efficiency, continuity, and repeatability of extracting spatially distributed deformation and crack-related data. In addition, its image-based outputs, such as displacement fields, strain concentration maps, and crack evolution images, provide an intuitive visual basis for identifying subtle changes in structural components that may not be captured by conventional sensors alone. When combined with image segmentation and crack recognition methods, DIC can further quantify crack length, propagation trajectories, through-crack development, and concrete spalling regions. Therefore, DIC reduces the subjectivity of manual visual inspection and provides objective spatial evidence for linking local damage evolution with global seismic response degradation [
51,
52]. In this study, the DIC-derived CLD, CPR, TCR and CSR were used to characterize different forms and stages of local damage, while the IDR was used to represent the corresponding global deformation response.
The experimental results indicate that the damage evolution of the RCFS exhibited clear stage-dependent characteristics. At the low-PGA stage, cracks were mainly distributed around beam–column joints, slab edges, and local stress concentration regions. The IDR increased slowly, suggesting that the structure remained in a slight-damage or initial nonlinear state. At this stage, local cracking primarily reflected the initial release of stress concentration, whereas the overall load-resisting mechanism was not significantly affected. As the PGA increased, both the number and total length of cracks increased rapidly, accompanied by pronounced growth in CLD and CPR. This indicates that the structure entered a rapid damage accumulation stage, during which local cracks expanded from isolated regions to a wider spatial range. Meanwhile, the increase in IDR became more evident, suggesting that the expansion of local cracking was associated with the degradation of structural stiffness and the increase in global deformation demand. The simultaneous growth of local damage indicators and global deformation response indicates that local cracking was no longer an isolated surface phenomenon, but had begun to contribute to the overall seismic response of the structure.
At the high-PGA stage, the formation of new cracks tended to saturate, whereas TCR and CSR continued to increase. This transition indicates that the dominant damage mechanism shifted from the initiation and extension of discrete cracks to the penetration of existing cracks and the spalling of concrete cover. In other words, although the apparent increase in crack number became less significant, the severity of existing damage continued to develop. Through-crack formation weakened the integrity of critical members, while concrete spalling reduced the effective cross-section and impaired the load-bearing mechanism of local regions. Consequently, the seismic vulnerability at this stage was governed less by the formation of additional cracks than by the development of continuous damage bands and local cross-sectional deterioration in critical regions. This explains why severe local damage may accelerate global response degradation even when the increase in crack number becomes limited.
From the perspective of damage hierarchy, CLD and CPR mainly reflect the spatial activity and propagation intensity of cracks, TCR characterizes the transition from distributed surface cracking to through-crack failure, and CSR represents concrete cover failure and cross-sectional deterioration. By contrast, IDR reflects the global deformation demand and story-level response degradation. These indicators therefore correspond to different but closely coupled levels of structural damage. The DIC-derived indices describe the initiation, expansion, connection, and intensification of local damage, whereas IDR represents the global response associated with such local deterioration. Their coordinated evolution suggests that the transition of an RCFS from an intact state to a severe-damage or near-collapse condition is not controlled by deformation demand alone. Instead, it is a local-to-global degradation process in which crack propagation first promotes stiffness deterioration, crack penetration then weakens member integrity, and concrete spalling further accelerates local cross-sectional damage. The accumulation and connection of these local damage mechanisms progressively modify the global deformation pattern and contribute to the degradation of seismic performance.
Overall, the DIC-based full-field monitoring results provide an objective and quantitative basis for revealing the coupling between local damage evolution and global response degradation. Compared with conventional discrete measurements, the DIC-derived damage indicators enable a more refined interpretation of how local damage initiates, develops, localizes, and contributes to global seismic performance degradation. This local-to-global interpretation is essential for evaluating the seismic damage state of RCFSs, particularly when the structure approaches a severe-damage or near-collapse condition.
4.2. Characteristics and Engineering Value of Semi-Ruin State
Under strong seismic excitation, RCFSs undergo a progressive deterioration process from local damage accumulation to global stability degradation, rather than experiencing a direct transition from an intact state to overall collapse. Previous studies have demonstrated that beam–column joint failure, column-end concrete crushing, concrete cover spalling, residual inter-story drift accumulation, and degradation of vertical load-bearing capacity are critical precursors to structural collapse [
22,
53]. The “semi-ruin state” proposed in this study is defined as a metastable failure stage of RCFSs prior to complete collapse, in which the structure retains overall upright capacity while progressive local deterioration substantially threatens global structural stability.
The semi-ruin state cannot be determined by a single threshold of PGA, crack quantity, or inter-story drift ratio; instead, it originates from the coupled effects of crack penetration, concrete spalling, residual deformation accumulation, and progressive global stability degradation. Within the PGA range of 1.5~1.8 g, the tested model exhibited typical coupled damage features, including extensive crack penetration, severe spalling at beam–column joints and column ends, local reinforcement exposure, rapidly increased inter-story drift, and notable residual structural inclination. Although macroscopic global collapse does not occur at this stage, the structural lateral stiffness, local load-bearing capacity, and secondary disturbance resistance degrade significantly. This indicates that the structure evolves from conventional severe damage to a metastable state with insufficient residual stability, which is consistent with existing recognition regarding the correlation between residual deformation, local failure, and collapse risk [
54,
55].
The practical use of the proposed framework can be organized according to image availability. For rapid post-earthquake inspection, calibrated images obtained from ground cameras, UAVs, or photogrammetric reconstruction can support the extraction of residual damage features, including crack distribution, through-crack development, and concrete spalling, corresponding to CLD, TCR, and CSR. CPR, which describes the evolution rate of cracking, is more suitable for multi-temporal assessment based on repeated inspections, aftershock-related image comparison, or continuous monitoring of critical members. In this way, the proposed index system can support both static damage-state identification and dynamic deterioration tracking of severely damaged but non-collapsed RCFSs.
4.3. Comparison with Previous Studies and Scientific Contribution
To clarify the position of the present work within the existing body of knowledge on earthquake-resistant RC structures,
Table 9 presents an analytical comparison between this study and representative previous works along five dimensions: research focus, measurement and analysis method, damage descriptor, target damage state, and the specific contribution of the present study. The comparison shows that prior research has advanced mainly along four largely separate lines—shaking-table collapse testing, post-earthquake damage evaluation, fragility/vulnerability and machine-learning prediction, and DIC/image-based crack analysis—whereas the metastable semi-ruin transition between severe damage and global collapse has so far been investigated chiefly through numerical models. The present study connects these lines by experimentally quantifying the continuous local-to-global degradation that culminates in the semi-ruin state.
On this basis, the scientific novelty of the present study lies in being, to the authors’ knowledge, the first to employ DIC-assisted shaking table testing to continuously and quantitatively track the full local-to-global damage evolution of an RC frame and to experimentally isolate the metastable semi-ruin state, a transitional stage that collapse-oriented shaking-table tests [
22,
53] and probabilistic fragility studies [
24,
25,
26] did not separate. The originality of the work resides in integrating four DIC-derived local damage indices (CLD, CPR, TCR, CSR) with the global IDR into a single multi-index identification framework, which goes beyond the single-crack metrics of component-level DIC studies [
41,
42,
43,
51,
52] and the drift-only criteria of conventional damage assessments [
46,
47]. Its uniqueness is reflected in the experimental capture of the semi-ruin state on a prototype-based exterior-corridor teaching building from the 2008 Wenchuan earthquake, thereby supplying the physical full-field evidence that previous numerical semi-ruin and secondary-collapse studies [
11,
12,
23] could not provide. Finally, the applied significance is that the proposed image-based multi-index framework, together with the associated PGA range of approximately 1.5–1.8 g, offers directly usable references for post-earthquake rapid inspection, secondary collapse risk assessment, and repair-or-demolition decision-making of severely damaged but non-collapsed RCFSs [
44,
45].
4.4. Limitation
Several limitations should be recognized when interpreting the present results. First, the shaking table test was performed on a single 1/25-scale RCFS specimen representing a specific exterior-corridor teaching building. As a result, the observed damage evolution, the PGA range associated with the semi-ruin state, and the proposed index thresholds may be influenced by the structural configuration, similitude design, material substitution, reinforcement simulation, and artificial mass arrangement [
40,
56]. Second, the specimen was subjected only to one-dimensional excitation using the Wolong ground motion. In real earthquakes, RCFSs are commonly exposed to multi-directional ground motions with different frequency contents, durations, pulse characteristics, and vertical components, which may affect crack propagation, residual deformation, local failure modes, and collapse vulnerability [
54,
55]. Third, although DIC enables effective full-field monitoring of surface deformation and visible damage, its measurement capability is mainly limited to the camera field of view and exposed structural surfaces. Internal cracking, bond deterioration, reinforcement yielding, and core concrete crushing cannot be directly detected from surface images alone. Moreover, the accuracy of DIC-based damage extraction may be affected by illumination conditions, speckle quality, camera stability, image resolution, and image-segmentation parameters [
49,
51,
52].
Accordingly, the proposed semi-ruin-state identification framework should currently be regarded as an experimental reference rather than a generalized criterion for all RCFSs. Future studies should incorporate multi-specimen tests, multiple ground motions, multi-directional excitations, refined numerical simulations, and residual bearing capacity tests to further validate the applicability and robustness of the proposed multi-index method.
5. Conclusions
Shaking table tests and DIC-based full-field monitoring were conducted to investigate the seismic damage evolution of a scaled RCFS from the intact state to the semi-ruin state under strong ground motions. The main conclusions are as follows:
(1) The scaled RCFS exhibited a progressive damage evolution process, characterized by local cracking, rapid crack propagation, crack penetration, and concrete spalling. Rather than collapsing immediately after severe damage, the structure gradually evolved into a metastable semi-ruin state with pronounced residual deformation and degraded structural stability.
(2) DIC-based full-field monitoring effectively captured the spatial evolution of cracking and concrete spalling throughout the loading process. The extracted damage indices, including crack line density (CLD), crack propagation rate (CPR), through-crack ratio (TCR), and concrete spalling ratio (CSR), provided quantitative measures for characterizing the local damage development of the RCFSs.
(3) As the seismic intensity increased, the dominant damage mechanism shifted from crack initiation and propagation to crack penetration and concrete cover spalling. This transition was indicated by the rapid increase in CLD and CPR during the moderate-to-high intensity stages, followed by the continuous growth of TCR and CSR at higher intensity levels.
(4) The semi-ruin state of RCFSs should be identified using a multi-index approach rather than relying on a single PGA level or inter-story drift threshold. Under the present test conditions, the scaled RCFS entered the semi-ruin state at a PGA of approximately 1.5–1.8 g, accompanied by extensive crack penetration, severe concrete spalling, local reinforcement exposure, a rapid increase in inter-story drift ratio, and evident residual inclination.
(5) This study provides an experimental basis for developing a local-to-global framework for seismic damage evolution and semi-ruin-state identification of RCFSs. Future research will further calibrate the proposed multi-index criteria and integrate them into post-earthquake visual inspection, secondary collapse risk assessment, and repair-or-demolition decision-making.





 ,
,