


Abstract
To study the changes in circumferential internal forces of an existing shield tunnel when an overlapping tunnel passes through, a surrounding pressure redistribution model for overlapping tunnels was established to calculate the circumferential surrounding pressure of the existing tunnel. Combined with an engineering case, a detailed three-segment tunnel model was created using Abaqus 2023 finite element software. The circumferential forces of the tunnel were applied to the model, and the circumferential internal forces of the segments were extracted to study the variation law of segment circumferential internal forces. The research results indicate the following: (1) During the excavation of overlapping tunnels, the circumferential surrounding pressure of the existing tunnel decreases, and the circumferential surrounding pressure at any position exhibits a symmetric “8”-shaped distribution. (2) During the excavation of the new tunnel, the circumferential internal forces of the existing shield tunnel increase. In front of the excavation face, the additional internal forces of the tunnel decrease with distance, while within approximately 6 m behind the excavation face, the additional internal forces of the tunnel increase sharply. (3) As the angle between the line connecting the axes of the two tunnels and the z-axis increases, the additional internal forces of the existing tunnel decrease; as the clear distance between tunnels increases, the circumferential internal forces of the existing tunnel decrease, and the additional bending moments and additional shear forces approximately show linear variation.
1. Introduction
In recent years, the rapid expansion of urban rail transit systems has made it inevitable that newly constructed shield tunnels will need to cross above existing ones. During such crossing operations, the stress field surrounding the existing tunnel is redistributed. This redistribution frequently induces deformation and damage in the existing structure. As described in the literature [1], a potential progression involving five stages—elastic behavior, damage initiation, damage propagation, steel reinforcement yielding, and mid-span crack penetration—may occur. As a result, issues such as spalling of segmental concrete, cracking of the lining, and uneven settlement or heave can affect the existing tunnel [2]. Consequently, it is necessary to investigate the influence of an overlapping shield tunnel crossing from above on the circumferential stresses and the changes in internal forces within the segments of the tunnel below.
Numerous studies on overlapping tunnels have been conducted by researchers worldwide. Regarding the construction sequence, physical model tests and numerical simulations carried out by Yang et al. [3], which considered the effects of different excavation orders and advance rates, indicated that a bottom-first, then-top sequence is superior to the reverse order. Both the deformation and internal forces within the existing tunnel were found to increase with a higher advance rate, and the zone of influence also expanded accordingly. Through laboratory model tests using a drainage method, Liu [4] analyzed ground settlement resulting from excavation unloading and ground loss, along with the longitudinal deformation patterns of the existing tunnel. The results showed that no abrupt changes in ground settlement occur when the bottom-first sequence is adopted. Do [5] used FLAC3D finite difference software to analyze the structural forces on each tunnel in a stacked configuration and the resulting ground surface displacements. The numerical results showed that the most significant effects occur when the upper tunnel is excavated first, generally leading to larger surface settlements compared to excavating the lower tunnel first. Similar findings were reported by Zheng and colleagues [6,7,8]. In studies focused on internal forces, Xie et al. [9] compared segment internal force variations under different construction sequences through experiments. They found that both the additional displacements and internal forces in the existing tunnel increase with the advance rate, as does the spatial extent of these effects. Liu [10] established a three-dimensional finite element model incorporating a modified Mohr–Coulomb constitutive law to simulate the shield construction process. The model was used to analyze the displacement and stress changes in the lower tunnel under various reinforcement conditions, leading to a proposed set of recommended reinforcement parameters for fully overlapping tunnel sections. He et al. [11] investigated the stress and deformation patterns of an existing shield tunnel when a new overlapping tunnel is constructed beneath it, considering various influencing factors. Zheng et al. [6] analyzed changes in bending moment within an existing tunnel caused by new tunnel construction using a bottom-first sequence. Through numerical simulations under different conditions, Shi [12] demonstrated that the unloading effect is more pronounced during the construction of overlapping tunnels compared to a single tunnel. Regarding deformations induced in the existing tunnel and surrounding soil by the excavation of an overlapping tunnel, Fei [13] used three-dimensional FLAC3D simulations to reveal deformation characteristics and interaction mechanisms during the construction of tunnels with extremely close spacing. It was found that as the face of the upper tunnel advances, the vertical deformation at the crown of the existing tunnel initially manifests as heave, followed by settlement. Concurrently, the springline region shows a typical “S”-shaped evolution. Zhang et al. [14] studied the uplift patterns of the lower tunnel and the stress characteristics of steel supports using numerical simulation and field monitoring. Liu et al. [4] and Do [5] focused on the impact of overlapping tunnel excavation on ground settlement. Their results indicated that the maximum uplift displacement experienced by the initial shield segment across all tunnel sections increases with greater transverse spacing between the tunnels. In other research contexts, Wei et al. [15,16,17] and Xiang et al. [18] studied the changes in internal forces in tunnels subjected to over-crossing, under-crossing, and surcharge loading by calculating the circumferential confining pressure on the tunnel. Wei et al. [19] conducted a full-scale loading test on a three-ring staggered assembled shield tunnel segment using a hydraulic loading system, analyzing the forces, convergence deformation, displacement of the tunnel linings within each segment, and the internal forces of the bolts. The relationship between force and deformation was obtained, and the residual bearing capacity of the shield tunnel at various stages was determined. Feng et al. [20] analyzed the effects of excavation beneath a tunnel and concluded that the vertical clearance distance, skew angle, volume loss rate, and elastic modulus between the two tunnels are significant factors influencing tunnel behavior. Qi et al. [21,22] proposed a stress reduction model for heterogeneous soil layers and a tunnel settlement calculation model, and analyzed the influence of different crossing angles on tunnel deformation and additional internal forces. However, most studies on internal forces in overlapping tunnels have relied on numerical simulation or model testing. A theoretical solution based on calculating circumferential confining pressure to investigate internal forces in the context of overlapping tunnels has not yet been reported. Therefore, further investigation into the internal forces in overlapping tunnels using the circumferential confining pressure method is warranted.
To address this gap in research on confining pressure and internal forces in overlapping tunnels, this study presents the following original contributions: (1) For the first time, an analytical redistribution model of circumferential confining pressure is derived specifically for overlapping tunnels constructed using the “bottom-first, then-top” sequence, capturing the unloading effect of the new tunnel on the existing one. (2) Unlike conventional numerical simulations that rely on fully coupled soil–structure interaction models, the proposed approach decouples the load calculation from the structural analysis, enabling efficient and systematic parametric studies of key geometric variables (intersection angle and clear distance). (3) The detailed circumferential distribution patterns of bending moment, shear force, and axial force in the existing tunnel are revealed across a range of influencing factors, providing quantitative references for structural monitoring and design in similar engineering projects. Subsequently, the redistributed confining pressure is applied to a detailed segmental lining model developed in Abaqus, and the internal forces are extracted to determine the stress and deformation patterns of the segments.
2. Derivation of the Calculation Method for Confining Pressure
2.1. Limitations of Existing Studies
- (1)
- While previous research on shield tunnel confining pressure has considered scenarios such as over-crossing, under-crossing, and surcharge loading [15,16,17,18], no study has specifically addressed the impact of a new overlapping tunnel constructed above an existing one on the confining pressure of the lower tunnel.
- (2)
- Most studies on overlapping tunnels have used model tests or numerical simulations to investigate variations in internal forces within the existing tunnel. These approaches do not typically account for the process of confining pressure redistribution during the crossing.
- (3)
- In their simulations of segment stress and deformation, Wei et al. [17,23] used Midas GTX NX software to apply the circumferential confining pressure evenly, dividing it into 20 equal parts applied to the segment model. However, calculations by the present authors show that the circumferential confining pressure varies sharply near the springline. Therefore, applying the confining pressure as a series of uniform loads may not allow for a sufficiently detailed simulation of segment stress and deformation.
2.2. Proposed Improvements to Address These Limitations
- (1)
- In this study, a model for the redistribution of confining pressure under the “bottom-first, then-top” construction sequence for overlapping tunnels was derived. The initial and additional circumferential confining pressures on the existing tunnel were calculated separately and then summed to obtain the total confining pressure.
- (2)
- Using the redistributed circumferential confining pressure on the existing tunnel, subsequent changes in the tunnel’s internal forces were investigated.
- (3)
- Using the load-structure method, a detailed segmental lining model was created in Abaqus. The circumference of the tunnel ring was divided into four segments (taking clockwise as positive): 0–180°, 90–270°, 180–360°, and 270–90°. The calculated loads were applied to each segment. The resultant force directed toward the center of the ring represents the confining pressure on the segment. Detailed operational procedures can be found in the Abaqus user documentation.
2.3. Calculation of Additional Loads on the Existing Tunnel
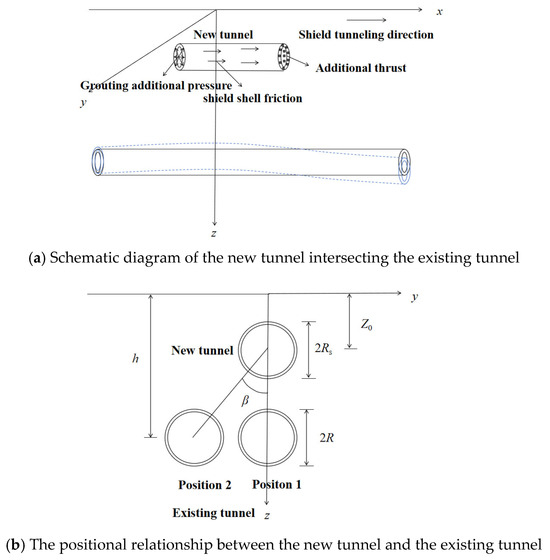
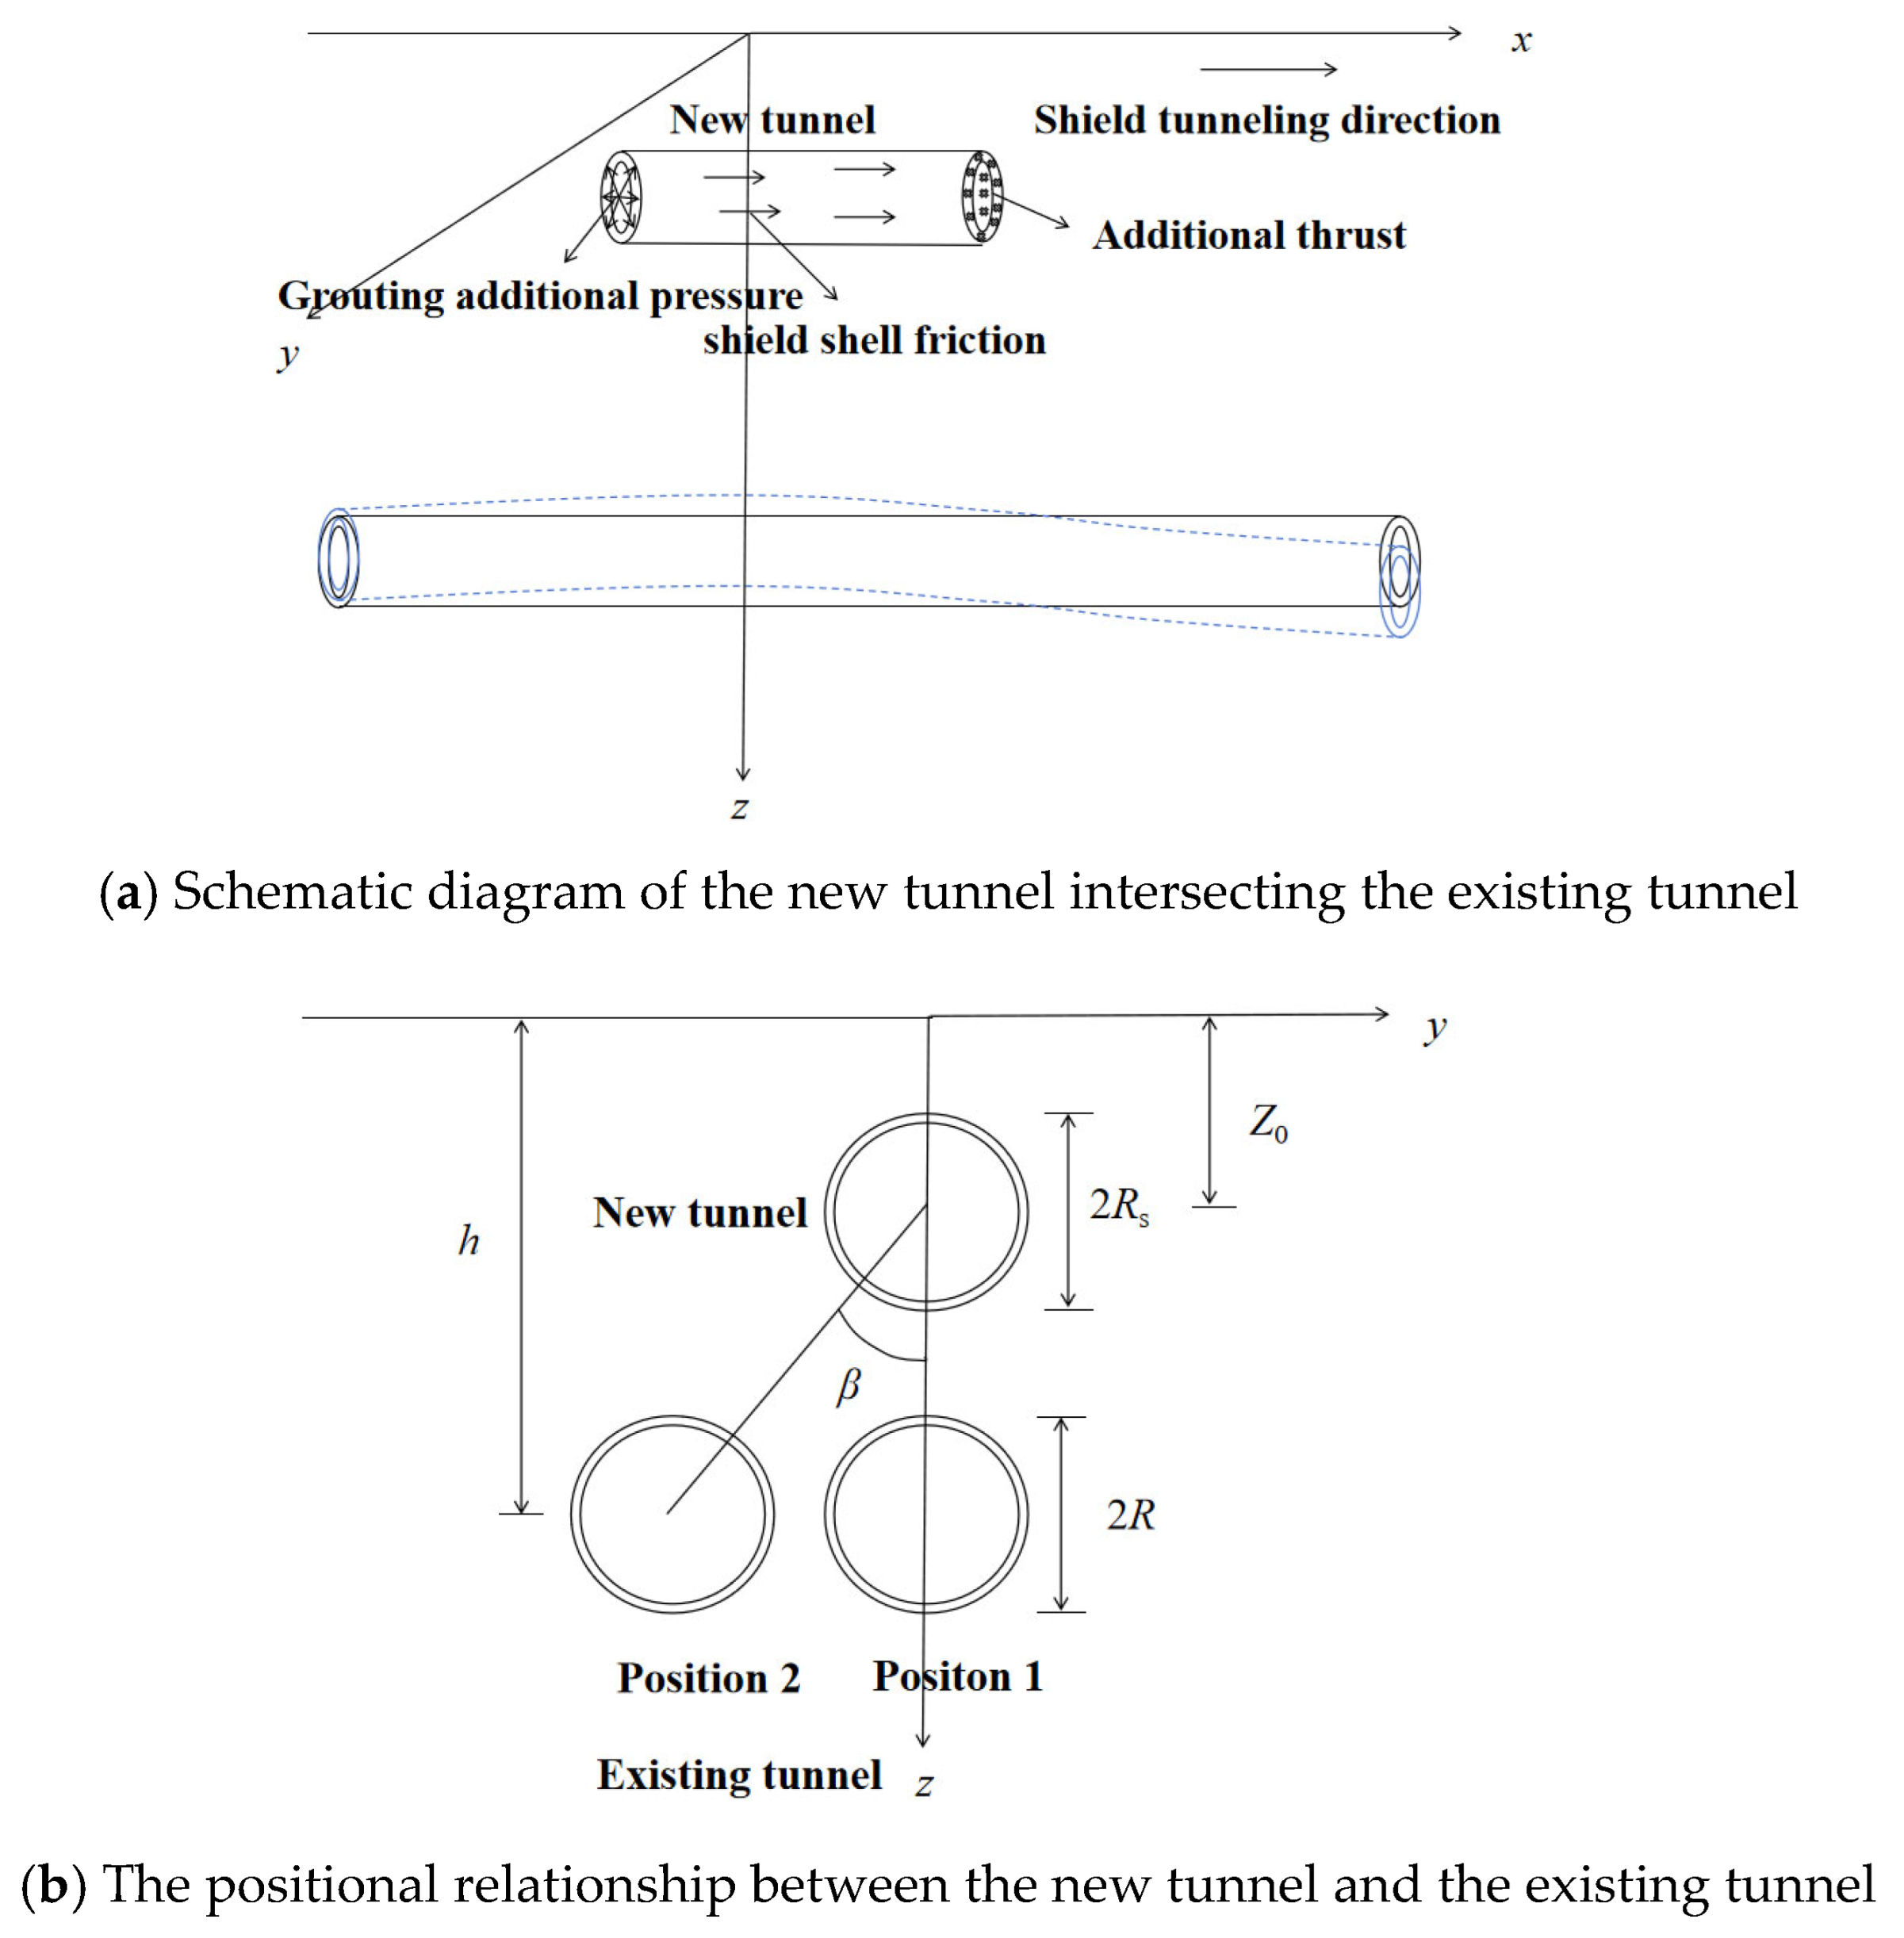
Figure 1 presents the calculation model for a new shield tunnel constructed overlapping and above an existing shield tunnel. In the figure, h represents the burial depth of the existing tunnel axis, R is the radius of the existing tunnel, Z0 is the burial depth of the new tunnel axis, and Rs is the radius of the new tunnel. In practice, the new and existing tunnels may not be perfectly aligned vertically; partial overlap may occur, as illustrated by Positions 1 and 2 in Figure 1b. The angle β denotes the angle between the line connecting the centers of the two tunnels and the z-axis.
Figure 1.
Computational model diagram of a newly constructed shield tunnel overlapping and crossing an existing tunnel.
2.4. Calculation of Initial Circumferential Confining Pressure on the Existing Tunnel
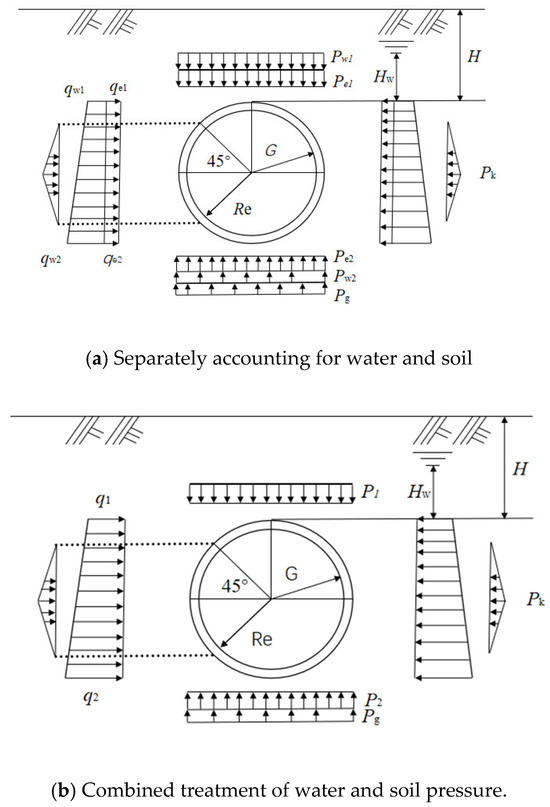
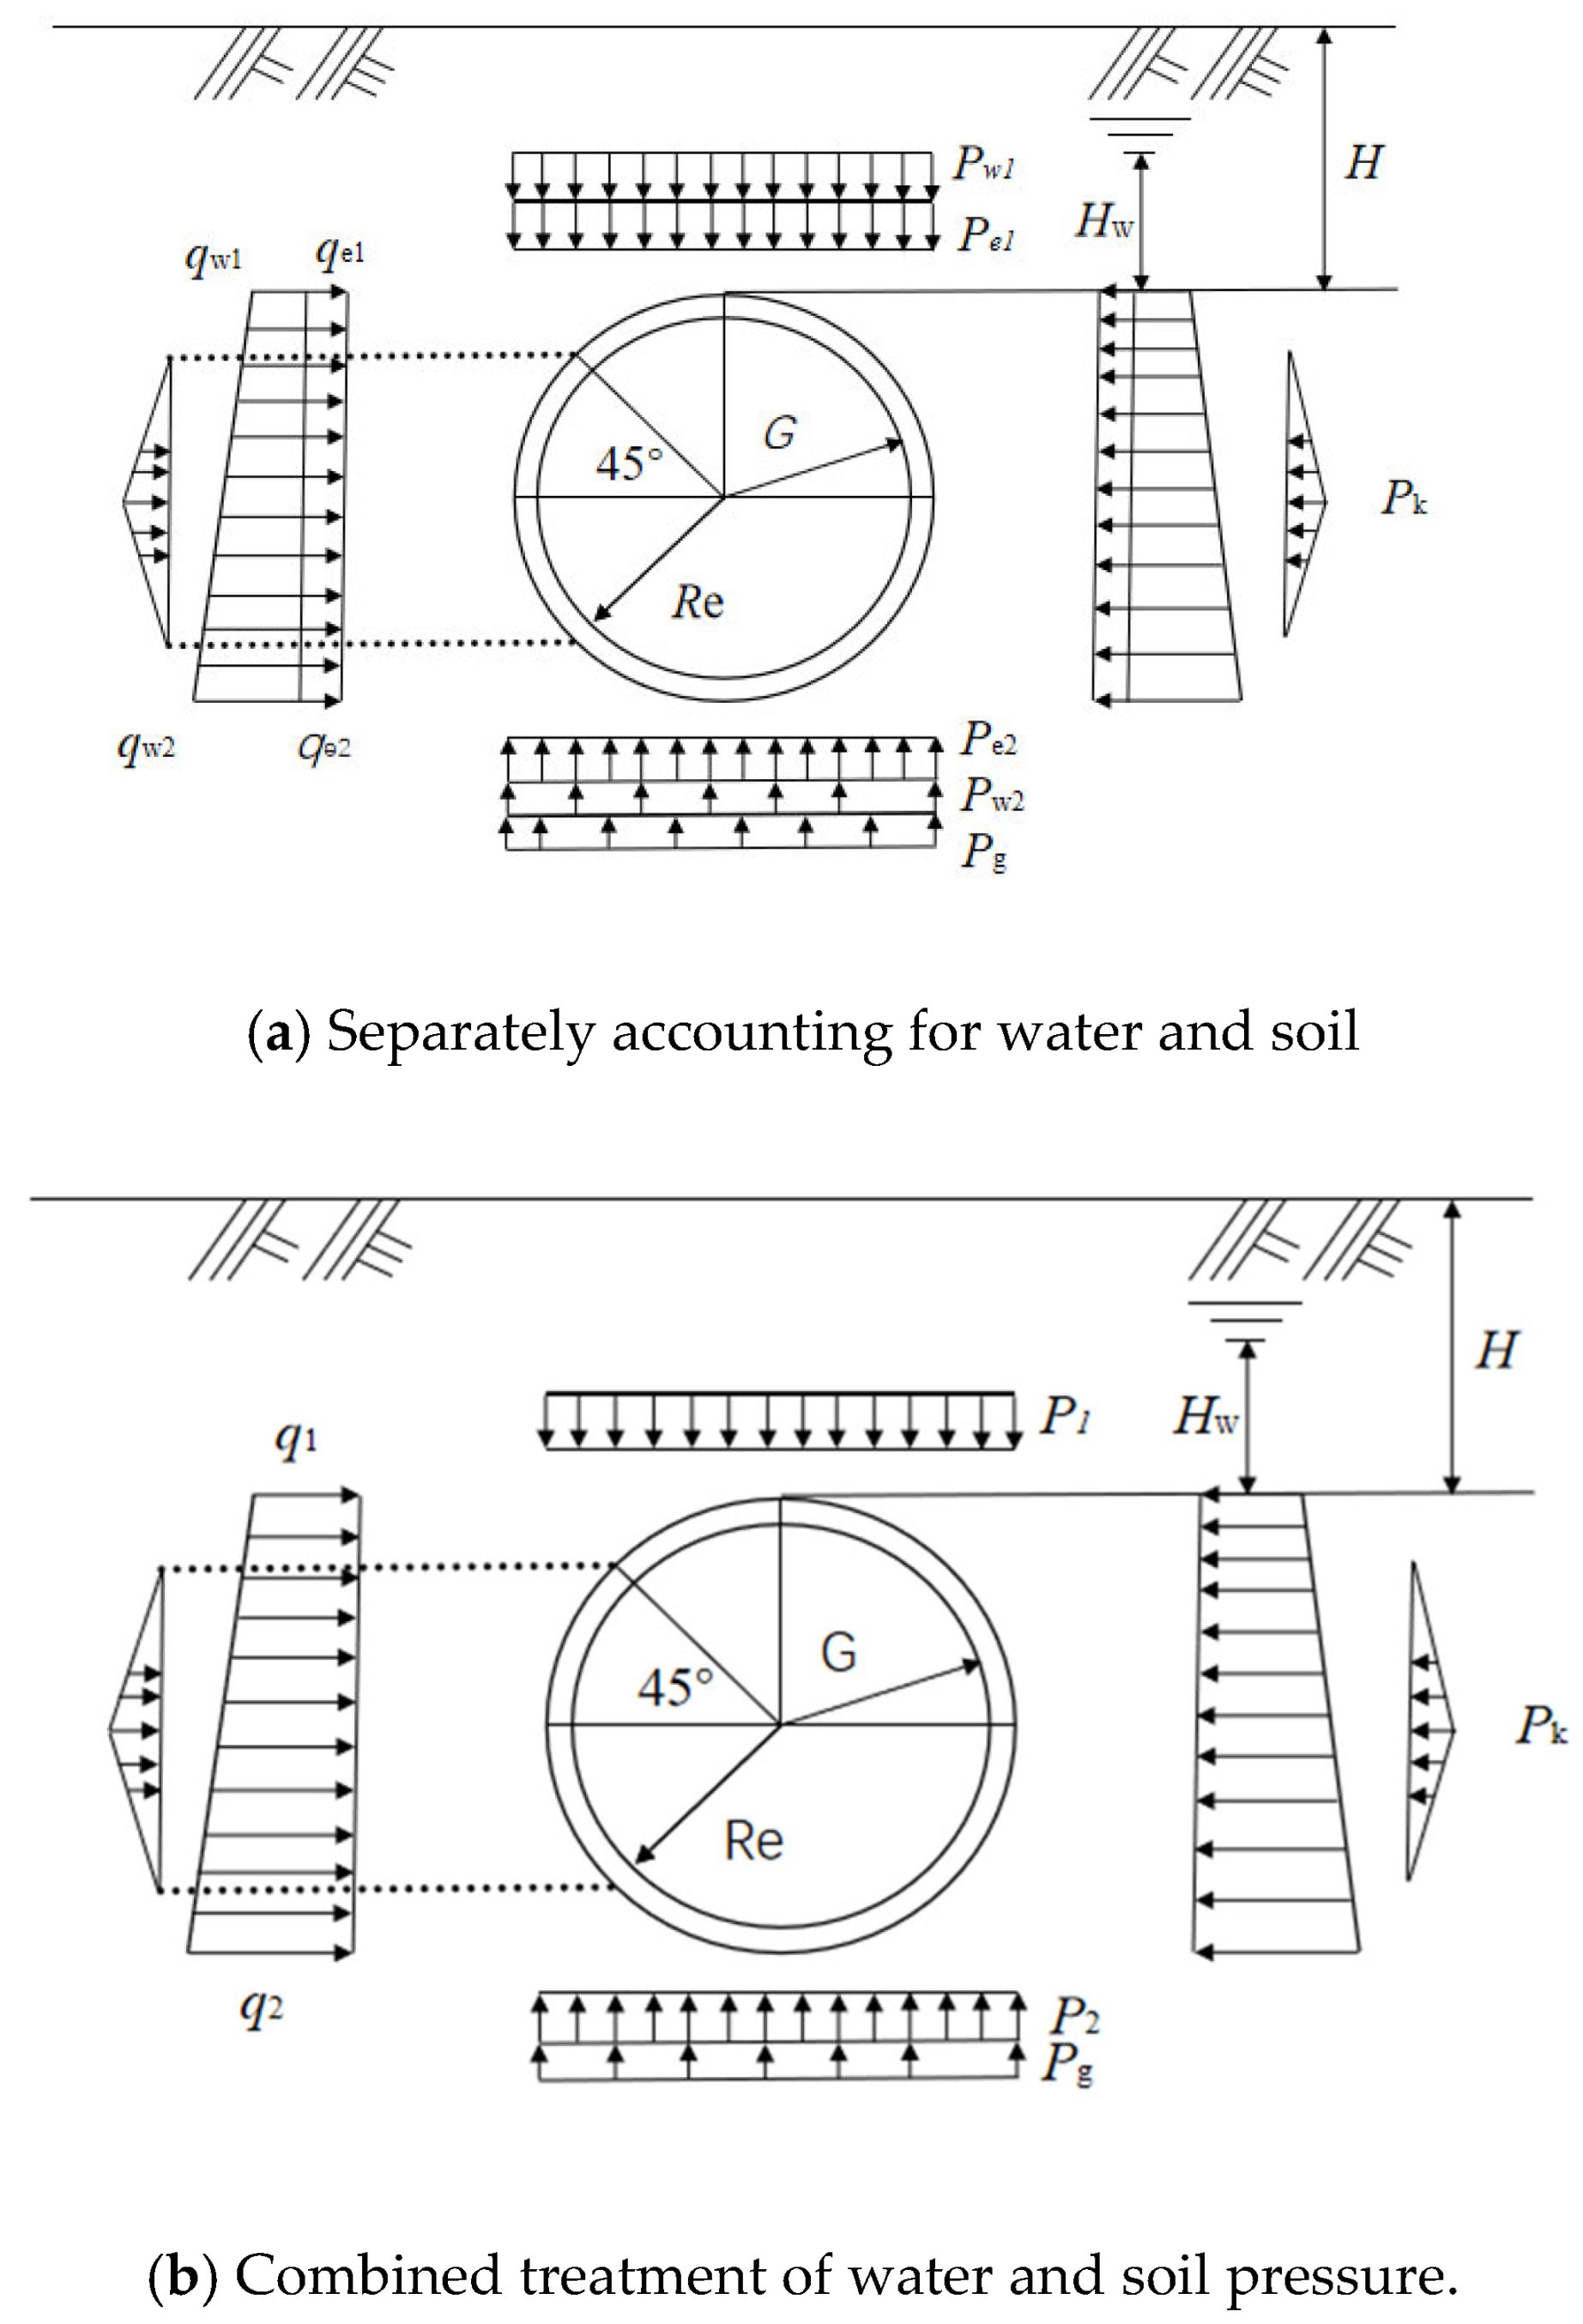
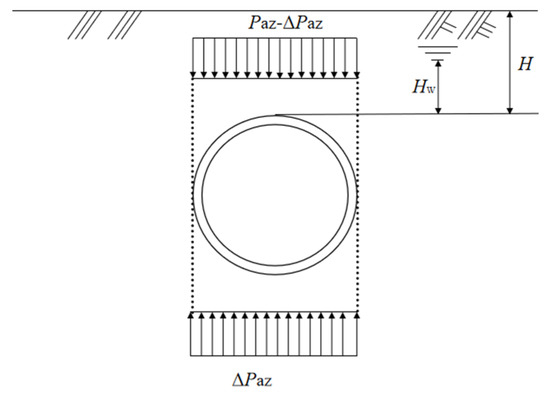
The initial circumferential loads on the tunnel can be calculated using either the separate or combined treatment of water and soil pressures [20]. Figure 2a shows a schematic diagram for the separate calculation. In this figure, G represents the self-weight of the lining; pk is the horizontal soil resistance; Pg is the reaction force at the invert; H is the distance from the ground surface to the tunnel crown; HW is the distance from the groundwater table to the crown; qe1 and qw1 are the horizontal soil and water pressures at the crown, respectively; pe1 and Pw1 are the vertical soil and water pressures at the crown; qe2 and qw2 are the horizontal soil and water pressures at the invert; and Pe2 and Pw2 are the vertical soil and water pressures at the invert. Figure 2b presents the schematic for the combined calculation, where P1 and q1 are the vertical and horizontal combined (soil-water) pressures at the crown, and P2 and q2 are the vertical and horizontal combined pressures at the invert. Due to space constraints, specific calculation methods for soil pressures, water pressures, self-weight, and ground resistance are not detailed here, and these can be found in reference [24].
Figure 2.
Schematic Diagram of Initial Stress on Tunnel.
2.5. Calculation of Additional Circumferential Confining Pressure on the Existing Tunnel
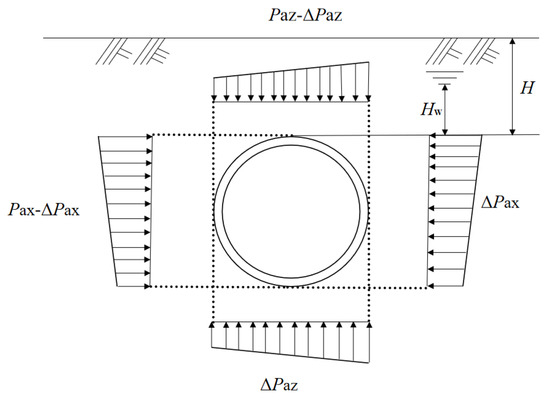
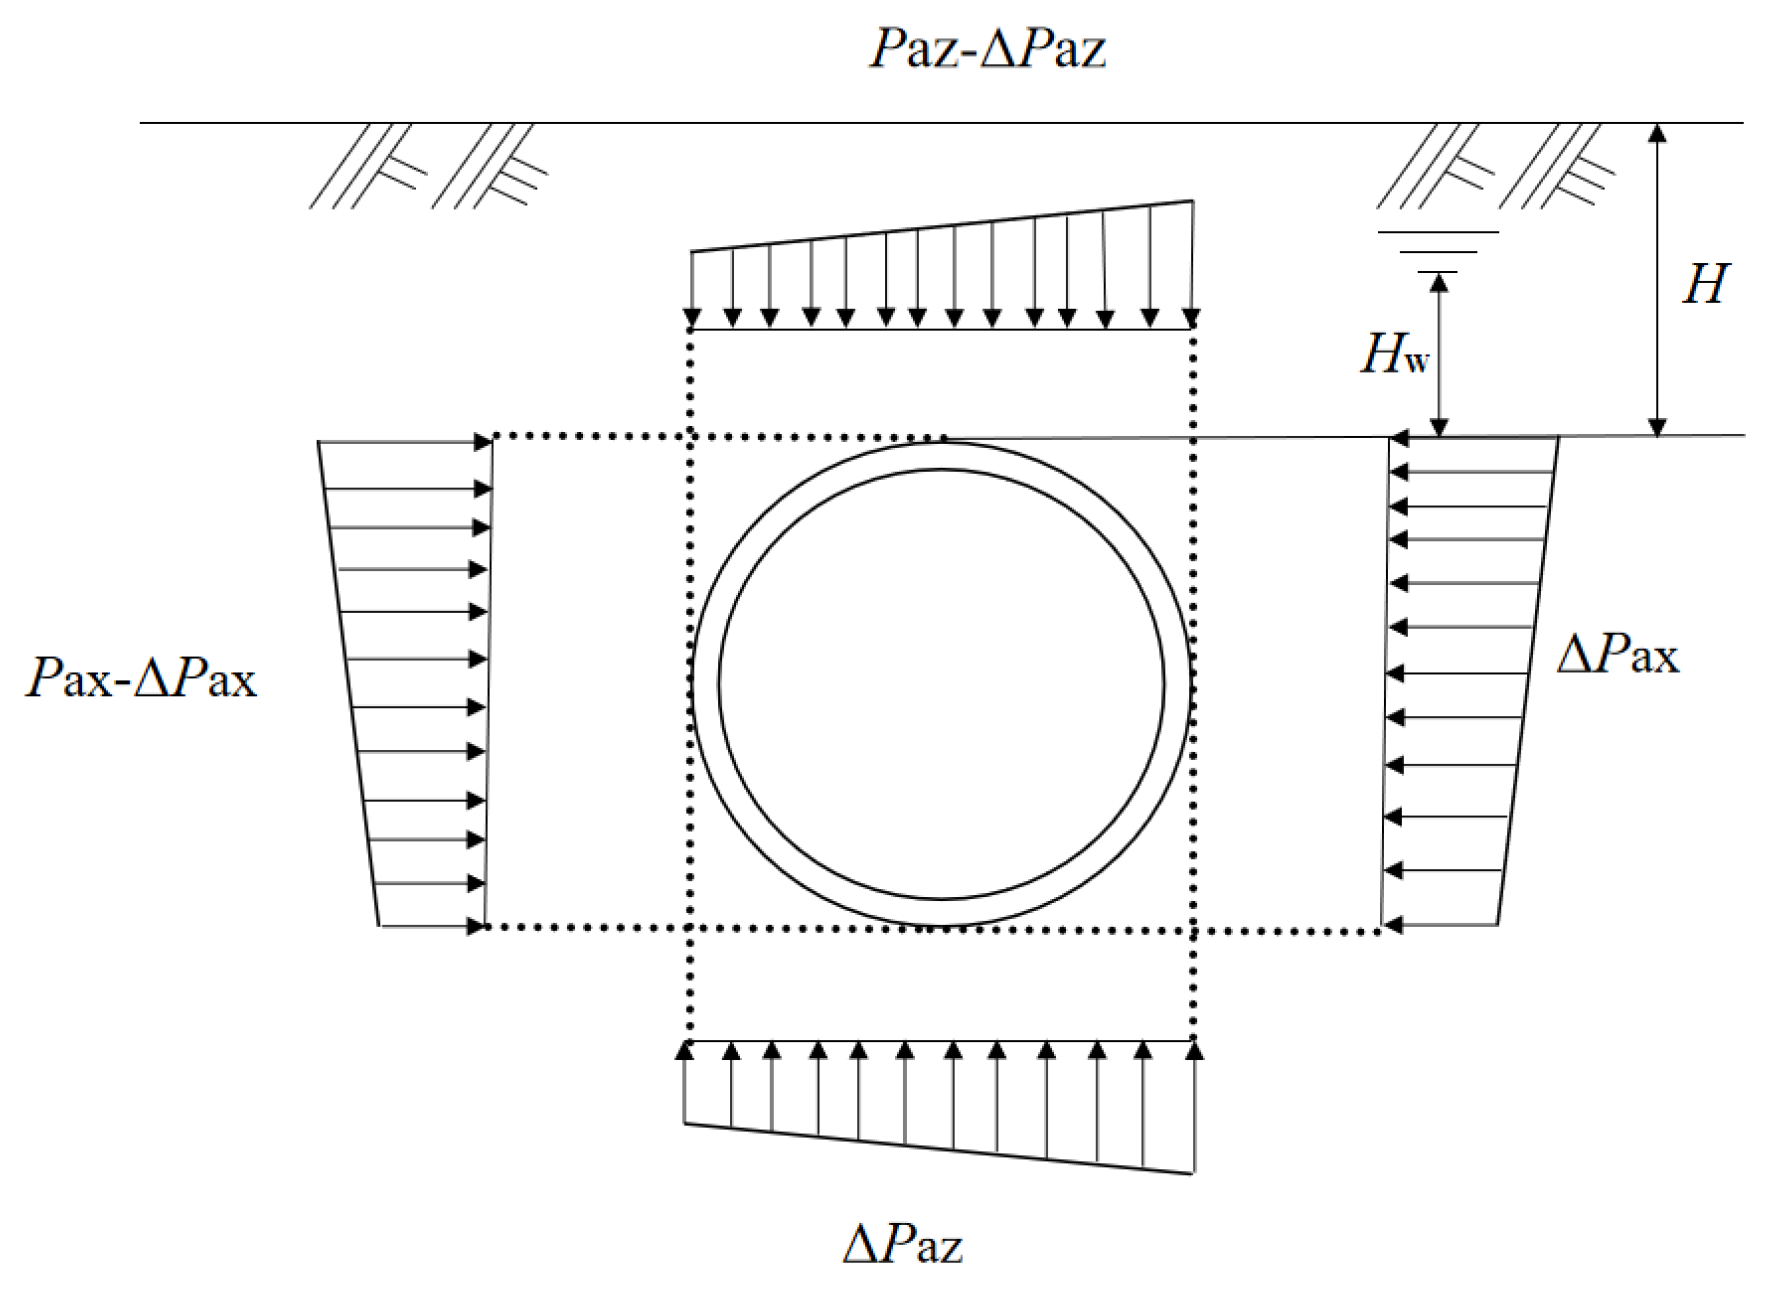
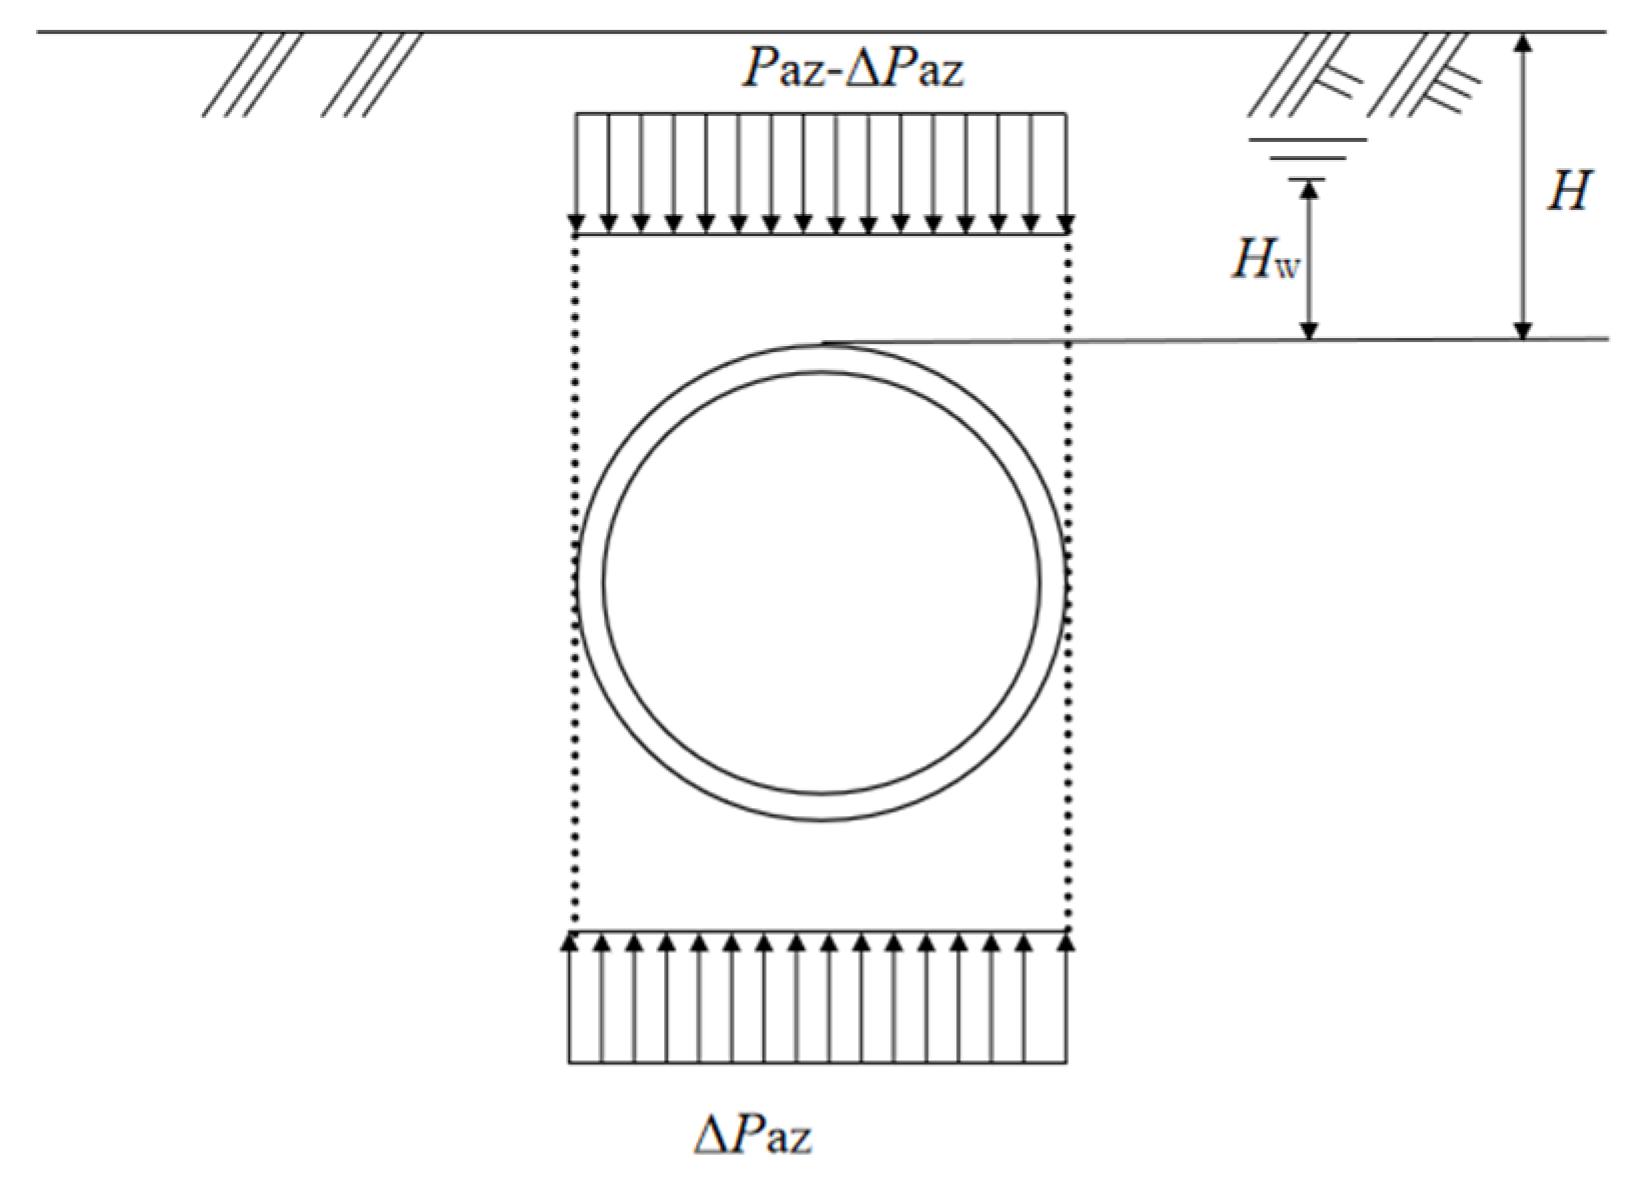
When β ≠ 0°, as shown in Position 2 of Figure 1b, the construction of the new tunnel disrupts the original stress equilibrium between the existing tunnel and the surrounding soil, inducing inter-ring rotation and staggering. Figure 3 presents a schematic diagram of the redistribution of additional loads on the segment. As the new tunnel crosses from the upper right relative to the existing tunnel, the additional stresses cause deformation in both the existing tunnel and the surrounding soil until a new stress equilibrium is reached after deformation stabilizes; this phenomenon is defined as the redistribution of confining pressure. During the construction of the new tunnel, it is assumed that the loads on the right and upper sides of the existing tunnel are pax and paz, respectively. Due to the unloading effect of excavation, the existing tunnel undergoes a net displacement toward the upper right. As the segment moves, the soil imposes additional loads on the segment to resist deformation, denoted as the horizontal increment Δpax and the vertical increment Δpaz. At the same time, the stresses on the upper and right sides of the tunnel decrease correspondingly. Assuming that the shape of the segment remains unchanged during the crossing process, the increases in additional loads on the left and lower sides equal the decreases on the right and upper sides, and the additional loads eventually reach a balanced state. Under this condition, the vertical and horizontal additional loads satisfy the following relationship.
where Ftx is the circumferential shear force in the x-axis direction, Ftz is the circumferential shear force in the z-axis direction, Fpx is the circumferential tensile force in the x-axis direction, and Fpz is the circumferential tensile force in the z-axis direction.
Figure 3.
Schematic Diagram of Additional Load Redistribution on Segments.
Wei et al. [25] proposed a tunnel deformation model named the cooperative deformation model, in which shear staggering is the dominant mechanism and rigid-body rotation is secondary. Based on the principle of minimum potential energy, this model enables the calculation of longitudinal tunnel deformation, inter-ring staggering displacement, rotation angle, and shear force. This model is based on the following assumptions: (1) The foundation soil is assumed to be isotropic, homogeneous, and a semi-infinite elastic body. (2) The tunnel’s longitudinal deformation is mainly in the shear fault mode, with rigid body rotation as a secondary mode. The relative settlement between the two satisfies a linear superposition relationship. (3) It is assumed that the inter-ring rotation angle θ is infinitesimally small, so sinθ ≈ θ is used in calculations. (4) The foundation reaction uses the Winkler elastic foundation model, assuming that the stress at any point in the foundation is proportional only to the displacement at that point (Fk = kDω(x)), and the springs at each point are independent of each other. (5) The displacement of the foundation spring Sx is strictly equal to the displacement of the tunnel lining ring ωx, meaning there is no separation or relative sliding between them. In this paper, this model is adopted to compute the horizontal and vertical displacements of the tunnel under overlapping over-crossing conditions, as well as the inter-ring shear forces and tensile forces acting on the segmental rings. Using this model, the horizontal displacement of an arbitrary segmental ring is denoted as wx (m), and the vertical displacement as wz (m). The differences in displacement between two adjacent rings are expressed as Δwx and Δwz.
where m and m + 1 are the number of segment rings, and Dt is the width of the segment ring.
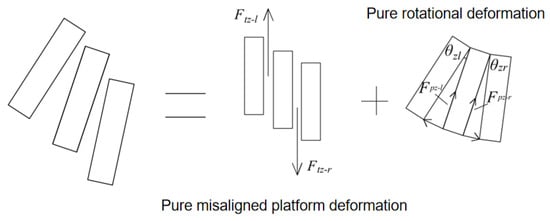
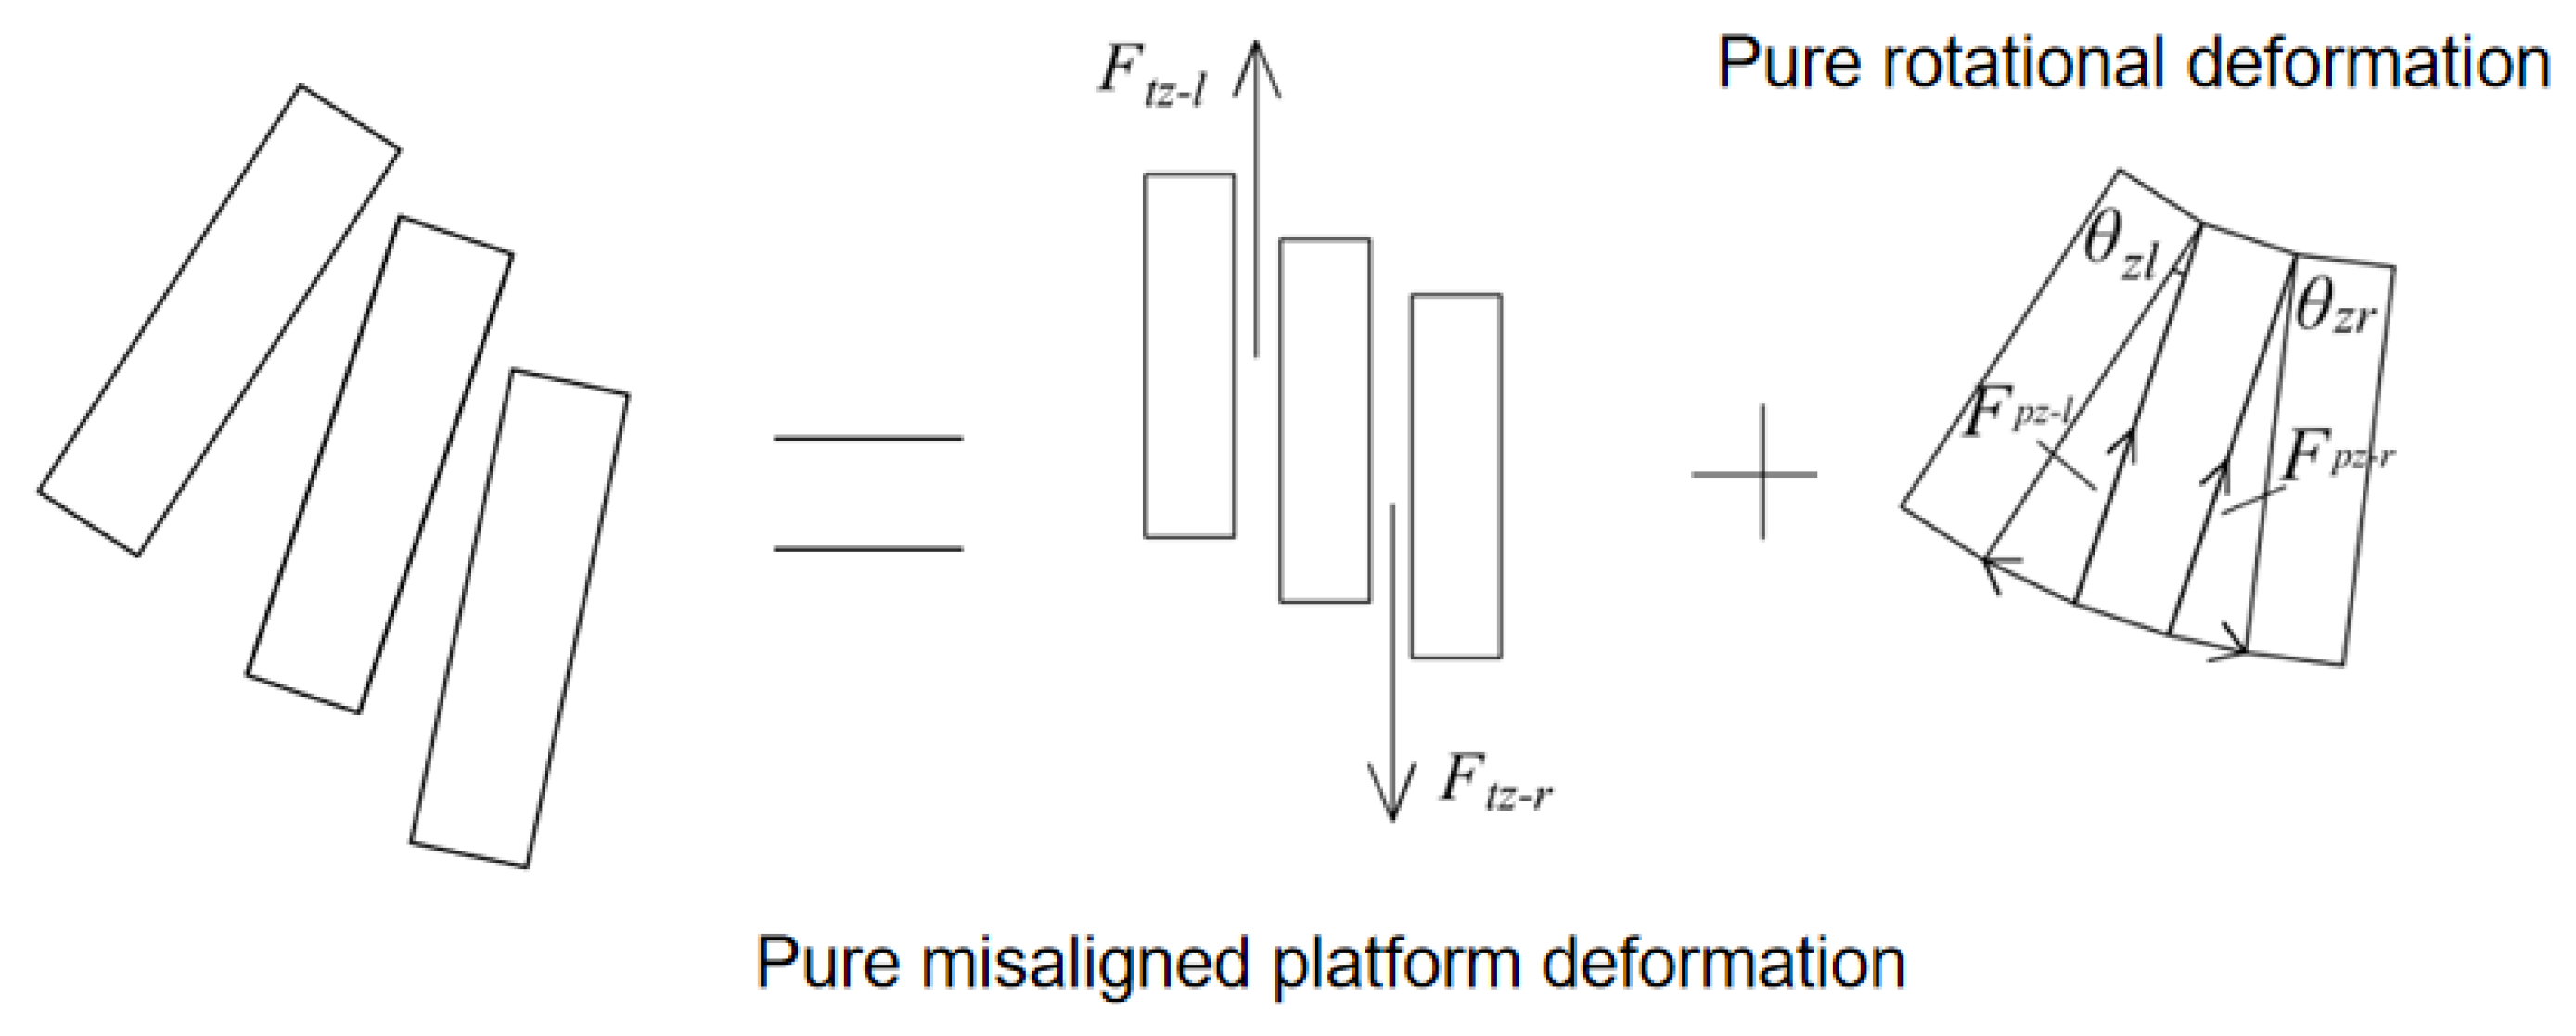
The rotation and deformation caused by horizontal tunnel displacement are similar to those caused by vertical displacement. Therefore, the staggering and rotational deformation induced by vertical displacement are taken as an example in this paper. As shown in Figure 4, the middle ring is subjected to inter-ring shear forces from the adjacent left and right rings, denoted as Ftz-l and Ftz-r, which act in opposite directions. The total shear force Ftz, as well as Ftz-l and Ftz-r, is given as follows:
where kt is the shear stiffness between segments, and are the displacement differences between the middle segment and the left and right segments, respectively, and j is the proportion coefficient of shear deformation to total deformation.
Figure 4.
Schematic Diagram of the Interaction Principle Between Adjacent Segment Rings.
The components of the inter-ring tensile forces in the direction toward the circle center are Fpz-l and Fpz-r. Because the inter-ring rotation angle is very small, is assumed in the calculation. Therefore, the following relationships are obtained.
where θz-l is the relative rotation angle between the middle ring and the left segment, and θz-r is the relative rotation angle between the middle ring and the right segment.
Inter-ring tensile force can be expressed as:
θz-l and θz-r can be expressed as:
Performing a stress analysis on the segment yields the following equilibrium equations:
From the additional stress at each point along the circumferential direction of the segment, the additional confining pressure at that point can be determined as follows:
When β = 0°, as shown in Position 1 of Figure 1b, the axes of the new tunnel and the existing tunnel are completely aligned vertically in terms of their projection onto the z-axis. In this case, the forces on the left and right sides of the existing tunnel are equal. However, inter-ring shear forces and tensile forces may still exist between the segments. The schematic diagram of the redistribution of additional loads on the segment under this condition is shown in Figure 5. The derivation of the additional stress and additional confining pressure at each circumferential point of the segment is similar to the previous case and is therefore not repeated here.
Figure 5.
Schematic Diagram of Additional Load Redistribution on Segments (The old and new tunnels completely overlap).
It should be further clarified that, in deriving the confining pressure redistribution model in this paper, the existing tunnel is treated as being already in its final redistributed state, and the segmental shape is assumed to remain unchanged during the redistribution process. This simplification is justified by the load-structure method adopted in this study. During TBM advancement, transient effects—including cutterhead thrust, shield skin friction, and tail void grouting pressure—are highly coupled and path-dependent. However, for a lining system responding within the elastic range, the final equilibrium state, rather than the transient loading path, governs the ultimate internal force distribution. The assumption of unchanged segment shape applies only to the analytical derivation of force equilibrium; the actual ovalization deformation of the tunnel is fully captured by the detailed solid-element FE model in Section 4.4.1. Nevertheless, it is acknowledged that this simplification precludes consideration of cumulative plastic deformation induced by transient loading, which remains a limitation of the present approach.
3. Case Study Analysis
3.1. Case Study Conditions
The overlapping twin-tunnel section of the Tianjin Metro Line 5, extending from Chenglin Road Station to Jintang Road Station, has a total length of 1348 m [26]. The up and down lines were designed and constructed as vertically stacked tunnels. Two earth pressure balance shield machines, each 8.7 m long with a diameter of 6.4 m, were used. The tunnels are lined with precast concrete segments. Each ring is 1.2 m long, with an inner diameter of 5.5 m and an outer diameter of 6.2 m. The axis depths of the lower and upper tunnels are 26.1 m and 13.4 m, respectively. The shield thrust applied at the cutterhead was 350 kPa, the grouting pressure was 263 kPa, and the shield skin friction was 150 kPa. The segments are made of C50 concrete with an elastic modulus of 34.5 GPa and a Poisson’s ratio of 0.2. The inter-ring tensile stiffness ks = 4 × 10⁵ kN/m, and the inter-ring shear stiffness kt = 8.6 × 10⁵ kN/m. Relevant physical parameters of the ground layers are presented in Table 1.
Table 1.
Information Table of Related Stratum Physical Parameters.
3.2. Analysis of the Calculated Confining Pressure
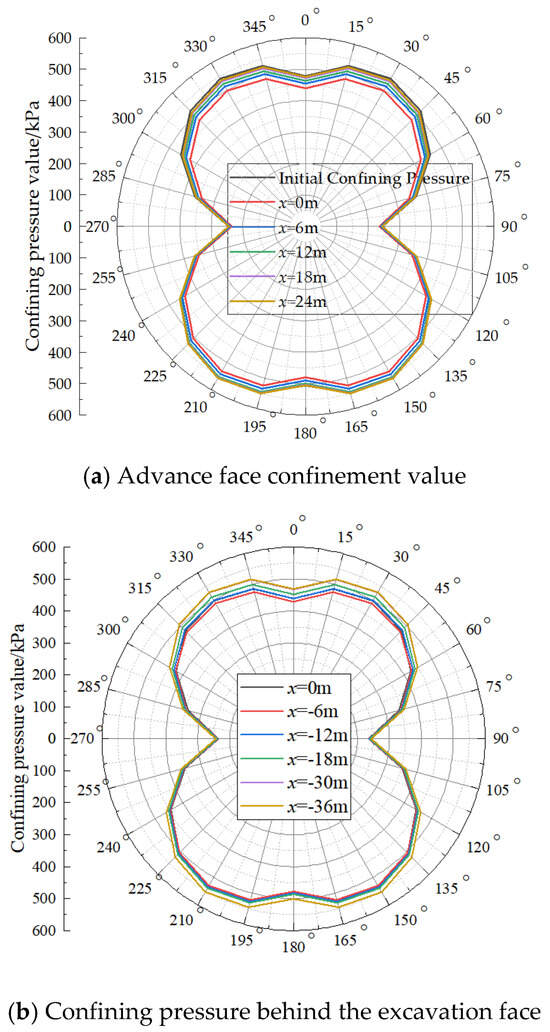
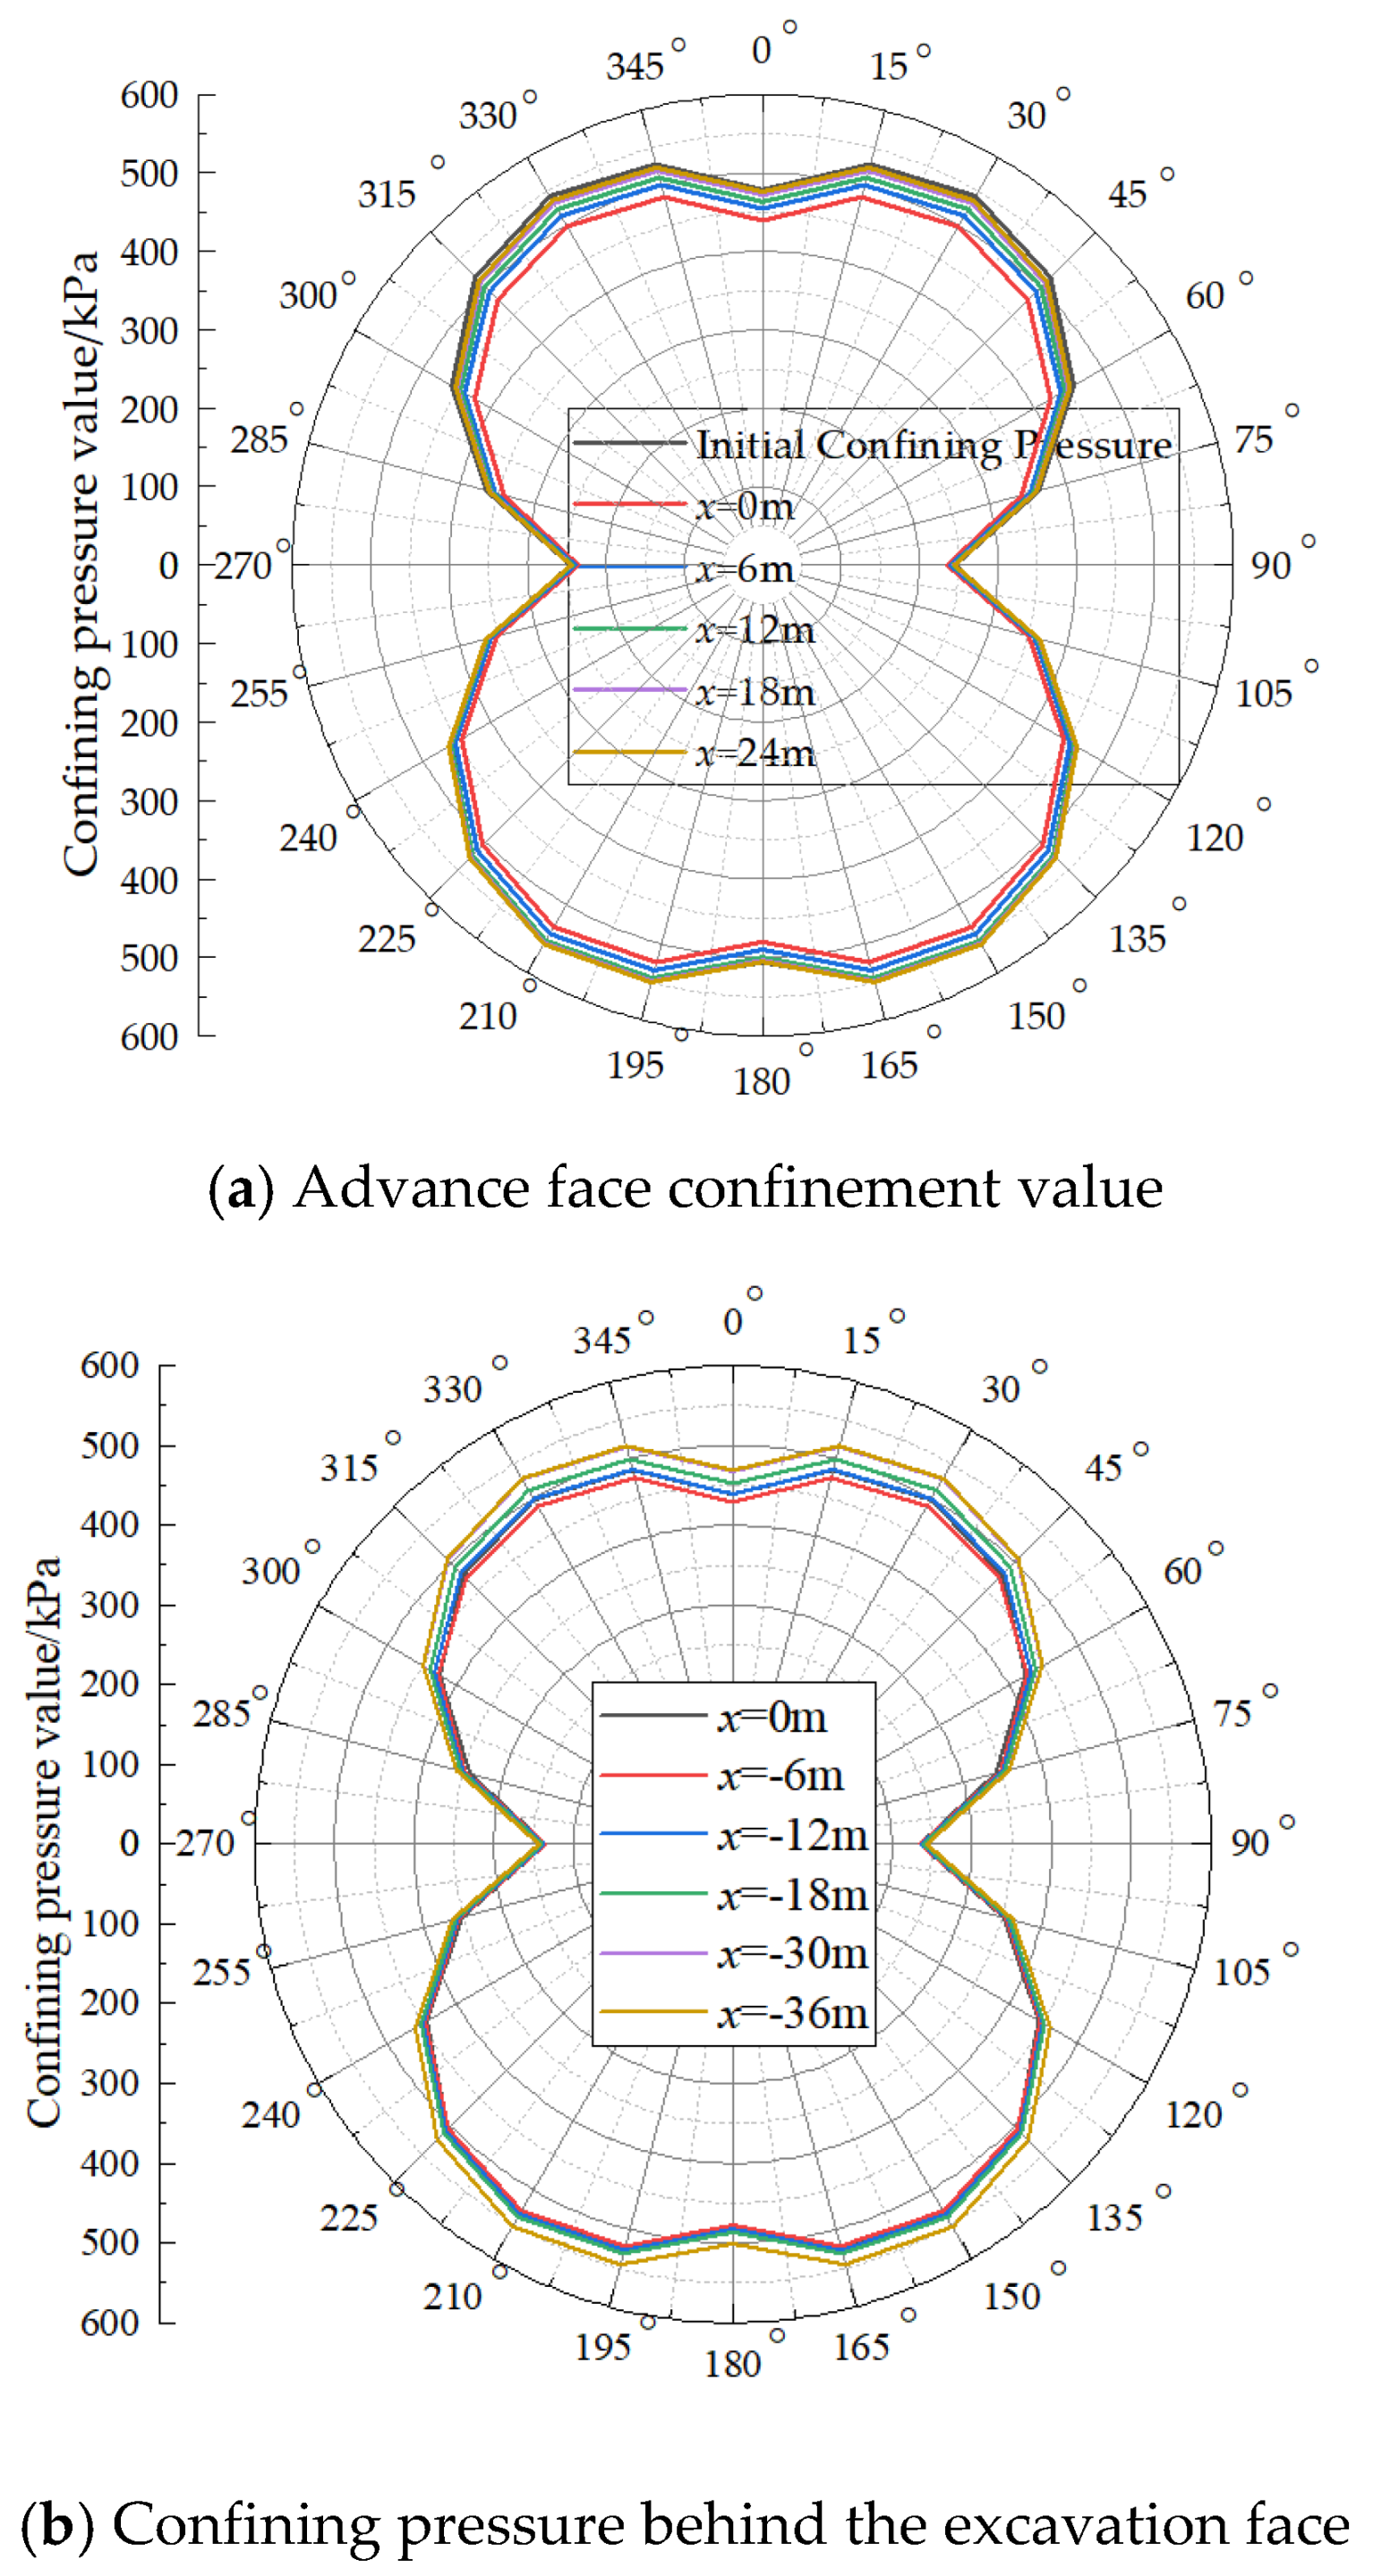
The circumferential confining pressure on the tunnel at different distances from the excavation face is shown in Figure 6, where positive distances indicate locations ahead of the face and negative distances indicate locations behind it. The following observations can be made from this figure. (1) The initial circumferential confining pressure on the existing tunnel exhibits a symmetrical “8” shape, being smaller at the crown and larger at the invert, which is consistent with findings reported in reference [15]. A similar symmetrical distribution is also observed for the circumferential confining pressure at various distances from the face after excavation. (2) When the new tunnel is excavated, a decrease in the circumferential confining pressure on the underlying existing tunnel is induced, which can be attributed to the unloading nature of the excavation process. (3) At a distance of approximately 24 m ahead of the excavation face, the circumferential confining pressure on the tunnel becomes roughly equal to its initial value, indicating that the zone of influence of shield excavation on the confining pressure of the existing tunnel extends approximately 24 m in front of the shield. (4) At a distance of about 36 m behind the excavation face, the circumferential confining pressure undergoes almost no further change and stabilizes at approximately 95% of the initial confining pressure. At this location, which is relatively far from the excavation face, the effects of additional thrust at the cutterhead, shield skin friction, and additional grouting pressure on the existing tunnel are relatively small; however, ground loss caused by excavation still persists.
Figure 6.
Tunnel surrounding pressure values at different positions from the excavation face.
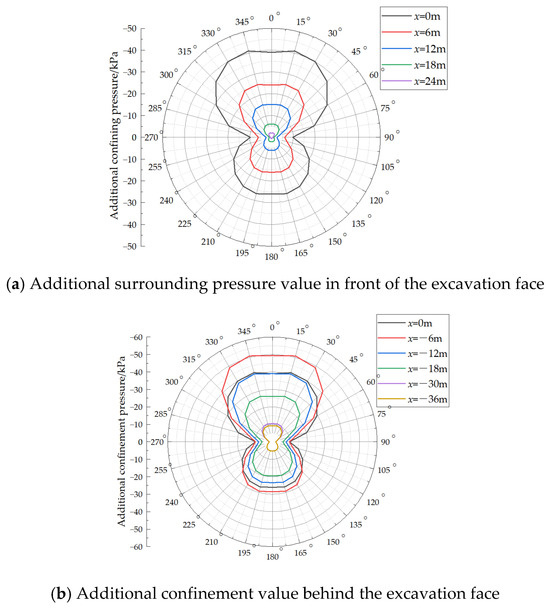
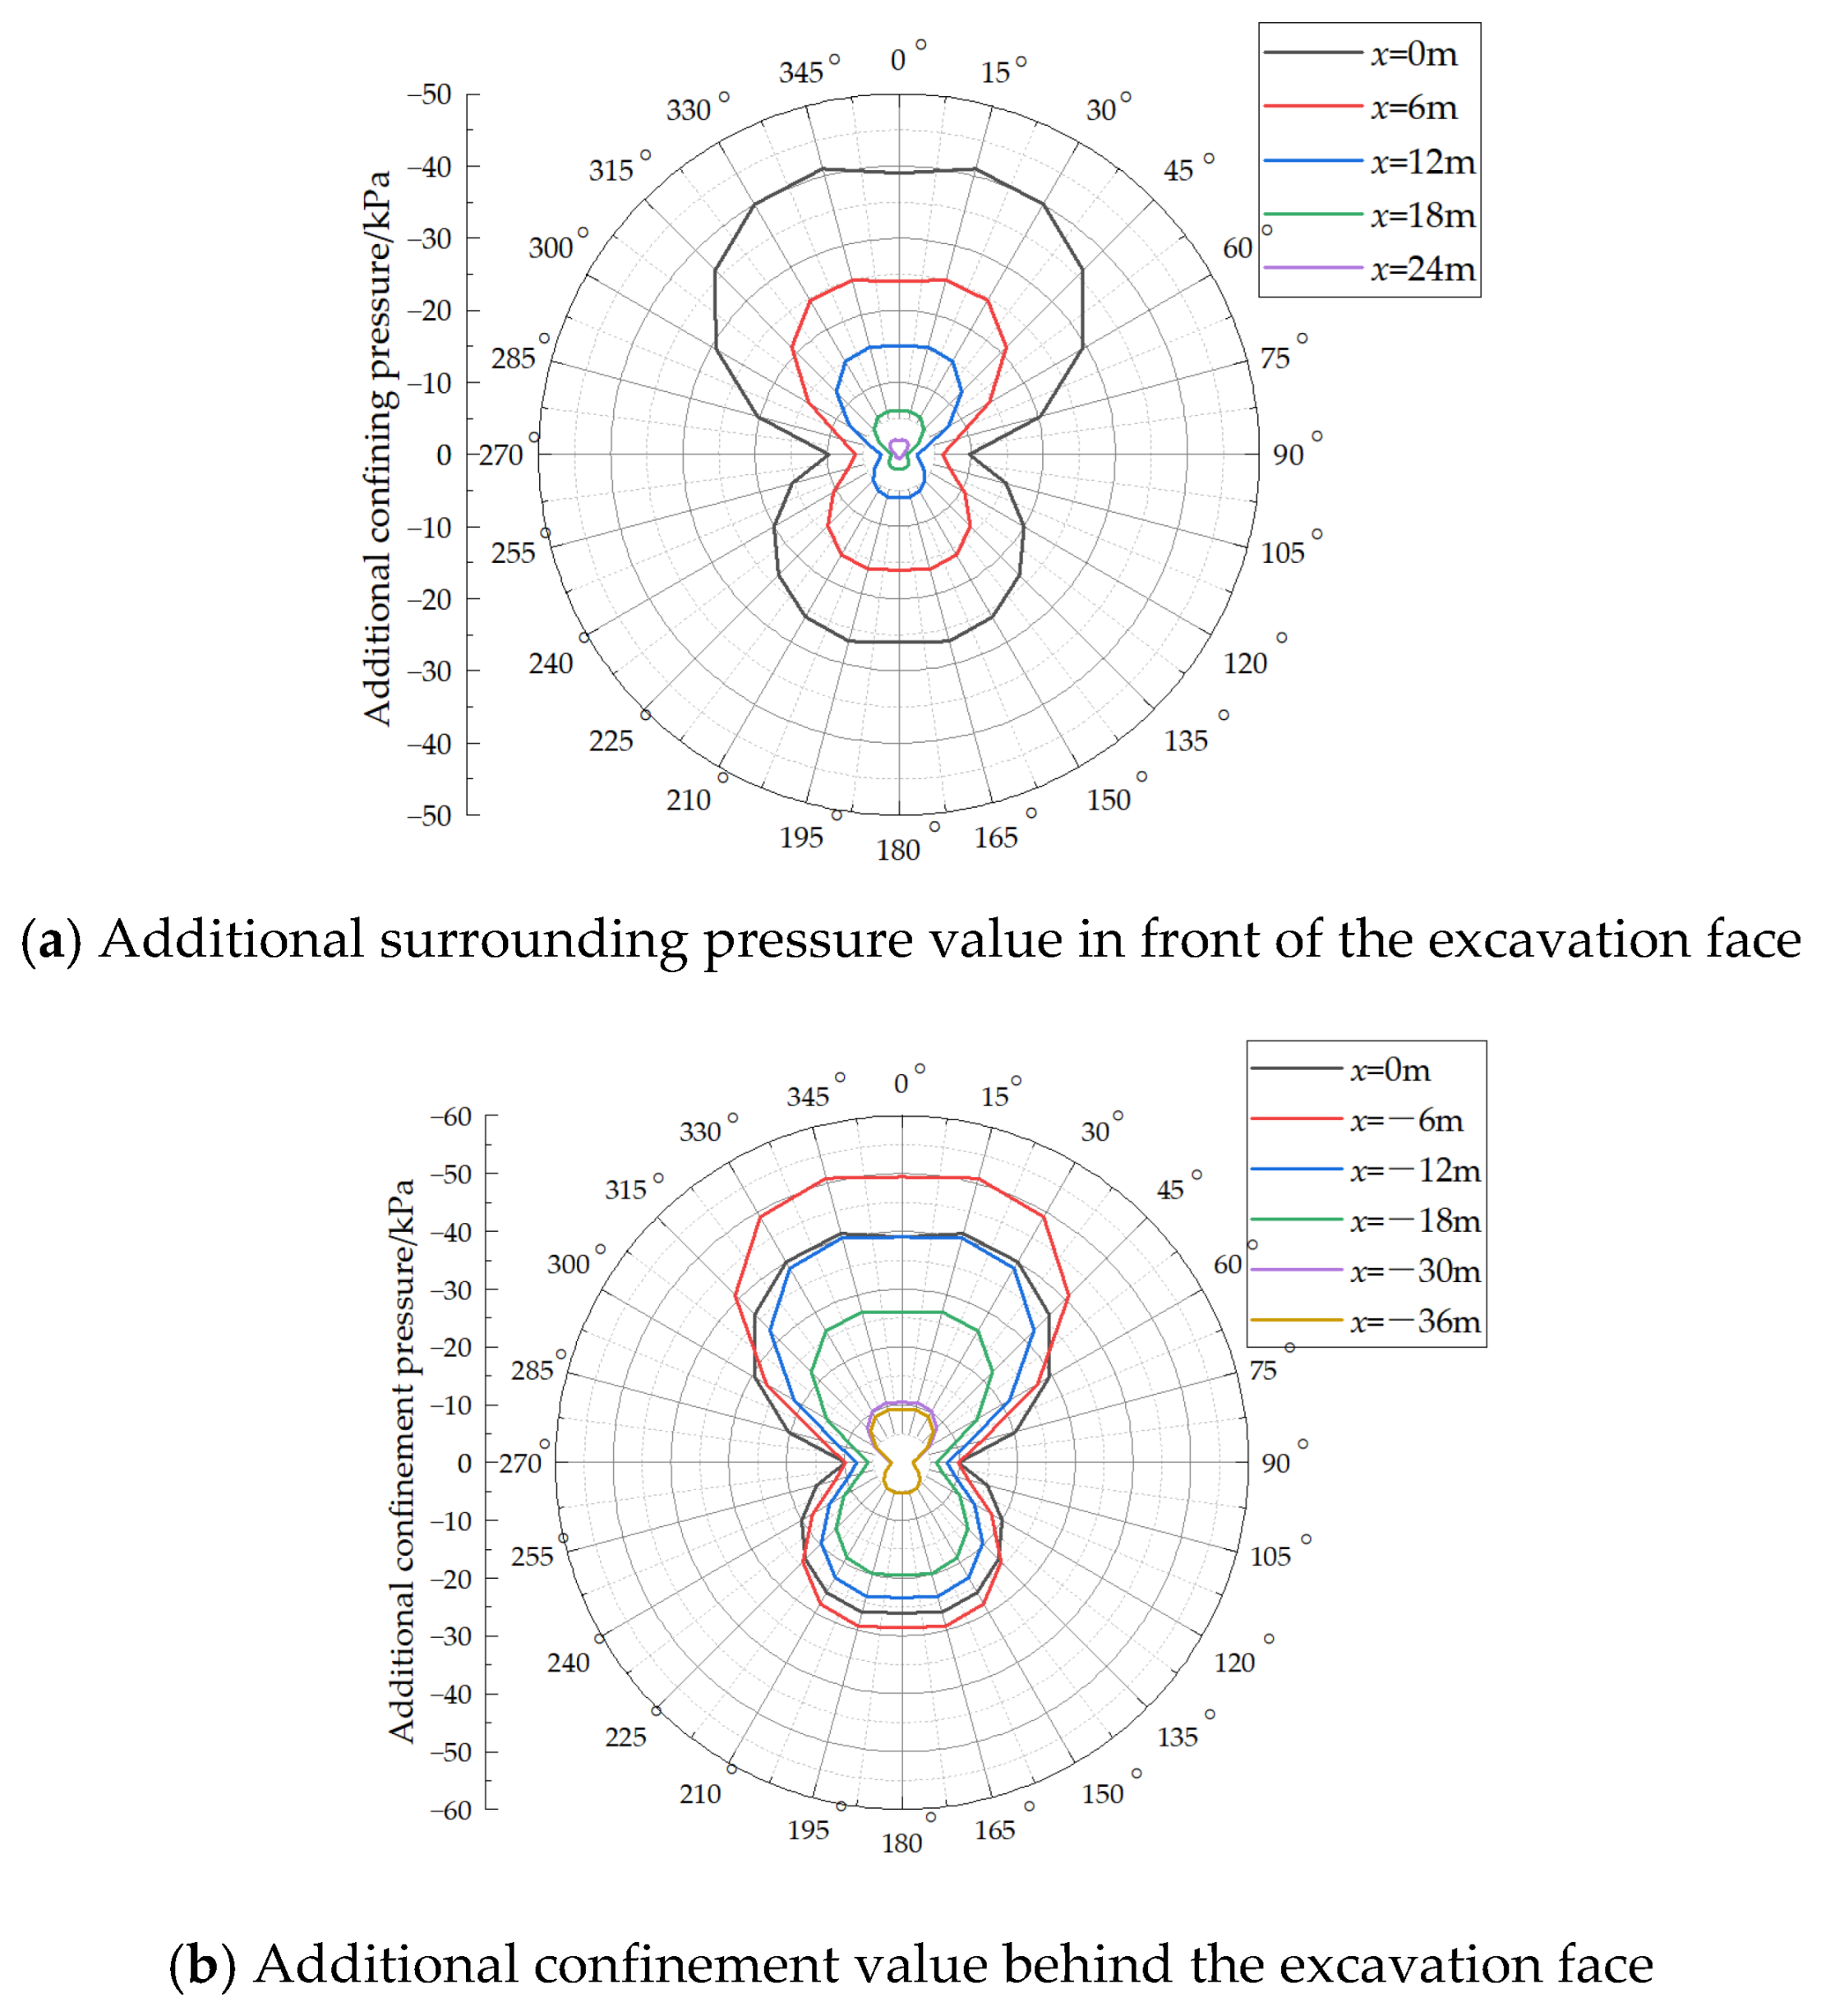
The additional circumferential confining pressure on the tunnel at various distances from the excavation face is presented in Figure 7. The following observations can be made from this figure. (1) After excavation, the additional confining pressure is entirely negative and symmetrically distributed around the circumference, with more pronounced variations observed in the upper half than in the lower half. (2) Ahead of the excavation face, the magnitude of the additional confining pressure is greatest at a distance of x = 0 m. At this location, the maximum value reaches −41 kPa at circumferential positions of 15° and 345°, while the minimum value is −9.75 kPa at positions of 90° and 270°. The additional confining pressure approaches zero at a distance of x = 24 m ahead of the face. (3) Behind the excavation face, the additional confining pressure initially increases and then decreases. The overall maximum is reached at a distance of x = −6 m, where the peak value is −50.9 kPa at the 15° and 345° positions, and the minimum remains −9.75 kPa at the 90° and 270° positions. Although this minimum value equals that observed at x = 0 m for the 90° and 270° positions, this agreement is considered a numerical coincidence. (4) At distances of x = −30 m and x = −36 m behind the face, the additional circumferential confining pressure on the existing tunnel shows little variation, and it becomes essentially stable beyond 36 m behind the excavation face.
Figure 7.
Tunnel additional surrounding pressure at different positions from the excavation face.
It is worth noting that the “additional confining pressure” calculated in this paper represents the net change in confining pressure of an existing tunnel relative to the initial stress field after all transient construction loads have dissipated. The load changes during the shield construction process can be divided into four stages: cutterhead additional thrust, shield shell lateral friction, tail grouting pressure, and ground loss due to excavation. Among these, the grouting pressure belongs to the third stage—it exists only during slurry injection and early setting, and is a transient effect. Once the slurry sets and hardens, this pressure completely dissipates. What ultimately persists is the reduction in confining pressure caused by excavation unloading and ground loss. Additionally, the grouting pressure acts directly on the lining of the new tunnel, and its impact on the existing tunnel is transmitted indirectly through the soil, and it is significantly attenuated during this transmission. Therefore, in the final equilibrium state captured by the model in this paper, it is reasonable that the persistent net effect is the reduction in confining pressure, and the additional confining pressure appears as a negative value. It should be emphasized that the model in this paper focuses on the final stress state after construction, rather than the transient load peaks during construction—this is consistent with the engineering principle in tunnel lining design of using “post-construction” or “operational stage” loads as the controlling condition.
3.3. Validation of the Calculated Additional Confining Pressure
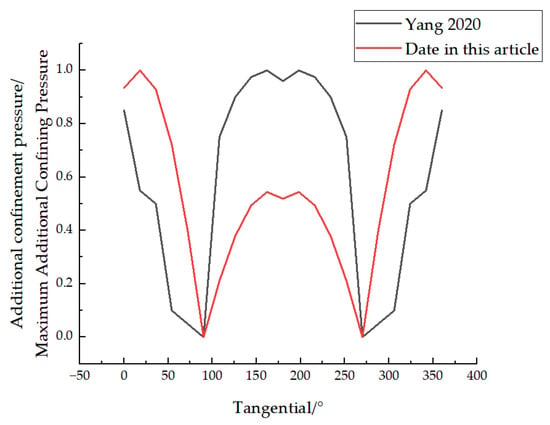
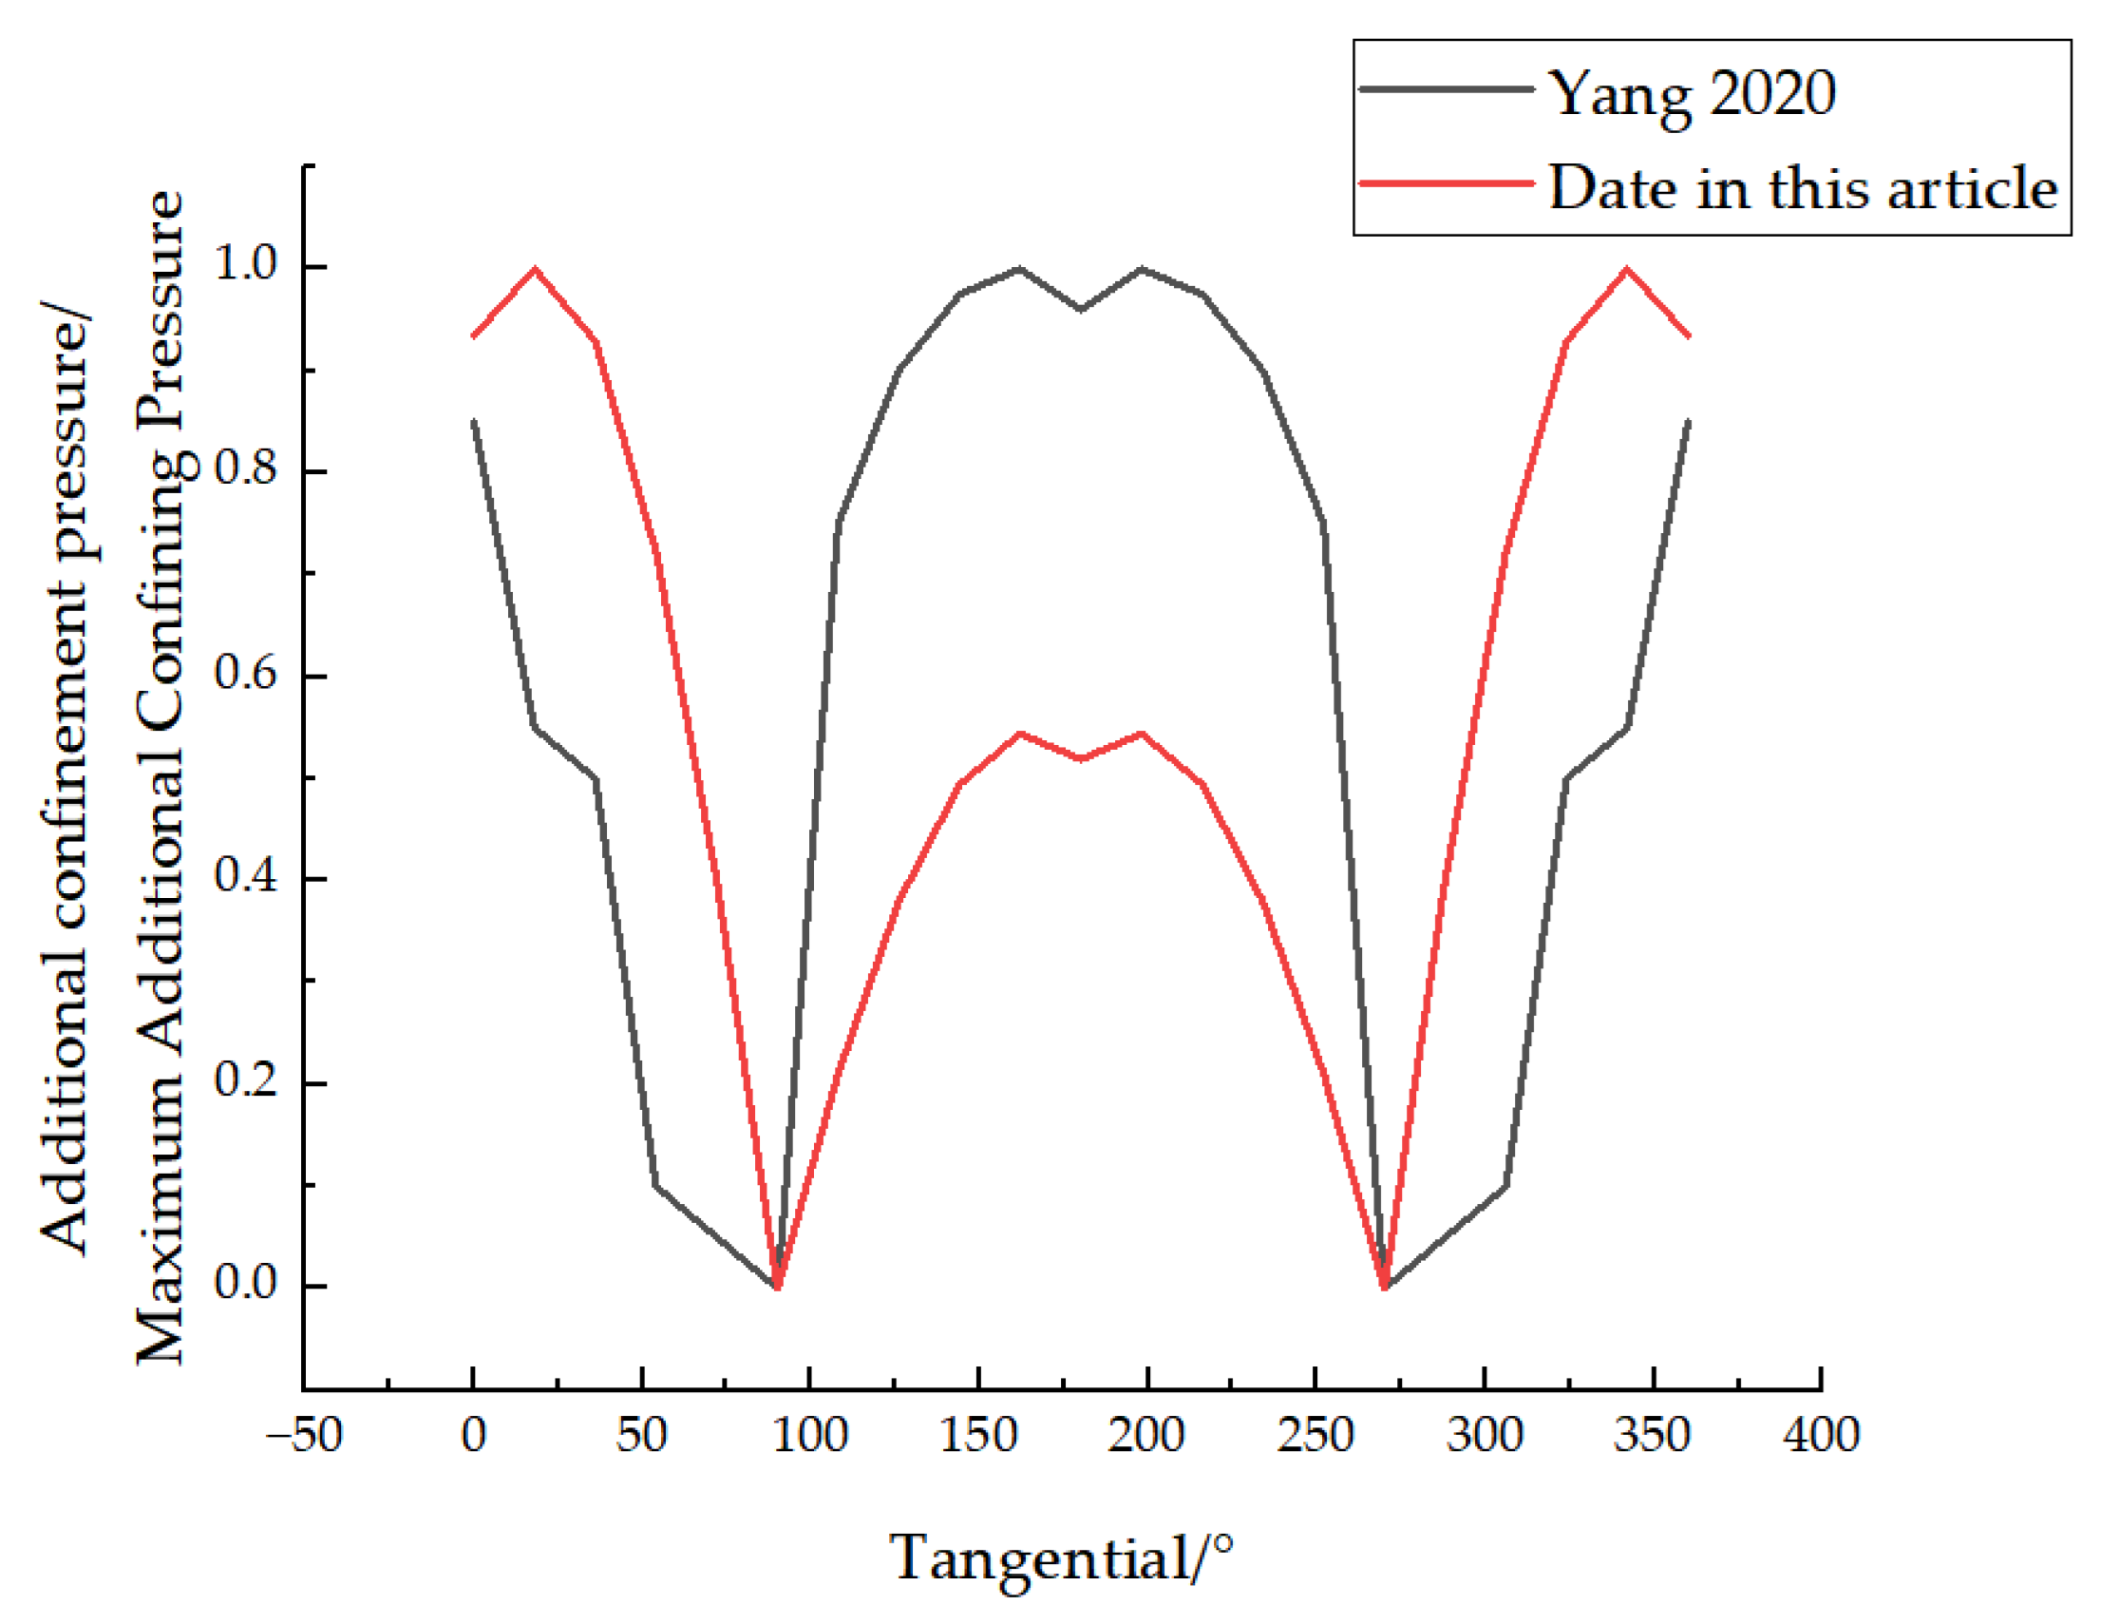
A dimensionless comparative analysis was conducted between the radial pressure data for overlapping tunnels reported by Yang et al. [8] and the data obtained in this study. The results are presented in Figure 8. As can be seen from the figure, the additional confining pressure calculated in this study shows a consistent trend with the data of Yang et al. [8], which supports the validity of the proposed calculation method. However, the circumferential position of the maximum additional confining pressure obtained in this study differs from the position of the maximum radial pressure reported in reference [8], with a notable discrepancy observed within the range of 125° to 225°. This difference may be attributed to the fact that the simulation conducted by Yang et al. [8] accounted for the influence of the earlier tunnel excavation on the displacement field of the surrounding soil, whereas such an influence was not considered in the present calculation method. Nevertheless, the location of the maximum additional confining pressure found in this study is consistent with the experimental results reported by Xie et al. [9].
Figure 8.
Comparison Analysis of Additional Confining Pressure in Dimensionless Form [8].
In Yang et al.’s [8] numerical simulation, the excavation process of the preceding tunnel (the lower tunnel) was fully simulated—that is, they first established the initial ground stress field, then simulated the excavation, support, and redistribution of surrounding stress for the lower tunnel, and finally simulated the impact of the upper tunnel’s excavation on the lower tunnel. In this process, the displacement field of the surrounding soil caused by the lower tunnel excavation was already included in the model.
In contrast, in our calculation method, the initial surrounding stress is directly calculated based on classical earth pressure theory, without simulating how the lower tunnel excavation would disturb the soil displacement field. What we focus on is the ‘additional impact of the upper tunnel excavation on the existing (already stabilized) lower tunnel,’ rather than ‘fully simulating the construction of both tunnels from scratch.’
The impact of this difference is that in Yang et al.’s [8] model, the soil around the lower tunnel has already gone through a disturbance from excavation, and its stress history and displacement field are significantly different from the ‘initial ground stress field.’ The additional effects of the upper tunnel excavation are then superimposed on this ‘already disturbed’ soil. In our analytical model, the additional effects are superimposed on the ‘initial ground stress field.’ Naturally, these two different ‘initial conditions’ lead to different final results.
4. Numerical Simulation Analysis
4.1. Basic Assumptions
A three-dimensional, detailed segmental lining model was established using the load-structure method, in which the surrounding soil was not explicitly modeled. The following assumptions were made. (1) No reinforcement is explicitly modeled within the segments, and materials such as water stops and rubber gaskets between segments are neglected. The concrete is modeled using a plasticity damage constitutive law (CDP model). It should be noted that this simplification is adopted because the primary objective of this study is to investigate the relative trends and parametric sensitivities of internal force variations, rather than to predict the absolute cracking load or ultimate bearing capacity of the segments. Within the elastic response range in which the internal forces are extracted, the reinforcement has not yet yielded, and its exclusion does not materially affect the distribution patterns of internal forces. However, the omission of rebar does lead to an underestimation of post-crack stiffness; therefore, the results should be interpreted with caution when applied to ultimate limit state design, and future work should incorporate reinforcement explicitly for more accurate absolute predictions. (2) The contacts between adjacent segments and between segments and bolts are all modeled using a surface-to-surface contact approach. The tangential behavior is defined as Coulomb friction based on a penalty function with a friction coefficient of 0.4, while hard contact is specified for the normal direction. The connection between the bolt head and the segment handhole is simulated by a tie constraint. (3) Constraints in the z-direction are applied to the front and rear faces of the segments to account for inter-ring interactions, and no longitudinal movement of the segments is assumed.
4.2. Model Parameters
The material parameters adopted in the model are presented in Table 2.
Table 2.
Model Material Parameters.
4.3. Model Establishment
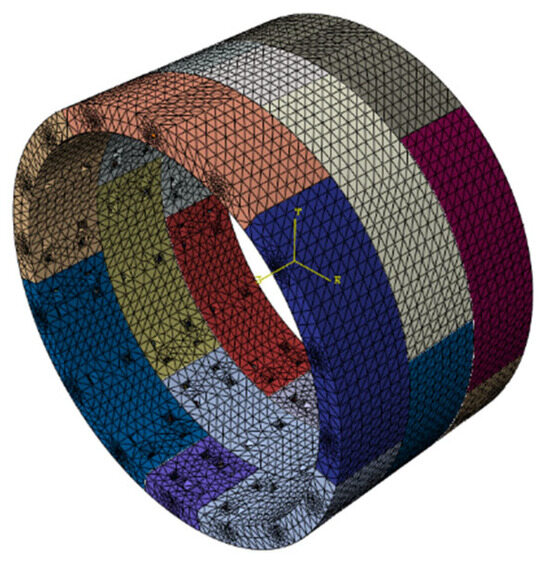
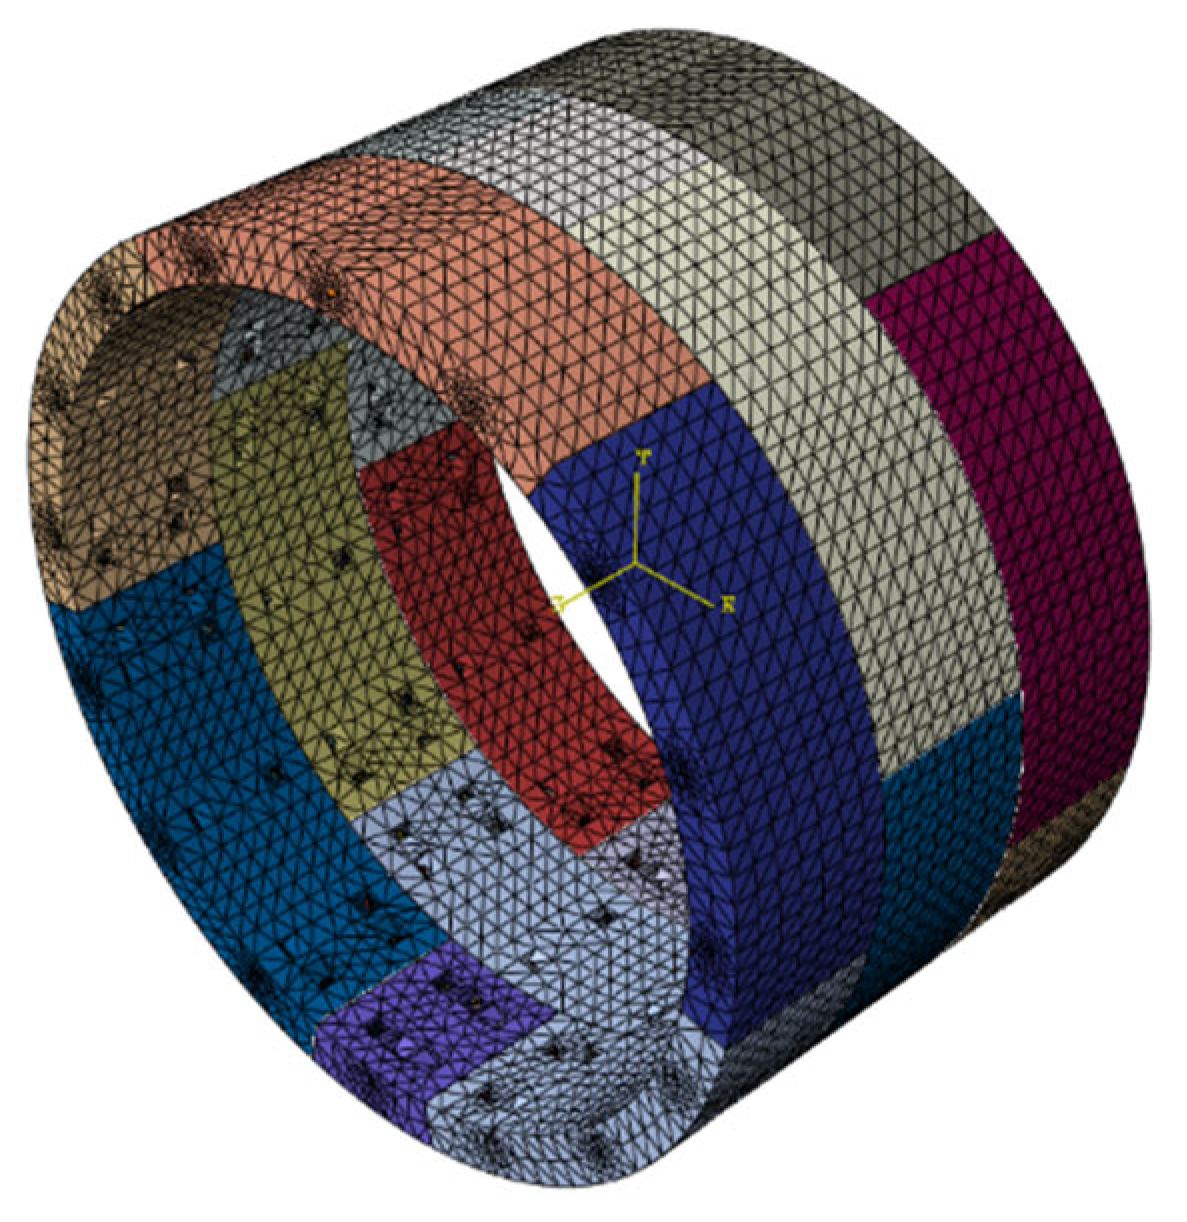
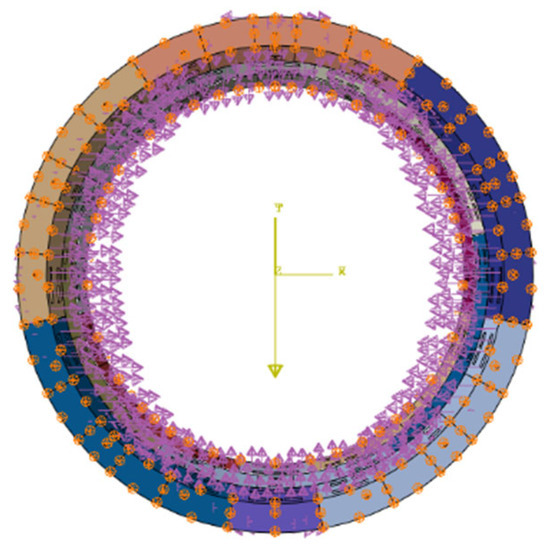
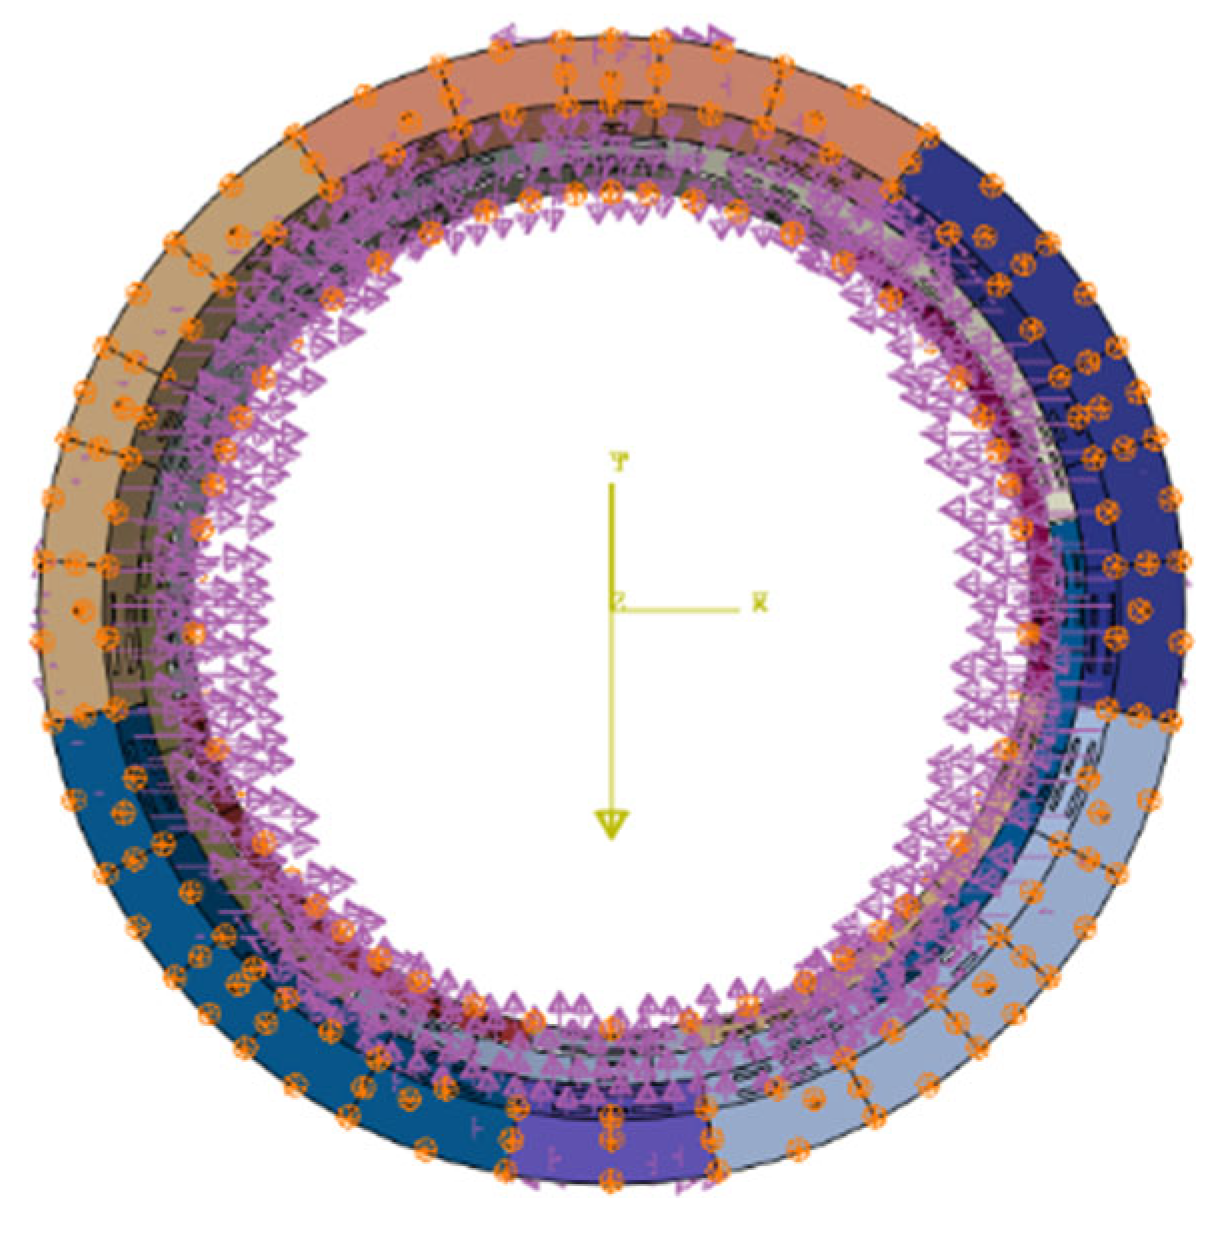
Each tunnel ring consists of six segments arranged in a “1 + 2 + 3” pattern [19]. Both the segments and the bolts were modeled using solid elements. The resistance of the ground to deformation was applied to the segments through compression-only nonlinear soil springs. The stiffnesses of the tangential and normal springs were calculated based on a foundation reaction coefficient of 5000 kN/m3, with the tangential stiffness set to one-third of the normal stiffness [27]. The segment model is shown in Figure 9. Loads were applied to the segments using the load-structure method to simulate the actual loading conditions. Taking the clockwise direction as positive, the circumferential direction of the ring was divided into four regions: 0–180°, 90–270°, 180–360°, and 270–90°. Because the circumferential load varies considerably, the load distribution in each region was expressed as a function and applied accordingly. Detailed procedures can be found in the Abaqus user documentation. The loaded segment model is shown in Figure 10.
Figure 9.
Segment Model.
Figure 10.
Schematic Diagram of Segment Forces.
4.4. Analysis of Simulation Result
4.4.1. Deformation of the Segments at the Excavation Face (x = 0 m)
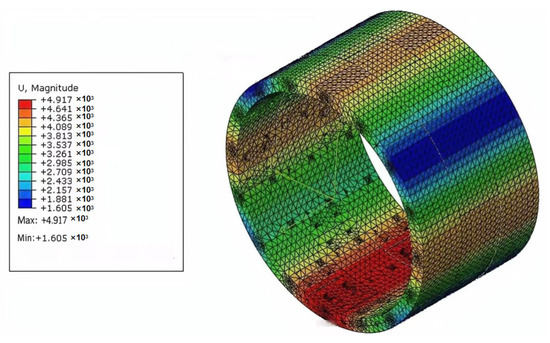
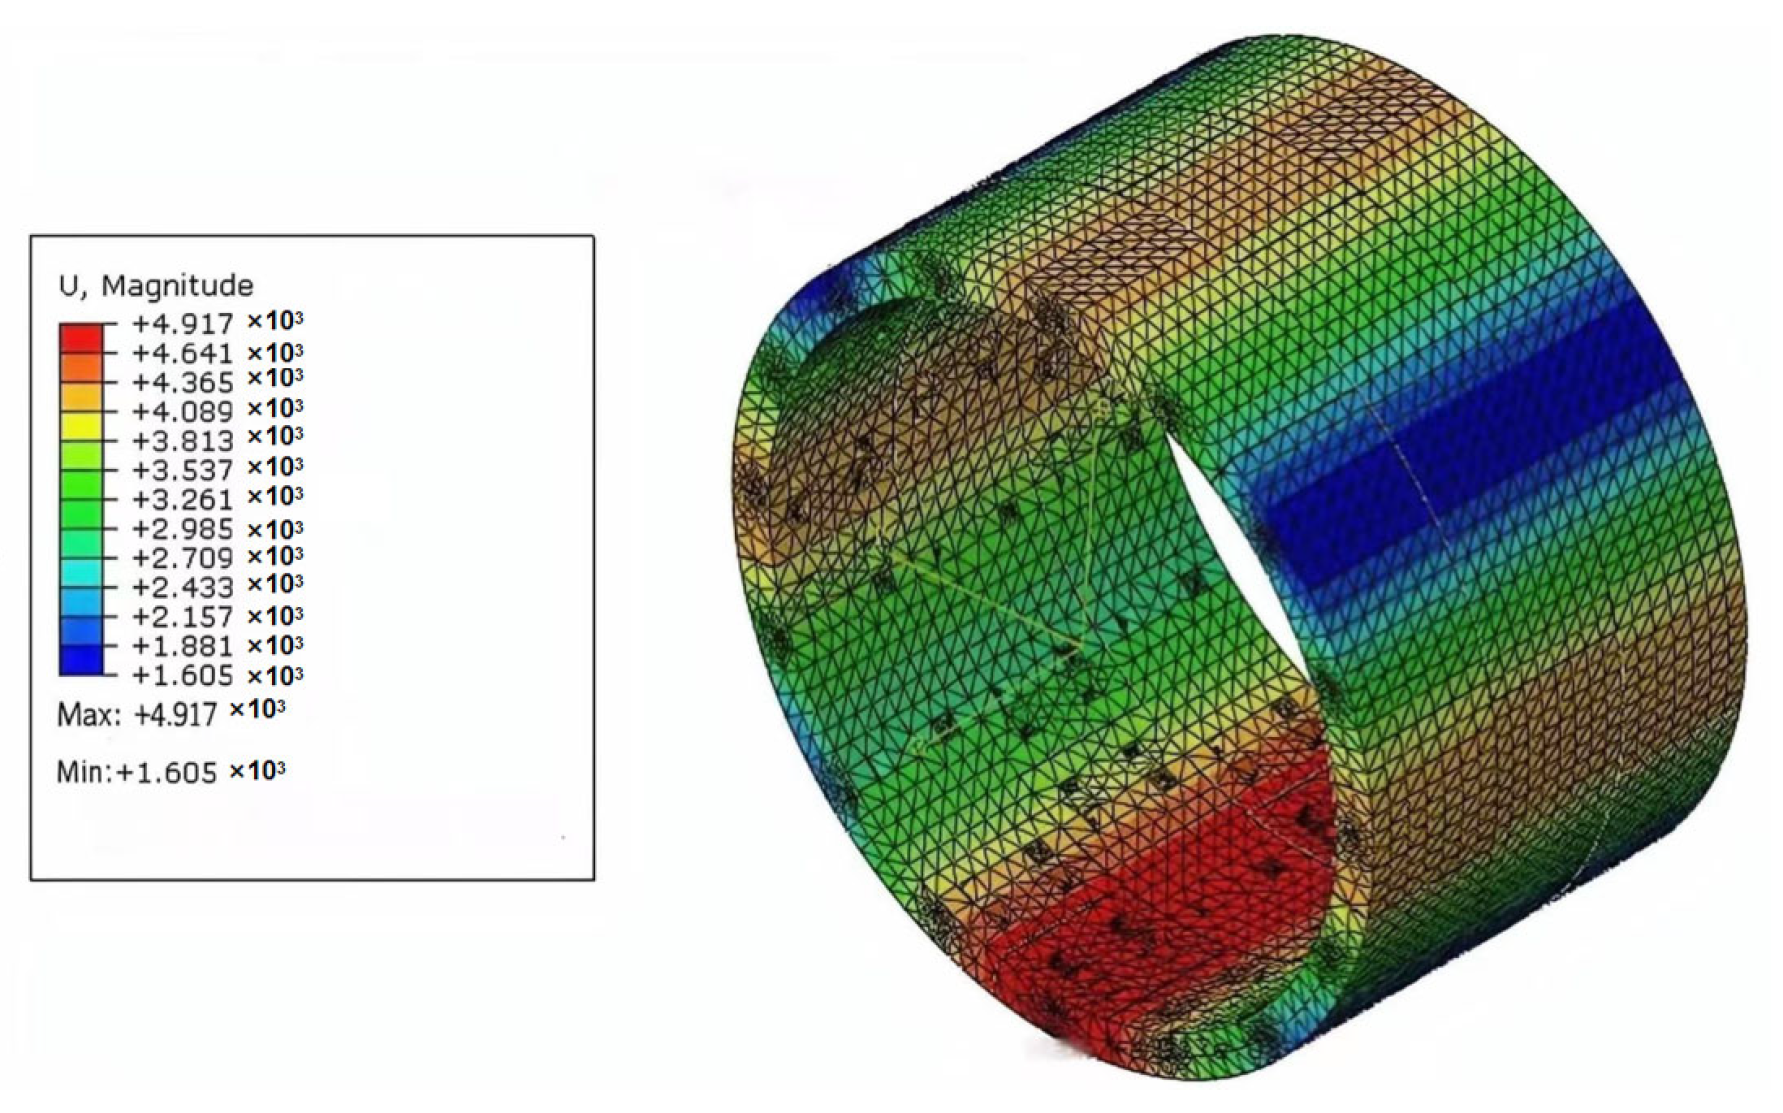
The overall deformation of the segments at the excavation face is presented in Figure 11. The following observations can be made. (1) The lateral deformation of the segments is concentrated mainly between 60–120° and 240–300°. The maximum lateral deformation is 4.356 mm at the 180° position, and the minimum lateral deformation is −4.290 mm at the 270° position (where positive values denote expansion and negative values denote contraction). (2) The vertical deformation of the segments is concentrated mainly between 330–30° and 150–210°. The maximum vertical deformation is 4.917 mm at the 180° position, and the minimum vertical deformation is −4.279 mm at the 0° position. (3) The overall deformation of the tunnel is characterized by an elliptical shape in the cross-section. The maximum overall deformation is 4.917 mm at the 180° position, and the minimum overall deformation is 1.605 mm at the 345° and 45° positions.
Figure 11.
Overall deformation diagram of the segment at the excavation face location.
4.4.2. Bolt Stresses at the Excavation Face (x = 0 m)
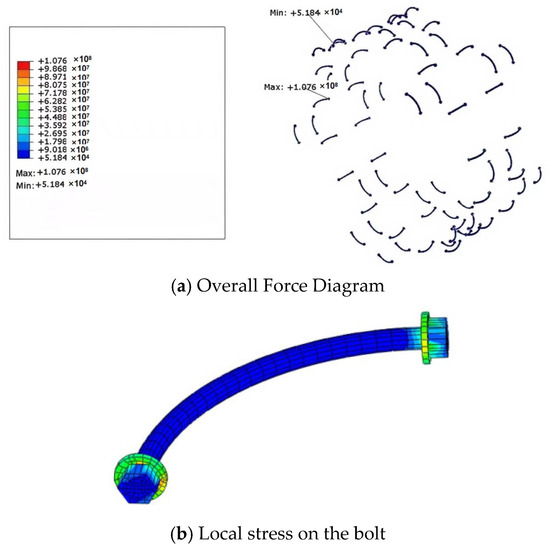
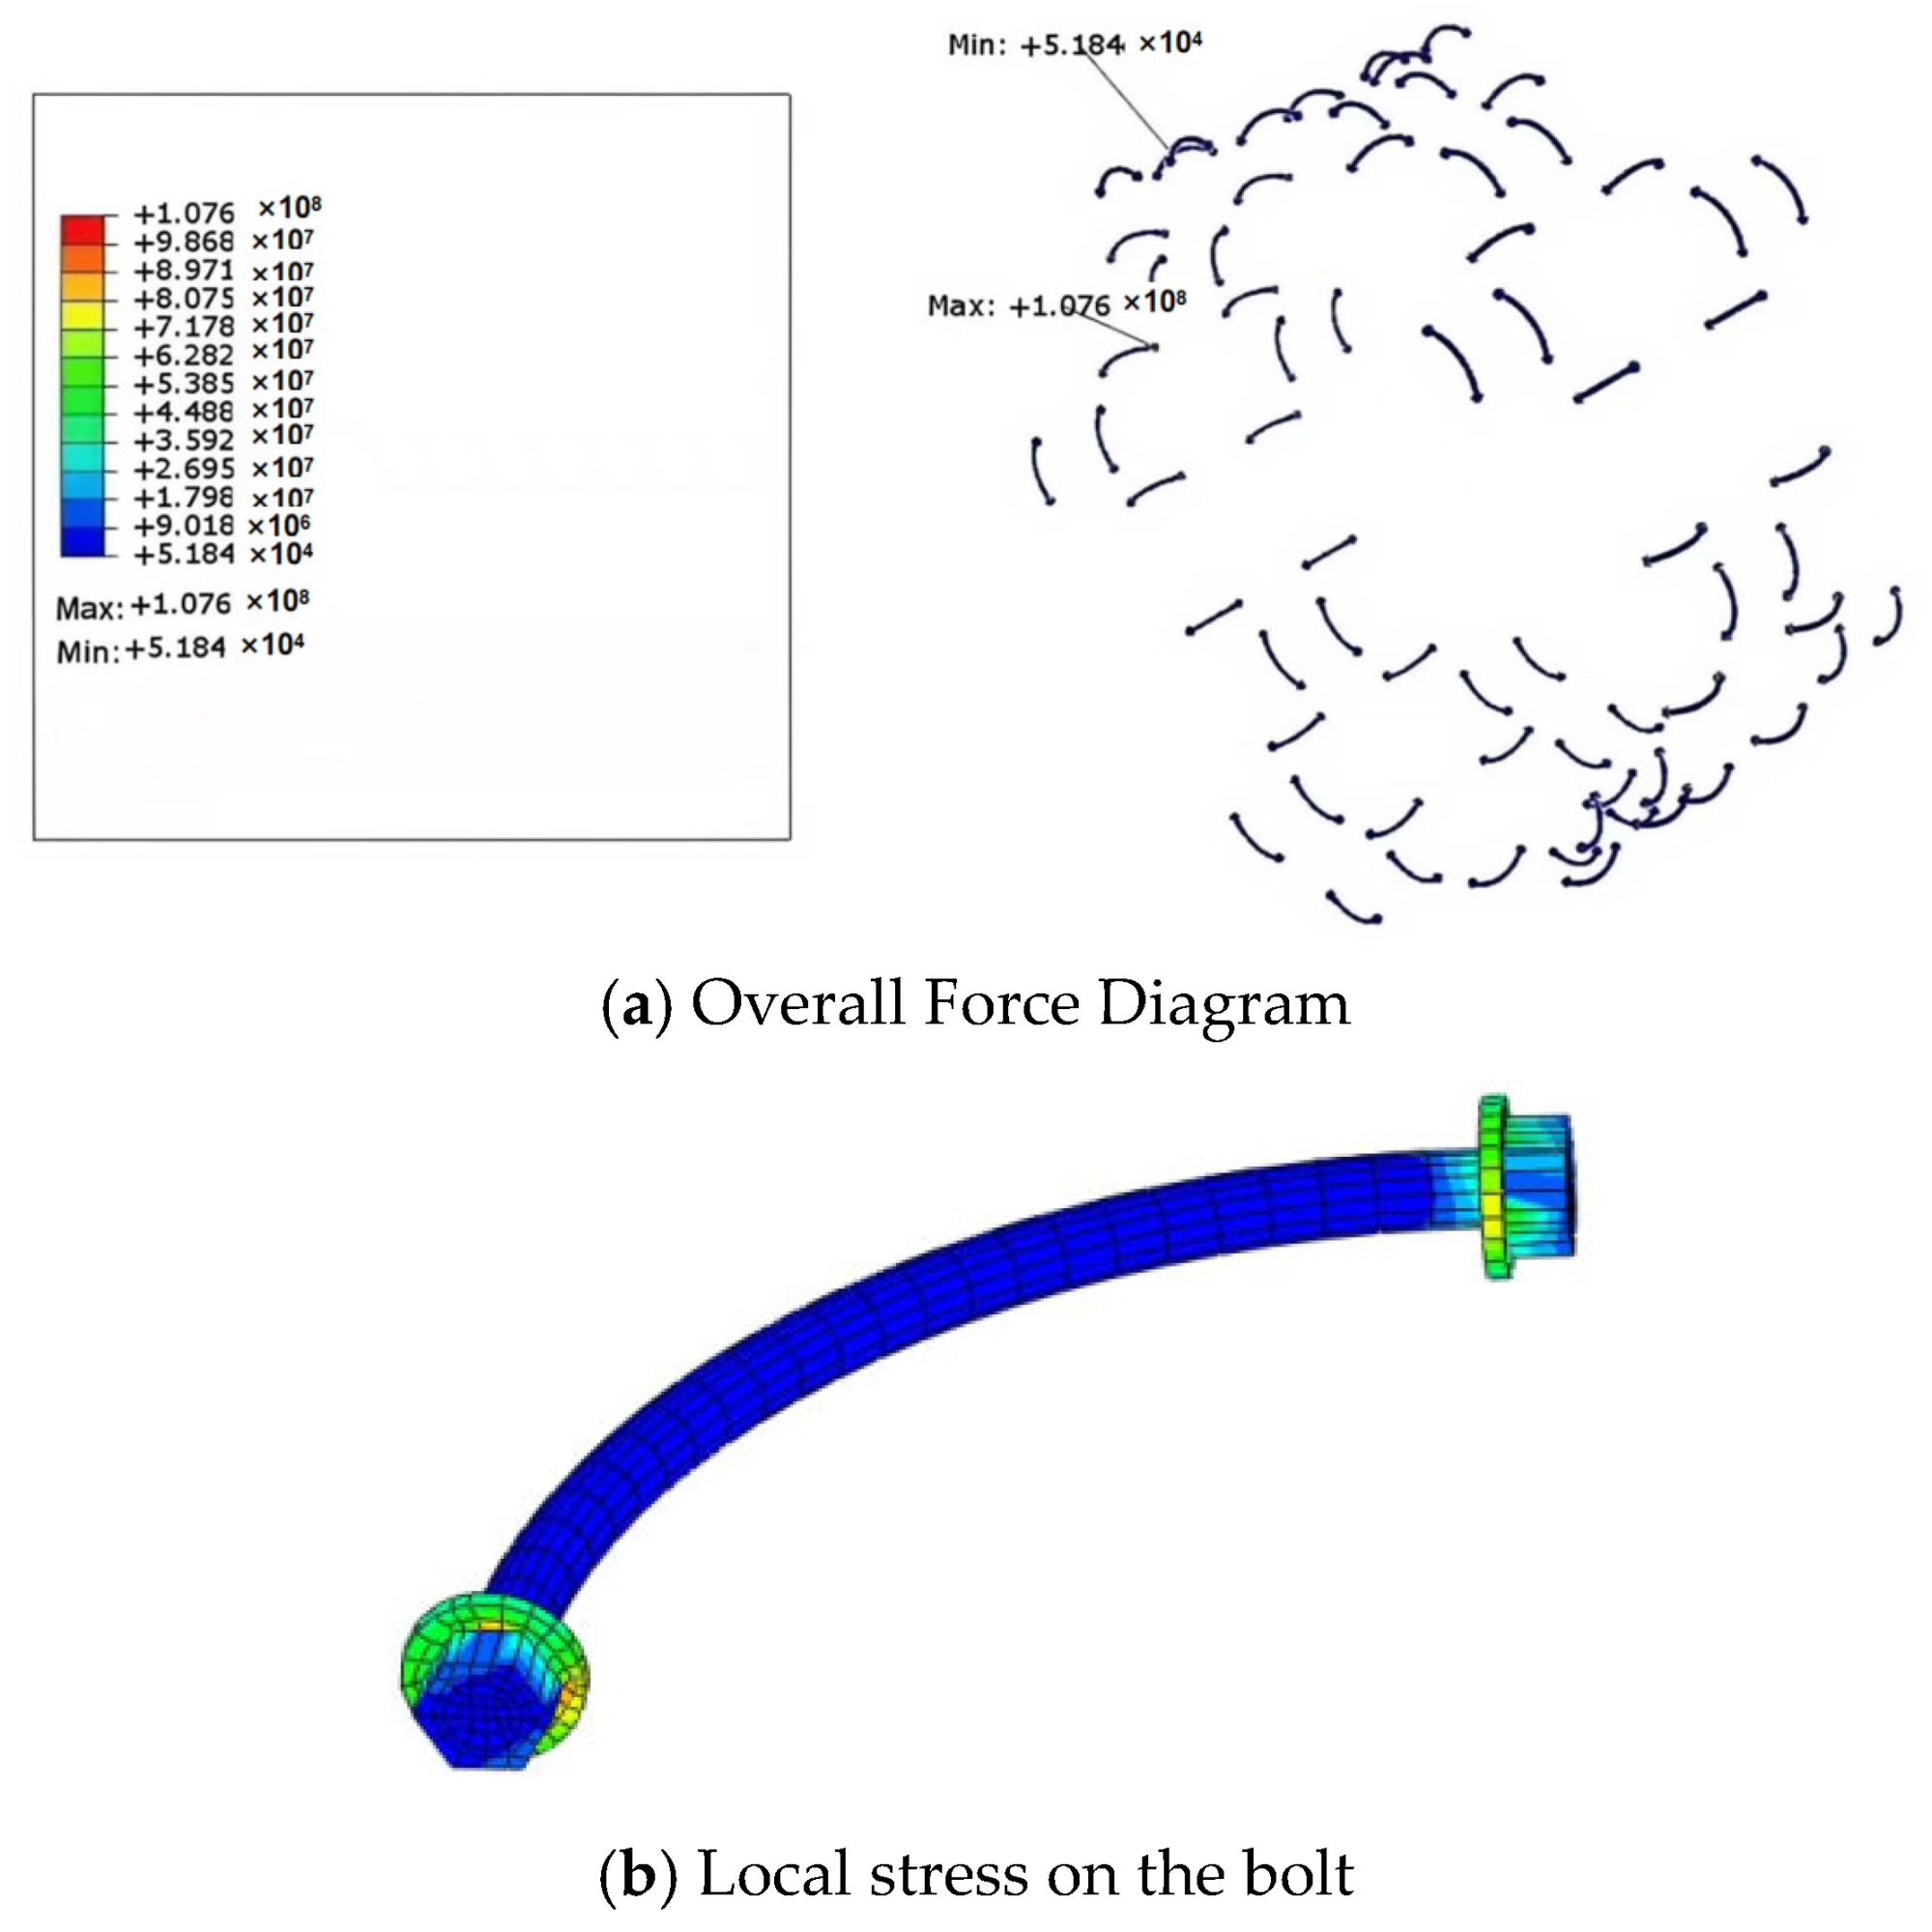
The stress distribution in the bolts is shown in Figure 12. The following observations can be made. (1) All bolts are in a state of tension, with the stress in the bolt shaft being smaller than that in the bolt head. (2) The maximum principal stress in the bolts is observed at the 90° and 270° positions, reaching a value of 107.6 MPa, while the minimum principal stress is observed at the 315° and 45° positions, with a value of 51.84 kPa. (3) The maximum stress within an individual bolt occurs at the bolt head. Therefore, in practical engineering, the condition of the bolt heads should be monitored closely to prevent damage to the segments.
Figure 12.
Bolt Stress at Excavation Face Location.
4.4.3. Variation in Internal Forces at Different Positions
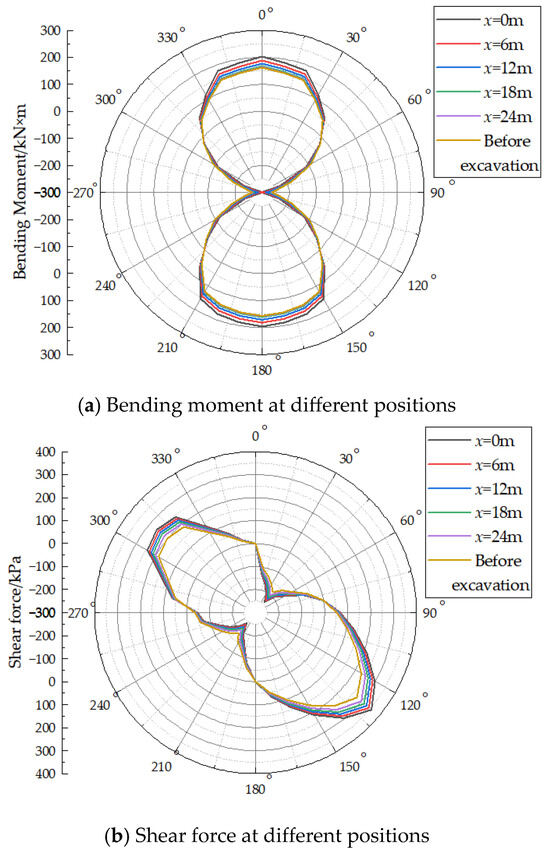
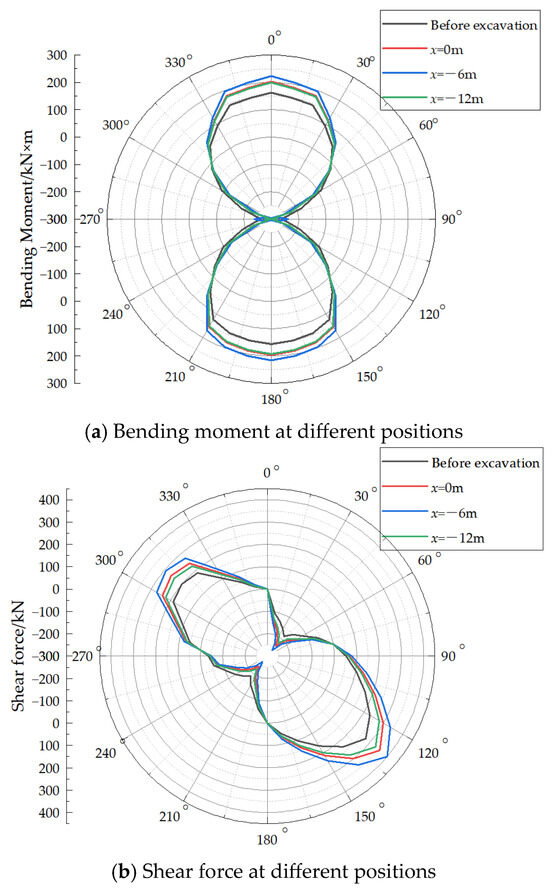
Positive internal forces are defined as follows: a bending moment is positive when it induces tension, an axial force is positive when it induces compression, and a shear force is positive when it causes clockwise rotation of a free body. Figure 13a shows the bending moment distribution in the segments at different positions ahead of the excavation face. The following observations can be made. (1) Ahead of the excavation face, the bending moment distribution exhibits a symmetrical “figure-8” pattern. (2) As the distance from the excavation face increases, the circumferential bending moment decreases and becomes stable at approximately 24 m ahead of the face. At the excavation face (x = 0 m), the maximum positive circumferential bending moment is 202.80 kN·m, and the maximum negative bending moment is −328.41 kN·m at the 0° position, with additional extreme values observed at the 90° and 270° positions.
Figure 13.
Internal Forces in the Segment Ahead of the Excavation Face.
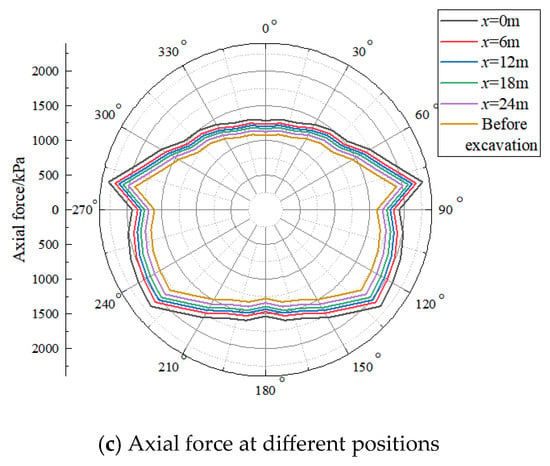
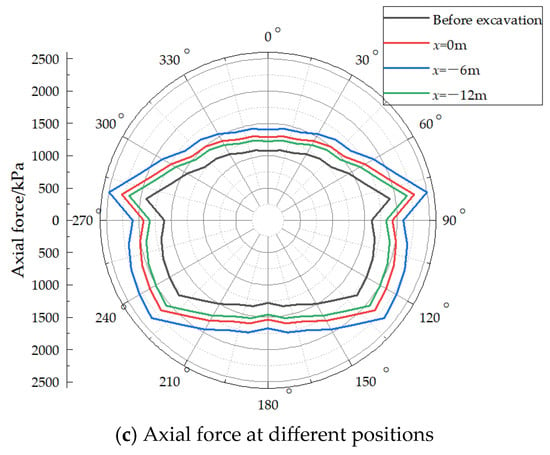
Figure 13b presents the shear force distribution at different positions ahead of the excavation face. It can be seen that: (1) The shear force decreases with increasing distance from the excavation face. (2) The circumferential shear force is distributed approximately symmetrically between 130° and 310°. (3) At different positions, the maximum positive shear force occurs at 130°, while the maximum negative shear force occurs at 40° and 220°, with the magnitude of the positive shear force being larger than that of the negative shear force. At the excavation face, the maximum positive shear force is 357.24 kN, and the maximum negative shear force is −240.24 kN.
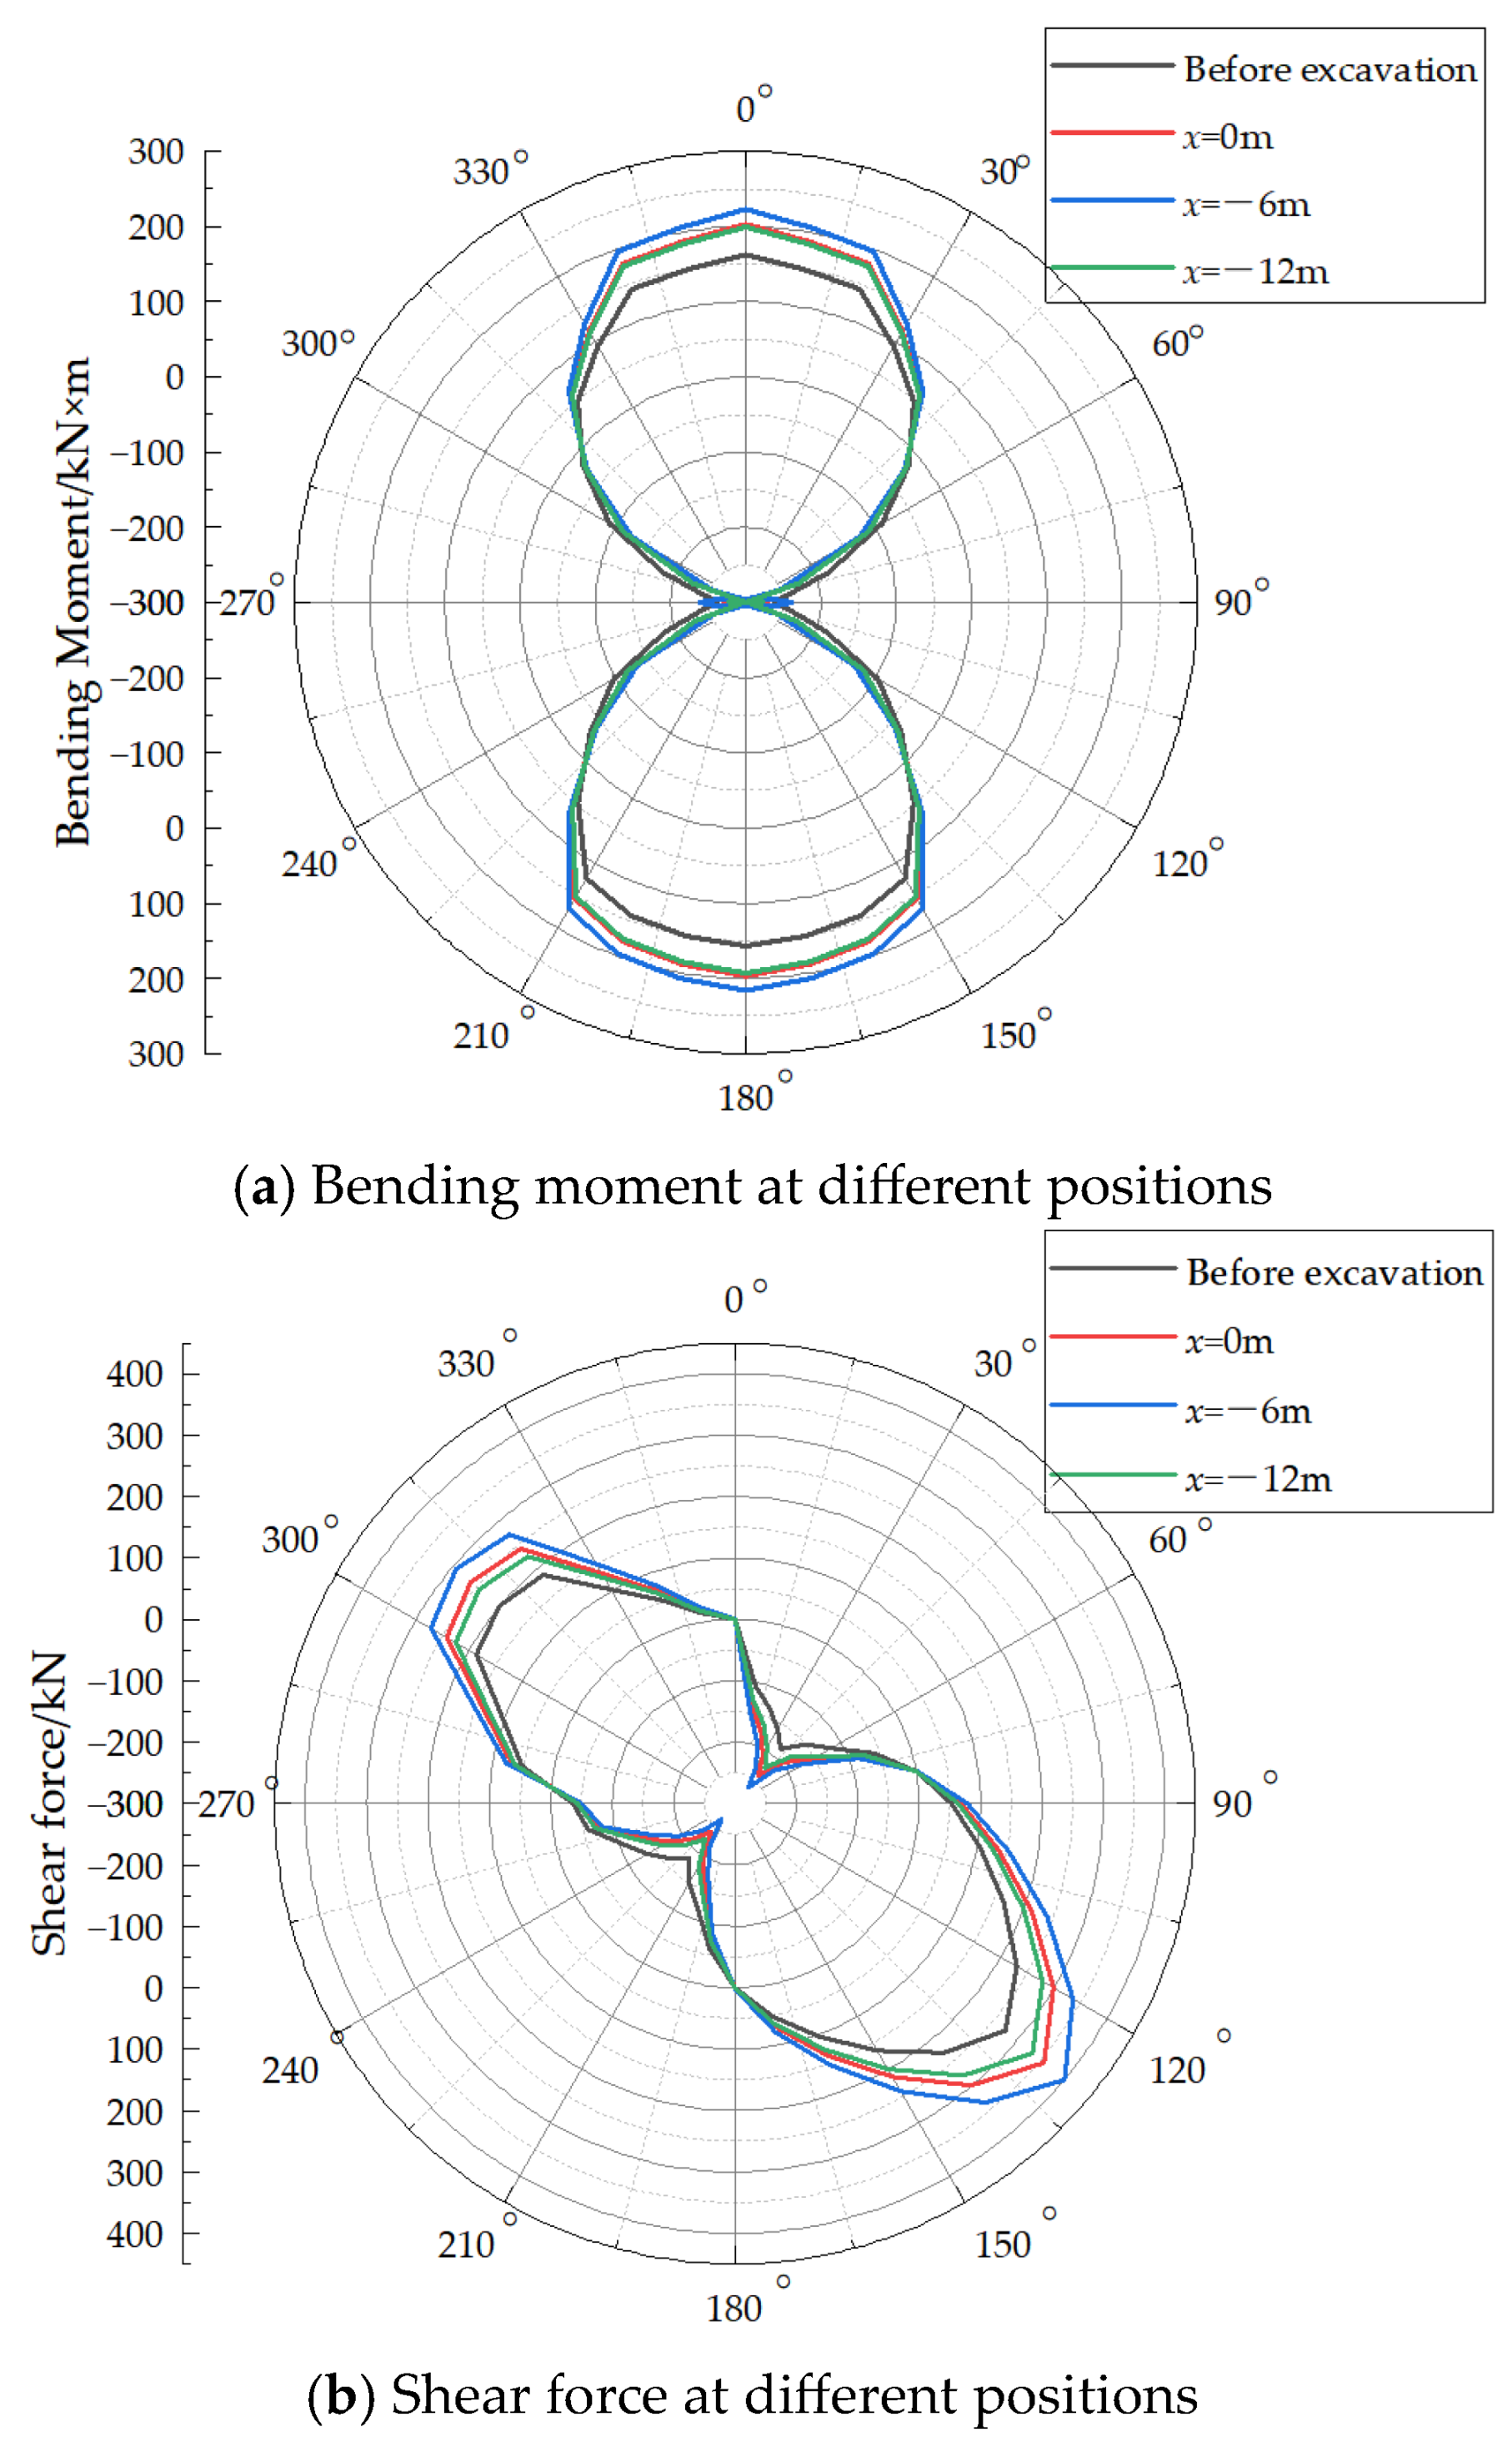
Figure 13c shows the axial force distribution at different positions ahead of the excavation face. It can be observed that all axial forces are positive. The maximum axial force occurs at the 80° and 280° positions, with equal magnitudes, which is consistent with the findings reported by Xiang et al. [18]. The axial force gradually decreases with increasing distance from the excavation face. At the excavation face, the maximum axial force is 2298.24 kN. Regarding the internal forces behind the excavation face, it was found that within the range of 0 to −12 m, the additional circumferential confining pressure first increases and then decreases, and the subsequent variation pattern is similar to that observed ahead of the face. Therefore, only two positions, x = −6 m and x = −12 m, were selected for the analysis of internal forces behind the excavation face.
Figure 14a shows the bending moment distribution at different positions behind the excavation face. It can be seen that within the range of 0 to −12 m, the bending moment first increases and then decreases. At x = −12 m, the circumferential bending moment is numerically similar to that at the excavation face (x = 0 m). At x = −6 m, the maximum positive circumferential bending moment is 223.08 kN·m, and the maximum negative bending moment is −363.25 kN·m. Compared with the values at the excavation face, the rates of change are 10% for the maximum positive bending moment and 10.61% for the maximum negative bending moment.
Figure 14.
Internal Forces in the Segment Behind the Excavation Face.
Figure 14b presents the shear force distribution at different positions behind the excavation face. Within the range of 0 to −12 m, the circumferential shear force in the existing tunnel first increases and then decreases, reaching a maximum at x = −6 m, where the maximum positive shear force is 400.24 kN and the maximum negative shear force is −265.96 kN. Compared with the values at the excavation face, the rates of change are 12.04% for the maximum positive shear force and 10.71% for the maximum negative shear force.
Figure 14c shows the axial force distribution at different positions behind the excavation face. Within the range of 0 to −12 m, the axial force in the existing tunnel first increases and then decreases, reaching a maximum of 2497.76 kN at x = −6 m. Compared with the value at the excavation face, the rate of change is 8.68%.
From an engineering perspective, the internal forces within 6 m behind the tunnel face increase significantly, which means the most critical period for structural safety occurs just after the shield tail passes a certain section. During this stage, the annular gap is either not filled or only partially filled, and ground loss reaches its maximum. Therefore, on-site monitoring should be intensified in this area, and grouting parameters (pressure and volume) must be strictly controlled to minimize the long-term unloading impact on the existing tunnel.
From the perspective of the longitudinal distribution pattern of the additional internal force, the peak appears approximately 6 m behind the tunnel face, and the determination of this position has a clear mechanical mechanism. The impact of new tunnel excavation on existing underlying tunnels is essentially an unloading effect, the intensity of which is closely related to the annular gap caused by the shield tail emergence. Under the condition that the length of the shield machine is 8.7 m, the shield tail emergence position is at x = −8.7 m. At this time, ground loss begins to occur, but the spatial transmission and accumulation of the unloading effect require a certain distance because the soil is not a perfectly elastic body; its deformation response exhibits lag and diffusion. In cohesive soil layers, this lag effect is particularly significant. When the longitudinal distance develops forward from the shield tail emergence position (x = −8.7 m) to x = −6 m (positive x-direction), the cumulative effect of ground loss reaches the maximum, and the unloading effect on the existing tunnel also reaches its peak. As the distance increases further (x > −6 m, i.e., closer to the tunnel face), the shield shell has not yet fully emerged, and ground loss has not fully developed, so the unloading effect is relatively smaller. This spatial distribution characteristic explains why the peak of the additional internal force occurs at this specific location.
5. Single-Factor Analysis
5.1. Influence of Angle β
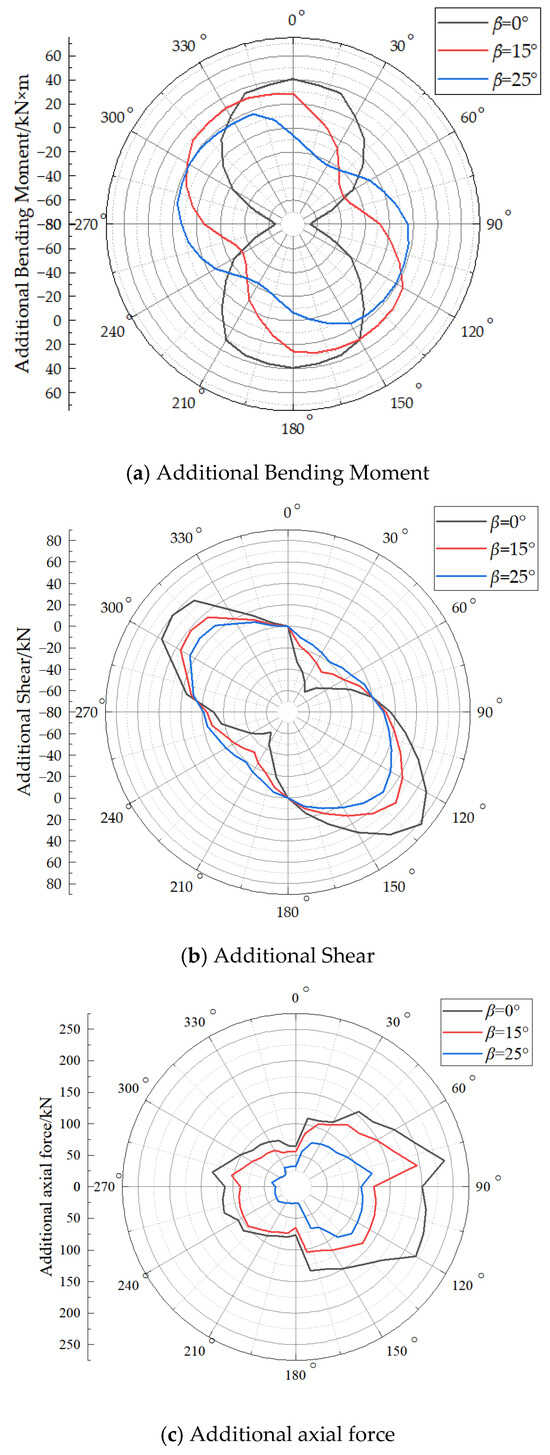
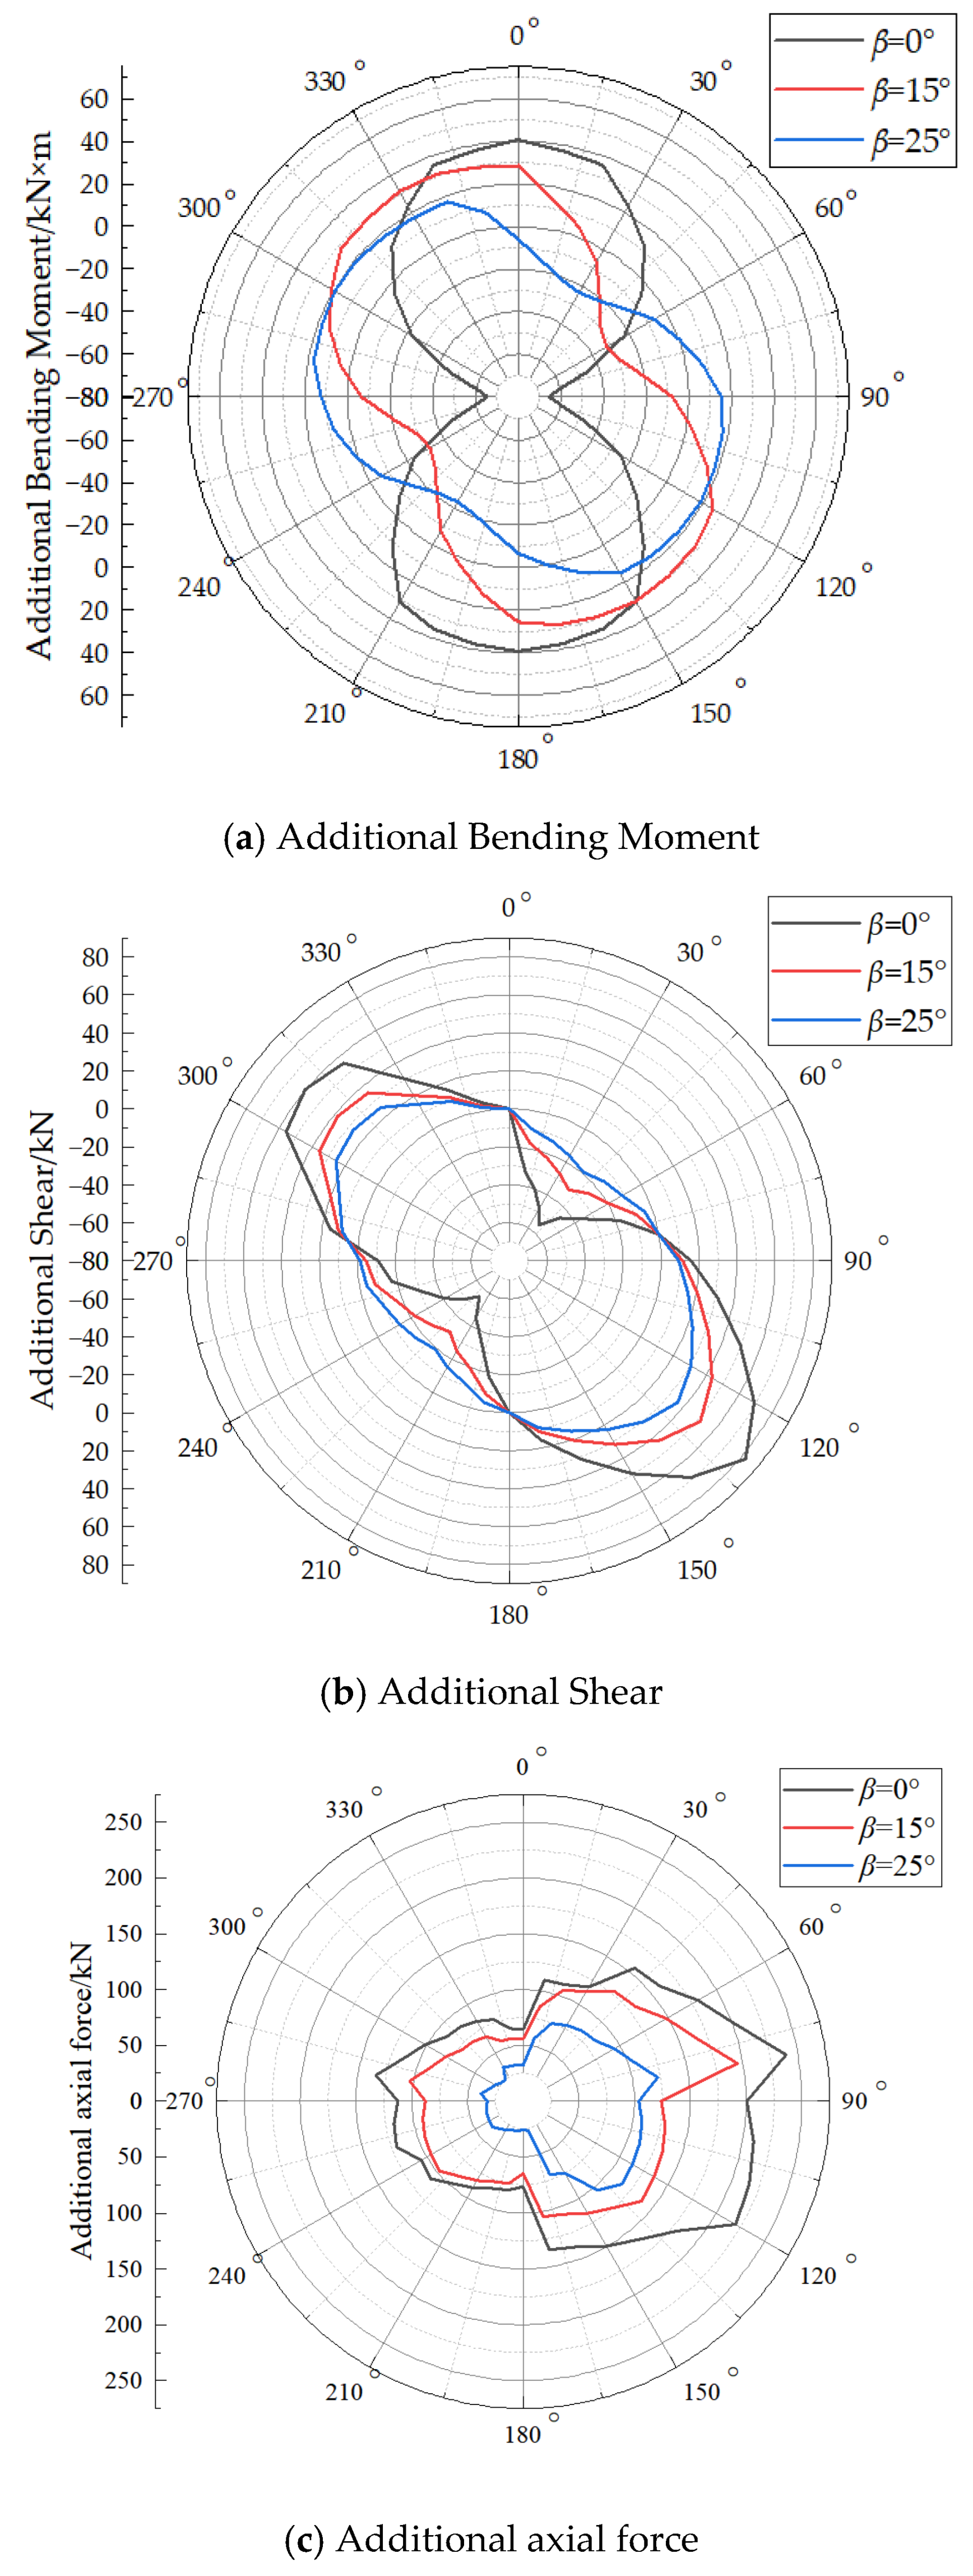
The internal forces discussed in the preceding sections were obtained under the condition that the axes of the new tunnel and the existing tunnel are completely aligned vertically. To investigate the variation in the internal forces with different intersection angles, three values of β (0°, 15°, and 25°) were examined. The range of β angles (0°, 15°, and 25°) is selected based on the actual alignment of the Tianjin Metro Line 5 case, where the axes of the overlapping tunnels are nearly vertically aligned with a maximum deviation of approximately 0–15°. The upper bound is extended to 25° to explore the effect of a larger offset. The applicability of the conclusions to cases with β > 25° requires further investigation.
Figure 15a presents the additional bending moment at the excavation face (x = 0 m) for different β values. The following observations can be made. (1) The additional circumferential bending moment in the existing tunnel decreases as β increases. (2) As β increases, the distribution of the additional circumferential bending moment shifts circumferentially. This finding is consistent with the experimental results reported by Xie et al. [9]. When β = 15°, the entire distribution shifts counter-clockwise by approximately 30°, and when β = 25°, the shift is approximately 50°. (3) The additional bending moment distribution is symmetric. For β = 0°, the distribution is symmetric about the 0–180° axis. The axis of symmetry shifts counter-clockwise by the same number of degrees as the overall distribution.
Figure 15.
Additional stress in existing tunnels at different β angles.
Figure 15b shows the additional shear force at the excavation face for different β values. It can be seen that: (1) The additional circumferential shear force in the existing tunnel decreases as β increases. (2) When β = 0°, the maximum positive additional shear force is 82.44 kN and the maximum negative additional shear force is −48.38 kN. When β = 15°, the maximum positive value is 51.46 kN, and the maximum negative value is −27.03 kN. When β = 25°, the maximum positive value is 35.98 kN, and the maximum negative value is −16.35 kN.
Figure 15c presents the additional axial force at the excavation face for different β values. It can be observed that: (1) The additional circumferential axial force in the existing tunnel decreases as β increases. (2) The additional axial force on the right side of the tunnel is larger than that on the left side. (3) The maximum additional axial force occurs at the circumferential position of 80°. For β = 0°, this maximum value is 239.4 kN; for β = 15°, it is 195.02 kN; and for β = 25°, it is 122.41 kN.
The fact that additional internal forces decrease as the β angle increases suggests that, when geometry allows, designing overlapping tunnels with a certain lateral offset can effectively reduce the structural demand on the existing tunnel, thereby improving its safety margin.
5.2. Influence of Clear Distance Between Tunnels
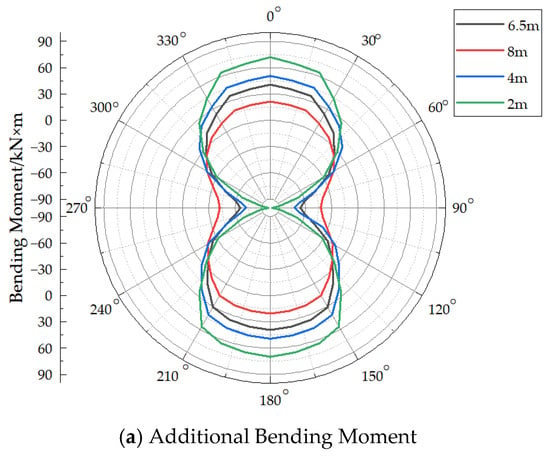
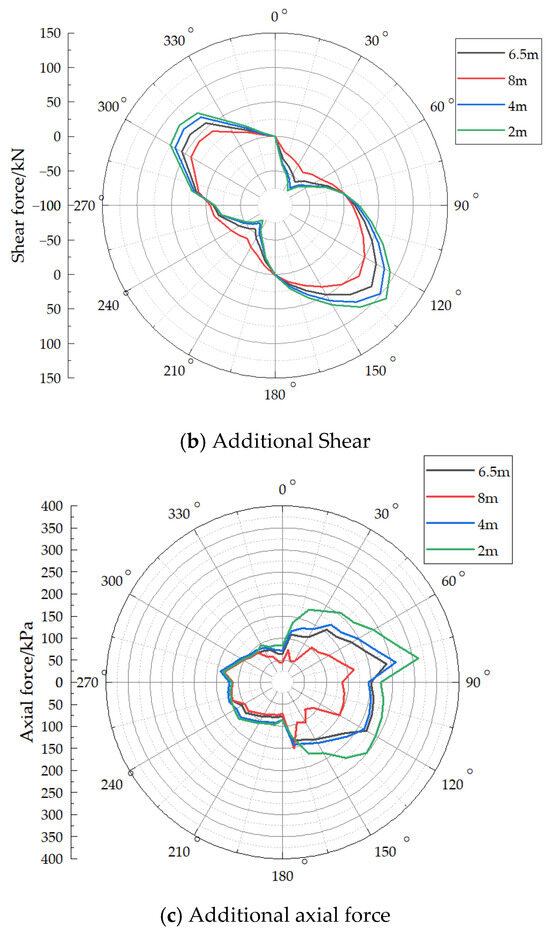
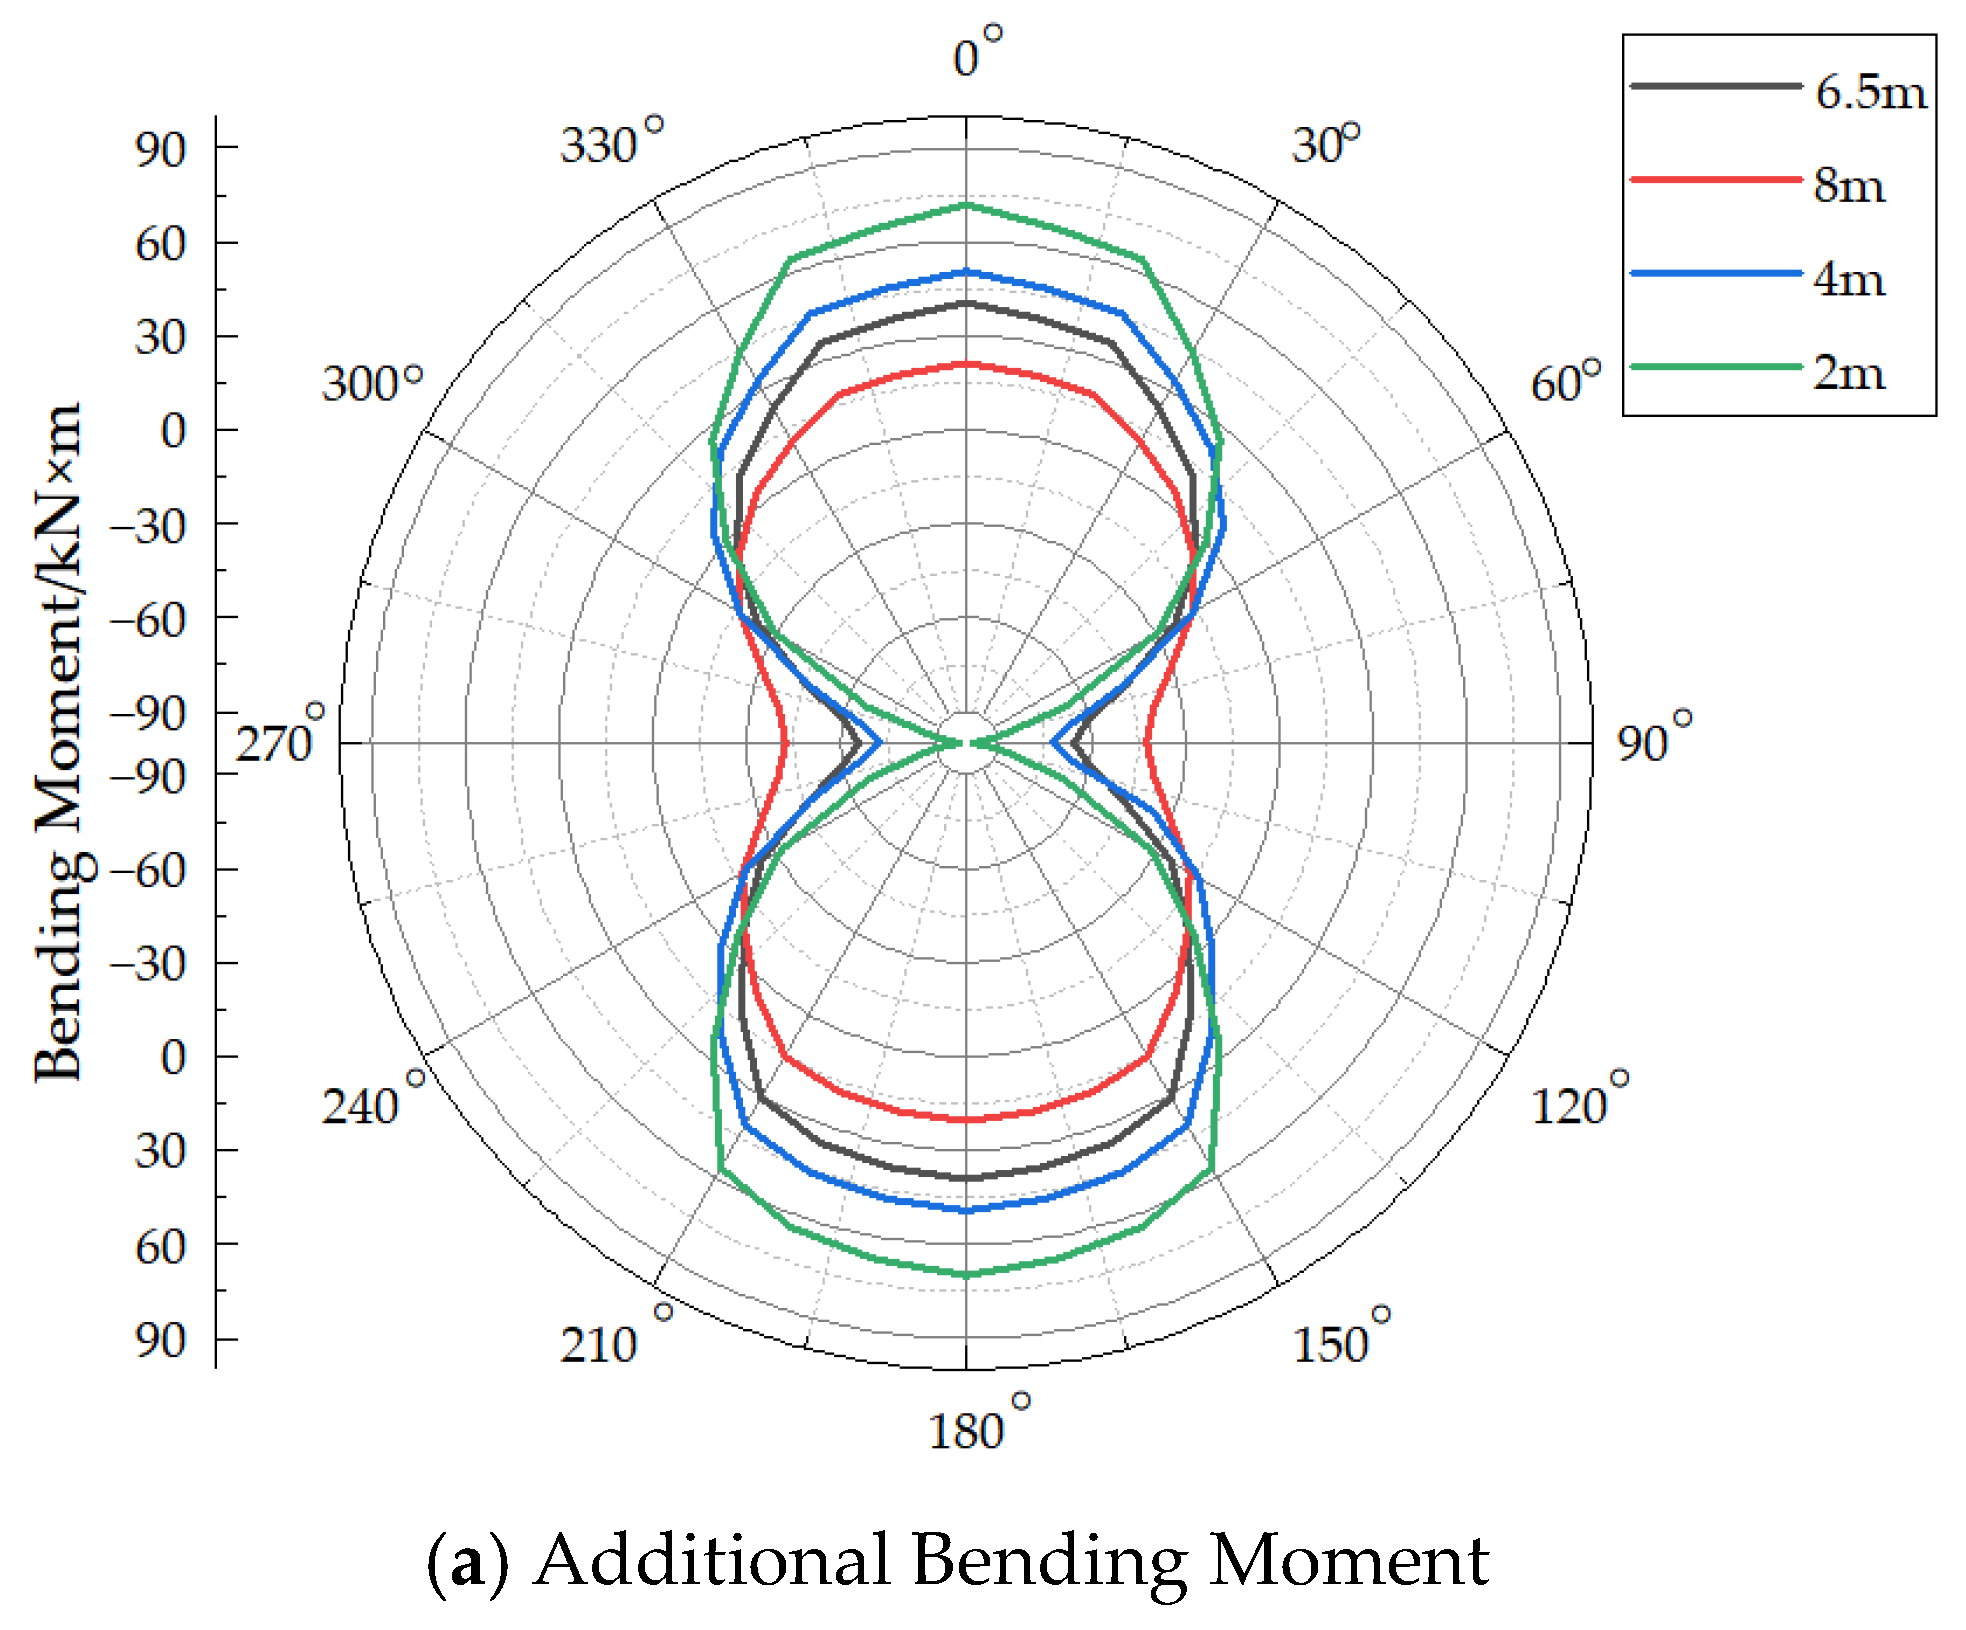
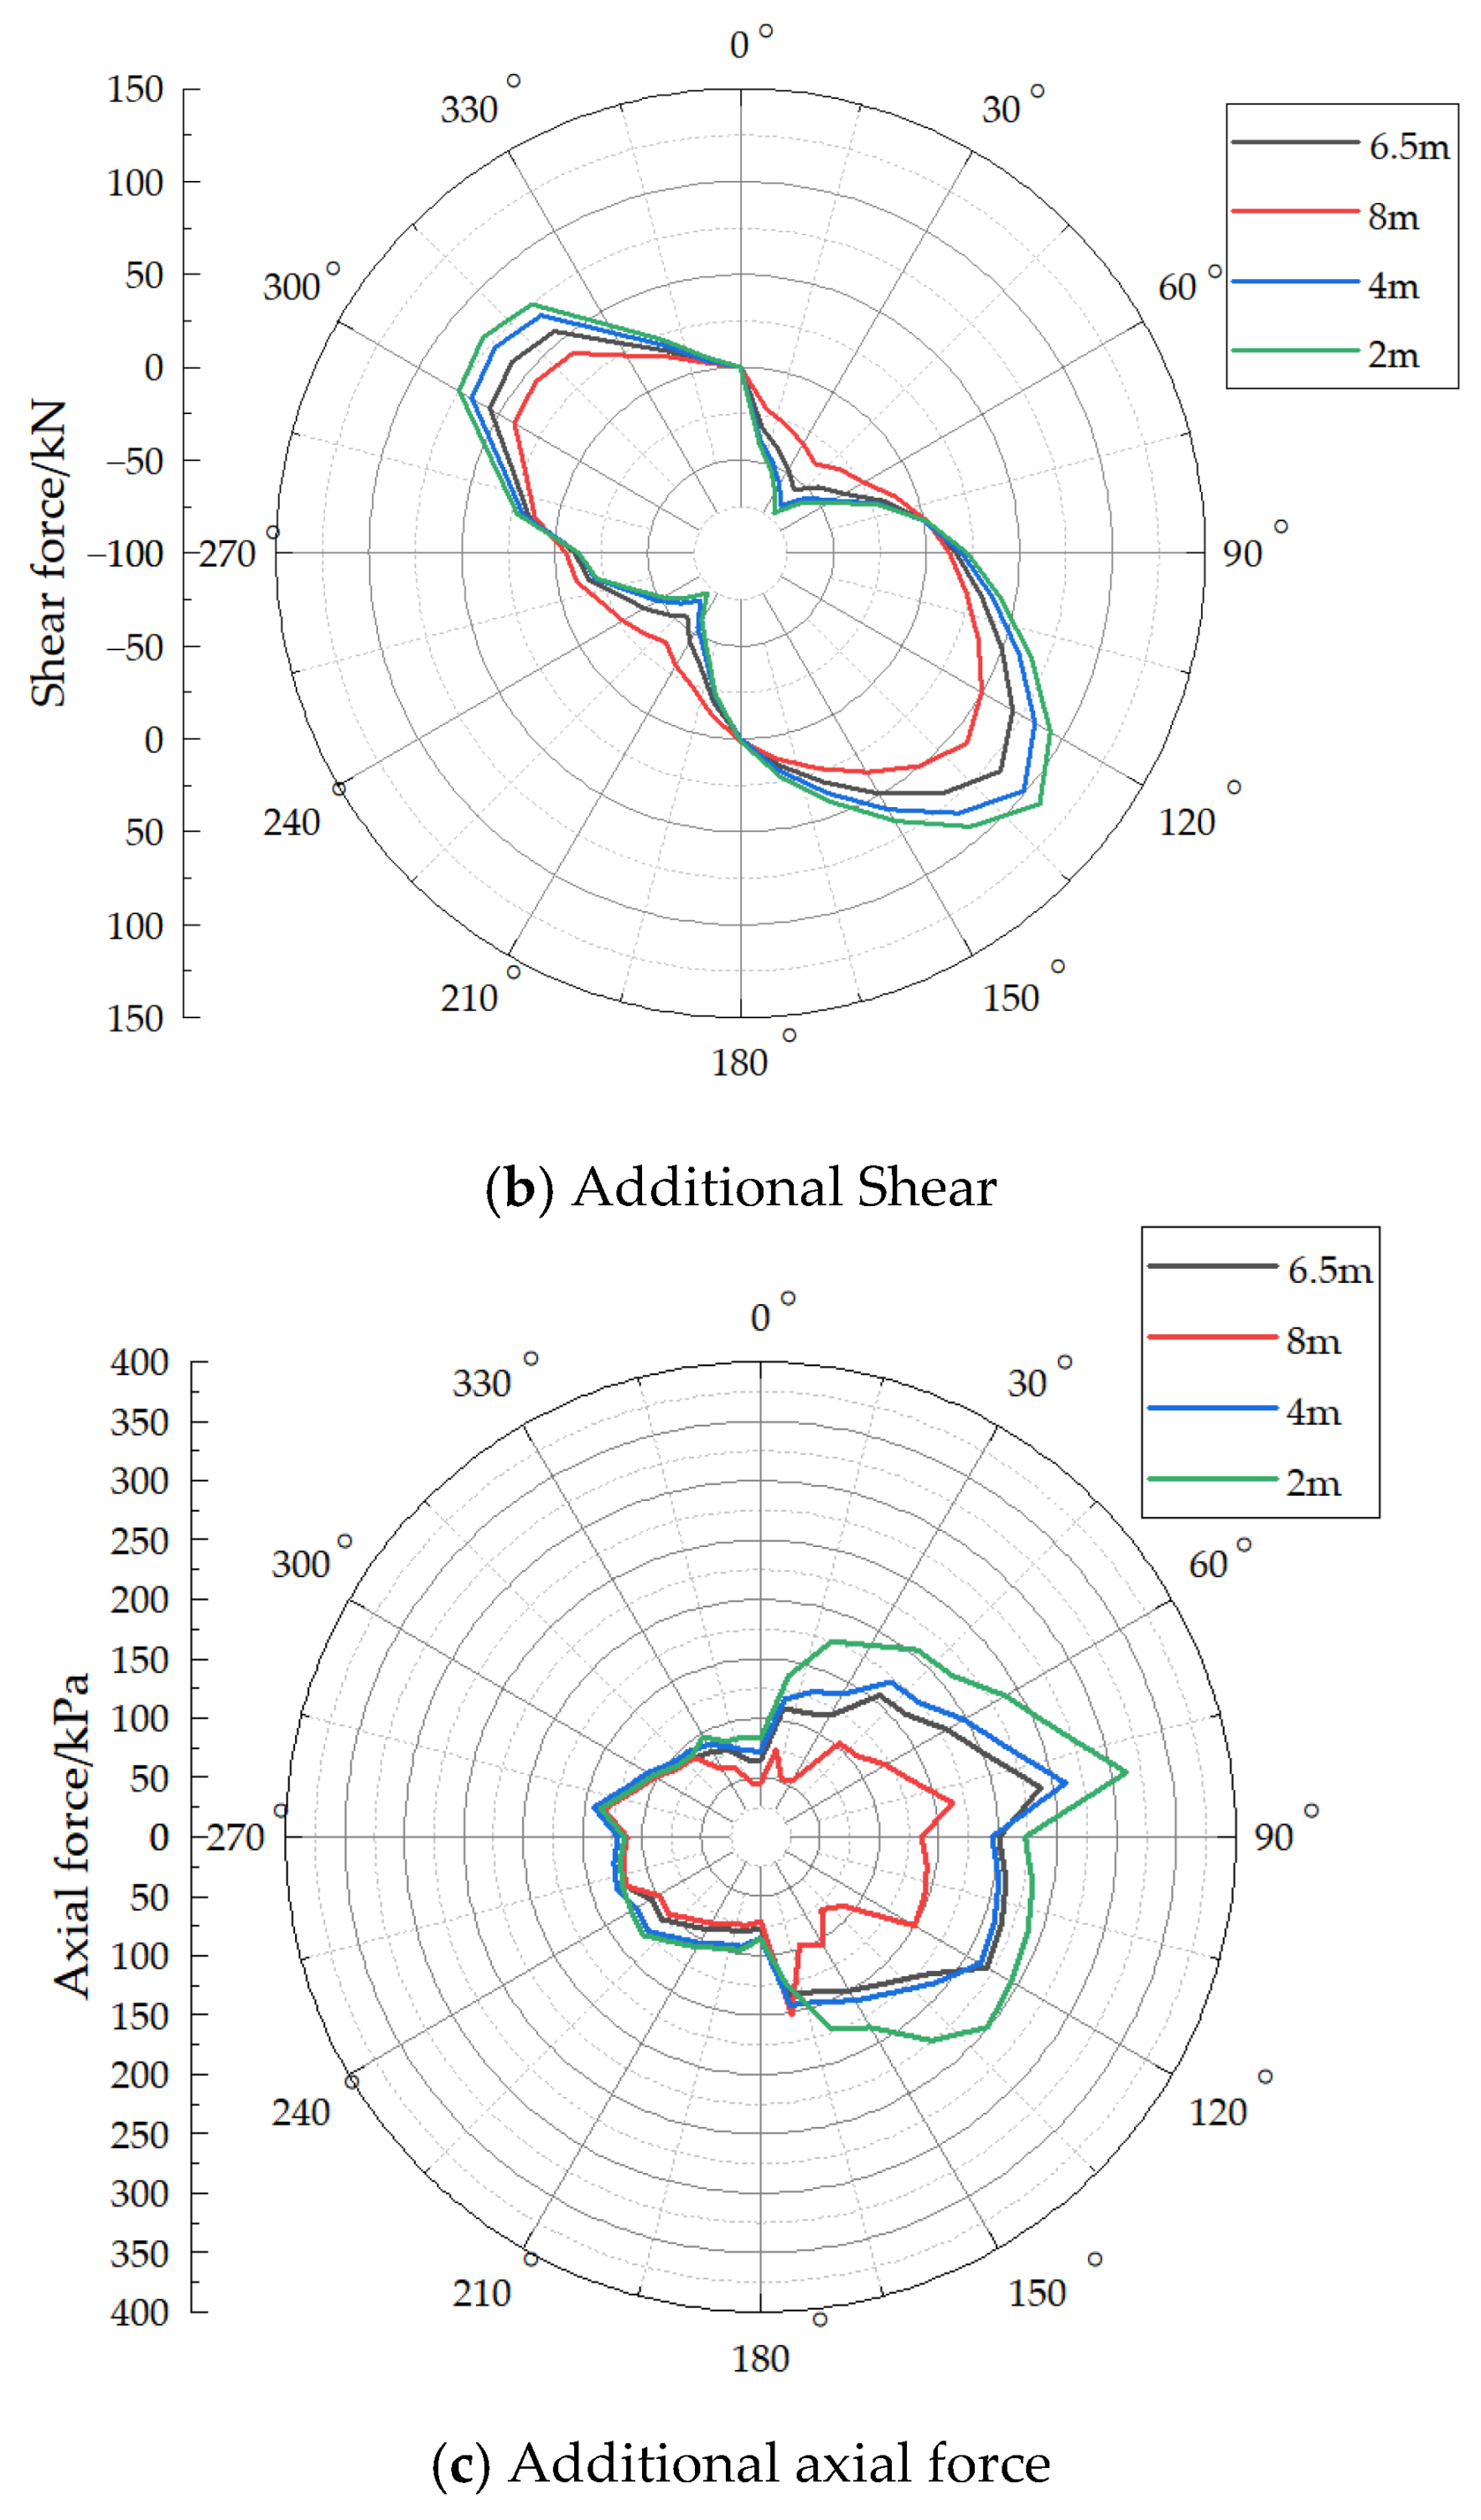
The position of the existing tunnel was kept unchanged, and four clear distances between the two tunnels were considered: 6.5 m, 8 m, 4 m, and 2 m. The variation in the circumferential internal forces in the existing tunnel was then examined.
Figure 16a shows the additional bending moment in the existing tunnel for different clear distances. It can be seen that: (1) As the clear distance between the tunnels decreases, the additional circumferential bending moment in the existing tunnel increases, and this increase is approximately linear. (2) The circumferential bending moment varies more sharply within the ranges of 60–120° and 240–330°.
Figure 16.
Additional Internal Forces of Existing Tunnels at Different Net Distances.
Figure 16b presents the additional shear force in the existing tunnel for different clear distances. It can be observed that: (1) As the clear distance decreases, the additional circumferential shear force in the existing tunnel increases, and this increase is also approximately linear. (2) The magnitude of the additional shear force in the range of 0–180° is slightly larger than that in the range of 180–360°.
Figure 16c shows the additional axial force in the existing tunnel for different clear distances. It can be seen that: (1) As the clear distance increases, the additional axial force decreases. Unlike the trends observed for additional bending moment and shear force, the change in additional axial force is not linear. (2) As the clear distance increases, the maximum additional axial force values are 312.43 kN, 260.65 kN, 239.4 kN, and 163.78 kN, respectively. Compared with the value at a clear distance of 6.5 m, the rates of change are 30.5%, 8.88%, and 31.59%.
Additional bending moment and shear force decrease roughly linearly as the clear distance increases. This pattern provides a straightforward basis for preliminary design assessment. When site conditions restrict the clear distance to a small range (e.g., 2–4 m), additional reinforcement or protective measures for the existing tunnel should be considered to accommodate the increased internal force levels.
6. Conclusions and Limitations
6.1. Conclusions
- (1)
- The method proposed in this paper, which involves calculating the circumferential confining pressure on the existing tunnel and extracting the internal forces using Abaqus 2023 software, yields results that are consistent with those reported in several previous studies. This consistency validates the correctness of the present method.
- (2)
- At a distance of approximately 24 m ahead of the excavation face, the influence of the new tunnel excavation on the existing tunnel becomes negligible, and the circumferential internal forces tend to stabilize. Behind the excavation face, the impact of the excavation on the existing tunnel is significantly greater than that ahead of the face. Within the range of 0 to 6 m behind the face, the additional internal forces increase rapidly. Therefore, in practical engineering, timely synchronous grouting should be carried out.
- (3)
- Variations in the angle β induce a shift in the circumferential distribution of the additional bending moment, whereas the additional shear force and additional axial force are not affected. As β increases, all additional internal forces show a decreasing trend.
- (4)
- As the clear distance between the two tunnels increases, the additional circumferential internal forces in the existing tunnel decrease. Under this condition, the additional bending moment and additional shear force exhibit an approximately linear trend of variation.
6.2. Limitations
- (1)
- Although the spring-soil load-structure method is computationally efficient, it does not explicitly consider the full soil–structure interaction, especially the coupling effect between soil deformation and lining response.
- (2)
- The soil parameters and geometric configuration are derived from a specific engineering case (Tianjin Metro Line 5), so the quantitative results may not be directly applicable to other soil conditions or tunnel geometries.
- (3)
- The concrete CDP model does not include reinforcement, which limits the results to use in elastic-range analysis and trend studies, and it is not suitable for absolute bearing capacity predictions.
- (4)
- The crossing angle β was only examined up to 25°, and larger lateral offsets commonly encountered in actual projects require further parametric study.
- (5)
- The transient loading history during shield tunneling was not simulated; the analysis is based on the final redistributed state.
Despite these limitations, the analytical framework proposed in this paper provides a reliable and efficient tool for understanding the basic trends in internal force changes in overlapping tunnels, and the observed parameter sensitivity rules can offer valuable references for preliminary design and risk assessment.
Author Contributions
Conceptualization, G.W.; methodology, G.W. and H.C.; software, H.C. and Y.L.; validation, H.C., G.W. and Y.Q.; data curation, H.C. and Y.L.; writing—original draft preparation, H.C.; writing—review and editing, G.W., H.C. and Y.Q. All authors have read and agreed to the published version of the manuscript.
Funding
This research was funded by the National Natural Science Foundation of China (Grant No 52578490) and the Zhejiang Provincial Natural Science Foundation of China (Grant No. LMS26E080035).
Data Availability Statement
The original contributions presented in this study are included in the article. Further inquiries can be directed to the corresponding author.
Acknowledgments
We are grateful to other members of our research team for their technical support.
Conflicts of Interest
The authors declare no conflicts of interest.
References
- Huang, K.; Sun, Y.; Cui, H.; Chen, X.; Zhang, D.; Huang, B.; Huang, Z.; Gan, B. Analysis of bearing capacity characteristics and resilience enhancement mechanism in shield tunnel segments based on fracture energy and modulus degradation. Tunn. Undergr. Space Technol. 2026, 167, 106952. [Google Scholar] [CrossRef] [Scilit]
- Qi, W.Q. Study on the Disturbance Effects of Small-Radius Curve Excavation in Calcareous Sand Layer Overlapping Shield Tunnels; China University of Mining and Technology (Beijing): Beijing, China, 2022. (In Chinese) [Google Scholar]
- Yang, J.L.; Liu, K.; Chen, Q.S. Performance of overlapped shield tunneling through an integrated physical model tests, numerical simulations and real-time field monitoring. Undergr. Space 2017, 2, 45–59. [Google Scholar] [CrossRef] [Scilit]
- Liu, S.; Wang, Y.; Zhou, H.; Sun, C.; Lin, D. Test on Approaching the Construction of Multi-LineOverlapping Shield Tunnels for Up-and Down-Crossing. Process 2022, 10, 500. [Google Scholar] [CrossRef] [Scilit]
- Do, N.A.; Dias, D.; Oreste, P. Three-dimensional numerical simulation of mechanized twin stacked tunnels in soft ground. J. Zhejiang Univ.-Sci. A 2014, 15, 896–913. [Google Scholar] [CrossRef] [Scilit]
- Zheng, G.; Fan, Q.; Zhang, T.; Zhang, Q. Numerical study of the Soil-Tunnel and Tunnel-Tunnel interactions of EPBM overlapping tunnels constructed in soft ground. Tunn. Undergr. Space Technol. 2022, 124, 104490. [Google Scholar] [CrossRef] [Scilit]
- Li, S.T. Numerical Simulation and Analysis of Surface Settlement and Tunnel Deformation during Overlapping Tunnel Shield Construction. Archit. Struct. 2022, 52, 2935–2940. (In Chinese) [Google Scholar]
- Yang, Z.Y.; Ding, Y.W.; Jiang, Y.S.; Fang, K.D.; Dong, L.W.; Qi, W.; Wei, Z. Study of the Construction Sequence of Overlapping Tunnels by the Shield Tunneling Method: A Case Study of the Longest Overlapping Tunnel in China. Adv. Civ. Eng. 2020, 2020, 4909750. [Google Scholar] [CrossRef] [Scilit]
- Xie, X.; Niu, J.; Yang, G.; Liu, C. Experimental Study on the Influence of Shield Tunneling in Overlapping Tunnels on Pre-existing Tunnels. Chin. J. Rock. Mech. Eng. 2013, 32, 2061–2069. [Google Scholar]
- Liu, F.; Sun, L.Y. Research on the Optimization of Reinforcement Measures and the Deformation Mechanism of the Lower Tunnel in the Construction of the Overlapping Tunnels. Appl. Sci. 2025, 15, 11016. [Google Scholar] [CrossRef] [Scilit]
- He, C.; Su, Z.X.; Zeng, D.Y. The Impact of Overlapping Shield Tunnel Construction on the Existing Upper Tunnel. J. Civ. Eng. 2008, 41, 91–98. (In Chinese) [Google Scholar] [CrossRef]
- Shi, S. Numerical Analysis of Internal Forces of Segmental Lining in Overlapping Shield Tunnels. Railw. Stand. Des. 2009, 10, 19–22. (In Chinese) [Google Scholar] [CrossRef]
- Fei, J.; Su, R.; Chen, X.; Deng, T.; Zhou, X.; Huang, J. Study on Construction Deformation Behavior of Super-Small Spacing Overlapped Tunnel Under Interactive Influence. Indian Geotech. J. 2025. [Google Scholar] [CrossRef] [Scilit]
- Zhang, X.; Luo, B.; Xu, Y.; Zhao, C.; Wang, H. Case study of performance assessment with a small curve radius of overlapping shield tunnels. Deep. Undergr. Sci. Eng. 2024, 3, 481–496. [Google Scholar] [CrossRef] [Scilit]
- Wei, G.; Feng, F.F.; Qi, Y.J.; Hua, X.X. Study on the Impact of the Full-Process Shield Tunnel Crossing on the Underlying Existing Tunnel. Tunn. Constr. 2022, 42, 69–79. (In Chinese) [Google Scholar] [CrossRef]
- Wei, G.; Qi, Y.J.; Wu, H.J.; Hua, X.X.; Zhang, Y.Z. Circular confinement and stress changes of shield tunneling under existing subway tunnels. J. Cent. South Univ. 2020, 51, 3515–3527. (In Chinese) [Google Scholar] [CrossRef]
- Wei, G.; Cai, H.R.; Qi, Y.J.; Feng, G.H.; Xu, T.B. Study on the impact of surrounding pressure changes caused by shield tunneling under existing shield tunnels. Tunn. Constr. 2025, 45, 708–718. (In Chinese) [Google Scholar] [CrossRef]
- Xiang, P.F.; Qi, Y.J.; Jiang, H.B.; Wei, G.; Zhang, J.; Wang, H.J. Study on Tunnel Internal Forces Considering Shield Tunneling Excavation Effects under Surface Loading. Chin. J. Geotech. Eng. 2026, 48, 126–136. (In Chinese) [Google Scholar] [CrossRef]
- Wei, G.; Feng, F.; Huang, S.; Xu, T.; Zhu, J.; Wang, X.; Zhu, C. Full-scale loading test for shield tunnel segments: Load-bearing performance and failure patterns of lining structures. Undergr. Space 2025, 10, 197–217. [Google Scholar] [CrossRef] [Scilit]
- Feng, G.; Ding, Z.; Xu, C.; Liang, L.; Ge, S.; Fan, X.; Yang, K.; Wei, G. Analytical solution to estimate the effect of underlying tunnel excavations on the existing tunnel. Int. J. Numer. Anal. Methods Geomech. 2024, 48, 4221–4231. [Google Scholar] [CrossRef] [Scilit]
- Qi, Y.; Wei, G.; Xie, Y.; Wang, Q. Effect of grouting reinforcement on settlement of existing tunnels: Case study of a new crossing underpass. Symmetry 2021, 13, 482. [Google Scholar] [CrossRef] [Scilit]
- Qi, Y.; Wei, G.; Xie, Y. Method of calculating the vertical displacement and additional stress of existing tunnels under the influence of grouting rings of new tunnels. Symmetry 2020, 12, 1623. [Google Scholar] [CrossRef] [Scilit]
- Wei, G.; Xu, T.B.; Zhang, Z.G. Numerical analysis of corrugated steel reinforced shield tunnels under complex stress paths. Tunn. Undergr. Eng. Disaster Prev. 2023, 5, 24–32. (In Chinese) [Google Scholar] [CrossRef]
- Wei, G.; Hong, W.Q.; Wei, X.J.; Jiang, J.Q. Deformation patterns of shield tunnel cross-sections under eccentric stacking loads and their control limits. J. Cent. South Univ. 2020, 51, 750–757. (In Chinese) [Google Scholar]
- Wei, X.J.; Hong, W.Q.; Wei, G.; Yu, G.H. Calculation of rotation and step deformation of adjacent subway tunnels caused by stacked loads. Chin. J. Rock. Mech. Eng. 2018, 37, 1281–1289. (In Chinese) [Google Scholar] [CrossRef]
- Fan, Q.; Zhang, T.Q. Study on the Influence of Construction Sequence and Construction Interval on Soil Deformation in the Construction Process of Overlapping Shields Tunnels. J. Tianjin Univ. 2022, 55, 1318–1328. (In Chinese) [Google Scholar]
- Su, D.; Chen, W.; Wang, X.; Huang, M.; Pang, X.; Chen, X. Numerical study on transverse deformation characteristics of shield tunnel subject to local soil loosening. Undergr. Space 2022, 7, 106–121. [Google Scholar] [CrossRef] [Scilit]

Disclaimer/Publisher’s Note: The statements, opinions and data contained in all publications are solely those of the individual author(s) and contributor(s) and not of MDPI and/or the editor(s). MDPI and/or the editor(s) disclaim responsibility for any injury to people or property resulting from any ideas, methods, instructions or products referred to in the content. |
© 2026 by the authors. Licensee MDPI, Basel, Switzerland. This article is an open access article distributed under the terms and conditions of the Creative Commons Attribution (CC BY) license.