


Abstract
Load-bearing prefabricated concrete sandwich wall panels (LBPCSW) offer potential for rapid construction and energy efficiency, yet their seismic performance requires systematic evaluation. In this study, quasi-static tests and finite element analysis were conducted on LBPCSW specimens with varying height-to-width ratios and embedded column configurations. The results indicate that the LBPCSW specimens exhibit satisfactory structural integrity, with all specimens achieving ductility coefficients greater than 3.0. Specifically, specimen W1 with a height-to-width ratio of 1:1 failed in shear, whereas specimens with a height-to-width ratio of 2:1 exhibited flexural failure. Compared with W1, specimen W2 with embedded columns at the wall ends demonstrated significantly enhanced load-bearing capacity and ductility. Parametric analysis revealed that concrete layer thickness is the dominant factor influencing load-bearing capacity: taking W1 as an example, as the single-side concrete layer thickness increased from 30 mm to 50 mm, the ultimate load-bearing capacity increased from 182 kN to 246 kN, representing a 35% improvement. In contrast, the effect of concrete strength was relatively minor: increasing the strength grade from C25 to C35 raised the ultimate load-bearing capacity from only 223 kN to 255 kN, an increase of merely 14%. It is concluded that the proposed LBPCSW combine favorable seismic performance with energy efficiency, representing a promising solution for shear wall systems in low-rise rural housing in earthquake-prone regions.
1. Introduction
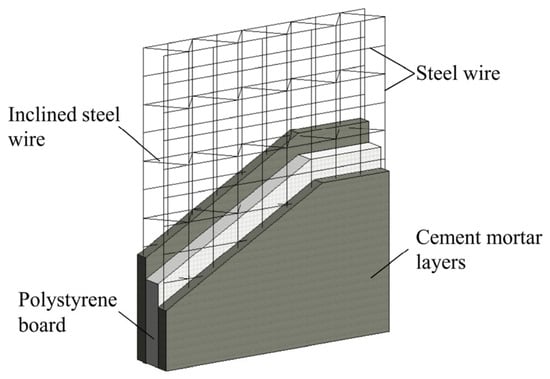
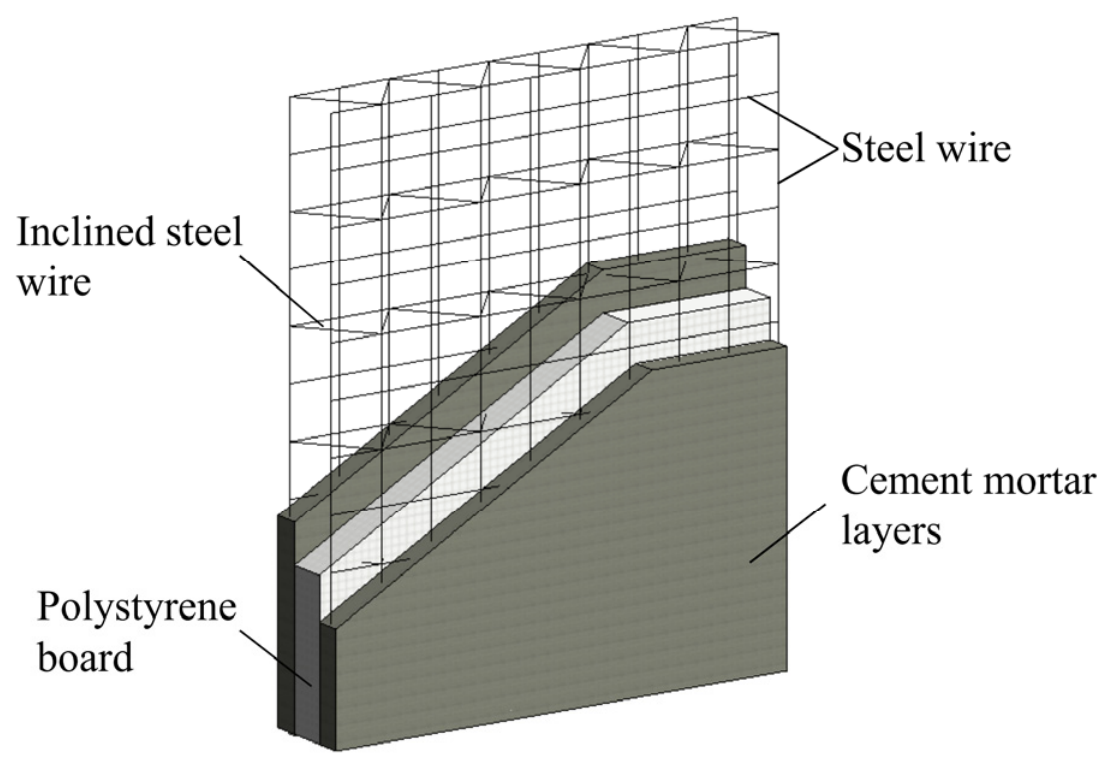
Prefabricated sandwich wallboards widely used in China consist of an expanded polystyrene (EPS) core sandwiched between two cement mortar layers reinforced with steel wire meshes (Figure 1). Figure 1 illustrates the traditional configuration: a 40 mm thick EPS board is placed between two cement mortar layers, each reinforced by a single layer of steel wire mesh without direct connection between the two meshes. These panels offer good thermal insulation and ease of installation, but due to the low strength of the cement mortar and the flexible wire-mesh connections, they are generally used only as non-load-bearing partition walls rather than structural components [1]. Their load-carrying capacity and seismic performance are insufficient for residential buildings in seismic regions.
Figure 1.
Traditional prefabricated concrete sandwich wallboard.
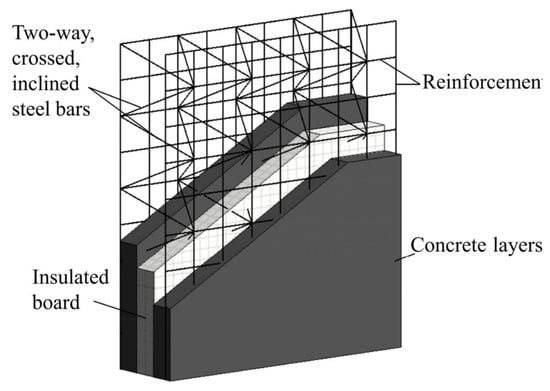
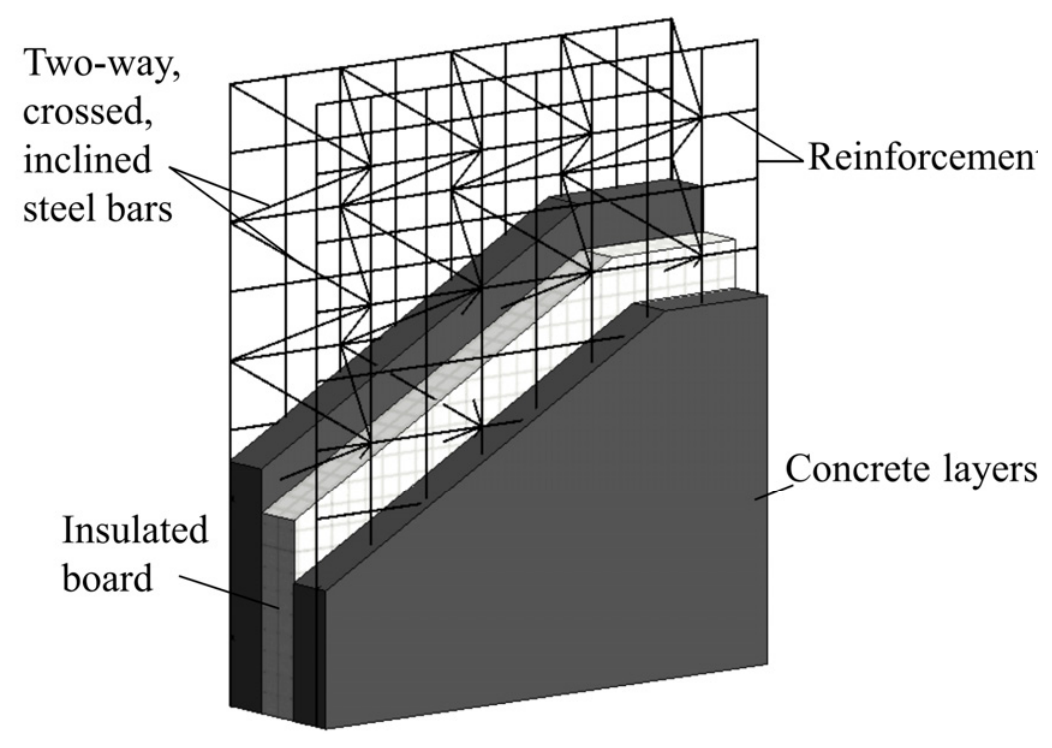
To overcome these limitations, this study proposes a redesigned load-bearing variant, termed the load-bearing prefabricated concrete sandwich wallboard (LBPCSW). Three major modifications are introduced: (i) replacing steel wire meshes with welded steel reinforcement meshes; (ii) upgrading cement mortar to structural concrete (e.g., C30); and (iii) connecting the two reinforcement meshes using crossed inclined steel bars (Figure 2). Figure 2 shows the proposed configuration: two concrete wythes, each reinforced by a bidirectional welded steel mesh, are connected by diagonal insert bars arranged in a bidirectional three-dimensional crossing pattern, which improves the structural integrity and load-transfer capacity. These enhancements significantly improve structural integrity and load-transfer capacity, enabling LBPCSW to serve as a novel prefabricated structural element.
Figure 2.
Proposed load-bearing prefabricated concrete sandwich wallboard (LBPCSW).
Previous studies have investigated the mechanical properties of prefabricated sandwich panels under various loading conditions. Benayoune et al. [2,3,4] demonstrated that precast reinforced composite sandwich panels (PCSPs) can function as load-bearing elements, with failure modes similar to solid slabs when full composite action is achieved. More recently, several researchers have evaluated the seismic performance of precast concrete sandwich walls under cyclic and dynamic loading. Lameiras et al. [5] found that panels with steel fiber reinforced concrete layers and FRP connectors exhibited seismic behavior comparable to solid shear walls. Zhang et al. [6] showed that squat precast concrete sandwich shear walls (PCSSWs) with double-row reinforcement achieved equivalent performance to cast-in-place walls. He et al. [7] conducted shaking table tests on a full-scale precast sandwich wall panel structure with dry bolt connections, confirming high lateral stiffness and safety margins. Sun et al. [8] studied precast high-titanium heavy slag concrete sandwich panel walls (PHCSPWs) and reported superior energy dissipation capacity. Cheng et al. [9] emphasized that wall thickness and height-to-width ratio are key parameters affecting seismic performance. Wang et al. [10] conducted shaking table tests on a full-scale lightweight bolt-connected concrete sandwich wall panel structure, confirming that the system exhibits good seismic performance and remains essentially elastic even under rare earthquake excitation.
Numerical simulations have also been extensively employed. Li and Sheng [11] conducted an experimental and numerical study on the seismic performance of a lightweight cold-formed steel frame system with tension bars between columns, providing a valuable reference for similar prefabricated structural systems. Li et al. [12] presented an experimental and numerical study on prefabricated ceramsite foam concrete sandwich shear walls. Ding et al. [13] proposed an unreinforced precast wall-slab structure based on ultra-high performance concrete (UHPC) sandwich panels, showing excellent seismic performance. Wang et al. [14] demonstrated the reliability of ABAQUS for parametric studies of LBPCSW. Xiong et al. [15] performed shake-table tests on a full-scale two-story bolt-assembled precast concrete sandwich wall building, which remained elastic with no damage after 9-degree rare earthquake excitation. Ge et al. [16] investigated the seismic performance of precast concrete sandwich walls with bolt-steel plate connections, and demonstrated that the use of UHPC to strengthen the connection joints effectively improved the load-bearing capacity and drift ratio of the wall panels. Xu and Li [17] conducted experimental and numerical studies on the lateral performance of concrete sandwich walls, providing insights into the load-bearing behavior of such systems under lateral loading. Recent studies have also applied advanced computational methods, including machine learning and fragility analysis, to assess seismic damage and structural response [18,19], which provide useful methodological references for future extensions of the present work.
Chinese researchers have also contributed to this field. Chen et al. [20] developed and applied a multifunctional integrated prefabricated low-rise building system, which was validated through demonstration projects and proved suitable for rural housing in earthquake-prone regions of China. National design codes, such as GB/T 50011-2010 (2024 edition), provide essential seismic design guidance for prefabricated structures [21].
Despite these advances, four critical research gaps remain. As highlighted in a comprehensive state-of-the-art and practice review by Čavčić et al. [22], current design codes largely rely on general recommendations rather than explicit provisions for prefabricated concrete wall panels, and the structural behavior of their connections remains insufficiently understood. First, most load-bearing sandwich wall studies focus either on traditional cement mortar-based configurations or on high-cost materials like UHPC, leaving a lack of moderate, cost-effective upgrades for conventional non-load-bearing panels. Second, the effect of height-to-width ratio, a key parameter governing failure mode (flexural vs. shear), has not been systematically quantified for LBPCSW in terms of ductility, energy dissipation, and ultimate capacity. Third, comprehensive parametric studies simultaneously examining concrete thickness, concrete strength, and height-to-width ratio on LBPCSW seismic behavior are scarce. Fourth, most existing studies were conducted outside China or with different material contexts (e.g., UHPC, FRP connectors, high-titanium slag), leaving a notable absence of experimental data on LBPCSW fabricated with locally available, economical materials.
Compared with existing studies on precast sandwich shear walls, the novelty of this study lies in the connector arrangement and the end-column configuration, specifically in the following two aspects. First, this paper adopts a three-dimensional spatial steel bar mesh construction method, in which the steel bar meshes of the two wall wythes are connected by diagonal insert bars in a bidirectional three-dimensional crossing pattern. Since the diagonal insert bars are inclined in both vertical and horizontal sections, this approach is more effective in improving the integrity and mechanical performance of the sandwich panel components than connections made in only one direction. Second, this paper considers the addition of concealed columns (embedded columns) in precast sandwich shear walls and investigates their influence on seismic performance. To the best of our knowledge, such a practice has not been reported in existing studies on precast sandwich shear walls, making this a beneficial and innovative contribution.
To address these gaps, the present study develops LBPCSW through moderate material upgrades and systematically evaluates its seismic performance using quasi-static tests and finite element analysis (ABAQUS). Three full-scale specimens with varying height-to-width ratios and embedded column configurations are tested to obtain failure characteristics, load-bearing capacity, hysteresis curves, skeleton curves, and energy dissipation capacity. The numerical model is validated against experimental results, followed by parametric analyses assessing the effects of concrete thickness, concrete strength, and height-to-width ratio on seismic performance. The findings provide an experimental basis and theoretical support for seismic design of LBPCSW, contributing to relevant Chinese design codes and promoting engineering applications in seismically vulnerable regions.
2. Materials and Methods
2.1. Test Specimens and Setup
2.1.1. Design of Test Specimens
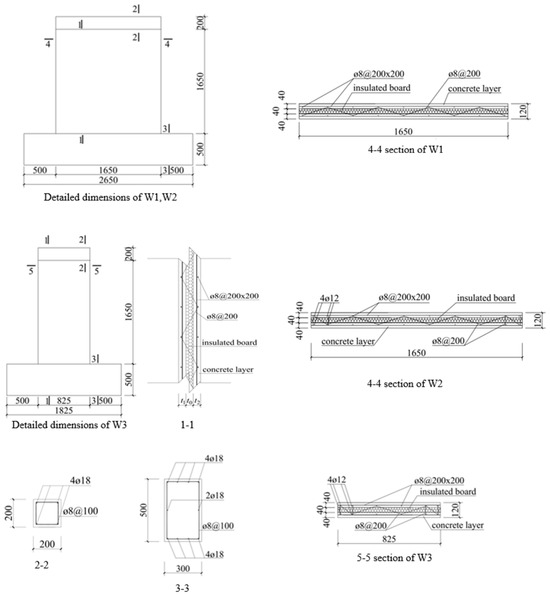
Three load-bearing sandwich wallboards (designated as W1, W2, and W3) were designed for the quasi-static test. Specimens W1 and W2 had the same dimensions, with both height and width equal to 1650 mm, while specimen W3 had a height of 1650 mm and a width of 825 mm. All specimens had a total wall thickness of 120 mm, with a 40 mm polystyrene board serving as the middle insulation layer. Each wall consisted of two 40-mm-thick reinforced concrete wythes, each containing a bidirectional reinforcement mesh composed of 8 mm diameter rebars spaced at 200 mm, resulting in a reinforcement ratio of 0.69%. The bidirectional reinforcement meshes of the inner and outer wythes were connected by inclined rebars passing through the middle insulation layer (see Figure 3). These inclined rebars also had a diameter of 8 mm, were spaced at 200 mm, and were connected to alternating junctions of the bidirectional reinforcement mesh.
Figure 3.
Section size and steel bar details of wallboards.
As illustrated in Figure 3, embedded columns were arranged at the ends of specimens W2 and W3. These columns were reinforced with four 12 mm diameter longitudinal rebars and 8 mm diameter stirrups spaced at 200 mm. Specimen W3 had a height-to-width ratio of 2 (1650 mm height/825 mm width), while its other dimensions and configurations were identical to those of W2. Figure 3 presents the detailed dimensions and reinforcement layout of the three wallboards.
For the connection between the wall and the top loading beam, the reinforcement from both concrete wythes was extended into the top beam, and the wall and the top beam were cast monolithically to form a rigid connection, through which the shear stresses at the interface were transferred.
The concrete used on both sides of the specimen wall is C30 ordinary concrete, with a measured cube compressive strength of 32 MPa and a density of 2400 kg/m3. The mix proportions of the concrete are presented in Table 1, and its measured mechanical properties are provided in Table 2. The middle insulation layer of the wall consists of expanded polystyrene (EPS) board, which has a density of 5 kg/m3 and a thermal conductivity of 0.032 W/(m·K). The longitudinal rebars of the embedded columns were HRB335 grade, while all other rebars were HPB300 grade. The measured mechanical properties of the rebars are listed in Table 3. To ensure reliable anchorage, the vertical reinforcement was extended to the bottom of the foundation beam with 90° hooks at the ends, and the anchorage length satisfies the relevant requirements specified in the Chinese Code for Design of Concrete Structures (GB/T-2010 50010) [23]. The concrete cover thickness at the ends of the specimens is shown in Table 4 and Figure 3.
Table 1.
Proportions of fine aggregate concrete mix.
Table 2.
Mechanical properties of concrete.
Table 3.
Mechanical properties of the rebars.
Table 4.
Concrete cover at the ends of each specimen (mm).
2.1.2. Loading Protocol
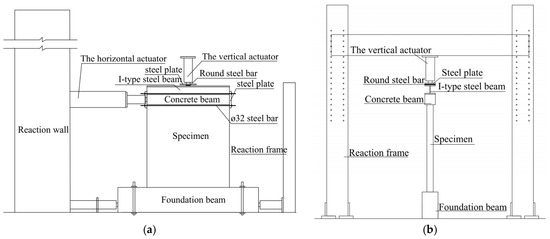
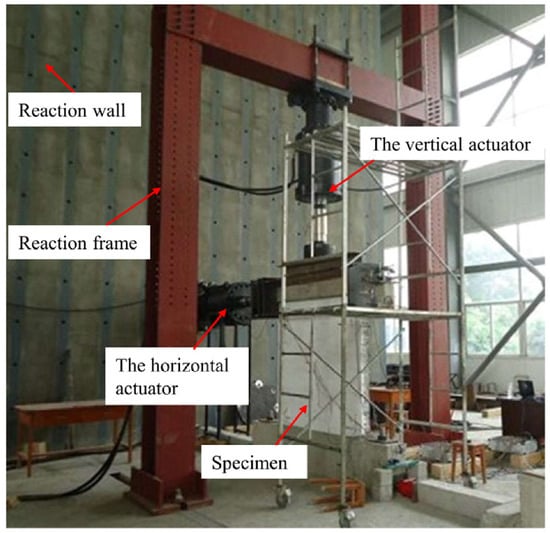
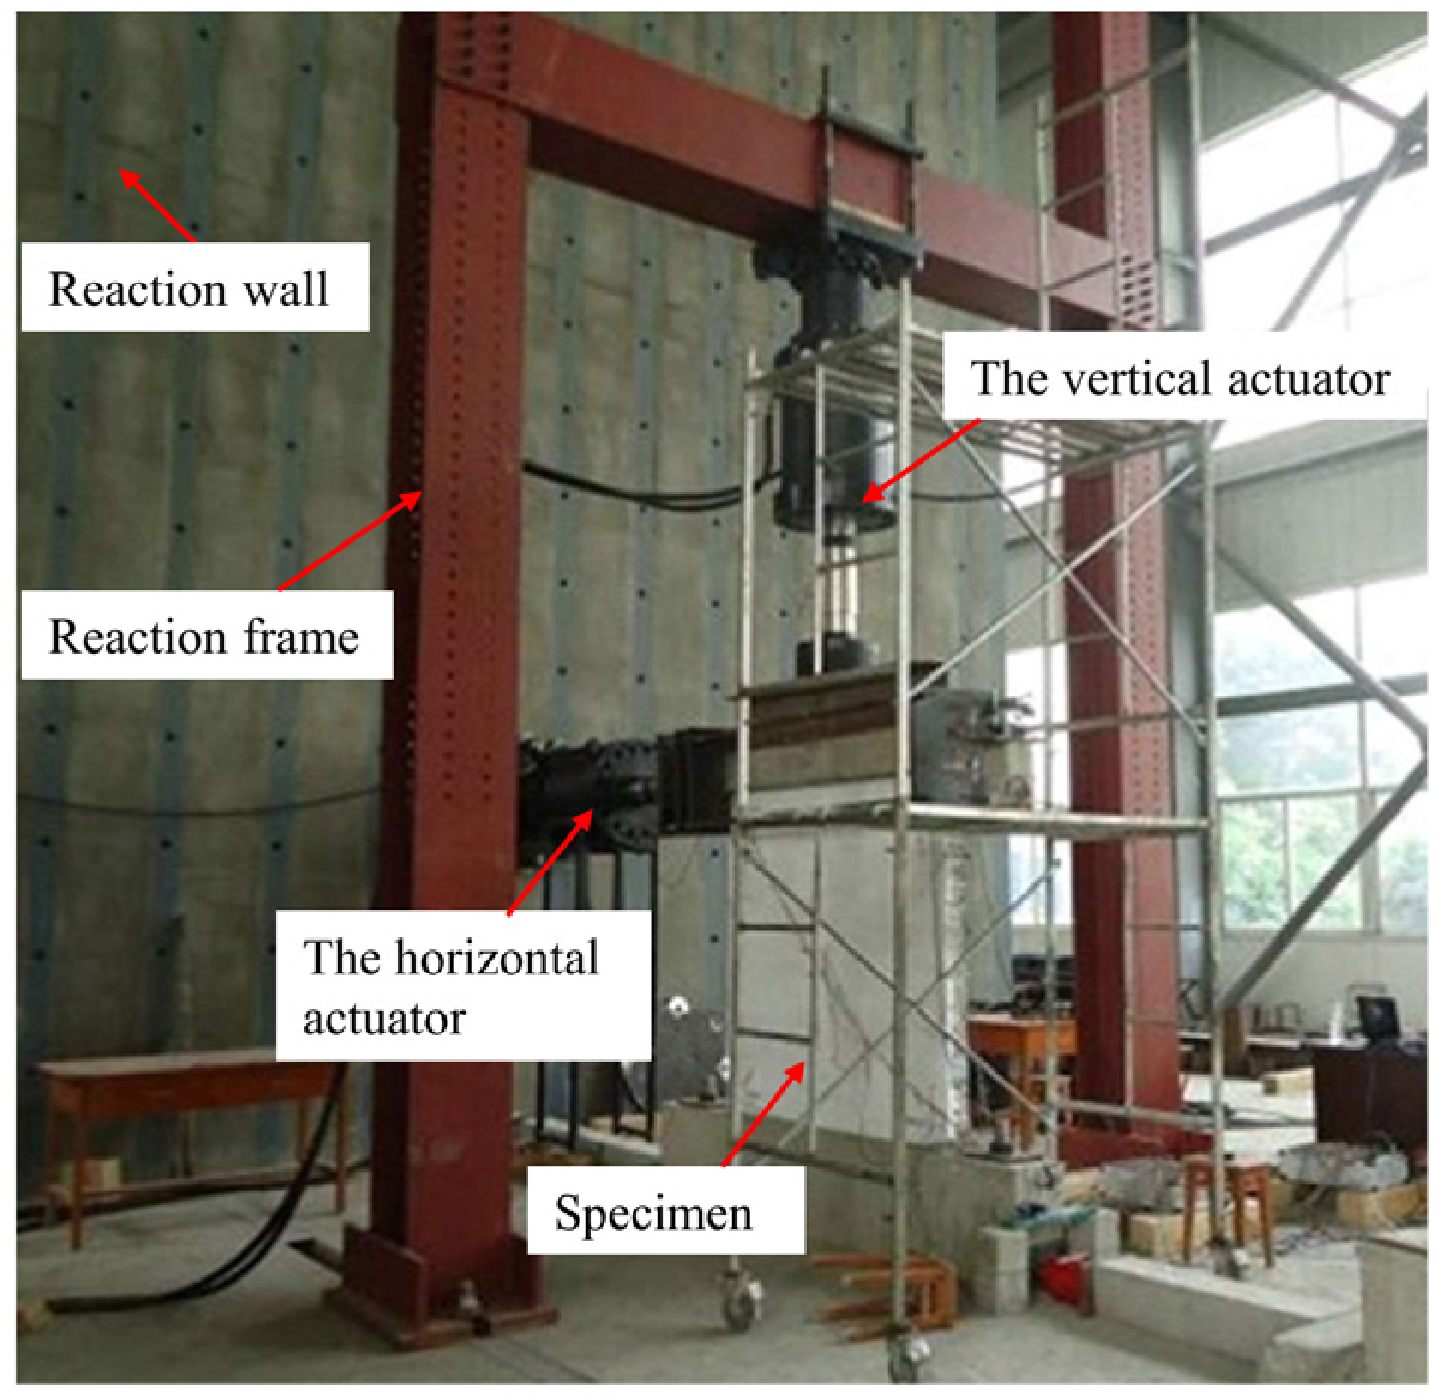
The quasi-static test was conducted in the Civil Structural Laboratory of Sichuan University. A low-cycle reversed horizontal loading method was adopted, with the loading device shown in Figure 4 and Figure 5. The horizontal load was provided by a horizontal servo-controlled hydraulic actuator (maximum capacity: 2 MN; Xi’an Lichuang Material Testing Technology Co., Ltd., Xi’an, China) mounted on a concrete reaction wall. Four 32 mm diameter high-strength rebars, together with steel plates, connected the top loading beam of each specimen to the end of the servo actuator, allowing the application of reversed horizontal forces. A spherical hinge was incorporated at the front end of the force sensor to permit a small relative rotation between the wall and the horizontal loading device, thereby preventing spurious bending moments during wall displacement.
Figure 4.
(a) Device for horizontal loading; (b) device for vertical loading.
Figure 5.
Quasi-static test setup of LBPCSW.
The vertical load was first applied to a steel plate by the vertical servo actuator and then transmitted to an I-section steel beam. Four 20 mm diameter round steel bars were placed between the steel plate and the I-section steel beam to accommodate ±100 mm horizontal deformation of the specimen. The vertical load was then transferred from the I-section steel beam to the specimen as a uniformly distributed load (converting the concentrated load from the actuator). The vertical loads applied to the wall were calculated based on the dead load (e.g., self-weight of the floor slab) and live load of a typical single-story roof structure for low-rise rural housing in China, with reference to the Chinese code GB 50009-2012 [24] Load Code for the Design of Building Structures [24]. The loads were transmitted to the wall as uniformly distributed linear loads. For W1 and W2 (wall width 1650 mm), the dead load was approximately 10 kN. For W3 (wall width 825 mm), the load was proportionally halved to 5 kN. This vertical load was first applied to the predetermined value and then kept constant.
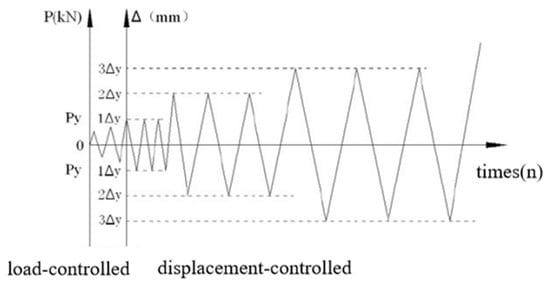
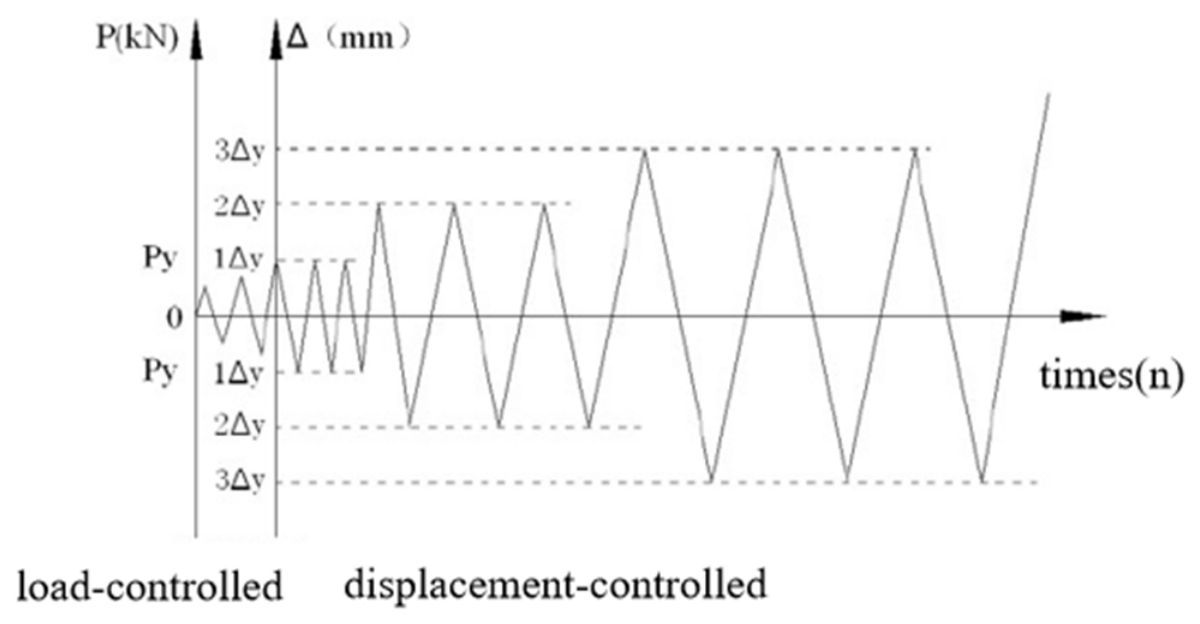
Subsequently, the horizontal loading was applied using a mixed load–displacement control mode. Initially, load-controlled loading was applied until cracking of the specimen. The load step was set to one-tenth of the predicted ultimate load. Based on simple calculations, the load step was 20 kN for specimens W1 and W2, and 5 kN for specimen W3. After cracking, the loading mode was switched to displacement control. The displacement increment per step was taken as 3.0 times the cracking displacement Δcr. The test was terminated when the specimen completely failed or when the lateral load dropped to 0.85 times the ultimate load.
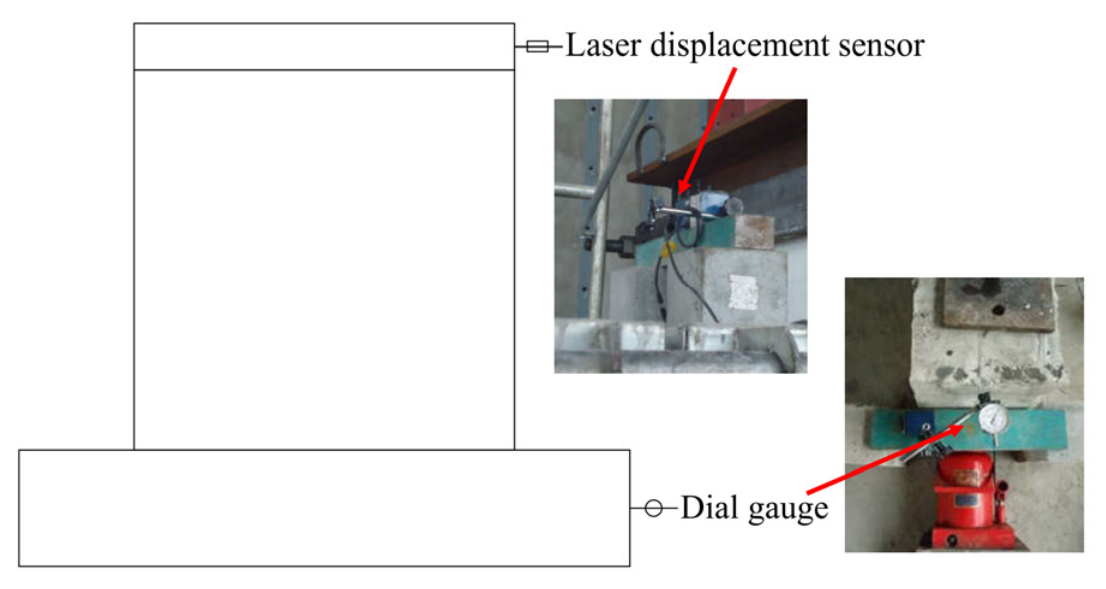
The base beam was anchored to the strong floor using four high-strength anchor bolts. During the force-controlled stage, one cycle was applied at each load increment; after cracking, the loading was switched to displacement control with three cycles per displacement level. The laser displacement sensor had a range of ±200 mm with an accuracy of 0.01 mm, and the dial gauge had an accuracy of 0.01 mm.
The loading history is schematically illustrated in Figure 6, which shows the relationship between the applied load/displacement and the number of cycles throughout the test.
Figure 6.
Schematic diagram of loading history.
2.1.3. Experimental Procedure
The tests focused on failure characteristics, crack distribution, load–displacement hysteresis curves, and skeleton curves of the wallboards. To facilitate crack observation, a layer of white lime paint was evenly applied to both sides of each wallboard. During loading, the crack length and width were measured using a measuring tape, and the corresponding load levels were recorded.
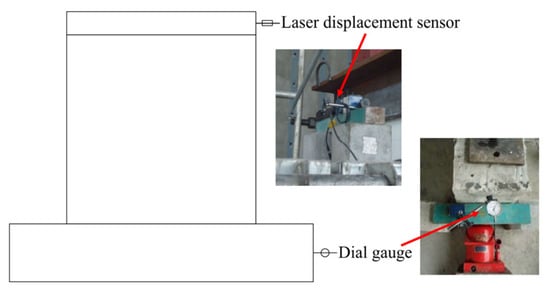
The load–displacement hysteresis curves and skeleton curves were recorded using the built-in force sensor of the servo actuator and its online control system. The lateral displacement of the wall was measured by a laser displacement sensor installed at the top of the wallboard. Additionally, a dial gauge was placed at the center of the bottom foundation beam to record any sliding displacement of the specimen during loading. This sliding displacement was subsequently subtracted from the total measured displacement when preparing the final load–displacement hysteresis curves and skeleton curves, as shown in Figure 7.
Figure 7.
Location of displacement measurement setup.
2.2. Finite Element Modeling
Using the finite element software ABAQUS 2021 [25,26,27], a finite element analysis (FEA) of the seismic performance of LBPCSW was conducted. The primary load-bearing components of the LBPCSW are the reinforcement meshes within the wall and the concrete layers on both sides, while the middle insulation layer, made of polystyrene board, serves mainly for thermal insulation purposes, and its contribution to the mechanical performance of the wall is negligible. Furthermore, the structural connection between the insulation layer and the concrete layers relies entirely on diagonal steel connectors, rather than on interfacial bond between the materials. Therefore, in the ABAQUS finite element model, the load-bearing contribution of the insulation layer is not considered; it is replaced by a hollow region, neglecting its strength and stiffness.
The two concrete wythes were analyzed using a discrete modeling approach, i.e., the concrete and reinforcement were meshed as separate elements, each assigned with appropriate material properties (e.g., parameters of the material constitutive models). The nonlinear behavior of concrete was simulated using the Concrete Damaged Plasticity (CDP) model available in ABAQUS. The basic material parameters of concrete, including compressive strength, density, Young’s modulus, Poisson’s ratio, dilation angle, eccentricity, and the biaxial-to-uniaxial compressive strength ratio fb0/fc0, are summarized in Table 5. The compressive and tensile behaviors of the CDP model, defined by yield stress, inelastic strain, and corresponding damage factors, are presented in Table 6 and Table 7, respectively. For steel reinforcement, an elastic-perfectly plastic material model was adopted, with material properties (yield strength and ultimate tensile strength) listed in Table 8 (Φ8: HPB300; Φ12: HRB335). The Young’s modulus and Poisson’s ratio for steel were taken as 200 GPa and 0.3, respectively.
Table 5.
Material attribute of concrete.
Table 6.
Parameters of concrete damaged plasticity model when concrete in compression.
Table 7.
Parameters of the concrete damaged plasticity (CDP) model under tension.
Table 8.
Material properties of steel reinforcement.
The interactions between materials and elements were realized through assembly models and the constraint relationships provided by ABAQUS. The embedded region technique was used for both concrete and reinforcement. To simulate the rigid connection between the wall and the top beam, tie constraints were applied between the wall wythes and the top beam, through which the shear stresses at the interface were transferred. The wall was tied to the foundation beams and to the loading beams.
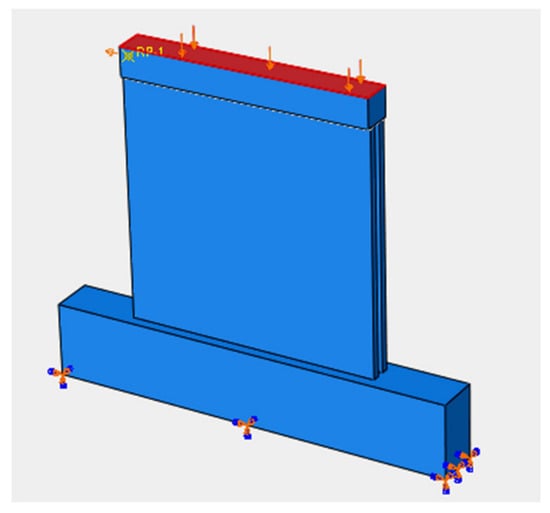
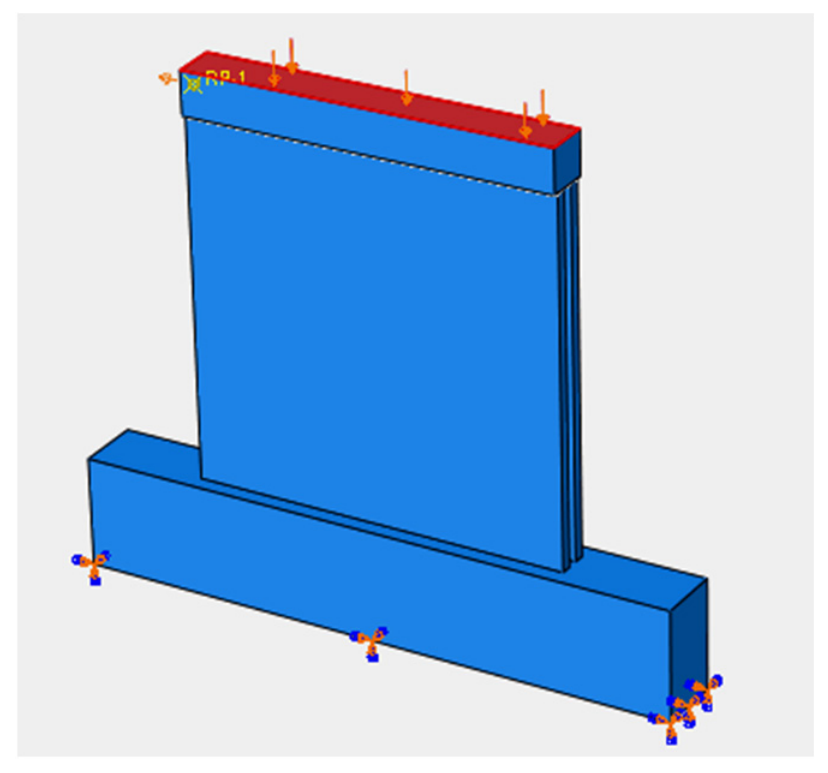
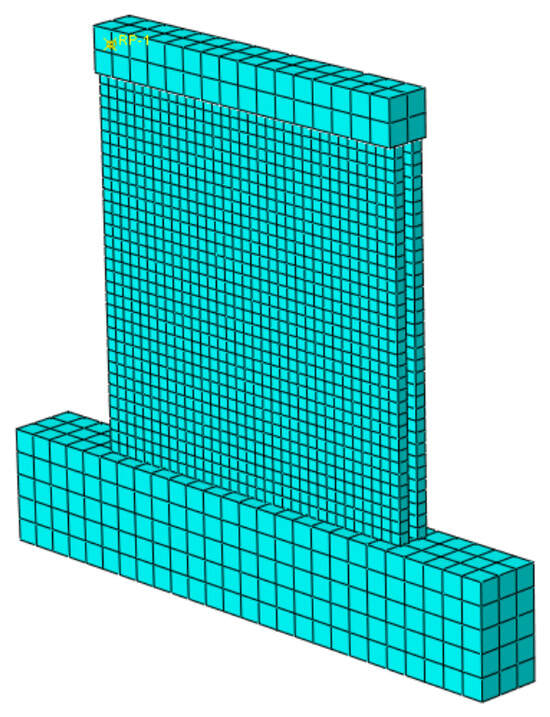
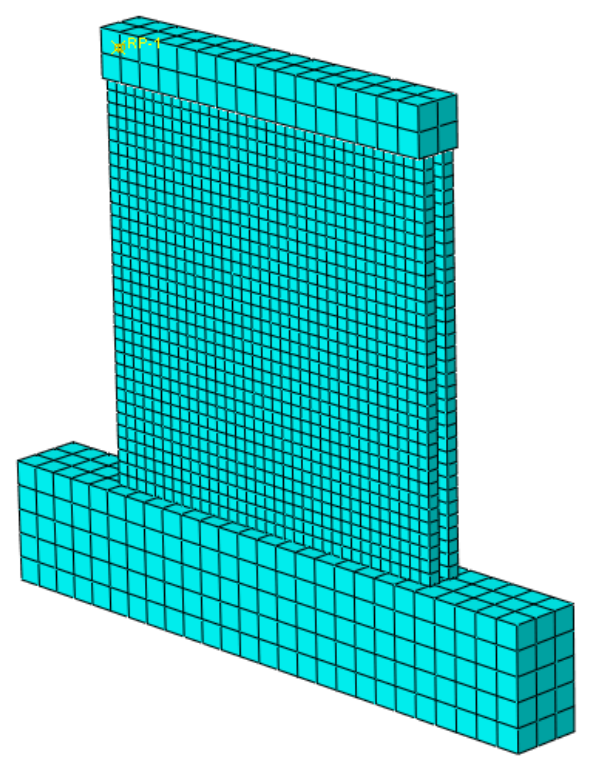
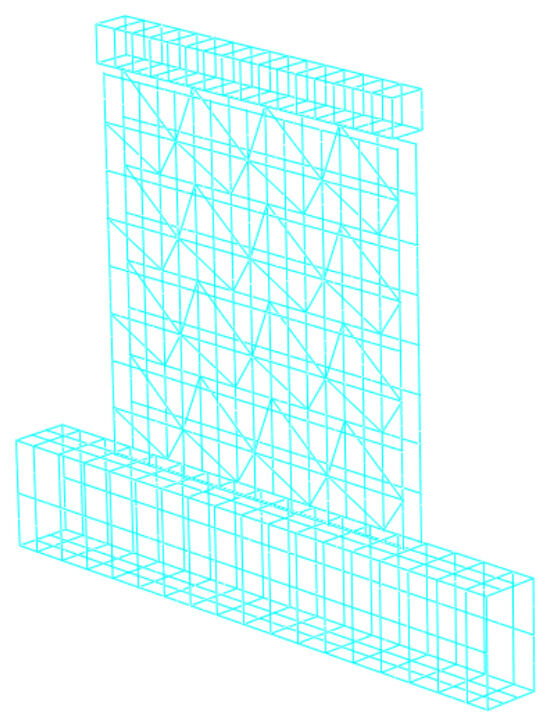
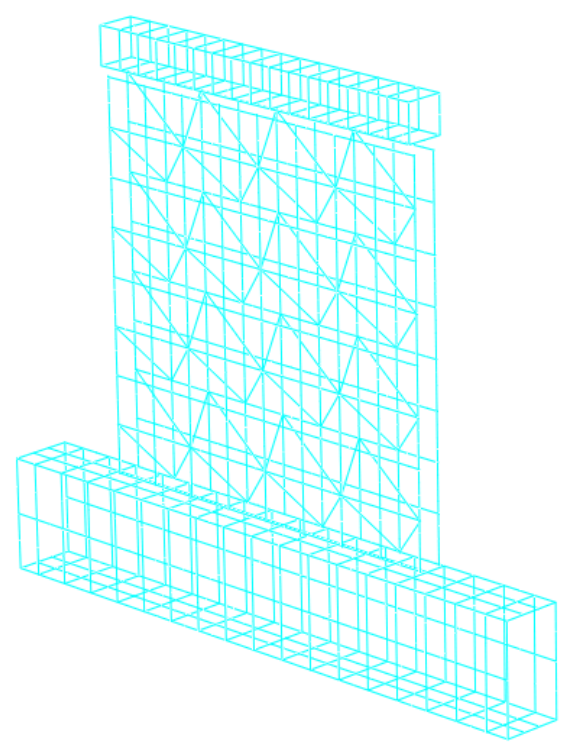
The boundary conditions, loading locations, and element loading modes were determined according to the test setup (see Figure 8). The mesh size of the concrete in the distribution beam and the foundation beam was 0.1 m, while that of the concrete on the two concrete wythes was 0.05 m (see Figure 9). The wall reinforcement and the inclined inserted rebars were treated as a single independent element (see Figure 10). The concrete element type was C3D8R (eight-node linear hexahedral element), and the reinforcement element type was T3D2 (two-node linear three-dimensional truss element).
Figure 8.
Boundary conditions and loading protocol of the finite model.
Figure 9.
Mesh of the concrete.
Figure 10.
Mesh of the reinforcement.
3. Results
3.1. Failure Process of the Wallboards
3.1.1. Specimen W1
Specimen W1 remained intact without visible cracks when the load was below 80 kN. At a forward horizontal load of 100 kN, the first fine horizontal crack, approximately 300 mm in length and 0.2 mm in width, appeared at the bottom corner of the wall. A similar first crack was observed under a reverse load of −100 kN. Under reversed cyclic loading, the cracks tended to close and reopen, gradually growing in length and width with increasing load levels.
When the forward and reverse loads reached 160 kN, multiple diagonal cracks appeared on the wall, and the width and distribution range of the cracks increased significantly. Under cyclic loading, the cracks exhibited a diamond-shaped crossing pattern. As the load further increased, more cracks developed, and the surface concrete began to spall slightly. When the load reached 240 kN, the specimen reached its ultimate load capacity. At this stage, the deformation increased substantially, with marked plastic deformation, and the newly developed cracks in the upper-middle region propagated diagonally toward the bottom of the wall.
Ultimately, the concrete in the compression zone was crushed under combined shear and compression, resulting in extensive spalling and buckling of the longitudinal reinforcement. At the same time, the concrete in the tension zone cracked severely and gradually separated from the foundation beam, exposing the reinforcement, which eventually fractured with visible necking. The deformation increased rapidly, and the specimen failed. In summary, W1 exhibited a typical shear failure mode.
3.1.2. Specimen W2
The failure process and crack development characteristics of specimen W2 were generally similar to those of W1, except that the cracking load of W2 was slightly lower than that of W1. At a reverse load of −80 kN, the first fine horizontal crack, approximately 250 mm in length and 0.2 mm in width, appeared at the bottom corner of the wall.
When the forward and reverse loads reached 200 kN, multiple diagonal cracks with an inclination of approximately 45° appeared below the mid-height of the wall. Under cyclic loading, these cracks also exhibited a diamond-shaped crossing pattern. Compared with W1, the cracks in W2 were denser and more uniformly distributed, indicating that the enhanced detailing at the wall ends provided more comprehensive energy dissipation.
At a reverse load of −280 kN, diagonal cracks appeared in the upper-middle region of the wall and continued to propagate with increasing load. When the load reached 320 kN, the specimen reached its ultimate load capacity, with cracks fully developed and significant plastic deformation observed. Finally, the concrete in the compression zone failed in shear-compression, while the concrete in the tension zone cracked and separated from the foundation beam. The compression reinforcement buckled, and the tension reinforcement fractured with necking. Notably, due to the reduced concrete cover thickness in the end regions and the enhanced reinforcement detailing, vertical cracks resembling splitting failure developed at the wall ends.
3.1.3. Specimen W3
The failure process of specimen W3 was generally similar to that of W1 and W2, but the crack development characteristics differed from those of the other two specimens.
When the forward load reached 60 kN, the first horizontal cracks appeared at the bottom of the wall and propagated further with increasing load. At a reverse load of −80 kN, new horizontal cracks appeared at one-third of the wall height from the bottom, while the bottom cracks continued to extend and widen. At a forward load of 120 kN, multiple visible cracks developed. Except for slightly diagonal crossing at the bottom corners, the cracks were predominantly horizontal and distributed densely and uniformly.
When the load reached 140 kN, the specimen reached its ultimate load capacity, with deformation increasing substantially and plastic deformation becoming very pronounced. Existing cracks further propagated and penetrated. Ultimately, the concrete in the compression zone crushed, and the tension reinforcement exhibited necking and fracture. Similar to W2, splitting-type vertical cracks developed at the wall ends due to the enhanced detailing.
3.1.4. Summary of Failure Characteristics
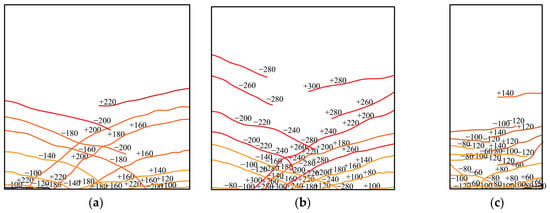
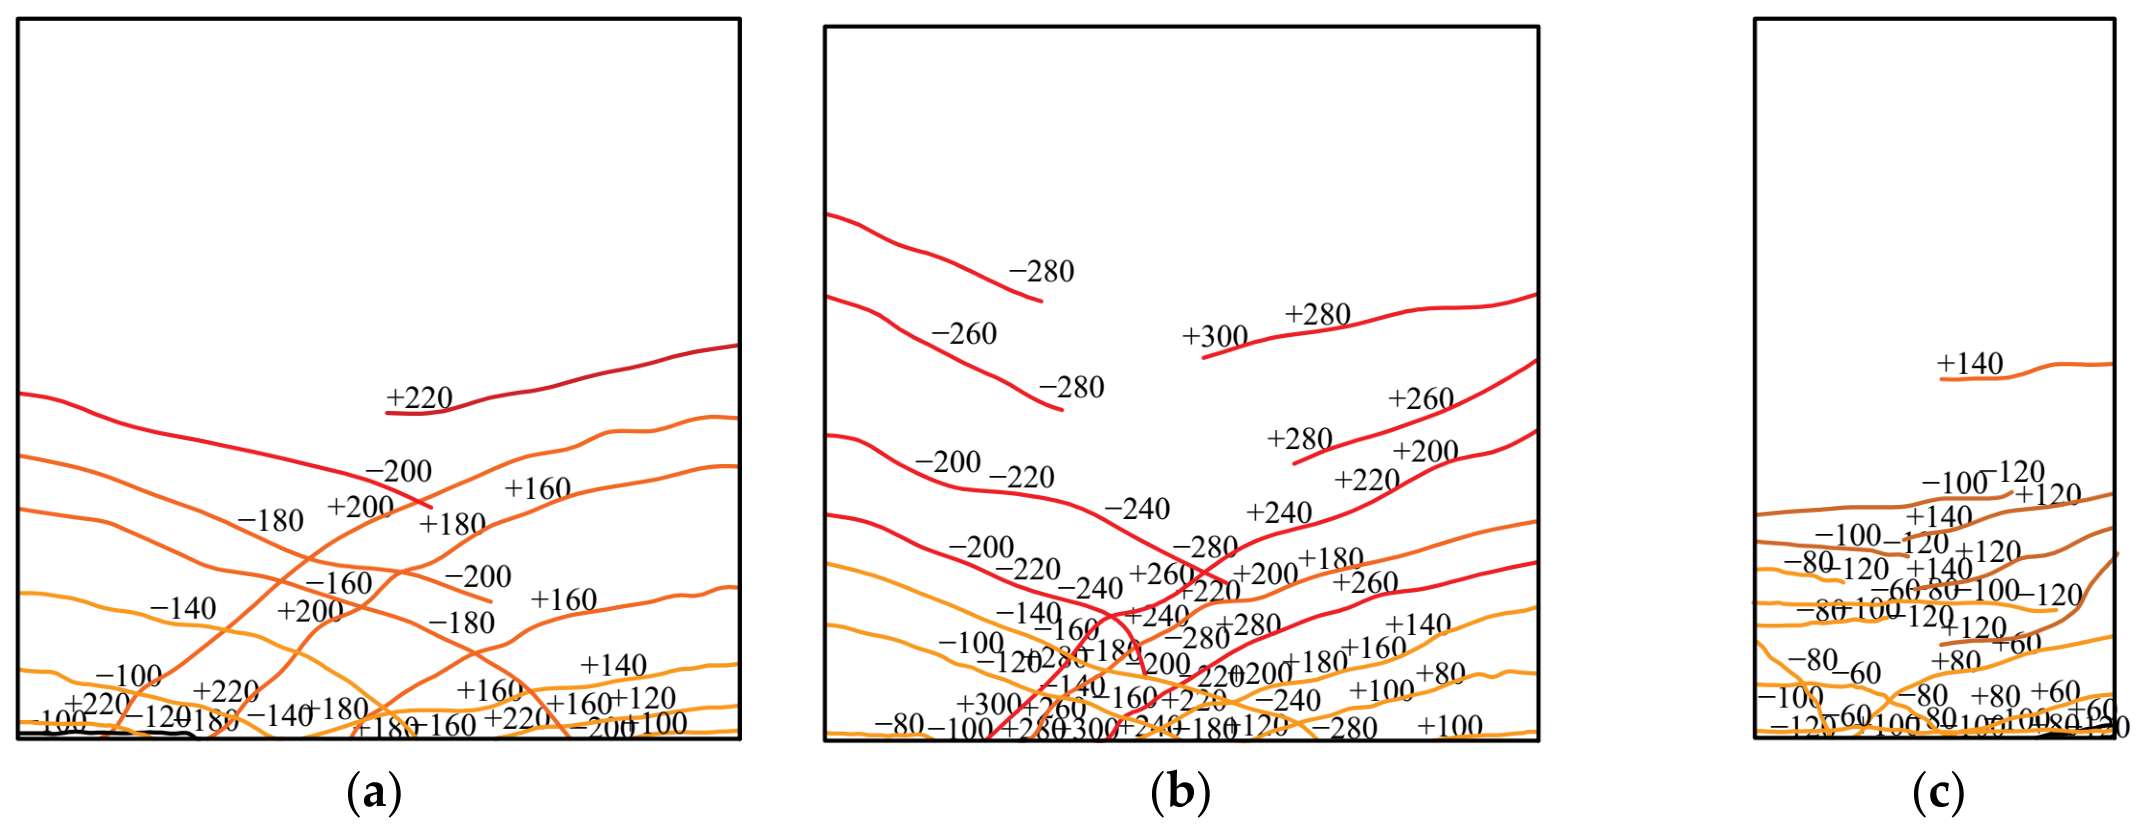
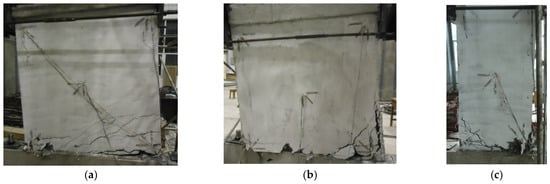
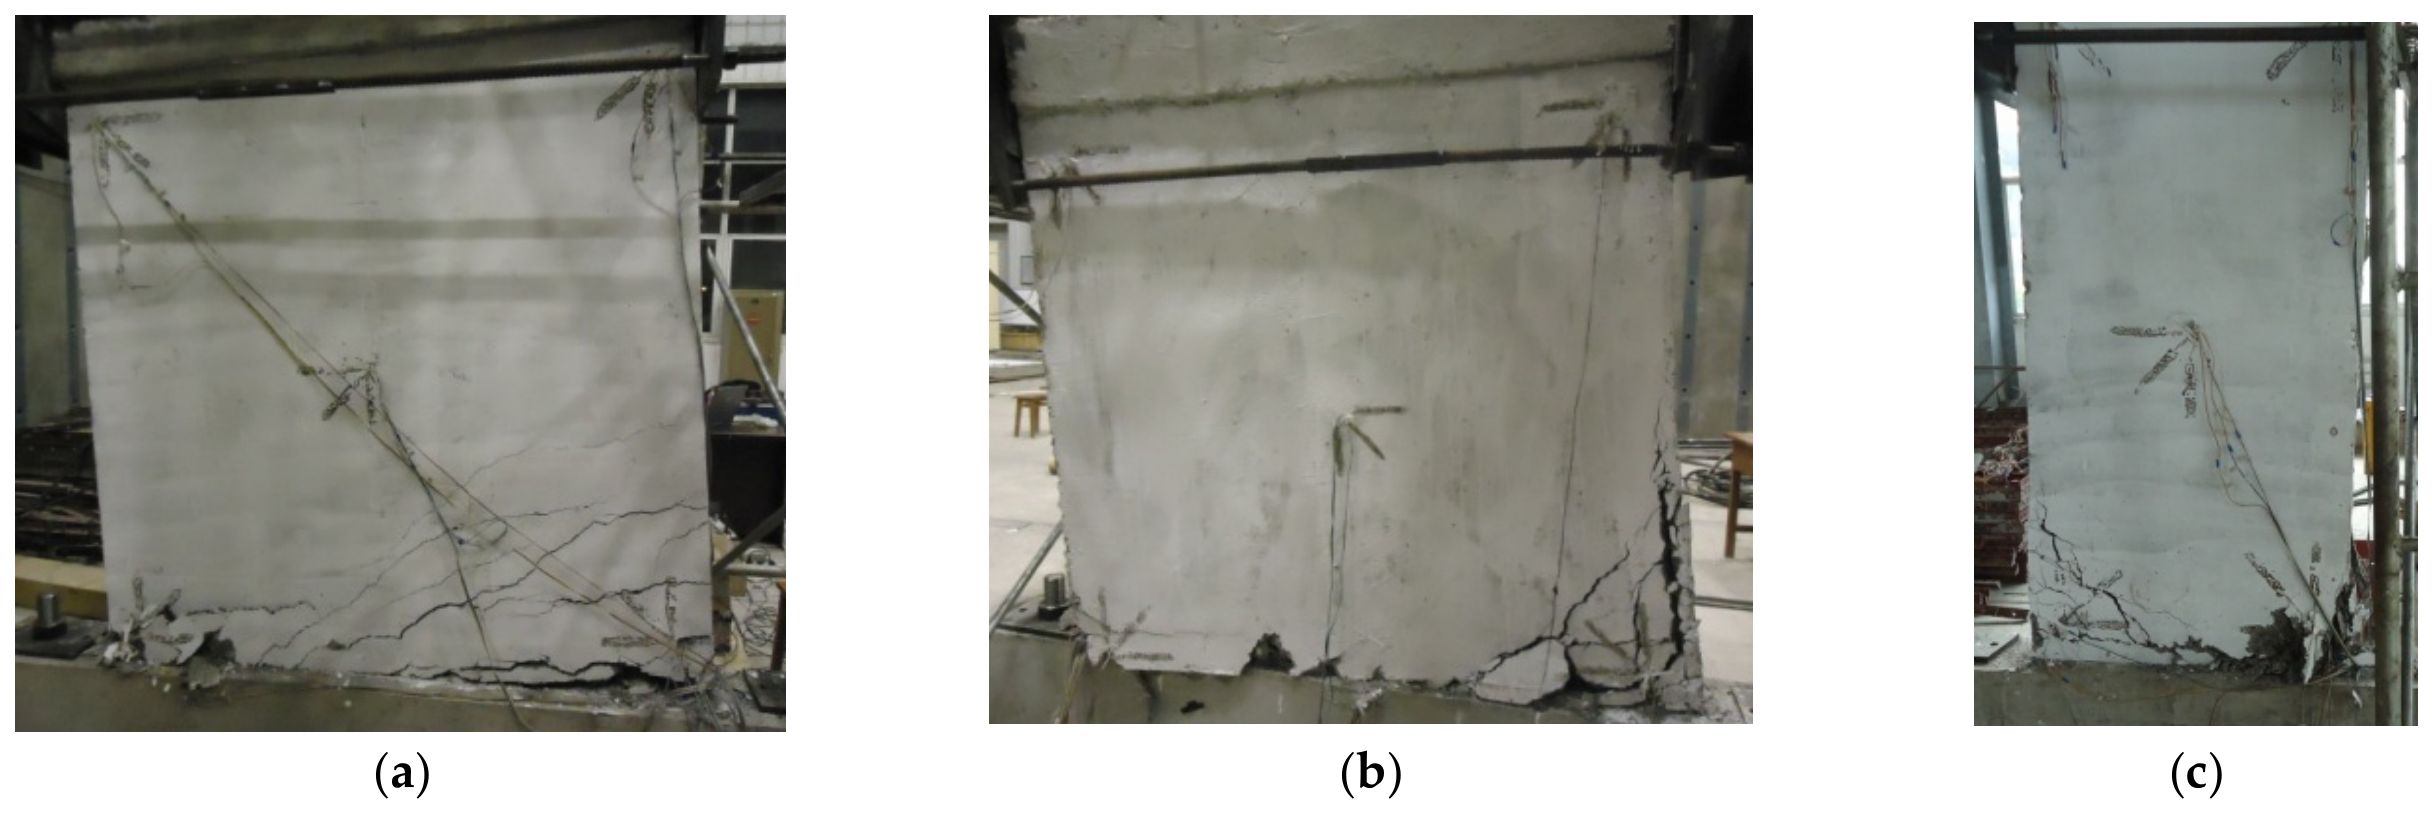
Figure 11 and Figure 12 present the crack patterns and final failure states of the three specimens. It should be noted that the apparent “unidirectional” crack appearance in Figure 11 is due to two main reasons: (1) in the final failure state, the specimen remained connected to the servo actuator; under the residual force or unidirectional pushing force exerted by the actuator, the cracks on one side of the wall were pulled open while those on the opposite side tended to close or reduce in width, resulting in only the primary cracks on one side being clearly visible in the photograph; (2) the photographs were not taken from a fixed side of the wall, and therefore the crack distribution on both sides could not be captured simultaneously.
Figure 11.
Crack patterns of the three specimens: (a) W1; (b) W2; (c) W3.
Figure 12.
Final failure photos of the three specimens: (a) W1; (b) W2; (c) W3.
The failure processes of the three specimens were generally similar and could be divided into five stages: elastic, cracking, yielding, ultimate, and failure. The characteristic loads at these stages are summarized in Table 9. Specimen W1 failed after 12 horizontal loading cycles, with an ultimate load of 240 kN. W2 and W3 failed after 17 and 9 cycles, with ultimate loads of 300 kN and 140 kN, respectively.
Table 9.
Experimental results from the quasi-static test.
The different failure modes can be attributed to the height-to-width ratio. For W1 and W2 (height-to-width ratio ≈ 1.0), shear deformation predominated, leading to shear-compression failure and diagonal crack patterns. For W3 (height-to-width ratio ≈ 2.0), bending deformation governed the response, resulting in flexural failure characterized by predominantly horizontal cracks and crushing of the compression zone. This observation confirms that the height-to-width ratio is a key parameter controlling the failure mechanism of LBPCSW.
3.2. Ultimate Load
The horizontal load P and the corresponding measured displacement Δ at cracking and ultimate loading are listed in Table 10. The ratio of displacement at first cracking (Δcr) to the displacement at ultimate load (Δmax) ranged from 0.128 and 0.169, indicating significant deformation development between first cracking and final failure. The ultimate load of specimen W2 was 1.25 times that of W1, demonstrating that embedded columns at the wall ends can effectively enhance the load-bearing capacity of the wallboard. Notably, the cracking load of W2 was slightly lower than that of W1, and the ratio of cracking load (Pcr) to ultimate load (Pmax) was also smaller for W2 than for W1. Given that W1 and W2 shared the same height-to-width ratio, this reduction in Pcr/Pmax may be attributed to the increased diameter of the longitudinal rebars and the reduced concrete cover thickness within the embedded column (see Table 4 and Figure 3). Furthermore, under the same embedded column configuration (W2 and W3), the Pcr/Pmax ratio of W2 was also lower than that of W3, suggesting that the cracking load tends to increase with the height-to-width ratio.
Table 10.
Experimental results at cracking and ultimate stages.
In this study, a larger reinforcement diameter was used due to limitations of the laboratory conditions. Therefore, it is recommended that smaller-diameter reinforcements (e.g., 4 mm or 6 mm) be adopted for multi-storey building applications.
3.3. Hysteresis Curve
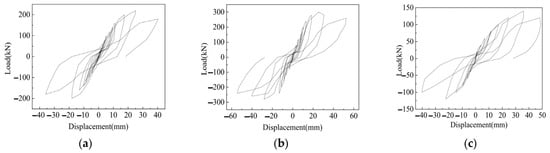
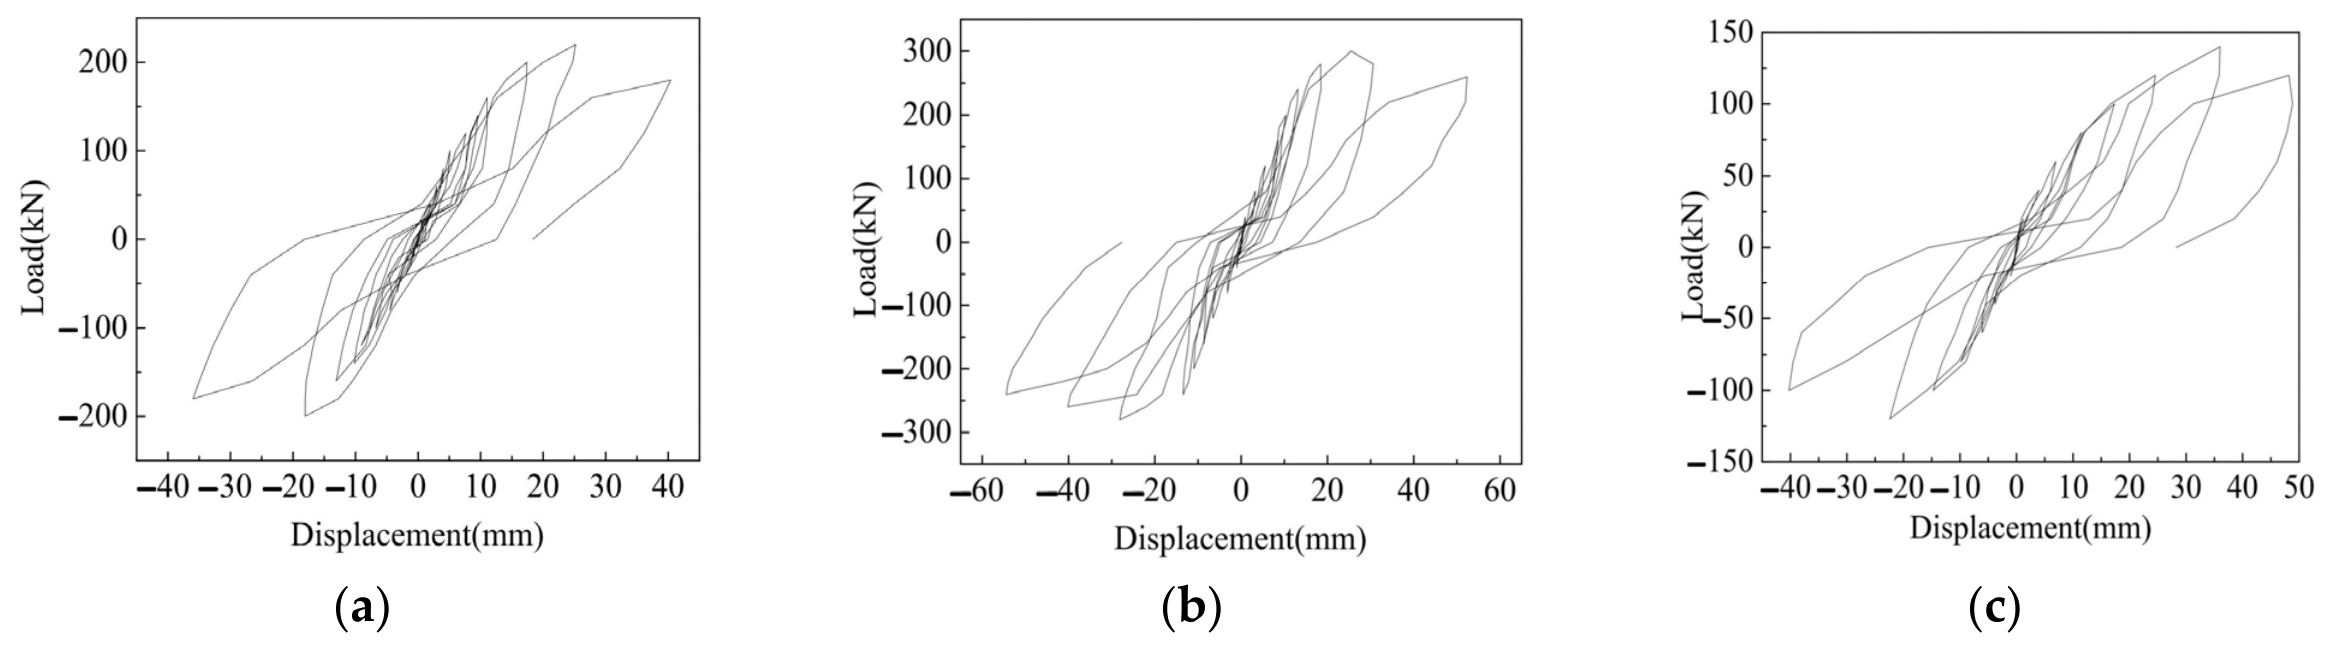
Figure 13a–c present the load–displacement hysteresis curves for specimens W1, W2, and W3, respectively. Under the same horizontal load level, both the slope of the hysteresis curves and the areas of the hysteresis loops of specimen W1 were larger than those of W2, indicating that W1 exhibited higher initial stiffness and greater energy dissipation per cycle than W2. This suggests that the incorporation of embedded columns at the wall ends did not enhance the elastic stiffness or the cyclic energy dissipation capacity within the elastic range; instead, W2 showed relatively lower stiffness and smaller loop areas under identical load levels. For specimen W3, the slope of the hysteresis curves was smaller than that of W1 and W2. However, after entering the yield stage, specimen W3 exhibited larger deformation, favorable ductility, and more stable and plump hysteresis loops, demonstrating superior post-yield energy dissipation capacity.
Figure 13.
Hysteresis curves of the three specimens. (a) W1; (b) W2; (c) W3.
3.4. Deformability
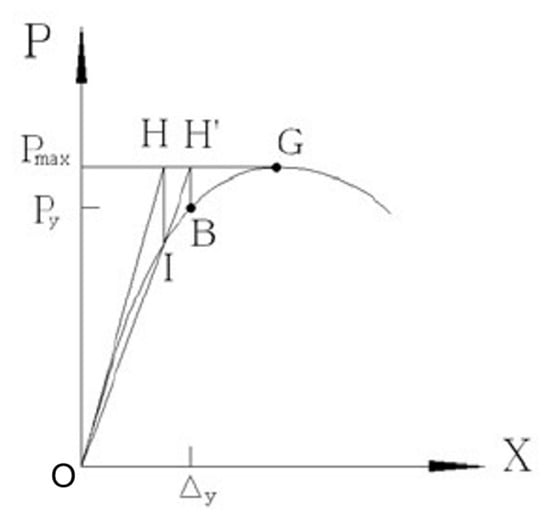
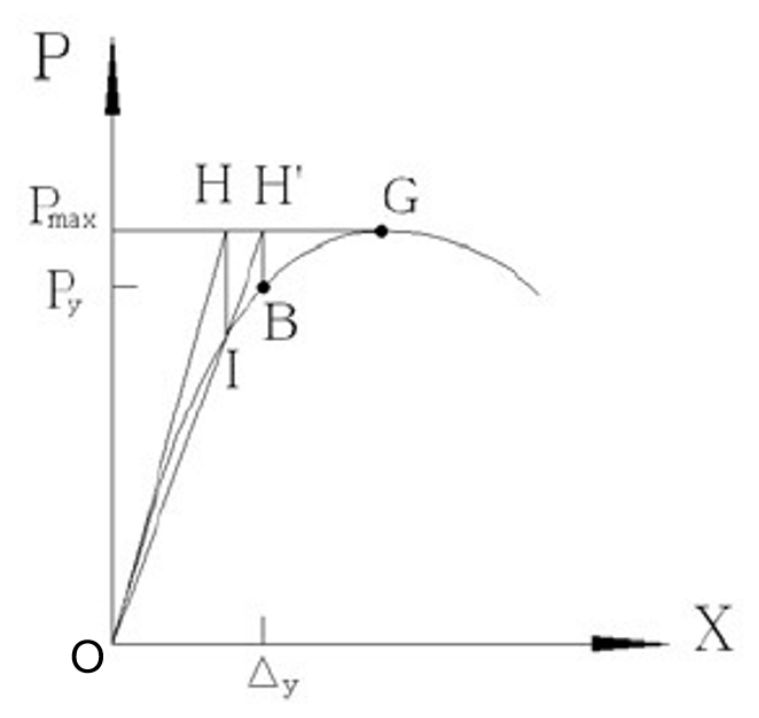
The ductility coefficient μ, defined as the ratio of the ultimate displacement Δu to the yield displacement Δy, is used to evaluate the deformability of a wall [28]. In this study, the yield displacement is taken as the horizontal displacement corresponding to the yield point of the specimen, and the ultimate displacement is taken as the horizontal displacement corresponding to the ultimate load. For hysteretic skeleton curves without an obvious yield point, the modified “general yield bending moment method” [29] was adopted to determine the yield load and displacement. The procedure for determining the yield point is as follows: as illustrated in Figure 14, a tangent line OH is drawn from the origin O and intersects the horizontal line passing through the ultimate load point G at H; a vertical line through H intersects the curve at I; line OI is extended to meet the horizontal line HG at point J; a vertical line through J intersects the curve at point B, which is taken as the approximate yield point. The corresponding load Py and displacement Δy are then taken as the yield load and yield displacement, respectively.
Figure 14.
Determination of yield point.
The calculated ductility coefficients μ of the three walls are listed in Table 11. The values are 3.20, 4.27, and 4.54 for specimens W1, W2 and W3, respectively. Given that the required ductility coefficient for concrete seismic structures is typically between 3 and 4, the LBPCSW exhibits favorable ductility performance. Notably, W3 achieved the highest ductility coefficient, indicating that the height-to-width ratio plays an important role. Furthermore, the ductility coefficient of W2 was 1.33 times of W1, demonstrating that the embedded column at the wall ends can significantly improve the ductility of structural element.
Table 11.
Ductility parameters of the specimens.
4. Discussion
4.1. Finite Element Model Validation
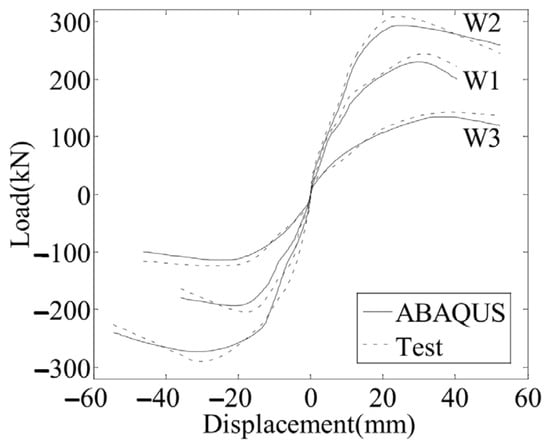
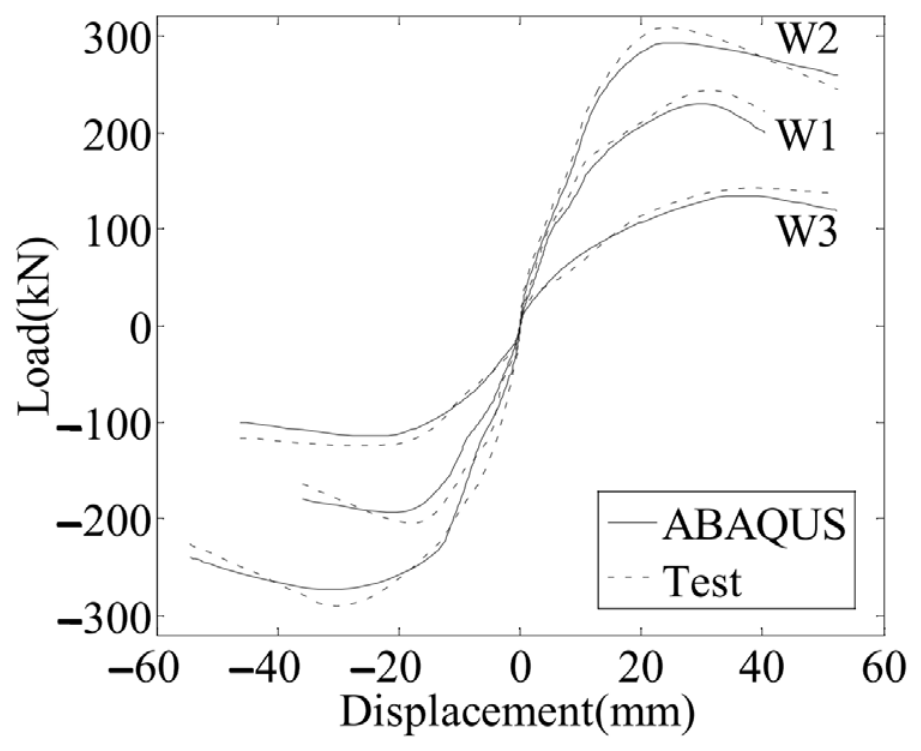
To ensure the reliability of the numerical model for subsequent parametric analysis, the load–displacement hysteretic skeleton curves obtained from ABAQUS were compared with the experimental results, as shown in Figure 15. The simulated skeleton curves of the three wallboards agree well with the experimental results in terms of overall trend, peak load, and stiffness degradation. Moreover, the failure modes observed in the numerical simulation are consistent with the experimental observations (shear failure for W1 and W2, flexural failure for W3). This good agreement confirms that the established FE model, with the material parameters and boundary conditions described in Section 2.2, is capable of capturing the key seismic response characteristics of the LBPCSW system and can be used for further parametric studies.
Figure 15.
Skeleton curves of the experimental and simulated results.
4.2. Effects of Concrete Wythe Thickness and Strength on Seismic Performance
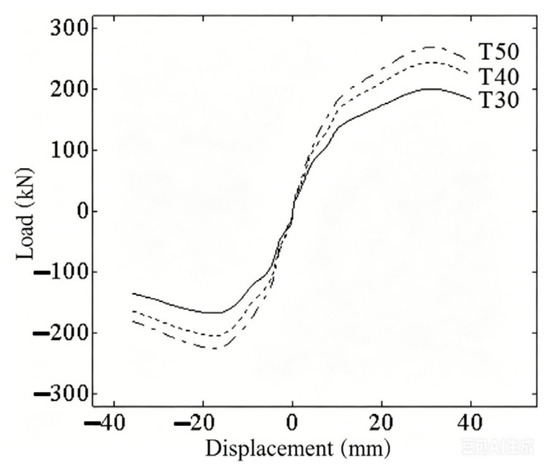
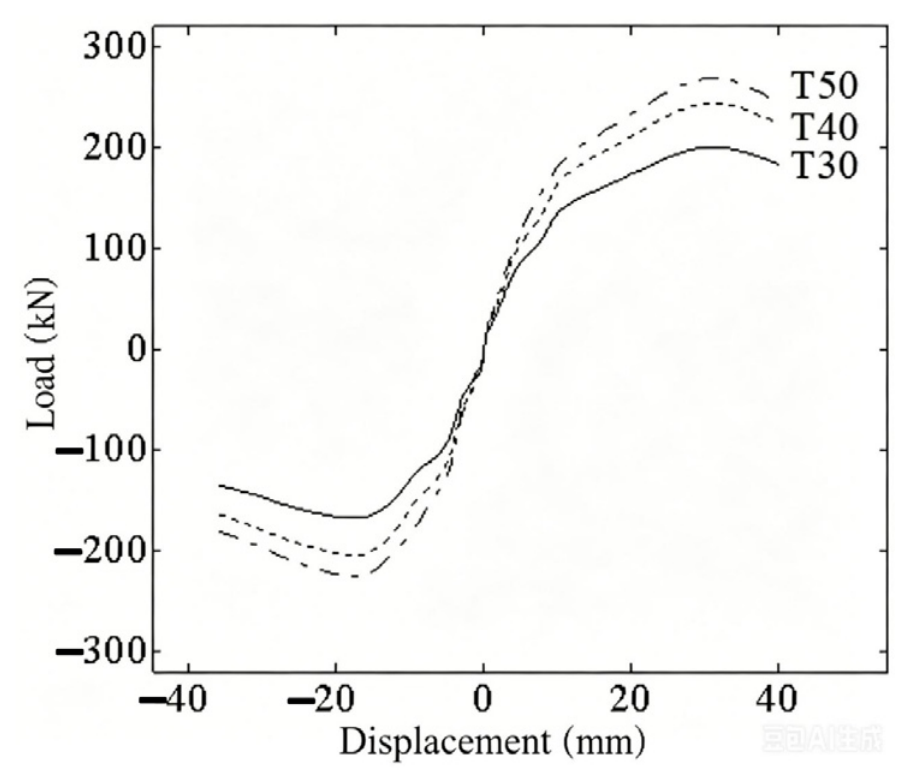
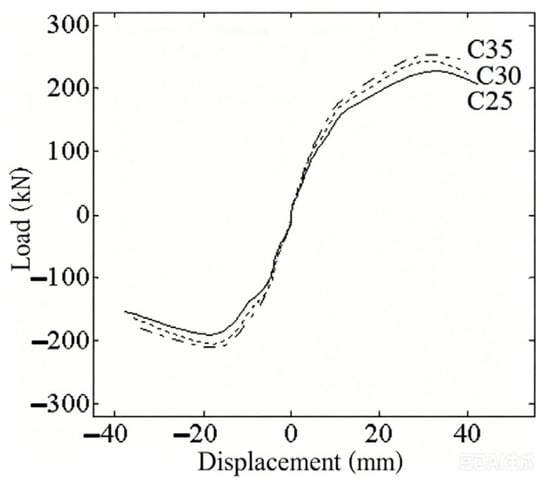
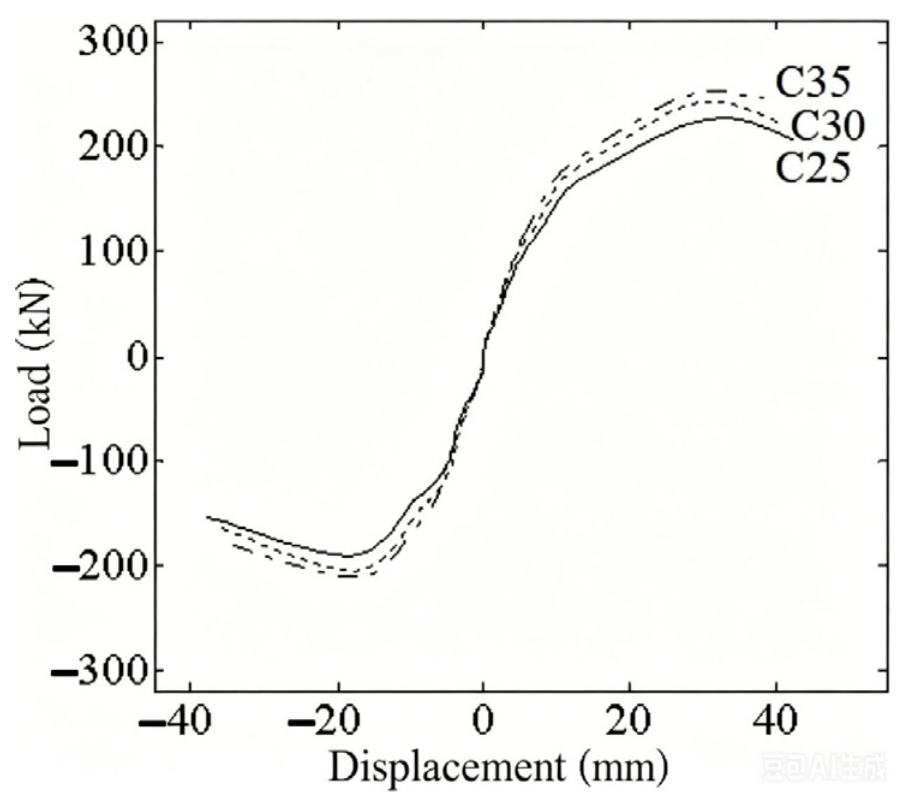
Based on the validated FE model, a parametric study was conducted using specimen W1 as the baseline to investigate the effects of concrete wythe thickness and concrete strength on the seismic performance of the wall. The resulting load–displacement skeleton curves for different concrete wythe thicknesses (30 mm, 40 mm, and 50 mm) and concrete strength grades (C25, C30, and C35) are presented in Figure 16 and Figure 17, respectively. The quantitative results are summarized in Table 12.
Figure 16.
Skeleton curves of specimens with different concrete thickness.
Figure 17.
Skeleton curves of specimens with different concrete strength.
Table 12.
Summary of parametric study results.
As shown in Figure 16 and Table 12, increasing the concrete wythe thickness from 30 mm to 40 mm and 50 mm led to an increase in the ultimate load from 208 kN to 253 kN (+21.6%) and 279 kN (+34.1%), respectively. This pronounced improvement can be attributed to the fact that increasing the concrete thickness directly enlarges the compression zone and enhances the flexural stiffness of the cross-section, thereby providing a more effective means of improving lateral load resistance.
In contrast, Figure 17 and Table 12 show that when the concrete strength increased from C25 to C30 and C35, the ultimate load increased from 236 kN to 253 kN (+7.2%) and 260 kN (+10.2%), respectively. The relatively modest improvement suggests that, within the range of concrete grades commonly used in low-rise rural buildings, the concrete strength has a minor influence on the load-bearing capacity compared to the concrete thickness. Higher concrete strength mainly enhances the material’s peak stress capacity but does not substantially alter the sectional stiffness.
These findings suggest that, for low-rise rural housing applications where material cost is a critical concern, optimizing the concrete wythe thickness is a more efficient design strategy than simply increasing the concrete grade.
4.3. Influence of Height-to-Width Ratio on Failure Mode
From the beginning of loading to the final failure, no obvious slip was observed between the wall components, indicating that the LBPCSW could serve as an integral structural wall to resist horizontal loading. Furthermore, the crack distributions on specimens W1, W2 and W3 reveal that the height-to-width ratio significantly influenced the failure characteristics of the wallboard. When the height-to-width ratio was 1, shear failure predominated; when the height-to-width ratio increased to 2, the wall exhibited apparent flexural failure. A detailed analysis of this phenomenon is provided as follows.
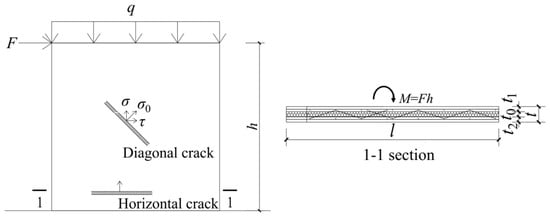
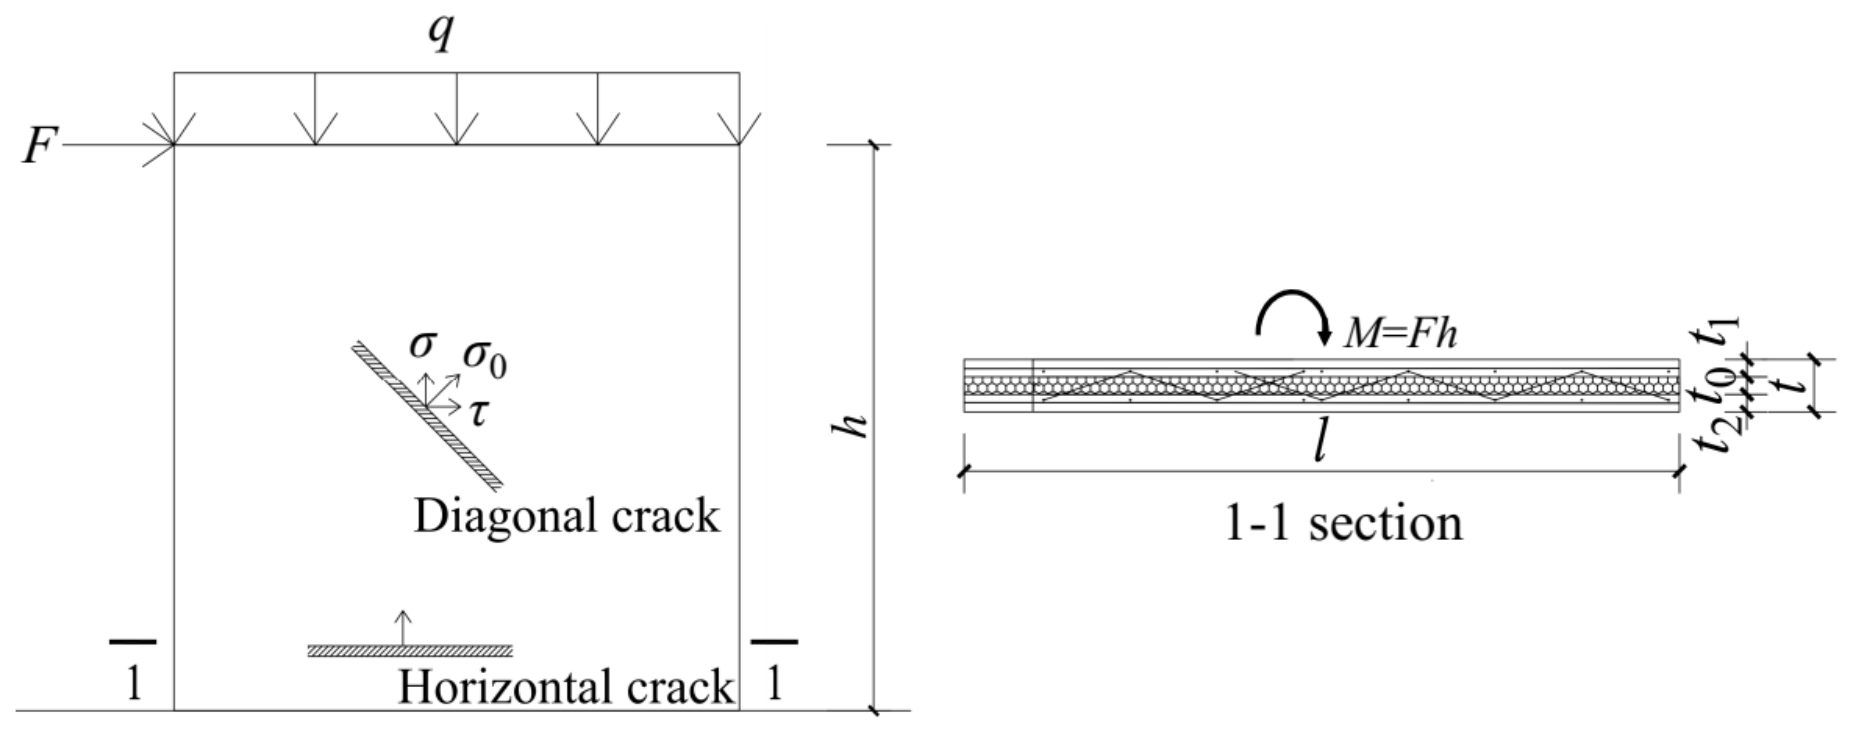
During the test, the wallboard was subjected to horizontal load (concentrated force) and vertical load (distributed load), as shown in Figure 18. Since the horizontal load was much larger than the vertical load, it was the primary focus of the analysis. From the force diagram and experimental results, it can be seen that the maximum stress occurred at the bottom section of wall. The bending moment (M) at the bottom section equals the horizontal load (F) multiplied by the height (h) of the wall. Based on the formulas of mechanics of materials, the relationship between bending-shear stress ratio (σ/τ) and height-to-width ratio (h/L) of the bottom section can be derived as follows.
where I is the moment of inertia of the wall section; is the total thickness of two leaf concrete wythes (); l is the width of the wall, W is the section modulus; σ and τ are the bending and shear stresses of the section, respectively; M is the bending moment (); F is the horizontal concentrated load; h is the height of the wall; and C is a constant.
Figure 18.
Load, stress, and crack sketch of the wall.
According to Formula (2), the bending-shear stress ratio (σ/τ) is directly proportional to the height-to-width ratio (h/L). This implies that as the height-to-width ratio increases, the bending stress (σ) become larger than the shear stress (τ). When the bending stress is significantly larger than the shear stress such that the shear stress can be neglected, horizontal cracks predominate, eventually leading to flexural failure of the wall. Conversely, when the bending stress is not sufficiently larger than the shear stress and the shear stress cannot be ignored, diagonal cracks are more likely to occur, resulting in shear failure.
5. Conclusions
This study conducted quasi-static tests and finite element analysis to investigate the seismic performance of load-bearing prefabricated concrete sandwich wallboards (LBPCSWs). Three full-scale specimens with varying height-to-width ratios and embedded column configurations were tested, and the numerical model was validated against the experimental results. Based on the experimental and numerical investigations, the following conclusions can be drawn:
- From the beginning of loading to final failure, each specimen exhibited specific and distinct characteristics at different loading stages. Crack development on both concrete wythes was largely consistent, and the insulation layer did not separate from the concrete sides. The reinforced concrete on the two wythes acted compositely, resulting in high load-bearing capacity. These observations indicate that the LBPCSW possesses favorable mechanical properties and strong structural integrity.
- The mechanical behavior and failure mechanisms of the LBPCSW were similar to those of a solid shear wall. Therefore, the calculation formula for a solid shear wall can be used as a reference. In practical design, the effective thickness of the LBPCSW may be taken as the sum of the thicknesses of the two concrete wythes. However, when calculating the horizontal displacement of the wall, the effects of stiffness degradation and bond-slip between reinforcement and concrete should be taken into account.
- The height-to-width ratio and the presence of embedded columns at the wall ends significantly affect the seismic performance of the wall. A higher height-to-width ratio promotes flexural failure under seismic loading, and plays an important role in enhancing structural ductility, energy dissipation capacity, and overall seismic performance. The use of embedded columns to strengthen the wall ends effectively improves the overall stiffness, load-bearing capacity and ductility of the wall, which is beneficial to its seismic performance.
- The concrete thickness and concrete strength of the two wythes influence the seismic performance of the wall to different extent. The concrete thickness has the greatest impact; increasing the concrete thickness leads to a certain improvement in load-bearing capacity. Meanwhile, the concrete strength has a relatively minor effect on seismic performance. With an increase in concrete strength, the overall strength of the wall element improves slightly, and the ratio of increase is small.
- The proposed load-bearing prefabricated sandwich wallboard can be used in shear wall systems for low-rise rural housing in earthquake-prone regions. It exhibits favorable seismic performance as well as energy efficiency, which aligns with low-carbon policies and offers broad application prospects.
Based on the limitations of the present study, the following recommendations are made for future research:
- Although the calculation formulas for solid shear walls may be used as a reference, the specific design formulas and key design considerations for LBPCSW require further investigation, particularly regarding the determination of effective stiffness and the design of the connection details.
- As the concrete damaged plasticity model in ABAQUS does not account for bond-slip between reinforcement and concrete, further investigation is needed to better simulate the pinching phenomenon of the wall element during cyclic loading.
- The present study focuses primarily on the seismic performance of individual wall panels. Future research should address the connection methods and load transfer mechanisms between components, and further evaluate the seismic performance of the overall structural system.
Author Contributions
Conceptualization, J.Z. and Q.H.; methodology, J.Z., Q.H. and Y.H.; software, J.Z. and D.T.; validation, J.Z., Q.H. and D.T.; formal analysis, J.Z. and Y.H.; investigation, J.Z.; resources, Q.H.; data curation, J.Z.; writing—original draft preparation, J.Z.; writing—review and editing, Q.H., Y.H. and D.T.; visualization, J.Z.; supervision, Q.H.; project administration, Q.H.; funding acquisition, Q.H. All authors have read and agreed to the published version of the manuscript.
Funding
This research was funded by the Science and Technology Research and Development Program Project of China Railway Group Limited, grant number 2023-Major-06.
Data Availability Statement
The original contributions presented in this study are included in the article. Further inquiries can be directed to the corresponding author.
Conflicts of Interest
The authors declare no conflicts of interest. The authors declare that this study received funding from the Science and Technology Research and Development Program Project of China Railway Group Limited (Grant No. 2023-Major-06). The funder was not involved in the study design, collection, analysis, interpretation of data, the writing of this article or the decision to submit it for publication.
References
- Huang, Q.Y.; Xiong, F.; Zhou, N.; Ge, Q. Experimental Study on Seismic Performance of New Type 3D Panel Walls. J. Sichuan Univ. Eng. Sci. Ed. 2014, 46, 15–22. [Google Scholar]
- Benayoune, A.; Samad, A.A.A.; Abang Ali, A.A.; Trikha, D.N. Response of Pre-Cast Reinforced Composite Sandwich Panels to Axial Loading. Constr. Build. Mater. 2007, 21, 677–685. [Google Scholar] [CrossRef] [Scilit]
- Benayoune, A.; Samad, A.A.A.; Trikha, D.N.; Abang Ali, A.A.; Ashrabov, A.A. Structural Behaviour of Eccentrically Loaded Precast Sandwich Panels. Constr. Build. Mater. 2006, 20, 713–724. [Google Scholar] [CrossRef] [Scilit]
- Benayoune, A.; Samad, A.A.A.; Trikha, D.N.; Abang Ali, A.A.; Ellinna, S.H.M. Flexural Behaviour of Pre-Cast Concrete Sandwich Composite Panel—Experimental and Theoretical Investigations. Constr. Build. Mater. 2008, 22, 580–592. [Google Scholar] [CrossRef] [Scilit]
- Lameiras, R.; Barros, J.A.O.; Valente, I.B.; Poletti, E.; Azevedo, M.; Azenha, M. Seismic Behaviour of Precast Sandwich Wall Panels of Steel Fibre Reinforced Concrete Layers and Fibre Reinforced Polymer Connectors. Eng. Struct. 2021, 237, 112149. [Google Scholar] [CrossRef] [Scilit]
- Zhang, Y.; Yuan, K.; Zou, R.; Zhang, G.; Guo, J. Experimental Study on Seismic Performance of Squat Precast Concrete Sandwich Shear Walls under Low Axial Load Ratio. Structures 2024, 63, 106483. [Google Scholar] [CrossRef] [Scilit]
- He, J.-X.; Xu, Z.-D.; Zhang, L.-Y.; Lin, Z.-H.; Hu, Z.-W.; Li, Q.-Q.; Dong, Y.-R. Shaking Table Tests and Seismic Assessment of a Full-Scale Precast Concrete Sandwich Wall Panel Structure with Bolt Connections. Eng. Struct. 2023, 278, 115543. [Google Scholar] [CrossRef] [Scilit]
- Sun, J.; Li, R.Y.M.; Su, D.; Gong, H.; Zhang, X. Experimental Study on Seismic Performance of Precast High-Titanium Heavy Slag Concrete Sandwich Panel Wall. Buildings 2024, 14, 2450. [Google Scholar] [CrossRef] [Scilit]
- Cheng, Y.; He, H.; Sun, H.; Cheng, S. Experimental Study and Mechanism Analysis of Out-of-Plane Seismic Performance of Reinforced Concrete Shear Walls. J. Build. Eng. 2023, 78, 108058. [Google Scholar]
- Wang, Y.; Liu, Y.; Xiong, F.; Zheng, C.; Ge, Q.; Bian, Y. Shaking Table Test of a Full-Scale Lightweight Bolt-Connected Concrete Sandwich Wall Panel Structure: Overview and Seismic Analyses. J. Build. Eng. 2024, 97, 110773. [Google Scholar] [CrossRef] [Scilit]
- Li, L.; Sheng, A. Study on the Seismic Performance of a Lightweight Cold-formed Steel Frame System with Tension bars between Columns. J. Build. Eng. 2025, 117, 114864. [Google Scholar] [CrossRef] [Scilit]
- Li, M.; Li, Z.; Gao, C.; Ma, H. Experimental and Numerical Study on the Seismic Performance of Prefabricated Ceramsite Foam Concrete Sandwich Shear Wall. Structures 2025, 75, 108838. [Google Scholar] [CrossRef] [Scilit]
- Ding, R.; Sun, Y.-T.; Nie, X.; Chen, D.-Q. Experimental Study on Seismic Behaviour of an Unreinforced Precast Wall-Slab Structure Based on UHPC Sandwich Panels. J. Build. Eng. 2023, 64, 106197. [Google Scholar] [CrossRef] [Scilit]
- Wang, Y.; Li, M.; Zhang, Q. Numerical Simulation of Seismic Performance of LBPCSW with Different Concrete Strengths. Comput. Struct. 2024, 287, 107234. [Google Scholar]
- Xiong, F.; Chen, W.; Ge, Q.; Chen, J.; Lu, Y. Shake Table Tests of a Novel Low-Rise Bolt-Assembled Precast Concrete Sandwich Wall Panel Structure. Buildings 2025, 15, 4024. [Google Scholar]
- Ge, Q.; Meng, Y.; Ai, J. Seismic Performance of Precast Concrete Sandwich Walls with Bolt-Steel Plate Connections. Eng. Struct. 2024, 303, 117402. [Google Scholar] [CrossRef] [Scilit]
- Xu, G.; Li, A. Experimental and numerical studies on the lateral performance of concrete sandwich walls. J. Struct. Eng. 2023, 149, 04023032. [Google Scholar]
- Lazaridis, P.; Kavvadias, I.; Demertzis, K.; Iliadis, L.; Vasiliadis, L. Interpretable Machine Learning for Assessing the Cumulative Damage of a Reinforced Concrete Frame Induced by Seismic Sequences. Sustainability 2023, 15, 12768. [Google Scholar] [CrossRef] [Scilit]
- Zhang, H.; Yu, D.; Li, G.; Dong, Z. A Real-time Seismic Damage Prediction Framework Based on Machine Learning for Earthquake Early Warning. Earthq. Eng. Struct. Dyn. 2024, 53, 593–621. [Google Scholar]
- Chen, L.J.; Sun, Y.P.; Zhu, G.C.; Wang, Z.L.; Zhou, D.; Mao, G.N.; Wang, C. Development and Application of Multifunctional integrated Prefabricated Low-rise Building Systems. Struct. Des. Tall Spec. Build. 2020, 29, e1715. [Google Scholar]
- GB/T 50011-2010; Code for Seismic Design of Buildings (2024 Edition). China Architecture & Building Press: Beijing, China, 2024.
- Čavčić, A.; Nikolić, M.; Grgić, N.; Harapin, A. Structural Behavior of Prefabricated Concrete Wall Panels and Their Connections: A State-of-the-Art and Practice Review. Buildings 2026, 16, 1936. [Google Scholar] [CrossRef] [Scilit]
- GB/T 50010-2010; Code for Design of Concrete Structures. China Architecture & Building Press: Beijing, China, 2024.
- GB 50009-2012; Load Code for the Design of Building Structures. China Architecture & Building Press: Beijing, China, 2012.
- Li, S.D. Abaqus Finite Element Analysis: From Beginner to Master (2022 Edition); China Machine Press: Beijing, China, 2022; p. 252. [Google Scholar]
- Ding, F.X.; Yu, Z.W. ABAQUS Structural Nonlinear Analysis: A Practical Tutorial; China Machine Press: Beijing, China, 2025; p. 341. [Google Scholar]
- Chen, H.Y. ABAQUS Finite Element Analysis: From Beginner to Master, 3rd ed.; Publishing House of Electronics Industry: Beijing, China, 2022; p. 480. [Google Scholar]
- Jiang, X.; Gu, Y. Restoring-force test of fiber-reinforced plasterboard with concrete core column. J. Tianjin Univ. 2007, 40, 542–547. [Google Scholar]
- Liu, Y.F. An Experimental Study on Seismic Behavior of CS Wallboard Structure. Master’s Thesis, Tianjin University, Tianjin, China, 2007. [Google Scholar]

Disclaimer/Publisher’s Note: The statements, opinions and data contained in all publications are solely those of the individual author(s) and contributor(s) and not of MDPI and/or the editor(s). MDPI and/or the editor(s) disclaim responsibility for any injury to people or property resulting from any ideas, methods, instructions or products referred to in the content. |
© 2026 by the authors. Licensee MDPI, Basel, Switzerland. This article is an open access article distributed under the terms and conditions of the Creative Commons Attribution (CC BY) license.