


Abstract
The Discrete Element Method (DEM) provides an efficient framework for simulating concrete under severe loading conditions involving cracking, discontinuities, and fragmentation. However, DEM formulations based on spherical rigid particles may produce an excessively brittle macroscopic response because particle rolling is insufficiently constrained, particularly under compression. To overcome this limitation, this study develops a three-dimensional DEM model for concrete incorporating a Moment Transfer Law (MTL) that introduces rolling resistance while preserving the computational efficiency of spherical particles. The proposed model combines cohesive and contact interactions with an elastoplastic rolling law formulated at the local scale. A calibration strategy is established to identify both elastic and nonlinear parameters from quasi-static uniaxial compression and tension tests. The model is applied to three concretes with experimental compressive strengths ranging from 33.8 to 67 MPa and splitting tensile strengths ranging from 3.0 to 4.7 MPa. The numerical simulations reproduce the compressive peak strength with relative errors below 1.2% and the available tensile strength values with relative errors below 0.7%. The introduction of the MTL significantly improves the compressive post-peak response by limiting excessive rolling between spherical particles and has a limited influence on the simulated tensile response while reproducing the available tensile strength values. The post-peak ductility is satisfactorily reproduced for the wet concrete, whereas it is overestimated for the concrete with higher compressive strength and the dry ordinary concrete. Because direct experimental uniaxial tensile stress–strain curves were not available, the tensile validation is restricted to splitting tensile strength. The simulated tensile post-peak response should therefore be regarded as a brittle modeling assumption rather than as a fully validated prediction. Overall, the proposed DEM–MTL formulation provides a robust and computationally efficient approach for reproducing the quasi-static compressive behavior and tensile strength level of concrete.
1. Introduction
Concrete structures may be subjected to severe loading conditions such as impact, blast, and seismic actions, which can induce cracking, fragmentation, and highly localized failure mechanisms. Under such conditions, predictive numerical modeling requires approaches capable of representing the initiation and propagation of discontinuities without prescribing crack paths in advance. Although continuum-based methods, particularly the finite element method, remain widely used in structural engineering, their classical formulations are not always well suited to the simulation of discrete fracture processes and material separation in quasi-brittle materials such as concrete [1].
The Discrete Element Method (DEM), originally introduced by Cundall and Strack for granular assemblies, provides an alternative framework in which the macroscopic response emerges from interactions between discrete particles [2]. Because cracking and fragmentation can be represented naturally through the degradation and rupture of inter-particle links, the DEM has become an attractive tool for modeling discontinuous and quasi-brittle materials. Recent studies have further confirmed the relevance of discrete and lattice-type approaches for simulating creep, damage evolution, fracture processes, and failure in concrete and other quasi-brittle materials [3,4,5,6,7].
For large-scale simulations, spherical particles are particularly appealing because they simplify contact detection and keep the computational cost at a manageable level. However, this geometrical simplification introduces an important limitation. In conventional force-based DEM formulations, the interaction between two spherical particles is transmitted through a normal force and a tangential force acting at, or close to, a point-like contact. Unless an additional contact-moment law is introduced, this interaction does not provide an intrinsic resistance to the relative rolling of the two particles. Under shear-dominated loading, the tangential relative motion can therefore be partly accommodated by particle rotation, which reduces the tangential deformation stored at the interaction and promotes rearrangement of the discrete assembly.
This behavior differs from that of real concrete mesostructures, in which aggregate angularity, surface roughness, mechanical interlocking, and finite contact areas hinder relative rotation and contribute to the transfer of shear and bending effects. Consequently, an assembly of perfectly spherical particles may exhibit excessive rolling, insufficient shear transfer capacity, and an unrealistically brittle macroscopic response, particularly in compression. This limitation has been widely recognized in DEM studies of materials whose real microstructure exhibits angularity or enhanced rotational resistance [8,9,10]. Rolling-resistance and contact-moment formulations have therefore been introduced to reproduce part of the mechanical effects associated with particle shape complexity. For the present quasi-static uniaxial simulations, the proposed formulation focuses on resistance to rolling in the plane normal to the interaction direction. The torsional or pivoting component about the interaction normal is not included, since its contribution is considered secondary for the loading conditions investigated here [8,9,10]. In particular, Zhao et al. [10] showed that rolling resistance can capture important aspects of the macroscopic response and induced anisotropy of granular assemblies, while also highlighting the influence of particle shape effects.
In the case of concrete, this limitation is particularly critical in uniaxial compression, where excessive local rolling may accelerate damage propagation and produce a post-peak response that is much more brittle than the experimentally observed behavior. Several strategies have been proposed to overcome this drawback, including the use of non-spherical particles, particle clusters, rotational constraints, and rolling-resistance or contact-moment laws. Among these options, rolling resistance provides a particularly attractive compromise because it improves the local transfer of rotational and shear effects [8,9,10,11]. At the same time, the predictive capability of the DEM strongly depends on the calibration of local constitutive parameters, which remains a key issue in simulations of concrete and quasi-brittle materials with the DEM [5,6].
In this context, the present study develops a three-dimensional DEM model for concrete in which an MTL is introduced to limit excessive rolling between interacting spherical elements. The proposed formulation combines cohesive and contact interactions with an elastoplastic rolling law defined at the local scale. The objective is to improve the compressive response of the model, particularly its post-peak ductility, while maintaining the computational advantages associated with spherical discretization. A calibration strategy is then proposed to identify both elastic and nonlinear parameters from quasi-static uniaxial compression and tension tests.
The model is applied to several concrete types, in order to assess its ability to reproduce elastic properties, compressive strength, tensile strength, and the compressive-to-tensile strength ratio characteristic of concrete. The results show that the proposed MTL significantly enhances compressive ductility while preserving a brittle tensile response consistent with the adopted modeling assumption, thereby providing a robust and computationally efficient framework for the quasi-static simulation of concrete.
The remainder of this paper is organized as follows. Section 2 presents the DEM framework, including the generation of the discrete assembly and the local interaction laws. Section 3 describes the calibration of the elastic and nonlinear parameters and discusses the limitations of the initial formulation. Section 4 introduces the MTL and its identification procedure. Section 5 presents the numerical results for different concretes and discusses the influence of the MTL on the macroscopic response.
2. Discrete Element Method
Concrete is modeled as a homogeneous, isotropic material at the macroscopic scale. The concrete material is modeled as an assembly of rigid spherical particles interacting through local cohesive and contact laws. This choice minimizes the computational cost and allows interactions between DEs to be handled with ease. These elements do not represent the actual mesoscale components of concrete (e.g., aggregates) but rather function at a higher-order scale to replicate the macroscopic behavior in both the linear and nonlinear regimes. Within the DEM, the mechanical response of the specimen results from the balance between external actions and the forces and moments transmitted at the interactions between neighboring particles. Each discrete element (DE) is treated as a rigid body whose translational and rotational motions are governed by Newton’s second law.
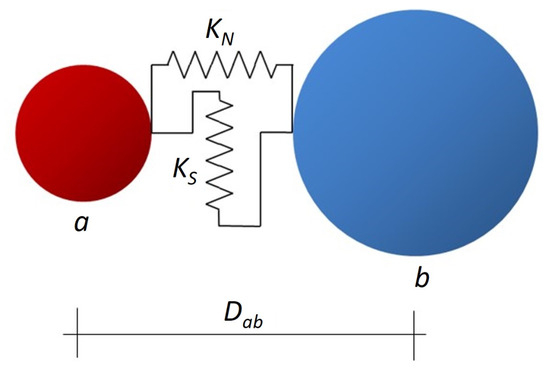
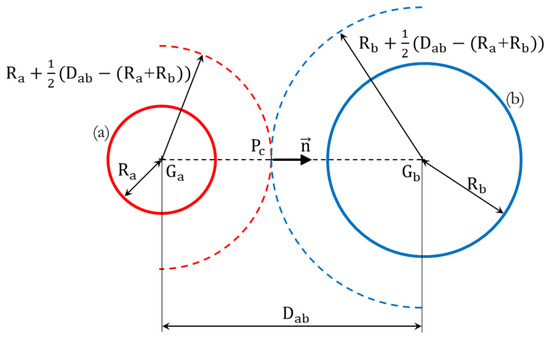
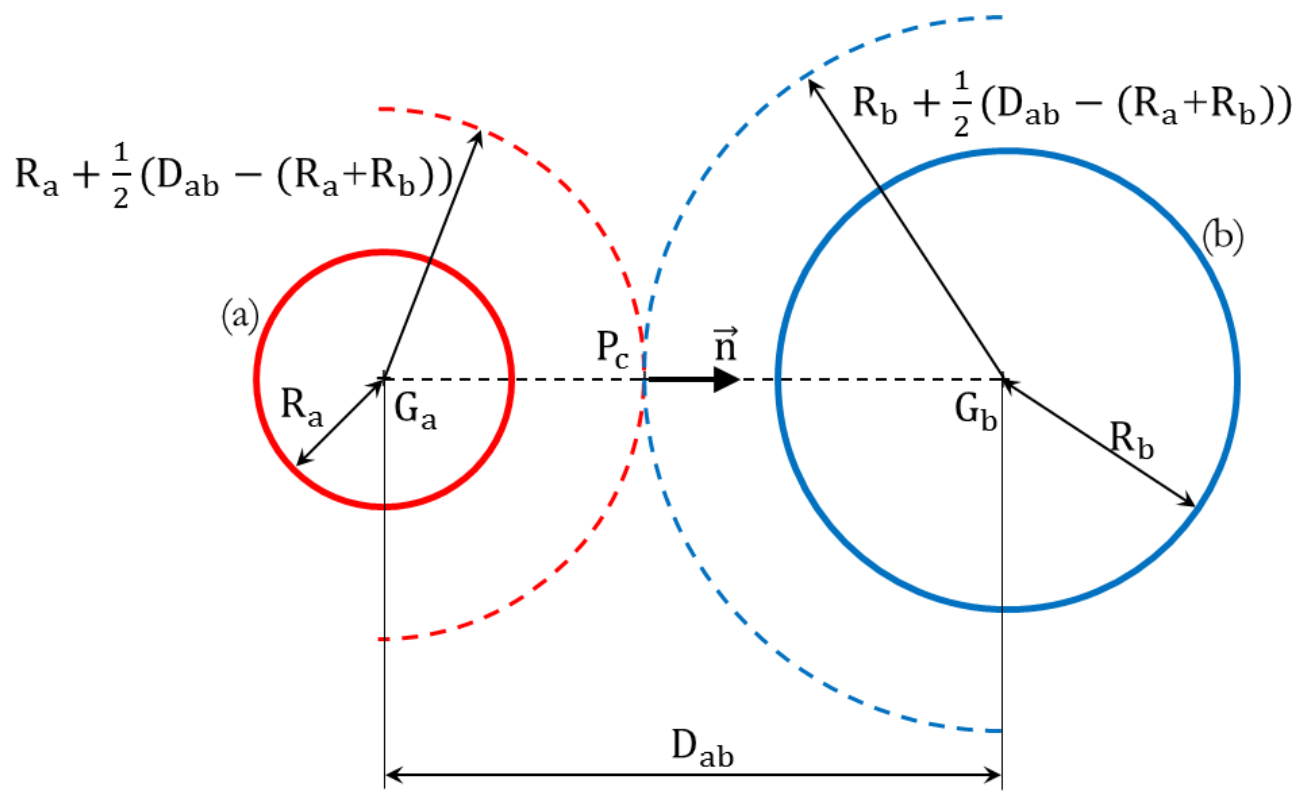
The main features of the DEM model used in this study were previously introduced by Frangin et al. [12] and Rousseau et al. [13]. Two types of interactions are considered between neighboring DEs: cohesive links and contact links. Cohesive interactions are defined at the initial state between two remote spheres a and b when Equation (1) is satisfied:
where λ (≥1) is the interaction coefficient, Ra and Rb are the radii of elements a and b, and is the distance between their centroids (Figure 1). These cohesive interactions provide the assembly with tensile strength, unlike the classical DEM formulation initially developed for cohesionless granular materials. Contact interactions, on the other hand, are created during the calculation when the geometrical contact condition between two elements is fulfilled (λ = 1). These links do not sustain tension; once the two spheres move away from each other, the contact link is considered broken. The present DEM model was implemented within Europlexus [14], a code dedicated to fast transient dynamic analyses involving structures and fluids.
Figure 1.
Cohesive interaction between DE a and b [15].
2.1. Creation of the Discrete Assembly
Since the modeled concrete is assumed to be homogeneous and isotropic at the macroscopic scale, the discretization procedure must preserve these properties as much as possible. A regular arrangement of identical spheres would lead to privileged interaction directions and therefore to spurious preferential crack paths. To avoid this drawback, disorder must be introduced both in the spatial arrangement of the elements and in their size distribution.
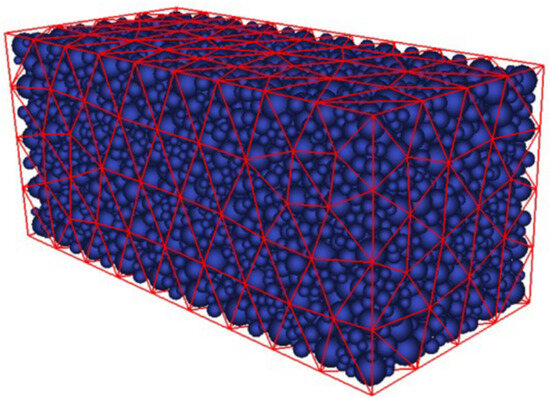
Several techniques are available in the literature to generate discrete assemblies, and they can be classified into two main families: dynamic methods [16,17] and geometric methods [18,19]. Dynamic methods generate the assembly by solving the equations of motion together with interaction laws, whereas geometric methods rely on geometrical constructions and packing rules. Because dynamic methods are computationally expensive for large-scale problems and are generally restricted to simple specimen geometries, a geometric packing algorithm based on a tetrahedral mesh is adopted here. This is the method initially proposed by Jerier et al. [18], in which a finite element tetrahedral mesh is first generated and then progressively filled with spheres until the target density is reached (Figure 2).
Figure 2.
Tetrahedral FE mesh with 4 tetrahedra per side filled by spherical elements [15].
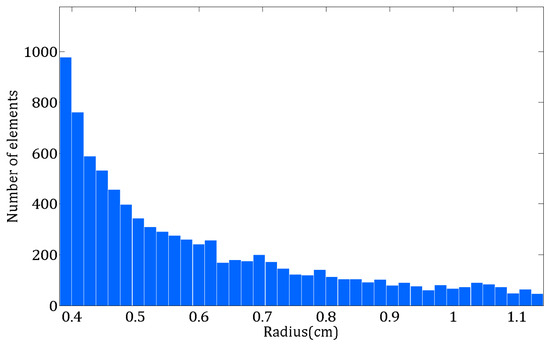
Some modifications were introduced into the original Jerier algorithm in order to better represent contour lines and corners. In addition, the ratio between the maximum and minimum radii was fixed to 3, which provides a reasonable compromise between computational cost and packing compactness. The mean radius of the discrete assembly is chosen as a function of the tetrahedral mesh size. This modified procedure provides better control of the particle-size distribution and compactness of the numerical samples (Figure 3).
Figure 3.
Size distribution of DEs in discretized sample using modified Jerier algorithm [15].
Because the particle assembly is generated from an initial tetrahedral finite element mesh, the geometrical adaptability of the packing procedure is directly governed by the ability of this mesh to represent the target domain. Consequently, the method is not restricted to prismatic specimens and can be applied to geometries involving curved boundaries, openings, or variable cross-sections, provided that these features are adequately resolved by the input tetrahedral mesh. The local particle distribution and the representation of small geometrical details nevertheless depend on the mesh quality and refinement.
2.2. Local Interaction Laws
The DEM formulation describes both the linear elastic and nonlinear behaviors of concrete at the local scale. In the elastic regime, the interaction between two DEs is governed by two local stiffnesses: the normal stiffness Kn and the tangential stiffness Ks (Figure 1).
These stiffnesses (Equation (2)) are related to the macroscopic elastic properties of concrete, namely Young’s modulus E and Poisson’s ratio ν, through micro–macro relations proposed by Hentz et al. [20] and inspired by the best-fit approximation proposed by Liao et al. [21].
where is the initial distance between the centers of elements a and b, and is the interaction area, defined as the minimum diametric plane surface of the two interacting spheres. The dimensionless parameters α, β, and γ depend on the arrangement of the discrete elements, the distribution of particle sizes, and the mean number of interactions per element, i.e., the coordination number. In the present work, the coordination number is set to 12. This value corresponds to the average number of links in a regular face-centered cubic packing and is adopted here to promote isotropy while limiting the computational cost [13]. Thus, after generating the DE assembly, the interaction coefficient λ (Equation (1)) is first identified such that the coordination number is 12.
The prescribed average coordination number of 12 is an idealized modeling choice rather than a direct representation of the actual contact distribution in concrete. It may affect the local force network and damage localization. Therefore, the present calibration and conclusions should be understood within the adopted discretization and interaction-generation strategy.
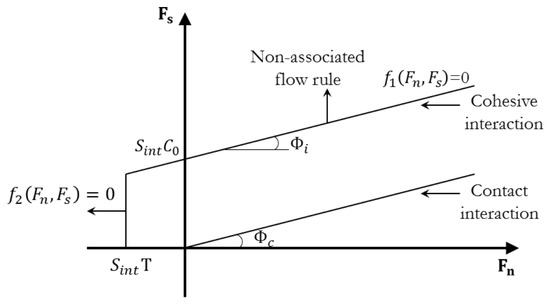
To describe the nonlinear behavior, two local criteria are introduced on the basis of a modified Mohr–Coulomb criterion (Figure 4). They are written as
where and are the normal and tangential interaction forces, is the local cohesion, T is the local tension cut-off, and is the local friction angle. The tensile threshold T controls tensile failure, the cohesion parameter C0 governs the shear strength of cohesive interactions, and the softening coefficient ζ controls the progressive degradation of the normal cohesive force after tensile damage.
Figure 4.
Modified Mohr-Coulomb criterion.
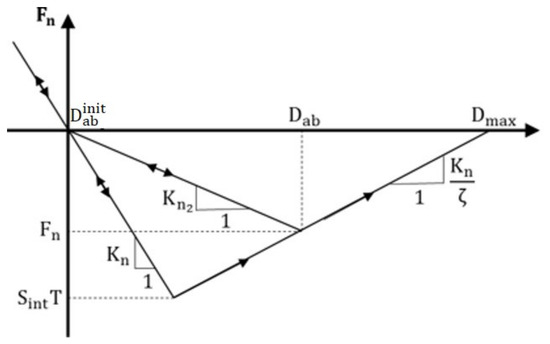
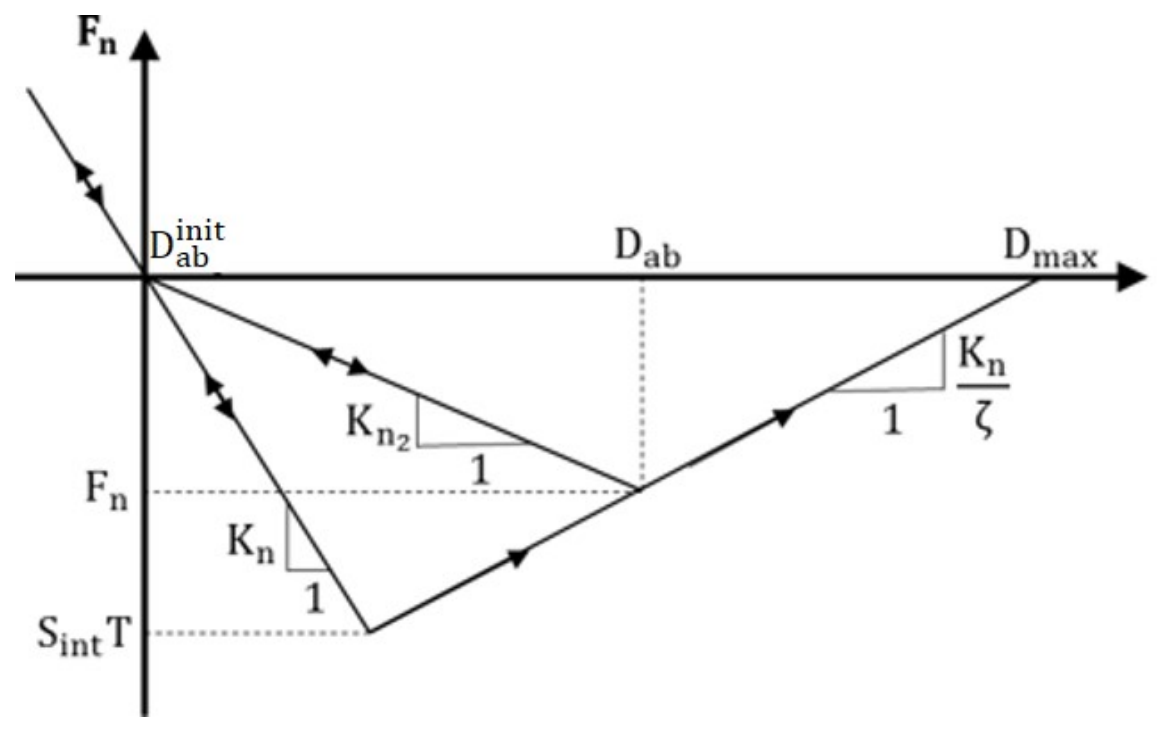
The first criterion of Equation (3) governs the shear strength of the interaction, whereas the second one controls tensile failure. In addition, the local tensile behavior ( includes a softening factor ζ, which allows for a progressive attenuation of the normal force before complete rupture of the cohesive link (Figure 5). This softening law is essential for representing the progressive degradation of concrete under tensile loading.
Figure 5.
Constitutive model for the normal interaction.
, the current distance between the centers of elements a and b, varies between and at failure. Damage of the cohesive link is characterized by the current elastic stiffness Kn2 that varies from the initial stiffness Kn to zero at failure. A contact interaction may develop between DE a and b with a friction governed by the friction angle . The constitutive behavior is considered as linear elastic under compression () in the present study. To describe compaction under high mean stress, the compressive behavior can be modeled as elastoplastic with hardening. Accounting for compaction is essential to model concrete response under hard impact [22]. A large number of experimental studies of concrete under triaxial compression at high confining pressure have been carried out at laboratory 3SR of Université Grenoble Alpes [23,24,25,26] and modeled with the present DEM model [27,28,29,30,31]. These studies are beyond the scope of the present study and are not presented.
Overall, the local formulation presented in this paper allows the DEM assembly to reproduce the main features of concrete behavior, namely elastic response, strength in tension and shear, and progressive degradation of cohesion. However, as will be shown in the following sections, this formulation alone remains insufficient to reproduce a realistic compressive post-peak response when spherical elements are used. This limitation motivates the introduction of the Moment Transfer Law (MTL), presented in Section 4.
3. Calibration of the Base DEM Model
3.1. Representative Specimen and Modeling Strategy
The DEM model is intended to reproduce the macroscopic behavior of concrete while keeping the computational cost compatible with future structural-scale applications. Direct identification of the model parameters at the scale of a full structure would require an excessively large number of discrete elements. Therefore, the calibration procedure is performed at an intermediate scale by considering a representative concrete specimen extracted from the structure. This intermediate-scale strategy makes it possible to identify the model parameters on a specimen that remains computationally tractable while preserving the essential macroscopic response of the material. The model parameters are identified from quasi-static uniaxial compression and tension simulations.
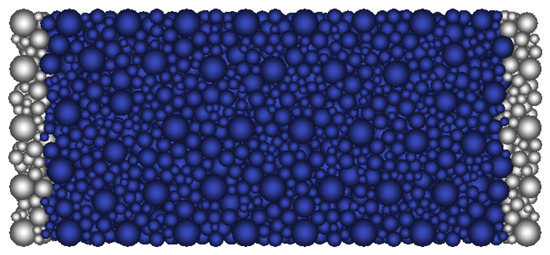
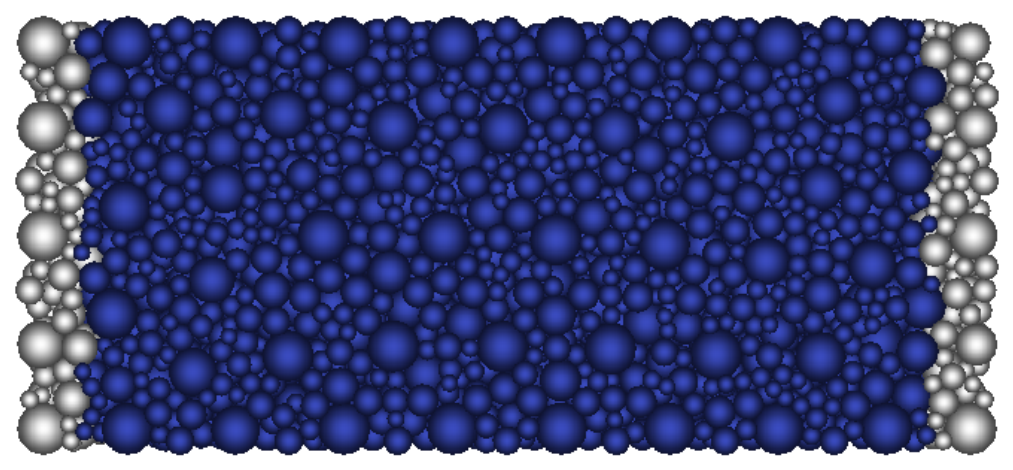
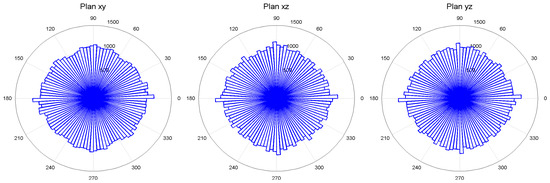
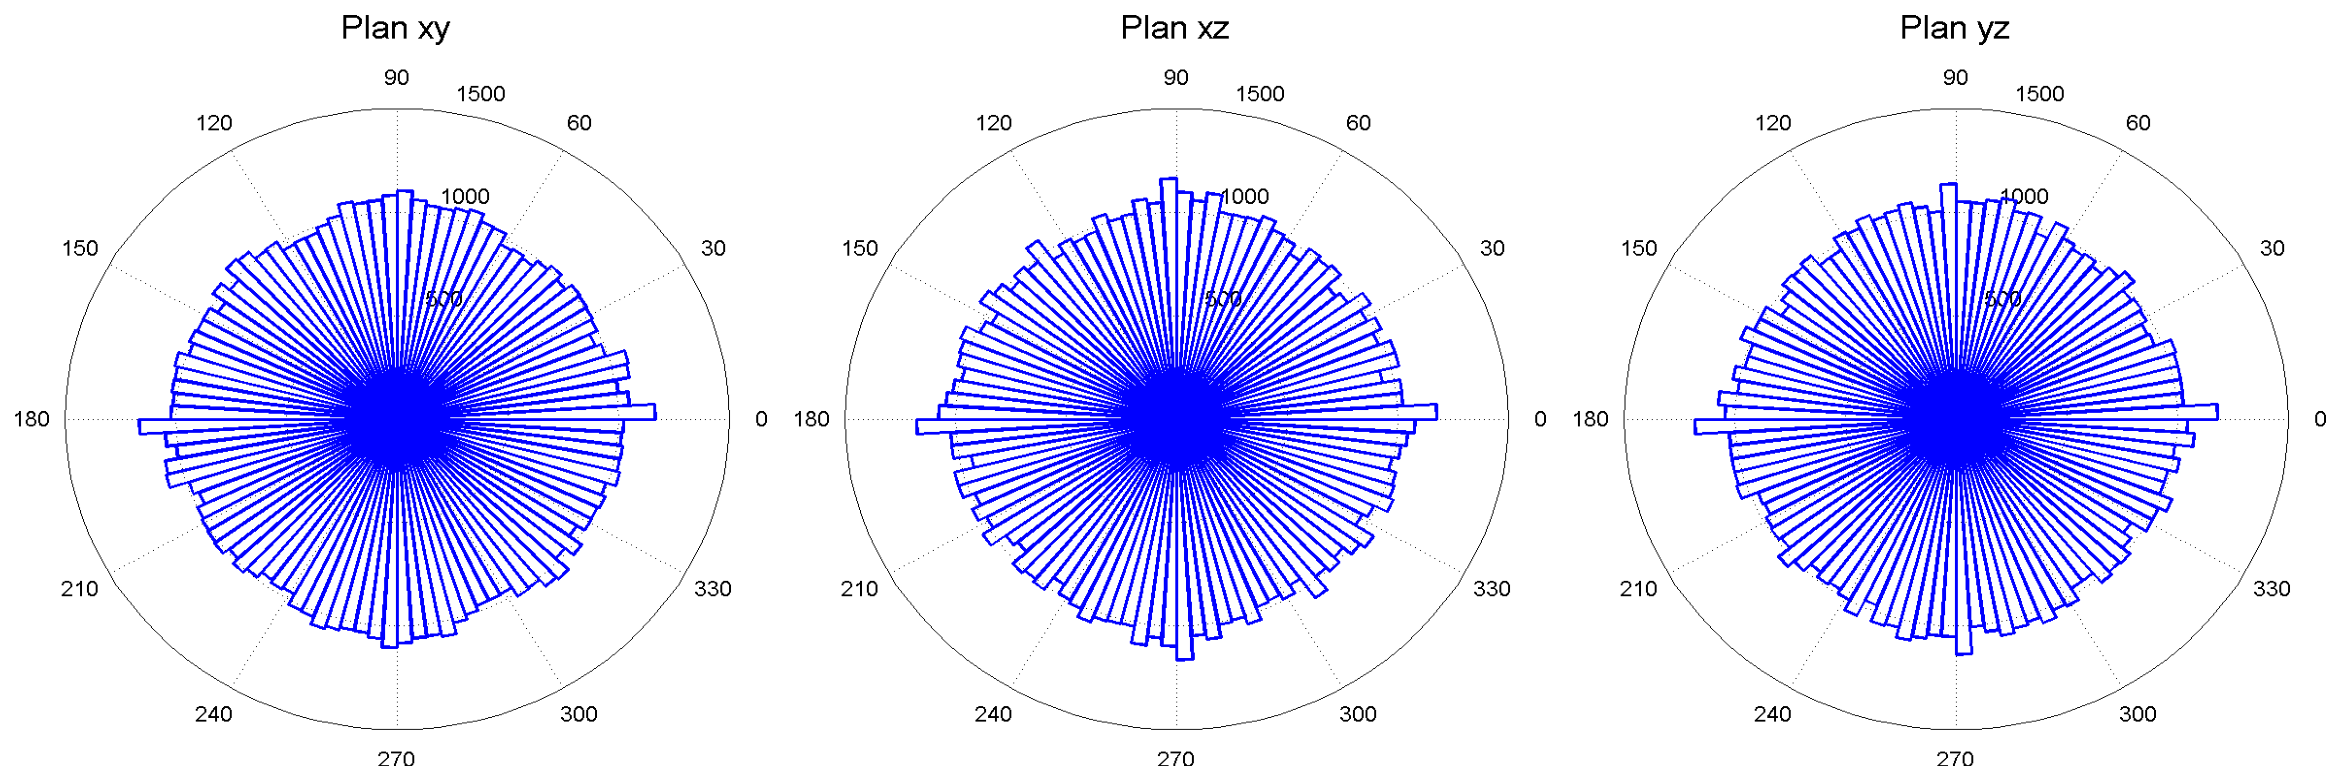
The specimen is modeled as a rectangular parallelepiped with dimensions 0.45 × 0.20 × 0.20 m3. The influence of specimen size and discretization is discussed later through the sensitivity analyses reported in Table 1 and Table 2. Two DE platens are used to prescribe the displacement along the x axis, so that the net specimen length is 0.40 m (Figure 6). The reference discretization is generated from a finite element mesh containing four tetrahedra over the two specimen widths (Figure 2). The resulting assembly contains 8630 DEs, with a mean radius of 0.6 cm and a compactness equal to 0.6. The isotropy of the assembly is verified from the distribution of interaction directions projected onto the three orthogonal planes. No privileged direction is observed, which indicates that the specimen is sufficiently isotropic for parameter identification (Figure 7).
Table 1.
Influence of discretization refinement.
Table 2.
Influence of specimen size and geometry.
Figure 6.
DE specimen for uniaxial tests with two platens where axial displacement is prescribed.
Figure 7.
Distribution of interaction directions projected on the planes xy, xz and yz.
Macroscopic strains are obtained by averaging the strain values over the DEs, excluding those located near the specimen edges and on the neutral axis in order to avoid unstable or non-representative local kinematics.
3.2. Identification of the Elastic Behavior Parameters
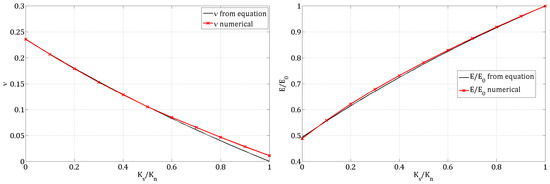
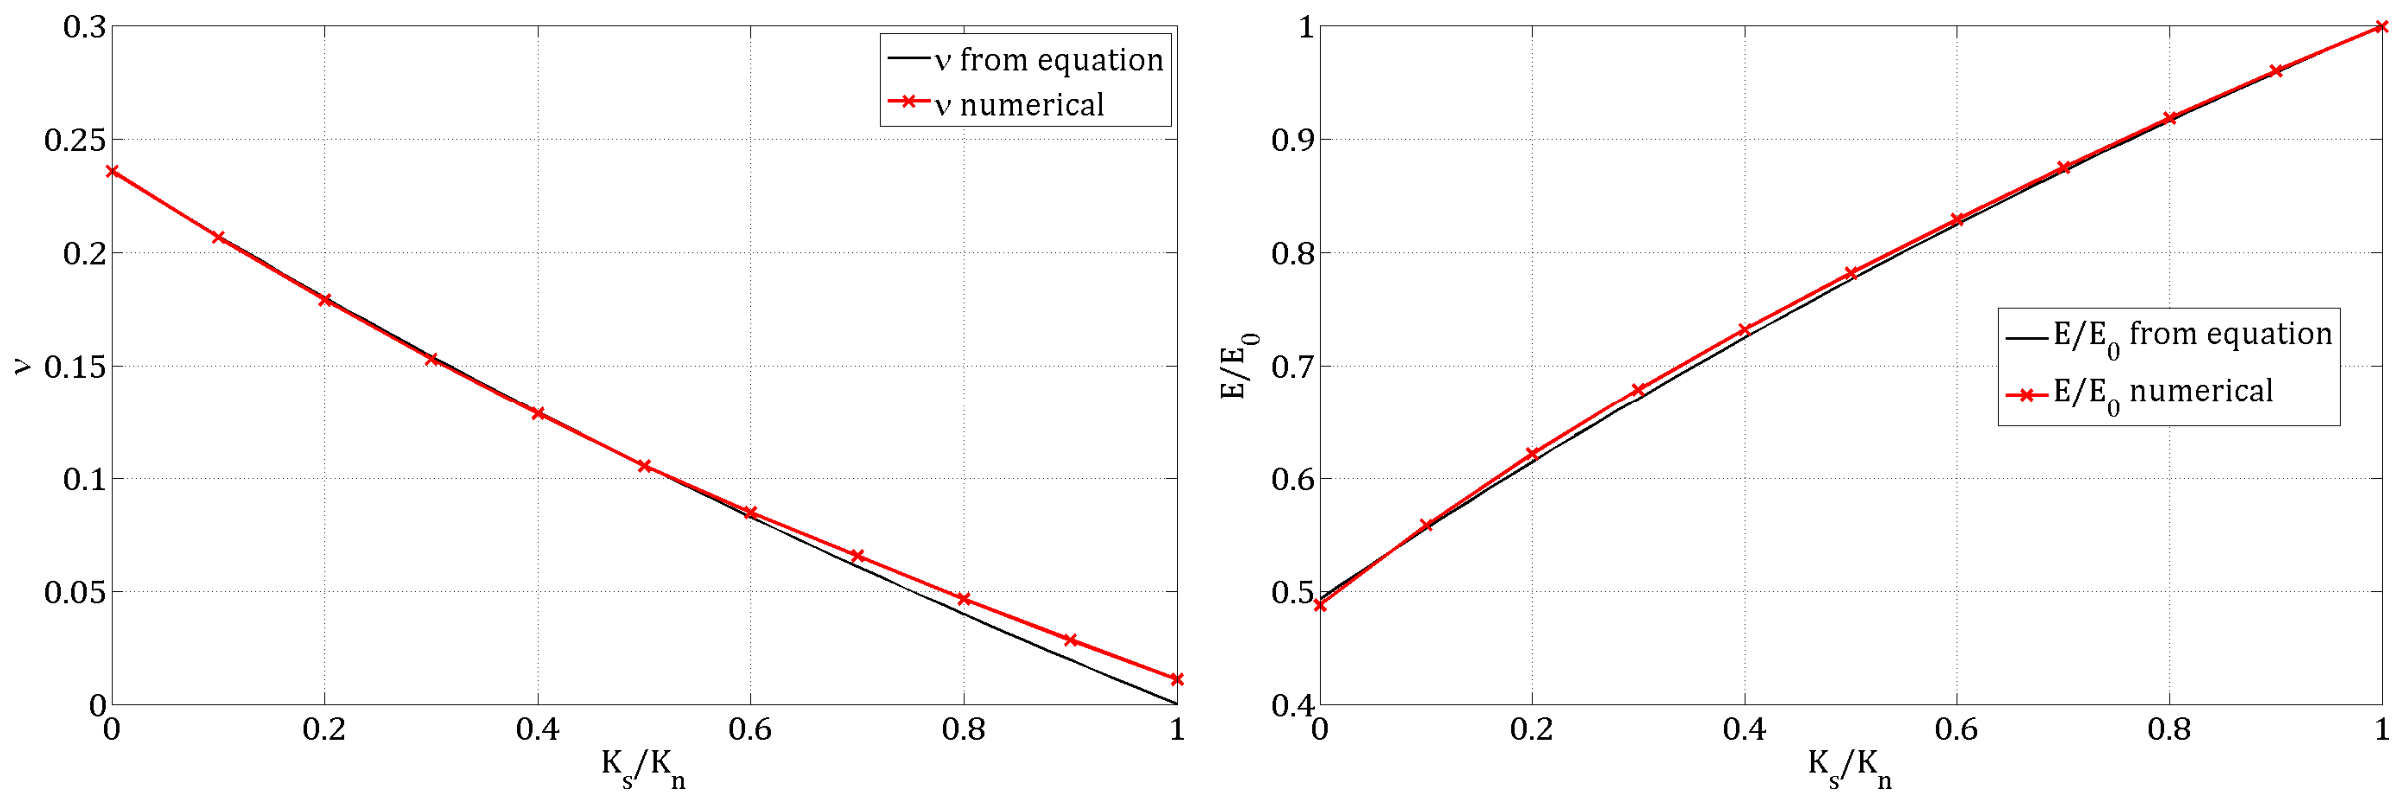
The first step of the calibration consists of adjusting the interaction coefficient λ so that the coordination number is equal to 12. Once this value is reached, the elastic parameters are identified by simulating uniaxial tests while varying the ratio involved in Equation (2). The parameters α, β, and γ are then calibrated so that numerical Young’s modulus E and Poisson’s ratio ν match the target macroscopic values. In this procedure (Figure 8), the stiffness ratio is varied from 0 to 1, and represents Young’s modulus when the ratio is equal to 1.
Figure 8.
Identification of DEM elasticity parameters for Poisson’s ratio ν (left) and Young’s modulus E (right).
This identification procedure of elastic behavior parameters led to the values α, β, and γ reported in Equation (4).
The robustness of this calibration was then verified for different discretization refinements and specimen geometries. The results showed that the target elastic properties E = 30 GPa and ν = 0.2 were reproduced with limited relative errors for the discretizations and sample dimensions reported in Table 1 and Table 2.
The relative error remained limited for both E and ν, which confirms that the selected specimen is representative of the macroscopic elastic response and that the calibrated parameter set can be used beyond a single geometry.
3.3. Identification of the Nonlinear Behavior Parameters of the Base Model
Once the elastic parameters have been identified, the parameters of the nonlinear base DEM model, namely T, C0, and ζ, are calibrated in order to reproduce the quasi-static uniaxial compressive and tensile behavior of concrete. The tensile parameters T and ζ are identified from tension simulations, whereas C0 is adjusted from uniaxial compression simulations.
The calibration is performed for three concrete types: an ordinary concrete denoted R30A7 under dry and wet (42% water saturation) conditions and another concrete denoted C50 with a higher compression strength [23,24]. Their target macroscopic properties are summarized in Table 3 in terms of Young’s modulus E, Poisson’s ratio ν, compressive strength fc, and tensile strength ft. Because the available experimental data mainly include compression stress–strain curves and tensile strengths obtained from splitting tests, the tensile response is reproduced under the assumption of a rather brittle behavior in direct tension.
Table 3.
Concrete type properties [23,24].
The values of Young’s modulus E, Poisson’s ratio ν, compressive strength fc, and splitting tensile strength ft reported in Table 3 are experimental mean values of two tests for each concrete and selected as calibration targets for the DEM model. They are not characteristic values derived from design codes or regulatory provisions.
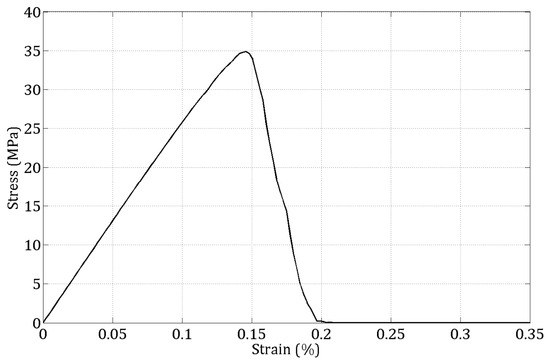
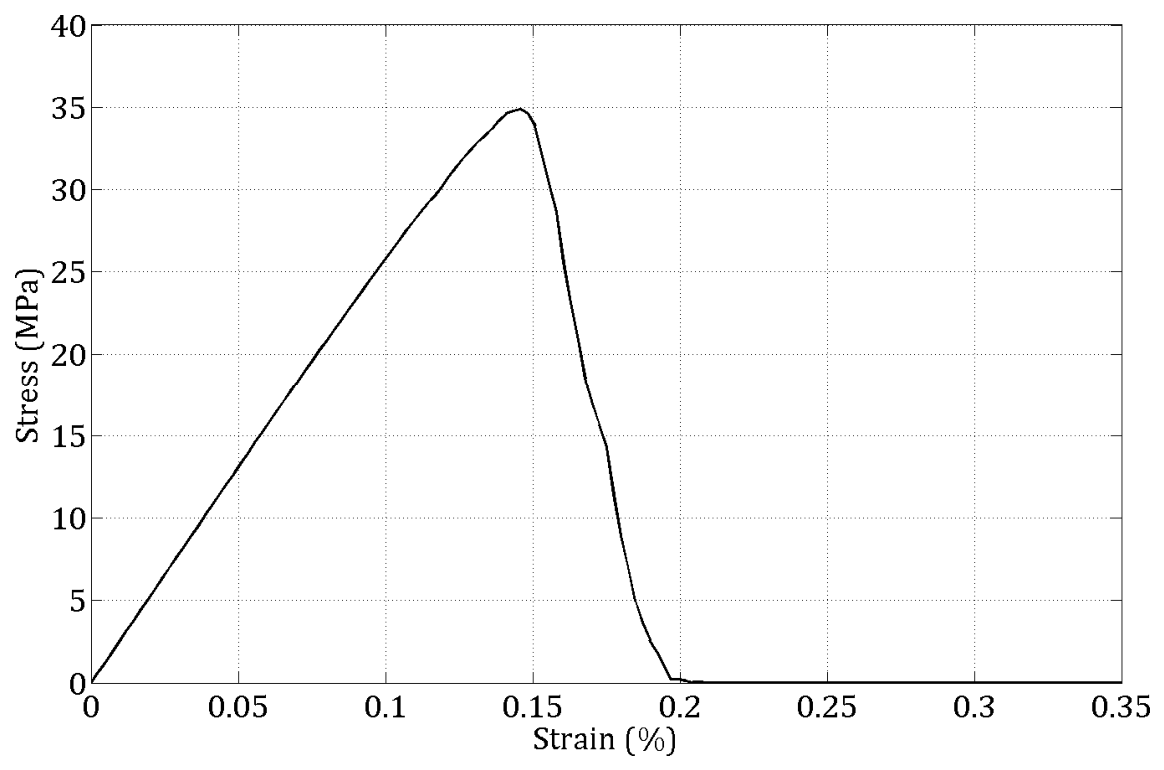
However, even after calibration of T, C0, and ζ, the base DEM model still exhibits an excessively brittle post-peak response in compression (Figure 9). This limitation motivates the introduction of an additional rolling-resistance mechanism, namely the Moment Transfer Law presented in the next section.
Figure 9.
DEM stress–strain uniaxial compression response.
4. Moment Transfer Law for Concrete
4.1. Motivation
The compression response obtained with the base DEM model shows a steep post-peak stress drop, which is not representative of the actual ductile degradation observed in concrete under uniaxial compression (Figure 9).
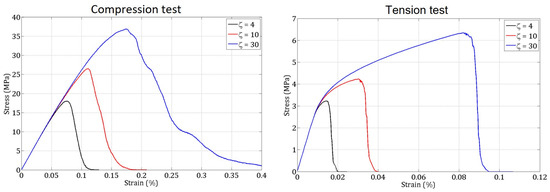
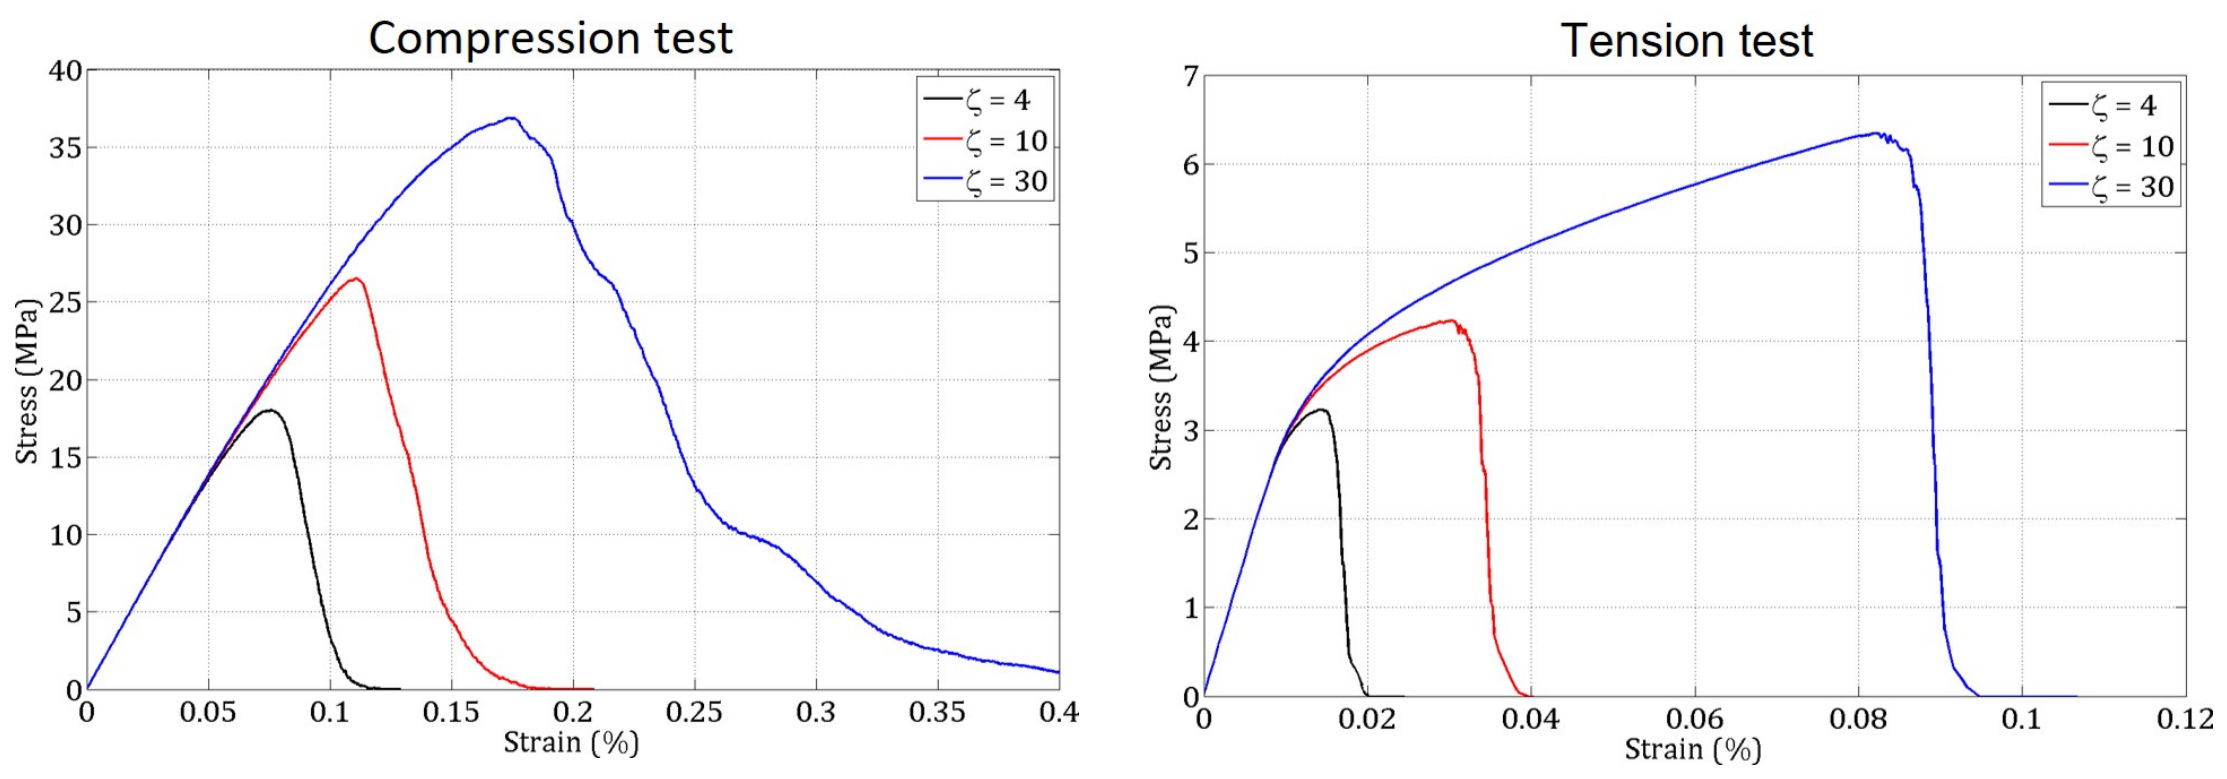
Increasing the softening parameter ζ can reduce this brittleness, but it also induces an unrealistic plastic-like behavior in tension (Figure 10).
Figure 10.
Influence of softening coefficient ζ on the compression and tension stress–strain curves.
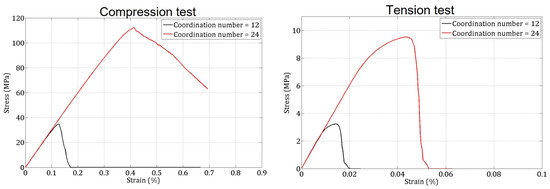
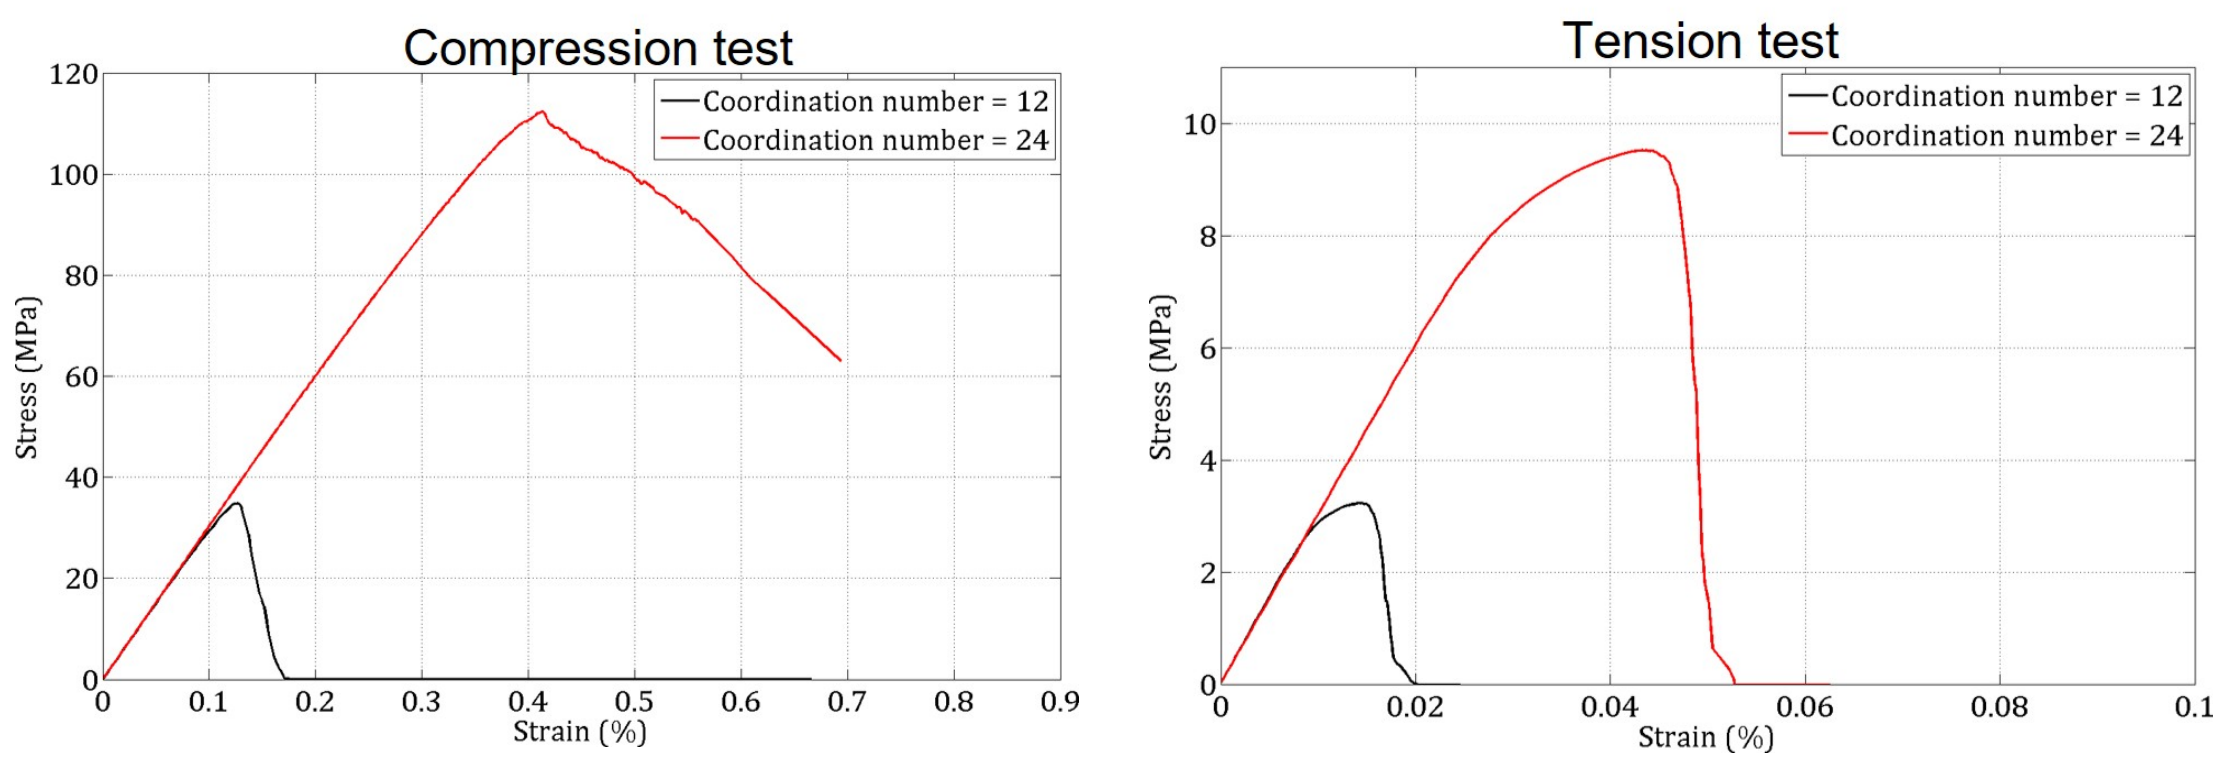
Likewise, increasing the coordination number, through the interaction coefficient λ, improves compressive ductility, but at the expense of a much higher computational cost and without preserving a realistic compressive-to-tensile strength ratio (Figure 11).
Figure 11.
Influence of the coordination number on the compression and tension stress–strain curves.
These observations indicate that the limitation of the base model mainly arises from the excessive rolling of spherical elements under shear-dominated loading. To overcome this drawback while preserving the numerical efficiency of spherical discretizations, a Moment Transfer Law (MTL) is introduced at the interaction scale.
4.2. Rolling Kinematics Between Two Elements
For clarity, only the quantities required for the definition of the rolling angle are introduced here.
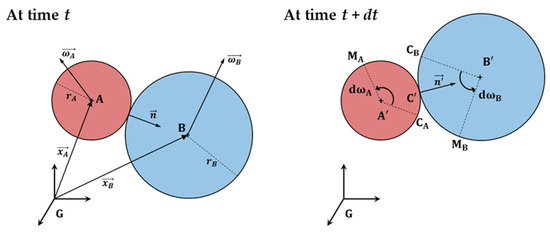
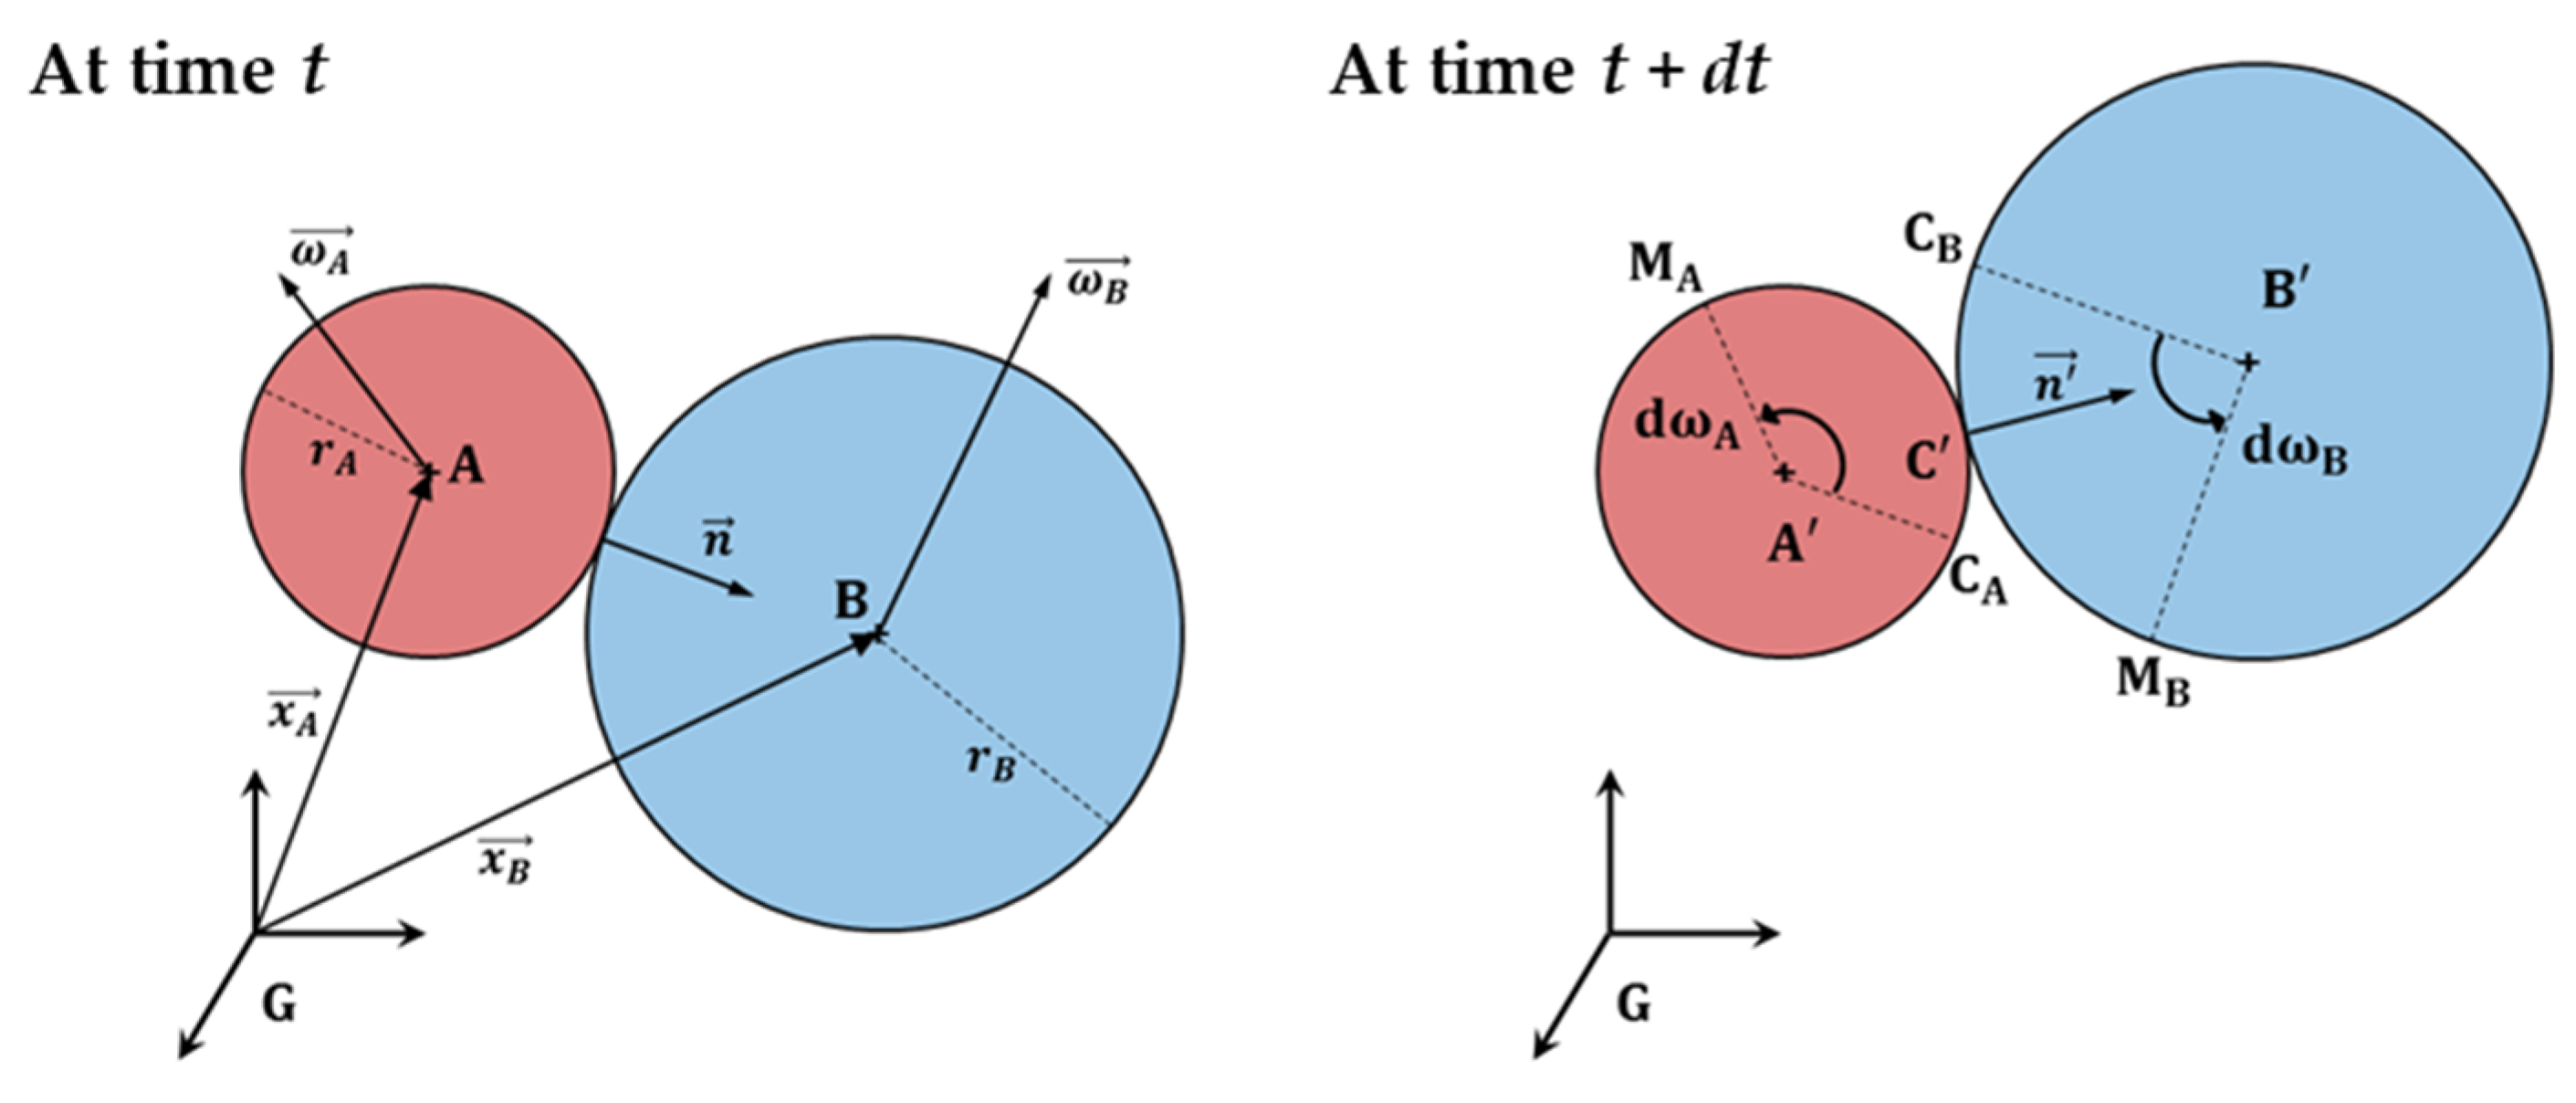
The MTL is formulated at the interaction level between two DEs. In the present formulation, because the assembly is polydisperse, the rolling kinematics must account for different particle sizes. The MTL equations are expressed in the global coordinate system G. Consider two interacting elements a and b, whether linked by contact or by cohesion (Figure 12 and Figure 13). Their radii are and , in the case of a contact link. In the case of a cohesive link, a fictitious contact point Pc is defined and radii and must be considered.
Figure 12.
Evolution of contact between two DEs during a time step.
Figure 13.
Determination of contact point Pc for a cohesive link.
At time t, their positions are defined by the vectors and , while their rotations are described by and . Their angular velocity vectors are denoted and , and the corresponding rotational increments during a time step are and . The normal unit vector between the two elements is denoted oriented from a to b. After one time step, the updated contact point and the updated normal vector are denoted C′ and .
The rolling calculation must account for both the rotational and sliding components of the relative motion. In a monodisperse assembly, the incremental rolling vector can be obtained directly from the differential motion of the two particles. In the present case, the packing is polydisperse, and the incremental rolling vector is calculated by averaging the rolling contributions associated with the two interacting elements (Equation (5)). The corresponding incremental rolling angle vector is then deduced from this rolling vector (Equation (6)). The total angular rolling vector is obtained by summing the incremental angular rolling vectors from the creation of the interaction. Since only rolling resistance is considered in the MTL formulation, while torsion torque transfer is neglected, the vector is projected onto the plane perpendicular to the normal vector (Equation (7)). The norm of this projected vector is then used to calculate the resistant moment associated with rolling.
4.3. Elastoplastic Constitutive Law of the MTL
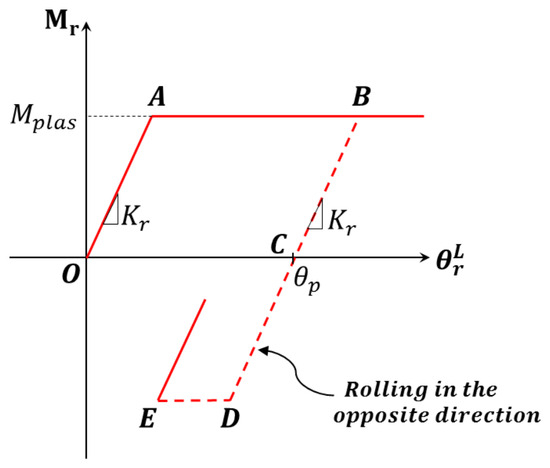
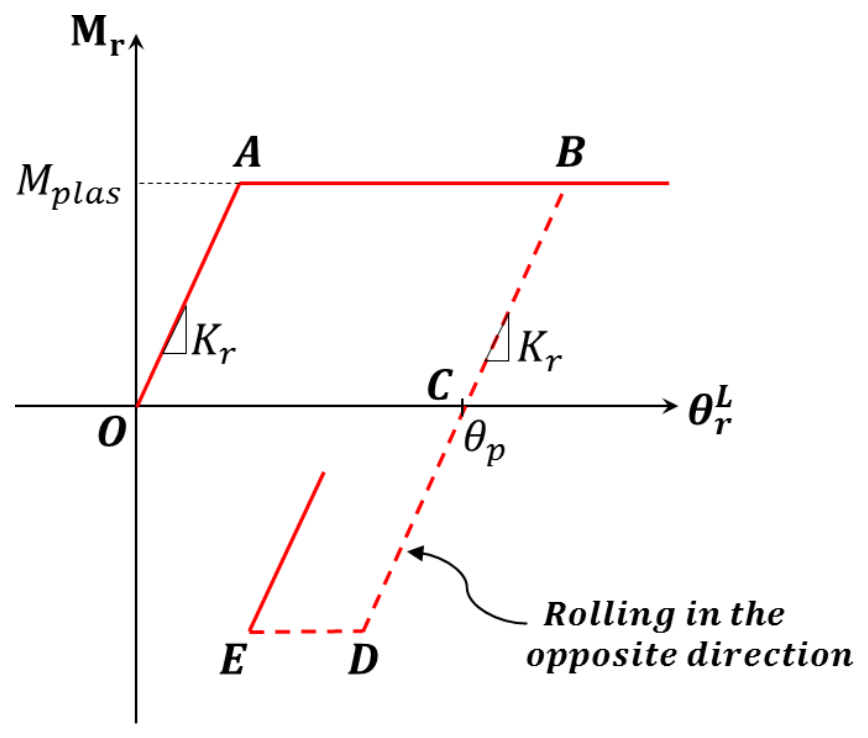
The MTL introduces both an elastic resistance to rolling and a plastic limit beyond which irreversible rolling develops. Its elastic branch is governed by the rolling stiffness Kr, while the plastic branch is controlled by a limiting rolling moment Mplas, which defines the maximum rolling-resistance moment that can be sustained by the interaction (Figure 14). Upon unloading from the plastic regime, the response follows a linear path of slope Kr, leading to an irreversible rolling angle. The constitutive law also accounts for rolling in the opposite direction, which allows cyclic effects to be represented.
Figure 14.
Elastoplastic constitutive behavior law associated with the MTL.
Once the projected rolling angle is known, the norm of the rolling-resistance moment can be determined assuming isotropic hardening in the contact plane. The elastic moment Mel is written as a function of the rolling stiffness Kr and the difference between the total projected rolling angle and the irreversible rolling angle (Equation (8)). The rolling-resistance moment vector is then obtained in the direction of the unit vector associated with the projected rolling angle (Equation (9)).
The MTL is governed by two parameters, defined through an analogy with an equivalent beam connecting the two interacting elements of a cohesive link. This beam is assumed to have a circular section of radius r (Equation (10)) and a length .
The rolling stiffness is assumed to be proportional to the bending stiffness of this equivalent beam. Under the assumption of small deformations, the bending moment is related to Young’s modulus E, the quadratic moment of inertia , and the relative angular rolling between the two DEs. Introducing a dimensionless coefficient , the rolling stiffness is defined so as to control the elastic rolling response (Equation (11)).
Similarly, the plastic rolling threshold is determined by considering the local tensile limit T as the maximum tensile stress in the equivalent beam section corresponding to the plastic moment. A second dimensionless coefficient η is introduced to weight this plastic threshold according to the concrete type to be reproduced.
As a result, the MTL is fully governed by the pair of parameters (, η). When the MTL is included, the complete nonlinear behavior of the DEM model is therefore controlled by five parameters: T, C0, ζ, , and η.
4.4. Identification of the Linear Behavior with the MTL
Because the coefficient controls the elastic rolling stiffness, the linear DEM parameters must be recalibrated when the MTL is introduced. By contrast, the parameter η does not affect the elastic response because the plastic branch of the MTL is not activated in the elastic regime. The elastic parameters α, β, and γ were therefore recalibrated for , and the relative errors in the reproduction of the target properties E = 30 GPa and ν = 0.2 were then evaluated for different values of .
The results reported in Table 4 show that the new elastic parameter set remains valid for values up to 50. Within this range, the reproduction error for both the Young’s modulus and Poisson’s ratio remain below 3%.
Table 4.
The influence of on the reproduction of the elastic properties ().
4.5. Identification of the Nonlinear Behavior with the MTL
With the MTL, the nonlinear response depends on five parameters: T, C0, ζ, , and η. The influence of T, C0, and ζ had already been identified for the base model [13], whereas the specific role of the MTL parameters is investigated in the present study. To this end, a sensitivity analysis was carried out on concrete C50 by fixing preliminary values of T, C0, and ζ (T = 4 MPa, C0 = 12 MPa, and ζ = 12), and then varying and η separately (Figure 15).
Figure 15.
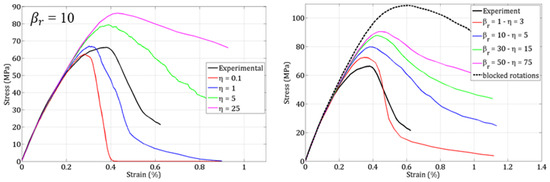
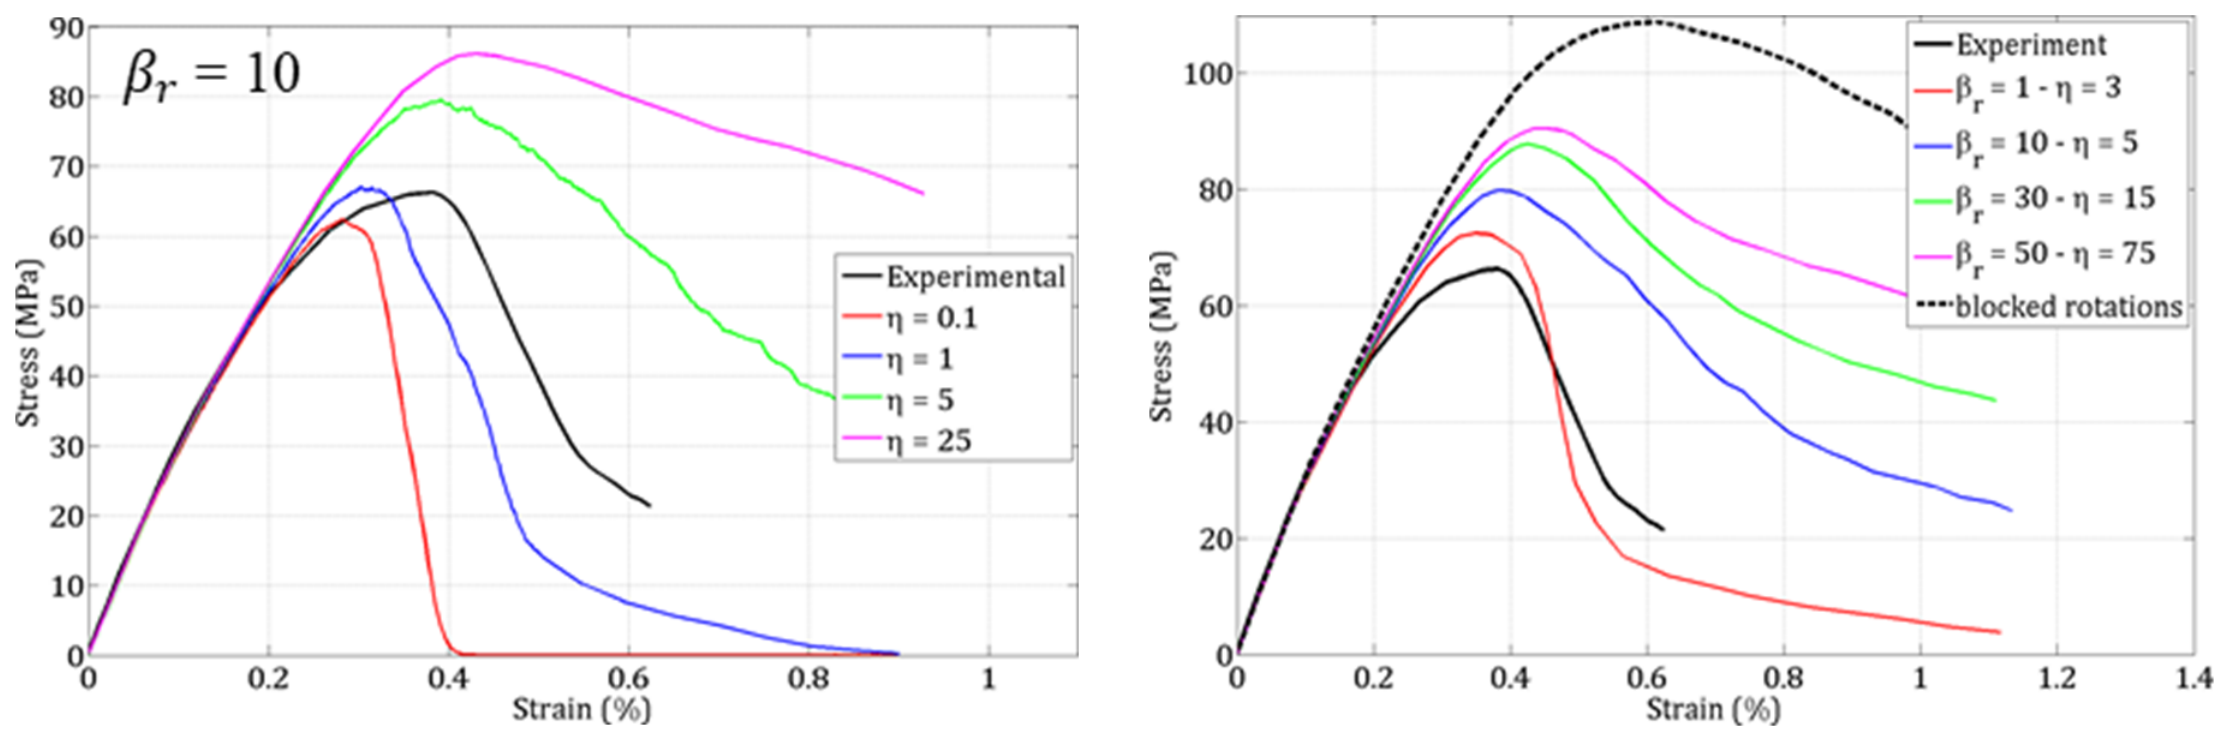
Influences of and η on compressive behavior of concrete with MTL.
For a fixed value of , increasing η leads to a higher compressive strength and makes the post-peak branch less abrupt. This indicates that a higher plastic rolling threshold allows for stronger moment transfer and delays the degradation process. However, this effect progressively saturates as η increases. For a fixed value of η, increasing increases the stress peak and makes the compressive response approach the limiting case of blocked rotations. Thus, mainly controls the elastic resistance to rolling, whereas η governs the plastic rolling threshold and hence the extent of ductility enhancement in compression.
Based on these results, the values and η were selected as a suitable compromise for reproducing the compressive ductility of concrete while maintaining a manageable identification procedure. Once these two parameters are fixed, the remaining nonlinear parameters are calibrated sequentially. First, ζ and T are calibrated from uniaxial tension simulations. Then, the cohesion parameter C0 is identified from uniaxial compression.
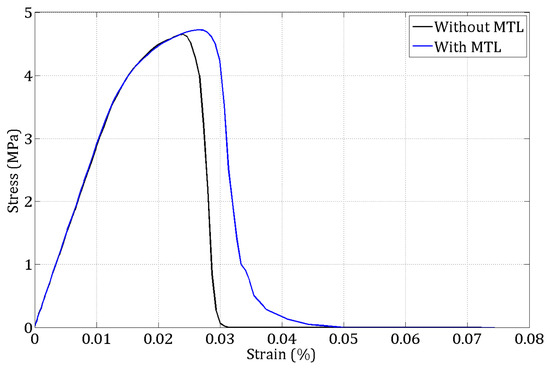
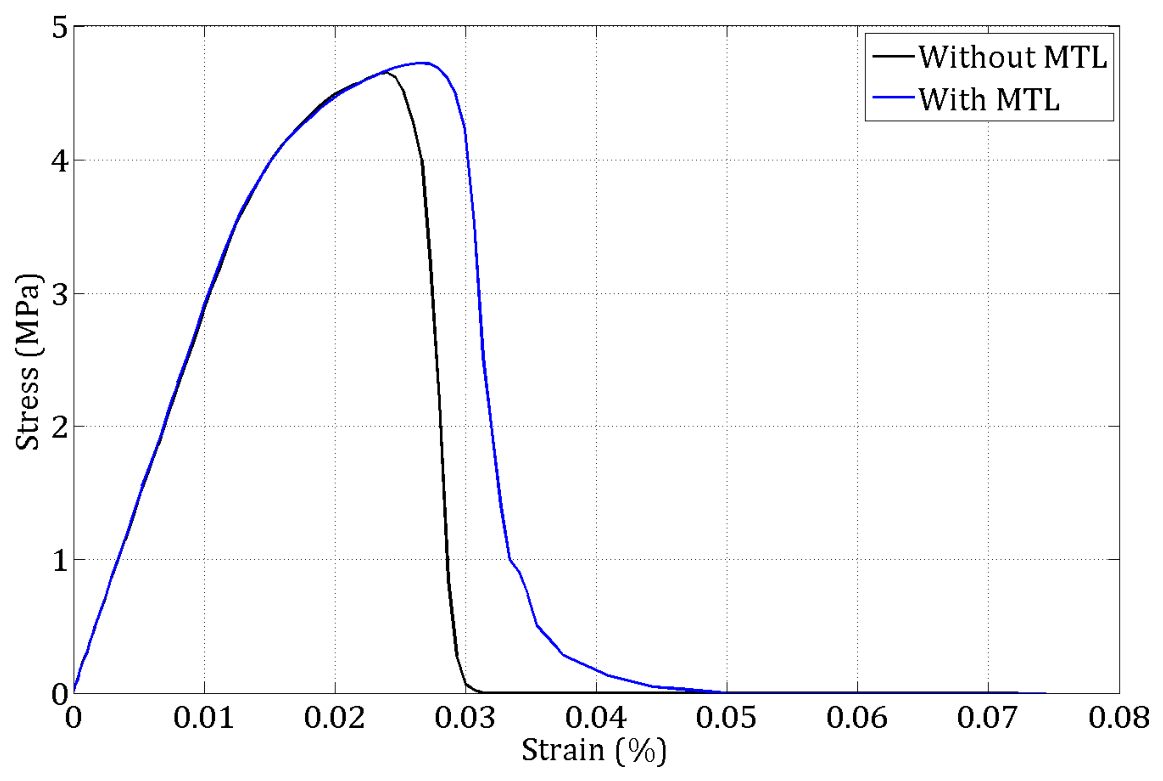
The effect of the MTL on tensile behavior shown in Figure 16 remains limited: the tensile peak increases only slightly, and the post-peak branch is only marginally modified. This is consistent with the fact that relative rolling plays a much smaller role in tension than in compression. Therefore, the MTL mainly improves the compressive response while having only a limited influence on the simulated tensile response and a high compressive-to-tensile strength ratio.
Figure 16.
Influence of MTL on tensile test response of concrete.
5. Results and Discussion
5.1. Identification Results for Different Concrete Types
The proposed calibration strategy was applied to the three concrete types considered in this study. These concretes were widely studied under quasi-static or dynamic loading at the 3SR laboratory, Université Grenoble Alpes.
The capacity of the model to reproduce the elastic parameters E and ν is demonstrated with quantitative error criteria as shown in Table 1, Table 2 and Table 4.
The identified values of parameters influencing the nonlinear behavior are reported in Table 5.
Table 5.
Identified parameters of nonlinear behavior for three concrete types.
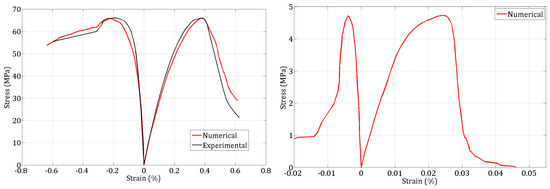
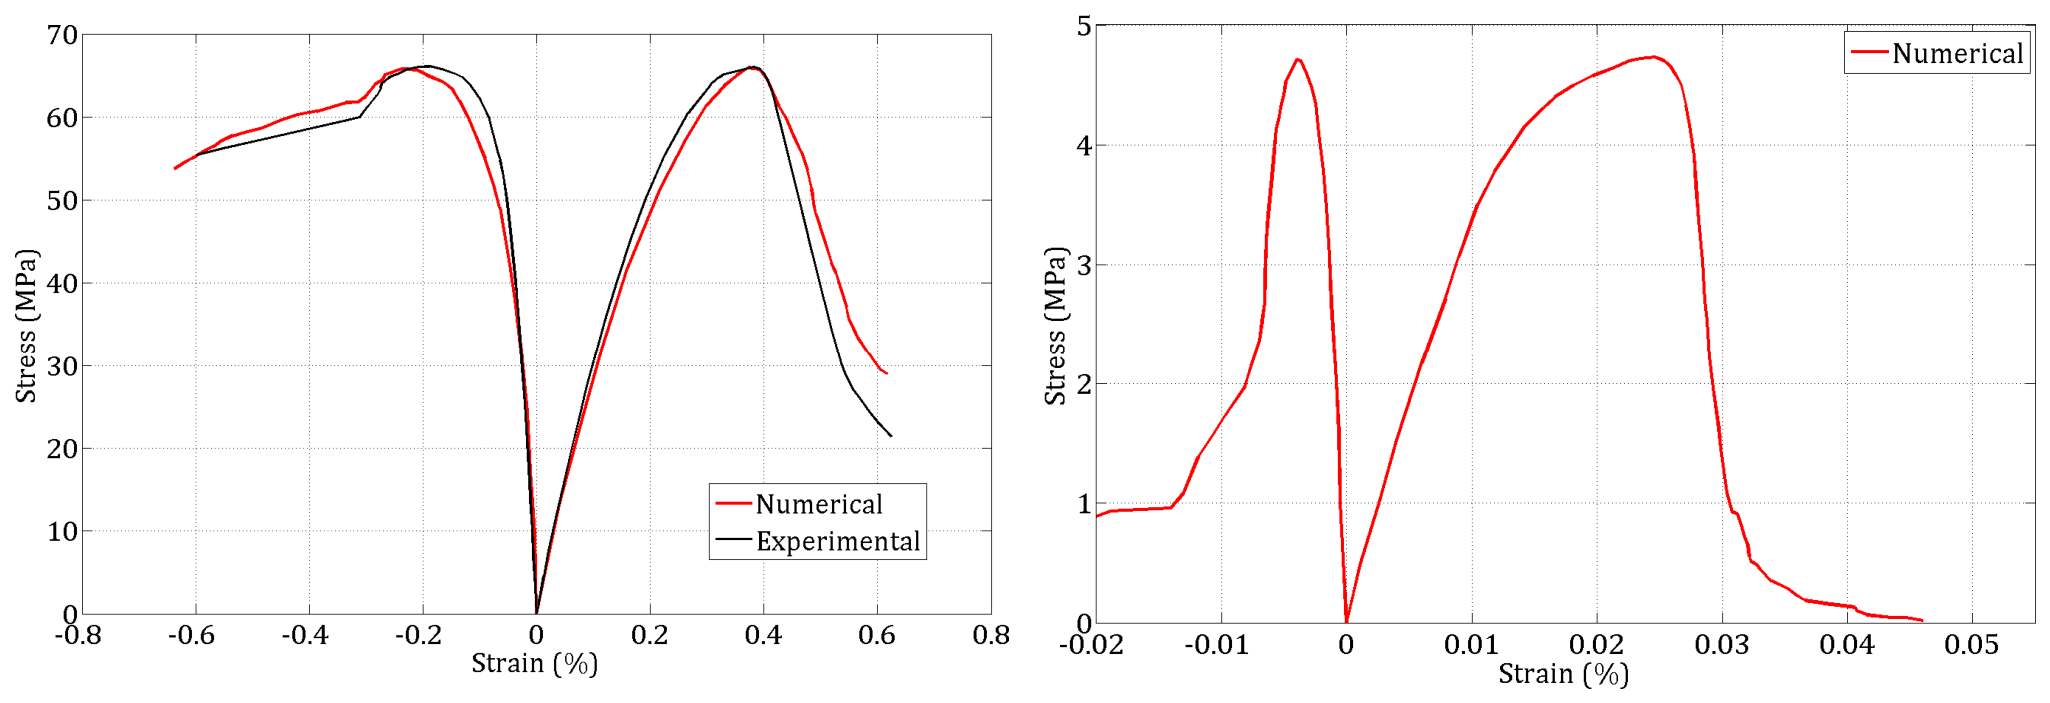
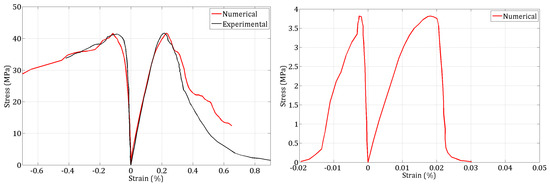
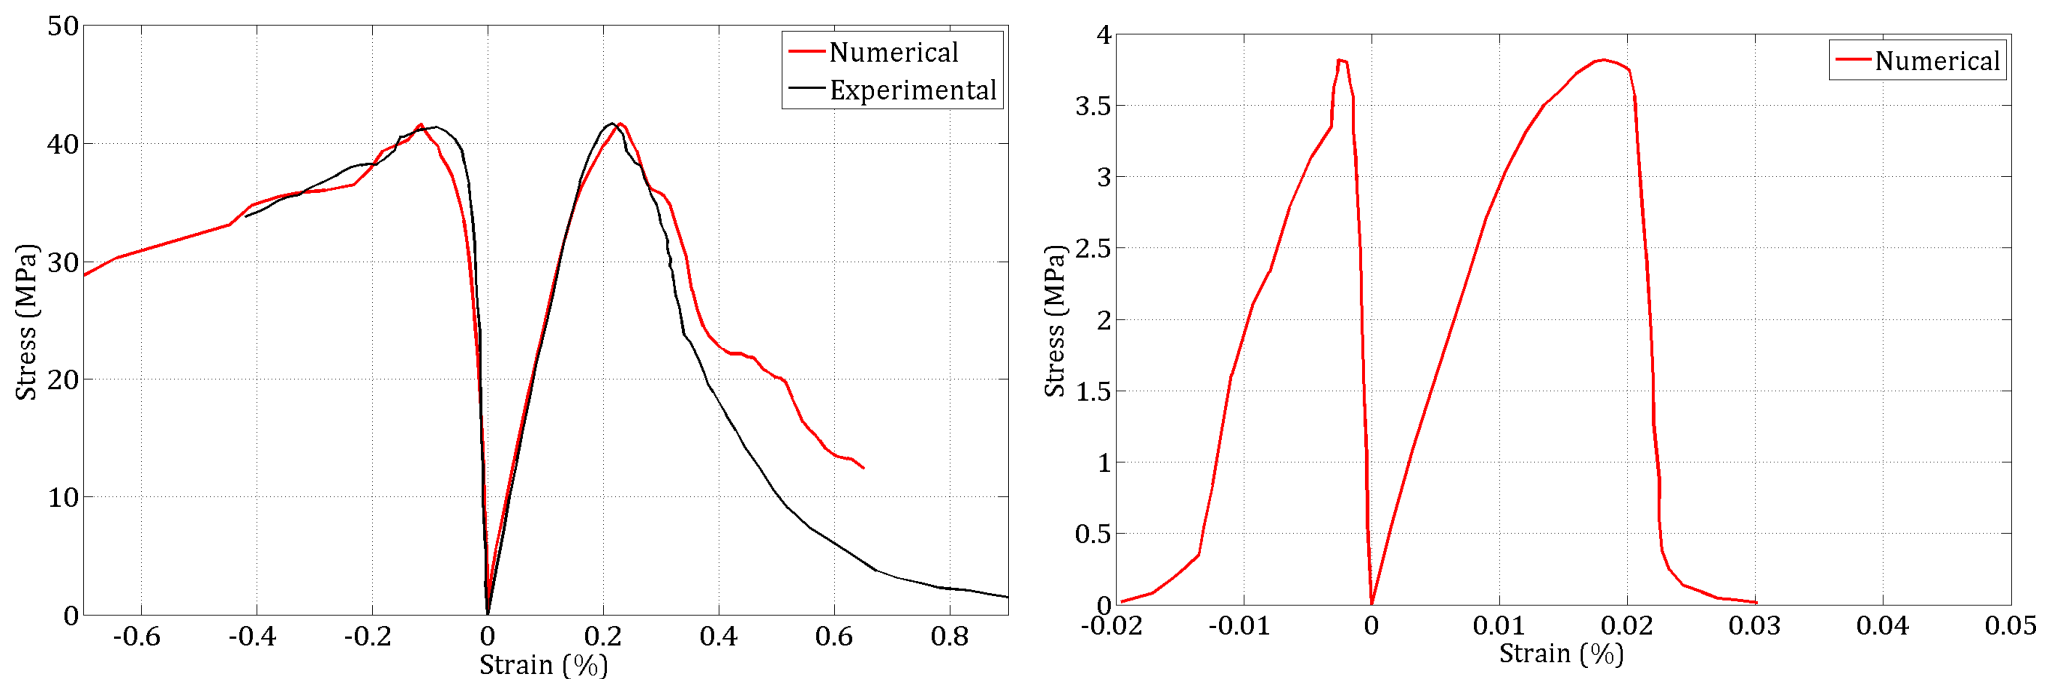
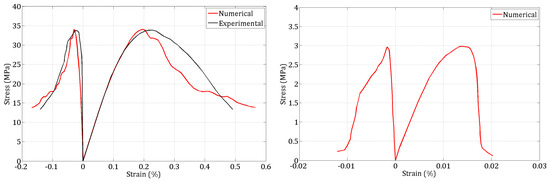
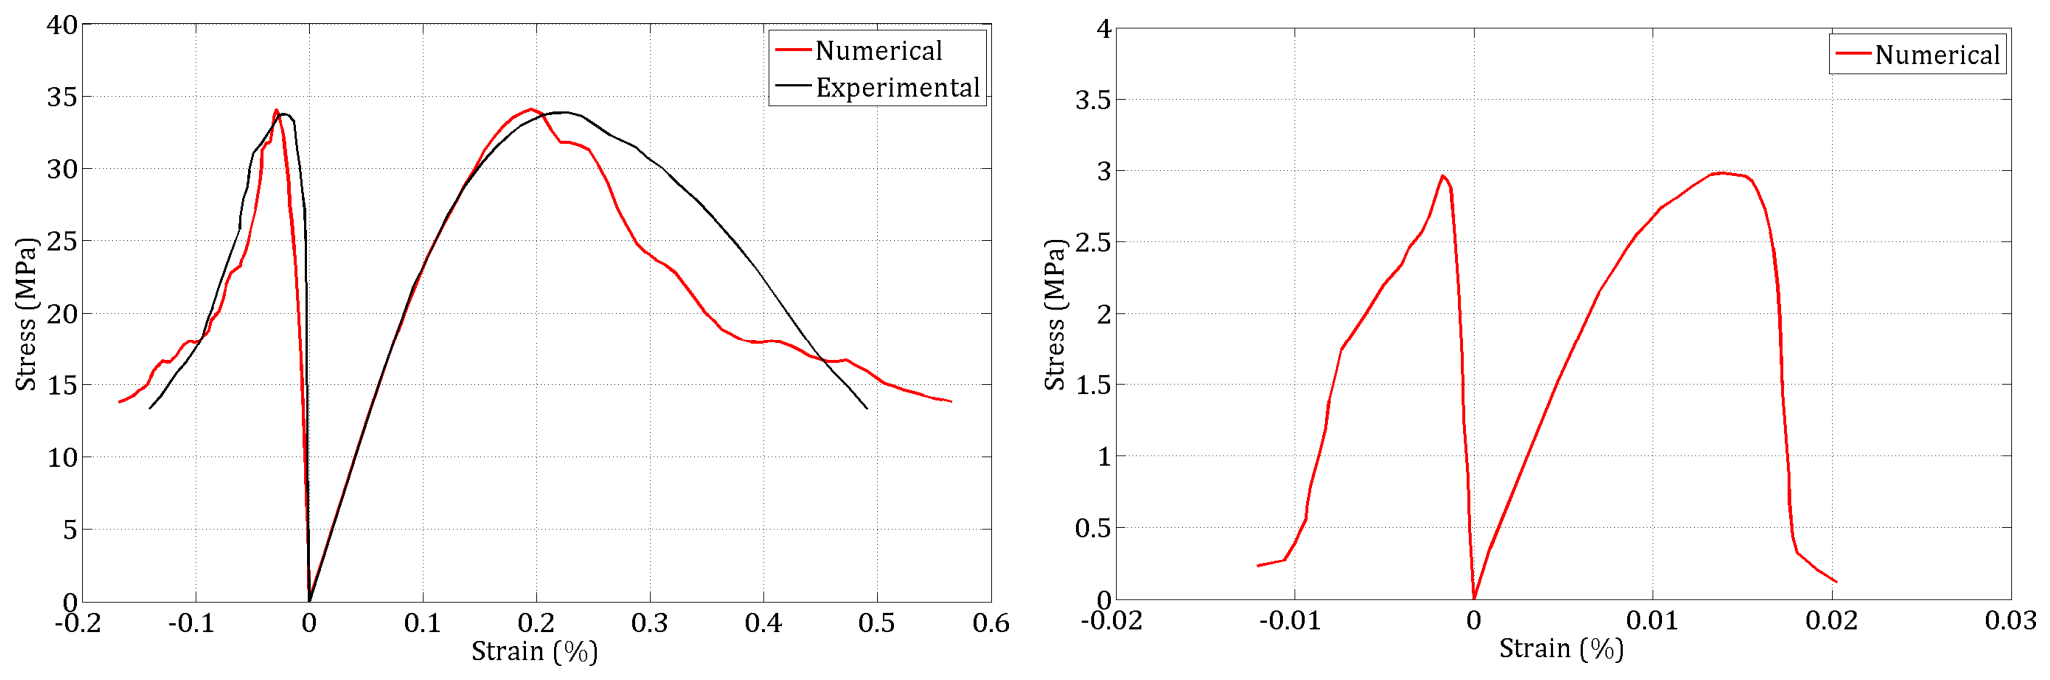
Compression and tension simulations were then performed and compared with the available experimental data. The good agreement between the numerical and experimental compressive stress–strain curves for the three concretes can be observed in Figure 17, Figure 18 and Figure 19. Because direct experimental uniaxial tensile stress–strain curves were not available, the present tensile validation is restricted to the tensile strength obtained from a splitting test. The simulated tensile post-peak response should therefore be regarded as a modeling assumption consistent with a brittle tensile behavior, rather than as a fully validated prediction.
Figure 17.
Experimental vs. numerical stress–strain responses in compression and tension for C50 concrete.
Figure 18.
Experimental vs. numerical stress–strain responses in compression and tension for R30A7 dry concrete.
Figure 19.
Experimental vs. numerical stress–strain responses in compression and tension for R30A7 wet (42%) concrete.
Table 6 allows for the quantification of the errors on the peak strengths in compression and tension (fc, ft) and the post-peak ductility in compression (D0.5) defined as
Table 6.
Errors of the model on the peak strengths (fc, ft) and the post-peak ductility indicator (D0.5).
These values show that the peak strengths are well reproduced in compression and tension. The post-peak ductility is well reproduced for the R30A7 wet concrete but overestimated for C50 and R30A7 dry concretes.
5.2. Influence of Discretization
It is well known that local constitutive laws with strain softening may lead to damage localization and mesh-dependent post-peak responses unless an internal length scale or an appropriate regularization mechanism is introduced [32]. In the present study, the internal length scale is imposed by micro–macro relations in Equation (2) with Sint that depends on the element radius.
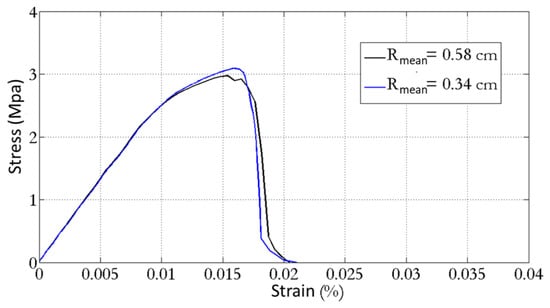
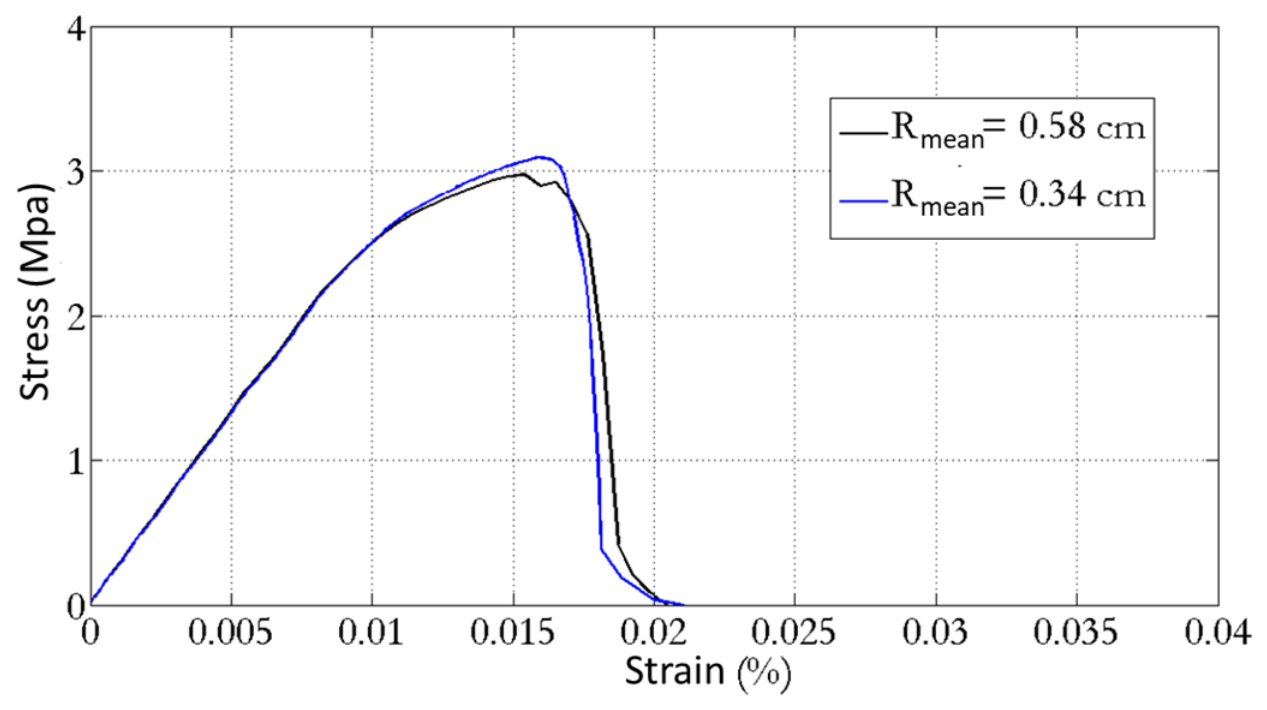
This localization phenomenon is particularly influential in tension. In order to assess the sensitivity of the tensile response to particle-size refinement, two tensile tests with two different particle assemblies were simulated (Table 7 and Figure 20). The stress–strain curves of these two tests are very similar showing that, for a refined-enough discretization, there is no influence of the particle mean radius.
Table 7.
Two different discretizations for the simulation of the tensile test.
Figure 20.
Numerical stress–strain responses in tension of R30A7 wet (42%) concrete for two mean radii.
For the tensile test considered here, the two refined discretizations provide very similar responses. A systematic assessment of discretization effects on compressive post-peak behavior remains beyond the scope of the present study.
5.3. Failure Patterns
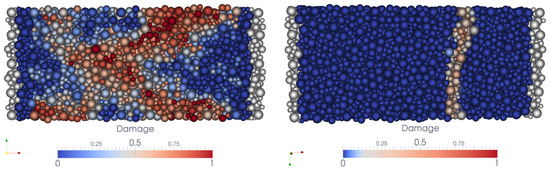
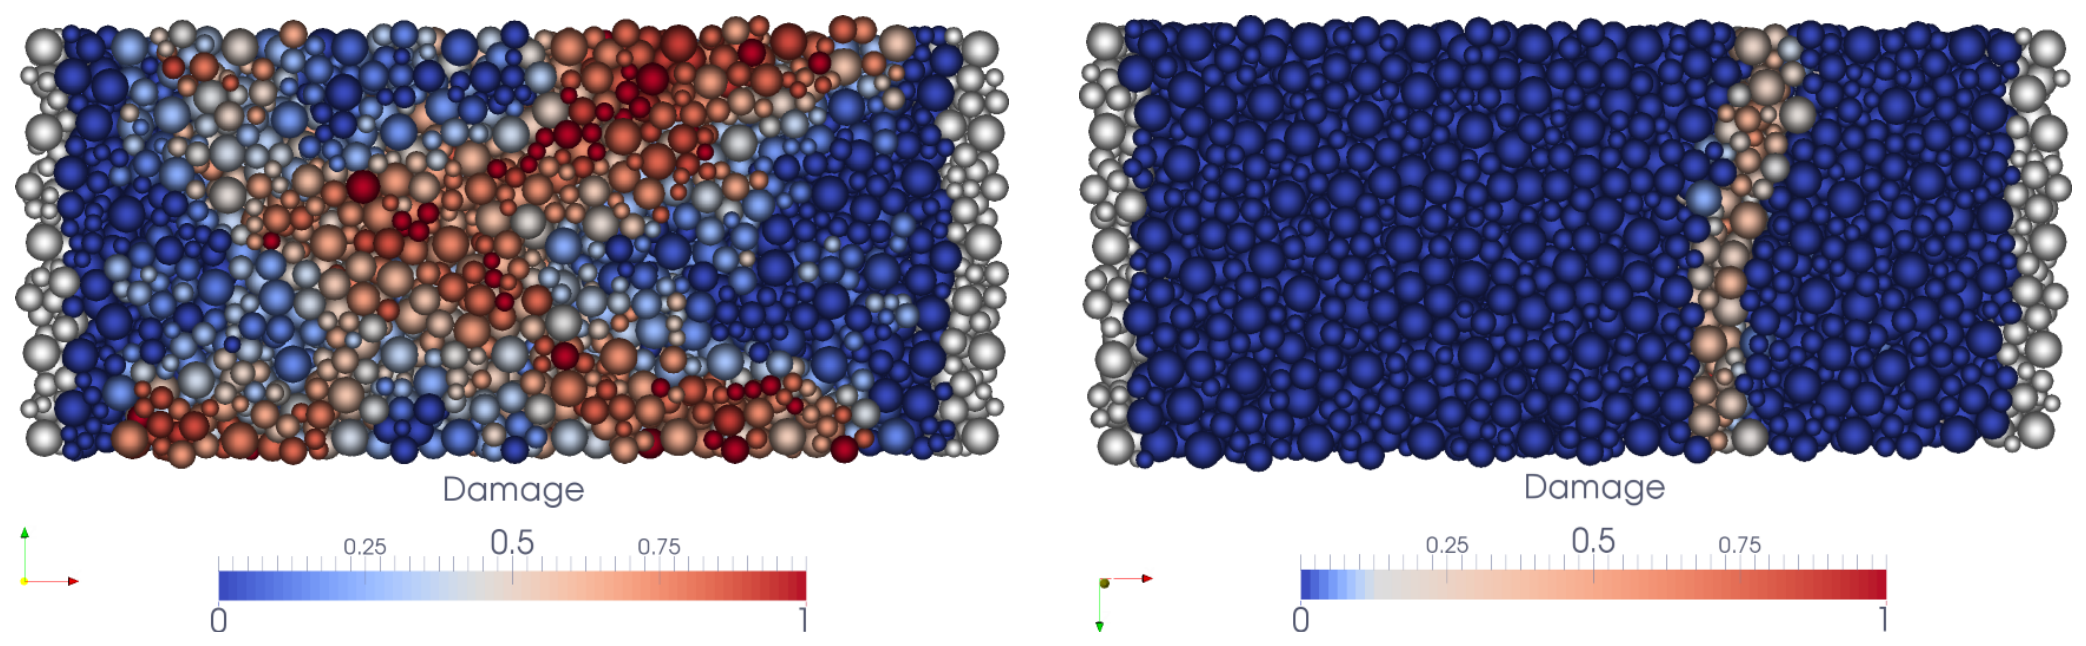
The evolution of damage was analyzed by defining the damage of each discrete element as the ratio between the number of broken links and the initial number of interactions. For the R30A7 wet (42%) concrete, the damage maps showed the formation of shear bands in compression and a localized rupture plane in tension (Figure 21). These failure patterns are consistent with the expected behavior of concrete under the corresponding loading conditions and support the physical relevance of the proposed DEM–MTL formulation.
Figure 21.
Damage maps within the R30A7 wet (42%) specimen in compression and tension tests.
5.4. Discussion
The results confirm that the introduction of the Moment Transfer Law (MTL) significantly improves the compressive response of the DEM model. In particular, the MTL makes it possible to reproduce a more realistic post-peak behavior in uniaxial compression, while preserving the main numerical advantage of spherical discrete elements, namely the simplicity and efficiency of contact detection. Compared with alternative strategies such as increasing the coordination number or constraining particle rotations, the proposed approach provides a more satisfactory compromise between physical relevance, computational efficiency, and calibration capability. A key outcome of this study is that the MTL mainly affects the compressive behavior, whereas its influence on the tensile response remains limited. This difference can be explained by the local kinematics of the discrete assembly. Under compressive loading, the response is strongly influenced by shear-induced relative rolling and sliding between neighboring spherical elements. In this case, the introduction of rolling resistance directly modifies the local transfer of moments and delays the degradation process, which results in higher compressive strength and improved post-peak ductility. Under tensile loading, by contrast, the relative rolling between particles is much less pronounced. As a result, the MTL has only a limited influence on the simulated tensile response while significantly improving the compressive one. Since direct tensile stress–strain data were unavailable, the simulated post-peak tensile response remains a modeling assumption consistent with a brittle behavior. The proposed formulation also makes it possible to reproduce a high compressive-to-tensile strength ratio, which is a fundamental characteristic of concrete. This point is important because several numerical adjustments that improve ductility in compression, such as increasing the coordination number or excessively increasing the softening parameter ζ, also tend to alter the tensile response in an unrealistic manner. In the present approach, the MTL improves the compressive response without introducing such an artificial effect in tension, which strengthens the relevance of the method for quasi-brittle materials such as concrete. Another important aspect of the proposed approach is its computational efficiency. The use of spherical particles remains attractive for three-dimensional simulations because it keeps contact detection simple and robust. In this respect, the MTL offers a practical alternative to more complex strategies based on non-spherical particles or clusters of particles, which would considerably increase the computational cost and implementation effort. The present formulation therefore retains the numerical benefits of spherical discretization while compensating for one of its main mechanical limitations.
The present study validates the DEM–MTL formulation only under quasi-static uniaxial compression and tension. Its applicability to multiaxial stress states and dynamic loading, including rate and inertial effects, is presented in other published papers [4,22,23,24,25,26,27,28,29,30,31].
Author Contributions
Methodology, A.O. and L.D.; software, A.O.; validation, A.O.; writing—original draft preparation, A.O. and L.D.; writing—review and editing, A.O. and L.D.; supervision, L.D.; funding acquisition, L.D. All authors have read and agreed to the published version of the manuscript.
Funding
This research received support from Univ. Grenoble Alpes to fund the PhD grant of the first author.
Data Availability Statement
The original contributions presented in this study are included in the article. Further inquiries can be directed to the authors.
Conflicts of Interest
The authors declare no conflicts of interest.
Abbreviations
The following abbreviations are used in this manuscript:
| DEM | Discrete Element Method |
| MTL | Moment Transfer Law |
| DE | Discrete Element |
References
- Mukhtar, F.M.; Wang, Z.; Zhang, D.; Ye, J.; Yan, C. A review on fracture propagation in concrete: Models, monitoring techniques, experiments, and numerical simulations. Cem. Concr. Compos. 2023, 139, 105043. [Google Scholar]
- Cundall, P.A.; Strack, O.D.L. A discrete numerical model for granular assemblies. Geotechnique 1979, 29, 47–65. [Google Scholar] [CrossRef] [Scilit]
- Tanzi, B.N.R.; Birck, G.; Sobczyk, M.; Iturrioz, I.; Lacidogna, G. Truss-like discrete element method applied to damage process simulation in quasi-brittle materials. Appl. Sci. 2023, 13, 5119. [Google Scholar] [CrossRef] [Scilit]
- Omar, A.; Daudeville, L. Discrete element modeling of concrete under dynamic tensile loading. Materials 2025, 18, 3347. [Google Scholar] [CrossRef] [Scilit] [PubMed]
- Zhu, R.; Gao, H.; Zhan, Y.; Wu, Z.X. Construction of discrete element constitutive relationship and simulation of fracture performance of quasi-brittle materials. Materials 2022, 15, 1964. [Google Scholar] [CrossRef] [Scilit] [PubMed]
- Wang, T.; Du, X.; Chen, S.; Sun, Q.; Jiang, Y.; Dong, H. Calibration and experimental determination of parameters for the discrete element model of shells. Appl. Mech. 2026, 7, 6. [Google Scholar] [CrossRef] [Scilit]
- Li, Y.; Qiang, S.; Xu, W.; Hua, X.; Xu, C.; Lai, J.; Yuan, M.; Chen, B. Verification of concrete nonlinear creep mechanism based on meso-damage mechanics. Constr. Build. Mater. 2021, 276, 122205. [Google Scholar] [CrossRef] [Scilit]
- Iwashita, K.; Oda, M. Rolling resistance at contacts in simulation of shear band development by DEM. J. Eng. Mech. 1998, 124, 285–292. [Google Scholar] [CrossRef] [Scilit]
- Tordesillas, A.; Walsh, D.S. Incorporating rolling resistance and contact anisotropy in micromechanical models of granular media. Powder Technol. 2002, 124, 106–111. [Google Scholar] [CrossRef] [Scilit]
- Zhao, S.; Evans, T.M.; Zhou, X. Shear-induced anisotropy of granular materials with rolling resistance and particle shape effects. Int. J. Solids Struct. 2018, 150, 268–281. [Google Scholar] [CrossRef] [Scilit]
- Soltanbeigi, B.; Podlozhnyuk, A.; Kloss, C.; Pirker, S.; Ooi, J.Y.; Papanicolopulos, S.A. Influence of various DEM shape representation methods on packing and shearing of granular assemblies. Granul. Matter 2021, 23, 26. [Google Scholar] [CrossRef] [Scilit]
- Frangin, E.; Marin, P.; Daudeville, L. On the use of combined finite/discrete element method for impacted concrete structures. J. De Phys. IV 2006, 134, 461–466. [Google Scholar] [CrossRef] [Scilit]
- Rousseau, J.; Frangin, E.; Marin, P.; Daudeville, L. Damage prediction in the vicinity of an impact on a concrete structure: A combined FEM/DEM approach. Comput. Concr. 2009, 5, 343–358. [Google Scholar]
- Europlexus. A Computer Program for Analysis of Fast Transient Phenomena Involving Structures and Fluids in Interaction. Available online: http://www-epx.cea.fr (accessed on 20 April 2026).
- Omar, A. Développement et Validation d’un Modèle aux Eléments Discrets de Comportement du Béton sous Chargement Dynamique. Ph.D. Thesis, Université Grenoble Alpes, Saint-Martin-d’Hères, France, 2015. [Google Scholar]
- Siiriä, S.; Yliruusi, J. Particle packing simulations based on Newtonian mechanics. Powder Technol. 2007, 174, 82–92. [Google Scholar] [CrossRef] [Scilit]
- Moghaddam, E.M.; Foumeny, E.A.; Stankiewicz, A.I.; Padding, J.T. Rigid body dynamics algorithm for modeling random packing structures of nonspherical and nonconvex pellets. Ind. Eng. Chem. Res. 2018, 57, 14988–15007. [Google Scholar] [CrossRef] [Scilit] [PubMed]
- Jerier, J.-F.; Imbault, D.; Donzé, F.V.; Doremus, P. A geometric algorithm based on tetrahedral meshes to generate a dense polydisperse sphere packing. Granul. Matter 2009, 11, 43–52. [Google Scholar]
- Lozano, E.; Roehl, D.; Celes, W.; Gattass, M. An efficient algorithm to generate random sphere packs in arbitrary domains. Comput. Math. Appl. 2016, 71, 1586–1601. [Google Scholar] [CrossRef] [Scilit]
- Hentz, S.; Daudeville, L.; Donzé, F.V. Identification and validation of a discrete element model for concrete. J. Eng. Mech. 2004, 130, 709–719. [Google Scholar] [CrossRef] [Scilit]
- Liao, C.L.; Chang, T.P.; Young, D.H.; Chang, C.S. Stress-strain relationship for granular materials based on the hypothesis of best fit. Int. J. Solids Struct. 1997, 34, 4087–4100. [Google Scholar] [CrossRef] [Scilit]
- Shiu, W.; Donze, F.V.; Daudeville, L. Discrete element modelling of missile impacts on a reinforced concrete target. Int. J. Comput. Appl. Technol. 2009, 34, 33–41. [Google Scholar] [CrossRef] [Scilit]
- Vu, X.H.; Malecot, Y.; Daudeville, L.; Buzaud, E. Effect of the water/cement ratio on concrete behavior under extreme loading. Int. J. Numer. Anal. Methods Geomech. 2009, 33, 1867–1888. [Google Scholar] [CrossRef] [Scilit]
- Vu, X.H.; Malecot, Y.; Daudeville, L.; Buzaud, E. Experimental analysis of concrete behavior under high confinement: Effect of the saturation ratio. Int. J. Sol. Struc. 2009, 46, 1105–1120. [Google Scholar] [CrossRef] [Scilit]
- Vu, X.H.; Daudeville, L.; Malecot, Y. Effect of coarse aggregate size and cement paste volume on concrete behavior under high triaxial compression loading. Constr. Bldg. Mat. 2011, 25, 3941–3949. [Google Scholar] [CrossRef] [Scilit]
- Vu, X.D.; Briffaut, M.; Malecot, Y.; Daudeville, L.; Ciree, B. Influence of the saturation ratio on concrete behavior under triaxial compressive loading. Sci. Technol. Nucl. Install. 2015, 1, 976387. [Google Scholar]
- Shiu, W.; Donzé, F.V.; Daudeville, L. Compaction process in concrete during missile impact: A DEM analysis. Comp. Concr. 2008, 5, 329–342. [Google Scholar] [CrossRef] [Scilit]
- Benniou, H.; Accary, A.; Malecot, Y.; Briffaut, M.; Daudeville, L. Discrete element modeling of concrete under high stress level: Influence of saturation ratio. Comput. Part. Mech. 2021, 8, 157–167. [Google Scholar] [CrossRef] [Scilit]
- Potapov, S.; Masurel, A.; Marin, P.; Daudeville, L. Mixed DEM/FEM modeling of advanced damage in reinforced concrete structures. J. Eng. Mech. 2017, 143, 04016110. [Google Scholar] [CrossRef] [Scilit]
- Antoniou, A.; Forquin, P.; Daudeville, L. Discrete element modeling of edge-on-impact tests on concrete. Comput. Part. Mech. 2025, 12, 3439–3447. [Google Scholar] [CrossRef] [Scilit]
- Antoniou, A.; Daudeville, L.; Marin, P.; Potapov, S. Extending the discrete element method to account for dynamic confinement and strain-rate effects for simulating hard impacts on concrete targets. J. Dyn. Behav. Mater. 2025, 11, 119–135. [Google Scholar]
- Pijaudier-Cabot, G.; Bažant, Z.P. Nonlocal damage theory. J. Eng. Mech. 1987, 113, 1512–1533. [Google Scholar] [CrossRef] [Scilit]

Disclaimer/Publisher’s Note: The statements, opinions and data contained in all publications are solely those of the individual author(s) and contributor(s) and not of MDPI and/or the editor(s). MDPI and/or the editor(s) disclaim responsibility for any injury to people or property resulting from any ideas, methods, instructions or products referred to in the content. |
© 2026 by the authors. Licensee MDPI, Basel, Switzerland. This article is an open access article distributed under the terms and conditions of the Creative Commons Attribution (CC BY) license.