Article

Machine Learning-Based Compressive Strength Prediction, Sensitive Analysis, and Microstructural Mechanism Study of Carbonated Recycled Aggregate Concrete


1
School of Civil and Hydraulic Engineering, Chongqing University of Science and Technology, Shapingba District, Chongqing 401331, China
2
Centre for Infrastructural Engineering and Safety, School of Civil and Environmental Engineering, The University of New South Wales, High Street, Sydney 2052, Australia
*
Authors to whom correspondence should be addressed.
Buildings 2026, 16(13), 2602; https://doi.org/10.3390/buildings16132602
Submission received: 14 May 2026 / Revised: 22 June 2026 / Accepted: 25 June 2026 / Published: 29 June 2026
(This article belongs to the Special Issue Innovations in Sustainable Concrete Construction)

Abstract

Carbonation treatment can effectively address defects in recycled aggregates (RA) while achieving CO2 sequestration, thereby improving properties of recycled aggregate concrete (RAC). However, the compressive strength of carbonated recycled aggregate concrete (CRAC) is governed by complex interactions among multiple parameters, and existing machine learning (ML) studies often rely on heterogeneous literature data with limited parameter coverage, resulting in constrained predictive accuracy. To address this issue, this study established a robust ML framework for precise strength prediction. By integrating published literature with original experimental results, a dataset of 226 groups was constructed, incorporating 12 key parameters across RA properties, carbonation processes, mix proportions, and concrete age to systematically compare three ML models (GPR, SVM, EDT). To enhance model transparency, global sensitivity analysis used the SHapley Additive exPlanations (SHAP) method, while X-ray diffraction (XRD), scanning electron microscopy (SEM), and microhardness tests were employed to reveal reinforcement mechanisms at the phase, microstructural, and micromechanical levels, supporting the connection between intelligent prediction and mechanistic explanation. Results show that the GPR model exhibited the highest predictive performance and generalization capability (R2 = 0.98 for training, R2 = 0.94 for testing; RMSE = 1.08 MPa), outperforming comparative models in handling high-dimensional nonlinear relationships. SHAP analysis identified concrete age, water–cement (W/C) ratio, and the initial crush index of the RA as the primary factors, while carbonation process parameters, particularly relative humidity, carbonation pressure, and carbonation time, exerted significant regulatory effects on strength. XRD results qualitatively confirmed the formation of CaCO3 after carbonation, while SEM and microhardness analyses indicated that carbonation products contributed to pore filling and interfacial transition zone (ITZ) strengthening, providing a physical basis for both macroscopic performance improvement and model reliability. This study provides a scientific, data-driven solution for the mix design optimization and performance prediction of CRAC, delivering substantial environmental and economic benefits.

1. Introduction

A great amount of construction waste is generated globally each year, primarily originating from the demolition and renovation of old buildings. With rapid domestic economic growth and urbanization, the demand for construction materials continues to rise, leading to a severe accumulation of urban construction waste [1]. These large volumes of waste not only cause significant pollution to urban environments but also result in the waste of domestic building material resources [2]. China produces upwards of 2 billion tonnes of construction and demolition (C&D) debris each year, representing more than one-third of the nation’s municipal solid waste stream. Given that the current recycling rate lingers below 10%, advancing resource recovery has become a critical imperative [3].
Recycled Aggregate Concrete (RAC) has emerged as a sustainable building material, yet its performance is limited by inherent defects in recycled aggregates (RA) [4,5,6]. The composite structure, covered by old cement paste, increases the number of interfacial transition zones (ITZs) [7]. Additionally, micro-cracks from mechanical processing result in low density, high water absorption, and poor crushing resistance [8,9]. To address these issues, carbonation treatment offers a promising solution. This process reacts CO2 with calcium hydroxide (CH) to form CaCO3 crystals, which fill pores and defects in the old mortar, thereby enhancing aggregate density and mechanical properties [10,11]. Compared to thermal or chemical methods, carbonation is more energy-efficient and safer, reducing heavy metal leaching (e.g., arsenic and cadmium) by about 50% [12]. Crucially, this technology sequesters CO2, transforming waste into resources. It improves material performance while supporting the “carbon peaking and carbon neutrality” goals of China, aligning with global low-carbon development.
The formation of compressive strength in carbonated recycled aggregate concrete (CRAC) is a complex, nonlinear process driven by the coupling of multiple parameters, constrained by three primary categories: the inherent properties of RA, carbonation process conditions, and concrete mix design [13,14]. The core physical attributes of the RA, such as the crush index and water absorption, define the initial strength defects and internal pore structure, serving as the fundamental basis for macroscopic performance [15,16], while aggregate particle size significantly influences carbonation efficiency and uniformity by altering the specific surface area [17]. Regarding the carbonation process, parameters including CO2 concentration, pressure, relative humidity, and duration form an interconnected reaction window; for instance, CO2 concentration can enhance improvement up to an optimal level of 70% [18], increased pressure accelerates the reaction but may reduce effectiveness if excessive [19], the optimal relative humidity ranges from 50% to 70% [20], and longer treatment times generally lead to greater aggregate improvement [21]. These controllable process variables allow for the active enhancement of aggregate performance. Furthermore, mix proportions, such as the water–cement (W/C) and aggregate–binder (A/B) ratios, govern the density of the cement matrix and the structure of the ITZs [22], while the aggregate substitution rate directly dictates the quantity of weak interfaces within the system [23]. Finally, the curing age reflects the cumulative effects of both hydration and carbonation [24]. These parameters do not act in isolation but exhibit profound interactions, constituting an indivisible system that determines the ultimate performance of CRAC; consequently, the absence of any single category or parameter would prevent a complete characterization of the underlying physicochemical processes.
Due to the non-negligible nonlinear coupling effects among these parameters, traditional mathematical models based on simplifications and assumptions struggle to fit such high-dimensional and complex relationships. Consequently, machine learning (ML) methods, which are capable of handling high-dimensional and nonlinear data, have become effective tools for revealing the internal laws of these multi-parameter systems. In recent years, ML techniques have been widely applied to predict the compressive strength of RAC to address mechanical uncertainties caused by complex aggregate sources and the multiphase characteristics of the ITZs [25,26,27,28]. Various ML models have been utilized for this purpose. Specifically, Zhang et al. [29] developed multiple ML models, including XGBoost, RF, KNN, SVR, and GBDT, to predict RAC strength, finding that a GBDT model optimized by BO-TPE exhibited higher accuracy and better generalization. Alkharisi and Dahish [30] confirmed the excellent performance of XGBoost through a comparative study of various models, while Phoeuk and Kwon [31] demonstrated that CatBoost achieved higher fitting precision and lower error on large-scale datasets. Regarding CRAC, ANNs using seven input parameters have shown strong correlation with experimental results (R2 = 0.95), with an average error of 1.24 MPa (3.43%) validated across 22 additional mix proportion datasets [32].
However, existing models for predicting the compressive strength of RAC and CRAC still face a critical limitation: their development and validation rely primarily on external datasets from the literature, lacking calibration and verification against independent experimental data [29,31,33]. Given the significant variations in RA sources and carbonation process conditions [34], models trained solely on heterogeneous external data struggle to fully capture the subtle influence mechanisms specific to certain aggregate properties and carbonation-condition combinations, thereby limiting their accuracy and reliability in practical applications. Furthermore, current research often utilizes a limited number of input parameters; consequently, several key variables related to the intrinsic quality of recycled aggregates and the carbonation reaction environment have not been fully incorporated. For example, a previous study on the compressive strength prediction of CRAC used seven input variables, namely W/C ratio, recycled coarse aggregate replacement ratio, carbonation duration, carbonation pressure, cement content, water content, and sand content [32]. These variables mainly covered mixture proportions and basic carbonation-operation parameters. However, parameters such as the initial crushing index and water absorption of RA, CO2 concentration, relative humidity, carbonation temperature, aggregate particle size, and concrete age were not systematically considered. The absence of these variables may cause aggregates with different initial defect levels or carbonation reactivities to be treated as equivalent materials, weaken the model’s ability to describe CO2 diffusion and carbonation reaction efficiency, and limit its capacity to capture age-dependent strength development. As a result, the predictive performance, robustness, and generalization ability of existing models remain insufficiently verified within a comprehensive framework that covers multidimensional parameters such as aggregate properties, carbonation processes, and mix proportions. To enhance the practical value of these models, it is necessary to introduce targeted experimental data and explore model performance under more comprehensive parameter inputs, thereby improving their adaptability to complex real-world scenarios.
This study collected 214 groups of experimental data combined with 12 groups of original experimental results for modeling. Twelve parameters (including aggregate crush index, water absorption, A/B ratio, W/C ratio, carbonization pressure, CO2 concentration, relative humidity, temperature, carbonation time, particle size, substitution rate, and concrete age) were used as inputs, with carbonated compressive strength as the output to ensure comprehensive coverage of aggregate properties, carbonation processes, and mix design factors. To accurately predict these nonlinear relationships, three ML models (GPR, SVM, and EDT) were comparatively trained and evaluated using R2, RMSE, MAE, and MAPE; furthermore, a SHAP analysis was conducted to assess the contribution of each parameter. Compared to existing research, this study utilized a more comprehensive set of input variables and validates both the effectiveness of carbonation treatment and model reliability from macro- and micro-perspectives through original experimental data and microstructural analysis. This research not only provided an effective method for precisely predicting the performance of CRAC under multi-parameter influences but also established a theoretical basis for the broader application of RA and construction waste recycling. By sequestering CO2 to reduce carbon emissions, this work aligned with the principles of green and sustainable development, offering significant environmental and economic benefits.

2. Materials and Methods

2.1. Experimental Program

2.1.1. Mix Design and Casting

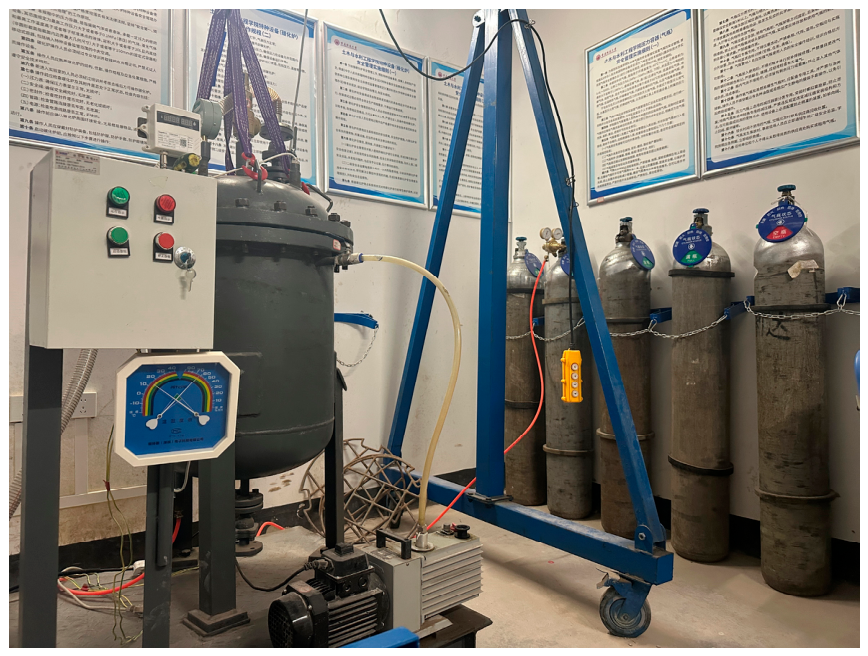
In this study, the carbonation treatment was carried out using a pressurized carbonation reactor with dimensions of Φ500 mm × 500 mm × 8 mm and an approximate volume of 100 L, as shown in Figure 1. A temperature and humidity display gauge was installed at the top of the reactor vessel to monitor the internal temperature and relative humidity during the carbonation process (the carbonation temperature was controlled at 20 °C, and the relative humidity was maintained at 50%). Multiple layers of detachable perforated overhead racks and material trays were placed inside the reactor to maximize the batch processing capacity of the experiment. Prior to each test, the reactor was evacuated to maintain an internal pressure of approximately −0.1 MPa. Then, the vacuum system was turned off, the inlet valve of the reactor was opened, and the pressure reducing valve on the gas cylinder was adjusted to control the CO2 inflow rate until the desired target pressure was achieved.
For the carbonation tests, a fixed carbonation time of 24 h was first adopted to treat the recycled coarse aggregates under three pressure levels: 0.3, 0.4, and 0.5 MPa. After carbonation, the physical properties (water absorption, apparent density, and crushing index) of the recycled coarse aggregates were tested for each pressure condition, and the results are presented in Table 1. The data indicated that after 24 h of carbonation, the aggregates treated at 0.5 MPa exhibited the best overall physical performance; therefore, 0.5 MPa was determined as the optimal carbonation pressure. Subsequently, the recycled coarse aggregates were carbonated under this optimal pressure (0.5 MPa) for four different durations: 12 h, 24 h, 36 h, and 48 h. The basic physical properties of each group are summarized in Table 2. Comparative analysis of the aggregate physical properties in Table 2 identified 48 h as the optimal carbonation time. It should be noted that the relationship between carbonation duration and the improvement in aggregate properties is not strictly linear. The marginal gains gradually decrease with extended time, and a saturation tendency may occur when the carbonation reaction approaches completion. Therefore, 48 h was selected as the optimal duration for this study rather than a definitive saturation threshold. Combined with the optimal carbonation pressure (0.5 MPa), the final optimal carbonation condition was established. All RA used in subsequent concrete tests were carbonated under this optimized condition.
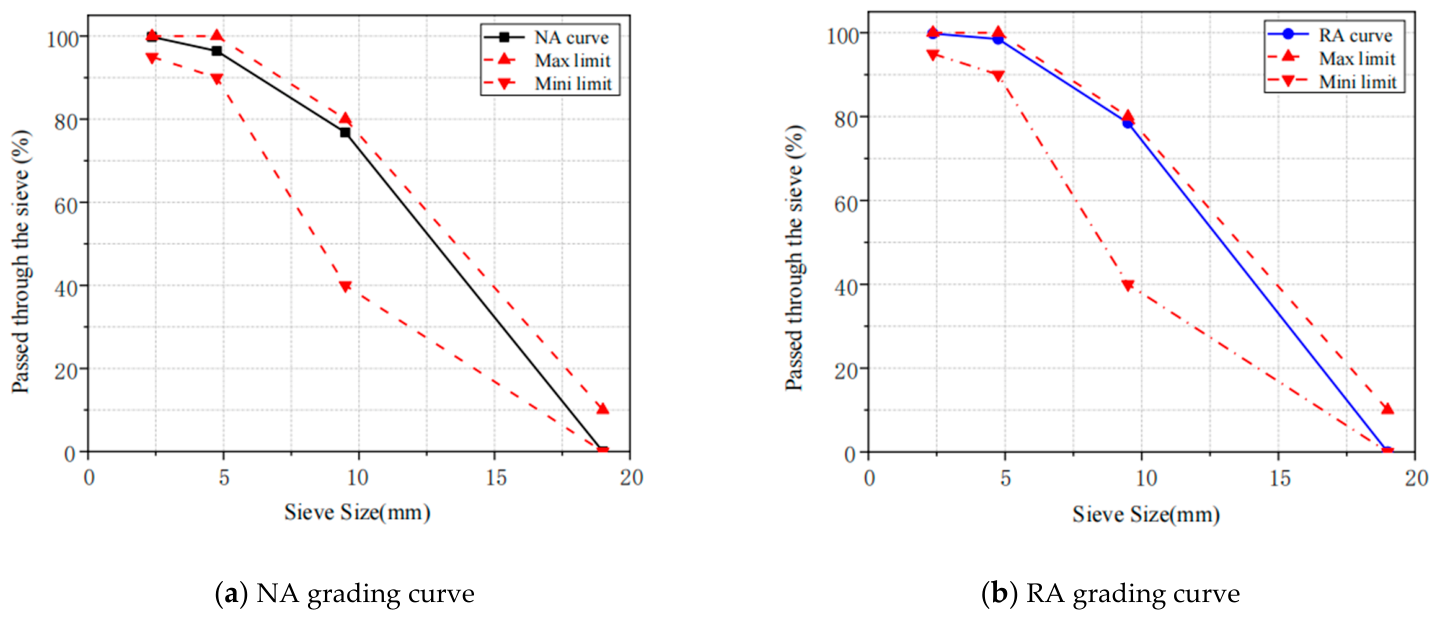
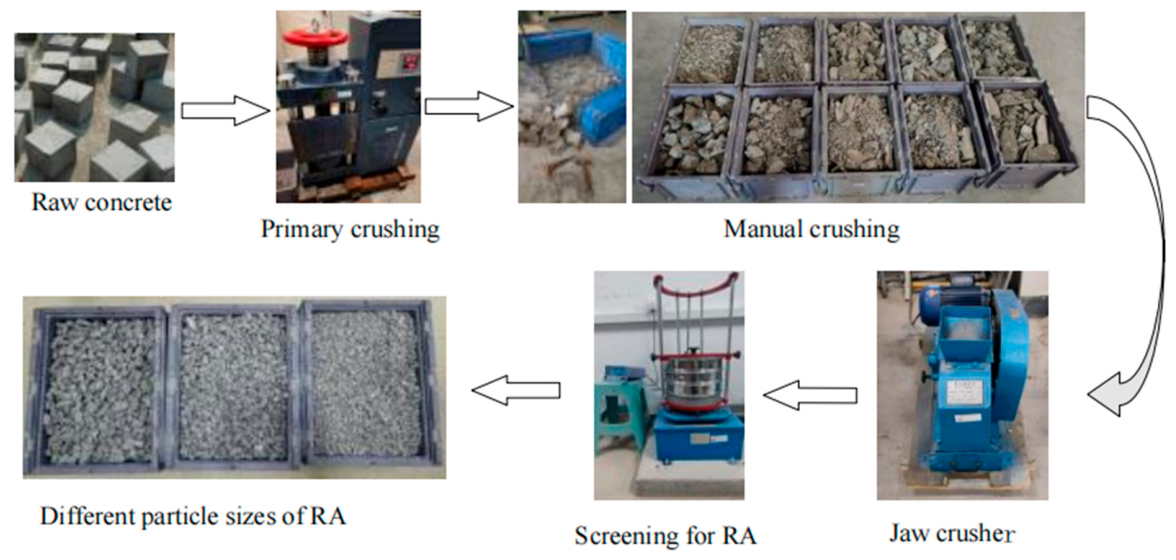
The cement used in this study was P.O 42.5R ordinary Portland cement (Chongqing Qingpeng Cement Co., Ltd., Chongqing, China), with its properties meeting the requirements of the Chinese standard GB 175-2007 [35]. Local river sand from Chongqing was used as the natural fine aggregate, with experimentally measured water absorption, moisture content, bulk density, apparent density, and fineness modulus of 4.6%, 0.6%, 1081.67 kg/m3, 2570.84 kg/m3, and 1.72, respectively. High-pressure liquid CO2 with a purity of 99.5% (Chongqing Lida Gas Co., Ltd., Chongqing, China). The RA used in this study were prepared in the laboratory, as shown in Figure 2. Figure 3 presents the grading curves of both natural aggregate (NA) and RA, while the physical properties of the aggregates and the concrete mix proportions are summarized in Table 3 and Table 4, respectively.

2.1.2. Compressive Strength Test

Compressive strength testing was conducted according to the Chinese standard GB/T50081-2019 [36] using 100 mm × 100 mm × 100 mm cubic specimens. For each mix proportion, three samples per group were tested at curing ages of 3, 7, and 28 days. A constant loading rate of 0.5 MPa/s was applied until failure.

2.1.3. XRD Test

The phase analysis of RA before and after carbonation was conducted using a SmartLab-9 X-ray powder diffractometer (XRD, Rigaku, Tokyo, Japan) to investigate the modification mechanism and the effect of carbonation on the aggregates. Samples for XRD analysis were dried in a forced-air oven to remove moisture. After drying, the samples were cooled to room temperature, ground into fine powder in an agate mortar, and sieved through a 200-mesh sieve. The collected powder was then used for the measurements. The XRD tests were performed under the following conditions: an accelerating voltage of 50 kV, a current of 200 mA, a scanning 2θ range of 10° to 80°, and a scanning speed of 10°/min with a step size of 0.02°.

2.1.4. Scanning Electron Microscope Test

In this study, a ZEISS Sigma 300 scanning electron microscope (SEM, Carl Zeiss AG, Oberkochen, Germany) was employed to observe the micromorphology of RA under different treatments. The objective was to verify the improvement effects of carbonation on aggregate performance and reveal the underlying enhancement mechanisms at the microstructural level. Samples were gold-coated using a sputter coater, and an acceleration voltage of 3 kV was applied during imaging.

2.1.5. Microhardness Test

The microhardness test was conducted using an HVS-1000 Vickers microhardness tester (Suzhou Maige Instruments, Suzhou, China), with observation magnifications of 100× and 400×. Considering the relatively low hardness of the RA and the old and new cement pastes, an excessive test load was avoided to prevent overly large indentation areas and possible overlap between adjacent indentations, which could affect the accuracy of the measured values. After several preliminary trials, a load of 25 g was selected. RAC is characterized by a multi-interface structure. Therefore, to accurately locate each target testing region, the specimen was first placed on the stage and observed at 100× magnification to adjust and identify the area of interest. The pyramidal indenter was then applied to the selected surface under the preset load, maintained for a specified dwell time, and automatically unloaded. Subsequently, the magnification was switched to 400×, under which an inverted pyramidal indentation could be clearly observed on the tested surface. The diagonal length, d, of the indentation was accurately measured. The indentation area, F, was then calculated using Equation (1), and the Vickers hardness value, HV, of each testing point was obtained as the ratio of the applied load, P, to the indentation area, F, according to Equation (2).
F = d 2 2 sin θ
H V = P F
where d is the diagonal length of the indentation, P is the applied load, F is the indentation area, and θ is the contact angle between the pyramidal indenter and the material surface, with a value of 68°.
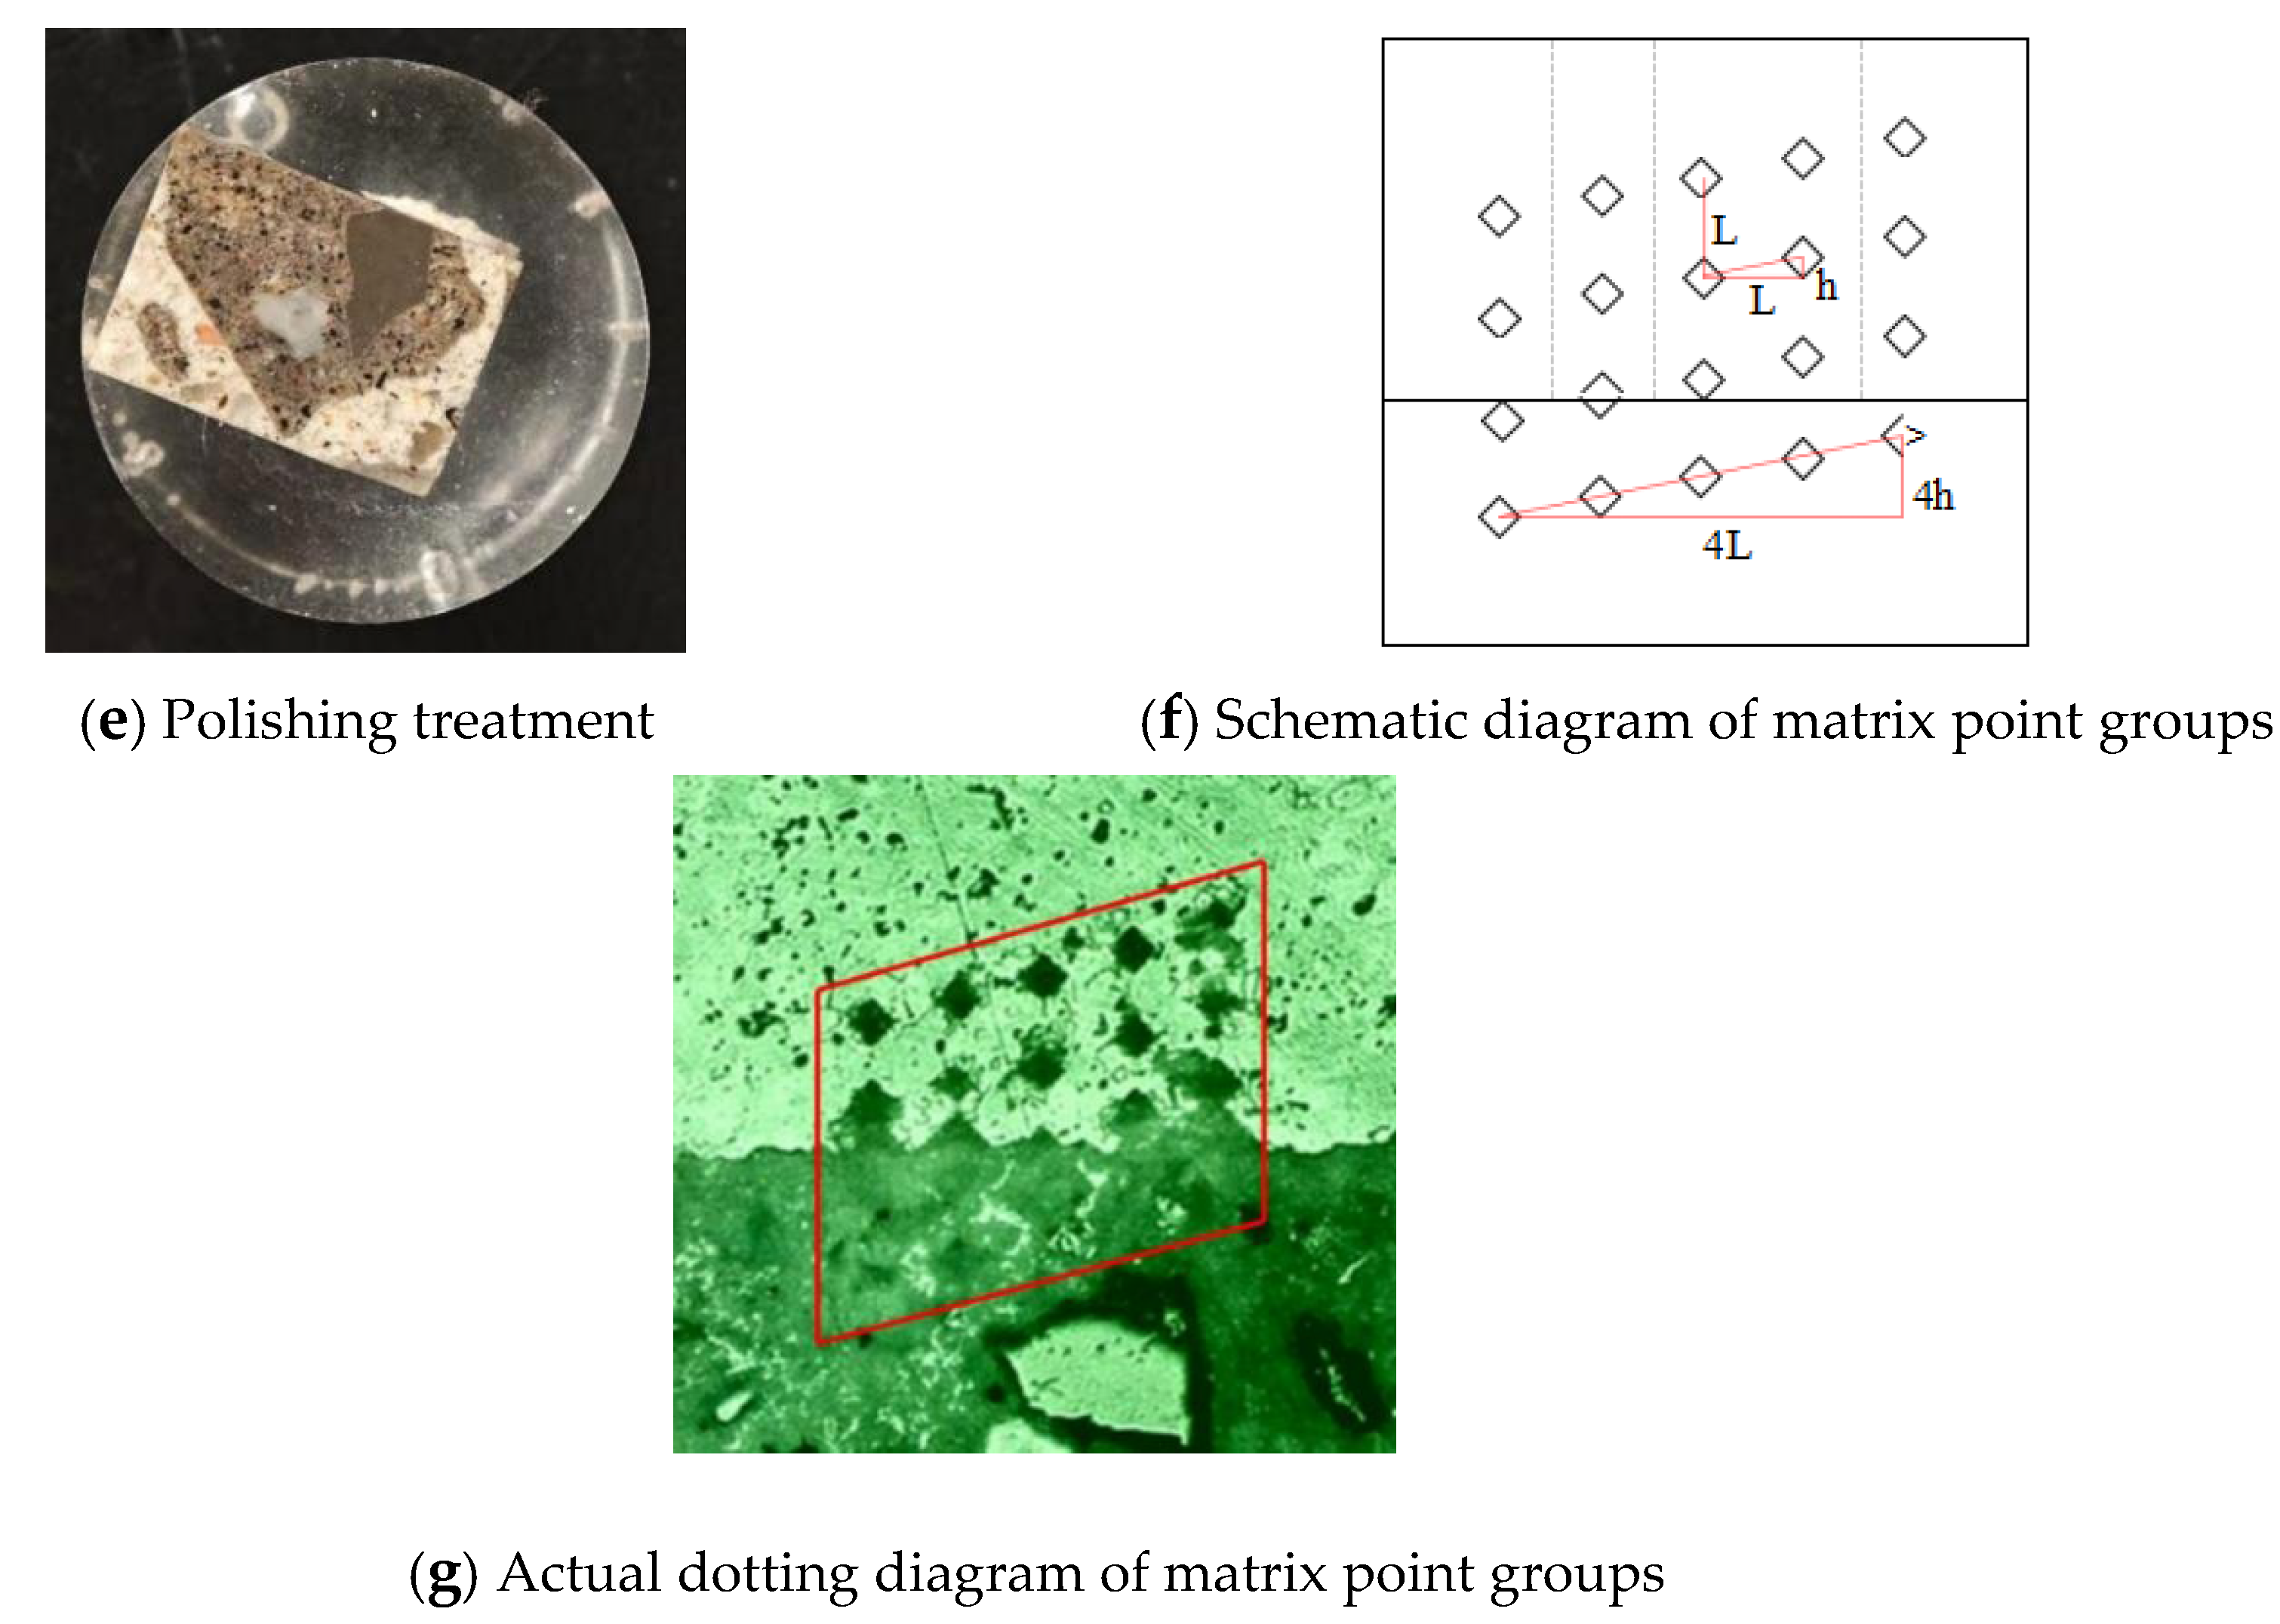
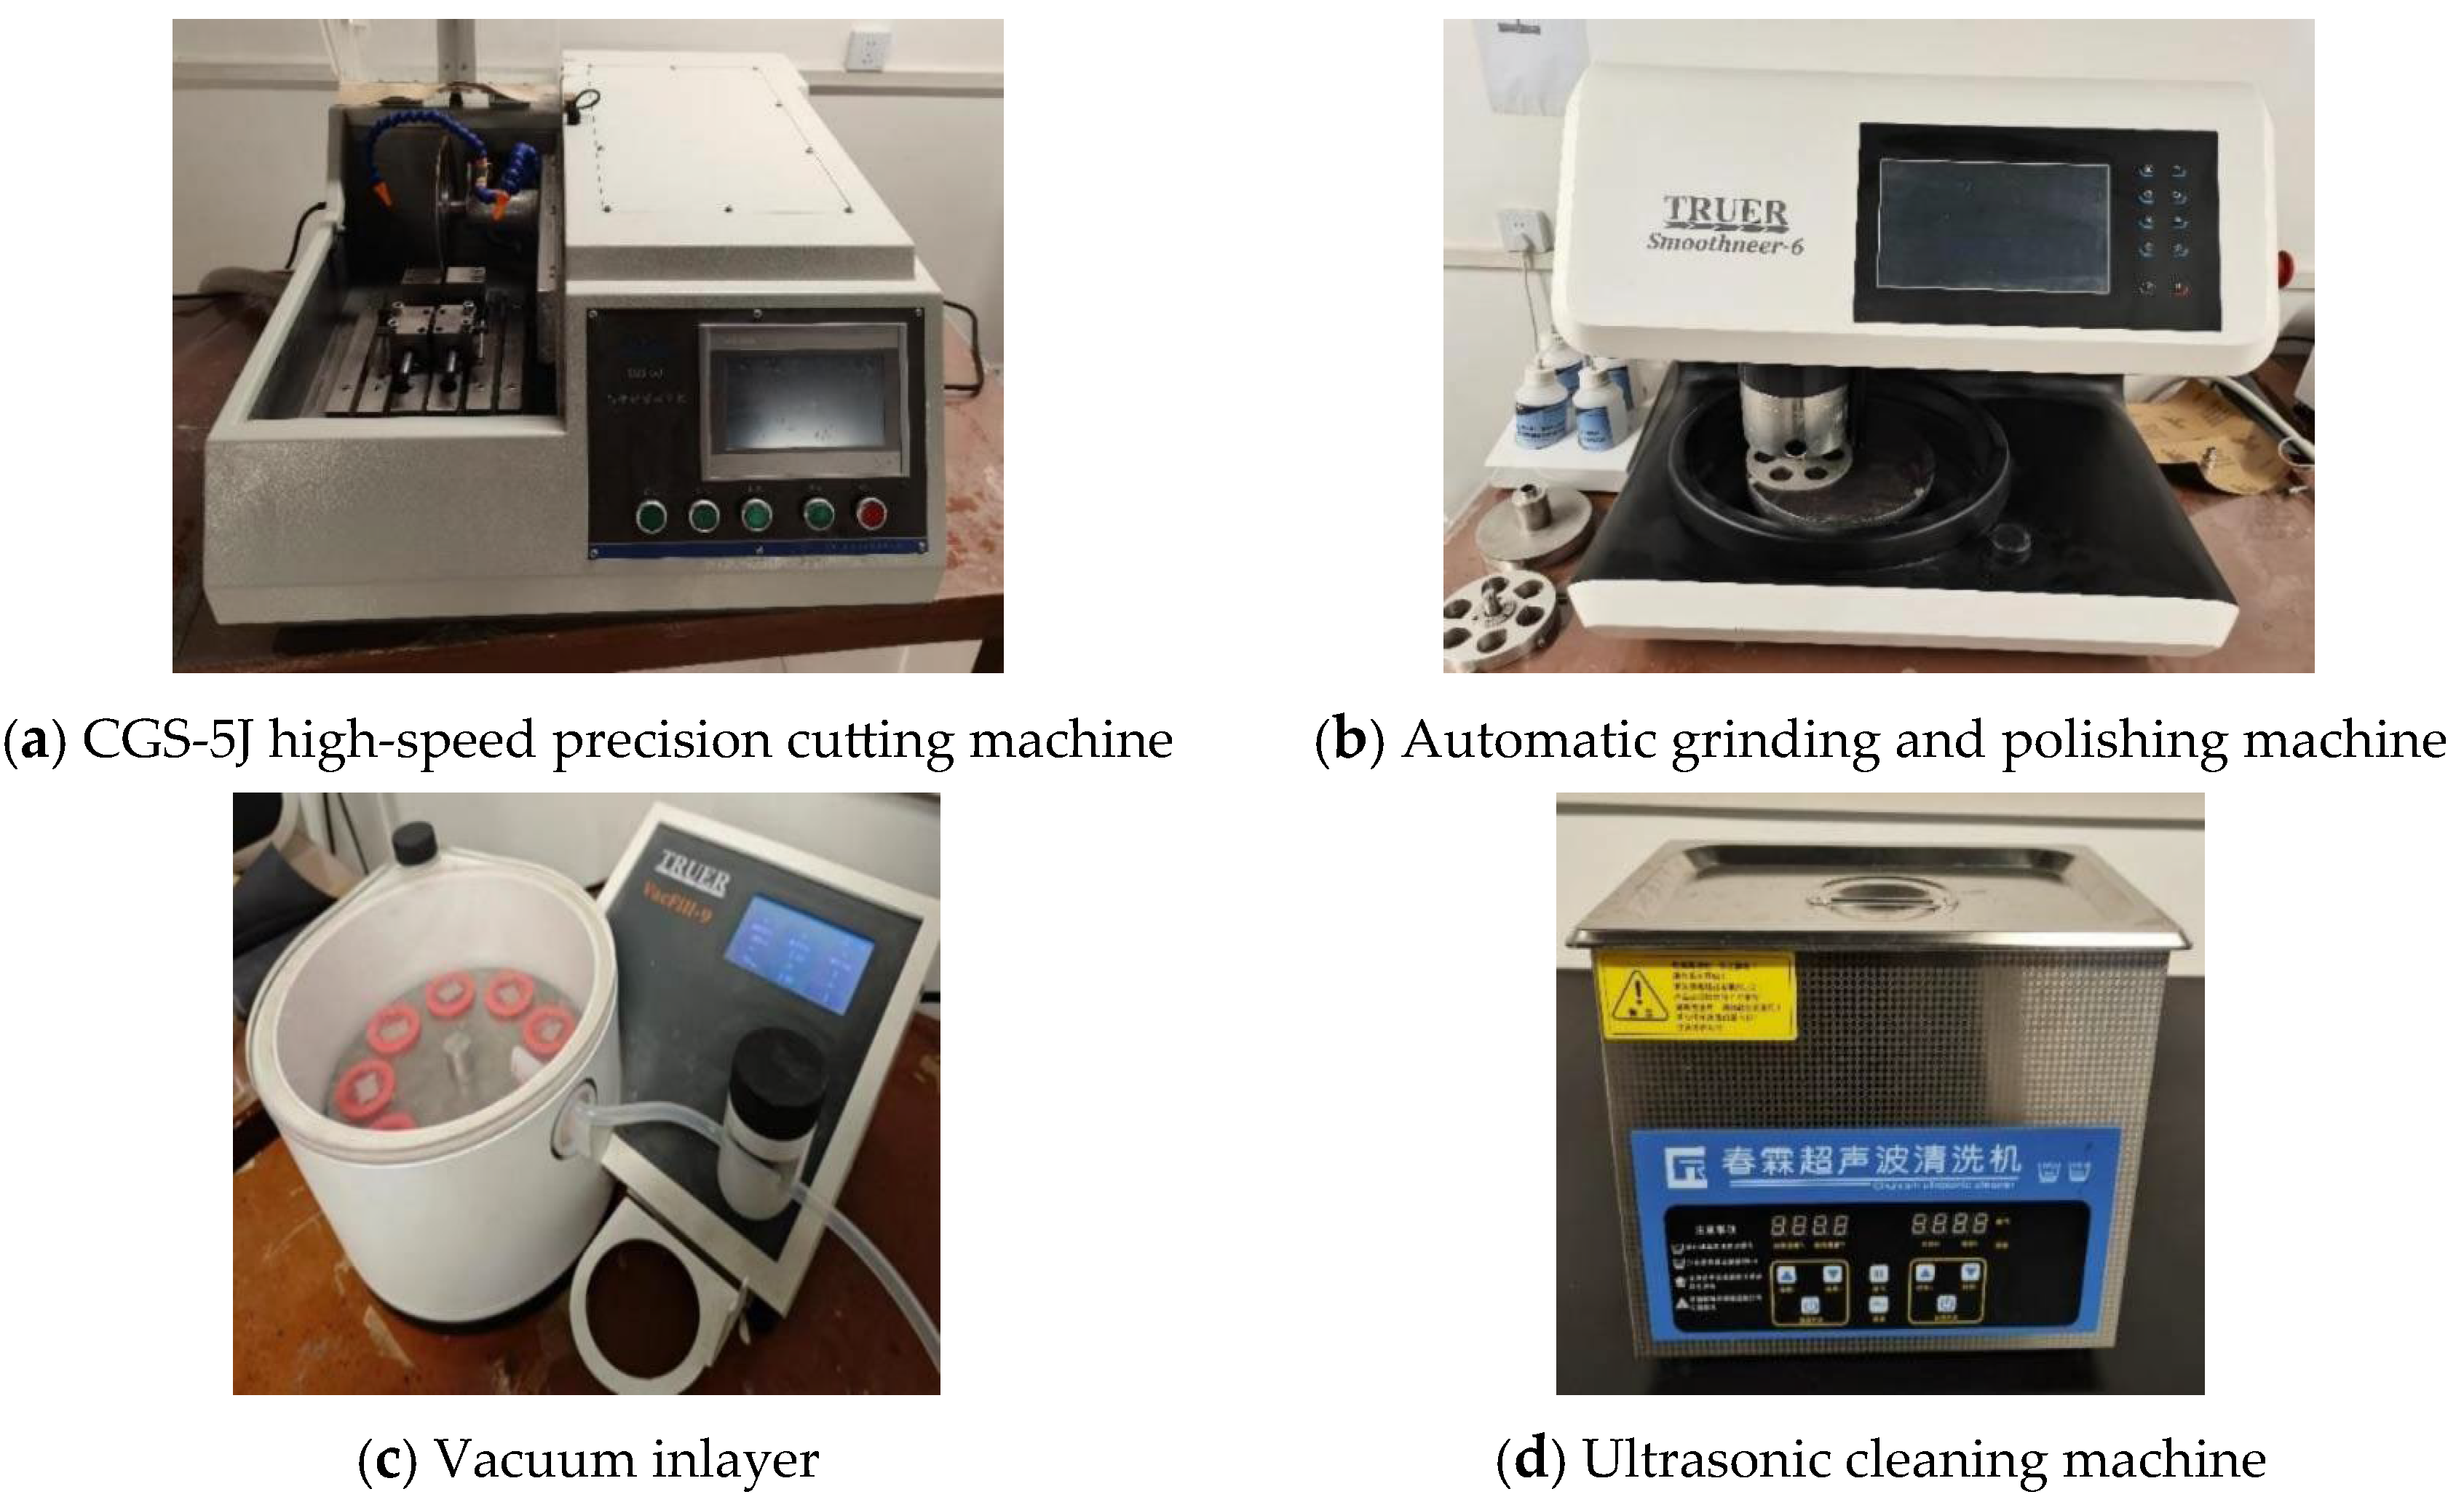
In this study, specimens were prepared for both untreated and carbonated RAC using standard 70 mm × 70 mm × 70 mm cubes. To better distinguish between old and new mortar, white Portland cement of the same grade as the previously mentioned ordinary Portland cement was used for mixing; the preparation process and w/c ratio remained identical to previous tests. After 24 h, the hardened specimens were relocated to a standard moist-curing environment for 28 days. The preparation of samples for microhardness testing involved four steps—cutting, embedding, polishing, and cleaning—using the equipment shown in Figure 4a–d. A matrix point-group method was adopted, with nine matrices distributed across various locations in each ITZ, each consisting of 4 × 5 testing points. To prevent overlapping indentations in the softer mortar matrix or ITZ, the horizontal and vertical spacing L between centers was set at 50 μm, with a vertical height difference h of 10 μm, as illustrated in Figure 4f. Figure 4g displays the actual indentation pattern of the matrix point-group.
Due to the influence of numerous complex factors on the ITZs of RAC, the microhardness data obtained from indentation testing do not strictly follow a normal distribution. To minimize data dispersion and experimental error, the box-plot method was adopted to process the indentation data in this study. Data points with the same distance gradient from the ITZ in the nine point groups were integrated using box-plot analysis. Outliers lower than the lower quartile or higher than the upper quartile were excluded, and the median value was selected as the effective microhardness value at the corresponding gradient. Meanwhile, to quantitatively determine the widths of the old aggregate–old mortar ITZ and the old mortar–new mortar ITZ, a large number of indentation points were arranged in the corresponding mortar matrix regions. The box-plot method was also used to eliminate outliers and determine the standard microhardness range of the mortar matrix. The region with microhardness values lower than the lower limit of this standard range was then defined as the width of the corresponding ITZ.

3. Theoretical Background

3.1. Data Collection and Analysis

It is well-established that the number of input variables and the scale of the dataset play a crucial role in the performance of machine learning models, as high predictive accuracy generally requires sufficient and diverse input information. However, in-house experimental data alone are often insufficient for model development; therefore, additional experimental data were collected from published literature [37,38,39,40,41,42,43,44,45,46,47,48,49,50,51,52,53,54,55,56,57,58,59,60,61,62,63,64,65,66] for training and testing. Because RA originate from various sources, their physical properties—such as porosity and water absorption—and the condition of adhered mortar vary significantly. Furthermore, specific carbonation conditions, such as CO2 concentration, carbonation pressure, and carbonation duration, also differ among studies. This reliance on heterogeneous external data makes it difficult for trained models to fully capture these complex and subtle factors, thereby limiting their accuracy and reliability in practical applications. Consequently, this study incorporates 12 input parameters to develop a compressive strength prediction model for CRAC. These inputs include aggregate crushing value, water absorption, A/B ratio, W/C ratio, carbonation pressure, CO2 concentration, relative humidity, temperature, carbonation duration, particle size, replacement rate, and curing age, with the compressive strength of CRAC as the output. Descriptive statistics for all input variables are summarized in Table 5, which lists the maximum, minimum, and median values. In the in-house experimental program, 9 concrete mixtures were tested at 3, 7, and 28 days, resulting in 27 compressive strength results. However, the NAC and untreated RAC groups were mainly used as reference groups to evaluate the strengthening effect of recycled aggregate carbonation. To maintain consistency with the objective of CRAC strength prediction, only the four CRAC mixtures tested at 3, 7, and 28 days were incorporated into the machine learning database, corresponding to 12 original experimental data points. Therefore, the final dataset used for model development consisted of 214 data points collected from the literature and 12 in-house experimental data points, giving a total of 226 data records.
It should also be noted that some potentially influential material-related parameters, such as cement type, cement content, aggregate density, and parent concrete strength, were not included as independent input variables in the present model. This exclusion was mainly due to the incomplete and inconsistent reporting of these parameters in the available literature. In particular, parent concrete strength and cement type were absent in many data sources, while aggregate density was reported using different testing methods and definitions. Including these parameters would have greatly reduced the number of usable data records and introduced additional uncertainty caused by inconsistent data formats. In the current 12-parameter framework, the effects of cement content and paste proportion were partially reflected by the W/C ratio and A/B ratio, while the quality of recycled aggregates was represented by the crushing index and water absorption. Nevertheless, the omission of these material-related parameters may still contribute to part of the unexplained variability in the dataset and should be regarded as a limitation of the present model. Future studies should further incorporate these variables when more standardized and complete datasets become available, thereby improving the robustness and generalization ability of CRAC strength prediction models.
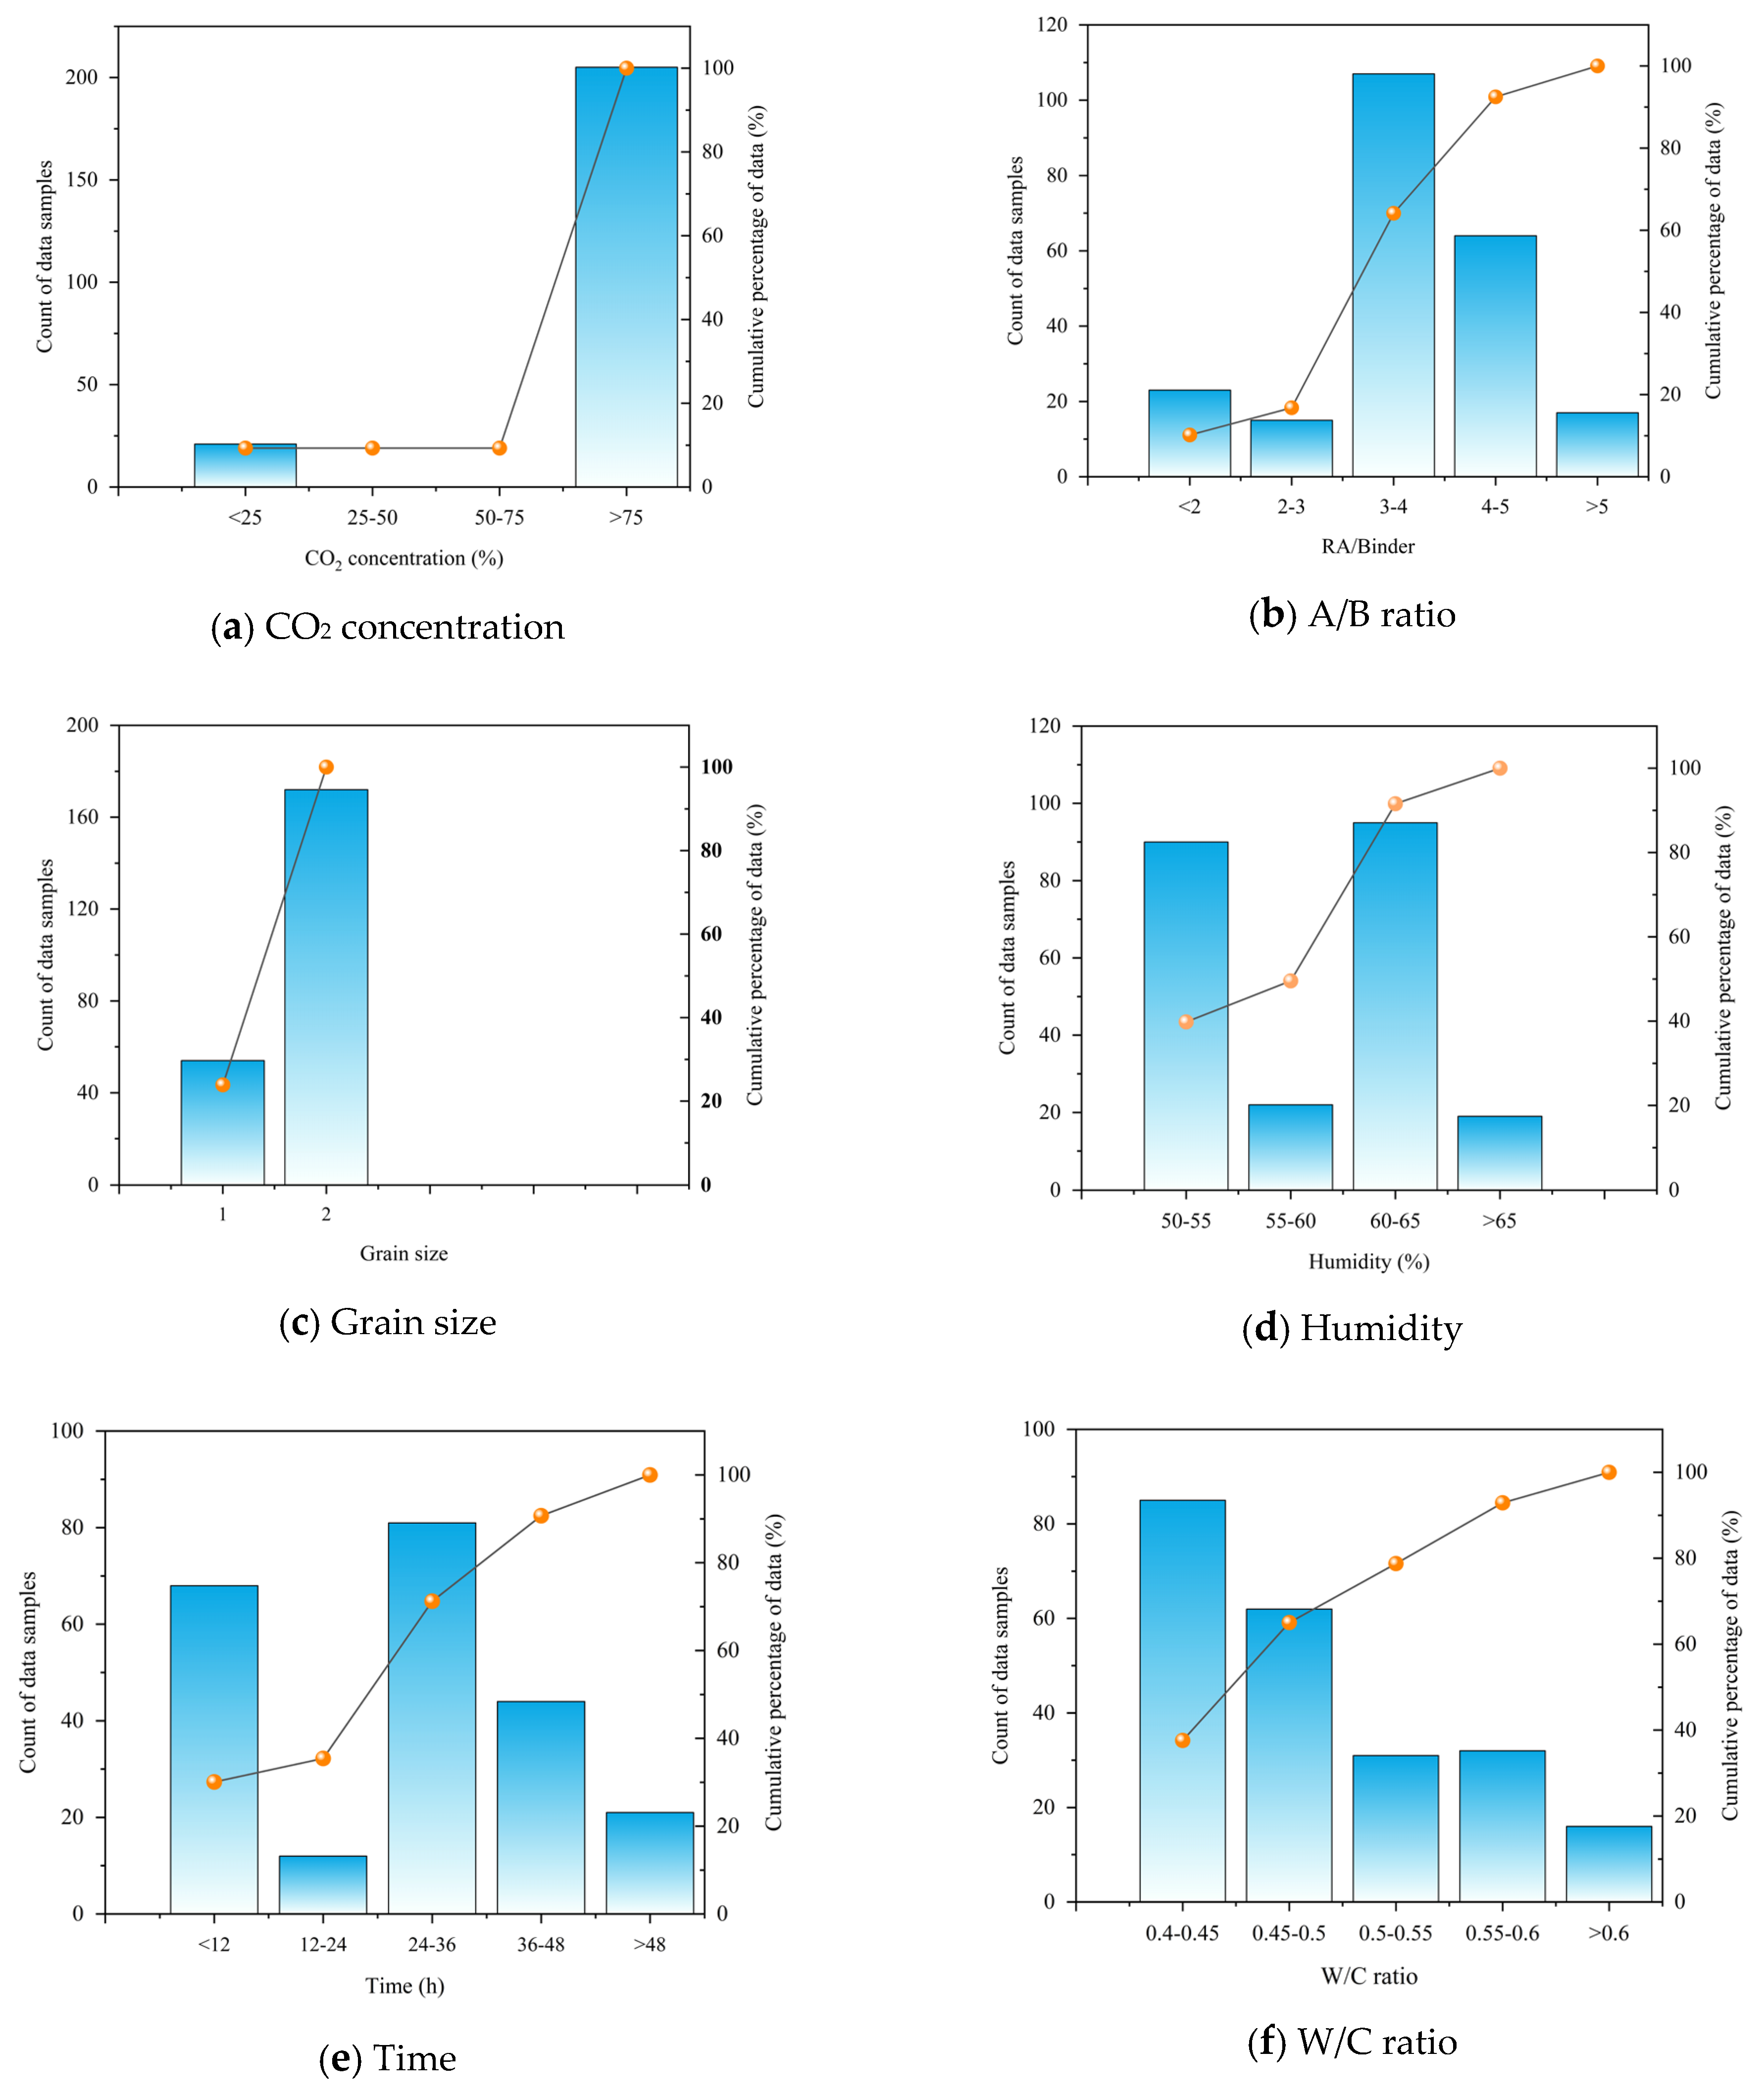
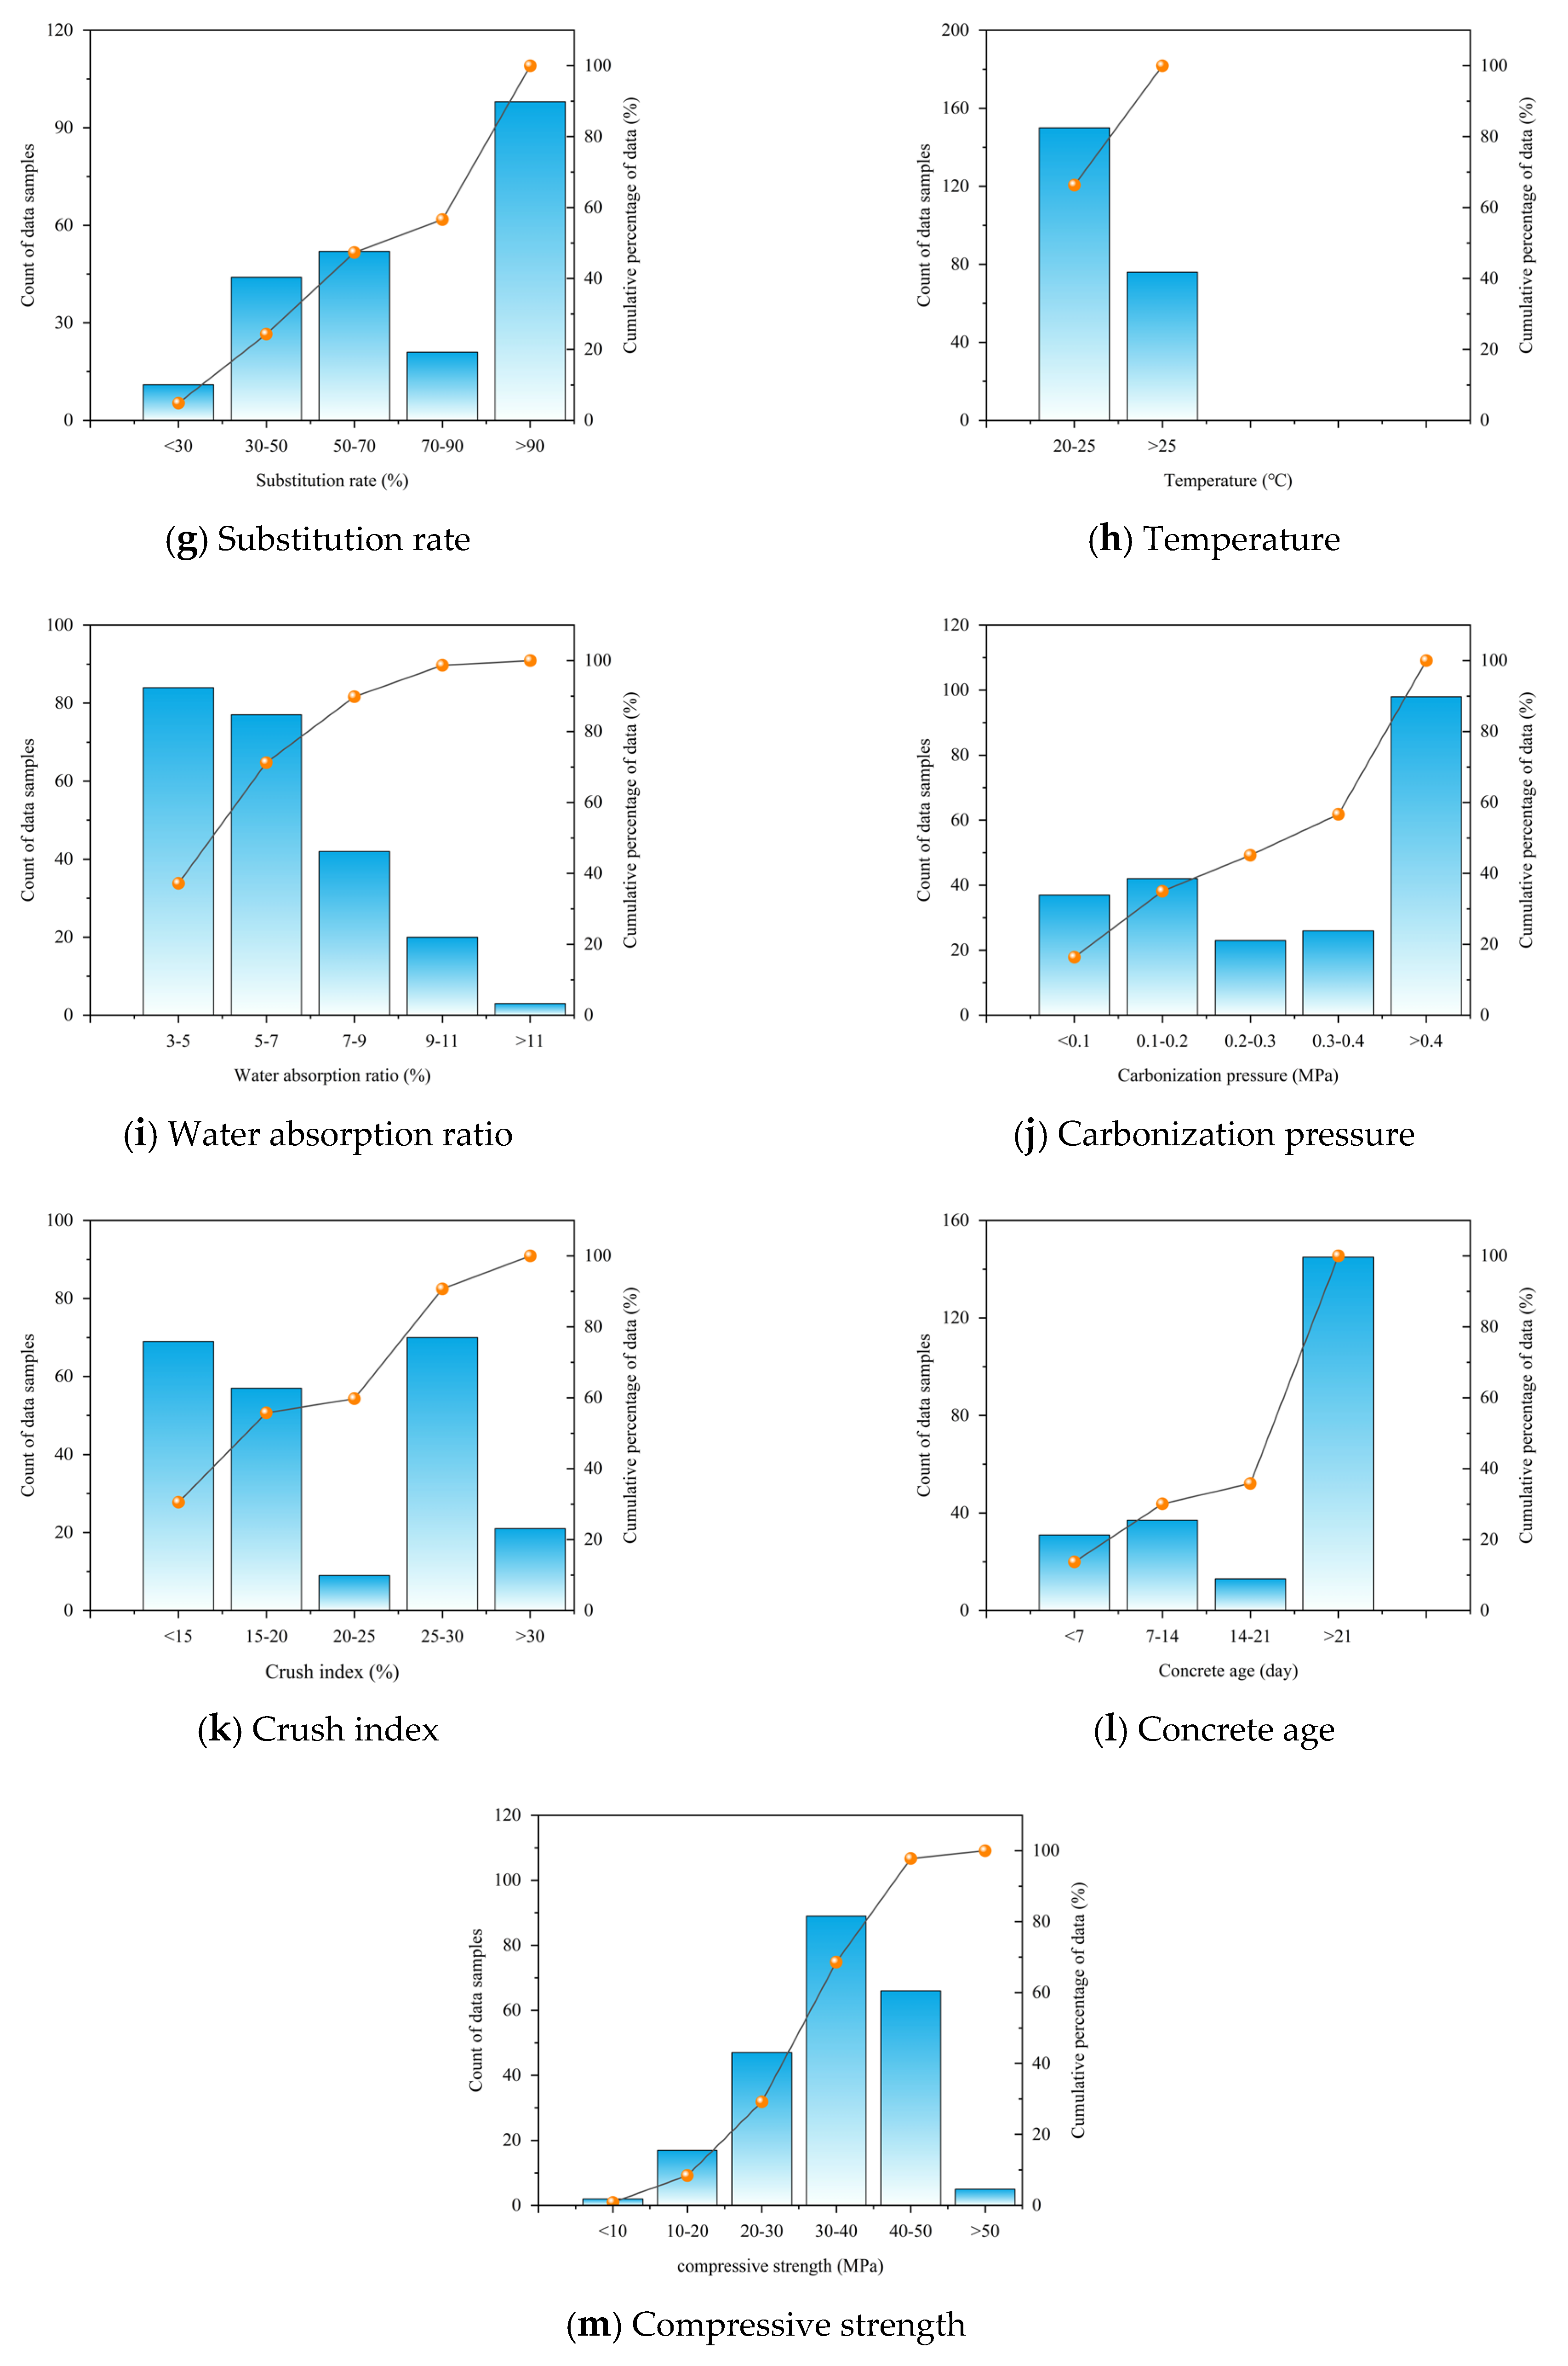
Figure 5 systematically illustrates the statistical distribution patterns of the input variables and the target output parameter within the modeling dataset. The A/B ratio is primarily concentrated between 3 and 4 (Figure 5b), and the aggregate type consists mainly of recycled coarse aggregate (in Figure 5c, 1 represents recycled fine aggregate and 2 represents recycled coarse aggregate). The W/C ratio is most frequent in the 0.4–0.45 range, followed by 0.45–0.5, with the remaining data distributed evenly across other intervals (Figure 5f). Carbonation pressure is densest in the 0.3–0.4 MPa range, while curing ages are mostly distributed above 21 days (Figure 5l), indicating that the majority of collected compressive strength data corresponds to a 28-day curing period. These distributions indicate that the dataset mainly represents the commonly investigated parameter ranges in existing CRAC studies, rather than uniformly covering all possible practical engineering conditions. Finally, the output parameter plot (Figure 5m) clearly shows that the compressive strength data are highly concentrated in the medium-to-high strength range of 30–50 MPa, accounting for the vast majority of the dataset. This distribution is not a sampling artifact but reflects the practical limitations of CRAC: the inherent porosity of recycled aggregates and the presence of multiple interfacial transition zones restrict the achievable strength ceiling compared to natural aggregate concrete. Consequently, current engineering applications of CRAC are primarily focused on medium-strength grades, resulting in a scarcity of ultra-high-strength (>60 MPa) data in the literature. The wide range of input parameters combined with the concentrated distribution of output values ensures that the model can learn effectively within typical operating conditions. This setup demonstrates that the core objective of the model is to precisely gauge intermediate to high-strength levels, thereby establishing a robust informational basis for constructing a dependable predictive framework.
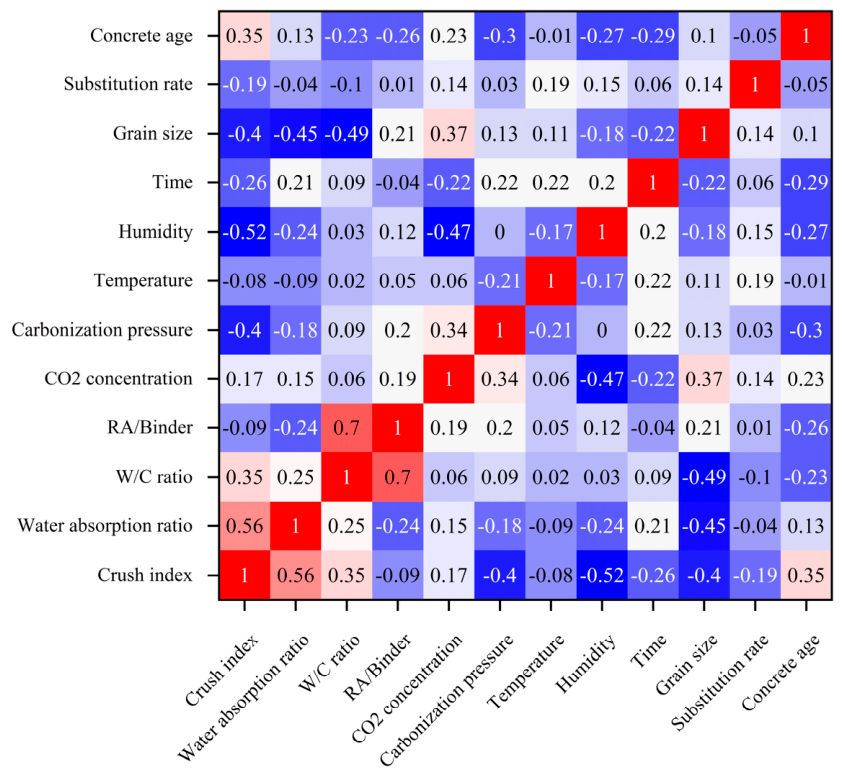
As shown in Figure 6, the vast majority of the Pearson correlation coefficients between variable pairs are small, with absolute values typically below 0.3. This widespread low correlation indicates that most features in the dataset have weak linear relationships with one another, thereby ensuring the accuracy of the modeling results. Given that the dataset is primarily composed of data from Chinese studies, the model’s applicability to regions with significantly different construction material systems should be further verified in subsequent work to ensure robust generalization.

3.2. Machine Learning Models

The present work applied three machine learning algorithms, namely Gaussian Process Regression (GPR), Support Vector Machine (SVM) and Ensemble Decision Tree (EDT), to predict CRAC compressive strength. Each method relies on a distinct inferential mechanism, which consequently shapes its predictive accuracy, robustness, and capacity to generalize to unseen data.
Grounding itself in Bayesian inference [67], GPR serves as a non-parametric regression method capable of modeling uncertainty and fitting intricate nonlinear data structures. This capability is particularly advantageous for addressing the noisy datasets frequently encountered in concrete materials research [68,69,70]. Diverging from conventional parametric approaches, GPR operates by constructing a probabilistic regression framework predicated on a Gaussian process prior. This methodology empowers the model to yield not only the expected output but also quantified uncertainty metrics during inference. Such dual-output capability renders it exceptionally effective for addressing complex systems characterized by sparse datasets and pronounced nonlinearities. The fundamental equations are detailed below:
f ( x ) ~ g p ( m ( x ) ,   k ( x , x ) )
f | X , y , x * ~ N ( μ , σ 2 )
μ * = k ( x , X ) [ K ( X , X ) + σ n 2 I ] 1 y
σ 2 = k ( x , x ) k ( x , X ) [ K ( X , X ) + σ n 2 I ] 1 k ( X , x )
In these expressions, the mean function m(x) is typically fixed at zero, whereas the kernel k(x, x′) describes the correlation pattern among the samples. The term K(X, X) represents the covariance matrix computed from the training inputs, and σn2 indicates the variance attributed to observational noise.
By mapping input vectors into a high-dimensional feature space via kernel tricks, SVM constructs a decision boundary that maximizes the geometric margin between distinct classes [71]. The primary optimization objective is to identify a linear function within this space that minimizes deviations while remaining as flat as possible, subject to an ϵ-insensitive constraint. The fundamental equations are detailed below:
min ω , b , ξ , ξ * 1 2 ω 2 + C i = 1 n ( ξ i + ξ i * )
Here, w represents the weight vector controlling the model complexity, C denotes the regularization parameter balancing the trade-off between flatness and training errors, and ξi, ξ*i are the slack variables permitting deviations outside the ϵ-tube.
EDT is an ensemble-based learning technique that improves model generality by combining multiple base trees with low mutual correlation [71]. Different from conventional Random Forests, the method introduces extra stochasticity by randomly selecting a split point for each attribute, entirely avoiding the search for an optimal cut. This design lowers the dependence among individual learners, effectively suppressing the tendency to overfit and rendering the algorithm particularly suitable for tackling the high-dimensional, complex datasets that frequently arise in structural engineering investigations.

3.3. Data Preprocessing

The dataset employed in this work combines 12 groups of in-house experimental data with 214 data records gathered from 30 published studies [37,38,39,40,41,42,43,44,45,46,47,48,49,50,51,52,53,54,55,56,57,58,59,60,61,62,63,64,65,66], thereby reflecting a wide variety of laboratory settings, geographical regions, and testing arrangements. To alleviate the heterogeneity effects introduced by merging data from different origins, several preprocessing actions were executed: (1) Only research that provided clearly specified experimental methodologies and uniform measurement criteria was taken into account; (2) All compressive strength values were converted to equivalent standard cube strengths using conversion coefficients from applicable codes and prior literature, thus removing distortions caused by differences in specimen geometry; (3) Numerical input features were normalized, and distinct outliers were discarded. Together, these procedures guaranteed physical comparability and statistical consistency throughout the assembled dataset, ultimately strengthening the predictive reliability and generalization capacity of the trained models.
During the preprocessing stage, a five-fold cross-validation procedure was employed only to assist in the robust identification of abnormal samples. Specifically, the dataset was divided into five subsets, and the abnormality of samples was examined across different validation folds to reduce the dependence on a single random split. Samples showing abnormal behavior during this process were removed before final model development. It should be emphasized that this five-fold cross-validation was used only as a preprocessing step for outlier screening and was not used to calculate the final performance metrics of the models. After outlier removal, the cleaned dataset was randomly divided into a training set and an independent testing set at a ratio of 70% and 30%, respectively. The training set was used for model training and hyperparameter optimization, while the testing set was kept independent and used only for the final evaluation of model generalization performance. Therefore, the final R2, RMSE, MAE, and MAPE values reported in this study were obtained from the independent hold-out testing set rather than from the average results of cross-validation. No nested cross-validation was adopted in this work.

3.4. Model Accuracy Evaluation Metrics

To comprehensively quantify the predictive performance of the developed machine learning models, four widely recognized statistical metrics were employed: the Coefficient of Determination (R2), Root Mean Square Error (RMSE), Mean Absolute Error (MAE), and Mean Absolute Percentage Error (MAPE).
R2 quantifies the fraction of total variance in the compressive strength data that can be accounted for by all independent variables included in the model. Serving as a goodness-of-fit indicator, its value spans between 0 and 1; moving closer to one signals that a greater share of the observed variability is captured, reflecting improved predictive ability. The formula is as follows:
R 2 = 1 i = 1 n ( y i y i ^ ) 2 i = 1 n ( y i y i ¯ ) 2
RMSE measures the standard deviation of the prediction errors (residuals). It represents the absolute magnitude of the error, giving higher weight to large errors due to the squaring operation. Therefore, RMSE is highly sensitive to outliers and is effective for identifying significant deviations in high-strength predictions. Lower RMSE values indicate better model performance. The formula is as follows:
R M S E = 1 n i = 1 n ( y i y i ^ ) 2
MAE measures the average magnitude of deviations between predicted and observed outcomes by computing the mean of absolute differences. Because it employs absolute values rather than squared terms, the metric exhibits reduced sensitivity to outliers and offers an intuitive expression of typical prediction error in the same unit as the target variable (MPa). The formula is as follows:
M A E = 1 n i = 1 n | y i y i ^ |
MAPE quantifies the relative error by calculating the average absolute percentage deviation. As a dimensionless metric, it facilitates the interpretation of prediction accuracy regardless of the scale of the data, allowing for straightforward comparison of model performance across different datasets. The formula is as follows:
M A P E = 1 n i = 1 n | y i y i ^ y i | × 100

3.5. Hyperparameter Optimization

Given that the predictive performance of machine learning models critically depends on appropriate hyperparameter configurations, a Bayesian optimization framework was employed in this work to systematically identify optimal hyperparameter values for each of the three models (GPR, SVM, and EDT). The search procedure used the “Expected Improvement Plus” acquisition criterion and was limited to 30 objective evaluations for each model, balancing exploration efficiency with computational cost. For the GPR model, the optimized hyperparameters included the basis function (set to constant), the kernel function (non-isotropic rational quadratic), the kernel length-scale, the signal standard deviation, the noise level (Sigma), and the standardization flag. Under the standardized data regime, the optimization converged to a kernel length-scale of 3.799 and a Sigma of 6.485.
For the SVM model, the tuned hyperparameters comprised the kernel function (linear), box constraint (automatically set to 9.118), kernel scale (automatic, value 1), epsilon (automatic, value 1), and the standardization of data (enabled). The optimization yielded a kernel scale of 9.118 and an epsilon of 1, with the box constraint automatically determined. For the EDT (ensemble decision tree) model, the optimized settings included the ensemble method (Bagging), minimum leaf size (8), number of learners (30), learning rate (0.1), and the number of predictors to sample (all, i.e., 1). All three models were optimized using Bayesian optimization, with feature selection retaining all 12 input features and PCA disabled. The detailed hyperparameter configurations are summarized in Table 6. This systematic optimization ensured that each model operated under its most favorable settings, enabling a fair and robust comparison of their predictive performance.

4. Results and Discussion

4.1. Compressive Strength

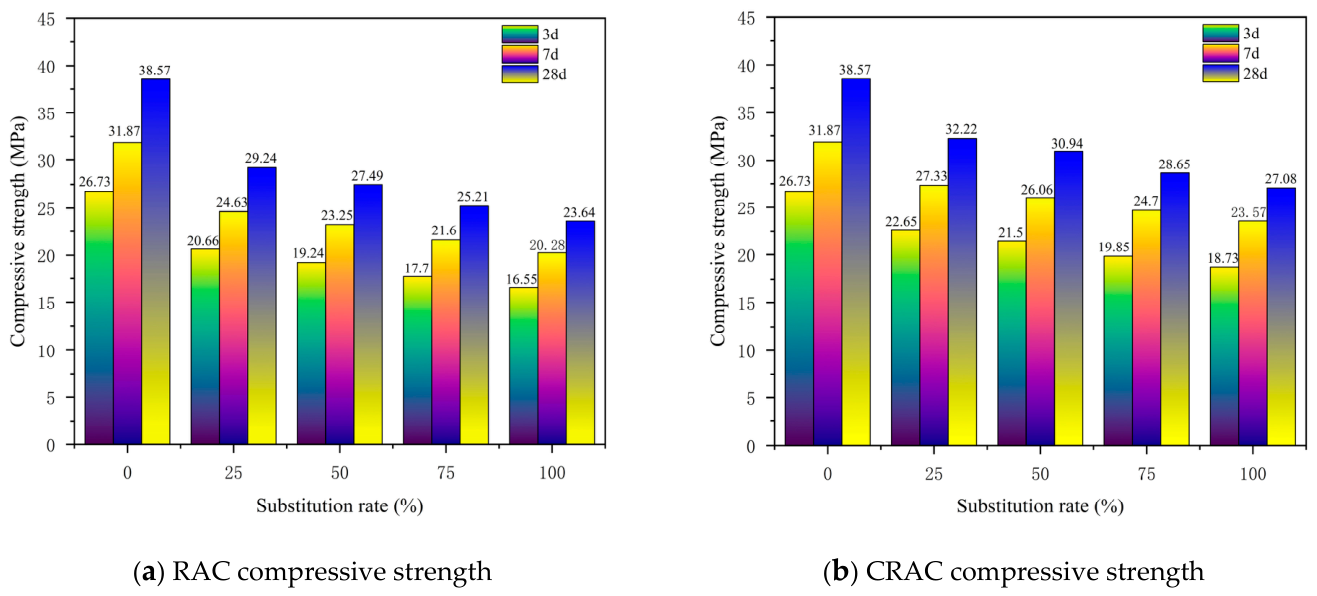
Figure 7 illustrates the influence of untreated and carbonated RA on concrete compressive strength at various replacement rates. As shown, at the same replacement rate and curing age, the compressive strength of concrete made with untreated aggregates was consistently lower than that of concrete using carbonated aggregates, demonstrating that carbonation treatment significantly improved compressive strength. Specifically, carbonation enhanced compressive strength by up to 13.17%, 16.22%, and 14.55% at 3, 7, and 28 days, respectively. At any given curing age, the improvement effect became more pronounced as the replacement rate increased, with the highest gains observed at a 100% replacement rate across all three curing ages. At 100% replacement, the strength of untreated RAC reached only 61.92%, 63.63%, and 61.29% of that of NAC at 3, 7, and 28 days, respectively, whereas the carbonated RAC achieved 70.07%, 73.96%, and 70.21% of the NAC’s strength over the same periods.
These results indicate that carbonation treatment of RA significantly enhanced the compressive strength of RAC, particularly at high replacement rates. Both untreated and carbonated RAC showed a decreasing trend in compressive strength as the replacement rate increased, a finding consistent with previous research. At all curing ages, the compressive strength of both types of RAC remained lower than that of NAC. For instance, at a 100% replacement rate and 28-day curing age, the compressive strengths of untreated and carbonated RAC reached only 61.29% and 70.21% of the NAC strength, respectively. This performance gap was primarily due to the porous and loose old mortar adhered to the surface of RA, which compromised aggregate strength. The interaction between this old mortar and the new cement paste created additional ITZs with lower bond strength, leading to reduced overall compressive strength. Furthermore, the mechanical crushing process used to produce RA inevitably introduced numerous micro-cracks, which also negatively affected strength. Consequently, even after carbonation treatment, a significant strength disparity remained between RAC and natural aggregate concrete.

4.2. XRD Analysis

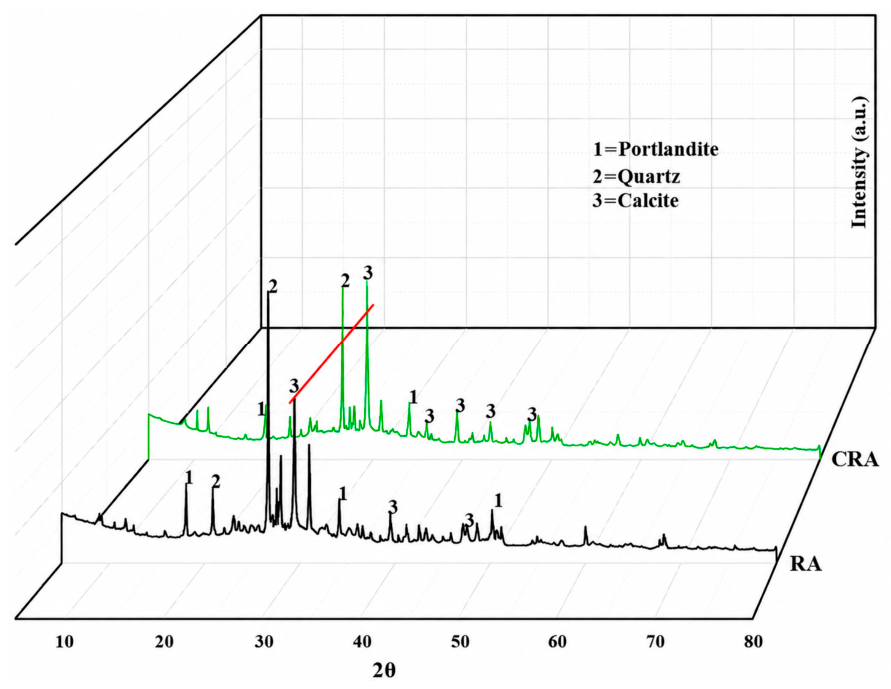
Figure 8 presents the XRD patterns of RA before and after carbonation treatment. The horizontal red line in the figure serves as the reference baseline for comparing the calcite diffraction peak intensity before and after carbonation. The main crystalline phases identified in both RA and CRA were portlandite, quartz, and calcite. For the untreated RA, distinct diffraction peaks corresponding to portlandite were observed, indicating the presence of residual calcium hydroxide in the adhered old mortar. After carbonation treatment, the intensity of the portlandite-related peaks decreased noticeably, while the diffraction peaks assigned to calcite became more pronounced. Under carbonation treatment, the diffraction peak intensity of CaCO3 increased to a certain extent. This is because the introduced CO2 reacted with CH or C-S-H in the old mortar attached to the aggregate, generating CaCO3 and silica gel. The increase in CaCO3 content is reflected by the corresponding rise in its diffraction peak intensity, whereas calcium silicate hydrate (C-S-H) gel is amorphous and therefore cannot be directly identified in the XRD patterns. This change confirms that CO2 penetrated into the old mortar attached to the recycled aggregate and reacted with calcium-bearing hydration products, especially portlandite, to generate CaCO3. Meanwhile, the quartz peaks showed no obvious change before and after carbonation, suggesting that the mineral skeleton of the aggregate remained relatively stable during the carbonation process. The increased calcite content provides direct phase evidence for the filling and densification effect of carbonation products within pores and microcracks. These newly formed CaCO3 crystals can refine the pore structure of the adhered mortar and improve the compactness of the aggregate surface, thereby reducing water absorption and enhancing the crushing resistance of RA. Therefore, the XRD results support the macroscopic strength improvement observed in Figure 7 and further explain the microstructural densification revealed by the subsequent SEM and microhardness analyses.

4.3. SEM Test

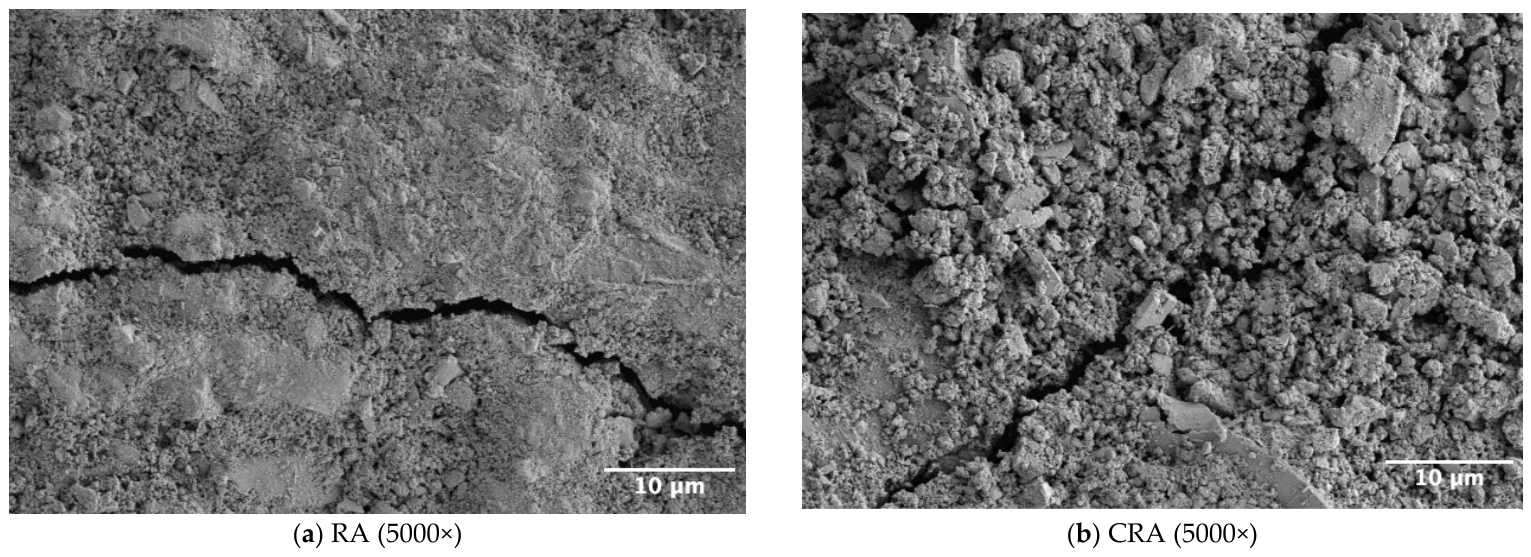
Figure 9 presents the micromorphology of RA before and after carbonation at a magnification of 2000×. In the untreated specimen (Figure 9a), wide fissures and a loose internal texture are clearly visible, resulting from the mechanical breakage and collision processes inherent in aggregate manufacturing. These interlinked micro-cracks not only induce stress concentration but also serve as primary channels for moisture transport, constituting a decisive weakness that degrades both the mechanical performance and durability of the concrete. Following carbonation treatment (Figure 9b), the pre-existing cracks within the aggregate became substantially narrower, with copious carbonation reaction products deposited along the crack boundaries, thereby producing a notable filling and sealing effect. Simultaneously, granular precipitates accumulated on the aggregate surface and densely occupied the pore voids, leading to a much more compact overall architecture relative to the uncarbonated condition. This microstructural enhancement originates from the penetration of CO2 into the internal pore system, where it chemically reacts with calcium hydroxide and C-S-H gel to generate calcium carbonate and silica gel. These newly formed phases fill the internal pores and micro-cracks, densify the interfacial transition zones, and ultimately bring about a marked improvement in the physical properties of the RA.

4.4. Microhardness Analysis

4.4.1. Old Aggregate–Old Mortar Interface

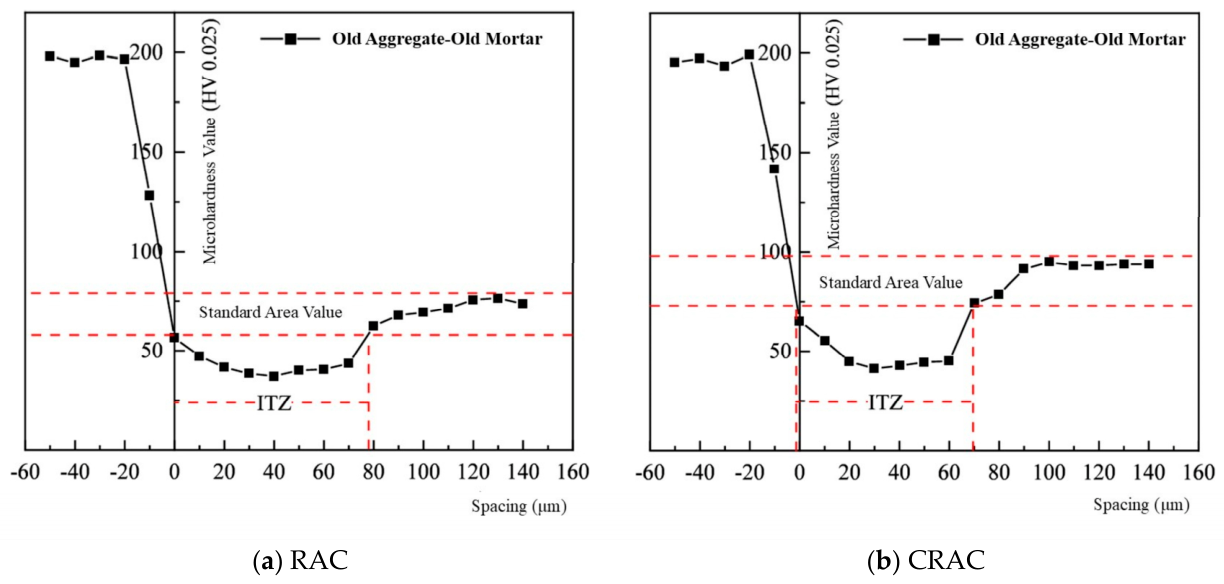
Figure 10a,b illustrate the microhardness variations across the old aggregate-old mortar interface for both RAC and CRAC. The results indicate that carbonation treatment did not significantly alter the microhardness of the old aggregate itself, with average values remaining around 196 kgf/mm2 for both groups. These values were substantially higher than those of the old mortar matrix and the ITZ, with the ITZ consistently exhibiting the lowest microhardness. This stability occurred because the carbonation reaction was primarily concentrated within the adhered old mortar and did not affect the aggregate core. Compared to the mortar matrix and the ITZ, the aggregate possessed higher inherent strength and a more stable structure, resulting in higher microhardness with minimal fluctuations. Conversely, the cement paste within the ITZ was relatively porous, leading to lower structural strength and correspondingly lower microhardness values than the surrounding mortar matrix.
As shown in Figure 10a, the average microhardness values for the old mortar matrix and its ITZ with the old aggregate in untreated RAC were 70.9 kgf/mm2 and 43.1 kgf/mm2, respectively; for carbonated RAC, these values increased to 89.1 kgf/mm2 and 48.4 kgf/mm2. Carbonation treatment not only enhanced the hardness of both the old mortar and the ITZ but also reduced the ITZ width by 10–15 μm (Figure 10b), demonstrating its effectiveness in improving the micro-mechanical properties of these regions. This improvement was primarily attributed to the carbonation reaction consuming the oriented CH crystals within the ITZ, while the resulting CaCO3 and silica gel products agglomerated to fill cracks and pores, thereby increasing the overall density and structural integrity of the aggregate.

4.4.2. Old Mortar-New Mortar Interface

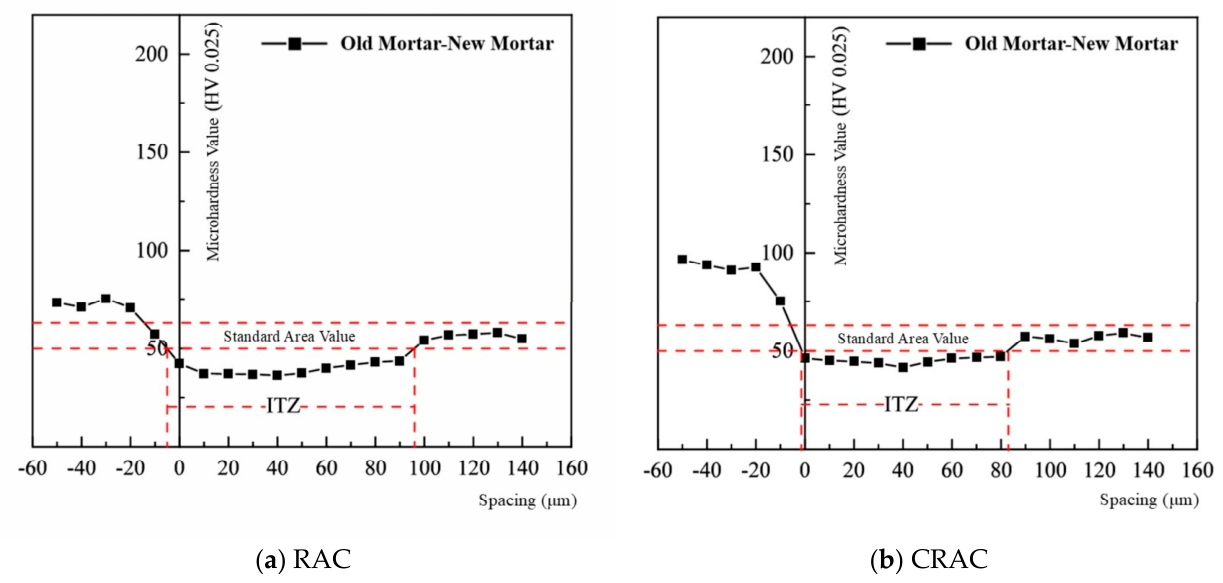
Figure 11 illustrates the microhardness variation across the old mortar-new mortar interface of RAC before and after carbonation treatment. Following carbonation, the microhardness values of both the old mortar matrix and its ITZ with the new mortar increased to varying degrees, while the ITZ width decreased; these observations were consistent with the results previously presented in Figure 11.
The improvement in the microhardness of the old mortar matrix was primarily due to the same mechanisms described for the old aggregate–old mortar interface. In contrast, for the old mortar–new mortar ITZ, the average microhardness values for the untreated and carbonated RAC were 39.8 kgf/mm2 and 45.2 kgf/mm2, respectively. The enhancement in microhardness and the reduction in ITZ width were more pronounced at this interface than at the old aggregate–old mortar interface. This phenomenon can be attributed to the fact that carbonation improved the adhered old mortar by consuming CH and reducing porosity. Consequently, the lower water absorption of the carbonated aggregate mitigated the localized increase in the W/C ratio, facilitating a tighter bond at the interface. Furthermore, the water absorption and subsequent release characteristics of the old mortar may have promoted secondary hydration in the ITZ adjacent to the new mortar, thereby contributing to the relatively higher strength gain. Notably, the microhardness of the new mortar in both RAC and CRAC was lower than that of the old mortar and remained largely unchanged after carbonation. This difference may be related to the original characteristics and hydration history of the adhered old mortar. However, because the parent concrete characteristics of the RA were not fully known, this interpretation should be treated with caution. The hardness of the old mortar may vary depending on factors such as the original concrete strength, binder composition, service age, and environmental exposure history. Therefore, the higher microhardness of the old mortar should not be attributed solely to longer hydration age or more complete hydration, but rather to the combined influence of its original material characteristics and subsequent carbonation modification. In contrast, the new mortar did not directly undergo carbonation treatment, resulting in relatively lower hardness values and negligible differences between the untreated and carbonated groups.

4.5. Models

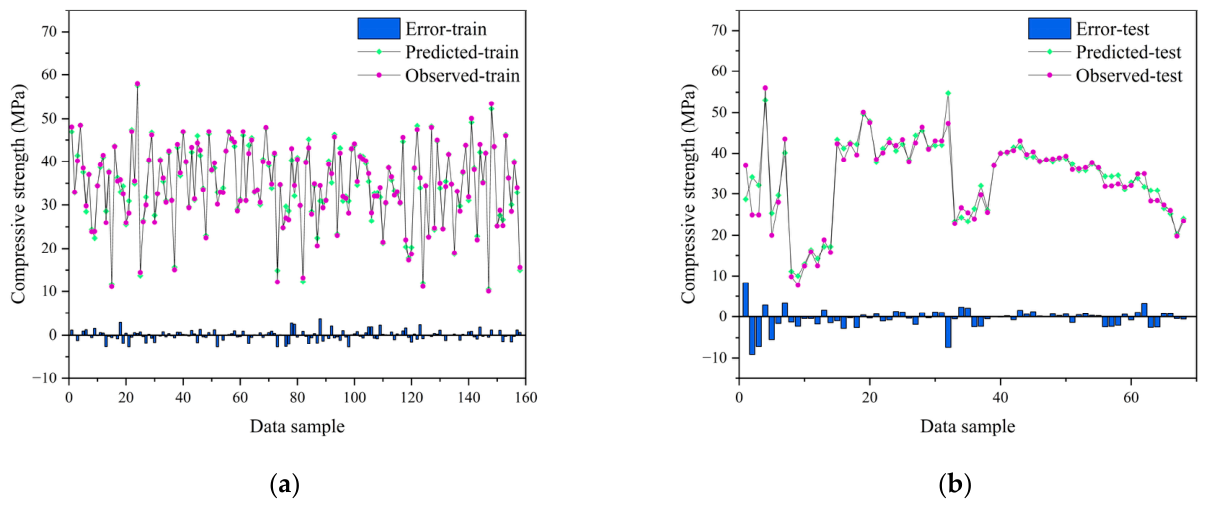
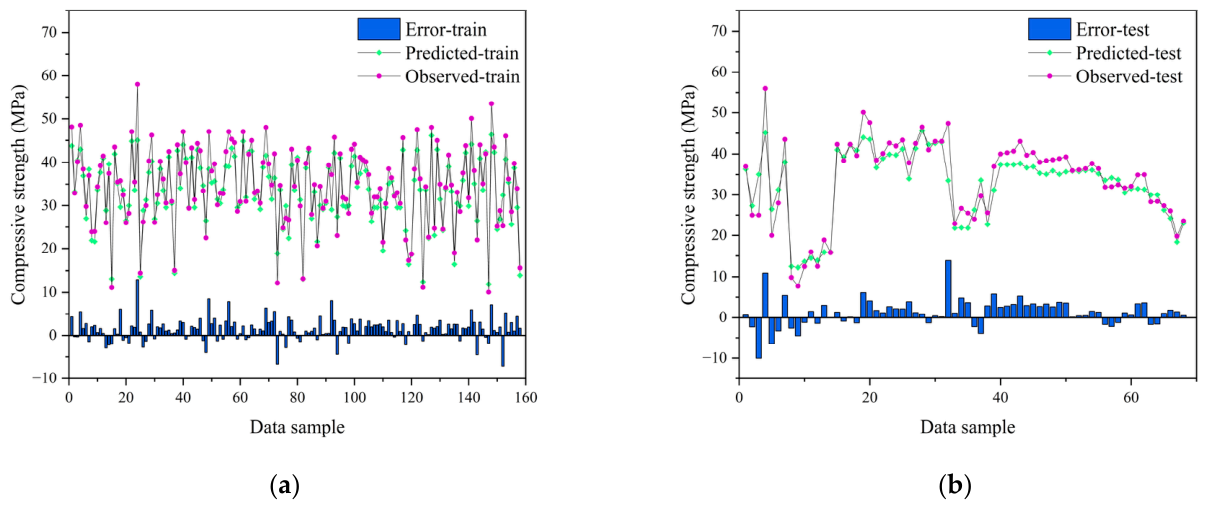
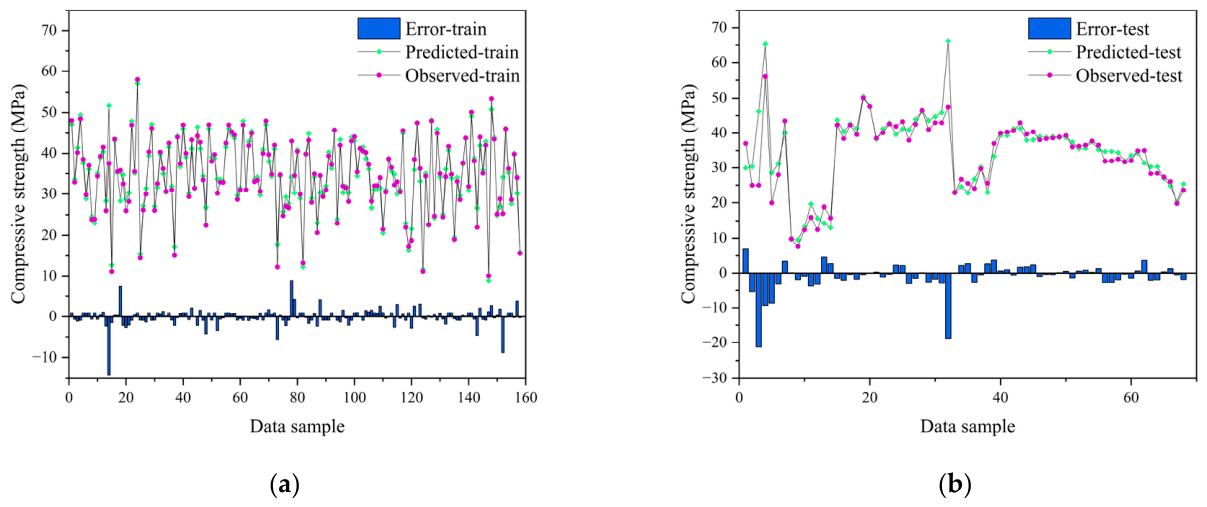
To rigorously assess the generalization capabilities of the predictive models, the compiled dataset of 226 experimental groups was partitioned into a training subset (70%, 158 groups) and a testing subset (30%, 68 groups). As illustrated in Figure 12, Figure 13 and Figure 14, a comparative analysis of predicted versus actual compressive strength reveals significant disparities in model efficacy. The GPR model demonstrated a remarkable congruence between predicted and observed values, exhibiting minimal deviation. Conversely, the SVM and EDT models yielded comparatively larger errors. Overall, the GPR model consistently outperformed its counterparts across both training and validation phases, establishing itself as the most accurate and reliable predictor among the evaluated machine learning algorithms.
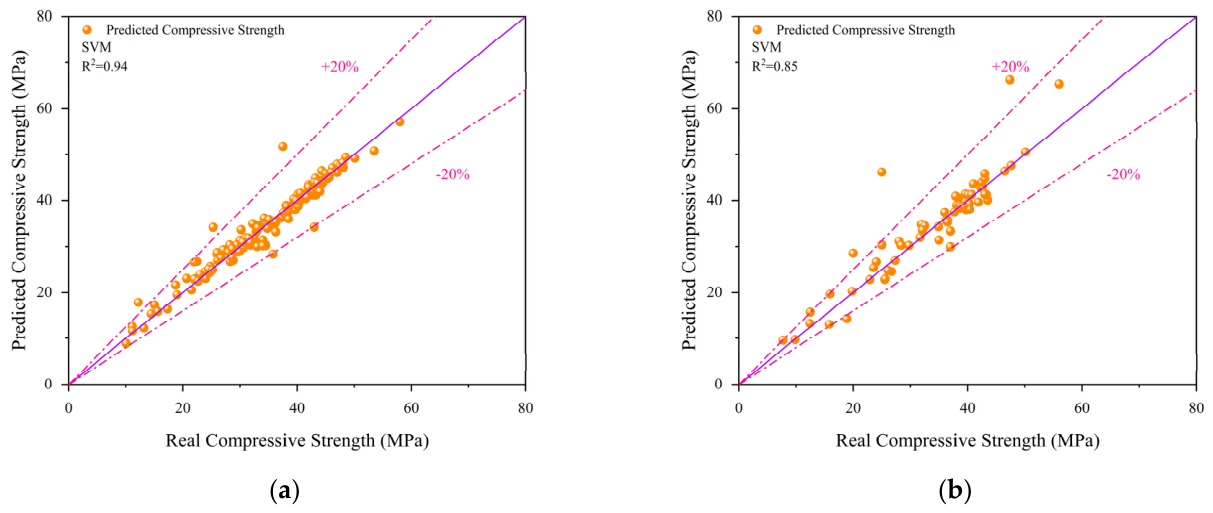
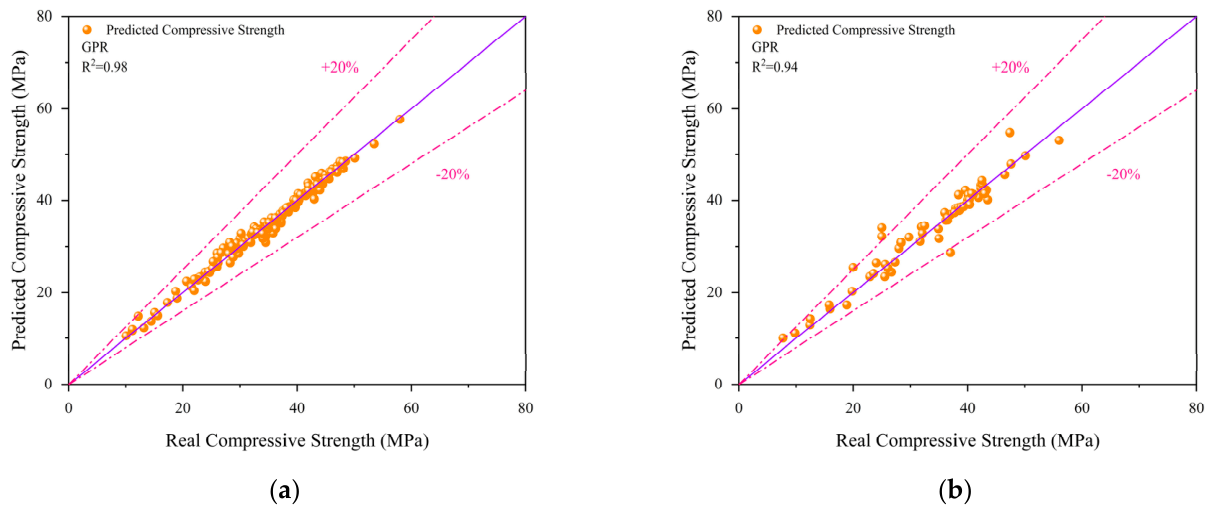
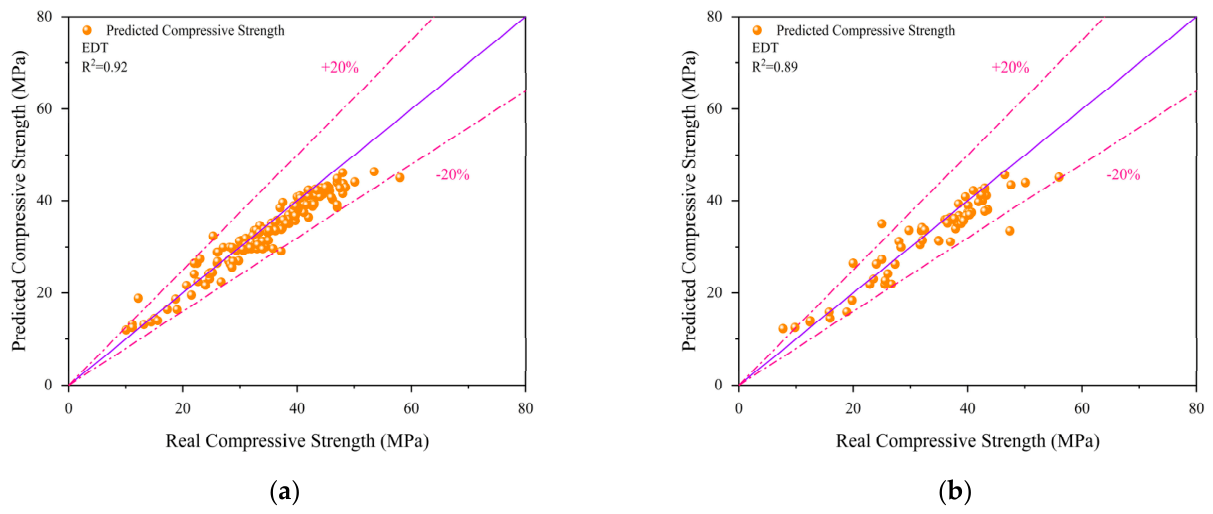
The regression performance of the three machine learning models for estimating the compressive strength of carbonated recycled aggregate concrete is compared in Figure 15, Figure 16 and Figure 17, where panels (a) and (b) respectively depict the outcomes for the training and testing subsets. A direct comparison across the GPR, EDT, and SVM approaches reveals that GPR delivered the most accurate predictions. In the training stage, the GPR model attained a coefficient of determination of 0.98, with the predicted values tightly distributed along the line of equality (y = x) and almost entirely confined within the ±20% deviation boundaries, reflecting a remarkably strong fit. When evaluated on the testing data, the EDT and SVM models yielded R2 scores of 0.89 and 0.85, respectively. Although the majority of their estimates still fell inside the ±20% error margins, these points exhibited noticeably wider dispersion relative to the GPR results, and a number of SVM predictions lay well beyond the ±20% thresholds. Taken together, these observations indicate that GPR considerably surpassed the two alternative methods in both fitting quality and predictive consistency, underscoring its outstanding accuracy and dependability.
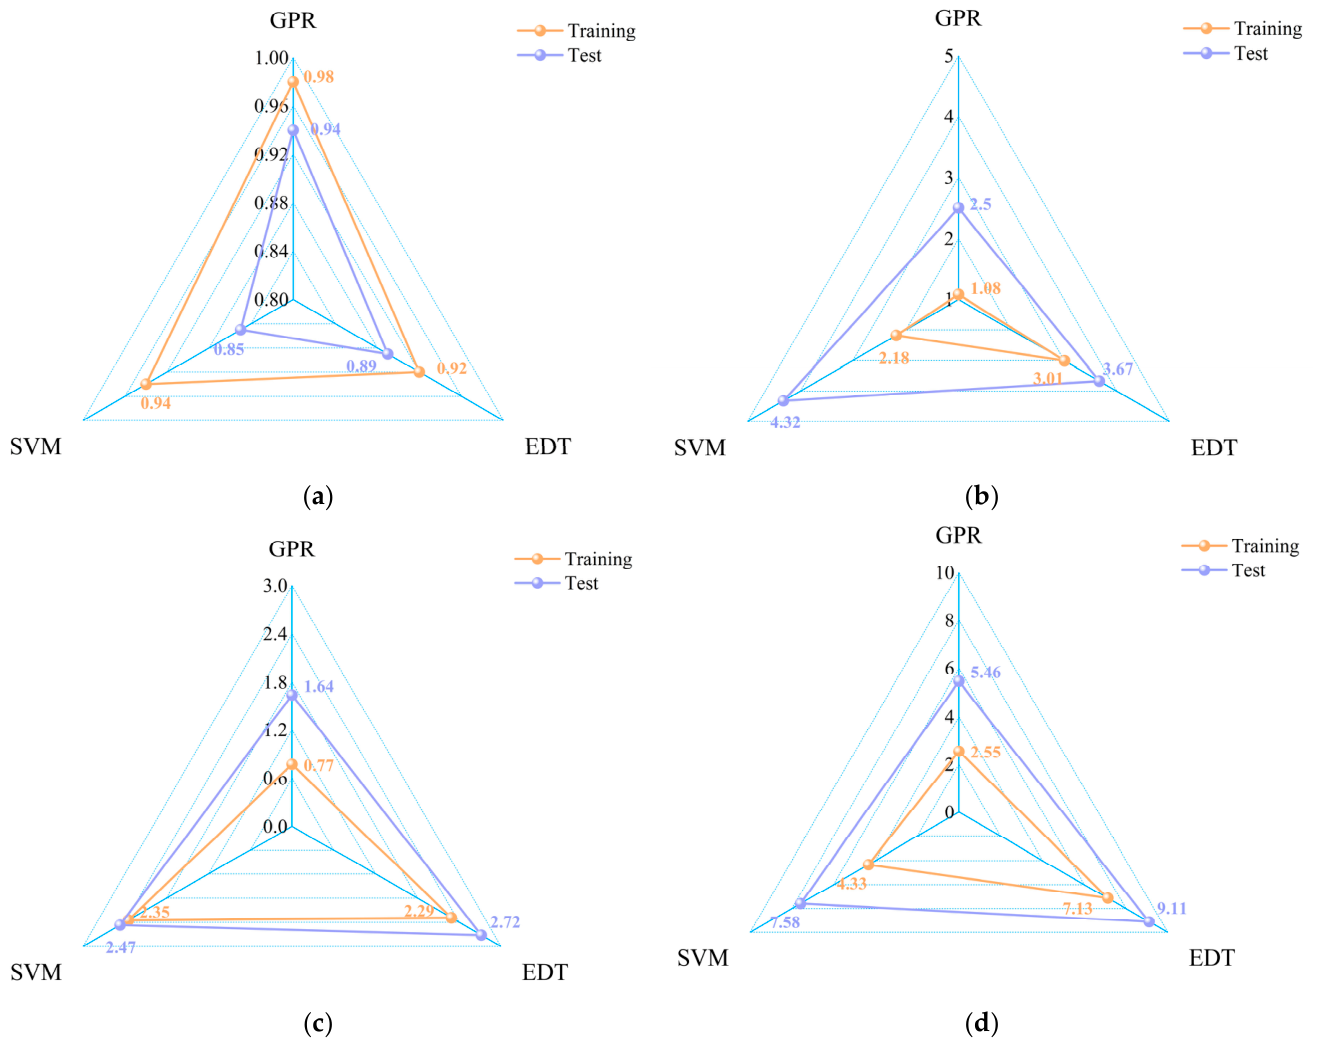
A radar chart in Figure 18 provides an intuitive comparison among the three machine learning models across four evaluation criteria, namely R2, RMSE, MAE, and MAPE, for predicting the compressive strength of CRAC. The results clearly demonstrate that the GPR model consistently yielded superior performance relative to both the SVM and EDT models on every evaluated indicator. With respect to the goodness-of-fit measure R2, GPR attained a training value of 0.98 and a testing value of 0.94, exceeding the corresponding scores of SVM (0.94 and 0.85) and EDT (0.92 and 0.89). This outcome highlights the stronger explanatory capacity and better generalization ability of the GPR approach. The superiority of GPR became even more evident when examining the three error-related metrics. Specifically, its training and testing RMSE stood at 1.08 and 2.5, MAE at 0.77 and 1.64, and MAPE at 2.55% and 5.46%, all of which were the lowest among the three competing models and substantially below those produced by SVM (RMSE: 2.18, 4.32; MAE: 2.35, 2.47; MAPE: 4.33%, 7.58%) and EDT (RMSE: 3.01, 3.67; MAE: 2.29, 2.72; MAPE: 7.13%, 9.11%). Moreover, the performance gap between the training and testing phases was narrowest for the GPR model, whereas both SVM and EDT exhibited a marked outward divergence on the testing dataset. This observation further supports that GPR possessed the greatest stability and the least susceptibility to overfitting. Taken collectively, the GPR model markedly surpassed SVM and EDT in prediction accuracy, robustness, and the capacity to generalize to previously unseen data.
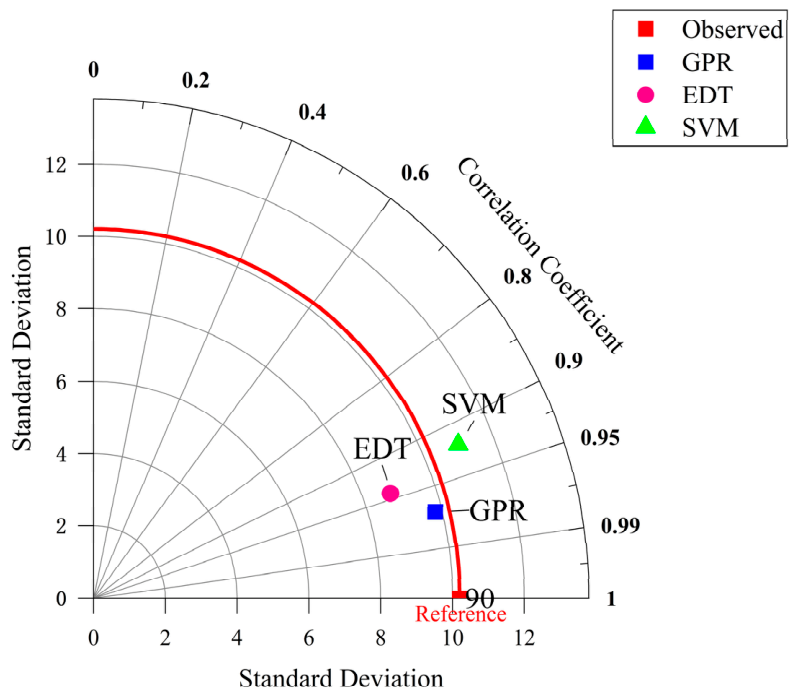
To comprehensively evaluate the predictive performance of the different machine learning models (GPR, EDT, and SVM), a Taylor diagram (Figure 19) was employed to visually compare the simulated results with the observed reference data. The Taylor diagram integrated the correlation coefficient, standard deviation, and root-mean-square deviation (RMSD) into a single two-dimensional polar coordinate system. A model’s proximity to the reference point on the horizontal axis indicates its overall simulation accuracy, where a shorter distance represents higher predictive performance [72].
As clearly observed in Figure 19, GPR significantly outperformed the other two models across three key statistical metrics. First, regarding the correlation coefficient, the polar angle for GPR was closest to 1, with values ranging from 0.95 to 0.99 (notably higher than those of SVM and EDT), indicating that GPR predictions exhibited the highest consistency with actual observed trends. Second, the solid red arc representing the standard deviation of the measured data (approximately 10) served as a critical benchmark for capturing data volatility. The GPR data point aligned almost perfectly with this reference arc, meaning it accurately reproduced the inherent variability and dispersion of the observed sequence; in contrast, the standard deviations for EDT and SVM (approximately 8.5 and 9, respectively) failed well below the reference line, suggesting an underestimation of the true data fluctuations. Finally, the linear geometric distance from each model’s point to the red reference point on the horizontal axis shows that GPR had the shortest distance, representing the smallest centered RMSD and the lowest overall prediction bias. In summary, whether considering trend fitting, the ability to capture real variability, or the control of absolute prediction error, the GPR model demonstrated exceptional predictive performance and high robustness, proving it to be the more precise and reliable modeling approach in this research context.
To summarize, of the three machine learning techniques evaluated in this work, the GPR model exhibited the most reliable predictive capability for the compressive strength of CRAC, consistently exceeding the performance of both the SVM and the EDT across every assessment criterion, namely R2, RMSE, MAE, and MAPE. The superior performance of the GPR model was attributed to the high compatibility between its algorithmic characteristics and the specific nature of the experimental data. This study involved 12 input parameters with complex nonlinear relationships; as a Bayesian-based non-parametric model, GPR possessed inherent advantages in addressing such high-dimensional, small-sample, and highly nonlinear regression problems [73,74,75]. It effectively captured intricate data patterns through its kernel functions while providing a quantification of predictive uncertainty [76,77]. Consequently, in the task of predicting the strength of CRAC influenced by multi-parameter interactions, the GPR model demonstrated greater accuracy, robustness, and generalization capability than the SVM and EDT models.
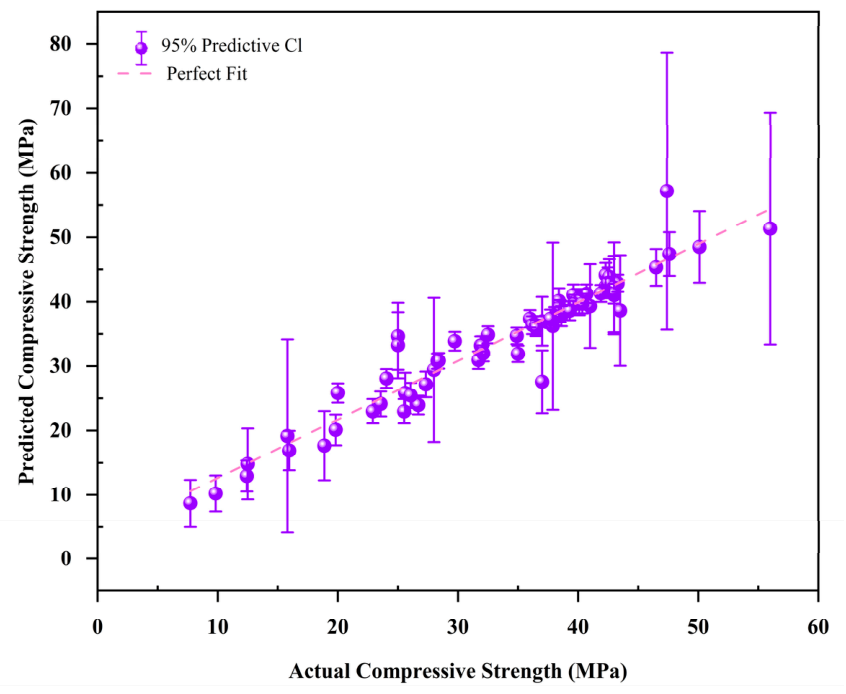
To further illustrate another key advantage of the GPR model—its ability to quantify predictive uncertainty—Figure 20 presents the predicted mean compressive strength along with the corresponding 95% confidence intervals (error bars) for the test set. As shown in Figure 20, the GPR predictions generally follow the ideal fitting line, indicating that the model captures the overall trend of compressive strength variation well. Unlike conventional point predictions, this figure further provides the 95% prediction confidence intervals for each individual sample, reflecting the model’s uncertainty estimation for each prediction. In the medium-strength range, where the samples are relatively concentrated, the predicted points are close to the ideal fitting line and the confidence intervals are relatively narrow, demonstrating high prediction stability in this region. In contrast, the confidence intervals become notably wider in both the low-strength and high-strength ranges. This is especially evident at the high-strength end, where several samples exhibit considerably larger predictive uncertainty, likely due to the limited number of samples in this region, sparse data distribution, or higher local variability. The fact that most of the ideal fitting line falls within or close to the 95% prediction confidence intervals suggests that the uncertainty estimates provided by the GPR model are generally reasonable. For the few samples whose predicted mean deviates from the ideal fitting line, the wider confidence intervals indicate that the model can identify the higher uncertainty associated with these predictions, thereby avoiding over-confident interpretations of single point estimates.
Although the GPR model exhibited the best predictive performance among the three models, its generalization capability should be interpreted within the parameter ranges covered by the current dataset. The database used in this study contained 226 records with 12 input variables, which remains relatively limited for nonlinear machine learning models, especially considering the high heterogeneity of CRAC data collected from different literature sources and original experiments. In addition, several variables showed concentrated distributions. For example, most curing ages were close to 28 days, CO2 concentrations were largely concentrated near 99%, and compressive strength values were mainly distributed within the 30–50 MPa range. Such uneven data distribution may introduce dataset bias and reduce the robustness of the model in sparsely represented regions. Therefore, the high testing accuracy of the GPR model indicates good predictive reliability mainly within the trained parameter space, rather than unrestricted extrapolation capability. Predictions for conditions outside the current data range, such as low-CO2 carbonation environments, longer curing ages, ultra-high-strength CRAC above 60 MPa, or RA from substantially different regional material systems, should be treated with caution. The wider confidence intervals observed in the low- and high-strength regions also indicate that prediction uncertainty increases when the sample density is low. Future studies should expand the database by incorporating more balanced data covering different CO2 concentrations, curing ages, strength grades, aggregate sources, and regional material systems. Such expansion will be necessary to further improve model robustness, reduce dataset bias, and validate the extrapolation capability of machine learning models for CRAC strength prediction.

4.6. Sensitive Analysis

To interpret the internal logic of the top-performing model and assess the relative influence of each input variable on the compressive strength of CRAC, a global sensitivity investigation was performed using the Shapley Additive Explanations (SHAP) algorithm. SHAP is a widely recognized approach in the field of interpretable machine learning, which decomposes a prediction by evaluating the incremental contribution of every feature over all possible subsets of features [78,79]. By doing so, it allocates balanced and stable importance scores to different variables, thereby enhancing both the transparency and interpretability of the model [80,81]. The subsequent analysis places emphasis on revealing the role of carbonation process parameters, with the goal of establishing a connection between the data-driven predictive outcomes and the fundamental physical mechanisms responsible for strength development.
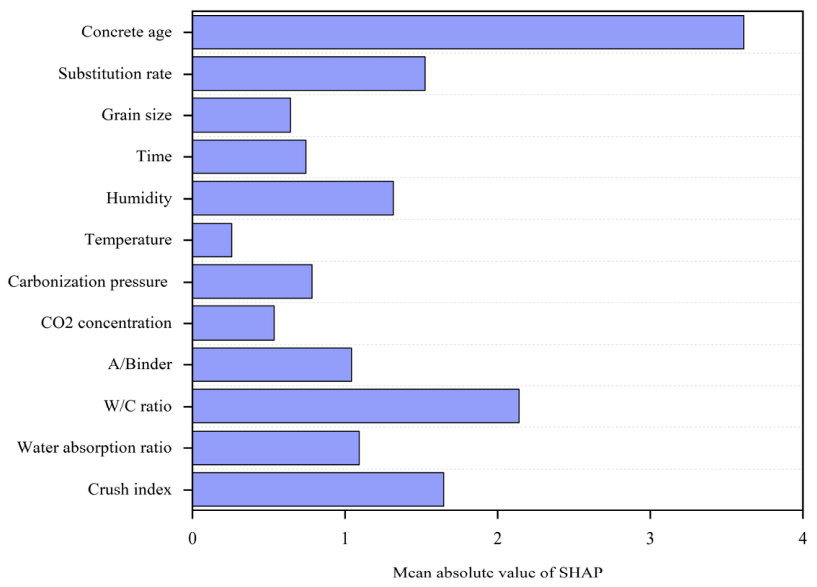
The SHAP analysis results (Figure 21) clearly illustrate the global importance ranking of each parameter in the GPR model. Concrete age, W/C ratio, substitution rate, and the initial crush index of the recycled aggregate were identified as the most influential factors affecting the compressive strength of CRAC. This result is consistent with the basic strength formation mechanism of concrete. Concrete age reflects the continuous development of hydration products, the W/C ratio governs the compactness of the cement matrix and ITZs, the substitution rate determines the proportion of recycled aggregates and weak interfaces, and the crush index represents the initial mechanical quality of RA. In particular, the high importance of the W/C ratio mainly reflects its fundamental physical role in controlling matrix porosity and ITZ quality; however, the possible influence of dataset distribution cannot be completely excluded and should be considered when interpreting the SHAP ranking. In addition to these basic material and mixture parameters, carbonation-related variables, including relative humidity, CO2 concentration, carbonation pressure, and carbonation duration, also showed noticeable contributions in Figure 21. These results indicate that carbonation process conditions participate in regulating the final compressive strength by modifying the physical quality of RA and the microstructure of the adhered old mortar. However, the SHAP ranking should be interpreted as a data-driven global sensitivity result within the current dataset, rather than as direct proof of an individual physical mechanism.
The physical interpretation of the SHAP results can be further supported by the XRD, SEM, and microhardness analyses presented in Figure 8, Figure 9, Figure 10 and Figure 11. As shown in Figure 8, the newly added XRD results qualitatively confirmed the formation of CaCO3 after carbonation treatment, as indicated by the weakened portlandite-related diffraction peaks and the enhanced calcite-related peaks. This provides phase-level evidence that carbonation reactions occurred in the adhered old mortar of RA. The SEM observations in Figure 9 further show that, compared with untreated RA, the surface of carbonated RA became denser, and pores and microcracks were partially filled by carbonation products. These observations explain why carbonation-related parameters in Figure 21, such as relative humidity, CO2 concentration, carbonation pressure, and carbonation duration, contributed to strength prediction: these parameters directly affect CO2 diffusion, carbonation reaction efficiency, and the filling effect of carbonation products in the old mortar.
Furthermore, the microhardness results presented in Figure 10 and Figure 11 provide micromechanical evidence for the improvement of the interfacial transition zone (ITZ) suggested by the SHAP analysis. As shown in Figure 10, after carbonation, the microhardness of the old mortar matrix increased from 70.9 kgf/mm2 to 89.1 kgf/mm2, while that of the old aggregate–old mortar ITZ increased from 43.1 kgf/mm2 to 48.4 kgf/mm2, and the ITZ width decreased by approximately 10–15 μm. Similarly, Figure 11 shows that the microhardness of the old mortar–new mortar ITZ increased from 39.8 kgf/mm2 to 45.2 kgf/mm2 after carbonation. These results indicate that the improvement in RA quality and ITZ compactness observed at the microstructural level is consistent with the importance of crush index, water absorption, substitution rate, and carbonation process parameters identified by SHAP in Figure 21. Nevertheless, these microstructural parameters were not directly incorporated into the ML model because quantitative indicators such as porosity, CaCO3 content, ITZ width, and local hardness values were only available from the in-house experiments and were not consistently reported in the literature database. Therefore, the XRD, SEM, and microhardness results should be regarded as supporting physical evidence for the SHAP-based interpretation rather than direct model inputs. Future studies should establish larger datasets containing standardized microstructural descriptors to quantitatively link microstructure evolution with ML-based strength prediction.

5. Conclusions

This study systematically evaluated the compressive strength of CRAC and its corresponding predictive models through an integrated approach of experimental testing and machine learning, leading to the following conclusions:
(1)
Experimental results demonstrate that carbonation treatment effectively enhanced the physical properties of RA, such as reducing water absorption and improving the crush index, and significantly increased the macroscopic compressive strength of concrete by up to 16.22%. The XRD results qualitatively confirmed the formation of CaCO3 after carbonation, while SEM and microhardness analyses further indicated that carbonation products were associated with pore filling, microcrack densification, and ITZ improvement. This process simultaneously achieved the permanent sequestration of CO2, offering substantial environmental benefits.
(2)
Within the framework of 12 key input parameters, including RA properties, carbonation process conditions, mix proportions, and curing age, the GPR model demonstrates exceptional predictive performance and robustness. It achieved a high coefficient of determination (R2 = 0.94) on the testing set, with error metrics (RMSE: 1.08 MPa, MAE: 0.77 MPa, MAPE: 2.55%) significantly lower than those of the SVM and EDT models, proving the superior capability of GPR in handling such high-dimensional, nonlinear problems.
(3)
Global sensitivity analysis based on SHAP quantitatively revealed the contribution of each input parameter to the compressive strength of the concrete. Concrete curing age was identified as the most critical factor, followed by the aggregate substitution rate and the W/C ratio. The analysis further confirmed that carbonation process parameters, particularly relative humidity and CO2 concentration, exerted a definite and significant regulatory effect on final strength, validating from a data perspective the effectiveness of carbonation treatment as an active performance enhancement method.
(4)
Microstructural characterization, including XRD, SEM, and microhardness testing, correlated well with the machine learning sensitivity analysis, forming a more complete evidentiary chain from intelligent prediction to mechanistic explanation. XRD qualitatively confirmed the formation of CaCO3 after carbonation treatment, SEM revealed the densification and pore-filling morphology of carbonated RA, and microhardness testing verified the strengthening of both the old aggregate–old mortar and old mortar–new mortar ITZs. These findings provided phase-level, microstructural, and micromechanical support for the observed improvements in macroscopic performance.

Author Contributions

Conceptualization, J.Z., Y.S. and J.L.; Methodology, Z.C.; Software, S.Y. and Y.Y.; Validation, B.L. and Z.C.; Formal analysis, J.Z. and M.Z.; Investigation, C.B.; Resources, C.B.; Data curation, S.Y. and B.L.; Writing—original draft, J.Z.; Writing—review & editing, S.Y., B.L., Z.C., Y.S., C.B., M.Z., Y.Y. and J.L.; Visualization, M.Z.; Supervision, Y.Y. and J.L.; Project administration, J.L.; Funding acquisition, Y.S. and J.L. All authors have read and agreed to the published version of the manuscript.

Funding

This research is supported by the Postgraduate Innovation Program of Chongqing University of Science and Technology (YKJCX2520715); Research Foundation of Chongqing University of Science and Technology (ckrc20241225); Chongqing Overseas Returnees’ Entrepreneurship and Innovation Support Program (cx2025065); Science and Technology Research Program of Chongqing Municipal Education Commission (KJQN202401510); Key Natural Science Foundation of Chongqing Municipal Science and Technology Bureau (CSTB2025NSCQ-LZX0114); the project of Natural Science Foundation of Chongqing municipality (CSTB2025NSCQ-GPX0216); the project of Chongqing Construction science and Technology Plan (2024 No. 3-4).

Data Availability Statement

Data are contained within the article.

Acknowledgments

The authors would like to appreciate the financial supports from the funding body.

Conflicts of Interest

The authors declare no conflicts of interest.

References

  1. Altuncı, Y.T. A Comprehensive Study on Concrete Produced with Recycled Concrete Aggregate (RCA). Buildings 2026, 16, 1776. [Google Scholar] [CrossRef]
  2. Deng, X.; Guo, H.; Tan, H.; He, X.; Zheng, Z.; Su, Y.; Yang, J. An accelerator prepared from waste concrete recycled powder and its effect on hydration of cement-based materials. Constr. Build. Mater. 2021, 296, 123767. [Google Scholar] [CrossRef]
  3. Ginga, C.P.; Ongpeng, J.M.C.; Daly, M.K.M. Circular Economy on Construction and Demolition Waste: A Literature Review on Material Recovery and Production. Materials 2020, 13, 2970. [Google Scholar] [CrossRef] [PubMed]
  4. Alibeigibeni, A.; Stochino, F.; Zucca, M.; Gayarre, F.L. Enhancing Concrete Sustainability: A Critical Review of the Performance of Recycled Concrete Aggregates (RCAs) in Structural Concrete. Buildings 2025, 15, 1361. [Google Scholar] [CrossRef]
  5. Jagadesh, P.; Karthik, K.; Kalaivani, P.; Karalar, M.; Althaqafi, E.; Madenci, E.; Özkılıç, Y.O. Examining the Influence of Recycled Aggregates on the Fresh and Mechanical Characteristics of High-Strength Concrete: A Comprehensive Review. Sustainability 2024, 16, 9052. [Google Scholar] [CrossRef]
  6. Özkılıç, Y.O.; Althaqafi, E.; Karalar, M.; Aksoylu, C. Shear and flexural performance of reinforced concrete beams with recycled concrete aggregates. Rev. Adv. Mater. Sci. 2025, 64, 20250140. [Google Scholar] [CrossRef]
  7. Memon, S.A.; Bekzhanova, Z.; Murzakarimova, A. A Review of Improvement of Interfacial Transition Zone and Adherent Mortar in Recycled Concrete Aggregate. Buildings 2022, 12, 1600. [Google Scholar] [CrossRef]
  8. Muhammad, F.; Harun, M.; Ahmed, A.; Kabir, N.; Khalid, H.R.; Hanif, A. Influence of bonded mortar on recycled aggregate concrete properties: A review. Constr. Build. Mater. 2024, 432, 136564. [Google Scholar] [CrossRef]
  9. Wang, D.; Lu, C.; Zhu, Z.; Zhang, Z.; Liu, S.; Ji, Y.; Xing, Z. Mechanical performance of recycled aggregate concrete in green civil engineering: Review. Case Stud. Constr. Mater. 2023, 19, e02384. [Google Scholar] [CrossRef]
  10. Jamil, S.; Idrees, M.; Akbar, A.; Ahmed, W. Investigating the Mechanical and Durability Properties of Carbonated Recycled Aggregate Concrete and Its Performance with SCMs. Buildings 2025, 15, 201. [Google Scholar] [CrossRef]
  11. Lin, M.; Li, X.; Wei, M.; Xie, Q. Experimental Study on Carbonization and Strengthening Performance of Recycled Aggregate. Buildings 2025, 15, 2309. [Google Scholar] [CrossRef]
  12. Hosseini Zadeh, A.; Mamirov, M.; Kim, S.; Hu, J. CO2-treatment of recycled concrete aggregates to improve mechanical and environmental properties for unbound applications. Constr. Build. Mater. 2021, 275, 122180. [Google Scholar] [CrossRef]
  13. Dündar, B.; Tuğluca, M.S.; İlcan, H.; Şahin, O.; Şahmaran, M. The effects of various operational- and materials-oriented parameters on the carbonation performance of low-quality recycled concrete aggregate. J. Build. Eng. 2023, 68, 106138. [Google Scholar] [CrossRef]
  14. Zhang, T.; Chen, M.; Wang, Y.; Zhang, M. Roles of carbonated recycled fines and aggregates in hydration, microstructure and mechanical properties of concrete: A critical review. Cem. Concr. Compos. 2023, 138, 104994. [Google Scholar] [CrossRef]
  15. Zhang, J.; Shi, C.; Li, Y.; Pan, X.; Poon, C.-S.; Xie, Z. Performance Enhancement of Recycled Concrete Aggregates through Carbonation. J. Mater. Civ. Eng. 2015, 27, 04015029. [Google Scholar] [CrossRef]
  16. Lu, J.; Cai, Z.; Gao, Y.; Yin, Y.; Ma, Z.; Liang, C. Effects of pretreatment methods on the properties of recycled aggregates and prepared concrete under CO2-curing. Case Stud. Constr. Mater. 2023, 18, e01826. [Google Scholar] [CrossRef]
  17. Wu, J. Effects of Carbonated Recycled Concrete Aggregate on Mechanical Properties of Concrete and Micro-Properties of Interfacial Transition Zone. Ceramics-Silikáty 2022, 66, 113–127. [Google Scholar] [CrossRef]
  18. Pan, G.; Zhan, M.; Fu, M.; Wang, Y.; Lu, X. Effect of CO2 curing on demolition recycled fine aggregates enhanced by calcium hydroxide pre-soaking. Constr. Build. Mater. 2017, 154, 810–818. [Google Scholar] [CrossRef]
  19. Zhan, B.J.; Xuan, D.X.; Poon, C.S.; Shi, C.J. Effect of curing parameters on CO2 curing of concrete blocks containing recycled aggregates. Cem. Concr. Compos. 2016, 71, 122–130. [Google Scholar] [CrossRef]
  20. Zhan, B.J.; Poon, C.S.; Shi, C.J. Materials characteristics affecting CO2 curing of concrete blocks containing recycled aggregates. Cem. Concr. Compos. 2016, 67, 50–59. [Google Scholar] [CrossRef]
  21. Luo, S.; Ye, S.; Xiao, J.; Zheng, J.; Zhu, Y. Carbonated recycled coarse aggregate and uniaxial compressive stress-strain relation of recycled aggregate concrete. Constr. Build. Mater. 2018, 188, 956–965. [Google Scholar] [CrossRef]
  22. Gao, Y.; De Schutter, G.; Ye, G.; Tan, Z.; Wu, K. The ITZ microstructure, thickness and porosity in blended cementitious composite: Effects of curing age, water to binder ratio and aggregate content. Compos. Part B Eng. 2014, 60, 1–13. [Google Scholar] [CrossRef]
  23. Lu, C.; Yu, Q.; Wei, J.; Niu, Y.; Zhang, Y.; Lin, C.; Chen, P.; Shi, C.; Yang, P. Influence of interface transition zones (ITZ) and pore structure on the compressive strength of recycled aggregate concrete. Constr. Build. Mater. 2024, 456, 139299. [Google Scholar] [CrossRef]
  24. Xue, K.; Wan, C.; Xu, Y.; Jiang, Y.; Cheng, Y. Effect of pre-hydration age on phase assemblage, microstructure and compressive strength of CO2 cured cement mortar. Constr. Build. Mater. 2022, 325, 126760. [Google Scholar] [CrossRef]
  25. Peng, Y.; Unluer, C. Modeling the mechanical properties of recycled aggregate concrete using hybrid machine learning algorithms. Resour. Conserv. Recycl. 2023, 190, 106812. [Google Scholar] [CrossRef]
  26. Tran, V.Q.; Dang, V.Q.; Ho, L.S. Evaluating compressive strength of concrete made with recycled concrete aggregates using machine learning approach. Constr. Build. Mater. 2022, 323, 126578. [Google Scholar] [CrossRef]
  27. Zhao, Z.; Liu, Y.; Lu, Y.; Ji, C.; Lin, C.; Yao, L.; Pu, Z.; de Brito, J. Prediction of properties of recycled aggregate concrete using machine learning models: A critical review. J. Build. Eng. 2024, 90, 109516. [Google Scholar] [CrossRef]
  28. Mohamud, M.A.; Alasiri, M.R.; Ozdoner, N.; Yildizel, S.A.; Ozkilic, Y.O. Physics-guided machine learning framework for RCA concrete by experimental database, modelling, and statistical validation. Sci. Rep. 2026, 16, 7907. [Google Scholar] [CrossRef] [PubMed]
  29. Zhang, X.; Dai, C.; Li, W.; Chen, Y. Prediction of compressive strength of recycled aggregate concrete using machine learning and Bayesian optimization methods. Front. Earth Sci. 2023, 11, 1112105. [Google Scholar] [CrossRef]
  30. Alkharisi, M.K.; Dahish, H.A. The Application of Response Surface Methodology and Machine Learning for Predicting the Compressive Strength of Recycled Aggregate Concrete Containing Polypropylene Fibers and Supplementary Cementitious Materials. Sustainability 2025, 17, 2913. [Google Scholar] [CrossRef]
  31. Phoeuk, M.; Kwon, M. Accuracy Prediction of Compressive Strength of Concrete Incorporating Recycled Aggregate Using Ensemble Learning Algorithms: Multinational Dataset. Adv. Civ. Eng. 2023, 2023, 5076429. [Google Scholar] [CrossRef]
  32. Tam, V.W.Y.; Butera, A.; Le, K.N.; Silva, L.C.F.D.; Evangelista, A.C.J. A prediction model for compressive strength of CO2 concrete using regression analysis and artificial neural networks. Constr. Build. Mater. 2022, 324, 126689. [Google Scholar] [CrossRef]
  33. de-Prado-Gil, J.; Palencia, C.; Silva-Monteiro, N.; Martínez-García, R. To predict the compressive strength of self compacting concrete with recycled aggregates utilizing ensemble machine learning models. Case Stud. Constr. Mater. 2022, 16, e01046. [Google Scholar] [CrossRef]
  34. Liu, G.; Li, Q.; Song, J.; Wang, L.; Liu, H.; Guo, Y.; Yue, G. Quantitative Analysis of Surface Attached Mortar for Recycled Coarse Aggregate. Materials 2021, 15, 257. [Google Scholar] [CrossRef] [PubMed]
  35. GB 175-2007; Common Portland Cement. Standards Press of China: Beijing, China, 2007.
  36. GB/T 50081-2019; Standard for Test Methods of Mechanical Properties on Ordinary Concrete. China Architecture & Building Press: Beijing, China, 2019.
  37. Xiao, J.; Deng, Q.; Duan, Z.; Hou, S.; Tao, J. Carbonation Modification of Recyled Fine Aggregate and Its Effect on Rheological Properties of. J. Basic Sci. Eng. 2024, 32, 1486–1495. [Google Scholar] [CrossRef]
  38. Liu, C.; Hao, H.; Liu, L.; Zhu, C. Test study on dynamic mechanical properties of pre-impregnated carbonized recycled aggregate concrete. J. Vib. Shock 2024, 43, 117–125+193. [Google Scholar] [CrossRef]
  39. Li, L.; Ziyabek, N.; Jiang, Y.; Xiao, J.; Poon, C.S. Effect of carbonation duration on properties of recycled aggregate concrete. Case Stud. Constr. Mater. 2023, 19, e02640. [Google Scholar] [CrossRef]
  40. Zhang, M.; Ding, Y.; Yang, X.; Sun, B. Mechanical properties and strengthening mechanism of fully recycled aggregate concrete prepared by nano-SiO2 composite carbonated recycled aggregates. Acta Mater. Compos. Sin. 2025, 42, 2102–2111. [Google Scholar] [CrossRef]
  41. Yan, X. Characterization of Carbonation-Treated Recycled Powder and Aggregates and Their Effects on the Properties of Cement-Based Materials. Master’s Thesis, Guangzhou University, Guangzhou, China, 2024. [Google Scholar]
  42. Li, H. Research on Accelerated Carbonation Efficiency of Recycled Concrete Aggregates and Fracture Properties of Carbonated Recycled Coarse Aggregate Concrete. Master’s Thesis, Guizhou University, Guiyang, China, 2024. [Google Scholar]
  43. Xia, X.; Liu, X.; Niu, D.; Xue, Z. Study on The Influence of Carbonized Recycled Aggregate on the Mechanical Properties of Concrete. Shaanxi Water Resour. 2024, 3, 9–12. [Google Scholar] [CrossRef]
  44. Gu, K.; Yang, L.; Ao, Q. Effect of Carbon-condition of Recycled Coarse Aggregate on Mechanical Properties of Concrete. Transp. Sci. Technol. 2022, 2022, 112–116. [Google Scholar] [CrossRef]
  45. Wu, L.; Guan, L.; Yang, X.; Li, T.; Hu, H.; Yuan, X. Effect of carbonated recycled aggregate on mechanical strength and durability of recycled aggregate concrete of port engineering. J. Waterw. Harb. 2022, 43, 370–376. [Google Scholar]
  46. Kou, S.-C.; Zhan, B.-J.; Poon, C.-S. Use of a CO2 curing step to improve the properties of concrete prepared with recycled aggregates. Cem. Concr. Compos. 2014, 45, 22–28. [Google Scholar] [CrossRef]
  47. Li, Y. Effect of Carbonation Treatment of Recycled Coarse Aggregate on Mechanical Properties and Microstructure of Recycled Concrete. Master’s Thesis, Henan Polytechnic University, Jiaozuo, China, 2022. [Google Scholar]
  48. Ning, W. Study on the Effect of Pre-Soaking Composite Carbonated Recycled Fine Aggregate on the Properties of Mortar. Master’s Thesis, Henan Polytechnic University, Jiaozuo, China, 2022. [Google Scholar]
  49. Wu, J. Study on the Mechanical Properties of Recycled Aggregate Concrete Prepared with Carbonated Aggregates and the Interfacial Transition Zones. Ph.D. Thesis, Henan Polytechnic University, Jiaozuo, China, 2022. [Google Scholar]
  50. Cheng, Y.; Meng, M. Effect of Carbonated Recycled Aggregate on the Properties of Concrete. New Build. Mater. 2021, 48, 57–60. [Google Scholar] [CrossRef]
  51. Cheng, W. Experimental Study on Bond Behavior Between Reinforcement and Recycled Concrete with Carbonized Aggregate. Master’s Thesis, Fuzhou University, Fuzhou, China, 2017. [Google Scholar]
  52. Lin, G. The Influences on Stress–Strain Curves of Recycled Concrete Enhanced by Recycled Aggregate Cured by CO2. Master’s Thesis, Fuzhou University, Fuzhou, China, 2017. [Google Scholar]
  53. Wang, J. Effects of Recycled Concrete Aggregate Carbonated Treatments on Permeability and ITZs of Recycled Aggregate Concrete. Master’s Thesis, Hunan University, Changsha, China, 2017. [Google Scholar]
  54. Cao, Z. The Effect of Recycled Aggregate Treated by Carbon Dioxide on Properties of Recycled Concrete. Master’s Thesis, Hunan University, Changsha, China, 2016. [Google Scholar]
  55. Ouyang, Y. Study on the Performance of Regenerated Fine Aggregate Polystyrene Particle Concrete by Carbonization Pretreatment. Master’s Thesis, Chongqing University of Science and Technology, Chongqing, China, 2023. [Google Scholar]
  56. Xuan, D.; Zhan, B.; Poon, C.S. Assessment of mechanical properties of concrete incorporating carbonated recycled concrete aggregates. Cem. Concr. Compos. 2016, 65, 67–74. [Google Scholar] [CrossRef]
  57. Zhan, B.J.; Xuan, D.X.; Zeng, W.; Poon, C.S. Carbonation treatment of recycled concrete aggregate: Effect on transport properties and steel corrosion of recycled aggregate concrete. Cem. Concr. Compos. 2019, 104, 103360. [Google Scholar] [CrossRef]
  58. Liang, C.; Lu, N.; Ma, H.; Ma, Z.; Duan, Z. Carbonation behavior of recycled concrete with CO2-curing recycled aggregate under various environments. J. CO2 Util. 2020, 39, 101185. [Google Scholar] [CrossRef]
  59. Tam, V.W.Y.; Butera, A.; Le, K.N. Carbon-conditioned recycled aggregate in concrete production. J. Clean. Prod. 2016, 133, 672–680. [Google Scholar] [CrossRef]
  60. Wan, L.; Qiao, J.; Zhang, G.-Z. Effect of pre-soaking saturated limewater and sodium bicarbonate catalysis on carbonation of recycled fine aggregates. Constr. Build. Mater. 2025, 464, 140228. [Google Scholar] [CrossRef]
  61. Zhang, C. Research on Chloride Ion Permeability and Microstructure of Carbonized Recycled Aggregate Concrete. Master’s Thesis, Chongqing University of Science and Technology, Chongqing, China, 2024. [Google Scholar]
  62. Lu, B.; Shi, C.; Cao, Z.; Guo, M.; Zheng, J. Effect of carbonated coarse recycled concrete aggregate on the properties and microstructure of recycled concrete. J. Clean. Prod. 2019, 233, 421–428. [Google Scholar] [CrossRef]
  63. Li, L.; Poon, C.S.; Xiao, J.; Xuan, D. Effect of carbonated recycled coarse aggregate on the dynamic compressive behavior of recycled aggregate concrete. Constr. Build. Mater. 2017, 151, 52–62. [Google Scholar] [CrossRef]
  64. Fang, X.; Zhan, B.; Poon, C.S. Enhancement of recycled aggregates and concrete by combined treatment of spraying Ca2+ rich wastewater and flow-through carbonation. Constr. Build. Mater. 2021, 277, 122202. [Google Scholar] [CrossRef]
  65. Chinzorigt, G.; Lim, M.K.; Yu, M.; Lee, H.; Enkbold, O.; Choi, D. Strength, shrinkage and creep and durability aspects of concrete including CO2 treated recycled fine aggregate. Cem. Concr. Res. 2020, 136, 106062. [Google Scholar] [CrossRef]
  66. Tam, V.W.Y.; Butera, A.; Le, K.N. Mechanical properties of CO2 concrete utilising practical carbonation variables. J. Clean. Prod. 2021, 294, 126307. [Google Scholar] [CrossRef]
  67. Parab, S.; Srivastava, S.; Samui, P.; Murthy, A.R. Prediction of Fracture Parameters of High Strength and Ultra-high Strength Concrete Beam using Gaussian Process Regression and Least Squares. Comput. Model. Eng. Sci. 2014, 101, 139–158. [Google Scholar] [CrossRef]
  68. Rayjada, S.P.; Raghunandan, M.; Ghosh, J. Machine learning-based RC beam-column model parameter estimation and uncertainty quantification for seismic fragility assessment. Eng. Struct. 2023, 278, 115111. [Google Scholar] [CrossRef]
  69. Zhang, D. Prediction of concrete strength using MCMC and GPR methods. Theor. Nat. Sci. 2023, 9, 54–61. [Google Scholar] [CrossRef]
  70. Ayyanar, D.; Ali, S.H.M. Analysis of compressive strength of sustainable fibre reinforced foamed concrete using machine learning techniques. Mater. Res. Express 2024, 11, 035701. [Google Scholar] [CrossRef]
  71. Opěla, P.; Walek, J.; Kopeček, J. Machine Learning Techniques in Predicting Hot Deformation Behavior of Metallic Materials. CMES-Comput. Model. Eng. Sci. 2024, 142, 713–732. [Google Scholar] [CrossRef]
  72. Anžel, A.; Heider, D.; Hattab, G. Interactive polar diagrams for model comparison. Comput. Methods Programs Biomed. 2023, 242, 107843. [Google Scholar] [CrossRef] [PubMed]
  73. He, Z.K.; Liu, G.B.; Zhao, X.J.; Wang, M.H. Overview of Gaussian process regression. Kongzhi Yu Juece/Control Decis. 2013, 28, 1121–1129+1137. [Google Scholar]
  74. Liu, H.; Ong, Y.S.; Shen, X.; Cai, J. When Gaussian Process Meets Big Data: A Review of Scalable GPs. IEEE Trans. Neural Netw. Learn. Syst. 2020, 31, 4405–4423. [Google Scholar] [CrossRef] [PubMed]
  75. Miao, Y. Gaussian Process Regression Model Based on Random Sampling and Secondary Encoding Techniques. Highlights Sci. Eng. Technol. 2025, 136, 60–69. [Google Scholar] [CrossRef]
  76. Kuok, S.-C.; Yao, S.-A.; Yuen, K.-V.; Yan, W.-J.; Girolami, M. Bayesian generative kernel Gaussian process regression. Mech. Syst. Signal Process. 2025, 227, 112395. [Google Scholar] [CrossRef]
  77. Zhang, Y. Application of Composite Kernel Function in Gaussian Process Prediction. Front. Comput. Intell. Syst. 2025, 12, 125–127. [Google Scholar] [CrossRef]
  78. Yu, Y.; Al-Damad, I.M.A.; Foster, S.; Nezhad, A.A.; Hajimohammadi, A. Compressive strength prediction of fly ash/slag-based geopolymer concrete using EBA-optimised chemistry-informed interpretable deep learning model. Dev. Built Environ. 2025, 23, 100736. [Google Scholar] [CrossRef]
  79. Lundberg, S.M.; Lee, S.-I. A unified approach to interpreting model predictions. In Proceedings of the 31st International Conference on Neural Information Processing Systems, Long Beach, CA, USA, 4–9 December 2017; pp. 4768–4777. [Google Scholar]
  80. Yu, Y.; Jayathilakage, R.; Liu, Y.; Hajimohammadi, A. Intelligent compressive strength prediction of sustainable rubberised concrete using an optimised interpretable deep CNN-LSTM model with attention mechanism. Appl. Soft Comput. 2025, 185, 113993. [Google Scholar] [CrossRef]
  81. Gebreyesus, Y.; Dalton, D.; De Chiara, D.; Chinnici, M.; Chinnici, A. AI for Automating Data Center Operations: Model Explainability in the Data Centre Context Using Shapley Additive Explanations (SHAP). Electronics 2024, 13, 1628. [Google Scholar] [CrossRef]
Figure 1. Carbonization reactor.
Buildings 16 02602 g001
Figure 2. Preparation of recycled aggregates.
Buildings 16 02602 g002
Figure 3. NA and RA grading curve.
Buildings 16 02602 g003
Figure 4. Schematic of testing microhardness of the ITZs.
Buildings 16 02602 g004aBuildings 16 02602 g004b
Figure 5. Dataset focusing on compressive strength stress as the output parameter.
Buildings 16 02602 g005aBuildings 16 02602 g005b
Figure 6. Correlation matrix of input parameters for compressive strength.
Buildings 16 02602 g006
Figure 7. Effect of substitution rate of RA on compressive strength of concrete.
Buildings 16 02602 g007
Figure 8. X-ray diffraction patterns of recycled coarse aggregates before and after carbonization treatment.
Buildings 16 02602 g008
Figure 9. The microscopic morphology of RA before and after carbonization.
Buildings 16 02602 g009
Figure 10. Microhardness of old aggregate–old mortar interface of recycled aggregate concrete.
Buildings 16 02602 g010
Figure 11. Microhardness of old mortar–new mortar interface of recycled aggregate concrete.
Buildings 16 02602 g011
Figure 12. Predicted vs. Measured Compressive Strength of the GPR Model. (a) Training; (b) Testing.
Buildings 16 02602 g012
Figure 13. Predicted vs. Measured Compressive Strength of the EDT Model. (a) Training; (b) Testing.
Buildings 16 02602 g013
Figure 14. Predicted vs. Measured Compressive Strength of the SVM Model. (a) Training; (b) Testing.
Buildings 16 02602 g014
Figure 15. Regression Analysis of the GPR Model Performance. (a) Training; (b) Testing.
Buildings 16 02602 g015
Figure 16. Regression Analysis of the EDT Model Performance. (a) Training; (b) Testing.
Buildings 16 02602 g016
Figure 17. Regression Analysis of the SVM Model Performance. (a) Training; (b) Testing.
Buildings 16 02602 g017
Figure 18. Multi-metric performance comparison of GPR, SVM, and EDT models for CRAC compressive strength prediction via radar visualization: (a) R2, (b) RMSE, (c) MAE, (d) MAPE.
Buildings 16 02602 g018
Figure 19. Taylor diagram for comparing the compressive strength prediction capabilities of different models.
Buildings 16 02602 g019
Figure 20. Predictive uncertainty of the GPR model: predicted compressive strength with 95% confidence intervals.
Buildings 16 02602 g020
Figure 21. Horizontal bar chart of SHAP feature contribution to compressive strength prediction.
Buildings 16 02602 g021
Table 1. Comparison of physical properties of different carbonized compacted aggregates.
Carbonization Time (h)Carbonization Pressure (MPa)Water
Absorption
(%)
Apparent Density
(kg/m3)
Crushing Index
(%)
240.36.912687.8615.56
0.46.622690.0714.92
0.56.432691.9314.55
Table 2. Physical properties of recycled coarse aggregates under different carbonation times.
SpecimensCarbonization Time (h)Water Absorption
(%)
Apparent Density
(kg/ m3)
Crushing Index
(%)
CRA-1212 h6.892689.1415.25
CRA-2424 h6.432691.9314.55
CRA-3636 h6.112694.1114.19
CRA-4848 h5.952695.2814.11
Note: CRA represents the carbonized recycled aggregate.
Table 3. Natural, recycled coarse aggregate physical performance indicators.
Physical IndexGrain Size
(mm)
Water
Absorption
(%)
Apparent Density
(kg/m3)
Crushing Index
(%)
NA5~200.432718.508.60
RA5~207.392685.7816.93
CRA5~205.952695.2814.11
Table 4. Concrete mixing ratio design.
SpecimensWater
(kg/m3)
Cement
(kg/m3)
Sand
(kg/m3)
NA
(kg/m3)
RA
(kg/m3)
CRA
(kg/m3)
NAC215390.91681.751112.34
RAC25215390.91681.75834.26278.1
CRAC25215390.91681.75834.26278.1
RAC50215390.91681.75556.17556.17
CRAC50215390.91681.75556.17556.17
RAC75215390.91681.75278.1834.26
CRAC75215390.91681.75278.1834.26
RAC100215390.91681.751112.34
CRAC100215390.91681.751112.34
Note: NAC represents the natural aggregate concrete; RAC25, RAC50, RAC75, and RAC100 denote concrete prepared with untreated RCA at replacement rates of 25%, 50%, 75%, and 100%, respectively; similarly, CRAC25, CRAC50, CRAC75, and CRAC100 refer to concrete made with carbonated RCA at the same corresponding replacement levels.
Table 5. Statistical description of the experimental dataset. (Q1: 25th percentile, Q2: median, Q3: 75th percentile).
ParameterMinMaxMedianMeanStd.Q1Q2Q3
Crush index (%)7.5341819.138.0713.421827.26
Water absorption ratio (%)3.0721.046.77.594.933.846.77.29
W/C ratio0.410.4550.4810.12820.40.4550.5
A/B ratio0.8067.1723.6623.64920.97593.183.6624.21
CO2 concentration (%)5999986.3828.33999999
Carbonization pressure (MPa)0.0250.50.30.2610.14870.10.30.4
Temperature (°C)20252020.4621.584202020
Humidity (%)50706058.76.44506060
Time (h)0.51682435.5337.3722448
Grain size1221.8890.3153222
Substitution rate (%)101007065.629.975070100
Concrete age (day)3282823.079.88972828
Compressive strength (MPa)7.735835.2534.929.828.4535.2541.15
Note: In “Grain size”, the “1” indicates recycled fine aggregate.; 2 indicates recycled coarse aggregate.
Table 6. Hyperparameter Optimization Results for GPR, SVM and EDT Model.
HyperparameterGPRSVMEDT
OptimizationBasis FunctionKernel FunctionEnsemble Method
Kernel FunctionBox ConstraintMin Leaf Size
Kernel ScaleKernel ScaleNum Learners
Signal Std DevEpsilonLearn Rate
SigmaStandardize DataNum Variables to Sample
Standardize Data
Optimize Numeric Params
ValueConstantLinearBag
Non-Isotropic Rational QuadraticAuto (9.118)8
Auto (3.799)Auto (1)30
Auto (6.485)Auto (0.9118)0.1
Auto (6.485)YesAll (1)
Yes
Yes
Feature SelectionSelected 12/12 featuresSelected 12/12 featuresSelected 12/12 features
PCADisabledDisabledDisabled
OptimizerBayesian OptimizationBayesian OptimizationBayesian Optimization
Disclaimer/Publisher’s Note: The statements, opinions and data contained in all publications are solely those of the individual author(s) and contributor(s) and not of MDPI and/or the editor(s). MDPI and/or the editor(s) disclaim responsibility for any injury to people or property resulting from any ideas, methods, instructions or products referred to in the content.