


Abstract
Building-integrated photovoltaics (BIPV) provide an important pathway for expanding distributed solar generation in dense urban areas, but comparable evidence on roof–facade resources across different urban morphologies remains limited. This study develops a scalable workflow to estimate the technical BIPV potential of roofs and facades within standardized 3 km × 3 km urban-core windows in 10 representative Chinese cities. Building footprints, height-related attributes, and functional tags derived mainly from OpenStreetMap were audited, cleaned, and completed through a hierarchical imputation strategy. A 2.5D urban geometry model was then used to estimate annual solar irradiation on building envelopes, with shading, orientation, and sky visibility explicitly considered. The results show that inter-city variation in BIPV potential is not governed by sunshine duration alone, but is strongly shaped by building density, height structure, envelope composition, and roof–facade contribution patterns. High total potential and high envelope-use efficiency do not necessarily occur in the same cities, indicating that total supply capacity and spatial deployment efficiency should be evaluated separately. The analysis further shows that facade-led BIPV pathways may be important in high-density urban cores, but facade-related estimates are sensitive to height-data completeness and usable-facade assumptions. These findings suggest that urban BIPV planning should move beyond aggregate solar-resource ranking and adopt morphology-aware, surface-specific, and data-quality-conscious assessment frameworks. The proposed workflow is intended for early-stage screening and cross-city comparison and provides a basis for identifying differentiated deployment priorities for roofs and facades in urban solar energy systems.
1. Introduction
Building-integrated photovoltaics (BIPV) have become an important component of low-carbon urban energy systems. In dense cities, where land resources are limited and electricity demand is spatially concentrated, integrating photovoltaic elements into building envelopes provides a way to expand distributed renewable generation without requiring additional land. Unlike conventional ground-mounted or utility-scale photovoltaic systems, BIPV uses existing building components, including roofs and facades, as energy-generating surfaces while also contributing to building performance and architectural integration.
The assessment of BIPV potential has gradually evolved from broad resource estimation toward more spatially explicit and technically detailed analysis. Early studies mainly supported national or regional energy planning and typically adopted top-down approaches. These methods derived solar resource availability from satellite remote sensing or meteorological reanalysis, combined it with land-use or building-stock statistics, and applied empirical coefficients such as roof availability factors and system performance ratios to estimate installable capacity or electricity generation at a macro scale [1,2,3]. Such approaches are efficient and suitable for large-scale scenario analysis, but their simplified treatment of building morphology, shading, and envelope usability limits their applicability to urban design, policy implementation, and project-level planning.
With the increasing availability of urban spatial data, including high-resolution building footprints, digital surface models, and LiDAR datasets, research has increasingly shifted toward bottom-up, building-level assessment approaches [4,5,6]. These methods treat individual buildings as the analytical unit and explicitly model roof geometry, orientation, tilt, inter-building shading, and local environmental conditions. Compared with top-down approaches, bottom-up methods better capture the influence of urban morphology on solar access and are therefore more suitable for city-scale planning, distributed PV deployment, and building-level screening.
BIPV assessment also differs from conventional rooftop PV evaluation. BIPV systems serve as both energy-generating devices and functional building components. According to international frameworks, such as IEA PVPS Task 15 and IEC standards, photovoltaic elements qualify as BIPV only when they replace conventional envelope components and provide functions such as weather protection, thermal regulation, structural integrity, or daylight modulation [7,8,9]. Therefore, BIPV potential assessment should not only identify available solar surfaces, but also consider which roofs, facades, skylights, and shading devices can be realistically substituted with PV-integrated components. This introduces additional constraints related to facade composition, window-to-wall ratio, transparency requirements, architectural integration, and regulatory compliance.
Recent studies have further advanced BIPV and urban PV assessment toward continuously updatable digital workflows. Solar cadastre systems in several countries integrate GIS-based irradiance modelling, building databases, and web-based visualization tools to provide regularly updated PV potential information [10,11]. In parallel, the integration of GIS, BIM, and urban-scale energy modelling has supported more transferable and scalable assessment frameworks, which are often based on standardized data structures and automated processing pipelines [12,13]. These developments indicate a shift from isolated simulation exercises toward operational digital infrastructure for urban energy planning.
Alongside workflow development, the conceptual definition of PV potential has also become more standardized. Earlier studies often reported theoretical maximum capacity or annual generation directly, whereas more recent frameworks distinguish between theoretical, geographical, technical, economic, and implementable potential, with explicit documentation of assumptions and constraints [14,15,16]. This distinction is especially important for BIPV, because technical feasibility depends not only on solar resource availability, but also on architectural compatibility, envelope composition, and system integration conditions.
At the data acquisition level, deep learning has improved the extraction of building and roof information from high-resolution aerial or satellite imagery [17,18]. These methods have reduced the need for manual preprocessing and improved the scalability of urban solar assessment. More recent work has extended this direction to facade-level semantic analysis by combining street-view imagery and GIS data to estimate parameters such as window-to-wall ratio and facade segmentation [19]. This development is particularly relevant for BIPV because facade potential cannot be fully assessed from geometric envelope area alone.
Energy-yield modelling has also progressed from simplified empirical estimation toward more physically consistent simulation. Earlier studies often relied on fixed efficiency assumptions or aggregate correction factors [20], while recent approaches increasingly incorporate irradiance variability, temperature effects, inverter performance, and system losses using time-resolved models [21]. For BIPV systems, this refinement is important because photovoltaic components are thermally and functionally integrated into building envelopes, creating interactions among electrical output, thermal behavior, and indoor environmental performance [22]. Beyond resource estimation, frontier studies have begun to link BIPV potential with load matching, grid constraints, and energy storage, moving the field from static potential assessment toward operational feasibility analysis [23].
Overall, BIPV potential assessment has advanced along several directions: from macro-scale estimation to building-scale modelling, from rooftop-focused analysis to roof–facade integration, and from static resource quantification to multi-dimensional urban energy evaluation. However, a practical challenge remains in balancing modelling precision with scalability and data availability. High-fidelity methods can improve accuracy, but they often rely on detailed geometric, facade, and weather data that are not consistently available across cities. Open and widely accessible datasets are more suitable for multi-city comparison, but they require careful treatment of data incompleteness, simplified geometry, and uncertainty in facade-related estimates.
Despite these advances, three gaps remain in current BIPV potential assessment. First, many high-resolution studies provide detailed estimates for individual buildings or single cities, but their data requirements limit transferability across multiple urban contexts. Second, open-data-based approaches are more scalable, yet they often simplify building height, facade geometry, and usable envelope area without explicitly discussing how these assumptions affect cross-city comparison. Third, existing assessments frequently emphasize total solar or PV potential, while giving less attention to the distinction between total supply capacity, envelope-use efficiency, roof–facade contribution structure, and data-quality uncertainty. These gaps are particularly important for BIPV, because facade-based potential is strongly affected by urban morphology, building-height completeness, window-to-wall ratio, and practical deployability constraints.
This study contributes to this field by developing a consistent and transferable workflow for comparative BIPV potential assessment across 10 representative Chinese cities. Rather than aiming at high-fidelity prediction for individual buildings, the study focuses on identifying morphology-driven differences under a unified analytical framework. The main contributions are threefold: first, it integrates data auditing, hierarchical height completion, 2.5D geometry construction, and solar-irradiation calculation into a scalable cross-city workflow; second, it evaluates BIPV potential using multiple indicators, including total potential, window-area-normalized potential, footprint-area-normalized potential, envelope-area-normalized potential, and roof–facade contribution structure; third, it explicitly discusses the interpretation boundary caused by height-data completeness, simplified geometry, sunshine-duration correction, and usable-facade assumptions. These contributions provide a screening-level basis for comparing urban BIPV resources and identifying differentiated deployment priorities for roofs and facades.
In this context, this study develops a consistent and transferable workflow for evaluating roof and facade BIPV potential across 10 representative Chinese cities. Using standardized 3 km × 3 km urban-core windows, the workflow combines data auditing, hierarchical attribute completion, 2.5D urban geometry, and solar-irradiation modelling with shading, orientation, and sky visibility. Rather than replacing high-fidelity building-level simulations, the study aims to support early-stage screening and cross-city comparison by identifying how urban morphology, envelope composition, and data quality jointly shape BIPV potential under a unified analytical framework.
2. Research Methods
2.1. Site Selection
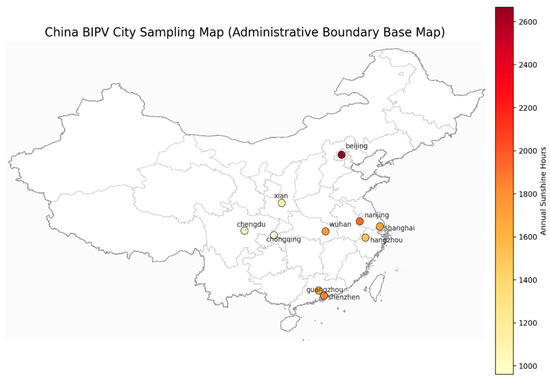
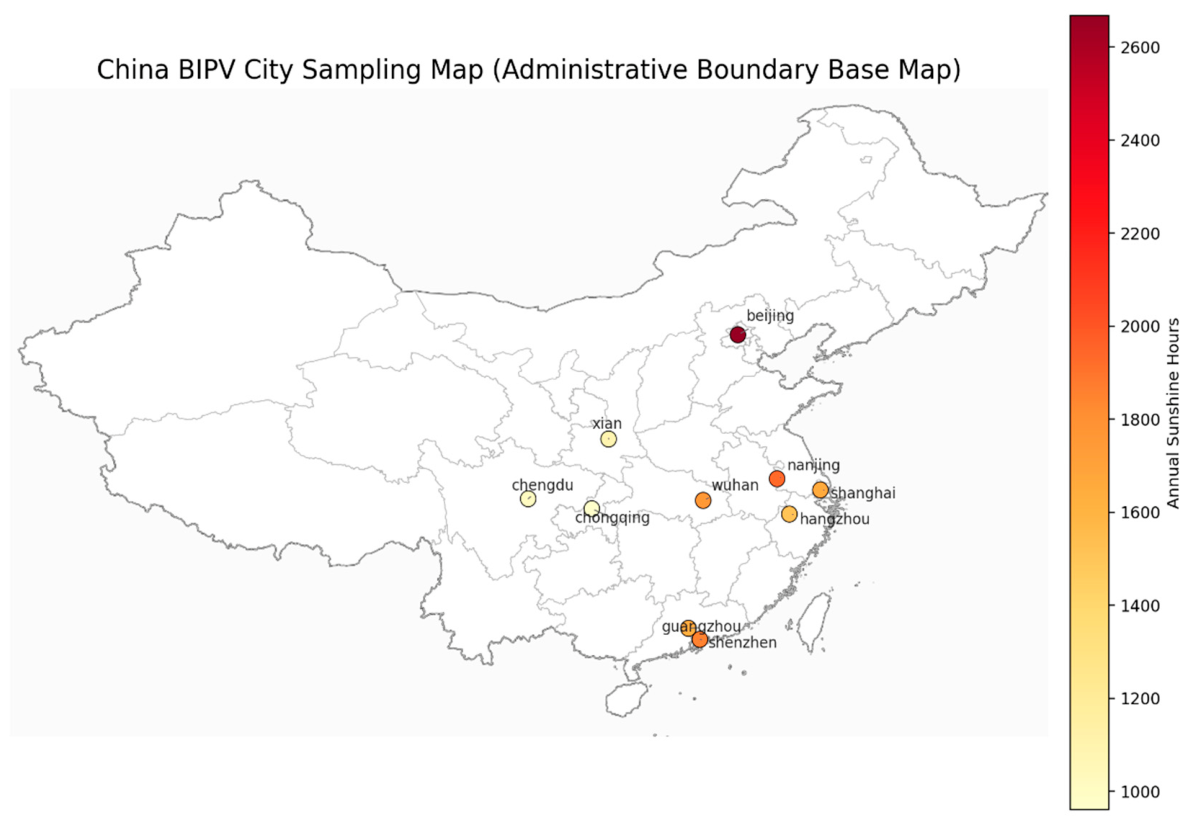
This study examines 10 representative Chinese cities as analytical cases, selected to reflect a broad range of urban, climatic, and morphological conditions rather than to form a statistically exhaustive sample. The selection intentionally covers major geographical regions of China, including northern cities such as Beijing, central cities such as Wuhan, western inland cities such as Chengdu and Xi’an, and eastern coastal cities such as Shanghai, Hangzhou, and Shenzhen, shown in Figure 1. This spatial distribution allows the analysis to capture variations in solar resource conditions, including differences in annual sunshine duration and atmospheric characteristics.
Figure 1.
City sampling map.
Beyond climatic diversity, the selected cities also represent different stages and patterns of urban development. Megacities such as Beijing and Shanghai exhibit complex and mature urban fabrics with a mixture of historical and modern building stock, while rapidly developing cities such as Shenzhen are characterized by high-density, high-rise clusters and relatively uniform building typologies. Other cities, such as Chongqing and Chengdu, present terrain and urban forms that are more heterogeneous, introducing additional variability in building distribution and shading relationships.
Importantly, the selection also reflects differences in data completeness within the underlying open-source dataset. Some cities contain relatively rich building-height and functional-tag information, while others rely heavily on inferred or default values. Rather than treating this variability purely as a limitation, the study incorporates it into the comparative framework, using it to illustrate how data quality interacts with methodological assumptions and influences the interpretation of BIPV potential, particularly for facade-related results.
For comparability, each case city was represented by a fixed 3 km by 3 km urban-core window rather than by its full administrative boundary. The window coordinates were predefined in the city configuration file and processed in WGS84 coordinates with the same nominal area of approximately 9 km2. The purpose of this design was to hold the spatial sampling unit constant while comparing urban morphology, building density, height-data completeness, and solar-resource conditions across cities. The results should therefore be interpreted as determinations based on standardized urban-core samples, not as estimates of total citywide BIPV resources.
2.2. Data Audit, Cleaning, and Preprocessing
Before conducting BIPV potential assessment, the completeness, consistency, and reliability of raw building data are systematically evaluated and processed to ensure that subsequent calculations are based on physically plausible and internally consistent inputs. This process integrates attribute auditing, data cleaning, geometric feature extraction, and missing-value imputation into a unified preprocessing workflow.
The analysis begins with an attribute completeness audit, focusing on the availability of building height and functional information. Specifically, the proportion of buildings with explicit height attributes, those with building-levels attributes, and those missing both is quantified to assess the degree of reliance on inferred data. In parallel, the coverage of building-type tags is summarized to evaluate the feasibility of type-based grouping and parameter assignment. At the geometric level, the distribution of footprint area is characterized using minimum, median, and upper-percentile statistics, providing a baseline understanding of building-scale variation within each study area.
Following the audit, building height information is extracted and standardized. When explicit height values are available and fall within a physically reasonable range (greater than 0 and less than 300 m), they are retained directly. Values outside this range are adjusted to boundary thresholds to mitigate the influence of extreme outliers. For buildings lacking explicit height but containing building-levels information, height is estimated by multiplying floor counts with simplified floor-height assumptions, using 3 m per floor for buildings below 30 floors and 4 m per floor for taller structures. Floor counts exceeding a predefined upper limit are capped to prevent unrealistic height estimates. Buildings missing both height and floor-count attributes are marked as incomplete and reserved for subsequent imputation.
To support morphological analysis and potential estimation, geometric features are further derived from building footprints. These include footprint area, perimeter, and a compactness indicator defined as the ratio of area to perimeter. Based on footprint area, buildings are grouped into multiple size classes (e.g., <80 m2, 80–200 m2, 200–800 m2, 800–3000 m2, and >3000 m2), allowing the analysis to distinguish scale-dependent differences in solar potential, shading exposure, and deployment feasibility.
Missing height values are addressed through a hierarchical imputation strategy designed to balance statistical robustness and spatial plausibility. First, buildings are grouped according to functional type, spatial zone, and size class. When a sufficient number of valid samples is available within a group, the group-average height is used for imputation. If group-level data are insufficient, a spatial neighborhood approach is applied by searching for nearby buildings within a defined window and using neighborhood statistics for estimation. In cases where both group-level and neighborhood-level information are limited, a uniform default height is assigned to ensure model completeness. While this approach introduces uncertainty, particularly for facade-related calculations, it allows the construction of a continuous and computationally tractable dataset suitable for city-scale comparative analysis.
Overall, the preprocessing workflow prioritizes consistency and scalability over geometric precision, ensuring that all cities are evaluated under a unified data structure and assumption system while preserving the primary morphological characteristics relevant to BIPV potential estimation.
2.3. Calculation Method
At the city scale, this study aimed to provide a physically consistent and spatially interpretable estimate of annual solar irradiation received by building exterior surfaces, including roofs and facades. The method was designed for comparative urban-scale assessment rather than high-fidelity prediction of individual building performance. Therefore, simplified building geometry, regular surface sampling, explicit shading representation, and empirical weather scaling were combined to capture the first-order spatial differences in solar availability among cities, under consistent assumptions.
2.3.1. Building-Envelope Geometry
Each building was represented as a 2.5D extrusion of its footprint. Roof area was calculated as the projected footprint area, while geometric facade area was calculated as the footprint perimeter multiplied by building height. Building height was treated as an approximate value derived from available building-height or floor-count information. When floor-count information was used, building height was estimated by multiplying the number of floors by a constant floor height. This abstraction was not intended to reproduce exact architectural forms, but to represent the main geometric drivers of urban solar potential, including roof area, facade area, building height, and surrounding shading relationships.
The baseline facade results reported in Section 3 are based on geometric facade area, which was calculated as building footprint perimeter multiplied by building height. Therefore, the facade-related estimates represent geometric upper-bound BIPV resources rather than directly deployable facade capacity.
In practical BIPV deployment, windows, balcony openings, structural elements, external air-conditioning units, shading devices, maintenance zones, and architectural constraints reduce the usable facade area. To clarify how such constraints could be incorporated in future or scenario-based analysis, the usable facade area can be estimated using Equation (1):
where WWR is the window-to-wall ratio, f_struct represents the remaining facade fraction after structural and architectural constraints, and f_service represents the remaining facade fraction after service-equipment and maintenance exclusions. These parameters were not applied to the baseline results in Section 3 because consistent building-type-specific WWR, structural-constraint, and service-equipment data were not available across all 10 cities. Therefore, Equation (1) is presented as a correction framework rather than as the basis of the reported baseline results.
A_facade,usable = A_facade × (1 − WWR) × f_struct × f_service
2.3.2. Surface Discretization
Roof and facade surfaces were discretized into regular sampling points. Roof surfaces were sampled using a regular grid with a baseline spacing of 20 m. Facade surfaces were sampled along each footprint edge at 20 m horizontal spacing and 10 m vertical spacing. If a roof polygon did not contain any regular grid point, one representative point was assigned to the roof to avoid omitting small buildings. Each sample point carried an area weight corresponding to the roof or facade area it represented. Annual irradiation for each surface was then calculated by summing the weighted irradiation values of all sample points.
To examine the sensitivity of the results to sampling resolution, a convergence test was conducted using grid spacings of 40 m, 20 m, and 10 m. The number of roof and facade sample points in each city and the convergence results are reported in the revised manuscript.
2.3.3. Solar Position, Shading, and Sky Visibility
Hourly solar position was calculated using standard solar-geometry equations based on latitude, longitude, date, and local time. For each sample point, surrounding buildings within a 250 m search radius were identified to estimate local obstruction conditions. These surrounding buildings were projected into 16 azimuth bins, and the maximum obstruction angle in each bin was used to define the local skyline profile.
Direct irradiance was counted only when the solar altitude was greater than the obstruction angle in the corresponding solar azimuth bin. If the solar altitude was lower than the obstruction angle, the direct component was set to zero. This procedure allowed the model to represent the effects of building height, orientation, and inter-building shading on direct solar access.
Sky visibility was estimated using the obstruction angles of the azimuth bins. The sky view factor was approximated as the mean squared cosine of the skyline obstruction angles and was used to attenuate diffuse and horizon-related irradiance components. In this way, the method accounts not only for direct shading, but also for the reduction of visible sky caused by dense urban morphology.
2.3.4. Irradiance Model and Weather Scaling
For solar altitude α > 0, clear-sky direct normal irradiance and diffuse horizontal irradiance were estimated in Equation (2):
where α is the solar altitude angle. Plane-of-array irradiation was calculated by combining direct incidence, isotropic diffuse radiation, circumsolar diffuse radiation, horizon-brightening diffuse radiation, and reflected radiation. Diffuse partitioning used an anisotropy index based on DNI/I0n, for which I0n is the extraterrestrial normal irradiance. The horizon-brightening component was represented using a Reindl-type factor based on sqrt(BHI/GHI), in which BHI and GHI denote beam horizontal irradiance and global horizontal irradiance, respectively.
DNI = 950 sin(α)1.2
DHI = 120 sin(α)0.5
DHI = 120 sin(α)0.5
To account for differences between theoretical clear-sky irradiation and local long-term weather conditions, an empirical sunshine-duration correction was applied. Annual weather scaling was calculated using Equation (3):
where n is the observed annual sunshine duration and N is the modelled annual daylight-hour count. When monthly sunshine-duration data were available, the same ratio was applied month by month. This correction was used to rescale the theoretical irradiation level according to observed sunshine availability. It should be interpreted as an empirical sunshine-duration correction rather than a calibrated Angstrom–Prescott model, because no site-specific calibration coefficients were introduced.
k = min(1, n/N)
2.3.5. Electricity Conversion
Annual PV electricity generation was estimated from incident plane-of-array irradiation in Equation (4):
where H_POA is the annual incident plane-of-array irradiation in kWh m−2 yr−1, A is the represented surface area in m2, η_PV is the PV module conversion efficiency, and E_PV is the annual electricity generation in GWh yr−1. In this study, a fixed PV module conversion efficiency of 20% was adopted. Inverter losses, temperature losses, degradation, soiling, availability, and AC-side performance ratio were not explicitly modelled. Therefore, the reported electricity estimates should be interpreted as DC-side technical potential rather than final AC electricity output.
E_PV = (H_POA × A × η_PV)/106
Overall, this workflow was designed to capture first-order spatial variations in solar availability across different urban morphologies, under a consistent modelling framework. The resulting estimates are therefore more suitable for comparative assessment and early-stage urban-scale screening than for precise prediction of PV performance at the individual-building level.
2.3.6. Parameter Rationale
The parameter values used in the proposed workflow were selected to balance spatial representation, computational feasibility, and methodological consistency across the 10 standardized urban-core windows. This follows the general requirement of urban-scale and large-scale PV potential studies, in which model resolution, data availability, spatial coverage, and scalability need to be balanced rather than maximized simultaneously. Previous studies on urban and large-scale rooftop-PV-potential assessment have emphasized that different assessment approaches involve trade-offs between spatial resolution and scalability, and that the appropriate method depends on the intended application, data availability, and planning scale [24]. Large-scale geospatial assessments have also demonstrated the value of standardized workflows for regional or cross-city technical-potential estimation, even when simplified assumptions are required to maintain broad spatial coverage and comparability [25,26]. In addition, review and urban-scale studies have shown that building geometry, shading representation, solar-resource modelling, and data completeness are key components of urban PV potential assessment, but their level of detail should be adapted to the study scale and available data [27,28].
In this study, the 250 m obstruction search radius was used to capture first-order shading effects from surrounding urban blocks while avoiding excessive computation from distant buildings with limited obstruction influence. The 16 azimuth bins were adopted as a compromise between directional resolution and computational efficiency in skyline-obstruction estimation. The 20 m roof sampling spacing and 20 m × 10 m facade sampling resolution were selected to provide sufficient surface coverage for city-scale comparison while maintaining tractable computation for all cities. These settings are therefore intended as baseline parameters for standardized comparison rather than universally optimal values for high-fidelity engineering simulation.
3. Results
Unless otherwise stated, all results reported in Section 3 are based on geometric roof and facade areas. Facade-related indicators therefore represent geometric upper-bound BIPV resources under the simplified 2.5D envelope model. The usable-facade correction in Equation (1) was not applied to the baseline results because consistent window-to-wall ratio, structural-constraint, and service-equipment data were not available for all 10 cities.
3.1. Inter-City Variation in Total BIPV Potential
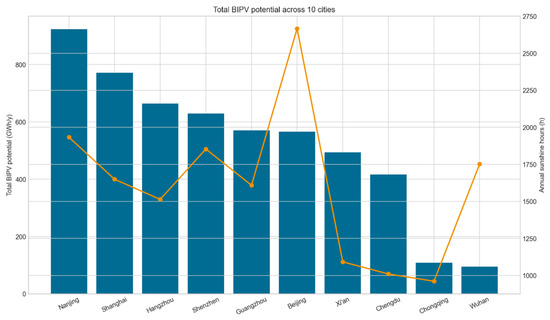
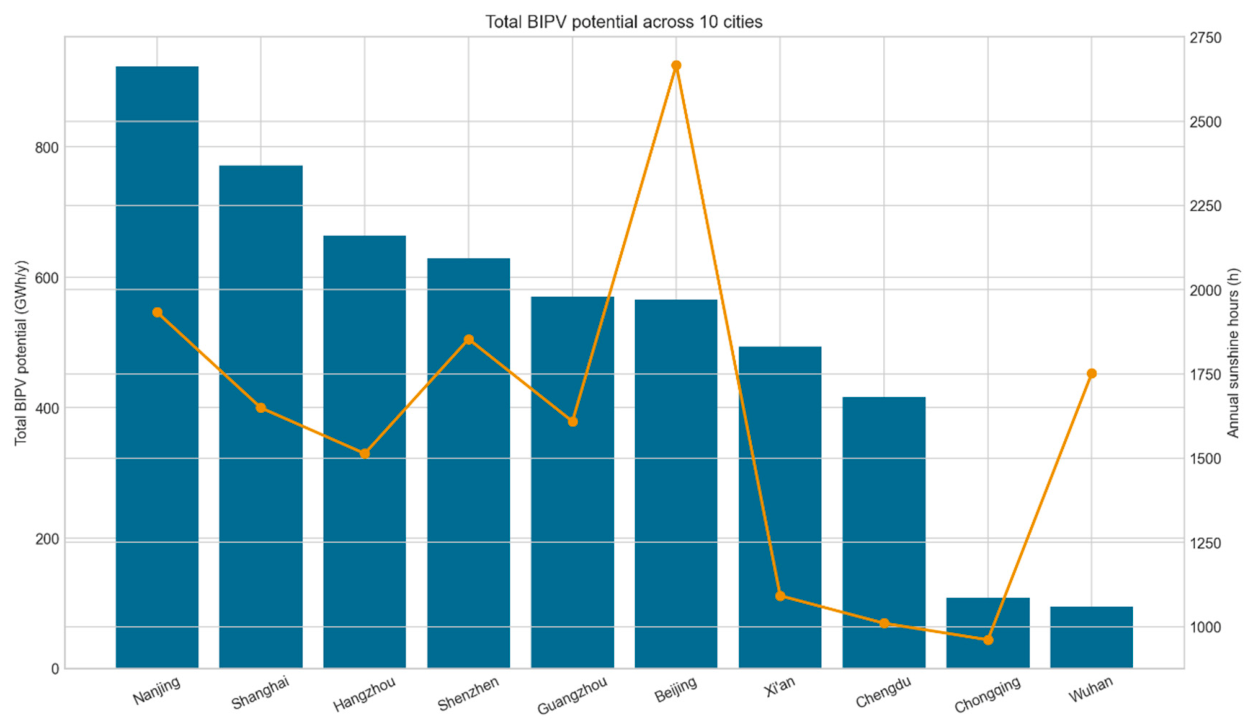
Under a unified 3 km by 3 km urban-core window, the technical BIPV potential of the 10 Chinese cities varies sharply. Nanjing has the highest annual total potential, at 923.61 GWh/y, followed by Shanghai (771.84 GWh/y), Hangzhou (663.97 GWh/y), and Shenzhen (629.50 GWh/y). Guangzhou (570.05 GWh/y) and Beijing (565.77 GWh/y) form a second tier; Xi’an (494.24 GWh/y) and Chengdu (416.04 GWh/y) are intermediate; Chongqing (108.24 GWh/y) and Wuhan (94.59 GWh/y) are substantially lower. The highest-to-lowest ratio reaches 9.76, indicating order-of-magnitude differences even under the same spatial window and calculation framework.
Figure 2 shows that sunshine duration alone does not explain the ranking of total potential. Across the 10-city sample, the Pearson correlation between annual sunshine duration and total BIPV potential is only 0.398. Beijing has the highest multi-year average sunshine duration (2667.2 h), yet its total potential remains only mid-ranked. By contrast, Hangzhou and Shanghai do not lead in sunshine conditions but still exhibit high aggregate potential. This pattern supports the central argument that morphology-driven factors, including building density, size structure, and facade availability, are stronger drivers of cross-city divergence than is solar climate alone within the standardized study window.
Figure 2.
Total BIPV potential versus multi-year average sunshine duration across the 10 city core windows.
3.2. Normalized Performance and Spatial Efficiency
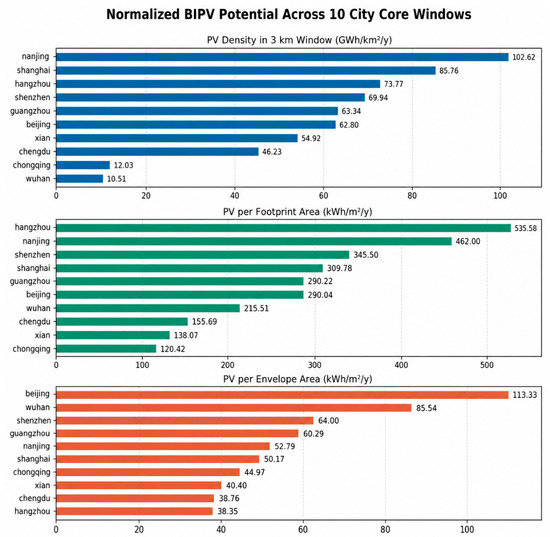
Comparing totals alone obscures efficiency differences per unit geometry. Under potential per window area, Nanjing still ranks first at 102.62 GWh/km2/year, followed by Shanghai (85.76 GWh/km2/year), Hangzhou (73.77 GWh/km2/year), and Shenzhen (69.94 GWh/km2/year). Under potential per building-footprint area, Hangzhou moves to first place at 535.58 KWh/m2/year, ahead of Nanjing (462.00 KWh/m2/year) and Shenzhen (345.50 KWh/m2/year). However, the envelope-normalized indicator tells a different story: Beijing ranks first at 113.33 KWh/m2/year, followed by Wuhan at 85.54 KWh/m2/year, while Hangzhou falls to 38.35 KWh/m2/year, details shown in Figure 3. This distinction is important because the study object is the full building envelope rather than footprint alone.
Figure 3.
Comparison of normalized BIPV potential across the 10 city core windows, using window-area, footprint-area, and envelope-area indicators.
The normalized indicators therefore separate total supply capacity from envelope-use efficiency. Footprint-based normalization tends to amplify the apparent advantage of high-rise cities, whereas the envelope-based metric is more directly aligned with BIPV as a roof-plus-facade system. Wuhan illustrates this distinction well: despite having the lowest total potential, it still reaches 215.51 KWh/m2/year by footprint area and 85.54 KWh/m2/year by envelope area. Conversely, Hangzhou remains highly efficient by footprint but no longer leads when the full envelope denominator is used.
3.3. Roof-Versus-Facade Contribution Structure
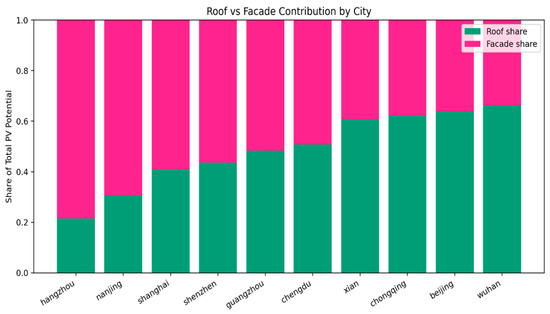
The contribution structure of roofs versus facades shows clear differentiation across cities. Hangzhou is the most facade-dominant city, with facades contributing 78.4% of total potential and roofs only 21.6%; Nanjing also shows strong facade dominance at 69.3%. Shanghai (59.0%) and Shenzhen (56.4%) are likewise facade-led. In contrast, Beijing (roof: 63.8%), Xi’an (60.7%), Chongqing (62.2%), and Wuhan (66.3%) are roof-dominant cities.
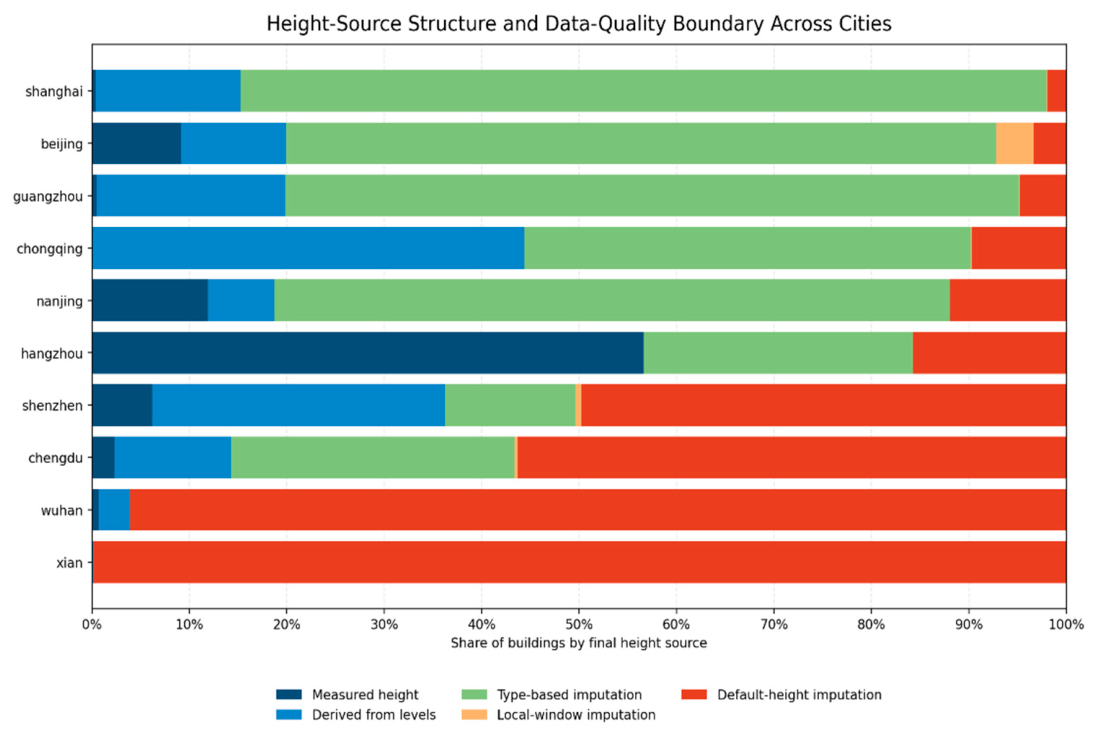
These structural differences imply different BIPV deployment pathways for different cities. Results for Hangzhou, Nanjing, Shanghai, and Shenzhen indicate that, in study windows with concentrated high-rise, high-density, and large-volume buildings, facades can provide more than half, and in some cases nearly three-quarters, of total potential. However, facade shares should be interpreted together with building-height data source structure rather than as pure morphology signals. In Xi’an, 14,334 of 14,360 buildings are assigned the default height, and in Wuhan 443 of 461 buildings are also default-imputed; Hangzhou, by contrast, contains 454 buildings with measured height and 222 with type-based imputation. Cross-city facade comparisons are therefore more reliable where height information is richer and should be treated as conservative estimates where default-height dependence is dominant, shown in Figure 4.
Figure 4.
Contribution structure of roofs and facades to total BIPV potential in the 10 city core windows.
3.4. Concentration Effect and Building-Size Pattern
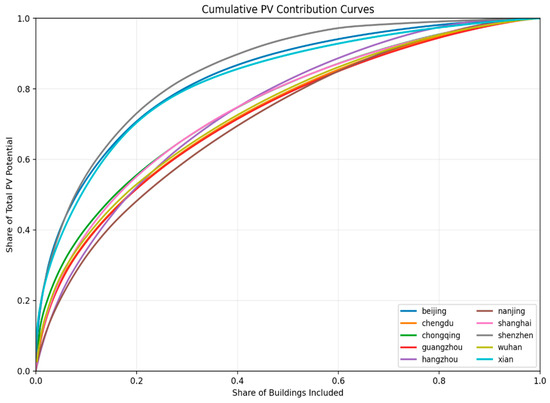
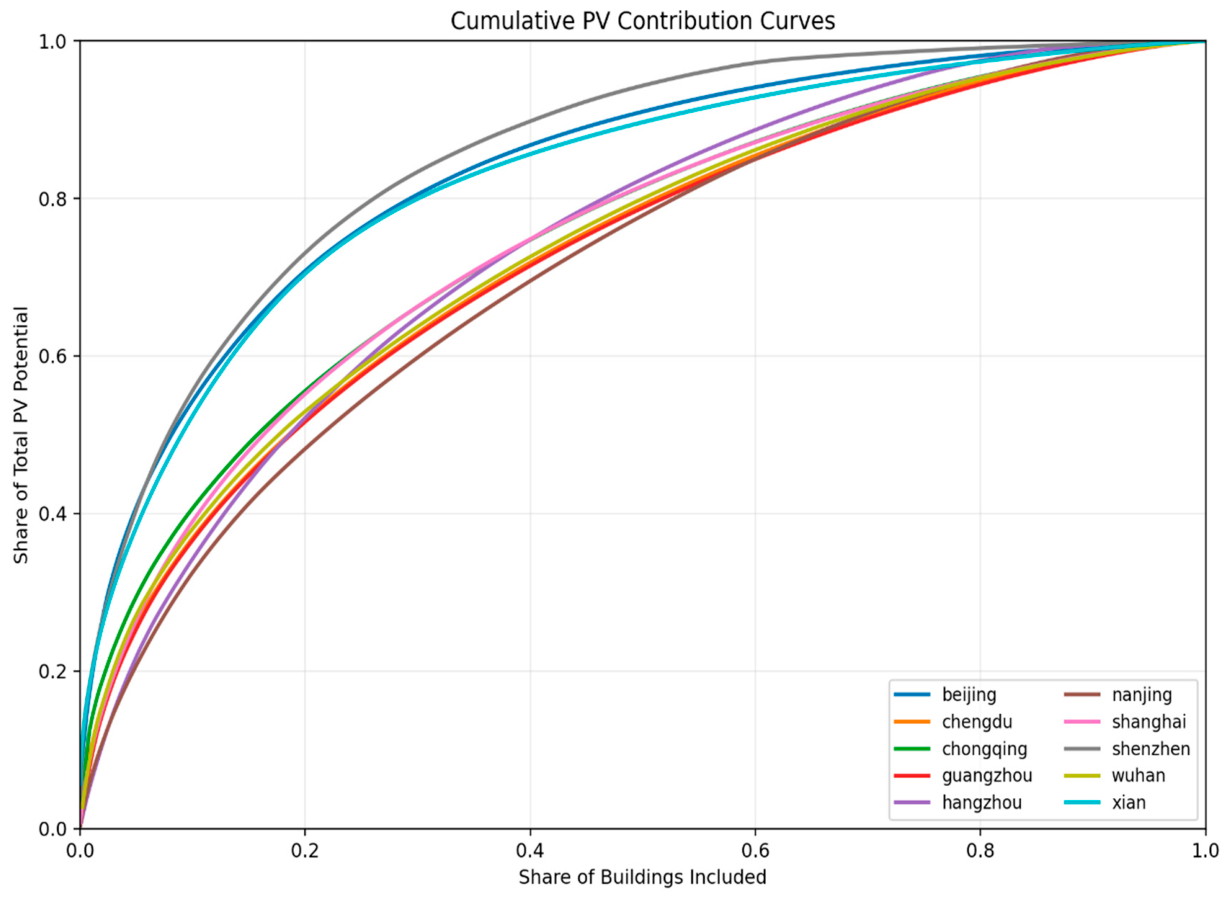
Building-level potential is not uniformly distributed, and cities exhibit distinct concentration patterns. Figure 5 makes this more intuitive than a single scatter metric: Shenzhen, Beijing, and Xi’an show steep cumulative curves, meaning a limited set of top-ranked buildings accounts for a large share of city potential. This matches the top-20% contribution values of 73.1%, 70.8%, and 70.4%, respectively, and the high P90/P50 ratios of 6.02 and 6.72 in Beijing and Xi’an. Such cities are better matched to pilot-project-oriented deployment strategies that prioritize a limited portfolio of high-yield assets.
Figure 5.
Cumulative share curves of building-level BIPV potential across the 10 city core windows.
From the perspective of building-size structure, the 800–3000 m2 class contributes the most in Hangzhou (46.9%), Guangzhou (43.7%), Beijing (33.9%), Chengdu (47.8%), Chongqing (48.3%), and Wuhan (44.2%), while Nanjing, Shanghai, and Xi’an are dominated by the 200–800 m2 class, with contributions of 42.4%, 39.3%, and 34.8%, respectively. Shenzhen is the only city dominated by very large buildings (3000+ m2), where this class contributes 42.6% of total potential. That contribution pattern should be interpreted together with the building-count structure: in Shenzhen, 3000+ m2 buildings account for only 7.9% of buildings but contribute 42.6% of potential, whereas in Nanjing the 200–800 m2 class represents 59.4% of buildings and contributes 42.4% of potential. The difference is therefore not only which class contributes the most, but whether it dominates because it is numerous or because it is exceptionally strong per building.
3.5. Functional Tags and Deployable Targets
Grouping by functional tags shows that most cities are still dominated by building = yes, indicating that OSM functional labels remain coarse in many study windows. This is especially pronounced in Beijing (87.5%), Xi’an (95.5%), and Wuhan (79.1%), so function-level structures in these cities should not be overinterpreted. Even so, determinations for cities with a relatively higher proportion of informative labels still support limited but useful deployment insights. In Shenzhen, commercial buildings contribute 36.4% of total city potential; in Hangzhou and Nanjing, apartments contribute 37.3% and 27.5%, respectively. The practical implication is that functional tags can help identify priority deployment objects where labels are reasonably complete, while cities dominated by building = yes should retain only the interpretation boundary rather than stronger type-specific conclusions.
3.6. Data Quality and Interpretation Boundary
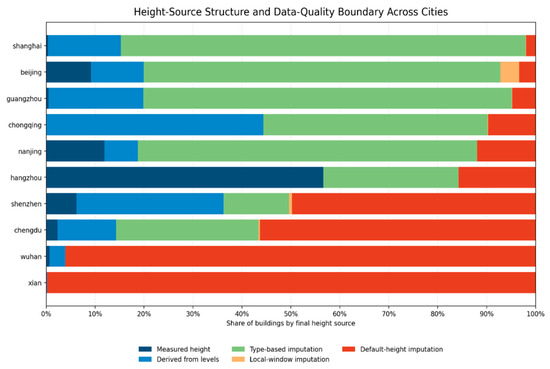
Data quality is not uniform across the 10 cities, and this should be treated as part of the interpretation of results rather than a footnote. Hangzhou has the strongest direct height support in the sample, with a height_present_ratio of 0.566, and only 15.7% of buildings use the default height. By contrast, the Xi’an dataset has a height_present_ratio of only 0.0011 and relies on default-height imputation for 99.8% of buildings, while the Wuhan dataset uses default-height imputation for 96.1% of the buildings, shown in Figure 6. Because facade area and facade irradiation are both height-sensitive, cross-city differences in facade share and envelope-normalized efficiency are more robust where height sources are richer, and more uncertain where default imputation dominates.
Figure 6.
Building-height data source structure across the 10 city core windows, showing measured, derived, and imputed building-height shares.
3.7. Limited External Reference-Validation Result
To provide a preliminary external check on the proposed screening-level workflow, a limited reference validation was conducted using a published rooftop-PV-potential study for Wuhan. Wuhan was selected because an independent city-scale rooftop PV assessment based on 0.5 m high-resolution aerial imagery and deep learning is available for its central urban area. The reference study covers seven central urban districts of Wuhan and reports approximately 130 km2 of suitable rooftop area and 18.18 GW of installable PV capacity [29].
The validation focused on the rooftop capacity-estimation component of the workflow. The fixed 20% PV module efficiency adopted in this study corresponds to an implied module power density of approximately 200 Wp/m2 under standard irradiance conditions, which is consistent with the 200 W/m2 power-density assumption used in the Wuhan reference study. In addition, the reported 18.18 GW capacity over approximately 130 km2 of suitable rooftop area corresponds to an effective capacity density of about 140 W/m2 after rooftop-use constraints. These results support the order-of-magnitude plausibility of the rooftop PV capacity-conversion assumption used in the proposed workflow.
However, this comparison should not be interpreted as a full validation of annual BIPV electricity generation, because the two studies differ in spatial boundaries, assessment objects, rooftop-availability assumptions, shading treatments, and electricity-yield modelling methods.
3.8. Result Summary
Overall, the 10-city comparison reveals four consistent patterns. First, morphology-driven factors are stronger than sunshine duration alone in explaining total-potential divergence. Second, normalized indicators identify different leaders, depending on whether the denominator is window area, footprint area, or envelope area, so high total supply does not necessarily imply high envelope-use efficiency. Third, roof-versus-facade structures and cumulative-share curves point to different deployment pathways, ranging from facade-led and demonstration-first cities to roof-led and broader-rollout cities. Fourth, these interpretations must be read together with data quality, especially the structure of height sources, because facade-related outputs are more uncertain where default-height imputation dominates.
Taken together, these results suggest that urban solar potential is not solely determined by climatic conditions, but is strongly shaped by the interactions between building morphology, spatial configuration, and data completeness. While individual indicators provide different perspectives on performance, their combined interpretation offers a more comprehensive understanding of how solar resources are distributed within urban environments. This reinforces the importance of adopting multi-dimensional evaluation approaches when assessing BIPV potential at the city scale.
4. Discussion and Limitations
4.1. Discussion
The results of this study indicate that the technical potential of BIPV in dense urban areas is determined by the combined effects of solar-resource conditions and urban morphological structure, rather than by sunshine duration alone. In principle, BIPV potential can be understood as the product of the available building-envelope area, the incident solar irradiation, and system conversion assumptions. Therefore, two cities with similar climatic solar resources may still show different BIPV potentials if their building densities, height distributions, envelope-area composition, shading relationships, and roof–facade proportions differ. This explains why the ranking of total BIPV potential in this study does not simply follow the ranking of annual sunshine duration. Similar conclusions have been reported in studies of urban solar access, where building form, compactness, density, and obstruction geometry were shown to affect solar availability at the scales of individual buildings, blocks, and neighborhoods [30,31,32,33,34].
The physical mechanism behind this result is related to the way urban geometry redistributes solar access. Roof surfaces are mainly affected by horizontal exposure, roof area, mutual shading, and surrounding obstruction angles, while facade surfaces are more sensitive to building height, orientation, street-canyon geometry, and sky-view conditions. In compact urban fabrics, increased density may enlarge the total available envelope area, especially vertical surfaces, but it can also intensify mutual shading and reduce the effective irradiance received by individual surfaces. Therefore, high levels of building density do not automatically imply high BIPV efficiency. Its effect depends on whether the additional envelope area compensates for the irradiation loss caused by shading. This is consistent with previous urban-solar studies showing that compactness and built-form configuration can either support or suppress solar potential, depending on the spatial arrangement of buildings [31,32,33,34,35].
The distinction between total potential and normalized potential is therefore necessary. Total BIPV potential reflects the aggregate electricity-generation opportunity within the selected 3 km × 3 km urban-core window, but it does not reveal whether the building envelope is used efficiently. Footprint-normalized potential emphasizes solar productivity relative to land occupation, which is useful for comparing the intensity of solar-energy production in different urban fabrics. However, for BIPV assessment, envelope-normalized potential is more directly related to the effective use of roofs and facades as photovoltaic carriers. The differences among these indicators show that BIPV evaluation should not rely on a single ranking metric. A city may have high total potential because it contains a large amount of envelope area, while another city may show higher envelope-use efficiency because its surfaces receive stronger irradiation per unit envelope area. Such multi-indicator interpretation is consistent with the broader distinction between geographical, technical, economic, and implementable renewable-energy potentials [36,37,38].
The roof–facade contribution structure is another key finding of this study. Conventional urban PV assessments have often focused on rooftops because roofs are easier to identify, model, and retrofit. However, BIPV differs from conventional rooftop PV because photovoltaic components can be integrated into vertical facades, curtain walls, shading devices, and other envelope elements. In high-rise and high-density urban cores, facade area can exceed roof area by a large margin, making vertical surfaces an important part of the technical potential even when their unit-area irradiation is lower than that of roofs. Previous studies on solar availability and BIPV facade renovation have also emphasized that facades should be included in dense-city assessments, particularly where roof area is limited or where building-envelope renovation is linked with energy transition strategies [23,39,40,41,42,43]. The facade-led patterns identified in some cities in this study are therefore not only numerical outcomes, but also reflect the geometric consequences of vertical envelope expansion in high-density built environments.
At the same time, the interpretation of facade potential must be linked to building-height data quality. In the present workflow, facade area is derived from footprint perimeter and building height. This means that height information directly affects both the denominator of envelope-normalized indicators and the estimated facade contribution. Where measured or reliable derived height data are available, roof–facade comparisons are more stable. Where default-height imputation dominates, facade-related results should be treated as more uncertain. This is an important methodological point, because open urban datasets are rarely uniform across cities. Studies on OpenStreetMap and those referencing building-height estimation have shown that building attributes, especially height, are often incomplete and spatially heterogeneous, and that missing height estimations can introduce uncertainty into downstream urban modeling [44,45]. Therefore, incorporating height-source structure into the interpretation is not merely a data-quality note, but a necessary condition for responsible cross-city comparison.
The concentration analysis further shows that BIPV potential is unevenly distributed among buildings. In some cities, a small proportion of buildings accounts for a large share of total potential, whereas other cities show a more even distribution. This pattern has practical significance. Where the cumulative curve is steep, deployment can first target a limited group of high-yield buildings, which is suitable for pilot-project-oriented strategies. Where the curve is flatter, broader deployment across medium-scale buildings may be more appropriate. This distinction links technical-potential assessment with implementation priority. It also avoids treating the city as a homogeneous solar surface, which would obscure the actual spatial hierarchy of deployable resources. Similar city-scale PV studies have highlighted the need to move from aggregate potential estimates toward spatially explicit prioritization based on building-level characteristics, shading, roof geometries, and demand-side relevance [46,47,48].
The methodological contribution of this study lies in its balance between scalability and interpretability. High-resolution LiDAR, DSM, BIM, or detailed 3D city models can provide more accurate surface geometry and shading calculation, but such data are not consistently available across many cities. Conversely, purely top-down methods are scalable but cannot capture building-envelope structure or local shading relationships. The proposed workflow occupies an intermediate position: it uses open building data and simplified 2.5D geometry to preserve the main geometric drivers of BIPV potential, including roof area, facade area, height, orientation, and obstruction effects. This makes the method suitable for early-stage comparison, policy screening, and identification of where more detailed local simulation is needed. Similar trade-offs between geometric detail, computational cost, data availability, and urban-scale comparability have been discussed in solar-potential modeling reviews and city-scale PV studies [30,37,46,47,48,49].
From an urban-planning perspective, the results suggest that BIPV deployment should be adapted to urban form rather than guided only by climatic solar resources. Cities with strong facade contribution may require design standards and incentive mechanisms for facade-integrated systems, while roof-led cities may benefit more from conventional rooftop deployment pathways. Cities with high concentrations of potential among top-ranked buildings may prioritize demonstration projects, whereas cities with more evenly distributed potential may need district-wide or building-type-based strategies. Therefore, the main significance of the study is not in providing exact building-level yield prediction, but in its establishment of a comparative framework that reveals how urban morphology, envelope composition, and data reliability jointly shape BIPV technical potential. This provides a basis for connecting BIPV assessment with urban design, renewable-energy planning, and future high-resolution simulations.
4.2. Limitations and Future Work
The results should be interpreted as a standardized comparison of technical BIPV potential within selected urban-core windows, not as validated estimates of actual deployable electricity generation. Several limitations should be noted.
First, the irradiation model was not externally validated against ground measurements, LiDAR-based radiation simulations, satellite-derived solar products, or solar cadastre datasets. Therefore, the magnitude and direction of systematic bias cannot be quantified. The observed inter-city differences may reflect real morphological differences, but may also include errors from model simplification and input-data uncertainty.
Second, the OpenStreetMap-based building dataset has uneven attribute completeness. Building height is especially important, because both facade area and facade shading depend on it. Facade-related indicators are therefore more reliable in cities with measured or derived height information, and more uncertain where default-height imputation dominates.
Third, the 2.5D geometry simplifies real building form. Buildings are represented as extruded footprints with a uniform height, and without detailed roof shapes, rooftop equipment, setbacks, facade articulations, or local self-shading. This supports scalable cross-city comparison but limits building-level accuracy.
Fourth, baseline facade estimates represent geometric upper-bound resources. Facades are initially treated as continuous vertical planes, while real BIPV deployment is constrained by windows, balcony openings, structural elements, external air-conditioning units, shading devices, maintenance zones, and architectural requirements. Therefore, facade-dominant results should be interpreted together with usable-facade correction factors, especially for buildings with high window-to-wall ratios or complex curtain-wall systems.
Fifth, the sunshine-duration correction is an empirical scaling step rather than a calibrated Angstrom–Prescott model. It adjusts clear-sky irradiation according to observed sunshine duration, but does not fully capture seasonal cloud cover, aerosol loading, humidity, or short-term weather variability.
Sixth, the reported GWh/year values are based on simplified PV conversion assumptions. A fixed module efficiency was used, while inverter losses, temperature effects, degradation, soiling, availability, grid constraints, economic feasibility, and policy restrictions were not explicitly modelled. The results should therefore be understood as DC-side technical potential or screening-level generation potential, not final AC electricity output.
Finally, the 3 km by 3 km windows improve cross-city comparability but do not represent entire municipal areas. The results describe selected urban-core samples and should not be directly extrapolated to total citywide BIPV resources.
5. Conclusions
This study establishes a city-based, comparison-capable workflow for estimating BIPV technical potential within standardized 3 km by 3 km urban-core windows in 10 representative Chinese cities. Under consistent assumptions and a unified calculation framework, the results reveal substantial inter-city variation in annual potential and show that morphology-driven factors, rather than solar resources alone, are the main drivers of divergence. The comparison also demonstrates that high aggregate potential does not necessarily correspond to the highest envelope-use efficiency at the building level.
A second key finding is the strong structural heterogeneity between roof and facade contributions, together with clear differences in concentration patterns across cities. Facade-led cities demonstrate that vertical envelope utilization can dominate total potential in high-rise and high-density contexts, whereas roof-led cities are more suitable for simpler roof-priority deployment pathways. Similarly, cities with strong concentrations near prominent buildings are better matched to demonstration-first strategies, while flatter distributions support broader rollout across medium-scale building groups.
These findings should nevertheless be interpreted within the limits of the present dataset and modeling assumptions. Height inference and missing-value imputation directly affect facade-related outputs, and coarse OSM functional tags constrain confidence in function-level interpretation where building = yes dominates. For this reason, the study is best understood as a consistent comparative assessment of technical potential rather than a direct prediction of deployable capacity.
Future work can improve this framework by introducing higher-fidelity geometry, richer attribute datasets, and tighter coupling with demand, grid hosting capacity, and storage operation. Such extensions would support a transition from comparative technical potential assessment toward more directly deployable urban BIPV planning.
In addition to the analytical findings, the results of this study also have implications for urban planning and policy development. The identification of morphology-driven differences in BIPV potential suggests that photovoltaic deployment strategies should be tailored to specific urban contexts rather than relying on uniform guidelines. For high-density and high-rise cities, where facade contributions are substantial, policy frameworks may need to place greater emphasis on facade-integrated systems, including design standards, incentives, and regulatory support for vertical applications. In contrast, cities characterized by lower building heights and more dispersed urban form may benefit more from roof-oriented deployment strategies, where implementation barriers are relatively lower and technical feasibility is more straightforward.
The proposed workflow is intended for screening-level cross-city comparison, preliminary BIPV feasibility assessment, and identification of roof- and facade-deployment priorities. It is not intended to replace detailed engineering designs, project-level system sizing, financial feasibility analyses, or high-fidelity building-level PV performance simulations, which require more detailed geometric, irradiance, facade-availability, and system-performance data.
Author Contributions
Conceptualization, Z.Q. and Z.Z.; Methodology, L.J. and Z.Q.; Software, L.J.; Data curation, H.F.; Formal analysis, H.F. and M.Z.; Investigation, H.F.; Writing—original draft, H.F., S.K.J. and M.Z.; Writing—review and editing, L.J., S.K.J., Z.Q. and Z.Z.; Visualization, H.F. and M.Z.; Supervision, Z.Z.; Project administration, Z.Q. and Z.Z. All authors have read and agreed to the published version of the manuscript.
Funding
We extend our gratitude to the Guoneng Shuohuang Railway Development Co., Ltd. for the project funding. The project is titled "Shuohuang Railway 2024 Heavy-haul Railway Zero-carbon Railway Technology Research and Application" with the project number SHTL-24-12.
Data Availability Statement
The main data supporting the findings of this study are included in the article. Additional processed datasets, including cleaned building-footprint attributes, height-imputation results, city-window calculation outputs, and BIPV potential assessment results, are available from the corresponding author upon reasonable request.
Conflicts of Interest
Authors Hanyu Feng and Lulu Jiang were employed by the company Guoneng Huangda Railway Co., Ltd. The authors declare no conflicts of interest.
References
- Hoogwijk, M.; de Vries, B.; Turkenburg, W. Assessment of the global and regional geographical, technical and economic potential of onshore wind energy. Energy Econ. 2004, 26, 889–919. [Google Scholar] [CrossRef] [Scilit]
- Šúri, M.; Huld, T.A.; Dunlop, E.D.; Ossenbrink, H.A. Potential of solar electricity generation in the European Union member states and candidate countries. Sol. Energy 2007, 81, 1295–1305. [Google Scholar] [CrossRef] [Scilit]
- Jäger-Waldau, A. Photovoltaics and renewable energies in Europe. Renew. Sustain. Energy Rev. 2007, 11, 1414–1437. [Google Scholar] [CrossRef] [Scilit]
- Jakubiec, J.A.; Reinhart, C.F. A method for predicting city-wide electricity gains from photovoltaic panels based on LiDAR and GIS data combined with hourly Daysim simulations. Sol. Energy 2013, 93, 127–143. [Google Scholar] [CrossRef] [Scilit]
- Brito, M.C.; Gomes, N.; Santos, T.; Tenedório, J.A. Photovoltaic potential in a Lisbon suburb using LiDAR data. Sol. Energy 2012, 86, 283–288. [Google Scholar] [CrossRef] [Scilit]
- Redweik, P.; Catita, C.; Brito, M. Solar energy potential on roofs and facades in an urban landscape. Sol. Energy 2013, 97, 332–341. [Google Scholar] [CrossRef] [Scilit]
- IEA PVPS. International Definitions of “BIPV”; Task 15; International Energy Agency Photovoltaic Power Systems Programme: Paris, France, 2018. [Google Scholar]
- IEC 63092-1:2020; Photovoltaics in Buildings—Part 1: Requirements for Building-Integrated Photovoltaic Modules. International Electrotechnical Commission: Geneva, Switzerland, 2020.
- IEA PVPS. Potential for Building Integrated Photovoltaics; Report IEA-PVPS T7-4:2002; Task 7; International Energy Agency Photovoltaic Power Systems Programme: Paris, France, 2002. [Google Scholar]
- Kanters, J.; Wall, M.; Kjellsson, E. The solar map as a knowledge base for solar energy use. Energy Procedia 2014, 48, 1597–1606. [Google Scholar] [CrossRef] [Scilit]
- European Commission; Joint Research Centre. PVGIS and Solar Cadastre Initiatives; European Commission: Brussels, Belgium, 2019.
- Nageler, P.; Koch, A.; Mauthner, F.; Leusbrock, I.; Mach, T.; Hochenauer, C.; Heimrath, R. Comparison of dynamic urban building energy models (UBEM): Sigmoid energy signature and physical modelling approach. Energy Build. 2018, 179, 333–343. [Google Scholar] [CrossRef] [Scilit]
- Allegrini, J.; Orehounig, K.; Mavromatidis, G.; Ruesch, F.; Dorer, V.; Evins, R. A review of modelling approaches and tools for the simulation of district-scale energy systems. Renew. Sustain. Energy Rev. 2015, 52, 1391–1404. [Google Scholar] [CrossRef] [Scilit]
- Verbruggen, A.; Fischedick, M.; Moomaw, W.; Weir, T.; Nadaï, A.; Nilsson, L.J.; Nyboer, J.; Sathaye, J. Renewable energy costs, potentials, barriers: Conceptual issues. Energy Policy 2010, 38, 850–861. [Google Scholar] [CrossRef] [Scilit]
- Resch, G.; Held, A.; Faber, T.; Panzer, C.; Toro, F.; Haas, R. Potentials and prospects for renewable energies at global scale. Energy Policy 2008, 36, 4048–4056. [Google Scholar] [CrossRef] [Scilit]
- Lopez, A.; Roberts, B.; Heimiller, D.; Blair, N.; Porro, G. U.S. Renewable Energy Technical Potentials: A GIS-Based Analysis; Technical Report NREL/TP-6A20-51946; National Renewable Energy Laboratory: Golden, CO, USA, 2012. [CrossRef] [Scilit] [PubMed]
- Malof, J.M.; Bradbury, K.; Collins, L.M.; Newell, R.G. Automatic detection of solar photovoltaic arrays in high resolution aerial imagery. Appl. Energy 2016, 183, 229–240. [Google Scholar] [CrossRef] [Scilit]
- Zhong, T.; Zhang, Z.; Chen, M.; Zhang, K.; Zhou, Z.; Zhu, R.; Wang, Y.; Lü, G.; Yan, J. A city-scale estimation of rooftop solar photovoltaic potential based on deep learning. Appl. Energy 2021, 298, 117132. [Google Scholar] [CrossRef] [Scilit]
- Xu, C.; Chen, S.; Ren, H.; Xu, C.; Li, G.; Li, T.; Sun, Y. A novel deep learning and GIS integrated method for accurate city-scale assessment of building facade solar energy potential. Appl. Energy 2025, 387, 125600. [Google Scholar] [CrossRef] [Scilit]
- King, D.L.; Boyson, W.E.; Kratochvil, J.A. Photovoltaic Array Performance Model; SAND2004-3535; Sandia National Laboratories: Albuquerque, NM, USA, 2004. [Google Scholar] [CrossRef] [Scilit]
- Dobos, A.P. PVWatts Version 5 Manual; Technical Report NREL/TP-6A20-62641; National Renewable Energy Laboratory: Golden, CO, USA, 2014. [CrossRef] [Scilit] [PubMed]
- Martín-Chivelet, N.; Kapsis, K.; Wilson, H.R.; Delisle, V.; Yang, R.; Olivieri, L.; Polo, J.; Eisenlohr, J.; Roy, B. Building-integrated photovoltaic (BIPV) products and systems: A review of energy-related behavior. Energy Build. 2022, 262, 111998. [Google Scholar] [CrossRef] [Scilit]
- Luthander, R.; Widén, J.; Nilsson, D.; Palm, J. Photovoltaic self-consumption in buildings: A review. Appl. Energy 2015, 142, 80–94. [Google Scholar] [CrossRef] [Scilit]
- Castellanos, S.; Sunter, D.A.; Kammen, D.M. Rooftop solar photovoltaic potential in cities: How scalable are assessment approaches? Environ. Res. Lett. 2017, 12, 125005. [Google Scholar] [CrossRef] [Scilit]
- Bódis, K.; Kougias, I.; Jäger-Waldau, A.; Taylor, N.; Szabó, S. A high-resolution geospatial assessment of the rooftop solar photovoltaic potential in the European Union. Renew. Sustain. Energy Rev. 2019, 114, 109309. [Google Scholar] [CrossRef] [Scilit]
- Joshi, S.; Mittal, S.; Holloway, P.; Shukla, P.R.; Ó Gallachóir, B.; Glynn, J. High resolution global spatiotemporal assessment of rooftop solar photovoltaics potential for renewable electricity generation. Nat. Commun. 2021, 12, 5738. [Google Scholar] [CrossRef] [Scilit] [PubMed]
- Fakhraian, E.; Alier, M.; Valls Dalmau, F.; Nameni, A.; Casañ Guerrero, M.J. The urban rooftop photovoltaic potential determination. Sustainability 2021, 13, 7447. [Google Scholar] [CrossRef] [Scilit]
- Cenky, M.; Bognár, G.; Kocsis, I. Urban-scale rooftop photovoltaic potential estimation and data-driven energy simulation using open-source software and publicly available GIS data. Smart Cities 2024, 7, 3962–3982. [Google Scholar] [CrossRef] [Scilit]
- Zhang, Y.; He, W.; Hu, J.; Zhou, C.; Ren, B.; Luo, H.; Tian, Z.; Liu, W. Assessment of Urban Rooftop Photovoltaic Potential Based on Deep Learning: A Case Study of the Central Urban Area of Wuhan. Buildings 2025, 15, 2607. [Google Scholar] [CrossRef] [Scilit]
- Compagnon, R. Solar and daylight availability in the urban fabric. Energy Build. 2004, 36, 321–328. [Google Scholar] [CrossRef] [Scilit]
- Freitas, S.; Catita, C.; Redweik, P.; Brito, M.C. Modelling solar potential in the urban environment: State-of-the-art review. Renew. Sustain. Energy Rev. 2015, 41, 915–931. [Google Scholar] [CrossRef] [Scilit]
- Cheng, V.; Steemers, K. Urban form, density and solar potential. In Proceedings of the 23rd Conference on Passive and Low Energy Architecture (PLEA 2006), Geneva, Switzerland, 6–8 September 2006. [Google Scholar]
- Mohajeri, N.; Upadhyay, G.; Gudmundsson, A.; Assouline, D.; Kämpf, J.; Scartezzini, J.L. Effects of urban compactness on solar energy potential. Renew. Energy 2016, 93, 469–482. [Google Scholar] [CrossRef] [Scilit]
- Sarralde, J.J.; Quinn, D.J.; Wiesmann, D.; Steemers, K. Solar energy and urban morphology: Scenarios for increasing the renewable energy potential of neighbourhoods in London. Renew. Energy 2015, 73, 10–17. [Google Scholar] [CrossRef] [Scilit]
- Lobaccaro, G.; Carlucci, S.; Croce, S.; Paparella, R.; Finocchiaro, L. Boosting solar accessibility and potential of urban districts in the Nordic climate: A case study in Trondheim. Sol. Energy 2017, 149, 347–369. [Google Scholar] [CrossRef] [Scilit]
- Amado, M.; Poggi, F. Solar urban planning: A parametric approach. Energy Procedia 2014, 48, 1539–1548. [Google Scholar] [CrossRef] [Scilit]
- Amado, M.; Poggi, F. Solar energy integration in urban planning: GUUD model. Energy Procedia 2014, 50, 277–284. [Google Scholar] [CrossRef] [Scilit]
- Kodysh, J.B.; Omitaomu, O.A.; Bhaduri, B.L.; Neish, B.S. Methodology for estimating solar potential on multiple building rooftops for photovoltaic systems. Sustain. Cities Soc. 2013, 8, 31–41. [Google Scholar] [CrossRef] [Scilit]
- Mainzer, K.; Fath, K.; McKenna, R.; Stengel, J.; Fichtner, W.; Schultmann, F. A high-resolution determination of the technical potential for residential-roof-mounted photovoltaic systems in Germany. Sol. Energy 2014, 105, 715–731. [Google Scholar] [CrossRef] [Scilit]
- Gooding, J.; Crook, R.; Tomlin, A.S. Modelling of roof geometries from low-resolution LiDAR data for city-scale solar energy applications using a neighbouring buildings method. Appl. Energy 2015, 148, 93–104. [Google Scholar] [CrossRef] [Scilit]
- Assouline, D.; Mohajeri, N.; Scartezzini, J.L. Large-scale rooftop solar photovoltaic technical potential estimation using random forests. Appl. Energy 2018, 217, 189–211. [Google Scholar] [CrossRef] [Scilit]
- Heinstein, P.; Ballif, C.; Perret-Aebi, L.E. Building integrated photovoltaics (BIPV): Review, potentials, barriers and myths. Green 2013, 3, 125–156. [Google Scholar] [CrossRef]
- Shukla, A.K.; Sudhakar, K.; Baredar, P. Recent advancement in BIPV product technologies: A review. Energy Build. 2017, 140, 188–195. [Google Scholar] [CrossRef] [Scilit]
- Attoye, D.E.; Tabet Aoul, K.A.; Hassan, A. A review on building integrated photovoltaic facade customization potentials. Sustainability 2017, 9, 2287. [Google Scholar] [CrossRef] [Scilit]
- Saretta, E.; Caputo, P.; Frontini, F. A review study about energy renovation of building facades with BIPV in urban environment. Sustain. Cities Soc. 2019, 44, 343–355. [Google Scholar] [CrossRef] [Scilit]
- Bernard, J.; Bocher, E.; Le Saux Wiederhold, E.; Leconte, F.; Masson, V. Estimation of missing building height in OpenStreetMap data: A French case study using GeoClimate 0.0.1. Geosci. Model Dev. 2022, 15, 7505–7532. [Google Scholar] [CrossRef] [Scilit]
- Biljecki, F.; Ledoux, H.; Stoter, J. An improved LOD specification for 3D building models. Comput. Environ. Urban Syst. 2016, 59, 25–37. [Google Scholar] [CrossRef] [Scilit]
- Polo, J.; García, M. Solar potential uncertainty in building rooftops as a function of digital surface model accuracy. Remote Sens. 2023, 15, 567. [Google Scholar] [CrossRef] [Scilit]
- Biljecki, F.; Stoter, J.; Ledoux, H.; Zlatanova, S.; Çöltekin, A. Applications of 3D city models: State of the art review. ISPRS Int. J. Geo-Inf. 2015, 4, 2842–2889. [Google Scholar] [CrossRef] [Scilit]
Disclaimer/Publisher’s Note: The statements, opinions and data contained in all publications are solely those of the individual author(s) and contributor(s) and not of MDPI and/or the editor(s). MDPI and/or the editor(s) disclaim responsibility for any injury to people or property resulting from any ideas, methods, instructions or products referred to in the content. |
© 2026 by the authors. Licensee MDPI, Basel, Switzerland. This article is an open access article distributed under the terms and conditions of the Creative Commons Attribution (CC BY) license.