


Abstract
The research scope comprises the analysis of disjunctions between photographic representations, architectural landmarks, tourist icons, and urbanized surroundings. Given the problem posed by imagery distortions in human cognition, the guiding hypothesis is that the perception of scenes of constructed touristic attractions is distorted with respect to their associated built vicinities. Therefore, the general objective is to systematize guidelines for integrating public policies on visual communication and urban management. Using multi-method, applied, qualitative–quantitative, and exploratory approaches, an investigation is conducted in four main parts: a literature review highlighting knowledge gaps on the topic; procedural methods involving the selection of study areas (cities) and objects (architectures) from those most visited worldwide in the pre-pandemic period followed by submitting their representative photographs for interpretation by experts and the public; analysis involving interpreting respondents’ feedback in association with specific criteria; and an integrated discussion leading to the formulation of directives. As a synthesis of the answers to the research question, the results diagnose a misrepresentation of the immediate and nearby surroundings of architectural sites due to the exclusive observation of images published on official tourism websites, confirming the proposed hypothesis and concluding that the methodological essay is feasible, with case-specific adaptations, as a reference for adequately conveying touristic landscapes in contemporary cities.
1. Introduction
Photography has served to document various aspects of human societies ever since it was invented in the early nineteenth century, but several aspects of human relationships with image representations have not yet been sufficiently investigated [1,2]. In turn, photographic techniques are evolving rapidly, and the prevailing trends point toward a focus on technological innovations, environmental concerns, and social awareness that is reshaping visual storytelling [3].
The notion of ‘seeing is believing’ has been obsolete for quite some time [4], given that photographs have been manipulated as a visual representation method. Due to recent technological progress, images can now appear genuine even without being anchored in reality. In a world that is becoming more urbanized, this underscores the essential role of photography in tourism and other fields, particularly as a means of enhancing visitors’ experiences [5].
Today, the ease of sharing digital images has changed the practices, functions, and meanings of photography, especially in relation to scenes disseminated by the media. These changes have repercussions in a general context but stand out particularly in the field of tourism [5,6,7,8,9].
The perception of images is guided by the perspective established before the viewer’s gaze is fixed, and the perceptual distortion of photographs—namely, the way in which viewers misinterpret various pictorial representations—has long been a subject of inquiry across multiple disciplines [10]. A bibliometric analysis of the topic concludes that connections between photographic representation and architectural landmarks, tourist icons, and urbanized surroundings are infrequent, thereby revealing an important scientific gap that is addressed in this study [11].
Generally, photographic representations may not faithfully correspond to local realities [4,12], and this problem is amplified by the modification of images for various purposes, including augmenting the value of tourist attractions [9,13]. Therefore, the communicated landscape is the one publicized through disseminated scenes, transforming the perception of places, which also shape narratives about architecture and built spaces [14], requiring the development of guidelines to support the processes of urban planning and management aimed at creating communicative and sustainable cities [15,16,17] based on social cohesion [18,19] and environmental resilience [20,21]. This premise is especially relevant for urbanized areas linked to iconic architectural tourism sites circulated through media, and this relationship is one of the main original and distinctive aspects of this essay, which also employs innovative procedures.
Based on the preceding presentation of its general context and central problem, this study seeks answers to the research question concerning the degree of perceptual distortion in photographic representations of architectural landmarks constituted as tourist icons in relation to their corresponding urbanized surroundings. In this framework, the guiding hypothesis—that the perception of scenes of constructed touristic attractions is distorted with respect to their associated built vicinities—is tested through an examination of the elements that cause this misrepresentation when observing photographs published on official websites. As a corollary, the general objective of the study is to systematize guidelines for integrating public policies on visual communication and urban management.
Beyond this introductory part, the article is structured into the following sections: Literature Review—this section addresses fundamental theories and concepts and the positioning of the research within the context of existing studies, highlighting scientific gaps and the relevance of the work; Materials and Methods—this section details diverse methodological procedures related to the selection of study areas (cities) and objects (architectures) and the evaluation of representative images; Results—this section presents results derived from the integrated analysis of architectural landmarks, immediate surroundings, and urbanized contexts; and Discussion—this section examines the main findings, linking the central themes and proposing directions for planning, management, and communication processes, along with the original contributions and principal limitations of the investigation. In the final part of the manuscript, the discoveries are articulated as conclusions of the methodological essay.
2. Literature Review
As previously mentioned, the principal gap in the topic concerns the scarcity of studies on the relationships between photographic representation, architectural landmarks, tourist icons, and urbanized surroundings [11]. Accordingly, these themes guide the theoretical and conceptual foundations of the research.
2.1. Photographic Representation
Considering theories ranging from technical transmission of information to theoretical approaches to the sociocultural effects of media, the concept of communication can be synthesized as a process of continuous mental inference, grounded in both individual and collective cognition [22] and often stimulated by images. Since landscape constitutes the visual manifestation of space, its communicated condition implies that it is publicly disseminated through circulating scenes. Such diffusion reshapes the perception of places and simultaneously contributes to the construction of narratives [14].
Among visual tools, photography stands out as one that, under abstract–practical and historical–cultural perspectives, encompasses a plurality of artistic, documentary, and narrative expressions [23]. Its principles can be summarized into five main axes: identity, place, representation, perception, and event [24].
Since the photographic representations are not merely objective records but also aesthetic and expressive constructions of images, they are linked to compositional aspects that direct the viewer’s gaze through modes of structuring light, perspective, framing, and objects, among other compositional elements [25]. They are also associated with characteristics of deconstruction used as artistic resources to provoke new interpretations, understood as factors of fragmentation or optical disassembly [25].
Although many persuasive messages include images, little is known about the potential of visual components to induce human reactions [26]. In this framework, the examination of the effects of message variations—such as their positioning and angle of capture, the juxtaposition of contrasting scenes, and the facial expression of emotion—leads to an assessment of the potential to evoke psychological reactance [26].
The human brain processes photographic images through different perceptual mechanisms [27], and photography can be explored as a mediator of historical narratives and local cultures [28,29,30]. However, its contemporary documentary representation faces an era of ‘post-truth,’ given that emotions and personal beliefs are frequently superimposed on scientific facts [31]. By exploring new ethical and critical strategies to address social issues, it does not aim to represent reality in a neutral manner within a political and cultural perspective marked by misinformation [31].
Before the viewer’s eyes rest on an image, a perspective is already defined that guides perception. The distortive potential of photographs—manifested in the frequent misreading of visual depictions—has consistently been explored within multiple areas of knowledge [10].
Contrary to photorealism, the interactions between artificial intelligence (AI) and photographic culture reveal fragmented and incomplete perspectives. Within this domain, there are tensions between stereotyped results and unique human creations, with AI tending to generate fewer specific details in many cases [32].
This brief exposition of the state of the art on photographic representation reinforces the context and the problem outlined in the introductory section. In other words, it confronts the issue of perceptual distortion in disseminated scenes, as well as the scientific gap addressed. Specifically, for the present study, the investigative interest lies in constructed icons.
2.2. Architectural Landmarks
From classical theories—such as the Vitruvian—to the diversified contemporary ones, in theoretical–empirical terms, architecture is understood as a practice of spatial intervention aimed at shaping social and environmental futures [33], and its framing in contemporaneity can be situated within the set of responses to sustainable development crises [34]. Architectural products classified as landmarks are defined as physical structures that anchor spaces, establishing cognitive reference points [35,36].
These buildings are distinct generators of meaning in cities, resulting in the formation of their identities through symbols drawn from collective memory [37]. Built elements and environmental components are inseparably connected, with the former influencing the urban image, human conditions, social well-being, and economic profiles [38].
Recent advances in AI have reshaped architectural design through the enhancement of spatial planning, parametric modeling, generative drawing, and performance-based analysis [39]. Aiming at the determination of its suitability as a target for the identification of reference points, specific conditions of constructed works strongly contrast with the surrounding environment and have a greater likelihood of attracting visual attention, remaining in human memory, and activating brain regions associated with spatial orientation [40]. Nevertheless, challenges across generative methods include the persistent problem of visual-semantic hallucination [41].
This brief synthesis on architectural landmarks is once again linked to the research problem and the main general gap addressed in this article, namely that images can be distorted from local reality. This condition is commonly observed in figures associated with tourism symbols.
2.3. Tourist Icons
Tourism theories have evolved from classical models—which regarded the occurrence of displacement and leisure—to contemporary approaches that conceptualize it as a systemic phenomenon in social, economic, and environmental terms, reflecting on principles for destination management and incorporating issues related to digital innovation and collaborative governance [42]. Although there is research on images of tourist attractions, scientific gaps remain concerning the study of iconic assets with visual influences, as well as the inverse challenge, namely how representations of these places impact such resources, many of which are established under the configuration of architectural works [43].
On the one hand, there are shifts toward constructed icons integrated into the landscape, with tourist facilities prioritizing atmospheres and experiences rather than utilitarian characteristics [44]; on the other hand, digital images have transformed the conditions and interpretations of tourist destinations [5,6,7,8,9]. However, innovative approach and technological integration, associated with participatory perspectives [18], including alignment with the sustainable development goals (SDGs) [21], aim at the equitable development of tourist regions, confirming that the achievement of this objective depends on the balance between governmental guidelines and community initiatives [16].
Despite the fundamental relevance of the spatial distribution of tourist attractions [45], the literature on the location of tourism activities is scarce [46], thereby reinforcing, in association with this concise overview of tourist icons, the thematic importance of the present study. Within this context, not only must the exact locational positions be considered, but also the characteristics of their built vicinities.
2.4. Urbanized Surroundings
Among recent urban and sociological theories, the notion of city–human needs [47] stands out for this study, integrating socio-environmental dimensions into the objectives of the 2030 Agenda [21]. From the review of major theoretical traditions in urban sociology (ranging from those derived from the Chicago School and urban Marxism to post-structuralist perspectives, for instance), critical approaches persist, connecting classical principles with contemporary challenges such as gentrification, inequality, and globalization—issues often associated with tourism [48].
In contemporary cities, it is important to highlight remarkable imbalances between tourist attractions and their adjacent spaces. Few existing studies explore this issue, and these primarily focus on the identification of points of interest and rarely on urban areas attractive to visitors [46]. This situation once again reinforces the scientific gap addressed in this study.
Historical landmarks, urban aesthetics, landscape complexity, spatial permeability, compositional harmony, human scale, and overall diversity elicit both positive and adverse behaviors, as well as topophilic or topophobic emotions [49,50]. On the other hand, social media information is frequently employed in studies restricted to travel planning and the factors influencing travel decisions [46].
In this regard, it should be noted that advances in AI have also produced relevant impacts on touristic activities, with the generation of digital products, including imagery, interfering with the perception of tourist icons and their surroundings [51]. Thus, there remains the need to deepen knowledge on the subject so that technical-technological solutions can enable synergies between efficiency and sustainability for the genuine promotion of urban tourism development.
Notwithstanding its concise approach, this literature review highlights the main thematic issues in the research and the scientific gaps that demonstrate the originality of the study, some of which are identified by the sources themselves and justify the relevance of the present work. At the same time, the introduction of methodological novelties is pursued, resulting in theoretical–empirical contributions to the field of knowledge.
3. Materials and Methods
Based on the previous postulates and on multi-method structure, applied nature, qualitative–quantitative approach, and exploratory character, the research was conducted using exploratory, descriptive, and analytical methods, carried out in two main phases: selection of the study areas (cities) and objects (architectures), and evaluation of representative images (architectural landmarks, immediate surroundings, and urbanized contexts), as described below (Figure 1).
Figure 1.
Diagram of the methodological flow of the research’s phases, stages, and steps. Source: Developed according to the procedures adopted by the authors.
3.1. Selection of the Study Areas: Cities
Structured in five core methodological steps (see Figure 1), this stage of the first phase was based on a probabilistic multistage sampling method, with a combination of criteria applied in successive levels [52]. It began with the selection of five cities according to their highest visitation levels over the past decade (2010 to 2019), before the coronavirus disease 2019 (COVID-19) pandemic. This option was chosen because pre-pandemic stages of international tourism had not fully recovered during the study elaboration period [53,54].
The first step was based on the rankings of the top 100 cities among the world’s most visited destinations by tourists between 2010 and 2019, as reported by Euromonitor International [55], an organization that tracks global market trends and compiles reports using global, regional, and national data sources [56]. The goal of this step was to include urban areas with the highest annual visitation rates prior to the onset of the COVID-19 pandemic.
In the second step, to reflect the relevance of more recent data, the rankings from the data from the seven available years at the moment of the study elaboration (2010 to 2014, 2018, and 2019) [55] received different weights (ω), with greater importance assigned to the most recent (2019: ω = 2.0) and less to the earliest (2010: ω = 1.0). Cities that consistently appeared in the rankings throughout the entire period were also retained. This process resulted in a selection of 66 urban centers, from which the top 17—those in the upper quartile—were chosen based on median values (third step).
To enhance global representativeness, these cities were then cross-referenced with lists of the most popular tourist attractions worldwide in 2018 and 2019. The 10 attractions identified by TripAdvisor [57,58] were scored in reverse order (first place received 10 points, while the tenth received 1). The 15 attractions listed by Uber in the same years [59,60] were normalized to a 1–10 scale to align with the previous dataset. Both sets were then evaluated using the same scoring method. This formed the fourth step, narrowing the focus to six cities and 10 key tourist landmarks.
To further confirm the global importance of these urban centers, the selected destinations were compared with the top 10 most visited countries worldwide from 2011 to 2021, based on data from the United Nations World Tourism Organization [53,61]. This fifth step revealed that only one of the six cities—Dubai, United Arab Emirates—was not located in one of the top 10 most-visited countries, resulting in a final group of five study areas (Paris, France; New York, United States; Rome, Italy; London, United Kingdom; Istanbul, Turkey).
3.2. Selection of the Study Objects: Architectures
This stage of Phase 1 was structured into two core methodological steps (see Figure 1), also based on a probabilistic multistage sampling method, with a combination of criteria applied at successive levels [52]. During the choice of the architectural landmarks (first step), according to the same data of the classification of the most popular tourist attractions worldwide in 2018 and 2019 [57,58,59,60], only a single point of interest was found for three of the cities, which was subsequently selected to represent each of them.
In the case of the other study areas (Paris, France, and New York, United States—three attractions for each), beyond calculating the total score based on the combined values of individual sites, additional criteria were introduced to promote diversity in the types of attractions (second step). These differentiation guidelines were applied across all selected tourism landmarks, considering both their original intended purposes and the nature of visitor engagement they historically attracted: Eiffel Tower, Paris, France—monumental purpose to commemorate an event; Empire State Building, New York, United States—tertiary service for business uses; Colosseum, Rome, Italy—sports task for watching competitions; Buckingham Palace, London, United Kingdom—monarchical feature with official attendance; Blue Mosque, Istanbul, Turkey—liturgical duty for religious celebrations. Thus, the sample result comprised the five buildings of analytical interest mentioned above.
3.3. Evaluation of Representative Images: Architectural Landmarks
As the initial stage of the second phase (see Figure 1), the first step was based on a probabilistic multistage sampling method, with a combination of criteria applied in successive levels [52], and the set of photographs of the tourist attractions was subjected to the following selection requirements:
- (a)
- The image should have been taken in 2020 or 2021 to ensure temporal consistency in the research;
- (b)
- The scene had to be published on the city’s official website (Eiffel Tower, Paris, France: n = 12; Empire State Building, New York, United States: n = 4; Colosseum, Rome, Italy: n = 9; Buckingham Palace, London, United Kingdom: n = 6; Blue Mosque, Istanbul, Turkey: n = 16), preferably in the tourism section, to ensure reliable and consistent information;
- (c)
- The building needed to be shown within an urban environment, maintaining relevance to the dual focus on architecture and the city;
- (d)
- The entire architectural structure had to be visible in the frame, enabling a clear understanding of its overall form and volume;
- (e)
- The perspective should, whenever possible, reflect the eye level of a typical viewer, simulating a visitor’s first impression;
- (f)
- Only daytime images were considered, given that access to some sites is limited to morning or afternoon hours.
The best compliance with these criteria enabled the selection of a sample comprising five photographs of analytical relevance (first step) (Figure 2).
Figure 2.
Selected photographs of the most visited architectural landmarks in 2018 and 2019 in the world’s most traveled-to cities from 2010 to 2019 and located in the top 10 toured countries from 2011 to 2021. Sources: 1 [62], 2 [63], 3 [64], 4 [65], and 5 [66].
In the second step of Stage 1, based on a non-probabilistic intentional sampling method, with selection based on the researcher’s judgment of the population representatives [67], the five images published on official websites were anonymously evaluated by experts using the Delphi Technique, a process used for group decisions. The advantages of this methodological alternative over others lie in the specialized interpretations of specific technical parameters [68] and, in the study in question, in the freedom afforded by anonymous evaluation, which, in this context, does not necessitate formal research ethics protocols, especially due to its opinion-based nature, without personal identification and with aggregated data, which do not contain sensitive characteristics.
The Delphi Technique is supported by the Wisdom of Crowds Theory, according to which the collective intelligence of a set of people is superior to individual knowledge [69]. In this process, it is common to establish a maximum of 30 evaluators per group, and a minimum of 10 participants [69,70]. The final number of experts—with international experience in their respective fields and consulted through digital means—was determined by the degree of response homogeneity, with consensus (c) in this study defined descriptively as exceeding 75%. The results of each type of evaluation were categorized into four quality classes (high, medium-high, medium-low, and low).
Thus, 15 photographers interpreted the following characteristics of the official photographs [71,72], with consensus (c) values derived for each variable: imagery (technical quality—composition and production—c = 77.0–85.3%), geographical (spatial-temporal representation—place and date—c = 77.7–82.5%), physical (stability conditions—fixed objects—c = 77.2–82.7%), figurative (ephemerality attributes—moving or changing elements—c = 75.7–83.0%), and thematic (symbolic representativeness—meaning—c = 79.2–80.4%).
A total of 16 experts from the field of architecture were also consulted to evaluate the variables related to the principles of classical architecture established by the Roman architect Marcus Vitruvius Pollio (~80 BC–15 BC) in his work ‘De architectura libri decem,’ which are [73]: structure (firmitas—c = 78.9–80.9%), form (venustas—c = 77.8–82.4%), and function (utilitas—c = 77.9–85.3%).
The following compositional variables were also rated in the photographs of the architectural tourist attractions: natural physical—sky (without clouds), clouds, water, rocks, and others (exposed soil, sand, etc.); natural biological—trees, non-arboreal vegetation, and others (animals, etc.); anthropic built—buildings and enclosures, streets and pavements, urban furniture, visible infrastructure (lights, fences, etc.), commercial signs, and others; and anthropic mobile—motorized vehicles (cars, buses, motorcycles, etc.), people, and others (non-motorized vehicles, etc.). Taking them into account, the authors determined their proportions in the images (Figure 3). The elements in the photographs were measured using AutoCAD 2024 software (Autodesk Inc., San Francisco, CA, USA) and tabulated proportionally in Excel spreadsheets (Microsoft Corp., Redmond, WA, USA).
Figure 3.
Edited photographs of selected architectural landmarks, considering the compositional variables of the location. Sources: Based on 1 [62], 2 [63], 3 [64], 4 [65], and 5 [66].
3.4. Evaluation of Representative Images: Immediate Surroundings
In the first step of the second stage of Phase 2 (see Figure 1), the photographs of the vicinities corresponded to the same five previously defined, but with and without the tourist icon (Figure 4) and with the architectural feature removed using Adobe Photoshop 2023 software (Adobe Inc., San Jose, CA, USA).
Figure 4.
Edited photographs of the sites of the selected architectural landmarks with the exclusion of the monument. Sources: Based on 1 [62], 2 [63], 3 [64], 4 [65], and 5 [66].
In the second step of the same phase, the images of the immediate surroundings with and without the reference architecture (see Figure 2 and Figure 4) were interpreted using the same Delphi Technique by 17 professionals from the field of urban planning and through 173 anonymous questionnaires completed by respondents of the public with international experience, to measure recognition (binary responses—yes or no) of the site (descriptive consensus values among urban planners ranged up to 75.0%).
The questionnaires were structured into three sections. The first focused on the respondent’s profile—gender, age group, place of residence, nationality, educational level, academic background, and current occupation. The second addressed the analysis of photographs of five architectural monuments (attractiveness rated on a scale of 1 to 10) as well as their urban contexts (evaluated using the same scale).
The third section was devoted to the recognition of spaces, with closed-ended questions (yes; no, but familiar through media; no, never seen before). Following this, respondents were presented with three perceptual options regarding the urban context (closed-ended, whether it matched their expectations, or whether it was positively or negatively surprising) and were asked to provide justifications for their answers (open-ended question).
The public survey, based on a probabilistic method of simple random sampling in which each populational element has the same chance of being chosen [52], was made available on social media (WhatsApp and Instagram), taking into account the world’s demographic contingent at that time (8.2 billion individuals) [74]. The target group included travelers (estimated at under 20%, i.e., 1.6 billion) over the age of 15—that is, those capable of reasonably interpreting the questions (also estimated at under 20% of the latter quantity, i.e., 320 million).
Therefore, the sample of participants in the anonymized public survey has a 90% confidence level, with an approximate sampling error of 6.2%. The predominant characteristics of those consulted were: gender—female (56.6%), relatively close to global averages of the female population (around 50% at that time) [75]; age range—between 30 and 59 years old (50.3%), included in the age bracket most common worldwide (approximately 30.5 years) [75]; education—completed higher education (36.0%), disregarding postgraduate levels, which together account for 37.0%; qualifications—40 different professions, most of them in the Social Science and Humanities fields (50.0%); current occupations—a prevalence of students (25.9%), retired people (18.5%), and architects and urban planners (18.5%). The same 173 respondents from public consultation answered questions about previous visits to the locations, the perceptions of those who have or have not visited the sites, and the attractiveness of locations photographed with and without the architectural icons (third step).
The evaluation of the photographic attributes of the tourist attraction surroundings without the architectural features was also carried out by the same 15 photographers and 17 urban planners using the Delphi Technique. These analyses were performed based on the characteristics of images [71,72], with corresponding descriptive consensus (c) values for each variable: imagery (technical quality—composition and production—c = 75.2–84.3% for photographers; c = 78.6–82.3% for urban planners), geographical (spatial-temporal representation—place and date—c = 75.5–86.0% for photographers; c = 78.8%–80.7% for urban planners), physical (stability conditions—fixed objects—c = 75.1–86.5% for photographers; c = 77.8–81.4% for urban planners), figurative (ephemerality attributes—moving or changing elements—c = 76.5–83.6% for photographers; c = 75.8–84.0% for urban planners), and thematic (symbolic representativeness—meaning—c = 76.4–87.0% for photographers; c = 77.6–82.1% for urban planners).
3.5. Evaluation of Representative Images: Urbanized Contexts
The first step of this third stage of the second phase (see Figure 1) was conducted by the arrangement of images available on Google Street View from 2021, taken near street junctions and aligned with the road axes, resulting in 16 photographs per landmark and 80 in total (Figure 5).
Figure 5.
Selected images of urbanized contexts near the architectural landmarks. Sources: Based on Google Earth (2021) (image above; vertical projection) and Google Street View (2021) (image below; at observer level).
The images of the urbanized contexts were also rated by the authors, who determined the proportions of the same compositional variables previously classified as natural physical (abiotic) and biological (biotic), and anthropic built and mobile. Taking them into account (Figure 6), the elements in the images were also measured using AutoCAD 2024 software and tabulated proportionally in Excel spreadsheets.
Figure 6.
Edited photographs of the urban contexts of selected architectural landmarks, considering the compositional variables of the location. Sources: Based on Google Street View (2021).
3.6. Methodological Considerations: Descriptive Statistical Outcomes
Complementing the research procedures, a general descriptive statistical analysis of the collected data was conducted. It should be emphasized that the assessment was of a general and merely supplementary nature, organized by study objects (Eiffel Tower, Empire State Building, Colosseum, Buckingham Palace, and Blue Mosque), expert respondents (photographers, architects, and urban planners), components of images related to architectural landmark and urbanized surroundings, recognition of the tourist icons and their sites (responses from experts and the public), and attractiveness (with or without the monument).
From the experts’ analysis (Table 1), the comparative evaluation of the photographs of the location of the monuments demonstrates consistent descriptive statistical patterns. For the Eiffel Tower, mean values remain stable across conditions, yet dispersion increases without the structure, indicating heightened heterogeneity.
Table 1.
Descriptive statistical values of analysis variables of photographs with and without the architectural tourist attractions by the experts participating in the Delphi Technique.
The Empire State Building exhibits nearly identical distributions, with coinciding medians and uniform ranges, reflecting stability. In contrast, the Colosseum shows reduced averages with the monument present but greater variability, while absence yields positive skewness and broader ranges, suggesting diverse visual outcomes.
Regarding Buckingham Palace, lower means accompany higher variability when included, whereas exclusion elevates the median and reduces dispersion, pointing to more consistent distributions. The Blue Mosque reveals higher averages and lower variability with the monument, while absence narrows the range, highlighting uniformity. Overall, these findings underscore how architectural landscapes’ presence systematically influences both central tendency and dispersion, producing distinct statistical profiles across tourist icons.
When interpreting the locational components of photographic representation, evaluated according to compositional variables for icons (architectural landmarks) and urbanized surroundings (Table 2), overall, the comparative descriptive analysis demonstrates that while mean values remain virtually identical across monuments, measures of dispersion and distributional shape reveal notable contrasts. The Eiffel Tower and Colosseum consistently display higher variability, with enlarged deviations, variances, and ranges, indicating greater heterogeneity in visual records.
Table 2.
Descriptive statistical values of locational components of photographic representations according to their compositional variables for icons (architectural landmarks) and urbanized surroundings.
In contrast, the Empire State Building and the Blue Mosque exhibit tighter clustering and reduced spread, reflecting more stable and uniform outcomes. Median values fluctuate across sites, with lower central points for the Colosseum and Buckingham Palace and slightly elevated ones for the North American structure, suggesting differences in compositional balance.
In addition to central tendency, shape descriptors reveal distinct statistical signatures. Extreme kurtosis in the Eiffel Tower and Colosseum denotes heavy-tailed distributions, while flatter profiles in the Blue Mosque and Buckingham Palace suggest more even distributions. Positive skewness is present in all cases, though more pronounced for the first and the second icons, reinforcing asymmetry toward higher values. Taken together, these findings underscore how the presence of monuments systematically influences variability, symmetry, and distributional form, producing differentiated measure profiles across iconic and urban contexts.
When organizing the data according to recognition of the locations (Table 3), the descriptive statistical assessment reveals remarkable consistency in central tendency, with mean and median values fixed at 50,000 across all monuments and respondent groups. This uniformity suggests a stable baseline in photographic representation. However, measures of dispersion vary considerably: experts generally report lower standard errors and deviations, while public responses display much wider variability, particularly for the Blue Mosque and Colosseum. These differences indicate that professional evaluations are more homogeneous, whereas public perceptions introduce greater uncertainty and spread.
Table 3.
Descriptive statistical values of locational recognition of photographic representation based on responses from experts participating in the Delphi Technique and through public consultation.
Aside from dispersion, the range and variance further emphasize contrasting descriptive patterns. Expert judgments remain relatively narrow, with minimum and maximum values clustered close to the mean, reflecting controlled assessments. In contrast, public consultation produces broader ranges and substantially higher variances, underlining diverse interpretations and less consistent recognition. Taken together, these findings demonstrate that while central measures remain stable, the distributional properties diverge sharply between expert and public groups, underscoring the influence of methodological expertise on statistical reliability in locational recognition studies.
Finally, the descriptive analysis of the data on the attractiveness of the location with and without architectural landmarks (Table 4) indicates remarkable uniformity in central tendency, with mean and median values consistently aligned across monuments, regardless of the presence or absence of tourist icons. However, measures of dispersion reveal notable contrasts: standard errors and deviations are considerably higher for the Colosseum and Blue Mosque, pointing to greater variability, while the Empire State Building and Buckingham Palace exhibit tighter clustering, reflecting more consistent assessments.
Table 4.
Descriptive statistical values of attractiveness of location photographs with and without the tourist icons reported by respondents from public consultation.
Variance values reinforce these differences, with the Colosseum showing the widest spread, whereas Buckingham Palace demonstrates more controlled distributions. Beyond dispersion, range and extremities further emphasize divergent outcomes. The Eiffel Tower and Blue Mosque display broader ranges between minimum and maximum values, highlighting pronounced heterogeneity, while the Empire State Building and Buckingham Palace maintain narrower intervals, suggesting more uniform recognition.
The sums mirror the stability of central measures, remaining close across monuments. Taken together, these findings underscore that although averages remain constant, variability and distributional breadth differ substantially, revealing how monument presence influences descriptive statistical reliability.
The methodological procedures outlined above aim to ensure transparency throughout the process and to guarantee the reproducibility of the study. At the same time, they serve to facilitate the understanding of the scientific findings presented below.
4. Results
Integrated analysis of the selected photographs, immediate surroundings, and urban contexts of the tourist icons based on the application of the previous methodological procedures is summarized in the following subsections.
4.1. Integrated Analysis of the Representative Images: Architectural Landmarks
This subsection presents overall ratings for the analytical variables relating to the photographic images. The Blue Mosque is rated highest of the five locations by the photographers (1706.9), with better relative evaluations in the following categories: physical (stability condition of fixed objects—380.0), geographical (spatial-temporal representation of place and date—373.3), and thematic (symbolic representativeness of meaning—340.1) (Table 5).
Table 5.
Rating matrix of analysis variables for photographs of architectural tourist attractions by the experts (photographers) participating in the Delphi Technique.
The Colosseum scores lowest (1360.3) and, apart from the figurative category, receives the lowest ranking. Overall, this class of ephemerality attributes of moving or changing elements has the lowest rating (1293.3), despite being the highest for the Empire State Building photograph (313.2), with geography (spatial-temporal representation of place and date) rated highest (1673.2). The Eiffel Tower rates highest in terms of imagery (technical quality of composition and production) (353.3).
In short, the elements that stand out are the place depicted in the photograph and the result of its trajectory over the years. People and other components that appear only occasionally are less representative. These results align with the argument regarding the relevance of the touristic visibility of heritage sites [76], but they contrast with findings concerning the presence of individuals in images being attractive for tourist locations [77].
Regarding the Vitruvian variables in the same images, the architects again award the highest total points to the Blue Mosque (1110.7), mainly due to the categories of venustas (form/beauty—377.7) and firmitas (structure/solidity—359.2) (Table 6). At the other end of the scale, the Eiffel Tower is rated lowest (988.3), due to utilitas (function/utility—238.8).
Table 6.
Rating matrix of Vitruvian analysis variables in the photographs of architectural tourist attractions rated by the experts (architects) participating in the Delphi Technique.
In general, firmitas (structure/solidity—1816.5) prevails, while utilitas (function/utility—1622.7) is rated lowest. The limited sample size reveals descriptive statistical variability, especially in the case of the Eiffel Tower. There is an emphasis on the constructive character of the architectural work associated with the adoption of materials, which should be related to sustainable practices [78]. On the other hand, there is less consideration of the use of space, linked to local functionality, which might indicate design flaws pertinent to spatial performance [79].
The evaluation of the image components (Table 7) demonstrates a predominance of natural physical components (42.6%), with a strong presence of sky (36.6%), notably for the Eiffel Tower (65.6% of the photo), followed by clouds (5.0%), more prominent for the Blue Mosque (17.1% of the photo). However, perception can be influenced by changes in the landscape due to daily and seasonal variations in sky and cloud conditions [80].
Table 7.
Rating matrix of compositional variables in photographs of architectural tourist attractions according to proportionality in the images.
Anthropic-built components are rated at 37.7%, due to the substantial presence of buildings and fences (28.0%), especially in the image of the Empire State Building (60.3% of the photo). Streets and pavements should also be mentioned (7.9%), which are more marked for the same example (26.5% of the specific photo), due to the very essence of the city as a man-made environment. Thus, emphasis is given to the systemic vision of the ‘socio-eco-evolutionary’ transition associated with global urbanization, at the risk of reducing urban sustainability [15].
Natural biological components then account for 18.8% of the total, singling out trees (10.4%), which are highly featured in the Blue Mosque photograph (22.4%). Non-arboreal vegetation averages 8.4%, standing out in the image of Buckingham Palace (28.8%). In general, scenes of nature are better processed by the human brain, whereas unnatural images can sometimes elicit hemodynamic responses of discomfort [81].
Unusually, anthropic mobile components achieve a low rating of 1.0%. This may reflect the photographer’s choice of framing the object itself, aimed at emphasizing the composition and the idea to be conveyed to viewers [14]. The following analysis integrates results by interpreting aspects of the direct urban vicinities of the landmarks studied.
4.2. Integrated Analysis of Representative Images: Immediate Surrounding
Table 8 shows a notable lack of recognition of the photograph locations with the tourist attractions removed (74.5% of the total), especially by urban planners participating in the Delphi Technique (64.7%). Almost all the participants were unable to identify the Blue Mosque (100.0% of the experts and 98.8% of the public), while the urban space of the Empire State Building was recognized by 58.8% of the former and the Eiffel Tower by 27.2% of the latter.
Table 8.
Rating matrix of photograph locations recognition without the architectural tourist attractions by the experts (urban planners) in the Delphi Technique and by respondents through public consultation.
Despite the Empire State Building being a highly visited and widely publicized tourist attraction, eight of the ten urban planners (80.0%) who said they recognized its location correctly identified the city of New York. From the public consultation, 47 respondents identified the location of the Eiffel Tower, with 37 replies (78.7%) accurately naming the French capital. These participants were more accurate in relation to the Colosseum, with 39 out of 45 correct references for Rome.
The evaluation of image variables for the tourist attraction surroundings without the architectural features demonstrated that the photographers rated the Colosseum (1558.4) higher than other sites (Table 9). In contrast, photos with the monument were rated lowest, at 1360.3 (see Table 4). At the other end of the spectrum, the Blue Mosque location, which previously ranked highest (1706.9), now ranks lowest (1024.8).
Table 9.
Rating matrix for analysis variables of photographs of tourist attraction surroundings without their architectural features by the experts (photographers) participating in the Delphi Technique.
Overall, the physical category (stability conditions of fixed objects), which placed second for the official image (1666.8) (see Table 5), is now the highest rated (1571.4), with the Colosseum standing out (488.1). On the other hand, the figurative category (ephemerality attributes of moving or changing elements) is rated lowest for photographs with the architectural features (1293.3) and for those without them (1076.5).
This result demonstrates the importance of the presence of tourist icons in official photos, as they can change experts’ perceptions in relation to the images. For a long time, seeing has not been synonymous with believing [4], as photographs can be falsified and manipulated, and given recent technological advances, reality is no longer necessary for them to appear authentic, which confirms the contrast between real and unknown components in photographic scenes.
As a result, the rationale of representing objects and their relationship with lived experience and constructed space is superimposed on the perception of the local and its trajectory over time. However, the occasional presence of people and other components remains less remarkable, except for the visibility of heritage elements [76].
The photographs of urban surroundings most highly rated by urban planners in terms of analysis variables are those of Buckingham Palace (1528.9) (Table 10), which the photographers rate second to last (1182.3) (see Table 9). Coinciding with this view, the Blue Mosque’s urban context is rated lowest in all categories (a total of 1288.0), except for figurative (ephemerality attributes of moving or changing elements), whose lowest rating (217.7) goes to the Eiffel Tower.
Table 10.
Rating matrix for analysis variables of photographs of tourist attraction surroundings without their architectural features by the experts (urban planners) participating in the Delphi Technique.
Overall, the physical category (stability conditions of fixed objects) is also rated highest (1458.7) by urban planners, with emphasis on the Eiffel Tower (323.5). On the other hand, the figurative category (ephemerality attributes of moving or changing elements) is again rated lowest (1358.3), despite being emphasized by Buckingham Palace (329.1). Once more, the importance of the representation of objects and their relationship with urban experience is reaffirmed, especially in historical sites [82], as well as the lesser relevance of the presence of people and other mobile components.
4.3. Integrated Analysis of Representative Images: Urban Contexts
The proportions of image components from the urban contexts of tourist attractions taken from Google Street View (2021) at nearby road junctions (Table 11) indicate the marked presence of buildings and enclosures (25.0%), especially in New York (52.8% of the specific photos) and a prevalence of anthropic built components (45.3%). The existence of streets and pavements is also notable (17.5%), especially in Paris (26.0% of the specific photos). These results are to be expected given the progressively anthropic essence of city landscapes [15], but it is worth noting that these items rank second in the official photographs (37.7%) (see Table 10).
Table 11.
Rating matrix of compositional variables in photographs of urban contexts of tourist attractions according to proportionality in the images.
This is followed by natural biological components (26.7%), with the presence of trees (29.7%) being particularly important for Paris, Istanbul, and London (33.8%, 29.7%, and 27.8% of photos, respectively). It should be noted that biotic elements are only rated third for the official images (18.8%) (see Table 10). Urban arborization can mitigate environmental and social problems in cities based on appropriate planting programs, monitoring, management, and studies of long-term eco-evolutionary dynamics [83].
Ranked first for the official images (42.6%) (see Table 10), natural physical components rated third for the urban contexts (21.6%), again with a predominance of the presence of sky (14.9%), particularly for the Colosseum (28.0% of photos), followed by clouds (6.0%). This reiterates the point about the changeability of celestial sphere conditions and effects on perception due to daytime and seasonal changes [80].
It is also unusual to note that the anthropic mobile components, amounting to a low overall proportion of 1.0% in the official images (see Table 10), are rated at 6.4%, with an emphasis on motorized vehicles in New York and people in Rome (9.0% and 6.7% of photographs, respectively). But the restrictions imposed on urban mobility by the COVID-19 pandemic should not be forgotten, which certainly influenced how some of the images were taken.
Among the respondents, the Colosseum demonstrated the highest visitor figures (20.8%) and the Blue Mosque the lowest (2.3%). Approximately 86.7% of respondents from the public have never visited the five architectural icons studied, and 25.0% have never seen them at all (Figure 7), while 61.7% of those who have not visited recognized the sites through the media, which highlights the importance of these resources for the tourism sector [84].
Figure 7.
Proportionality graphs of responses through public consultation regarding the presence of the architectural icons studied in the photographed locations. Source: Based on answers to the specific questionnaire.
The architectural sites generally provide a positive surprise both for those who have traveled to them (74.2%) and for those who have not (63.2%). Approximately 19.9% interpreted them as previously imagined, with this percentage rising to 24.3% for those who have not visited. In this sense, tourists’ imagination is sometimes more important than a true representation of the destination [85].
Respondents from public consultation found that changes in the attractiveness of the locations photographed with and without the architectural icons are most meaningful for the Colosseum (37.6%), which is ranked lowest without the building (656.9) (Table 12), in comparison to Buckingham Palace, which is ranked highest (793.0).
Table 12.
Rating matrix for attractiveness of locations photographed with and without the architectural icons, according to respondents from public consultation.
The Empire State Building (817.1) is ranked lowest in the images with monuments, while the Eiffel Tower is classified as highest (924.8). This disparity reveals the importance of the presence of architectural landmarks in these locations, with values increasing by an average of 23.0%.
The previous results, relating to the analysis of the selected photographs and urban contexts of the tourist icons, allow for integrated reflections. This analysis enables debates of premises and propositions for the guidance of city planners and managers, and especially for all communication professionals.
5. Discussion
With the aim of connecting the central themes of the study, the prior outcomes are employed to formulate proposals for planning, management, and communication processes. The interactions between photography, architecture, and the city are interpreted as a foundation for identifying improvements in the perceptual dimensions of each location and can be replicated in any other site.
5.1. Photographic Representation
In terms of the variables of the photos themselves, the figurative category (ephemerality attributes of moving or changing elements) is the least valued by experts, be they photographers (for the official image and for the same photo without the reference building) or urban planners (for representation of the surroundings). Nevertheless, for the former, geographical (spatial-temporal representation of place and date) and physical (stability conditions of fixed objects) are rated highest for scenes with and without the tourist icon, while the latter is endorsed by the urban planners for the built environment. More attention therefore needs to be paid to the presence of people and other transient components in the representation of the real space (figurative category), which might otherwise affect visitors’ enjoyment of their experiences in the place itself [49,50,80,85].
With the goal of improving the cognition of individuals and collectives through the narratives of images, enhancements can also be made in terms of technical quality (imagery category—composition and photographic production) and symbolic representativeness (thematic category—meaning) [12,14,22,23]. Regardless of when a photograph is taken, the scene will be seen through the eyes of the photographer, who makes certain choices [31]. As the professional generally strives for the best possible technical quality, this can often be beneficial for the city depicted, but it can restrict visitors’ perception of the urban environment.
The findings emphasize that the theory of visual representation must encompass not only static and enduring components of imagery but also transient aspects that shape perceptual engagement. The fact that the figurative dimension is the least valued by specialists exposes a conceptual gap, that is, the inclination to prioritize permanence and technical composition over the inclusion of people and fleeting elements. This observation suggests that image-based communication, particularly within tourism and urban planning, should expand its analytical scope to incorporate temporality and fluidity, acknowledging that collective interpretations of space are conditioned both by material structures and by momentary vitality.
Moreover, the prominence attributed by experts to attributes such as technical refinement and symbolic resonance contributes to advancing the theoretical framework of visual representation by underscoring the need to integrate aesthetics and narrative as inseparable facets of urban interpretation. Photographic records not only document but also construct meanings that may reinforce or distort the identity of a place. In this regard, the results broaden theoretical comprehension by demonstrating that representational discourse functions as an articulate process intertwining technique, symbolism, and social perception, thereby offering valuable insights for public strategies on landscape management and urban communication aligned with lived experiences.
Due to their artistic, documentary, and narrative dimensions [23,28,29,30] and their aesthetic constitution [25], photographic images should broaden knowledge regarding their capacity to elicit human reactions and emotions [26,31]. In this regard, attention must be drawn to problems caused by image distortion through artificial intelligence (AI) [32], including constructed icons.
5.2. Architectural Landmarks
For the Vitruvian variables of architectural photography, the architects find a relative balance between aspects of solidity (structure—firmitas), beauty (form—venustas), and utility (function—utilitas). The use of space can also be valued; however, it is linked to local functionality and spatial performance [33,79] and aligned with responses to sustainable development [34].
As cognitive reference points [35,36], architectural landmarks play a crucial role in generating urban meaning, shaping identity construction, and reinforcing collective memory [37], while also impacting citizen well-being [38]. Advances in AI are expected to enhance generative methods, reducing the risk of visual-semantic hallucination [41].
Substantial changes appear between classifications of compositional variables for official landmarks and urban contexts. The former demonstrates a prevalence of natural physical components, notably sky and clouds, whose changing conditions can affect perception due to daytime and seasonal changes [80]. There is also a predominance of anthropologically built components, characteristic of the structure of the city landscape [15].
Paradoxically, despite high population density and mass use of motorized vehicles in urbanized areas, the proportions of anthropogenic mobile components are not marked. It should be noted that a reduced presence of cars, buses, and motorcycles, for example, as well as people and other means of active transport, is not expected in urban scenes, especially in central regions, such as the cities under study.
The evidence advances theoretical perspectives on perception by illustrating how the studied dimensions—solidity, beauty, and utility—interact with spatial performance and sustainable functionality to shape cognitive interpretation of architectural imagery. Landmarks emerge as pivotal reference points that generate urban meaning, reinforce identity, and sustain collective memory, while simultaneously influencing well-being.
The predominance of natural elements, alongside anthropic structures, demonstrates how environmental cues shape interpretative baselines, with temporal and seasonal variations altering experiential engagement. Conversely, the reduced visibility of mobile components, despite dense populations and vehicular activity, underscores how exceptional circumstances recalibrate perceptual expectations of urban space. These findings contribute to theoretical models by linking compositional variables to cognitive processing, thereby enriching understanding of how environmental stimuli and contextual conditions shape human interpretation of built environments.
One should bear in mind that this can be explained by the exceptional global conditions when some of the images were taken, due to the restrictions imposed by COVID-19, especially those related to social isolation. It is worth noting that these adverse conditions have yet to be overcome by urban planning aimed at the prevention of epidemics in cities, particularly considering the so-called ‘Pandemic Era’ [86]; it is imperative to reflect on novel approaches, especially communication, refuting misinformation, and information pollution [87]. For tourism, the clarity of information is essential to ensuring visitor satisfaction [85].
5.3. Tourist Icons
Another considerable result achieved is that almost a third of the urban planners did not recognize the locations photographed. It is important to recall that the images depict tourist attractions that are highly visited and widely publicized. There is therefore a need for wider dissemination, focused not just on architecture itself but also on information about its urban surroundings, as communication offers relevant perspectives for life in the city [17,88].
The research demonstrates strong relationships between photographic components and the choices made by the photographer (such as angle, framing, and editing) and the level of site attractiveness. This can be seen in the higher proportions of sky in almost all the photos with or without the presence of the monument. Views dominated by natural elements are better processed by the human brain, unlike anthropized scenes, which give rise to hemodynamic responses [27,40]. Once again, visitors may be dissatisfied with the reality of locations when they find conditions to be different due to changing conditions of nature, for example [75].
In terms of visiting the architectural sites, more than four-fifths of respondents from the public state that they have not done so before, but little more than 2% are familiar with the architecture through the media. Ease of access to digital resources, smartphones, and social networks contributes to new ways of interacting with these spaces, which also affects their perception [89].
Most of those who have visited the sites and those who have not are positively surprised, which may be related to the prominence of the architectural monument in the images and the sparseness, or even lack, of photographs on official websites. Effective perception of the city requires those responsible to disseminate photos that portray the urban reality and not just the main building, highlighting the social, political, and cultural complexity of the city, which is, in short, a myriad of places and products of communication [15].
These findings enrich theoretical approaches to tourism communication by demonstrating how photographic composition, dissemination practices, and digital mediation shape destination narratives and visitor expectations. The limited recognition of highly publicized landmarks reveals the need for communicative strategies that extend beyond architectural icons to encompass surrounding environments, thereby fostering more comprehensive urban storytelling. Collectively, these insights advance conceptual models by linking representational choices to experiential authenticity, underscoring the role of accurate, context-sensitive imagery in strengthening touristic discourse and guiding sustainable destination management.
Tourism thought evolves systemic perspectives, addressing social, economic, and environmental dimensions, guiding destination management, and integrating digital innovation with collaborative management [42]. When constructed icons are increasingly integrated into landscapes, they emphasize atmospheres and experiences [44], while digital imagery could possibly reshape destination interpretations, innovative approaches, technological integration, and participatory actions [5,6,7,8,9,16,18], with potential reach of sustainable development goals [21].
Certain tourist icons are popularized, informed, and interpreted by photographic representations that condition spatial perception, which is essential for endorsement of the built space [90]. In other words, the fact that the respondent finds the tourist attraction more or less famous can influence their perception. Open-ended responses to the public questionnaire demonstrated pronounced deviations between their understanding of the sites studied and official dissemination of their respective characteristics, which must be compatible with the conditions of the urban areas in the neighboring region.
5.4. Urbanized Surroundings
A change in focus is needed, therefore, from urban management strategies using solely architectural icons to attract tourists to actions based on publicizing and communicating the whole city. Solutions also need to be found to address the landscape around iconic buildings, as spaces can only be understood fully once experienced physically, since their photographic images enable only partial experiences [91]. Such approaches will provide enjoyable benefits for tourists and residents alike.
In terms of the spatial quality of the urban surroundings of tourist monuments, it is important to note that places need to be designed to represent the city in its own complexity, establishing social interaction as one of the principles of dealing with such places [19]. In present-day urban contexts, evident disparities between visiting attractions and their nearby environments highlight the need for social media data, while AI tools, for instance, contribute, if appropriately adopted, to recognizing perceptions of icons and their settings [51].
The findings advance theoretical debates on urban image and planning by demonstrating that strategies centered exclusively on architectural icons are insufficient for conveying the complexity of cityscapes. The evidence underscores the necessity of communicative perspectives that integrate surrounding environments, thereby fostering more holistic representations of urbanized spaces. By revealing disparities between monuments and adjacent areas, the results enrich conceptual frameworks by linking landscape dissemination to collective perception, supporting more inclusive and sustainable models of communication and design of cities.
Relationships between architectural sites, public spaces and urban contexts can be promoted adequately, while at the same time transmitting the desired image message [88]. In the scientific domain, certain theoretical and methodological issues concerning the topic still lack adequate solutions.
5.5. Findings
The study shows that the predominance of natural elements such as sky and vegetation in photographs tends to have a positive impact on the qualification of the scene, just as images whose composition prioritizes constructed elements tend towards less pleasant sensations. These attributes therefore need to be considered by public administrators and communication professionals, with the aim of representing the local reality, including the vicinity of monuments, associated with continuous improvements in treatment and dissemination of the urban landscape.
Apart from the images of the surroundings of the reference buildings, which differ more greatly from the others, results among the respondents are relatively analogous, demonstrating similarities of perception, regardless of how the photographs are interpreted. The reference buildings also clearly have a positive effect, since every one of the scenes containing monuments is more attractive. Proximities and distances between the attributes analyzed once again highlight the relevance of these topics for decision-making by public managers and media professionals, especially in the face of the international influence and impact of certain city scenes on tourism.
The contributions of the review literature, revisiting concepts and theories, and conforming theoretical–empirical variables, demonstrate the conformity and divergence of the perception of architectural features and urban contexts brought about by photographic communications. Moreover, it is worth emphasizing the relevance of the results achieved, enabling improved understanding of the interactions between photography, architecture, and city, particularly in terms of the imagery communication processes of sociocultural construction in contemporary cities. At the same time, the analysis provides advances for future investigations, in terms of both contributions to the treatment of the publicized landscape and to formulating foundations for planning and management.
In summary, the rationale for selecting the methodological essay is, first, the recognition of an investigative gap stemming from the scarcity of studies—both theoretical and empirical—on the relationships between photographic representation, architectural landmarks, tourist icons, and urbanized environments. Second, the choice reflects the ease of application and, consequently, replication, even by individuals and institutions lacking substantial financial or technological resources. Nevertheless, some constraints deserve mention.
5.6. Research Limitations
A primary issue of the essay concerns the temporal scope of the investigation, which requires updating to encompass the post-pandemic epoch, since the occurrence of COVID-19 may have influenced some diagnosed characteristics due to the state of social isolation imposed at certain times, even with the restriction established for the analytical period. In this regard, the selection of the study areas (cities) must also be refined through the incorporation of diverse data sources and the expansion of selection criteria. These adjustments directly affect the categorization of the study objects (architectures), a process that can be further enhanced by employing more precise qualitative and quantitative information on tourist visitation.
Enhancements in the evaluation of representative images can be approached from multiple perspectives. The first concerns the photographs themselves—both of the architectural landmark, configured as tourist icons, and of the surrounding urbanized environment. Beyond their specific limitations of restrictive framing and spatial stativity, among other constraints, they could be more effectively selected from alternative sources that allow the choice of representations to be better aligned with stricter parameters of technical adequacy.
The application of specific forms of the Delphi Technique to specialists in photography, architecture, and urbanism revealed that perceptions of tourist monuments and their surroundings are influenced by the depicted scenes. However, this methodological choice imposes constraints. The evaluation of photographic variables—imagery (technical quality of composition and production), geographical (spatial-temporal representation of place and date), physical (stability of fixed objects), figurative (ephemerality of moving or changing elements), and thematic (symbolic representativeness of meanings)—is limited by the transient nature of images and the interpretive frameworks adopted.
Generally, the Delphi approach is a structured method for eliciting expert consensus, particularly effective in areas where empirical measurement is limited, as in the case of the present study. Its strengths also include anonymity, which minimizes the influence of dominant voices, and iterative feedback, which allows participants to refine judgments. In visual evaluation, these features provide a systematic framework for translating diverse impressions into coherent criteria, enhancing the reliability of assessments and supporting the development of conceptual models.
However, the technique also presents weaknesses in imagery analysis, such as subjectivity, including potential bias, iteration fatigue, reliance on panel composition, and time constraints. Despite these limitations, it remains a valuable instrument for advancing clarity in communication analysis, since when carefully designed with diverse participation and effective facilitation, it balances interpretive variability with structured consensus, contributing to more inclusive and sustainable procedures for image assessment.
While this technique represents a valuable methodological choice—particularly for gathering expert opinions in an anonymous and iterative manner, allowing flexibility, and enabling remote participation—other alternatives could also have been adopted. Among them are the Analytic Hierarchy Process (AHP), which is effective for comparing pictorial components and establishing a hierarchy of decision criteria; Conjoint Analysis, capable of identifying preferences regarding visuals and estimating the relative contribution of different elements; and Content Analysis, recommended for categorizing themes and interpreting representational materials. In addition, the consistency of the number of experts and their judgments could be statistically verified.
Normally, sampling processes have peculiar restrictions, which also constitute limitations of this research, requiring due attention to minimize their effects in future works. Furthermore, the scope of the sample populations should be broadened. This expansion would not only strengthen statistical reliability but, more importantly, allow for a progressive deepening of findings in subsequent research endeavors. These reflections lead to the final considerations of the research.
6. Conclusions
According to the pre-established criteria, this methodological essay included the determination of cities of interest based on their degree of visitation, selecting world architectural attractions according to the intensity of tourist visits and choosing an image of each site according to its dissemination on official websites, as well as organizing a set of photographs of the urban context taken from street junctions closest to each monument.
Integrated analysis of representative photographs and urban contexts allowed the formulation of proposals for the integration of guidelines for the management of communicative cities, producing relevant answers to the research question concerning the degree of perceptual distortion in photographic representations of architectural landmarks constituted as tourist icons in relation to their corresponding urbanized surroundings.
The exploratory, descriptive, and analytical methods prove the research’s guiding hypothesis that the perception of scenes of constructed touristic attractions is distorted concerning their associated built vicinities, even when images are communicated by means and media other than official websites. They also enabled the achievement of the study’s general objective of systematizing guidelines for the integration of public policies on communication and management.
The benefits of this essay for the integrated management of contemporary cities are thus evident, as it aims at improving feelings about urban settings and their respective dissemination, making technological interferences, voluntary cropping, and peculiar angles unnecessary in photographic communication intended to attract tourists to monument sites. This approach can also prevent potential frustration for visitors when faced with the local reality.
The scientific contributions of this essay become even more relevant considering the lack of studies into the theoretical, conceptual and methodological aspects of the relations between photography, architecture, and city, leading to suggestions for the formulation of public policies for the adequate dissemination of urban landscapes, along with their suitable planning, treatment, management, and communication.
Author Contributions
Conceptualization, A.B.Z.C. and L.P.A.H.; methodology, A.B.Z.C., L.P.A.H. and M.H.; validation, A.B.Z.C. and L.P.A.H.; formal analysis, C.H.; investigation, A.B.Z.C. and L.P.A.H.; resources, L.P.A.H., C.H. and M.H.; data curation, A.B.Z.C.; writing—original draft preparation, A.B.Z.C.; writing—review and editing, L.P.A.H., C.H. and M.H.; visualization, A.B.Z.C. and L.P.A.H.; supervision, L.P.A.H. All authors have read and agreed to the published version of the manuscript.
Funding
This research received no external funding.
Institutional Review Board Statement
Not applicable.
Informed Consent Statement
Not applicable.
Data Availability Statement
Data will be available from the corresponding author on request.
Acknowledgments
The authors thank the Coordenação de Aperfeiçoamento de Pessoal de Nível Superior (CAPES) for the assistance granted through the Programa de Excelência Acadêmica (PROEX), and the Pontifícia Universidade Católica do Paraná (PUCPR) for supporting the development of the research, as well as the anonymous contributions from experts in photography, architecture, and urban planning and those provided by unnamed participants through public consultation.
Conflicts of Interest
The authors declare no conflicts of interest.
References
- Pereira, H.S. Using photography in history of science and technology: A methodological proposal. Fotocinema Rev. Cient. Cine. Fotogr. 2024, 23, 113–138. [Google Scholar] [CrossRef] [Scilit]
- Li, J.; Zhang, Z.; Jing, F.; Gao, J.; Ma, J.; Shao, G.; Noel, S. An evaluation of urban green space in Shanghai, China, using eye tracking. Urban For. Urban Green. 2020, 56, 126903. [Google Scholar] [CrossRef] [Scilit]
- Magalhães, J.; Coelho, A.; Jarreau, P. Editorial: The creation and impact of visual narratives for science and health communication. Front. Commun. 2024, 9, 1393949. [Google Scholar] [CrossRef] [Scilit]
- Castelló, P.P. Why seeing is not believing and why believing is seeing: On the politics of sight. Am. Political Sci. Assoc. 2024, 119, 1–11. [Google Scholar] [CrossRef] [Scilit]
- Li, H.; Zhang, L.; Hsu, C.H.-C. Research on user-generated photos in tourism and hospitality: A systematic review and way forward. Tour. Manag. 2023, 96, 104714. [Google Scholar] [CrossRef] [Scilit]
- Cheng, M. Social media and tourism geographies: Mapping future research agenda. Tour. Geogr. 2025, 27, 579–588. [Google Scholar] [CrossRef] [Scilit]
- Haldrup, M.; Larsen, J. Tourism, Performance and the Everyday: Consuming the Orient; Routledge: Abingdon, UK, 2015. [Google Scholar]
- Wang, D. Examining the effects of potential tourists’ destination familiarity on destination image and travel intention: A mixed approach of PLS-SEM and fsQCA. Sage Open 2025, 15, 21582440251319612. [Google Scholar] [CrossRef] [Scilit]
- Wright, D.; Sharpley, R. The photograph: Tourist responses to a visual interpretation of a disaster. Tour. Recreat. Res. 2017, 43, 161–174. [Google Scholar] [CrossRef] [Scilit]
- Martin, D.; Gutierrez, D.; Masia, B.; DiVerdi, S.; Hertzmann, A. Viewers perceive shape in pictures according to per-fixation perspective. Sci. Rep. 2025, 15, 15414. [Google Scholar] [CrossRef] [Scilit] [PubMed]
- Conzatti, A.B.Z.; Hardt, L.P.A. Turismo, fotografia, arquitetura e cidade: Desvelando relações científicas para o desenvolvimento urbano sustentável. Turydes—Tur. Desarro. Local Sosten. 2022, 15, 51–65. [Google Scholar] [CrossRef] [Scilit]
- Joly, M.; Martin, J. Introduction à l’Analyse d’Image, 4th ed.; Armand Colin [Nathan]: Paris, France, 2021. [Google Scholar]
- Wang, X.; Mou, N.; Zhu, S.; Yang, T.; Zhang, X.; Zhang, Y. How to perceive tourism destination image? A visual content analysis based on inbound tourists’ photos. J. Destin. Mark. Manag. 2024, 33, 100923. [Google Scholar] [CrossRef] [Scilit]
- Rueda Velásquez, C.; Rentería Cano, I.; Martínez Durán, A. Construcciones visuales: Miradas cruzadas de arquitecto y fotógrafo: Luis Barragan versus Armando Salas Portugal, Jose Antonio Coderch versus Francesc Catala-Roca. Revista 180 2019, 44, 52–63. [Google Scholar] [CrossRef] [Scilit]
- Alberti, M. Cities of the Anthropocene: Urban sustainability in an eco-evolutionary perspective. Philos. Transations B Biol. Sci. 2024, 379, 20220264. [Google Scholar] [CrossRef] [Scilit] [PubMed]
- Basyar, M.R.; Mardiyanta, A.; Setijaningrum, E. Multi-stakeholder analysis in building tourism resilience: Collaborative governance implementation in the Majapahit House Heritage Area, Indonesia. Tour. Hosp. 2025, 6, 5. [Google Scholar] [CrossRef] [Scilit]
- Drucker, S.J.; Gumpert, G. Search for the communicative city. In Communicative Cities and Urban Space; McQuire, S., Wei, S., Eds.; Routledge: London, UK, 2021; pp. 11–27. [Google Scholar]
- Jackson, L. Community-Based Tourism: A catalyst for achieving the United Nations Sustainable Development Goals one and eight. Tour. Hosp. 2025, 6, 29. [Google Scholar] [CrossRef] [Scilit]
- Qi, J.; Mazumdar, S.; Vasconcelos, A.C. Understanding the relationship between urban public space and social cohesion: A systematic review. Int. J. Community Well-Being 2024, 2024, 155–212. [Google Scholar] [CrossRef] [Scilit]
- Nizamani, A.G.; Vu, D.T.; Nizamani, R.A.; Torgersen, G. Urban resilience through nature-based solutions in an era of environmental extremes: A global systematic analysis. Sustain. Cities Soc. 2026, 139, 107192. [Google Scholar] [CrossRef] [Scilit]
- UN-DESA—United Nations—Department of Economic and Social Affairs. 17 Goals. 2026. Available online: https://sdgs.un.org/goals (accessed on 19 May 2026).
- Rubio-Fernandez, P.; Berke, M.D.; Jara-Ettinger, J. Tracking minds in communication. Trends Cogn. Sci. 2025, 29, 269–281. [Google Scholar] [CrossRef] [Scilit] [PubMed]
- Smith, P.; Lefley, C. Rethinking Photography: Histories, Theories and Education; Routledge: London, UK, 2015. [Google Scholar]
- Miller, S. Contemporary Photography and Theory: Concepts and Debates; Routledge: London, UK, 2020. [Google Scholar]
- Perevozchikova, A.A. Composition and decomposition: An expressive medium in the art of photography. Manuscript 2025, 18, 97–104. [Google Scholar] [CrossRef] [Scilit]
- Bünzli, F.; Dillard, J.P.; Li, Y.; Eppler, M.J. When visual communication backfires: Reactance to three aspects of imagery. Commun. Res. 2025, 52, 683–713. [Google Scholar] [CrossRef] [Scilit] [PubMed]
- Arioli, M.; Canessa, N.; Gargiulo, A.; Zardin, M.; Falini, A.; Sanna, A. Combined fMRI and eye-tracking evidence on the neural processing of visual ambiguity in photographic aesthetics. Sci. Rep. 2025, 15, 12971. [Google Scholar] [CrossRef] [Scilit] [PubMed]
- Chen, R. Reframing the invention of photography. Photogr. Cult. 2025, 18, 97–111. [Google Scholar] [CrossRef] [Scilit]
- Fraser, K.M. Constructing knowledge between East and West: The photographic books of Ogawa Kazumasa. Photogr. Cult. 2025, 18, 141–166. [Google Scholar] [CrossRef] [Scilit]
- Yamaguchi, A. Postcards and Japonisme: Visual representations and cultural circulation in Edwardian Britain. Photogr. Cult. 2025, 8, 59–76. [Google Scholar] [CrossRef] [Scilit]
- Hamilton, K. Dear Truth: Documentary Strategies in Contemporary Photography; Hasselblad Foundation: Gothenburg, Sweden, 2021. [Google Scholar]
- Gates, K. Infrastructure photography and the AI data center building boom. Photogr. Cult. 2025, 18, 263–279. [Google Scholar] [CrossRef] [Scilit]
- Ciesla, E.-M.; Hauser, S.; Strothmann, H.; Weber, J. Architecture as intervention. Dimens. J. Archit. Knowl. 2024, 4, 9–18. [Google Scholar] [CrossRef] [Scilit]
- Minchenkov, R. Architecture of a sustainable future: Smart building as a synthesis of technology and nature. Archit. Stud. 2026, 12, 42–54. [Google Scholar] [CrossRef] [Scilit]
- Kosenkova, N.; Litvinov, D.; Kosenkova, Y. Revisiting architectural landmarks. E3S Web Conf. 2019, 135, 03040. [Google Scholar] [CrossRef] [Scilit]
- Milyani, H.; Mofarhi, S. Unfolding architectural landmarks: What makes them so distinguished? Int. J. Archit. Urban Stud. 2016, 1, 59–67. [Google Scholar]
- Zamparini, A.; Gualtieri, G.; Lurati, F. Iconic buildings in the making of city identity: The role of aspirational identity artefacts. Urban Stud. 2023, 60, 2474–2495. [Google Scholar] [CrossRef] [Scilit] [PubMed]
- Elhagla, K.; Nassar, D.M.; Ragheb, M.A. Iconic buildings’ contribution toward urbanism. Alex. Eng. J. 2020, 59, 803–813. [Google Scholar] [CrossRef] [Scilit]
- Albukhari, I.N. The role of artificial intelligence (AI) in architectural design: A systematic review of emerging technologies and applications. J. Umm Al-Qura Univ. Eng. Archit. 2025, 16, 1457–1476. [Google Scholar] [CrossRef] [Scilit]
- Rounds, J.D.; Cruz-Garza, J.G.; Kalantari, S. Using posterior EEG theta band to assess the effects of architectural designs on landmark recognition in an urban setting. Front. Hum. Neurosci. 2020, 14, 584385. [Google Scholar] [CrossRef] [Scilit] [PubMed]
- Al-Malla, M.A.; Jafar, A.; Ghneim, N. Image captioning model using attention and object features to mimic human image understanding. J. Big Data 2022, 9, 20. [Google Scholar] [CrossRef] [Scilit]
- Laesser, C.; Reinhold, S.; Beritelli, P. The 2024 consensus on advances in destination management. J. Destin. Mark. Manag. 2025, 38, 101038. [Google Scholar] [CrossRef] [Scilit]
- Velikova, N.; Charters, S.; Cogan-Marie, L. Destination image and the perceptions of regional iconic goods. Curr. Issues Tour. 2023, 27, 2726–2741. [Google Scholar] [CrossRef] [Scilit]
- Blasy, R.; Hrehorowicz-Gaber, H.; Hrehorowicz-Nowak, A.; Hładki, W.; Knapek, J. New architectural forms in the landscape as a response to the demand for beauty in 21st-Century Tourism and leisure. Arts 2026, 15, 18. [Google Scholar] [CrossRef] [Scilit]
- Xu, Y.; Zhang, X.; Zhang, K.; Yu, J.; Liu, J. Spatial pattern and influencing factors of tourist attractions in coastal cities: A case study of Qingdao. ISPRS—Int. J. Geo-Inf. 2024, 13, 444. [Google Scholar] [CrossRef] [Scilit]
- Nolasco-Cirugeda, A.; García-Mayor, C.; Lupu, C.; Bernabeu-Bautista, A. Scoping out urban areas of tourist interest though geolocated social media data: Bucharest as a case study. Inf. Technol. Tour. 2022, 24, 361–387. [Google Scholar] [CrossRef] [Scilit]
- Alsayed, S.S. Urban human needs: Conceptual framework to promoting urban city fulfills human desires. Front. Sustain. Cities 2024, 6, 1395980. [Google Scholar] [CrossRef] [Scilit]
- Keith, M.; Roy, A. Urban sociology: Theoretical foundations and contemporary challenges. In Research Handbook on Urban Sociology; Martínez, M.A., Ed.; Edward Elgar: Cheltenham, UK, 2024; pp. 45–68. [Google Scholar]
- Wan, Y.K.P. Understanding tourists’ perceived urban design qualities. J. Vacat. Mark. 2026, 32, 633–651. [Google Scholar] [CrossRef] [Scilit]
- Vanderheiden, E. Love for nature: Insights from biophilia, topophilia, and environmental identity. In International Handbook of Love; Mayer, C.H., Vanderheiden, E., Eds.; Springer: Cham, Switzerland, 2025. [Google Scholar]
- Vujko, A.; Knežević, M.; Arsić, M. The future is in sustainable urban tourism: Technological innovations, emerging mobility systems and their role in shaping smart cities. Urban Sci. 2025, 9, 169. [Google Scholar] [CrossRef] [Scilit]
- Lohr, S. Sampling: Design and Analysis, 3rd ed.; ImprintChapman and Hall/CRC [Cengage Learning]: New York, NY, USA, 2021. [Google Scholar]
- UN-WTO—United Nations World Tourism Organization. UNWTO Tourism Highlights: 2011–2020; Institutional Editions: Madrid, Spain, 2011. [Google Scholar]
- UN-WTO—United Nations World Tourism Organization. International Tourism to End 2023 Close to 90% of Pre-Pandemic Levels. 2023. Available online: https://www.unwto.org/news/international-tourism-to-end-2023-close-to-90-of-pre-pandemic-levels (accessed on 19 March 2025).
- EI—Euromonitor International. (2010–2019). Top 100 City Destinations. 2010–2019. Available online: https://go.euromonitor.com/white-paper-travel-2019-100-cities.html (accessed on 25 January 2020).
- EI—Euromonitor International. Who We Are. 2023. Available online: https://www.euromonitor.com/who-we-are (accessed on 25 May 2026).
- TripAdvisor. Top 10 Attractions in the World for 2018. 2018. Available online: https://www.tripadvisor.com/blog/best–travel–attractions–most–popular/ (accessed on 25 January 2020).
- TripAdvisor. Top 10 Attractions in the World for 2019. 2019. Available online: https://www.news.com.au/travel/travel–ideas/best–of–travel/tripadvisor–names–top10–attractions–in–the–world–for–2019/news–story/e071a5fcd709c9162312b5d8c46151b6 (accessed on 25 January 2020).
- Uber Newsroom. Looking back at 2018. 10 December 2018. Available online: https://www.uber.com/sa/en/newsroom/2018-year-in-review/ (accessed on 25 January 2020).
- Uber Newsroom. A look back at 2019. 3 December 2019. Available online: https://www.uber.com/gr/en/newsroom/a-look-back-at-2019/ (accessed on 25 January 2020).
- UN-Tourism—United Nations Tourism. World tourism barometer and statistical annex—January 2025. UN-Tour. E-Libr. 2025, 23, 1–40. [Google Scholar] [CrossRef]
- ParisInfo—Office du Tourisme et des Congrès de Paris. La Tour Eiffel. 2020. Available online: https://www.parisinfo.com/search?otcp_search%5Bq%5D=Tour+Eiffel (accessed on 1 March 2021).
- ESB—Empire State Building About. 2021. Available online: https://www.esbnyc.com/about (accessed on 1 March 2021).
- Il–Colosseo. Colosseo. 2021. Available online: https://www.il-colosseo.it/foto-album.php?dir=Il_Colosseo (accessed on 1 March 2021).
- Buckingham Palace. Buck. Palace. 2021. Available online: https://buckinghampalace.co.uk/ (accessed on 1 December 2021).
- Blue Mosque. Sultanahmet Camii. 2021. Available online: http://www.sultanahmetcamii.org/ (accessed on 1 December 2021).
- Ahmad, M.; Wilkins, S. Purposive sampling in qualitative research: A framework for the entire journey. Qual. Quant. 2025, 59, 1461–1479. [Google Scholar] [CrossRef] [Scilit]
- Sablatzky, T. The Delphi Method. Hypothesis Res. J. Health Inf. Prof. 2022, 34, 1–6. [Google Scholar] [CrossRef] [Scilit] [PubMed]
- Manyara, A.M.; Purvis, A.; Ciani, O.; Collins, G.S.; Taylor, R.S. Sample size in multistakeholder Delphi surveys: At what minimum sample size do replicability of results stabilize? J. Clin. Epidemiol. 2024, 174, 111485. [Google Scholar] [CrossRef] [Scilit] [PubMed]
- Vogel, C.; Zwolinsky, S.; Griffiths, C.; Hobbs, M.; Henderson, E.; Wilkins, E.A. Delphi study to build consensus on the definition and use of big data in obesity research. Int. J. Obes. 2019, 43, 2573–2586. [Google Scholar] [CrossRef] [Scilit] [PubMed]
- Kaur, A.; Rodrigues, A.L.; Hoogstraten, S.; Blanco-Mora, D.A.; Miranda, B.; Morgado, P.; Meshi, D. An urban image stimulus set generated from social media. Data 2023, 8, 184. [Google Scholar] [CrossRef] [Scilit]
- Kim, D.; Kang, Y.; Park, Y.; Kim, N.; Lee, J. Understanding tourists’ urban images with geotagged photos using convolutional neural networks. Spat. Inf. Res. 2020, 28, 241–255. [Google Scholar] [CrossRef] [Scilit]
- Rowland, I.D. Vitruvius from manuscript to print. In Brill’s Companion to the Reception of Vitruvius; Rowland, I.D., Bell, S.W., Eds.; Brill: Leiden, The Netherlands; Boston, MA, USA, 2024; pp. 7–33. [Google Scholar]
- Statista. World Population 2024. 2024. Available online: https://www.statista.com/statistics/265759/world-population (accessed on 15 May 2024).
- UN-DESA—United Nations—Department of Economic and Social Affairs. World Population Prospects 2024. 2024. Available online: https://population.un.org/wpp/ (accessed on 19 March 2025).
- Lequeux-Dincă, A.-I.; Gheorghilaş, A.; Tudor, E.-A. Empowering urban tourism resilience through online heritage visibility: Bucharest case study. Urban Sci. 2025, 9, 63. [Google Scholar] [CrossRef] [Scilit]
- Li, Y.W.; Wan, L.C. Inspiring tourists’ imagination: How and when human presence in photographs enhances travel mental simulation and destination attractiveness. Tour. Manag. 2025, 106, 104969. [Google Scholar] [CrossRef] [Scilit]
- Vagtholm, R.; Matteo, A.; Vand, B.; Tupenaite, L. Evolution and current state of building materials, construction methods, and building regulations in the UK: Implications for sustainable building practices. Building 2023, 13, 1480. [Google Scholar] [CrossRef] [Scilit]
- Pont, U.; Swoboda, S.; Jonas, A.; Waldmayer, F.; Schober, P.; Priebernig, H.; Mahdavi, A. Combining scientific approaches in building science and architectural design in academia: A case study. Int. Rev. Appl. Sci. Eng. 2018, 9, 129–135. [Google Scholar] [CrossRef] [Scilit]
- Schüpbach, B.; Junge, X.; Lindemann-Matthies, P.; Walter, T. Seasonality, diversity, and aesthetic valuation of landscape plots: An integrative approach to assess landscape quality on different scales. Land Use Policy 2016, 53, 27–35. [Google Scholar] [CrossRef] [Scilit]
- Le, A.T.D.; Payne, J.; Clarke, C.; Kelly, M.A.; Prudenziati, F.; Armsby, E.; Penacchio, O.; Wilkins, A.J. Discomfort from urban zones: Metabolic consequences. Landsc. Urban Plan. 2017, 160, 61–68. [Google Scholar] [CrossRef] [Scilit]
- Zhang, L.; Xiao, J.; Liu, Q. Comparative analysis of photographic and general tourists’ experiences in heritage sites: A tripartite model study in Pingyao Ancient City. J. Herit. Tour. 2025, 20, 576–602. [Google Scholar] [CrossRef] [Scilit]
- Pataki, D.E.; Alberti, M.; Cadenasso, M.L.; Felson, A.J.; McDonnell, M.J.; Pincetl, S.; Pouyat, R.V.; Setälä, H.; Whitlow, T.H. The benefits and limits of urban tree planting for environmental and human health. Front. Ecol. Evol. 2021, 9, 603757. [Google Scholar] [CrossRef] [Scilit]
- Tankovic, A.C.; Kapeš, J.; Benazić, D. Measuring the importance of communication skills in tourism. Econ. Res.-Ekon. Istraž. 2023, 36, 460–479. [Google Scholar] [CrossRef] [Scilit]
- Jaafar, S.M.R.; Ismail, H.N. Capturing the actual perceived image of international urban tourist during visitation in Kuala Lumpur. Int. J. Built Environ. Sustain. 2015, 2, 324–329. [Google Scholar] [CrossRef] [Scilit]
- Gupta, S.D. Editorial: Public health in post-COVID-19 Pandemic Era. J. Health Manag. 2025, 27, 133. [Google Scholar] [CrossRef] [Scilit]
- Gürgen, H. Forward. In New Communication in the Pos-Pandemic Era: Media, Education, and Information; Suher, H.K., Tetik, T., Denizel, D., Eds.; Peter Lang: Berlin, Germany, 2021; pp. 13–15. [Google Scholar]
- Rossini, F.; Roca, E.; Harris, S. The notion of ground: A definition of urban permeability in Hong Kong and Barcelona. Archit. City Environ. 2018, 13, 211–234. [Google Scholar] [CrossRef] [Scilit]
- Motamed, B.; Farahani, L.M. The evaluative image of the city through the lens of social media: Case study of Melbourne CBD. J. Archit. Urban. 2018, 42, 24–33. [Google Scholar] [CrossRef] [Scilit]
- Otxotorena Elícegui, J.M. Focus, frames, looks. Some complementary appreciations about the relationship between architecture and photography. EGA—Expresión Gráfica Arquit. 2018, 23, 122–133. [Google Scholar] [CrossRef] [Scilit]
- Llinares Millán, M.C.; Iñarra, S.; Guixeres, J. Design attributes influencing the success of urban 3D visualizations: Differences in assessments according to training and intention. J. Urban Technol. 2018, 25, 39–57. [Google Scholar] [CrossRef] [Scilit]
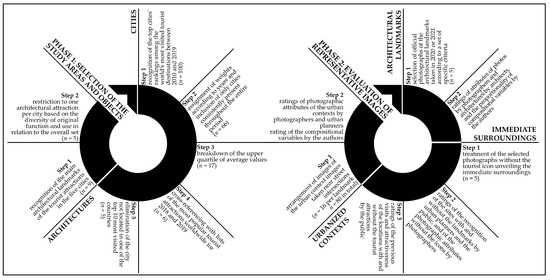
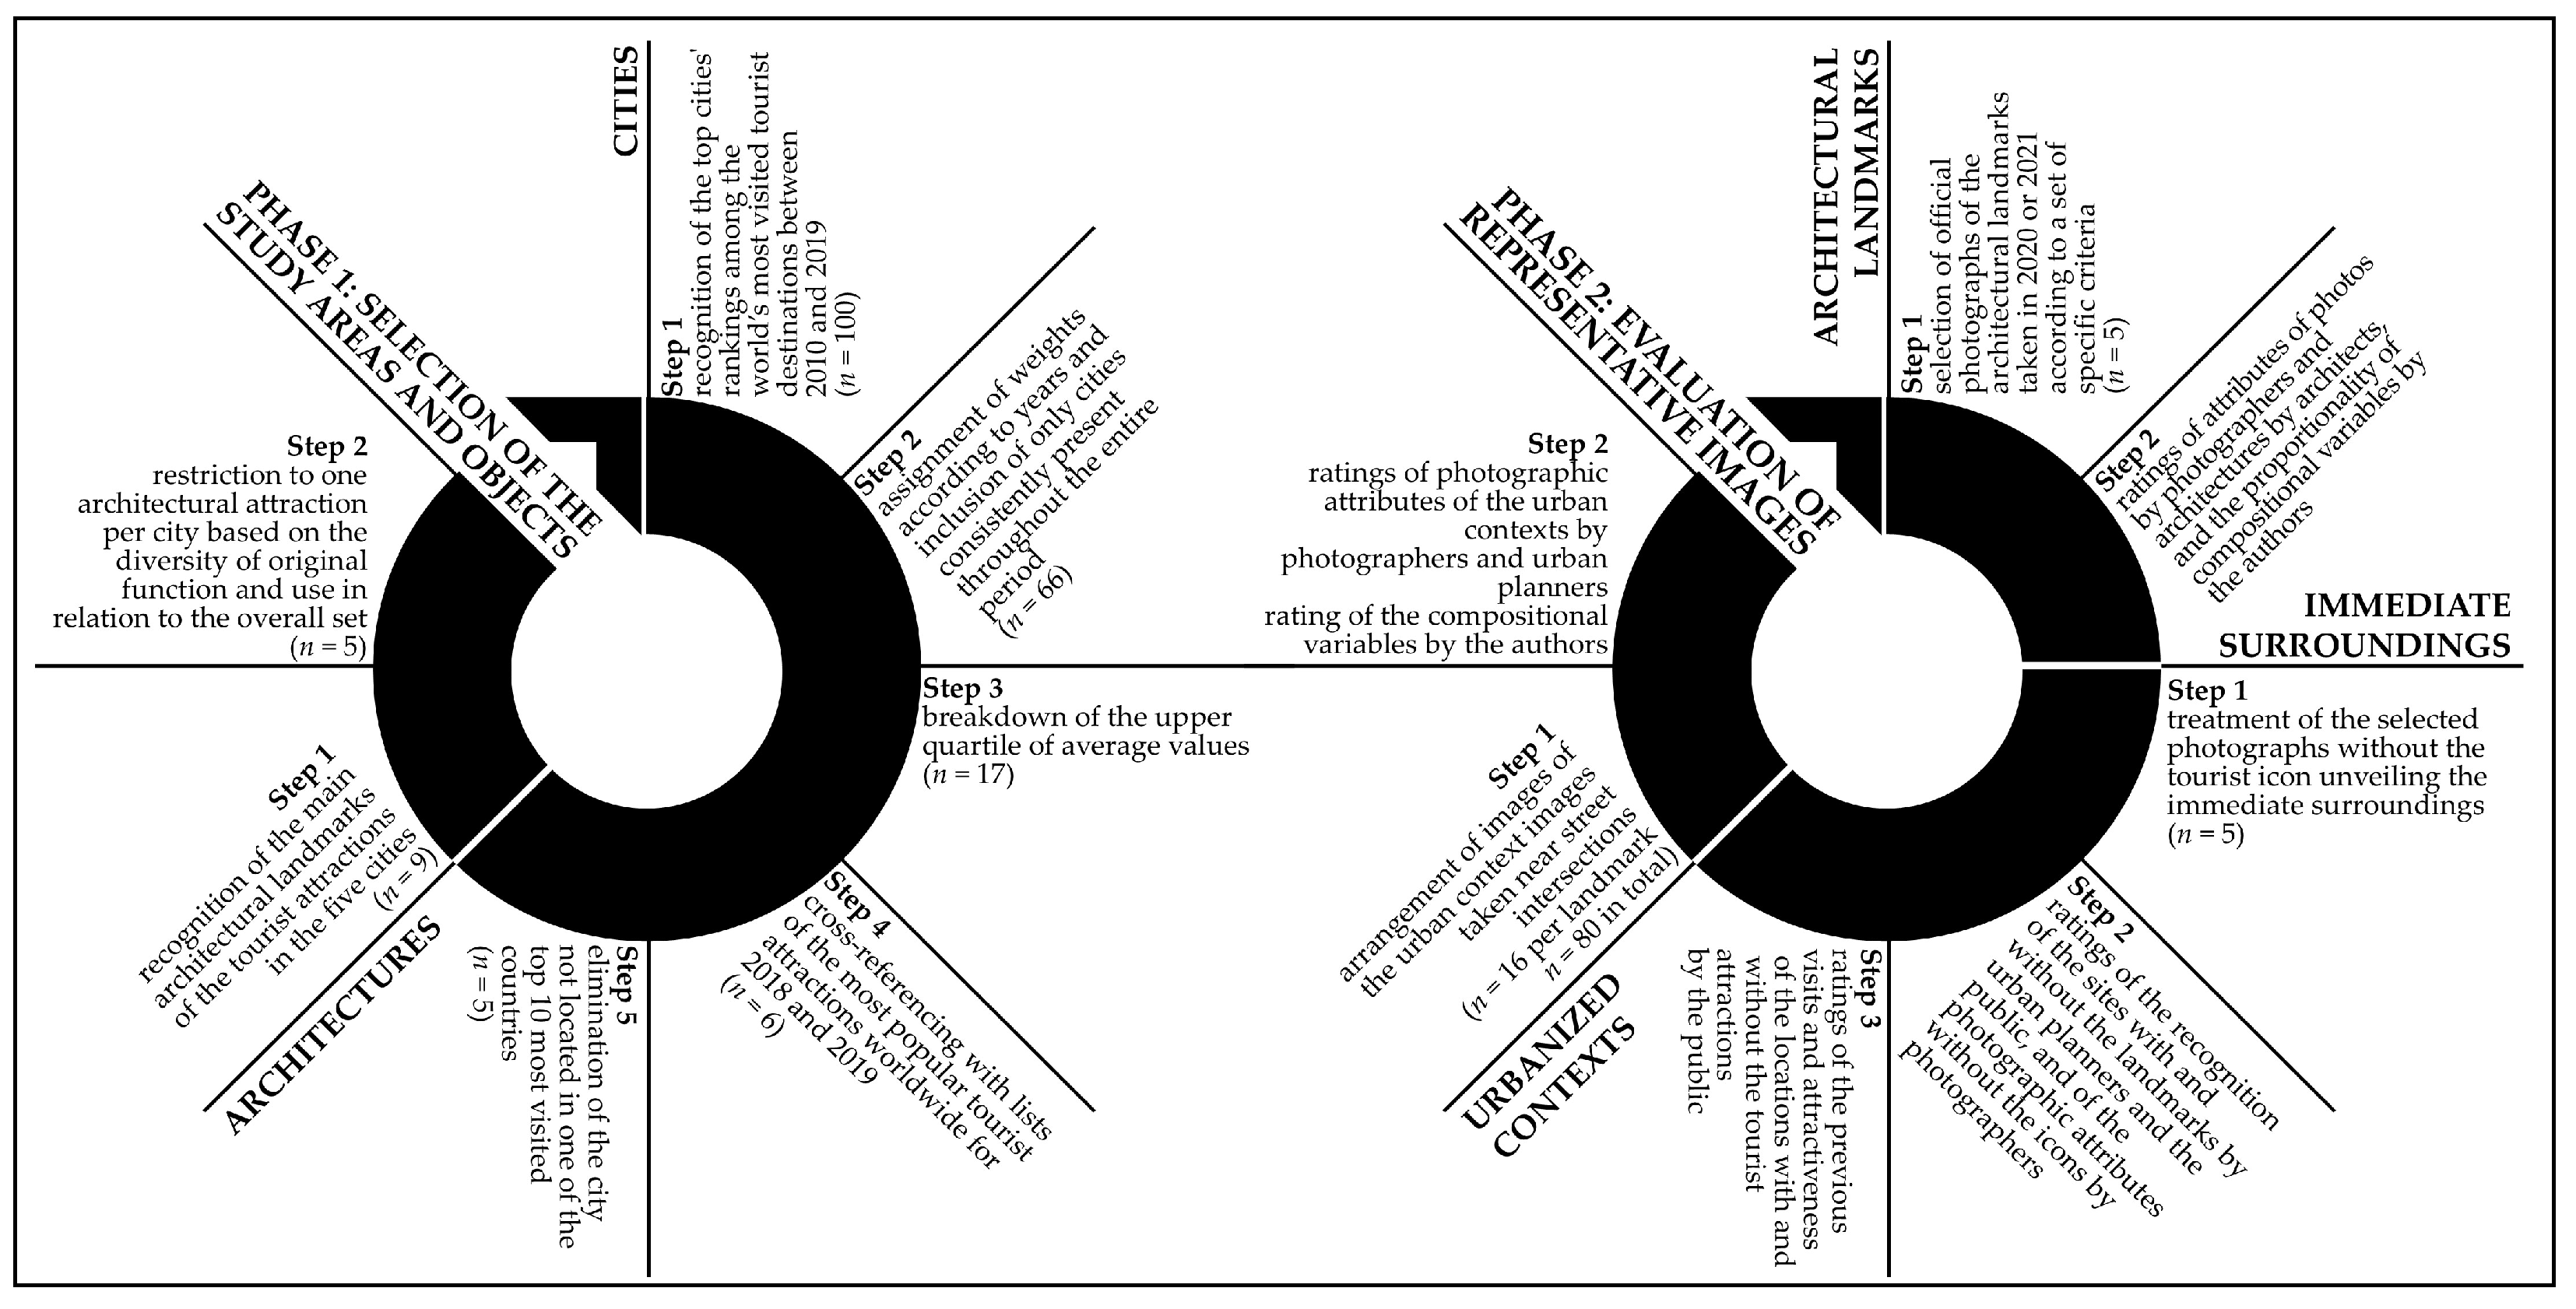
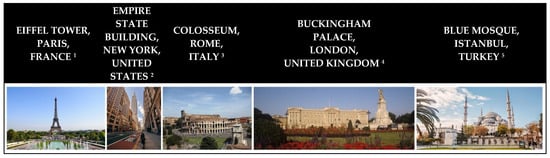
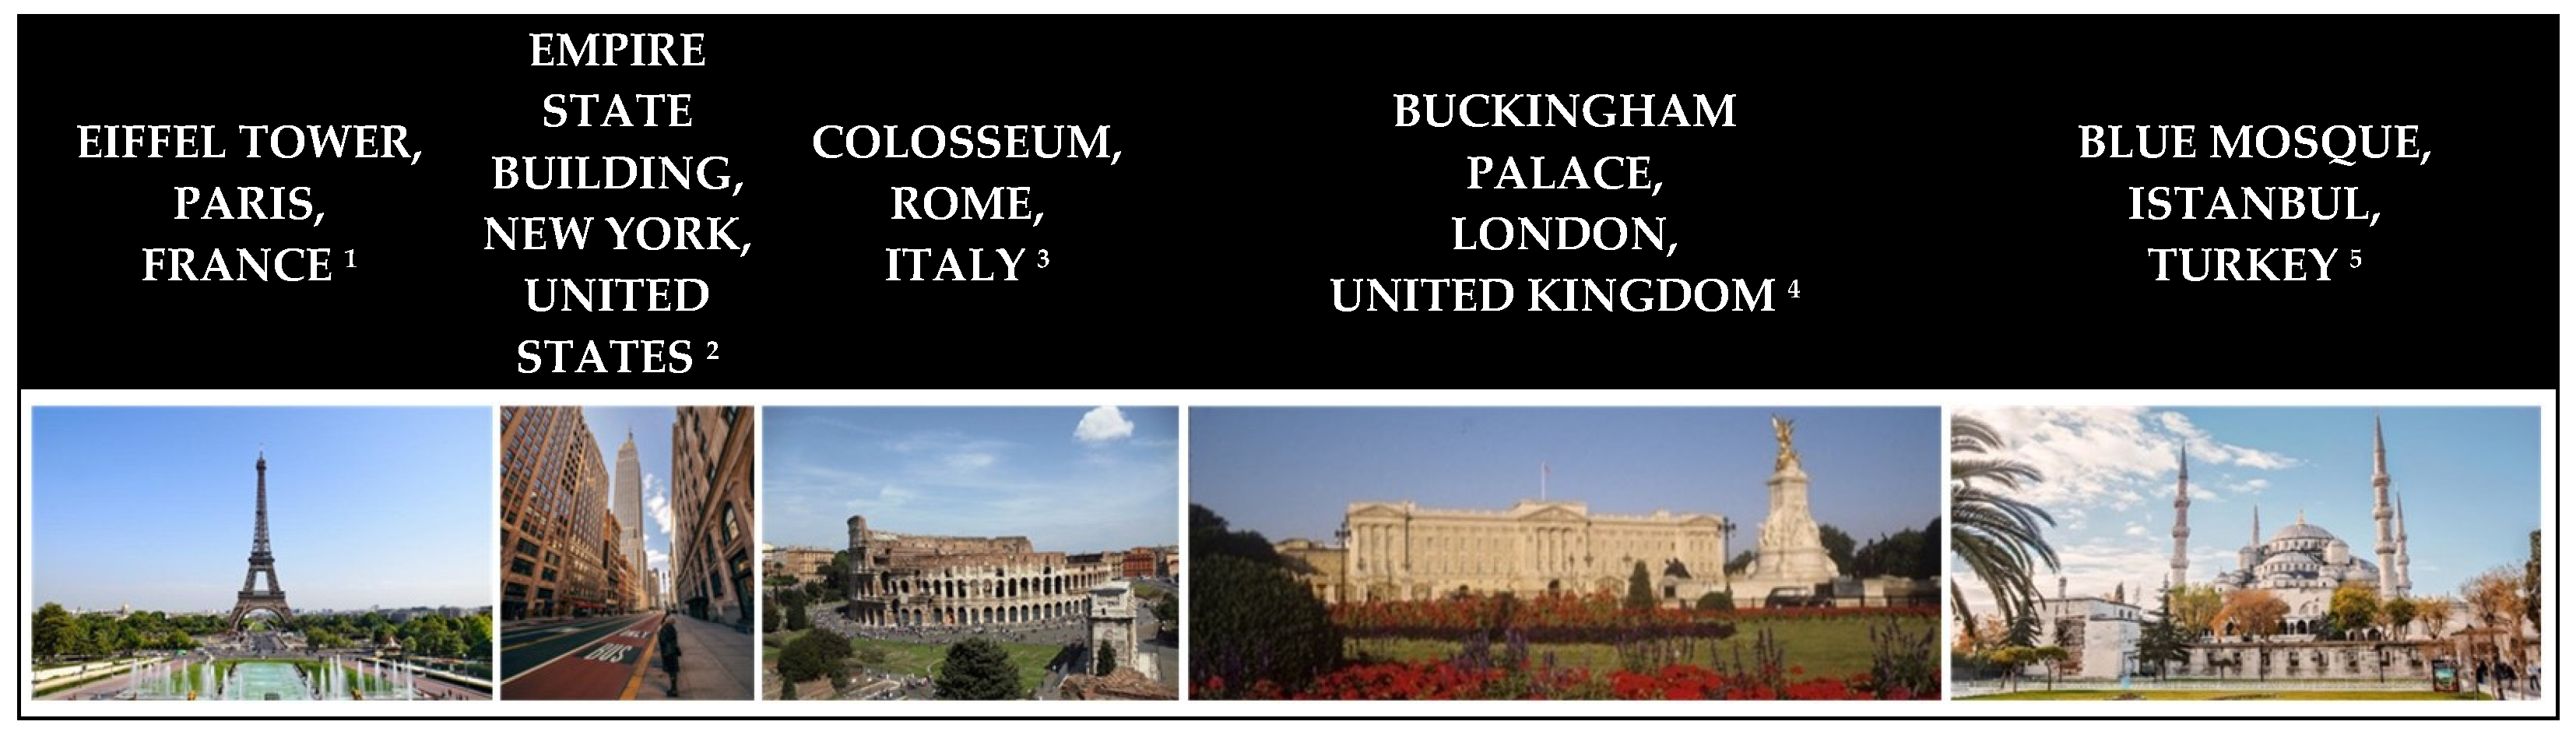
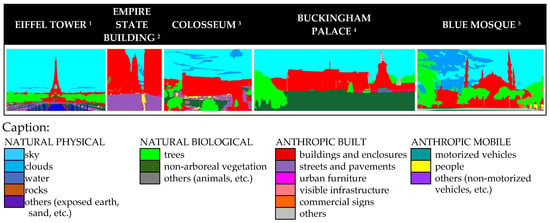
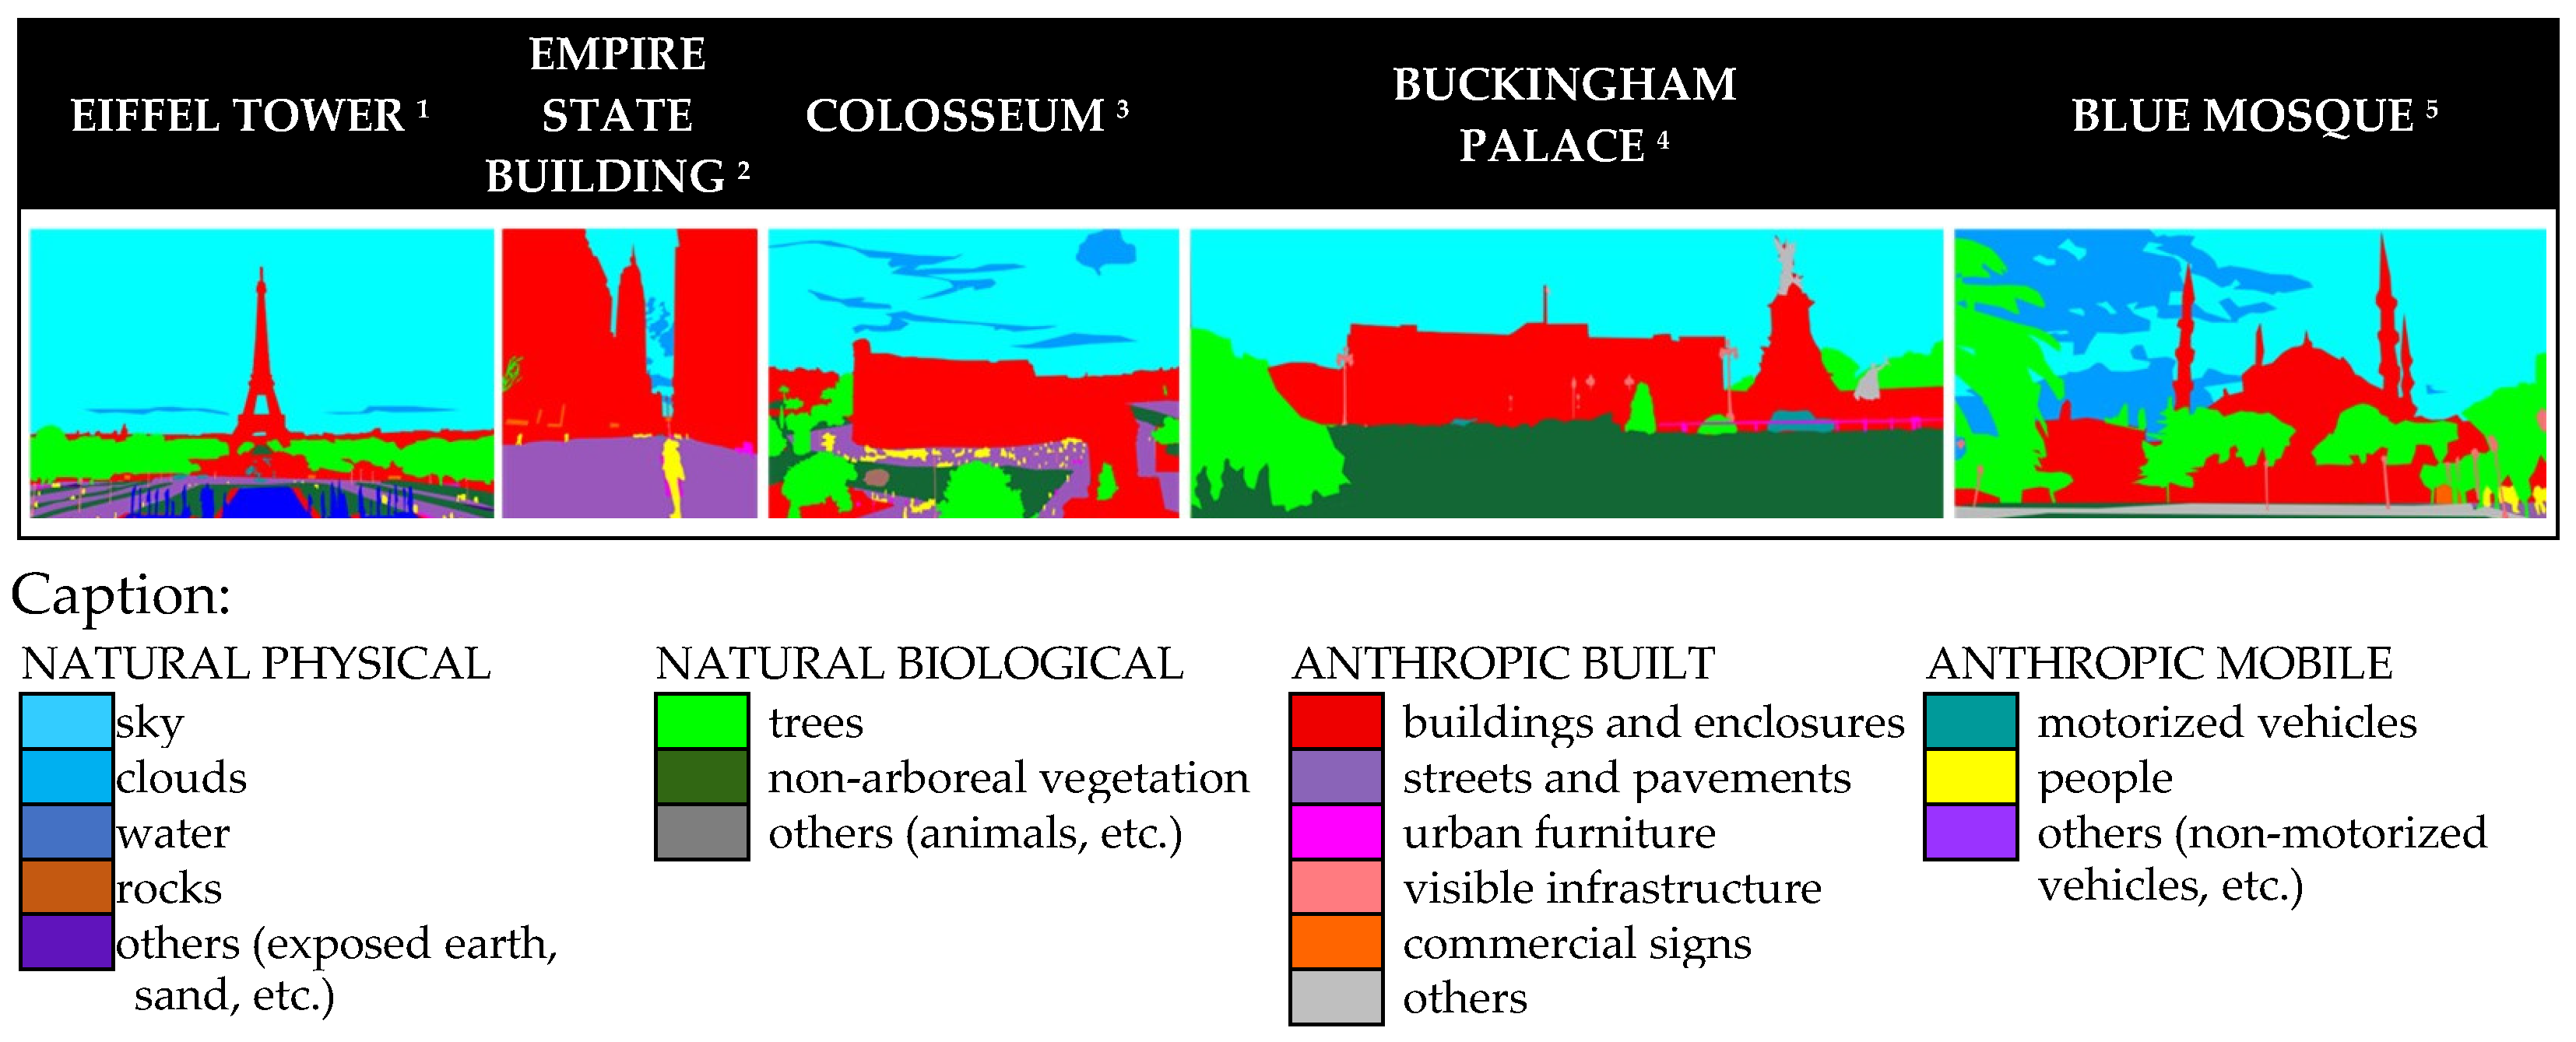
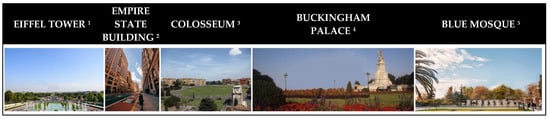
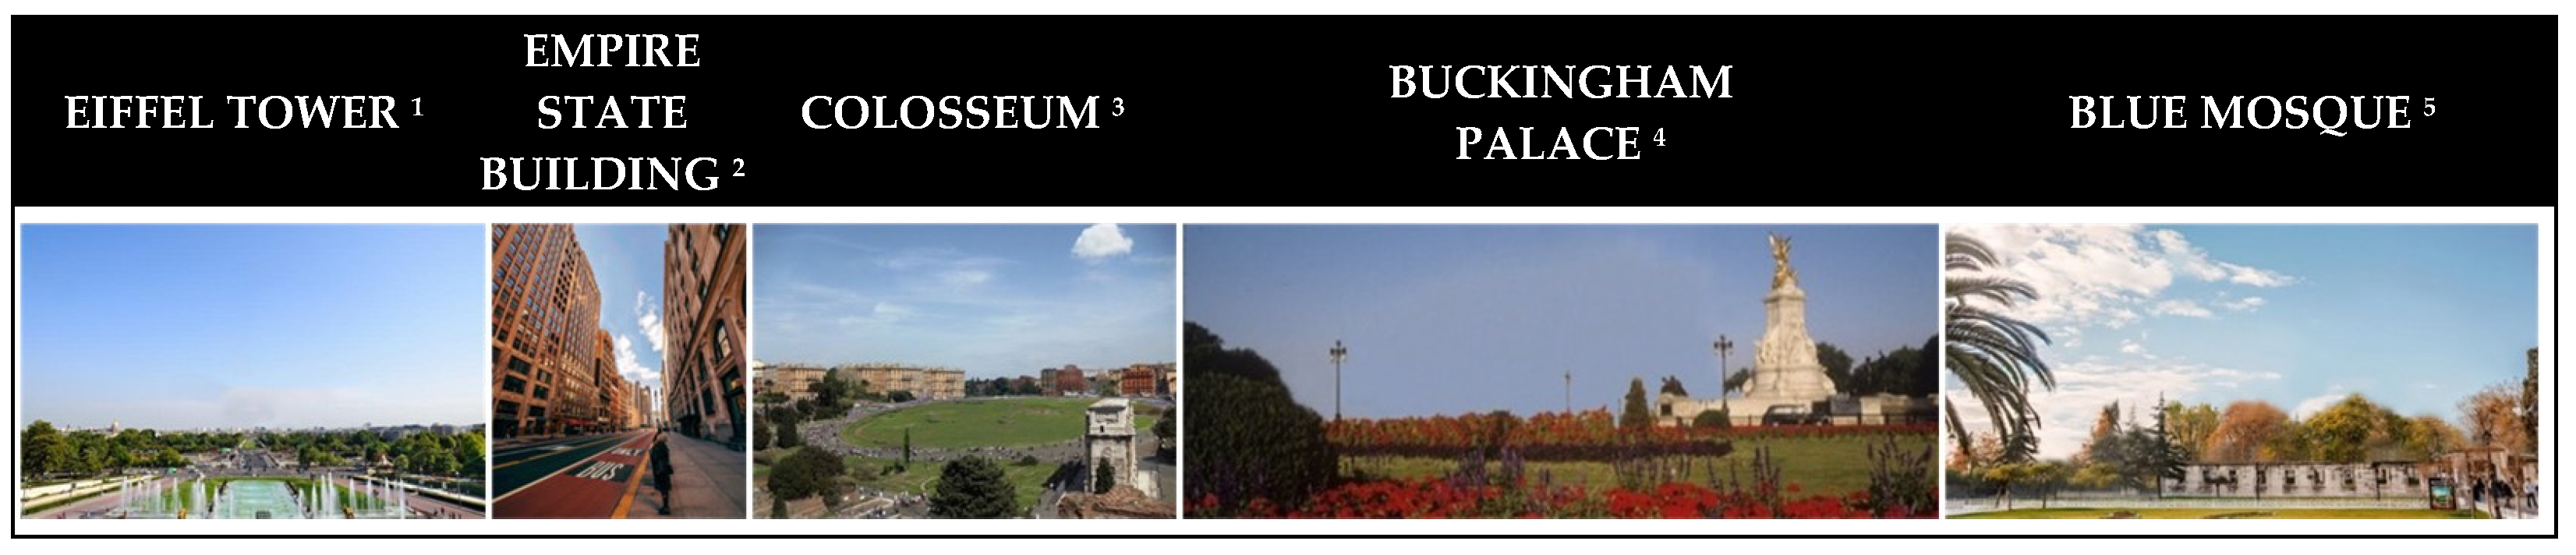
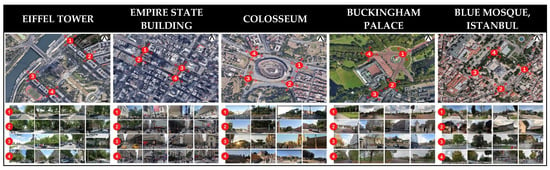
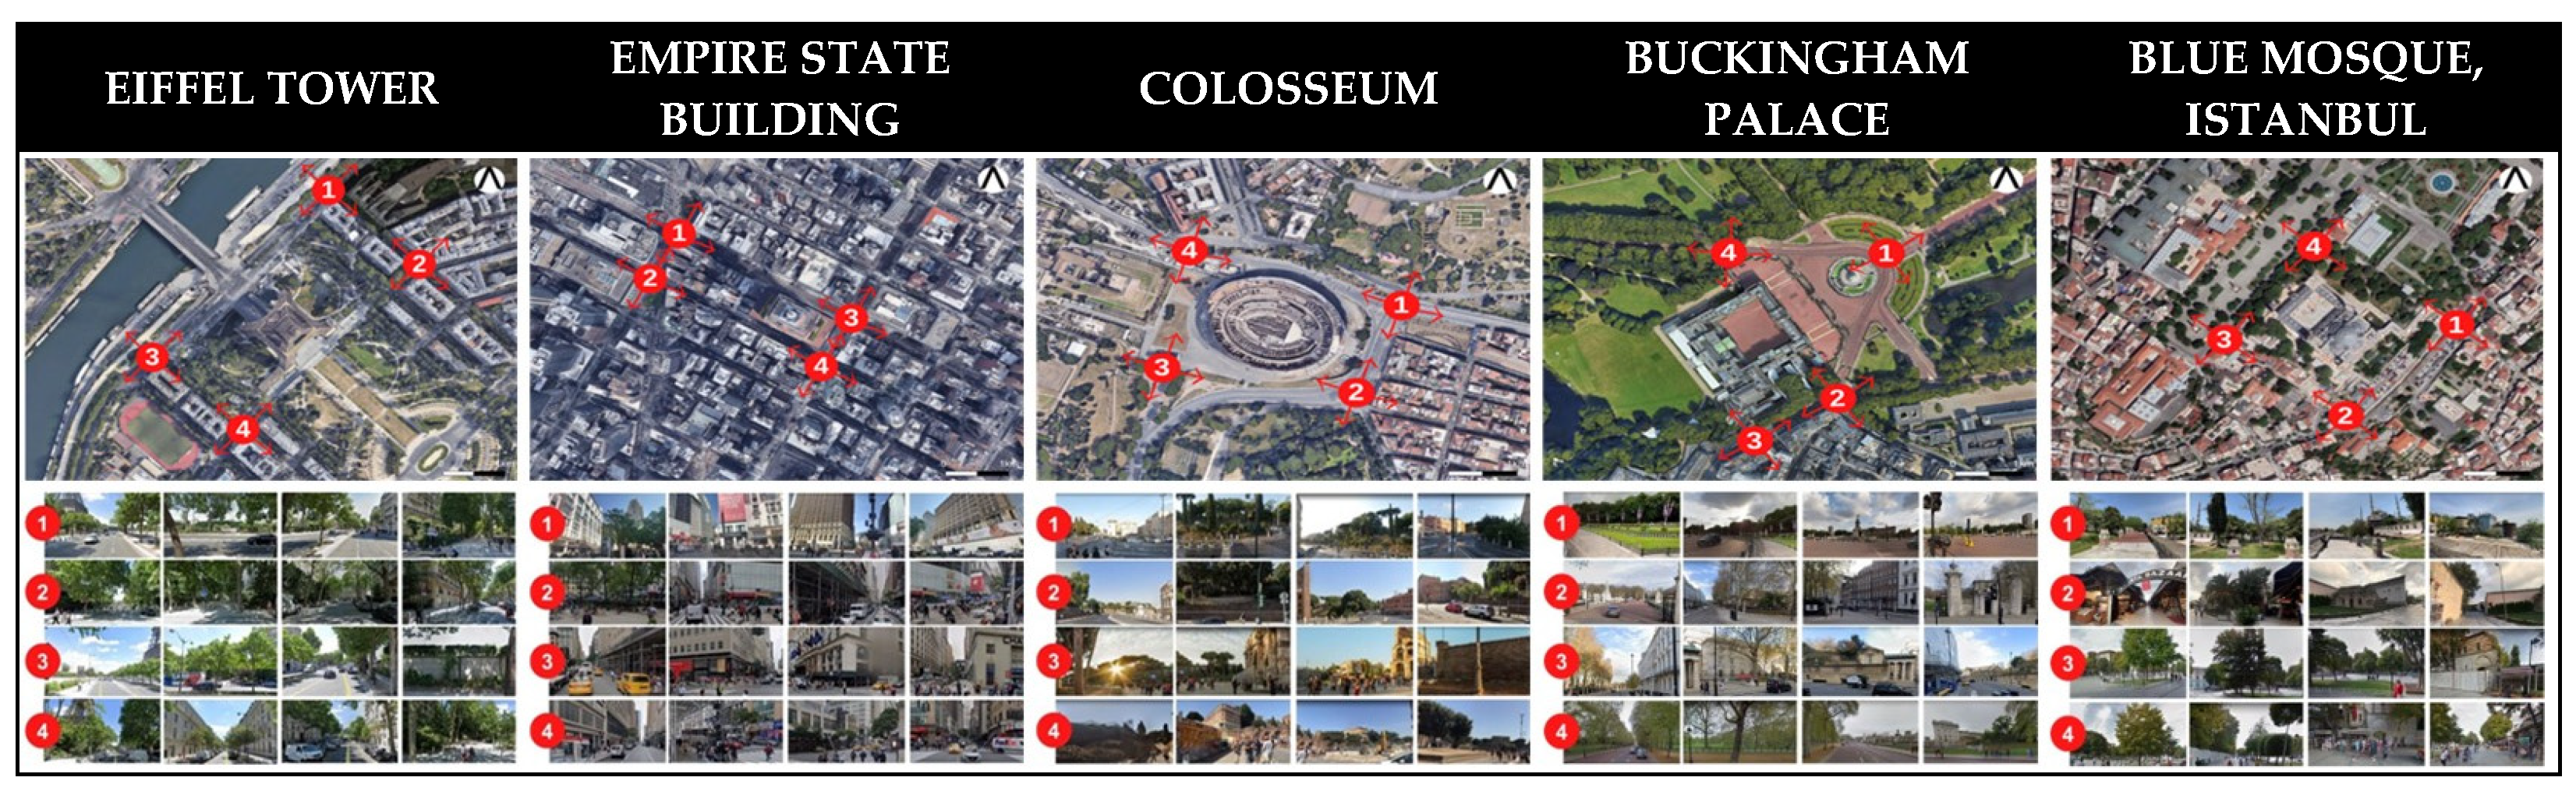
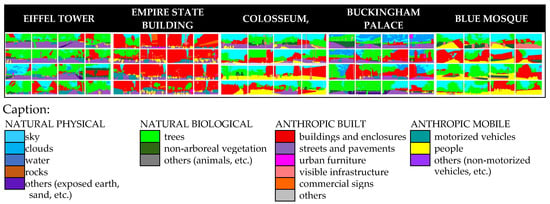
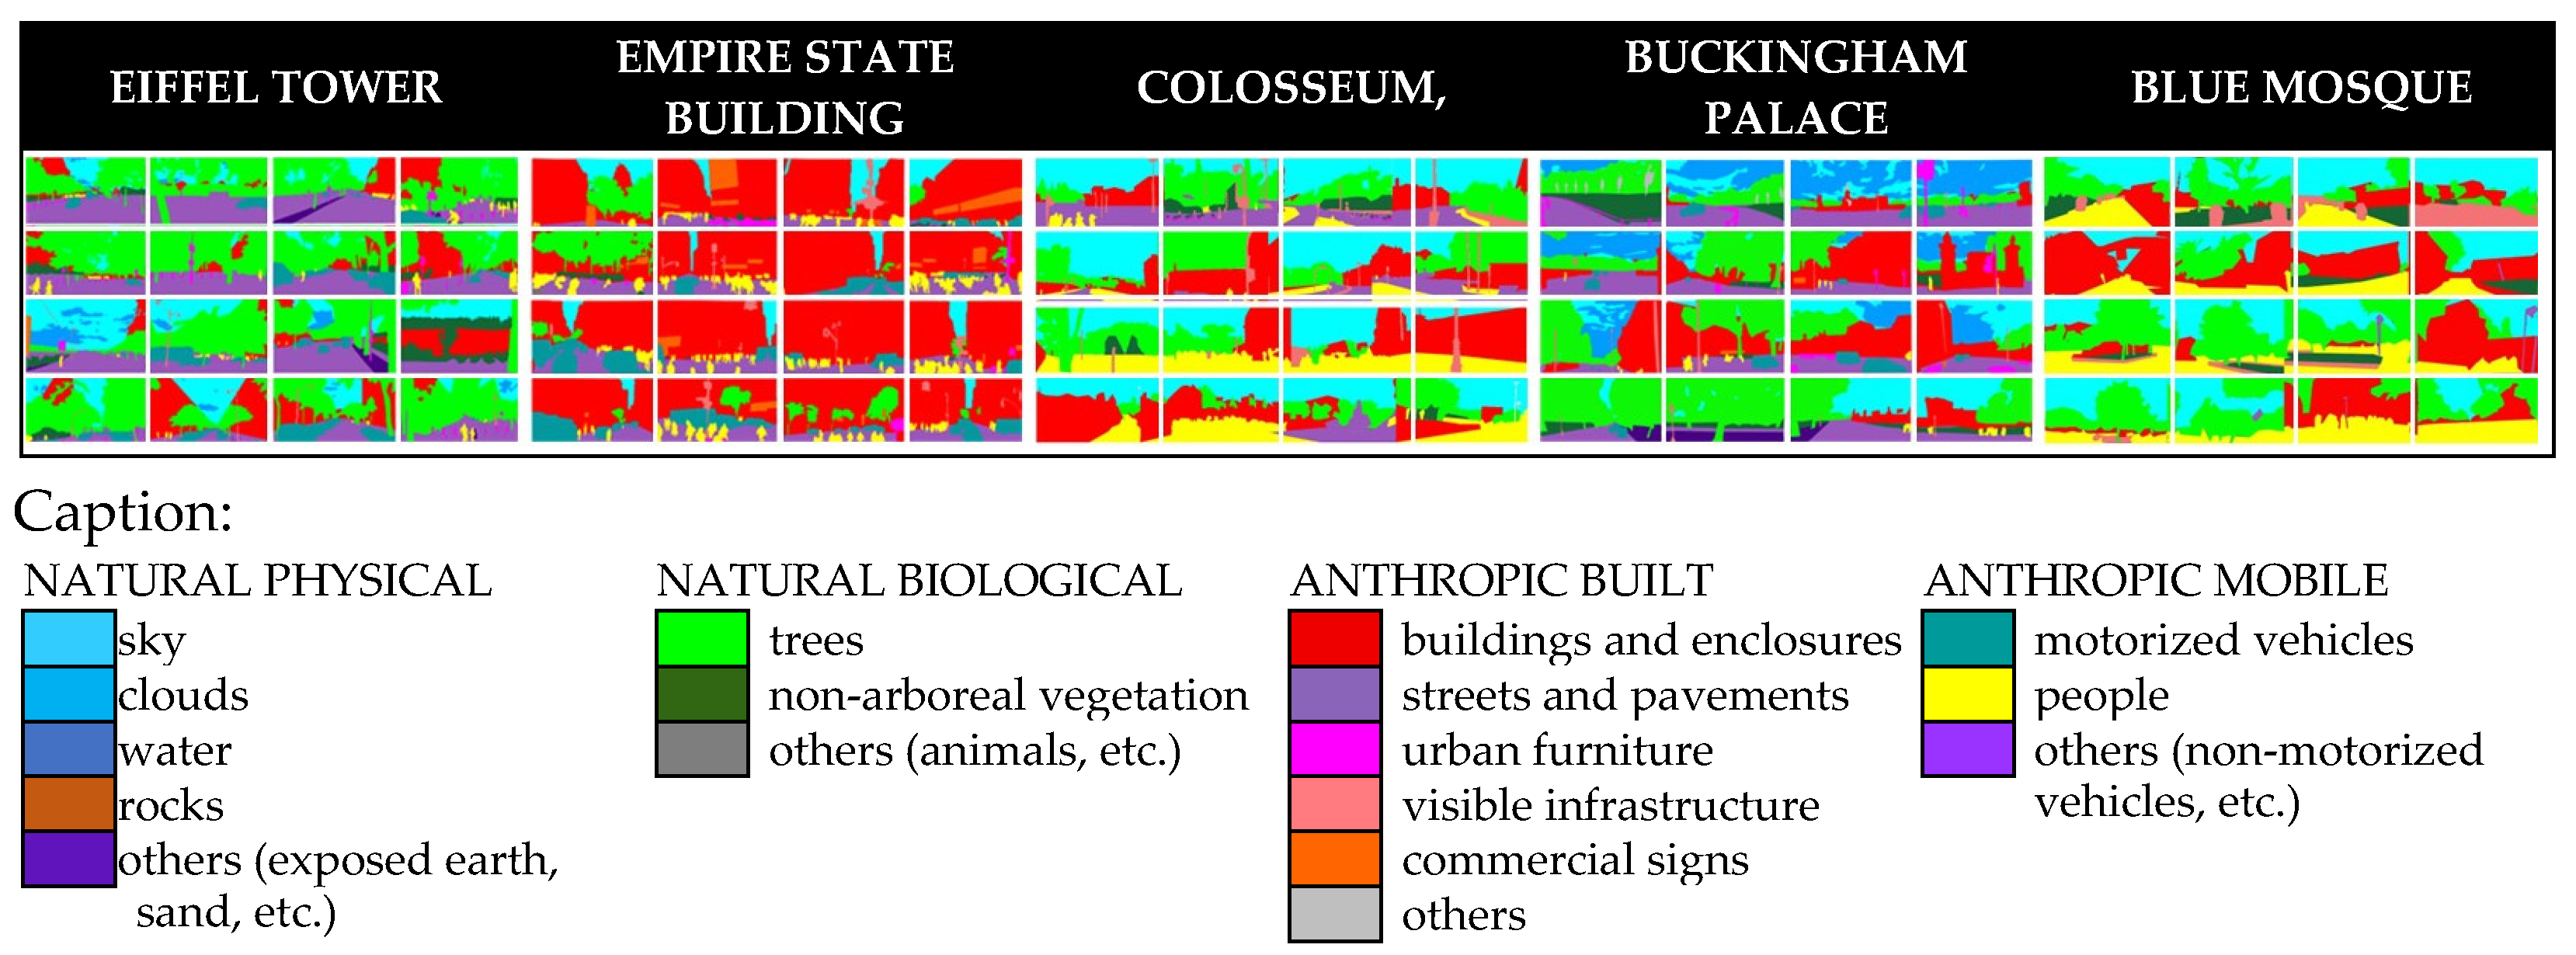
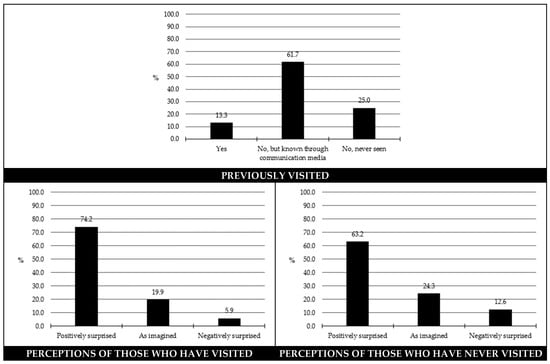

Disclaimer/Publisher’s Note: The statements, opinions and data contained in all publications are solely those of the individual author(s) and contributor(s) and not of MDPI and/or the editor(s). MDPI and/or the editor(s) disclaim responsibility for any injury to people or property resulting from any ideas, methods, instructions or products referred to in the content. |
© 2026 by the authors. Licensee MDPI, Basel, Switzerland. This article is an open access article distributed under the terms and conditions of the Creative Commons Attribution (CC BY) license.