


Abstract
City information modeling (CIM) has developed from the extension of building information modeling (BIM) toward urban-scale information environments that combine geometry, semantics, spatial data, and analytical functions. CIM-related research is increasingly connected with BIM-GIS integration, semantic 3D city models, CityGML/CityJSON, smart-city platforms, and urban digital twins. However, previous reviews have mostly summarized themes, applications, and challenges, while less attention has been given to how CIM-related studies are operationalized through workflows, analytical functions, planning domains, validation evidence, temporal logic, and tooling. This study conducts a PRISMA- and BSMS-aligned systematic review of CIM-related research. Scopus and Web of Science searches retrieved 1541 records, which were deduplicated to 1101 records and screened through title, abstract, and keywords. The screening retained 318 records, of which 306 were accessible in full text. Eight additional eligible studies were added through supplementary snowballing, resulting in a final full-text extractable corpus of 314 studies. The results show that the largest workflow categories are data integration (W3, 95 studies, 30.3%), simulation (W4, 92 studies, 29.3%), and planning/governance support (W6, 84 studies, 26.8%). The largest planning domains are multi-scale/data infrastructure (P8, 91 studies, 29.0%), energy/environment (P5, 81 studies, 25.8%), and urban planning/governance (P7, 66 studies, 21.0%). Most studies were classified as applied (205 studies, 65.3%), followed by prototype (66 studies, 21.0%) and conceptual studies (43 studies, 13.7%). Validation evidence was dominated by empirical case studies (V3, 183 studies, 58.3%), while operational or practice-based validation remained limited (V4, 8 studies, 2.5%). Temporal analysis showed that dynamic and static studies appear in almost equal numbers, but full dynamic data use was reported in only 51 studies (16.2%). The review shows that CIM-related research is moving beyond conceptual framing, but operational maturity remains uneven. The main recurring gaps concern planning application, data quality, interoperability, dynamic data use, validation, and standardization.
1. Introduction
1.1. Background: CIM and Urban Planning
City information modeling (CIM) emerged as an extension of building information modeling (BIM) for integration into urban-scale systems [1]. While BIM manages detailed object-level information within single buildings or multi-building complexes, CIM focuses on the coordination of spatial, semantic, and temporal data across urban environments. Three-dimensional geometry, semantic attributes, and temporal information are integrated in CIM to support digital urbanism, geospatial information science, and infrastructure management. CityGML standards have been regarded as a milestone in enabling representations of three-dimensional urban structures at scale [2,3]. Such developments have expanded the analytical capabilities of 3D models and supported environmental simulation, urban assessment, and performance evaluation [4], contributing to the emergence of CIM as an integrative model for digital urban systems.
One of the main approaches adopted in creating CIMs is the need to integrate multiple data environments. The primary reason for this is the lack of a standardized CIM platform. One of the most prominent of these approaches is the integration of BIM and GIS. The major technical challenge is bridging the gap between building information modeling (BIM) and geographic information system (GIS) data environments; whereby BIM and GIS differ in their geometric representation, coordinate systems, levels of detail, and semantic structures. Deng et al. [5] introduced a BIM-GIS integration framework at multiple levels of detail. Zhu et al. [6] reviewed BIM-GIS integration frameworks and pointed out the integration concerns regarding data size, modeling time, and limitation of integration scope. According to empirical studies, there are technical inconsistencies across platforms between georeferencing strategies and conversion pipelines [7]. Semantic and data-level integration between BIM and GIS has also been examined in previous review studies. These studies included IFC- and CityGML-based interoperability approaches [8]. More broadly, methods to improve geometric and semantic BIM-GIS integration for urban digital twin applications were examined [9]. The concept of CIM extends beyond technical integration, including smart city research that focused on digital infrastructure as mechanisms for managing urban complexity [10], while other studies have highlighted the rise of real-time data governance and algorithmic urban planning [11]. Within this context, CIM increasingly functions as a spatial information infrastructure that supports planning and management processes.
CIM is increasingly discussed in conjunction with urban digital twins. In the literature, a digital twin is usually defined as a virtual version of something real, such as a system, asset, or process. Papers often explain digital twins by focusing on the technologies needed to build them, the areas where they are used, and the difficulties of their implementation. These discussions increasingly include smart-city and urban applications [12,13]. Digital twins are also described as planning and management tools that combine a virtual representation of the city with data integration, visualization, and simulation functions [14]. However, CIM and urban digital twins should not be treated as interchangeable terms. CIM is more directly related to the structured modeling and integration of city-scale information, especially through the combination of GIS, BIM, 3D city models, infrastructure data, and planning-related datasets [15,16,17]. In contrast, urban digital twins usually imply a more dynamic relationship between the physical city and its digital representation. Urban digital twins include data updating, monitoring, simulation, interoperability, and feedback between real urban systems and the digital environment [13,18,19].
The distinction between CIM studies and digital twin studies is crucial. Deprêtre et al. [20] directly compares digital twins and CIM and notes that the two labels can refer to similar city-modeling practices, although digital twins usually carry stronger expectations of dynamic connection with the physical environment. Jeddoub et al. [18] also show that city digital twins remain conceptually uneven, with a gap between theoretical definitions and current implementations. Maturity assessments indicate that most urban digital twin studies are still in their early and mid-stages, focusing primarily on 3D modeling, monitoring, and visualization rather than advanced interaction and system capabilities [21]. This makes interoperability critical, as deploying an urban digital twin requires different platforms and datasets to reliably exchange information. Lei et al. [19] highlight interoperability issues as a major barrier to wider implementation. At the same time, research on semantic digital twin emphasizes the need for stronger semantic structuring in digital twin implementation and the need for more scalable semantic approaches capable of integrating dynamic data [22]. In this context, CIM can be considered a structured information environment for the city that supports the integration of urban data for planning purposes, while digital twins can be seen as a more operational and dynamic extension when CIM-based data structures are connected to monitoring, simulation, and feedback processes [18,19,20]. This relationship is also demonstrated in a case study linking CIM and digital twin approaches in the context of urban planning [23].
1.2. CIM Operational Challenge
BIM operates within a standardized professional workflow at the building scale that emphasizes modeling and analysis in a singular homogeneous data ecosystem. By contrast, CIM lacks this aspect, as it currently depends mainly on integrating data from different sources and system logics. Effective implementation requires the integration of BIM models, geographic information system (GIS) databases, remote sensing datasets, domain-specific simulation engines, and other urban datasets. This complexity introduces variations in workflow configuration, analytical embedding, and validation practices. CIM research contributions differ in focus, scope, and design. Some papers focus on integrating and connecting various datasets or systems. Other papers focus on visualization and representation of urban environment. While some focus on proposing conceptual frameworks without validating or supporting them through actual implementation. The literature includes both conceptual CIM framing and case-based operational applications, which makes the operational status of some contributions difficult to compare consistently [24,25]. Thus, there is a need for a structured framework that differentiates CIM studies, so that theoretical ideas are not confused with tested and operational systems.
1.3. Structural Fragmentation in CIM
CIM is not used in the same way in all research studies, which makes comparing and drawing conclusions from different studies a challenge. Some papers refer mainly to a city-scale information model, BIM-GIS integration, a data-management framework, a planning-support tool, or a basis for an urban digital twin. The same problem appears in workflow reporting. Some papers explain their data sources, integration steps, software, outputs, and validation clearly. Other papers use terms such as integration, simulation, visualization, or governance support without showing how the workflow was built or tested. This makes it difficult to compare conceptual frameworks, prototypes, and applied systems using only thematic categories, which limits methodological transparency, reduces reproducibility, and makes systematic comparison challenging [6,7]. The transition from prototypes to city-scale implementation remains a challenge. Urban digital twin research frequently highlights differences across standards and interoperability barriers as major obstacles to upscaling [19]. Earlier review work also suggests that CIM applications have been discussed unevenly across planning, management, mobility, infrastructure, and environmental domains [15,16]. For this reason, the present review treats CIM-related studies through operational categories. The analysis separates contribution maturity, workflow configuration, analytical function, planning domain, spatial scale, and validation evidence. This makes it possible to compare studies by what they actually do, not only by the terminology they use.
1.4. Research Gap
Previous systematic and bibliometric reviews have already helped define the development of CIM and related urban digital technologies. Souza and Bueno [15] examined CIM as a decision-support tool for planning and city management, with attention to CIM concepts, computational tools, interoperability, potential applications, and case studies. Omrany et al. [16] reviewed CIM implementations through PRISMA and identified major application domains and challenges, including data quality, BIM-GIS interoperability, standardized workflows, cybersecurity, and data management. Okonta et al. [26] combined bibliometric analysis and systematic review to examine CIM publication trends, citation patterns, research hotspots, research gaps, and future directions. Yu et al. [17] approached CIM from a data perspective, focusing on data acquisition, integration, processing, analysis, visualization, and decision support. In parallel, broader reviews of smart cities, digital twins, 3D city models, and decision-support systems show how related urban digital technologies have developed around data integration, visualization, and planning applications [27,28].
These reviews are important for showing the growth, themes, applications, and challenges of CIM and related fields. However, they do not fully examine CIM studies through a unified operational framework that connects how each study is built, which workflow it follows, what analytical function it performs, which planning domain and spatial scale it addresses, and whether the contribution is validated. The added value of this study is therefore not limited to thematic classification of CIM literature but a structured assessment of how CIM is operationalized as a planning-support approach.
1.5. Aim, Research Questions, and Contributions
This study systematically analyzes the operational structure, analytical function, planning relevance, and validation maturity of CIM-related research using a PRISMA- and BSMS-aligned review approach.
The study addresses the following research questions:
- RQ1: How are CIM-related contributions structured in terms of maturity (conceptual, prototype, applied)?
- RQ2: Which workflow patterns characterize CIM-related studies?
- RQ3: What analytical functions and decision-support capacities are reported?
- RQ4: In which planning domains, planning process types, and spatial scales is CIM operationalized?
- RQ5: To what extent are CIM-related workflows validated, and what levels of evidence are reported?
- RQ6: What recurring operational gaps emerge across the literature?
By addressing these questions, the study makes four main contributions: development of a rules-based operational extraction framework, construction of a workflow-based typology, systematic validation and maturity assessment, and synthesis of recurring operational gaps in CIM-related research.
2. Materials and Methods
2.1. Methodological Framework
The literature on CIM is characterized by methodological diversity. Some research presents conceptual frameworks, others prototypes, and still others describe practical applications, often varying in the types of evidence and depth of reporting. This necessitates a structured review framework capable of moving beyond descriptive bibliometrics toward operational synthesis. Methodological review approaches have already been adapted in the field of urban planning studies for multidisciplinary and applied topics, where the evidence cannot be reduced to a single, uniform conclusion [29]. To ensure transparency in how records are identified and examined, the review process follows the PRISMA 2020 statement, which provides internationally recognized reporting standards for evidence identification and screening [30].
2.1.1. Operationalizing the BSMS Logic for CIM
The bibliometric analysis, systematic review, meta-analysis, and storytelling (BSMS) approach was used as a staged framework in this study. It guided the review through gradual narrowing of the study set while keeping qualitative interpretation central to the review process. Rather than treating the studies only as numerical records or broad statistical groups, BSMS allows closer examination of their meaning, structure, differences, and patterns [31]. In this study, the framework was applied through five main phases: (1) framing and scope definition, (2) logical query formation, (3) inclusion–exclusion screening, (4) full-text operational extraction, and (5) structured synthesis. As the corpus becomes smaller, the analysis places greater emphasis on qualitative interpretation of the remaining studies. This is especially useful for CIM research, where studies do not usually report one shared intervention or one standard outcome but instead describe different types of operational modeling systems. For this reason, BSMS logic helps separate conceptual studies, prototype systems, and applied implementations in a systematic way.
2.1.2. Evidence Logic and Analytical Positioning
Each included study was treated as a complete CIM contribution rather than a collection of separate variables. Each paper was examined as a complete study that combined workflow logic, analytical function, planning application, and validation. This made it possible to examine how CIM systems were organized, how they were applied, and whether their workflows were supported by testing or use in practice. The analysis focused on how the reviewed CIM systems were structured and used, not only on publication-level description.
2.2. Research Design and Review Strategy
This research followed a staged review process based on database searching, rule-based screening, full-text retrieval, supplementary snowballing, full-text extraction, and structured synthesis. The analysis focused on workflow classification, analytical function, planning domain, and validation or implementation maturity. The review process consisted of five main stages. In the first stage, CIM was defined as an urban-scale digital modeling paradigm that integrates geometry, semantic information, and analytical function, not just 3D visualization. In the second stage, search queries for CIM-related papers in Scopus and Web of Science were formulated and applied. In the third stage, title, abstract, and keyword screening was conducted independently by two reviewers using predefined inclusion and exclusion rules. In the fourth stage, full-text retrieval, eligibility assessment, supplementary backward and forward snowballing, and structured full-text extraction were carried out. Finally, the fifth stage synthesized findings through frequency distribution, cross-tabulation, and identification of maturity patterns. The review was not registered, and a separate review protocol was not prepared or published. Therefore, no protocol amendments are applicable.
2.3. Data Sources and Search Queries
Scopus and Web of Science were used in this study for their broad coverage of peer-reviewed journals and conference literature, and the records were exported in May 2026. To avoid terminological mistakes, a unified structured search query containing wildcard operators (*) was formulated to capture variations of CIM and related urban-scale information modeling terms, including city information modeling, urban information modeling, urban BIM, BIM-GIS, GeoBIM, 3D city models, semantic 3D city models, urban digital twins, city digital twins, and smart city models. These terms were combined with planning, management, governance, decision-support, and urban-development terms.
In Scopus, the query was applied to title, abstract, and keyword fields. In Web of Science, the query was applied using the topic field. In both databases, the search was limited to English-language records and to articles, proceeding papers, and book chapters. Articles, proceeding papers, and book chapters were retained because CIM-related methods are often reported in both journal and technical conference venues. No temporal restriction was imposed during the search phase. All retrieved records were exported in full bibliographic format, including DOI, title, authorship, abstract, author keywords, index keywords, source title, document type, and publication metadata. The full search strategy is provided in Supplementary Material S1, and a summary of the database search strategy is presented in Appendix A Table A1.
2.4. Deduplication and Master Dataset Construction
After exporting the Scopus and Web of Science datasets, the records were merged into a single working file, and the deduplication process was conducted before screening. To identify duplicate records across databases systematically, a deduplication key (Dedup_Key) was created in Excel for every record using DOI as the primary identifier, while normalized title was used as a fallback when DOI was missing. This ensured that records without DOIs were not automatically discarded and remained eligible for screening.
Records sharing an identical Dedup_Key were flagged as duplicates. Duplicate records were then checked manually where metadata were incomplete or inconsistent across databases. For duplicate groups, the record with more complete bibliographic information was retained as the master record. When metadata completeness was similar, the Scopus record was retained for consistency. The duplicate record was retained in the working file for audit purposes but excluded from analytical counting.
The final deduplicated dataset was used as the input for title/abstract/keyword screening. Each deduplication decision was retained in the working file to support transparency and reproducibility.
2.5. Screening Procedure and Eligibility Criteria
A screening process was adopted to identify and assess peer-reviewed literature related to CIM and CIM-related urban-scale information modeling. A rigorous framework for inspection was necessary in order to ensure consistency, transparency, and methodological accuracy. The screening was limited to title, abstract, author keywords, index keywords, document type, and bibliographic metadata. No full texts, figures, citations, or external data were considered at this stage. Screening was conducted independently by two reviewers using predefined screening criteria.
First, each record was checked by reading the title, abstract, keywords, and document type. Papers were assessed according to whether they showed a city-scale or urban-scale information-modeling component; an identifiable method or workflow; planning, management, simulation, governance, or decision-support relevance; and likely codeability under the later full-text extraction framework. This codeability test considered whether the record was likely to be classifiable by workflow type, analytical function, planning domain, spatial scale, and implementation maturity. Records that were only broadly related to smart cities, digital twins, BIM-GIS, 3D city models, GIS, AI, remote sensing, or visualization were excluded when they did not show an operational CIM-like information-modeling workflow.
Each reviewer assigned one of three decisions: Include, Exclude, or Uncertain/needs full-text check. Reviewer agreement was checked after independent screening, and inconsistencies between reviewer decisions were examined. Because the screening stage was intended to avoid removing potentially relevant studies before full-text assessment, the final decision was then calculated in Excel using an inclusive rule. A record was included if either reviewer marked it as Include, or if both reviewers marked it as Uncertain/needs full-text check. All other combinations were excluded. This rule allowed potentially relevant studies to move forward to full-text retrieval while maintaining the predefined inclusion and exclusion criteria.
Initial screening was based on title, abstract, keyword relevance, document type, and likely codeability. Studies were excluded if they met the following criteria:
- they were review papers, editorials, roadmaps, vision papers, or conceptual discussions without an original method, workflow, platform, or case application;
- they focused exclusively on single-building BIM, construction BIM, or building-management workflows without urban-scale extension;
- they addressed smart cities or digital twins conceptually without an identifiable city-scale information-modeling workflow;
- they presented 3D visualization, GIS mapping, remote sensing, point-cloud processing, AI, or sensor methods without clear planning, management, simulation, governance, or decision-support relevance;
- they lacked sufficient methodological signals to be coded later under workflow type, analytical function, planning domain, spatial scale, and implementation maturity.
2.6. Full-Text Coding Framework and Data Extraction
2.6.1. Full-Text Retrieval and Coding Eligibility Procedure
After title/abstract/keyword screening, full papers were retrieved for all included studies where institutional access, open access, or publisher access was available. Papers that could not be accessed were retained in the screening-included corpus for transparency but were excluded from the full-text extraction and coding stage. No full-text coding was conducted before the availability check was completed.
Full-text versions were then examined to confirm operational relevance. Eligibility at this stage required that the paper provide enough information to identify the main workflow, analytical function, planning domain, spatial scale, contribution maturity, and validation evidence. Papers were checked to determine whether they dealt with CIM or CIM-related urban-scale information modeling as an operational system, had identifiable workflow logic, had extractable analytical or planning application components, and were described clearly enough to be coded.
After full-text retrieval, backward and forward snowballing was used as a supplementary step to identify additional relevant studies that were not captured in the Scopus and Web of Science exports. Backward snowballing was based on the reference lists of included full-text papers and key CIM-related studies, while forward snowballing used citation links to identify papers that were citing included or key studies. Candidate papers identified through snowballing were assessed using the same full-text eligibility and extraction criteria as the database-included studies. Snowballing records were handled as a separate source stream and were not included in the database-screening counts.
2.6.2. Full-Text Coding
Full-text coding was conducted after full-text availability and eligibility were confirmed. Coding at this stage was based on the full text, not on title, abstract, or keywords. A rule-based framework was organized to cover workflow operational classification, analytical function, planning domain application, spatial scale, implementation level, validation level, temporal aspect, dynamic data use, tooling, and synthesis gaps. These data were designed to cover various aspects of CIM synthesis under six main categories: CIM core contribution, workflow and data logic, analysis and decision support, planning domain and scale, validation and maturity, and critical appraisal and synthesis flags. For each accessed paper, these data were extracted and documented in the Excel sheet next to the relevant study. These data form the core of the CIM synthesis analysis. Table 1 shows the codes used for assessment and summarizes the code categories and their criteria basis.
Table 1.
Full-text coding framework used for operational extraction.
The six main categories covered at this stage were designed to investigate how CIM and CIM-related studies are conceptualized, implemented, operationalized, and used to support planning, management, and decision-making at urban scales. The CIM core contribution category identifies what the paper actually adds. It includes the author’s objective, CIM type (model, framework, platform, method, workflow, ontology, database, or digital twin system), the paper’s primary contribution, and contribution level (conceptual, prototype, or applied). The workflow and data logic category tests how CIM is built and how it operates. This category includes the primary workflow code, workflow steps, data sources actually used, integration method used, and study output type. The primary workflow code was assigned according to the main intended contribution of the paper, rather than all secondary activities mentioned in the study.
The analysis and decision support category tests the applications carried out using the built or proposed CIM-related workflow. It covers the primary analytical function, analysis type, planning domain, planning function, decision supported, and planning process type. Planning domain and scale formed a critical layer where city-scale or urban-scale claims were checked against the actual scale of implementation. It includes stakeholder or user group, spatial scale used, and whether the workflow was operational at the stated scale or only partially operational.
The validation and maturity category records whether the workflow was validated and what level of evidence was provided. Validation was not treated only as a binary variable. In addition to workflow validation status, validation level, validation method, validation evidence, and validation scope were extracted. Validation levels ranged from illustrative demonstration to prototype or simulation test, empirical case study, and operational or practice-based validation. Studies that stayed at the level of a concept, illustrative scenario, or theoretical architecture without testing were coded at lower validation levels, while studies applied to real urban cases, infrastructure systems, building stocks, or operational settings were coded at higher validation levels.
The temporal and technical setup category records whether the study was static, dynamic, or real-time/near-real-time, whether dynamic data were actually used, what software or tools were used in the developed study, the tool category, and whether the technical setup was clearly reported. Tools mentioned only in the introduction, literature review, or future work were not coded as tools used in the study. Lastly, the critical appraisal and synthesis category included interpretive insight, reported limitations, interoperability issues, replicability, and gap type. These fields were used to support the discussion of recurring operational gaps rather than to summarize each paper.
Before full extraction was applied to the analytical corpus, a pilot extraction was conducted on a small subset of studies representing different contribution and workflow types. This was used to clarify category boundaries and reduce inconsistency in the main categorical fields. After extraction, a second reviewer checked the key categorical variables used in the analysis, including full-text eligibility, contribution level, workflow code, analytical function, planning domain, planning process type, spatial scale, scale operationalization, validation status, validation level, temporal aspect, dynamic data use, tool category, technical setup, interoperability issues, replicability, and gap type. Disagreements were reviewed and resolved before final analysis.
2.7. Synthesis and Analytical Strategy
A multi-layered analytical strategy combining descriptive statistics, cross-tabulation, bibliometric mapping, and qualitative interpretation was developed to identify structural patterns, operational configurations, maturity levels, and common constraints in the reviewed CIM-related literature. The review dataset was differentiated into three analytical subsets: the deduplicated screening dataset, the screening-included corpus, and the full-text extractable corpus. Bibliometric and network analyses were conducted on the screening-included corpus, whereas workflow, validation, maturity, planning-domain, temporal, tooling, and gap-related analyses were restricted to the full-text extractable corpus.
Bibliometric analysis focused on temporal publication distribution, author keyword co-occurrence, thematic evolution, and co-authorship structure. Bibliometric visualization and network analyses were performed using VOSviewer version 1.6.18 (Centre for Science and Technology Studies, Leiden University, Leiden, The Netherlands). Author keyword co-occurrence was analyzed using a minimum occurrence threshold of three, and a thesaurus file was used to harmonize spelling variants and related terms such as modelling/modeling, BIM-GIS/GeoBIM, urban digital twin/city digital twin, and CityGML/CityJSON-related terms. No laboratory equipment, physical materials, or experimental devices were used in this systematic review. Database searching was conducted using Scopus (Elsevier, Amsterdam, The Netherlands) and Web of Science (Clarivate, Philadelphia, PA, USA). Data organization, deduplication, screening, and extraction tables were managed using Microsoft Excel for Microsoft 365 (Microsoft Corporation, Redmond, WA, USA).
Frequency distribution analysis was applied to the full-text extractable corpus to examine contribution levels, workflow patterns, analytical functions, planning domains, planning process types, spatial scales, validation levels, temporal aspects, dynamic data use, and tool categories. Cross-tabulations were conducted to examine relationships between the main analytical dimensions, including contribution level by workflow type, contribution level by validation level, workflow type by analytical function, workflow type by planning domain, and workflow type by spatial scale. Additional synthesis examined the tooling and platform ecosystem supporting CIM-related implementation. The tooling field was recoded into non-exclusive tool categories because one study could use more than one tool category. Finally, interpretive insight, reported limitations, interoperability issues, replicability, and gap-type fields were used to support the discussion of recurring operational gaps.
3. Results
3.1. PRISMA-Based Study Selection
The database search and export conducted in May 2026 yielded a total of 1541 records, comprising 1031 records from Scopus and 510 records from Web of Science. After exporting the records and consolidating them into a single working dataset, duplicate records were identified and removed through DOI-based and title-based verification. A total of 440 duplicate records were removed, leaving 1101 unique records for title/abstract/keyword screening.
3.1.1. Title/Abstract/Keyword Screening
The 1101 deduplicated records were screened using title, abstract, author keywords, index keywords, document type, and bibliographic metadata. Full texts were not used at this stage. The screening applied predefined inclusion and exclusion rules to retain studies with an identifiable urban-scale information-modeling workflow and sufficient methodological detail for full-text extraction. The exclusion criteria followed the screening procedure described in Section 2.5, and this stage resulted in the exclusion of 783 records, leaving 318 records retained for full-text retrieval and eligibility checking.
3.1.2. Full-Text Eligibility Assessment
Full texts were searched for all 318 records retained after title/abstract/keyword screening. Full texts were available for 306 records. The remaining 12 records could not be accessed in full text. These 12 records were retained in the screening-included database corpus for transparency and descriptive/bibliometric reporting, but they were excluded from full-text extraction and coding.
After full-text retrieval, backward and forward snowballing was used as a supplementary source stream. Six records were identified through backward snowballing and two records through forward snowballing. These eight records were assessed using the same full-text eligibility and extraction criteria as the database-included studies. They were not included in the database-screening counts, but they were added to the final full-text extraction corpus after eligibility was confirmed.
3.1.3. Corpus Definition
The review distinguishes between the database screening corpus and the final extraction corpus. Descriptive PRISMA-based and bibliometric reporting are based on the screening-included database corpus of 318 records [23,25,32,33,34,35,36,37,38,39,40,41,42,43,44,45,46,47,48,49,50,51,52,53,54,55,56,57,58,59,60,61,62,63,64,65,66,67,68,69,70,71,72,73,74,75,76,77,78,79,80,81,82,83,84,85,86,87,88,89,90,91,92,93,94,95,96,97,98,99,100,101,102,103,104,105,106,107,108,109,110,111,112,113,114,115,116,117,118,119,120,121,122,123,124,125,126,127,128,129,130,131,132,133,134,135,136,137,138,139,140,141,142,143,144,145,146,147,148,149,150,151,152,153,154,155,156,157,158,159,160,161,162,163,164,165,166,167,168,169,170,171,172,173,174,175,176,177,178,179,180,181,182,183,184,185,186,187,188,189,190,191,192,193,194,195,196,197,198,199,200,201,202,203,204,205,206,207,208,209,210,211,212,213,214,215,216,217,218,219,220,221,222,223,224,225,226,227,228,229,230,231,232,233,234,235,236,237,238,239,240,241,242,243,244,245,246,247,248,249,250,251,252,253,254,255,256,257,258,259,260,261,262,263,264,265,266,267,268,269,270,271,272,273,274,275,276,277,278,279,280,281,282,283,284,285,286,287,288,289,290,291,292,293,294,295,296,297,298,299,300,301,302,303,304,305,306,307,308,309,310,311,312,313,314,315,316,317,318,319,320,321,322,323,324,325,326,327,328,329,330,331,332,333,334,335,336,337,338,339,340,341,342,343,344,345,346,347]. Full texts were available for 306 of these records. The 12 full-text inaccessible database records were retained for transparency and metadata-level reporting only [53,72,77,117,119,122,133,134,179,187,196,281]. Extraction-based analyses are based on the final full-text extractable corpus of 314 studies, consisting of the 306 accessible database records and 8 eligible snowballing records [348,349,350,351,352,353,354,355].
The study-level characteristics of the full-text extractable corpus are provided in Supplementary Material S2. Corpus stratification is summarized in Table 2.
Table 2.
Corpus stratification across database screening, full-text availability, and extraction-based analysis.
The staged PRISMA–BSMS selection and analytical process is illustrated in Figure 1. The figure documents database identification, deduplication, title/abstract/keyword screening, full-text availability, supplementary snowballing, and final corpus consolidation.
Figure 1.
PRISMA flow diagram integrated with BSMS staged analytical logic.
3.2. Bibliometric and Network Structure of CIM Research
The Scopus and Web of Science metadata linked to the screening-included corpus were used for descriptive publication reporting and bibliometric structuring. This analysis investigated publication trends, author keyword co-occurrence, thematic evolution, and co-authorship structure.
3.2.1. Temporal Distribution of Publications
Figure 2 shows the annual publication counts for the screening-included corpus. Publication activity remained limited before 2020, with most years containing only a small number of records. The number of studies increased from 2020 onward, with 21 records in 2020, 15 in 2021, 19 in 2022, and 22 in 2023. The highest counts appear in 2024 and 2025, with 52 and 83 records, respectively. Because the search was exported in May 2026, the 2026 count does not represent the full publication year.
Figure 2.
Annual publication distribution of the screening-included corpus.
3.2.2. Keyword Co-Occurrence Network
Keyword co-occurrence analysis was carried out in VOSviewer using the author keywords of the screening-included corpus. A minimum occurrence threshold of three was applied, and a thesaurus file was used to harmonize spelling variants and related terms. The keyword co-occurrence network is shown in Figure 3. The largest visible nodes include urban digital twin, 3D city model, CityGML, city information modeling, building information modeling, GIS, smart city, urban planning, and decision-support system. The map shows that CIM-related research is distributed across several connected keyword areas rather than one single term. Around the main nodes, there are terms related to data and interoperability, such as BIM-GIS integration, data integration, 3DCityDB, CityJSON, point cloud, semantic 3D city model, interoperability, ontology, and data model. Other visible terms point to application areas, including urban design, change detection, photovoltaic potential, urban building energy modeling, urban heat island, flooding, urban resilience, mobility, cultural heritage, and carbon neutrality. Terms such as artificial intelligence, machine learning, IoT, computer vision, occupant movement, and 3D visualization also appear in the network.
Figure 3.
Author keyword co-occurrence network of the screening-included corpus in VOSviewer.
3.2.3. Temporal Evolution of Research Themes
Figure 4 presents an overlay visualization generated in VOSviewer using average publication year. In the map, earlier terms appear toward the blue end of the scale, while more recent terms appear toward the yellow end. Terms such as decision-support system, change detection, urban design, interoperability, and urban heat island are positioned among the earlier or middle keywords. Terms such as 3D city model, GIS, city information modeling, urban planning, data integration, building information modeling, and artificial intelligence appear in the middle range. More recent terms include urban digital twin, smart city, machine learning, carbon neutrality, architecture, IoT, and urban computing. This pattern places urban digital twin and smart city among the more recent visible terms in the dataset, while 3D city model, GIS, CityGML, and city information modeling remain central across the network.
Figure 4.
Overlay visualization of thematic evolution based on average publication year.
3.2.4. Author Co-Authorship Network
Author collaboration patterns were analyzed using VOSviewer based on the screening-included corpus. A minimum threshold of three publications per author was applied. The co-authorship structure is presented in Figure 5. The network is divided into several small author groups. Most collaborations appear within these groups, while clear connections between the groups are limited in the visualization. Visible clusters include author groups around Kolbe, Biljecki, Coors, Agugiaro, Bellini, Murayama, Petrova-Antonova, and Emamgholian. The co-authorship structure in the dataset is fragmented, with research contributions emerging from separate teams rather than from one connected author community.
Figure 5.
Author co-authorship network of the screening-included corpus generated in VOSviewer using a minimum threshold of three publications per author.
3.3. Operational Contribution Typology
The operational contribution classification was conducted for the full-text extractable corpus. Contribution level was coded as applied, prototype, or conceptual. Applied studies are those that use the proposed workflow in a real urban case, infrastructure system, building stock, district, city, or real dataset with reported outputs. Prototype studies demonstrate a tool, workflow, or model in a limited pilot, simulated, experimental, or partial setting. Conceptual studies mainly propose frameworks, architectures, ontologies, or data models without a real implementation or empirical case.
Conceptual studies were not excluded only because they lacked empirical implementation. They were retained when they presented a clearly defined CIM-related framework, ontology, data model, architecture, or workflow that could be coded under the extraction framework. Broad conceptual discussions without an identifiable workflow or codeable structure had already been excluded during title/abstract/keyword screening.
Of the 314 full-text extractable studies, 205 were classified as applied, 66 as prototype, and 43 as conceptual. In percentage terms, this corresponds to 65.3% applied studies, 21.0% prototype studies, and 13.7% conceptual studies. The applied category forms the largest group in the dataset. Prototype and conceptual studies appear in smaller proportions. Figure 6 presents the distribution of contribution levels.
Figure 6.
Distribution of contribution levels across the full-text extractable corpus (n = 314).
3.4. Workflow Patterns (W1–W6)
The 314 full-text extractable studies are spread across six workflow categories. Data integration (W3) is the largest group, with 95 studies (30.3%). Simulation (W4) follows closely with 92 studies (29.3%), and planning/governance support (W6) includes 84 studies (26.8%). Generation or automation (W5) appears in 29 studies (9.2%), while visualization or representation (W2) appears in 12 studies (3.8%). Data acquisition (W1) appears in 2 studies (0.6%). Figure 7 shows the distribution of workflow categories across the full-text extractable corpus.
Figure 7.
Distribution of CIM-related workflow categories (W1–W6) across the full-text extractable corpus (n = 314).
Contribution Level × Workflow
To examine the operational depth of CIM-related contributions, contribution levels were cross-tabulated with workflow categories (Table 3).
Table 3.
Cross-tabulation of contribution maturity levels and workflow categories (W1–W6) ().
Among the 205 applied studies, 82 are in simulation (W4), 58 in planning/governance support (W6), and 41 in data integration (W3). The total of these three categories accounts for 181 of the 205 applied studies. Generation or automation (W5) appears in 17 applied studies, while visualization or representation (W2) and data acquisition (W1) appear in smaller numbers. The 43 conceptual studies are mainly located in data integration (W3) and planning/governance support (W6), with 19 and 16 studies, respectively. Five conceptual studies appear in visualization or representation (W2), two in generation or automation (W5), and one in simulation (W4). In this group, most conceptual studies are concentrated in integration- and planning-related categories. The 66 prototype studies are mainly distributed across data integration (W3), generation or automation (W5), planning/governance support (W6), and simulation (W4), with 35, 10, 10, and 9 studies, respectively. Smaller numbers appear in visualization or representation (W2), and no prototype study appears in data acquisition (W1). Data integration (W3) is the largest workflow category with 95 studies. It is followed by simulation (W4) with 92 studies and planning/governance support (W6) with 84 studies.
3.5. Analytical Function Mapping
The 314 full-text extractable studies were coded using the primary analytical function classification (A1–A7). Environmental and energy analysis (A2) is the most common category, with 87 studies (27.7%). It is followed by technical or data governance analysis (A7) with 82 studies (26.1%) and governance or policy analysis (A6) with 47 studies (15.0%). Geometric and spatial analysis (A1) appears in 36 studies (11.5%). Asset or infrastructure management analysis (A5), risk or resilience analysis (A3), and mobility analysis (A4) appear in smaller numbers, with 28 studies (8.9%), 20 studies (6.4%), and 14 studies (4.5%), respectively. The distribution shows that the expanded corpus contains a strong environmental and technical data component, while mobility and risk/resilience appear in smaller but still visible groups.
Cross-tabulation of workflow categories and analytical functions (Table 4) shows that the analytical categories are not distributed evenly across workflow types. Data integration (W3) appears mainly in technical or data governance analysis (A7), with 70 studies. Simulation (W4) appears mainly in environmental and energy analysis (A2), with 59 studies. Planning/governance support (W6) appears most often in governance or policy analysis (A6), with 29 studies, followed by asset or infrastructure management analysis (A5), with 20 studies, and environmental and energy analysis (A2), with 17 studies. Generation or automation (W5) appears most often in geometric and spatial analysis (A1), with 13 studies. Visualization or representation (W2) and data acquisition (W1) appear in smaller numbers across the analytical functions.
Table 4.
Cross-tabulation of workflow categories (W1–W6) and primary analytical functions (A1–A7) ().
3.6. Planning Domain and Planning Process
3.6.1. Planning Domain Distribution
Across the 314 full-text extractable studies, multi-scale or data infrastructure systems (P8) represent the largest planning domain, comprising 91 studies (29.0%). Environmental and energy applications (P5) account for 81 studies (25.8%), followed by urban planning and governance (P7) with 66 studies (21.0%). Mobility systems (P4) appear in 23 studies (7.3%), while asset or facility management (P6) accounts for 21 studies (6.7%). City block or urban design unit studies (P2) appear in 18 studies (5.7%), infrastructure or urban morphology (P3) in 12 studies (3.8%), and building or building-stock studies (P1) in 2 studies (0.6%).
3.6.2. Workflow × Planning Domain
Workflow-domain cross-tabulation (Table 5) shows that the planning domains are distributed differently across workflow types. Multi-scale/data infrastructure studies (P8) are mainly located in data integration (W3), with 66 studies. This shows that this domain is mostly connected to data structuring, interoperability, semantic modeling, and platform/data-infrastructure work. Environmental and energy studies (P5) show a different pattern. They are mainly located in simulation workflows (W4), with 53 studies, followed by planning/governance support (W6), with 19 studies. This reflects the strong role of energy modeling, environmental simulation, solar analysis, heat-risk assessment, and carbon-related workflows in this domain.
Table 5.
Cross-tabulation of workflow categories (W1–W6) and planning domains (P1–P8) ().
Urban planning and governance studies (P7) are more distributed across workflow types. The largest group is planning/governance support (W6), with 25 studies, followed by simulation (W4) with 17 studies and data integration (W3) with 11 studies. Mobility systems (P4) are mainly located in simulation workflows (W4), with 11 studies, followed by planning/governance support (W6), with 7 studies. Asset or facility management studies (P6) are mostly located in planning/governance support (W6), with 15 studies. The smaller domains, including P1, P2, and P3, appear in lower numbers and are distributed across integration, simulation, automation, and planning-support workflows. The table shows that workflow structures vary by planning domain rather than following one uniform CIM-related workflow pattern.
3.6.3. Planning Process Type Distribution
Planning process type was used to identify the practical planning orientation of each study. Because the extracted labels included both broad and highly specific descriptions, they were harmonized into controlled planning-process categories before reporting. Environmental and energy planning forms the largest group, with 94 studies (29.9%). Governance and monitoring follows with 70 studies (22.3%), while risk or resilience planning accounts for 34 studies (10.8%). Detailed urban design appears in 24 studies (7.6%), followed by mobility planning with 20 studies (6.4%). Infrastructure planning includes 15 studies (4.8%), while strategic planning, asset or facility management, and permit or statutory control each include 14 studies (4.5%). Master planning or land-use planning and public participation appear in smaller numbers, with 8 studies (2.5%) and 7 studies (2.2%), respectively. The distribution of planning process types is summarized in Table 6.
Table 6.
Distribution of planning process types across the full-text extractable corpus ().
3.7. Spatial Scale and Scale Operationalization
Spatial-scale analysis shows that the full-text extractable corpus is mainly concentrated at the district and city scales. District-scale studies account for 81 studies (25.8%), followed closely by city-scale studies with 80 studies (25.5%). Multi-scale studies represent 56 studies (17.8%), and neighborhood-scale studies account for 42 studies (13.4%). City-block studies appear in 32 studies (10.2%). Building-scale studies account for 12 studies (3.8%), while building-stock studies account for 4 studies (1.3%). Region-scale studies appear in 7 studies (2.2%).
Building-scale studies were not retained when they focused only on a single building without urban extension. The building and building-stock categories in this review refer to papers where building-level data were used within a CIM-related, BIM-GIS, CityGML, urban digital twin, or urban information-modeling workflow. This distinction is important because some urban-scale workflows are operationalized through building-level units, especially in energy, risk, asset-management, or semantic-modeling studies.
3.7.1. Scale Operationalization
Scale operationalization was coded to distinguish between studies that actually applied their workflow at the stated spatial scale, studies that only partly operationalized the stated scale, and studies that proposed a scale without implementation. “Yes” means that the workflow was applied at the stated scale using real or defined case data. “Partial” means that the study claimed a broader scale but tested only a pilot, subset, partial dataset, or incomplete implementation. “No” means that the scale was proposed or discussed but not operationally applied.
Across the 314 full-text extractable studies, 214 studies (68.2%) were coded as operational at the stated scale. Partial scale operationalization was identified in 66 studies (21.0%), while 34 studies (10.8%) did not operationalize the stated scale. District-scale studies showed the largest number of fully operationalized cases, with 64 studies coded as Yes, followed by city-scale studies with 57 and neighborhood-scale studies with 33. Multi-scale studies had a higher number of non-operational cases than most other categories, with 10 studies coded as No and 14 as Partial. Table 7 presents the distribution of scale operationalization across spatial scales.
Table 7.
Scale operationalization across spatial scales ().
3.7.2. Workflow × Spatial Scale Structure
Table 8 shows how the workflow categories are distributed across spatial scales. At the district scale, simulation workflows (W4) appear most often with 27 studies, followed by planning/governance support (W6) with 26 studies and data integration (W3) with 21 studies. At the city scale, planning/governance support (W6) is the largest group with 26 studies, followed by simulation (W4) with 22 studies and data integration (W3) with 20 studies. Multi-scale studies are mainly located in data integration (W3), with 31 studies. Neighborhood-scale studies are more distributed, with 13 studies in simulation (W4), 12 in planning/governance support (W6), and 9 in data integration (W3). City-block studies are mainly located in simulation (W4), automation or generation (W5), and planning/governance support (W6), with 10, 8, and 7 studies, respectively. Building and building-stock studies appear in smaller numbers and are mainly linked to data integration, simulation, automation, and planning-support workflows.
Table 8.
Cross-tabulation of spatial scales and workflow categories (W1–W6) ().
3.8. Validation and Maturity Assessment
Validation was assessed using two related fields. The first field recorded the validation status of the workflow as yes, partial, or no. A study was coded as Yes when the workflow was tested through a real case, prototype, simulation, experiment, operational use, or comparable empirical application. It was coded as Partial when only part of the workflow was demonstrated, when testing was limited to a pilot or illustrative application, or when the paper provided some evidence but did not validate the full proposed workflow. It was coded as No when the paper proposed a framework, model, architecture, or workflow without testing or empirical application. The second field recorded the level of validation evidence. V1 refers to illustrative or conceptual demonstration, V2 to prototype or simulation test, V3 to empirical case study, and V4 to operational or practice-based validation.
3.8.1. Validation Level by Contribution Level
Across the 314 full-text extractable studies, V3 empirical case study is the largest validation level, with 183 studies (58.3%). V2 prototype or simulation test appears in 86 studies (27.4%), while V1 illustrative demonstration appears in 37 studies (11.8%). Operational or practice-based validation (V4) appears in 8 studies (2.5%).
The validation pattern differs by contribution level. Among the 205 applied studies, 179 were coded as V3 and 8 as V4. A further 18 applied studies were coded as V2, usually because they used real or defined case data but remained closer to a limited test or prototype workflow. Among the 66 prototype studies, 64 were coded as V2 and 2 as V3. The conceptual group shows a different pattern. Of the 43 conceptual studies, 37 were coded as V1, while 4 were coded as V2 and 2 as V3. Conceptual studies were included when they presented a structured CIM-related framework, ontology, data model, architecture, or workflow that could be coded under the extraction framework. This is different from broad conceptual discussions that were excluded during title/abstract/keyword screening because they did not contain an identifiable workflow or codeable structure. Some included conceptual papers did not test the proposed workflow and were therefore coded at the illustrative validation level. A small number included limited testing or case-based evidence, but their main contribution still remained conceptual rather than applied. Table 9 shows the cross-tabulation between contribution level and validation level.
Table 9.
Cross-tabulation of contribution levels and validation levels ().
3.8.2. Workflow Validation Status
Workflow validation status was also examined separately from validation level. Of the 314 studies, 237 were coded as validated, 44 as partially validated, and 33 as not validated. The studies coded as not validated were mainly papers where the proposed workflow, model, or framework was not tested through a case, prototype, simulation, or operational application.
The distribution across workflow categories is shown in Table 10. Simulation workflows (W4) have the highest number of validated studies, with 86 validated out of 92. Planning/governance support (W6) includes 61 validated studies, 10 partially validated studies, and 13 non-validated studies. Data integration (W3) includes 59 validated studies, 23 partially validated studies, and 13 non-validated studies. Generation or automation (W5) includes 24 validated studies, 4 partially validated studies, and 1 non-validated study. Visualization or representation (W2) is more mixed, with 5 validated, 2 partially validated, and 5 non-validated studies. Both data acquisition studies (W1) were coded as validated.
Table 10.
Workflow validation status across workflow categories (W1–W6) ().
The validation-level and validation-status results show that contribution type and evidence strength are related but not identical. Applied studies are mostly supported by empirical case studies, prototype studies are mostly supported by limited tests or demonstrations, and conceptual studies are mostly located at the illustrative validation level.
3.9. Temporal Aspect and Dynamic Data Use
Temporal aspect and dynamic data use were coded separately. Temporal aspect refers to whether the study used a static model, a dynamic or scenario-based structure, or a real-time/near-real-time workflow. Dynamic data use refers to whether changing, time-based, updateable, or live data were actually used in the study. This distinction was necessary because some papers describe dynamic or real-time logic without fully implementing dynamic data streams.
Across the 314 full-text extractable studies, 144 studies (45.9%) were coded as dynamic, 143 studies (45.5%) as static, and 27 studies (8.6%) as real-time or near-real-time. Dynamic data use was more limited than temporal framing. Only 51 studies (16.2%) were coded as using dynamic data, while 122 studies (38.9%) were coded as partial and 141 studies (44.9%) as no dynamic data use. In this coding, partial dynamic data use refers to studies that proposed, discussed, simulated, or partly demonstrated dynamic data but did not implement a full dynamic or real-time workflow.
Table 11 shows the relationship between temporal aspect and dynamic data use. Among dynamic studies, 40 used dynamic data, 91 were coded as partial, and 13 did not use dynamic data. The real-time/near-real-time group includes 11 studies with implemented dynamic data use and 16 studies with partial dynamic data use. Static studies are mainly located in the no dynamic data category, with 128 studies, although 15 static studies were coded as partial because they included limited updateable, time-based, or proposed dynamic components while the main workflow remained static.
Table 11.
Cross-tabulation of temporal aspect and dynamic data use ().
3.10. Tooling and Technical Setup
The tooling information reported in the full-text extractable corpus was recoded into nine tool categories. Tool category counts can exceed 314 because one study could be assigned to more than one tool category. Percentages were therefore calculated against the 314 full-text extractable studies rather than against the total number of tool mentions.
GIS and 3D GIS tools appear in 288 studies (91.7%), making this the most frequent tool category. Database or data-infrastructure tools appear in 239 studies (76.1%), followed by simulation or analytical engines in 191 studies (60.8%) and 3D visualization or game-engine tools in 186 studies (59.2%). Hardware or data-acquisition tools appear in 77 studies (24.5%), and BIM authoring or platform tools appear in 75 studies (23.9%). Semantic web or ontology tools appear in 61 studies (19.4%), machine learning or AI tools appear in 59 studies (18.8%), and conceptual or non-implemented architectures in 39 studies (12.4%). Table 12 shows the frequency of tool categories identified across the full-text extractable corpus.
Table 12.
Frequency of tool categories identified across the full-text extractable corpus ().
3.10.1. Tool Categories by Workflow and Analytical Function
To examine the relation between tool categories, workflows, and analytical functions, two cross-tabulations were prepared: workflow × tool category and analytical function × tool category. Tool category counts are not exclusive. One study can include more than one tool category, so the total counts in a group can be higher than the number of studies in that group. Table A2 shows the cross-tabulation of workflow categories (W1–W6) and reported tool categories, while Table A3 shows the cross-tabulation of primary analytical functions (A1–A7) and reported tool categories.
In the workflow table, GIS/3D GIS appears across all workflow groups and is especially frequent in data integration (W3), simulation (W4), and planning/governance support (W6). Database or data-infrastructure tools are also strongly represented in W3 and W6. Simulation or analytical engines appear most often in simulation workflows (W4), while BIM authoring or platform tools appear most often in data integration (W3). Conceptual or non-implemented architectures are most visible in data integration (W3) and planning/governance support (W6).
In the analytical-function table, GIS/3D GIS appears across all analytical functions. Environmental and energy analysis (A2) is mainly represented by GIS/3D GIS, simulation or analytical engines, and database/data-infrastructure tools. Technical or data governance analysis (A7) is mainly represented by database/data infrastructure, GIS / 3D GIS, semantic web/ontology, and BIM authoring/platform tools. This pattern shows that tooling is not limited to one technical environment but is distributed across GIS, database, simulation, visualization, BIM, semantic, and AI-related systems.
3.10.2. Software and Technical Systems Reported
At the software-name level, the most frequently reported technical systems include both software platforms and data standards or formats. These counts are not exclusive, because one study can report more than one software tool, library, platform, standard, or data format. The percentages were calculated against the full-text extractable corpus of 314 studies. General tool categories were analyzed separately in the previous section; this subsection reports the most frequent named systems only.
CityGML is the most frequently reported named system, appearing in 112 studies (35.7%). ArcGIS appears in 81 studies (25.8%), followed by Python in 64 studies (20.4%) and PostgreSQL/PostGIS in 49 studies (15.6%). FME appears in 43 studies (13.7%). Cesium and OpenStreetMap each appear in 40 studies (12.7%), followed by 3DCityDB, IFC, and QGIS, each with 39 studies (12.4%). Revit appears in 37 studies (11.8%). Table 13 shows the most frequent software, platforms, standards, and technical systems reported in the corpus.
Table 13.
Most frequently reported software, platforms, standards, and technical systems in the full-text extractable corpus ().
The software-level results are consistent with the tool-category distribution. CityGML, IFC, 3DCityDB, PostgreSQL/PostGIS, and FME point to the importance of data standards, databases, and conversion workflows. ArcGIS and QGIS show the continued role of GIS environments, while Cesium and similar web-based 3D visualization systems support the publication and interaction side of CIM-related workflows. Python appears frequently because many studies used custom scripts, data-processing routines, or model-conversion workflows. These results should be read as reported software and technical-system use, not as a complete inventory of all tools available in the field.
3.10.3. Technical Setup Reporting
Technical setup was coded as clear, partial, or not reported. A clear setup means that the study reported enough information about tools, data, and workflow steps to understand the implementation. A partial setup means that some tools or workflow steps were reported, but implementation details were incomplete. Of the 314 studies, 196 studies (62.4%) reported a clear technical setup, while 118 studies (37.6%) were coded as partial. No study was coded as not reported in this field.
Table A4 shows technical setup reporting by workflow category. Clear technical setup appears most often in data integration (W3), simulation (W4), and planning/governance support (W6), while partial setup is also common in these three groups. This reflects the fact that the largest workflow categories also contain the largest number of technical configurations.
3.11. Operational Gaps and Interpretive Synthesis
Operational gaps were extracted from the reported limitations, interoperability notes, replicability assessment, and interpretive synthesis fields in the full-text extraction. Because more than one gap type could be assigned to the same study, the gap counts are non-exclusive. Table 14 shows the frequency of operational gap types identified across the 314 full-text extractable studies.
Table 14.
Frequency of operational gap types identified across the full-text extractable corpus ().
Planning application gaps appear most often, with 230 studies (73.2%). Data quality gaps appear in 213 studies (67.8%), followed by interoperability gaps in 172 studies (54.8%). Dynamic data gaps appear in 108 studies (34.4%), and validation gaps appear in 102 studies (32.5%). Standardization and replicability gaps are also visible, with 88 studies (28.0%) and 85 studies (27.1%), respectively. Additional gap categories appear in smaller shares, including tooling, scale, governance, conceptual-to-operational gaps, automation, computational or scalability issues, model assumptions, data availability, participation, stakeholder collaboration, equity, and the residual other category.
Interoperability issues were also coded separately because they were frequently reported as part of CIM-related implementation. Across the corpus, 268 studies (85.4%) reported interoperability issues explicitly, while 46 studies (14.6%) involved implicit interoperability issues through integration, conversion, or data exchange processes without naming them directly as a problem. No study was coded as having no relevant interoperability issue in this field. Table 15 shows the distribution of interoperability issue reporting.
Table 15.
Distribution of interoperability issue reporting across the full-text extractable corpus ().
Replicability was coded as high, medium, or low according to the clarity of reported workflow steps, data inputs, tools, and implementation details. The results show that 151 studies (48.1%) were coded as high replicability, while 161 studies (51.3%) were coded as medium. Only 2 studies (0.6%) were coded as low. This distribution suggests that many studies provide enough information to understand their workflow logic but not always enough detail to fully repeat the method without additional assumptions, data access, or technical clarification. The replicability distribution is shown in Table 16.
Table 16.
Replicability assessment across the full-text extractable corpus ().
The gap type by workflow table shows that the most frequent gap categories appear across more than one workflow type. Planning application gaps appear most often in simulation (W4) and planning/governance support (W6), with 78 and 77 studies, respectively. Data quality gaps are most visible in simulation (W4), with 78 studies, and in data integration (W3), with 57 studies. Interoperability gaps are concentrated mainly in data integration (W3), with 88 studies, followed by planning/governance support (W6), with 42 studies. Dynamic data gaps are distributed across simulation (W4), planning/governance support (W6), and data integration (W3). Table A5 presents the cross-tabulation of gap types and workflow categories.
Figure 8 summarizes the main operational structure identified in the full-text extractable corpus. It brings together the dominant workflow directions, the main planning domains, validation evidence, scale and dynamic-data use, and the recurring operational gaps. The figure is not intended to replace the detailed tables above but to show how the main results connect across the reviewed corpus.
Figure 8.
Summary of the operational structure identified in the full-text extractable corpus. The figure combines the main workflow directions, dominant planning domains, validation evidence levels, scale operationalization, dynamic data use, and recurring operational gaps. Percentages are calculated relative to the full-text extractable corpus (), except gap categories, which are non-exclusive.
4. Discussion
4.1. Terminological Fragmentation and Operational Connections in CIM Research
The reviewed literature shows that CIM-related work is not organized under one stable term. Some studies use the term CIM directly, while others use BIM-GIS, GeoBIM, 3D city model, semantic city model, CityGML/CityJSON, smart city model, or urban digital twin terminology. This variation is not only a naming issue. It reflects the fact that similar operational problems are discussed through different technical terms.
The keyword co-occurrence results support the observation that CIM-related work is spread across several connected terms. Terms such as urban digital twin, 3D city model, CityGML, building information modeling, GIS, smart city, urban planning, and decision-support system form the main visible structure of the keyword network. Around these terms, the map also shows data integration, interoperability, ontology, artificial intelligence, urban energy modeling, and photovoltaic potential. The map therefore indicates terminological overlap around related urban digital-modeling topics. The full-text coding provides the operational connection, where studies using different terms are classified under common workflow, analytical-function, planning-domain, validation, and tooling categories.
The applied data-infrastructure studies show this pattern clearly. Some papers use different labels, including CityGML, CityJSON, Spatial ID, GeoBIM, ADEs, urban digital twins, and semantic 3D city models, but they share the same coding profile as applied data-integration workflows (W3), technical/data-governance analyses (A7), and multi-scale or data-infrastructure domains (P8). They were also coded as validated empirical case studies, with operationalized scale and static data structures. Their common concern is how city-scale information is structured, enriched, stored, queried, linked, or exchanged. The cited studies include national 3D city model access, semantic roof-material enrichment, geodatabase management, streetspace integration, land-cover modeling, underground land-administration ADEs, utility-network ADEs, GeoBIM contamination workflows, and CityGML-based simulation/data management [49,76,105,110,124,143,153,168,176,184,239,316,350]. In these papers, data infrastructure is not only a background technical component. It is the part of the workflow that makes later simulation, monitoring, analysis, or planning-support use possible.
The coding results suggest that the difference between CIM and urban digital twin studies is not always clear at the operational level. Papers using digital twin terminology and papers using CIM, CityGML, GeoBIM, or semantic 3D city model terminology appeared within the same workflow codes, analytical codes, planning domains, and planning-process categories. This indicates that the authors’ labels do not always describe how the study actually works. In the coded cases reviewed here, digital twin terminology did not always mean that the workflow used dynamic data or had a dynamic temporal aspect. Some studies described as urban digital twins were coded as static and did not include dynamic data use. At the same time, some CIM or 3D city model studies included temporal, update-oriented, or scenario-based components. This does not mean that the terms are the same. Rather, it shows that terminology alone is not enough for classifying these studies. For this reason, this review gives more weight to workflow behavior, temporal aspect, dynamic data use, and planning function than to the label used by the authors.
4.2. Main Operational Directions: Integration, Simulation, and Planning Support
The results show three main operational directions in the reviewed corpus: data integration, simulation, and planning/governance support. These should not be read as identical forms of CIM work. Data integration studies prepare the information base. Simulation studies use city-scale information to calculate performance, risk, energy, mobility, or environmental indicators. Planning/governance studies connect model outputs to decision-support, management, monitoring, or regulatory tasks.
The P8 group shows that data infrastructure can be an operational layer by itself. The applied data-infrastructure studies discussed above developed access mechanisms for national 3D city model datasets, geodatabases, semantic enrichment workflows, ADE-based extensions, or multi-source integration pipelines. These contributions do not always support a planning decision directly, but they create the information environment through which later simulation, monitoring, analysis, or decision-support can operate.
Environmental and energy studies form one of the clearest applied and dynamic branches of CIM-related research. These studies use 3D city models, CityGML/CityJSON, GIS, LiDAR, BIM-GIS workflows, UBEM tools, climate or energy datasets, and simulation engines to assess energy demand, solar and PV potential, UHI effects, outdoor thermal comfort, carbon impacts, land-cover effects, and green-roof performance. Their outputs are often connected to planning tasks such as retrofit prioritization, renewable-energy deployment, climate adaptation, and environmental design evaluation [33,44,46,66,71,94,100,102,259,353]. At the same time, these studies show that applied simulation remains dependent on data quality, model assumptions, LoD, weather inputs, material attributes, vegetation representation, and measured validation data [71,94,100,130,231,236,259,294,317].
The environmental and energy studies also show the technical role of semantic 3D city models and GIS environments. CityGML, CityJSON, 3DCityDB, PostGIS, ArcGIS, QGIS, FME, and related simulation engines appear repeatedly as the technical base for preparing, storing, converting, and analyzing environmental data. This suggests that simulation workflows are not separate from data-integration work. They usually depend on prior geometric and semantic structuring before energy, solar, heat, noise, or carbon calculations can be performed [44,46,71,79,94,130,142,253,294,317,353].
Multi-scale environmental and energy studies add a related point. They show how 3D city models can connect building-level information with district or city-level planning indicators. Heat-demand modeling, solar-potential ranking, energy-indicator frameworks, sunlight–shadow analysis, and carbon assessment all depend on preparing simulation-ready urban information before a planning output can be produced [46,253,267,294,301,317,353]. In this sense, the simulation direction is strongly connected to the integration direction.
4.3. Planning Relevance: Direct and Indirect Support
The planning relevance of CIM-related studies appears in two main ways. Some studies support planning directly by producing outputs for permit checking, flood adaptation, energy retrofit, mobility management, public participation, or asset management. Other studies support planning indirectly by preparing data infrastructures, standards, semantic models, databases, ADEs, APIs, or visualization environments that can later support analysis and decision-making.
Applied planning-support studies show how CIM-related workflows can move from data modeling toward decision-oriented outputs. In this group, the outputs are not only 3D representations or technical data structures but perception scores, sustainability indicators, risk predictions, volumetric development measures, and planning-compliance indicators. Luo et al. [96] used an urban digital twin to predict visual perception along a Singapore greenway, Sohail et al. [114] developed a Sydney UDT that ranks suburbs and predicts traffic risk from multi-domain urban datasets, and Lata et al. [264] used 3D GIS to compare development intensity and FSI change in Chennai. Grimaldi et al. [351] applied a GIS-BIM/CIM workflow to evaluate urban transformation scenarios and planning-rule compliance in Nocera Inferiore. These studies demonstrate a more direct link between CIM-related workflows and planning interpretation, but they also show that institutional adoption, stakeholder testing, and translation into routine planning practice remain open issues.
Risk and resilience applications provide clear examples of CIM-related workflows being used for direct planning support. These studies translate heterogeneous urban data into spatial priorities for adaptation, mitigation, preparedness, or emergency response. The Cedar Key dashboard links flood scenarios, critical assets, 3D visualization, and public workshops in an operational coastal-resilience planning setting. The Freiburg demonstrator connects CityGML building attributes to earthquake vulnerability assessment and exposure visualization. The BIM-GIS crisis-preparedness framework links IFC, CityGML, semantic queries, IoT inputs, and VR simulation for earthquake and fire evacuation training [37,292,298]. These papers show that the planning relevance of resilience-oriented CIM workflows comes from converting hazard, vulnerability, exposure, or evacuation-related data into outputs that can support intervention priorities, emergency planning, preparedness training, or adaptation discussion.
Mobility-oriented CIM and UDT studies provide another specific form of decision-support. In these studies, models are used not only to visualize transport systems but to reconstruct traffic, predict conditions, compare scenarios, compute KPIs, and support service or network decisions. Bellini et al. [135] describe a Snap4City mobility architecture that supports traffic reconstruction, scenario editing, KPI computation, and optimization-based suggestions. Herath et al. [152] demonstrate an edge-cloud traffic-management architecture using adaptive sampling and traffic prediction. Fanfani et al. [159] apply the MODOM simulator to Florence to test public transport, sharing, and micro-mobility demand–offer matching. These studies show that mobility planning can be supported by CIM-related workflows when dynamic data, simulation, and decision indicators are connected. However, they also show that optimization and what-if analysis still depend on data availability, boundary conditions, behavioral assumptions, computational capacity, and human interpretation.
Asset and facility management studies show another operational use of CIM-related workflows. Rather than focusing mainly on design or simulation, these studies connect spatial models with inspection, maintenance, routing, monitoring, and operational decision support. Ma et al. [101] demonstrate a BIM-GIS platform for underground pipeline relocation, including automated modeling, clash and depth analysis, quantity calculation, and progress support. Cárdenas-León et al. [111] link geospatial data, citizen reports, simulated waste generation, and route optimization in a solid-waste UDT. Other studies propose BIM-GIS-IoT or CIM-IoT-AI operation and maintenance frameworks for utility tunnels and urban power facilities [84,116]. These examples show that asset/facility management can be a practical domain for CIM-related workflows, but the evidence also points to recurring limits in data quality, operational validation, governance roles, interoperability, and long-term adoption.
Permit and statutory-control studies provide one of the clearest examples of direct planning relevance. In these studies, the decision problem is explicit: whether a proposed development complies with planning rules, zoning parameters, building-height limits, shadow restrictions, noise requirements, land-use regulations, or urban transformation indicators. However, the reviewed examples also show that this is not only a geometric problem. Planning rules have to be interpreted, formalized, and linked to the required BIM, GIS, CityGML, IFC, iTwin, or platform-specific information before automated checking can occur [69,242,248,255,277,351]. Most of these workflows remain conceptual, prototype-based, or case-specific, which shows that statutory CIM applications are promising but still limited by legal ambiguity, data requirements, georeferencing, semantic completeness, interoperability, and validation in real permit processes.
Public participation appears in the reviewed corpus through a set of human-centered CIM and UDT workflows. These studies integrate visual perception, subjective experience, citizen comments, VR experiments, public dashboards, night-time economy scenarios, geo-tagged feedback, and participatory 3D environments into city information models or digital twin platforms [96,170,173,174,207]. They show that CIM-related workflows can represent more than physical geometry by including perception, safety, social feedback, stakeholder evaluation, and user experience. However, the same studies also show that participation-oriented tools remain sensitive to usability, participant profile, data quality, platform performance, model complexity, and the way results are integrated into real planning processes. For this reason, participation should be treated as a planning and interface-design challenge, not only as a visualization feature.
4.4. Validation Maturity and Evidence Strength
The validation results show that contribution type and evidence strength are related but not identical. Applied studies are mostly supported by empirical case studies, prototype studies are mostly supported by limited tests or demonstrations, and conceptual studies are mostly located at the illustrative validation level. This distinction matters because a conceptual framework, a prototype, an empirical case study, and an operational platform do not provide the same kind of evidence.
The conceptual planning/governance studies show why conceptual contributions were retained in the corpus when they were operationally structured. These studies do not merely discuss smart cities in general; they define frameworks, data models, regulatory logics, or decision-support structures for UAV airspace governance, 3D land-use regulation, IMM/SDG11-based urban performance, smart park management, CIM-based urban renewal, and planning-permit support [55,69,91,132,150,255]. At the same time, they also show the gap between planning ambition and operational maturity. Most of these papers describe what a planning-support or governance-oriented CIM framework should contain but do not validate it through a fully implemented planning process. This explains why conceptual studies remain relevant to the review, while still appearing mainly at lower validation levels.
Strategic planning studies show a related pattern. Some contributions are applied to real cases and produce maps, scenarios, or platform outputs, while others remain conceptual structures or first-stage prototypes. The Paranoá IMM-UDT case links spatial diagnosis, KPI mapping, and scenario simulation for informal-settlement regeneration, while the Draguć UDT integrates 3D survey data, cadastral ownership, historical records, and planning datasets for small historic-town regeneration. Other studies propose IMM/SDG11 data models, park information modeling, and lighting-planning digital twins [51,91,132,144,156]. These studies show that strategic CIM/UDT work often begins by organizing indicators, stakeholders, actions, scenarios, and governance logic. However, their maturity varies, with several contributions remaining conceptual or prototype-based and still requiring stronger validation, institutional adoption, and long-term data updating.
The operationally stronger examples in the corpus are mostly platforms, standards, dashboards, or data infrastructures that support repeated use rather than isolated modeling exercises. PLATEAU’s SDPS-3DCM reports municipal adoption of standardized 3D city model specifications across Japanese cities. Snap4City appears in semantic big-data ingestion and mobility decision-support architectures, with large-scale real-time data handling, scenario workflows, and city-scale deployments. The Cedar Key UDT dashboard was used in task-force meetings, public workshops, and hurricane-preparation contexts. Other operational examples include graph-based CityGML change interpretation for large-scale model maintenance and the ACTIVe3D/SIGA3D ontology-based BIM-GIS platform for urban facility management [35,37,106,135,193,321,355]. These cases show what higher validation maturity looks like in CIM-related research: standardization, repeated deployment, stakeholder use, platform operation, large-scale implementation, or multi-case operational use. At the same time, their reported limitations show that operational maturity still depends on data maintenance, dynamic reasoning, computational scalability, standards migration, privacy, accessibility, semantic interoperability, and human interpretation of decision outputs.
4.5. CIM and Urban Digital Twins: Static, Dynamic, and Real-Time Evidence
The temporal results show that dynamic modeling and real-time digital twin operation should not be treated as the same. Several environmental and energy studies use hourly, monthly, annual, scenario-based, or future-climate simulations, but they do not necessarily implement live feedback from the physical environment. Their workflows are dynamic in the sense of temporal modeling or scenario analysis, not necessarily in the sense of real-time monitoring [33,46,94,130,305]. A smaller number of studies include monitored, sensor-based, or more frequently updated environmental data, but full continuous feedback remains less common [71,137,267,317,353]. This supports the need to distinguish between dynamic simulation, monitored data use, and fully operational feedback-based digital twin workflows, rather than relying only on whether a paper uses the digital twin label.
Many applied data-infrastructure studies remain static. They demonstrate real datasets, APIs, geodatabases, CityGML/ADE schemas, semantic enrichment workflows, or multi-source integration pipelines, but they do not implement dynamic updating or live data integration. Several studies mention temporal support, real-time extension, automated updating, web-service expansion, or operational digital-twin functionality as future work rather than as part of the implemented workflow. This supports the distinction between a structured CIM-related information base and a feedback-based urban digital twin workflow with continuous monitoring, updating, or live data exchange. In these studies, the information infrastructure is empirically implemented and validated, while the dynamic feedback layer remains absent or incomplete [49,76,105,110,124,143,153,168,176,184,239,316,350].
Real-time or near-real-time CIM/UDT workflows depend less on visualization alone and more on data ingestion, indexing, time-series storage, sensor connection, and service architecture. Snap4City’s semantic ingestion architecture combines ontology-based enrichment, context brokers, OpenSearch/Kafka storage, and large-scale message processing. Its mobility architecture uses scenario copies, real-time and historical mobility data, traffic reconstruction, KPI calculation, and optimization workflows. Other applied examples show the same technical requirement in different domains: the Huelva outdoor thermal-comfort UDT links weather-station data, PostGIS/GeoServer services, UMEP simulations, and CesiumJS visualization; the BIM-GIS disaster-management digital twin connects fire sensors, BIM/GIS data, evacuation routing, and dispatch support; and the campus energy digital twin integrates real-time sensors, WiFi occupancy, energy simulations, and dashboard visualization [102,106,135,140,318]. These examples suggest that real-time or near-real-time CIM/UDT workflows require more than a 3D model. They require data infrastructures capable of handling changing urban data, sensor inputs, model outputs, and service-based visualization or decision support.
The conceptual planning-support papers also show why temporal aspect and dynamic data use had to be coded separately. Some papers include dynamic or real-time ideas, such as UAV risk layers, IMM/SDG11 performance logic, IoT-enabled park governance, or CIM-based urban renewal with sensing and data-mining components. However, these elements are usually proposed as part of the framework rather than implemented as a live operational workflow. In such cases, dynamic data use is better understood as a proposed capacity or architectural requirement, not as a fully implemented digital-twin feedback system [55,91,132,150].
4.6. Interoperability, Standardization, and Tooling Conditions
Interoperability appears in the extracted studies as a practical implementation condition rather than only a general technical challenge. The papers show repeated problems around CityGML/CityJSON exchange, BIM-GIS conversion, ADE and schema development, database integration, semantic enrichment, topological alignment, and transfer between BIM, GIS, database, point-cloud, and web-visualization environments. Some studies report schema or reference-system problems, while others point to semantic loss, manual conversion, incomplete automation, or limits in current database and visualization tools. These examples suggest that CIM-related workflows cannot be evaluated only by whether they produce a 3D model; they also need to be assessed by how well data can be exchanged, queried, updated, and reused across systems [108,110,124,176].
CityGML and related semantic city-model structures appear repeatedly across different application areas. They are used for national 3D city model access, semantic enrichment, road-space modeling, land-cover representation, underground land administration, utility-network modeling, geodatabase management, and simulation data management. This repeated use suggests that CityGML-based structures are not limited to visualization. They also provide a common technical basis for storing semantic attributes, linking city objects to external information, supporting database workflows, and preparing data for simulation, querying, or decision-support tasks [49,64,110,124,143,153,316,350].
Infrastructure-oriented CIM studies show that interoperability becomes more demanding when the model must represent roads, bridges, tunnels, utility networks, subsurface resources, or underground legal and physical spaces. The reviewed examples use IFC-CityGML schema mapping, CityGML 3.0 streetspace modules, Utility Network ADEs, SURBIM concepts, BIM-GIS conversion, intermediate data formats, database extensions, and shared utility data models to represent infrastructure information [97,124,153,218,221,270,316]. These studies support the interpretation that infrastructure planning often depends first on building a reliable semantic and spatial information backbone. However, their reported limitations show continuing problems with engineering semantics, network topology, incomplete underground data, data ownership, standardization, conversion loss, and condition-data availability. This makes infrastructure CIM a data-governance and interoperability problem as much as a modeling problem.
Energy and environmental CIM-related studies show that environmental and energy workflows often require a semantic data-exchange layer before simulation inputs and outputs can become reusable across tools. Several papers focus less on the simulation method itself and more on how inputs, outputs, and domain concepts can be structured through CityGML, ADEs, 3DCityDB, web services, gateways, and data access layers. The FWE ADE extends CityGML toward food, water, and energy flows; the EnvPlan ADE integrates BIM construction data with GIS-based environmental planning objects; CI-NERGY connects heterogeneous city data and energy simulations through a service architecture; the CitySim–Energy ADE gateway maps energy simulation data back into CityGML; and the DAL links semantic 3D city models with domain simulation tools [213,215,268,290,307]. These studies support the interpretation that environmental CIM depends not only on analytical engines but also on standardized semantic structures that make data and results reusable across tools and institutions.
Visualization-oriented CIM and UDT studies are not limited to the final display of 3D scenes. Several papers show that visualization depends on data-service architecture, dynamic data links, web delivery formats, and preprocessing workflows. Gitahi and Kolbe [68] connect semantic 3D city models, SensorThings API, SUMO simulation outputs, 3D Tiles, CZML, and CesiumJS in a 4D UDT viewer. Oliveira and Rocha [285] test a W3DS service for delivering urban 3D scenes and telecommunications infrastructure through tiled terrain and web clients. Other studies point toward future UDT infrastructure, including an AI-based large flow model for multimodal urban flows and a distributed computing-continuum architecture for UDTs [181,194]. These studies suggest that visualization and governance/monitoring workflows can provide enabling infrastructure rather than direct planning decisions. Their limitations also show that temporal support, data consistency, scalability, privacy, implementation, and validation remain important barriers.
4.7. Operational Gaps and Future Research Agenda
The extracted gap categories are connected rather than isolated. Planning application, data quality, interoperability, dynamic data, validation, and standardization appear repeatedly across the corpus. This suggests that many CIM-related studies face a sequence of linked operational constraints. A workflow may be technically plausible, but it cannot become a reliable planning-support system if the data are incomplete, interoperability is weak, validation is limited, dynamic data are not implemented, or the planning decision is not clearly defined.
Data quality is one of the most repeated operational constraints. Applied and prototype cases show that data quality becomes a bottleneck once CIM-related workflows move beyond conceptual design. Problems appear in different forms: point-cloud quality and terrain-related extraction errors, vertical reference inconsistency, imbalanced training data, occluded or missing visual information, incomplete or ambiguous legal and physical underground data, land-cover classification uncertainty, and CIM visual or image-segmentation limitations. These are not secondary issues, because they directly affect whether the resulting city model, API, ADE, simulation input, or assessment output can be reused for planning, simulation, or management. The extraction therefore suggests that data quality is part of CIM maturity, not only a preprocessing concern [48,49,76,149,153,309].
Although many environmental and energy studies are applied to real cases, their reliability remains strongly tied to data quality, calibration, and modeling assumptions. Several studies depend on EPC completeness, LiDAR-derived geometry, simplified LoD models, assumed building or envelope parameters, estimated window/façade properties, weather-input choices, vegetation or obstruction modeling, and the availability of measured validation data. This means that applied simulation does not remove uncertainty; it shifts the problem toward data completeness, calibration, input-data transparency, and the assumptions used in the model [94,100,113,130,236,257,267].
Automation and generation form a smaller but important direction in CIM-related research. The reviewed examples show that W5 workflows are mostly connected to parametric design, generative design, and planning optimization rather than to fully operational automated city-scale planning systems. They include CityGML-based dormitory allocation using system dynamics and genetic algorithms, GAN-based design widgets in Virtual Singapore, zoning-based densification massing, parametric form-based code modeling, grammar-based CIM design platforms, and parametric redevelopment scenario generation [54,58,233,254,265,286]. These studies show that automation can support early-stage scenario generation, allocation, and design comparison, but they also show limits related to data completeness, manual linking, platform access, validation, and stakeholder interpretation. Future work should therefore treat automation not only as a modeling technique but as a workflow that depends on reliable planning rules, structured geospatial data, and testing in real planning settings.
Future CIM-related research should report workflow logic more explicitly. This includes data sources, transformation steps, integration methods, toolchains, spatial scale, validation evidence, and limitations. For planning-oriented studies, it is also important to state what decision is supported, who uses the output, and whether the workflow was tested in a real planning or management setting. This would make future studies easier to compare and would reduce ambiguity between conceptual frameworks, prototype demonstrations, applied case studies, and operational systems.
4.8. Limitations of the Review
This review has some limitations that should be considered. The search strategy was expanded beyond the exact term “city information model”, but it was still limited to Scopus and Web of Science, English-language records, and selected document types. Relevant work using other terminology, indexed in other databases, or published in professional reports may therefore be missing. Snowballing was used as a supplementary source stream, but it was not designed as a full citation-network expansion.
The full-text extraction was based on 306 accessible database records and 8 eligible snowballing studies. Records that could not be accessed in full text were retained for transparency but not used in the detailed operational extraction. This means that the extraction-based findings reflect the final full-text extractable corpus rather than all screening-included records.
Another limitation is related to classification. The review used predefined categories for workflow, analytical function, planning domain, planning process type, scale, validation, temporal aspect, tooling, and gap type. Some studies combined several workflows or planning domains in one paper. The primary code therefore represents the main intended contribution of each study, not every secondary component. Tool categories and gap types were also non-exclusive, so their counts should be read as recurring patterns rather than mutually exclusive classifications.
Finally, some fields required interpretive judgment, especially planning process type, scale operationalization, temporal aspect, dynamic data use, replicability, and gap type. A second reviewer checked the key categorical variables, and disagreements were reviewed before final analysis. Even so, some residual interpretation is unavoidable in a heterogeneous CIM-related corpus. For this reason, the results should be read as a structured operational synthesis of the reviewed corpus rather than a complete representation of all CIM-related research.
5. Conclusions
This review examined CIM-related research through an operational extraction framework that covered contribution maturity, workflow type, analytical function, planning domain, planning process type, spatial scale, validation level, temporal aspect, dynamic data use, tooling, and reported gaps. The final full-text extractable corpus included 314 studies, consisting of 306 accessible database records and 8 eligible snowballing records. The reviewed corpus shows that CIM-related research is not organized under one stable term. It is distributed across studies using CIM, BIM-GIS, GeoBIM, 3D city models, semantic city models, CityGML/CityJSON, smart city models, and urban digital twin terminology. The common point across these studies is not the label itself but the use of structured city-scale information to support data integration, simulation, visualization, monitoring, or planning-related analysis.
The results show that CIM-related studies are concentrated mainly in three operational directions: data integration, simulation, and planning/governance support. Data integration studies provide the information backbone through BIM-GIS integration, semantic 3D city models, CityGML/CityJSON, ADEs, databases, APIs, and interoperability workflows. Simulation studies use these data structures for environmental, energy, flood, mobility, carbon, thermal, and other performance analyses. Planning/governance studies connect model outputs to decision-support, monitoring, permit checking, participation, asset management, resilience planning, or urban management tasks. These directions are linked rather than separate, since simulation and planning-support workflows often depend on prior data structuring and interoperability.
The review also shows that planning relevance takes both direct and indirect forms. Some studies directly support planning decisions through dashboards, scenario testing, permit checking, resilience assessment, mobility planning, energy-retrofit prioritization, asset management, and public participation tools. Other studies support planning indirectly by developing semantic models, data standards, integration pipelines, geodatabases, visualization environments, or technical infrastructures that make later analysis possible. This distinction is important because not every CIM-related workflow becomes a planning-support system, even when it is applied in an urban context.
Validation and maturity remain uneven across the corpus. Applied studies form the largest contribution group and are mostly supported by empirical case studies, while prototype studies are mainly supported by limited tests or demonstrations. Conceptual studies remain important when they provide structured and codeable frameworks, ontologies, architectures, or data models, but they usually provide lower levels of validation. Operational or practice-based validation appears much less often than empirical case-study validation. This indicates that CIM-related research has moved beyond purely conceptual discussion in many areas, but routine institutional use, long-term deployment, and repeated operational validation are still limited.
The temporal and dynamic data results also clarify the relationship between CIM and urban digital twins. Many studies include dynamic, scenario-based, or time-dependent analysis, but fewer implement real-time or near-real-time data use. Some studies using urban digital twin terminology remain static or only partially dynamic, while other CIM or 3D city model studies include temporal or update-oriented components. This shows that the digital twin label alone is not enough to classify operational maturity. A clearer distinction is needed between static information models, dynamic simulation workflows, monitored data use, and feedback-based digital twin systems.
The main operational gaps identified in the review concern planning application, data quality, interoperability, dynamic data, validation, standardization, replicability, tooling, scale, governance, conceptual-to-operational transition, and automation. These gaps are connected. A technically plausible workflow cannot become reliable planning support if data are incomplete, interoperability is weak, validation is limited, dynamic data are absent, or the decision context is unclear. Future CIM-related research should therefore report workflow logic more explicitly, document data and tool pipelines, clarify the scale of operation, distinguish static and dynamic claims, validate conceptual and prototype frameworks through real cases, and show how model outputs are used by planners, stakeholders, or institutions. In this way, CIM research can move from fragmented technical development toward more transparent, reusable, and planning-oriented urban information systems.
Supplementary Materials
The following supporting information can be downloaded at: https://www.mdpi.com/article/10.3390/buildings16132573/s1, Supplementary Material S1: Full Search Strategy; Supplementary Material S2: Study-Level Included Studies Table for the CIM Systematic Review; PRISMA 2020 checklist.
Author Contributions
Conceptualization, A.T.Y.A.; methodology, A.T.Y.A. and Ö.E.; formal analysis, A.T.Y.A.; investigation, A.T.Y.A.; data curation, A.T.Y.A.; writing—original draft preparation, A.T.Y.A.; writing—review and editing, A.T.Y.A. and Ö.E.; visualization, A.T.Y.A.; supervision, Ö.E. All authors have read and agreed to the published version of the manuscript.
Funding
This research received no external funding.
Data Availability Statement
The full search strategy and study-level included studies table are provided as Supplementary Materials S1 and S2. The detailed review dataset and extraction workbook are available to reviewers during the review process and may be provided by the corresponding author upon reasonable request.
Acknowledgments
This research builds upon one chapter of an ongoing Ph.D. thesis prepared by Abdalrahman T. Y. Alashi and supervised by Özhan Ertekin at Istanbul Technical University, Department of Urban and Regional Planning. The authors would like to acknowledge the institutional support provided by Istanbul Technical University during the preparation of this study. The authors also thank Abeer Al-Shater for her valuable academic support and guidance. The authors thank Amr Abouseif for his professional support during the screening process and for providing BIM-related feedback on the coding framework and classification decisions. The authors also thank Deborah Kennedy for her helpful reading of the manuscript and language-related comments.
Conflicts of Interest
The authors declare no conflicts of interest.
Abbreviations
The following abbreviations are used in this manuscript:
| 3DCityDB | 3D City Database |
| ADE | Application Domain Extension |
| AI | Artificial Intelligence |
| API | Application Programming Interface |
| BIM | Building Information Modeling |
| BSMS | Bibliometric Analysis, Systematic Review, Meta-Analysis, and Storytelling |
| CAD | Computer-Aided Design |
| CFD | Computational Fluid Dynamics |
| CIM | City Information Modeling |
| CityGML | City Geography Markup Language |
| DBMS | Database Management System |
| DEM | Digital Elevation Model |
| DSM | Digital Surface Model |
| DTM | Digital Terrain Model |
| EPC | Energy Performance Certificate |
| FME | Feature Manipulation Engine |
| GIS | Geographic Information System |
| IFC | Industry Foundation Classes |
| IoT | Internet of Things |
| JSON | JavaScript Object Notation |
| LCA | Life Cycle Assessment |
| LoD | Level of Detail |
| OGC | Open Geospatial Consortium |
| OSM | OpenStreetMap |
| PRISMA | Preferred Reporting Items for Systematic Reviews and Meta-Analyses |
| PV | Photovoltaic |
| RDF | Resource Description Framework |
| UBEM | Urban Building Energy Modeling |
| UCIM | Unified City Information Modeling |
| UDT | Urban Digital Twin |
| UHI | Urban Heat Island |
| UML | Unified Modeling Language |
| UAV | Unmanned Aerial Vehicle |
| VGI | Volunteered Geographic Information |
| VR | Virtual Reality |
| VOSviewer | Visualization of Similarities viewer |
| XML | Extensible Markup Language |
Appendix A. Search Queries
Table A1.
Summary of database search strategy.
Appendix B. Additional Results Tables
Table A2.
Cross-tabulation of workflow categories (W1–W6) and reported tool categories across the full-text extractable corpus.
Table A3.
Cross-tabulation of primary analytical functions (A1–A7) and reported tool categories across the full-text extractable corpus.
Table A4.
Technical setup reporting by workflow category ().
Table A5.
Cross-tabulation of operational gap types and workflow categories (W1–W6).
References
- Xu, X. From cloud computing to cloud manufacturing. Robot. Comput.-Integr. Manuf. 2014, 28, 75–86. [Google Scholar] [CrossRef] [Scilit]
- Kolbe, T.H. Representing and exchanging 3D city models with CityGML. In 3D Geo-Information Sciences; Lee, J., Zlatanova, S., Eds.; Springer: Berlin/Heidelberg, Germany, 2009; pp. 15–31. [Google Scholar] [CrossRef] [Scilit]
- Gröger, G.; Plümer, L. CityGML–Interoperable semantic 3D city models. ISPRS J. Photogramm. Remote Sens. 2012, 71, 12–33. [Google Scholar] [CrossRef] [Scilit]
- Biljecki, F.; Stoter, J.; Ledoux, H.; Zlatanova, S.; Çöltekin, A. Applications of 3D city models: State of the art review. ISPRS Int. J. Geo-Inf. 2015, 4, 2842–2889. [Google Scholar] [CrossRef] [Scilit]
- Deng, Y.; Cheng, J.C.P.; Anumba, C. Mapping between BIM and 3D GIS in different levels of detail using schema mediation and instance comparison. Autom. Constr. 2016, 67, 1–21. [Google Scholar] [CrossRef] [Scilit]
- Zhu, J.; Wright, G.; Wang, J.; Wang, X. A critical review of the integration of geographic information system and building information modelling at the data level. ISPRS Int. J. Geo-Inf. 2018, 7, 66. [Google Scholar] [CrossRef] [Scilit]
- Noardo, F.; Harrie, L.; Arroyo Ohori, K.; Biljecki, F.; Ellul, C.; Krijnen, T.; Stoter, J. Tools for BIM-GIS integration (IFC georeferencing and conversions): Results from the GeoBIM benchmark 2019. ISPRS Int. J. Geo-Inf. 2020, 9, 502. [Google Scholar] [CrossRef] [Scilit]
- Liu, X.; Wang, X.; Wright, G.; Cheng, J.C.; Li, X.; Liu, R. A state-of-the-art review on the integration of Building Information Modeling (BIM) and Geographic Information System (GIS). ISPRS Int. J. Geo-Inf. 2017, 6, 53. [Google Scholar] [CrossRef] [Scilit]
- Azari, P.; Li, S.; Shaker, A. An effective approach to geometric and semantic BIM/GIS data integration for urban digital twin. ISPRS Int. J. Geo-Inf. 2025, 14, 478. [Google Scholar] [CrossRef] [Scilit]
- Batty, M.; Axhausen, K.W.; Giannotti, F.; Pozdnoukhov, A.; Bazzani, A.; Wachowicz, M.; Portugali, Y. Smart cities of the future. Eur. Phys. J. Spec. Top. 2012, 214, 481–518. [Google Scholar] [CrossRef] [Scilit]
- Kitchin, R. The real-time city? Big data and smart urbanism. GeoJournal 2014, 79, 1–14. [Google Scholar] [CrossRef] [Scilit]
- Fuller, A.; Fan, Z.; Day, C.; Barlow, C. Digital twin: Enabling technologies, challenges and open research. IEEE Access 2020, 8, 108952–108971. [Google Scholar] [CrossRef] [Scilit]
- Shahat, E.; Hyun, C.T.; Yeom, C. City digital twin potentials: A review and research agenda. Sustainability 2021, 13, 3386. [Google Scholar] [CrossRef] [Scilit]
- Boccardo, P.; La Riccia, L.; Yadav, Y. Urban echoes: Exploring the dynamic realities of cities through digital twins. Land 2024, 13, 635. [Google Scholar] [CrossRef] [Scilit]
- Souza, L.; Bueno, C. City Information Modelling as a support decision tool for planning and management of cities: A systematic literature review and bibliometric analysis. Build. Environ. 2022, 207, 108403. [Google Scholar] [CrossRef] [Scilit]
- Omrany, H.; Ghaffarianhoseini, A.; Ghaffarianhoseini, A.; Clements-Croome, D.J.; Tookey, J. The uptake of City Information Modelling (CIM): A comprehensive review of current implementations, challenges and future outlook. Smart Sustain. Built Environ. 2023, 12, 1090–1116. [Google Scholar] [CrossRef] [Scilit]
- Yu, W.; Zhou, X.; Wang, D.; Dong, J. The development and construction of city information modeling (CIM): A survey from data perspective. Appl. Sci. 2025, 15, 4696. [Google Scholar] [CrossRef] [Scilit]
- Jeddoub, I.; Nys, G.-A.; Hajji, R.; Billen, R. Digital twins for cities: Analyzing the gap between concepts and current implementations with a specific focus on data integration. Int. J. Appl. Earth Obs. Geoinf. 2023, 122, 103440. [Google Scholar] [CrossRef] [Scilit]
- Lei, B.; Janssen, P.; Stoter, J.; Biljecki, F. Challenges of urban digital twins: A systematic review and a Delphi expert survey. Autom. Constr. 2023, 147, 104716. [Google Scholar] [CrossRef] [Scilit]
- Deprêtre, A.; Jacquinod, F.; Mielniczek, A. Exploring digital twin adaptation to the urban environment: Comparison with CIM to avoid silo-based approaches. ISPRS Ann. Photogramm. Remote Sens. Spat. Inf. Sci. 2022, 4, 337–344. [Google Scholar] [CrossRef] [Scilit]
- Masoumi, H.; Shirowzhan, S.; Eskandarpour, P.; Pettit, C.J. City digital twins: Their maturity level and differentiation from 3D city models. Big Earth Data 2023, 7, 1–36. [Google Scholar] [CrossRef] [Scilit]
- Boje, C.; Guerriero, A.; Kubicki, S.; Rezgui, Y. Towards a semantic construction digital twin: Directions for future research. Autom. Constr. 2020, 114, 103179. [Google Scholar] [CrossRef] [Scilit]
- Shariatpour, F.; Behzadfar, M.; Zareei, F. Urban 3D Modeling as a Precursor of City Information Modeling and Digital Twin for Smart City Era: A Case Study of the Narmak Neighborhood of Tehran City, Iran. J. Urban Plan. Dev. 2024, 150, 04024005. [Google Scholar] [CrossRef] [Scilit]
- Gil, J. City information modelling: A conceptual framework for research and practice in digital urban planning. Built Environ. 2020, 46, 501–527. [Google Scholar] [CrossRef] [Scilit]
- Cureton, P.; Hartley, E. City information models (CIMs) as precursors for urban digital twins (UDTs): A case study of Lancaster. Front. Built Environ. 2023, 9, 1048510. [Google Scholar] [CrossRef] [Scilit]
- Okonta, E.D.; Rahimian, F.; Sheikhkhoshkar, M.; Rodriguez Trejo, S. Future directions and research gaps in City Information Modelling (CIM). Smart Sustain. Built Environ. 2025, ahead-of-print. [Google Scholar] [CrossRef] [Scilit]
- Mora, L.; Bolici, R.; Deakin, M. The first two decades of smart-city research: A bibliometric analysis. J. Urban Technol. 2017, 24, 3–27. [Google Scholar] [CrossRef] [Scilit]
- Syed Abdul Rahman, S.A.F.; Abdul Maulud, K.N.; Ujang, U.; Wan Mohd Jaafar, W.S.; Shaharuddin, S.; Ab Rahman, A.A. The digital landscape of smart cities and digital twins: A systematic literature review of digital terrain and 3D city models in enhancing decision-making. SAGE Open 2024, 14, 21582440231220768. [Google Scholar] [CrossRef] [Scilit]
- Abusaada, H.; Elshater, A. Notes on developing research review in urban planning and urban design based on PRISMA statement. Soc. Sci. 2022, 11, 391. [Google Scholar] [CrossRef] [Scilit]
- Page, M.J.; McKenzie, J.E.; Bossuyt, P.M.; Boutron, I.; Hoffmann, T.C.; Mulrow, C.D.; Moher, D. The PRISMA 2020 statement: An updated guideline for reporting systematic reviews. BMJ 2021, 372, n71. [Google Scholar] [CrossRef] [Scilit] [PubMed]
- Elshater, A.; Abusaada, H. Developing process for selecting research techniques in urban planning and urban design with a PRISMA-compliant review. Soc. Sci. 2022, 11, 471. [Google Scholar] [CrossRef] [Scilit]
- Okonta, E.D.; Rahimian, F.; Rodriguez, S. A Proposed Framework for Enhanced Interoperability in Smart Cities Through Unified City Information Modeling (UCIM). In The International Conference of Sustainable Development and Smart Built Environments, Auckland, New Zealand, 7–9 November 2024; Springer Nature: Singapore, 2024; pp. 95–104. [Google Scholar] [CrossRef] [Scilit]
- Ramnarine, I.D.; Sherif, T.A.; Alorabi, A.H.; Helmy, H.; Yoshida, T.; Murayama, A.; Yang, P.P. Urban revitalization pathways toward zero carbon emissions through systems architecting of urban digital twins. Environ. Plan. B Urban Anal. City Sci. 2025, 52, 1920–1948. [Google Scholar] [CrossRef] [Scilit]
- Çıtıpıtıoğlu, A.; Balkaya, C. A Framework for Rapid Vulnerability Assessment of Building Stock Utilizing Critical Seismic Wall Index Calculated via BIM Integrated into GIS for Prioritization of Seismic Risk to Avoid Demolition for Sustainable Cities. Buildings 2025, 15, 3292. [Google Scholar] [CrossRef] [Scilit]
- Kurokawa, C.; Minegami, Y.; Anzai, S.; Sogawa, Y.; Sekimoto, Y. Development of the Standard Data Product Specification for 3D City Models Using CityGML. ISPRS Ann. Photogramm. Remote Sens. Spat. Inf. Sci. 2025, 10, 129–136. [Google Scholar] [CrossRef] [Scilit]
- Lawal, O.O.; Nawari, N.O. Blockchain-enabled city information modeling framework for urban asset management. J. Archit. Eng. 2024, 30, 04024020. [Google Scholar] [CrossRef] [Scilit]
- Chen, C.; Han, Y.; Galinski, A.; Calle, C.; Carney, J.; Ye, X.; van Westen, C. Integrating urban digital twin with cloud-based geospatial dashboard for coastal resilience planning: A case study in florida. J. Plan. Educ. Res. 2025, 45, 743–759. [Google Scholar] [CrossRef] [Scilit]
- Krischler, J.; Schuler, P.C.; Taraben, J.; Koch, C. Using ICDD for BIM and GIS Integration in Infrastructure. In Proceedings of Linked Data in Architecture and Construction 2024 (LDAC 2024), Bochum, Germany, 13–14 June 2024; CEUR-WS: Skövde, Sweden, 2024; Volume 3824, pp. 118–132. Available online: https://linkedbuildingdata.net/ldac2024/files/papers/LDAC2024_Camera_12.pdf (accessed on 8 May 2026).
- Balletti, C.; Berto, L.; Breggion, E.; Faccio, P.; Guerra, F.; Martinelli, G.D.; Rocca, I.; Saetta, A.; Talledo, D. An interpretative model for seismic risk: The case of Fiumefreddo Bruzio in Southern Italy. Procedia Struct. Integr. 2026, 78, 1823–1830. [Google Scholar] [CrossRef] [Scilit]
- Faiad, A.A.; Abdel-Ghany, S.M.; Ayachi, M.; Ahmed, S. City scale digital twins for mobility emissions evaluation. In 2023 International Wireless Communications and Mobile Computing (IWCMC); IEEE: Piscataway, NJ, USA, 2023; pp. 1166–1171. [Google Scholar] [CrossRef] [Scilit]
- Veisi, O.; Shakibamanesh, A. The application of CIM and BIM to the simulation of energy in urban superblocks; an effort to develop the initial digital twins (case studies: Kermanshah, iran). In Urban Commons, Future Smart Cities and Sustainability; Springer International Publishing: Cham, Switzerland, 2023; pp. 733–760. [Google Scholar] [CrossRef] [Scilit]
- Ali, Z.; Traoré, M.K. A holistic approach to multi-scale and multi-perspective urban digital twin development. Comput. Environ. Urban Syst. 2026, 127, 102432. [Google Scholar] [CrossRef] [Scilit]
- Zeng, Q.; Nation, R.T.; Ahmed, H.I.; Ma, H.C.; Zhou, K.; Gu, J.; Yoshida, T.; Murayama, A.; Yang, P.P.J. Enhancing urban heat risk resilience in Tokyo’s Nihonbashi through urban digital twins of 4-step scenario planning. Int. Arch. Photogramm. Remote Sens. Spat. Inf. Sci. 2025, 48, 135–142. [Google Scholar] [CrossRef] [Scilit]
- Vitanova, L.; Petrova-Antonova, D.; Shirinyan, E. Urban digital twin for assessing and understanding urban Heat Island impacts. Urban Clim. 2025, 62, 102530. [Google Scholar] [CrossRef] [Scilit]
- Ping, D.; Li, C.; Yu, X.; Liu, Z.; Tu, R.; Zhou, Y. City-scale information modelling for urban energy resilience with optimal battery energy storages in Hong Kong. Appl. Energy 2025, 378, 124813. [Google Scholar] [CrossRef] [Scilit]
- Harter, H.; Willenborg, B.; Lang, W.; Kolbe, T.H. Climate-neutral municipal building stock-life cycle assessment of large residential building stocks based on semantic 3D city models. Energy Build. 2023, 292, 113141. [Google Scholar] [CrossRef] [Scilit]
- Pantazatou, K.; Kanters, J.; Mattisson, K.; Olsson, P.O.; Harrie, L. Recommendation for Vegetation Information in Semantic 3D City Models Used in Urban Planning Applications. In International 3D GeoInfo Conference; Springer Nature: Cham, Switzerland, 2023; pp. 3–30. [Google Scholar] [CrossRef] [Scilit]
- Kang, T. Scan to BIM mapping process description for building representation in 3D GIS. Appl. Sci. 2023, 13, 9986. [Google Scholar] [CrossRef] [Scilit]
- Baba, H.; Tamura, K.; Inoue, H. Developing a Spatial-ID–BasedWeb API for Serving 3-D City-Model Attributes and Reviewing the Spatial ID Specification. Int. Arch. Photogramm. Remote Sens. Spat. Inf. Sci. 2025, 48, 25–29. [Google Scholar] [CrossRef] [Scilit]
- Bui, H.T.; Nguyen, H.Q. Integrating BIM and GIS to Move Towards CIM: A Case Study on Integration Information of Building Permit and 3D GIS in Construction Supervision of Hue City. In International Conference on Asian Urbanization Forging a Livable and Sustainable Urban Future; Springer Nature: Singapore, 2024; pp. 453–465. [Google Scholar] [CrossRef] [Scilit]
- Dong, T.; Tadi, M. Digital Twin-Assisted Urban Resilience: A Data-Driven Framework for Sustainable Regeneration in Paranoá, Brasilia. Urban Sci. 2025, 9, 333. [Google Scholar] [CrossRef] [Scilit]
- Syed Abdul Rahman, S.A.F.; Abdul Maulud, K.N.; Ujang, U.; Wan Mohd Jaafar, W.S.; Kuok Choy, L.; Syed Mustorpha, S.N.A. Optimizing 3D Urban Modelling: Integrating Land Lot and Building Footprint Geometries in Dual-Iteration Morphometric Algorithms. Int. Arch. Photogramm. Remote Sens. Spat. Inf. Sci. 2026, 48, 331–337. [Google Scholar] [CrossRef] [Scilit]
- Carolini, U.F.; Loconte, D.; Loseto, G.; Scioscia, F. A Simulation-as-a-Service Engine for Urban Mobility Digital Twins. In The Inclusive Web: Realizing Safe, Accessible, Inclusive, and Sustainable Web Engineering. ICWE 2025. Communications in Computer and Information Science; Hsu, Y.C., Systä, K., Ko, I.Y., Gramegna, F., Eds.; Springer: Cham, Switzerland, 2026; Volume 2735. [Google Scholar] [CrossRef] [Scilit]
- Wang, H.; Hijazi, I.; Donaubauer, A.; Kolbe, T.H. Optimizing urban layout: A system dynamics, artificial intelligence, and 3D urban information model approach for active management of city complexity. ISPRS Ann. Photogramm. Remote Sens. Spat. Inf. Sci. 2024, 10, 317–324. [Google Scholar] [CrossRef] [Scilit]
- Stelmach-Fita, B. Smart Cities and U-space. Preparing for UAV operations in urban airspace. Bull. Geogr. Socio-Econ. Ser. 2025, 70, 19–42. [Google Scholar] [CrossRef] [Scilit]
- Lei, B.; Liang, X.; Biljecki, F. Integrating human perception in 3D city models and urban digital twins. ISPRS Ann. Photogramm. Remote Sens. Spat. Inf. Sci. 2024, 10, 211–218. [Google Scholar] [CrossRef] [Scilit]
- Mrosla, L.; Petrova-Antonova, D.; Malinov, S.; Fabritius, H. Urban vegetation semantics in CityGML: Key stakeholder survey findings and vegetation ADE development. Int. J. Appl. Earth Obs. Geoinf. 2026, 146, 105043. [Google Scholar] [CrossRef] [Scilit]
- Nazim, I.B.R.A.H.I.M.; Joyce, S.C. Urban analytics and generative deep learning for context responsive design in digital twins. In Proceedings of the 29th International Conference of the Association for Computer Aided Architectural Design Research in Asia (CAADRIA) 2024; Association for Computer-Aided Architectural Design Research in Asia (CAADRIA): Hong Kong, 2024; Volume 2, pp. 495–504. [Google Scholar] [CrossRef] [Scilit]
- Pan, X.; Mavrokapnidis, D.; Ly, H.T.; Mohammadi, N.; Taylor, J.E. Assessing and forecasting collective urban heat exposure with smart city digital twins. Sci. Rep. 2024, 14, 9653. [Google Scholar] [CrossRef] [Scilit] [PubMed]
- Wang, L.; Wu, Z.; Zhang, W.; Wang, X.; Feng, W. Dynamic life cycle environmental impact assessment for urban built environment based on BIM and GIS. Energy Build. 2025, 333, 115445. [Google Scholar] [CrossRef] [Scilit]
- Ene, A.; Badea, A.C.; Badea, G.; Grădinaru, A.P. Development of Urban Digital Twins Using GIS and Game Engine Systems. Land 2026, 15, 254. [Google Scholar] [CrossRef] [Scilit]
- Jayachandran, N.; Abdrabou, A.; Al Bataineh, M.; Noordin, K.A. An Architecture and Realisation of a Smart City Digital Twin with eHealth Case Studies. IET Smart Cities 2025, 7, e70006. [Google Scholar] [CrossRef] [Scilit]
- Jiang, Y.; Cheng, M.; Pan, S.; Liu, X.; Geng, Z.; Gao, H.O. Digital twin-augmented spatio-temporal bayesian nowcasting model for emissions accounting in complex urban grid systems. Inf. Sci. 2025, 122918. [Google Scholar] [CrossRef] [Scilit]
- Kanna, K.; Kolbe, T.H. Automatic Enrichment of Semantic 3D City Models using Large Language Models. ISPRS Ann. Photogramm. Remote Sens. Spat. Inf. Sci. 2025, 10, 105–112. [Google Scholar] [CrossRef] [Scilit]
- Tsikas, P.; Chassiakos, A.; Papadimitropoulos, V. Watershed-BIM Integration for Urban Flood Resilience: A Framework for Simulation, Assessment, and Planning. Sustainability 2025, 17, 7687. [Google Scholar] [CrossRef] [Scilit]
- Matsuoka, R.; Takemoto, T.; Takahashi, G.; Inazawa, T.; Sogo, S. Estimation of photovoltaic potential of urban buildings considering a solar panel arrangement using a 3D city model. ISPRS Ann. Photogramm. Remote Sens. Spat. Inf. Sci. 2024, 10, 123–130. [Google Scholar] [CrossRef] [Scilit]
- Lam, P.D.; Gu, B.H.; Lam, H.K.; Ok, S.Y.; Lee, S.H. Digital twin smart city: Integrating IFC and CityGML with semantic graph for advanced 3D city model visualization. Sensors 2024, 24, 3761. [Google Scholar] [CrossRef] [Scilit] [PubMed]
- Gitahi, J.; Kolbe, T.H. Requirements for web-based 4D visualisation of integrated 3D city models and sensor data in urban digital twins. In International 3D GeoInfo Conference; Springer Nature: Cham, Switzerland, 2023; pp. 707–725. [Google Scholar] [CrossRef] [Scilit]
- Emamgholian, S.; Pouliot, J.; Shojaei, D. A conceptual framework for automatic modelling and conflict detection of 3D land-use regulation restrictions to support issuing planning permits. Land Use Policy 2024, 137, 106972. [Google Scholar] [CrossRef] [Scilit]
- Ma, J.; Zhao, C.; Ogawa, Y.; Sekimoto, Y. Predicting Building Height from Footprint and Urban Planning information for Digital Twin Generation. Int. Arch. Photogramm. Remote Sens. Spat. Inf. Sci. 2025, 48, 107–112. [Google Scholar] [CrossRef] [Scilit]
- Ricky, W.; Azri, S.; Ujang, U. Semantic Enrichment of 3D City Models for Sustainable Cooling Analysis: Integrating Building Physics and Thermal Parameters. In 2025 IEEE Asia-Pacific Conference on Geoscience, Electronics and Remote Sensing Technology (AGERS); IEEE: Piscataway, NJ, USA, 2025; pp. 746–752. [Google Scholar] [CrossRef] [Scilit]
- Tassi, C.K.N.; Anicet, B.G.; Limaleba, R.B.; Mouniane, Y. Leveraging City Information Modeling (CIM) and GIS for Sustainable Road Infrastructure: The SIC Housing Access Road in Mfou, Cameroon. In Building Information Modeling and Geographic Information Systems for Next-Generation Spatial Intelligence; IGI Global Scientific Publishing: Hershey, PA, USA, 2026; pp. 83–112. [Google Scholar] [CrossRef] [Scilit]
- Ji, Y.; Wang, Y.; Wei, Y.; Wang, J.; Yan, W. An ontology-based rule mapping approach for integrating IFC and CityGML. Trans. GIS 2024, 28, 675–696. [Google Scholar] [CrossRef] [Scilit]
- Sabri, S.; Alexandridis, K.; Koohikamali, M.; Zhang, S.; Ozkaya, H.E. Designing a spatially-explicit urban digital twin framework for smart water infrastructure and flood management. In 2023 IEEE 3rd International Conference on Digital Twins and Parallel Intelligence (DTPI); IEEE: Piscataway, NJ, USA, 2023; pp. 1–9. [Google Scholar] [CrossRef] [Scilit]
- Bahreini, F.; Nik-Bakht, M.; Hammad, A. Developing Computer Vision-Based Digital Twin for Vegetation Management near Power Distribution Networks. Remote Sens. 2025, 17, 3565. [Google Scholar] [CrossRef] [Scilit]
- Arzoumanidis, L.; Nguyen, S.H.; Johannsen, L.; Rothaut, F.; Li, W.; Dehbi, Y. Object Detection for the Enrichment of Semantic 3D City Models with Roofing Materials. ISPRS Ann. Photogramm. Remote Sens. Spat. Inf. Sci. 2025, 10, 9–16. [Google Scholar] [CrossRef] [Scilit]
- Petrova-Antonova, D.; Stamenov, M. Location-Allocation of Social Amenities Based on Constraint Programming. In International Conference on Computational Science and Its Applications; Springer Nature: Cham, Switzerland, 2025; pp. 438–455. [Google Scholar] [CrossRef] [Scilit]
- Sohaib, M.; Najeeb, A.; Umair, M.; Khan, M.A.; Zubair, M.U.; Jehan, Z.; Khattak, A. Improving urban road infrastructure analysis and design using an integrated BIM-GIS and traffic microsimulation framework. Innov. Infrastruct. Solut. 2024, 9, 285. [Google Scholar] [CrossRef] [Scilit]
- Marrone, P.; Civiero, P.; D’Autilia, R.; Palma, V. A model for the co-production of knowledge in energy-related decision-making processes. TECHNE-J. Technol. Archit. Environ. 2025, 30, 260–268. [Google Scholar] [CrossRef] [Scilit]
- Li, M.; Xue, F.; Yeh, A.G. Efficient and accurate assessment of window view distance using City Information Models and 3D Computer Vision. Landsc. Urban Plan. 2025, 260, 105389. [Google Scholar] [CrossRef] [Scilit]
- McCarthy, M.; Cruz-Neira, C.; Reiners, D. Dynamic Development of Traffic Simulations for Urban Digital Twins. In 2025 Annual Modeling and Simulation Conference (ANNSIM); IEEE: Piscataway, NJ, USA, 2025; pp. 1–11. [Google Scholar]
- Azadi, S.; Kasraian, D.; Nourian, P.; van Wesemael, P. Formalizing-modelling-utilizing ontology: A semantic framework for adaptive stakeholder-specific urban digital twins in urban planning processes. Environ. Plan. B Urban Anal. City Sci. 2026, 53, 804–830. [Google Scholar] [CrossRef] [Scilit]
- Romanengo, C.; Sorgente, T.; Cabiddu, D.; Ghellere, M.; Belussi, L.; Danza, L.; Mortara, M. Geometry-aware estimation of photovoltaic energy from aerial LiDAR point clouds. Comput. Graph. 2025, 104424. [Google Scholar] [CrossRef] [Scilit]
- Liu, Y.; Yang, C.; Zheng, L.; Zhong, Z.; Yu, W. Operation and Maintenance Management of Utility Tunnel Based on Intelligent Systems. In Proceedings of the 2024 International Conference on Cloud Computing and Big Data, Hangzhou, China, 11–13 October 2024; IEEE: Piscataway, NJ, USA, 2024; pp. 610–615. [Google Scholar] [CrossRef] [Scilit]
- Fricke, A.; Döllner, J.; Asche, H.; Isaac, F. Optimising a Virtual 3D City Model for Citizen-Based Urban Development in East Jerusalem. In International Conference on Computational Science and Its Applications; Springer Nature: Cham, Switzerland, 2023; pp. 521–535. [Google Scholar] [CrossRef] [Scilit]
- Aldao, E.; Veiga-Piñeiro, G.; Domínguez-Estévez, P.; Martín, E.; Veiga-López, F.; Fontenla-Carrera, G.; González-Jorge, H. Towards Safer UAV Operations in Urban Air Mobility: 3D Automated Modelling for CFD-Based Microweather Systems. Drones 2025, 9, 730. [Google Scholar] [CrossRef] [Scilit]
- Takahashi, H.; Toyokawa, M.; Kimura, Y.; Yamagata, Y. Achieving Decarbonization and Employee Well-Being in Urban Business Districts: The Nihonbashi Initiative. In Energy Proceedings; Scanditale AB: Stockholm, Sweden, 2025; Volume 55. [Google Scholar] [CrossRef] [Scilit]
- Tran, K.P.; Nguyen, T.D.; Luc, T.T.; Tri, P.L.M.; Tran, P.T. Integrating Port Planning Information into a Web-Based Geographic Information System Platform. In Ports 2025; American Society of Civil Engineers: Reston, VA, USA, 2025; pp. 380–392. [Google Scholar] [CrossRef] [Scilit]
- Hosseingholizadeh, M.; Coors, V.; Ostadabbas, H.; Friesecke, F. Development of QGIS plugin for urban energy simulation using 3D city model at the city district level. ISPRS Ann. Photogramm. Remote Sens. Spat. Inf. Sci. 2023, 10, 81–90. [Google Scholar] [CrossRef] [Scilit]
- Shirinyan, E.; Petrova-Antonova, D. Large-scale solar potential analysis in a 3d cad framework as a use case of urban digital twins. Remote Sens. 2024, 16, 2700. [Google Scholar] [CrossRef] [Scilit]
- Zadeh, H.M.; Lenzi, E.; Dong, T.; Biraghi, C.A.; Pucci, E.; Cerutti, F.; Tadi, M. A conceptual data model for IMM: A methodological interpretation of targets and indicators in SDG11. Sci. Total Environ. 2024, 956, 177269. [Google Scholar] [CrossRef] [Scilit] [PubMed]
- Alva, P.; Mosteiro-Romero, M.; Miller, C.; Stouffs, R. Mitigating operational greenhouse gas emissions in ageing residential buildings using an Urban Digital Twin dashboard. Energy Build. 2024, 322, 114681. [Google Scholar] [CrossRef] [Scilit]
- Jeddoub, I.; Roquet, M.; Oudadda, Y.; Hajji, R.; Dewallef, P.; Billen, R. A Lightweight Framework for Seamless Integration of Building Energy Simulations into Urban Digital Twins. Int. Arch. Photogramm. Remote Sens. Spat. Inf. Sci. 2025, 48, 77–84. [Google Scholar] [CrossRef] [Scilit]
- Johari, F.; Shadram, F.; Widén, J. Urban building energy modeling from geo-referenced energy performance certificate data: Development, calibration, and validation. Sustain. Cities Soc. 2023, 96, 104664. [Google Scholar] [CrossRef] [Scilit]
- Wang, X.; Li, S.; Sun, C.; Liu, H. Pre-design Evaluation System for Urban Design Based on the RDF. In 2023 International Conference on Computer, Internet of Things and Smart City (CIoTSC); IEEE: Piscataway, NJ, USA, 2023; pp. 85–91. [Google Scholar] [CrossRef] [Scilit]
- Luo, J.; Liu, P.; Xu, W.; Zhao, T.; Biljecki, F. A perception-powered urban digital twin to support human-centered urban planning and sustainable city development. Cities 2025, 156, 105473. [Google Scholar] [CrossRef] [Scilit]
- El Mekawy, M.; Ismail, H.M. An Evaluation of IFC-CityGML Unidirectional Conversion for Road and Transportation Models. Int. Arch. Photogramm. Remote Sens. Spat. Inf. Sci. 2025, 48, 63–70. [Google Scholar] [CrossRef] [Scilit]
- Patil, N.M.; Maram, B. Digital Twins For Urban Mitigation: Modelling City-Wide Carbon Neutrality Scenarios Via High-Performance Computing (HPC). Int. J. Drug Deliv. Technol. 2026, 16, 833–844. [Google Scholar] [CrossRef] [Scilit]
- Karim, N.I.A.; Bakar, N.S.A.A. Integration of Building Information Modelling with Geographic Information System for Underground Utility Mapping. In E3S Web of Conferences; EDP Sciences: Les Ulis, France, 2026; Volume 683, p. 01023. [Google Scholar] [CrossRef] [Scilit]
- Suppa, A.R.; Bottero, M.C.; Corrado, V.; Dell’Anna, F. District-scale life cycle costing of climate-neutral retrofits, based on automatic envelope detection workflows and LOD3 3D city model. Energy Build. 2026, 359, 117289. [Google Scholar] [CrossRef] [Scilit]
- Ma, F.; Gao, Y.; Zhang, G.; Huang, C.; Chen, W. An underground pipeline relocation decision support system based on BIM and GIS integration. J. Phys. Conf. Ser. 2024, 2824, 012003. [Google Scholar] [CrossRef] [Scilit]
- Lopez-Cabeza, V.P.; Videras-Rodriguez, M.; Gomez-Melgar, S. An Open-Source Urban Digital Twin for Enhancing Outdoor Thermal Comfort in the City of Huelva (Spain). Smart Cities 2025, 8, 160. [Google Scholar] [CrossRef] [Scilit]
- Dan, Z.; Song, A.; Zheng, Y.; Zhang, X.; Zhou, Y. City information models for optimal EV charging and energy-resilient renaissance. Nexus 2025, 2, 100056. [Google Scholar] [CrossRef] [Scilit]
- Liu, Y.; Brembilla, E.; Rafiee, A. Cloud-based application for indoor daylight performance analysis through BIM-GIS Integration. Build. Environ. 2026, 293, 114376. [Google Scholar] [CrossRef] [Scilit]
- Lei, Y.; Bruno, N.; Roncella, R. Integrating 3D survey and open datasets for creating low-cost urban digital twins in VR. Int. Arch. Photogramm. Remote Sens. Spat. Inf. Sci. 2024, 48, 295–302. [Google Scholar] [CrossRef] [Scilit]
- Bellini, P.; Collini, E.; Fanfani, M.; Nesi, P.; Panconi, C. Efficient and Scalable Semantic Data Ingestion for Smart City Digital Twin Platforms. In 2025 IEEE 11th International Conference on Big Data Computing Service and Machine Learning Applications (BigDataService); IEEE: Piscataway, NJ, USA, 2025; pp. 44–51. [Google Scholar] [CrossRef] [Scilit]
- Dai, T.Y.; Niyogi, D.; Nagy, Z. CityTFT: A Temporal Fusion Transformer-Based Twin Model for Urban Building Energy Modeling. In Computing in Civil Engineering 2024; American Society of Civil Engineers: Reston, VA, USA, 2024; pp. 12–21. [Google Scholar] [CrossRef] [Scilit]
- Şenol, H.İ.; Gökgöz, T. Integration of Building Information Modeling (BIM) and Geographic Information System (GIS): A new approach for IFC to CityJSON conversion. Earth Sci. Inform. 2024, 17, 3437–3454. [Google Scholar] [CrossRef] [Scilit]
- Wibisana, M.I.; Koeva, M.; Nourian, P.; Petrova-Antonova, D.; Karamitov, K. A LiDAR-Based Digital Twinning Workflow for Traffic Monitoring and Simulation. ISPRS Ann. Photogramm. Remote Sens. Spat. Inf. Sci. 2024, 10, 411–418. [Google Scholar] [CrossRef] [Scilit]
- Yao, Z.; Nagel, C.; Kendir, M.; Willenborg, B.; Kolbe, T.H. The New 3D City Database 5.0-Advancing 3D City Data Management based on CityGML 3.0. ISPRS Ann. Photogramm. Remote Sens. Spat. Inf. Sci. 2025, 10, 241–248. [Google Scholar] [CrossRef] [Scilit]
- Cárdenas-León, I.; Koeva, M.; Nourian, P.; Davey, C. Urban digital twin-based solution using geospatial information for solid waste management. Sustain. Cities Soc. 2024, 115, 105798. [Google Scholar] [CrossRef] [Scilit]
- Tsiranidou, E.; González-Cabaleiro, P.; Fernández, A.; Díaz-Vilariño, L. A framework for road space extraction from point clouds and integration into 3D city models. Int. J. Appl. Earth Obs. Geoinf. 2025, 143, 104803. [Google Scholar] [CrossRef] [Scilit]
- Matsuoka, R.; Takemoto, T.; Takahashi, G.; Inazawa, T.; Sogo, S. A Novel Algorithm to Estimate Solar Irradiance of Urban Buildings for Photovoltaic Potential Estimation System Using a 3D City Model. ISPRS Ann. Photogramm. Remote Sens. Spat. Inf. Sci. 2024, 10, 115–122. [Google Scholar] [CrossRef] [Scilit]
- Sohail, A.; Shen, B.; Cheema, M.A.; Ali, M.E.; Ulhaq, A.; Babar, M.A.; Qureshi, A. Beyond data, towards sustainability: A sydney case study on urban digital twins. PFG J. Photogramm. Remote Sens. Geoinf. Sci. 2025, 93, 365–377. [Google Scholar] [CrossRef] [Scilit]
- Horst, D.; Ganal, H.; Geiger, D.; Härtel, P.; Dobschinski, J. Integrating Urban Digital Twins and Agent-Based Models for Strategic Grid Expansion in Evolving Urban Energy Networks. In 2025 21st International Conference on the European Energy Market (EEM); IEEE: Piscataway, NJ, USA, 2025; pp. 1–6. [Google Scholar] [CrossRef] [Scilit]
- Duan, L.; Li, B.; Xia, T.; Meng, X. Research on Next Generation O&M Platform for urban Power and Energy Facilities Based on CIM. In 2025 IEEE 9th Conference on Energy Internet and Energy System Integration (EI2); IEEE: Piscataway, NJ, USA, 2025; pp. 3021–3027. [Google Scholar] [CrossRef] [Scilit]
- Liu, Y.; Kang, J. CIM-MARL-based dynamic coupling risk assessment and real-time decision optimization for fire emergencies. In Proceedings of the 13th International Symposium on Project Management (ISPM2025); Aussino Academic Publishing House: Sydney, Australia, 2025; pp. 2116–2126. [Google Scholar] [CrossRef] [Scilit]
- Thao, N.D.; Khoi, T.P.M.; Anh, L.T. BIM-GIS Integration for Port Planning: Case Study of Hai Phong Port Cluster in Vietnam. In International Conference on Civil Engineering and Architecture; Springer Nature: Singapore, 2024; pp. 155–167. [Google Scholar] [CrossRef] [Scilit]
- Sivakumar, A.; Melina JV, T.; Suresh, E.S.M. BIM-GIS integration for efficient management of urban underground stormwater networks. Proc. Inst. Civ. Eng. Smart Infrastruct. Constr. 2025, 178, 186–199. [Google Scholar] [CrossRef] [Scilit]
- Sakamoto, R.; Igeta, Y.; Hamada, T.; Deguchi, A.; Koshizuka, N. A Framework for Analyzing Urban Spaces from Pedestrian Perspectives: Integrating Micro-Scale Trajectories with Digital Twins. In 2025 IEEE International Smart Cities Conference (ISC2); IEEE: Piscataway, NJ, USA, 2025; pp. 1–6. [Google Scholar] [CrossRef] [Scilit]
- Vijaywargiya, J.; Ramiya, A.M. 3D Spatio-Semantic Micro-Morphology for Empirical Decision-Making. In IGARSS 2024-2024 IEEE International Geoscience and Remote Sensing Symposium; IEEE: Piscataway, NJ, USA, 2024; pp. 3564–3567. [Google Scholar] [CrossRef] [Scilit]
- Parezanović, A.; Nadaždi, A.; Isailović, D.; Višnjevac, N.; Petojević, Z. Mapping the urban building stock for a circular economy by integrating GIS and BIM. A case study from Belgrade, Serbia. Resour. Conserv. Recycl. 2025, 215, 108075. [Google Scholar] [CrossRef] [Scilit]
- Santhanavanich, T.; Padsala, R.; Coors, V. An OGC API–Based Framework for Scalable and Interoperable Urban Digital Twin Ecosystems: Insights from the OGC Urban Digital Twins Interoperability Pilot. Int. Arch. Photogramm. Remote Sens. Spat. Inf. Sci. 2025, 48, 135–140. [Google Scholar] [CrossRef] [Scilit]
- Deng, Z.; Hijazi, I.; Kolbe, T.H. CityGML 3.0 as a Hub: Integrating BIM, GIS, and Point Cloud Data for 3D streetspace modeling comprising roads, bridges and tunnels. ISPRS Ann. Photogramm. Remote Sens. Spat. Inf. Sci. 2025, 10, 65–72. [Google Scholar] [CrossRef] [Scilit]
- Syed Abdul Rahman, S.A.F.; Abdul Maulud, K.N.; Ujang, U.; Wan Mohd Jaafar, W.S.; Choy, L.K.; Syed Mustorpha, S.N.A. Investigating the influence of raster DTM bit depth on flood modelling in 3D urban models. J. Kejuruter. 2025, 37, 3543–3553. [Google Scholar] [CrossRef] [Scilit] [PubMed]
- Lis, M.; Mądziel, M. Green Transportation Planning for Smart Cities: Digital Twins and Real-Time Traffic Optimization in Urban Mobility Networks. Appl. Sci. 2026, 16, 678. [Google Scholar] [CrossRef] [Scilit]
- Crampen, D.; Yadav, Y.; Ishar, S.; Zlatanova, S.; Tian, W. Development of 3D UDTs for Traffic Monitoring in Unreal 5 Game Engine. Int. Arch. Photogramm. Remote Sens. Spat. Inf. Sci. 2024, 48, 131–138. [Google Scholar] [CrossRef] [Scilit]
- Lawal, O.O.; Nawari, N.O.; Alsaffar, A. A Blockchain-Enabled Urban Digital Twin: Decentralized Asset Management Using City Information Modeling. In International Conference on Computing in Civil and Building Engineering; Springer Nature: Cham, Switzerland, 2024; pp. 558–570. [Google Scholar] [CrossRef] [Scilit]
- Zarean, J.; Nasri, S.A.E.M.; Kavakli-Thorne, M. NEXUS (Networked Exchange of Unified Systems) for Data Exchange in a Federated Smart City Digital Twin: A Case Study on Twin Cities. In 2025 IEEE International Conference on High Performance Computing and Communications (HPCC); IEEE: Piscataway, NJ, USA, 2025; pp. 1–12. [Google Scholar] [CrossRef] [Scilit]
- Xu, L.; León-Sánchez, C.; Agugiaro, G.; Stoter, J. High resolution solar potential computation in large scale urban areas by means of semantic 3D city models. Int. Arch. Photogramm. Remote Sens. Spat. Inf. Sci. 2024, 48, 167–174. [Google Scholar] [CrossRef] [Scilit]
- Tamort, A.; Kharroubi, A.; Hajji, R.; Billen, R. 3D change detection for semi-automatic update of buildings in 3D city models. Int. Arch. Photogramm. Remote Sens. Spat. Inf. Sci. 2024, 48, 349–355. [Google Scholar] [CrossRef] [Scilit]
- Yang, K.; Zhen, F.; Zhang, S. Evolution of Smart Parks and Development of Park Information Modeling (PIM): Concept and Design Application. Chin. Geogr. Sci. 2025, 35, 982–998. [Google Scholar] [CrossRef] [Scilit]
- Legapriyadharshini, N.; Nanthini, S.; Guhan, P.; Balamurugan Singaravelan Sheeja Kumari, V. MMDT-DM: Multimodal Foundation Models with Digital Twin Technology for Predictive Disaster Management in Smart Cities. In Mathematical Methods in Artificial Intelligence: Intelligent Systems; Kumar, A., Ramírez, R.J., Quezada, M.D.L.A., Chinnathambi, D., Eds.; De Gruyter: Berlin, Germany, 2026; pp. 165–176. [Google Scholar] [CrossRef] [Scilit]
- Keler, A.; Nishigaki, T.; Schmöcker, J.-D. Constructing a Public Transport Simulation by Fusing Open Source Data into SUMO with Kyoto Case Study. In Proceedings of the 28th International Conference of Hong Kong Society for Transportation Studies (HKSTS), Hong Kong, 9–10 December 2024. [Google Scholar]
- Bellini, P.; Collini, E.; Fanfani, M.; Palesi, L.A.I.; Nesi, P. Smart City Digital Twin Platform Architecture for Mobility and Transport Decision Support Systems. In Proceedings of the 2024 IEEE International Conference on Big Data (BigData); IEEE: Piscataway, NJ, USA, 2024; pp. 5486–5495. [Google Scholar] [CrossRef] [Scilit]
- Zhang, Y.; Liu, C.-W.; Li, J.; Chen, Y.; Cheng, J.; Fan, R. Establishing Reality-Virtuality Interconnections in Urban Digital Twins for Superior Intelligent Road Inspection and Simulation. IEEE Robot. Autom. Lett. 2026, 11, 1378–1385. [Google Scholar] [CrossRef] [Scilit]
- Adibhesami, M.A.; Karimi, H.; Sepehri, B.; Pajani, F.; Makaremi, S.; Ghahremani, S.; Hassanzadeh, A. A Data-Driven Multi-scale Digital Twin Framework for Optimizing Energy Efficiency in Public Pedestrian Infrastructure. In Digital Twin Computing for Urban Intelligence; Pourroostaei Ardakani, S., Cheshmehzangi, A., Eds.; Springer Nature: Singapore, 2024; pp. 147–166. [Google Scholar] [CrossRef] [Scilit]
- Kasprzyk, J.-P.; Nys, G.-A.; Billen, R. Towards a multi-database CityGML environment adapted to big geodata issues of urban digital twins. Int. Arch. Photogramm. Remote Sens. Spat. Inf. Sci. 2024, 48, 101–106. [Google Scholar] [CrossRef] [Scilit]
- Nguyen, S.H.; Kolbe, T.H. If cities could speak: What semantic 3D city models reveal about their evolution. GIS Sci. 2025, 2, 47–56. [Google Scholar] [CrossRef]
- Hyun, C.-T.; Lee, S.; Jin, C. Digital Twin for Disaster Management in Smart City. In Advances in Information and Communication; Arai, K., Ed.; Springer Nature: Cham, Switzerland, 2024; Volume 919, pp. 627–641. [Google Scholar] [CrossRef] [Scilit]
- Alva, P.; Mosteiro-Romero, M.; Pei, W.; Bartolini, A.; Yuan, C.; Stouffs, R. Bottom-Up Approach for Creating an Urban Digital Twin Platform and Use Cases. In 28th International Conference on Computer-Aided Architectural Design Research in Asia: Human-Centric, CAADRIA; Association for Computer-Aided Architectural Design Research in Asia (CAADRIA): Hong Kong, 2023; pp. 605–614. [Google Scholar] [CrossRef] [Scilit]
- Usta, Z. SWAN: An open-source 3D shadow analysis tool for cities. SoftwareX 2026, 34, 102659. [Google Scholar] [CrossRef] [Scilit]
- Olsson, P.-O.; Andersson, A.; Calvert, M.; Loreman, A.; Lökholm, E.; Martinsson, E.; Pantazatou, K.; Svensson, B.; Spielhaupter, A.; Uggla, M.; et al. Representation of 3D Land Cover Data in Semantic City Models. ISPRS Int. J. Geo-Inf. 2025, 14, 328. [Google Scholar] [CrossRef] [Scilit]
- Leplat, L.; López-Alfaro, C.; Styve, A.; Torres, R.D.S. NorDark-DT: A digital twin for urban lighting infrastructure planning and analysis. Environ. Plan. B Urban Anal. City Sci. 2025, 52, 667–688. [Google Scholar] [CrossRef] [Scilit]
- Fujiwara, K.; Tsurumi, R.; Kiyono, T.; Fan, Z.; Liang, X.; Lei, B.; Yap, W.; Ito, K.; Biljecki, F. VoxCity: A seamless framework for open geospatial data integration, grid-based semantic 3D city model generation, and urban environment simulation. Comput. Environ. Urban Syst. 2026, 123, 102366. [Google Scholar] [CrossRef] [Scilit]
- Padsala, R.; Falay, B.; Hainoun, A.; Coors, V. A Data-Driven Urban Digital Twin Approach for Evaluating Positive Energy District Potential Using OGC Standards in Stuttgart. Int. Arch. Photogramm. Remote Sens. Spat. Inf. Sci. 2025, 48, 67–74. [Google Scholar] [CrossRef] [Scilit]
- Zheng, N.; Xu, Y.; Cai, K.; Inalhan, G. A Digital-Twin Based Airspace Corridor Design and Dynamic Configuration for High-density UAS Traffic Management. In 2025 Integrated Communications, Navigation and Surveillance Conference (ICNS); IEEE: Piscataway, NJ, USA, 2025; pp. 1–11. [Google Scholar] [CrossRef] [Scilit]
- Longo, D.; Turillazzi, B.; Roversi, R.; Lilla, S.; Nucci, C.A.; Piccinini, A.; Costa, A. Urban Digital Twin and Energy Modeling: Experiences and Case Study Analyses. Agathon-Int. J. Archit. Art Des. 2024, 15, 160–169. [Google Scholar] [CrossRef]
- Pantazatou, K.; Mattisson, K.; Olsson, P.-O.; Telldén, E.; Kettisen, A.; Hosseinvash Azari, S.; Liu, W.; Harrie, L. Influence of land cover on noise simulation output—A case study in Malmö, Sweden. Noise Mapp. 2025, 12, 20250016. [Google Scholar] [CrossRef] [Scilit]
- Wu, L.; Leng, J.; Wu, S. Intelligent Perception and Data Mining Technology of City Information Modeling CIM in Urban Renewal. In 2024 3rd International Conference on Data Analytics, Computing and Artificial Intelligence (ICDACAI); IEEE: Piscataway, NJ, USA, 2024; pp. 627–632. [Google Scholar] [CrossRef] [Scilit]
- Balaban, O.; Gabrie, A.; Botero, B.; Soman, R.K.; Pauwels, P. Improved Cadastral Data Management for Flood Risk Management in A BIM-GIS Compliant Environment by Engaging Stakeholders. In European Conference on Computing in Construction, EC3 2025; European Council on Computing in Construction (EC3): Sint-Niklaas, Belgium, 2025. [Google Scholar] [CrossRef] [Scilit]
- Herath, M.; Alvi, M.; Minerva, R.; Dutta, H.; Crespi, N.; Raza, S.M. Smart City Digital Twins: A Modular and Adaptive Architecture for Real-Time Data-Driven Urban Management. In 2024 20th International Conference on Network and Service Management (CNSM); IEEE: Piscataway, NJ, USA, 2024; pp. 1–7. [Google Scholar] [CrossRef] [Scilit]
- Saeidian, B.; Rajabifard, A.; Atazadeh, B.; Kalantari, M. A semantic 3D city model for underground land administration: Development and implementation of an ADE for CityGML 3.0. Tunn. Undergr. Space Technol. 2023, 140, 105267. [Google Scholar] [CrossRef] [Scilit]
- Tucci, G.; Fiorini, L.; Meucci, A.; Conti, A. Integrated Geomatic Solutions for the Digital Twin of Florence: Protecting the Arno River and its Historic Urban Landscape from Climate Risks. Int. Arch. Photogramm. Remote Sens. Spat. Inf. Sci. 2025, 48, 1463–1470. [Google Scholar] [CrossRef] [Scilit]
- Sun, B. A digital twin and IoT-enabled framework for smart landscape systems in sustainable city engineering. In International Conference on Smart Transportation and City Engineering (STCE 2025); Wang, W., Feng, Z., Eds.; SPIE: Bellingham, WA, USA, 2026; p. 22. [Google Scholar] [CrossRef] [Scilit]
- Blagonić, B.; Markovinović, D.; Matijević, H.; Redovniković, L. Integration of Digital Twin Technologies in Urban Regeneration of a Small Historic Town in Europe. Sustainability 2025, 17, 10740. [Google Scholar] [CrossRef] [Scilit]
- Kanna, K.; Kolbe, T.H. Advanced User Interaction with Urban Digital Twins using Large Language Models. ISPRS Ann. Photogramm. Remote Sens. Spat. Inf. Sci. 2025, 10, 469–476. [Google Scholar] [CrossRef] [Scilit]
- Maiullari, D.; Nageli, C.; Rudena, A.; Isacson, Å.; Dokter, G.; Ellenbroek, I.; Wallbaum, H.; Thuvander, L. Digital twin for supporting decision-making and stakeholder collaboration in urban decarbonization processes. A participatory development in Gothenburg. Environ. Plan. B Urban Anal. City Sci. 2024, 53, 23998083241286030. [Google Scholar] [CrossRef] [Scilit]
- Fanfani, M.; Palesi, L.A.I.; Nesi, P. Data-Driven Mobility Demand-Versus-Offer Matching by Dynamic Integration of Public and Sharing Services. IEEE Access 2026, 14, 23166–23193. [Google Scholar] [CrossRef] [Scilit]
- Hajrasouliha, A.; Amos, D. Procedural modeling in urban digital twins as a tool for visualization, analysis, and public engagement: Examining a housing policy in California. J. Plan. Educ. Res. 2025, 45, 790–801. [Google Scholar] [CrossRef] [Scilit]
- Guler, D. Implementation of 3D spatial planning through the integration of the standards. Trans. GIS 2023, 27, 2252–2277. [Google Scholar] [CrossRef] [Scilit]
- Petrova-Antonova, D.; Malinov, S.; Mrosla, L.; Petrov, A. Towards a conceptual model of CityGML 3.0 vegetation ADE. Int. Arch. Photogramm. Remote Sens. Spat. Inf. Sci. 2024, 48, 155–161. [Google Scholar] [CrossRef] [Scilit]
- Sukma, A.I.; Koeva, M.N.; Reckien, D.; Bockarjova, M.; Mano, A.D.S.; Canili, G.; Vicentini, G.; Kerle, N. 3D City Digital Twin Simulation to Mitigate Heat Risk of Urban Heat Islands. In 19th 3D GeoInfo Conference 2024; Copernicus Publications: Göttingen, Germany, 2024; Volume XLVIII-4/W11-2024, pp. 129–136. [Google Scholar] [CrossRef] [Scilit]
- Wang, M.; Wong, P.K.Y.; Cheng, J.C. A BIM-GIS Framework Integrated with CCTV Analytics for Urban Walkability Assessment. Sensors 2025, 25, 3637. [Google Scholar] [CrossRef] [Scilit] [PubMed]
- Alfouly, M.; Halilovic, S.; Hamacher, T. Evaluating urban form influence on solar exposure and corresponding building energy demands. Energy Build. 2025, 338, 115708. [Google Scholar] [CrossRef] [Scilit]
- Usta, Z.; Cömert, Ç.; Akın, A.T. An interoperable web-based application for 3d city modelling and analysis. Earth Sci. Inform. 2024, 17, 163–179. [Google Scholar] [CrossRef] [Scilit]
- Adreani, L.; Bellini, P.; Fanfani, M.; Nesi, P.; Pantaleo, G. Smart City Digital Twin Framework for Real-Time Multi-Data Integration and Wide Public Distribution. IEEE Access 2024, 12, 76277–76303. [Google Scholar] [CrossRef] [Scilit]
- Tsiranidou, E.; Agugiaro, G.; Fernández, A.; Díaz Vilariño, L. From point clouds to CityGML 3.0: An approach to multi-granular urban road modelling. ISPRS Ann. Photogramm. Remote Sens. Spat. Inf. Sci. 2025, 10, 201–208. [Google Scholar] [CrossRef] [Scilit]
- Lim, J.; Biljecki, F.; Stouffs, R. Integration of movement data into 3D GIS. ISPRS Ann. Photogramm. Remote Sens. Spat. Inf. Sci. 2024, 10, 219–227. [Google Scholar] [CrossRef] [Scilit]
- Le, N.H.H.; Trinh, T.A.; Pham, K. Multi-Level Interactive Platform for Night Time Economy Planning: A Case Study in Nha Trang, Vietnam. J. Sustain. Archit. Civ. Eng. 2026, 39, 58–70. [Google Scholar] [CrossRef] [Scilit]
- Leopold, U.; Braun, C.; Pinheiro, P. An interoperable digital twin to simulate spatio-temporal photovoltaic power output and grid congestion at neighbourhood and city levels in luxembourg. Int. Arch. Photogramm. Remote Sens. Spat. Inf. Sci. 2023, 48, 95–100. [Google Scholar] [CrossRef] [Scilit]
- Duka, J.A.; Traen, J.L.; Sarmiento, C.J.; Principe, J. Estimating Cooling Energy Demand from Building Attributes and Environmental Parameters using 3D City Models. ISPRS Ann. Photogramm. Remote Sens. Spat. Inf. Sci. 2024, 10, 63–70. [Google Scholar] [CrossRef] [Scilit]
- Najafi, P.; Mohammadi, M.; van Wesemael, P.; Le Blanc, P.M. A user-centred virtual city information model for inclusive community design: State-of-art. Cities 2023, 134, 104203. [Google Scholar] [CrossRef] [Scilit]
- Al Jurdi, M.; Wehbe, R.; Mroueh, H. Integration of citizens’ feelings and feedback into the city information modeling environment. Sustain. Cities Soc. 2023, 99, 104971. [Google Scholar] [CrossRef] [Scilit]
- Li, X.; Xia, Y.; Huang, Z.; Gu, R.; Zhang, B. A digital twin prototype for 3D structural health monitoring and simulation-based diagnosis of urban bridges. In Fifth International Conference on Intelligent Traffic Systems and Smart City (ITSSC 2025); SPIE: Bellingham, WA, USA, 2025; Volume 13792, pp. 260–267. [Google Scholar] [CrossRef] [Scilit]
- Yadav, Y.; Colucci, E.; Boccardo, P.; Zlatanova, S. A Geodatabase Design for the Development of a Digital Twin for Urban Environments: A Case Study from Turin, Italy. Int. Arch. Photogramm. Remote Sens. Spat. Inf. Sci. 2024, 48, 525–532. [Google Scholar] [CrossRef] [Scilit]
- Roumyeh, M.; Badenko, V.; Volkova, Y. Method for BIM and GIS databases integration for CIM creation support. In International School on Neural Networks, Initiated by IIASS and EMFCSC; Springer International Publishing: Cham, Switzerland, 2022; pp. 923–932. [Google Scholar] [CrossRef] [Scilit]
- Barrile, V.; La Foresta, F.; Calcagno, S.; Genovese, E. Innovative system for BIM/GIS integration in the context of urban sustainability. Appl. Sci. 2024, 14, 8704. [Google Scholar] [CrossRef] [Scilit]
- Anselmo, S.; Ferrara, M. The Potential of Urban Digital Twins for Renewable Energy Communities. In International Conference on Construction, Energy, Environment and Sustainability; Springer Nature: Singapore, 2025; pp. 347–355. [Google Scholar] [CrossRef] [Scilit]
- Lopez-Cabeza, V.P.; Videras-Rodriguez, M.; Gomez-Melgar, S.J.; Andujar-Marquez, J.M. Urban Digital Twins for Microclimate and Comfort Analysis: A Case Study in Huelva. In IOP Conference Series: Earth and Environmental Science; IOP Publishing: Bristol, UK, 2025; Volume 1568, p. 012053. [Google Scholar] [CrossRef] [Scilit]
- Huang, J.; Bibri, S.E.; Keel, P. Generative spatial artificial intelligence for sustainable smart cities: A pioneering large flow model for urban digital twin. Environ. Sci. Ecotechnology 2025, 24, 100526. [Google Scholar] [CrossRef] [Scilit] [PubMed]
- Bong, A.; Clemen, C. Digital Urban Twins for heavy rain events-An open source QGIS plugin for machine learning classification of residential buildings using CityGML with additional datasets. ISPRS Ann. Photogramm. Remote Sens. Spat. Inf. Sci. 2025, 10, 25–32. [Google Scholar] [CrossRef] [Scilit]
- Ssin, S.; Bang, J.; Woo, W. CDT-GEM: Conversational digital twin for geographic emergency management. In International XR Conference; Springer International Publishing: Cham, Switzerland, 2022; pp. 134–138. [Google Scholar] [CrossRef] [Scilit]
- Aschieri, D.L.D.; Khosravi, M.; Cano, V.C. Bridging above and below: A multi-criteria evaluation of GeoBIM modelling workflows for contamination assessment—The PSRI case study (Italy). J. Environ. Manag. 2026, 401, 128959. [Google Scholar] [CrossRef] [Scilit] [PubMed]
- Andriessen, L.; Agugiaro, G.; Borgers, A.; Pauwels, P. Semantic 3D city models as support for urban flood resilience: Experiences from Rotterdam. ISPRS Ann. Photogramm. Remote Sens. Spat. Inf. Sci. 2024, 10, 5–12. [Google Scholar] [CrossRef] [Scilit]
- Kaynak, S.; Kaynak, B.; Mermer, O.; Demir, I. City-scale digital twin framework for flood impact analysis: Integrating urban infrastructure and real-time data analytics. Urban Clim. 2025, 64, 102640. [Google Scholar] [CrossRef] [Scilit]
- Backhaus, L.; Stamm, J. Leveraging urban digital twins for enhanced flood risk management and decision-making in smart cities. In Book of Extended Abstracts of the 41st IAHR World Congress; International Association for Hydro-Environment Engineering and Research: Madrid, Spain, 2025. [Google Scholar]
- Martella, A.; Longo, A.; Martella, C.; Zappatore, M.; Miccoli, F. An Architectural Framework for Urban Digital Twin Design: A Case Study on Hydrogeological Risk Management. In 2025 55th Annual IEEE/IFIP International Conference on Dependable Systems and Networks Workshops (DSN-W); IEEE: Piscataway, NJ, USA, 2025; pp. 127–134. [Google Scholar] [CrossRef] [Scilit]
- Leonforte, F.; Adhikari, R.S.; Aste, N.; Del Pero, C.; Huerto-Cardenas, H.E.; Xin, Z.; Bazaki, I. The Effect of Urban Morphology on Solar Potential: A Detailed Assessment of the City of Milan in Italy. Energies 2026, 19, 1332. [Google Scholar] [CrossRef] [Scilit]
- Shang, Y.; Li, S.; Tao, B.; Zhang, H.; Li, X.; Zhou, T.; Zhao, W.; Zhao, L. Research on the construction of an integrated BIM-and GIS-based smart operation and maintenance system for urban bridges throughout their entire lifecycle. In Sixth International Conference on Green Energy, Environment, and Sustainable Development (GEESD 2025); SPIE: Bellingham, WA, USA, 2025; Volume 13975, pp. 555–560. [Google Scholar] [CrossRef] [Scilit]
- Waqas, H.; Jiang, Y.; Shang, J.; Munir, I.; Khan, F.U. An integrated approach for 3D solar potential assessment at the city scale. Remote Sens. 2023, 15, 5616. [Google Scholar] [CrossRef] [Scilit]
- Bolte, A.M.; Niedermann, B.; Kistemann, T.; Haunert, J.H.; Dehbi, Y.; Kötter, T. The green window view index: Automated multi-source visibility analysis for a multi-scale assessment of green window views. Landsc. Ecol. 2024, 39, 71. [Google Scholar] [CrossRef] [Scilit]
- Bellini, P.; Bilotta, S.; Collini, E.; Fanfani, M.; Nesi, P. Mobility and transport data for city digital twin modeling and exploitation. In 2023 IEEE International Smart Cities Conference (ISC2); IEEE: Piscataway, NJ, USA, 2023; pp. 1–7. [Google Scholar] [CrossRef] [Scilit]
- Laso, S.; Toro-Gálvez, L.; Berrocal, J.; Troya, J.; Canal, C.; Manuel Murillo, J. Towards an urban digital twins continuum architecture. In European Conference on Software Architecture; Springer Nature: Cham, Switzerland, 2023; pp. 272–286. [Google Scholar] [CrossRef] [Scilit]
- Tucci, G.; Meucci, A.; Fiorini, L.; Conti, A. Data Quality in Urban Digital Twins: Challenges in the Virtualization of Florence’s Historic Heritage. Int. Arch. Photogramm. Remote Sens. Spat. Inf. Sci. 2025, 48, 1539–1545. [Google Scholar] [CrossRef] [Scilit]
- Pittaluga, S.; Cabiddu, D.; Mortara, M.; Spagnuolo, M. Organising and Enriching Urban 3D Models for Digital Twin Applications. In Smart Tools and Applications in Graphics; The Eurographics Association: Eindhoven, The Netherlands, 2025. [Google Scholar] [CrossRef]
- Alorabi, A.H.; Shen, J.; Smith, J.M.; Hawkins, M.; Fatemifar, K.; Yoshida, T.; Murayama, A.; Yang, P.P.J. A Data-driven Smart District Toward Net Zero Using Generative Design and Urban Digital Twins: A Use Case of Nihonbashi, Tokyo. Int. Arch. Photogramm. Remote Sens. Spat. Inf. Sci. 2025, 48, 1–8. [Google Scholar] [CrossRef] [Scilit]
- Nguyen, T.D.; Tran, K.P.; Le, A.T.; Tran, P.T. Building a 3D BIM-GIS Model for the Digital Transformation of Inland Waterways in Ho Chi Minh City, Vietnam. In Ports 2025; American Society of Civil Engineers: Reston, VA, USA, 2025; pp. 225–236. [Google Scholar] [CrossRef] [Scilit]
- Capetillo-Ordaz, N.B.; Beckers, B.; Alonso-Tristán, C. Procedural urban modeling for accurate thermal analysis in contemporary cities. In Journal of Physics: Conference Series; IOP Publishing: Bristol, UK, 2025; Volume 3140, p. 042012. [Google Scholar] [CrossRef] [Scilit]
- Zahid, H.; Hijazi, I.; Donaubauer, A.; Kolbe, T.H. Enhancing Realism in Urban Simulations: A Mapping Framework for the German National Standard XPlanung and CityGML. In International 3D GeoInfo Conference; Springer Nature: Cham, Switzerland, 2023; pp. 437–457. [Google Scholar] [CrossRef] [Scilit]
- Dai, T.Y.; Niyogi, D.; Nagy, Z. CityTFT: A temporal fusion transformer-based surrogate model for urban building energy modeling. Appl. Energy 2025, 389, 125712. [Google Scholar] [CrossRef] [Scilit]
- Ugliotti, F.M.; Daud, M.; Iacono, E. Spatial Insights for Building Resilience: The Territorial Risk Management & Analysis Across Scale Framework for Bridging Scales in Multi-Hazard Assessment. Smart Cities 2025, 8, 27. [Google Scholar] [CrossRef] [Scilit]
- Barrile, V.; Genovese, E.; Maesano, C.; Calluso, S.; Manti, M.P. Developing an urban digital twin for environmental and risk assessment: A case study on public lighting and hydrogeological risk. Future Internet 2025, 17, 110. [Google Scholar] [CrossRef] [Scilit]
- Zhao, Y.; Li, K.; Zhang, W. Digital Twin–Based Simulation and Decision-Making Framework for the Renewal Design of Urban Industrial Heritage Buildings and Environments: A Case Study of the Xi’an Old Steel Plant Industrial Park. Buildings 2025, 15, 4367. [Google Scholar] [CrossRef] [Scilit]
- Park, Y.; Guldmann, J.M.; Liu, D. Impacts of tree and building shades on the urban heat island: Combining remote sensing, 3D digital city and spatial regression approaches. Comput. Environ. Urban Syst. 2021, 88, 101655. [Google Scholar] [CrossRef] [Scilit]
- Çağdaş, V. An application domain extension to CityGML for immovable property taxation: A Turkish case study. Int. J. Appl. Earth Obs. Geoinf. 2013, 21, 545–555. [Google Scholar] [CrossRef] [Scilit]
- Dembski, F.; Wössner, U.; Letzgus, M.; Ruddat, M.; Yamu, C. Urban digital twins for smart cities and citizens: The case study of Herrenberg, Germany. Sustainability 2020, 12, 2307. [Google Scholar] [CrossRef] [Scilit]
- Ujang, U.; Anton, F.; Ariffin, A.; Mioc, D.; Azri, S. An amalgamation of 3D city models in urban air quality modelling for improving visual impact analysis. Air Pollut. XXIII 2015, 198, 51. [Google Scholar] [CrossRef] [Scilit]
- Li, S.; Suh, W.; Kim, J.I. An integrated urban road rehabilitation planning and decision support based on BIM and GIS. In Computing in Civil Engineering 2023; American Society of Civil Engineers: Reston, VA, USA, 2024; pp. 112–120. [Google Scholar] [CrossRef] [Scilit]
- Ebrahim, H.; Santhanavanich, T.; Wuerstle, P.; Coors, V. Concept and evaluation of an urban platform for interactive visual analytics. ISPRS Ann. Photogramm. Remote Sens. Spat. Inf. Sci. 2021, 8, 33–40. [Google Scholar] [CrossRef] [Scilit]
- Josephs, H.; Gong, J.; Wang, Y.; Xia, J. Urban digital twin-based decision support for housing rebuilding choices in catastrophically flooded communities. In Computing in Civil Engineering 2023; American Society of Civil Engineers: Reston, VA, USA, 2024; pp. 1–9. [Google Scholar] [CrossRef] [Scilit]
- Del Duca, G.; Rocha, G.; Orszt, M.; Mateus, L. A preliminary contribution towards a risk-based model for flood management planning using BIM: A case study of Lisbon. Sensors 2022, 22, 7456. [Google Scholar] [CrossRef] [Scilit] [PubMed]
- Padsala, R.; Gebetsroither-Geringer, E.; Peters-Anders, J.; Coors, V. Inception of harmonising data silos and urban simulation tools using 3d city models for sustainable management of the urban food water and energy resources. ISPRS Ann. Photogramm. Remote Sens. Spat. Inf. Sci. 2021, 8, 81–88. [Google Scholar] [CrossRef] [Scilit]
- Ahmed, C.F. Smart Geo-Spatial Analytical Tool for Urban Development and Management. In Proceedings of the Special Collection on eGovernment Innovations in India; ACM: New York, NY, USA, 2017; pp. 76–81. [Google Scholar] [CrossRef] [Scilit]
- Wilhelm, L.; Donaubauer, A.; Kolbe, T.H. Integration of BIM and environmental planning: The CityGML EnvPlan ADE. J. Digit. Landsc. Archit. 2021, 6, 323–324. [Google Scholar] [CrossRef] [Scilit]
- Bernegger, H.J.; Laube, P.; Ochsner, P.; Meslec, M.; Rahn, H.; Junghardt, J.; Aurich, I.; Ashworth, S. Sustain GEOBIM—A New Method to Simulate Sustainable Development Scenarios for Urban Areas. Circ. Econ. Sustain. 2021, 1, 967–976. [Google Scholar] [CrossRef] [Scilit]
- Massimo, D.E. Green building: Characteristics, energy implications and environmental impacts. Case study in Reggio Calabria, Italy. Green Build. Phase Change Mater. Charact. Energy Implic. Environ. Impacts 2015, 1, 71–101. [Google Scholar]
- Zerhouny, M.; Fadil, A.; Hakdaoui, M. Underground space utilization in the urban land-use planning of Casablanca (Morocco). Land 2018, 7, 143. [Google Scholar] [CrossRef] [Scilit]
- Suwardhi, D.; Trisyanti, S.W.; Virtriana, R.; Syamsu, A.A.; Jannati, S.; Halim, R.S. Heritage smart city mapping, planning and land administration (Hestya). ISPRS Int. J. Geo-Inf. 2022, 11, 107. [Google Scholar] [CrossRef] [Scilit]
- Vogelbacher, G.; Finger, J.; Häring, I. Towards visibility and audibility algorithms for assessing perceived safety and security in public areas based on digital 3D city models. In Proceedings of the 29th European Safety and Reliability Conference (ESREL 2019). ESREL. Hannover, Germany, 22–26 September 2019; CRC Press: Boca Raton, FL, USA, 2019; pp. 22–26. [Google Scholar] [CrossRef] [Scilit]
- Wang, M.; Deng, Y.; Won, J.; Cheng, J.C. An integrated underground utility management and decision support based on BIM and GIS. Autom. Constr. 2019, 107, 102931. [Google Scholar] [CrossRef] [Scilit]
- Seifert, N.; Mühlhaus, M.; Petzold, F. Urban strategy playground: Rethinking the urban planner’s toolbox. Int. J. Archit. Comput. 2020, 18, 20–40. [Google Scholar] [CrossRef] [Scilit]
- Rua, H.; Falcão, A.P.; Roxo, A.F. Digital models–proposal for the interactive representation of urban centres. eCAADe 2013, 18, 265. [Google Scholar] [CrossRef] [Scilit]
- Muñoz, D.; Besuievsky, G.; Patow, G. A Level-of-Detail Technique for Urban Physics Calculations in Large Urban Environments. In Spanish Computer Graphics Conference (CEIG); The Eurographics Association: Eindhoven, The Netherlands, 2019. [Google Scholar] [CrossRef]
- Coors, V.; Hünlich, K.; On, G. Constraint-based generation and visualization of 3D city models. In 3D Geo-Information Sciences; Springer: Berlin/Heidelberg, Germany, 2009; pp. 365–378. [Google Scholar] [CrossRef] [Scilit]
- Rubinowicz, P. Protection of the Waterfront Panoramas Based on Computational 3D-Analysis. In Architecture in the Age of the 4th Industrial Revolution: Proceedings of the 37th eCAADe and 23rd SIGraDi Conference, Porto, Portugal, 11–13 September 2019; Education and Research in Computer Aided Architectural Design in Europe: Brussels, Belgium, 2019; Volume 2, pp. 325–332. [Google Scholar] [CrossRef] [Scilit] [PubMed]
- Charlton, J.; Giddings, B.; Thompson, E.M.; Peverett, I. Understanding the interoperability of virtual city models in assessing the performance of city centre squares. Environ. Plan. A 2015, 47, 1298–1312. [Google Scholar] [CrossRef] [Scilit]
- Aliaga, D.G.; Vanegas, C.; Lei, M.; Niyogi, D. Visualization-based decision tool for urban meteorological modeling. Environ. Plan. B Plan. Des. 2013, 40, 271–288. [Google Scholar] [CrossRef] [Scilit]
- Sindram, M.; Kolbe, T.H. Modeling of urban planning actions by complex transactions on semantic 3D city models. In Proceedings of the International Environmental Modelling and Software Society (iEMSs), San Diego, CA, USA, 15–19 June 2014; Available online: https://mediatum.ub.tum.de/doc/1224665/document.pdf (accessed on 8 May 2026).
- Jaillot, V.; Servigne, S.; Gesquière, G. Delivering time-evolving 3D city models for web visualization. Int. J. Geogr. Inf. Sci. 2020, 34, 2030–2052. [Google Scholar] [CrossRef] [Scilit]
- Muñoz, D.; Besuievsky, G.; Patow, G. A procedural technique for thermal simulation and visualization in urban environments. Build. Simul. 2019, 12, 1013–1031. [Google Scholar] [CrossRef] [Scilit]
- Ford, M.; Cadzow, S.; Wilson, D.; Parslow, P.; Prandi, F.; de Amicis, R. Using 3D urban information models to aid simulation, analysis and visualisation of data for smart city web services (i-SCOPE). In International Symposium on Environmental Software Systems; Springer: Cham, Switzerland, 2013; Available online: https://ceur-ws.org/Vol-1322/paper_8.pdf (accessed on 8 May 2026).
- Chatzi, A.M.; Wesseler, L.M. OGOS+–A Tool to Visualize Densification potential. In RE: Anthropocene, Design in the Age of Humans—Proceedings of the 25th CAADRIA Conference—Volume 1, Chulalongkorn University, Bangkok, Thailand, 5–6 August 2020; Holzer, D., Nakapan, W., Globa, A., Eds.; Association for Computer-Aided Architectural Design Research in Asia (CAADRIA): Hong Kong, 2020; pp. 5–6. Available online: https://depositonce.tu-berlin.de/bitstreams/a9ac6ba1-2513-491c-850a-158725870df3/download (accessed on 8 May 2026).
- Malinverni, E.S.; Tassetti, A.N. GIS-based smart cartography using 3D modeling. Int. Arch. Photogramm. Remote Sens. Spat. Inf. Sci. 2013, 40, 47–52. [Google Scholar] [CrossRef] [Scilit]
- Noardo, F.; Ellul, C.; Harrie, L.; Overland, I.; Shariat, M.; Arroyo Ohori, K.; Stoter, J. Opportunities and challenges for GeoBIM in Europe: Developing a building permits use-case to raise awareness and examine technical interoperability challenges. J. Spat. Sci. 2020, 65, 209–233. [Google Scholar] [CrossRef] [Scilit]
- Hofierka, J. Assessing land surface temperature in urban areas using open-source geospatial tools. Int. Arch. Photogramm. Remote Sens. Spat. Inf. Sci. 2022, 48, 195–200. [Google Scholar] [CrossRef] [Scilit]
- Ghaith, M.; Yosri, A.; El-Dakhakhni, W. Digital Twin: A City-Scale Flood Imitation Framework. In Proceedings of the Canadian Society of Civil Engineering Annual Conference 2021. CSCE 2021; Walbridge, S., Nik-Bakht, M., Ng, K.T.W., Shome, M., Alam, M.S., Damatty, A.E., Lovegrove, G., Eds.; Lecture Notes in Civil Engineering; Springer: Singapore, 2022; Volume 250. [Google Scholar] [CrossRef] [Scilit]
- Kemeç, S.; Duzgun, H.S. Use of 3D visualization in natural disaster risk assessment for urban areas. In Innovations in 3D Geo Information Systems; Springer: Berlin/Heidelberg, Germany, 2006; pp. 557–566. [Google Scholar] [CrossRef] [Scilit]
- Ross, L.; Bolling, J.; Döllner, J.; Kleinschmit, B. Enhancing 3D city models with heterogeneous spatial information: Towards 3D land information systems. In Advances in GIScience: Proceedings of the 12th AGILE Conference; Springer: Berlin/Heidelberg, Germany, 2009; pp. 113–133. [Google Scholar] [CrossRef] [Scilit]
- Deng, Y.; Cheng, J.C.; Anumba, C. A framework for 3D traffic noise mapping using data from BIM and GIS integration. Struct. Infrastruct. Eng. 2016, 12, 1267–1280. [Google Scholar] [CrossRef] [Scilit]
- Yosino, C.M.O.; Ferreira, S.L. Using BIM and GIS Interoperability to Create CIM Model for USW Collection Analysis. In Proceedings of the 18th International Conference on Computing in Civil and Building Engineering; Toledo Santos, E., Scheer, S., Eds.; Springer International Publishing: Berlin/Heidelberg, Germany, 2021; Volume 98, pp. 248–271. [Google Scholar] [CrossRef] [Scilit]
- Noardo, F.; Wu, T.; Arroyo Ohori, K.; Krijnen, T.; Tezerdi, H.; Stoter, J. Geobim for digital building permit process: Learning from a case study in Rotterdam. ISPRS Ann. Photogramm. Remote Sens. Spat. Inf. Sci. 2020, 6, 151–158. [Google Scholar] [CrossRef] [Scilit]
- Heo, J.; Moon, H.; Chang, S.; Han, S.; Lee, D.E. Case study of solar photovoltaic power-plant site selection for infrastructure planning using a BIM-GIS-based approach. Appl. Sci. 2021, 11, 8785. [Google Scholar] [CrossRef] [Scilit]
- Bogdahn, J.; Coors, V. 3D city models as part of an open geospatial data infrastructure. In Proceedings of the 14th International Conference on Distributed Multimedia Systems (DMS 2008); Knowledge Systems Institute: Skokie, IL, USA, 2008; pp. 220–225. Available online: https://www.disit.org/axmedis/710/00000-710c4b12-7126-49a9-89f3-67fd83a8db19/3/~saved-on-db-710c4b12-7126-49a9-89f3-67fd83a8db19.pdf (accessed on 8 May 2026).
- Den Duijn, X.; Agugiaro, G.; Zlatanova, S. Modelling below-and above-ground utility network features with the CityGML Utility Network ADE: Experiences from Rotterdam. ISPRS Ann. Photogramm. Remote Sens. Spat. Inf. Sci. 2018, 4, 43–50. [Google Scholar] [CrossRef] [Scilit]
- Schröter, K.; Lüdtke, S.; Redweik, R.; Meier, J.; Bochow, M.; Ross, L.; Nagel, C.; Kreibich, H. Flood loss estimation using 3D city models and remote sensing data. Environ. Model. Softw. 2018, 105, 118–131. [Google Scholar] [CrossRef] [Scilit]
- Yamamura, S.; Fan, L.; Suzuki, Y. Assessment of Urban Energy Performance through Integration of BIM and GIS for Smart City Planning. Procedia Eng. 2017, 180, 1462–1472. [Google Scholar] [CrossRef] [Scilit]
- Emamgholian, S.; Pouliot, J.; Shojaei, D.; Losier, L.M. A web-based planning permit assessment prototype: Itwin4pp. Int. Arch. Photogramm. Remote Sens. Spat. Inf. Sci. 2022, 48, 37–44. [Google Scholar] [CrossRef] [Scilit]
- Piepereit, R.; Beuster, A.; von der Gruen, M.; Voß, U.; Pries, M.; Wagner, U. Towards wind-simulation of virtual 3D city models in a collaborative VR environment. Int. Arch. Photogramm. Remote Sens. Spat. Inf. Sci. 2019, 42, 61–66. [Google Scholar] [CrossRef] [Scilit]
- Mounika, T.; Anguluri, R. 3D City Models for Extracting Urban Environmental Quality Indicators in Greater Hyderabad, Telangana. In Sustainable Smart Cities in India: Challenges and Future Perspectives; Springer International Publishing: Cham, Switzerland, 2017; pp. 243–256. [Google Scholar] [CrossRef] [Scilit]
- Badwi, I.M.; Ellaithy, H.M.; Youssef, H.E. 3D-GIS parametric modelling for virtual urban simulation using CityEngine. Ann. GIS 2022, 28, 325–341. [Google Scholar] [CrossRef] [Scilit]
- Pedrinis, F.; Morel, M.; Gesquière, G. Change detection of cities. In 3D Geoinformation Science: The Selected Papers of the 3D GeoInfo 2014; Breunig, M., Al-Doori, M., Butwilowski, E., Kuper, P.V., Benner, J., Häfele, K.H., Eds.; Lecture Notes in Geoinformation and Cartography; Springer: Berlin/Heidelberg, Germany, 2015. [Google Scholar] [CrossRef] [Scilit]
- Bahu, J.M.; Koch, A.; Kremers, E.; Murshed, S.M. Towards a 3D spatial urban energy modelling approach. ISPRS Ann. Photogramm. Remote Sens. Spat. Inf. Sci. 2013, 2, 33–41. [Google Scholar] [CrossRef] [Scilit]
- Zhang, Y.; Schnabel, M.A. Parametric modeling in form-based urban design code for high-dense cities. In Proceedings of the Symposium on Simulation for Architecture and Urban Design; ACM: New York, NY, USA, 2017; pp. 1–8. Available online: https://pure.tudelft.nl/ws/portalfiles/portal/51446165/SimAUD_2017_Proceedings.pdf#page=277 (accessed on 8 May 2026).
- Emamgholian, S.; Pouliot, J.; Shojaei, D. 3D CityLuR: Modelling 3D City Land-Use Regulations to Support Issuing a Planning Permit. ISPRS Ann. Photogramm. Remote Sens. Spat. Inf. Sci. 2021, 8, 113–120. [Google Scholar] [CrossRef] [Scilit]
- Sugihara, K.; Shen, Z. Automatic Generation of 3D Building Models with Efficient Solar Photovoltaic Generation. Int. Rev. Spat. Plan. Sustain. Dev. 2017, 5, 4–14. [Google Scholar] [CrossRef] [Scilit] [PubMed]
- Kaden, R.; Kolbe, T.H. City-wide total energy demand estimation of buildings using semantic 3D city models and statistical data. ISPRS Ann. Photogramm. Remote Sens. Spat. Inf. Sci. 2013, 2, 163–171. [Google Scholar] [CrossRef] [Scilit]
- Liang, J.; Gong, J.; Sun, J.; Liu, J. A customizable framework for computing sky view factor from large-scale 3D city models. Energy Build. 2017, 149, 38–44. [Google Scholar] [CrossRef] [Scilit]
- Mutani, G.; Todeschi, V. The effects of green roofs on outdoor thermal comfort, urban heat island mitigation and energy savings. Atmosphere 2020, 11, 123. [Google Scholar] [CrossRef] [Scilit]
- Aschwanden, G.D.; Wullschleger, T.; Müller, H.; Schmitt, G. Agent based evaluation of dynamic city models: A combination of human decision processes and an emission model for transportation based on acceleration and instantaneous speed. Autom. Constr. 2012, 22, 81–89. [Google Scholar] [CrossRef] [Scilit]
- Pepe, M.; Costantino, D.; Alfio, V.S.; Angelini, M.G.; Restuccia Garofalo, A. A CityGML multiscale approach for the conservation and management of cultural heritage: The case study of the old town of Taranto (Italy). ISPRS Int. J. Geo-Inf. 2020, 9, 449. [Google Scholar] [CrossRef] [Scilit]
- Liu, X.; Tan, S. Identifying causal relationships in an urban information modeling framework. In The 2010 International Joint Conference on Neural Networks (IJCNN); IEEE: Piscataway, NJ, USA, 2010; pp. 1–5. [Google Scholar] [CrossRef] [Scilit]
- Aschwanden, G.; Zhong, C.; Papadopoulou, M.; Vernay, D.G.; Arisona, S.M.; Schmitt, G. System design proposal for an urban information platform: A systems proposal. In Digital Physicality: Proceedings of the 30th eCAADe Conference; Achten, H., Pavlicek, J., Hulin, J., Matejovska, D., Eds.; Czech Technical University in Prague, Faculty of Architecture: Prague, Czechia, 2012; Volume 1, pp. 665–673. [Google Scholar] [CrossRef] [Scilit]
- Lata, K.; Ahmed Chundeli, F.; Ramamurthy, A. Smart Master Plan and 3D GIS Planning Support system—A Case of Chennai City, Tamil Nadu, India. In Smart Master Planning for Cities: Case Studies on Digital Innovations; Springer Nature: Singapore, 2022; pp. 111–143. [Google Scholar] [CrossRef] [Scilit]
- Beirão, J.; Duarte, J.P. Generic grammars for design domains. AI EDAM 2018, 32, 225–239. [Google Scholar] [CrossRef] [Scilit]
- Sugihara, K.; Shen, Z. Automatic generation of 3D house models with solar photovoltaic generation for smart city. In 2016 3rd MEC International Conference on Big Data and Smart City (ICBDSC); IEEE: Piscataway, NJ, USA, 2016; pp. 1–7. [Google Scholar] [CrossRef] [Scilit]
- Peronato, G.; Rastogi, P.; Rey, E.; Andersen, M. A toolkit for multi-scale mapping of the solar energy-generation potential of buildings in urban environments under uncertainty. Sol. Energy 2018, 173, 861–874. [Google Scholar] [CrossRef] [Scilit]
- Agugiaro, G.; Robineau, J.-L.; Rodrigues, P. Project Ci-Nergy: Towards an integrated energy urban planning system from a data modelling and system architecture perspective. ISPRS Ann. Photogramm. Remote Sens. Spat. Inf. Sci. 2017, 4, 5–12. [Google Scholar] [CrossRef] [Scilit]
- Rubinowicz, P. Sustainable development of a cityscape using the Visual Protection Surface method–optimization of parameters for urban planning. In RE: Anthropocene: Proceedings of the 25th International Conference of the Association for Computer-Aided Architectural Design Research in Asia CAADRIA; Association for Computer-Aided Architectural Design Research in Asia (CAADRIA): Hong Kong, China, 2020; Volume 1, pp. 863–872. [Google Scholar] [CrossRef] [Scilit]
- Becker, T.; Nagel, C.; Kolbe, T.H. Semantic 3D modeling of multi-utility networks in cities for analysis and 3D visualization. In Progress and New Trends in 3D Geoinformation Sciences; Springer: Berlin/Heidelberg, Germany, 2012; pp. 41–62. [Google Scholar] [CrossRef] [Scilit]
- Lu, X.; Gu, D.; Xu, Z.; Xiong, C.; Tian, Y. CIM-powered multi-hazard simulation framework covering both individual buildings and urban areas. Sustainability 2020, 12, 5059. [Google Scholar] [CrossRef] [Scilit]
- Ghaith, M.; Yosri, A.; El-Dakhakhni, W. Synchronization-enhanced deep learning early flood risk predictions: The core of data-driven city digital twins for climate resilience planning. Water 2022, 14, 3619. [Google Scholar] [CrossRef] [Scilit]
- Aubrecht, C.; Steinnocher, K.; Hollaus, M.; Wagner, W. Integrating earth observation and GIScience for high resolution spatial and functional modeling of urban land use. Comput. Environ. Urban Syst. 2009, 33, 15–25. [Google Scholar] [CrossRef] [Scilit]
- Hellmanns, J.; Schiewe, J.; Kistemann, T.; Höser, C. A planning tool for the automated quantification and visualization of blue space. KN J. Cartogr. Geogr. Inf. 2019, 69, 63–71. [Google Scholar] [CrossRef] [Scilit]
- Agugiaro, G.; González, F.; Cavallo, R. The City of Tomorrow from…the Data of Today. ISPRS Int. J. Geo-Inf. 2020, 9, 554. [Google Scholar] [CrossRef] [Scilit]
- Moshrefzadeh, M.; Kolbe, T.H. Smart Data Infrastructure for Smart and Sustainable Cities. In Proceedings of the 13th International Conference on Design & Decision Support Systems in Architecture and Urban Planning, Eindhoven, The Netherlands, 27–28 June 2016. [Google Scholar]
- Van Berlo, L.A.H.M.; Dijkmans, T.; Stoter, J. Experiment for integrating Dutch 3D spatial planning and BIM for checking building permits. ISPRS Ann. Photogramm. Remote Sens. Spat. Inf. Sci. 2013, 2, 279–284. [Google Scholar] [CrossRef] [Scilit]
- Lee, A.; Lee, K.W.; Kim, K.H.; Shin, S.W. A geospatial platform to manage large-scale individual mobility for an urban digital twin platform. Remote Sens. 2022, 14, 723. [Google Scholar] [CrossRef] [Scilit]
- Kim, J.; Ham, Y. Real-time participatory sensing-driven computational framework toward digital twin city modeling. In Construction Research Congress 2022; American Society of Civil Engineers: Reston, VA, USA, 2022; pp. 281–289. [Google Scholar] [CrossRef] [Scilit]
- Khan, M.S.; Park, J.; Seo, J. Geotechnical property modeling and construction safety zoning based on GIS and BIM integration. Appl. Sci. 2021, 11, 4004. [Google Scholar] [CrossRef] [Scilit]
- Beirão, J. City information modelling: Spatial planning and design with CAD and GIS-a workshop experiment. In 2012 International Conference on New Urban Configurations; IOS Press: Amsterdam, The Netherlands, 2014; pp. 645–651. [Google Scholar] [CrossRef] [Scilit]
- Gil, J.; Almeida, J.; Duarte, J.P. The Backbone of a City Information Model (CIM): Implementing a Spatial Data Model for Urban Design. In Respecting Fragile Places: Proceedings of the 29th eCAADe Conference, Ljubljana, Slovenia, 21–24 September 2011; Education and Research in Computer Aided Architectural Design in Europe: Brussels, Belgium, 2011; pp. 143–151. Available online: https://papers.cumincad.org/data/works/att/ecaade2011_104.content.pdf (accessed on 8 May 2026).
- Agugiaro, G. Energy planning tools and CityGML-based 3D virtual city models: Experiences from Trento (Italy). Appl. Geomat. 2016, 8, 41–56. [Google Scholar] [CrossRef] [Scilit]
- Vishnu, E.; Saran, S. Semantic modeling of utility networks implementation of use cases for Dehradun city. Int. Arch. Photogramm. Remote Sens. Spat. Inf. Sci. 2018, 42, 139–145. [Google Scholar] [CrossRef] [Scilit]
- Oliveira, N.; Rocha, J.G. Evolution of Geospatial Web Services: Proving 3D Scenes for Urban Management and Planning. 2013. Available online: https://cupum2013.geo.uu.nl/download/usb/contents/pdf/shortpapers/135_Oliveira.pdf (accessed on 8 May 2026).
- Beirão, J.; Arrobas, P. Interactive urban parametric design. In Computation and performance: Proceedings of the 31st eCAADe Conference; Stouffs, R., Sariyildiz, S., Eds.; Faculty of Architecture, Delft University of Technology: Delft, The Netherlands, 2013; Volume 1, pp. 291–299. [Google Scholar] [CrossRef] [Scilit]
- Bi, T.; Zhou, F.; Yang, X.; Zhu, Y.; Diao, X. Research on the construction of City information modelling basic platform based on multi-source data. IOP Conf. Ser. Earth Environ. Sci. 2021, 693, 012021. [Google Scholar] [CrossRef] [Scilit]
- Prieto, I.; Izkara, J.L.; Mediavilla, A.; Arambarri, J.; Arroyo, A. Collaborative platform based on standard services for the semi-automated generation of the 3D city model on the cloud. In eWork and eBusiness in Architecture, Engineering and Construction; CRC Press: Boca Raton, FL, USA, 2018; pp. 169–175. [Google Scholar] [CrossRef] [Scilit]
- Beani, E.; Colucci, E.; La Riccia, L.; Lingua, A.M.; Maschio, P.F.; Matrone, F.; Possa, A.; Traore, A. The 3D metric survey for the digital cartographic production to support the knowledge of the new municipality of Mappano. In Post Un-Lock: From Territorial Vulnerabilities to Local Resilience; Springer International Publishing: Cham, Switzerland, 2023; pp. 153–168. [Google Scholar] [CrossRef] [Scilit]
- Coccolo, S.; Mauree, D.; Kämpf, J.H. Urban energy simulation based on a new data model paradigm: The CityGML application domain extension energy. A case study in the EPFL campus of Lausanne. In Proceedings of the 14th International Conference of the International Building Performance Simulation Association, Hyderabad, India, 7–9 December 2015; Available online: https://infoscience.epfl.ch/bitstreams/be451584-3c26-4e50-8e82-5e889348ed79/download (accessed on 8 May 2026).
- Chun, B.; Choi, K.; Pan, Q. Key determinants of particulate matter 2.5 concentrations in urban environments with scenario analysis. Environ. Plan. B Urban Anal. City Sci. 2022, 49, 1980–1994. [Google Scholar] [CrossRef] [Scilit]
- Fischer, K.; Trometer, S. Vulnerability Analysis of Urban Areas, Assessment of Disruptive Events Based on 3D City Models to Increase Resilience. GIS. Science. 2019. Available online: https://gispoint.de/artikelarchiv/gis/2019/gisscience-ausgabe-42019/6191-vulnerability-analysis-of-urban-areas-assessment-of-disruptive-events-based-on-3d-city-models-to-increase-resilience-verwundbarkeitsanalyse-urbaner-gebiete-bewertung-von-disruptiven-ereignissen-und-die-schnittstelle-zu-3d-stadtmodellen-zur-steigerung-der-resilienz.html (accessed on 8 May 2026).
- Marzouk, M.; Othman, A. Planning utility infrastructure requirements for smart cities using the integration between BIM and GIS. Sustain. Cities Soc. 2020, 57, 102120. [Google Scholar] [CrossRef] [Scilit]
- Mutani, G.; Todeschi, V.; Kämpf, J.; Coors, V.; Fitzky, M. Building energy consumption modeling at urban scale: Three case studies in Europe for residential buildings. In 2018 IEEE International Telecommunications Energy Conference (INTELEC); IEEE: Piscataway, NJ, USA, 2018; pp. 1–8. [Google Scholar] [CrossRef] [Scilit]
- Alomía, G.; Loaiza, D.; Zúñiga, C.; Luo, X.; Asoreycacheda, R. Procedural modeling applied to the 3D city model of bogota: A case study. Virtual Real. Intell. Hardw. 2021, 3, 423–433. [Google Scholar] [CrossRef] [Scilit]
- Harikesh Singh, S.; Shrivastava, V.; Sharma, V. CityGML based 3D modeling of urban area using UAV dataset for estimation of solar potential. In International Conference on Unmanned Aerial System in Geomatics; Springer International Publishing: Cham, Switzerland, 2019; pp. 355–367. [Google Scholar] [CrossRef] [Scilit]
- Zahran, E.S.; Bennett, L.; Smith, M. An approach to represent air quality in 3D digital city models for air quality-related transport planning in urban areas. In Computing in Civil and Building Engineering, Proceedings of the International Conference; American Society of Civil Engineers: Reston, VA, USA, 2010; Volume 30, p. 19. [Google Scholar]
- Kanak, A.; Arif, İ.; Kumaş, O.; Ergün, S. Extending BIM to urban semantic context for data-driven crisis preparedness. In 2020 IEEE International Conference on Systems, Man, and Cybernetics (SMC); IEEE: Piscataway, NJ, USA, 2020; pp. 3813–3818. [Google Scholar] [CrossRef] [Scilit]
- Plume, J.; Mitchell, J. An urban information framework to support planning decision-making and urban design. In 14th International Conference on Computer Aided Architectural Design; University of Liège: Liège, Belgium, 2011; pp. 653–666. Available online: https://papers.cumincad.org/data/works/att/cf2011_p152.content.pdf (accessed on 8 May 2026).
- Depretre, A.; Jacquinod, F. Evaluating urban intensity through a City Information Model–Intermediate results from an action research project. ISPRS Ann. Photogramm. Remote Sens. Spat. Inf. Sci. 2021, 8, 153–160. [Google Scholar] [CrossRef] [Scilit]
- Eicker, U.; Monien, D.; Duminil, É.; Nouvel, R. Energy performance assessment in urban planning competitions. Appl. Energy 2015, 155, 323–333. [Google Scholar] [CrossRef] [Scilit]
- Nguyen, S.H.; Kolbe, T.H. Path-tracing semantic networks to interpret changes in semantic 3D city models. ISPRS Ann. Photogramm. Remote Sens. Spat. Inf. Sci. 2022, 10, 217–224. [Google Scholar] [CrossRef] [Scilit]
- Chaturvedi, K.; Smyth, C.S.; Gesquière, G.; Kutzner, T.; Kolbe, T.H. Managing versions and history within semantic 3D city models for the next generation of CityGML. In Advances in 3D Geoinformation; Springer International Publishing: Cham, Switzerland, 2016; pp. 191–206. [Google Scholar] [CrossRef] [Scilit] [PubMed]
- Zwolińskia, A.; Jarzemskib, M. Computing and monitoring potential of public spaces by shading analysis using LiDAR data in 3D city models. Int. Arch. Photogramm. Remote Sens. Spat. Inf. Sci. 2015, 7, W3. [Google Scholar] [CrossRef] [Scilit]
- HosseiniHaghighi, S.; Izadi, F.; Padsala, R.; Eicker, U. Using climate-sensitive 3D city modeling to analyze outdoor thermal comfort in urban areas. ISPRS Int. J. Geo-Inf. 2020, 9, 688. [Google Scholar] [CrossRef] [Scilit]
- Bi, T.; Yang, X.; Zhou, F.; Zhu, Y.; Diao, X. Research on CIM basic platform construction. In Proceedings of the 2020 8th International Conference on Information Technology: IoT and Smart City; ACM: New York, NY, USA, 2020; pp. 159–163. [Google Scholar] [CrossRef] [Scilit]
- Widl, E.; Agugiaro, G.; Peters-Anders, J. Linking semantic 3D city models with domain-specific simulation tools for the planning and validation of energy applications at district level. Sustainability 2021, 13, 8782. [Google Scholar] [CrossRef] [Scilit]
- Şengül, A. Extracting semantic building models from aerial stereo images and conversion to CityGML. Int. Arch. Photogramm. Remote Sens. Spat. Inf. Sci. 2012, 39, 321–324. [Google Scholar]
- Li, M.; Xue, F.; Wu, Y.; Yeh, A.G. A room with a view: Automatic assessment of window views for high-rise high-density areas using City Information Models and deep transfer learning. Landsc. Urban Plan. 2022, 226, 104505. [Google Scholar] [CrossRef] [Scilit]
- Aschwanden, G.D.; Haegler, S.; Bosché, F.; Van Gool, L.; Schmitt, G. Empiric design evaluation in urban planning. Autom. Constr. 2011, 20, 299–310. [Google Scholar] [CrossRef] [Scilit]
- Aschwanden, G.D.; Wullschleger, T.; Müller, H.; Schmitt, G. Agent-Based Emission Evaluation of Traffic in Dynamic City Models. In Future Cities: Proceedings of the 28th eCAADe Conference, Zurich, Switzerland, 15–18 September 2010; Education and Research in Computer Aided Architectural Design in Europe: Brussels, Belgium, 2010; pp. 717–726. [Google Scholar]
- Hong, T.; Luo, X. Modeling building energy performance in urban context. In Proceedings of the 2018 Building Performance Analysis Conference and SimBuild Co-Organized by ASHRAE and IBPSA-USA, Chicago, IL, USA, 26–28 September 2018; ASHRAE: Peachtree Corners, GA, USA, 2018; Volume 26, Available online: https://publications.ibpsa.org/proceedings/simbuild/2018/papers/simbuild2018_C015.pdf (accessed on 8 May 2026).
- Chang, Y.T.; Sierra, E.M.; Hsieh, S.H. Combining BIM & GIS information to simulate circularity of building stocks in a city—A case study of Taipei City. IOP Conf. Ser. Earth Environ. Sci. 2022, 1122, 012025. [Google Scholar] [CrossRef] [Scilit]
- Leszek, K. Environmental and urban spatial analysis based on a 3D city model. In International Conference on Computational Science and Its Applications; Springer International Publishing: Cham, Switzerland, 2015; pp. 633–645. [Google Scholar] [CrossRef] [Scilit]
- Amirebrahimi, S.; Rajabifard, A.; Mendis, P.; Ngo, T. A framework for a microscale flood damage assessment and visualization for a building using BIM–GIS integration. Int. J. Digit. Earth 2016, 9, 363–386. [Google Scholar] [CrossRef] [Scilit]
- Vishnu, E.; Sameer, S. OGC CityGML 3D city models enriched with utility infrastructures for developing countries. J. Indian Soc. Remote Sens. 2021, 49, 813–826. [Google Scholar] [CrossRef] [Scilit]
- Murshed, S.M.; Lindsay, A.; Picard, S.; Simons, A. PLANTING: Computing high spatio-temporal resolutions of photovoltaic potential of 3D city models. In The Annual International Conference on Geographic Information Science; Springer International Publishing: Cham, Switzerland, 2018; pp. 27–53. [Google Scholar] [CrossRef] [Scilit]
- Alva, P.; Mosteiro-Romero, M.; Miller, C.; Stouffs, R. Digital twin-based resilience evaluation of district-scale archetypes. In 27th International Conference on Computer-Aided Architectural Design Research in Asia: Post-Carbon, CAADRIA; Association for Computer-Aided Architectural Design Research in Asia (CAADRIA): Hong Kong, China, 2022; pp. 525–534. [Google Scholar] [CrossRef] [Scilit]
- Sharkawi, K.H.; Rahman, A.A. Towards an Efficient City Inventory Management System for Urban Authorities in Developing Countries–The Case of 3D Change Detection. Electron. J. Inf. Syst. Dev. Ctries. 2014, 60, 1–13. [Google Scholar] [CrossRef] [Scilit]
- Akl, M.H.; Sheta, S.A.; ElGizawi, L. Application of BIM/GIS-based integrated models on the historic urban districts of Rosetta city, Egypt. Ital. J. Plan. Pract. 2023, 13, 24–46. [Google Scholar]
- Nguyen, S.H.; Kolbe, T.H. A multi-perspective approach to interpreting spatio-semantic changes of large 3D city models in CityGML using a graph database. ISPRS Ann. Photogramm. Remote Sens. Spat. Inf. Sci. 2020, 6, 143–150. [Google Scholar] [CrossRef] [Scilit]
- HosseiniHaghighi, S.; de Uribarri, P.M.Á.; Padsala, R.; Eicker, U. Characterizing and structuring urban GIS data for housing stock energy modelling and retrofitting. Energy Build. 2022, 256, 111706. [Google Scholar] [CrossRef] [Scilit]
- Zirak, M.; Weiler, V.; Hein, M.; Eicker, U. Urban models enrichment for energy applications: Challenges in energy simulation using different data sources for building age information. Energy 2020, 190, 116292. [Google Scholar] [CrossRef] [Scilit]
- Luo, Y.; He, J.; Ni, Y. Analysis of urban ventilation potential using rule-based modeling. Comput. Environ. Urban Syst. 2017, 66, 13–22. [Google Scholar] [CrossRef] [Scilit]
- Fricke, A.; Döllner, J.; Asche, H. A virtual 3D city model for urban planning and decision-making-the east jerusalem case. In International Conference on Computational Science and Its Applications; Springer International Publishing: Cham, Switzerland, 2022; pp. 144–159. [Google Scholar] [CrossRef] [Scilit] [PubMed]
- Tang, L.; Chen, C.; Li, H.; Mak, D.Y.Y. Developing a BIM GIS–integrated method for urban underground piping management in China: A case study. J. Constr. Eng. Manag. 2022, 148, 05022004. [Google Scholar] [CrossRef] [Scilit]
- Hijazi, I.H.; Krauth, T.; Donaubauer, A.; Kolbe, T. 3DCITYDB4BIM: A system architecture for linking bim server and 3d citydb for bim-gis-integration. ISPRS Ann. Photogramm. Remote Sens. Spat. Inf. Sci. 2020, 4, 195–202. [Google Scholar] [CrossRef] [Scilit]
- Agius, T.; Sabri, S.; Kalantari, M. Three-Dimensional Rule-Based City Modelling to Support Urban Redevelopment Process. ISPRS Int. J. Geo-Inf. 2018, 7, 413. [Google Scholar] [CrossRef] [Scilit]
- Schüler, N.; Agugiaro, G.; Cajot, S.; Maréchal, F. Linking interactive optimization for urban planning with a semantic 3D city model. ISPRS Ann. Photogramm. Remote Sens. Spat. Inf. Sci. 2018, 4, 179–186. [Google Scholar] [CrossRef] [Scilit]
- Hristov, P.O.; Petrova-Antonova, D.; Ilieva, S.; Rizov, R. Enabling city digital twins through urban living labs. Int. Arch. Photogramm. Remote Sens. Spat. Inf. Sci. 2022, 43, 151–156. [Google Scholar] [CrossRef] [Scilit]
- El Meouche, R.; Eslahi, M.; Ruas, A. Investigating the Effects of Population Growth and Urban Fabric on the Simulation of a 3D City Model. In The Proceedings of the Third International Conference on Smart City Applications; Springer International Publishing: Cham, Switzerland, 2020; pp. 1344–1358. [Google Scholar] [CrossRef] [Scilit]
- Chundeli, F.A. Using 3D GIS as a decision support tool in urban planning. In Proceedings of the 10th International Conference on Theory and Practice of Electronic Governance; ACM: New York, NY, USA, 2017; pp. 401–404. [Google Scholar] [CrossRef] [Scilit]
- Saretta, E.; Bonomo, P.; Frontini, F. A calculation method for the BIPV potential of Swiss façades at LOD2. 5 in urban areas: A case from Ticino region. Sol. Energy 2020, 195, 150–165. [Google Scholar] [CrossRef] [Scilit]
- Ali, I.; Khan, A.A.; Qureshi, S.; Umar, M.; Haase, D.; Hijazi, I. A hybrid approach integrating 3D city models, remotely sensed SAR data and interval-valued fuzzy soft set based decision making for post disaster mapping of urban areas. In 3D Geoinformation Science: The Selected Papers of the 3D GeoInfo 2014; Springer International Publishing: Cham, Switzerland, 2014; pp. 87–105. [Google Scholar] [CrossRef] [Scilit]
- Sinning-Meister, M.; Gruen, A.; Dan, H. 3D City models for CAAD-supported analysis and design of urban areas. ISPRS J. Photogramm. Remote Sens. 1996, 51, 196–208. [Google Scholar] [CrossRef] [Scilit]
- Zhang, X.; Zhu, Q. Applications of 3D City Models Based Spatial Analysis to Urban Design. Int. Arch. Photogramm. Remote Sens. Spat. Inf. Sci. 2004, 35. [Google Scholar]
- Nichol, J.; Wong, M.S. Modeling urban environmental quality in a tropical city. Landsc. Urban Plan. 2005, 73, 49–58. [Google Scholar] [CrossRef] [Scilit]
- Chan, C.S.; Dang, A.; Tong, Z. A 3D Model of the Inner City of Beijing. In Computer Aided Architectural Design Futures 2005; Martens, B., Brown, A., Eds.; Springer: Dordrecht, The Netherlands, 2005. [Google Scholar] [CrossRef] [Scilit]
- Zhang, X.; Zhu, Q.; Wang, J. 3D city models based spatial analysis to urban design. Geogr. Inf. Sci. 2004, 10, 82–86. [Google Scholar] [CrossRef] [Scilit]
- Aditya, T.; Andaru, R.; Latif, A.; Wijaya, C. Envisioning City Digital Twins in Indonesia: From Urban Management Concept to Implementation; GIM International: Lemmer, The Netherlands, 2025; Available online: https://www.gim-international.com/content/article/envisioning-city-digital-twins-in-indonesia (accessed on 8 May 2026).
- Montenegro, N.; Gomes, J.C.; Urbano, P.; Duarte, J.P. A land use planning ontology: LBCS. Future Internet 2012, 4, 65–82. [Google Scholar] [CrossRef] [Scilit]
- Krüger, A.; Kolbe, T.H. Building analysis for urban energy planning using key indicators on virtual 3D city models–the Energy Atlas of Berlin. Int. Arch. Photogramm. Remote Sens. Spat. Inf. Sci. 2012, 39, 145–150. [Google Scholar] [CrossRef] [Scilit]
- Montenegro, N.; Gomes, J.; Urbano, P.; Duarte, J. An OWL2 land use ontology: LBCS. In International Conference on Computational Science and Its Applications; Springer Berlin Heidelberg: Berlin/Heidelberg, Germany, 2011; pp. 185–198. [Google Scholar] [CrossRef] [Scilit]
- Góźdź, K.; Pachelski, W. The Use of CITYGML Standard in the Context of Creating Smart Cities. Int. Multidiscip. Sci. GeoConference SGEM 2015, 2, 883–889. [Google Scholar]
- Jaillot, V.; Pedrinis, F.; Servigne, S.; Gesquière, G. A generic approach for sunlight and shadow impact computation on large city models. In 25th International Conference on Computer Graphics, Visualization and Computer Vision 2017; University of West Bohemia: Plzeň, Czech Republic, 2017; Available online: https://hal.science/hal-01559175v1 (accessed on 8 May 2026).
- Montenegro, N.C.; Duarte, J.P. Computational Ontology of Urban Design: Towards a City Information Model. In Computation: The New Realm of Architectural Design: Proceedings of the 27th eCAADe Conference, Istanbul, Turkey, 16–19 September 2009; Education and Research in Computer Aided Architectural Design in Europe: Brussels, Belgium, 2009; pp. 253–260. [Google Scholar] [CrossRef] [Scilit]
- Robles-Ortega, M.D.; Ortega, L.; Coelho, A.; Feito, F.; de Sousa, A. Automatic street surface modeling for web-based urban information systems. J. Urban Plan. Dev. 2013, 139, 40–48. [Google Scholar] [CrossRef] [Scilit]
- Zhu, J.; Wu, P. Towards Effective BIM/GIS Data Integration for Smart City by Integrating Computer Graphics Technique. Remote Sens. 2021, 13, 1889. [Google Scholar] [CrossRef] [Scilit]
- Stoter, J.; Peters, R.; Commandeur, T.; Dukai, B.; Kumar, K.; Ledoux, H. Automated reconstruction of 3D input data for noise simulation. Comput. Environ. Urban Syst. 2020, 80, 101424. [Google Scholar] [CrossRef] [Scilit]
- Delval, T.; Jolibois, A.; Carré, S.; Aguinaga, S.; Mailhac, A.; Brachet, A.; Soula, J.; Deom, S. Building/city information model for simulation and data management. In eWork and eBusiness in Architecture, Engineering and Construction, 1st ed.; Karlshøj, J., Scherer, R., Eds.; CRC Press: Boca Raton, FL, USA, 2018; pp. 137–145. [Google Scholar] [CrossRef] [Scilit]
- Grimaldi, M.; Giordano, C.; Graziuso, G.; Barba, S.; Fasolino, I. A GIS-BIM Approach for the Evaluation of Urban Transformations. A Methodological Proposal. Wseas Trans. Environ. Dev. 2022, 18, 247–254. [Google Scholar] [CrossRef] [Scilit]
- Shi, J.; Pan, Z.; Jiang, L.; Zhai, X. An ontology-based methodology to establish city information model of digital twin city by merging BIM, GIS and IoT. Adv. Eng. Inform. 2023, 57, 102114. [Google Scholar] [CrossRef] [Scilit]
- Su, S.; Ju, J.; Guo, Q.; Li, X.; Zhu, Y. A temporally dynamic model for regional carbon impact assessment based on city information modeling. Renew. Sustain. Energy Rev. 2023, 173, 113076. [Google Scholar] [CrossRef] [Scilit]
- Chen, K.; Lu, W.; Xue, F.; Tang, P.; Li, L.H. Automatic building information model reconstruction in high-density urban areas: Augmenting multi-source data with architectural knowledge. Autom. Constr. 2018, 93, 22–34. [Google Scholar] [CrossRef] [Scilit]
- Mignard, C.; Nicolle, C. Merging BIM and GIS using ontologies application to urban facility management in ACTIVe3D. Comput. Ind. 2014, 65, 1276–1290. [Google Scholar] [CrossRef] [Scilit]
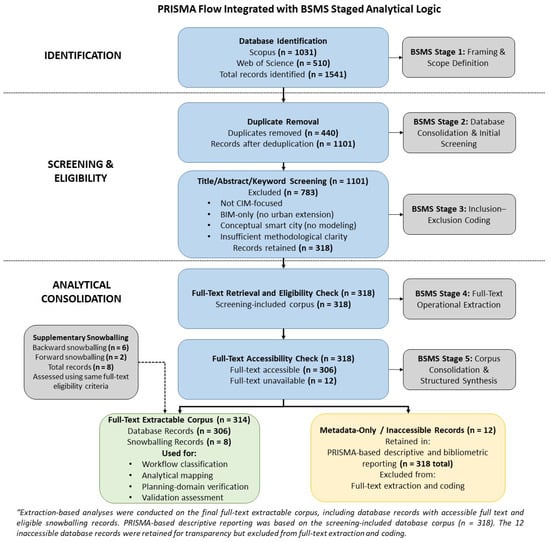
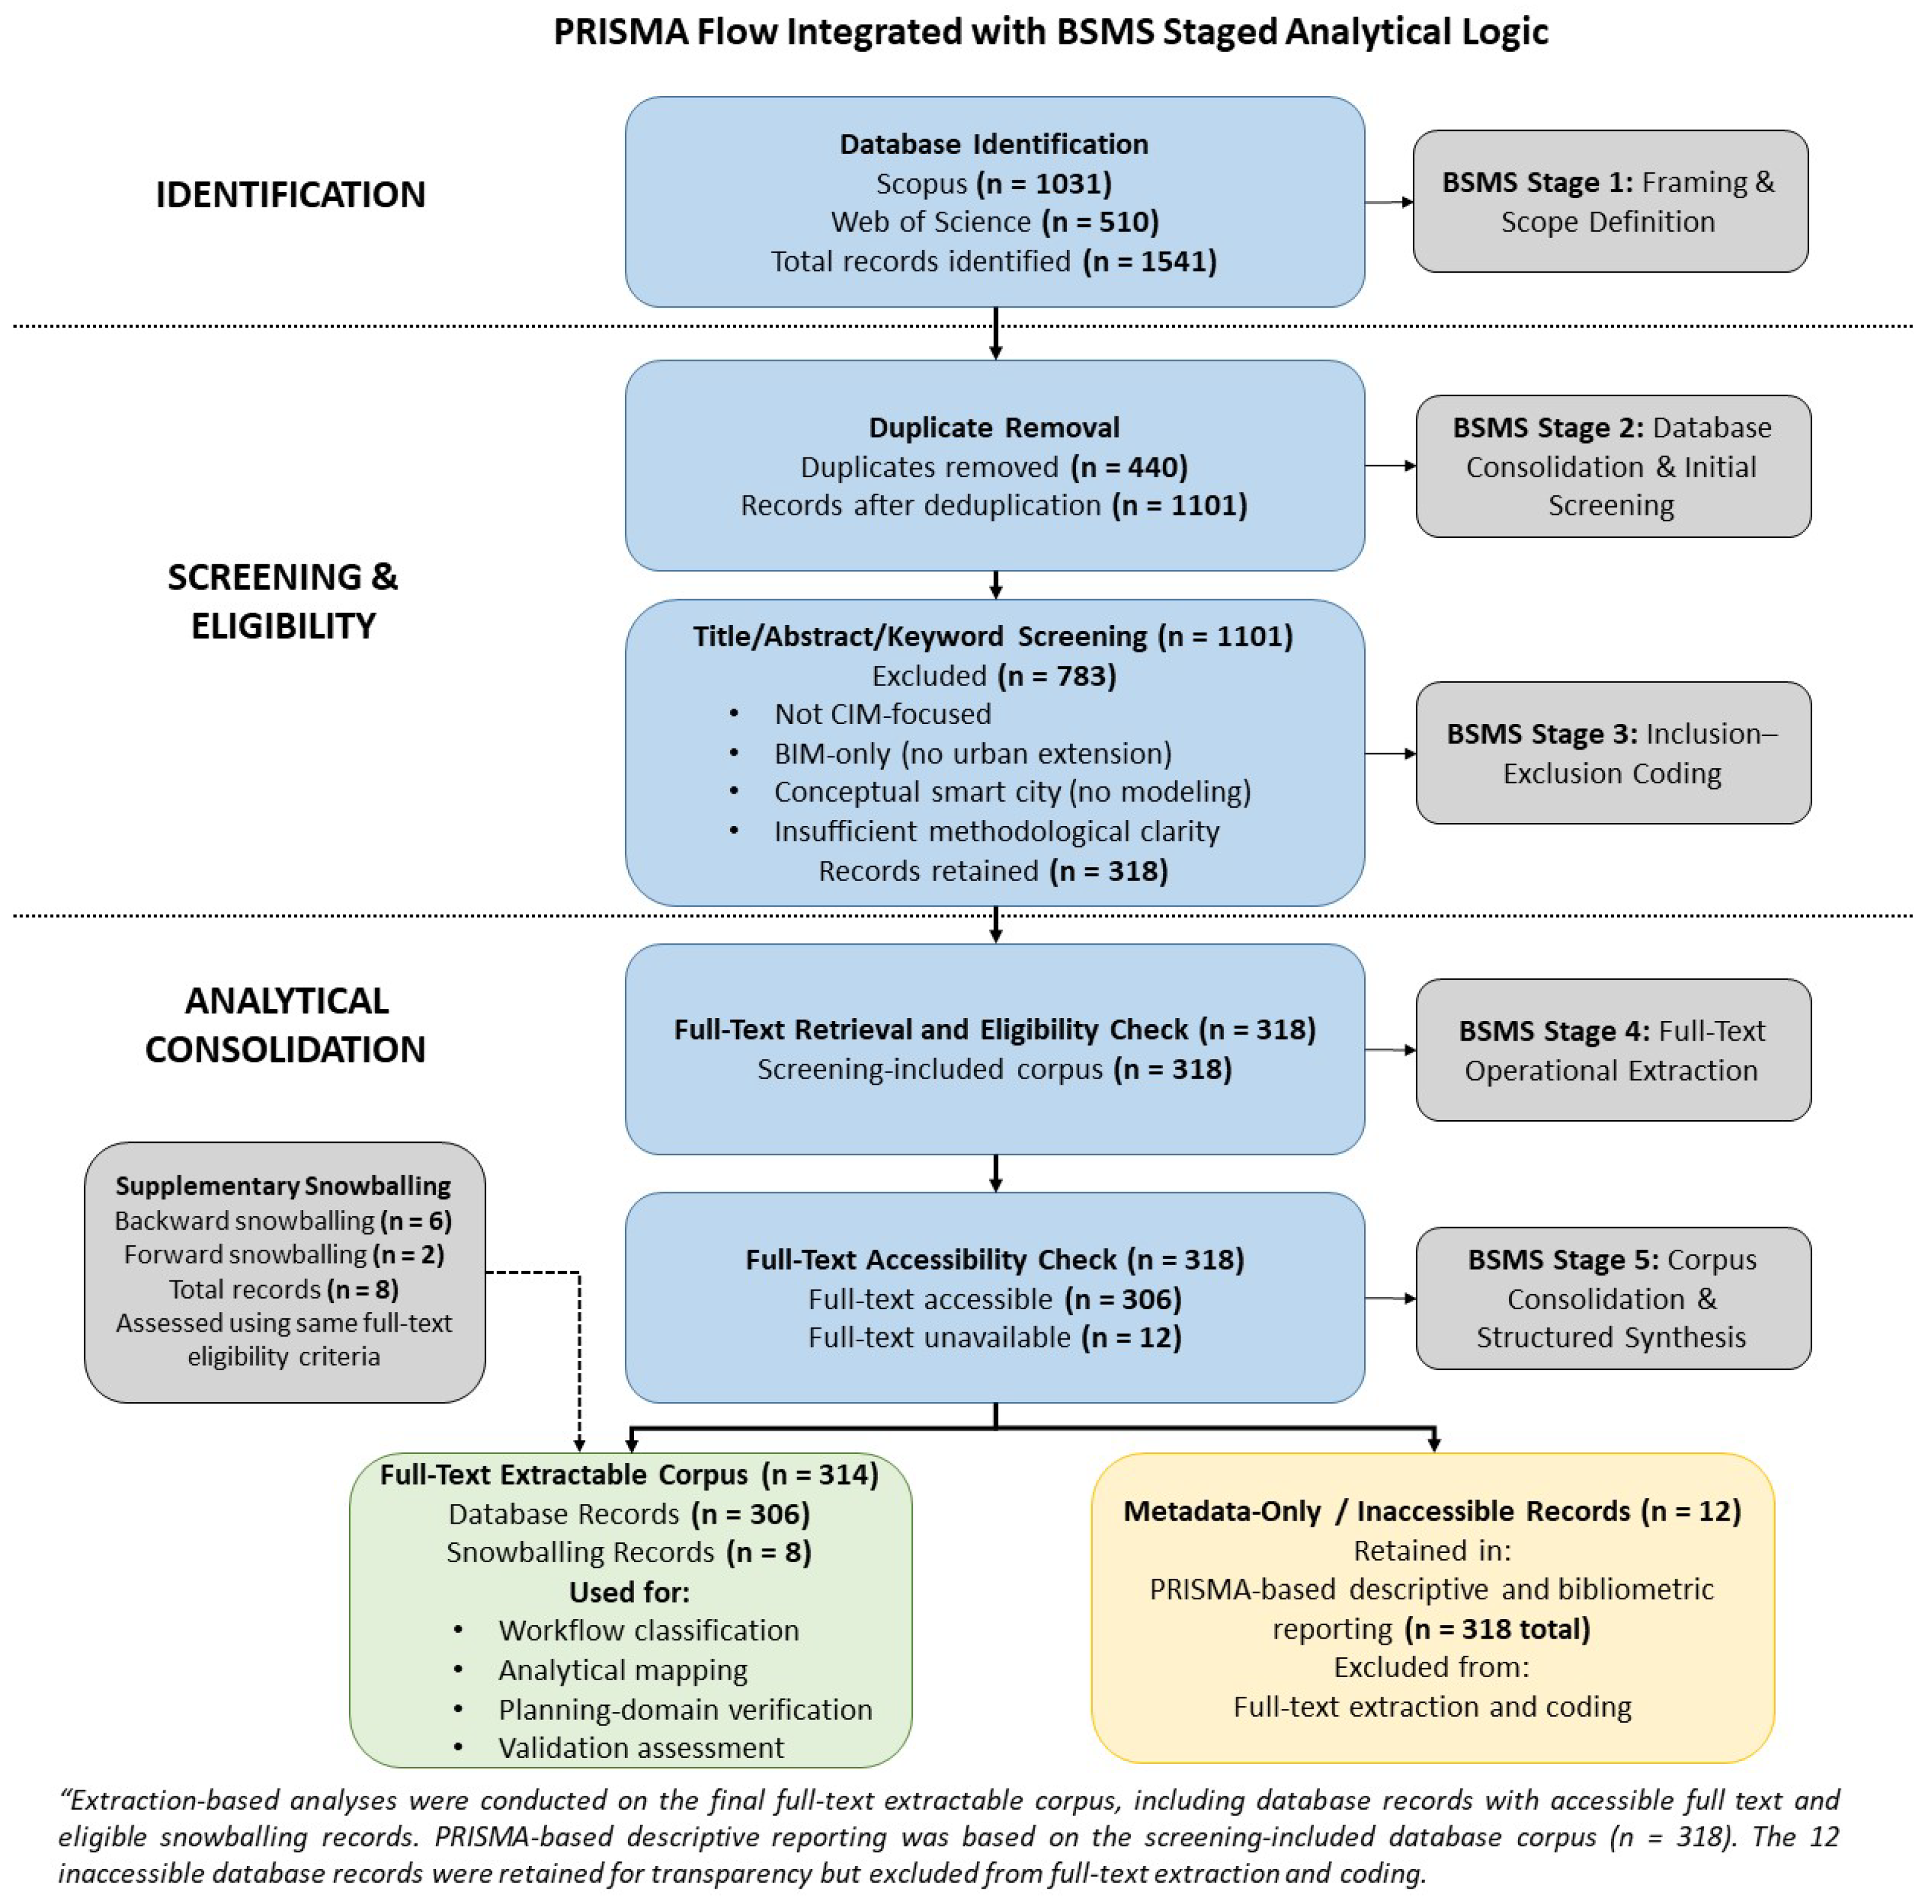
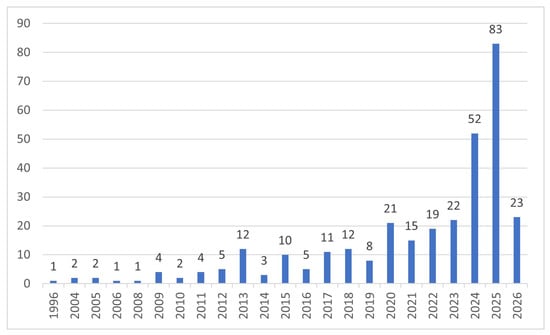
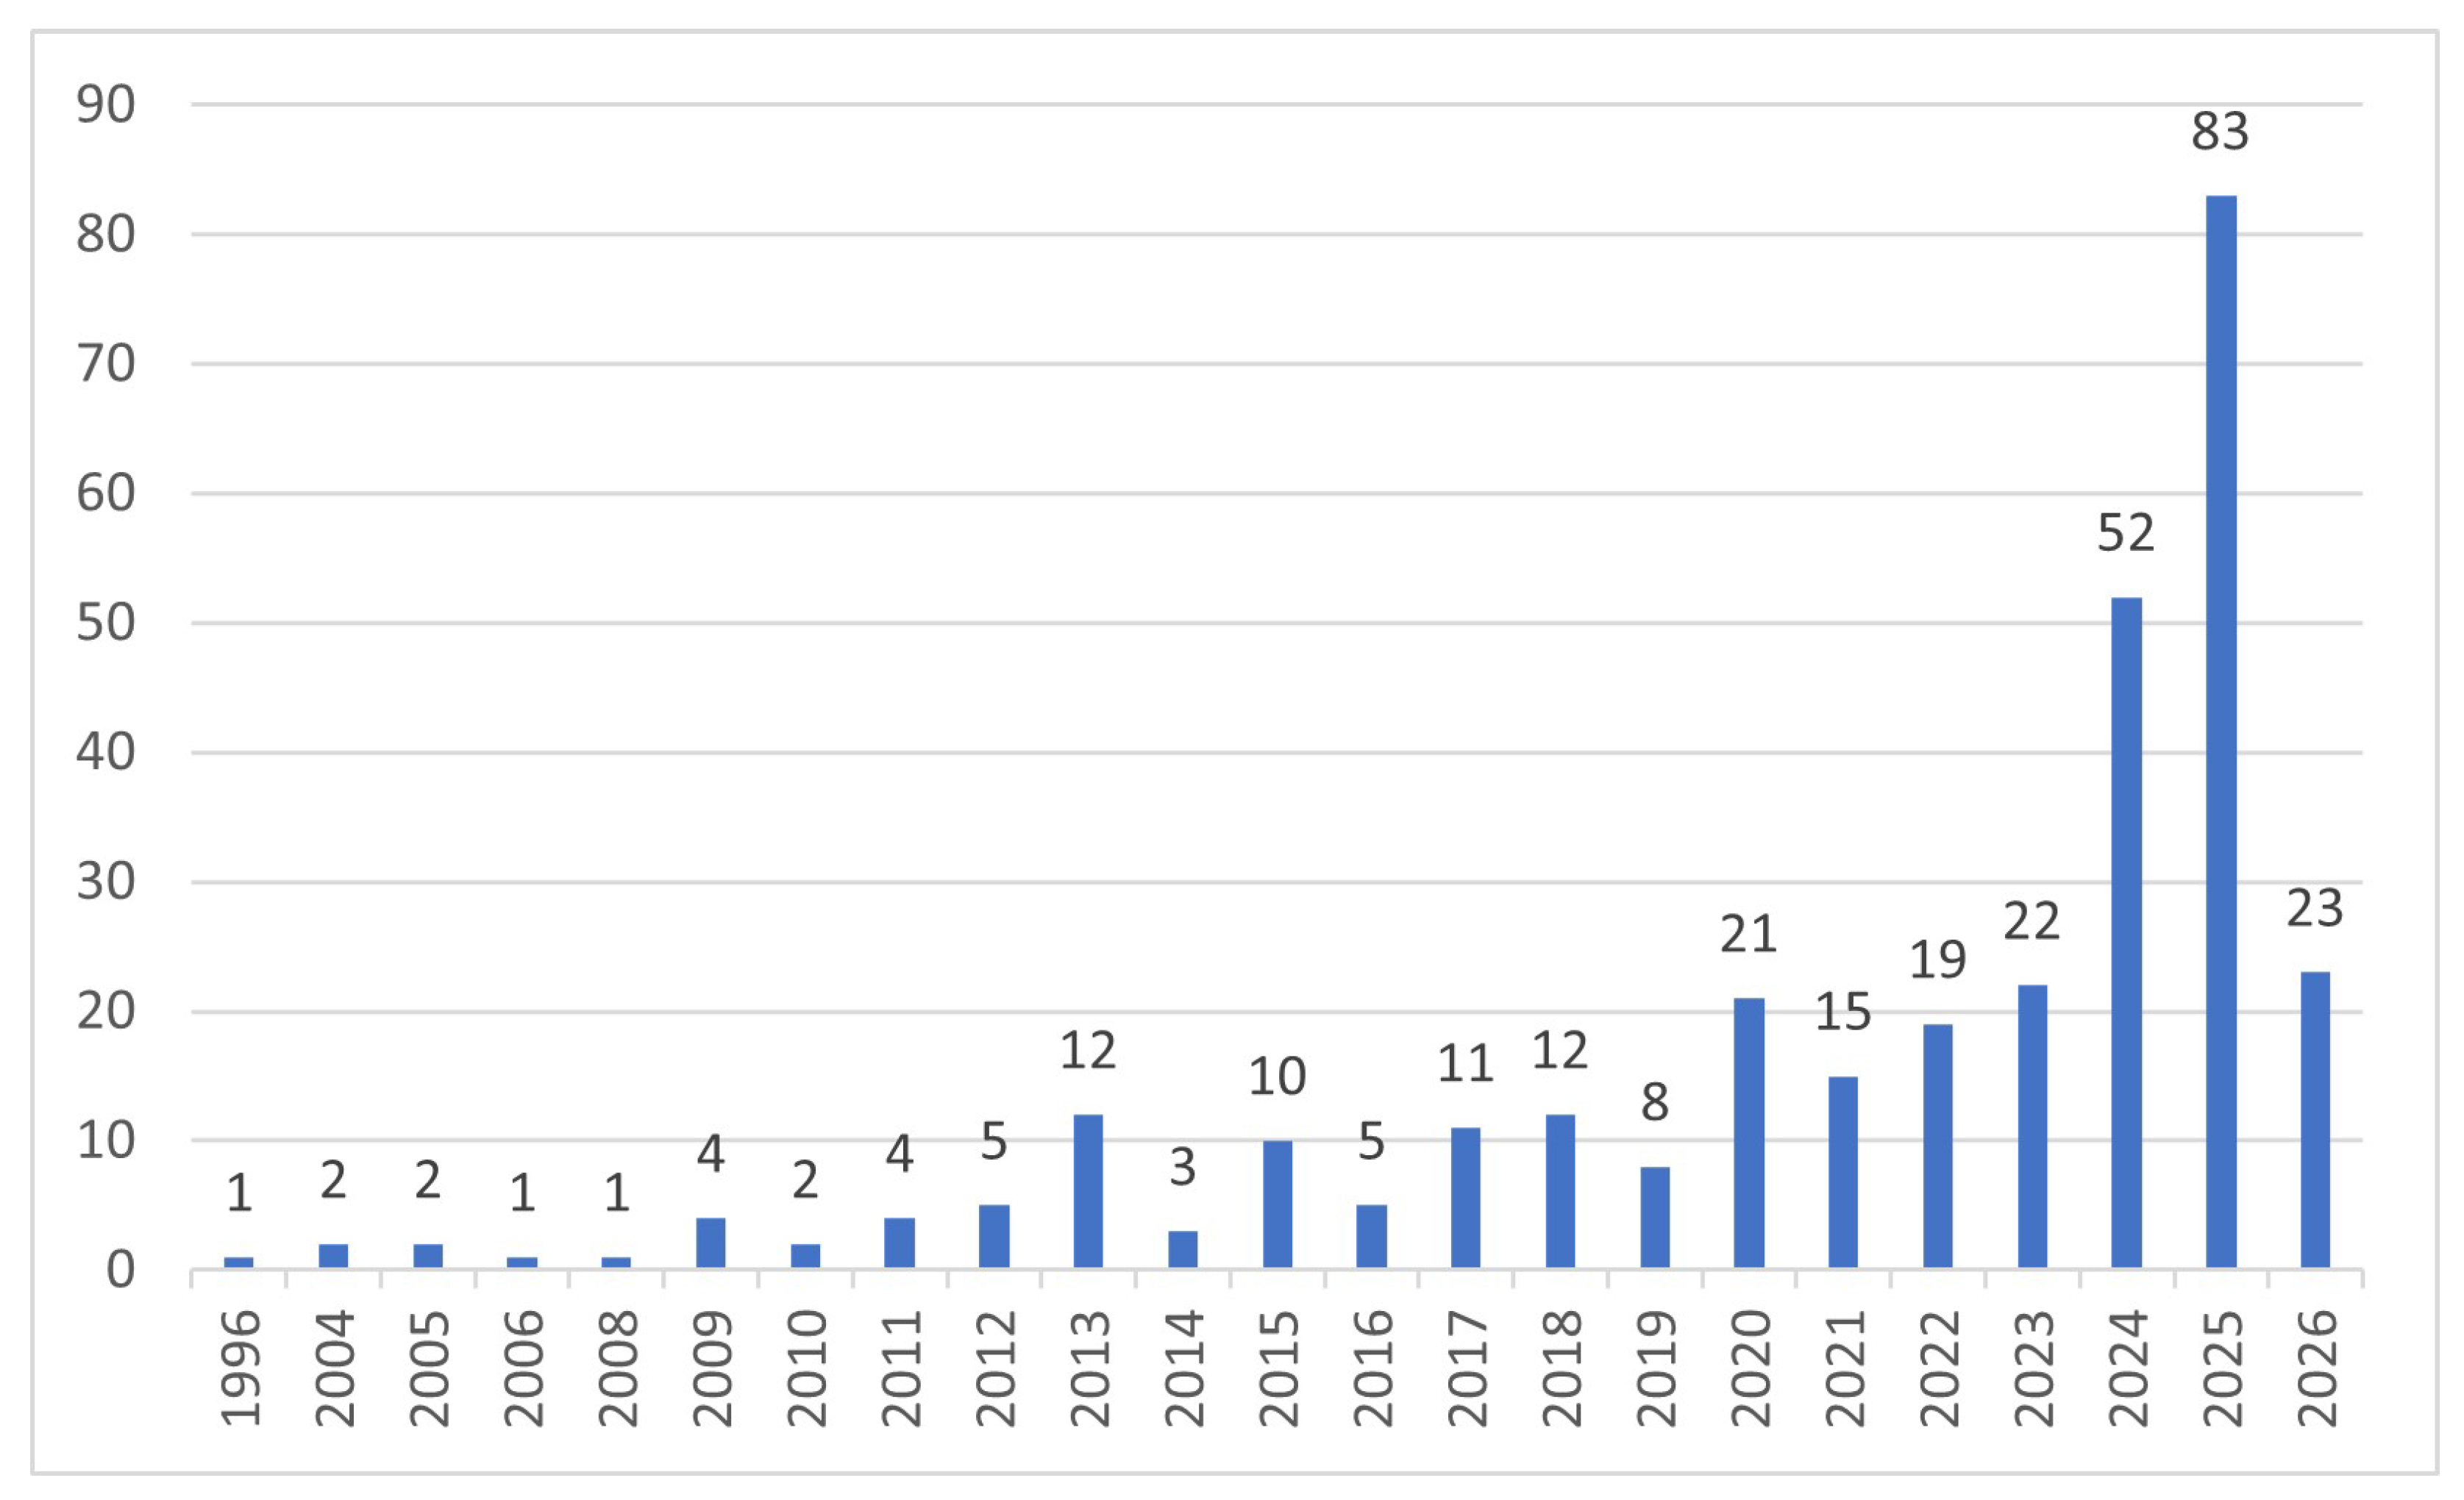
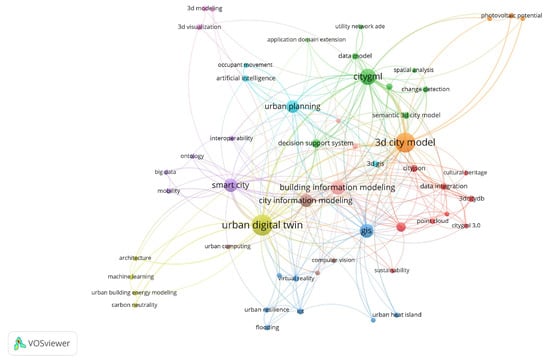
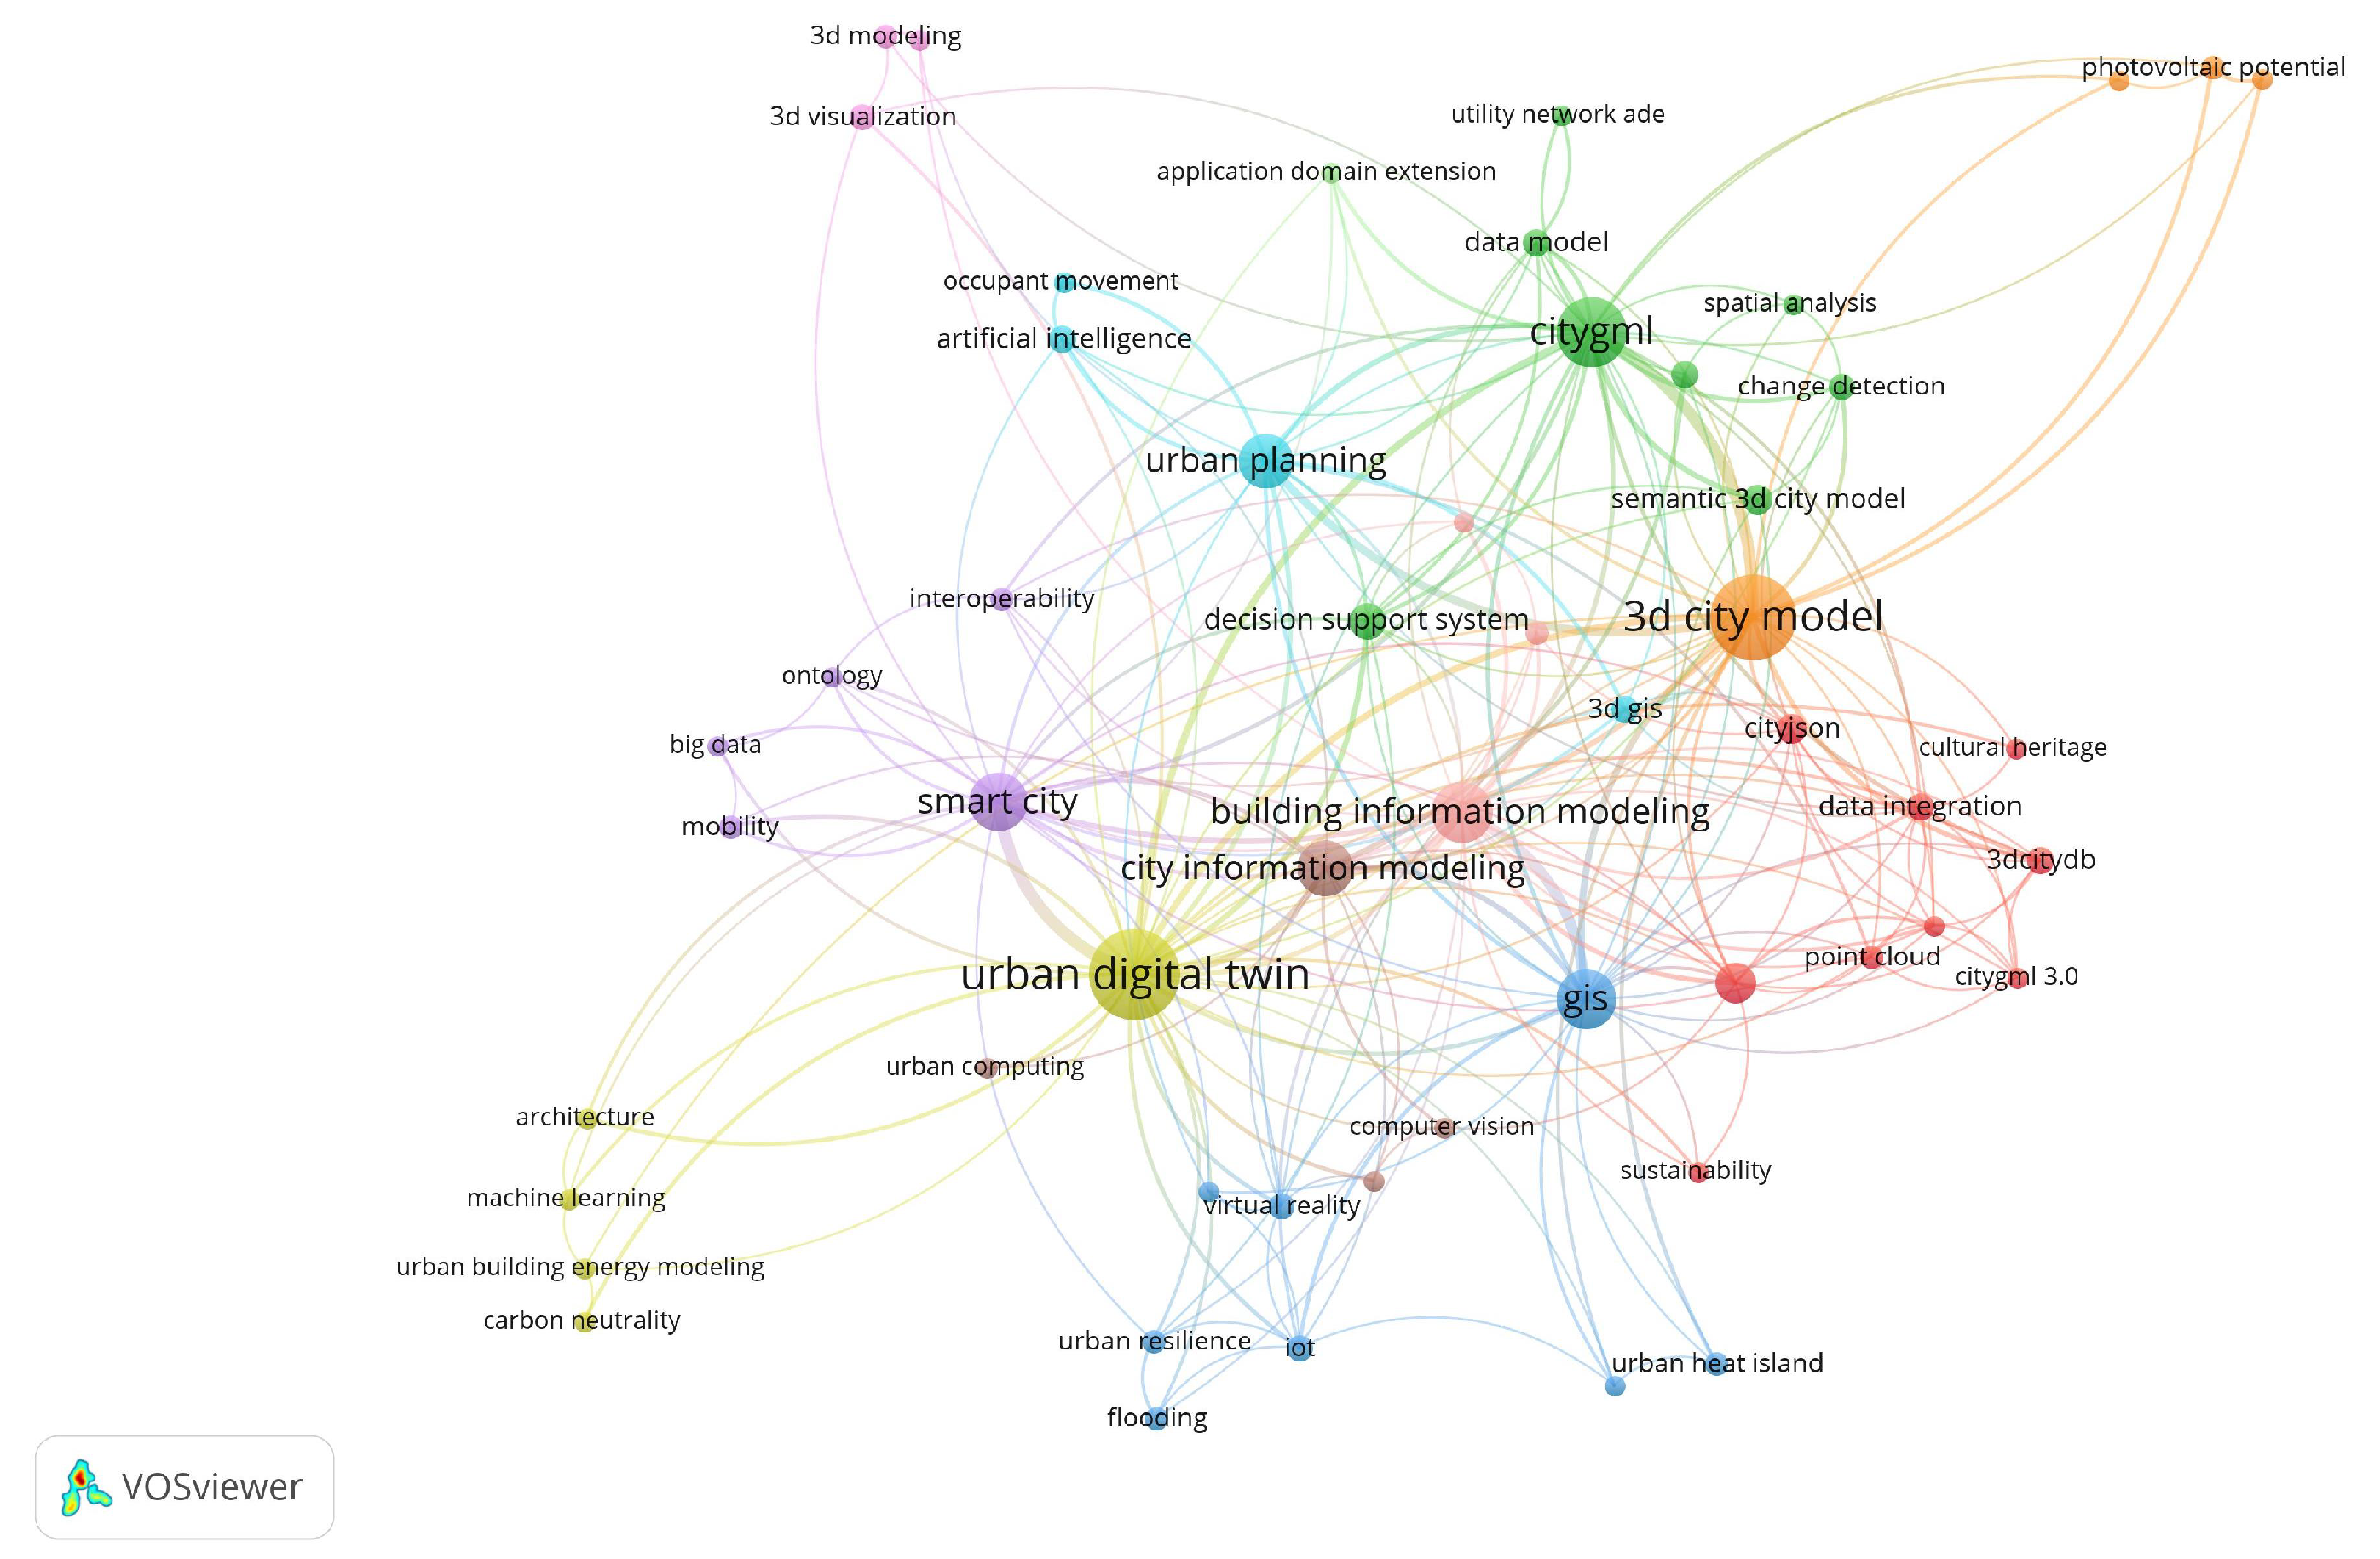
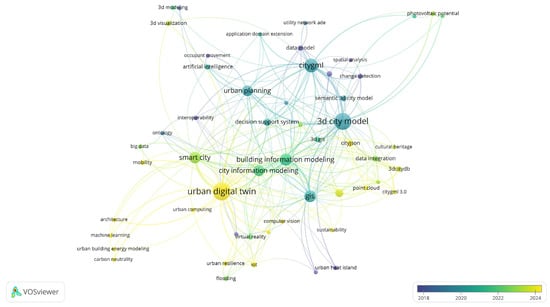
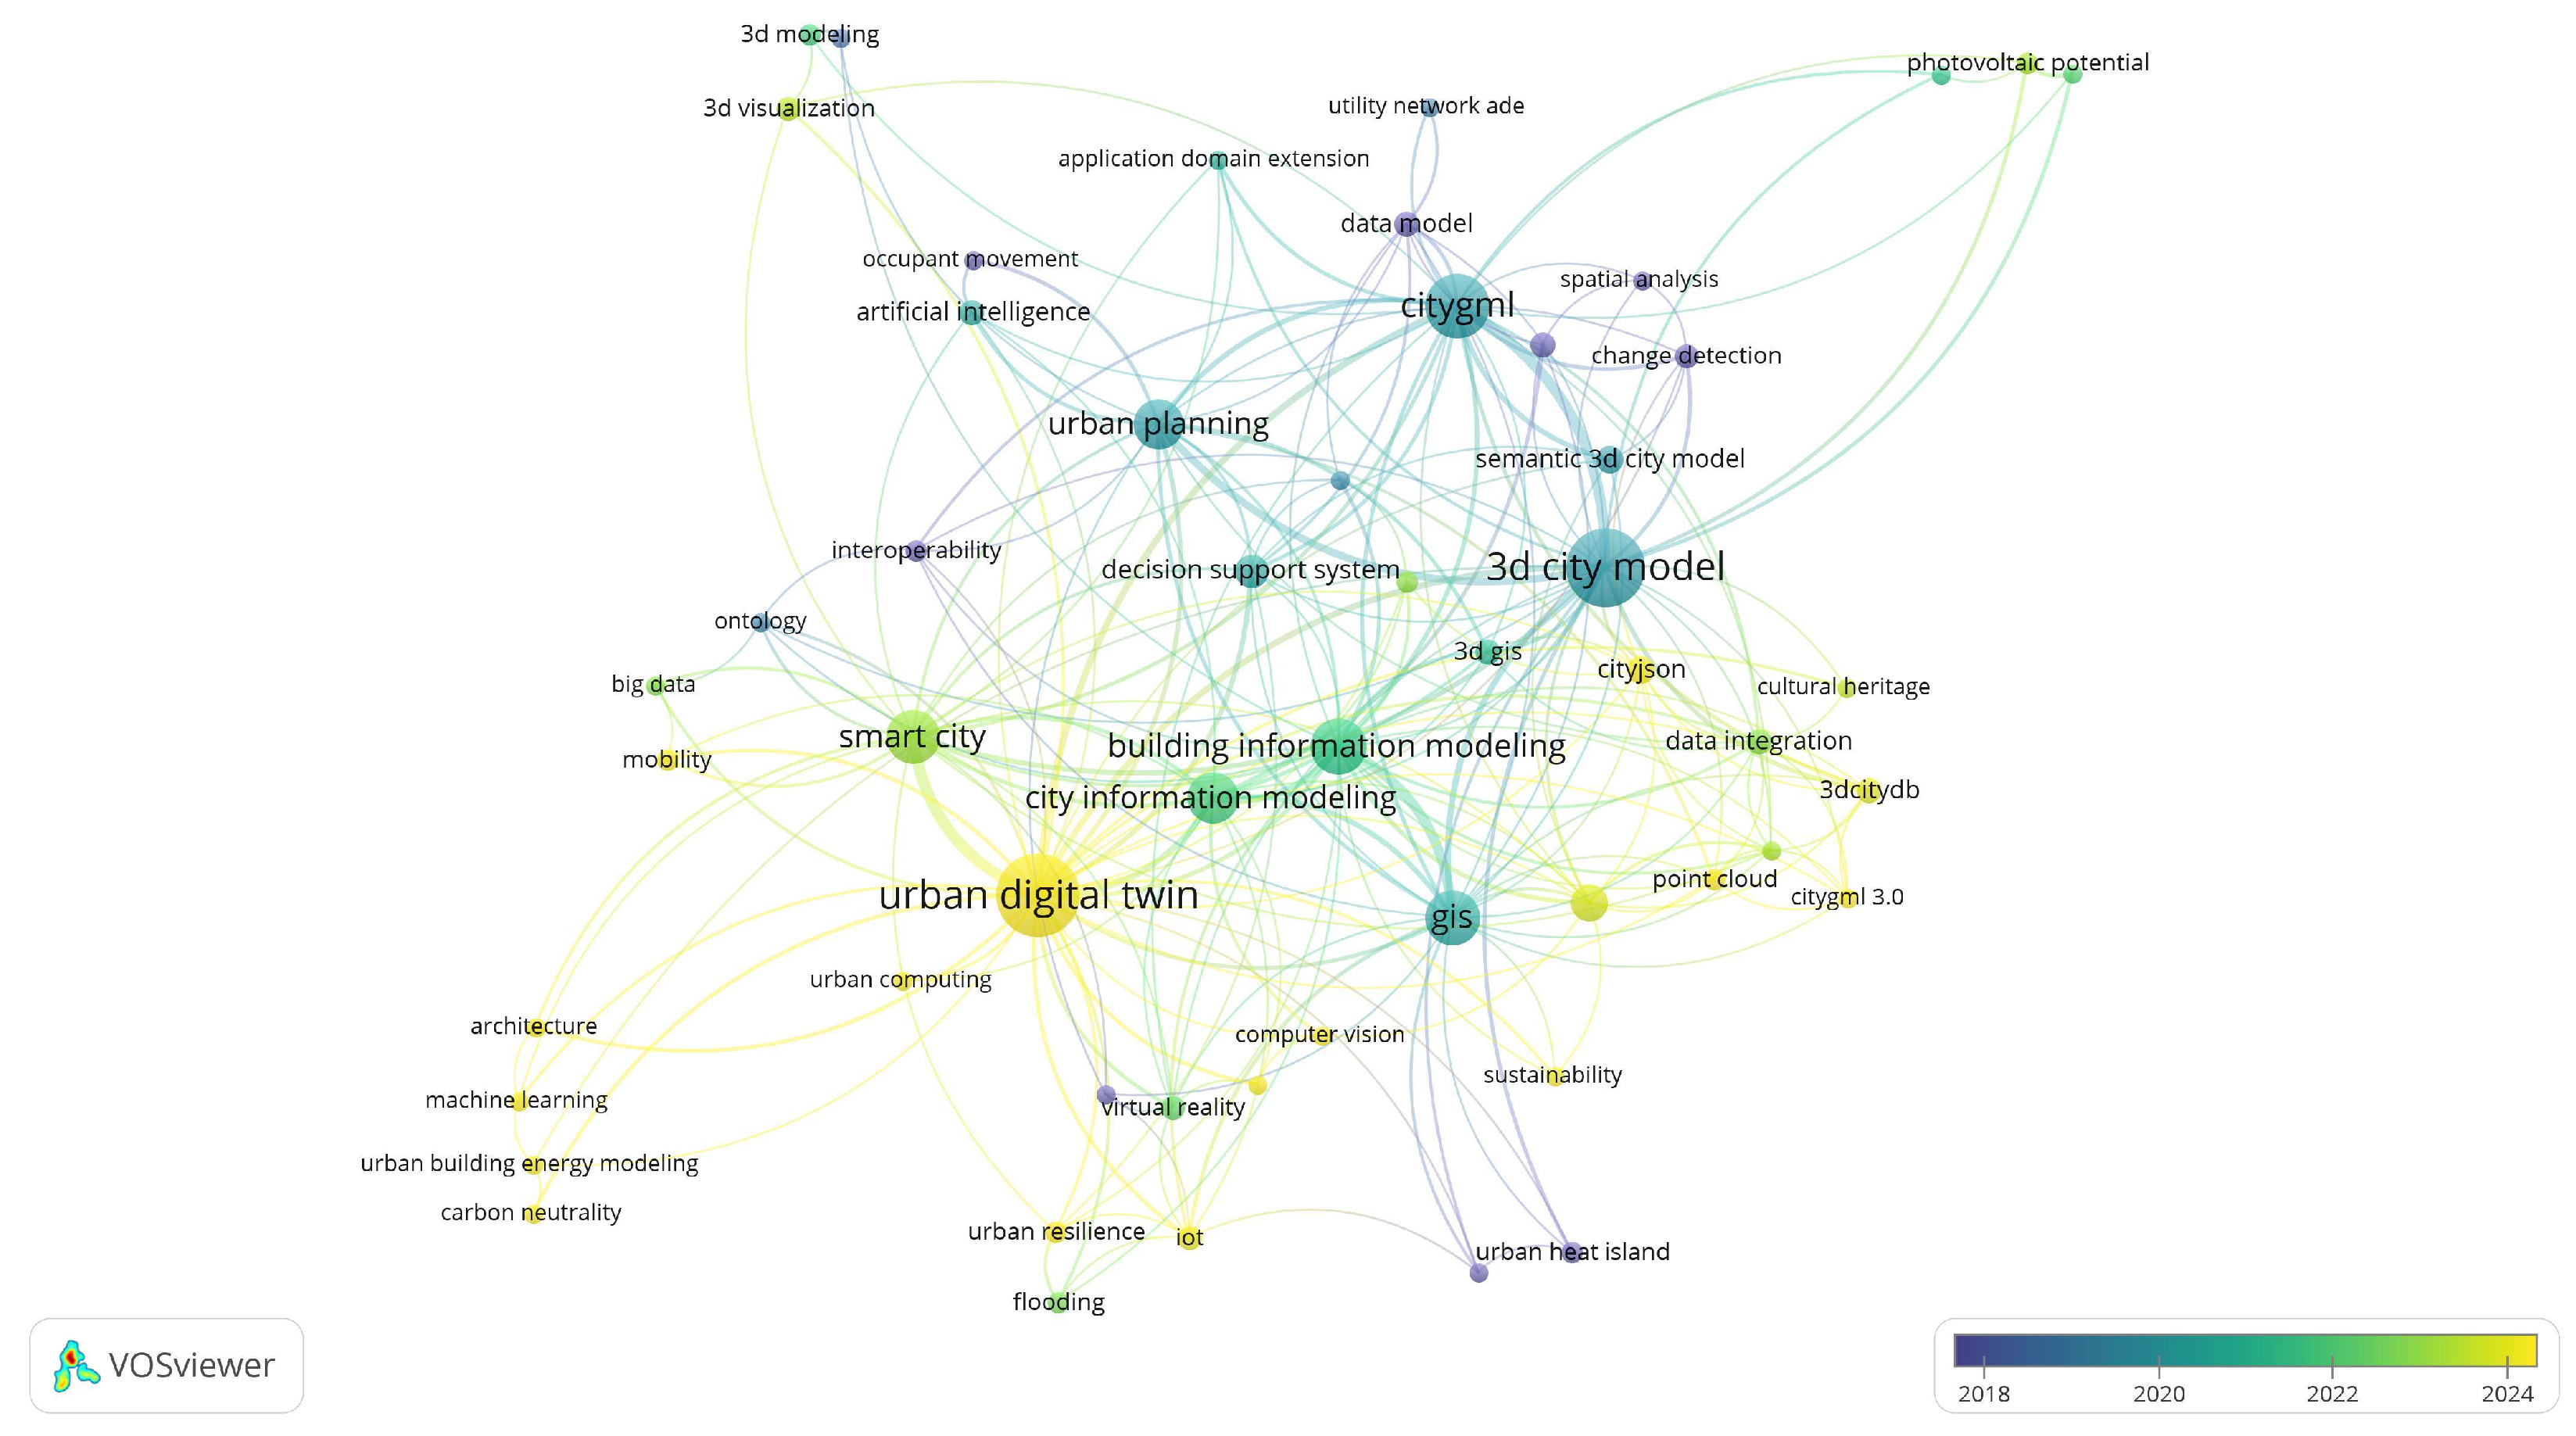
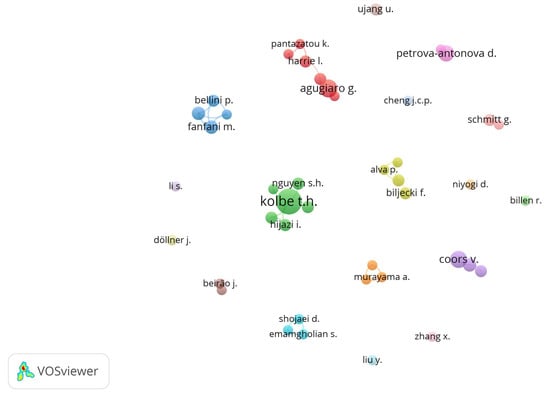
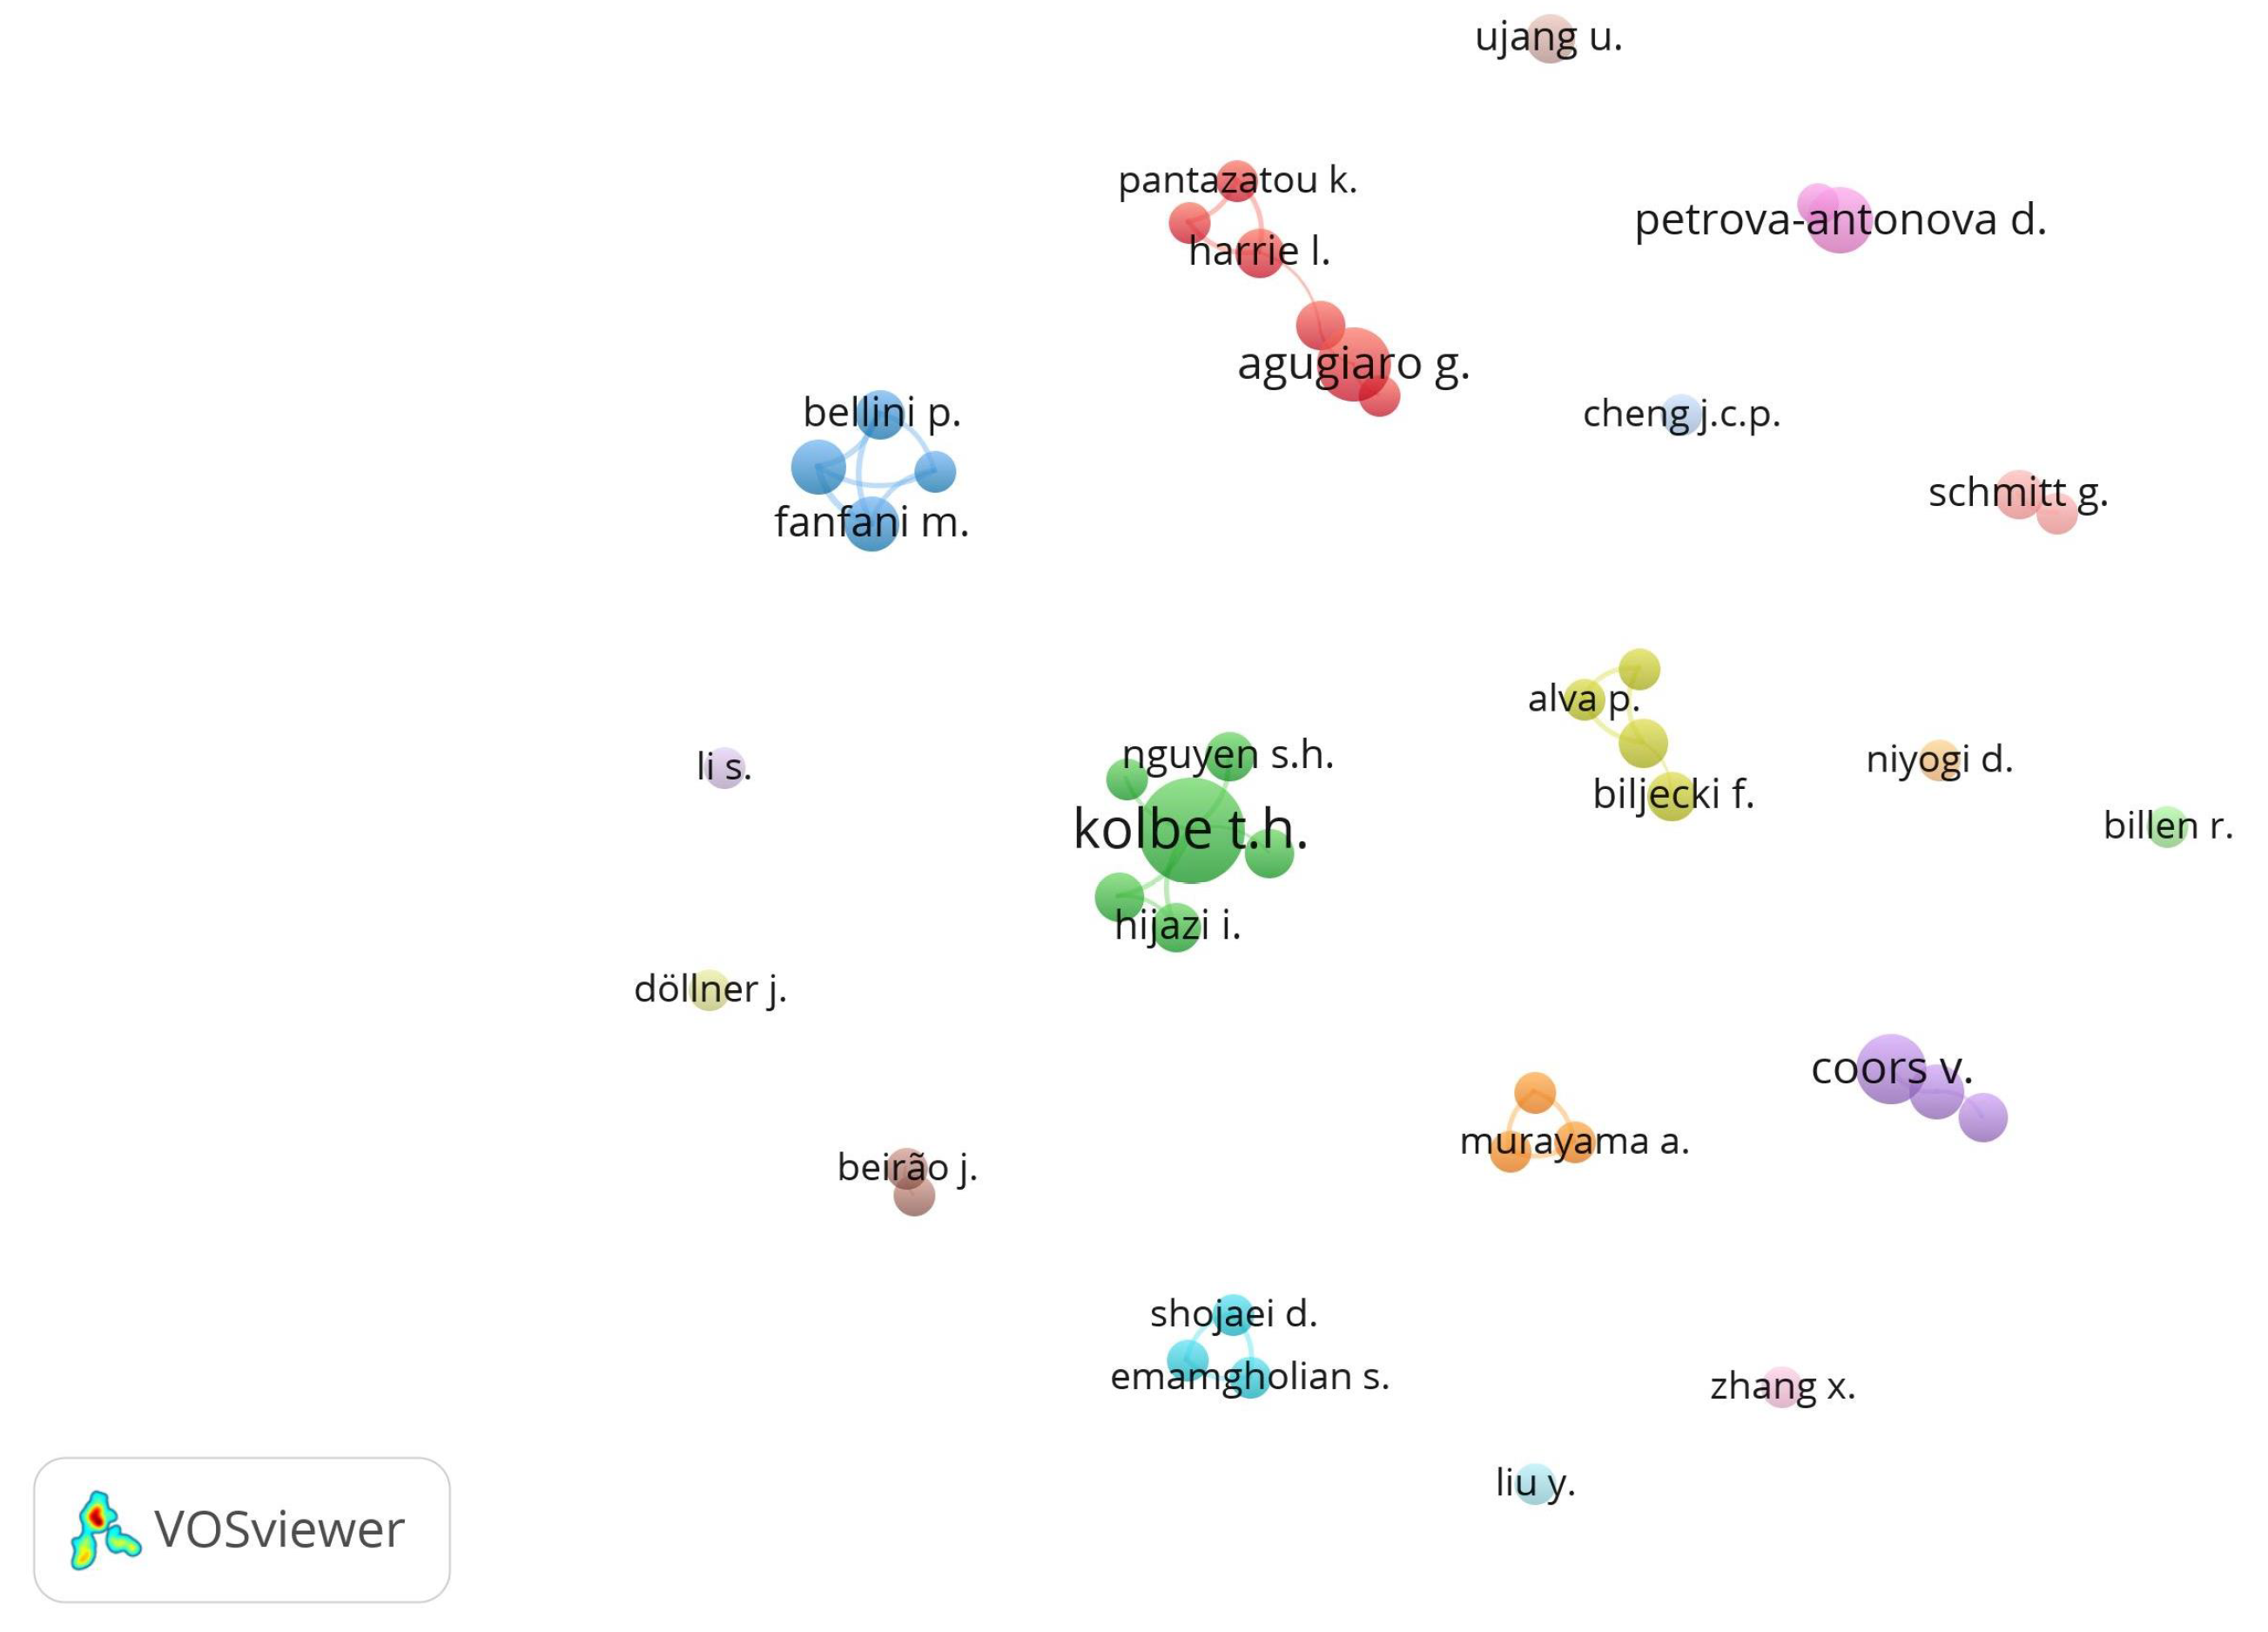
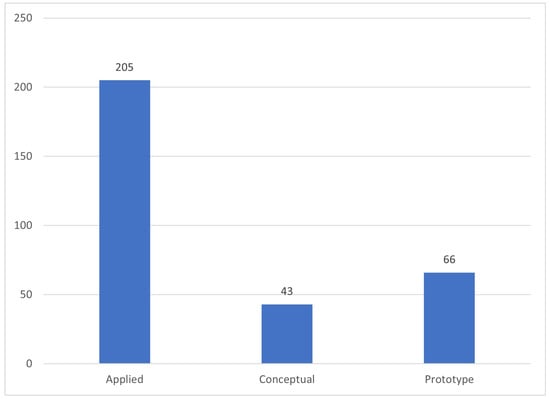
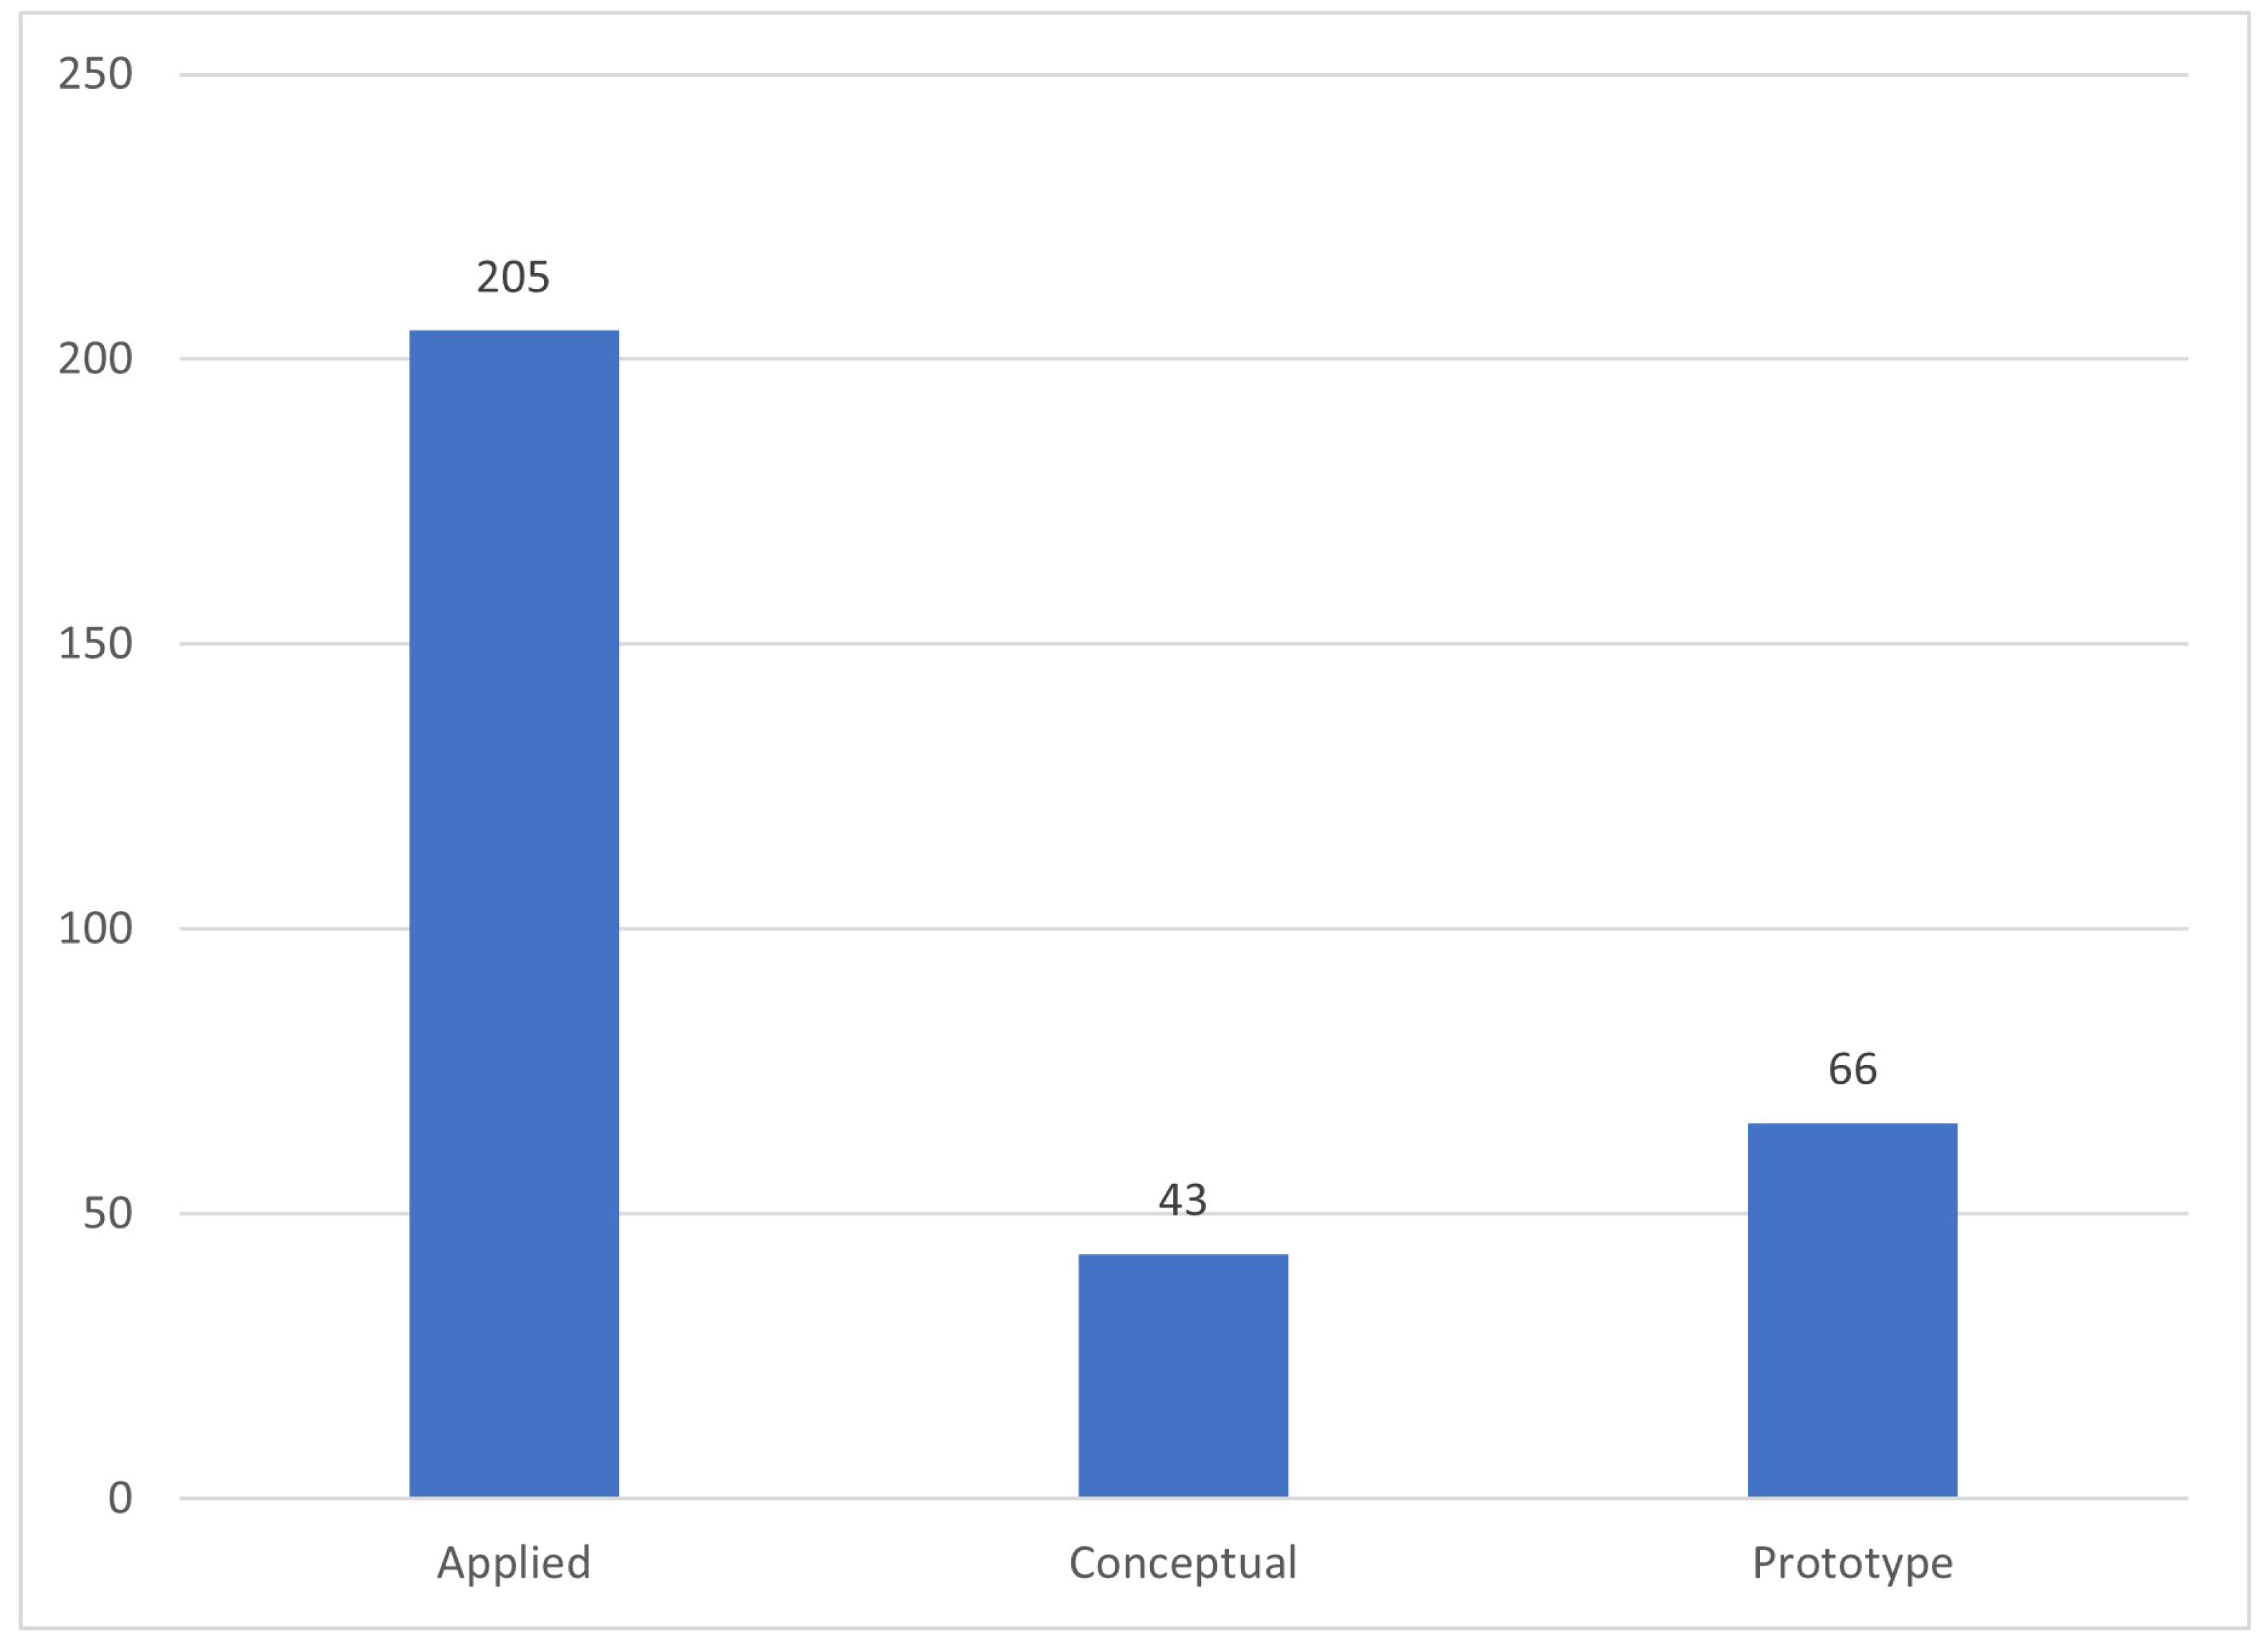
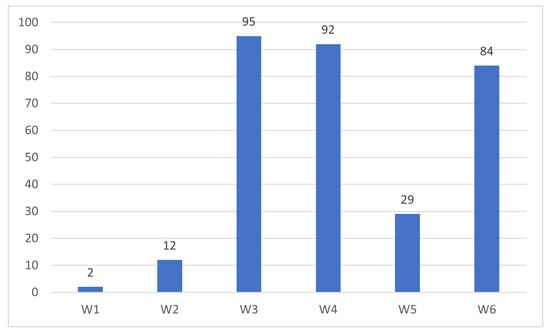
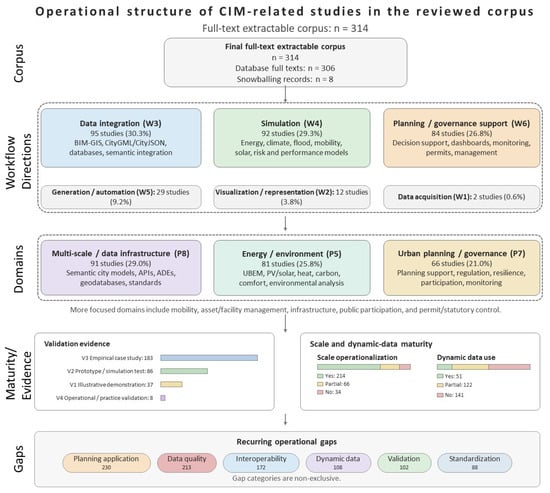

Disclaimer/Publisher’s Note: The statements, opinions and data contained in all publications are solely those of the individual author(s) and contributor(s) and not of MDPI and/or the editor(s). MDPI and/or the editor(s) disclaim responsibility for any injury to people or property resulting from any ideas, methods, instructions or products referred to in the content. |
© 2026 by the authors. Licensee MDPI, Basel, Switzerland. This article is an open access article distributed under the terms and conditions of the Creative Commons Attribution (CC BY) license.