Evaluating Urban Street Space Quality Using Multi-Source Data and Fully Convolutional Neural Networks: A Case Study of Xi’an’s Historic Urban Area

Abstract
1. Introduction
2. Materials and Methods
2.1. Study Area
2.2. Data Sources
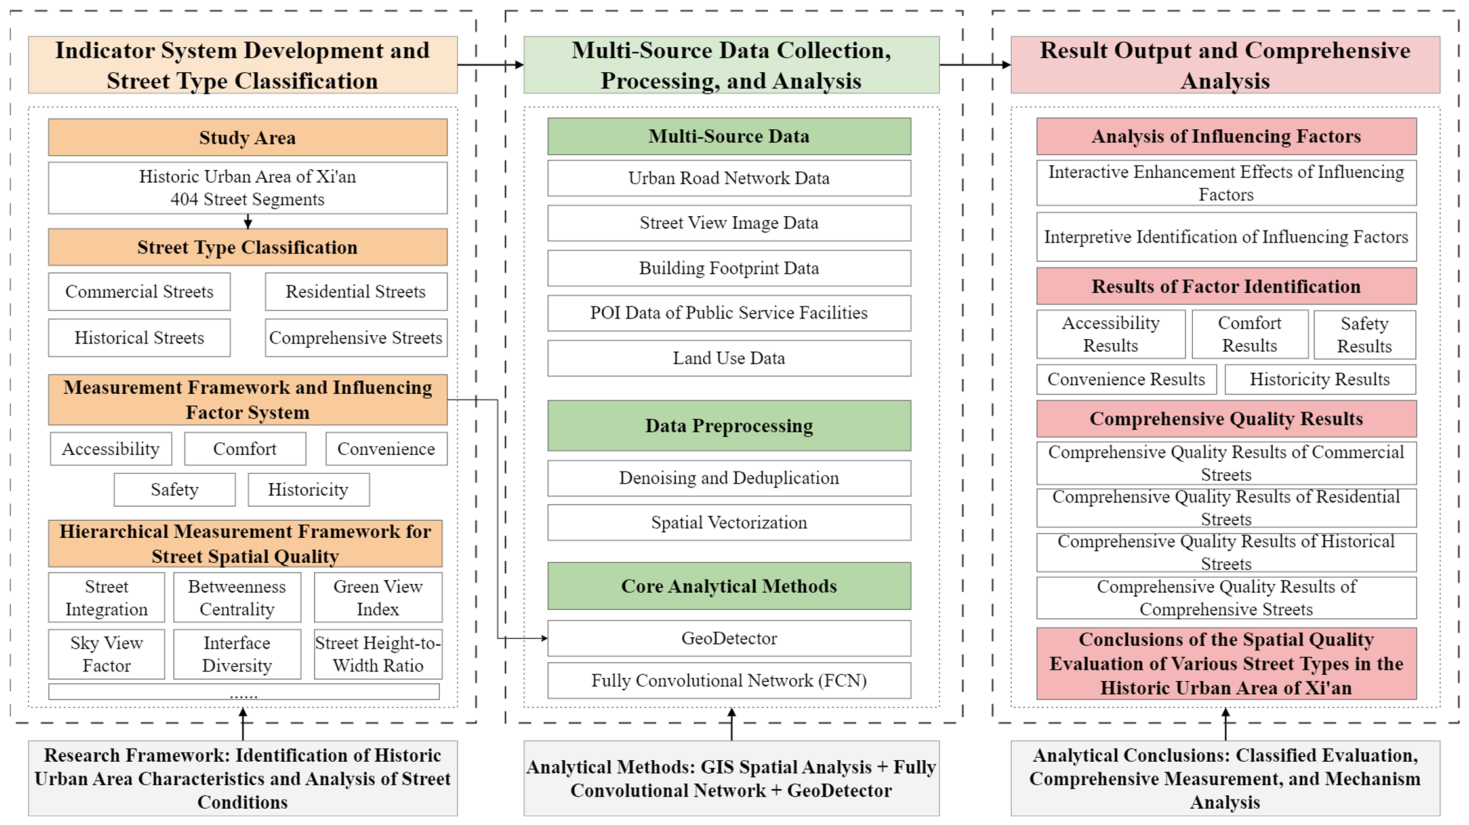
2.3. Research Approach and Methods
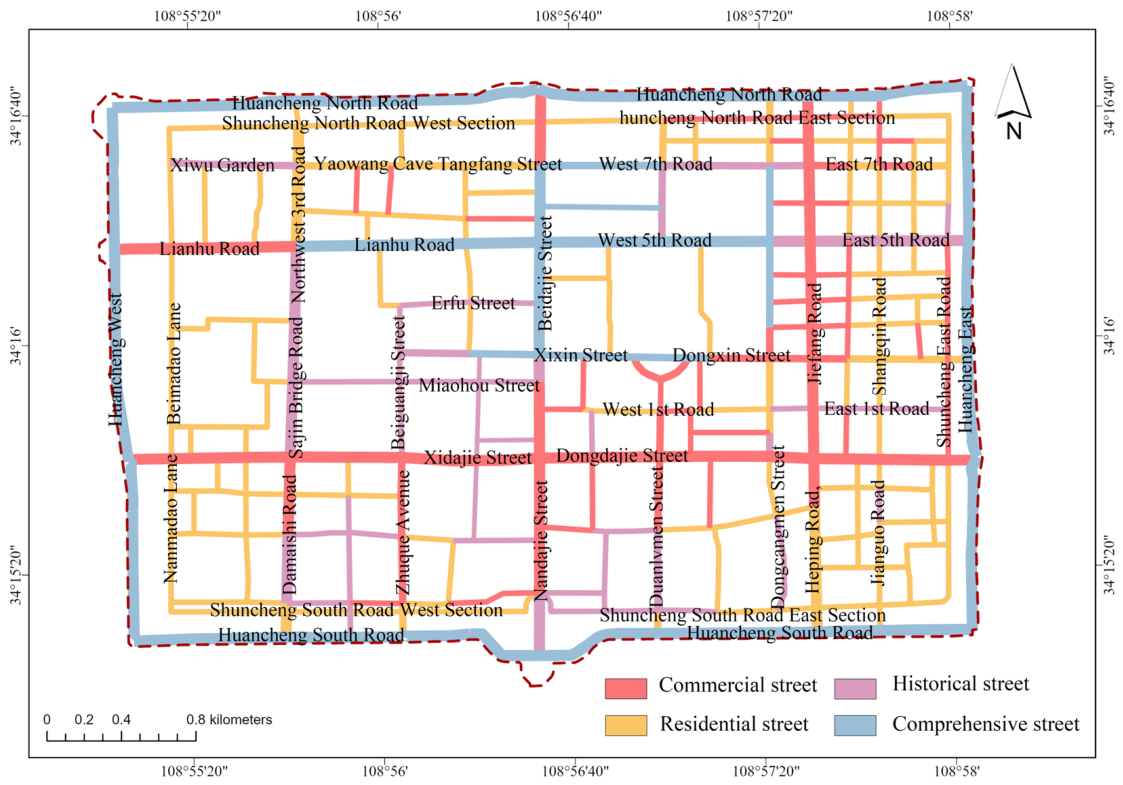
2.4. Classification of Street Types and Development of an Evaluation Indicator System
2.5. Research Methods
2.5.1. Fully Convolutional Neural Network
2.5.2. Analysis of the GeoDetector
3. Results
3.1. Spatial Patterns of Single-Factor Indicators for the Spatial Quality of Streets in Historic Districts
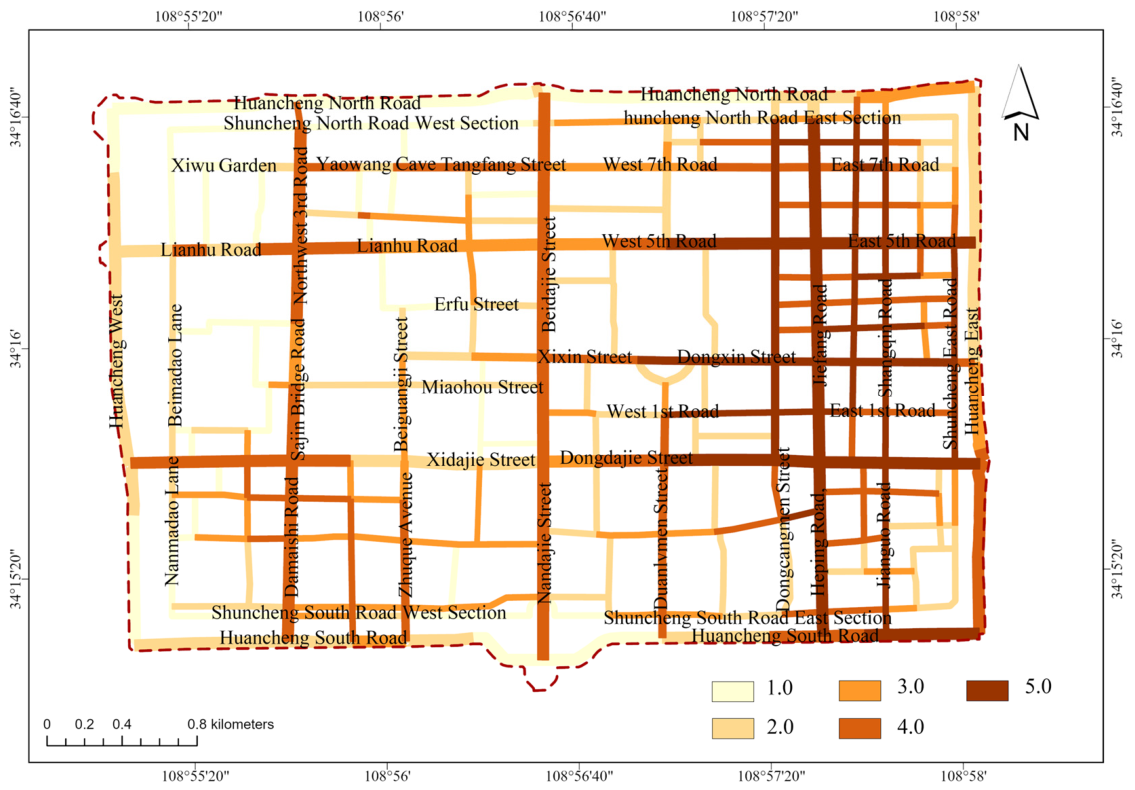
3.1.1. Accessibility
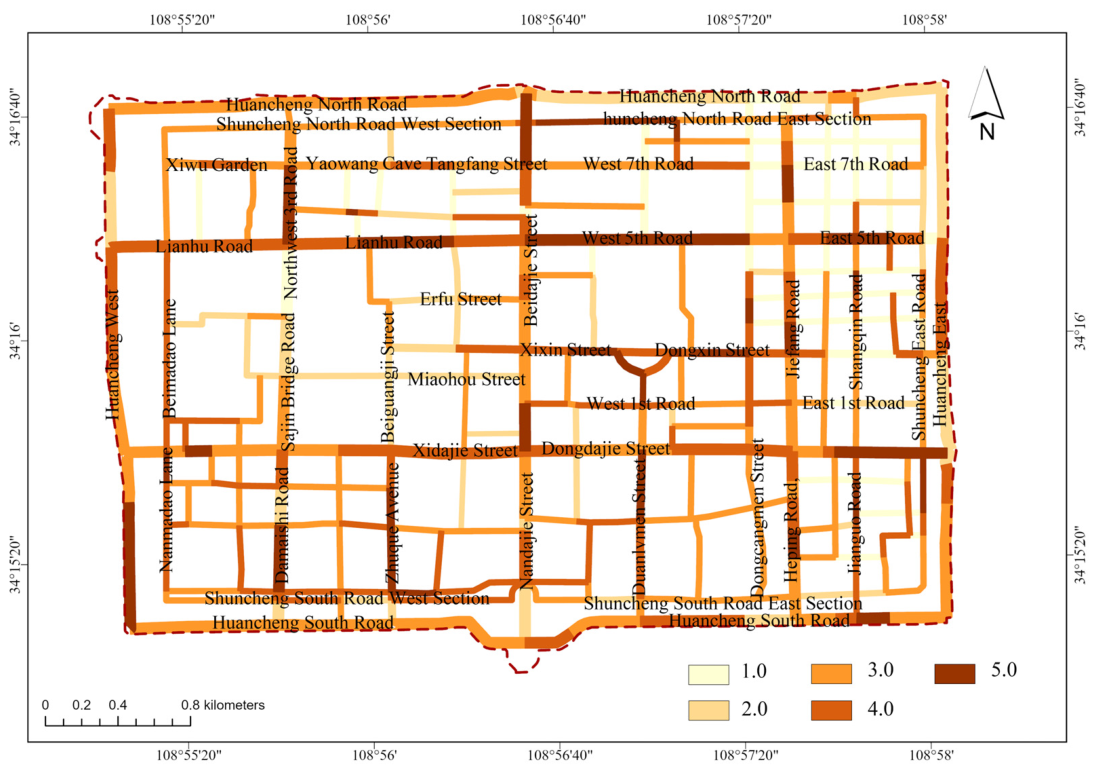
3.1.2. Comfort
3.1.3. Convenience
3.1.4. Safety
3.1.5. Historical
3.2. Comprehensive Assessment of Street Quality in the Historic District
3.3. Geographical Detection Analysis of Factors Influencing the Spatial Quality of Streets in Historic Urban Areas
3.3.1. Univariate Detection
3.3.2. Detection of Interactions Between Factors
4. Discussion
4.1. Perceived Comfort Plays a Primary Role in Street Quality in Historic Districts
4.2. Interaction Effects Between Factors and the Need for Comprehensive Interventions
4.3. Historical Factors and Public Space Improvement Have a Mutually Reinforcing Relationship
4.4. Differentiated Optimisation Strategies for Different Types of Streets
5. Conclusions
Author Contributions
Funding
Data Availability Statement
Conflicts of Interest
References
- Tang, J.; Long, Y. Metropolitan Street Space Quality Evaluation: Second and Third Ring of Beijing, Inner Ring of Shanghai. Planners 2017, 33, 6. [Google Scholar]
- Fan, X. A Study on the Spatial Design of Pedestrian Streets in Xi’an’s Ming-Era City Centre from a Cultural Perception Perspective. Master’s Thesis, Xi’an University of Architecture and Technology, Xi’an, China, 2020. [Google Scholar]
- Lynch, K.A. The Image of the City; MIT Press: Cambridge, MA, USA, 1962. [Google Scholar]
- Ashihara, Y. The Aesthetic Townscape; MIT Press: Cambridge, MA, USA, 1983. [Google Scholar]
- Jacobs, J. The Death and Life of Great American Cities; Vintage Books: Vancouver, WA, USA, 2012. [Google Scholar]
- Gehl, J. Life Between Buildings: Using Public Space; Van Nostrand Reinhold: Hoboken, NJ, USA, 2003. [Google Scholar]
- Cervero, R.; Kockelman, K. Travel demand and the 3Ds: Density, diversity, and design. Transp. Res. Part D Transp. Environ. 1997, 2, 199–219. [Google Scholar] [CrossRef]
- Ewing, R.; Cervero, R. Travel and the built environment: A meta-analysis. J. Am. Plan. Assoc. 2010, 76, 265–294. [Google Scholar]
- Griew, P.; Hillsdon, M.; Foster, C.; Coombes, E.; Jones, A.; Wilkinson, P. Developing and testing a street audit tool using Google Street View to measure environmental supportiveness for physical activity. Int. J. Behav. Nutr. Phys. Act. 2013, 10, 103. [Google Scholar] [CrossRef] [PubMed]
- Seiferling, I.; Naik, N.; Ratti, C.; Proulx, R. Green streets—Quantifying and mapping urban trees with street-level imagery and computer vision. Landsc. Urban Plan. 2017, 165, 93–101. [Google Scholar]
- Liu, C.; Zhao, J. Research on the Evaluation System of Urban Street Alfresco Spaces Based on an AHP–Entropy Method: A Case Study of Daxue Road in Shanghai. Buildings 2025, 15, 2840. [Google Scholar] [CrossRef]
- Zhang, F.; Zhou, B.; Liu, L.; Liu, Y.; Fung, H.H.; Lin, H.; Ratti, C. Measuring human perceptions of a large-scale urban region using machine learning. Landsc. Urban Plan. 2018, 180, 148–160. [Google Scholar] [CrossRef]
- Hillier, B.; Hanson, J. The Social Logic of Space; Cambridge University Press: Cambridge, UK, 1984. [Google Scholar]
- Yang, L.; Jin, Q.; Fu, F. Research on urban street network structure based on spatial syntax and POI Data. Sustainability 2024, 16, 1757. [Google Scholar] [CrossRef]
- Wu, Z.; Mao, M.; Yang, J.; Peng, C.; Zha, H. Street Vitality Evaluation of the Mengzi East Street Historical District Based on Space Syntax and POI Big Data. Buildings 2025, 15, 2896. [Google Scholar] [CrossRef]
- Li, P.; Xu, Y.; Liu, Z.; Jiang, H.; Liu, A. Evaluation and Optimization of Urban Street Spatial Quality Based on Street View Images and Machine Learning: A Case Study of the Jinan Old City. Buildings 2025, 15, 1408. [Google Scholar] [CrossRef]
- Yao, Y.; Dall’Ò, G.; Lu, F. Urban Street-Scene Perception and Renewal Strategies Powered by Vision–Language Models. Land 2026, 15, 244. [Google Scholar]
- Xiong, X.; Wu, Y.; Ma, M.; Yang, S.; Zhang, J.; Zhang, Q.; Ye, H.; Hu, Y. Exploring the Multidimensional Visual Perception of Urban Riverfront Street Environments: A Framework Using Street View Images, Deep Learning and Eye-Tracking. Land 2025, 14, 2039. [Google Scholar] [CrossRef]
- Yin, J.; Chen, R.; Zhang, R.; Li, X.; Fang, Y. The scale effect of street view images and urban vitality is consistent with a Gaussian function distribution. Land 2025, 14, 415. [Google Scholar] [CrossRef]
- Hu, L.; Liu, Y.; Yu, B. Evolution Method of Built Environment Spatial Quality in Historic Districts Based on Spatiotemporal Street View: A Case Study of Tianjin Wudadao. Buildings 2025, 15, 1953. [Google Scholar] [CrossRef]
- Li, J.; Lin, S.; Kong, N.; Ke, Y.; Zeng, J.; Chen, J. Nonlinear and synergistic effects of built environment indicators on street vitality: A case study of humid and hot urban cities. Sustainability 2024, 16, 1731. [Google Scholar] [CrossRef]
- Han, C.; Zhang, Z. Nonlinear effects of built environment perception and objective features on street vitality in historic districts. Front. Archit. Res. 2025, 15, 1075–1091. [Google Scholar]
- Hamim, O.F.; Kancharla, S.R.; Ukkusuri, S.V. Mapping sidewalks on a neighborhood scale from street view images. Environ. Plan. B Urban Anal. City Sci. 2024, 51, 823–838. [Google Scholar]
- Zhong, T.; Ye, C.; Wang, Z.; Tang, G.; Zhang, W.; Ye, Y. City-scale mapping of urban façade color using street-view imagery. Remote Sens. 2021, 13, 1591. [Google Scholar]
- Mo, Y.; Wu, Y.; Yang, X.; Liu, F.; Liao, Y. Review the state-of-the-art technologies of semantic segmentation based on deep learning. Neurocomputing 2022, 493, 626–646. [Google Scholar]
- Tu, H.; Miao, X.; Jin, S.; Yang, J.; Miao, X.; Qi, J. Deep Learning-Based Systems for Evaluating and Enhancing Child-Friendliness of Urban Streets—A Case of Shanghai Urban Street. Buildings 2025, 15, 2291. [Google Scholar]
- Wang, R.; Ren, S.; Zhang, J.; Yao, Y.; Wang, Y.; Guan, Q. A comparison of two deep-learning-based urban perception models: Which one is better? Comput. Urban Sci. 2021, 1, 3. [Google Scholar]
- Gao, L.; Xiang, X.; Chen, W.; Nong, R.; Zhang, Q.; Chen, X.; Chen, Y. Research on urban street spatial quality based on street view image segmentation. Sustainability 2024, 16, 7184. [Google Scholar] [CrossRef]
- Sun, X.; Nie, X.; Wang, L.; Huang, Z.; Tian, R. Spatial Sense of Safety for Seniors in Living Streets Based on Street View Image Data. Buildings 2024, 14, 3973. [Google Scholar] [CrossRef]
- Li, K. Research on the factors influencing the spatial quality of high-density urban streets: A framework using deep learning, street scene images, and principal component analysis. Land 2024, 13, 1161. [Google Scholar] [CrossRef]
- Guo, Z.; Xu, H.; Lin, Q.; Li, X. Deep learning assessment of street spatial quality in old residential communities of Wuchang, Wuhan, China. Sci. Rep. 2025, 15, 45176. [Google Scholar] [CrossRef] [PubMed]
- Wen, Z.; Zhao, J.; Li, M. A Study on the Influencing Factors of the Vitality of Street Corner Spaces in Historic Districts: The Case of Shanghai Bund Historic District. Buildings 2024, 14, 2947. [Google Scholar] [CrossRef]
- Wang, R.; Huang, C.; Ye, Y. Measuring Street Quality: A Human-Centered Exploration Based on Multi-Sourced Data and Classical Urban Design Theories. Buildings 2024, 14, 3332. [Google Scholar]
- Wang, Z.; Zhang, W.; Huang, Y. Nonlinear Perceptual Thresholds and Trade-Offs of Visual Environment in Historic Districts: Evidence from Street View Images in Shanghai. Sustainability 2025, 17, 11075. [Google Scholar] [CrossRef]
- Liu, T.; Yu, L.; Chen, X.; Chen, Y.; Li, X.; Liu, X.; Cao, Y.; Zhang, F.; Zhang, C.; Gong, P. Identifying potential urban greenways by considering green space exposure levels and maximizing recreational flows: A case study in Beijing’s built-up areas. Land 2024, 13, 1793. [Google Scholar]
- Li, X.; Pang, C. A spatial visual quality evaluation method for an urban commercial pedestrian street based on streetscape images—Taking Tianjin Binjiang road as an example. Sustainability 2024, 16, 1139. [Google Scholar] [CrossRef]
- Liu, X.; Lv, Y.; Li, W.; Peng, L.; Wu, Z. Assessment of Age-Friendly Streets in High-Density Urban Areas Using AFEAT, Street View Imagery, and Deep Learning: A Case Study of Qinhuai District, Nanjing, China. Buildings 2025, 15, 3518. [Google Scholar]
- Li, D.; Ni, Y. Assessing street environments for older adults in urban villages using POIs and street view images—A case study of Guangzhou, China. Sustainability 2025, 17, 31. [Google Scholar]
- Zhang, J.; Liu, C.; Xu, M.; Zheng, S. Equity Evaluation of Street-Level Greenery Based on Green View Index from Street View Images: A Case Study of Hangzhou, China. Land 2025, 14, 1653. [Google Scholar] [CrossRef]
- Liu, L.; Tu, Y.; Sun, M.; Lyu, H.; Wang, P.; He, J. Spatial Quality Measurement and Characterization of Daily High-Frequency Pedestrian Streets in Xi’an City. Land 2024, 13, 885. [Google Scholar]
- Zhang, Q.; Cheng, T.; Xu, P.; Jiang, X. Balancing Heritage Conservation and Urban Vitality Through a Multi-Tiered Governance Strategy: A Case Study of Nanjing’s Yihe Road Historic District, China. Land 2025, 14, 1894. [Google Scholar]
- Wang, Y.; Xiu, C. Spatial Quality Evaluation of Historical Blocks Based on Street View Image Data: A Case Study of the Fangcheng District. Buildings 2023, 13, 1612. [Google Scholar] [CrossRef]
- Meng, L.; Wen, K.H.; Brewin, R.; Wu, Q. Knowledge Atlas on the Relationship between Urban Street Space and Residents′ Health—A Bibliometric Analysis Based on VOSviewer and CiteSpace. Sustainability 2020, 12, 2384. [Google Scholar] [CrossRef]
- Zhou, B.; Zhao, H.; Fernandez, F.X.P.; Fidler, S.; Torralba, A. Scene parsing through ADE20K dataset. In 30th IEEE Conference on Computer Vision and Pattern Recognition (CVPR); IEEE: Piscataway, NJ, USA, 2017; pp. 5122–5530. [Google Scholar]
- Zhou, B.; Zhao, H.; Puig, X.; Fidler, S.; Barriuso, A.; Torralba, A. Semantic Understanding of Scenes through the ADE20K Dataset. Int. J. Comput. Vis. 2016, 127, 302–321. [Google Scholar]
- Wang, J.; Xu, D. Geodetector: Principle and prospective. Acta Geogr. Sin. 2017, 72, 19. [Google Scholar]
- Yu, H.; Liu, D.; Zhang, C.; Yu, L.; Yang, B.; Qiao, S.; Wang, X. Research on spatial–temporal characteristics and driving factors of urban development intensity for pearl river delta region based on geodetector. Land 2023, 12, 1673. [Google Scholar] [CrossRef]
- Ling, Y.; Zhao, Y.; Ren, Q.; Qiu, Y.; Zhang, Y.; Zhai, K. Evaluating the Spatial Heterogeneity and Driving Factors of Sustainable Development Level in Chengdu with Point of Interest Data and Geographic Detector Model. Land 2024, 13, 1018. [Google Scholar] [CrossRef]
- Xu, H.; Jiang, X.; Shao, J.; Li, Z.; Pang, W.; Zhou, L. Evaluation of Spatial Integration Degree Between Hankou Historical and Cultural Blocks and Surrounding Areas in Wuhan Based on Street View Images. Buildings 2026, 16, 1158. [Google Scholar] [CrossRef]
- Zeng, Z.; Li, Y.; Tang, H. Multidimensional Spatial Driving Factors of Urban Vitality Evolution at the Subdistrict Scale of Changsha City, China, Based on the Time Series of Human Activities. Buildings 2023, 13, 2448. [Google Scholar] [CrossRef]
- Jordan, S.W.; Ivey, S. Complete Streets: Promises and Proof. J. Urban Plan. Dev. 2021, 147, 04021011. [Google Scholar] [CrossRef]






| Data Type | Data Sources | Use of Data |
|---|---|---|
| Road network data | Open Street Map | Base map for street segment delineation, followed by spatial syntax analysis |
| Street View image data | Baidu Maps API * | Calculation of indicators such as green coverage ratio and sky openness |
| Building outline data | Baidu Maps API * | Calculation of street height-to-width ratio |
| Public service facility POI data | Baidu Maps API * | Calculation of street facility completeness and density within the accessibility dimension |
| Land use data | Current Land Survey | Used for the classification of street types |
| Indicator Dimensions and Weights | Indicator Name | Calculation Method | Relevance | Secondary Weight |
|---|---|---|---|---|
| Accessibility (0.10) | Street Integration (SI) | The degree of clustering or dispersion of a given spatial element relative to other elements within the urban road network, calculated using sDNA-V4.2.0 software | Positive correlation | 0.70 |
| Back-to-Back Centrality (BC) | The accessibility of a street to other streets within its search radius, calculated using sDNA software | Positive correlation | 0.30 | |
| Comfort (0.30) | Green View Index (GVI) | Area of green vegetation pixels in street view images/total pixel area | Positive correlation | 0.20 |
| Sky View Factor (SVF) | Area of sky pixels in street view images/total pixel area | optimal range | 0.15 | |
| Interface Diversity (ID) | Number of identified element types in street view images/156 | Positive correlation | 0.15 | |
| Aspect Ratio (AR) | Average height of buildings on both sides of the street based on building outline data/street width | optimal range | 0.15 | |
| Proportion of Pedestrian Space (PSP) | Area of pixels representing pedestrian spaces (including pavements, running tracks, hard-surfaced areas, etc.) in street view images/total pixel area | Positive correlation | 0.20 | |
| Interface Permeability (IP) | Pixels representing building facades in street view images/total pixels representing enclosed facades | Positive correlation | 0.15 | |
| Convenience (0.20) | Facility Completeness (FC) | Number of POI facility types within the 50-m buffer zone on both sides of the street/Total number of POI facility types in the historic urban area | Positive correlation | 0.60 |
| Facility Distribution (FD) | Point density of POI facilities within the 50-m buffer zone on both sides of the street | Positive correlation | 0.40 | |
| Safety (0.25) | Motorised Traffic Impact (MTI) | Area of motorised transport (cars, large vehicles, buses, motorcycles, etc.) pixels in Street View images/Total pixel area | negative correlation | 0.70 |
| Safety Facility Completeness (SFC) | Pixel area of safety facilities (including fences, railings, etc.) in street view images/total pixel area | Positive correlation | 0.10 | |
| Road Safety (RSD) | Pixel area of motor vehicle road surfaces in street view images/total pixel area | negative correlation | 0.20 | |
| Historicity (0.15) | Historical Spatial Authenticity (SA) | Classified into three categories: no change, road widened, and significant changes or adjustments to road length and alignment | Positive correlation | 0.30 |
| Proportion of Heritage Conservation Areas (HSP) | Number of cultural heritage sites within the 50-m buffer zone on either side of the street/total number of cultural heritage sites in the historic urban area | Positive correlation | 0.70 |
| Parameters Name | Setting | Description |
|---|---|---|
| Optimizer | SGD (Stochastic Gradient Descent) | Standard optimizer for momentum |
| Initial learning rate | 0.0004 | Employs a polynomial decay strategy |
| Momentum factor | 0.9 | Accelerates convergence and suppresses oscillations |
| Batch size | 8 | Subject to GPU memory constraints |
| Number of training iterations | 50 | Stops once the validation set loss has converged |
| Loss function | Cross-entropy loss | Standard loss for per-pixel multi-class classification |
| Input dimensions | 768 × 512 pixels | Uniform cropping to a fixed size |
| Type | Commercial Street | Residential Street | Historical Street | Comprehensive Street |
|---|---|---|---|---|
| Accessibility | 4.21 | 3.77 | 3.78 | 3.79 |
| Comfort | 3.02 | 2.75 | 2.94 | 3.16 |
| Convenience | 3.25 | 2.90 | 3.31 | 3.24 |
| Safety | 3.40 | 3.16 | 3.24 | 3.35 |
| Historical | 1.67 | 1.52 | 2.71 | 1.41 |
| Overall score | 3.08 | 2.80 | 3.14 | 3.02 |
| Rank | Factor | Dimension | Q-Value | p-Value |
|---|---|---|---|---|
| 1 | Interface Permeability (IP) | Comfort | 0.412 | <0.001 |
| 2 | Facility Distribution (FD) | Convenience | 0.387 | <0.001 |
| 3 | Proportion of Pedestrian Space (PSP) | Comfort | 0.356 | <0.001 |
| 4 | Facility Completeness (FC) | Convenience | 0.341 | <0.001 |
| 5 | Sky View Factor (SVF) | Comfort | 0.298 | <0.001 |
| 6 | Interface Diversity (ID) | Comfort | 0.267 | <0.001 |
| 7 | Green View Index (GVI) | Comfort | 0.245 | <0.001 |
| 8 | Proportion of Heritage Conservation Areas (HSP) | Historical | 0.201 | <0.01 |
| 9 | Aspect Ratio (AR) | Comfort | 0.178 | <0.01 |
| 10 | Motorised Traffic Impact (MTI) | Safety | 0.134 | <0.05 |
| Factors | Commercial Street | Residential Street | Historical Street | Comprehensive Street |
|---|---|---|---|---|
| Street Integration (SI) | 0.06 | 0.05 | 0.03 | 0.11 |
| Back-to-Back Centrality (BC) | 0.09 | 0.08 | 0.07 | 0.08 |
| Green View Index (GVI) | 0.19 | 0.38 | 0.33 | 0.34 |
| Sky View Factor (SVF) | 0.34 | 0.45 | 0.08 | 0.06 |
| Interface Diversity (ID) | 0.34 | 0.43 | 0.18 | 0.05 |
| Aspect Ratio (AR) | 0.03 | 0.05 | 0.02 | 0.05 |
| Proportion of Pedestrian Space (PSP) | 0.42 | 0.53 | 0.30 | 0.33 |
| Interface Permeability (IP) | 0.44 | 0.55 | 0.24 | 0.45 |
| Facility Completeness (FC) | 0.25 | 0.38 | 0.34 | 0.4 |
| Facility Distribution (FD) | 0.28 | 0.38 | 0.36 | 0.39 |
| Motorised Traffic Impact (MTI) | 0.12 | 0.11 | 0.16 | 0.18 |
| Safety Facility Completeness (SFC) | 0.11 | 0.02 | 0.06 | 0.10 |
| Road Safety (RSD) | 0.06 | 0.05 | 0.21 | 0.06 |
| Historical Spatial Authenticity (SA) | 0.06 | 0.05 | 0.29 | 0.21 |
| Proportion of Heritage Conservation Areas (HSP) | 0.10 | 0.04 | 0.04 | 0.17 |
Disclaimer/Publisher’s Note: The statements, opinions and data contained in all publications are solely those of the individual author(s) and contributor(s) and not of MDPI and/or the editor(s). MDPI and/or the editor(s) disclaim responsibility for any injury to people or property resulting from any ideas, methods, instructions or products referred to in the content. |
© 2026 by the authors. Licensee MDPI, Basel, Switzerland. This article is an open access article distributed under the terms and conditions of the Creative Commons Attribution (CC BY) license.
Share and Cite
Liu, N.; Zheng, X.; Ma, J. Evaluating Urban Street Space Quality Using Multi-Source Data and Fully Convolutional Neural Networks: A Case Study of Xi’an’s Historic Urban Area. Buildings 2026, 16, 2574. https://doi.org/10.3390/buildings16132574
Liu N, Zheng X, Ma J. Evaluating Urban Street Space Quality Using Multi-Source Data and Fully Convolutional Neural Networks: A Case Study of Xi’an’s Historic Urban Area. Buildings. 2026; 16(13):2574. https://doi.org/10.3390/buildings16132574
Chicago/Turabian StyleLiu, Na, Xiaowei Zheng, and Jun Ma. 2026. "Evaluating Urban Street Space Quality Using Multi-Source Data and Fully Convolutional Neural Networks: A Case Study of Xi’an’s Historic Urban Area" Buildings 16, no. 13: 2574. https://doi.org/10.3390/buildings16132574
APA StyleLiu, N., Zheng, X., & Ma, J. (2026). Evaluating Urban Street Space Quality Using Multi-Source Data and Fully Convolutional Neural Networks: A Case Study of Xi’an’s Historic Urban Area. Buildings, 16(13), 2574. https://doi.org/10.3390/buildings16132574