


Abstract
Using the Suzhou East Station integrated transportation hub as a case study, this paper investigates the train-induced vibration responses and their distribution patterns under various operating conditions of high-speed railway lines, intercity lines, and subway lines. The results show that train speed is the dominant factor: the high-speed railway passage controls floor vibrations in most stories, while line distance also plays a role for some floors. No significant amplification is observed under multi-train convergence; the vibration level is similar to that of the most unfavorable single-train condition. Therefore, only the most unfavorable single-train condition needs to be considered. As vibrations propagate upward through the floors, high-frequency vibrations gradually attenuate while low-frequency vibrations are amplified, leading to an overall amplification of vibrations at the top floors of some buildings. The floor vibration response level decreases as the vertical stiffness of the structural member increases. Cantilevered slabs and mid-span areas are vibration-sensitive zones. For station–city integrated transportation hubs with high-speed railways running underneath, track vibration mitigation measures should be prioritized, such as thickening the track slab. Thin side-wall vibration mitigation pads have a poor vibration reduction effect. When diaphragm walls are rigidly connected to the station and buildings, they amplify the building’s vibration response.
1. Introduction
With the rapid expansion of China’s high-speed railway network, the normal operation of ultra-high-speed trains at 350 km/h has become routine, and the “station–city integration” development model for integrated transportation hubs has become a mainstream trend in urban development. At the same time, environmental vibrations caused by rail transit operations have become a non-negligible issue. Research on the vibration patterns and control of “station–city integrated” comprehensive transportation hubs is of significant practical engineering importance.
During high-speed railway operation, vibrations first propagate into the soil, causing site vibrations. Zhai et al. [1] found through the analysis of a train–track–soil coupling model that the site vibration frequencies induced by high-speed trains are generally below 80 Hz. Subsequently, through field measurements, they pointed out that ground vibration response increases linearly with train speed [2]. Dai et al. [3] thoroughly studied site vibrations caused by underground high-speed trains and found that the attenuation coefficient of the maximum Z-vibration level can reach 0.276 dB/m, and for every 50 km/h increase in train speed, the maximum Z-vibration level increases by 2 dB. Zheng et al. [4] found a vibration amplification phenomenon at a distance of 35 m from the track, with vibration frequencies concentrated between 25 and 75 Hz. Faizan et al. [5] found that site vibration gradually increases with soil hardness. Connolly et al. [6] found that the attenuation rate of high-frequency vibrations in the site is higher than that of low-frequency vibrations. The above studies have effectively revealed the vibration propagation patterns in free fields; however, soil–structure interaction alters the distribution patterns.
Scholars have conducted extensive research on the distribution patterns of building floor vibrations. Wang et al. [7] and Zhang et al. [8] found that building vibration frequency is highly correlated with the structure’s own vibration characteristics. Chen et al. [9] found that vibrations induced by subway operations in over-track buildings are mainly concentrated in the 10–20 Hz range. The stiffness of structural members also has a significant impact on vibrations. Wang et al. [10] found that floor vibrations are much greater than frame column vibrations under both high-speed rail and subway operations. Lyratzakis et al. [11] found that the vibration at the edge of cantilevered slabs increases significantly and recommended avoiding such structures in buildings adjacent to tracks. These studies have mostly focused on single lines or conventional subway speeds. The distribution patterns of floor vibrations in complex hubs with multiple converging lines and a wide range of train speeds remain unclear.
Regarding the vertical propagation characteristics of train-induced vibrations along building floors, Li et al. [12] found that for low-rise buildings, vibration levels gradually increase with floor height. Di et al. [13] observed a vibration amplification phenomenon in the top three floors through field measurements. He et al. [14] and Liu et al. [15] found that vibration first decreases and then increases with floor height. Zhou et al. [16] attributed this phenomenon to the gradual attenuation of high-frequency vibrations and resonance at the floor’s fundamental frequency. Chen et al. [17] suggested that this phenomenon is caused by reflection and superposition of vibrations at the top floor. Although the vertical propagation patterns have been discussed extensively, analyses of the impact of multiple rail lines on super-tall buildings are relatively lacking.
Compared to ordinary trains, high-speed trains generate greater vibration energy and a wider frequency band. Moreover, most track vibration mitigation measures are severely restricted in high-speed railways; therefore, vibration mitigation for high-speed trains relies more on the propagation path and the receiving structure. Trench barriers are a common propagation path isolation measure. Kontoni et al. [18] found that the isolation effect of trench barriers is highly correlated with the frequency of the vibration source. Seyedi et al. [19] found that the isolation effect is highly correlated with the vibration characteristics of the soil and the building. Yao et al. [20] found that the greater the difference in density and elastic modulus between the filling material of a filled trench and the soil, the better the isolation effect. Auersch [21] found that the isolation effect of filled trenches improves as the stiffness of the filling medium decreases. Receiving structure vibration mitigation often involves installing isolation devices at the building base. For example, Luo et al. [22] found that laminated rubber bearings can effectively reduce train-induced vibrations in the 16–200 Hz frequency range. Di et al. [23] found that spring isolation bearings at the building foundation can reduce vibrations by about 30 dB at specific frequencies. Liang et al. [24] found that laminated rubber bearings can effectively reduce the vertical frequency of buildings and increase their vertical damping, thereby achieving vibration isolation. Most studies agree that the smaller the stiffness of the base isolation device, the better the isolation effect [25,26,27], but Haghighi et al. [28] found that different soil properties significantly affect the isolation effect. Additionally, adjusting the stiffness of structural members can also reduce vibration responses. For example, Feng et al. [29] found that for track–building integrated systems, reducing the stiffness of the connection points between members is beneficial for reducing vibrations, while the opposite is true for non-integrated systems. Huang et al. [30] found that compared to raft foundations and strip foundations, pile foundations can effectively reduce high-frequency components in building vibrations. Overall, existing vibration mitigation studies mostly target single lines or conventional speeds. There is a lack of systematic evaluation of the actual effectiveness of different vibration mitigation measures in complex hubs where the station and track are integrated, high-speed trains pass underground at 350 km/h, and multiple lines converge.
In summary, previous research suffers from several major gaps: most studies focus on single lines or low-to-moderate train speeds, whereas a modern integrated hub involves multiple lines with vastly different speeds and train–track configurations. The vibration distribution and propagation in super-tall buildings under such multi-source excitation are not well understood, especially the superposition effect of concurrent trains and the frequency-dependent amplification along height.
To address these gaps, this paper takes the construction of Suzhou East Station integrated transportation hub as the engineering background, establishes a station–soil–building coupling model, analyzes train-induced vibrations for two plots adjacent to the tracks, determines the vibration impact of different rail lines on these buildings, investigates the propagation patterns of train-induced vibrations within the buildings, and based on this, analyzes the vibration reduction effectiveness of different mitigation measures, providing a basis for vibration analysis and mitigation design for the development of “station–city integrated” comprehensive transportation hubs. This study provides new insights into the vibration characteristics of multi-line converging hubs and offers practical guidance for mitigation design, which has not been systematically addressed in previous work.
2. Project Overview
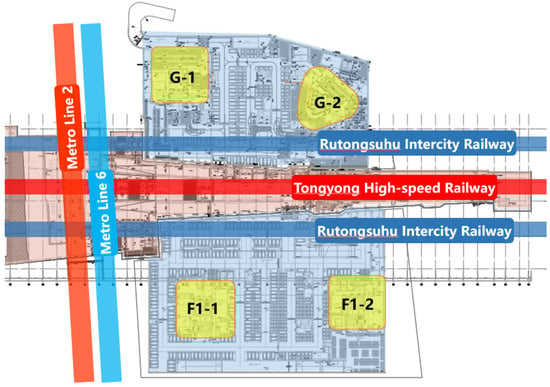
Suzhou East Station is located west of the Sangtian Island Bio-Industrial Park in Suzhou Industrial Park, bounded on the north by the south side of Dushu Lake Avenue, and on the south by the north bank of the Wusong River. The station has 4 platforms and 9 tracks, including the Tongyong High-speed Railway passing through the middle with a scale of 2 platforms and 6 tracks, and an effective length of 650 m for arrival–departure tracks; the intercity main line is arranged on the outer sides with 2 platforms and 3 tracks, and an effective length of 400 m for arrival–departure tracks. This project is China’s first comprehensive development where a high-speed railway passes underground through a station–track integrated structure at a speed of 350 km/h. It involves Metro Lines 2 and 6, the planned Intercity Railway Line 17, the main line and arrival–departure tracks of the Tongyong High-speed Railway, and the arrival–departure tracks of the Rutongsuhu Intercity Railway. This creates a challenging scenario characterized by dense line convergence, a wide range of operating speeds (from 80 km/h for metro to 350 km/h for high-speed rail), and diverse line types and train models. The project’s development scope includes multiple plots: A, B, F, F1, H, G. Figure 1 shows the positional relationship between the station and surrounding plots.
Figure 1.
Positional relationship of surrounding plots of Suzhou East Station.
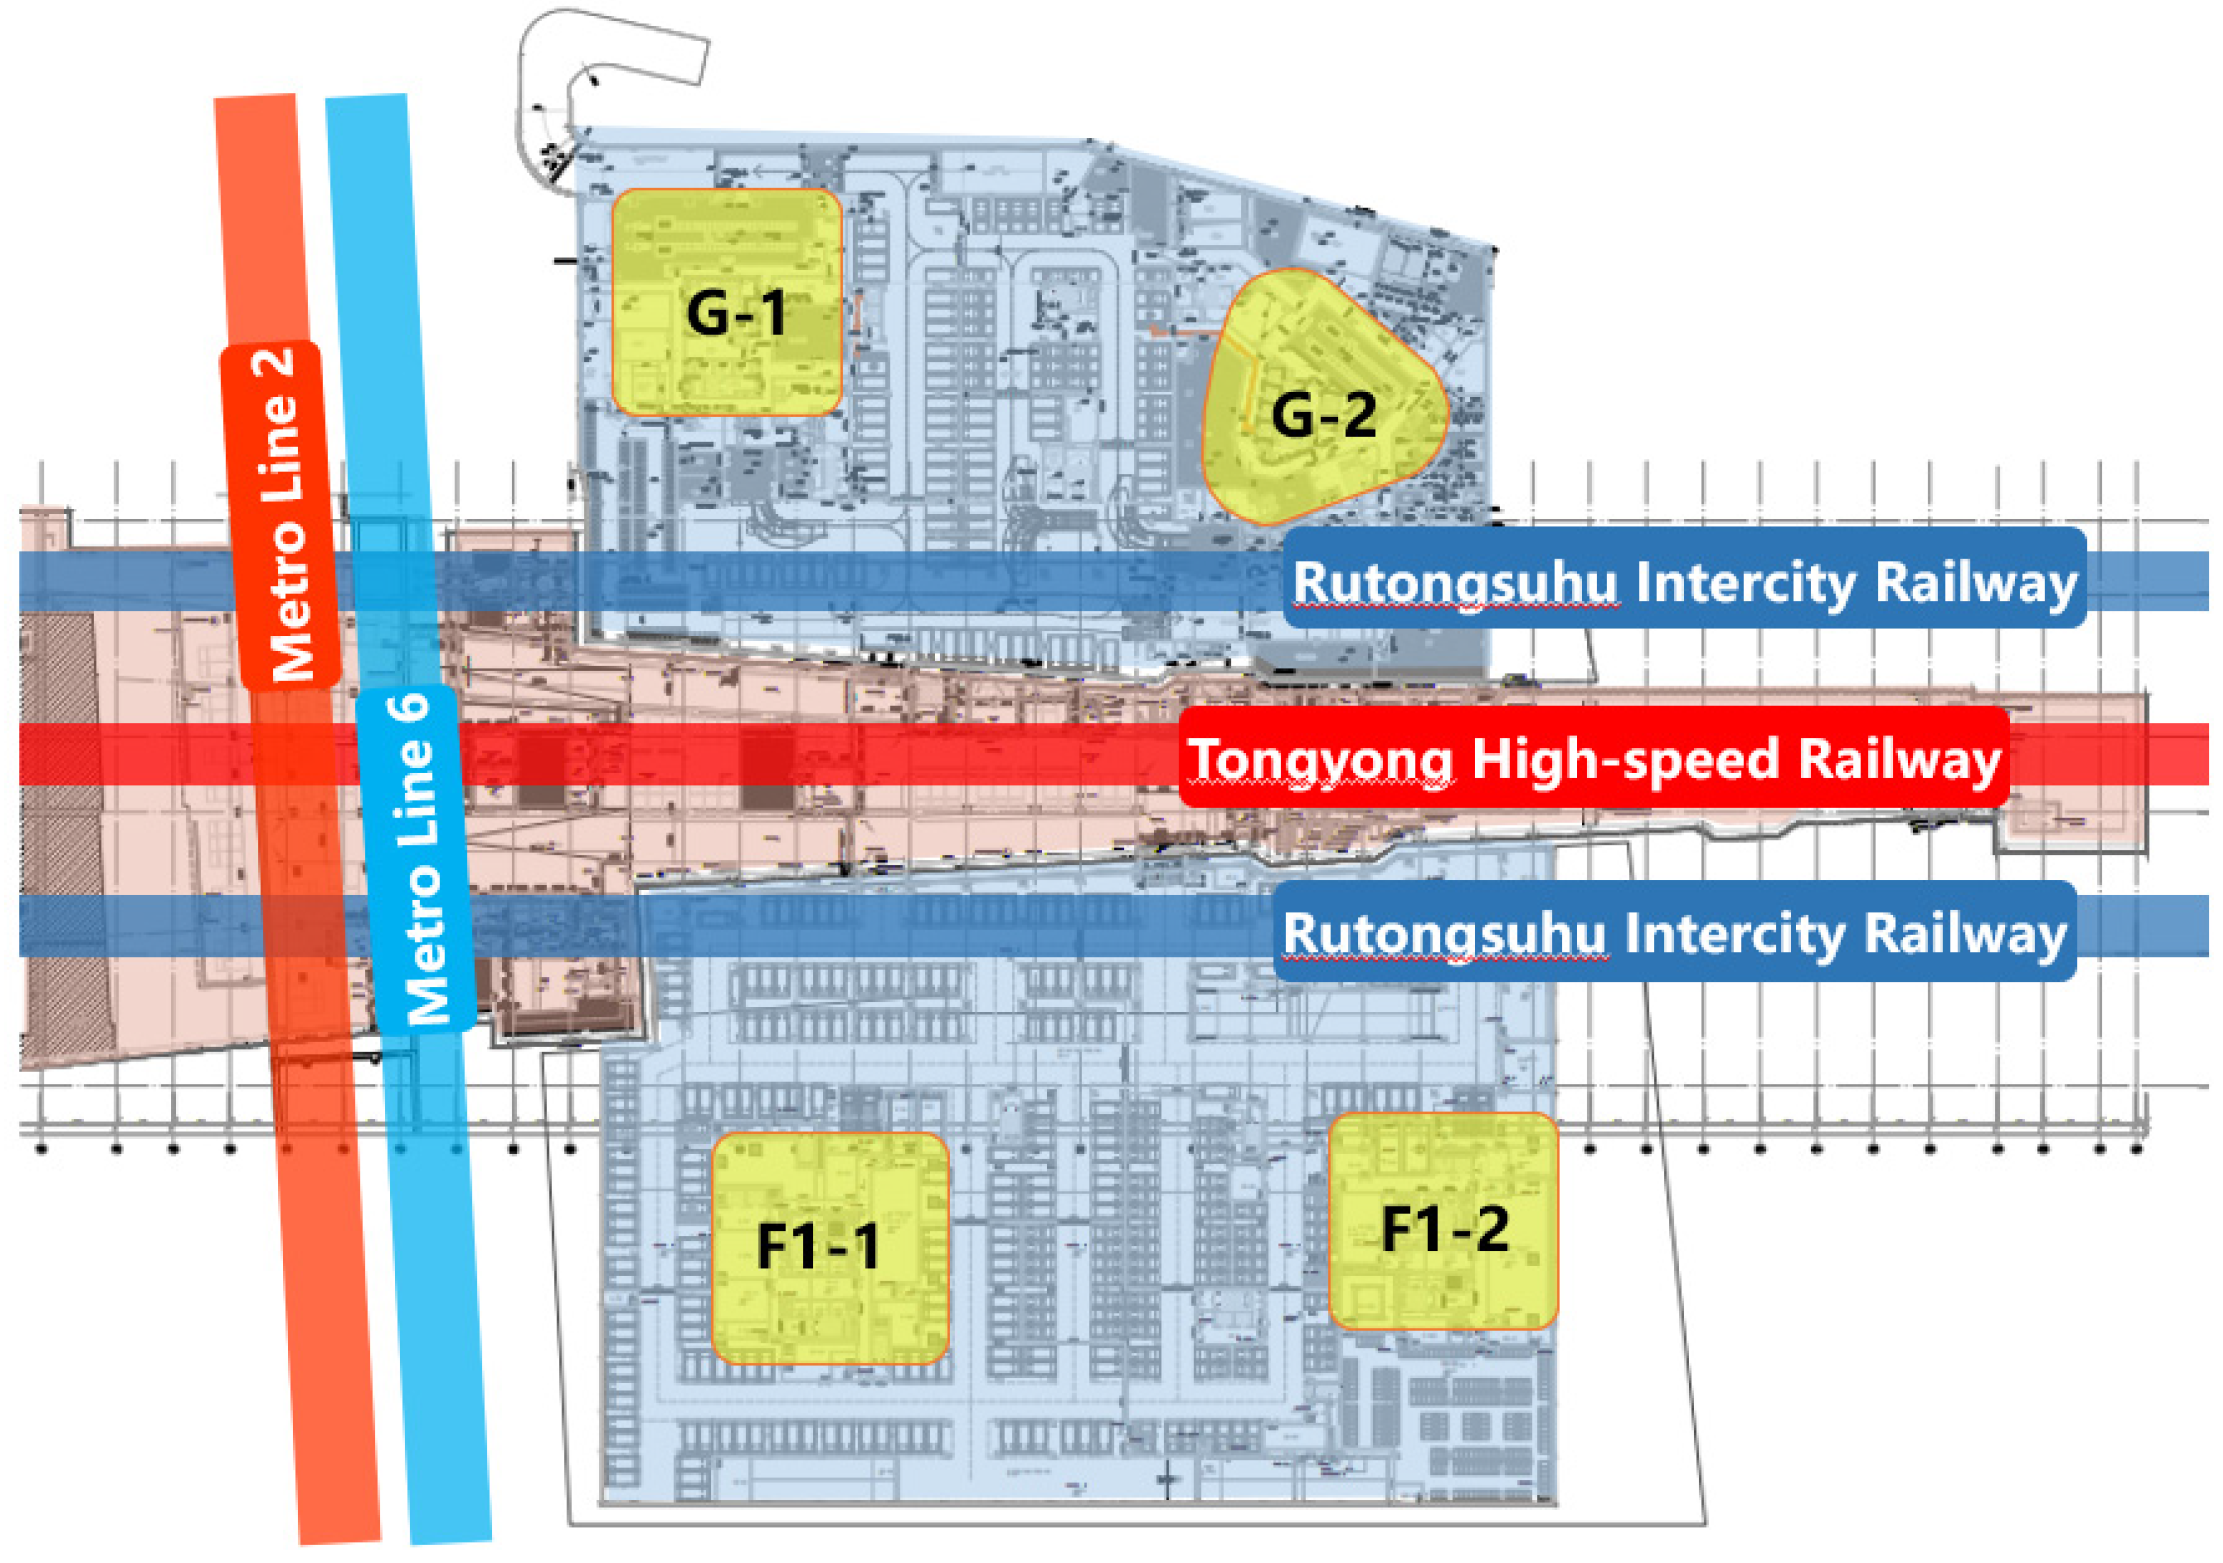
This paper takes plots G and F1 as examples to analyze the vibration impact caused by rail transit operations and carry out targeted vibration mitigation design. The selection is based on their proximity to multiple rail lines and typical building configurations, which are critical for assessing train-induced vibrations in station–city integrated hubs. The relationship between plots G and F1 and the rail transit lines is shown in Figure 2. It can be seen that plots G and F1 are mainly affected by the Tongyong High-speed Railway, the Rutongsuhu Intercity Railway, Metro Line 2, and Metro Line 6. Plot G is located east of the Tongyong High-speed Railway line and includes two tower buildings and a podium. Plot F1 is located west of the Tongyong High-speed Railway line and includes two tower buildings and a podium. Specific building information is shown in Table 1.
Figure 2.
Relationship between buildings in plots G and F1 and rail transit lines.
Table 1.
Building information for plots G and F1.
The vibration evaluation index used in this paper is the maximum Z-vibration level proposed in the Chinese standard “Standard of environmental vibration in urban area” (GB 10070-1988) [31]. Its calculation method is shown in Equations (1) and (2):
where: represents the instantaneous acceleration after frequency weighting, with weighting factors derived from “Evaluation of human exposure to whole-body vibration—Part 1: General requirements” (ISO 2631-1:1985) [32]; represents the time averaging constant, taken as 1 s by Chinese code; is the reference acceleration, taken as by Chinese code; and represents the maximum Z-vibration level, with the subscript Z denoting the vertical direction.
The maximum Z-vibration level limits for various urban areas specified in GB 10070-1988 are shown in Table 2. Based on these requirements, G-2# Building belongs to residential and cultural and educational areas, with a daytime limit of 70 dB and nighttime limit of 67 dB. The remaining buildings belong to mixed-use and commercial center areas, with a daytime limit of 75 dB and nighttime limit of 72 dB.
Table 2.
Vibration evaluation limits from GB 10070-1988 (dB).
3. Numerical Prediction Model
To obtain the vibration response results of the target buildings, a numerical simulation method is adopted. Typically, a multi-system coupling model including the train body, track, station, soil, and building is required. To improve computational efficiency, the overall model is divided into two subsystems: the vehicle–track coupling subsystem and the station–soil–building coupling subsystem.
3.1. Vehicle–Track Coupling Model
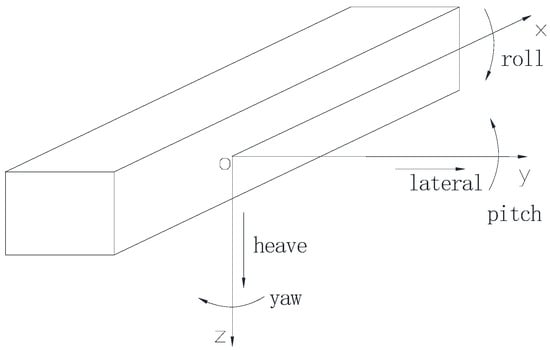
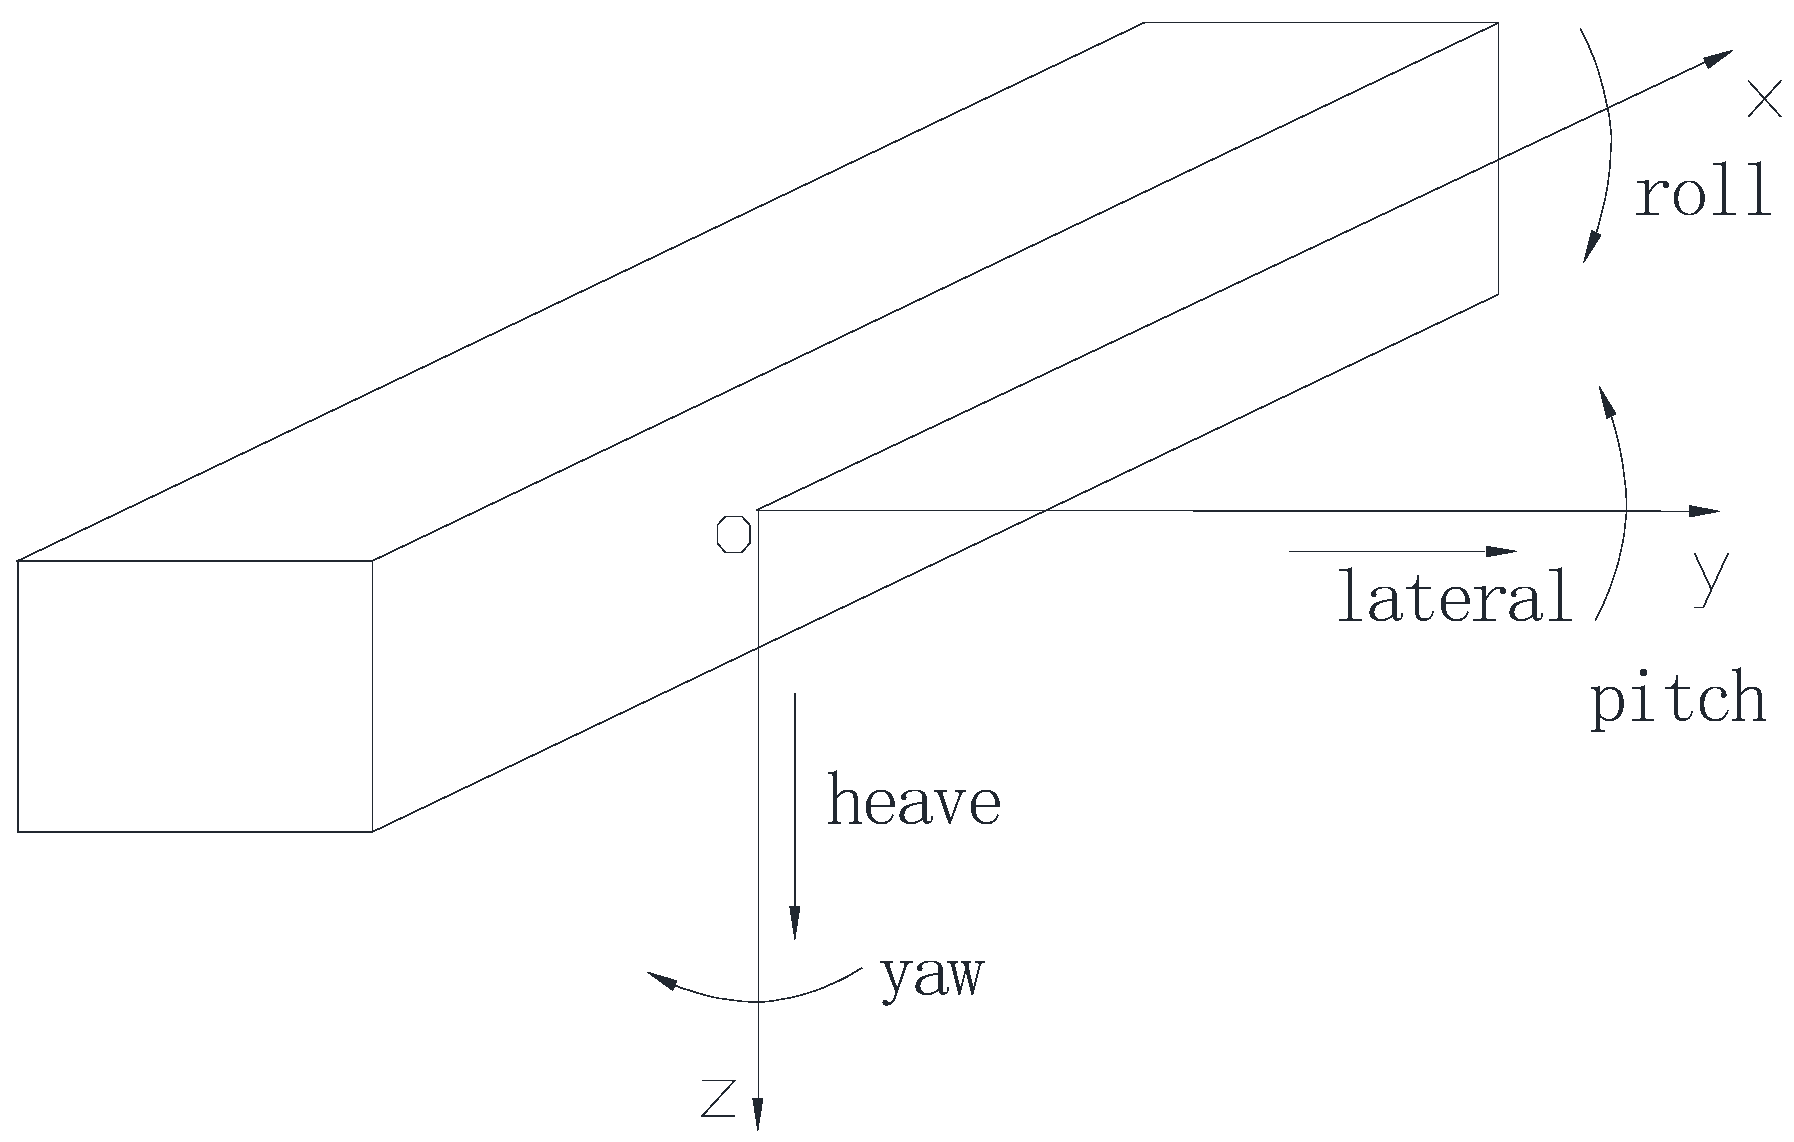
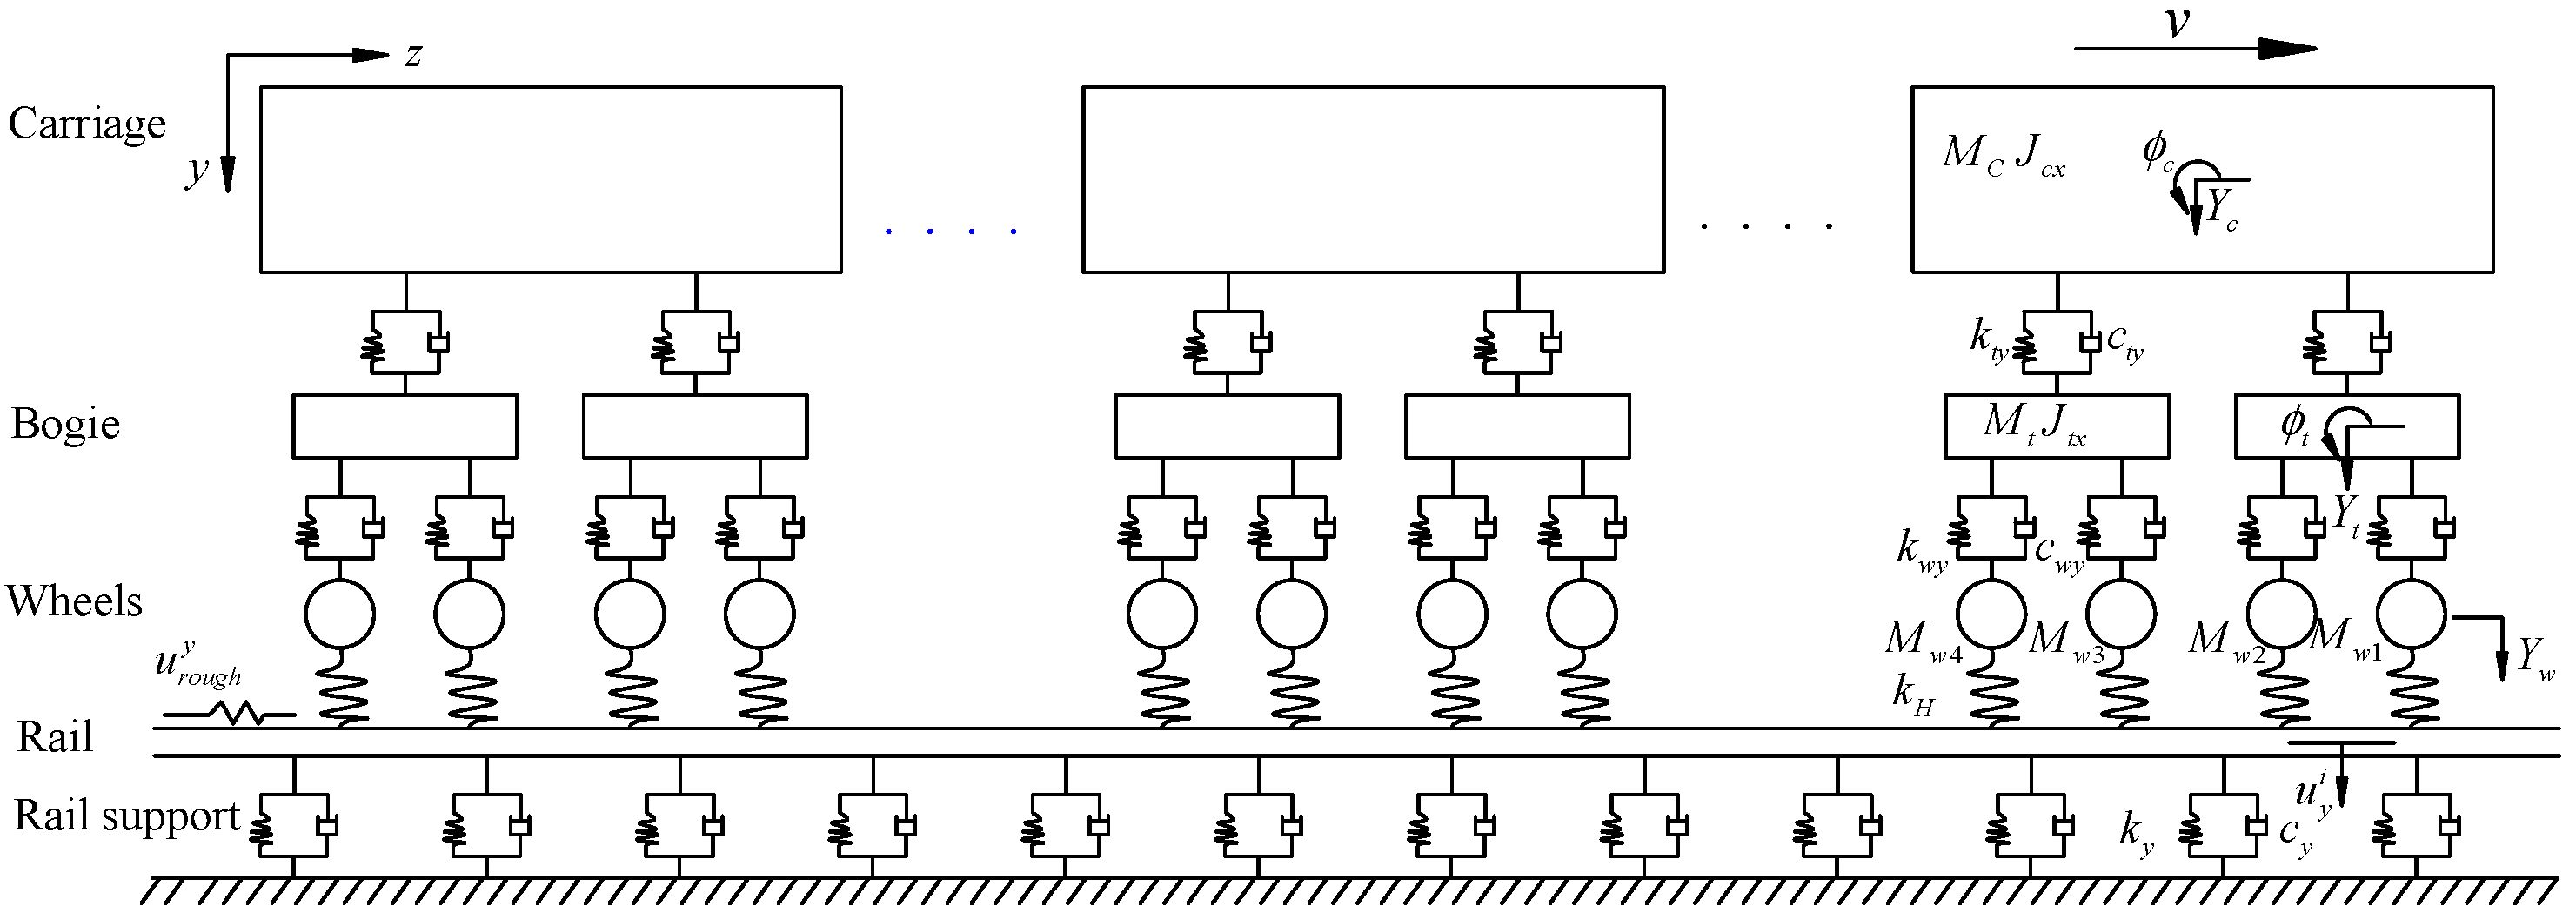
A comprehensive three-dimensional vehicle dynamics model, based on the structural characteristics of subway vehicles, should consider the spatial forces and displacements of seven structural components: one car body, two bogies, and four wheelsets. For the car body, bogies, and wheelsets, only rigid body motion is considered, ignoring flexible body vibrations and deformations. The wheelsets and bogies are connected by primary suspensions, and the car body and frame are connected by secondary suspensions. According to the motion characteristics of each component, the degrees of freedom (DOFs) of the vehicle model are defined as follows: the car body is assigned five DOFs (heave, lateral, roll, pitch, and yaw); each of the front and rear bogies is assigned five DOFs (heave, lateral, roll, pitch, and yaw); and each wheelset is assigned four DOFs (heave, lateral, roll, and yaw). Thus, the entire vehicle model has 35 DOFs in total. The positive directions of the above DOFs are shown in Figure 3. According to the track bed type, the track structure can be classified into ballasted track and ballastless track. The specific track model is simplified according to its structural form. It is assumed that the wheel and rail remain in close contact, satisfying Hertz contact theory in the normal direction and Kalker’s creep theory in the tangential direction. Thus, a vehicle–track coupling model can be established as shown in Figure 4.
Figure 3.
Positive direction definitions of DOFs.
Figure 4.
Vehicle–track coupling model.
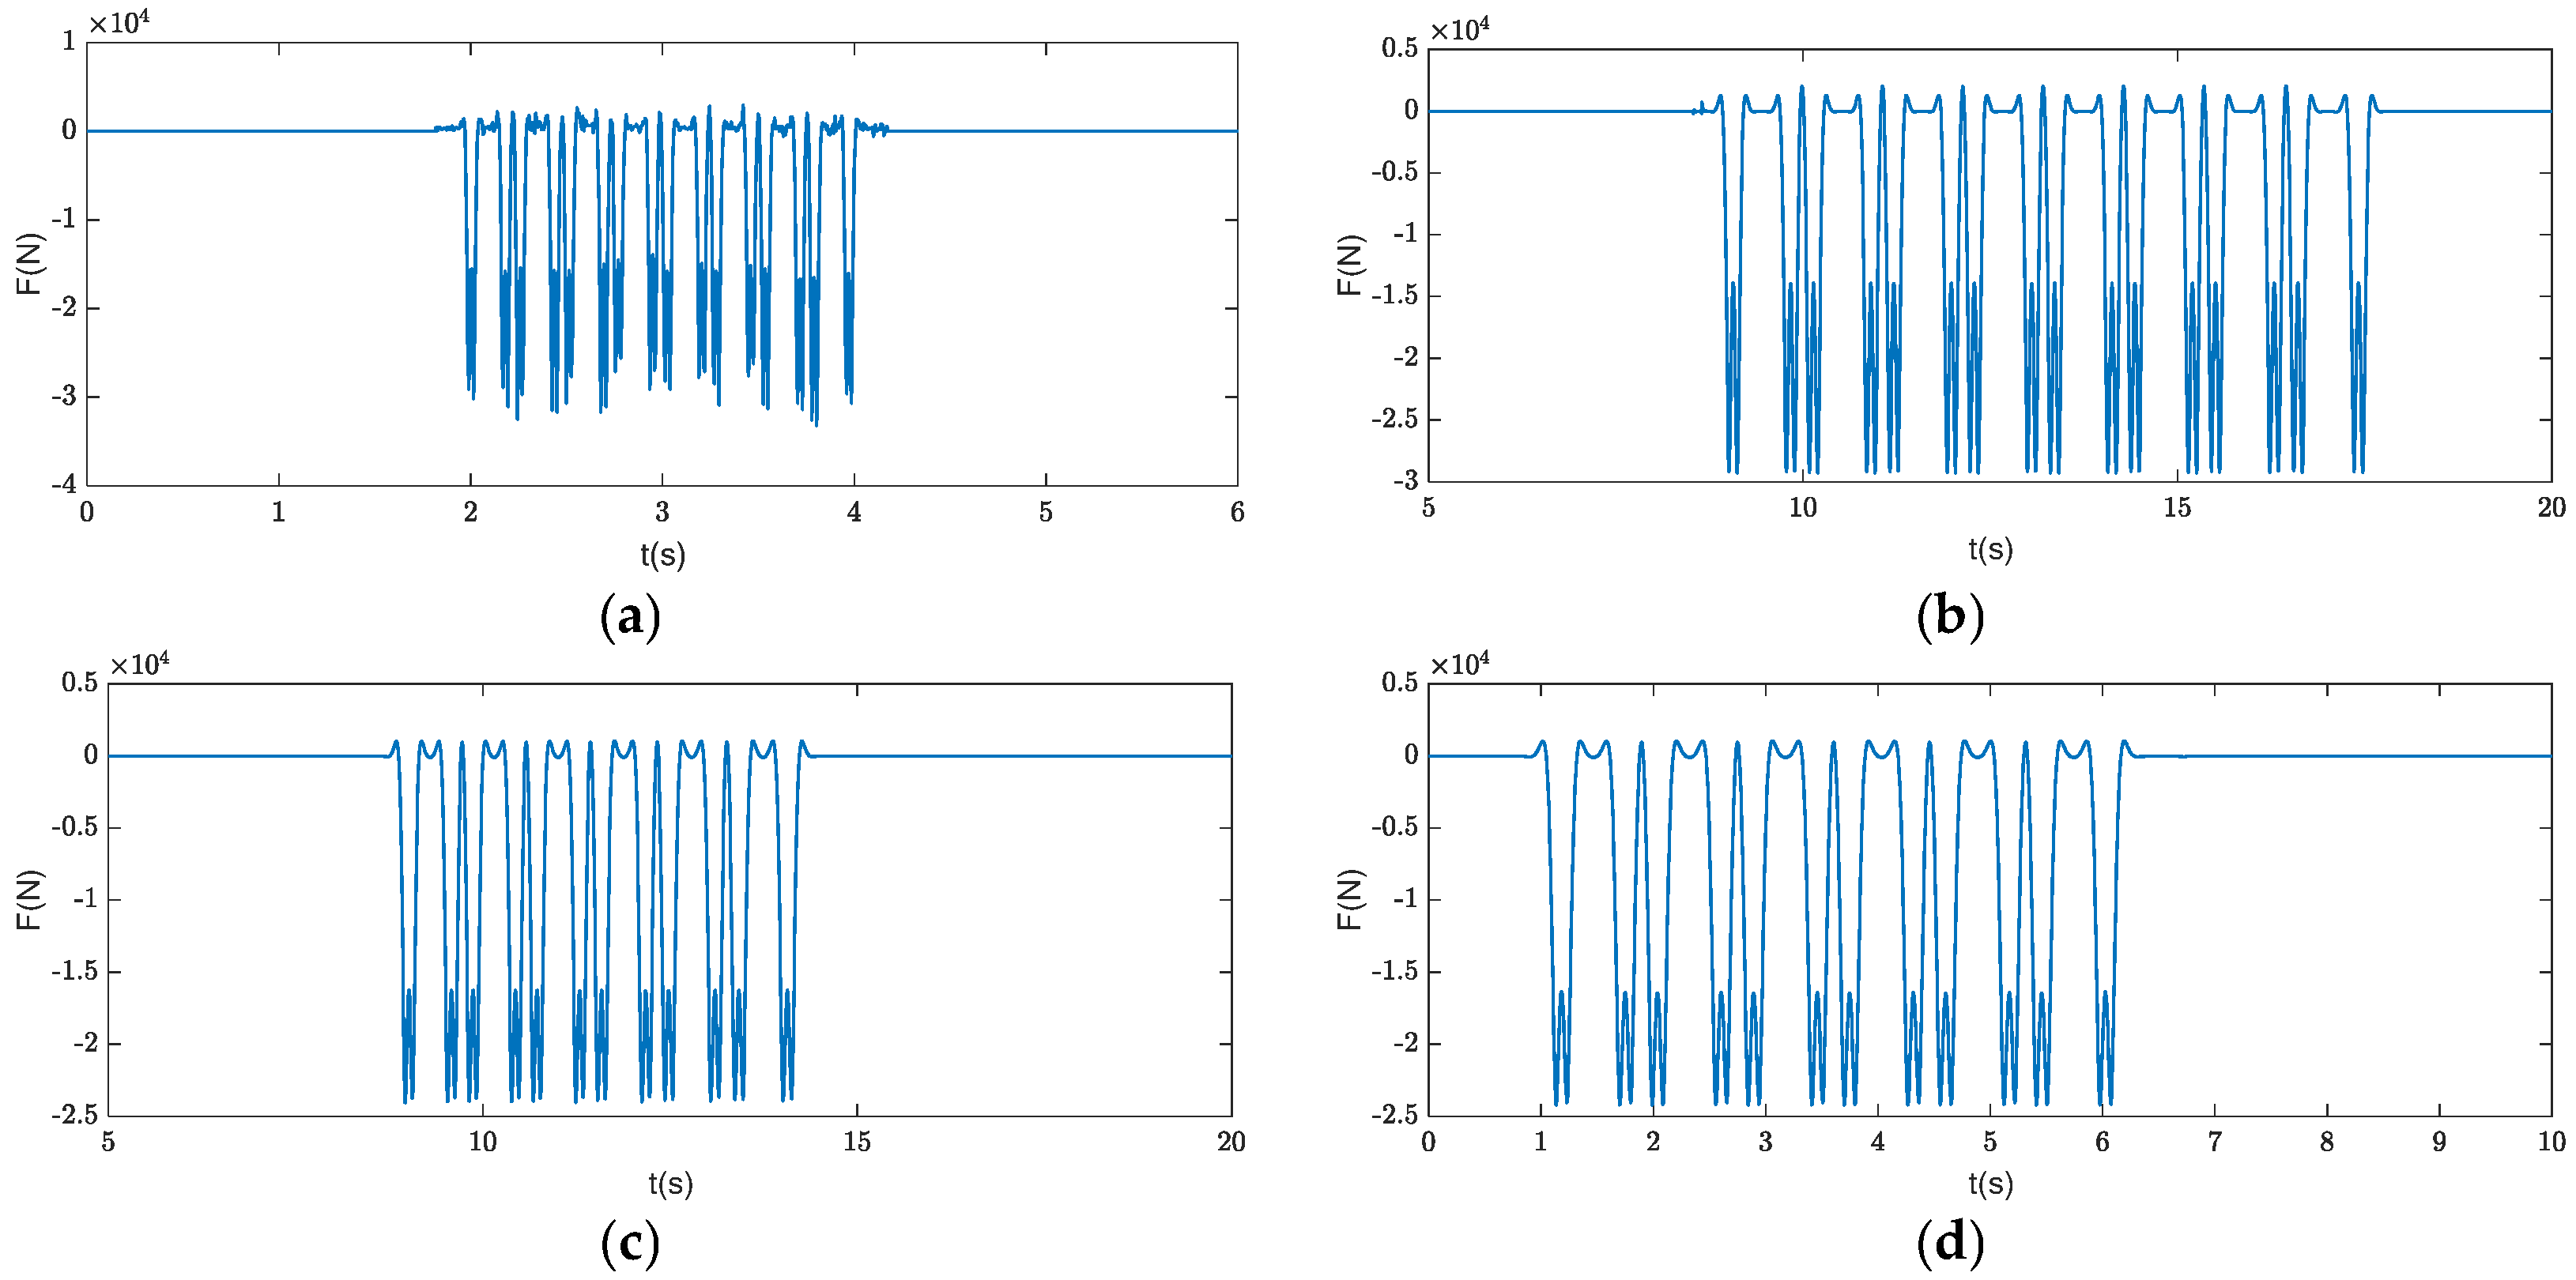
Based on the vehicle–track coupling model, dynamic equations were established [33], as shown in Equation (3). The wheel-rail excitations for the following operating conditions were obtained: Tongyong High-speed Railway passing through the station at 350 km/h, Intercity Railway entering the station at 80 km/h with deceleration of 0.6 m/s2, and Metro Line 2 and Line 6 entering the station at 80 km/h with deceleration of 1 m/s2, as shown in Figure 5. Since Metro Line 2 and Line 6 have identical train types, speeds, and track conditions, the same wheel-rail excitation was used for both.
Let , , , , and denote the mass matrix, damping matrix, stiffness matrix, displacement vector, and external load of the vehicle element, respectively; and let , , , , and denote the mass matrix, damping matrix, stiffness matrix, displacement vector, and external load of the track and foundation subsystem, respectively.
Figure 5.
Time history of wheel-rail excitation under different operating conditions. (a) High-speed Railway. (b) Intercity Railway. (c) Metro Line 2. (d) Metro Line 6.
3.2. Station–Soil–Building Coupling Model
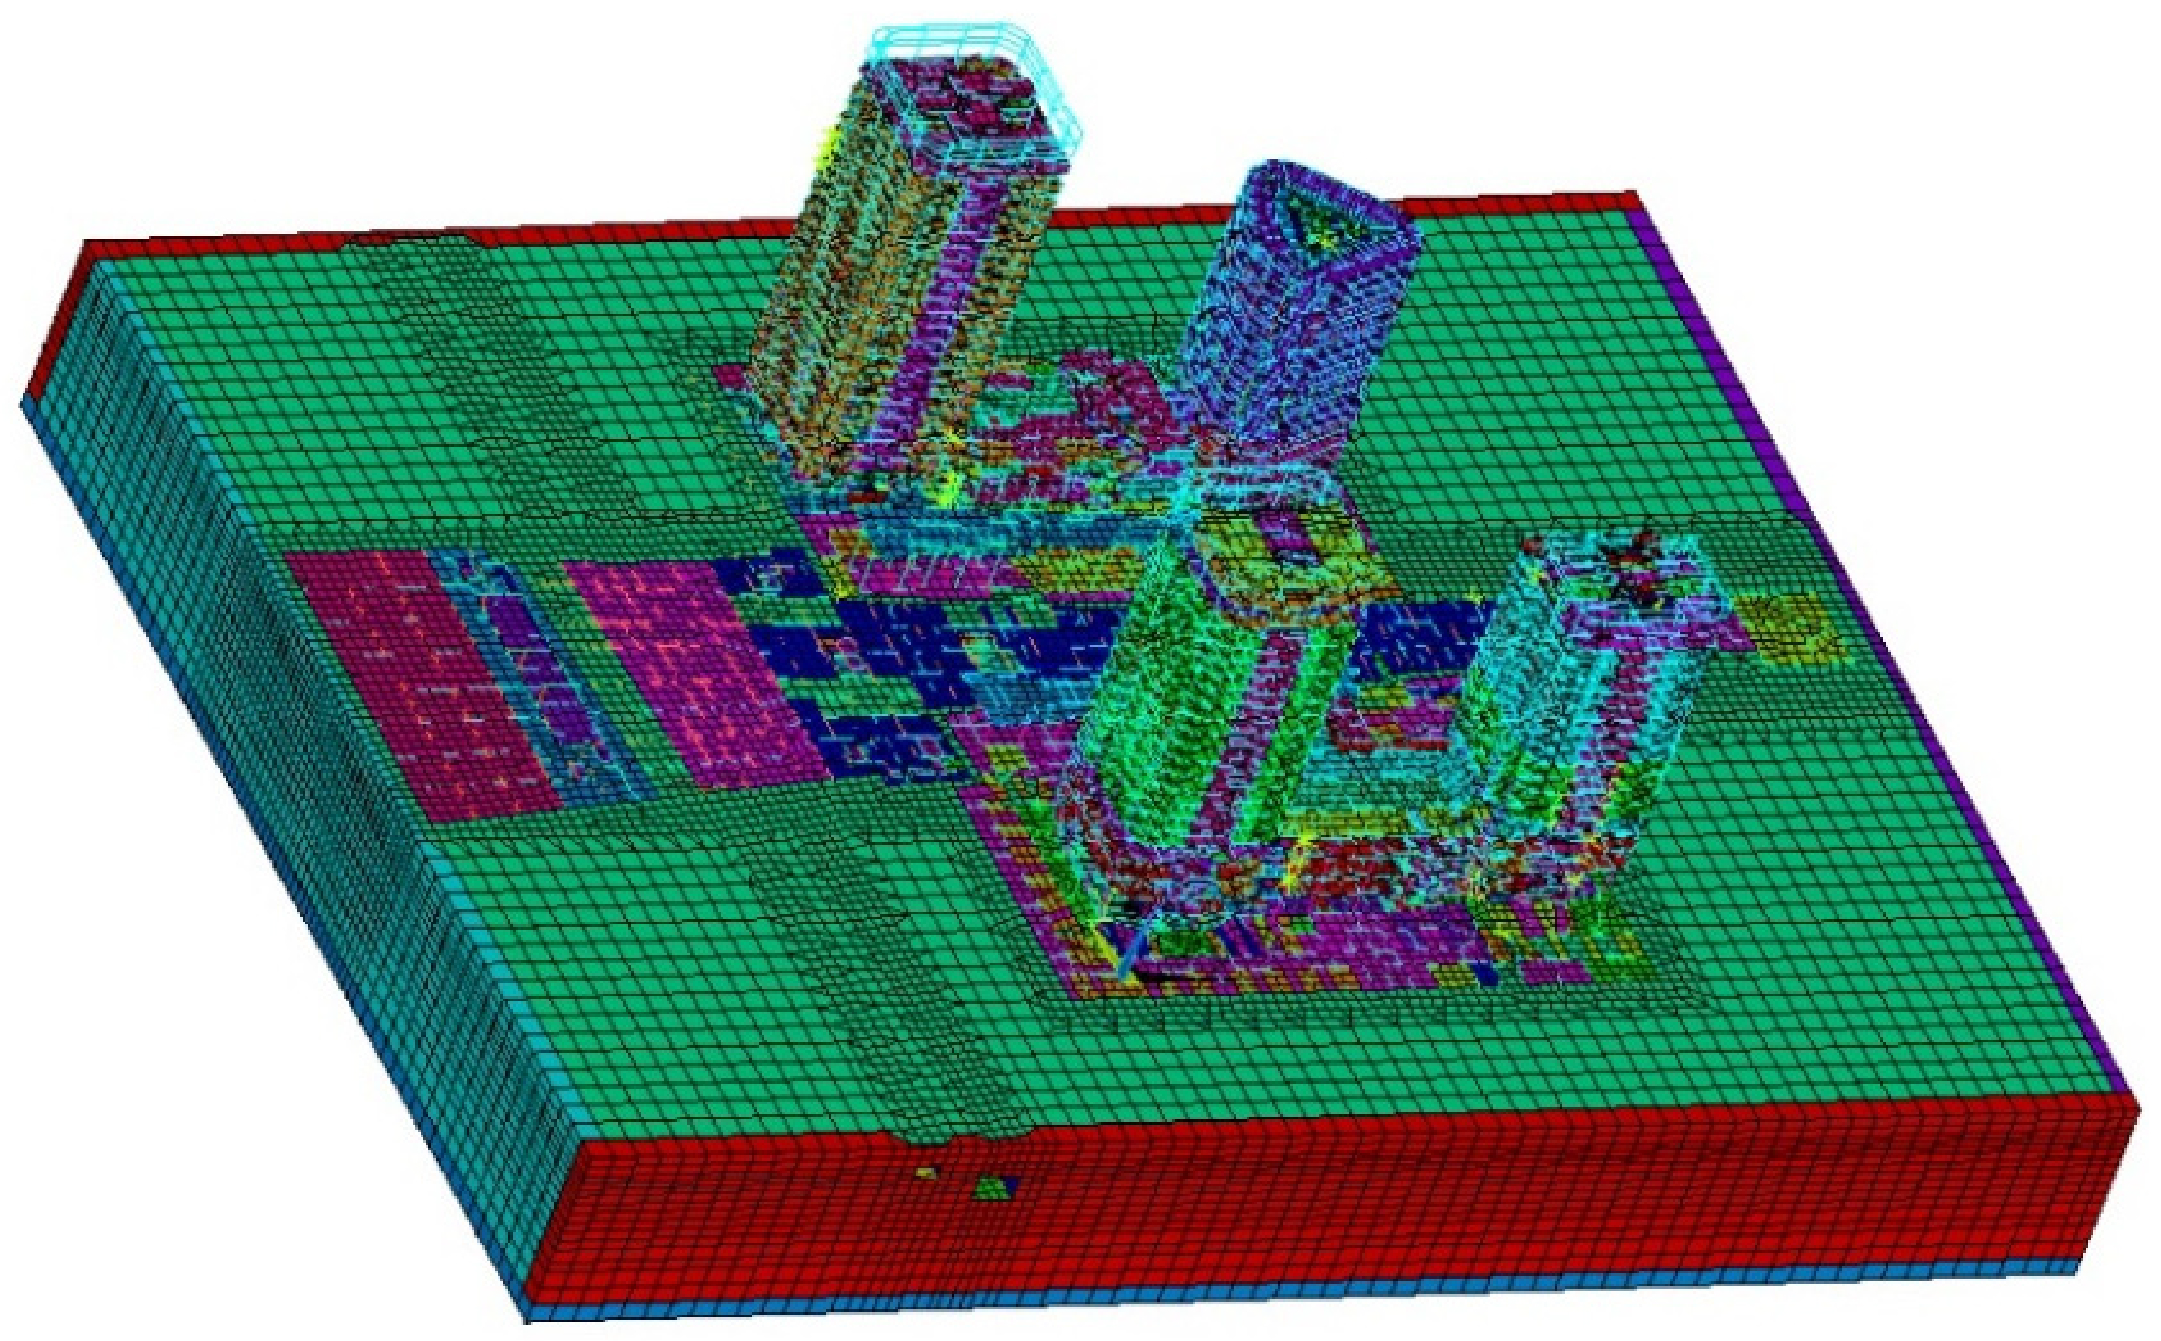
A station–soil–building coupling model was established using finite element software. Since train-induced vibrations of adjacent buildings are micro-vibrations and the entire structure remains within the elastic range, all components were modeled as elastic materials. The soil was modeled using solid elements, walls and slabs using shell elements, and beams and columns using beam elements. The soil material parameters were selected according to the geotechnical investigation report, as shown in Table 3.
Table 3.
Soil material parameters.
To avoid “low-pass filtering” and “dispersion” effects, the element size should not be too big. Research shows that when the element length satisfies , where is the minimum shear wavelength, the calculation results can meet the accuracy requirements. Balancing computational accuracy and efficiency, the element size in this analysis model was controlled between 0.6 and 6 m.
To simulate wave propagation in an infinite soil domain, appropriate boundary conditions were applied to the model boundaries. Three-dimensional viscoelastic artificial boundary elements were used around the model to prevent wave reflections at the boundaries that would affect computational accuracy. The viscoelastic boundary has been validated to effectively absorb both body waves and surface waves in the frequency range of interest (1–80 Hz).
Furthermore, an excessively small model size may lead to calculation deviations due to boundary condition limitations, thereby reducing accuracy. Conversely, an excessively large model size, while improving accuracy, significantly increases computation time. Therefore, while ensuring accuracy and efficiency, the overall soil dimensions in the model were controlled to 400 m × 310 m × 50 m. This size ensures that the distance from the vibration source to the artificial boundary is at least 3~5 times the shear wavelength of the lowest frequency (1 Hz), which minimizes boundary-induced errors.
During computation, damping needs to be set to simulate the attenuation of vibration during propagation. The commonly used damping model is Rayleigh damping, expressed as . The corresponding damping ratio can be expressed as . Therefore, it is only necessary to determine two frequencies and their corresponding damping ratios to obtain the Rayleigh damping coefficients. Based on empirical measurements, train-induced vibrations are mainly distributed in the 1–80 Hz frequency range. To ensure that the damping ratio remains at a reasonable level within this frequency band, the frequencies for calculating the Rayleigh damping coefficients were set to 1 Hz and 80 Hz. The damping ratio for reinforced concrete structures is typically taken as 0.05. The calculated coefficients are , . With these coefficients, the actual damping ratio stays between 0.01 and 0.05 across the 1–80 Hz range, providing a conservative yet accurate representation of energy dissipation.
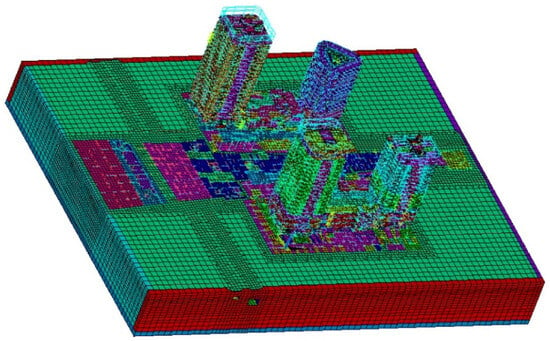
The final established station–soil–building coupling model is shown in Figure 6.
Figure 6.
Station–soil–building coupling model.
3.3. Model Reliability Verification
Since most of the buildings analyzed in this project and the rail lines have not yet been completed, field vibration measurements are not possible. Therefore, field vibration measurements of Metro Lines 2 and 6 were used to compare with numerical simulation results to verify the model’s reliability.
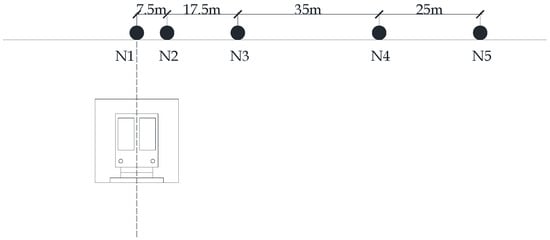
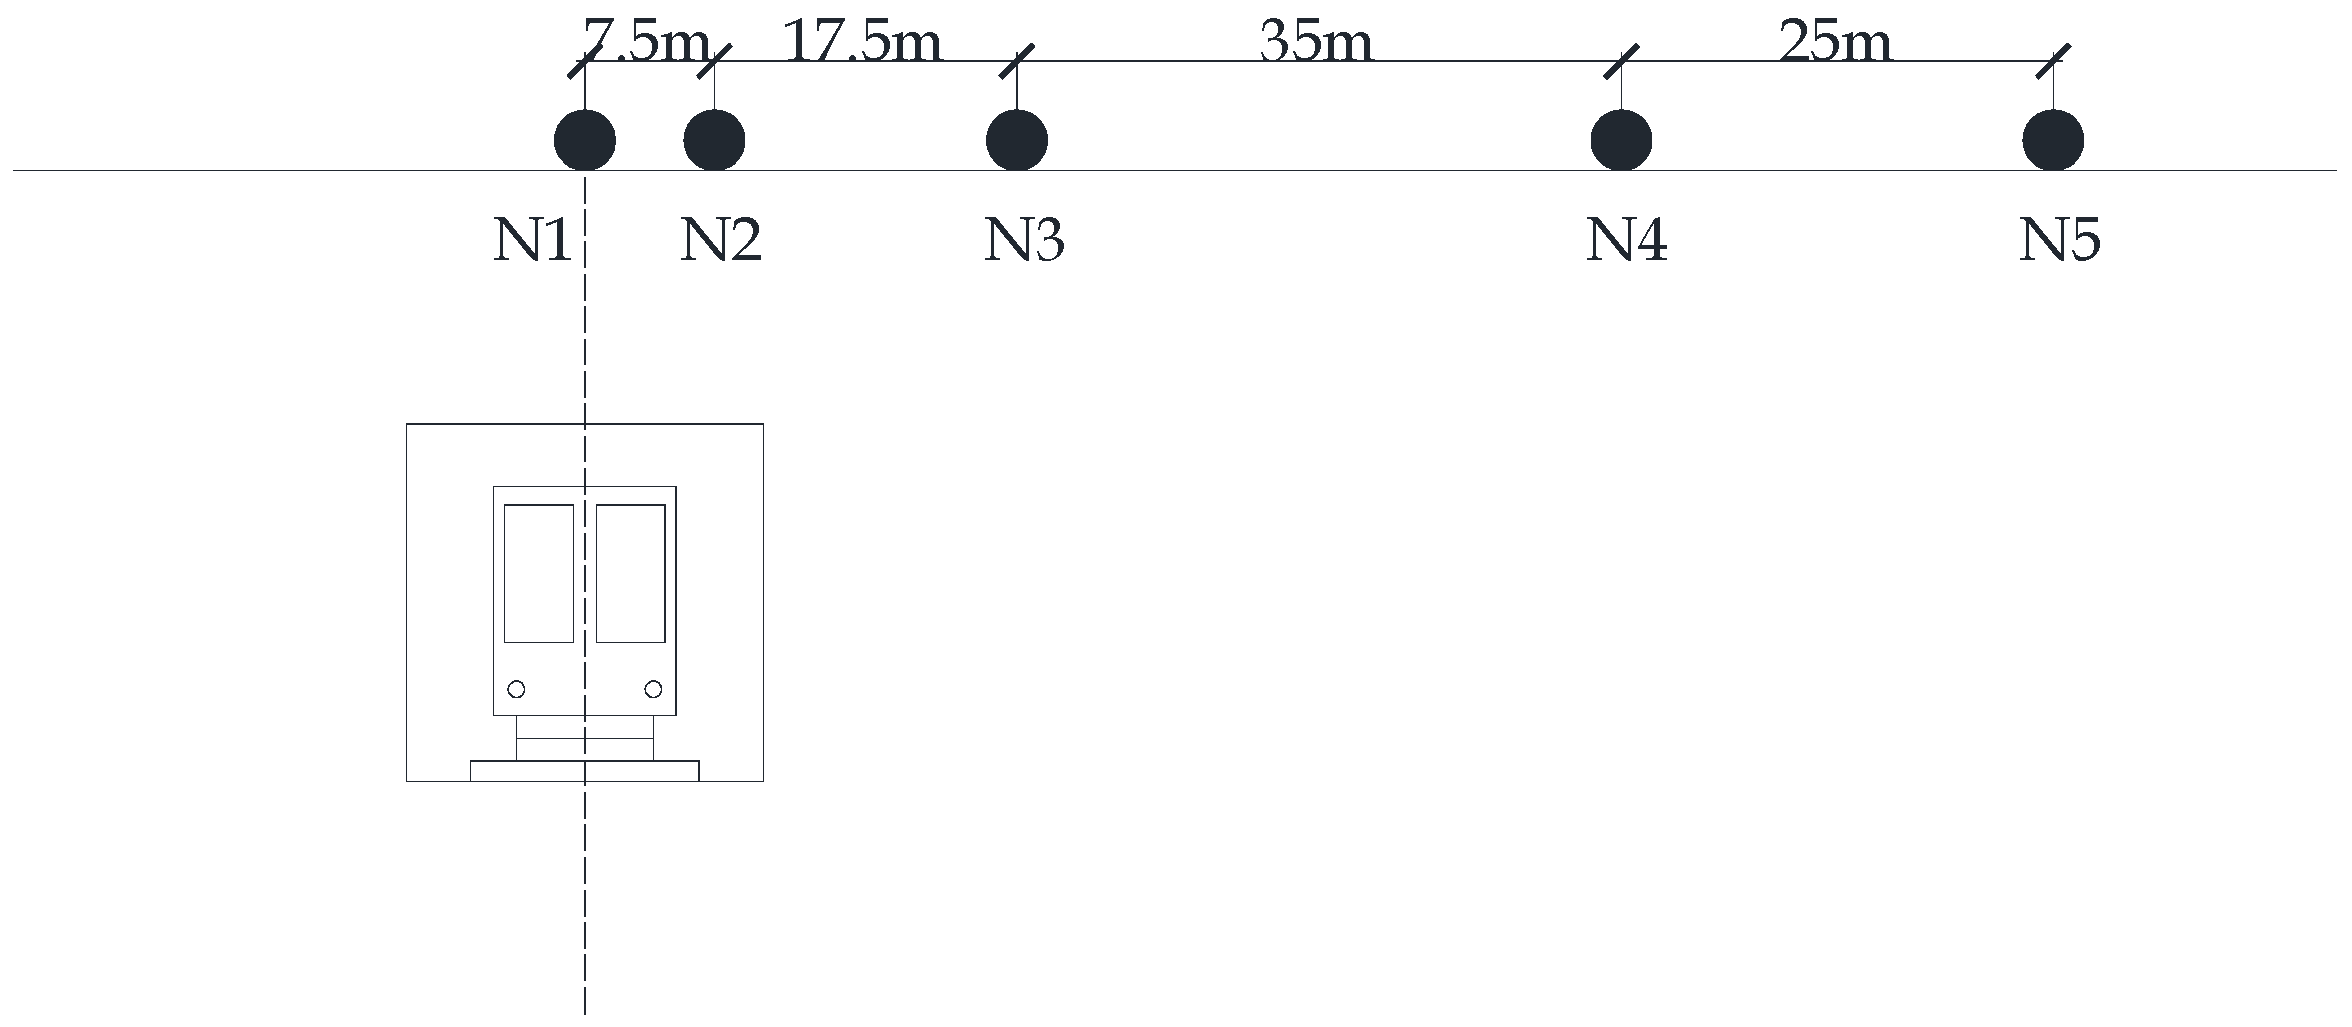
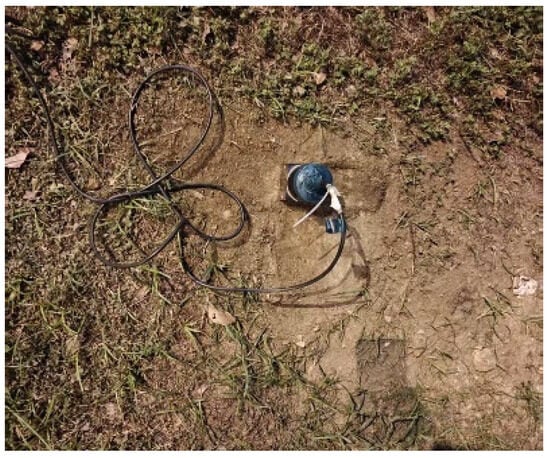
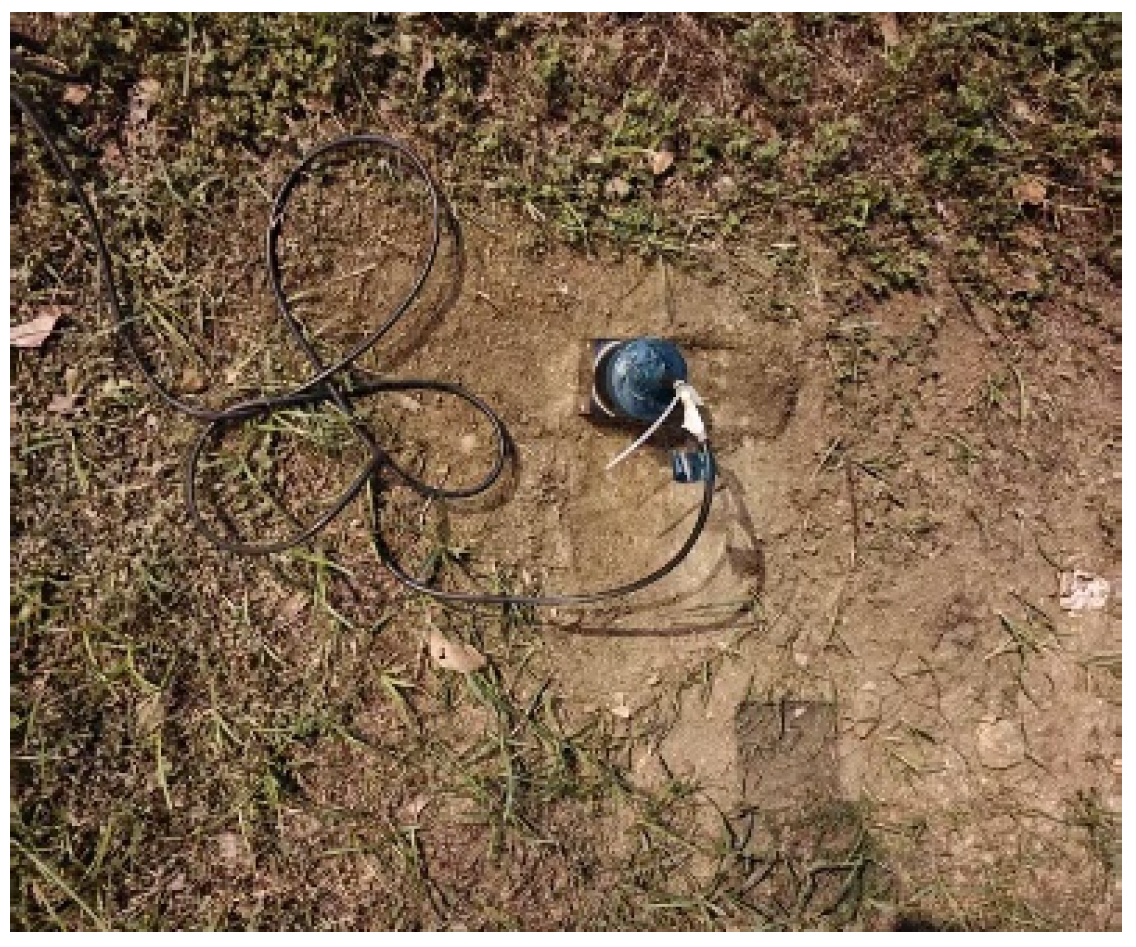
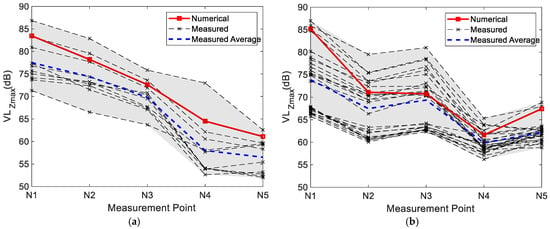
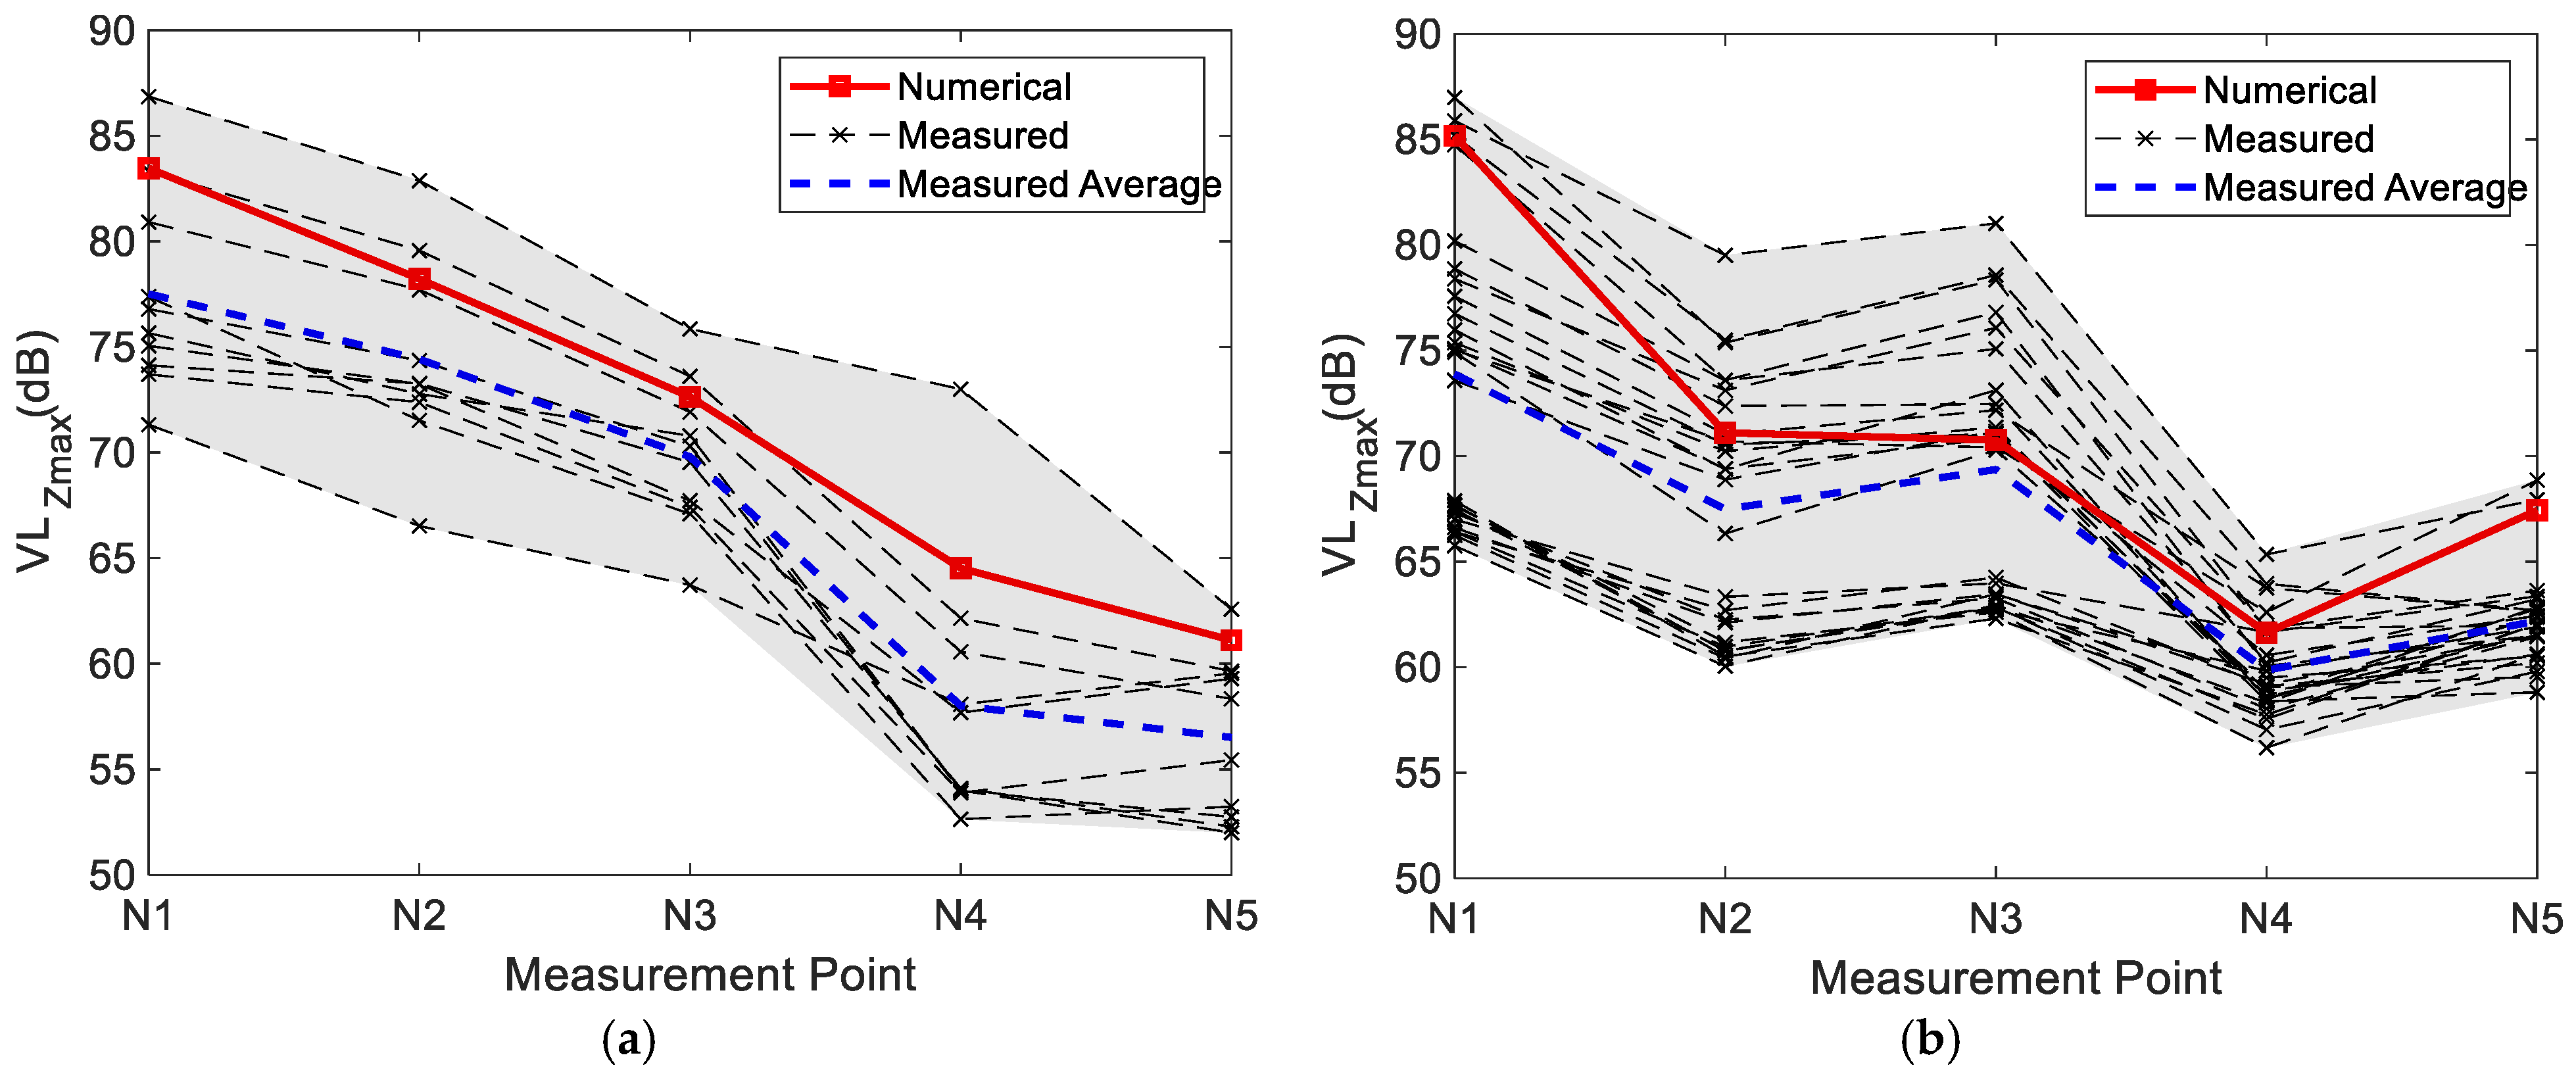
Surface measurement points were selected directly above the tracks and at various horizontal distances from the track for Metro Lines 2 and 6. The specific layout of the measurement points is shown in Figure 7. Multiple vibration tests were conducted under train entering station conditions. During field measurements, loose surface soil and debris were cleared, the soil was compacted, and the vibration pickups were placed horizontally. The field layout of the vibration pickups is shown in Figure 8. According to the requirements of the Chinese standard “Measurement method of environmental vibration of urban area” (GB 10071-1988) [34] for railway vibration measurement methods, tests were conducted for the entering-station conditions of the two metro lines. Vertical acceleration time-history signals of site vibrations were collected, and the maximum Z-vibration level at each measurement point during each subway train passage was obtained through analysis. The arithmetic mean of multiple measurements was used as the evaluation value. Meanwhile, the wheel-rail excitations of the two metro lines were input into the track nodes of the finite element model to obtain numerical simulation results for the corresponding measurement points. The site prediction results from the numerical simulation were compared with the measured results, as shown in Figure 9, and the error comparison between the simulated and measured average values is presented in Table 4. The figure shows that the numerical simulation results fall within the envelope of the measured results. Compared with the measured evaluation values, both show similar patterns, with relative errors within 15%. The numerical simulation results are slightly higher than the measured average. This may be because the finite element model cannot precisely simulate material variations in the soil, and its calculations typically consider the most unfavorable factors. Specifically for Metro Line 6, although the train type and track condition are the same as those of Metro Line 2, minor differences in tunnel geometry and local soil heterogeneity lead to slightly larger deviations at points N1 and N5. Nevertheless, the relative errors for both lines remain within 15%, which is acceptable for engineering practice. Although the above validation is based on site vibration data from metro lines, the analytical and simulation methods used for high-speed railway trains are exactly the same as those used for metro lines—both rely on the same vehicle–track–soil–building coupling framework and numerical scheme. Therefore, the predictions of floor vibrations induced by high-speed railway trains can also be considered reliable.
Figure 7.
Schematic diagram of measurement point layout.
Figure 8.
Field layout of ground vibration pickups.
Figure 9.
Comparison of numerical simulation and field measurement results. (a) Metro Line 2. (b) Metro Line 6.
Table 4.
Error between numerical simulation and measured results (dB).
4. Vibration Comfort Analysis
Plots G and F1 are mainly affected by four rail transit lines: Tongyong High-speed Railway, Rutongsuhu Intercity Railway, and Metro Lines 2 and 6. Therefore, the following analysis focuses on five typical operating conditions with significant impact, as shown in Table 5. The burial depth of the Tongyong High-speed Railway track is approximately 28 m. The horizontal distance to the basement of Plot G is about 15 m, and to the basement of Plot F1 is about 12 m. The Rutongsuhu Intercity Railway track is buried at about 28 m and passes underneath both plots G and F1. Metro Line 2 is buried at about 10 m, with a horizontal distance of about 65 m to the basement of Plot G and about 60 m to the basement of Plot F1. Metro Line 6 is buried at about 17 m, with a horizontal distance of about 40 m to the basement of Plot G and about 35 m to the basement of Plot F1. Furthermore, since the High-speed Railway and Intercity Railway operate only during the daytime, Conditions 1, 2, and the combined Condition 5 are evaluated only against daytime limits, not nighttime vibration limits.
Table 5.
Analysis conditions.
4.1. Inter-Story Vibration Response Distribution
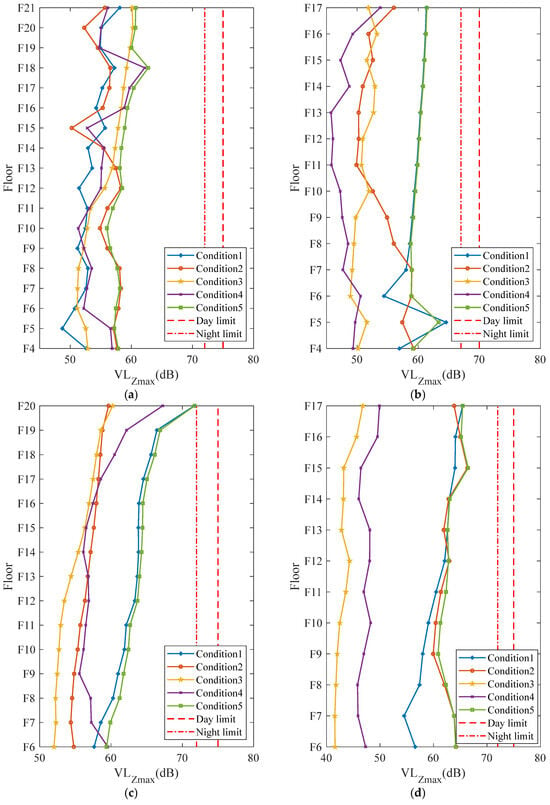
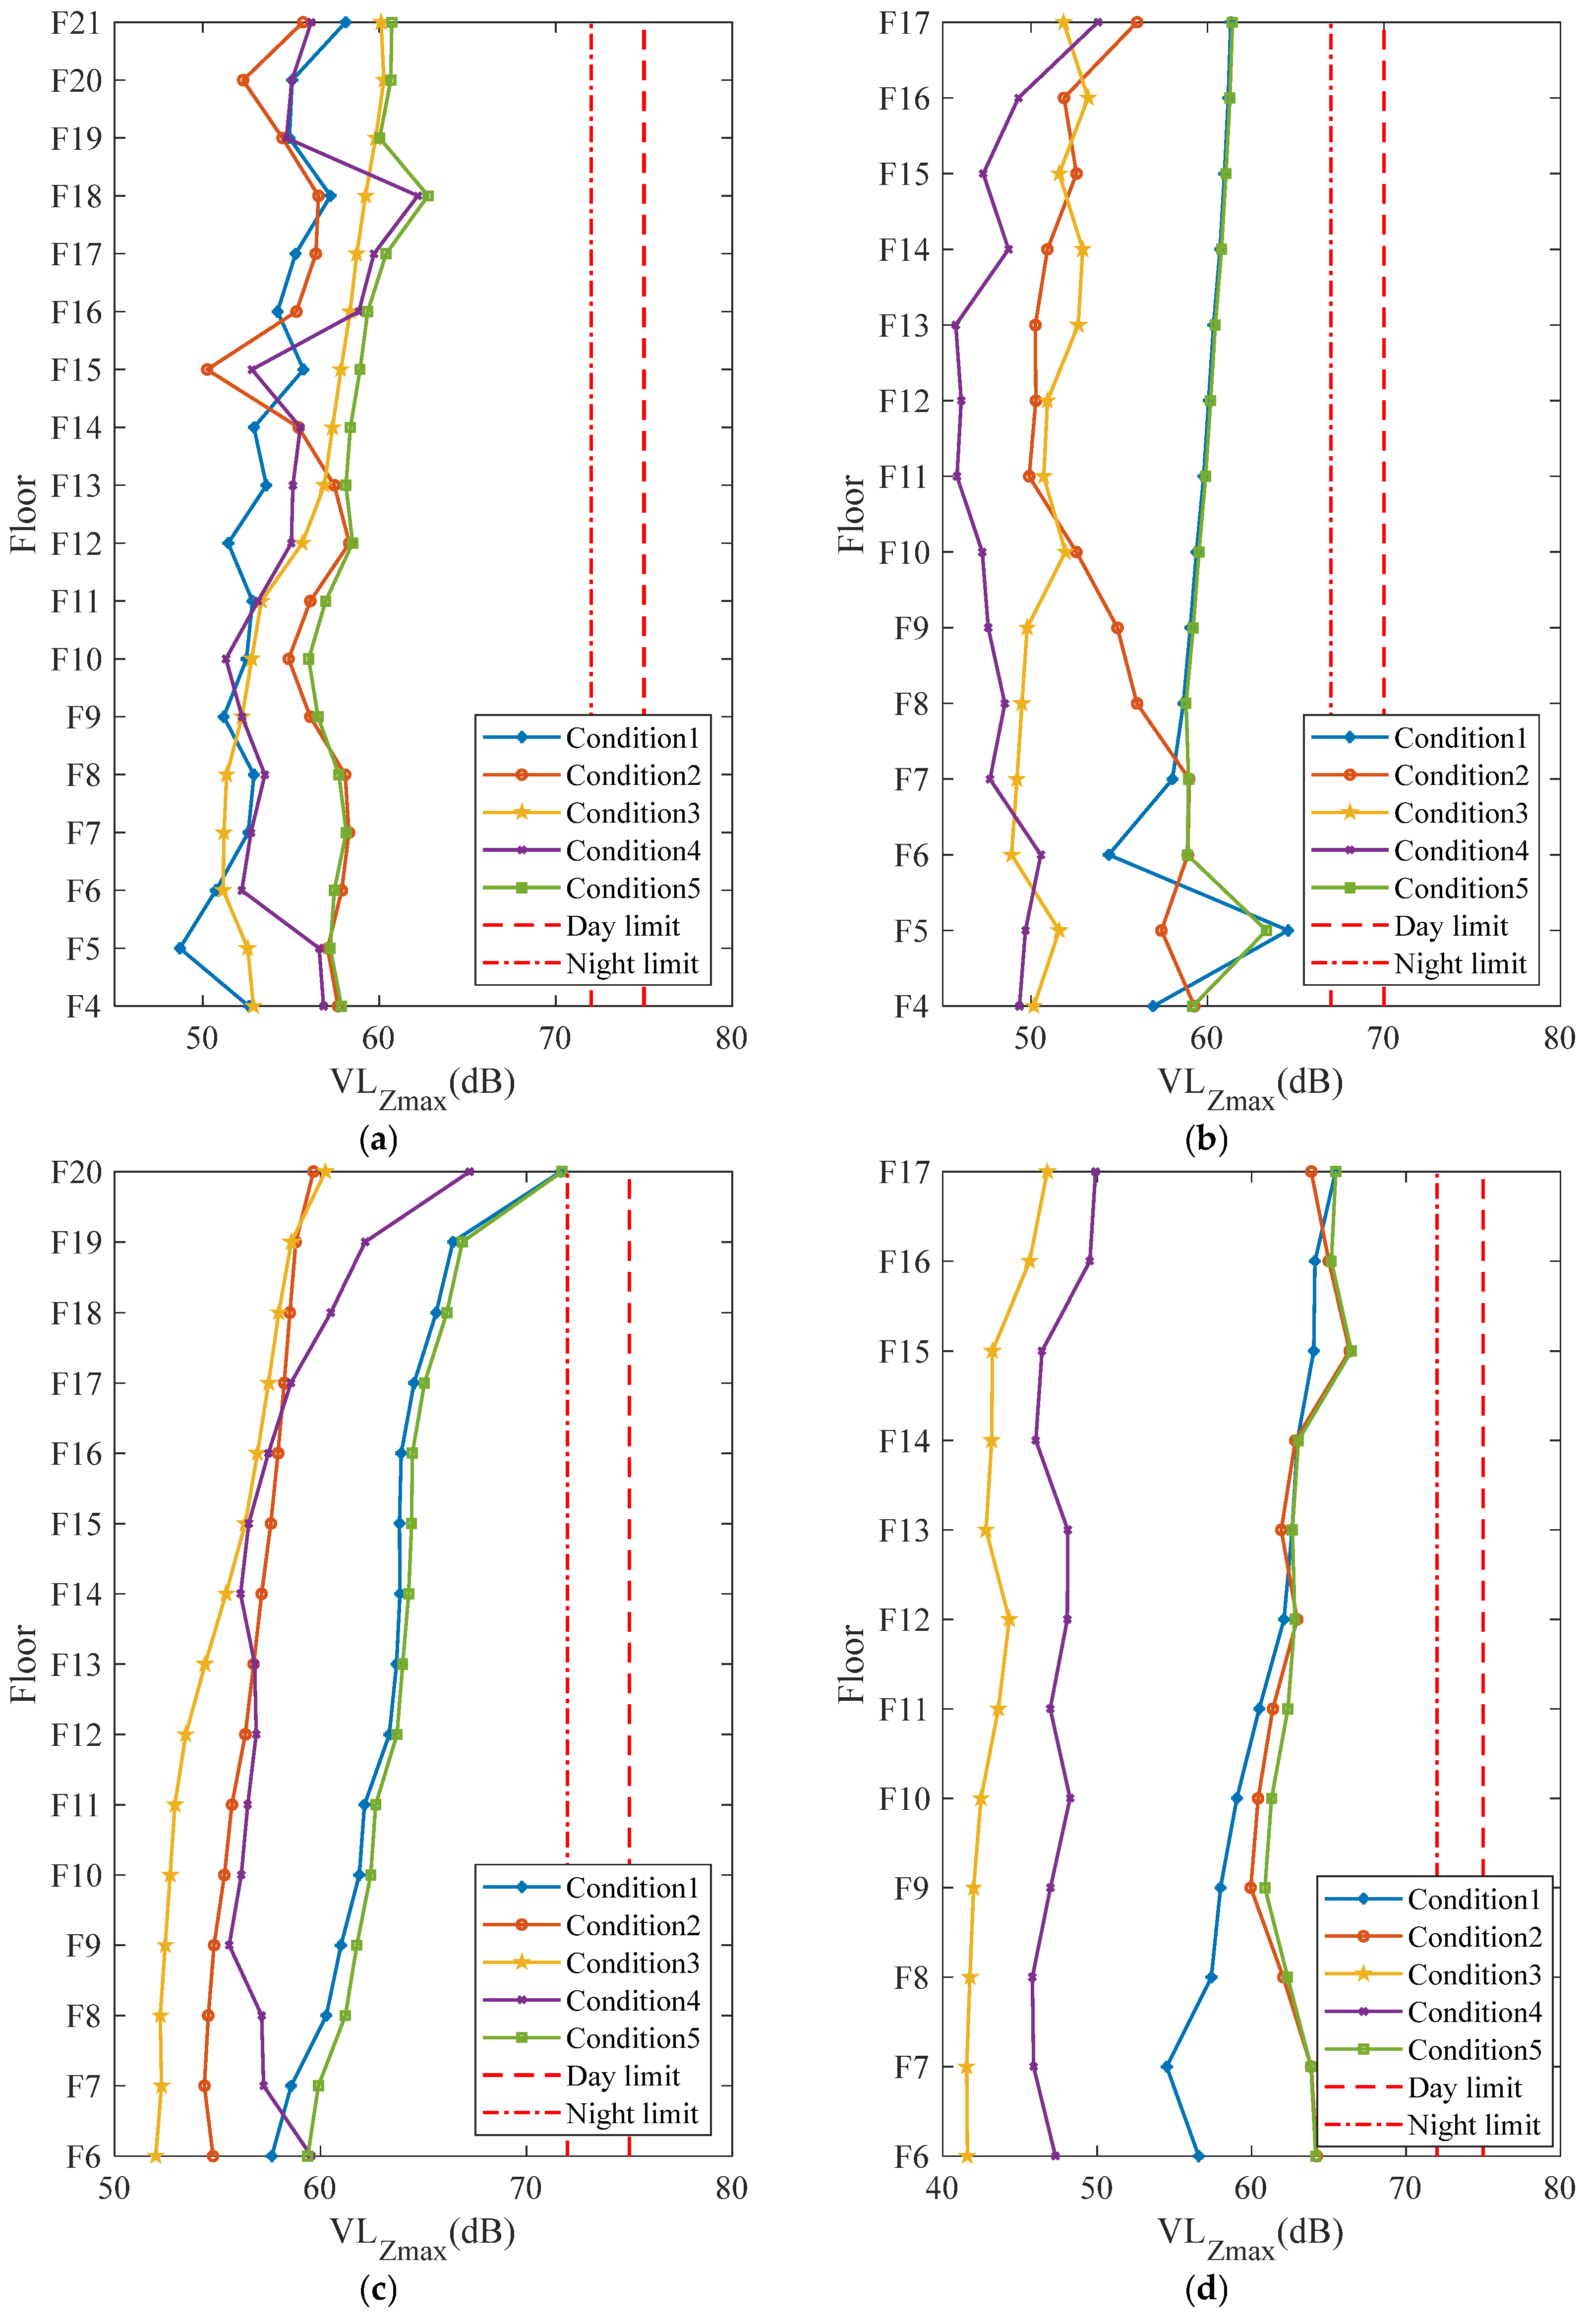
The wheel-rail excitations calculated above were input into the established station–soil–building coupling model, and the vibration responses for single-train passage cases (Conditions 1 to 4) were obtained. Since both the building structure and the soil remain in the elastic range during train-induced vibrations, the results under combined operating conditions can be obtained by direct linear superposition of the single-case results. Furthermore, because different trains may pass through the station with a certain time lag, the maximum vibration response considering variable time lags was obtained through multiple linear superpositions; this is taken as the response for Condition 5 (multi-train convergence). Figure 10 shows the maximum Z-vibration level for each floor of the main towers (excluding podiums).
Figure 10.
Maximum Z-vibration level for each floor under different conditions. (a) G-1# Building. (b) G-2# Building. (c) F1-1# Building. (d) F1-2# Building.
Comparing the vibration response amplitudes under different conditions: For the vast majority of floors, Condition 1 (Tongyong High-speed Railway passing through at 350 km/h) induces a significantly larger vibration response than the other single-train conditions. This indicates that train speed is a major factor affecting structural vibrations. The next most significant vibration response is induced by Condition 2 (Rutongsuhu Intercity Railway entering station). This is because the Rutongsuhu Intercity Railway passes directly underneath the raft slabs of Plots G and F1, whereas the other three rail lines pass laterally at greater distances from the building structures. This indicates that the distance from the track to the building is also a key secondary factor affecting vibrations. For Conditions 3 and 4, the horizontal distances of the subway tracks from the buildings are relatively large, and the operating speeds are slower, so the structural vibrations induced by these two conditions are relatively small. The vibration response under Condition 5 is almost identical to the maximum vibration values among the four single-train conditions. Specifically, among the four tower buildings, the maximum difference between Condition 5 and the most unfavorable single-train condition at any floor is 1.33 dB, and for the vast majority of floors, the difference is within 1 dB. Multi-train converging conditions do not significantly increase the structural vibration level, indicating that structural vibration is dominated by the strongest vibration source. This is likely due to differences in phase, amplitude, and frequency distribution between vibrations generated by different lines. Therefore, in engineering practice, only the most unfavorable single-train condition needs to be controlled.
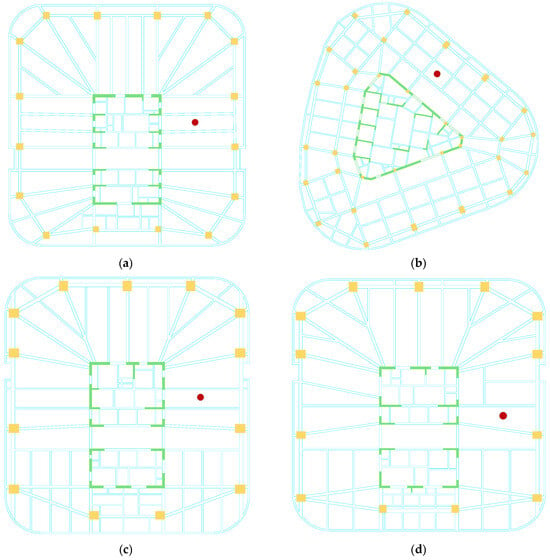
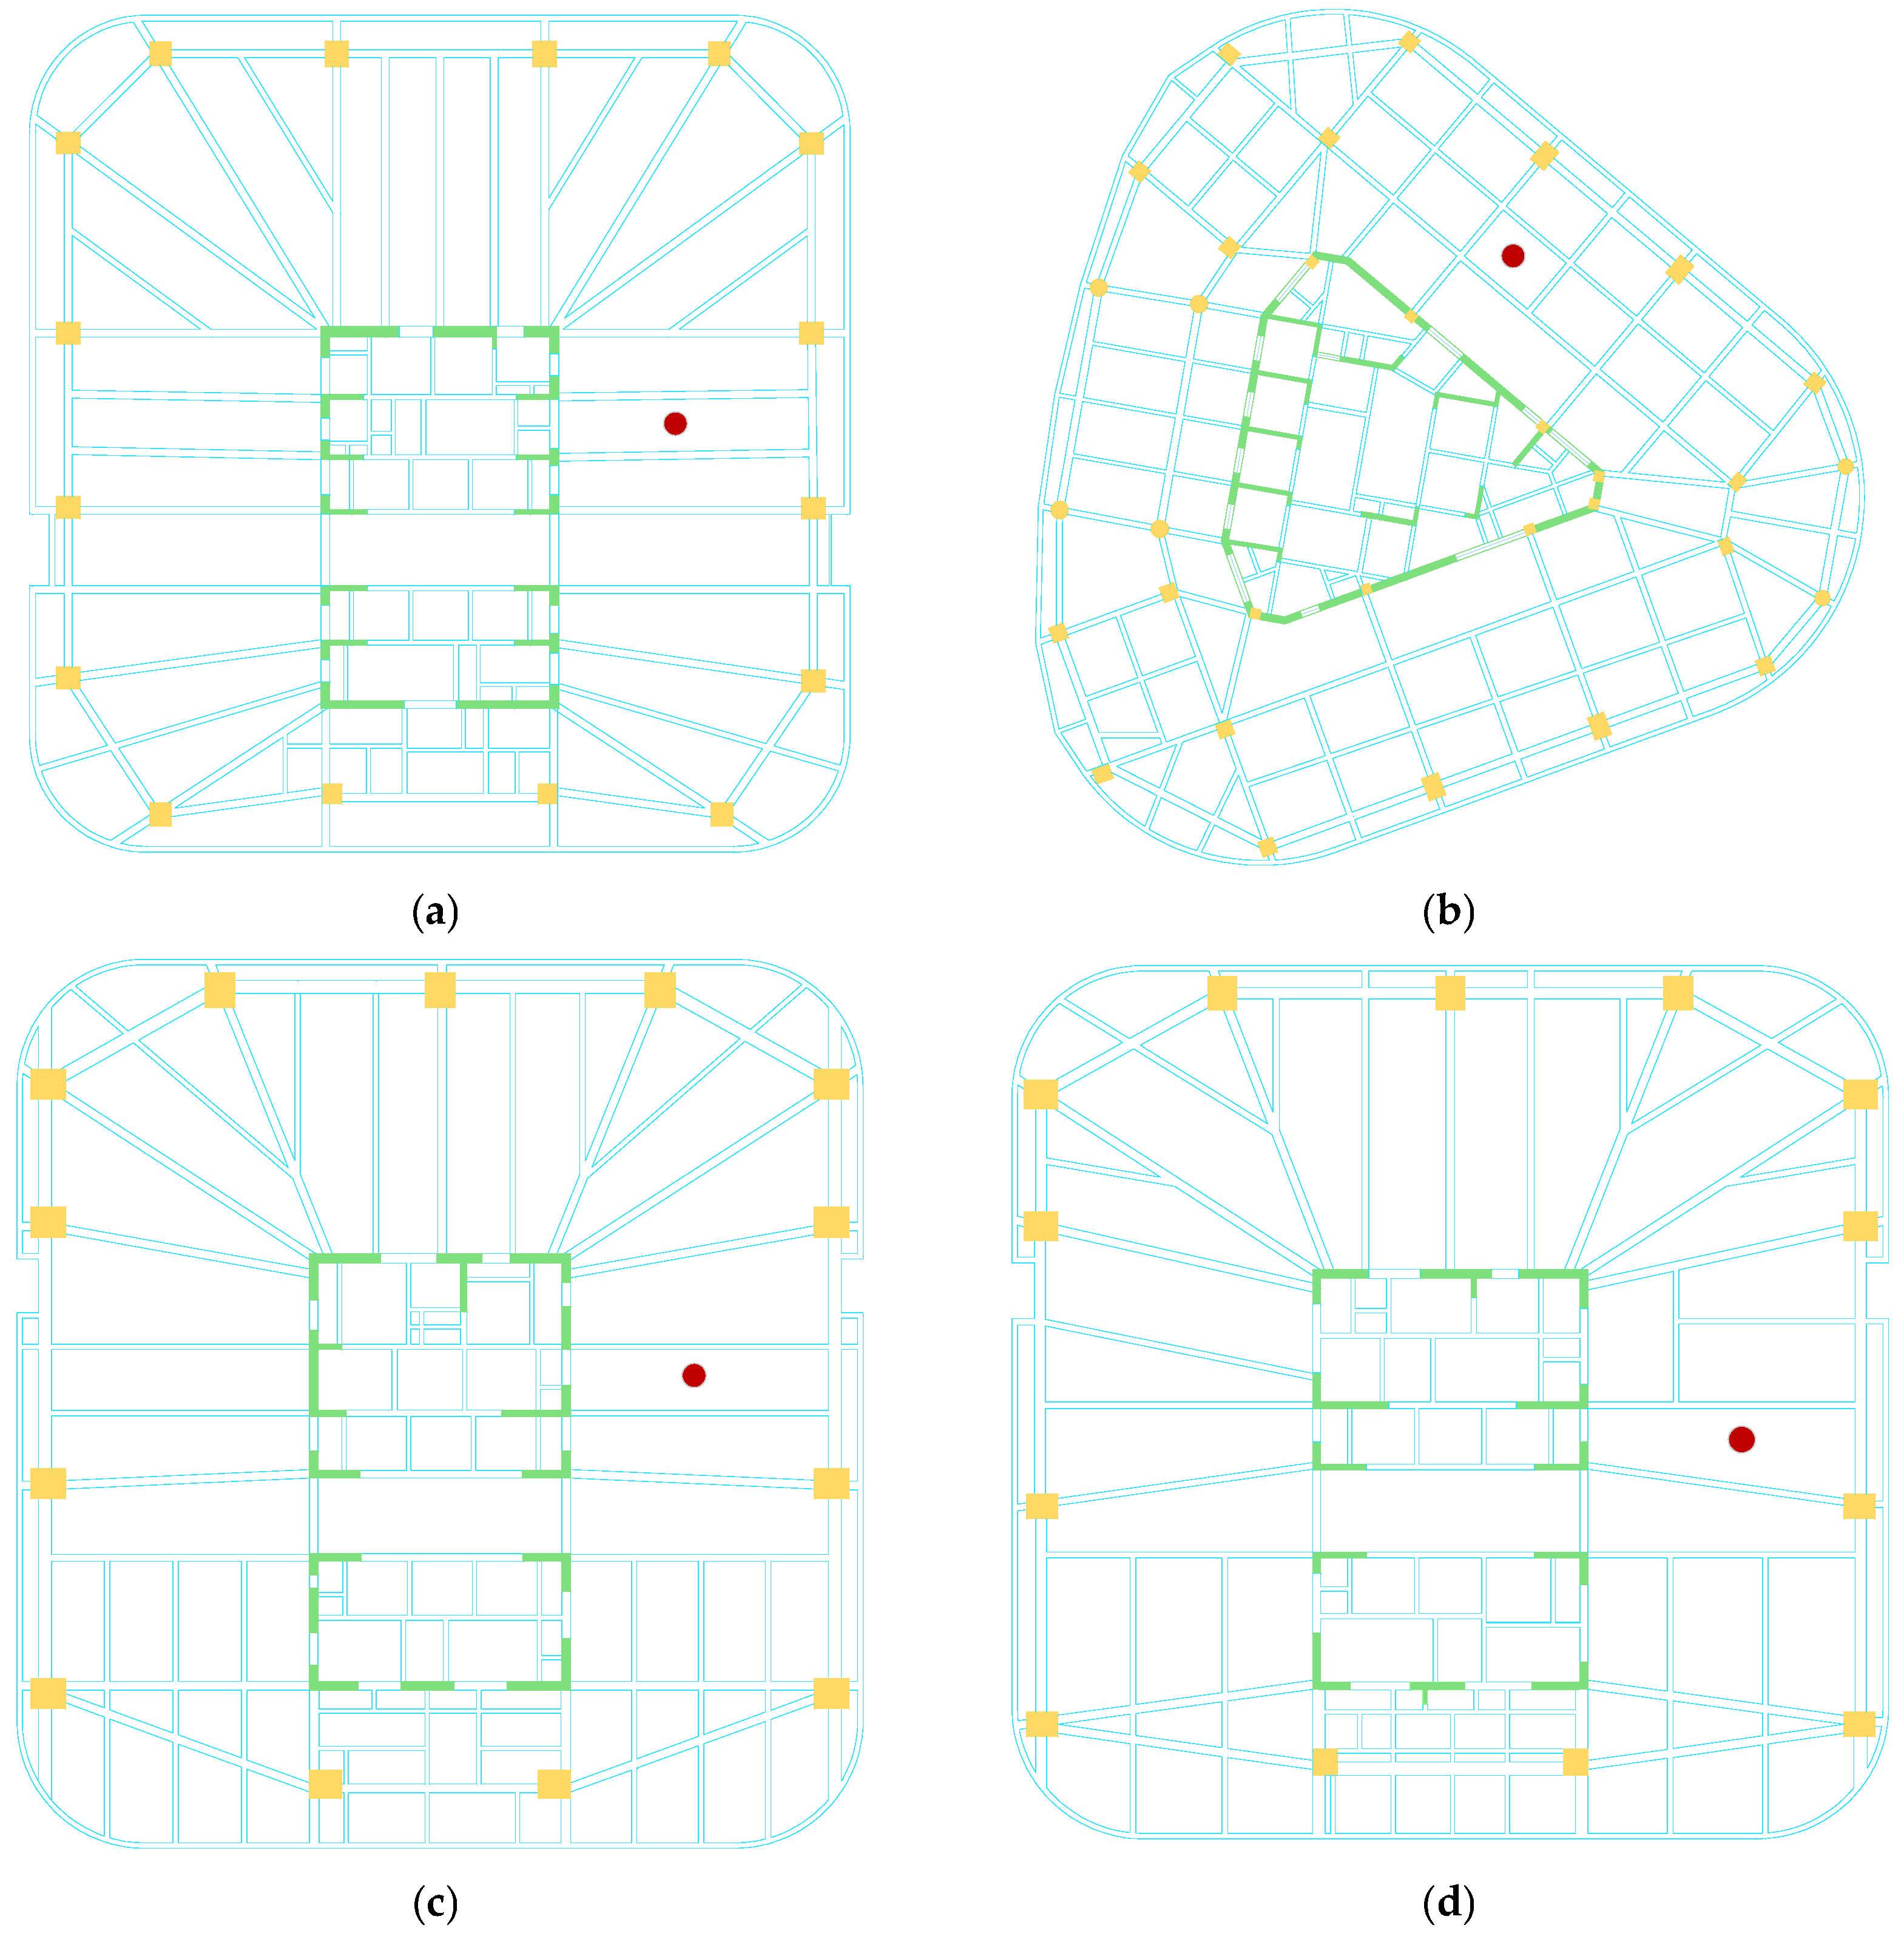
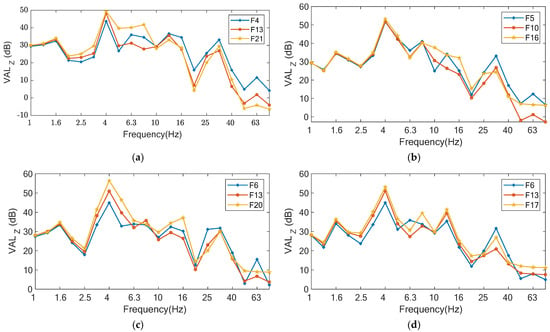
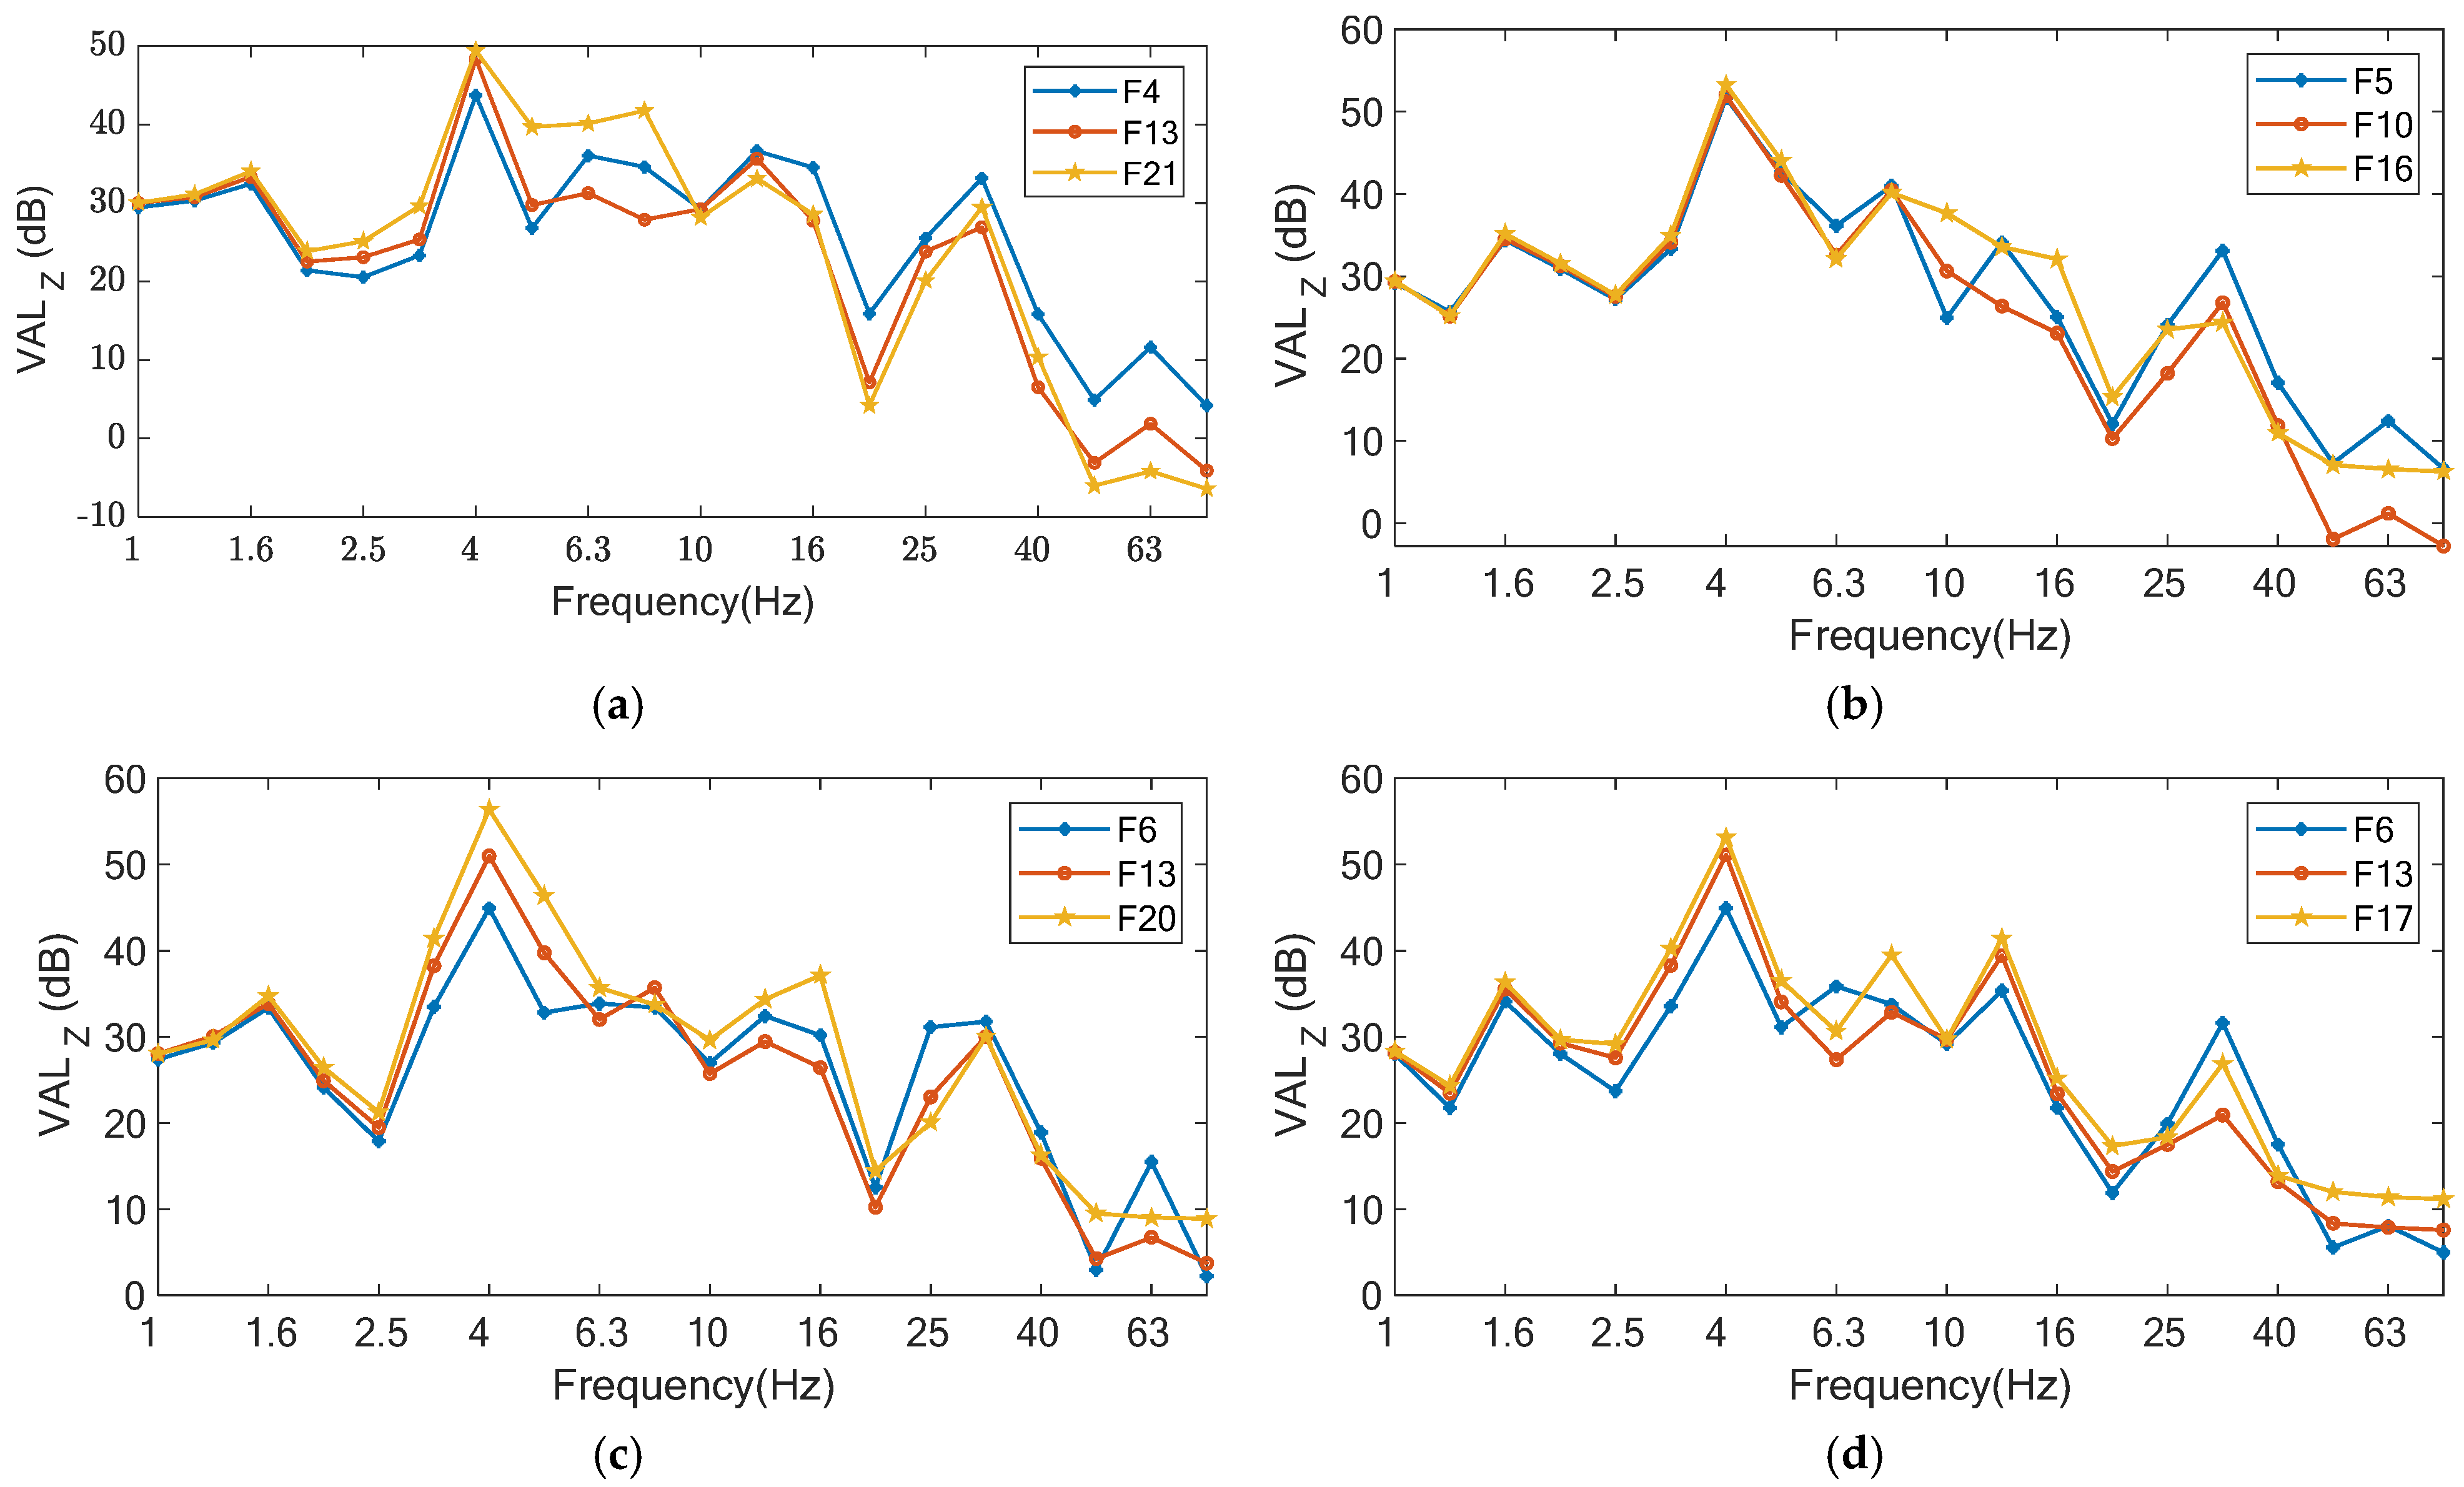
To investigate the frequency distribution of vibrations on each floor, measurement points were arranged at the mid-span of the slabs, as indicated by the red dots in Figure 11. Figure 12 shows the one-third octave band vibration level spectra at the above measurement points on some typical floors under Condition 1. It can be seen from the figure that the dominant vibration frequency on each floor is around 4 Hz, which is close to the natural frequency of the slabs. High-frequency vibrations are more pronounced in lower floors, while low-frequency vibrations are more pronounced in higher floors. This indicates that high-frequency vibrations gradually attenuate due to energy dissipation and other reasons during upward propagation through the floors, while low-frequency vibrations undergo resonant amplification due to proximity to the slab’s fundamental frequency (approximately 4 Hz). As the floors increase in height, the higher-mode contributions of the building become more significant, and the reduced vertical stiffness of the upper structure further lowers the local natural frequencies, making them closer to the dominant low-frequency excitation. Consequently, the amplification of low-frequency components is more pronounced on upper floors. Therefore, the vibration response level of some buildings does not gradually attenuate with increasing floor height but is amplified at the top floor, as seen in F1-1# Building.
Figure 11.
Structural layout of main typical floors and schematic diagram of measurement point locations. (a) G-1# Building. (b) G-2# Building. (c) F1-1# Building. (d) F1-2# Building.
Figure 12.
Comparison of one-third octave band vibration levels on typical floors. (a) G-1# Building. (b) G-2# Building. (c) F1-1# Building. (d) F1-2# Building.
4.2. Floor Vibration Response Distribution
From the numerical simulation results, the vibration levels at all nodes on the slabs of each floor can be obtained. This section uses the vibration results of the main towers under Condition 1 to analyze the distribution patterns of floor vibration responses in Plots G and F1 under the influence of high-speed trains. The structural layout of the main typical floors of each main tower is shown in Figure 11.
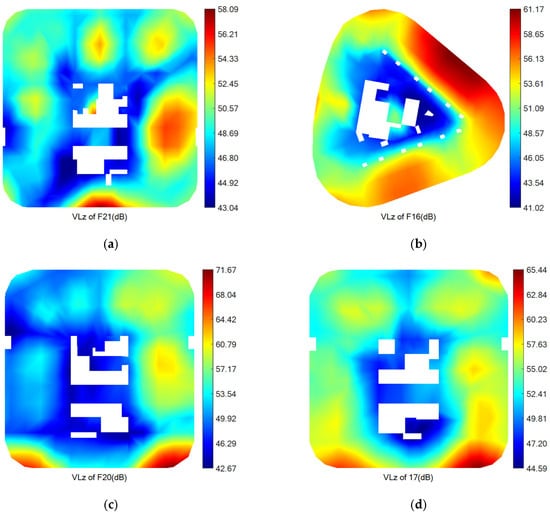
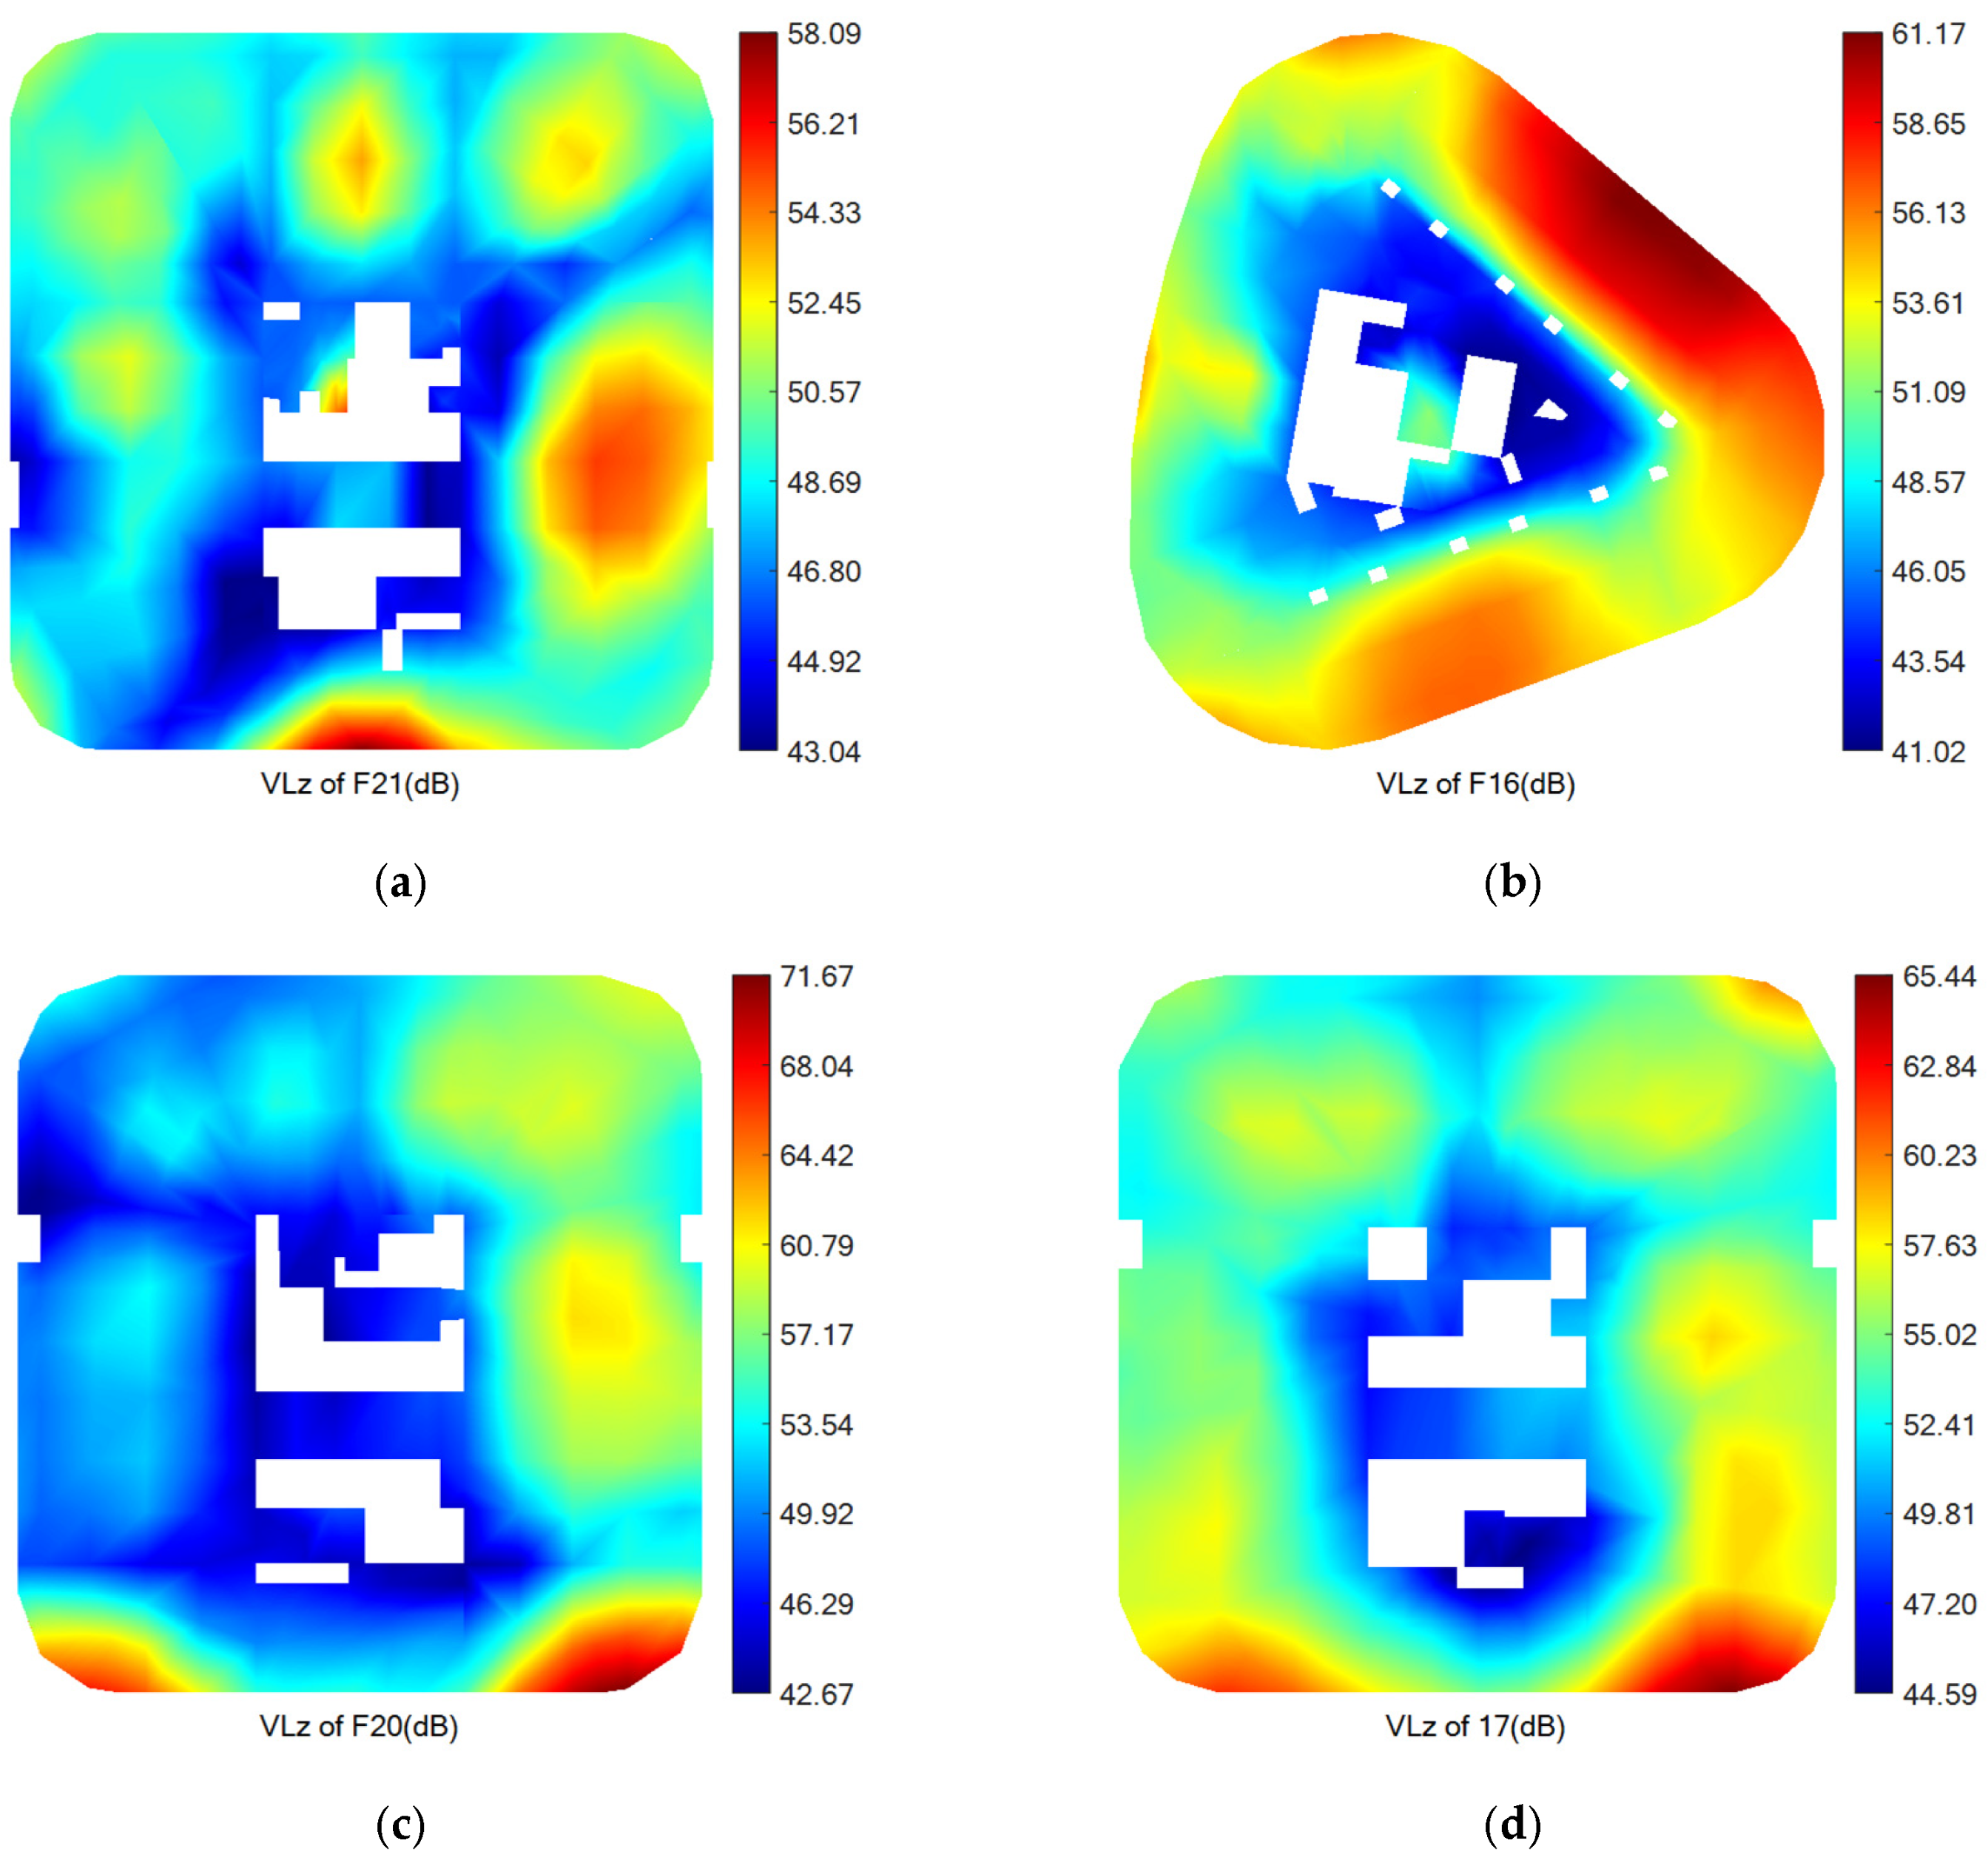
Figure 13 shows the distribution cloud maps of the maximum Z-vibration level on typical floors of several main towers under Condition 1. Combining Figure 10 and Figure 12, it can be seen that the maximum vibration values on each floor are generally located at cantilevered parts. Taking Floor F20 of F1-1# Building as an example, the maximum Z-vibration level at the cantilever tip is 71.67 dB, while that at the cantilever root is only 57.49 dB. Under the same conditions, as the cantilever length increases, the maximum Z-vibration level at the cantilevered part gradually increases. For example, the cantilever length at the maximum vibration point on Floor F20 of F1-1# Building is about 6.0 m, and the maximum Z-vibration level reaches 71.67 dB. The cantilever length at the maximum vibration point on Floor F17 of F1-2# Building is about 4.3 m, and the maximum Z-vibration level reaches 65.44 dB. Except for local large-cantilever areas, locations with larger structural vibration responses typically appear at the mid-span areas of slabs, while near vertical stiffness members such as core walls and frame columns, vibration levels are significantly lower. It can be seen that the vibration response level decreases as the vertical stiffness of the structural member increases. Combined with the above analysis, during vertical propagation, low-frequency vibrations gradually increase, leading to amplified vibrations at the top floor. The main amplification areas are at cantilevers and slab mid-spans, where vertical stiffness is smaller. Therefore, in design, the cantilever length should be controlled, and the stiffness of cantilevers and mid-spans should be increased to reduce responses in vibration-sensitive areas.
Figure 13.
Distribution cloud maps of maximum Z-vibration level on typical floors of main towers. (a) G-1# Building. (b) G-2# Building. (c) F1-1# Building. (d) F1-2# Building.
5. Analysis of Vibration Mitigation Measures
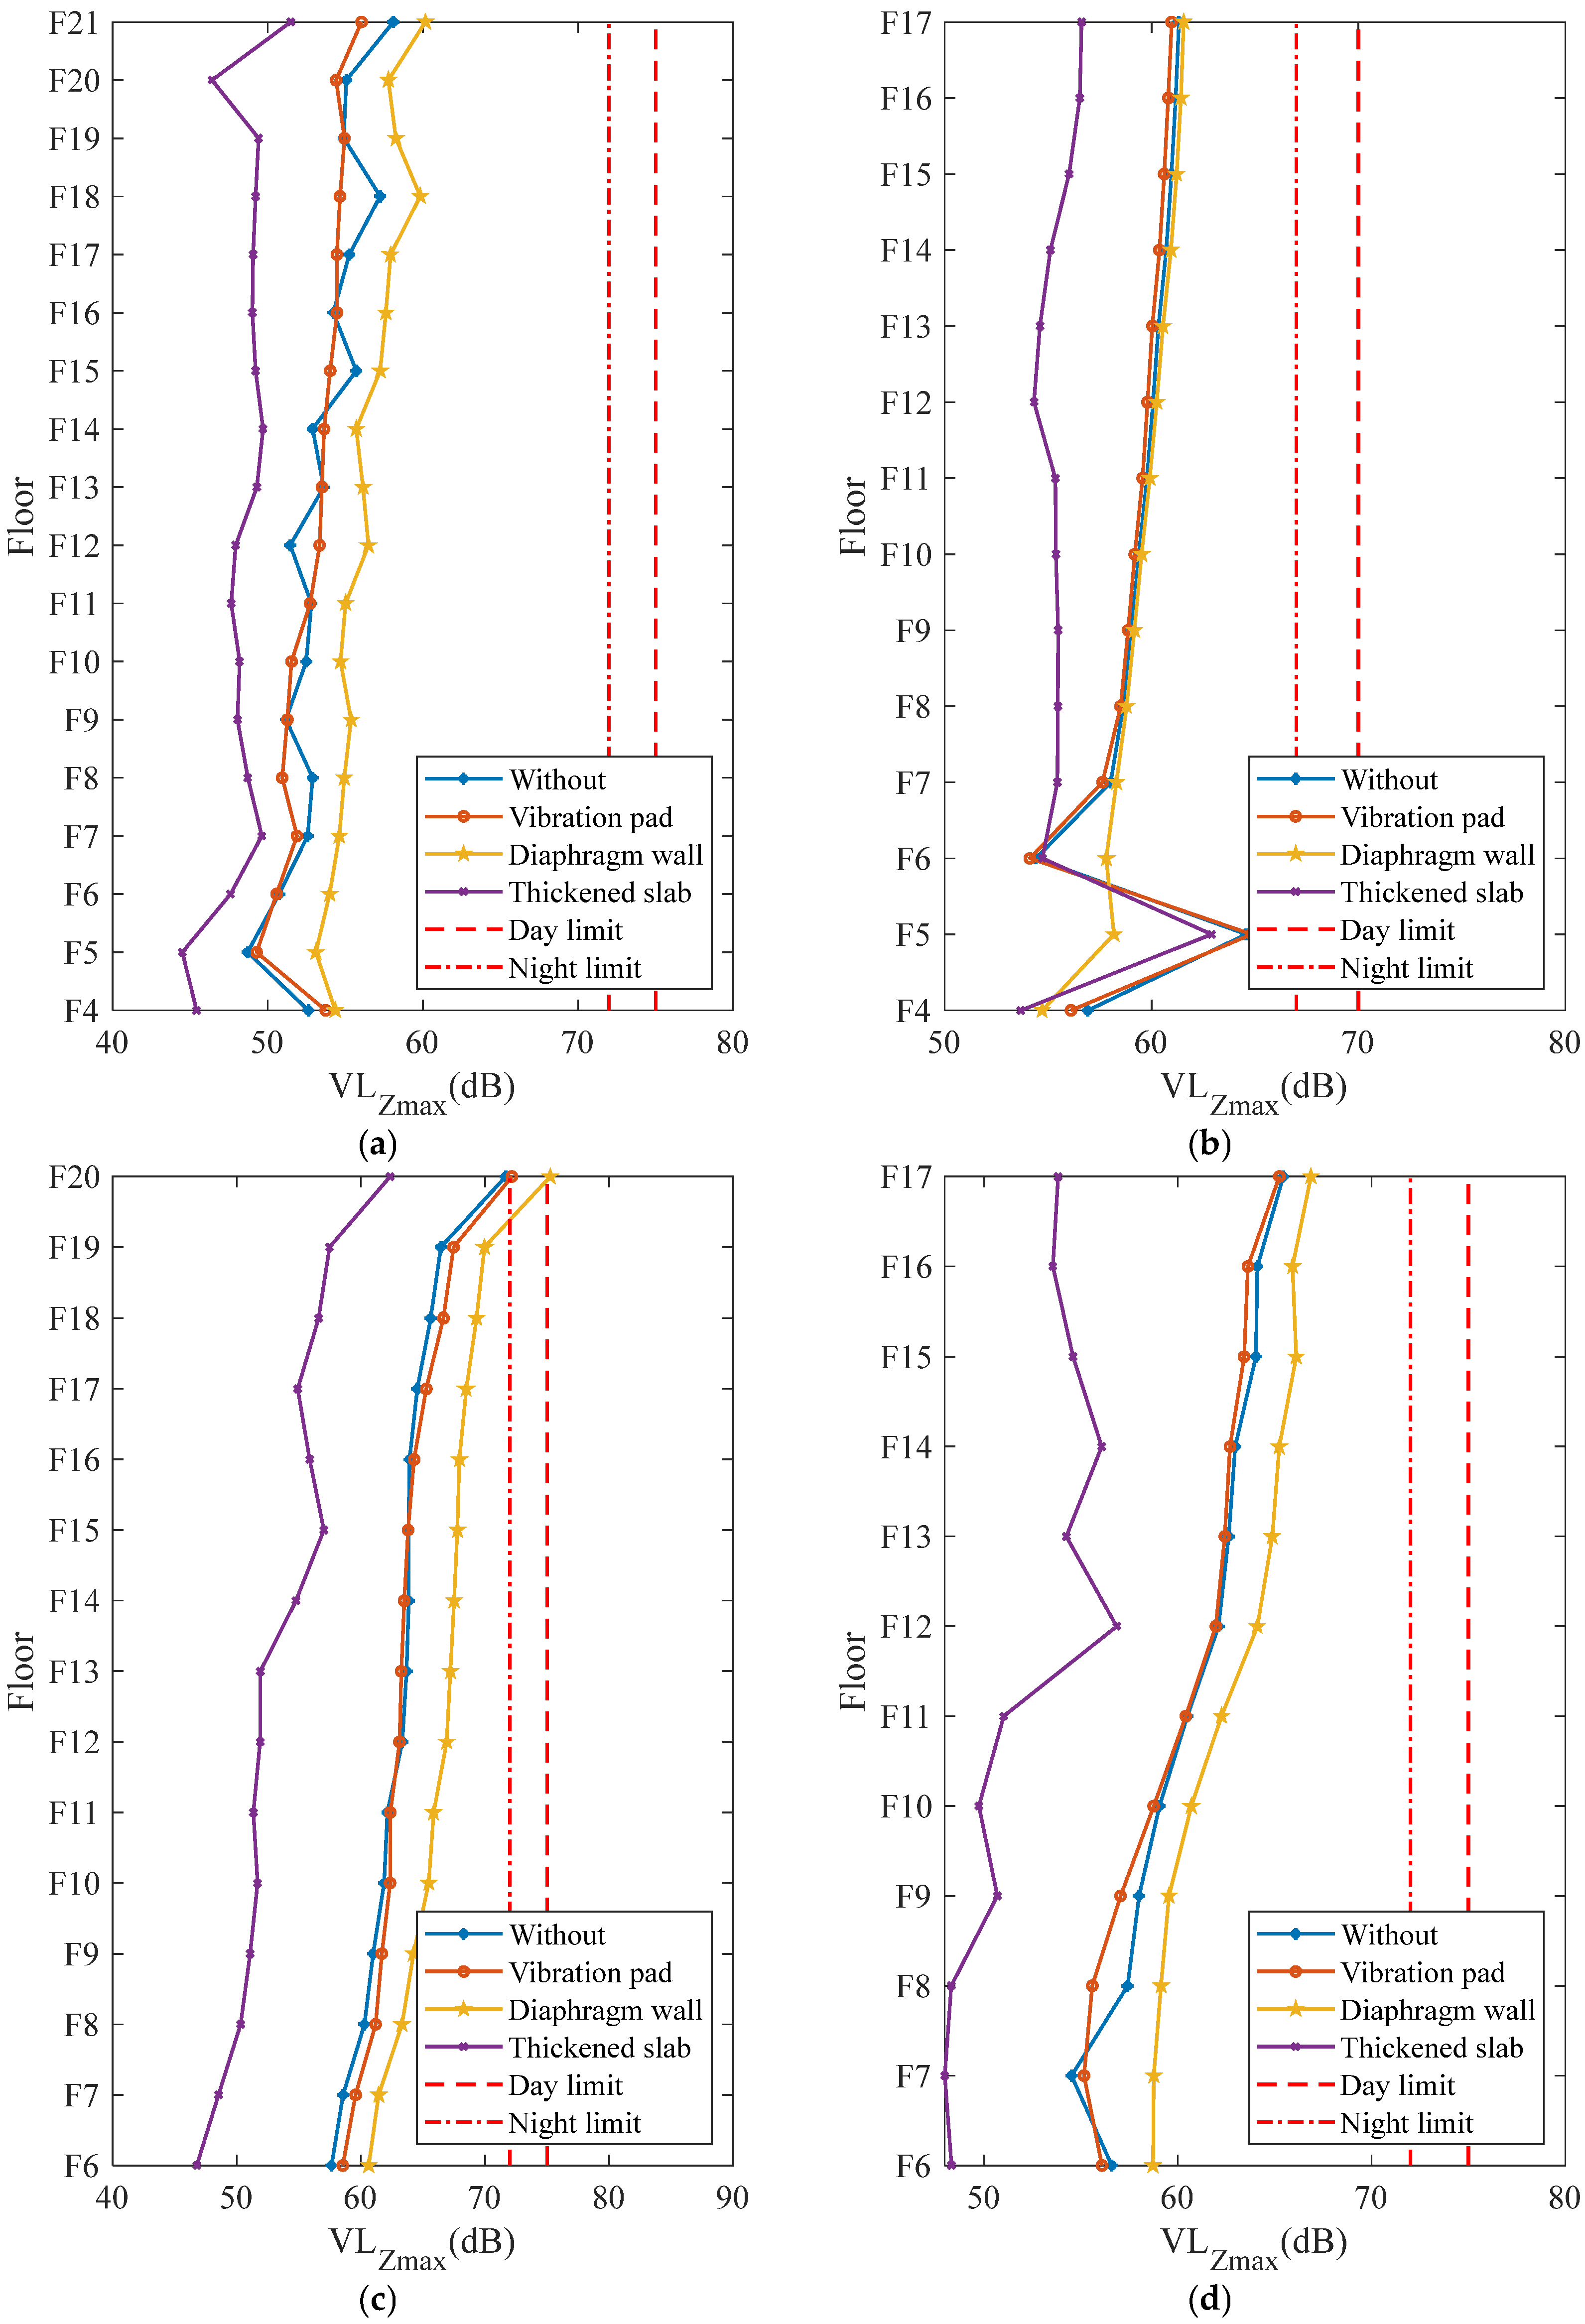
Based on the above analysis, under Condition 1 (Tongyong High-speed Railway passing through at 350 km/h), vibrations on some floors approach the daytime limit of 75 dB. Therefore, certain vibration mitigation measures are necessary. This section takes Condition 1 as an example to analyze and study the effectiveness of vibration mitigation schemes for Plots G and F1.
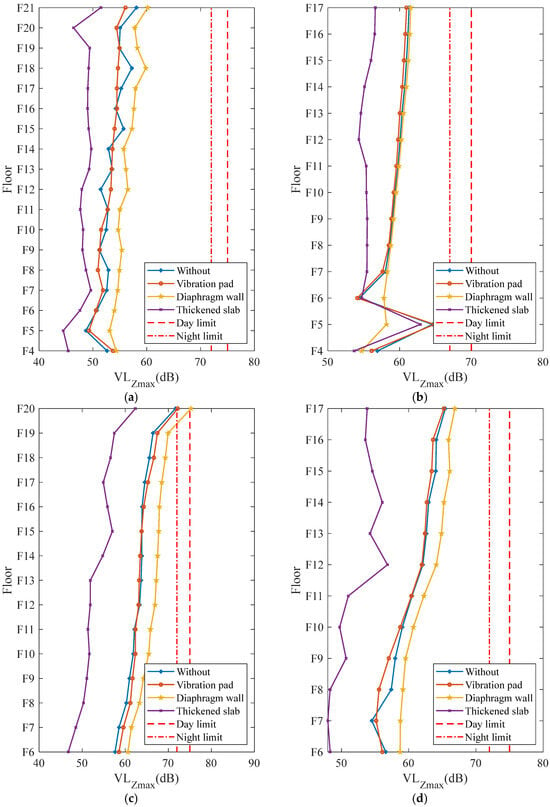
Considering the actual conditions of the plots, the following vibration mitigation measures can be adopted: (1) installing side wall vibration mitigation pads between Plots G and F1 and the station; (2) installing diaphragm walls between Plots G and F1 and the station; (3) thickening the track slab of the Tongyong High-speed Railway. Considering spatial conditions, structural configurations, and engineering feasibility of the plots, the following parameters were set for the three types of overall vibration mitigation measures: (1) side wall vibration mitigation pads were fully laid between the adjacent side walls of Plots G and F1 and the station, with a thickness of 25 mm and an elastic modulus of 2 MPa; (2) a 1200 mm thick reinforced concrete diaphragm wall was installed between the plots and the station, with concrete grade C40 and an elastic modulus of MPa; (3) the track slab of the Tongyong High-speed Railway was thickened from 1700 mm to 5500 mm. Based on these, finite element models under different vibration mitigation measures were re-established. The excitation of the Tongyong High-speed Railway passing through the main line was input, and the maximum Z-vibration level for each floor under the above-mentioned mitigation measures was obtained, as shown in Figure 14. Note that the maximum Z-vibration level for each floor shown in Figure 14 is defined as the maximum value among all measurement points on that floor. After applying mitigation measures, the vibration frequency content of the floor responses changes, which may shift the location where the maximum vibration occurs on a given floor. Consequently, when comparing different measures, apparent deviations in some data points may appear, reflecting the change in spatial distribution rather than simulation errors.
Figure 14.
Maximum Z-vibration level for each floor under different vibration mitigation measures. (a) G-1# Building. (b) G-2# Building. (c) F1-1# Building. (d) F1-2# Building.
In general, the figure shows that thickening the track slab is the most effective vibration mitigation measure, reducing vibrations on each floor by approximately 3~10 dB. This is because this measure increases the stiffness of the track slab, effectively suppressing its deformation under train loads, thereby reducing the vibration transmitted from the source to the soil and the building. Unlike path- or receiver-type measures, this source-based approach directly reduces the vibration energy generated by the train, which is fundamentally more efficient. Although thickening the track slab is an effective vibration mitigation measure, whether to adopt this measure should be considered comprehensively in combination with construction cost, structural implications, and railway operation safety. Installing side wall vibration mitigation pads has a poor vibration reduction effect on upper floors. Compared to the case without any mitigation measure, the change in maximum Z-vibration level is about 1 dB, and the distribution pattern of structural vibrations is essentially unchanged. This is because, for vibration waves, the relationship between wavelength and frequency satisfies . Assuming the shear wave velocity in the site is 200 m/s, even for the maximum frequency of concern for train vibrations (80 Hz), the wavelength can reach 2.5 m, far exceeding the pad thickness of 25 mm. Therefore, vibration waves can directly bypass the pad and propagate into the building, failing to effectively isolate vibration transmission. Installing a diaphragm wall does not achieve vibration isolation; instead, it amplifies the vibration response of the main towers. This is because vibrations undergo refraction and reflection at the interface of two media, attenuating the energy of waves transmitted through the medium. However, after installing a diaphragm wall, the underground exterior walls of the plots and the station form a rigid contact, allowing vibrations to bypass the soil and directly enter the building, thereby amplifying the vibration response of the upper structure. Thus, thickening the track slab tackles the vibration at its origin, while the other two measures attempt to interrupt the propagation path but are either bypassed or inadvertently create a more efficient rigid transmission path. However, the above analysis of mitigation measures is specific to this project. For other projects, the vibration reduction effectiveness may vary due to differences in track conditions, building structural types, soil properties, and other parameters.
6. Conclusions
In this paper, finite element methods were used to analyze train-induced vibrations and vibration mitigation measures for Plots G and F1 adjacent to the Suzhou East Station integrated transportation hub. The main conclusions are as follows:
- (1)
- Train speed and line distance are the two dominant factors. The 350 km/h high-speed railway passage controls vibrations on most floors, while the intercity railway entering the stations controls some lower floors due to its closer proximity.
- (2)
- The difference between multi-train converging conditions and the most unfavorable single-train condition is only about 1 dB, indicating that multi-train converging condition does not significantly increase the structural vibration response. Therefore, in engineering practice, only the single-train condition needs to be considered.
- (3)
- High-frequency vibrations gradually attenuate during upward propagation through the floors, while low-frequency vibrations are amplified on higher floors, leading to a vibration amplification effect at the upper floors. Moreover, floor vibration levels decrease with increasing vertical stiffness of structural members; cantilevered parts and slab mid-spans exhibit significantly higher vibrations than areas near core walls or columns. Increasing the stiffness of cantilevered parts is recommended to reduce local vibrations.
- (4)
- For this project, thickening the track slab of the high-speed railway can effectively control structural vibrations induced by high-speed railway operations, reducing vibrations by approximately 3–10 dB. Installing side wall vibration mitigation pads has limited vibration reduction performance for upper floors, and setting diaphragm walls will amplify vibration responses on upper floors. It is recommended to prioritize thickening the track slab, but its impact on train operation safety should be considered. If side wall vibration mitigation pads are used, their thickness should be appropriately increased. If diaphragm walls are required for foundation pit support, it should be ensured that flexible materials such as soil exist between the diaphragm wall and the building to avoid forming a rigid connection.
Author Contributions
Conceptualization, H.C. and J.L.; methodology, F.L.; software, F.L.; validation, H.C., F.L. and X.F.; formal analysis, Z.Y.; investigation, X.F.; resources, H.C., J.L. and J.Z.; data curation, Z.Y.; writing—original draft preparation, Z.Y.; writing—review and editing, X.F.; visualization, Z.Y.; supervision, F.L.; project administration, H.C., F.L. and J.Z.; funding acquisition, H.C. and J.L. All authors have read and agreed to the published version of the manuscript.
Funding
This research was funded by the National Key Research and Development Program of China (Grant No. 2024YFF0508102) and by the Major Research Project of China Railway Engineering Consulting Group Co., Ltd.: Key Technology Application of Vibration and Noise Control for Suzhou East Station (Grant No. 2023-7).
Data Availability Statement
The original contributions presented in this study are included in the article. Further inquiries can be directed to the corresponding author.
Conflicts of Interest
Author Hui Chen and Jianyou Liu were employed by the company China Railway Engineering Consulting Group Co., Ltd. Author Jianmin Zhong was employed by the company Suzhou Hengtai Chengfa ChanCheng Real Estate Co., Ltd. The remaining authors declare that the research was conducted in the absence of any commercial or financial relationships that could be construed as potential conflicts of interest. The authors declare that this study received funding from China Railway Engineering Consulting Group Co., Ltd. The funder had the following involvement with the study: contributed to the study design, provided technical guidance during the research, and reviewed the manuscript prior to submission.
References
- Zhai, W.; He, Z.; Song, X. Prediction of high-speed train induced ground vibration based on train-track-ground system model. Earthq. Eng. Eng. Vib. 2010, 9, 545–554. [Google Scholar] [CrossRef] [Scilit]
- Zhai, W.; Wei, K.; Song, X.; Shao, M. Experimental investigation into ground vibrations induced by very high speed trains on a non-ballasted track. Soil Dyn. Earthq. Eng. 2015, 72, 24–36. [Google Scholar] [CrossRef] [Scilit]
- Dai, F.; Yang, J.; Bi, L.; Liu, Y. Analysis on characteristics of ground vibration induced by underground high-speed trains based on in-situ test. J. Low Freq. Noise Vib. Act. Control. 2024, 43, 1097–1111. [Google Scholar]
- Zheng, H.; Yan, W. Investigating the influence of the engineering geological conditions on vibration propagation near the embankment induced by high-speed trains. Acta Geotech. 2024, 19, 6021–6038. [Google Scholar] [CrossRef] [Scilit]
- Faizan, A.A.; Kırtel, O.; Çelebi, E.; Zülfikar, A.C.; Göktepe, F. Experimental validation of a simplified numerical model to predict train-induced ground vibrations. Comput. Geotech. 2022, 141, 104547. [Google Scholar] [CrossRef] [Scilit]
- Connolly, D.P.; Kouroussis, G.; Woodward, P.K.; Costa, P.A.; Verlinden, O.; Forde, M.C. Field testing and analysis of high speed rail vibrations. Soil Dyn. Earthq. Eng. 2014, 67, 102–118. [Google Scholar] [CrossRef] [Scilit]
- Wang, L.; Gao, X.; Zhao, C.; Wang, P.; Li, Z. Vibration transfer from underground train to multi-story building: Modelling and validation with in-situ test data. Undergr. Space 2024, 19, 2096–2754. [Google Scholar] [CrossRef] [Scilit]
- Zhang, Q.; Bai, W.; Dai, J.; Shao, Z.; Yue, J. Implications of evaluation algorithms and added-structure effect: Monitoring of train-induced vibration on a subway-adjacent building under construction. J. Build. Eng. 2025, 110, 112957. [Google Scholar]
- Chen, Z.; Wan, F.; He, C. Field Test and Numerical Study of Train-Induced Vibration of Over-Track Buildings Above Metro Depot. Urban Rail Transit 2024, 10, 361–375. [Google Scholar] [CrossRef] [Scilit]
- Wang, L.; Li, Z.; Lu, W.; Yang, X.; Wang, J.; Qing, X.; Chen, J.; Yang, Y.; Han, Y. Vibration assessment and mitigation for an over-track building in a large-scale transportation hub induced by subway and high-speed railway trains. J. Railw. Sci. Technol. 2026, in press. [Google Scholar] [CrossRef] [Scilit]
- Lyratzakis, A.; Tsompanakis, Y.; Psarropoulos, P. Efficient mitigation of high-speed train vibrations on adjacent reinforced concrete buildings. Constr. Build. Mater. 2022, 314, 125653. [Google Scholar] [CrossRef] [Scilit]
- Li, X.; Chen, Y.; Luo, W.; Guo, W.; Zou, C. Characteristics and prediction of over-track building vibration response due to train operation in turnout areas. Transp. Geotech. 2026, 57, 101859. [Google Scholar] [CrossRef] [Scilit]
- Di, H.; Su, G.; Yu, J.; Xu, Y.; Xu, P.; Zhou, S. Field measurement and evaluation of vibrations inside buildings above metro tunnels. Soil Dyn. Earthq. Eng. 2023, 166, 107767. [Google Scholar] [CrossRef] [Scilit]
- He, L.; Tao, Z. Building Vibration Measurement and Prediction during Train Operations. Buildings 2024, 14, 142. [Google Scholar] [CrossRef] [Scilit]
- Liu, Y.; Xu, H.; Xia, W.; Cai, W.; Zheng, S. Research on a Vibration Model of a Superstructure under the Vibration Load of Metro Trains. Buildings 2024, 14, 2342. [Google Scholar] [CrossRef] [Scilit]
- Zhou, Y.; Ma, K.; Chen, P.; Lu, D.; Wu, H. Investigations on Train-induced Vibration and Vibration Control of an Over-track Building Using Thick-layer Rubber Bearings. Struct. Des. Tall Spec. Build. 2022, 31, 1898. [Google Scholar]
- Chen, Y.; Feng, Q.; Liu, Q. Experimental study on the train-induced vibration characteristics in the over-track buildings of metro depots. J. Build. Eng. 2025, 111, 113523. [Google Scholar]
- Kontoni, D.P.N.; Farghaly, A.A. Mitigation of train-induced vibrations on nearby high-rise buildings by open or geofoam-filled trenches. J. Vibroeng. 2020, 22, 416–426. [Google Scholar] [CrossRef] [Scilit]
- Seyedi, M. Impact of Train-Induced Vibrations on Residents’ Comfort and Structural Damages in Buildings. J. Vib. Eng. Technol. 2024, 12, 1961–1978. [Google Scholar] [CrossRef] [Scilit]
- Yao, J.; Zhao, R.; Zhang, N.; Yang, D. Vibration Isolation Effect Study of In-filled Trench Barriers to Train-induced Environmental Vibrations. Soil Dyn. Earthq. Eng. 2019, 125, 105741. [Google Scholar] [CrossRef] [Scilit]
- Auersch, L. Reduction of Train-Induced Vibrations—Calculations of Different Railway Lines and Mitigation Measures in the Transmission Path. Appl. Sci. 2023, 13, 6706. [Google Scholar] [CrossRef] [Scilit]
- Luo, W.; Deng, S. Mitigation of metro train-induced over-track super high-rise building vibrations using laminated rubber bearings. Eng. Struct. 2026, 85, 111167. [Google Scholar] [CrossRef] [Scilit]
- Di, G.; Xie, Z.; Guo, J. Predict the Influence of Environmental Vibration from High-Speed Railway on Over-Track Buildings. Sustainability 2021, 13, 3218. [Google Scholar] [CrossRef] [Scilit]
- Liang, Q.; Zhou, Y.; Wang, D.; Luo, W.; Li, J.; He, Z. Shaking table test of vertical isolation performances of super high-rise structure under metro train-induced vibration. J. Build. Eng. 2024, 82, 108323. [Google Scholar] [CrossRef] [Scilit]
- Mousavi-Rahimi, M.; Zakeri, J.A.; Esmaeili, M. Investigating foundation design and train speed on the dynamic response of building floors to moving train excitation. J. Struct. Des. Constr. Pract. 2025, 31, 04025138. [Google Scholar]
- Shao, Z.; Bai, W.; Dai, J.; Liu, R. Research on compressive behavior of thick rubber bearings for mitigating train-induced structural vibration. Eng. Struct. 2024, 315, 118444. [Google Scholar] [CrossRef] [Scilit]
- Luo, W.; Liang, Q.; Zhou, Y.; Lu, Z.; Li, J.; He, Z. A novel three-dimensional isolation bearing for buildings subject to metro- and earthquake-induced vibrations: Laboratory test and application. J. Build. Eng. 2024, 86, 108798. [Google Scholar] [CrossRef] [Scilit]
- Haghighi, E.; Pooshideh, S.M.; Ghadami, A. Building isolation against train-induced vibrations considering the effects of soil and structure: A numerical and experimental study. Soil Dyn. Earthq. Eng. 2023, 175, 108251. [Google Scholar] [CrossRef] [Scilit]
- Feng, S.; Li, F.; Zhang, X.; Dong, G.; Li, J. In-situ experimental investigation of the influence of structure characteristics on subway-induced building vibrations. Earthq. Eng. Eng. Vib. 2021, 20, 673–685. [Google Scholar] [CrossRef] [Scilit]
- Huang, S.; Chen, Y.; Zou, C.; Jian, S. Train-induced environmental vibrations by considering different building foundations along curved track. Transp. Geotech. 2022, 35, 100785. [Google Scholar] [CrossRef] [Scilit]
- GB 10070-1988; Standard of Environmental Vibration in Urban Area. National Environmental Protection Bureau: Beijing, China, 1988.
- ISO 2631-1:1985; Evaluation of Human Exposure to Whole-Body Vibration—Part 1: General Requirements. International Organization for Standardization: Geneva, Switzerland, 1985.
- Yang, Y.; Liu, C.; Chen, L.; Zhang, X. Phase deviation of semi-active suspension control and its compensation with inertial suspension. Acta Mech. Sin. 2024, 40, 523367. [Google Scholar] [CrossRef] [Scilit]
- GB 10071-1988; Measurement Method of Environmental Vibration of Urban Area. National Environmental Protection Bureau: Beijing, China, 1988.



Disclaimer/Publisher’s Note: The statements, opinions and data contained in all publications are solely those of the individual author(s) and contributor(s) and not of MDPI and/or the editor(s). MDPI and/or the editor(s) disclaim responsibility for any injury to people or property resulting from any ideas, methods, instructions or products referred to in the content. |
© 2026 by the authors. Licensee MDPI, Basel, Switzerland. This article is an open access article distributed under the terms and conditions of the Creative Commons Attribution (CC BY) license.