


Abstract
This study addresses the absence of a structured and reproducible framework for evaluating road infrastructure project quality under decentralized procurement systems. A quantitative approach was employed using project-level data from 96 completed road infrastructure projects and questionnaire responses from 50 stakeholders. Infrastructure quality was measured using an Infrastructure Quality Index (IQI) derived from objective technical inspection data, while perceived risk factors were assessed through Likert-scale questionnaires. Multiple regression analysis was used to estimate the relationship between risk factors and infrastructure quality, and statistically significant predictors were incorporated into a risk-based evaluation model following ISO 31000 principles. The results indicate that Procurement Governance Risk, Contract Compliance Risk, Project Supervision Risk, Resource Availability Risk, and Sociocultural Risk significantly influence infrastructure quality, whereas Contractor Capacity Risk and Contractor Workload Risk were not statistically significant. A Composite Risk Index was subsequently developed by integrating likelihood and consequence dimensions through weighted aggregation and explicit classification thresholds. The proposed framework provides a transparent and reproducible tool for project evaluation, contractor performance assessment, and risk-informed decision-making. The findings highlight the importance of strengthening governance, supervision, and contract compliance to improve infrastructure quality in decentralized construction environments.
1. Introduction
Infrastructure development is widely recognized as a key driver of regional connectivity, economic growth, and social welfare. Reliable road networks facilitate the movement of goods and services, reduce transportation costs, improve access to public services, and support regional integration. In developing countries, infrastructure investment is often considered a strategic instrument for reducing spatial inequality and accelerating economic development in remote and disadvantaged regions. In Indonesia, road infrastructure development has become a major national priority, particularly in Papua and Southwest Papua, where geographical constraints, dispersed settlements, and limited accessibility continue to hinder socio-economic progress.
To accelerate infrastructure delivery in these regions, the Indonesian government has introduced decentralized procurement mechanisms through the Special Autonomy policy. One of the policy instruments allows direct appointment procedures for construction projects with a value of up to IDR 2 billion, thereby increasing opportunities for local contractors, including indigenous entrepreneurs and small-qualified construction firms, to participate in public infrastructure development. This approach is expected to stimulate local economic growth, strengthen indigenous participation, and enhance regional development outcomes.
Despite these objectives, concerns regarding infrastructure quality and project accountability remain significant. Empirical evidence suggests that road projects implemented by small-scale contractors frequently encounter challenges related to compliance with technical specifications, contract administration, and quality assurance procedures. In many cases, the handover process is conducted without comprehensive technical verification, resulting in discrepancies between planned and actual construction outcomes. Such deficiencies may lead to project rejection, contractual disputes, premature infrastructure deterioration, and increased maintenance costs for local governments [1]. Previous studies have similarly reported that inadequate monitoring, weak contract enforcement, and insufficient quality control mechanisms contribute substantially to poor infrastructure performance and reduced project sustainability [2,3].
A fundamental challenge underlying these issues is the absence of a structured and transparent evaluation mechanism capable of objectively assessing project quality and contractor performance. Existing project evaluation practices are frequently characterized by fragmented assessment procedures, subjective judgments, inconsistent evaluation criteria, and limited integration of risk considerations into decision-making processes [4,5]. Infrastructure quality assessments often rely heavily on inspector experience and administrative compliance reviews, while lacking standardized mechanisms for aggregating multiple technical, managerial, and contextual dimensions into a single decision framework. Consequently, local governments may face difficulties in determining whether completed projects satisfy contractual requirements and whether infrastructure assets are suitable for formal acceptance.
The importance of systematic evaluation frameworks has been increasingly emphasized within construction management literature. Studies have shown that structured performance assessment systems can improve project monitoring, enhance accountability, and support evidence-based decision-making throughout the project lifecycle [6,7]. Likewise, transparent contract administration and clearly defined handover procedures are considered essential for ensuring compliance, reducing disputes, and strengthening governance in public infrastructure projects [8,9]. Nevertheless, the practical implementation of these recommendations remains challenging, particularly in decentralized environments characterized by limited institutional capacity and heterogeneous contractor capabilities.
Recent research has investigated numerous factors influencing construction project performance and infrastructure quality. These factors include contractor competence, financial capacity, resource availability, project supervision, contract management effectiveness, regulatory compliance, stakeholder coordination, organizational culture, and sociocultural conditions [10,11,12,13,14,15]. For example, studies have demonstrated that contractor capability and project governance significantly affect project outcomes [10,11], while regulatory compliance and procurement effectiveness influence construction quality and schedule performance [12,13]. Other researchers have highlighted the role of organizational culture, communication patterns, and local institutional contexts in shaping project implementation success [14,15].
Although these studies provide valuable insights, the existing literature remains fragmented in several important respects. First, most studies examine determinants of project performance as independent explanatory variables, focusing on their statistical significance rather than their integration into an operational evaluation framework. For instance, studies investigating contractor performance primarily analyze contractor-related attributes [10,11], whereas research on procurement systems emphasizes regulatory and governance dimensions [12,13]. Similarly, investigations of organizational and sociocultural influences focus on behavioral and institutional aspects without incorporating technical infrastructure quality indicators into the assessment process [14,15]. As a result, the interactions among these multidimensional factors are rarely translated into a comprehensive evaluation model capable of supporting real-world project acceptance decisions [16,17].
Second, while risk management has become an established paradigm in construction and infrastructure management, existing studies predominantly employ risk assessment for project planning, cost estimation, schedule management, or safety analysis [18,19,20]. Risk registers, probability–impact matrices, and risk prioritization techniques are widely used to identify and mitigate project risks. However, relatively few studies have operationalized risk concepts as the foundation for evaluating completed infrastructure quality and determining project acceptance outcomes. In particular, there remains limited research that transforms diverse technical, managerial, contractual, and sociocultural factors into quantifiable risk indicators that can be systematically aggregated into a project evaluation model [21].
Third, advances in multi-criteria decision-making (MCDM) and data-driven infrastructure assessment have generated numerous approaches for supporting complex infrastructure decisions. Methods such as the Analytic Hierarchy Process (AHP), Analytic Network Process (ANP), TOPSIS, PROMETHEE, DEMATEL, fuzzy-based approaches, and hybrid decision-support models have been widely applied in construction management and infrastructure evaluation [22,23]. These methods provide rigorous weighting and aggregation mechanisms for combining multiple evaluation criteria. However, most applications focus on contractor selection, project prioritization, risk ranking, or investment decision-making rather than post-construction infrastructure quality evaluation. Moreover, relatively few studies integrate objective field-based infrastructure performance data with perception-based risk assessments within a unified evaluation framework [24].
From a theoretical perspective, therefore, an important gap exists at the intersection of risk management theory, infrastructure quality evaluation, and multi-criteria decision-making. Existing research has largely developed these streams independently. Risk management studies emphasize risk identification and mitigation, infrastructure quality studies focus on compliance and performance measurement, and MCDM studies concentrate on weighting and ranking alternatives. Limited attention has been given to developing an integrated framework that combines these perspectives into a reproducible decision model for evaluating completed infrastructure projects under decentralized procurement environments.
From a methodological perspective, there is also a lack of evaluation models that simultaneously incorporate (1) multidimensional risk factors, (2) explicit weighting mechanisms, (3) quantitative aggregation procedures, (4) objective infrastructure quality measurements, and (5) transparent decision rules for project acceptance classification. Consequently, the practical applicability of many existing studies remains limited because their findings cannot be directly translated into operational tools for government agencies responsible for project evaluation and infrastructure handover.
To address these theoretical and methodological gaps, this study proposes a risk-based evaluation model for road infrastructure projects implemented by small-scale contractors in Southwest Papua, Indonesia. The proposed model integrates objective infrastructure quality data obtained from technical assessments with perception-based risk indicators collected from construction practitioners and experts. Drawing upon established risk management principles, the model quantifies both the likelihood and impact dimensions of identified risks and transforms them into a composite evaluation framework capable of supporting project acceptance decisions.
Specifically, this study aims to: (1) identify key risk factors affecting infrastructure quality in decentralized road projects; (2) determine the relative importance of these factors using statistical modeling techniques; (3) develop a composite risk scoring system that incorporates likelihood and impact dimensions; and (4) establish explicit decision rules for classifying project outcomes into acceptance categories.
This research contributes to the literature in several ways. First, it extends the application of risk management principles beyond traditional risk identification and mitigation by operationalizing risk as a measurable construct for infrastructure quality evaluation. Second, it bridges the gap between infrastructure performance assessment and multi-criteria decision-making by integrating weighting, aggregation, and classification procedures into a unified evaluation framework. Third, it combines objective project quality measurements and expert-based risk perceptions, thereby providing a more comprehensive representation of project performance. Finally, the study offers a practical decision-support tool that can assist local governments in improving infrastructure governance, strengthening contractor accountability, and enhancing the transparency and consistency of project acceptance processes within decentralized procurement systems.
2. Materials and Methods
2.1. Research Design
This study employed a quantitative research design to develop a risk-based evaluation model for assessing the quality of road infrastructure projects implemented under decentralized procurement systems. The methodological framework was based on ISO 31000, which conceptualizes risk as a combination of the likelihood of occurrence and the consequences associated with a particular event.
The study integrated two complementary sources of information. The first source consisted of project-level assessment data obtained from completed road infrastructure projects. These data were used to measure infrastructure quality and evaluate the influence of project risk factors on quality outcomes. The second source consisted of questionnaire responses collected from practitioners and stakeholders involved in road infrastructure projects. The questionnaire was used exclusively to estimate the perceived likelihood of occurrence of each risk factor and to assess the validity and reliability of the proposed risk indicators.
The methodological procedure consisted of five stages:
- Identification and operationalization of project risk factors based on ISO 31000 principles and relevant construction management literature;
- Collection of project assessment data and questionnaire responses;
- Estimation of the relationship between project risk factors and infrastructure quality using multiple regression analysis;
- Development of a Composite Risk Index (CRI) by integrating likelihood and consequence dimensions; and
- Validation of the proposed model through project-level classification analysis.
2.2. Data Sources and Unit of Analysis
The project was used as the unit of analysis throughout the study.
Secondary data were obtained from 96 completed road infrastructure projects implemented between 2022 and 2024 in Sorong Regency, Southwest Papua, Indonesia. All projects were awarded to small-qualified local contractors through direct appointment procurement mechanisms with contract values not exceeding IDR 2 billion.
Project records included:
- contract documents;
- procurement records;
- project implementation reports;
- technical inspection reports;
- supervision reports;
- project handover reports; and
- infrastructure quality assessment documents.
For each project, an ISO 31000-based assessment checklist was completed using information contained in the project documentation. The checklist generated project-specific scores for each risk factor, thereby producing seven independent variable values for every project.
Consequently, the regression dataset consisted of 96 observations (projects), with each project having:
- one Infrastructure Quality Index (IQI) value; and
- seven project-level risk scores (X1–X7).
Primary data were collected through a structured questionnaire administered to 50 respondents selected using purposive sampling.
Respondents consisted of:
- Local contractors (54%);
- Government representatives (36%); and
- Community representatives (10%).
The questionnaire responses were not used as regression observations. Instead, they were used solely to estimate the likelihood component of risk and to evaluate the validity and reliability of the risk measurement instrument.
2.3. Variable Definition and Operationalization
2.3.1. Dependent Variable
The dependent variable was the Infrastructure Quality Index (IQI), representing the overall quality of completed road infrastructure projects.
The IQI was derived exclusively from objective technical inspection data obtained during project completion and handover evaluations.
Five indicators were used:
- Pavement thickness conformity;
- Pavement width conformity;
- Shoulder construction conformity;
- Drainage construction conformity; and
- Surface condition and visible defect assessment.
Each indicator was evaluated against contractual specifications and converted into a compliance score ranging from 0 to 100. The relative importance of the indicators was determined through a two-round Delphi consultation involving eight experts, consisting of highway engineers, infrastructure inspectors, procurement specialists, and construction management academics. The expert panel consisted of three highway engineers, two procurement specialists, two infrastructure inspectors, and one academic specializing in construction management. Consensus was considered achieved when at least 80% agreement was obtained among participants.
The Infrastructure Quality Index was calculated as:
where:
- IQI = Infrastructure Quality Index;
- = score of quality indicator (j);
- = weight assigned to quality indicator (j);
- m = number of quality indicators.
The resulting IQI ranged from 0 to 100, with higher values indicating better infrastructure quality.
2.3.2. Independent Variable
Seven project-level risk factors, as shown in Table 1, were evaluated.
Table 1.
Independent Variables.
The conceptual definitions of the variables are as follows.
- Contractor Capacity Risk (X1) refers to the risk arising from inadequate contractor technical capability, managerial competence, certification, or organizational resources required for project execution.
- Contractor Workload Risk (X2) refers to the risk associated with simultaneous project commitments that may reduce contractor attention, productivity, or project control.
- Resource Availability Risk (X3) refers to the risk of insufficient labor, materials, equipment, or logistics necessary for project implementation.
- Procurement Governance Risk (X4) refers to the risk arising from weaknesses in procurement transparency, accountability, monitoring, and administrative control.
- Contract Compliance Risk (X5) refers to the risk associated with non-compliance with contractual requirements, technical specifications, and administrative obligations.
- Project Supervision Risk (X6) refers to the risk resulting from inadequate inspection, monitoring, documentation, and quality-control activities during project implementation.
- Sociocultural Risk (X7) refers to the risk associated with local community dynamics, customary institutions, stakeholder relationships, and sociocultural factors that may influence project execution.
Each variable was assessed using an ISO 31000-based project evaluation checklist consisting of observable indicators. Checklist results were converted into scores ranging from 1 to 5, where:
1 = Very Low Risk;
2 = Low Risk;
3 = Moderate Risk;
4 = High Risk;
5 = Very High Risk.
The resulting project-level scores were used as independent variables in the regression analysis. The project-level scores (X1–X7) represent the observed condition of each risk factor in individual projects and were used as independent variables in the regression analysis. The questionnaire-based likelihood scores were not used as project-level predictors. Instead, they were used only during the development of the Composite Risk Index to represent the perceived probability of occurrence of each risk factor across the study context.
2.4. Risk Conceptualization
Following ISO 31000, each risk factor was conceptualized as the combination of likelihood and consequence:
where:
- = risk score of factors ;
- = likelihood of occurrence;
- = consequence (impact).
Likelihood values were obtained from questionnaire responses, whereas consequence values were derived from regression-based impact estimation.
2.5. Risk Likelihood
A structured questionnaire was administered to 50 respondents. Each respondent assessed the likelihood of occurrence of each risk factor using a five-point Likert scale as shown in Table 2. The mean score for each risk factor was used as the likelihood value () in the risk model. The questionnaire data were not used in the regression analysis.
Table 2.
Risk Likelihood Scale.
2.6. Statistical Analysis and Model Estimation
This study employs inferential statistical techniques to quantify the relationship between risk factors and infrastructure quality.
2.6.1. Multiple Regression Analysis
The relationship between project-level risk factors and infrastructure quality was estimated using multiple linear regression as shown in Equation (3).
where:
- = infrastructure quality index;
- = project-level risk factors;
- = regression coefficients;
- = random error.
The regression dataset consisted of 96 project observations.
2.6.2. Weight Retained
Only statistically significant variables () were retained in the final model. The normalized weight of each retained variable was calculated as Equation (4).
where:
- = normalized weight;
- = standardized regression coefficient;
- n = number of statistically significant variables retained in the final model.
2.7. Diagnostic Testing
Several diagnostic tests were conducted before model estimation.
- Multicollinearity: Variance Inflation Factor (VIF) values were calculated for all independent variables. Variables with VIF values below 5 were considered free from serious multicollinearity.
- Normality: The normality of regression residuals was assessed using the Shapiro–Wilk test and normal probability plots.
- Homoscedasticity: The Breusch–Pagan test was used to evaluate homoscedasticity of residuals.
- Independence of Errors: The Durbin–Watson statistic was used to assess residual independence.
Only models satisfying these diagnostic requirements were retained for further analysis.
2.8. Development of the Risk-Based Evaluation Model
A CRI value was calculated individually for each project using the retained risk factors and their corresponding weights. For each retained risk factor, The Composite Risk Index (CRI) was calculated as shown in Equation (5).
where:
- = Composite Risk Index;
- = normalized weight;
- = likelihood–consequence score.
The multiplication factor of 20 transformed the index onto a 0–100 scale. For each project, the risk factor score obtained from the ISO 31000 assessment checklist was multiplied by the corresponding likelihood value and consequence weight. Therefore, the Composite Risk Index varied across projects according to the project-specific risk conditions observed in each case.
2.9. Decision Rule and Classification
To support practical decision-making, projects were classified according to their Composite Risk Index as shown in Table 3.
Table 3.
Decision categorization.
This categorization provides a transparent and reproducible basis for evaluating project outcomes and contractor performance.
2.10. Validity and Reliability Testing
The validity of the questionnaire items was assessed using Pearson’s product–moment correlation. Items with correlation coefficients greater than the critical value (r = 0.279 for number of respondent = 50 at 5% significance) were considered valid. Reliability was evaluated using Cronbach’s Alpha, with a threshold of 0.70 indicating acceptable internal consistency. All variables met this criterion, confirming the robustness of the measurement instrument.
2.11. Model Validation
Model validation was conducted at the project level. For each of the 96 projects, a Composite Risk Index was calculated using the proposed model. Projects were then classified into Acceptable, Conditional Acceptance, or Rejected categories based on their CRI values.
Observed project quality classifications were derived independently from the Infrastructure Quality Index. The observed project quality category was determined from the IQI using the same three-category classification framework adopted for model evaluation. Predicted classifications were compared with observed classifications using:
- Accuracy;
- Precision;
- Recall;
- F1-score;
- Confusion Matrix.
Particular attention was given to false-negative classifications because incorrectly classifying poor-quality projects as acceptable may lead to increased maintenance requirements, reduced infrastructure service life, and potential safety risks.
2.12. Data Integration and Triangulation
The final model integrated two complementary sources of information. Project-level ISO 31000 assessment data provided the consequence dimension through statistical estimation of quality impacts, while questionnaire responses provided the likelihood dimension through stakeholder perceptions of risk occurrence. These two dimensions were subsequently combined into the Composite Risk Index, providing a transparent and reproducible framework for infrastructure quality evaluation and project acceptance decisions.
3. Results
3.1. Analysis of Existing Data
Analysis results were obtained for 96 projects consisting of 36 projects in 2022, 27 projects in 2023, and 33 projects in 2024. From the data, several road sections have concrete quality that does not comply with the contract, resulting in a lower handover quality than agreed upon, with all projects below 100%. According to the distribution of project acquisitions, 38 small (local) entrepreneurs received 1–2 projects (79.16%).
Table 4 illustrates the distribution of projects by local entrepreneurs, with the majority receiving 1–2 projects over a period of 3 years, accounting for 79.16% (38 local entrepreneurs). This illustrates that the distribution of direct appointments has been running well; there is no particular dominance to be won in road infrastructure development in Southwest Papua.
Table 4.
Project acquisition criteria.
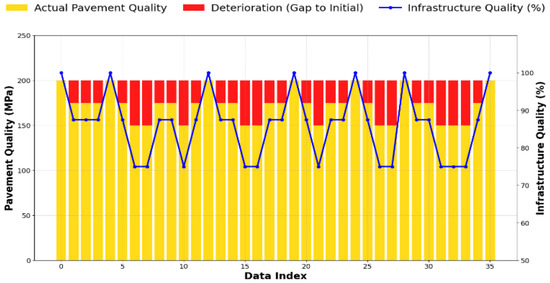
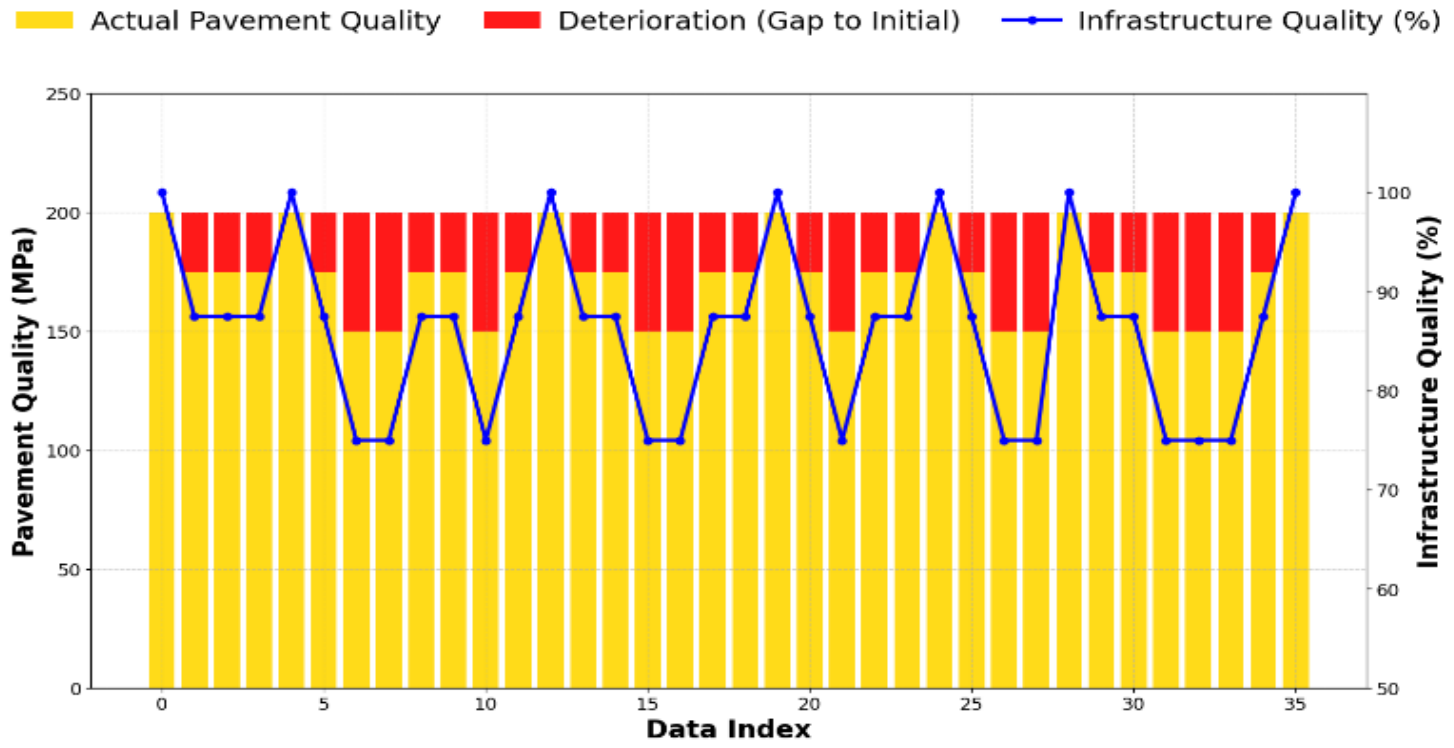
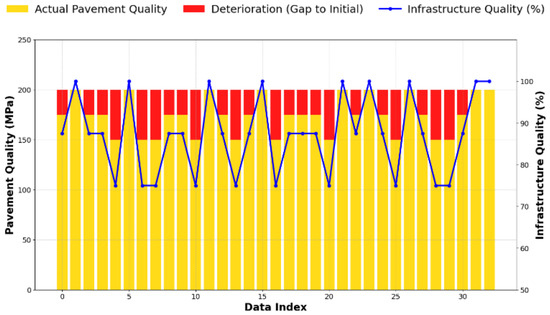
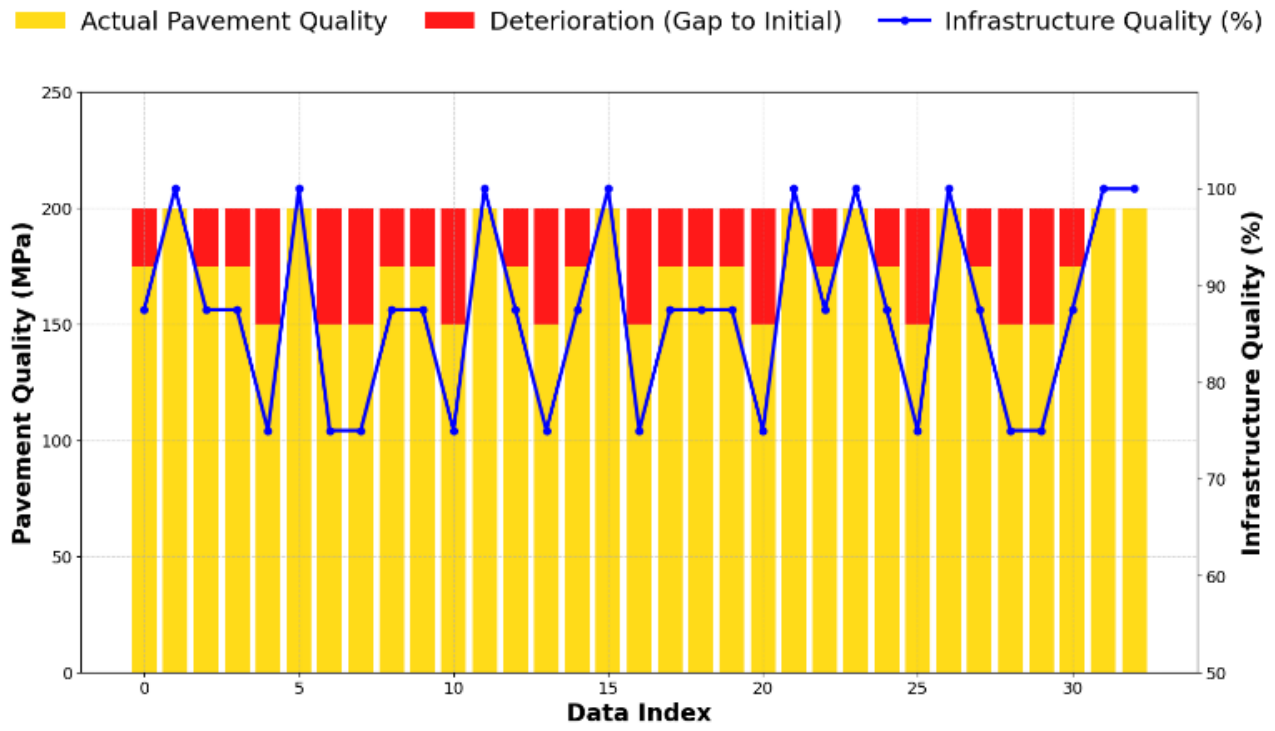
Figure 1 shows a comparison of initial and actual road pavement quality with infrastructure quality in 2022. Of the 36 road locations, only 7 had good or adequate infrastructure quality, representing 20%. Meanwhile, approximately 50% of projects had an infrastructure quality of 87.5%. This indicates that a substantial proportion of projects did not achieve full compliance with the technical specifications used in the Infrastructure Quality Index assessment. This condition indicates a decline in quality from the initial stages of construction or the possible use of materials and implementation methods that do not fully comply with technical specifications.
Figure 1.
Comparison of initial and actual road pavement quality against infrastructure quality in 2022.
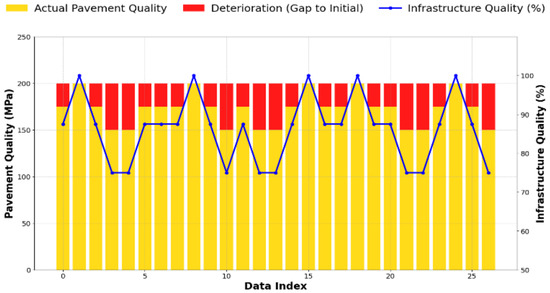
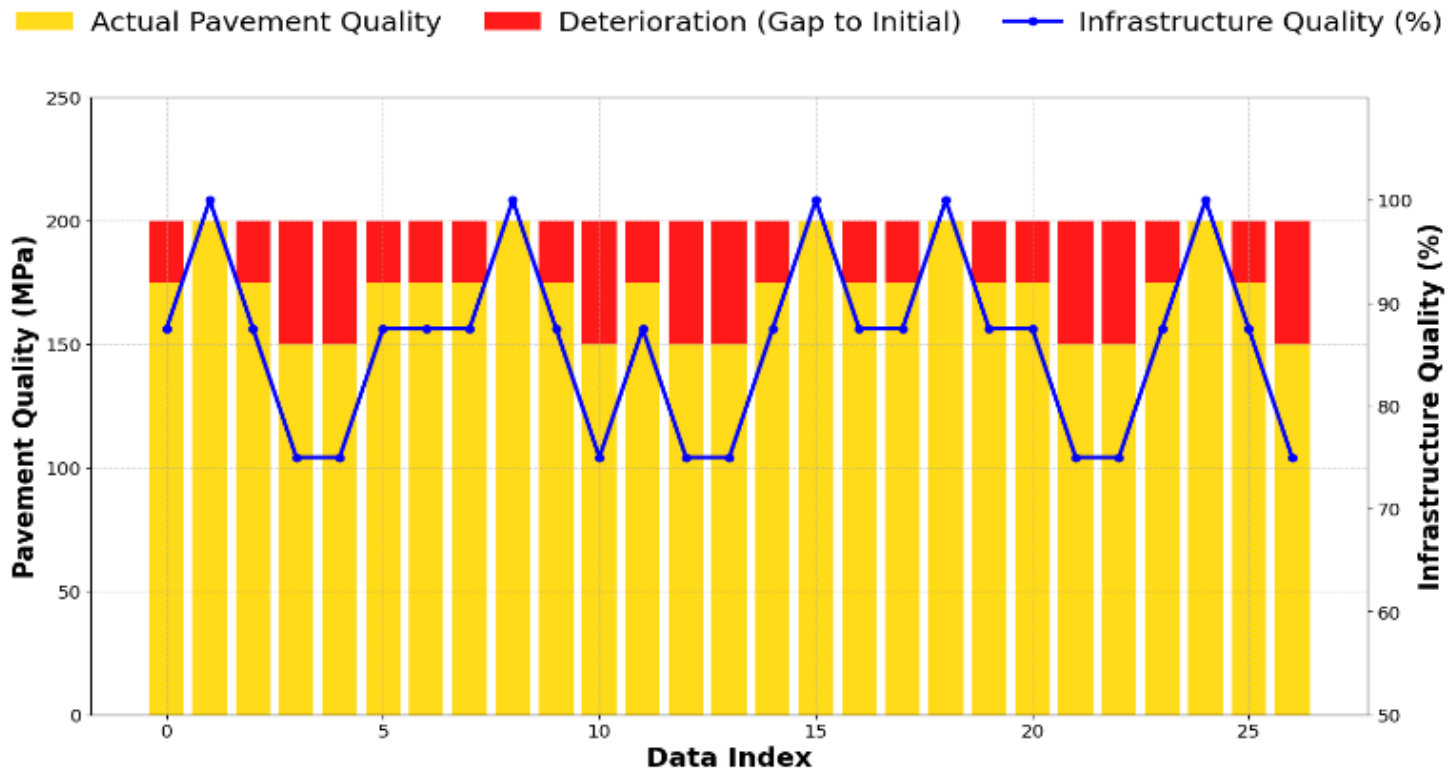
In 2023, as shown in Figure 2, of 27 road sections, only five achieved 100% infrastructure quality, while the rest ranged from 0% to 20%.
Figure 2.
Comparison of initial and actual road pavement quality against infrastructure quality in 2023.
Meanwhile, in 2024, as shown in Figure 3, the majority of project work results were also less than satisfactory. Of the 33 projects in 2024, only 9 (28%) had good or satisfactory work quality. Although the percentage values indicate better results than in previous years, the difference is not significant. This confirms the need for a more comprehensive evaluation of local contractors’ involvement, including the technical aspects of construction implementation and material selection.
Figure 3.
Comparison of initial and actual road pavement quality against infrastructure quality in 2024.
Based on the analysis above, it can be concluded that the quality of road infrastructure built by local contractors in Papua during the 2022–2024 period generally does not meet expected quality standards. Infrastructure quality is directly reflected in the condition of the actual road pavement.
The results indicate that most contractors received only one or two projects during the observation period. This distribution suggests that the direct appointment mechanism implemented under the Special Autonomy framework has largely achieved its objective of broadening participation among local contractors rather than concentrating project awards among a limited number of firms. From a procurement governance perspective, this finding is important because contractor concentration is frequently associated with reduced market competition and potential inefficiencies in public procurement systems. The relatively dispersed project allocation observed in this study indicates that access to public infrastructure projects was distributed across a wider contractor population.
However, equitable project distribution alone did not guarantee satisfactory infrastructure outcomes. Analysis of technical inspection records revealed substantial variation in project quality across the 96 projects. Figure 1, Figure 2 and Figure 3 illustrate the comparison between planned specifications and actual infrastructure quality for projects completed during the study period. Across the three-year observation period, only a limited proportion of projects achieved full compliance with contractual specifications. A considerable number of projects exhibited deficiencies in pavement thickness conformity, shoulder construction quality, drainage implementation, and surface condition assessments. These findings suggest that participation-oriented procurement policies must be complemented by effective quality control mechanisms to ensure that infrastructure quality objectives are achieved.
The analysis further showed that infrastructure quality varied substantially among projects despite relatively similar procurement procedures and contractor classifications. This observation highlights the importance of examining organizational, managerial, and governance-related factors that may influence project outcomes beyond procurement allocation itself.
3.2. Respondent Characteristics
A total of 50 respondents participated in the survey. The respondents were selected using purposive sampling to ensure that participants possessed adequate knowledge and experience regarding road infrastructure project implementation, procurement procedures, project supervision, and infrastructure management within the study area. The respondent composition consisted of local contractors (54%), government representatives (36%), and community representatives (10%). Local contractors and government officials represented the primary stakeholders directly involved in project planning, procurement, implementation, supervision, and handover processes. Community representatives were included to capture beneficiary perspectives regarding project implementation and local contextual conditions.
Regarding educational background, 42% of respondents had completed senior high school education, 46% held bachelor’s degrees, and 12% possessed master’s degrees. This educational distribution indicates a relatively diverse respondent profile while maintaining sufficient technical and administrative knowledge relevant to infrastructure project evaluation. The gender composition comprised 80% male and 20% female respondents. This distribution reflects the workforce structure commonly observed within the construction sector, where male participation remains dominant, particularly in project implementation and field supervision activities.
Overall, the respondent profile suggests that the survey data were primarily derived from individuals directly engaged in construction-related activities and public infrastructure management. Because the questionnaire was used to estimate perceived likelihood of risk occurrence rather than to generate project-level regression variables, community representatives were retained to provide contextual perspectives on project implementation and stakeholder interactions. Consequently, the collected responses provide a relevant basis for assessing the perceived likelihood of project-related risks and evaluating the practical relevance of the proposed risk indicators.
3.3. Validity and Reliability Test of the Instrument
Because the likelihood component of the proposed risk model was derived from stakeholder perceptions collected through the questionnaire, validity and reliability testing were conducted to ensure that the questionnaire items adequately represented the intended risk constructs. A structured questionnaire was administered to 50 respondents consisting of local contractors, government representatives, and community representatives. The questionnaire was designed exclusively to assess the perceived likelihood of occurrence of the seven project risk factors identified in this study. The questionnaire was not used to measure infrastructure quality and was not used as a source of project-level observations in the regression analysis.
Prior to estimating the likelihood component of the risk model, the questionnaire instrument was evaluated through validity and reliability testing. Construct validity was assessed using Pearson’s product–moment correlation analysis. All questionnaire items produced correlation coefficients greater than the critical value of 0.279 (N = 50, α = 0.05), indicating that each item adequately represented its corresponding risk-factor construct [25]. Table 5 presents the validity test results for all questionnaire items associated with the seven risk factors.
Table 5.
Results of the validity test.
Reliability was evaluated using Cronbach’s Alpha. The results, as shown in Table 6, indicate that all risk-factor constructs exceeded the recommended threshold value of 0.70, indicating satisfactory internal consistency and measurement reliability.
Table 6.
Results of the reliability test.
These results indicate that the questionnaire instrument provides a valid and reliable basis for estimating the likelihood dimension of the seven project risk factors. The questionnaire data were subsequently used only to derive likelihood estimates within the ISO 31000 risk framework, whereas project-level regression analysis and Infrastructure Quality Index (IQI) estimation were performed using the independent project dataset consisting of 96 completed road infrastructure projects.
3.4. Descriptive Statistics and Likelihood Estimation
The perception-based data collected from 50 respondents were analyzed to estimate the likelihood of each risk factor. The mean values of the Likert-scale responses were used to represent the likelihood (L) of risk occurrence, consistent with the methodological framework. The results are shown in Table 7.
Table 7.
Descriptive statistics and likelihood values.
Among the evaluated factors, Contract Compliance Risk (X5), Procurement Governance Risk (X4), and Project Supervision Risk (X6) obtained the highest likelihood scores. This finding suggests that respondents perceive weaknesses in contract compliance, procurement governance, and project supervision as the most probable sources of infrastructure quality problems. Sociocultural Risk (X7) exhibited a moderate likelihood score. Although its perceived probability was lower than that of governance- and compliance-related factors, respondents indicated that local social conditions, customary practices, and stakeholder interactions may still influence project implementation, particularly in geographically dispersed communities.
Overall, the results suggest that respondents perceived governance-, compliance-, and supervision-related risks as more likely to occur than several other project risk factors within the study context. The likelihood values presented in Table 7 were subsequently used as the likelihood component (Li) in the ISO 31000 risk formulation. These values were combined with consequence scores derived from the regression analysis to calculate the Composite Risk Index.
3.5. Regression Diagnostics and Model Adequacy
Before estimating the relationship between project-level risk factors and infrastructure quality, a series of diagnostic tests were conducted to verify that the regression model satisfied the assumptions required for valid statistical inference. The diagnostic evaluation was performed using the project-level dataset consisting of 96 road infrastructure projects. The results are presented in Table 8.
Table 8.
Regression diagnostic test results.
The diagnostic results indicate that all independent variables exhibit acceptable levels of multicollinearity, with VIF values ranging from 1.24 to 3.41, well below the commonly accepted threshold of 5.00. The Shapiro–Wilk test produced a p-value of 0.087, indicating that the regression residuals did not significantly deviate from normality. Similarly, the Breusch–Pagan test yielded a non-significant result (p = 0.214), suggesting that the assumption of homoscedasticity was satisfied.
Furthermore, the Durbin–Watson statistic of 1.94 indicates that residual autocorrelation was not present. Collectively, these findings demonstrate that the regression model satisfied the principal assumptions of multiple linear regression and was therefore considered appropriate for estimating the relationship between project-level risk factors and infrastructure quality.
3.6. Relationship Between Risk Factors and Infrastructure Quality
To examine the relationship between project-level risk factors and infrastructure quality, multiple linear regression analysis was performed using the Infrastructure Quality Index (IQI) as the dependent variable. The analysis was conducted using the dataset consisting of 96 completed road infrastructure projects. The standardized regression coefficients were subsequently used to estimate the relative impact of each risk factor on infrastructure quality and to derive the consequence weights applied in the proposed risk evaluation model.
The regression model produced an R2 value of 0.68 and an adjusted R2 value of 0.64, indicating that approximately 64% of the variation in infrastructure quality can be explained by the selected project-level risk factors. The regression results are presented in Table 9.
Table 9.
Regression results.
The regression results indicate that five variables were statistically significant predictors of infrastructure quality, namely Resource Availability Risk (X3), Procurement Governance Risk (X4), Contract Compliance Risk (X5), Project Supervision Risk (X6), and Sociocultural Risk (X7). Among these variables, Contract Compliance Risk (X5) exhibited the largest standardized coefficient (β = 0.42), indicating the strongest relative influence on infrastructure quality outcomes.
Procurement Governance Risk (X4) and Project Supervision Risk (X6) also demonstrated substantial effects on infrastructure quality. These findings suggest that weaknesses in procurement transparency, administrative control, monitoring processes, and project supervision may contribute to reductions in infrastructure quality. Resource Availability Risk (X3) and Sociocultural Risk (X7) were likewise found to be significant, although their relative influence was lower than that of governance and compliance-related factors.
In contrast, Contractor Capacity Risk (X1) and Contractor Workload Risk (X2) did not demonstrate statistically significant relationships with infrastructure quality (p > 0.05). Although these factors may influence project performance in practice, their effects were not sufficiently strong within the analyzed dataset to support their inclusion in the final risk aggregation model.
To ensure methodological consistency and avoid assigning decision weights to unsupported predictors, only statistically significant variables were retained for subsequent model development. Therefore, Resource Availability Risk (X3), Procurement Governance Risk (X4), Contract Compliance Risk (X5), Project Supervision Risk (X6), and Sociocultural Risk (X7) were carried forward to the weighting and Composite Risk Index (CRI) development stages.
For presentation purposes and to avoid confusion arising from the removal of non-significant variables, the retained variables were renumbered in the final model, as shown in Table 10.
Table 10.
Mapping of retained variables for the final model.
The renumbering was applied only to the final risk evaluation model and subsequent analyses. The original variable labels (X1–X7) were retained in the regression analysis to preserve consistency with the conceptual framework and questionnaire structure.
3.7. Risk Measurement
The statistically significant risk factors identified in the regression analysis were subsequently incorporated into the risk measurement stage. Consistent with the methodological framework, the likelihood values were obtained from questionnaire responses, whereas the consequence values were represented by the standardized regression coefficients of statistically significant predictors. The resulting risk scores were calculated as the product of likelihood and consequence (Risk = L × C). The results are presented in Table 11.
Table 11.
Risk score calculation.
The results indicate that Contract Compliance Risk (X5) produced the highest risk score, followed by Procurement Governance Risk (X4) and Project Supervision Risk (X6). These findings suggest that deficiencies in contract implementation, procurement governance, and project supervision constitute the most prominent sources of infrastructure quality risk in the analyzed projects.
Resource Availability Risk (X3) also generated a relatively high-risk score, indicating that limitations in labor, materials, equipment availability, and logistical support may substantially influence project outcomes. Meanwhile, Sociocultural Risk (X7) exhibited the lowest risk score among the retained variables, although it remained statistically significant and therefore contributed to the overall risk evaluation model.
Consistent with the regression results, Contractor Capacity Risk (X1) and Contractor Workload Risk (X2) were not included in the risk measurement stage because their relationships with infrastructure quality were not statistically significant (p > 0.05). Consequently, only the five statistically significant risk factors were retained for the subsequent development of the Composite Risk Index.
3.8. Weight Determination and Final Model Construction
To ensure that the final evaluation model reflects only statistically supported predictors, Contractor Capacity Risk (X1) and Contractor Workload Risk (X2) were excluded from the weighting procedure because their regression coefficients were not statistically significant at the 5% significance level (p > 0.05). Consequently, the final model retained five significant risk factors: Resource Availability Risk (X3), Procurement Governance Risk (X4), Contract Compliance Risk (X5), Project Supervision Risk (X6), and Sociocultural Risk (X7).
The relative weight of each retained risk factor was calculated by normalizing its standardized regression coefficient. These coefficients represent the relative consequence contribution of each risk factor to infrastructure quality deterioration. The resulting weights are presented in Table 12.
Table 12.
Weight determination.
The weighting results indicate that Contract Compliance Risk contributes the largest proportion of the overall risk model, accounting for approximately 30.9% of the total weight. Procurement Governance Risk and Project Supervision Risk represent the second and third most influential factors, respectively. Collectively, these three variables account for approximately 74.3% of the total model weight, highlighting the dominant role of governance, compliance, and supervision mechanisms in determining infrastructure quality outcomes.
Resource Availability Risk contributes 15.4% of the overall model weight, indicating that limitations in labor, materials, equipment, and logistics remain important determinants of project performance. Sociocultural Risk exhibits the smallest weight (10.3%), although it remains statistically significant and therefore contributes to the final evaluation framework.
The normalized weights presented in Table 11 were subsequently incorporated into the Composite Risk Index (CRI) formulation. By combining the likelihood estimates obtained from stakeholder perceptions with the consequence weights derived from project-level regression analysis, the final model integrates both dimensions of risk in accordance with the ISO 31000 framework.
3.9. Development of the Composite Risk Evaluation Model
Following the risk measurement and weight determination procedures, a Composite Risk Index (CRI) was developed to integrate the likelihood and consequence dimensions of the statistically significant risk factors. Consistent with the regression results, Contractor Capacity Risk (X1) and Contractor Workload Risk (X2) were excluded from the final model because they did not demonstrate statistically significant relationships with infrastructure quality (p > 0.05).
The final model therefore retained five risk factors: Resource Availability Risk (X3), Procurement Governance Risk (X4), Contract Compliance Risk (X5), Project Supervision Risk (X6), and Sociocultural Risk (X7).
Using the normalized weights obtained from Table 11, the Composite Risk Index was formulated as follows:
where:
- = Composite Risk Index;
- = likelihood–consequence score of risk factor .
The multiplication factor of 20 transforms the index onto a 0–100 scale, facilitating practical interpretation and project classification.
The resulting model indicates that Contract Compliance Risk contributes the largest proportion of the overall risk score, accounting for approximately 30.9% of the total model weight. Procurement Governance Risk and Project Supervision Risk represent the second and third most influential factors, respectively. Collectively, these three variables account for approximately 74% of the total model weight, highlighting the dominant role of governance, compliance, and supervision mechanisms in determining infrastructure quality outcomes within decentralized road infrastructure projects.
3.10. Composite Risk Index
To generate a practical project evaluation metric, the weighted risk scores were aggregated into a Composite Risk Index (CRI). Following the ISO 31000 framework, the CRI integrates the likelihood of risk occurrence obtained from stakeholder perceptions with the consequence dimension derived from the regression analysis. The Composite Risk Index was calculated as:
where:
- = Composite Risk Index;
- = normalized weight of risk factor ;
- = likelihood value of risk factor ;
- = consequence value represented by the standardized regression coefficient of risk factor .
The multiplication factor of 20 transforms the aggregated score onto a 0–100 scale, facilitating interpretation and alignment with the proposed project classification thresholds.
To illustrate the application of the model, the average likelihood values obtained from the respondent survey were combined with the consequence coefficients and normalized weights derived from the regression analysis. The resulting calculation is presented in Table 13.
Table 13.
Composite Risk Index calculation.
Using the average likelihood estimates obtained from the respondent survey, the weighted aggregation produced a reference Composite Risk Index value of 23.94. Contract Compliance Risk contributed the largest share of the overall risk profile, accounting for approximately 45.5% of the total index value, followed by Procurement Governance Risk and Project Supervision Risk. These findings indicate that deficiencies in contract administration, governance practices, and supervision mechanisms constitute the dominant sources of infrastructure quality risk within the studied projects.
The transformation of the aggregated score to a 0–100 scale facilitates interpretation and enables direct comparison with the project classification thresholds defined in the proposed evaluation framework. Consequently, the Composite Risk Index provides a practical decision-support metric for assessing the overall risk profile of decentralized road infrastructure projects.
3.11. Project Classification Framework
To facilitate practical implementation during project evaluation and handover processes, the Composite Risk Index was translated into a project classification framework, as presented in Table 14.
Table 14.
Project evaluation categories.
Projects classified as Acceptable are considered to have relatively low risk levels and generally satisfy technical and administrative requirements. Projects classified as Conditional Acceptance require corrective actions before final acceptance can be granted, whereas projects classified as Rejected exhibit substantial deficiencies requiring major remediation and re-evaluation.
The classification framework provides a practical decision-support tool that translates the Composite Risk Index into actionable project acceptance decisions. By integrating likelihood assessments obtained from stakeholder perceptions with consequence estimates derived from project-level statistical analysis, the framework enables project owners and supervising agencies to identify projects requiring additional monitoring, corrective actions, or further technical review prior to handover.
3.12. Model Evaluation
The predictive performance of the proposed risk evaluation model was assessed using an independent set of project observations completed in 2024. For each project, a Composite Risk Index (CRI) was calculated using the final weighting structure developed from the statistically significant risk factors. The resulting project classifications were then compared with the observed infrastructure quality categories derived from the five-indicator Infrastructure Quality Index (IQI) described in Section 2.3.1. The classification results are summarized in Table 15.
Table 15.
Confusion matrix of project classification.
Based on the confusion matrix, several standard classification performance metrics were calculated, as shown in Table 16.
Table 16.
Model validation results.
The model achieved an overall classification accuracy of 78.8%, indicating a satisfactory ability to distinguish between lower-risk and higher-risk projects within the validation dataset. The recall value of 80.0% suggests that the model successfully identified most projects exhibiting elevated risk profiles, while the F1-score of 76.2% indicates a balanced trade-off between precision and recall.
Nevertheless, several false-negative classifications were observed, indicating that a small number of projects with quality deficiencies were incorrectly categorized as acceptable. From an infrastructure management perspective, such errors are particularly important because they may result in substandard projects being accepted during the handover process. Therefore, the proposed model should be regarded as a decision-support tool that complements, rather than replaces, detailed technical inspections and engineering evaluations.
Although the validation results demonstrate promising predictive capability, the model has only been evaluated using small-scale road infrastructure projects awarded through direct appointment mechanisms in Sorong Regency, Southwest Papua. Additional validation using larger datasets, different project scales, and alternative procurement methods is required before broader application can be recommended.
4. Discussion
The findings indicate that among the evaluated risk factors, governance, compliance, and project management dimensions exhibited the strongest influence on infrastructure quality. Although the distribution of project allocations among local contractors was relatively balanced, with most contractors receiving only one to two projects, the Infrastructure Quality Index (IQI) exhibited substantial variation across projects. This finding suggests that equitable project allocation alone is insufficient to guarantee satisfactory construction outcomes. Instead, the results imply that the principal challenge lies in the ability of contractors and project governance systems to translate contractual requirements into consistent construction quality.
Among all evaluated variables, Contract Compliance Risk emerged as the most influential factor in the final risk model, contributing approximately 30.9% of the overall Composite Risk Index. This finding suggests that infrastructure quality is highly dependent on the extent to which contractors comply with technical specifications, contractual obligations, and administrative requirements throughout project implementation. In decentralized procurement environments involving small-qualified contractors, contract compliance functions as the primary mechanism linking planning requirements to actual construction outcomes. When compliance is weak, deviations from specifications may occur without timely corrective actions, ultimately reducing infrastructure quality and increasing project risk. This finding is consistent with previous studies emphasizing that effective contract administration, contractual enforcement, and procurement oversight are critical determinants of project success and infrastructure reliability [8,9,10].
The second most influential factor was Procurement Governance Risk. This result highlights the importance of institutional oversight, transparency, accountability mechanisms, and procurement management practices in ensuring construction quality. While decentralized procurement policies are intended to increase local participation and economic inclusion, they may simultaneously introduce governance challenges when monitoring systems are insufficiently developed. The findings therefore suggest that governance quality functions as an enabling condition for successful decentralization. In other words, decentralization may increase opportunities for local contractors, but without adequate governance mechanisms the intended developmental benefits may not be fully realized. This interpretation extends previous procurement studies by demonstrating how governance weaknesses can be translated into measurable infrastructure quality risks [3,6,19]. The finding also aligns with infrastructure management studies emphasizing that governance effectiveness is often more important than financial resources in determining long-term infrastructure performance [4,16].
Project Supervision Risk also exhibited a substantial contribution to the final model. This finding indicates that supervision should not be viewed merely as an administrative requirement but rather as an active quality-control mechanism throughout project implementation. Deficiencies in inspection procedures, monitoring frequency, documentation practices, and enforcement actions can substantially increase the probability of construction defects. This result is particularly relevant in geographically dispersed regions such as Southwest Papua, where logistical constraints and limited technical personnel may reduce the effectiveness of routine supervision activities. Consequently, strengthening supervisory capacity may represent one of the most practical interventions for improving infrastructure quality without necessarily increasing project budgets. Similar conclusions have been reported in studies highlighting the importance of project monitoring, work breakdown structures, and managerial control systems in ensuring project delivery performance [21,26].
Resource Availability Risk was also found to significantly influence infrastructure quality, although its relative contribution was lower than those of governance-related variables. This finding suggests that material availability, equipment accessibility, and workforce resources remain important determinants of project performance, particularly in remote regions characterized by transportation constraints and limited market accessibility. However, the comparatively lower weight assigned to this variable indicates that resource limitations alone do not fully explain infrastructure quality variation. Rather, resource-related challenges appear to become more critical when combined with weaknesses in governance, compliance, and supervision systems. This observation suggests that managerial effectiveness may partially mitigate the adverse effects of resource constraints. Such findings support previous studies emphasizing the interaction between project risk management practices and infrastructure project performance [21], as well as decision-support frameworks that prioritize resource allocation within complex infrastructure systems [16,22,23].
The influence of Sociocultural Risk deserves particular attention because it represents a context-specific factor that is rarely incorporated into conventional infrastructure evaluation models. Although its contribution to the Composite Risk Index was lower than that of technical and governance-related variables, the variable remained statistically significant and therefore retained in the final model. This result suggests that local norms, community expectations, informal leadership structures, and social relationships influence project implementation processes in ways that affect infrastructure outcomes. In the context of Southwest Papua, where customary institutions and community engagement play important roles in local governance, project implementation frequently occurs within a broader social environment that extends beyond formal contractual arrangements. Consequently, project performance may be affected not only by technical competence and administrative compliance but also by the ability of stakeholders to navigate local social dynamics. These findings support earlier studies demonstrating that organizational culture, local values, partnering culture, and social context influence project effectiveness and collaboration quality. Furthermore, research conducted in Papua highlights that local sociocultural characteristic can substantially influence procurement implementation and infrastructure delivery outcomes [13,14].
An important finding of this study is the absence of statistically significant effects for Contractor Capacity Risk (X1) and Contractor Workload Risk (X2). Consistent with the methodological framework, these variables were excluded from the final weighting and aggregation procedures because their regression coefficients were not statistically significant at the 5% level. This decision directly addresses concerns regarding the inclusion of non-significant predictors in composite risk calculations. However, the non-significant results should not be interpreted as evidence that contractor capacity and workload have no influence on infrastructure quality. Rather, the findings indicate that within the specific dataset analyzed, their independent effects could not be distinguished from other project-related factors. In particular, the relatively homogeneous characteristics of the sampled projects, all of which involved small-qualified contractors operating under similar procurement conditions and within a limited project value range, may have reduced observable variability in these variables. Therefore, the present findings should be interpreted as context-specific rather than universally applicable.
From a theoretical perspective, the study contributes to the integration of three research streams that are often investigated separately: risk management, infrastructure quality assessment, and multi-criteria evaluation. Previous studies have generally focused on identifying project risks, measuring project performance, or prioritizing decision alternatives independently [16,22,23]. The present study advances this literature by operationalizing risk as a measurable construct that combines likelihood and consequence dimensions and subsequently aggregates them through a statistically derived weighting framework. This approach transforms qualitative perceptions and project-level quality measurements into a single Composite Risk Index that can support evidence-based decision making. Methodologically, the study also responds to recent calls for more transparent and reproducible quantitative evaluation frameworks capable of supporting infrastructure management decisions under uncertainty [4,16,27,28,29].
The validation results further demonstrate the practical potential of the proposed framework. Using the available project dataset, the model achieved an overall classification accuracy of approximately 78.8%. These results indicate that the model possesses a reasonable ability to distinguish between projects exhibiting relatively lower and higher quality risks. Nevertheless, several false-negative classifications were observed. This issue is particularly important because incorrectly classifying poor-quality projects as acceptable may result in premature infrastructure handover, increased maintenance requirements, and potential safety concerns. Therefore, the proposed model should be viewed as a decision-support tool that complements, rather than replaces, detailed engineering inspections and technical verification procedures. This interpretation is consistent with contemporary infrastructure management approaches that emphasize the complementary use of quantitative decision-support systems and expert judgment [4,16].
The findings also have important policy implications for local governments implementing infrastructure programs under special autonomy arrangements. The results suggest that efforts to improve infrastructure quality should prioritize strengthening contract administration, procurement governance, and project supervision systems rather than focusing exclusively on increasing project budgets or expanding contractor participation. Capacity-building programs, contractor certification initiatives, enhanced monitoring procedures, and standardized handover verification mechanisms may provide more substantial quality improvements than financial interventions alone. Previous studies similarly emphasize the importance of workforce competence, managerial capability, and performance measurement systems in improving project outcomes [30,31,32,33]. Moreover, incorporating sociocultural considerations into project governance frameworks may improve stakeholder coordination and facilitate more effective project implementation in regions characterized by strong local institutional traditions [13,14,34,35].
Several limitations should be acknowledged. First, the study was conducted using 96 road infrastructure projects with contract values not exceeding IDR 2 billion, implemented through direct appointment procurement mechanisms in Sorong Regency, Southwest Papua, Indonesia. Therefore, the proposed model has been validated only within this specific project and procurement context. Second, the likelihood assessment was derived from a purposive sample of 50 respondents, including a limited proportion of community representatives. Future studies should employ larger and more diverse respondent groups to further evaluate the stability of the proposed likelihood estimates and weighting structure. Third, the model has not yet been validated across different geographical regions, infrastructure sectors, or procurement environments. Consequently, the applicability of the proposed framework beyond the context of Southwest Papua should be interpreted with caution until additional empirical validation becomes available.
Overall, the findings suggest that governance-related risks constitute the dominant drivers of infrastructure quality variation within decentralized road construction projects. By integrating likelihood, consequence, and weighted aggregation mechanisms into a unified framework, the proposed model offers a transparent and reproducible approach for supporting infrastructure evaluation and project handover decisions while simultaneously identifying priority areas for quality improvement. The results therefore contribute not only to the infrastructure risk management literature but also to the development of practical decision-support tools for local governments operating under decentralized procurement systems.
5. Conclusions
This study developed a risk-based evaluation model for assessing the quality of road infrastructure projects implemented by small-qualified local contractors under direct appointment procurement mechanisms in Sorong Regency, Southwest Papua. Analysis of 96 completed projects revealed that infrastructure quality deficiencies were not primarily associated with unequal project allocation among contractors. Although most contractors received only one to two projects, substantial variations in project quality were still observed, indicating that quality outcomes are more closely related to project implementation and governance factors than to project distribution patterns.
The regression results identified Contract Compliance Risk, Procurement Governance Risk, Project Supervision Risk, Resource Availability Risk, and Sociocultural Risk as significant predictors of infrastructure quality. Among these factors, contract compliance, procurement governance, and project supervision contributed the largest weights in the final model, highlighting the importance of effective contract administration, technical oversight, and monitoring mechanisms in maintaining construction quality. In contrast, Contractor Capacity Risk and Contractor Workload Risk were not statistically significant within the analyzed dataset and were therefore excluded from the final risk aggregation model.
Based on the significant risk factors, a Composite Risk Index was developed by integrating likelihood and consequence dimensions following ISO 31000 principles. The resulting framework provides a transparent and reproducible mechanism for translating multiple project risks into a single evaluation score that can support project acceptance decisions and contractor performance assessment.
From a practical perspective, the findings suggest that efforts to improve infrastructure quality should prioritize strengthening contract compliance, enhancing supervision effectiveness, improving governance practices during project implementation, and ensuring adequate resource availability. These areas appear to have a greater influence on project outcomes than financial or workload-related factors within the study context.
Several limitations should be acknowledged. The model was developed using 96 road infrastructure projects and a purposive sample of 50 respondents from a single regency in Southwest Papua. The framework has been validated only for road infrastructure projects implemented through direct appointment procurement mechanisms involving small-qualified local contractors with contract values not exceeding IDR 2 billion in Sorong Regency. Therefore, its applicability to other geographical regions, project scales, procurement methods, or infrastructure sectors has not yet been tested and should be interpreted with caution until further empirical validation becomes available. Future research should evaluate the model using larger datasets, multiple geographic regions, and different infrastructure types to examine its broader applicability and robustness.
Author Contributions
Conceptualization, S.S. and A.P.I.; methodology, S.S., A.P.I. and E.M.S.; software, S.S.; validation, A.P.I., E.M.S. and O.F.J.; formal analysis, S.S. and E.M.S.; investigation, S.S. and O.F.J.; resources, S.S.; data curation, S.S.; writing—original draft preparation, S.S.; writing—review and editing, S.S.; visualization, E.M.S.; supervision, A.P.I.; project administration, O.F.J.; funding acquisition, A.P.I. All authors have read and agreed to the published version of the manuscript.
Funding
This research received no external funding.
Institutional Review Board Statement
Ethical review and approval were waived for this study because it did not involve the collection, use, or processing of personal, identifiable, or sensitive human data.
Informed Consent Statement
Informed consent was obtained from all subjects involved in the study.
Data Availability Statement
The data presented in this study are available on request from the corresponding author. The data are not publicly available because they are owned by the Public Works Department of Sorong Regency, Papua, Indonesia, and are subject to institutional confidentiality and access restrictions.
Acknowledgments
The authors have reviewed and edited the output and take full responsibility for the content of this publication.
Conflicts of Interest
The authors declare no conflicts of interest.
Abbreviations
The following abbreviations are used in this manuscript:
| IDR | Indonesian Rupiah |
| ISO | International Organization for Standardization |
| R2 | Coefficient of Determination |
| β | Regression Coefficient |
| L | Likelihood |
| I | Impact |
References
- Mutikanga, H.E.; Abdul Nabi, M.; Ali, G.G.; El-adaway, I.H.; Caldwell, A. Postaward Construction and Contract Management of Engineering, Procurement, and Construction Hydropower Projects: Two Case Studies from Uganda. J. Manag. Eng. 2022, 38, 05022012. [Google Scholar] [CrossRef] [Scilit]
- Hughes, W.; Champion, R. Procurement, contracts and project management. In ICE Companion to Engineering Management; ICE Publishing: Leeds, UK, 2022; pp. 1–52. [Google Scholar] [CrossRef] [Scilit]
- Lingegård, S.; Havenvid, M.I.; Eriksson, P.E. Circular public procurement through integrated contracts in the infrastructure sector. Sustainability 2021, 13, 11983. [Google Scholar] [CrossRef] [Scilit]
- Atolagbe, B.; McNeil, S. Transportation asset management decision support tools: Computational complexity, transparency, and realism. Infrastructures 2023, 8, 143. [Google Scholar] [CrossRef] [Scilit]
- Chileshe, N.; Njau, C.W.; Kibichii, B.K.; Macharia, L.N.; Kavishe, N. Critical success factors for Public-Private Partnership (PPP) infrastructure and housing projects in Kenya. Int. J. Constr. Manag. 2022, 22, 1606–1617. [Google Scholar]
- Lahdenperä, P. Making sense of the multi-party contractual arrangements of project partnering, project alliancing and integrated project delivery. Constr. Manag. Econ. 2012, 30, 57–79. [Google Scholar] [CrossRef] [Scilit]
- Osifo, E.O.; Omumu, E.S.; Alozie, M. Evolving contractual obligations in construction law: Implications of regulatory changes on project delivery. World J. Adv. Res. Rev. 2025, 25, 1315–1333. [Google Scholar] [CrossRef] [Scilit]
- Israel, B. The impact of clients’ procurement challenges on the substance goals of roads construction projects in Songwe, Tanzania. Int. J. Constr. Manag. 2023, 23, 2144–2150. [Google Scholar] [CrossRef] [Scilit]
- Coleman, C.E.; Mwanaumo, E.M.; Mwanaumo, M.M.; Rahman, R.A. Contract Termination in the Construction Industry: A Systematic Literature Review. Construction 2025, 5, 27–38. [Google Scholar]
- Sidik, A.I. Legal Obligations of Contractors in Construction Projects: Analyzing the Conflict of Legal Compliance, Contract Performance, and Quality Assurance in Construction Services in Indonesia. Proc. Ser. Soc. Sci. Humanit. 2023, 14, 244–249. [Google Scholar]
- Ankrah, N.A.; Proverbs, D.; Debrah, Y. Factors influencing the culture of a construction project organisation: An empirical investigation. Eng. Constr. Archit. Manag. 2009, 16, 26–47. [Google Scholar] [CrossRef] [Scilit]
- Pancholi, J.; Devkar, G. Analysing the Influence of Organizational Culture in Projects using Last Planner System. Constr. Econ. Build. 2023, 23, 143–169. [Google Scholar]
- Yogi, F.; Wambrauw, K.; Rumbrawer, Y. Konstruksi sosial budaya dalam pengadaan barang dan jasa di Tanah Papua: Studi kasus pelibatan OAP dalam proyek infrastruktur. J. Adm. Publik Papua 2021, 9, 133–148. [Google Scholar]
- Naibaho, H. Integrasi nilai-nilai budaya lokal dalam pembangunan infrastruktur berbasis komunitas di Papua. J. Masy. Budaya 2022, 24, 25–42. [Google Scholar]
- Adzimah, E.D.; Lei, L.; Ishawu, M. Organisational culture influences on corporate social responsibility and sustainable procurement in a service sector industry. J. Psychol. Afr. 2020, 30, 390–396. [Google Scholar] [CrossRef] [Scilit]
- Bošnjak, A.; Jajac, N. Determining priorities in infrastructure management using multicriteria decision analysis. Sustainability 2023, 15, 14953. [Google Scholar] [CrossRef] [Scilit]
- Gamil, Y.; Rahman, I.A. Identification of causes and effects of poor communication in construction industry: A theoretical review. Emerg. Sci. J. 2017, 1, 239–247. [Google Scholar] [CrossRef] [Scilit]
- Shayya, M. The impact of organisational culture on performance. J. Glob. Bus. Adv. 2018, 11, 304–331. [Google Scholar] [CrossRef] [Scilit]
- Sari, E.M.; Bigwanto, A.; Wibowo, M.A.; Thohirin, A.; Al Fath, A.A. A comparation: Implementation lean construction between design & build and design bid build government project in Indonesia. Int. J. Innov. Res. Sci. Stud. 2025, 8, 2285–2294. [Google Scholar] [CrossRef] [Scilit]
- Creswell, J.W.; Creswell, J.D. Research Design: Qualitative, Quantitative, and Mixed Methods Approaches; Sage Publications: Singapore, 2017. [Google Scholar]
- Gichohi, P.P.; Iravo, M.; Muchelule, Y. Project risk management on the performance of road construction projects in Kenya. Int. J. Manag. Bus. Res. 2024, 6, 108–130. [Google Scholar]
- Zavadskas, E.K.; Turskis, Z.; Kildienė, S. State of art surveys of overviews on MCDM/MADM methods. Technol. Econ. Dev. Econ. 2014, 20, 165–179. [Google Scholar] [CrossRef] [Scilit]
- Goodarzi, H.; Khaledian, S.; Mirzaei, M.; Jahanshahi, R.; Motamedi, H.; Niya, O.F. AHP-TOPSIS Social Sustainability Approach for Supplier Selection in the Construction Supply Chain Using AHP-TOPSIS Methodologies in Selecting Sustainable Suppliers in an Electronic Supply Chain. Int. J. Mod. Achiev. Sci. Eng. Technol. 2026, 3, 84–91. [Google Scholar]
- Klarin, A.; Xiao, Q. Automation in architecture, engineering and construction: A scientometric analysis and implications for management. Eng. Constr. Archit. Manag. 2024, 31, 3308–3334. [Google Scholar]
- Peterson, R.A. A meta-analysis of Cronbach’s coefficient alpha. J. Consum. Res. 1994, 21, 381–391. [Google Scholar]
- Odedairo, B.O. Assessing the Influence of Various Work Breakdown Structures on Project Completion Time. Eng. Technol. Appl. Sci. Res. 2024, 14, 13773–13779. [Google Scholar] [CrossRef] [Scilit]
- Fryer, L.K.; Larson-Hall, J.; Stewart, J. Quantitative methodology. In The Palgrave Handbook of Applied Linguistics Research Methodology; Palgrave Macmillan: London, UK, 2018; pp. 55–77. [Google Scholar]
- Risher, J.; Hair, J.F. The robustness of PLS across disciplines. Acad. Bus. J. 2017, 1, 47–55. [Google Scholar]
- Kono, S.; Sato, M. The potentials of partial least squares structural equation modeling (PLS-SEM) in leisure research. J. Leis. Res. 2023, 54, 309–329. [Google Scholar]
- Ekasari, S.; Hartanto; Shu, E.; Yahya; Setiawan, R. The Effect of Motivation, Competence and Organizational Commitment on Performance of Employees in Food and Beverage Manufacturing Company. JEMSI J. Ekon. Manaj. Akunt. 2023, 9, 844–849. [Google Scholar] [CrossRef] [Scilit]
- Majstorović, A.; Cerić, A. Development of a human resources management model in construction. Electron. Collect. Pap. Fac. Civ. Eng. 2019, 9, 53–61. [Google Scholar]
- Mansor, M.A. Multi-Criteria Decision Making for Prioritizing Project Manager Skills according to Construction Project Success Factors. Eng. Technol. Appl. Sci. Res. 2025, 15, 21861–21875. [Google Scholar] [CrossRef] [Scilit]
- Bigwanto, A.; Widayati, N.; Wibowo, M.A.; Sari, E.M. Key Performance Indicators (KPI) to Measure Effectiveness of Lean Construction in Indonesian Project. Sustainability 2024, 16, 6461. [Google Scholar] [CrossRef] [Scilit]
- Lühr, G.J.; Bosch-Rekveldt, M.G.C.; Radujkovic, M. Key stakeholders’ perspectives on the ideal partnering culture in construction projects. Front. Eng. Manag. 2022, 9, 312–325. [Google Scholar] [CrossRef] [Scilit]
- Yasmin, Y.; Herwindiati, D.E.; Sari, E.M. Faktor Yang Mempengaruhi Harga Satuan Biaya Pembangunan Infrastruktur Di Wilayah Dengan Aksesabilitas Terbatas. J. Pensil 2025, 14, 613–625. [Google Scholar] [CrossRef] [Scilit]

Disclaimer/Publisher’s Note: The statements, opinions and data contained in all publications are solely those of the individual author(s) and contributor(s) and not of MDPI and/or the editor(s). MDPI and/or the editor(s) disclaim responsibility for any injury to people or property resulting from any ideas, methods, instructions or products referred to in the content. |
© 2026 by the authors. Licensee MDPI, Basel, Switzerland. This article is an open access article distributed under the terms and conditions of the Creative Commons Attribution (CC BY) license.