


Abstract
Landscape Visual Assessment (LVA) has long examined how landscape elements influence visual perception and aesthetic response, yet the question of which elements attract attention remains underexplored in historic parks. Compared with urban parks, streetscapes, or natural landscapes, historic parks are shaped by a distinctive combination of natural features, cultural structures, and historically embedded symbolic meanings. In this study, we categorize landscape elements in historic parks into Natural Landscape Elements (NLE) and Cultural Landscape Elements (CLE), and investigate their relative visual salience in three historic parks in Beijing: Taoranting Park, the Summer Palace, and Beihai Park. We adopt a multi-method exploratory framework integrating cognitive maps, eye-tracking experiments, computational vision analysis, and GIS/UGC-based spatial analysis. The study draws on 30 cognitive maps, participant-level eye-tracking data from 30 valid participants, supplementary heatmap-based computational image analysis, and large-scale geotagged photo-density data. The results show that, within the exploratory sample, CLE were more frequently associated with strong memory impressions than NLE. In the pooled eye-tracking analysis, CLE showed higher attention scores overall, but this pattern was not stable across all parks and was strongly context-dependent. The computational and spatial analyses further suggest that attention distribution is influenced not only by the presence of specific elements, but also by color contrast, the spatial coupling of CLE and NLE, and the broader organization of park scenes and visitor activity zones. Rather than proposing a universal model of visual attention in historic parks, this study offers an exploratory, context-sensitive account of how cultural and natural landscape elements jointly shape attention across perceptual and spatial scales. The findings contribute to landscape visual assessment research by extending it into the specific setting of historic parks and by demonstrating the value of combining perceptual, computational, and spatial methods in a complementary framework.
1. Introduction
Long-term interactions between humans and the environment continuously shape landscape form, function, and meaning [1]. As urbanisation, tourism, and heritage management increasingly transform historically significant environments, the assessment of landscape value has become an important concern in both environmental evaluation and design practice [2]. Within this broader context, Landscape Visual Assessment (LVA) seeks to understand how people perceive landscape scenes and how different elements contribute to visual quality and aesthetic response [3]. However, accurately evaluating visual quality remains challenging because landscape perception is shaped by both subjective preference and the complexity of environmental settings, especially in places with strong historical and cultural significance [4].
Landscape visual assessments can be broadly categorized into expert-based evaluations, emphasizing systematic analysis grounded in design theory, environmental science [5,6,7], and policy, and public perception-based evaluations, which focus on collecting and interpreting the subjective experiences and aesthetics of the public [8,9,10,11]. This study aligns with the latter perspective and asks a more specific question within that tradition: in historic parks, which landscape elements are more likely to attract attention, and under what spatial conditions?
Since the 1960s, research in environmental psychology, ecology, and landscape architecture has generated extensive knowledge on landscape preference and visual perception. Theories such as prospect-refuge theory and the landscape preference model have explained how openness, shelter, coherence, complexity, legibility, and mystery shape aesthetic response. Subsequent studies have also explored how natural and built elements influence preference and restorative effects [12,13]. More recently, eye-tracking techniques have enabled researchers to examine visual attention with greater precision by tracing fixation distribution and fixation duration during scene perception [14,15]. In parallel, advances in computer vision have made it possible to analyse image features computationally at larger scales. However, computational attention mechanisms in neural networks should not be equated with human visual attention; instead, they provide a supplementary image-based perspective on salience cues [10,16].
Despite these advances, most existing theories and empirical findings have been developed in relation to natural landscapes, urban parks, streetscapes, or general environmental settings. Historic parks cannot be treated simply as extensions of these environments. This distinction can also be understood through cultural landscape theory [1]. In Sauer’s classic formulation, landscape is not merely a natural scene but a cultural palimpsest shaped by successive layers of human occupation and inscription. Historic parks, especially those with long histories of design, use, and symbolic association, may therefore be perceived not only through their visible physical form but also through the historical meanings embedded in their spatial composition. In this sense, CLE are not simply built objects within a landscape; they are culturally inscribed features that may carry mnemonic and symbolic weight in ways that differ from many natural elements. This perspective helps explain why visual attention and memory in historic parks may not follow the same logic as in more general urban or natural landscape settings. Unlike many other landscape types, historic parks are characterised by the close integration of natural scenery, cultural structures, and historically embedded symbolic meanings. In such settings, visual attention may be shaped not only by general perceptual variables such as colour, visibility, and openness, but also by the interaction between architectural heritage, natural features, and culturally meaningful spatial organisation. Existing research has not sufficiently clarified how these components jointly influence attention distribution in historic park settings.
To address this gap, the present study investigates three historic parks in Beijing—Taoranting Park, the Summer Palace, and Beihai Park—through a multi-method exploratory framework integrating cognitive mapping, eye-tracking experiments, computational vision analysis, and GIS/UGC-based spatial analysis. For analytical clarity, we classify the landscape elements in these parks into Natural Landscape Elements (NLE) and Cultural Landscape Elements (CLE). Rather than testing a single classical theory, the study aims to examine how CLE, NLE, and their spatial combinations jointly shape attention across perceptual and spatial scales. This argument is also consistent with UNESCO’s conceptual framework for cultural landscapes, which emphasizes the interaction of natural settings, human intervention, and historically accumulated cultural value. From this perspective, the perceptual significance of historic parks may derive not only from formal scenic composition, but also from the way cultural and natural elements are jointly embedded in a historically meaningful landscape whole.
The objectives of this research are:
- (1)
- to identify the landscape elements and landscape combinations associated with stronger visual salience in the sampled historic parks; and
- (2)
- to clarify the respective roles and analytical contributions of the four methods employed, thereby providing an exploratory methodological reference for future research on visual attention in culturally significant landscape settings.
The framework integrates four complementary approaches to characterize human–environment interaction in historic parks: (i) cognitive mapping and interviews to capture visitors’ memory impressions and perceived importance of landscape elements; (ii) eye-tracking experiments to quantify photograph-based gaze allocation (fixation distribution and fixation duration); (iii) computational vision analysis (Section 4.3) as a supplementary exploratory perspective on image feature cues; and (iv) GIS-based spatial analysis to identify zone-level spatial patterns of visitor engagement. Outputs from these approaches are compared to identify convergent and divergent patterns across perceptual, image-based, and spatial scales.
2. Related Works
Parks are places of democracy, historical artifacts, nature, educators, and paradises [17]. Urban parks are an important component of public urban space, directly impacting residents’ living experience and the city’s image. High-quality urban parks are crucial for improving residents’ well-being [18]. Landscape visual assessment has been extensively studied through diverse methodologies, aiming to systematically quantify and evaluate the aesthetic qualities of landscape environments [19]. Early foundational studies in landscape visual quality assessment include Daniel and Boster’s Scenic Beauty Estimation Method [8], which quantitatively evaluates landscape aesthetics based on viewer responses. Similarly, Bacon [5] established a visual management system for landscape resources within the U.S. Forest Service, providing structured guidelines for managing visual qualities in forest landscapes. Several contemporary approaches have expanded upon these traditional methods. Bulut and Yilmaz [20] utilized visual quality assessments to determine landscape beauty in Kemaliye, Turkey, emphasizing visual perception factors. Kang and Liu [2] provided a comprehensive overview of methodologies and technological advances in landscape visual quality evaluation, highlighting innovative tools such as Geographic Information Systems (GIS), remote sensing, and advanced data analytics for more accurate and objective evaluations.
Visual attention research, rooted in environmental psychology and cognitive theories, has significantly influenced landscape visual assessment methodologies. Crawford’s Prospect-Refuge theory [16] emphasizes evolutionary preferences for landscapes providing visibility (prospect) and refuge, directly relating to visual attention by highlighting the importance of certain landscape features in attracting human gaze. Kaplan and Kaplan’s Attention Restoration Theory [17,18,21] further elaborates on the role of visual attention by suggesting that involuntary attention elicited by natural environmental stimuli promotes psychological restoration and relaxation, thereby enhancing landscape attractiveness. Ulrich’s Affect and aesthetic preference study [12] complements these perspectives by examining emotional responses triggered by visually attractive landscape features. His research demonstrates the strong correlation between visual attention, emotional engagement, and landscape aesthetic preferences, highlighting critical elements such as water, vegetation, and spatial arrangement as primary visual attraction factors.
Semantic and perceptual aspects have also been central to landscape visual evaluation. Historically, visual quality and impact assessments have relied on formal expert evaluations of landscape visual attributes. Traditional urban landscape perception research largely depends on individual experience, which may limit the collaborative production of knowledge across spatial scales and disciplines [22]. In contrast, environmental psychologists utilize rating and survey studies to investigate subjective landscape preferences. These two approaches represent the “objectivist” and “subjectivist” paradigms in visual landscape research, respectively. However, a gap exists between these two approaches: actual observation. Numerous past studies have demonstrated the necessity of incorporating eye-tracking research into visual landscape assessment, viewing it as a crucial bridge connecting objective landscape quality and subjective visual experience. Furthermore, the literature describes the fundamentals of eye-tracking methods and data types, and introduces the role of eye movements in landscape preference formation [15]. Meanwhile, research results show that eye-tracking experimental results are highly consistent with subjective evaluation results. Samples with higher landscape aesthetic scores perform better in core eye-tracking indicators such as total fixation duration, total fixation frequency, and total saccade duration, and typically have higher landscape feature factor values [23]. Cognitive perception mapping is a traditional method for landscape assessment, but its creation faces many challenges, one of which is the difficulty in representing spatially unevenly distributed viewpoints or viewpoints unrestricted by the location of physical elements within the landscape. In recent years, tools based on geographic information technology have been widely used in the field of landscape assessment [24]. One article proposed a method based on spatial generalization of cognitive landscape viewpoints: using a public participatory geographic information system to collect data, this system uses bipolar adjectives to describe user viewpoints and combines inverse distance weighted spatial interpolation and multi-criteria evaluation for spatial analysis to successfully create a cognitive landscape viewpoint map. A new procedure was established within the landscape methodology, which can be referenced in this paper [25]. Osgood et al.’s semantic differential scale [10] laid the groundwork for capturing the subjective meanings attributed to landscapes. Echelberger [9] and Ren [11] further applied the semantic differential scale combined with modern technologies such as eye-tracking experiments, significantly enhancing our understanding of the cognitive and perceptual processes involved in landscape appreciation. Ren [11] particularly underscored how eye-tracking technology, coupled with semantic analysis, can provide detailed insights into visual attention patterns and their influence on landscape perception.
The rapid development of artificial intelligence and street view big data has provided opportunities for advancing research on green space perception [26]. With the increasingly widespread application of artificial intelligence in environmental design, computer vision and deep learning have become important tools for understanding human visual perception. Many interdisciplinary collaborative methods in computer science have been validated for use in landscape design, including simulation and prediction, layout generation, image post-processing, management and evaluation, and text analysis [26]. For example, some studies have integrated textual and visual elements from classical Chinese poetry to quantitatively assess the emotions in landscape design and construct corresponding evaluation systems. This evaluation system also incorporates attention mechanisms to generate heatmaps that highlight areas of interest to the model [27]. Secondly, applying deep learning, especially deep convolutional neural networks (DCNNs), to natural landscape images can greatly promote landscape analysis and interpretation [28]. In recent years, deep learning technology has been applied to the study of traditional village landscapes to explore the representation of cultural heritage and the diversity of its information [29]. Furthermore, research has applied mixed reality (MR) technology, which overlays virtual content onto real scenes, to the field of landscape design, attracting widespread attention. These new technologies applied in the field of landscape have provided support for our research and exploration. Specifically, some studies have used computer vision technology to construct semantic segmentation models suitable for rural landscapes and developed a systematic and quantifiable set of landscape feature indicators [30]. Other research has proposed a deep learning-based method for assessing urban landscape diversity in street view images. Research related to deep learning indicates that vegetation and water bodies can significantly enhance a park’s attractiveness and positive perceptions, while excessive sky and artificial structures can have negative effects [25].
Visual experience is a primary channel for perceiving and managing the value of tangible cultural heritage [31]. However, visual impact assessment is a step often overlooked or even omitted in the planning process. Subsequently, visual landscape quality assessment has become one of the methods for planning research within the framework of the European Landscape Convention in Europe and even globally [32,33]. The visual characteristics of a landscape consist of natural and man-made features, as well as physical and biological resources. This assessment includes a list of cultural heritage protection areas and helps identify preferences for various factors and natural landscape elements [34]. Currently, it is known that the quality of urban green spaces is closely related to human perception, and accurately assessing the complexity of this attribute remains a challenge. Traditional urban landscape perception research largely relies on individual experience, which may limit the collaborative production of knowledge applied across spatial scales and disciplines [35]. In the future, against the backdrop of intensive tourism use and rapid urban spatial development, historical and cultural landscapes will require more comprehensive and objectively quantifiable methods for studying visual attention value in order to protect the sustainable design, restoration, and management of historical and cultural parks [32]. The task of visual analysis is to identify, describe, and assess visual resources, and to construct a visual framework for the further development of historic districts while preserving their unique spatial characteristics. A comprehensive assessment framework should include quantitative assessments of visual sensitivity and visual perception assessments based on public participation, which has proven effective in predicting the visual impact of proposed projects on heritage value [33]. Furthermore, past research methods primarily based on eye-tracking have shown that natural landscapes primarily attract participants’ immediate visual attention and score higher on visual appeal (AV); while cultural landscapes attract less immediate attention, they are appreciated for their historical and cultural significance [36]. Advancements in spatial analysis and participatory methods have also enriched the field, particularly concerning landscape visual attraction elements. Lynch’s work [37] on urban imagery introduced cognitive mapping methods widely applied in landscape research, as demonstrated by Eilola et al. [38], who employed participatory geospatial methodologies in local land-use planning to identify visually significant landscape elements. Liu and Nijhuis [39] further refined these spatial-visual analysis methods to better understand visual attraction mechanisms, emphasizing the importance of spatial composition, visibility, and visual connectivity in landscape design and planning.
The openness, rhythm, and richness of color in a space can influence people’s emotions and evoke different psychological feelings [40]. Historically significant urban parks have evolved into multifunctional spaces that integrate cultural heritage with contemporary urban life [41]. Furthermore, many historic parks, as heritage sites, are widely recognized for their positive aesthetic and social value [38,42]. Human perception of urban landscapes, that is, the degree to which local residents appreciate urban landscapes, provides a basis for people-centered policy-making that strengthens public participation [41,43].
Taken together, existing studies have established important theoretical foundations for understanding landscape preference, visual attraction, and spatial perception. However, three limitations remain evident in relation to historic parks. First, many classical theories were developed in broader natural or urban environmental contexts and do not explicitly address the perceptual role of historically embedded cultural landscape elements. Second, existing empirical studies often examine natural elements, architectural features, or spatial form separately, but pay less attention to how cultural and natural elements interact within historically significant park environments. Third, different methods such as cognitive mapping, eye tracking, computational image analysis, and spatial behavioral data are often used independently, leaving insufficient understanding of how these different forms of evidence can complement one another in the interpretation of visual attention. Accordingly, this study positions historic parks as a distinct landscape context and adopts a multi-method approach to examine how cultural landscape elements, natural landscape elements, and their spatial combinations jointly shape attention distribution.
3. Methods
3.1. Research Areas
The primary goal of this study is to explore how Cultural Landscape Elements (CLE) and Natural Landscape Elements (NLE) are associated with visual attention in historic park settings. To maintain typological comparability while focusing on historically layered environments, we selected three well-known historic parks in Beijing as case studies: Taoranting Park in Xicheng District, the Summer Palace (Yiheyuan) in Haidian District, and Beihai Park in Xicheng District.
These three sites share several relevant characteristics: each contains historically significant architectural or structural features, each exhibits a close spatial integration of buildings, corridors, bridges, water bodies, and vegetation, and each represents a mature example of Chinese historic park composition in which cultural and natural elements are deeply intertwined. This controlled site selection was intended to support comparison within a relatively coherent historic-park typology rather than to represent all possible park types. Accordingly, the findings of this study should not be generalised directly to other historic landscape traditions such as Islamic gardens, European Baroque parks, Japanese stroll gardens, or colonial botanical gardens.
Within the three selected parks, the landscape nodes examined in this study are organised around historically significant buildings or structures and include both CLE (e.g., pavilions, buildings, corridors, and bridges) and NLE (e.g., water bodies and vegetation). Figure 1 presents the hierarchical location of the study areas from the national scale to the site scale.
Figure 1.
Hierarchical location map of the study areas from the national to site scale: China, Beijing, Summer Palace, Taoranting Park, and Beihai Park.
3.2. Multi-Method Research Framework and Data Collection
This study adopts a four-part methodological framework consisting of cognitive mapping, eye-tracking experiments, computational vision analysis, and GIS/UGC-based spatial analysis (See Figure 2). These methods are analytically related but conceptually non-equivalent. In this study, the term “visual attention” is used in a narrow sense to refer specifically to overt attention measured by eye-tracking (i.e., fixation-based gaze behaviour). The other methods are treated as attention-related but non-equivalent proxies, capturing memory impressions, image-based salience cues, and spatial behavioural engagement, respectively. By combining these four approaches, the study seeks to compare convergent and divergent patterns across perceptual, image-based, and spatial scales. These four methods were used as complementary rather than interchangeable approaches to capture memory impressions, fixation-based attention, image-based salience cues, and zone-level spatial engagement.
Figure 2.
Research framework and multi-evidence study design.
Cognitive mapping. Cognitive mapping, widely used in environmental psychology and landscape studies, was employed to capture participants’ spatial memory representations. Drawing on Lynch’s The Image of the City [41], this method was used to identify the areas and elements that left strong impressions on participants after site experience. In this study, the cognitive mapping task was conducted through a structured base-map annotation procedure rather than freehand sketching. Participants were recruited on site from visitors in the three historic parks, with 10 visitors included from each park. After visiting the target area, participants were provided with pre-prepared base maps showing the main natural and cultural landscape elements and were asked to mark and label the areas or elements that had left a strong impression on them. The frequency with which specific areas were marked was then used as an indicator of memorability and perceived importance. This sample was intended to provide an exploratory representation of visitor impressions rather than a statistically representative sample of the full visitor population.
CLE/NLE classification. For the purposes of analysis, landscape areas and elements were classified as either Cultural Landscape Elements (CLE) or Natural Landscape Elements (NLE) according to predefined criteria. CLE referred to historically or culturally embedded built features, such as pavilions, buildings, corridors, bridges, and other architectural or constructed elements with clear cultural significance. NLE referred primarily to natural features such as water bodies and vegetation. In the cognitive mapping analysis, marked areas were classified according to the dominant element type within the area and, where relevant, according to participants’ verbal explanations of what made the area memorable. Ambiguous cases were discussed jointly by the research team and assigned according to the dominant spatial and historical role of the element in the specific scene.
Eye-tracking experiments. Eye-tracking was used to examine fixation-based overt visual attention under controlled viewing conditions [44]. In this study, we employed the German SMI RED5 (SensoMotoric Instruments GmbH, Teltow, Germany) eye-tracking system with a sampling rate of 500 Hz. Participants were recruited at Tsinghua University based on availability and their ability to complete the laboratory-based viewing task under controlled conditions [45,46]. Most participants were drawn from students and staff in design-related contexts, while a smaller number were recruited from the affiliated high school. Participants were recruited from design students at Tsinghua University based on availability and their ability to complete the laboratory-based viewing task under controlled conditions [45,46]. 30 valid participants were retained in the final participant-level statistical analysis after data screening and completeness checks (see Table 1). This relatively homogeneous group was selected to improve procedural consistency during stimulus presentation and data collection rather than to represent the full demographic diversity of park visitors. Because most participants had design-related educational or professional backgrounds, while a smaller number did not, the sample remained skewed toward visually trained observers and should not be treated as representative of the broader visitor population. Because the participants were visually trained design students, their gaze behaviour may differ systematically from that of the broader public. Accordingly, the eye-tracking results are interpreted as exploratory evidence from a specific participant group rather than as directly generalisable estimates of visitor attention patterns. Heatmaps and scanpath data were generated using BeGaze(3.6.52)(SensoMotoric Instruments GmbH, Teltow, Germany) software.
Table 1.
Basic demographic information of the eye-tracking participants.
Computational vision analysis. In addition to manual analysis of the eye-tracking heatmaps and scanpaths, we employed the Transformer-based semantic segmentation model Segmenter to extract pixel-level semantic features and internal attention-weight distributions from scene images [19]. These outputs were not treated as direct measures of human visual attention. Instead, they were retained as a supplementary exploratory image-based analysis used to compare image salience patterns with eye-tracking results and to provide an auxiliary analytical perspective on visually prominent scene regions.
GIS/UGC-based spatial analysis. This method builds on the concept of spatial syntax theory, particularly the work of Bill Hillier and Julienne Hanson [47], who demonstrated how the configuration of space influences human movement and interaction. By mapping Points of Interest (POI) data, we examined how spatial configurations and the arrangement of landscape elements impact human behavior in these parks, complementing the findings from the cognitive mapping and eye-tracking experiments. To complement the perceptual analyses, we used geotagged user-generated content (UGC) to examine the spatial distribution of visitor photographic activity within the three parks [45]. These data were obtained from the “6footprint” application and consisted of user-uploaded trajectory records and geotagged photographs. After import into ArcGIS (10.8.2) (Esri, Redlands, CA, USA), the spatial distribution of photographic activity was visualised using kernel density analysis, and the resulting heatmaps were classified into eight density levels using the natural breaks method. This layer was interpreted as a proxy for spatial behavioural engagement at the zone level rather than as a direct measure of object-level visual attention.
Ethics and consent. Participation in the cognitive mapping and eye-tracking components was voluntary, and informed consent was obtained from all participants before data collection. The study did not collect sensitive personal information beyond basic demographic characteristics used for descriptive reporting. The geotagged UGC data obtained from the “6footprint” platform were analysed only in aggregated and anonymised form for spatial pattern analysis.
3.3. Statistical Analysis
For the cognitive mapping task, the frequencies of CLE-dominant and NLE-dominant marked areas were compared using exact binomial tests against an equal expected distribution. We additionally report the observed CLE proportions together with 95% confidence intervals. Because each participant could mark more than one area, the marked-area observations were not fully independent; therefore, this inferential analysis was used as an approximate statistical supplement to an otherwise exploratory comparison.
For the eye-tracking analysis, each landscape element within each scene was classified into one of four AFT-based categories derived from heatmap interpretation: AFT ≥ 1.2, 0.3 ≤ AFT < 1.2, 0 ≤ AFT < 0.3, or element not present in the image. These categories were converted into ordinal attention scores of 2, 1, and 0, respectively, while elements not present in the image were treated as missing values rather than zeros. For each participant and scene, mean CLE and NLE attention scores were calculated by averaging the coded values of the corresponding landscape elements present in that image. Participant-level CLE and NLE scores were then obtained by averaging across all scenes, and park-specific participant-level scores were additionally calculated by averaging across scenes within each park. Because the resulting data were ordinal and the final valid sample size was limited (n = 30), CLE and NLE scores were compared using Wilcoxon signed-rank tests. Park-specific p-values were adjusted for multiple comparisons using the Holm method. The exact binomial test was used for the two-category frequency comparison, whereas the Wilcoxon signed-rank test was used because the participant-level CLE and NLE scores were paired and ordinal.
Throughout the study, inferential statistics were used to provide approximate statistical support for patterns observed in a limited and non-representative sample. These tests do not eliminate the sampling limitations of the study; accordingly, statistically significant results are interpreted as exploratory rather than confirmatory evidence.
No a priori power analysis was conducted before data collection. To clarify the implications of the present sample size, we added a sensitivity power analysis. Under a paired-comparison framework, a sample size of 30 participants provides 80% power at α = 0.05 only for medium-to-large within-participant effects of approximately Cohen’s dz = 0.53 or larger. For park-specific comparisons involving multiple testing correction, the detectable effect size would be larger. Therefore, the present design should be considered exploratory and not sufficiently powered for confirmatory park-specific inference. In addition, no per-stimulus reliability analysis was conducted because the photographic stimuli were heterogeneous and were not designed as a balanced psychometric stimulus set.
4. Analysis
In this study, the landscape elements analysed in relation to visual attention were classified into two broad categories: Natural Landscape Elements (NLE) and Cultural Landscape Elements (CLE). NLE included (1) vegetation and (2) water bodies, while CLE included (3) buildings, (4) paths, corridors, and bridges, (5) boundaries and barriers, and (6) decorations and details. Other landscape elements were not included in the present analysis.
4.1. Cognitive Maps
The cognitive mapping task was conducted with 10 visitors in each of the three historic parks, yielding 30 valid cognitive maps and 94 marked areas that participants described as leaving strong impressions. These marked areas were classified into two categories according to whether Cultural Landscape Elements (CLE) or Natural Landscape Elements (NLE) were dominant.
The classification of marked areas was based on two qualitative criteria: (1) whether historical buildings or structures occupied the spatial core of the area, and (2) whether historical or cultural characteristics were explicitly mentioned by participants during follow-up interviews as a reason for their strong impression. For example, the “Chuitai Pavilion” area in Taoranting Park was classified as CLE-dominant because the pavilion occupied the spatial core and participants specifically referred to its architectural character. By contrast, the boat dock area was classified as NLE-dominant because participants mainly emphasized the aesthetic appeal of the expansive water surface.
Across the 30 cognitive maps, participants marked a total of 94 impression areas, including 87 CLE-dominant areas and 7 NLE-dominant areas. CLE-dominant areas accounted for 92.6% of all marked areas. An exact binomial test indicated that the proportion of CLE-dominant marked areas was significantly higher than an equal CLE–NLE distribution (p < 0.001, 95% CI: 0.865–1.000). Under the null hypothesis of an equal CLE–NLE distribution ( = 0.5), the one-sided exact binomial was calculated as:
where is the total number of marked areas, is the observed number of CLE-dominant marked areas, and = 0.5 is the null probability under an equal CLE–NLE distribution. Similar patterns were observed in all three parks: Taoranting Park, 82.6% (19/23), = 0.0013; the Summer Palace, 93.5% (29/31), < 0.001; and Beihai Park, 97.5% (39/40), < 0.001 (See Table 2). Since individual participants could mark more than one area, these marked-area observations were not fully independent. Accordingly, the statistical results are interpreted as approximate inferential support for an exploratory pattern rather than as a basis for population-level generalisation.
Table 2.
Exact binomial test results for CLE-dominant marked areas in the cognitive mapping task.
This pattern is broadly consistent with the proposition that historically embedded cultural features may be especially memorable in historic park settings. In the context of cultural landscape theory, architectural features and historically significant structures may attract attention not only because of their formal appearance, but also because of the symbolic and cultural meanings associated with them.
4.2. Eye-Tracking Experiments
The eye-tracking experiment was conducted with design students from Tsinghua University in a controlled laboratory setting. 30 valid participants were retained in the final participant-level statistical analysis after data screening and completeness checks. Participants viewed photographic scenes from the three historic parks, and heatmaps were generated for each participant-scene trial. Using eye-tracking experiments, we obtained 1080 eye-tracking heatmaps; these heatmaps were generated across the 36 scenes (one heatmap per participant per scene), whereas “900 sets of eye-tracking data” in the Abstract refers to the number of valid gaze recordings/trials after data-quality screening. Previous studies, such as Yarbus [46], have demonstrated that the task at hand and the observer’s expertise significantly influence gaze behavior, with experts tending to focus on different elements than non-experts. Based on the Average Fixation Time (AFT) represented in the heatmaps, each landscape element in each image was classified into four categories: (1) AFT ≥ 1.2, indicating that the element received attention and was considered important; (2) 0.3 ≤ AFT < 1.2, indicating that the element received attention but was considered less important; (3) 0 ≤ AFT < 0.3, indicating that the element received little or no attention; and (4) element not present in the image.
For quantitative analysis, these categories were coded as ordinal attention scores of 2, 1, and 0, respectively, while elements not present in the image were treated as missing values. Formally, the coded score for participant , scene , and landscape element was defined as:
This coding strategy was adopted to provide a unified basis for comparing CLE and NLE across heterogeneous scenes. For each participant and scene, mean CLE and NLE attention scores were calculated by averaging the coded values of the corresponding elements present in that image:
where and denote the sets of CLE and NLE present in scene for participant , and and denote the corresponding numbers of elements. These scene-level scores were then aggregated to the participant level for overall and park-specific comparisons:
where denotes the number of valid scenes for participant .
At the pooled participant level, the mean CLE attention score (0.908) was higher than the mean NLE attention score (0.806). A Wilcoxon signed-rank test showed that this difference was statistically significant (W = 3.0, p < 0.001, r = 0.851), suggesting that CLE received stronger attention overall in the aggregated set of scenes. However, this pattern was not uniform across parks. In Taoranting Park, the mean NLE score (0.939) was higher than the mean CLE score (0.851), and the difference reached nominal significance before multiple-comparison correction (W = 49.0, p = 0.037, r = 0.467), although it was no longer significant after Holm adjustment. In the Summer Palace, the mean NLE score (0.921) also exceeded the mean CLE score (0.842), but the difference was not statistically significant (W = 63.0, p = 0.117, r = 0.351). By contrast, Beihai Park showed a strong reversed pattern, with CLE (mean = 1.078) scoring substantially higher than NLE (mean = 0.466), and this difference remained significant after Holm correction (W = 0.0, p < 0.001, adjusted p < 0.001, r = 0.877) (see Table 3).
Table 3.
Participant-level Wilcoxon signed-rank test results for CLE and NLE attention scores.
Taken together, these results indicate that the relative visual salience of CLE and NLE is context-dependent rather than stable across all historic parks. However, because the park-specific tests were conducted within a limited exploratory sample and across heterogeneous stimuli, the non-significant result in the Summer Palace and the reversed pattern in Taoranting Park should be interpreted cautiously and not as definitive evidence against a CLE advantage in those parks. The pooled CLE advantage appears to be driven primarily by Beihai Park, whereas Taoranting Park and the Summer Palace show either the opposite pattern or no reliable CLE advantage.
The coefficients of variation reported in Table 4 indicate that some landscape-element categories show substantial cross-site heterogeneity. In particular, the relatively high variability observed for vegetation, paths/corridors/bridges, and decorations/details suggests that pooled averages across the three parks should be interpreted with caution. Moreover, cultural and natural landscape elements influence each other. For example, in the analysis of the eye-tracking heatmap for Taoranting Park, we found that the expansive view created by large bodies of water helped direct the participants’ attention toward buildings (see Figure 3). In the Summer Palace, most of the plants that drew attention were flowering species, which were often planted in coordination with decorations and details. Their interaction enhanced the overall visual appeal and attention. In Beihai Park, the color contrast between decorations and details and green vegetation made the architectural features more visually prominent (see Figure 3).
Table 4.
Statistics of AFT of landscape elements.
Figure 3.
Eye-tracking heatmaps for representative scenes in three historic parks. (The colored overlay represents the normalized attention intensity, where warmer colors indicate higher attention intensity and cooler colors indicate lower attention intensity. Red regions correspond to the most visually concentrated areas.)
Heatmaps visualize the spatial distribution of gaze allocation during photograph viewing. Colour intensity represents fixation-based attention level (derived from the eye-tracking records; warmer colours indicate higher values, see legend). The three panels correspond to representative scenes from Taoranting Park (left), the Summer Palace (middle), and Beihai Park (right). These heatmaps are used to support element-level comparisons based on fixation metrics reported in Section 4.2.
To further interpret the interaction between cultural and natural landscape elements during scene viewing, we conducted a qualitative analysis of representative scanpaths from the three parks (See Figure 4). These scanpaths suggest that gaze did not remain fixed on a single element category. Instead, after an initial fixation on a visually prominent feature, attention often shifted between cultural and natural elements within the same scene. In some cases, architectural structures served as early fixation anchors, while water bodies, vegetation, or surrounding details subsequently attracted shorter or secondary fixations. These scanpath patterns should be interpreted as qualitative illustrations of gaze dynamics under controlled photograph-viewing conditions, rather than as stable or universal sequences of visual attention.
Figure 4.
Scanpath maps from the eye-tracking experiment. (The circles indicate fixation points, with larger circles representing longer fixation durations. The connecting lines indicate gaze transition paths between fixation points. Different colors are used to distinguish different gaze records or participants).
Because participants viewed static photographs under controlled conditions, the eye-tracking results are also potentially affected by center bias, a well-documented tendency [48] for fixations to cluster near the centre of images. This limitation is taken into account when interpreting the relative salience of centrally positioned architectural features versus more peripheral natural elements.
Each panel shows scanpaths for a representative scene from Taoranting Park (left), the Summer Palace (middle), and Beihai Park (right). Circles (nodes) indicate fixation locations, with circle size proportional to fixation duration (dwell time). Lines represent saccadic transitions between consecutive fixations, depicting the viewing sequence across the image (arrow direction, if shown, indicates the temporal order of gaze shifts). The colour gradient (see legend) encodes the temporal order of fixations from early to late viewing stages. The background image corresponds to the stimulus photograph presented to participants. Scanpaths provide qualitative visualization of gaze dynamics and are interpreted together with the quantitative fixation metrics reported in Section 4.2.
4.3. Deep Learning-Based Semantic Feature and Attention Weight Analysis
Positioning and scope. The deep-learning component in this study is presented as a supplementary exploratory computational analysis rather than a validated visual-saliency or attention-prediction model. The adopted model is not designed to predict fixation distributions, and its outputs are not validated against the eye-tracking ground truth in this work. Accordingly, the results from this section should be interpreted as model-derived feature weighting cues, used only to provide an auxiliary perspective alongside the primary empirical evidence (cognitive mapping, eye tracking, and GIS/UGC analysis).
Deep Learning-based Visual Attention Analysis: The use of the Transformer-based Segmenter model is informed by recent advances in computational vision, particularly the “Attention Is All You Need” framework proposed by Vaswani et al. [49]. We applied this method as a complementary tool to explore the saliency of landscape features. Moreover, internal attention-weight visualizations were generated from the Transformer architecture. It should be clarified that these internal attention weight visualizations represent computational feature weighting mechanisms within the model and do not directly correspond to human gaze behavior. By examining the generated heatmaps, we found that the Segmenter model tended to assign higher internal attention weights in the images with vivid colors and strong contrasts—for example, the red pillars of the Taoran Archway in Taoranting Park, the yellow plant reflections on the water surface near Zhexian Pavilion, and the sunlit plants in the front courtyard of Leshou Hall in the Summer Palace.
It is important to clarify that visual saliency modelling and semantic segmentation represent two fundamentally different computational paradigms. Saliency prediction models are explicitly designed and validated to estimate human fixation distributions [48,50]. In contrast, semantic segmentation models such as Segmenter are developed for pixel-wise classification and feature representation. The internal attention mechanisms in Transformer architectures reflect computational feature weighting optimized for segmentation tasks and should not be interpreted as direct predictors of human gaze behavior.
This result was also supported by our eye-tracking experiments, where vividly colored elements such as architectural decorations and flowering plants received longer fixation durations. It should be noted that in eye-tracking experiments, participants observe photographs taken from a fixed perspective, and their attention tends to focus on the central area of the image. This differs from the actual process of landscape perception. However, the use of the model provides a complementary computational perspective on image feature saliency, which can be compared with—but not equated to—eye-tracking results.
In several scenes, the Segmenter model assigned relatively high internal attention weights to regions with vivid colour contrast or strong local feature contrast, such as red architectural components, bright floral reflections, or sunlit vegetation. Some of these regions overlapped with areas that also attracted longer fixations in the eye-tracking analysis. However, other culturally significant architectural structures and details that received prolonged human attention were not equally emphasised by the model. This discrepancy reinforces the methodological distinction between model-derived feature weighting and human perceptual attention. This discrepancy may reflect several factors rather than parameter settings alone, including the mismatch between semantic segmentation and fixation prediction, the absence of validation against eye-tracking ground truth in the present study, and possible domain gaps between the model’s training data and the historic-park images analysed here. For this reason, the deep-learning results are interpreted only as supplementary exploratory feature-weighting cues rather than as direct predictors of human visual attention. Accordingly, the results of this section are used only as an auxiliary exploratory comparison rather than as evidence for fixation prediction.
4.4. GIS/UGC-Based Photo-Density Analysis
Using GIS big data analysis, we utilized Python (3.13.13) (Python Software Foundation, Wilmington, DE, USA)’s requests library to crawl photo data with location information from the “6footprint” website. Specifically, we obtained 179,428 location-tagged photos related to Taoranting Park, 622,907 photos related to the Summer Palace, and 45,753 photos related to Beihai Park. To ensure data quality, a rigorous pre-processing procedure was conducted on the 847,088 collected photographs. First, duplicate uploads, time-stamping errors, and samples with GPS coordinates outside the park boundaries were removed using Python scripts. Second, non-landscape images (e.g., close-up portraits, indoor commercial advertisements) were filtered out to focus on environmental visual elements. It should be noted that due to the inherent imbalance in the seasonal distribution of UGC data (with significantly higher sample sizes in spring and summer), a systematic seasonal normalization was not applied in this study. Instead, the analysis focuses on identifying general spatial patterns of visitor photographic engagement rather than object-level visual attention. The finalized dataset was then imported into ArcGIS to generate nuclear density heatmaps, reflecting the intensity of visitors’ spatial engagement. These datasets were transformed into photo-density heatmaps and categorized into nine levels from high to low density. (see Figure 5).
Figure 5.
GIS/UGC-based photo-density heatmaps indicating zone-level engagement intensity.
Photo-density heatmaps were generated from geotagged user-generated photographs to represent spatial engagement intensity at the area scale. Colour intensity indicates the number of photographs per unit area (warmer colours indicate higher density; see legend). Panels correspond to Taoranting Park (left), the Summer Palace (middle), and Beihai Park (right). This analysis is intended to identify broader spatial patterns of engagement rather than object-level visual attention. The act of taking photographs may, to some extent, indicate that an area has attracted visitor interest or visual engagement, indicating that the spatial organization of landscape elements in that area has successfully captured people’s visual focus. In our research, we quantify the attention-drawing capacity of a given space by calculating the number of photographs taken per unit area.
While photographic activity may serve as an indirect indicator of visual attention, the correlation is complex and may be influenced by the aforementioned factors. First, photographic behavior is influenced by accessibility, social practices, and platform-specific conventions, rather than visual attraction alone. The data source used in this study, the Liuzhiqiao application, likely reflects a demographically skewed user group (predominantly younger, urban, and smartphone-literate users), which may affect the spatial distribution of photographs. In addition, social norms, aesthetic trends, and peer imitation on social media platforms may further mediate decisions about where and what to photograph. Seasonal variations can also make a difference.
In Taoranting Park, the primary cultural landscape elements—pavilions—are distributed in a scattered pattern throughout the park. According to the generated photo density heatmap, areas with higher levels of visual attention exhibit a clear pattern of distribution along the lake. This finding is consistent with our eye-tracking experiment results, which showed that large water bodies enhance the visual prominence of architectural elements. By analyzing the spatial distribution of photo density across different seasons, we also observed a strong correlation between the distribution of visual attention and that of flowering plants. In spring, the northwestern and northeastern zones, where peonies, crabapples, and Chinese flowering peaches are concentrated, showed the highest attention levels. In summer, the southwestern lakeside area, densely planted with lotuses, was most prominent. However, in autumn and winter, when there are fewer flowering plants, this pattern becomes less evident. The seasonal comparisons presented here aim to illustrate how landscape characteristics potentially influence visual attention across seasons, rather than to normalize photographic activity statistically across seasonal datasets.Furthermore, photographic activity in landscape environments may vary across seasons due to vegetation phenology, weather conditions, and tourism patterns. Because the dataset spans multiple years and seasons, the GIS analysis relies on aggregated multi-season photo-density patterns to identify relatively stable spatial engagement tendencies rather than seasonal variations in photographic behavior.
To further explore how different landscape elements and their spatial configurations influence attention distribution, we abstracted the spatial arrangements of three notable zones in Taoranting Park (see Figure 6): Huxin Pavilion (Figure 6a), which is situated in one of the areas with the highest attention density; Yixin Pavilion (Figure 6b), which also demonstrates a relatively high level of attention; and the Garden of Famous Chinese Pavilions (Figure 6c), which shows relatively low attention. A comparative analysis of the spatial organization of these areas, combined with field photographs, reveals the following:
Figure 6.
Abstracted landscape-element configurations in Taoranting Park for pattern interpretation (a) Huxin Pavilion; (b) Yixin Pavilion; (c) Chinese Famous Pavilion Garden.
- The number of cultural landscape elements in a given area does not directly determine the distribution of visual attention; it is the harmonious integration of natural elements such as water bodies and vegetation that attracts more attention.
- For independently located pavilions—key cultural landscape features—the presence of water in the foreground and green vegetation in the background significantly enhances their ability to draw attention.
- Flowering plants play a critical role in attracting visual attention and further enhance visitor interest and engagement in the corresponding areas.
Three representative zones are abstracted to summarize how cultural and natural elements co-occur in spaces with different engagement/attention characteristics: (Figure 6a) Huxin Pavilion, a high-density zone; (Figure 6b) Yixin Pavilion, a relatively high-density zone; and (Figure 6c) the Garden of Famous Chinese Pavilions, a relatively low-density zone. Diagrams simplify the spatial composition of key cultural elements (e.g., pavilions/buildings) and natural elements (e.g., water bodies, vegetation, flowering plants) to support comparative interpretation alongside the GIS/UGC heatmaps (Figure 5) and eye-tracking evidence (Figure 3 and Figure 4).
In the Summer Palace, the photo density heatmap reveals that areas attracting higher levels of visual attention are concentrated around major architectural complexes. A comparison of seasonal photo density maps further shows a strong correlation between attention distribution and the presence of flowering or vividly colored plants. For example, Dehe Garden experiences high attention in spring due to the blooming of crabapple and magnolia trees within its courtyards. Along the western embankment, peach blossoms line the banks, making this area significantly more attractive in spring than in other seasons. In summer, the northern section of the eastern embankment features large patches of lotus flowers, becoming one of the park’s most visually compelling attractions. During autumn, the ginkgo and Chinese smoketree around the Zhi Chun Pavilion create a golden landscape, while the abundance of chrysanthemums planted in and around the Leshou Hall draws significant attention. In winter, the fragrance and presence of wintersweet flowers in Suzhou Street enhance the area’s visual appeal.
Similar to our approach in Taoranting Park, we selected three representative areas in the Summer Palace to abstract the spatial organization of landscape elements and further summarize the patterns that influence attention distribution (see Figure 7). Due to the large scale of buildings in the Summer Palace, we found that the locations where photographs are taken do not always coincide precisely with the locations of the attention-attracting landscape elements. This phenomenon is indicated by arrows in the diagram.
Figure 7.
Abstracted landscape-element configurations in the Summer Palace and cross-scale interpretation notes (a) Seventeen-Arch Bridge; (b) Foxiangge; (c) Deheyuan. (The arrows in the images indicate the direction of the line of sight).
The three selected areas—the Seventeen-Arch Bridge, the Tower of Buddhist Incense (Foxiang Pavilion), and Dehe Garden—are among the highest-density zones on the heatmap. Our analysis of their landscape element configurations yielded the following insights:
- For individually placed cultural landscape elements, such as the Seventeen-Arch Bridge situated over water (Figure 7a) and the Tower of Buddhist Incense located on a hillside (Figure 7b), the presence of a water foreground or a green vegetative background enhances the visual appeal and draws more attention. Seasonal variations, in this case, also play a role by altering the appearance of the vegetation.
- For architectural clusters like Dehe Garden and its surrounding buildings (Figure 7c), the significance of large-scale water bodies or green backgrounds diminishes. At this scale, potted plants and flower arrangements are more effective in complementing architectural details and decorations to attract visual attention.
- While water bodies, terrain, and vegetation can visually enhance standalone buildings, they may simultaneously reduce accessibility. This trade-off must be carefully considered in design. For instance, although the Tower of Buddhist Incense is rich in architectural detail and cultural meaning, its limited accessibility results in lower attention density compared to areas at the foot of the hill.
Three representative zones are summarized to highlight element configurations in areas with high photo-density: (Figure 7a) Seventeen-Arch Bridge, (Figure 7b) the Tower of Buddhist Incense (Foxiang Pavilion), and (Figure 7c) Dehe Garden. Diagrams show the co-presence of cultural elements (architectural structures) with natural elements (water bodies, vegetation, flowering plants) in different spatial settings. Arrows indicate that photo-taking locations may not align precisely with the visually attended objects, particularly in large-scale architectural settings. Therefore, the GIS/UGC photo-density analysis reflects zone-level engagement patterns, rather than attributing attention to individual landscape elements. This analysis is not intended to infer object-level visual attention, but rather to identify broader spatial patterns of relative attention density at the area scale.
In Beihai Park, we observed similar patterns to those found in Taoranting Park and the Summer Palace: the spatial combination of natural landscape elements (such as greenery and water bodies) with cultural elements significantly influences visual attention. In addition, we discovered the following:
- A comparison between the spatial configurations of Jingxinzhai (Figure 8a) and the Five-Dragon Pavilions (Figure 8b) reveals that, despite the Five-Dragon Pavilions being surrounded by a large water body, the smaller water area around Jingxinzhai proved more effective in attracting visual attention and thus achieved a higher level of heatmap intensity. This can be attributed to the more intricate shoreline of the smaller water body, which offers visitors a richer variety of viewing and photography angles. Compared to the sheer size of a water body, it is the complexity of its edge or boundary that plays a more crucial role in capturing visual attention.Figure 8. Landscape element patterns in Beihai park (a) Jingxinzhai; (b) Five Dragon Pavilions; (c) White Tower. (The arrows in the image indicate the direction of the line of sight).
In light of the limitations mentioned previously, the GIS-based photo-density analysis is not treated as a direct measure of human visual attention, but as a complementary, large-scale spatial indicator that contextualizes and extends the findings derived from cognitive maps and eye-tracking experiments. All spatial inferences drawn from the GIS data are therefore explicitly bounded to comparative and pattern-oriented interpretations, rather than causal or perceptual claims at the individual level. There are inherent limitations of using social media data as a proxy for visual attention and other behavioral or perceptual measures.
5. Discussion
This study explored how Cultural Landscape Elements (CLE) and Natural Landscape Elements (NLE) are associated with attention-related patterns in three historic parks in Beijing by integrating cognitive mapping, eye-tracking experiments, computational vision analysis, and GIS/UGC-based photo-density analysis. Taken together, the results suggest that historically embedded cultural features may be especially memorable in historic park settings, but their relative visual salience during scene viewing is not uniform across all sites and should be understood as context-dependent rather than universal.
The cognitive mapping results showed that CLE-dominant areas were much more frequently associated with strong memory impressions than NLE-dominant areas. This pattern is consistent with the idea that historically significant built features in historic parks carry symbolic and mnemonic weight that extends beyond their formal visual appearance. In this sense, the findings align with cultural landscape theory, which emphasises that culturally inscribed landscape features are not perceived merely as objects in space, but also as carriers of historical meaning and collective memory.
However, the eye-tracking results reveal a more differentiated picture. In the pooled participant-level analysis, CLE showed higher attention scores overall, but this contrast was not stable across all three parks. Only Beihai Park exhibited a robust CLE advantage after multiple-comparison adjustment, whereas Taoranting Park and the Summer Palace showed either the opposite pattern or no reliable CLE advantage. This suggests that visual attention in historic parks is shaped not only by the presence of cultural elements themselves, but also by scene composition, spatial arrangement, colour contrast, and the interaction between cultural and natural features within particular views. The divergence across the three parks can be interpreted more specifically through existing theories of restorative landscape perception and spatial preference.
A more theory-oriented interpretation of this divergence can be developed by drawing on Attention Restoration Theory and prospect-refuge theory, both of which are relevant to landscape perception but operate differently from historically embedded symbolic attraction. In Taoranting Park and the Summer Palace, many of the scenes associated with higher NLE scores involved expansive water surfaces, vegetation, flowering plants, and visually open settings. From the perspective of Attention Restoration Theory, such natural features may support soft fascination and perceptual ease, thereby drawing sustained gaze even when they do not carry the same symbolic weight as cultural structures. Prospect-refuge theory offers a related explanation: open water views, foreground–background layering, and vegetative framing may increase visual prospect while maintaining a sense of enclosure or refuge, making these scenes especially attractive under static photograph-viewing conditions. By contrast, the strong CLE advantage observed in Beihai Park may reflect a different compositional logic, in which architectural features were more visually central, more strongly contrasted against surrounding vegetation, and more tightly integrated with historically meaningful spatial focal points. In this sense, the divergence across the three parks suggests that attention in historic parks is shaped by the interaction between restorative natural-scene properties, prospect-refuge structure, and culturally embedded symbolic salience, rather than by any single factor in isolation.
This suggests that visual attention in historic parks is shaped not only by the presence of cultural elements themselves, but also by scene composition, spatial arrangement, colour contrast, and the interaction between cultural and natural features within particular views. Rather than treating CLE and NLE as competing in a simple binary opposition, the results indicate that they often work together in directing attention.
The computational and GIS/UGC-based analyses further support this interpretation, although they should be understood within their own methodological limits. The deep-learning component was retained only as a supplementary exploratory image-based analysis and was not treated as a model of human visual attention. Its partial overlap with eye-tracking results suggests that some image-based salience cues—such as colour contrast or local visual prominence—may coincide with fixation patterns, but discrepancies between the two approaches underscore the distinction between model-derived feature weighting and human perceptual attention. Similarly, the GIS/UGC-based photo-density analysis reflects zone-level visitor photographic engagement rather than object-level visual attention. Even so, it suggests that areas with high photographic engagement tend to emerge where cultural and natural elements are spatially coupled in visually rich and accessible configurations.
A further implication of this study concerns methodological integration. The four methods employed here do not measure a single unified construct. Eye-tracking captures momentary fixation-based overt attention under controlled viewing conditions; cognitive mapping reflects memory-based impressions after site experience; computational vision analysis identifies image-based feature weighting; and GIS/UGC density reflects visitor photographic engagement influenced by accessibility, movement, and social behaviour. For this reason, the value of the multi-method framework lies not in forcing these measures into a single variable, but in using them as complementary lines of evidence. Partial convergence across methods strengthens confidence in recurring patterns, whereas divergence helps reveal the complexity of attention and behaviour in historically layered environments.
These interpretations should be understood in light of the study’s methodological and sampling limitations, which are discussed in Section 6.
6. Conclusions, Limitations, and Future Development
This study examined how Cultural Landscape Elements (CLE) and Natural Landscape Elements (NLE) are associated with attention-related patterns in three historic parks in Beijing through an exploratory multi-method framework integrating cognitive mapping, eye-tracking, computational vision analysis, and GIS/UGC-based spatial analysis.
Three main conclusions can be drawn. First, in the cognitive mapping component, CLE-dominant areas were much more frequently associated with strong memory impressions than NLE-dominant areas, suggesting that historically embedded cultural features may have particular mnemonic salience in historic park settings. Second, in the pooled eye-tracking analysis, CLE showed higher attention scores overall, but this contrast was not consistent across all three parks. The relative salience of CLE and NLE varied by site, indicating that visual attention in historic parks is shaped by scene composition and by the interaction between cultural and natural elements rather than by the simple presence of one category alone. Third, the GIS/UGC-based photo-density analysis suggests that zones with high visitor photographic engagement tend to occur where cultural and natural elements are spatially combined in visually rich and accessible configurations.
Taken together, these findings suggest that the perceptual significance of historic parks does not lie solely in their cultural structures or solely in their natural scenery, but in the spatial and visual coupling of the two. Rather than proposing a universal model of attention in historic parks, this study offers an exploratory and context-sensitive account of how memory, fixation-based viewing, image salience cues, and spatial engagement may align—or diverge—across historically layered landscape environments.
Within the limits of the present sample and methods, the study contributes to landscape visual assessment research in two ways: it extends attention-related analysis into the specific setting of historic parks, and it demonstrates the value of combining perceptual, computational, and spatial approaches in a complementary analytical framework.
Although this study provides an exploratory multi-method account of attention-related patterns in historic parks, several limitations should be acknowledged. First, the GIS/UGC-based analysis is constrained by uneven seasonal representation. The number of geotagged photographs available for autumn and winter was relatively small because of seasonal fluctuations in tourism, and systematic seasonal normalization across the full time dimension was therefore not applied. In addition, photographic activity is shaped not only by visual attraction but also by accessibility, platform user bias, movement patterns, and social conventions of photographing. Accordingly, the GIS/UGC layer should be interpreted as a proxy for zone-level photographic engagement rather than as a direct measure of object-level visual attention.
Second, the participant samples used in the cognitive mapping and eye-tracking components were limited in both size and representativeness. The cognitive mapping task involved only 10 participants per park, and the eye-tracking analysis was based on 30 valid participants recruited at Tsinghua University, most of whom had design-related educational or professional backgrounds. Although this sampling strategy helped maintain procedural consistency under controlled experimental conditions, it limits the external validity of the findings. Visual attention, memory representation, and image interpretation may vary with age, gender, cultural background, educational experience, and professional training, but these factors were not analysed separately in the present study. In addition, because the eye-tracking experiment involved 56 heterogeneous photographic stimuli across three parks, the park-specific statistical comparisons may have been underpowered. Accordingly, the park-specific results for Taoranting Park and the Summer Palace should not be interpreted as definitive evidence against a CLE advantage, but rather as inconclusive findings within a limited exploratory sample. Future studies should determine target sample sizes through a priori power analysis and recruit larger park-specific samples, ideally exceeding the present participant count where site-level inference is intended. In addition, the photograph-based eye-tracking design cannot fully reproduce real-world, multisensory landscape experience and may also be affected by center bias, which could favour centrally positioned architectural focal points over more peripheral natural elements.
Third, A further limitation concerns statistical power and stimulus-level reliability. No a priori power analysis or per-stimulus reliability analysis was conducted before data collection. A sensitivity power analysis indicates that, with 30 participants, the paired comparison could reliably detect only medium-to-large within-participant effects, approximately Cohen’s dz ≥ 0.53 for 80% power at α = 0.05. For park-specific comparisons after multiple-testing adjustment, the detectable effect size would be even larger, approximately dz ≥ 0.62. Therefore, smaller or moderate CLE–NLE differences may not have been reliably detected, especially in the park-specific analyses. In addition, the 56 photographic stimuli varied in composition, element distribution, and spatial structure, and were not designed as a balanced psychometric stimulus set. Accordingly, the non-significant results for Taoranting Park and the Summer Palace should be interpreted as inconclusive under the statistical power and stimulus-reliability constraints of the present exploratory design, rather than as evidence for the absence of a CLE advantage. Future confirmatory studies should conduct an a priori power analysis, recruit larger and more diverse samples, use balanced stimulus sets, and apply item-level reliability analysis or mixed-effects models treating participants and stimuli as random effects.
Fourth, several methodological limitations remain at the level of analytical interpretation. The classification of areas and elements into CLE and NLE involved interpretive judgement, especially in ambiguous cases such as bridges, corridors, and historically embedded spatial structures. This limitation is also relevant to the relatively high coefficients of variation observed for paths/corridors/bridges (CV = 0.842) and decorations/details (CV = 0.721), which were among the most classificatorily ambiguous categories in the analysis. These high cross-site variations may therefore reflect not only genuine spatial heterogeneity, but also the interpretive sensitivity of the CLE/NLE classification in borderline cases. Future studies should incorporate formal double-coding procedures and report inter-rater reliability statistics (e.g., Cohen’s kappa) to strengthen the robustness of category assignment. The deep-learning component was retained only as a supplementary exploratory image-based analysis and was not validated against eye-tracking ground truth; it therefore should not be treated as primary empirical evidence of human attention. More broadly, the four methods used in this study capture different aspects of human–environment interaction and cannot fully simulate dynamic real-world perception when used with static scene materials and limited participant samples.
Future research should expand both data sources and methodological scope. More diverse participant groups and a wider range of historic park typologies are needed to test whether the CLE–NLE patterns observed here remain stable across different cultural and spatial contexts. It would also be valuable to combine mobile eye-tracking, virtual reality, in situ behavioural observation, and richer multimodal datasets to better capture attention under ecologically valid conditions. In addition, long-term and multi-source spatial data could help clarify how seasonal change, time of day, vegetation dynamics, and shifting light conditions influence attention-related patterns in culturally significant landscape environments.
Author Contributions
Conceptualization, Y.S.; T.L.; methodology, Y.S.; software, Y.S.; T.L.; validation, Y.S.; T.L.; X.L.; formal analysis, T.L.; X.L.; investigation, X.H.; resources, Y.S.; data curation, T.L.; writing—original draft preparation, Y.S.; T.L.; writing—review and editing, Y.S.; T.L.; X.L.; visualization, Y.S.; T.L.; supervision, X.H.; project administration, Y.S.; funding acquisition, X.H. All authors have read and agreed to the published version of the manuscript.
Funding
This research was funded by the Zhejiang Provincial Educational Science Planning Project (General Planning Project for Higher Education Institutions) grant number 2025SCG205. The APC was funded by NingboTech University.
Institutional Review Board Statement
The study was conducted in accordance with the Declaration of Helsinki and approved by the Institutional Review Board (or Ethics Committee) of NingboTech University, Design School (protocol code LL20260323 and date of approval (20260323)).
Informed Consent Statement
Informed consent was obtained from all subjects involved in the study.
Data Availability Statement
The original contributions presented in this study are included in the article. Further inquiries can be directed to the corresponding author.
Conflicts of Interest
The authors declare no conflicts of interest.
References
- Asur, F. An Evaluation of Visual Landscape Quality of Coastal Settlements: A Case Study of Coastal Areas in the Van Lake Basin (Turkey). Appl. Ecol. Environ. Res. 2019, 17, 1849–1864. [Google Scholar] [CrossRef] [Scilit]
- Kang, N.; Liu, C. Towards landscape visual quality evaluation: Methodologies, technologies, and recommendations. Ecol. Indic. 2022, 142, 109174. [Google Scholar] [CrossRef] [Scilit]
- Martínez-Harms, M.J.; Quijas, S.; Merenlender, A.M.; Balvanera, P. Enhancing ecosystem services maps combining field and environmental data. Ecosyst. Serv. 2016, 22, 32–40. [Google Scholar] [CrossRef] [Scilit]
- Wang, Z.; Shen, Y.; Ding, L.; Xu, L.; Cheng, X. A management model for tangible and intangible resources in nature reserve. J. Zhejiang For. Coll. 2007, 24, 736–740. [Google Scholar]
- Bacon, W.R. The visual management system of the Forest Service, USDA. In Proceedings of Our National Landscape: A Conference on Applied Techniques for Analysis and Management of the Visual Resource, Incline Village, NV, USA, 23–25 April 1979; General Technical Report PSW-GTR-35; Pacific Southwest Forest and Range Experiment Station, Forest Service, US Department of Agriculture: Berkeley, CA, USA, 1979; pp. 660–665. [Google Scholar]
- Vlami, V.; Zogaris, S.; Djuma, H.; Kokkoris, I.; Kehayias, G.; Dimopoulos, P. A Field Method for Landscape Conservation Surveying: The Landscape Assessment Protocol (LAP). Sustainability 2019, 11, 2019. [Google Scholar] [CrossRef] [Scilit]
- Yanru, H.; Masoudi, M.; Chadala, A.; Olszewska-Guizzo, A. Visual Quality Assessment of Urban Scenes with the Contemplative Landscape Model: Evidence from a Compact City Downtown Core. Remote Sens. 2020, 12, 3517. [Google Scholar] [CrossRef] [Scilit]
- Daniel, T.C.; Boster, R.S. Measuring Landscape Esthetics: The Scenic Beauty Estimation Method; Research Paper RM-167; USDA Forest Service Rocky Mountain Research Station: Fort Collins, CO, USA, 1976. [Google Scholar]
- Echelberger, H. The semantic differential in landscape research. In Proceedings of Our National Landscape: A Conference on Applied Techniques for Analysis and Management of the Visual Resource, Incline Village, NV, USA, 23–25 April 1979; General Technical Report PSW-GTR-35; Pacific Southwest Forest and Range Experiment Station, Forest Service, US Department of Agriculture: Berkeley, CA, USA, 1979; pp. 524–531. [Google Scholar]
- Osgood, C.E. The nature and measurement of meaning. Psychol. Bull. 1952, 49, 197–237. [Google Scholar] [CrossRef] [Scilit]
- Ren, J.Y. Landscape visual evaluation and place attachment in historical and cultural districts: A study based on semantic differential scale and eye tracking experimental methods. Multimed. Syst. 2024, 30, 306. [Google Scholar] [CrossRef] [Scilit]
- Ulrich, R.S. Aesthetic and affective response to natural environment. In Behavior and the Natural Environment; Springer: New York, NY, USA, 1983; pp. 85–125. [Google Scholar]
- Ode, Å.; Fry, G.; Tveit, M.S.; Messager, P.; Miller, D. Indicators of perceived naturalness as drivers of landscape preference. J. Environ. Manag. 2009, 90, 375–383. [Google Scholar] [CrossRef] [Scilit]
- Dupont, L.; Antrop, M.; Van Eetvelde, V. Eye-tracking Analysis in Landscape Perception Research: Influence of Photograph Properties and Landscape Characteristics. Landsc. Res. 2014, 39, 417–432. [Google Scholar] [CrossRef] [Scilit]
- Evans, D.; Chamberlain, B. In Pursuit of Eye Tracking for Visual Landscape Assessments. Land 2024, 13, 1184. [Google Scholar] [CrossRef] [Scilit]
- Crawford, D.W. The experience of landscape. J. Aesthet. Art Crit. 1976, 34, 367–369. [Google Scholar] [CrossRef] [Scilit]
- Kaplan, S. Aesthetics, Affect, and Cognition. Environ. Behav. 1987, 19, 3–32. [Google Scholar] [CrossRef] [Scilit]
- Katz, C. The Experience of Nature—A Psychological Perspective. J. Nerv. Ment. Dis. 1991, 179, 704. [Google Scholar] [CrossRef] [Scilit]
- Tveit, M.; Ode, Å.; Fry, G. Key concepts in a framework for analysing visual landscape character. Landsc. Res. 2006, 31, 229–255. [Google Scholar] [CrossRef] [Scilit]
- Bulut, Z.; Yilmaz, H. Determination of landscape beauties through visual quality assessment method: A case study for Kemaliye (Erzincan/Turkey). Environ. Monit. Assess. 2008, 141, 121–129. [Google Scholar] [CrossRef] [Scilit] [PubMed]
- Kaplan, R.; Kaplan, S. The Experience of Nature: A Psychological Perspective; Cambridge University Press: Cambridge, UK, 1989. [Google Scholar]
- Wei, J.; Yue, W.; Li, M.; Gao, J. Mapping human perception of urban landscape from street-view images: A deep-learning approach. Int. J. Appl. Earth Obs. Geoinf. 2022, 112, 102886. [Google Scholar] [CrossRef] [Scilit]
- Li, Y.; Luo, H.; Sun, S.; Wang, K.; Zhao, Q. Visual Quality Assessment of Rural Landscapes Based on Eye-Tracking Analysis and Subjective Perception. Sustainability 2026, 18, 161. [Google Scholar] [CrossRef] [Scilit]
- Shanghao, M.; Zetian, D.; Yinuo, W. Study on rural landscape design strategies integrating computer vision and deep learning: An analysis based on human perception and visual aesthetics. Sci. Rep. 2025, 15, 35722. [Google Scholar] [CrossRef] [Scilit]
- Palacio Buendia, A.V.; Pérez-Albert, Y.; Serrano Gine, D. Mapping landscape perception: An assessment with public participation geographic information systems and spatial analysis techniques. Land 2021, 10, 632. [Google Scholar] [CrossRef] [Scilit]
- ZHAO, X.; LIN, G. Research on the Perception Evaluation of Urban Green Spaces Using Panoramic Images and Deep Learning: A Case Study of Zhujiang Park in Guangzhou. Landsc. Archit. Front. 2024, 12, 7–18. [Google Scholar]
- Li, C. Deep learning landscape evaluation system integrating poetic emotion and visual features. IEEE Access 2024, 13, 6988–7001. [Google Scholar] [CrossRef] [Scilit]
- Buscombe, D.; Ritchie, A.C. Landscape Classification with Deep Neural Networks. Geosciences 2018, 8, 244. [Google Scholar] [CrossRef] [Scilit]
- Wang, T.; Chen, J.; Liu, L.; Guo, L. A Review: How Deep Learning Technology Impacts the Evaluation of Traditional Village Landscapes. Buildings 2023, 13, 525. [Google Scholar] [CrossRef] [Scilit]
- Shen, Z.; Tang, X. Research on rural landscape preference evaluation using deep learning. In Proceedings of the 2024 5th International Conference on Computer Engineering and Application (ICCEA), Hangzhou, China, 12–14 April 2024; pp. 780–784. [Google Scholar]
- Wu, Z.; Nijhuis, S.; Bracken, G.; Peng, Y.; Lian, J.; Zhang, H. Global multi-level mapping of visual heritage practice: Visual evaluation and management of cultural heritage. Environ. Impact Assess. Rev. 2026, 120, 108404. [Google Scholar] [CrossRef] [Scilit]
- Forczek-Brataniec, U. Assessment of Visual Values as a Tool Supporting the Design Decisions of the Cultural Park Protection Plan. The Case of Kazimierz and Stradom in Kraków. Sustainability 2021, 13, 6990. [Google Scholar] [CrossRef] [Scilit]
- Kou, H.; Zhang, L.; Zhang, S. Visual Impact Assessment Method for Cultural Heritage: West Lake Cultural Landscape in Hangzhou, China. Land 2024, 13, 1596. [Google Scholar] [CrossRef] [Scilit]
- Keleş, E.; Atik, D.; Bayrak, G. Visual landscape quality assessment in historical cultural landscape areas. Eur. J. Sustain. Dev. 2018, 7, 287–300. [Google Scholar] [CrossRef] [Scilit]
- Zhang, X.; Lin, E.S.; Tan, P.Y.; Qi, J.; Waykool, R. Assessment of visual landscape quality of urban green spaces using image-based metrics derived from perceived sensory dimensions. Environ. Impact Assess. Rev. 2023, 102, 107200. [Google Scholar] [CrossRef] [Scilit]
- Xu, X.; Dong, R.; Li, Z.; Jiang, Y.; Genovese, P.V. Research on visual experience evaluation of fortress heritage landscape by integrating SBE–SD method and eye movement analysis. Herit. Sci. 2024, 12, 281. [Google Scholar] [CrossRef] [Scilit]
- Lynch, K. The Image of the City; MIT Press: Cambridge, MA, USA, 1964. [Google Scholar]
- Eilola, S.; Käyhkö, N.; Ferdinands, A.; Fagerholm, N. A bird’s eye view of my village–Developing participatory geospatial methodology for local level land use planning in the Southern Highlands of Tanzania. Landsc. Urban Plan. 2019, 190, 103596. [Google Scholar] [CrossRef] [Scilit]
- Liu, M.; Nijhuis, S. Mapping landscape spaces: Methods for understanding spatial-visual characteristics in landscape design. Environ. Impact Assess. Rev. 2020, 82, 106376. [Google Scholar] [CrossRef] [Scilit]
- Zeng, L.; Li, R.Y.M.; Li, R. Chromaticity analysis on ethnic minority color landscape culture in Tibetan area: A semantic differential approach. Appl. Sci. 2024, 14, 4672. [Google Scholar] [CrossRef] [Scilit]
- Tang, Z.; Zhao, Y. Perception and Evaluation of Cultural Heritage Value in Historic Urban Public Parks Based on Social Media Data: A Case Study of Shanghai. Buildings 2025, 15, 3864. [Google Scholar] [CrossRef] [Scilit]
- Kümmerling, M.; Müller, N. The relationship between landscape design style and the conservation value of parks: A case study of a historical park in Weimar, Germany. Landsc. Urban Plan. 2012, 107, 111–117. [Google Scholar] [CrossRef] [Scilit]
- Thompson, C.W. Historic American Parks and Contemporary Needs. Landsc. J. 1998, 17, 1–25. [Google Scholar] [CrossRef] [Scilit]
- Holmqvist, K.; Nyström, M.; Andersson, R.; Dewhurst, R.; Jarodzka, H.; Van de Weijer, J. Eye Tracking: A Comprehensive Guide to Methods and Measures; Oxford University Press: Oxford, UK, 2011. [Google Scholar]
- Depietri, Y.; Ghermandi, A.; Campisi-Pinto, S.; Orenstein, D.E. Public participation GIS versus geolocated social media data to assess urban cultural ecosystem services: Instances of complementarity. Ecosyst. Serv. 2021, 50, 101277. [Google Scholar] [CrossRef] [Scilit]
- Yarbus, A.L. Eye Movements and Vision; Springer: New York, NY, USA, 2013. [Google Scholar]
- Hillier, B.; Hanson, J.; Peponis, J. What do we mean by building function. In Designing for Building Utilization; Spon: London, UK, 1984; pp. 61–72. [Google Scholar]
- Tatler, B.W. The central fixation bias in scene viewing: Selecting an optimal viewing position independently of motor biases and image feature distributions. J. Vis. 2007, 7, 4. [Google Scholar] [CrossRef] [Scilit]
- Vaswani, A.; Shazeer, N.; Parmar, N.; Uszkoreit, J.; Jones, L.; Gomez, A.N.; Kaiser, L.; Polosukhin, I. Attention Is All You Need. In Proceedings of the 31st Annual Conference on Neural Information Processing Systems (NIPS), Long Beach, CA, USA, 4–9 December 2017. [Google Scholar]
- Kümmerer, M.; Wallis, T.; Bethge, M. DeepGaze II: Reading fixations from deep features trained on object recognition. arXiv 2016, arXiv:1610.01563. [Google Scholar] [CrossRef] [Scilit]
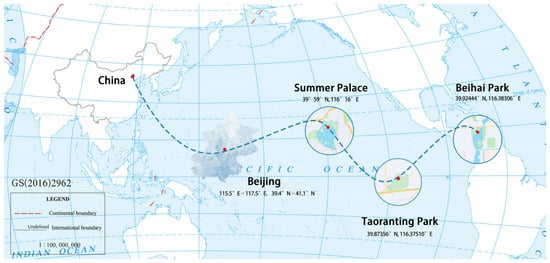
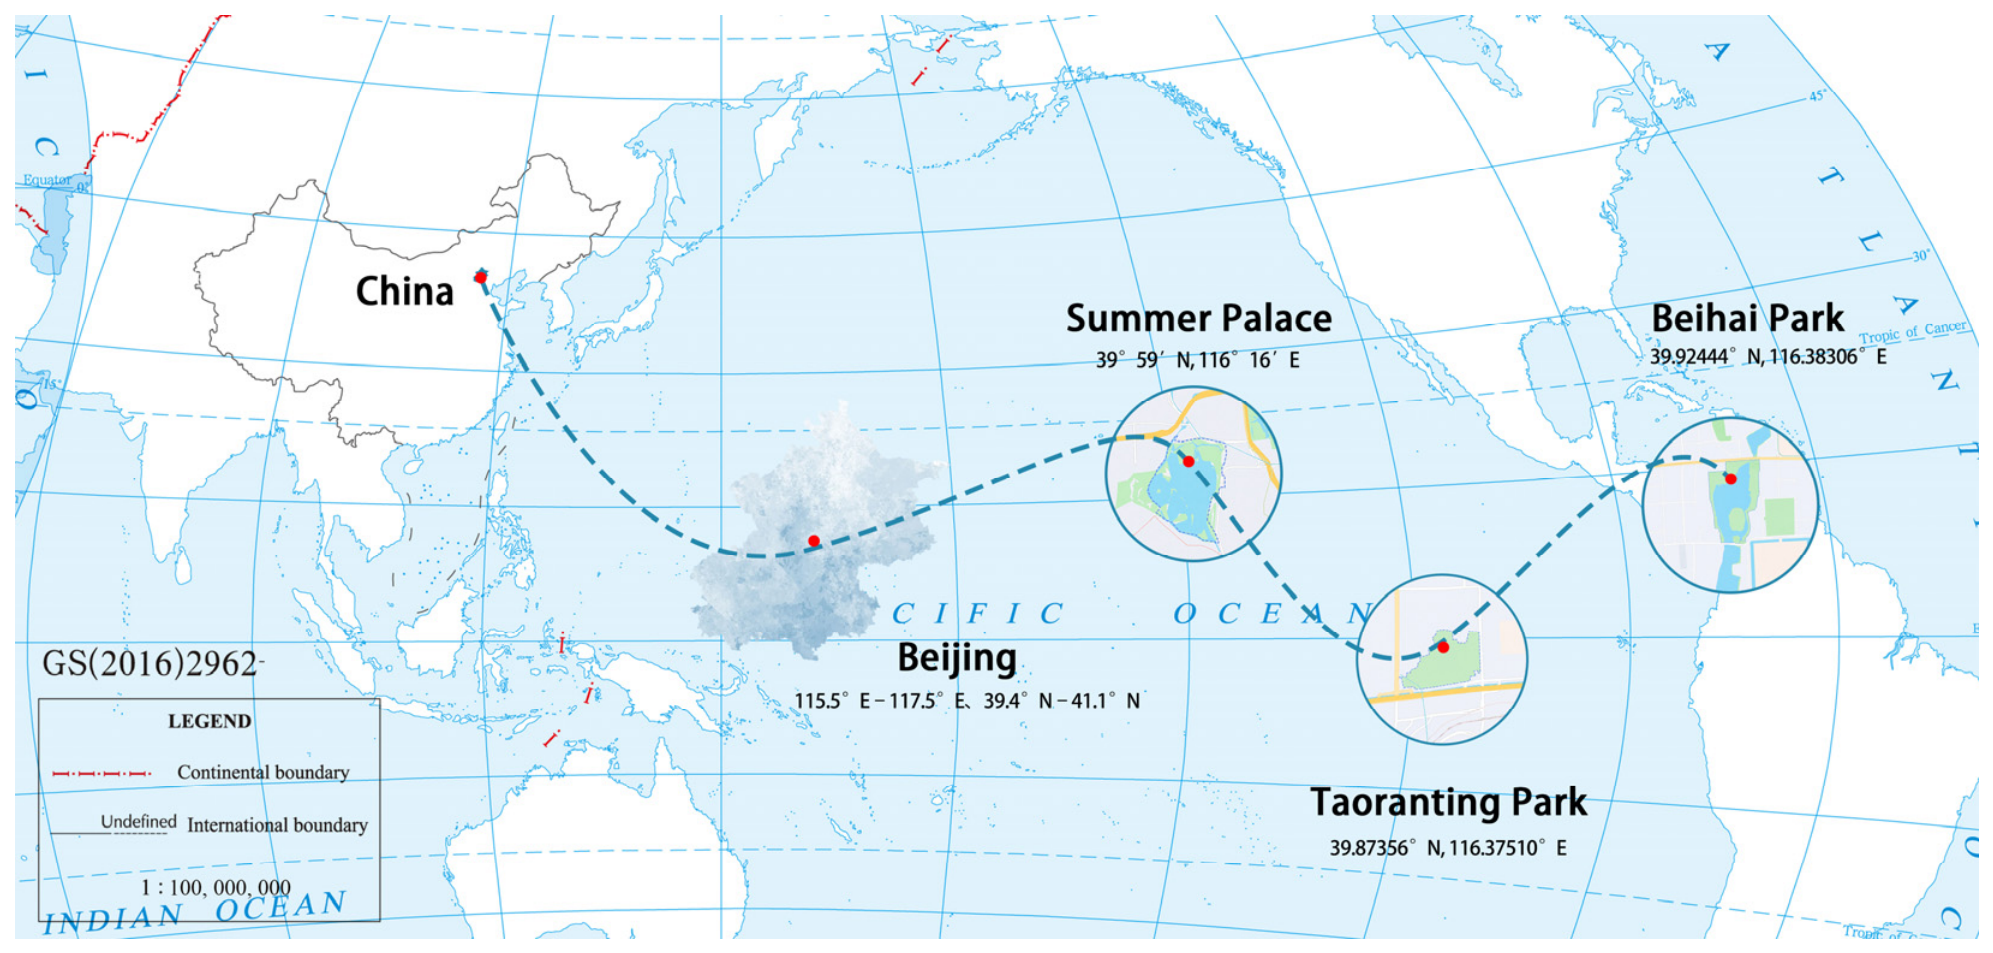
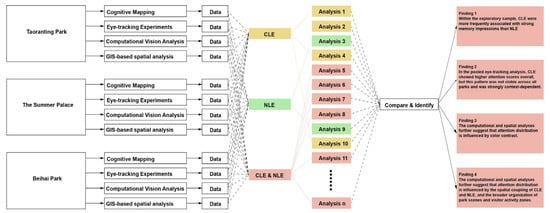
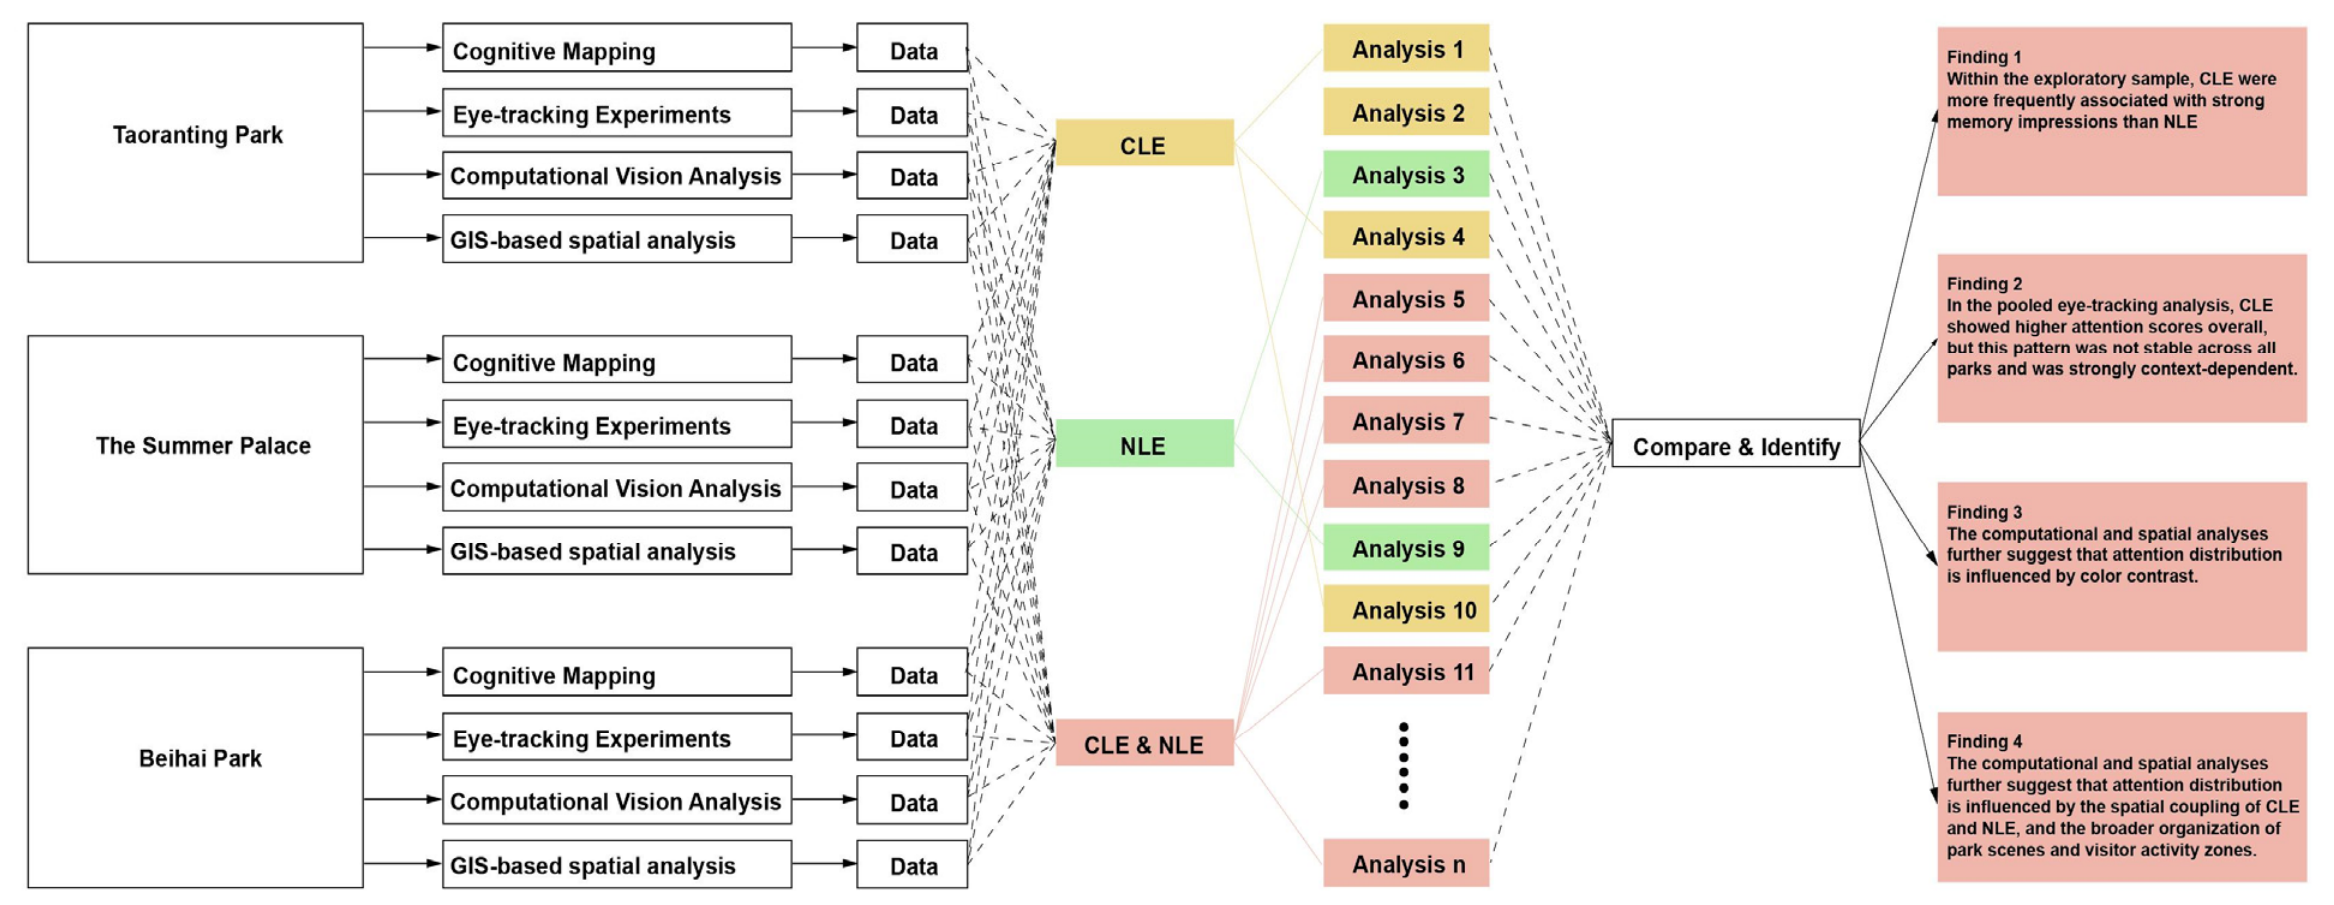
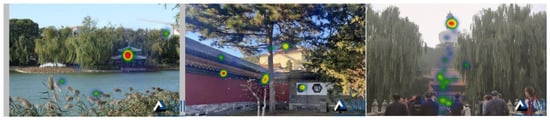
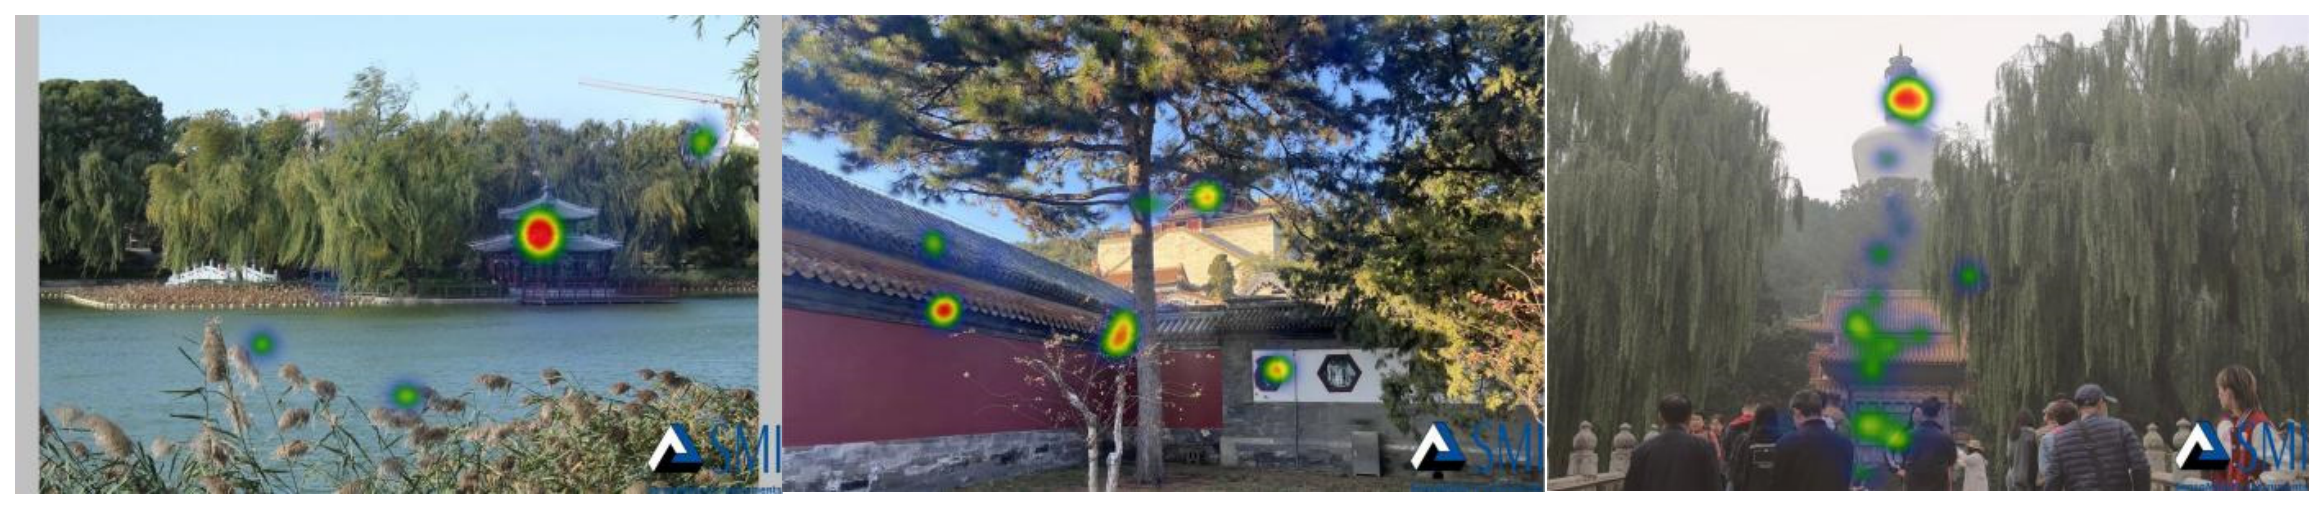
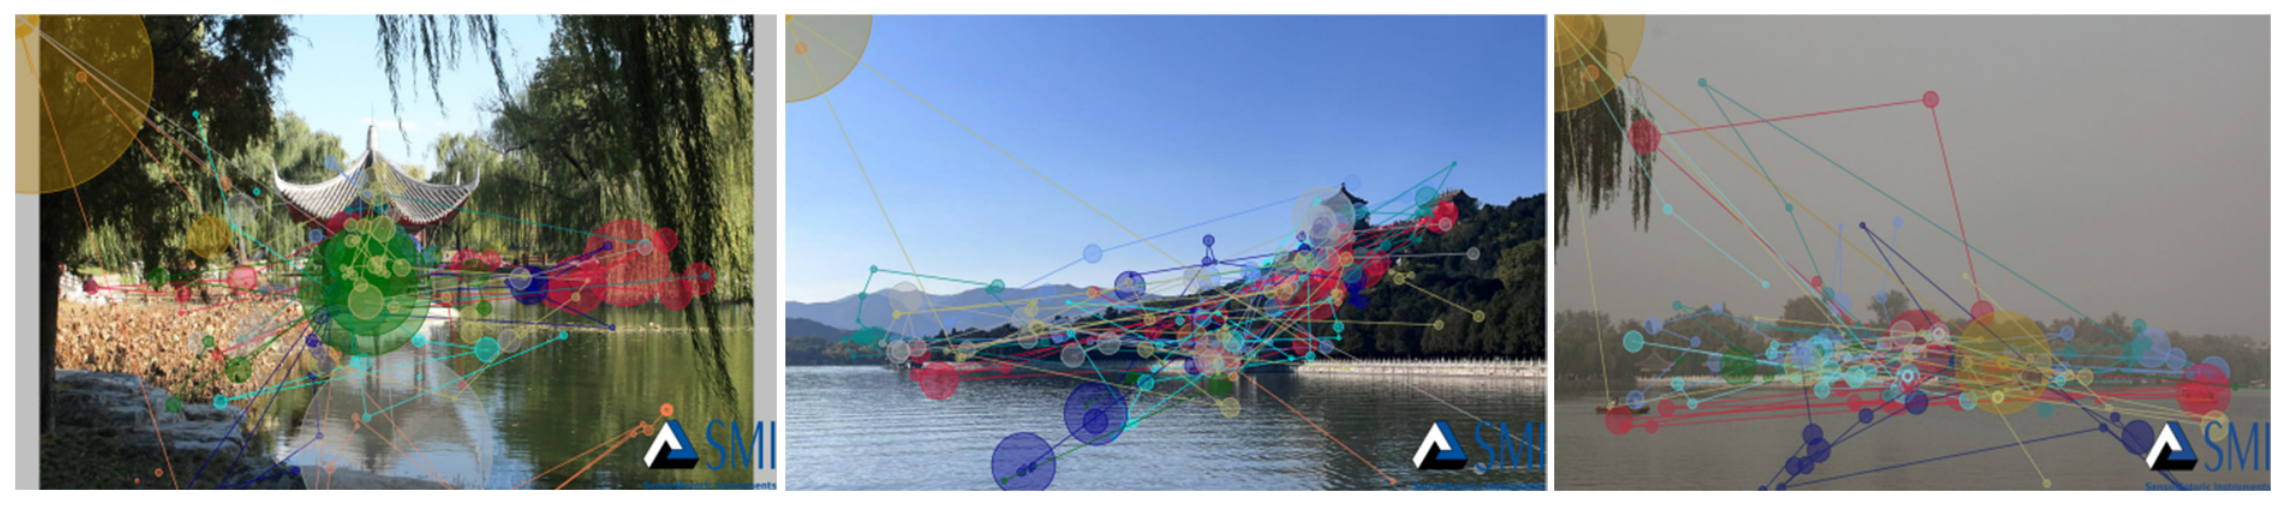
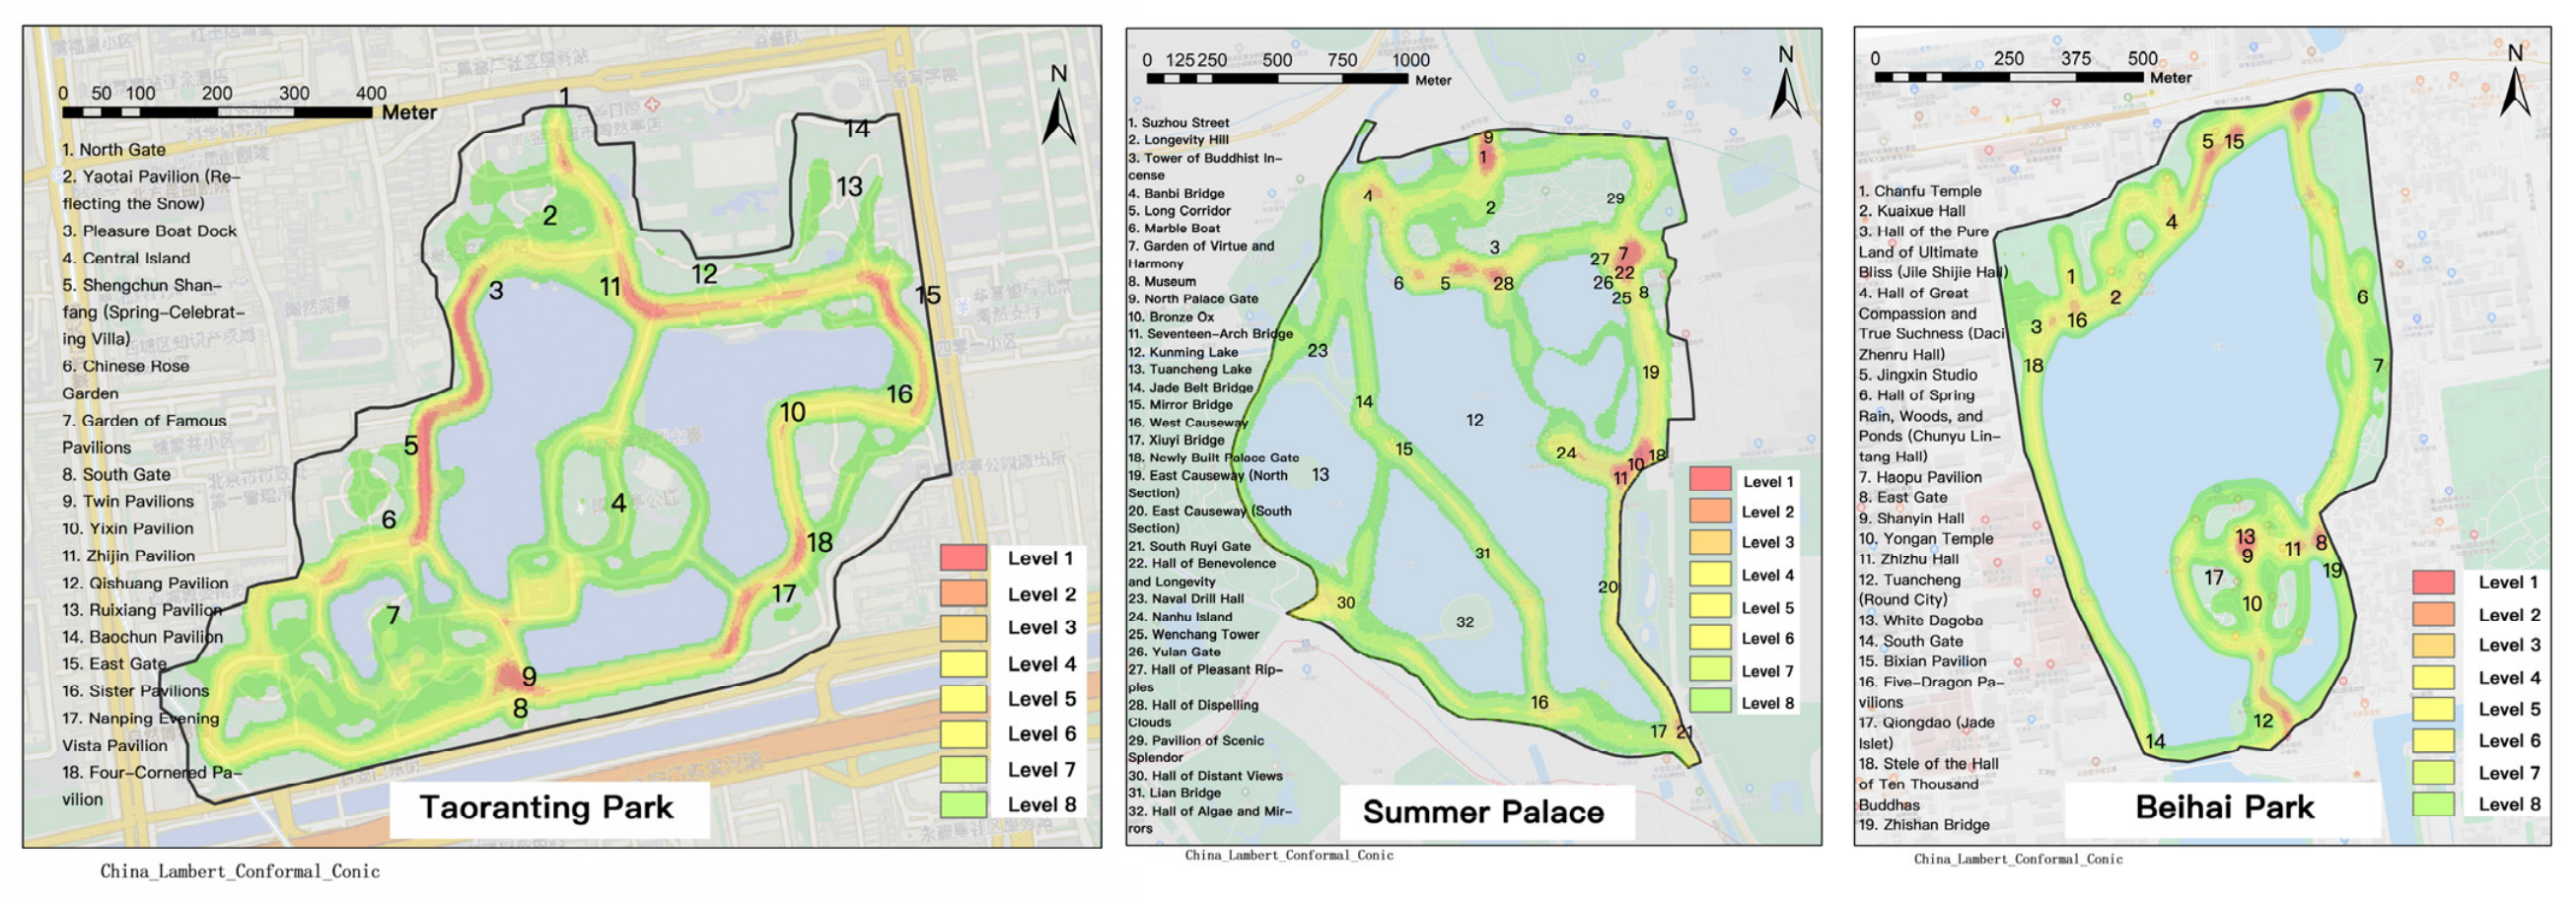
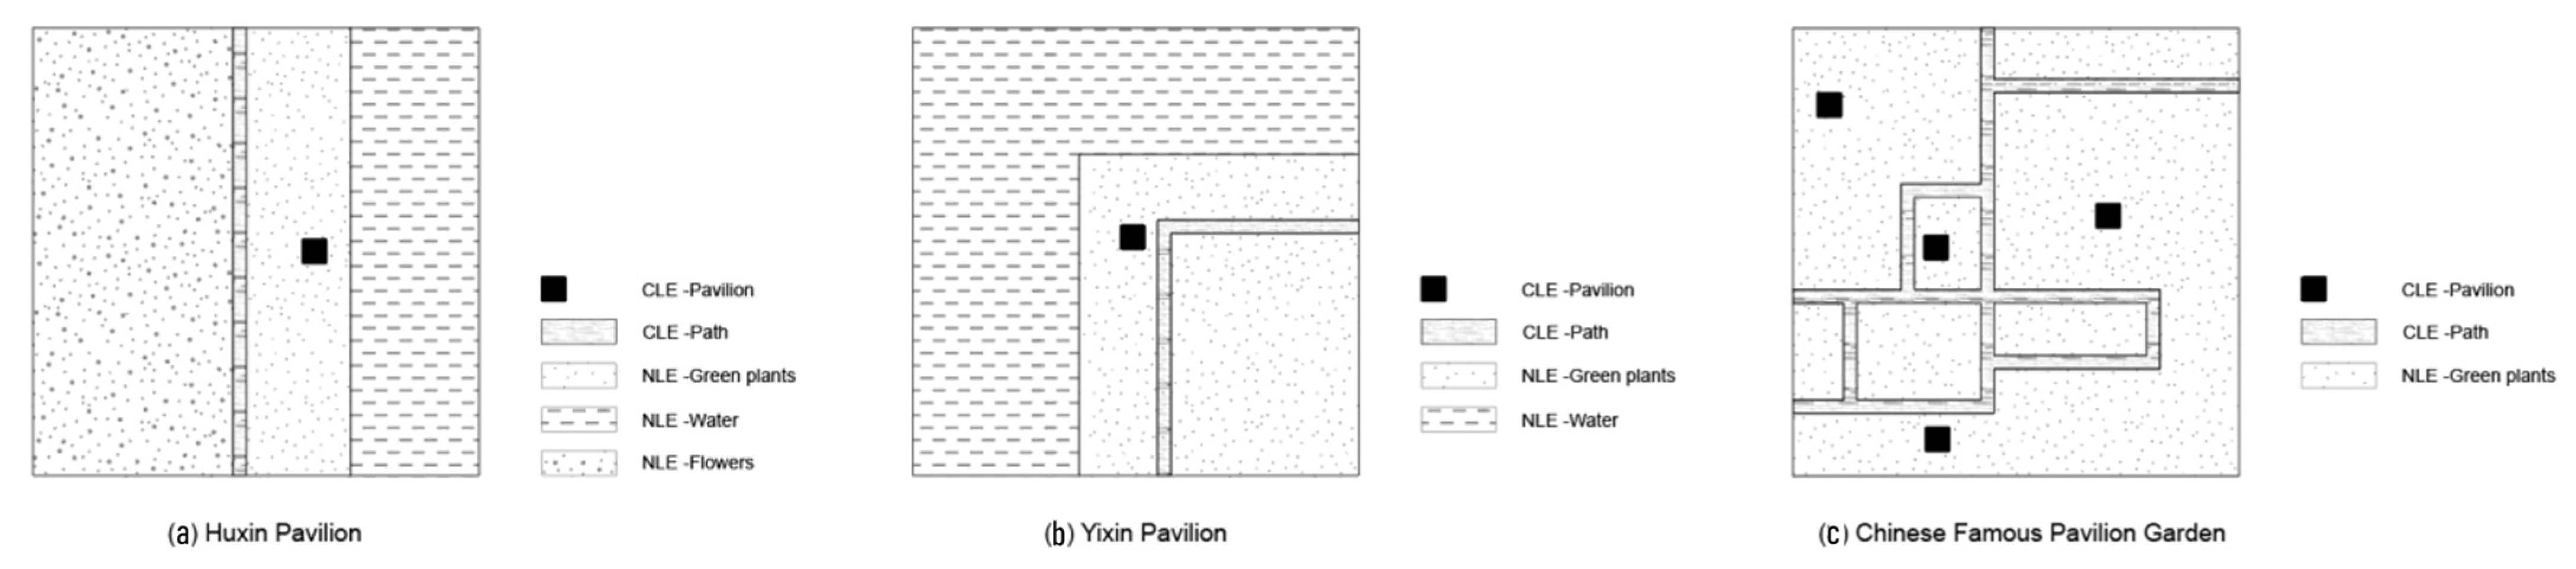
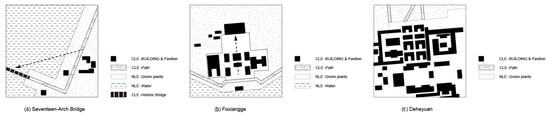
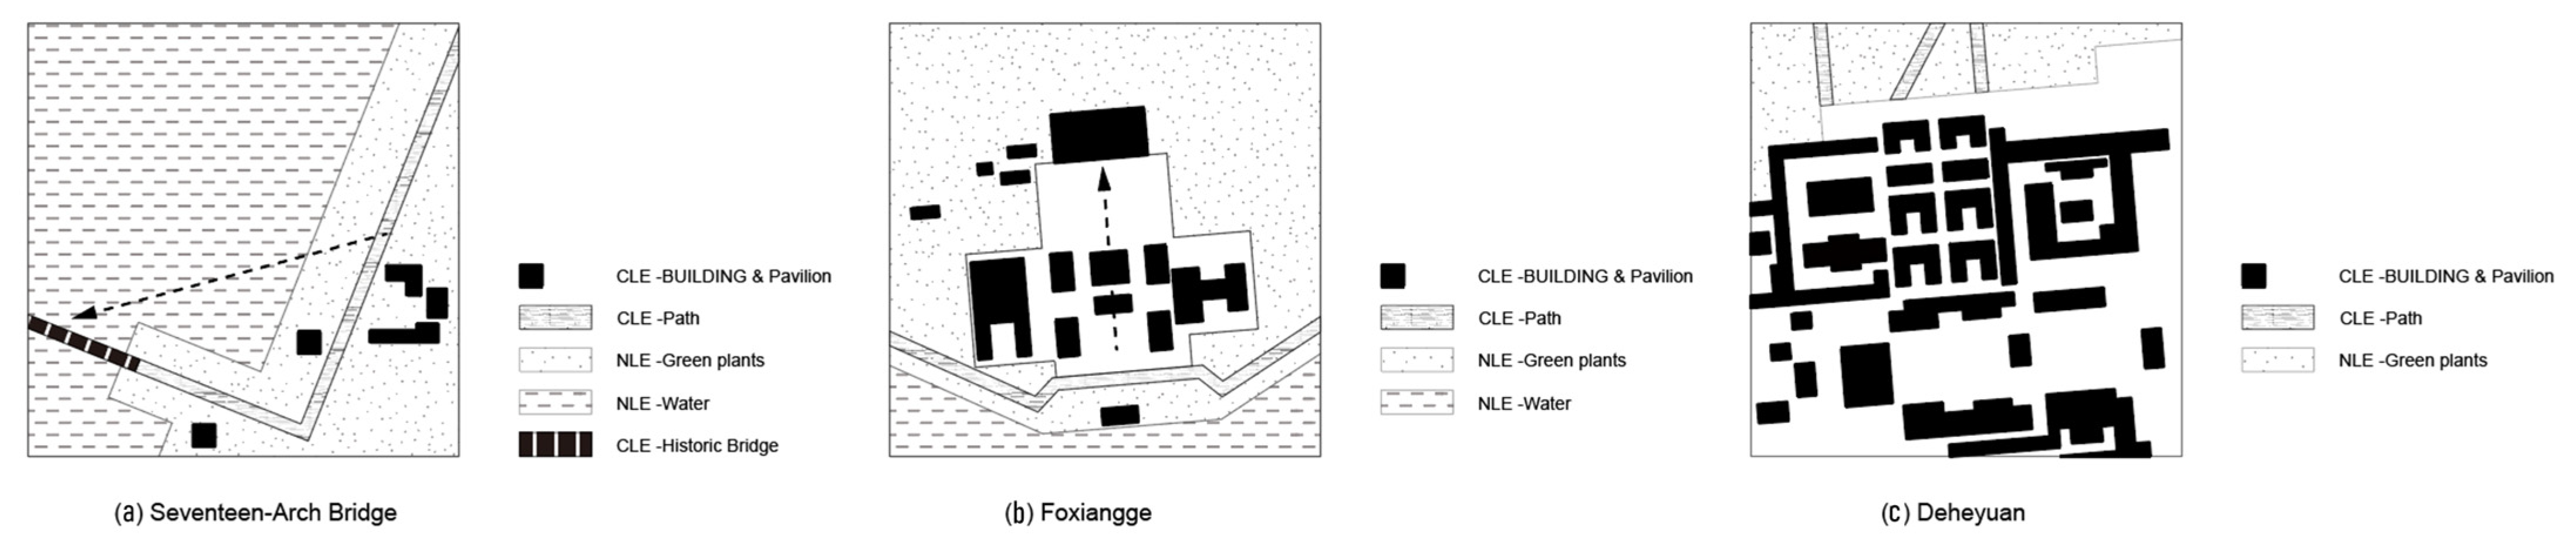
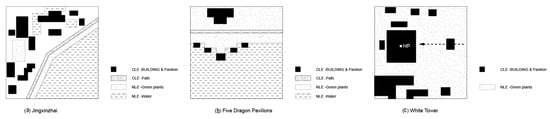
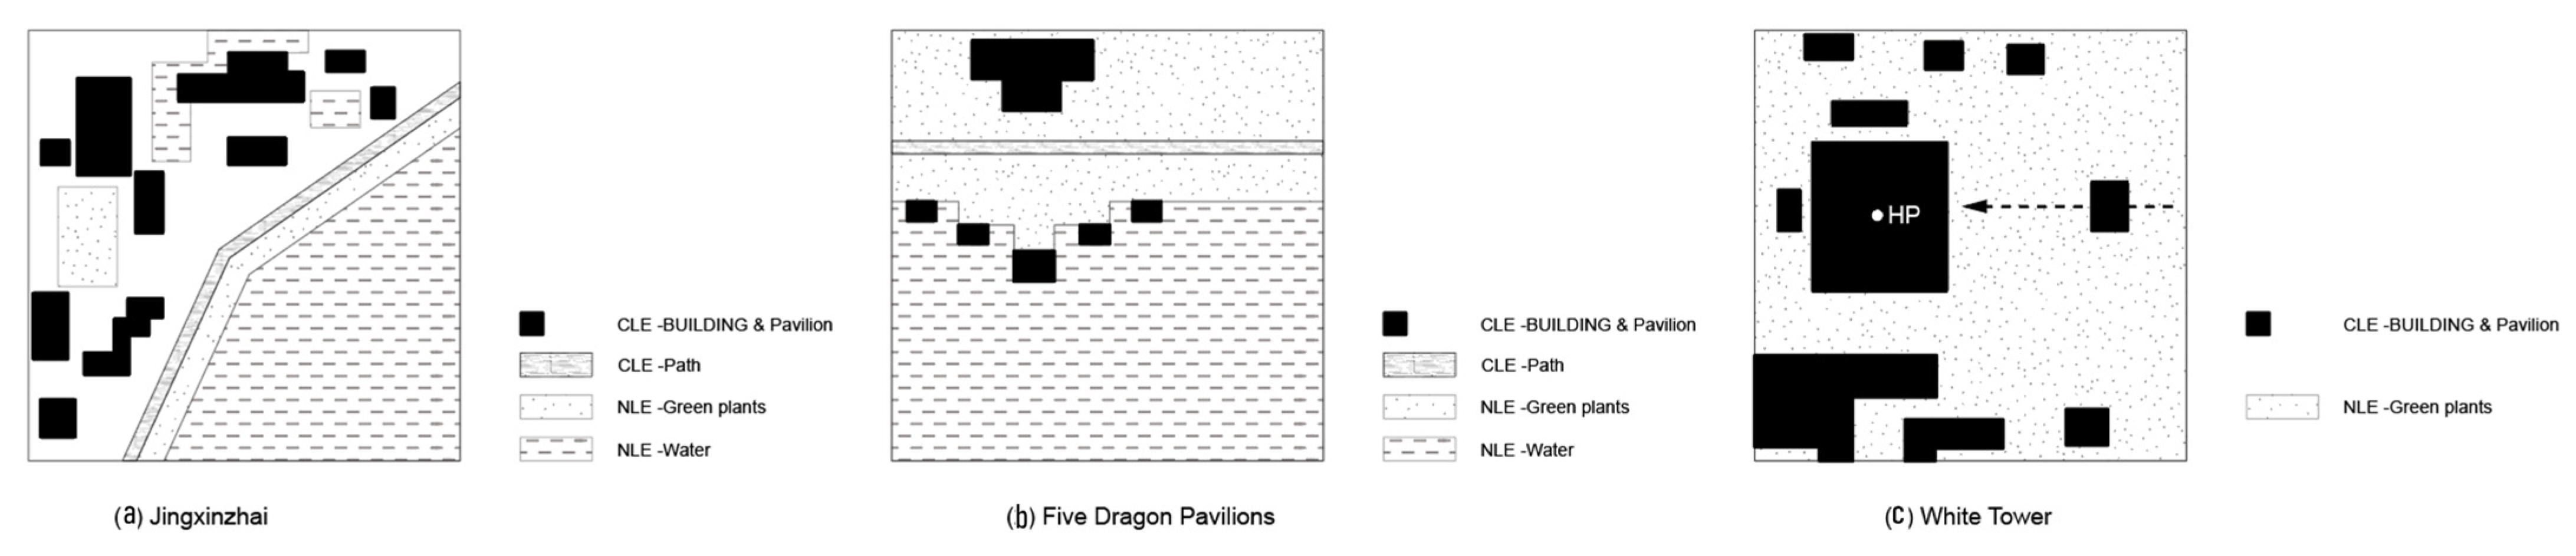

Disclaimer/Publisher’s Note: The statements, opinions and data contained in all publications are solely those of the individual author(s) and contributor(s) and not of MDPI and/or the editor(s). MDPI and/or the editor(s) disclaim responsibility for any injury to people or property resulting from any ideas, methods, instructions or products referred to in the content. |
© 2026 by the authors. Licensee MDPI, Basel, Switzerland. This article is an open access article distributed under the terms and conditions of the Creative Commons Attribution (CC BY) license.