1. Introduction
As a core contributor to global greenhouse gas emissions, the construction industry’s accurate accounting of life-cycle carbon emissions (LCCE) and optimization of emission reduction pathways have become critical issues in addressing climate change [
1,
2]. According to the 2021 report by the United Nations Environment Programme (UNEP), the global construction industry accounted for 37% of total emissions in 2020, with the operation stage of buildings accounting for 27% (including 9% direct emissions and 18% indirect emissions from electricity and commercial heating consumption) and the building materials production stage accounting for 10% [
1]. In China, approximately 2 billion square meters of new building area are added annually, and the low-carbon transformation of the construction industry is of irreplaceable strategic significance for achieving the goals of “peaking carbon emissions before 2030 and achieving carbon neutrality before 2060” [
3,
4]. In European countries such as Finland, with the implementation of the new Building Act in 2025, the whole-life-cycle carbon footprint of buildings has been incorporated into the statutory assessment scope, further highlighting the core position of Life Cycle Assessment (LCA) in global construction low-carbon governance [
5].
As a standardized tool for quantifying the environmental impacts of buildings, LCA has been widely used globally. Its framework and methodologies are clearly defined in the ISO 14040 series standards and ISO 21930 standard, covering all the life cycle stages from building material production, construction and installation, operational use to demolition and disposal [
2,
6]. Traditional LCA studies mostly adopt static parameter input, but the building life cycle can last for decades. Dynamic factors such as the transformation of upstream energy systems, technological progress, and changes in climate conditions will significantly affect the accuracy of carbon emission accounting [
5,
7,
8,
9]. The dynamic LCA model proposed by Su et al. [
7] integrates time-series parameters through gray prediction (GM(1,1) model) and scenario analysis (GCAM model). A case study on passive buildings shows that the whole-life-cycle carbon emissions under dynamic scenarios are approximately 23.4% lower than those under static scenarios, providing a key technical path for improving the accuracy of long-term carbon emission prediction. A systematic review by Salati et al. [
8] further points out that the core advantage of dynamic LCA lies in its ability to capture changes in time-dependent parameters such as energy structure evolution, technological progress, and material carbonation. Its key dynamic processes can be summarized into seven dimensions: energy evolution, temperature change, technological progress, carbonation, material flow, recycling rate, and temporal fluctuations of Characterization Factors (CFs) and Weighting Factors (WFs).
Research on building life-cycle carbon emissions mainly focuses on two core dimensions: Embodied Carbon Emissions (ECE) and Operational Carbon Emissions (OCE) [
1,
2]. ECE involves carbon emissions from the entire process of building materials extraction, production, transportation, and construction, while OCE focuses on emissions related to energy consumption during the building use phase [
2]. Studies have shown that operation stage emissions of traditional buildings account for 60–90% of total life-cycle emissions, while the proportion of ECE in low-energy consumption buildings and passive buildings is significantly increased, reaching more than 50%, and the proportion of ECE in some nearly zero-energy buildings even exceeds 100% [
1,
8]. Through a case study of typical buildings in China, Zhang et al. [
3] found that reinforced concrete block masonry structures can reduce ECE by 38–112 kgCO
2/m
2 compared with traditional reinforced concrete structures, confirming the emission reduction potential of structural optimization and material selection. In a study on office buildings in Finland, Ilgın et al. [
5] compared the life-cycle carbon emission characteristics of concrete, wood, and steel structures, and found that the carbon footprint of wood-structured buildings is significantly lower than that of concrete and steel structures, and their Carbon Handprint is much higher than the latter two due to the carbon storage capacity of wood, while the Carbon Handprint of steel structures is slightly higher than that of concrete structures due to the high recycling potential of steel.
However, according to the latest evaluation standards for zero-carbon buildings in China, existing studies mainly focus on the calculation methods and spatial distribution characteristics of life-cycle carbon emissions, while insufficient attention has been paid to the comparative economic analysis of different carbon reduction strategies. In particular, there is still a lack of in-depth quantitative research on the economic performance of two mainstream paths—increasing photovoltaic installation and purchasing green electricity certificates—toward the two core goals of operational-stage zero carbon and full life-cycle zero carbon. To fill this research gap, this study establishes a standardized full life-cycle carbon emission accounting framework for zero-carbon buildings in accordance with international ISO standards and domestic national codes. Taking the Jinan actual zero-carbon building project as a typical case, this paper quantitatively calculates carbon emissions at each life cycle stage, identifies key emission sources, and further adopts the equivalent annual cost (EAC) method to compare the economic benefits of two carbon offset strategies. The innovations of this study lie in constructing a targeted carbon emission quantification model suitable for Chinese zero-carbon building projects and systematically revealing the economic advantages and applicable scenarios of photovoltaic utilization versus green electricity purchase strategies. The research findings not only provide a standardized technical reference for the life-cycle carbon accounting of similar zero-carbon buildings, but also offer a scientific economic decision basis for the reasonable selection of carbon reduction schemes in architectural planning and design. Meanwhile, this study can support the large-scale promotion of zero-carbon buildings and facilitate the low-carbon transformation and high-quality development of the construction industry.
2. Methods
2.1. Overall Research Technical Route
The Life Cycle Assessment is a systematic analysis method [
10] that can quantify the potential environmental impacts of resource consumption and pollutant emissions of products, processes or activities throughout the life cycle, covering raw material mining, product production, transportation, use, waste disposal and other stages.
This study adopts the LCA method and carries out a systematic accounting of the carbon emissions of the construction project in the stages of building material production, transportation, construction, operation and demolition in accordance with the ISO14040/14044 standard [
11] framework and the Technical Standard for Calculation of Building Carbon Emissions (GB/T51366) [
12,
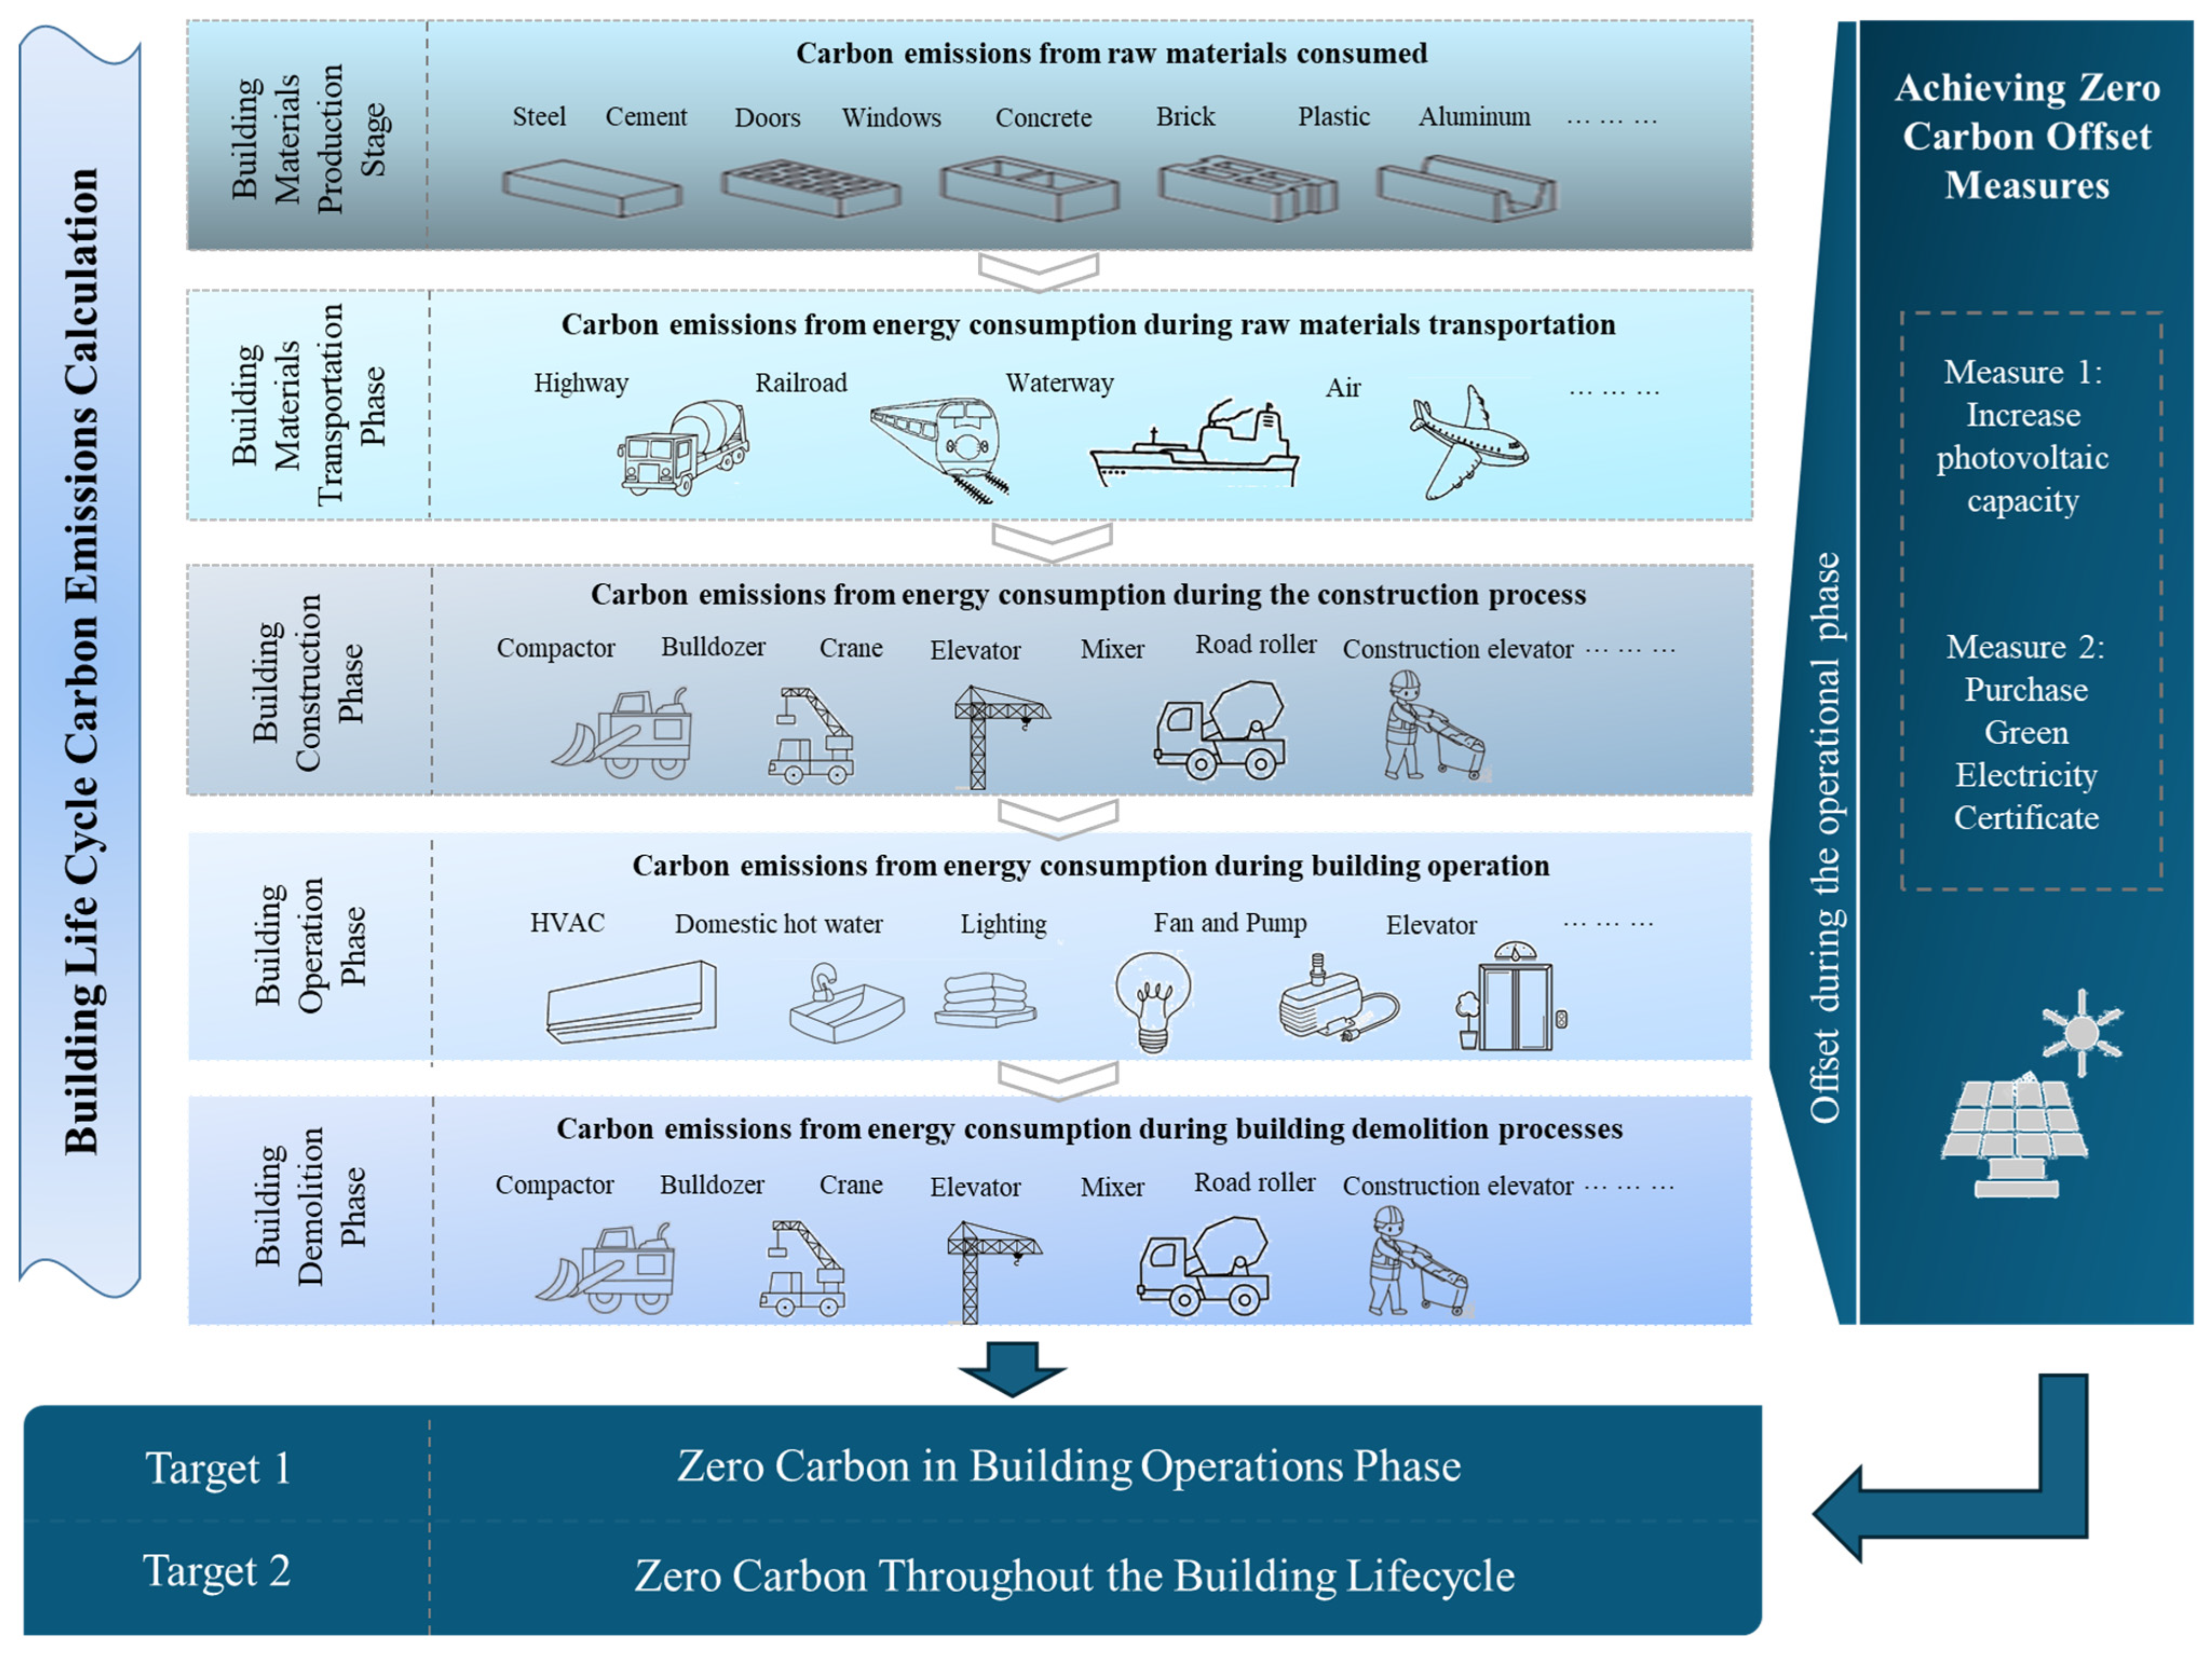
13]. Taking carbon dioxide emissions as the evaluation index, the “activity data × emission factor” accounting method is used to quantitatively analyze the main carbon emission sources such as energy consumption in building material production, transportation energy consumption, fuel consumption of construction machinery and energy consumption in the operation stage. Meanwhile, it analyzes the economic efficiency of achieving the zero-carbon building goal through measures such as increasing photovoltaic power generation, enhancing carbon sink and purchasing green electricity. The specific technical route of this study is shown in
Figure 1.
2.2. Theoretical Calculation Formulas
2.2.1. Calculation Formula for Carbon Emissions in the Building Material Production Stage
The calculation of carbon emissions in the building material production stage shall include building main structure materials, enclosure structure materials, components and parts, etc. The total weight of the selected main building materials shall not be less than 95% of the total weight of building materials consumed in the project [
12]. In addition, building materials with a weight ratio of less than 0.1% may not be included in the calculation. The formula is shown as Equation (1):
where
refers to carbon emissions in the building material production stage;
is the consumption of the
i-th main building material; and
represents the carbon emission factor of the
i-th main building material. The consumption of the main building materials of the project shall be determined by consulting design drawings, purchase lists and other technical documents related to engineering construction. The carbon emission factors for the building material production stage are obtained in accordance with national standards.
2.2.2. Calculation Formula for Carbon Emissions in the Building Material Transportation Stage
Carbon emissions in the building material transportation stage refer to the carbon emissions generated during the transportation of building materials from the production site to the construction site. The formula is shown as Equation (2):
where
denotes carbon emissions during the building material transportation process;
refers to the average transportation distance of the
i-th building material; and
is the carbon emission factor per unit weight and unit transportation distance for the transportation mode of the
i-th building material.
2.2.3. Calculation Formula for Carbon Emissions in the Building Construction Stage
Carbon emissions in the building construction stage are equal to the product of energy consumption during the construction process and the corresponding carbon emission factors. The energy consumption in the building construction stage is calculated by the construction process energy consumption estimation method. The specific calculations are shown in Equations (3) and (4):
where
is the carbon emissions during the building construction process;
refers to the total consumption of the j-th energy source in the building construction process;
is the carbon emission factor of the j-th fuel and power;
denotes the machine-shift consumption of the k-th construction machinery; and
is the consumption of the j-th energy source per machine-shift in the k-th construction machinery.
2.2.4. Calculation Formula for Carbon Emissions in the Building Operation Stage
Carbon emissions in the building operation stage shall be determined according to the energy consumption of different types in each system and the carbon emission factors of different types of energy sources. The calculations are shown in Equation (5):
where
is the carbon emission in the building operation stage;
refers to the annual consumption of the
i-th terminal energy source of the building;
is the carbon emission factor of the
i-th energy source;
refers to the carbon reduction from the application of on-site renewable energy of the building;
is the annual carbon reduction in the building green space carbon sink system; and
y represents the design service life of the building.
The calculation of carbon sequestration capacity for landscape greening is based on the area of planted trees and shrubs multiplied by the corresponding carbon sequestration factor [
14]. The calculations are shown in Equation (6):
where
refers to the annual carbon sequestration of landscape greening;
is the quantity or area of the
i-th arbor and shrub; and
represents the annual carbon sequestration of the
i-th arbor and shrub.
2.2.5. Calculation Formula for Carbon Emissions in the Building Demolition Stage
Carbon emissions in the building demolition stage are equal to the product of energy consumption during the demolition process and the corresponding carbon emission factors. The calculation process is shown in Equation (7):
where
is the carbon emissions during the building demolition process;
refers to the total consumption of the j-th energy source in the building demolition process; and
is the carbon emission factor of the j-th energy source.
3. Case Application
3.1. Project Overview
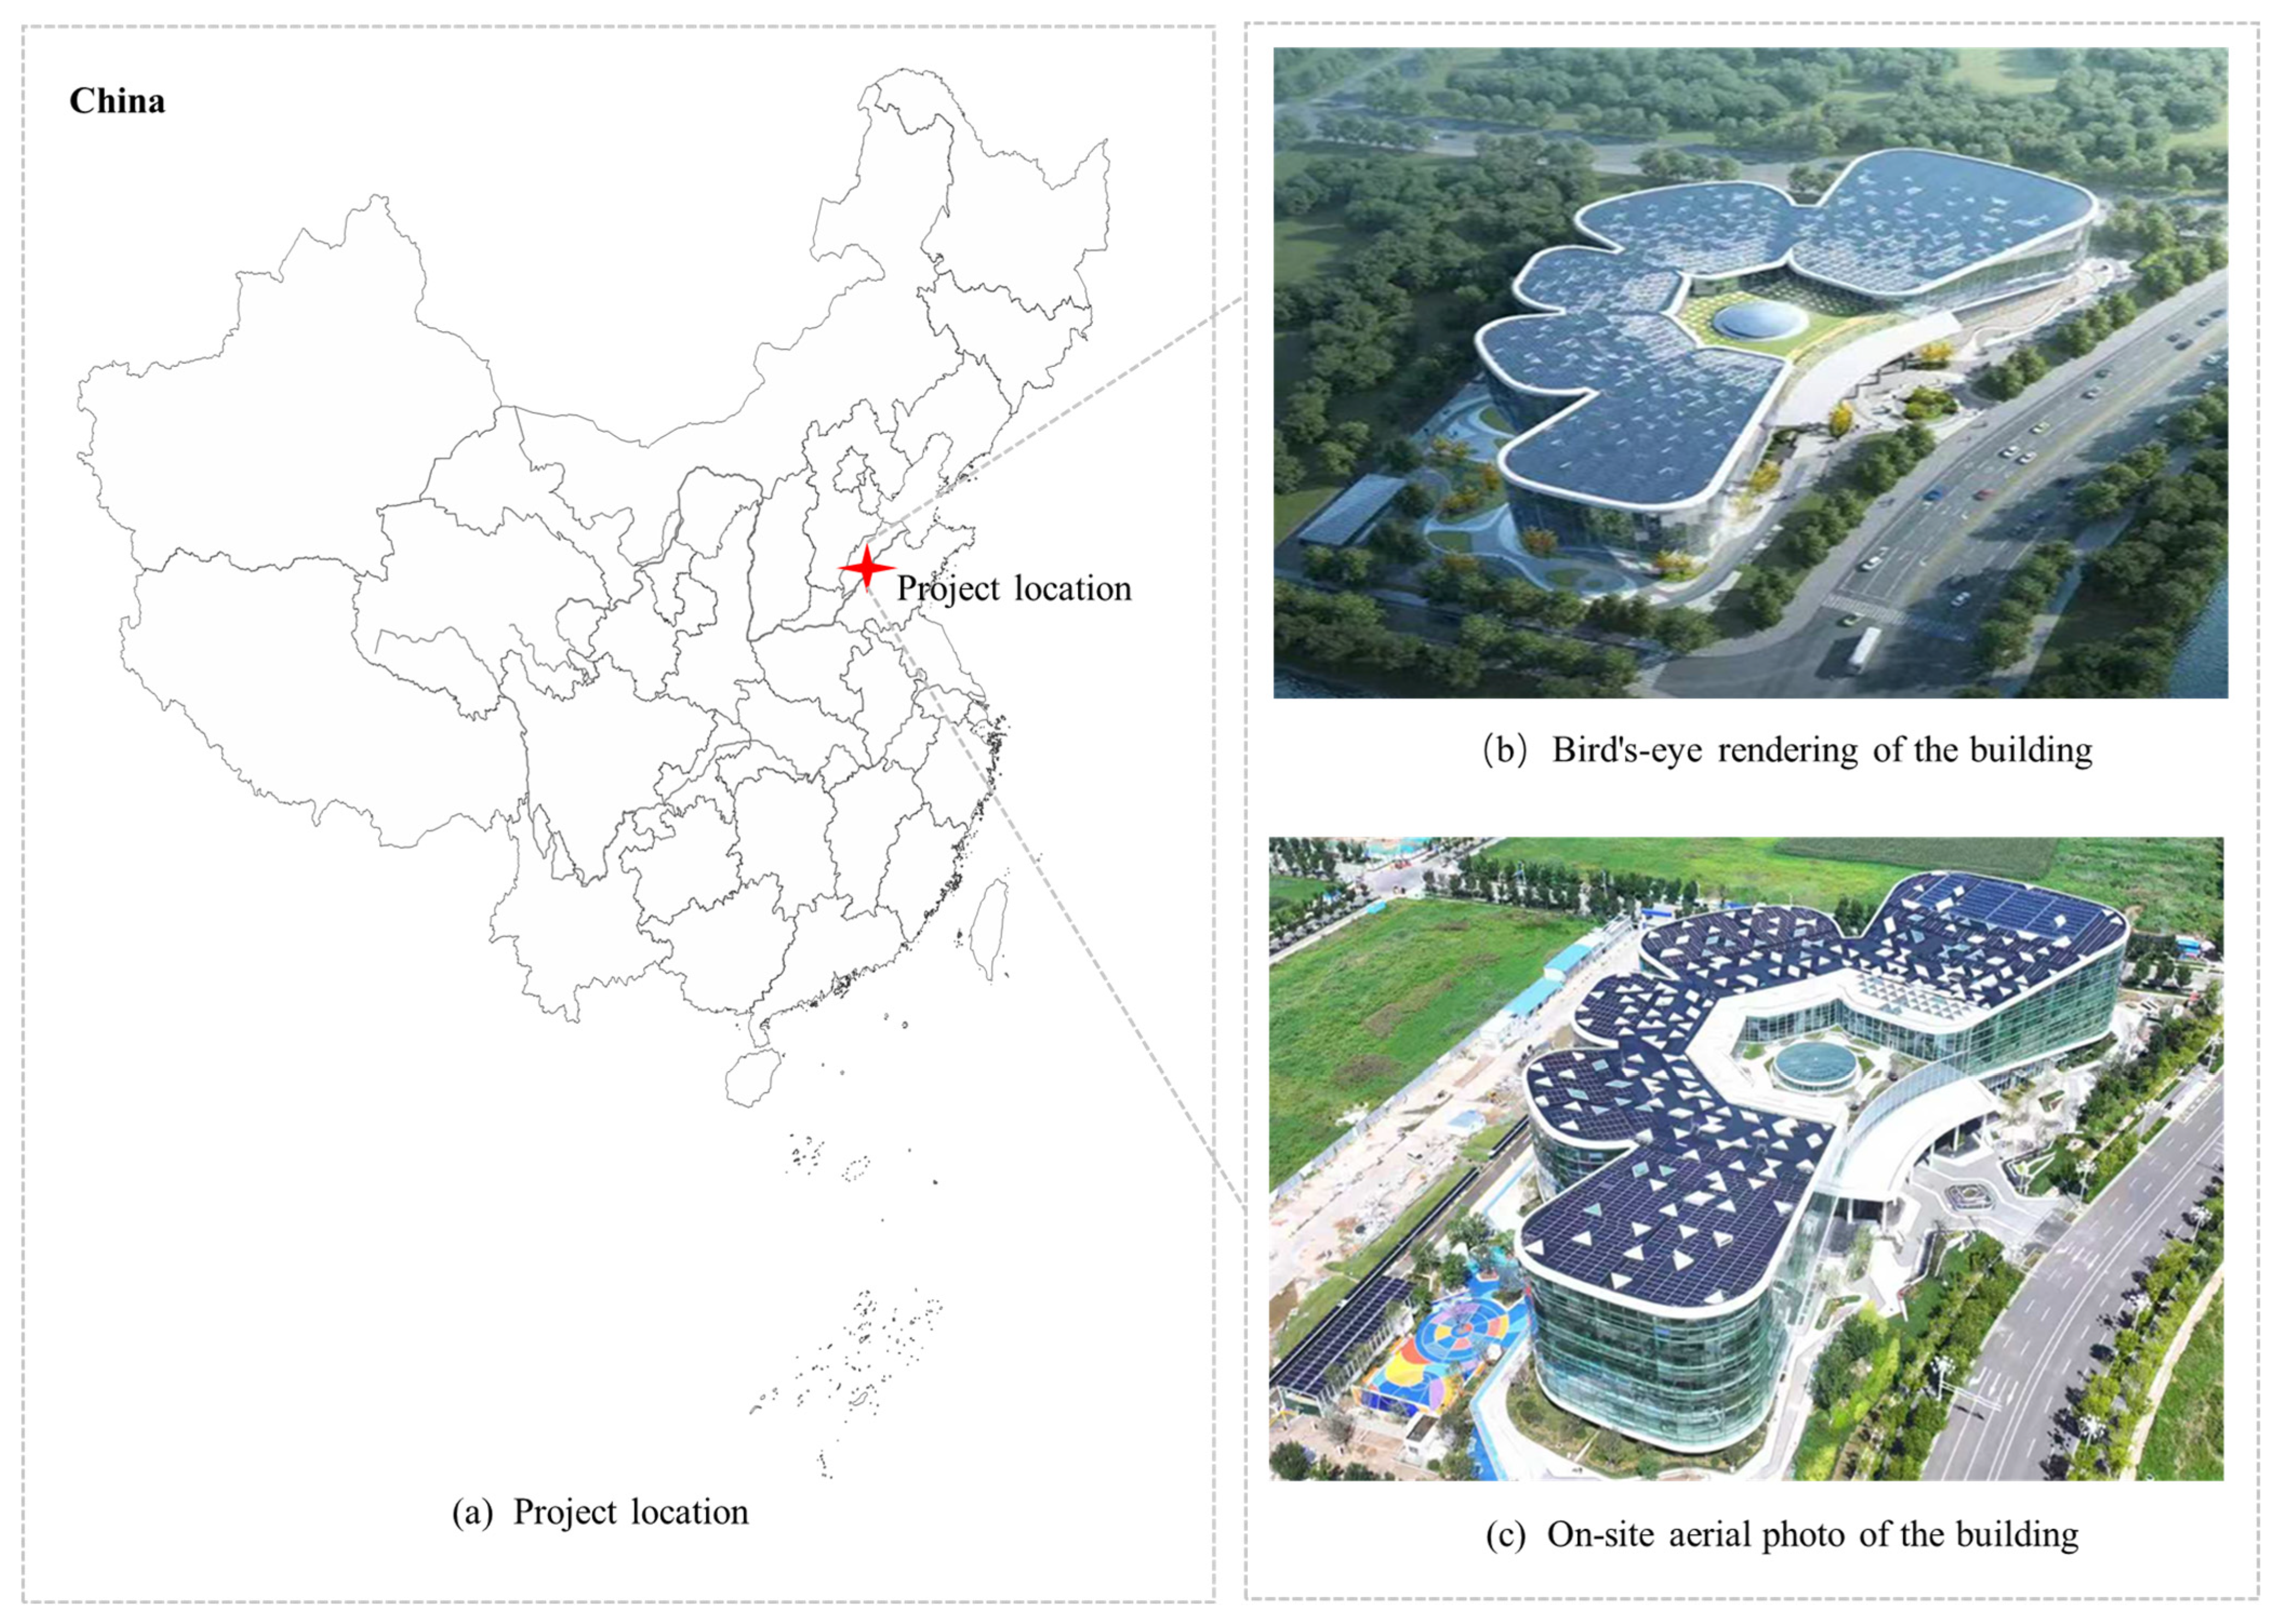
This study selects the Jinan Zero-Carbon Operation Center Project as a case for application. Located in Jinan City, Shandong Province, China, the project has a total building area of 72,431 m
2, including an aboveground building area of 48,053 m
2 and an underground building area of 24,378 m
2. To improve the energy-saving and carbon reduction effect of the project, it is designed and certified in accordance with China’s Zero-Carbon Building Standard [
14], China’s Green Building Standard [
15], the US LEED Building Standard [
16] and the US WELL Building Standard [
17], with the corresponding certification certificates obtained. In terms of reducing building carbon emissions, a polycrystalline silicon photovoltaic power generation system is installed on the building roof, and a cadmium telluride photovoltaic power generation curtain wall is installed on the building facade. In order to increase plant carbon sequestration, a large number of green plants are planted both indoors and outdoors of the project. When calculating the carbon emissions of buildings over their full life cycle, relevant provisions of GB/T 24067-2024 [
18] and ISO 14067:2018 [
19] specify that processes or building materials whose carbon footprint accounts for less than 1% of total carbon emissions may be exempted from accounting, and the total carbon emission proportion of all exempted items shall not exceed 5% of the overall total. The project location, renderings, site photos, and key low-carbon technologies are illustrated in
Figure 2.
3.2. Model Parameter Settings
3.2.1. Building Envelope Parameters
The thermal performance of the building envelope is designed in strict accordance with the cold-region requirements of [
20], and the resulting heat-transfer coefficients are significantly lower than the limits prescribed by the current national standard, which establishes a solid foundation for low operational energy use. The design parameters are summarized in the
Table 1.
3.2.2. Indoor Room Parameters
The cooling/heating setpoints, fresh-air rate, occupant density, and lighting/equipment power densities of the major indoor spaces are determined. The detailed parameters are listed in the
Table 2.
3.2.3. Main HVAC Equipment and Operating Schedule
Table 3 details the chillers, heat pumps, circulating water pumps and cooling towers of the air conditioning system, as well as the performance parameters of the units under different part-load ratios. Both the rated COPs and the part-load operating performance of the equipment meet the high-efficiency equipment requirements for nearly zero energy buildings.
The utilization rates of occupants, lighting and equipment are listed in
Table 4.
3.3. Calculation of Life-Cycle Carbon Emissions
3.3.1. Calculation of Carbon Emissions in the Building Material Production Stage
Carbon emissions in this stage are mainly derived from the energy consumption generated during the production of steel, concrete, sand, gravel and other materials. The building material data are obtained from the project design scheme, and the carbon emission factors of various building materials are sourced from [
13], as shown in
Table 5. Substituting the building material consumption and carbon emission factor data into Equation (1), the total carbon emissions of the project in the building material production stage are calculated to be 36,278.06 tCO
2e.
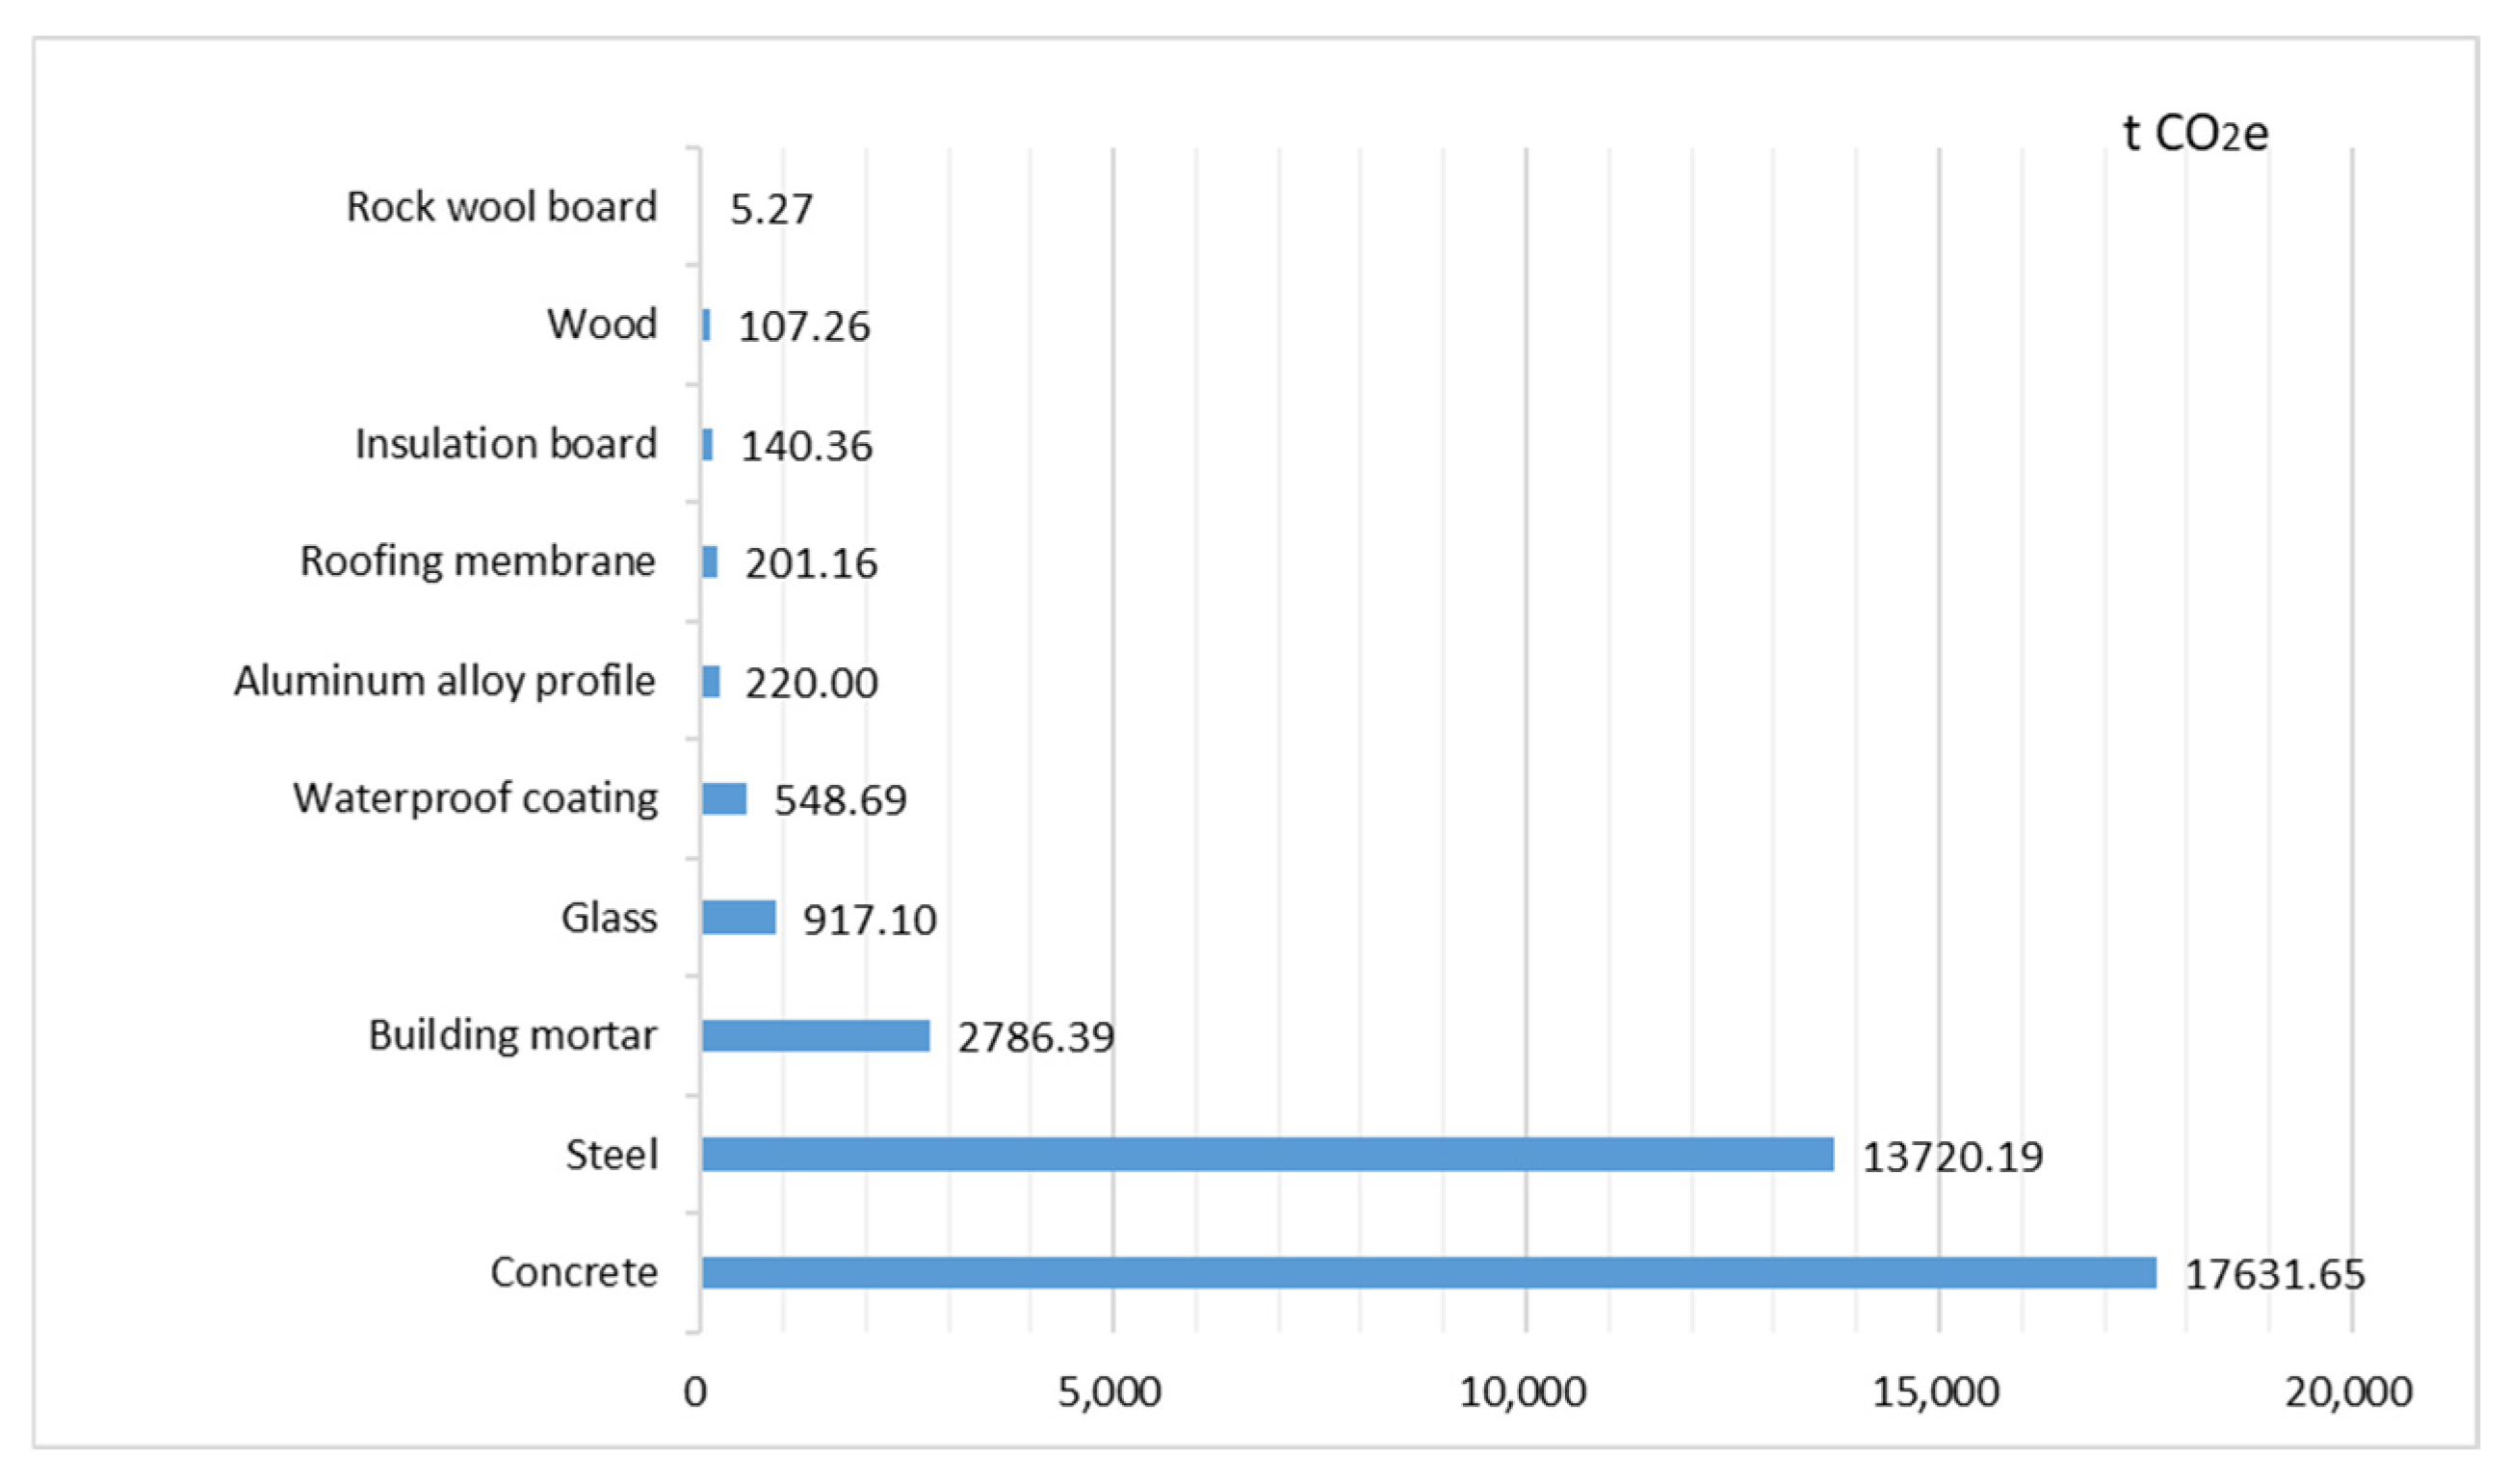
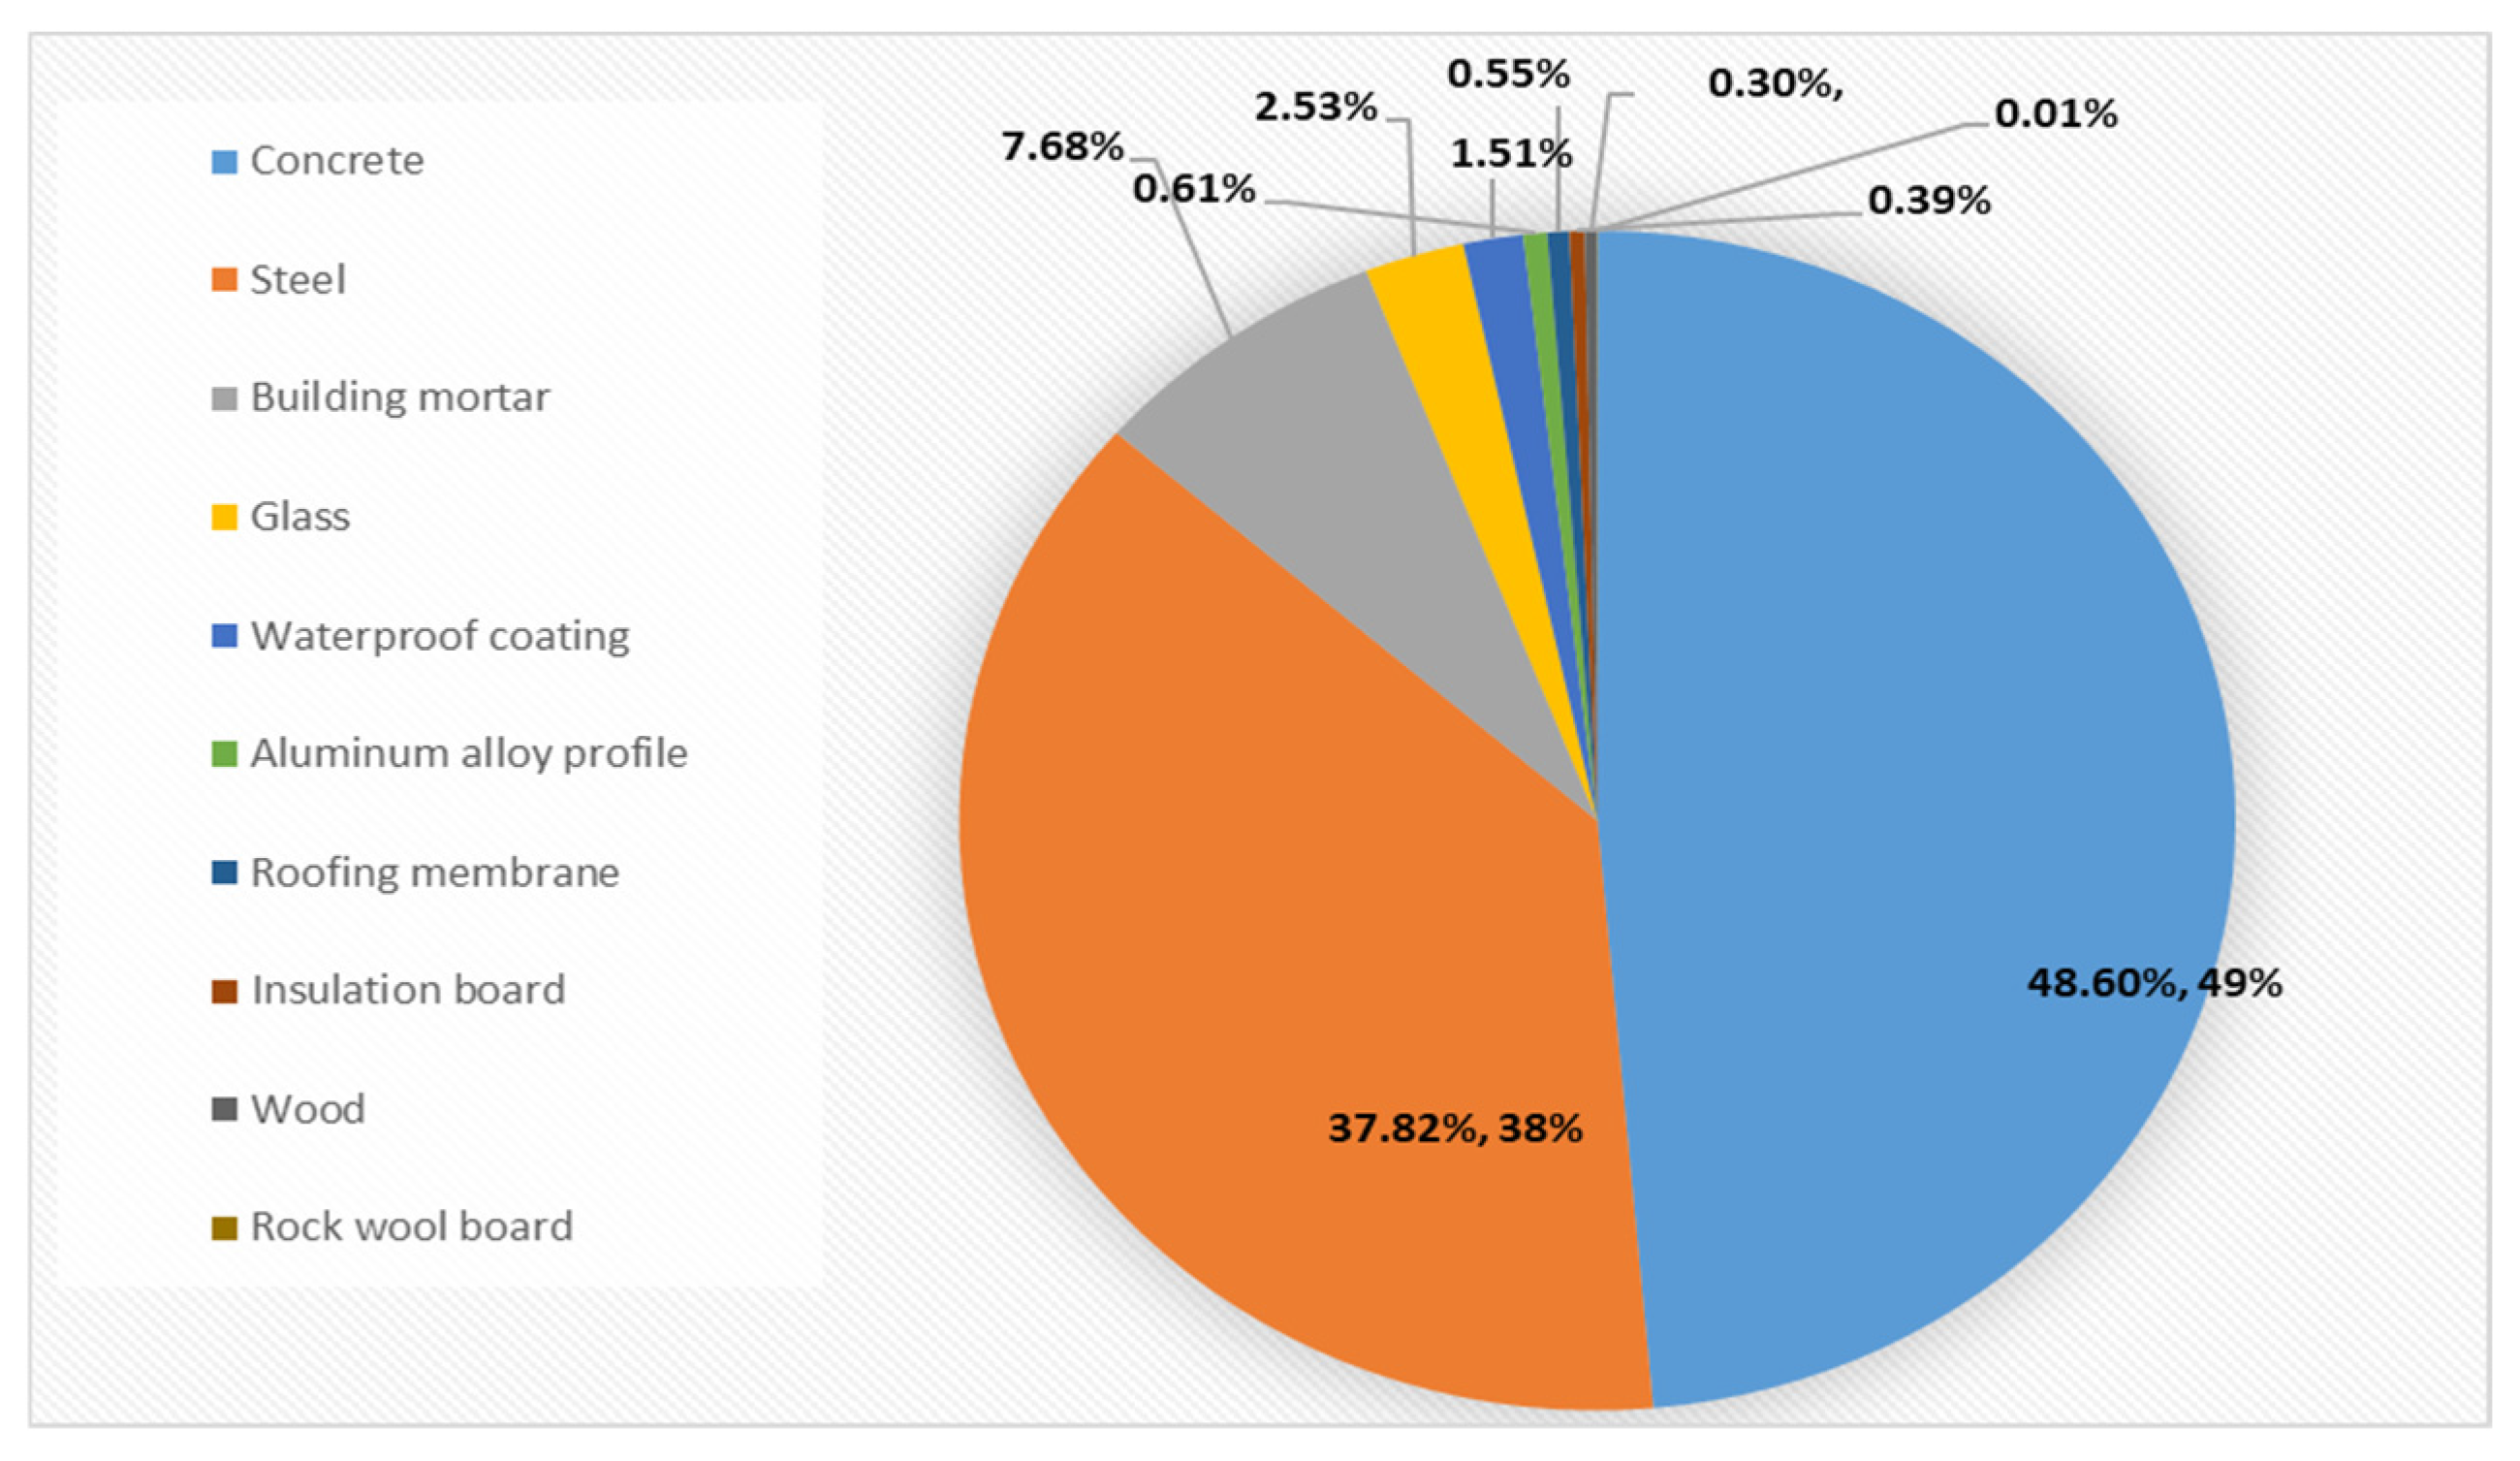
Figure 3 and
Figure 4 show the carbon emissions and their proportions of various types of building materials in the production stage. It can be seen from the figures that concrete, steel and building mortar are the core carbon-emitting materials, with carbon emissions of 17,631.65 tCO
2e, 13,720.19 tCO
2e and 2786.39 tCO
2e respectively, accounting for 48.60%, 37.82% and 7.68%. The total proportion of the three types of materials exceeds 94%, making them the key focus for carbon emission control in the building material production stage.
3.3.2. Calculation of Carbon Emissions in the Building Material Transportation Stage
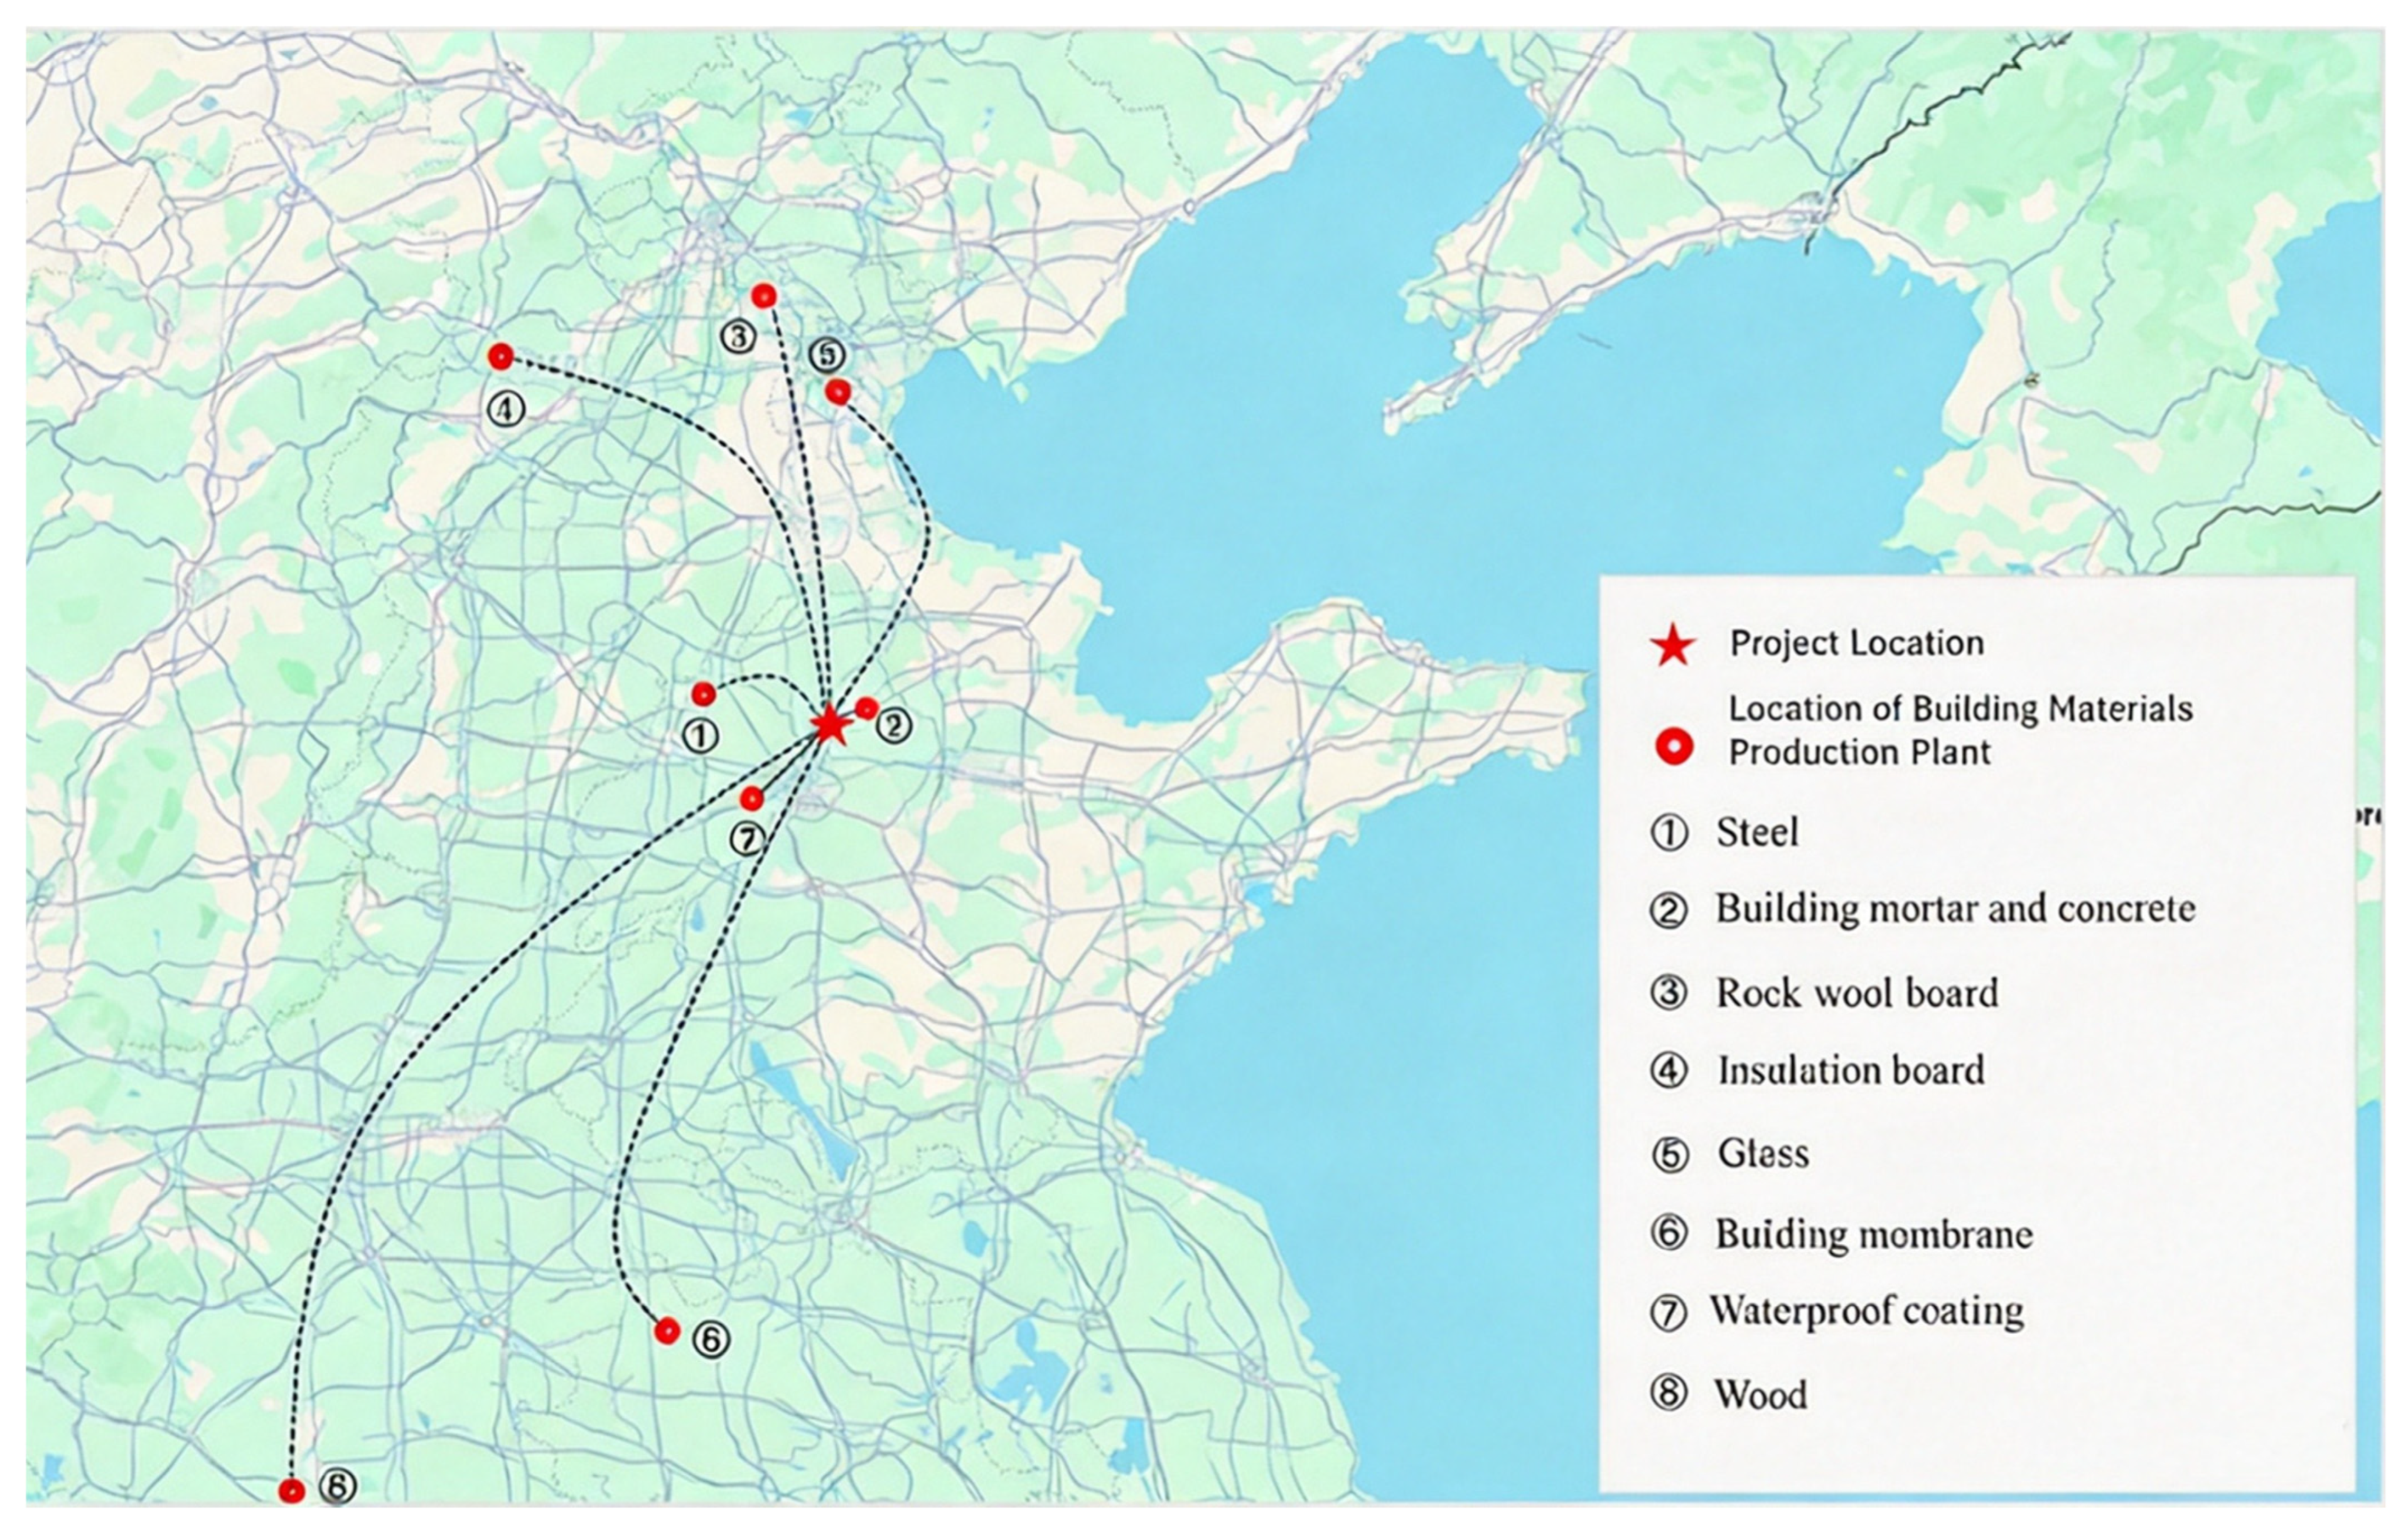
Diesel trucks are the primary transportation vehicle during the building material transportation stage. The location of the project site and the production bases of various building materials are illustrated in
Figure 5. The transportation distance of each building material is calculated based on their respective geographical locations, while the 500 km transportation distance for timber follows the industry average specified in relevant standards [
20]. Substituting the data in
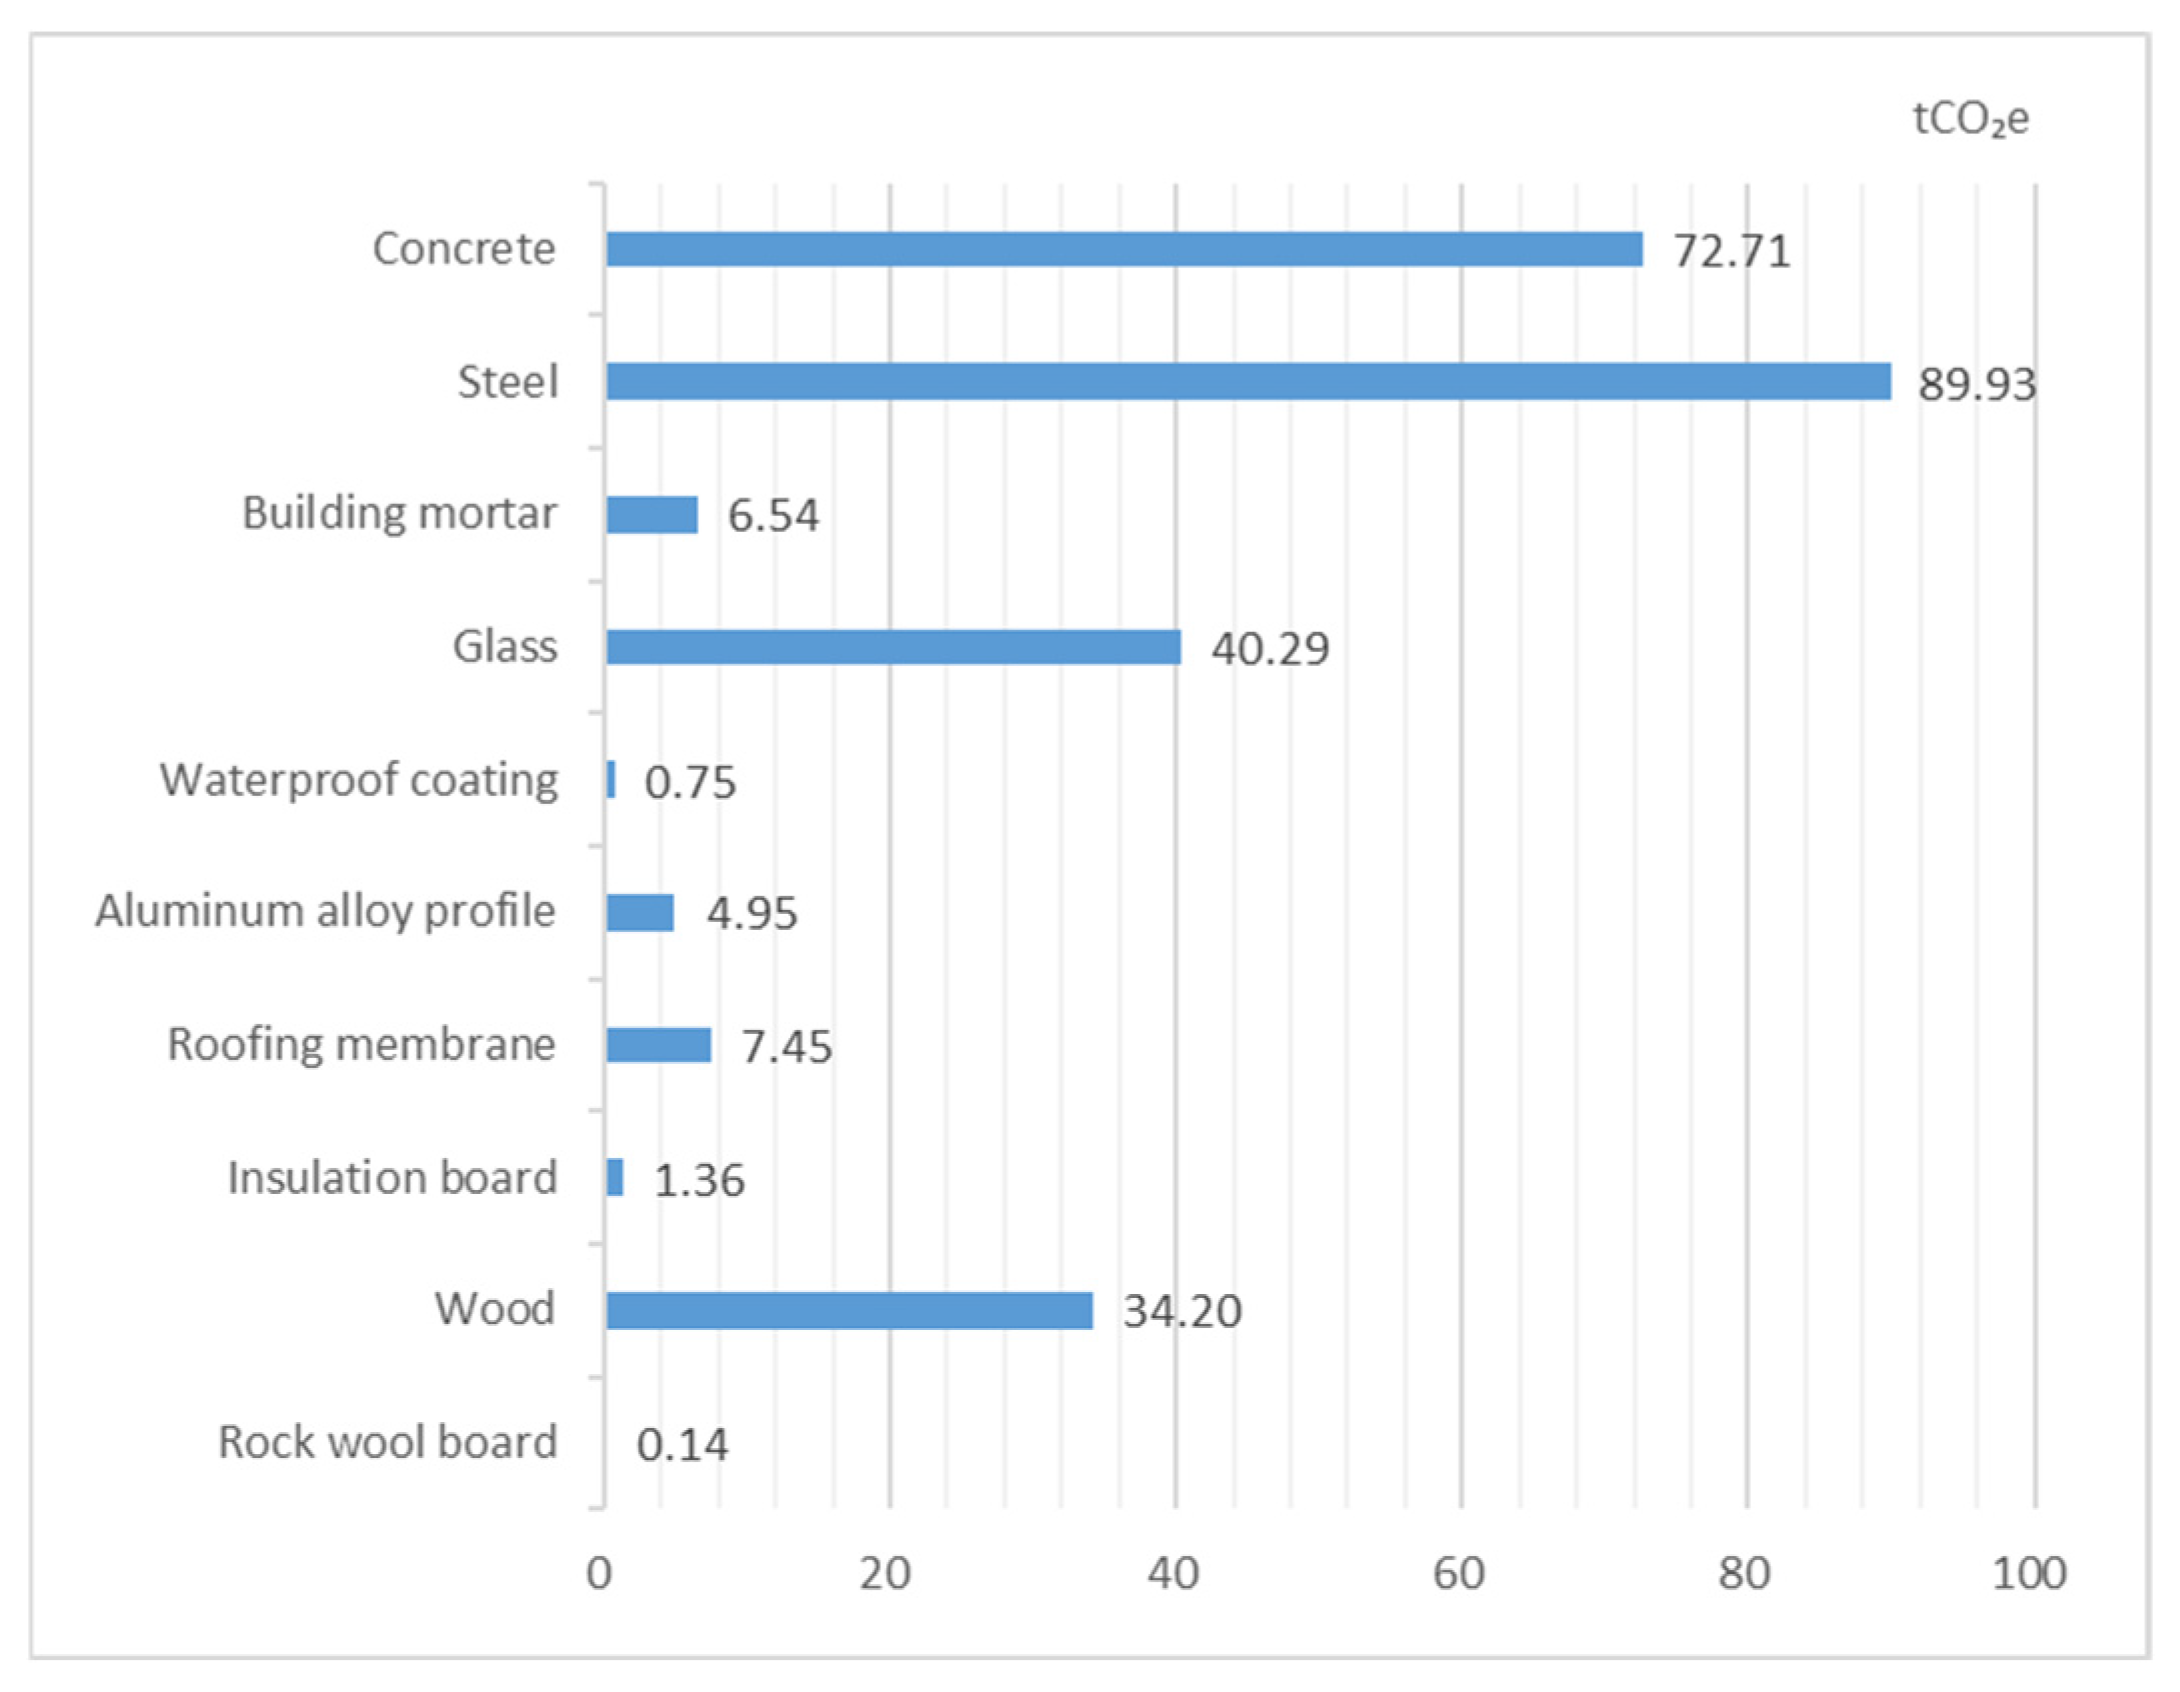
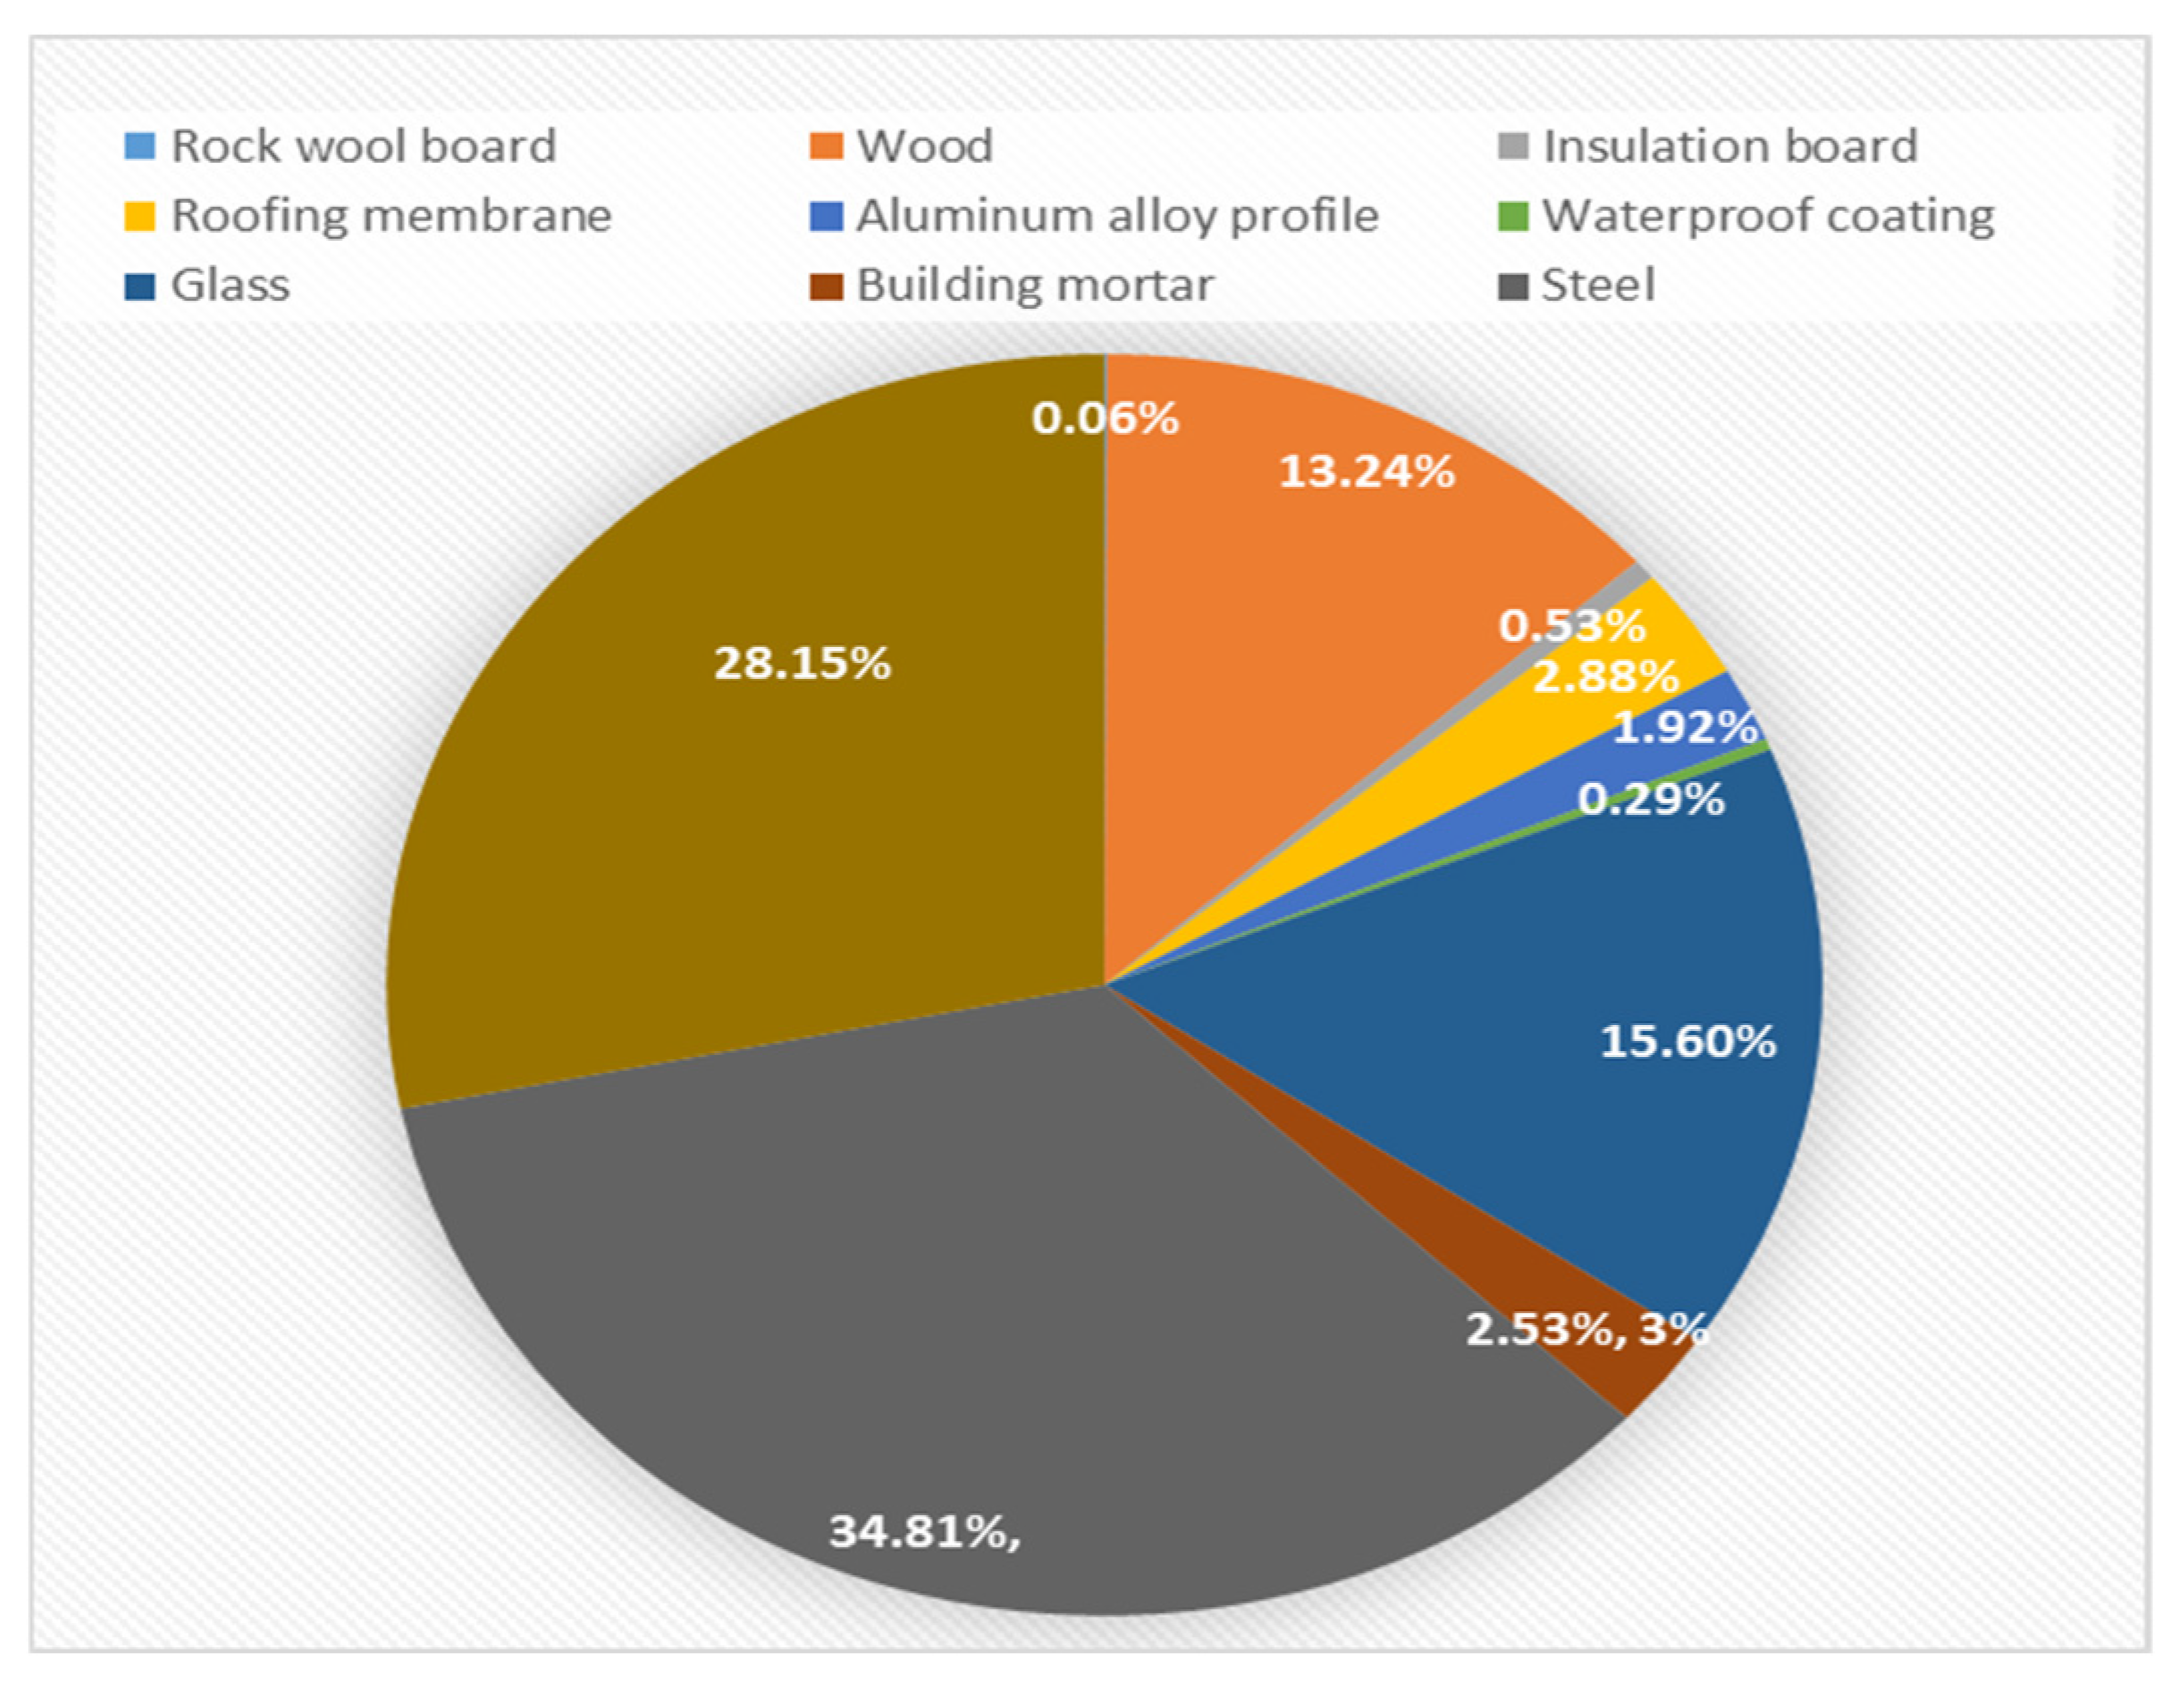
Table 6 into Equation (2), the carbon emissions and their proportions of various building materials in the transportation stage are shown in
Figure 6 and
Figure 7. It can be seen that the total carbon emissions of the project in the building material transportation stage are 258.32 tCO
2e. Carbon emissions in the building material transportation stage are jointly determined by transportation volume and distance. Among them, steel, concrete and glass have relatively high carbon emissions, with values of 89.93 tCO
2e, 72.71 tCO
2e and 40.29 tCO
2e respectively, accounting for 34.81%, 28.15% and 15.60%. The main reasons are the large transportation volume and long distance of steel, the large transportation volume of concrete, and the long transportation distance of glass.
3.3.3. Calculation of Carbon Emissions in the Building Construction Stage
The calculation time scope of the building construction stage is from the project commencement to completion acceptance. Carbon emissions are mainly derived from the fuel and electricity consumption of construction machinery shifts, including construction machinery operation, site construction, equipment installation and other links. The main construction machinery shifts and their quantities are shown in
Table 7. According to Equations (3) and (4) in
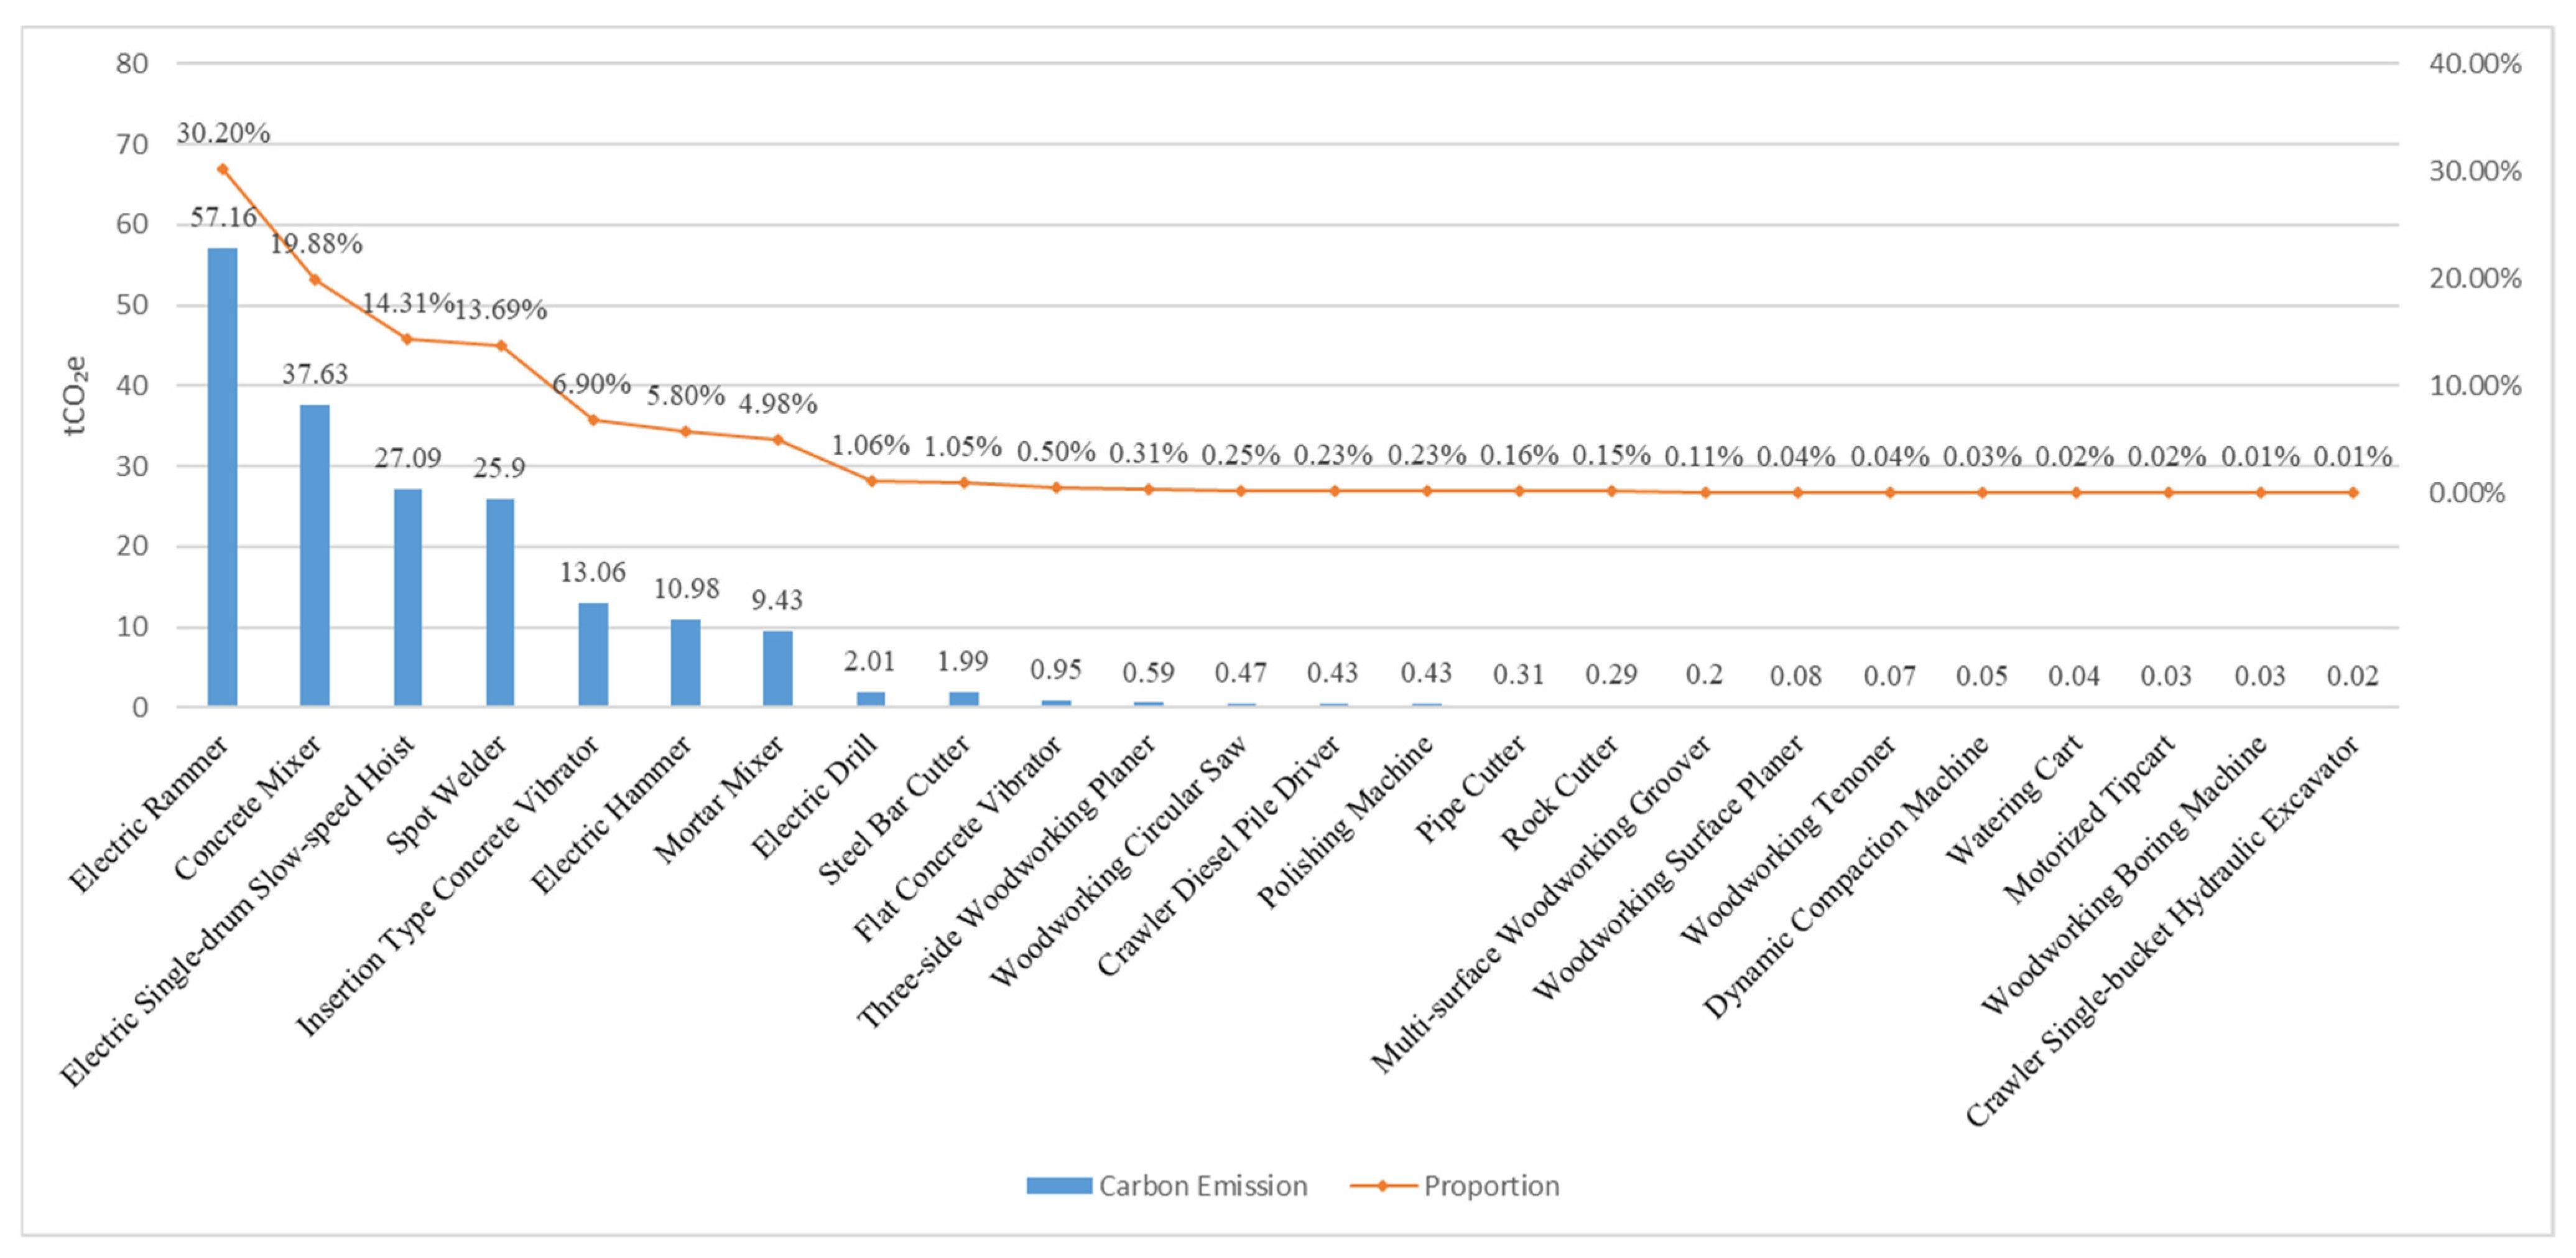
Section 2, combined with the machinery shift consumption data of the construction party, the calculated carbon emissions and their proportions in the construction stage are shown in
Figure 8. It can be seen that the total carbon emissions of the project in the construction stage are 189.26 tCO
2e. Among them, the electric rammer, concrete mixer and electric hoist have relatively high carbon emissions, with values of 57.16 tCO
2e, 37.63 tCO
2e and 27.09 tCO
2e respectively, accounting for 30.20%, 19.88% and 14.31%. Such machinery features large shift consumption and high energy consumption, which are the key equipment for carbon emission control in the construction stage.
3.3.4. Calculation of Carbon Emissions in the Building Operation Stage
The calculation scope of carbon emissions in the building operation stage includes the carbon emissions of HVAC, domestic hot water, lighting, elevators and other systems during the building operation period. The energy consumption is simulated for the whole year by using the simulation software of PKPM (2025 version). [
21], and the simulation results are shown in
Table 8. Energy consumption in the operation stage is dominated by electricity, with the carbon emission factor of electricity consumption set at 0.0006191 tCO
2e/kWh [
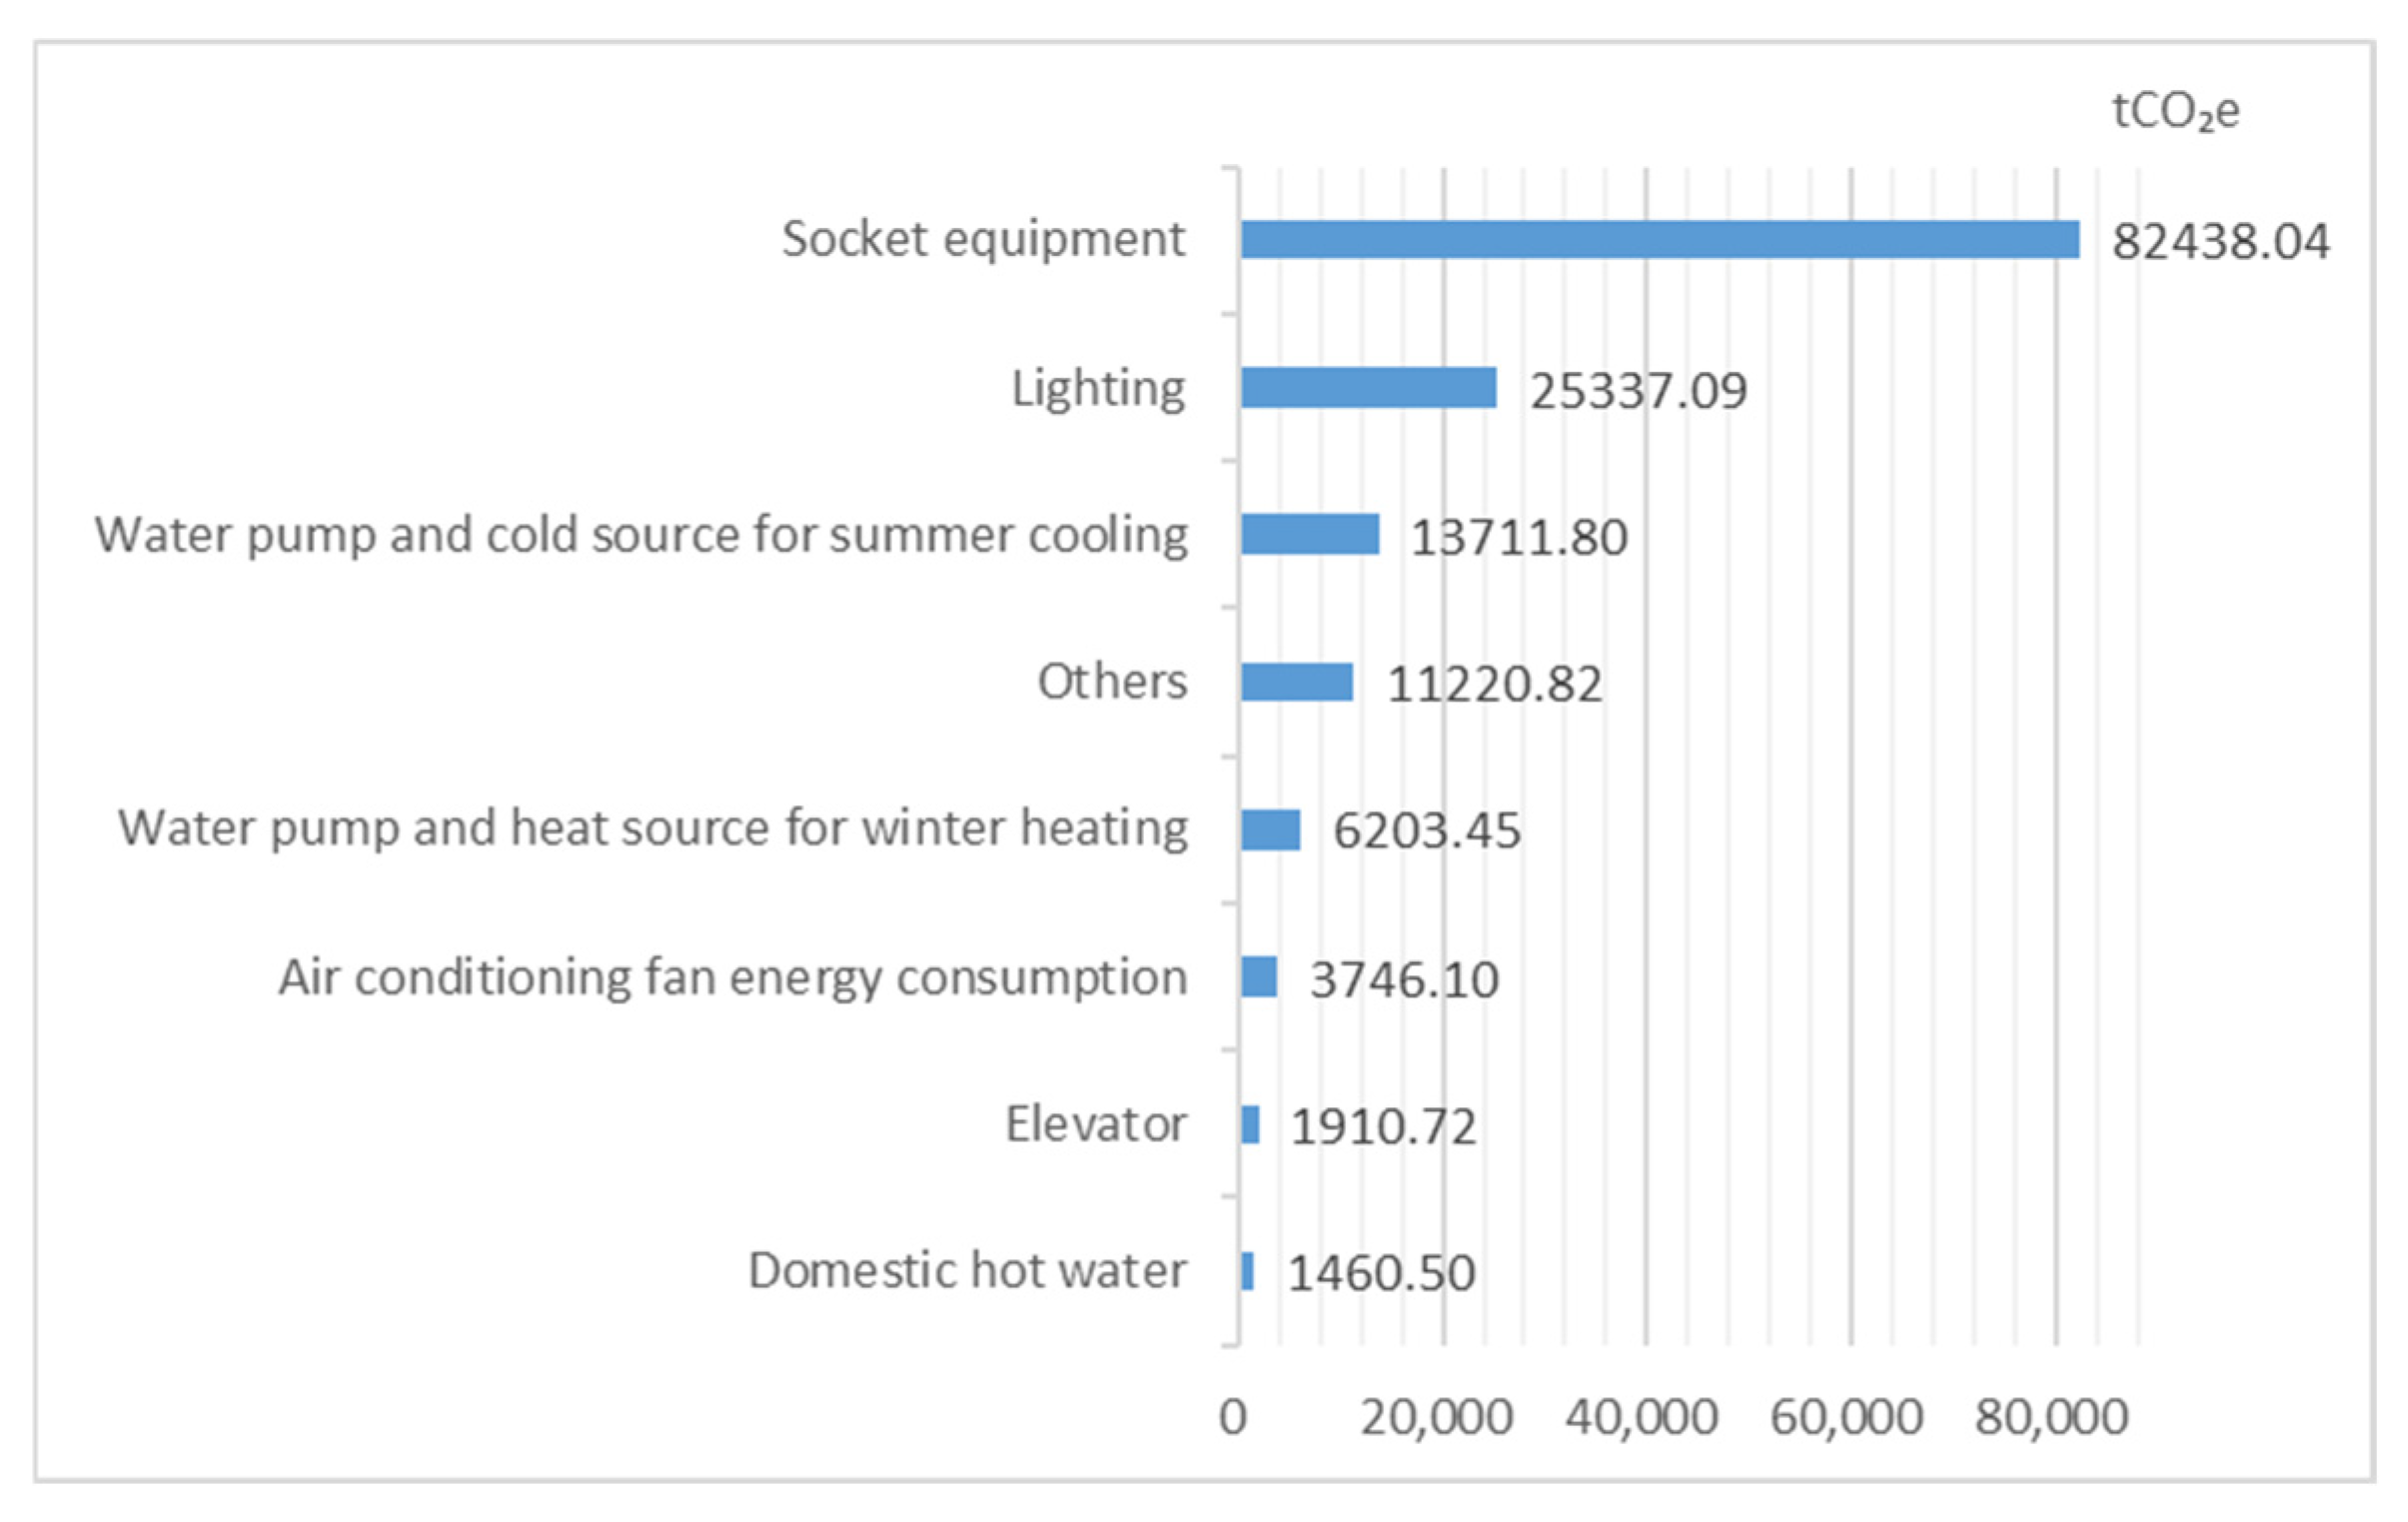
22]. Substituting this data into Equation (5), the total terminal carbon emissions of the project during the 50-year operation stage are calculated to be 146,028.53 tCO
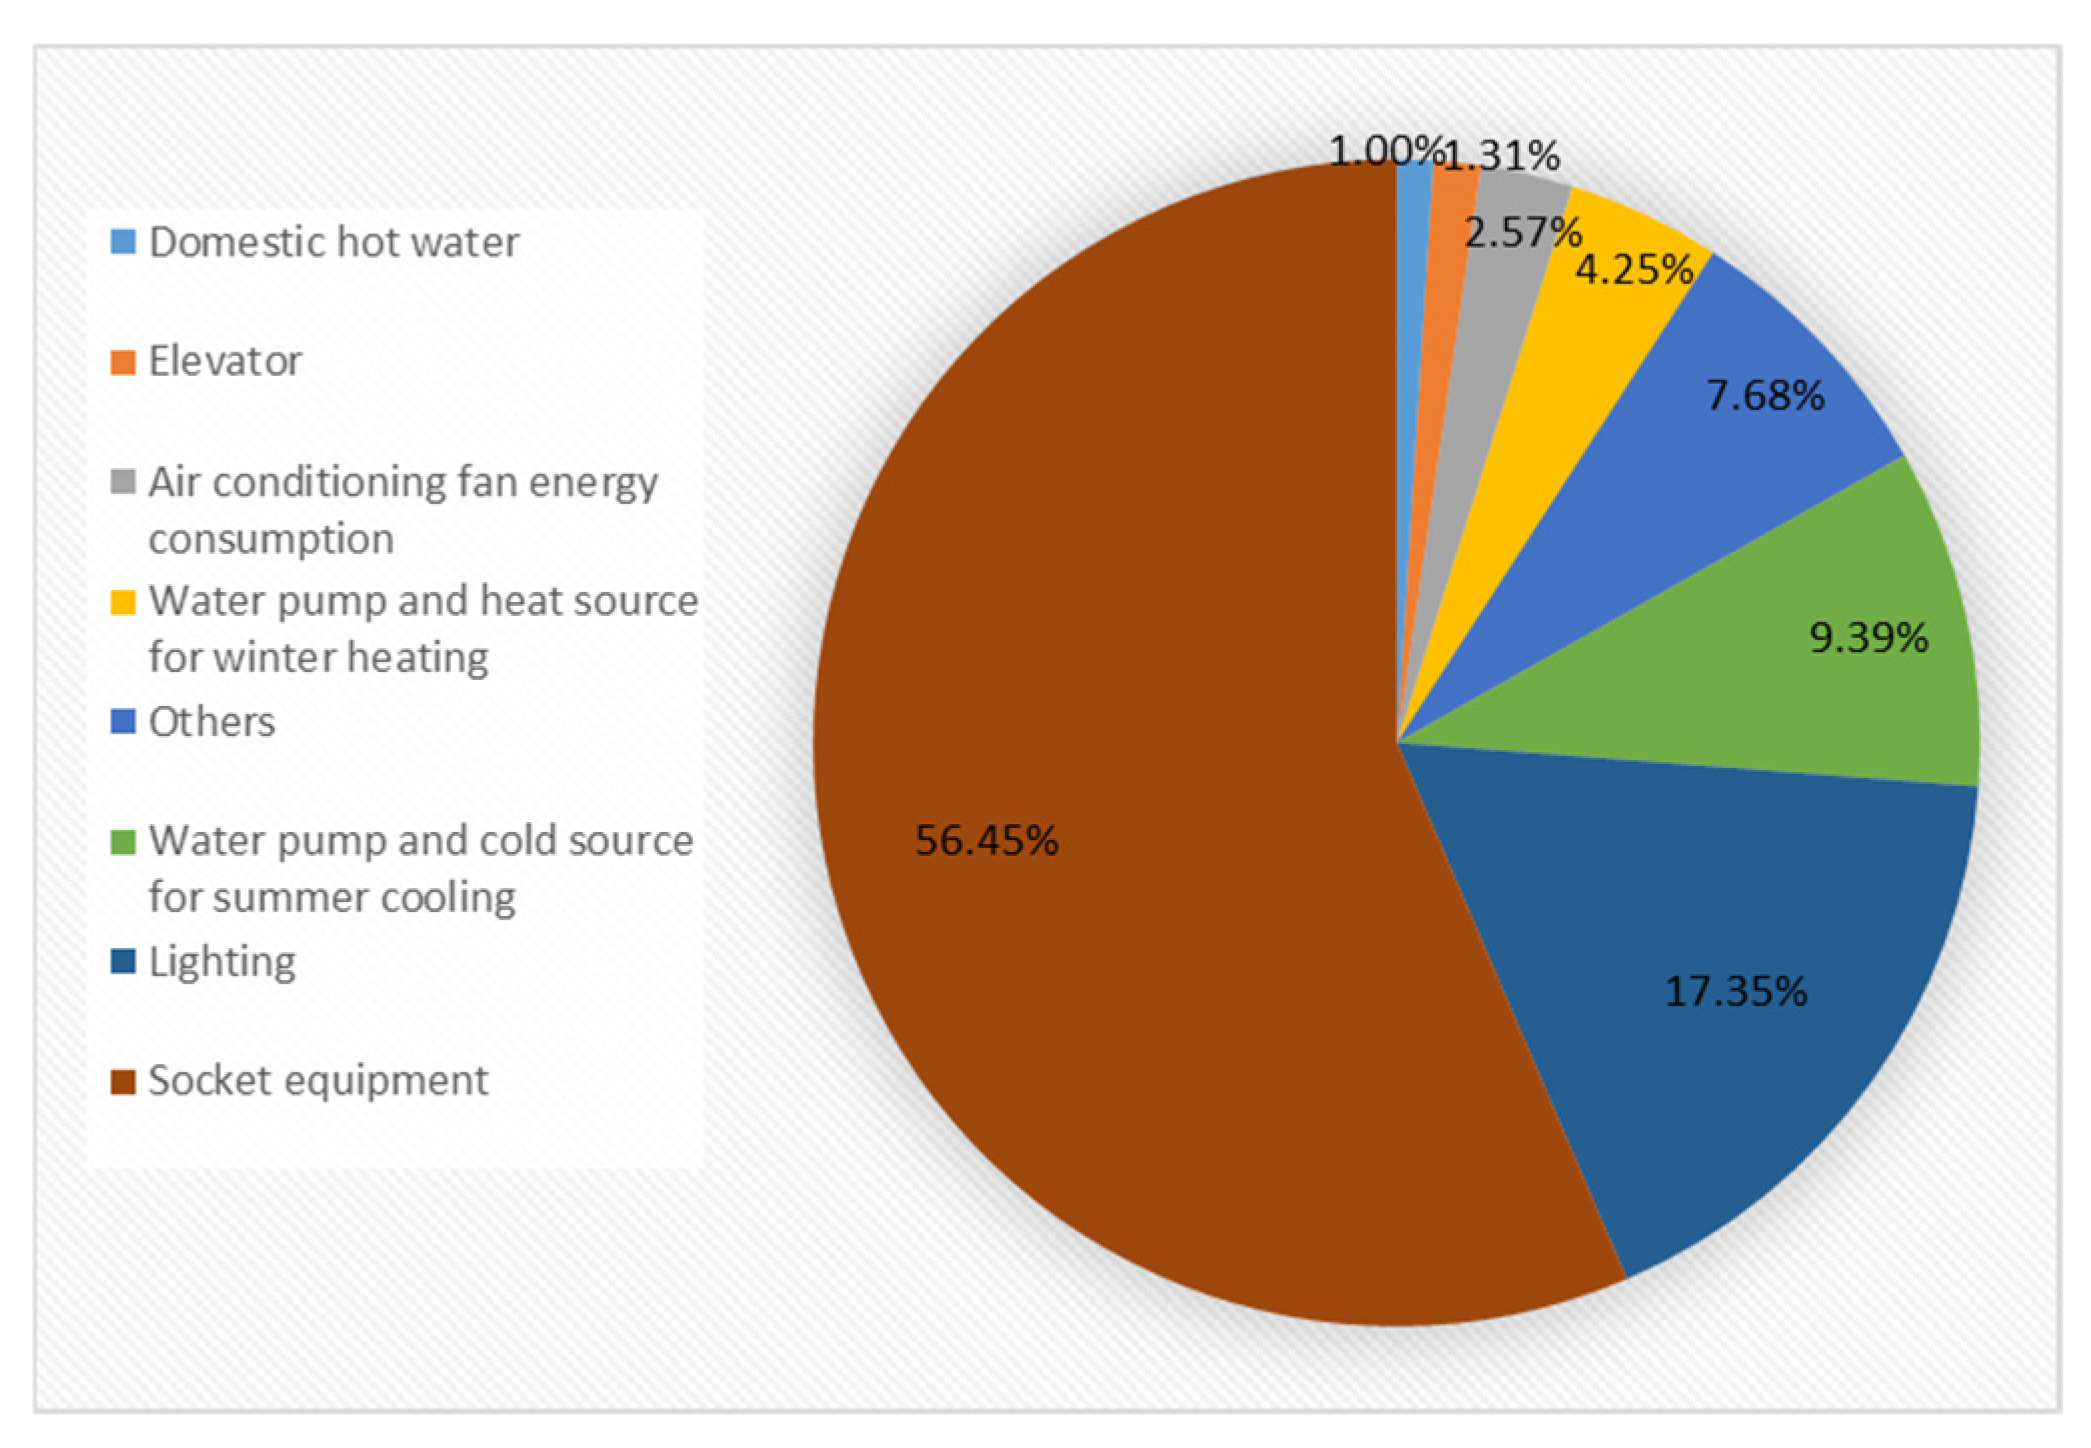
2e. The carbon emissions and their proportions of various energy consumption in the building operation stage are shown in
Figure 9 and
Figure 10. Among them, socket equipment, lighting and air conditioning for cooling in summer are the core energy consumption links, with carbon emissions of 82,438.04 tCO
2e, 25,337.09 tCO
2e and 13,711.80 tCO
2e respectively, accounting for 56.45%, 17.35% and 9.39%.
The project features a photovoltaic power generation system installed on the roof and exterior walls. The rooftop photovoltaic area covers 3042.28 square meters, accounting for 48.65% of the total roof area. The cadmium telluride curtain wall installed on the east and west exterior walls covers an area of 1442.23 square meters, accounting for approximately 7.21% of the total area of the east and west exterior walls. The total installed capacity of the photovoltaic system is 860 kilowatts. According to the standard for calculating photovoltaic power generation in China [
23], the power generation of the photovoltaic system in the first year is calculated to be 1,058,660 kWh. The service life of the photovoltaic power generation system is set at 25 years, and the annual attenuation coefficient of photovoltaic power generation is 0.8% [
24]. Therefore, the cumulative photovoltaic power generation of the building during the 50-year operation period is calculated to be 48,149,836.79 kWh, corresponding to a cumulative carbon reduction of 29,809.56 tCO
2e in the operation stage.
To increase the carbon sequestration of green plants, a large number of arbors, shrubs and lawns are planted in the outdoor area, inner courtyard and on the roof of the project, with an arbor coverage area of about 2876 m2 and a shrub coverage area of about 2297 m2. The average annual carbon sequestration coefficient of arbors is set at 14.3 kgCO2/(m2·a), and that of shrubs is 8.15 kgCO2/(m2·a). Substituting the above data into Equation (6), the annual carbon sequestration of arbors and shrubs in the project is calculated to be about 59.79 tCO2e, and the cumulative carbon sequestration during the 50-year operation period is 2989.5 tCO2e.
Therefore, after deducting the carbon emission offsets from building photovoltaic power generation and plant carbon sink, the final carbon emissions of the project during the 50-year operation period are 113,229.462 tCO2e.
3.3.5. Calculation of Carbon Emissions in the Building Demolition Stage
Due to the lack of design basis for water, power and other resource consumption during the building demolition stage, this paper refers to the existing relevant literature [
25,
26,
27], which indicates that the carbon emissions of the demolition process generally range from 10% to 100% of those during the construction stage. Meanwhile, the provincial standard Calculation Standard for Civil Building Carbon Emissions [
28] recommends that the carbon emissions of the building demolition stage be taken as 10% of the construction stage carbon emissions. Therefore, the carbon emissions of the demolition stage in this project are set to 10% of the construction stage emissions. Consequently, the carbon emissions from the building demolition stage are calculated to be 18.93 tCO
2e.
3.4. Summary
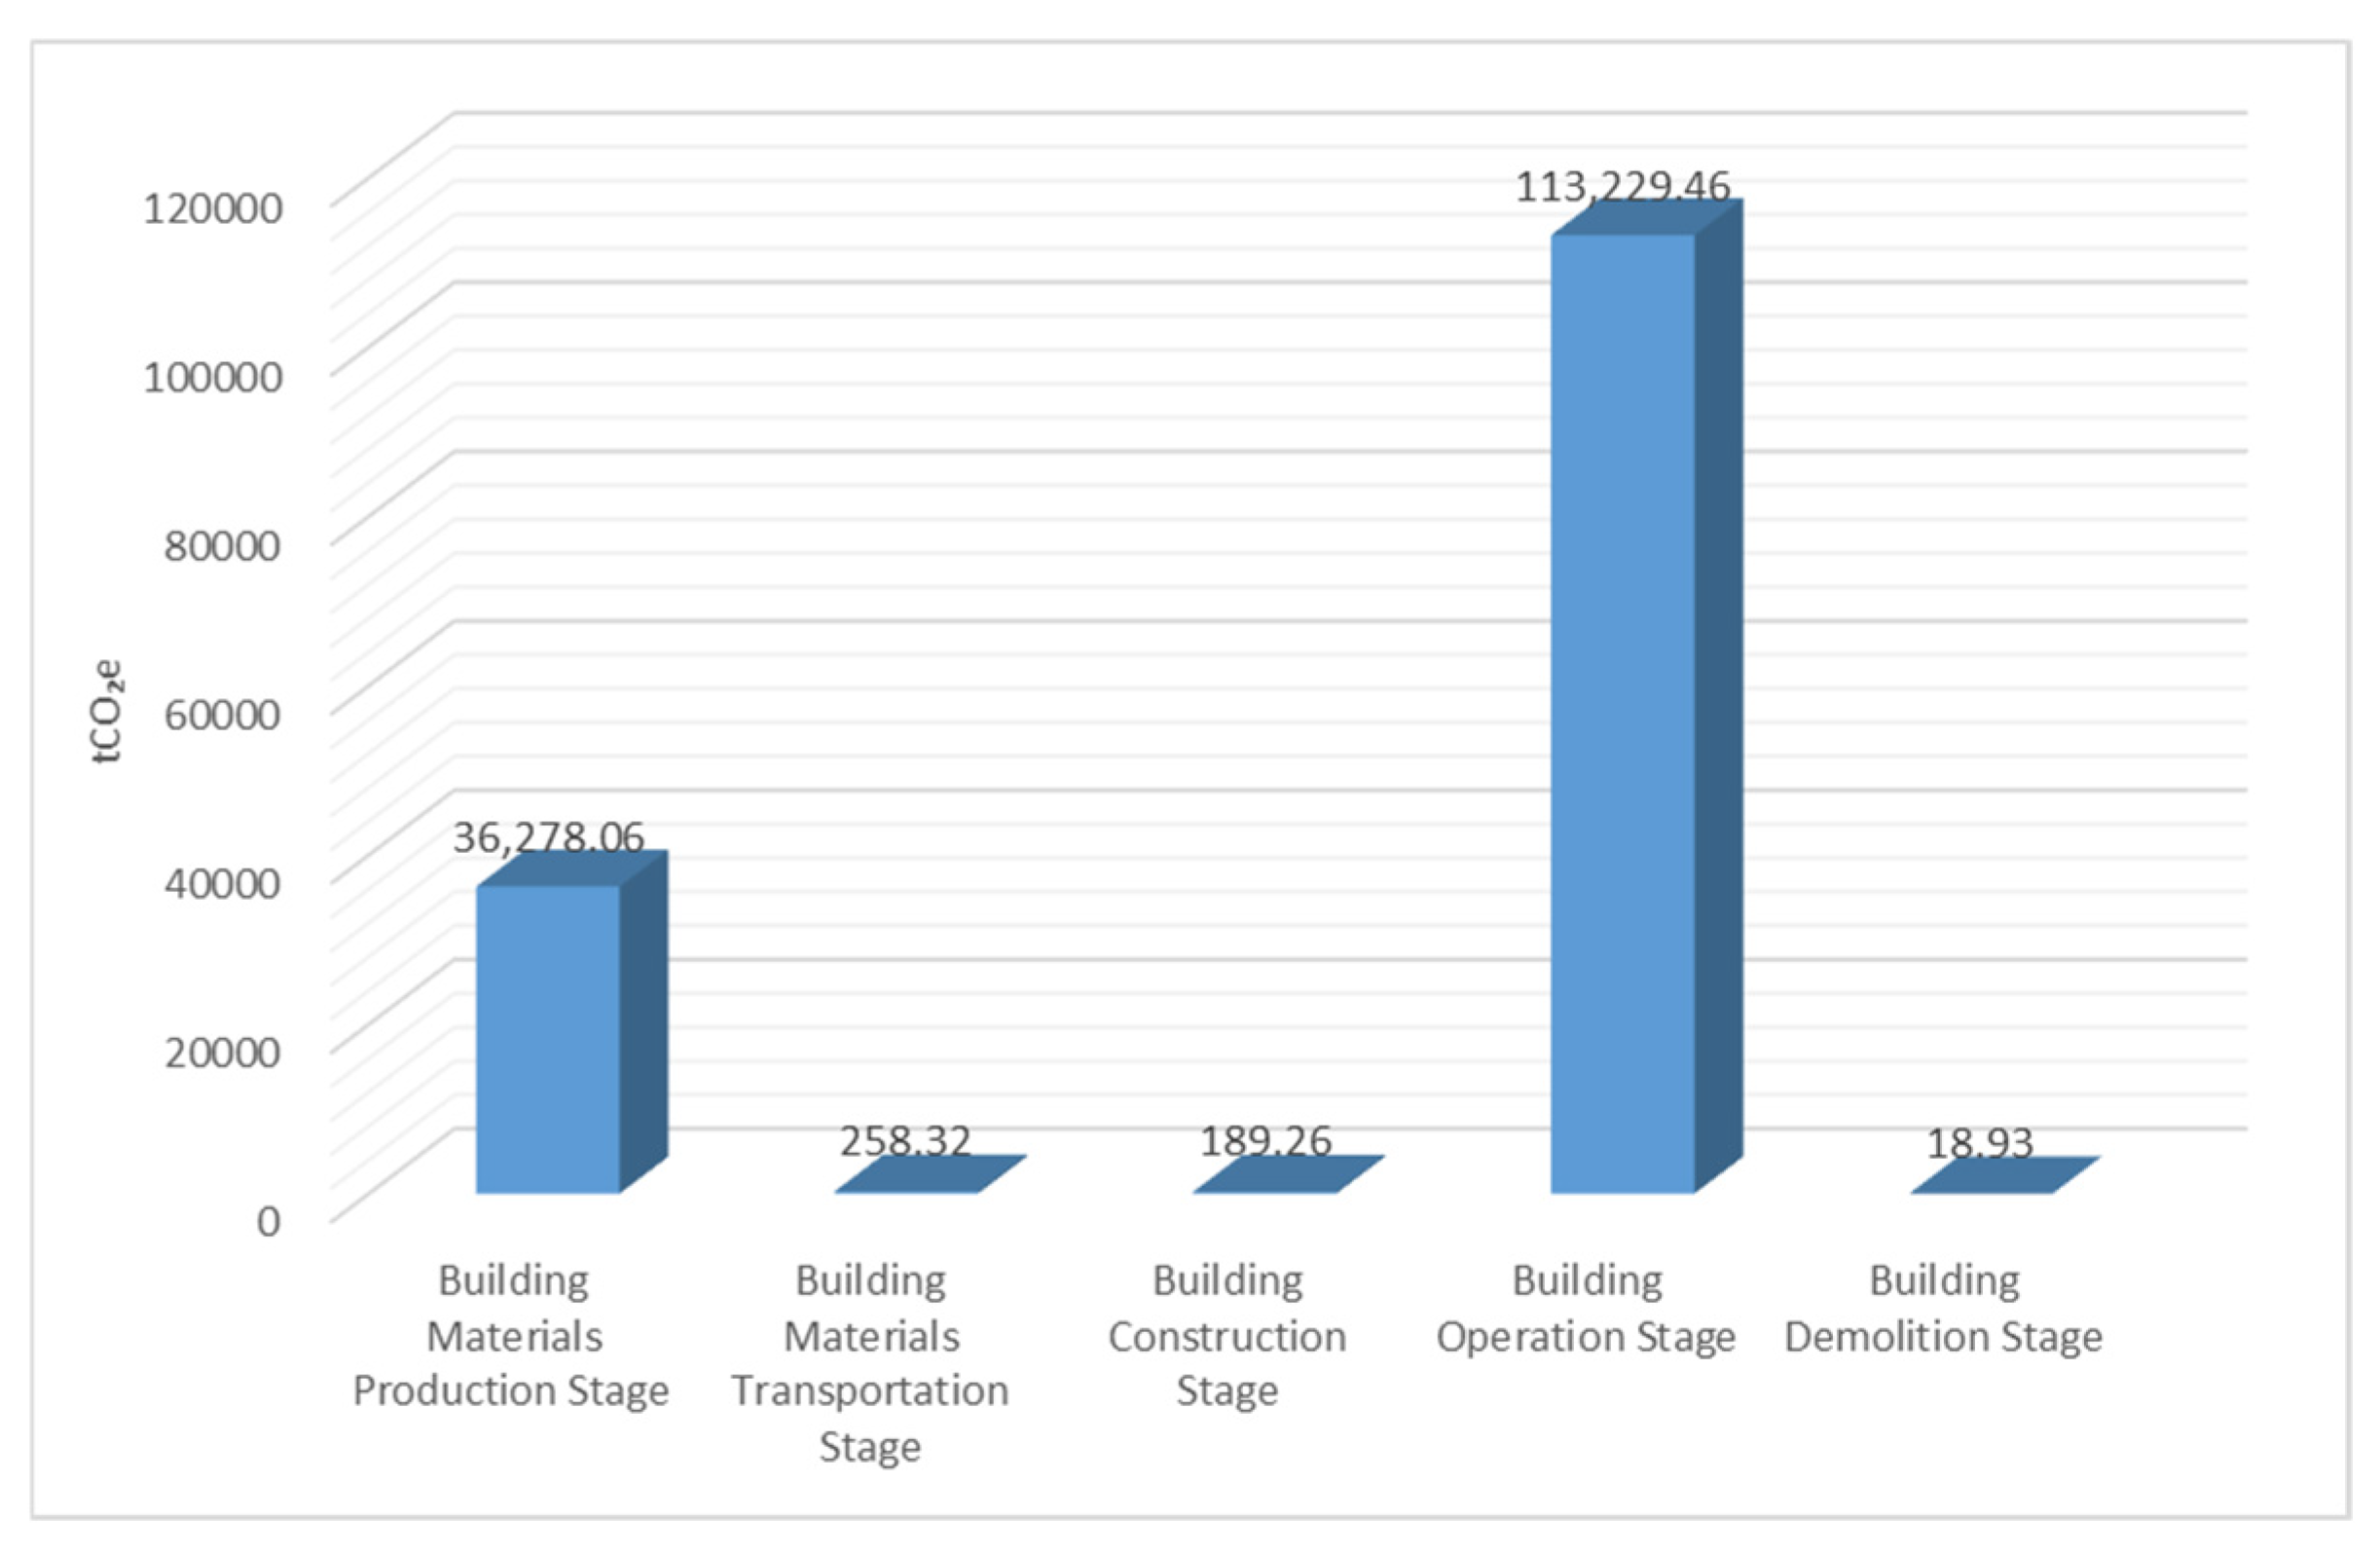
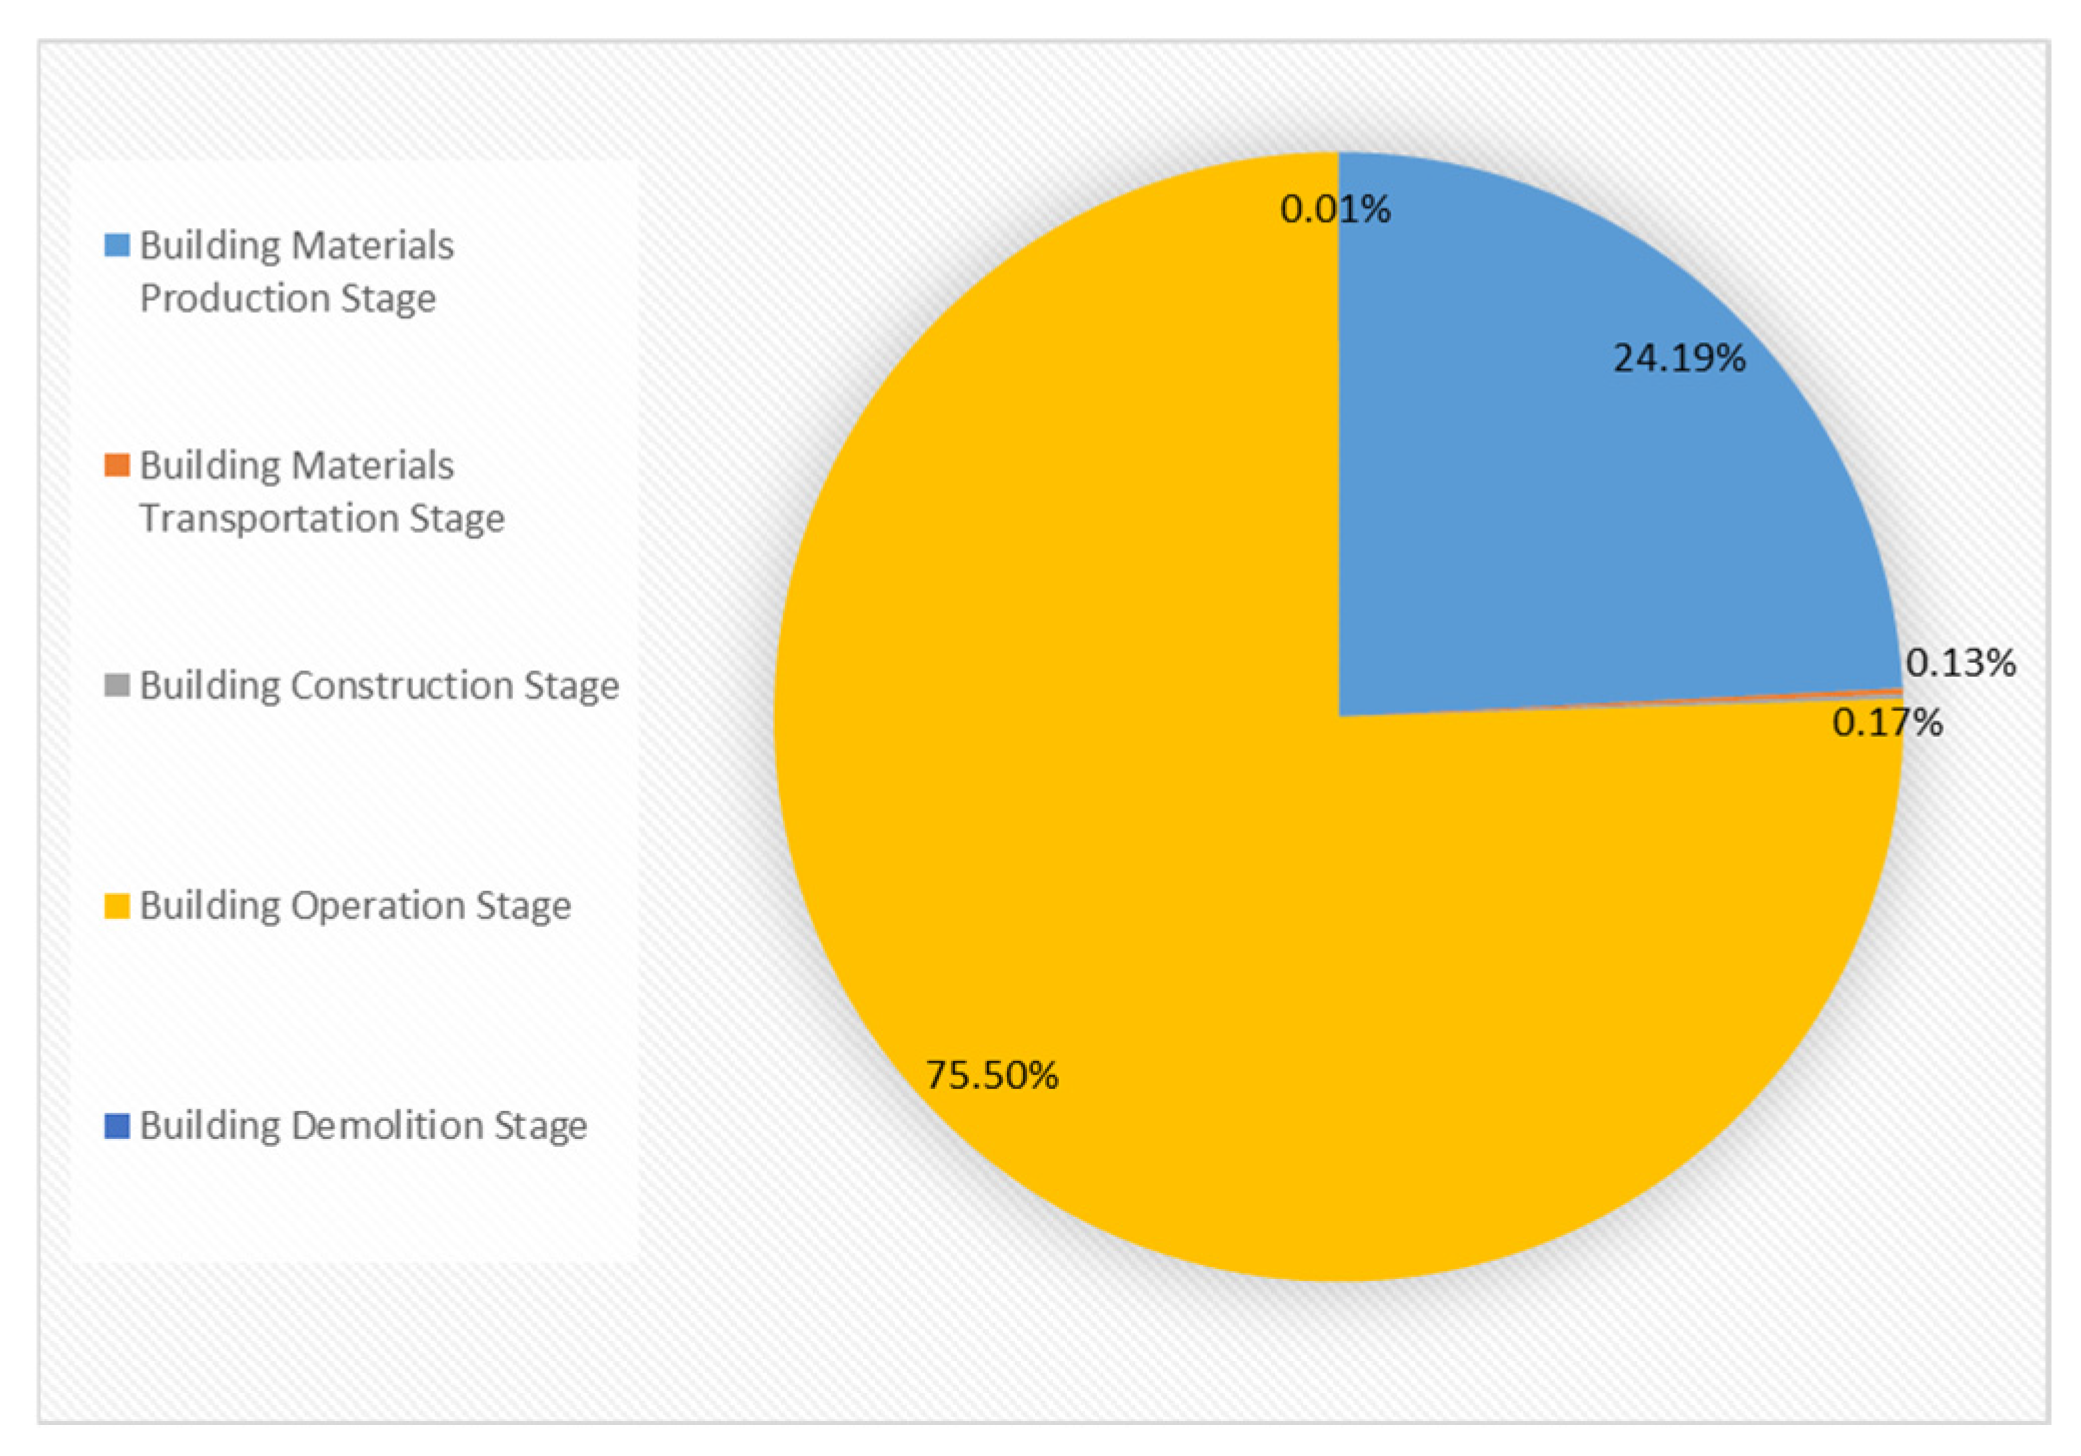
According to the above calculations, the total life-cycle carbon emissions of the project are 149,974.04 tCO
2e, and the carbon emissions and their proportions at each stage are shown in
Figure 11 and
Figure 12. Among them, the operation stage and building material production stage are the core carbon emission stages, with carbon emissions of 113,229.46 tCO
2e and 36,278.06 tCO
2e respectively, accounting for 75.50% and 24.19%; the carbon emissions in the building material transportation, construction and demolition stages are relatively small, with values of 258.32 tCO
2e, 189.26 tCO
2e and 18.93 tCO
2e respectively, accounting for less than 1% in total. It can be seen that the carbon emission control of zero-carbon buildings should focus on the operation stage and building material production stage, and achieve a substantial reduction in carbon emissions through targeted measures.
4. Discussion
Zero-carbon buildings have two core goals: zero carbon in the operation stage and zero carbon in the full life cycle. Based on the above calculation and analysis, even though the case project has adopted photovoltaic power generation and plant carbon sink measures, it still fails to meet the relevant requirements of zero-carbon buildings, and further carbon offset measures are needed to achieve zero carbon in the operation stage or the full life cycle. At present, the commonly used carbon offset measures in the construction field are mainly increasing photovoltaic power generation and purchasing green electricity certificates. This chapter uses the equivalent annual cost (EAC) method to analyze the economic efficiency of the two methods respectively, providing a basis for the selection of carbon reduction strategies.
The equivalent annual cost method is a financial analysis method used to compare projects with different service lives or cash flows. Its core is to amortize all costs of the project throughout the life cycle (including initial investment, future maintenance costs, operation costs, etc.) to each year of the project service life through a given discount rate, so as to obtain an equal annual annuity cost. This method converts the irregular cash flows at different time points into an equal annual virtual cost sequence, making the costs of different investment schemes comparable. The calculation formula is shown in Equation (8):
where
is the capital costs,
is the discount rate, and
is the number of periods.
To ensure the objectivity and comparability of the analysis, the following assumptions are made in this study: the average photovoltaic power generation is based on the power generation in the first year; all photovoltaic power generation can be consumed by the building; the photovoltaic power generation system has no residual value at the end of its service life; the discount rate is 10%; and the grid carbon emission factor and green electricity purchase price are based on the latest values announced by China in 2025, without considering future dynamic changes. This simplified calculation meets the estimation requirements of zero-carbon buildings in the construction field at the planning and design stage.
4.1. Achieving the Zero-Carbon Building Requirement in the Operation Stage
4.1.1. Economic Analysis of Carbon Emission Offset by Increasing Photovoltaic Power Generation in the Operation Stage
Based on the current design, to achieve zero carbon in the building operation stage, the energy consumption to be offset by photovoltaic power generation during the operation period is 182,893,655.30 kWh. According to the photovoltaic design standard [
23], the corresponding installed photovoltaic capacity is 2971.46 kW. Referring to the average construction cost of photovoltaic power generation in China of
$0.57 per watt [
29,
30], the initial investment in photovoltaic power generation is
$1,697,979.86. Considering that the service life of the photovoltaic power generation system is 25 years and the design service life of the building is 50 years, a re-investment in the photovoltaic power generation system of the same scale is required in the 26th year. In addition, the annual operation and maintenance cost of photovoltaic systems is
$0.0066 per watt [
31], with annual PV O&M cost amounting to
$19,526.77. Calculated according to the EAC formula, the equivalent annual cost of achieving zero carbon in the operation stage by increasing photovoltaic power generation is
$206,589.58.
4.1.2. Economic Analysis of Carbon Emission Offset by Purchasing Green Electricity in the Operation Stage
If green electricity is purchased to achieve zero carbon in the building operation stage, the cumulative 50-year green electricity purchase volume is 182,893,655.30 kWh. According to the latest price of green electricity certificates in China of
$0.74 per certificate [
32], with each certificate corresponding to 1000 kWh of electricity, the annual cost of purchasing green electricity certificates is
$2691.15. In addition, since the photovoltaic power generation system is not adopted to provide all the terminal energy of the building, 3,657,873.11 kWh of electricity needs to be purchased from the municipal power grid every year, with the electricity price of the municipal power grid set at
$0.086 per kWh, and the annual cost of purchasing electricity from the power grid is
$313,531.98. Calculated according to the EAC formula, the equivalent annual cost of achieving zero carbon in the operation stage is
$316,223.13.
4.2. Achieving the Zero-Carbon Building Requirement in the Full Life Cycle
4.2.1. Economic Analysis of Carbon Emission Offset by Increasing Photovoltaic Power Generation in the Full Life Cycle
Calculated by the same method, to achieve zero carbon in the life cycle of the building, the energy consumption to be offset by photovoltaic power generation is 242,245,252.00 kWh. The corresponding initial investment in photovoltaic power generation of $2,248,998.51, with the total annual PV O&M cost amounting to $25,863.48. Considering the secondary investment within the 50-year service life of the building, the equivalent annual cost of achieving zero carbon in the full life cycle by increasing photovoltaic power generation is calculated to be $273,630.84.
4.2.2. Economic Analysis of Carbon Emission Offset by Purchasing Green Electricity in the Full Life Cycle
If green electricity is purchased to achieve zero carbon in the full life cycle of the building, the cumulative 50-year green electricity purchase volume is 242,245,252.00 kWh, and the annual cost of purchasing green electricity certificates is $3564.47, and the annual cost of purchasing electricity from the power grid is $313,531.98. Combined with the cost of purchasing electricity from the municipal power grid, calculated according to the EAC formula, the equivalent annual cost of achieving zero carbon in the full life cycle is $317,096.45.
4.3. Summary
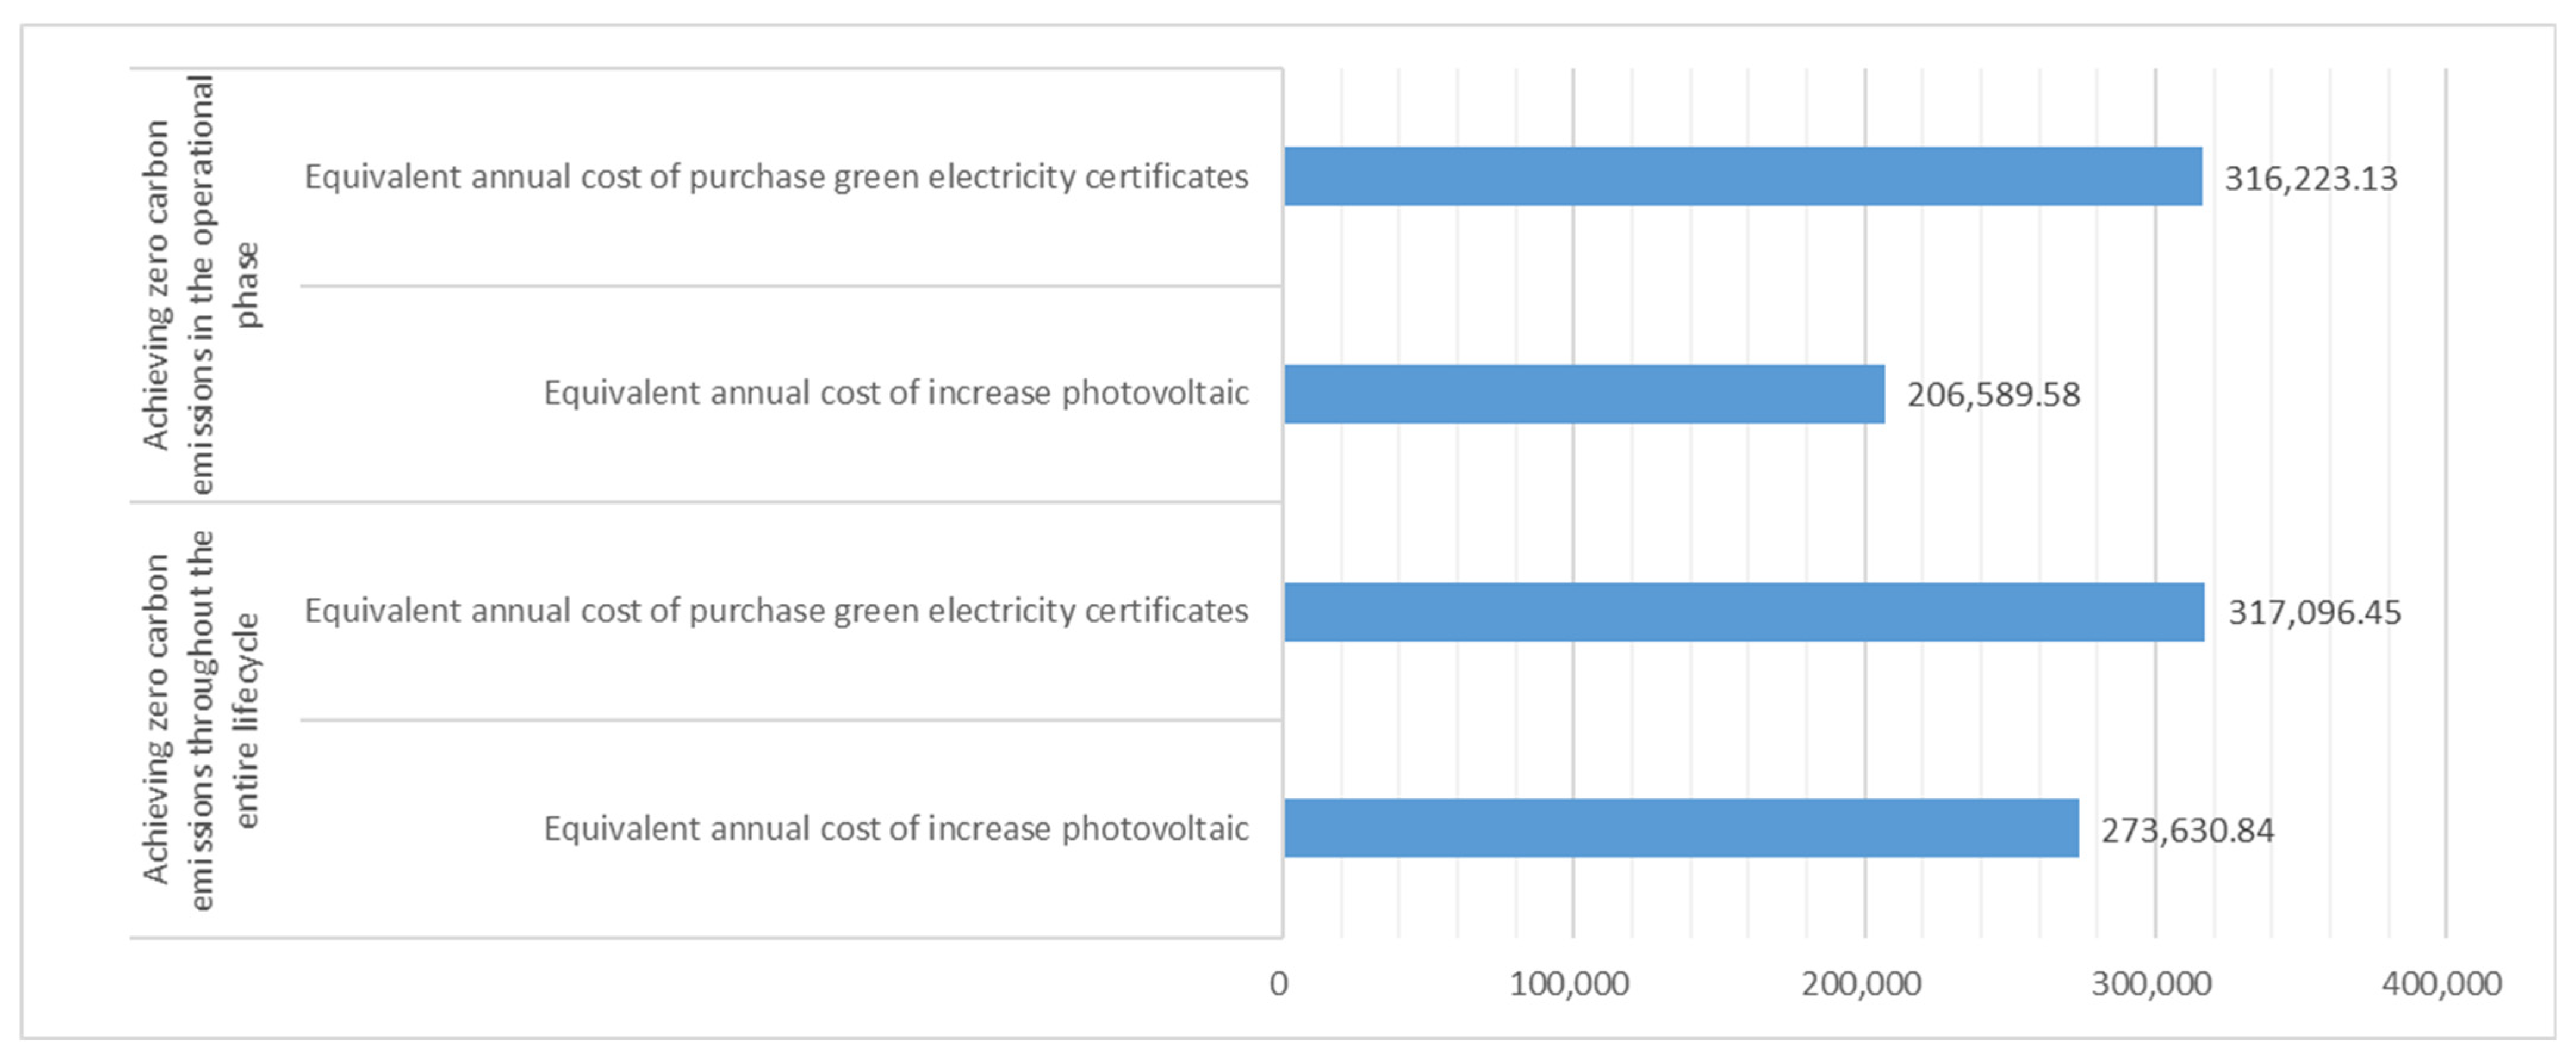
Based on the above analysis, although the initial investment in adding a photovoltaic power generation system is relatively high, it offers more significant benefits for achieving zero-carbon building goals in the long run. Comparative analysis using equivalent annual costs shows that adding a photovoltaic system achieves equivalent annual costs of
$206,589.58 and
$273,630.84 for operation stage and life-cycle zero-carbon targets, respectively. In contrast, purchasing green power certificates annually to achieve the same goals incurs equivalent annual costs of
$316,223.13 and
$317,096.45, representing annual savings of 34.67% and 13.71%, as illustrated in
Figure 13.
5. Conclusions
Based on the Life Cycle Assessment method, this study constructs a full life-cycle carbon emission accounting system for zero-carbon buildings, and takes the Jinan Zero-Carbon Operation Center Project as a case to complete the quantitative accounting of carbon emissions at all stages of the life cycle. Meanwhile, it comparatively analyzes the economic efficiency of two carbon offset strategies, increasing photovoltaic power generation and purchasing green electricity, for achieving the zero-carbon building goal. The core conclusions are as follows:
The life-cycle carbon emissions of zero-carbon buildings show significant stage differences, with the operation stage and building material production stage being the core carbon emission links. The total life-cycle carbon emissions of the case project are 149,974.04 tCO2e, with the operation stage accounting for 75.50% and the building material production stage 24.19%, while the total proportion of carbon emissions in the transportation, construction and demolition stages is less than 1%. This characteristic indicates that the carbon emission control of zero-carbon buildings should adhere to the principle of “focused breakthrough”, taking the improvement of energy efficiency and the utilization of renewable energy in the operation stage, as well as the selection of low-carbon materials and the reduction in high-carbon-emitting materials in the building material production stage as the core control directions.
From the perspective of equivalent annual cost, increasing the photovoltaic power generation system is a more economical carbon offset strategy than purchasing green electricity. Whether for the zero-carbon goal in the operation stage or the full life cycle, the equivalent annual cost of increasing photovoltaic power generation is significantly lower than that of purchasing green electricity, and the longer the building service life, the more obvious the cost advantage of photovoltaic power generation. This conclusion indicates that although photovoltaic power generation has a high initial investment threshold, it has significant economic feasibility from a long-term operation perspective, and is the preferred technical solution for zero-carbon buildings to achieve the carbon neutrality goal.
The building life-cycle carbon emission accounting method based on “activity data × emission factor” constructed in this study complies with the requirements of international standards and domestic specifications, is suitable for the quantitative analysis of carbon emissions in the planning and design stage of zero-carbon buildings, and can provide a standardized reference for the carbon emission accounting of similar buildings.
This study still has certain limitations. For example, the carbon emissions in the demolition stage are estimated due to the lack of measured data, and the economic analysis of carbon reduction strategies does not consider the dynamic changes in future green electricity prices and photovoltaic construction costs. Future research can further carry out the measured research on carbon emissions in the building demolition stage, construct a dynamic economic analysis model combined with market price fluctuations, and improve the accuracy and applicability of the research results. At the same time, it can explore the combined carbon reduction strategies of low-carbon building materials, energy-saving construction technologies with photovoltaic power generation and carbon sink enhancement, so as to provide a more comprehensive technical and economic solution for zero-carbon buildings.
The low-carbon transformation of the construction industry is the key to achieving the “carbon peaking and carbon neutrality” goals, and the development of zero-carbon buildings needs to balance technical feasibility and economic rationality. This study verifies the economic advantages of photovoltaic power generation in carbon reduction in zero-carbon buildings through practical cases, which can provide a decision-making basis for the planning, design and carbon reduction strategy selection of zero-carbon buildings, and also offer a method reference for the life-cycle carbon emission management and control of the construction industry, helping the construction industry develop towards a green, low-carbon and high-quality direction.