


Abstract
Driven by China’s “dual carbon” (carbon peak and carbon neutrality) goals and the national strategy of new-type urbanization, prefabricated construction has emerged as a pivotal pathway toward industrialized and sustainable development in the construction sector—leveraging its distinctive advantages in construction efficiency, cost optimization, environmental performance, and design adaptability. Nevertheless, the inherently sequential and interdependent nature of the full construction process—encompassing off-site component manufacturing, logistics transportation, and on-site assembly—introduces pronounced cross-stage risk transmission mechanisms, with prefabricated components serving as critical risk carriers. Such transmission dynamics significantly impede the scalable and safe deployment of prefabricated construction. To date, scholarly efforts on construction safety in prefabricated buildings have predominantly addressed isolated, stage-specific risks, falling short in quantitatively modeling the coupled propagation of risks across stages, accommodating epistemic uncertainties and latent (i.e., unknown or unobserved) risks, and informing targeted, evidence-based mitigation strategies. To bridge this gap, this study develops a rigorous quantitative framework for assessing cross-stage risk transmission in prefabricated construction safety. Specifically, it aims to (i) uncover the structural patterns and driving mechanisms underlying inter-stage risk propagation; (ii) reduce the likelihood of safety incidents throughout the construction life cycle; and (iii) deliver actionable theoretical insights and methodological guidance for practitioners and policymakers. Methodologically, we first conduct a systematic identification of safety-critical risk factors and establish a hierarchical risk indicator system comprising three first-level dimensions and twenty second-level indicators. Second, using the Decision-Making Trial and Evaluation Laboratory (DEMATEL) method, causal relationships among risk factors are clarified, while incorporating the Leaky Noisy-or Gate (LNOG) extended model to account for unknown risks. Risk data are processed using triangular fuzzy functions, and a Bayesian network (BN) topology diagram is constructed via the GeNIe 5.0 platform, forming a DEMATEL-LNOG-BN-based model for assessing cross-phase risk transmission. Finally, applying the model to an actual project—”a prefabricated construction project in Shanghai”—the study conducts a cross-phase risk transmission analysis. Through forward probability inference, backward causality tracing, sensitivity analysis, and pathway decomposition, sensitivity comparisons are performed under different LNOG unknown risk parameters. Results are compared with those from the traditional DEMATEL-BN model to validate the stability and consistency of high-sensitivity risk factor identification, comprehensively verifying the applicability and predictive reliability of the proposed DEMATEL-LNOG-BN model. The study quantitatively reveals the progressive diffusion and amplification mechanisms of risks across the production–transportation–assembly process, providing scientific support and practical reference for precise safety risk prevention, critical node control, and the optimization of management systems in prefabricated construction sites.
1. Introduction
Driven by China’s “dual carbon” (carbon peak and carbon neutrality) goals and the national strategy of new-type urbanization, the construction industry—long recognized as a pillar sector of the Chinese economy—is undergoing a fundamental paradigm shift: from quantitative expansion toward qualitative advancement centered on safety, sustainability, and systemic efficiency. Prefabricated construction has emerged as a strategic enabler of this transition, leveraging its distinctive advantages in construction efficiency, cost optimization, environmental performance, and design adaptability to address persistent challenges in traditional construction—including high energy intensity, low productivity, and elevated on-site safety risks. As stipulated in the “14th Five-Year Plan for the Development of the Construction Industry”, China aims to accelerate the adoption of prefabricated construction, targeting a share of over 30% in newly constructed buildings by 2025 [1]. Prefabricated projects follow an integrated value chain comprising off-site component manufacturing, logistics transportation, and on-site assembly. Among these, assembly operations constitute a critical and high-hazard phase: characterized by the handling of large-scale, heavy prefabricated components; complex spatial coordination; stringent lifting requirements; and intensive multi-trade collaboration—factors that collectively heighten susceptibility to occupational hazards such as falling object strikes, crane-related injuries, and structural collapse. Consequently, safety risk management in prefabricated assembly is inherently more complex and demanding than in conventional cast-in-place construction [2].
In recent years, scholars worldwide have advanced diverse methodological approaches to assess and mitigate safety risks in prefabricated construction. Forteza et al. proposed a novel risk assessment framework tailored to prefabricated construction workflows [3]; Shen et al. developed a cloud-based Bayesian network model to enable dynamic, real-time safety evaluation during hoisting operations [4]; Wang et al. integrated fault tree analysis (FTA), set pair analysis (SPA), and grey clustering to establish a holistic safety evaluation system [5]; Wang et al. refined the accident causation model to strengthen upstream risk governance and root-cause intervention [6]; and Jiang et al. employed a variable-weight matter-element extension approach to enhance the precision and responsiveness of hoisting risk quantification [7]. While valuable, these studies predominantly focus on stage-specific risk identification and static assessment—largely overlooking the dynamic, interdependent nature of risk propagation across the production–transportation–assembly continuum. A systematic understanding of cross-stage risk coupling, transmission pathways, and amplification mechanisms remains notably underexplored.
A Bayesian network (BN) is a probabilistic graphical model used to represent and reason about uncertainty in complex systems. In such systems, systematically analyzing the causal relationships and interaction mechanisms among multiple risk factors constitutes a critical pathway to enhancing the effectiveness of risk governance [8]. As a graph-based model endowed with probabilistic reasoning capabilities, BNs have been widely adopted across interdisciplinary domains—particularly in safety risk analysis [9] and quantitative risk assessment [10]. Chen et al. employed BN-based inference to identify specific risk transmission paths within multi-dimensional operational spaces [11]; Yang et al. applied dynamic Bayesian networks (DBNs) to conduct a time-dependent safety risk analysis during hoisting operations in prefabricated construction [12]. Building on this foundation, subsequent studies have integrated system-theoretic process analysis-temporal modeling (STPA-TM) to enable the intelligent, causally informed identification and analysis of construction safety risks [13], and developed prefabricated-building-specific safety risk assessment frameworks aligned with domestic engineering practices [14]. By refining the DEMATEL-ISM hybrid method, researchers clarified key influencing factors in lifting operations and further incorporated prospect theory to account for behavioral characteristics of decision-makers [15,16]. Dynamic ontology-enhanced BNs have enabled intelligent risk reasoning and real-time updates, while interpretable ensemble learning has supported the precise identification and prediction of construction delay risks [17,18]. Human-induced risk prediction and control schemes for hoisting operations have been formulated, and occupational health and safety (OHS) management performance in prefabricated construction has been systematically quantified [19,20]. A compliance-driven framework for rework risk identification in prefabricated construction has revealed intrinsic correlations between prefabricated structural productivity and accident risk [21,22], and the risk transmission mechanism across the prefabricated building supply chain has been thoroughly investigated [23]. Concurrently, research has expanded the theoretical frontiers of risk management through lenses of intelligent technologies, deep learning, and stakeholder interaction dynamics [24,25,26]. The fuzzy DEMATEL-ANP method has been utilized to accurately prioritize lifting safety-critical factors, and knowledge graph techniques have significantly improved the practical usability and domain interpretability of risk assessments [27,28]. From the 4M1E perspective, the application pathways of digital twins in construction safety management have been systematically mapped, and the probabilistic evolution patterns of hoisting risks have been uncovered via multivariate correlation analysis [29,30]. The G1-CRITIC weighting method and cloud models have been jointly applied to enhance the objectivity of risk assessment outcomes; meanwhile, BIM-ontology integration has facilitated intelligent upgrades in construction safety risk management [31,32]. Digital twin-augmented BNs have enabled the in-depth analysis of risk coupling effects in lifting operations [33]. Integrating STPA with BNs has refined safety risk analysis methodologies for lifting construction and yielded comprehensive assessment systems for accident causation-driven coupling risks [34,35]. Finally, coupling-path identification has empirically delineated key safety risk factors and their systemic transmission pathways in large-scale construction projects [36]. In the domain of numerical simulation and experimental validation for prefabricated structures, Garbowski et al. conducted a rigorous comparative study between high-fidelity finite element models and physical test data on precast concrete floor systems, establishing a well-validated methodological framework for the structural modeling of prefabricated buildings [37].
While substantial progress has been made in construction safety research for prefabricated buildings, the majority of existing studies adopt a phase-isolated approach—focusing exclusively on production, transportation, or on-site assembly in isolation. Such fragmentation obscures the systemic interdependencies among risk factors and fails to capture the dynamic transmission and cumulative amplification of risks across sequential phases. Furthermore, few studies holistically integrate causal inference, explicit treatment of epistemic uncertainties and latent (i.e., unknown or unobserved) risks, and probabilistic reasoning under data scarcity—leading to a critical gap in life cycle-oriented, integrated risk assessment frameworks. Consequently, quantitative characterization and mechanistic interpretation of cross-phase risk evolution remain limited. To address these limitations, this study develops a unified DEMATEL-LNOG-BN framework for assessing cross-phase safety risk transmission in prefabricated construction. Leveraging DEMATEL for causal mapping, LNOG-enhanced Bayesian networks for robust uncertainty quantification, and triangular fuzzy logic for expert judgment formalization, the model enables the systematic identification of safety-critical risk factors across the full construction workflow and elucidates their inter-stage propagation pathways. Empirical validation was conducted through a comprehensive case study of the “X Prefabricated Residential Project” in Shanghai, demonstrating the model’s validity, operational feasibility, and practical utility in supporting evidence-based safety governance.
2. Development of a Cross-Stage Risk Transmission Indicator System
2.1. Distinctive Features of Cross-Stage Risk Transmission
In prefabricated construction, prefabricated components serve as critical risk transmission nodes. Safety-related risks originating in one stage—such as component manufacturing—can propagate sequentially across interdependent phases (i.e., production, transportation, and on-site assembly), with structural interconnectivity enabling the amplification of localized defects. Specifically, a defect in a single component may be magnified through load-path dependencies and system-level interactions, ultimately compromising safety performance at the final assembly stage. This cascading, stage-to-stage risk transmission mechanism in prefabricated building construction is illustrated in Figure 1.
Figure 1.
Cross-stage transmission mechanism of construction safety risks in prefabricated building projects.
2.2. Identification of Cross-Stage Transmission Risk Factors
Risk identification for prefabricated building construction is grounded in the Chinese national standard Technical Standard for Prefabricated Concrete Buildings (GB/T 51231–2016) [38], which delineates three interdependent phases—production, transportation, and on-site assembly—and encompasses six fundamental risk domains: personnel, equipment, materials, technology, management, and environment. To ensure rigor, comprehensiveness, operational relevance, and methodological validity, this study adopts an integrated methodological framework comprising a literature synthesis, accident root-cause analysis, and expert-informed questionnaire surveying—designed specifically to identify and categorize safety-critical risk factors exhibiting cross-stage transmission potential.
A systematic review was conducted across authoritative academic databases—including CNKI (China National Knowledge Infrastructure) and Web of Science (WoS)—using controlled terminology such as “prefabricated construction”, “modular building”, and “off-site manufacturing”. High-impact peer-reviewed journal articles and doctoral dissertations were prioritized based on citation count, journal impact factor, and methodological transparency. Through thematic coding and conceptual triangulation, extant research on construction safety in prefabricated contexts was critically synthesized, yielding a consolidated set of 26 candidate risk factors. These factors reflect empirically documented failure modes and systemic vulnerabilities that propagate across phase boundaries; their preliminary classification is presented in Table 1.
Table 1.
Candidate risk factors with cross-stage transmission potential.
2.3. Empirical Validation and Refinement of Cross-Stage Transmission Risk Factors
To enhance the completeness and empirical grounding of the initial risk set—comprising 26 candidate factors derived from scholarly literature—this study conducted a targeted case-based validation using seven high-severity, publicly documented construction safety accidents involving prefabricated buildings in China between 2018 and 2024. Conduct a cause-and-effect analysis of the incident, focusing particularly on root causes. Causal analysis was performed following the accident causation model (e.g., Swiss Cheese Model) and aligned with GB 6441–1986 (Classification Standard for Enterprise Employee Injury Accidents) [44], focusing on root causes, contrib-uting conditions, and cross-phase propagation pathways. As evidenced in Table 2, the principal causes of construction safety accidents comprise scaffold collapse resulting from procedural noncompliance (e.g., bypassing mandatory inspection checkpoints), falls from height attributable to inconsistent or improper use of personal protective equipment (PPE), and worker falls from steel scaffolding arising from systemic deficiencies in safety training—namely, inadequate instructional delivery and insufficient verification of worker competency. Consequently, the risk factor “inadequate component fixation integrity” was formally integrated into the refined risk taxonomy in Table 1, thereby strengthening the system’s capacity to capture latent transmission mechanisms across production–transportation–assembly interfaces.
Table 2.
Causal analysis of representative construction safety accidents in prefabricated building projects.
2.4. Development of the Cross-Stage Transmission Risk Index System
Building upon the completion of the preliminary risk checklist for prefabricated construction, a panel of seven senior domain experts was convened. All possessed over a decade of professional experience and held the title of Senior or Associate Senior Engineer. The panel comprised one prefabricated building design specialist, two production engineering specialists, and four on-site construction professionals—including representatives from supervision agencies, project owners, and general contractors—to ensure balanced representation across key stakeholder groups and functional domains of the prefabricated construction process. To ensure methodological rigor in expert elicitation, inter-rater reliability was quantified using Cronbach’s α coefficient, yielding a value of 0.773—well above the widely accepted threshold of 0.7 for acceptable internal consistency. This confirms strong agreement among experts regarding the relative importance of risk indicators, reflecting low inter-expert variability and high data credibility—thereby furnishing a robust empirical foundation for both the development of the risk indicator system and subsequent quantitative modeling. A two-stage refinement process was then implemented: first, a five-point ordinal scale (1 = extremely unimportant; 2 = relatively unimportant; 3 = moderately important; 4 = relatively important; 5 = extremely important) was employed to elicit expert judgments on indicator significance; second, fuzzy membership degree analysis was applied to objectively screen indicators, with a conservative cutoff threshold of 0.6 [45]. Risk factors exhibiting membership degrees below this threshold were systematically excluded. Consequently, seven items—namely, unreasonable production scheduling, insufficient production capacity, delayed or unreliable supply of raw materials, substandard equipment operation proficiency, suboptimal transportation scheduling, insufficient transportation fleet capacity, and defective prefabricated components—were removed. The final cross-phase risk indicator system comprised 20 validated, stage-specific core risk factors distributed across the production, transportation, and assembly phases. Each factor was uniquely coded to facilitate traceability, computational integration, and systematic risk governance, as summarized in Table 3.
Table 3.
Cross-stage transmission risk indicator framework for prefabricated building construction safety.
3. Development of a Cross-Stage Risk Transmission Assessment Model
3.1. Methodological Framework for Model Construction
To address the defining characteristics of cross-stage risk transmission in prefabricated building construction—namely, its phased progression, multifactorial origin, and strong inter-stage dependencies—this study developed a Bayesian network (BN)-based risk assessment model. The methodology proceeds in two rigorously integrated stages. First, the causal structure and relative influence weights among the 20 secondary risk factors are quantitatively determined using the DEMATEL method, drawing upon both the established cross-stage risk indicator system and empirical data from expert elicitation surveys. Second, the DEMATEL-derived causal matrix is systematically translated into a BN topological architecture, wherein nodes represent risk factors and directed arcs encode conditional dependencies; this yields a unified probabilistic–causal model capable of both structural reasoning and quantitative inference under uncertainty. The complete workflow is illustrated in Figure 2.
Figure 2.
Steps for constructing a cross-stage risk transmission model.
3.2. Establishing Causal Structure Among Risk Factors Using the DEMATEL Method
The DEMATEL method is rigorously applied to quantify inter-factor influence intensities and explicitly identify directional causal relationships, thereby uncovering the hierarchical influence architecture underlying cross-stage risk transmission. The methodology comprises four sequential, mathematically grounded steps:
- Step 1: Construction of the Direct Influence Matrix A
A panel of domain experts independently evaluates pairwise influence among the 20 selected risk factors using a validated 0–4 Likert-type scale: 0 = no influence; 1 = weak influence; 2 = moderate influence; 3 = strong influence; 4 = very strong influence. Responses from fully completed questionnaires were aggregated and synthesized to construct the 20 × 20 direct influence matrix A, as presented in Appendix A.
- Step 2: Computation of the Normalized Influence Matrix D
Matrix A is normalized via row-wise summation normalization to yield the dimensionless normalized influence matrix D, ensuring comparability across heterogeneous risk dimensions, as shown in Appendix B.
- Step 3: Derivation of the Total Influence Matrix T
The total (comprehensive) influence matrix T is computed as the convergent sum T = D + D2 + D3 + …, capturing both direct and indirect influences through all possible transmission paths in the risk network, as detailed in Appendix C.
- Step 4: Quantification of Structural Metrics: ri, ci, Mi, and Ri
For each risk factor i, the influence degree (ri), affected degree (ci), centralization degree (Mi), and causality degree (Ri) are calculated per Equations (1)–(4). These metrics collectively characterize the factor’s structural role—whether as a root cause (Ri > 0), outcome (Ri < 0), or system hub (high Mi)—and are tabulated in Table 4.
Table 4.
Influence degree (ri), influenced degree (ci), centrality degree (Mi), and causality degree (Ri) of risk factors.
In Equations (1)–(4), the influence degree (ri) denotes the total direct and indirect influence exerted by risk factor i on all other factors, quantifying its role as a driver within the transmission network; the affected degree (ci) denotes the total direct and indirect influence received by factor i from all other factors, quantifying its susceptibility to external constraints; the centrality (Mi) reflects the overall prominence of factor i in the system, calculated as Mi = ri + ci; the net cause value (Ri), defined as Ri = ri − ci, classifies factor i’s functional role: Ri > 0 indicates a net cause factor (originating influence), Ri < 0 indicates a net effect factor (receiving influence), and |Ri| quantifies the strength of its causal dominance.
The computational results from Table 4 were imported into SPSSAU (https://spssau.com/index.html, accessed on 29 May 2026) for visualization, yielding the scatter plot of influence degree (ri) versus influenced degree (ci) in Figure 3 and that of centrality degree (Mi) versus causality degree (Ri) in Figure 4. Interpretations below were derived from the spatial distribution patterns observed in these figures.
Figure 3.
Distribution of influence degree (ri) and influenced degree (ci).
Figure 4.
Distribution of centrality degree (Mi) and causality degree (Ri).
First, in Figure 3, risk factors positioned above the horizontal reference line (ci > 1.0)—namely C7, C1, M4, T4, and C10—exhibit relatively low influence degrees. This indicates their predominant role as “receptors” rather than “drivers”: their occurrence is largely contingent upon upstream risk activation, and they exert minimal direct or indirect influence on others. Collectively, they constitute a cluster of “passive outcome-type” factors. Notably, C7 displays the highest ci value, confirming its status as the most susceptible node in the risk transmission network—the central recipient of cascading effects.
Second, risk factors located to the right of the vertical reference line (ri > 1.0)—including T1, M1, M2, and T2—consistently exhibit low affected degrees, reflecting strong unilateral influence capacity and minimal susceptibility to external perturbations. These represent the primary “originators” of risk propagation—“active causal-type” factors that initiate and amplify downstream risks. In contrast, factors situated in the lower-left quadrant (e.g., C9, C6, C3) function as foundational “source drivers”, often rooted in structural or systemic conditions. Meanwhile, those near the center of the plot (e.g., C8, C11), with intermediate ri and ci values, serve as “transmission mediators”: they receive input from upstream risks and propagate effects downstream, thereby bridging distinct phases of the risk chain.
Third, Figure 4 reveals the functional role of each risk factor within the network. The horizontal axis denotes the centrality degree (Mi), reflecting the overall prominence of a risk factor in the system; the vertical axis denotes the causality degree (Ri), which determines its directional role—positive Ri values indicate an “active causal role”, whereas negative Ri values indicate a “passive receptive role”. Risk factors with positive Ri—including M1, M2, T1, T2, T3, C3, C4, C6, C9, C11, and C12—exhibit strong net causal influence and low susceptibility to external perturbations. These constitute the primary “source drivers”: they initiate and propagate cascading effects across stages and serve as foundational triggers of the risk transmission process.
Fourthly, risk factors with negative Ri—namely C5, C8, C10, T4, M4, C1, and C7—are characterized by net receptivity. Their emergence is largely contingent upon upstream risk activation, confirming their status as “receptive endpoints”. Notably, C7 occupies the bottom-right corner of Figure 4, exhibiting both the highest centrality and the most negative net cause value, thereby functioning as the “terminal convergence node”—the ultimate outcome integrating all upstream risk pathways. Other receptive factors (e.g., C8, C10, M4) are positioned progressively leftward along the horizontal axis, forming a well-ordered hierarchical gradient: “source drivers → transmission mediators → terminal outcomes”.
3.3. Bayesian Network (BN) Model Construction
A Bayesian network (BN), also referred to as a belief network, is a probabilistic graphical model that formally encodes joint probability distributions over a set of random variables using a directed acyclic graph (DAG). By combining principles from graph theory and probability theory, BNs provide a rigorous framework for modeling conditional dependencies, reasoning under uncertainty, and supporting quantitative risk and safety analysis [46,47]. The structure of a BN comprises three core components: nodes, each representing a discrete or continuous random variable; directed edges, which encode direct conditional dependencies (i.e., a directed edge from node A to node B indicates that B is conditionally dependent on A); and conditional probability tables (CPTs), which specify the conditional probability distribution of each node given its parent nodes. The joint probability distribution factorizes according to the DAG structure, as expressed in Equation (5) [48]:
In Equation (5), P denotes the joint probability distribution over all variables; Xi denotes the i-th random variable (corresponding to node i in the DAG); n is the total number of variables; ∏ represents the product operator; and δ(Xi) denotes the set of parent nodes of Xi—i.e., all nodes with directed edges pointing to Xi.
3.4. Model Refinement Using the Extended Leaky Noisy-OR Gate
The Extended Leaky Noisy-OR Gate (LNOG) model, introduced by Henrion [49] in 1989, was originally developed to reduce the combinatorial complexity of conditional probability table (CPT) specification for non-root nodes in Bayesian networks. A key theoretical advantage of the LNOG is its ability to explicitly account for latent or unmodeled risk factors—referred to as the “leak” term—thereby enhancing model realism and robustness in practical risk assessment contexts where complete causal enumeration is infeasible. Consequently, the LNOG has become a widely adopted formalism in uncertainty propagation and safety-critical decision support systems. The conditional probability (also termed connection probability) of an intermediate node Y is given in Equation (6):
In Equation (6), Y denotes the target node; Y = 1 signifies event occurrence; Pi ∈ [0, 1] denotes the individual causal strength (i.e., probability of activation) of the i-th known parent risk factor (i = 1, …, k); and Pl ∈ [0, 1] denotes the leak probability—the baseline likelihood of Y occurring independently of all modeled parents, representing unobserved or residual risk sources.
3.5. Construction of a Cross-Stage Risk Transmission Model
Based on the integrated influence matrix T presented in Appendix C and the analytical results of impact degree (ri), affected degree (ci), centrality (Mi), and cause degree (Ri) reported in Section 3.2, a Bayesian network topology was constructed by applying a threshold λ to eliminate negligible inter-factor influences. In the transformation from the DEMATEL-derived integrated influence matrix to a directed acyclic graph (DAG) representation, λ governs both structural parsimony—the number of retained directional edges—and the interpretability of causal propagation pathways. To determine λ objectively and robustly, this study first computed a theoretically optimal threshold of 0.21 using the Tsallis [50] relative entropy method; subsequently, a systematic sensitivity analysis was conducted over the interval [0.15, 0.30] with increments of 0.02. Results indicate that for λ ≤ 0.25, the centrality-based ranking of key risk factors remains invariant, and the essential cross-phase risk propagation architecture—particularly the hierarchical “production → transportation → assembly” pathway—exhibits no qualitative alteration. In contrast, when λ > 0.25, structural distortion emerges: critical nodes shift anomalously in centrality ranking, and foundational transmission links dissolve, compromising model interpretability. Accordingly, λ = 0.25 was adopted as the definitive threshold. This value effectively suppresses spurious weak associations (e.g., M2→M1 = 0.231, M1→T1 = 0.230, T1→T2 = 0.226) while preserving all statistically meaningful directional dependencies visualized in Figure 5 (e.g., M2→M4 = 0.512, T1→T4 = 0.534, C5→C1 = 0.295, C7→C1 = 0.295, C3→C10 = 0.452). Crucially, the core cross-phase transmission chain—“production → transportation → assembly”—is fully retained, thereby ensuring both theoretical validity and practical relevance of the resulting Bayesian network topology. The model was implemented using GeNIe 5.0, a validated graphical probabilistic modeling platform; the final cross-phase risk transmission model for prefabricated building construction safety is depicted in Figure 5.
Figure 5.
Cross-stage risk transmission model.
As illustrated in Figure 5, two dominant propagation pathways emerge: (i) M1 (non-standard personnel operation), M2 (inadequate design detailing capability), and M3 (substandard raw material quality) collectively exert strong influence on M4 (nonconforming component quality), which in turn drives C7 (excessive schedule pressure); and (ii) T1 (improper handling during loading/unloading), T2 (adverse road conditions), and T3 (inadequate component securing) jointly precipitate T4 (delayed component delivery), ultimately amplifying C7. Both pathways converge on C7, confirming its role as a systemic bottleneck and critical amplification node in the cross-phase risk transmission process.
4. Empirical Analysis
Taking the prefabricated public housing project in Minhang District, Shanghai—used as a representative case study—as the empirical analysis object, this study systematically executed data collection, preprocessing, model computation, and result interpretation. Expert judgments were encoded using the triangular fuzzy function, and unknown risks were integrated into the extended LNOG model. Subsequently, Genie 5.0 was utilized to perform forward inference, backward inference, sensitivity analysis, and causal chain analysis on the cross-stage risk transmission model, thereby empirically validating its efficacy in risk forecasting, root-cause tracing, and transmission pathway identification.
4.1. Project Overview
The case project is a 71,000-m2 public housing development located in Minhang District, Shanghai. Its above-ground structure employs an assembled monolithic shear wall system. Five principal prefabricated component types were deployed: composite floor slabs, precast stairs, shear walls, infill walls, and bay windows. During architectural design scoping, components characterized by excessive reinforcement congestion or geometrically intricate connection details—posing significant challenges to fabrication, transportation, and on-site assembly—were deliberately excluded from prefabrication. Key operational characteristics of the project included intensive multi-trade interface management, high-frequency (high-altitude operations), and stringent synchronization requirements between off-site component logistics and on-site installation sequences. The subsequent empirical analysis is grounded in this project.
4.2. Risk Data Processing Using the Triangular Fuzzy Function
The triangular fuzzy function constitutes a standard representation within fuzzy set theory (FST). Introduced by American control theorist Zadeh [51] in 1965, FST provides a rigorous mathematical framework for modeling linguistic imprecision and epistemic uncertainty—phenomena inherently resistant to classical binary set logic. Owing to the computational tractability and widespread adoption of its membership function [52], the triangular fuzzy number was adopted herein to represent the fuzzy probabilities of nodes in the Bayesian network. A triangular fuzzy number is denoted as A = (a, m, b), where a ≤ m ≤ b, and its piecewise linear membership function is defined in Equation (7).
In Equation (7), a, m, and b denote the lower bound, modal value, and upper bound of the triangular fuzzy number, respectively; FA(x) denotes the membership degree of x in the universe of discourse U, where x ∈ [0, 1].
To estimate node probabilities in a Bayesian network that lack empirical frequency data, this study adopted a hybrid approach integrating expert elicitation with triangular fuzzy numbers. Expert judgments—expressed via linguistic terms ranging from “Very High” (VH) to “Very Low” (VL), totaling seven ordered categories—were systematically encoded into corresponding triangular fuzzy numbers [53] (as listed in Table 5). This encoding transforms qualitative assessments into quantifiable fuzzy probabilities, thereby rigorously representing epistemic uncertainty inherent in expert knowledge and enhancing the robustness of probabilistic inference within the network.
Table 5.
Linguistic terms and associated triangular fuzzy number representations.
In Table 5, the aggregation procedure for root node probabilities in the Bayesian network is described as follows. Let n denote the number of domain experts; the triangular fuzzy number Fij—assigned by the jth expert to root node i—is defined in Equation (8).
When expert weights are uniform, the arithmetic mean F′ij of the n triangular fuzzy numbers assigned to root node i is defined in Equation (9).
Finally, the area averaging method is applied to defuzzify the aggregated fuzzy number, yielding the crisp output Pi for root node i, as defined in Equation (10).
The computational procedure for non-root (intermediate) nodes in the Bayesian network follows the same methodology as that for root nodes; their conditional dependencies are formally encoded in conditional probability tables (CPTs). In practical prefabricated construction projects, exhaustive enumeration of all safety-related risk factors is infeasible. Consequently, unmodeled risk factors—though omitted from explicit representation—may still contribute to construction safety incidents. To address this limitation, the Leaky Noisy-OR gate extension was adopted: it explicitly incorporates a “leak” term representing the cumulative effect of all unobserved or unknown risk factors, thereby ensuring comprehensive coverage of safety risks and enhancing the model’s fidelity to real-world project conditions.
4.3. Application of the Cross-Stage Risk Transmission Model
Empirical data were collected via structured expert elicitation in construction safety. Seven domain experts independently assessed both root and non-root nodes; their triangular fuzzy evaluations are summarized in Table 6 and Table 7, respectively. To ensure the scientific rigor and measurement reliability of the Bayesian network risk node assessments, Cronbach’s α coefficient analyses were conducted separately for expert judgments on root nodes and non-root nodes. The computed coefficients were 0.873 for root nodes and 0.818 for non-root nodes—both well above the conventional reliability threshold of 0.7, indicating excellent internal consistency. These results confirm a high level of inter-expert agreement in evaluating the risk nodes within the prefabricated construction safety Bayesian network, reflecting low cognitive divergence and robust assessment stability. Consequently, the expert-derived inputs provide a sound empirical foundation for downstream modeling tasks, including Bayesian network topology construction, conditional probability estimation, and cross-phase risk propagation inference.
Table 6.
Expert elicitation summary for root nodes.
Table 7.
Expert elicitation summary for non-root nodes.
5. Empirical Application Results of the Cross-Stage Risk Transmission Model
5.1. Forward Inference in the Cross-Stage Risk Transmission Model
Bayesian network forward inference is a probabilistic reasoning technique that computes the posterior probability distribution of target variables given prior probabilities and observed evidence [54]. Risk states are dichotomously encoded as “occur” (Y) and “not occur” (N), representing the binary realization of each risk factor. Seven domain experts independently assessed the risk states of fourteen root nodes—M1, M2, M3, T1, T2, T3, C2, C3, C4, C5, C6, C9, C11, and C12—using standardized linguistic terms aligned with the triangular fuzzy scale. The resulting triangular fuzzy numbers were converted into prior probabilities via Equations (8)–(10); the final values are presented in Table 8.
Table 8.
Triangular fuzzy values and prior probabilities for root nodes.
The conditional probabilities of non-root (intermediate) nodes are exemplified using the quality nonconformance of component M4. Following derivation of its prior probability, the Leaky Noisy-OR Gate extended model was applied to integrate the contributions of unmodeled risk factors. By convention, the baseline probability of such latent risk factors—denoted as Pl—is assumed to be 5% [12]. Subsequent recalibration was performed using Equations (7)–(10), and the updated conditional probabilities are reported in Table 9.
Table 9.
Conditional probability table for unqualified component quality (M4).
Subsequently, the conditional probabilities for all remaining intermediate nodes were computed sequentially, and the resulting values were ingested into the Bayesian network system and mapped to their respective parent–child relationships. This yielded the complete set of probability distribution parameters underpinning the network’s inference engine, as visualized in Figure 6.
Figure 6.
Forward inference results of the cross-stage risk transmission model.
As shown in Figure 6, the posterior probability of construction safety risk occurrence was estimated at 35%, indicating a relatively low risk level—consistent with field observations and corroborated by the absence of safety incidents throughout the project life cycle, up to final handover. Bayesian network sensitivity analysis further revealed that perturbations in parent-node prior probabilities induced cascading adjustments in child-node marginal probabilities. For instance, fixing the occurrence probability of parent node C1 at 100% elevated the marginal probability of safety accident risk node R from 35% to 46%; concurrently setting both C9 and C10 to 100% raised it further to 49%. These results demonstrate a pronounced synergistic amplification effect: compound exposure to multiple upstream risk drivers increases downstream risk probability more substantially than the sum of individual effects. This nonlinear propagation behavior aligns closely with empirical evidence from construction safety practice, thereby substantiating the structural validity and inferential robustness of the proposed Bayesian network (BN) model.
5.2. Backward Inference of the Cross-Stage Risk Transmission Model
During backward inference of the cross-stage risk transmission model, the accident node R is instantiated as a deterministic evidence state (i.e., P(R = occur) = 100%), enabling derivation of the posterior probability distribution for each risk factor and identification of those exerting the strongest influence on overall system safety. The results are presented in Figure 7. As shown in the influence ranking analysis of Figure 7, the top four risk contributors to safety accidents—ordered by decreasing posterior probability contribution—were: C5 (overloading during hoisting, 58%), C1 and C9 (combined effect of operational violations and insufficient maintenance of hoisting equipment, 54%), C6 (inadequate use of personal protective equipment, 51%), and C4 (poor stability of temporary supports and fixations, 46%). Among these, C5, C1, and C9 constitute primary direct drivers of safety incidents and therefore warrant prioritized mitigation. C6 reflects systemic deficiencies in safety training; such gaps may foster complacency among workers, thereby elevating the likelihood of object strike and fall-from-height incidents. C4 poses escalating consequences: minor instability may result in tipping of precast concrete (PC) components—potentially crushing personnel—while severe instability risks structural collapse, necessitating rigorous control. C7 accelerates construction schedules by compressing essential procedural steps, thereby increasing the frequency of procedural violations and associated accident risk. Secondary contributors—listed in descending order of influence—were C2, M2, and C11, underscoring that beyond C5, risk factors pertaining to component quality (M2, C2) and safety training efficacy (C11) remain critical and merit sustained attention.
Figure 7.
Backward inference results of the cross-stage risk transmission model.
5.3. Sensitivity Analysis of the Cross-Stage Risk Transmission Model
Kjaerulff et al. [55] introduced an efficient sensitivity evaluation framework for Bayesian network (BN) models, designed to quantify how dynamic variations in individual risk factors influence the posterior probability of safety accident occurrence in prefabricated construction projects. Within this framework, node color saturation in the visualization is calibrated to reflect sensitivity magnitude—specifically, a monotonic positive relationship wherein increased saturation corresponds directly to higher sensitivity to the target variable. With accident node R designated as the target, the contribution of each upstream risk factor to P(R = occur) is quantified via probabilistic perturbation analysis, yielding the heat map visualization presented in Figure 8. As illustrated in Figure 8, the four most sensitive contributors were C9 (inadequate maintenance of hoisting machinery), C5 (overloading during hoisting), C11 (environmental risks), and C1 (operating in violation of regulations). Proactive mitigation of these high-sensitivity factors offers the greatest marginal reduction in overall accident probability. The next tier of sensitivity comprised C6 (inadequate use of personal protective equipment), C4 (inadequate stability of temporary supports and fixations), and C3 (inaccurate hoisting and positioning), whereas all other risk factors exhibited comparatively low sensitivity. Critically, reliance solely on prior probability magnitudes to prioritize risk interventions is inadequate: low-probability factors—such as C11 or C9—may exert disproportionately large effects on system-level safety outcomes due to their structural position and conditional dependencies within the BN. Thus, sensitivity-informed prioritization provides construction practitioners with actionable, evidence-based guidance—enabling the precise allocation of managerial attention, inspection efforts, and preventive resources toward those factors whose control yields the highest safety return on investment.
Figure 8.
Sensitivity analysis results of the cross-stage risk transmission model.
5.4. Causal Chain Analysis of the Cross-Stage Risk Transmission Model
Causal chain analysis in Bayesian networks traces directed propagation paths from root causes (e.g., design or procurement decisions) through intermediate mediators to the leaf node—R, representing the occurrence of a safety accident. Edge width in the visualization encodes the strength of conditional dependence: wider edges denote higher causal influence, quantified via path-specific sensitivity metrics (e.g., partial derivative of P(R) with respect to upstream node perturbation). As shown in Figure 9, five dominant cross-stage causal pathways emerged, each anchored in a distinct risk dimension and spanning multiple project phases.
Figure 9.
Causal chain analysis results of the cross-stage risk transmission model.
Path 1 (Management Dimension): M2 (inadequate design detailing capability) → M4 (nonconforming component quality) → C7 (schedule acceleration pressure) → C1 (operating in violation of regulations) → R. Inadequate design detailing leads to dimensional mismatches and incompatible connection details between components and site conditions, initiating a root-cause failure in component manufacturing. When defective components enter assembly, rework and field modifications disrupt baseline schedules, intensifying schedule acceleration pressure. This pressure, in turn, incentivizes procedural shortcuts—including bypassing lifting plan reviews or skipping pre-lift inspections—thereby elevating the likelihood of safety-critical failures.
Path 2 (Management Dimension): T1 (non-standard component handling) → T4 (delayed component delivery) → C7 (schedule acceleration pressure) → C1 (operating in violation of regulations) → R. Non-standard handling induces physical damage (e.g., chipping, cracking) and triggers logistical delays in transportation and staging. Late deliveries compress assembly windows, forcing crews to accelerate work without adequate preparation—such as omitting temporary bracing checks or reducing lift crew coordination time—directly increasing exposure to dynamic hazards.
Path 3 (Operational Dimension): C5 (overloading during hoisting) → C1 (Operating in violation of regulations) → R. Overloading during lifting operations constitutes an inherently hazardous practice. Under abnormal operational conditions—particularly when load limits are exceeded—on-site personnel may, under pressure from tight project schedules and other contextual constraints, deviate from established safety protocols by streamlining procedural safeguards or relaxing compliance oversight. Such deviations precipitate cascading procedural violations, inducing excessive mechanical stress on lifting equipment and rigging systems. This elevates the likelihood of acute safety failures—including rigging failure, crane instability or overturning, and uncontrolled dropping of prefabricated components—thereby directly contributing to construction-related accidents.
Path 4 (Human Factors Dimension): C6 (inadequate use of personal protective equipment, PPE) → C8 (personnel-related risks) → R. Inconsistent PPE use—particularly omission of hard hats during overhead lifting operations—reflects systemic gaps in safety culture and hazard awareness. Beyond direct trauma risk (e.g., skull fracture from falling debris), this behavior signals broader norm erosion: workers exhibiting PPE noncompliance are statistically more likely to disregard fall protection, lockout-tagout, or exclusion zone protocols. Thus, C6 acts not merely as an exposure factor but as a behavioral proxy for latent organizational weaknesses amplifying multiple hazard pathways.
Path 5 (Technical Dimension): C4 (inadequate stability of temporary supports and fixations) → C10 (technical risks) → R. Temporary support systems must sustain both dead loads (component self-weight) and dynamic live loads (wind, crane-induced sway, worker movement). Instability—arising from inadequate base bearing, improper bracing, or premature release—induces progressive geometric imperfections. These imperfections reduce load-bearing capacity, increase deflection, and may culminate in sudden buckling or collapse, resulting in acute trauma or structural system failure.
Collectively, these five pathways span the full prefabricated construction value chain—from design and manufacturing (M2, T1) through logistics (T4) to on-site assembly (C4, C5, C6)—and demonstrate how risks propagate across disciplinary boundaries and contractual interfaces. Critically, they reveal that accident causation is rarely attributable to isolated failures; rather, it emerges from the interaction of upstream management decisions, operational execution, human behavior, and technical constraints. This systems-level insight enables targeted intervention: disrupting any single high-leverage node (e.g., enforcing M2 competency standards or mandating C4 stability verification protocols) can decouple entire causal chains, thereby enhancing resilience beyond incremental safety improvements.
6. Conclusions
This study presents a systematic discussion addressing five core aspects: (i) the sensitivity of LNOG model parameters; (ii) the methodological justification for the DEMATEL threshold; (iii) comparative analysis with the extant literature; (iv) implications for engineering practice; and (v) acknowledged limitations—thereby integrating rigorous model validation, theoretically grounded parameter selection, scholarly contribution, and actionable practical relevance.
6.1. Sensitivity Analysis of the Unknown-Risk Probability Parameter (Pl) in the LNOG Model
To enhance the methodological robustness of model validation and mitigate the inherent constraints of single-case qualitative verification, this study adapts the experimental safety evaluation framework proposed by Gogolik et al. [56]—originally developed for construction support systems—to the context of prefabricated building risk modeling. Specifically, we integrated multi-model quantitative benchmarking with single-factor parametric sensitivity analysis to establish a more rigorous and transparent validation protocol. A systematic sensitivity analysis was conducted on the unknown-risk probability parameter Pl across three theoretically grounded scenarios: Pl = 0% (representing the conventional Bayesian network without unknown-risk extension), Pl = 5% (designated as the baseline LNOG-BN configuration), and Pl = 10% (an extended configuration reflecting heightened uncertainty). Both forward prior inference and backward posterior inference were executed to quantify the directional and magnitude effects of Pl variation on model outputs and evaluate structural stability under parametric perturbation.
Forward prior inference results indicate that the prior probability of construction accidents was 30% in the unextended Bayesian network (Pl = 0%). This increased to 35% in the baseline LNOG-BN model (Pl = 5%) and further rose to 40% under the extended setting (Pl = 10%). The strictly linear monotonic relationship between Pl and accident probability aligned precisely with the analytical formulation of the LNOG model and reflects the empirically observed phenomenon of risk amplification in modular construction workflows—thereby substantiating both the mathematical coherence and domain-specific plausibility of the selected parameter range.
In backward posterior inference, the accident node R was deterministically instantiated at 100%, and the resulting posterior probabilities of all risk factors were computed. As summarized in Figure 10, the top-three contributing risk factors remained invariant across all three configurations:
Figure 10.
Posterior probability distribution under the 10% unknown-risk probability assumption.
- Pl = 0%: C5 (61%), C9 (57%), C1 (52%);
- Pl = 5%: C5 (58%), C1 (54%), C9 (54%);
- Pl = 10%: C5 (57%), C1 (57%), C9 (52%).
Notably, no new high-probability risk factors emerged; only marginal rank-order shifts occurred among C1, C5, and C9—indicating stable risk prioritization. Crucially, the underlying causal topology and inferential logic remained unaffected, confirming the model’s structural resilience to plausible variations in unknown-risk assumptions. Collectively, these findings provide empirical validation of predictive reliability, overcome the epistemic limitation of accident-absence-based validation, and demonstrate that explicit incorporation of unknown risks significantly enhances the model’s fidelity to real-world operational uncertainty in prefabricated construction.
6.2. Engineering Interpretation and Practical Significance of Risk Convergence Nodes
The risk convergence pattern identified in this study admits a clear engineering interpretation. C7 emerged as the terminal convergence node across the entire risk network—indicating that upstream risks originating from production, transportation, and assembly phases collectively amplify and manifest as schedule-driven rush work. Consequently, on-site safety management must treat schedule discipline as a foundational control lever: enforcing strict adherence to planned timelines and proactively preventing uncontrolled acceleration is essential to interrupt risk transmission pathways and suppress downstream amplification at its origin. Quantitative analysis further revealed that C5, C1, and C9 exhibited the highest posterior responsiveness under accident conditions; notably, their influence extends beyond isolated hazards to shape the overall construction system state. This finding aligns closely with field observations and substantiates the model’s ecological validity in representing real-world risk configurations.
From an engineering implementation perspective, proactive schedule governance—not merely as a planning activity but as a primary risk control intervention—directly attenuates systemic risk accumulation by preventing operational compression and uncontrolled acceleration. Furthermore, aligning on-site inspection protocols and real-time monitoring systems with empirically derived risk distribution patterns significantly enhances the precision, timeliness, and operational relevance of safety interventions. While this study establishes a theoretically grounded explanatory framework for risk causation and nodal behavior, it does not yet operationalize these insights into deployable diagnostic or prescriptive tools for frontline decision-making. Walczak et al. [57] offer a methodologically transferable precedent through their rule-based decision-support system for building defect diagnosis and optimal repair selection—a framework readily adaptable to safety-critical contexts. Subsequent research should embed the identified convergence nodes, phase-specific transmission weights, and LNOG-quantified uncertainty into adaptive, context-aware safety decision architectures—thereby transforming analytical outputs into actionable intelligence for on-site risk identification, dynamic intervention planning, and evidence-informed protective measure optimization.
6.3. Comparative Analysis with Existing Literature
This section situates the five empirically identified risk causal transmission pathways (Figure 9) within the broader scholarly discourse on prefabricated construction safety, systematically comparing and contrasting the findings against the established literature. Relative to prior work, this study advances four distinct methodological and substantive contributions. First, it transcends the scope limitations of earlier studies—such as Forteza et al. [3] focus on isolated operational tasks or Jiang et al. [7] narrow examination of single workflow segments and Shen et al. [4] and Yang et al. [12] analysis confined to fragmented construction phases—by establishing a holistic, process-integrated framework that fully maps risk propagation dynamics across the end-to-end production–transportation–assembly value chain; notably, this constitutes the first rigorously quantified, phase-bridging characterization of systemic risk transmission in prefabricated construction. Second, it rectifies critical structural deficiencies in the conventional DEMATEL-BN hybrid approach (Chen et al. [11]), embedding the LNOG extension to explicitly model latent and emergent risks—thereby substantially improving the ecological validity and field applicability of probabilistic risk assessments. Third, moving beyond Wang et al. [6] qualitative accident causation taxonomy, this study leveraged the five validated causal pathways as robust empirical anchors to quantify directional risk influence strengths, decompose hierarchical transmission mechanisms, and statistically verify logical coherence through path-specific conditional probability testing. Fourth, it introduces a dual-layer sensitivity validation protocol—simultaneously assessing parameter perturbations in the LNOG module and threshold variations in the DEMATEL weighting scheme—thereby resolving the longstanding epistemic gap in Bayesian network applications concerning the justification and robustness of key modeling assumptions. Critically, these analytical advances are directly translated into actionable safety governance: evidence-based intervention strategies are formulated specifically for high-leverage convergence nodes (e.g., C7), enabling targeted, stage-sensitive risk containment.
6.4. Study Limitations
While this study yielded several substantive contributions, it was subject to four methodologically consequential limitations. First, model parameters were elicited exclusively through expert judgment and aggregated using uniform weighting—without stratification by domain expertise, potentially compromising the fidelity of domain-specific risk judgments. Second, empirical validation relied solely on projects located within Shanghai Municipality, thereby constraining geographical generalizability; cross-regional replication across diverse climatic, regulatory, and logistical contexts is required to assess external validity. Third, the Bayesian network employed a static topology, precluding dynamic representation of risk evolution in response to temporal shifts in construction progress or ambient conditions. Fourth, model calibration lacked anchoring in large-scale, verified incident databases—limiting absolute probability accuracy and necessitating future integration with national or industry-level accident repositories for robust probabilistic validation. These limitations do not undermine the core theoretical insights but delineate concrete, actionable pathways for advancing both methodological rigor and operational applicability in subsequent research.
7. Conclusions
This study employed the DEMATEL method to clarify the causal relationships among various risk factors and introduced the LNOG extended model to account for unknown risks, thereby constructing a cross-stage risk transmission analysis model for prefabricated construction safety based on the DEMATEL–LNOG–Bayesian network (BN) framework. It conducted an in-depth quantitative analysis of cross-stage risk transmission in prefabricated construction safety, making the analysis results more consistent with engineering reality and avoiding assessment distortion caused by risk omission in traditional risk evaluation models.
Second, this study conducted a cross-stage risk transmission analysis of prefabricated construction safety using the actual project “a large-scale prefabricated residential project in Shanghai”, comprehensively verifying the effectiveness and feasibility of the constructed model. The main empirical application results are as follows. First, the overall safety risk probability of 35% calculated by the cross-stage risk transmission model is broadly consistent with the observed outcome of no safety accidents upon project completion, and the three-stage risk distribution and the identification results of core risk factors align well with the established patterns of prefabricated construction safety. Second, C5 (overloading during hoisting), C1 (operating in violation of regulations), and C9 (inadequate maintenance of hoisting machinery) are identified as direct core risk triggers, whereas M2 (inadequate design detailing capability) and T3 (inadequate component securing) serve as key cross-stage transmission nodes. Third, the cross-stage risk transmission exhibits two defining characteristics: “stepwise amplification” and “multiplicative superposition” of multiple risks. Fourth, the five core transmission paths—spanning management, personnel, and technical dimensions—are critical intervention points for risk control.
Author Contributions
Conceptualization, Methodology, Formal Analysis, Writing—Review & Editing, Funding Acquisition, Y.L.; Investigation, Data Curation, Writing—Original Draft, Writing—Review & Editing, F.Y.; Software, Data Management, Visualization, Y.D.; Supervision, Project Administration, Resources, Visualization, J.T. All authors have read and agreed to the published version of the manuscript.
Funding
This work was supported by the Ministry of Education’s Industry–University Collaborative Education Program (Grant No. 201702058023) and the Yunnan Provincial Science Research Fund (Grant No. K2400107).
Data Availability Statement
The datasets generated and/or analyzed during the current study are available from the corresponding author on reasonable request.
Conflicts of Interest
Author Yuchen Duan was employed by the Kunming Fenghuangcheng Sub-Branch, China Construction Bank Corporation. The remaining authors declare that the research was conducted in the absence of any commercial or financial relationships that could be construed as a potential conflict of interest.
Abbreviations
The following abbreviations are used in this manuscript:
| DEMATEL | Decision-Making Trial and Evaluation Laboratory method |
| BN | Bayesian Network |
| LNOG | Leaky Noisy-or Gate |
| PC | Precast Concrete |
Appendix A. Direct Influence Matrix A for Cross-Stage Risk Transmission
| M1 | M2 | M3 | M4 | T1 | T2 | T3 | T4 | C1 | C2 | C3 | C4 | C5 | C6 | C7 | C8 | C9 | C10 | C11 | C12 | |
| M1 | 0 | 1 | 1 | 4 | 2 | 0 | 0 | 0 | 0 | 0 | 0 | 0 | 0 | 0 | 0 | 0 | 0 | 0 | 0 | 0 |
| M2 | 2 | 0 | 1 | 4 | 1 | 0 | 0 | 0 | 0 | 0 | 0 | 0 | 0 | 0 | 0 | 0 | 0 | 0 | 0 | 0 |
| M3 | 1 | 1 | 0 | 4 | 1 | 0 | 0 | 0 | 0 | 0 | 0 | 0 | 0 | 0 | 0 | 0 | 0 | 0 | 0 | 0 |
| M4 | 0 | 0 | 0 | 0 | 0 | 0 | 0 | 0 | 0 | 0 | 0 | 0 | 0 | 0 | 4 | 0 | 0 | 0 | 0 | 0 |
| T1 | 2 | 1 | 1 | 0 | 0 | 2 | 1 | 4 | 0 | 0 | 0 | 0 | 0 | 0 | 0 | 0 | 0 | 0 | 0 | 0 |
| T2 | 0 | 0 | 0 | 0 | 2 | 0 | 1 | 4 | 0 | 0 | 0 | 0 | 0 | 0 | 0 | 0 | 0 | 0 | 0 | 0 |
| T3 | 0 | 0 | 0 | 0 | 1 | 2 | 0 | 4 | 0 | 0 | 0 | 0 | 0 | 0 | 0 | 0 | 0 | 0 | 0 | 0 |
| T4 | 0 | 0 | 0 | 0 | 0 | 0 | 0 | 0 | 0 | 0 | 0 | 0 | 0 | 0 | 4 | 0 | 0 | 0 | 0 | 0 |
| C1 | 0 | 0 | 0 | 0 | 0 | 0 | 0 | 0 | 0 | 0 | 0 | 0 | 2 | 0 | 1 | 0 | 0 | 0 | 0 | 0 |
| C2 | 0 | 0 | 0 | 0 | 0 | 0 | 0 | 0 | 0 | 0 | 0 | 0 | 0 | 1 | 0 | 4 | 0 | 0 | 0 | 0 |
| C3 | 0 | 0 | 0 | 0 | 0 | 0 | 0 | 0 | 0 | 0 | 0 | 2 | 0 | 0 | 0 | 0 | 0 | 4 | 0 | 0 |
| C4 | 0 | 0 | 0 | 0 | 0 | 0 | 0 | 0 | 0 | 0 | 1 | 0 | 0 | 0 | 0 | 0 | 0 | 4 | 0 | 0 |
| C5 | 0 | 0 | 0 | 0 | 0 | 0 | 0 | 0 | 3 | 0 | 0 | 0 | 0 | 0 | 0 | 0 | 0 | 0 | 0 | 0 |
| C6 | 0 | 0 | 0 | 0 | 0 | 0 | 0 | 0 | 0 | 1 | 0 | 0 | 0 | 0 | 0 | 4 | 0 | 0 | 0 | 0 |
| C7 | 0 | 0 | 0 | 0 | 0 | 0 | 0 | 0 | 3 | 0 | 0 | 0 | 0 | 0 | 0 | 0 | 0 | 0 | 0 | 0 |
| C8 | 0 | 0 | 0 | 0 | 0 | 0 | 0 | 0 | 2 | 0 | 0 | 0 | 0 | 0 | 1 | 0 | 0 | 0 | 0 | 0 |
| C9 | 0 | 0 | 0 | 0 | 0 | 0 | 0 | 0 | 0 | 0 | 0 | 0 | 2 | 0 | 0 | 0 | 0 | 0 | 0 | 0 |
| C10 | 0 | 0 | 0 | 0 | 0 | 0 | 0 | 0 | 0 | 0 | 0 | 0 | 0 | 0 | 0 | 0 | 0 | 0 | 2 | 1 |
| C11 | 0 | 0 | 0 | 0 | 0 | 0 | 0 | 0 | 2 | 0 | 0 | 0 | 1 | 0 | 0 | 1 | 0 | 0 | 0 | 0 |
| C12 | 0 | 0 | 0 | 2 | 0 | 0 | 0 | 0 | 0 | 0 | 0 | 0 | 0 | 0 | 0 | 0 | 0 | 4 | 0 | 0 |
Appendix B. Normalized Influence Matrix D for Cross-Stage Risk Transmission
| M1 | M2 | M3 | M4 | T1 | T2 | T3 | T4 | C1 | C2 | C3 | C4 | C5 | C6 | C7 | C8 | C9 | C10 | C11 | C12 | |
| M1 | 0 | 0.091 | 0.091 | 0.364 | 0.182 | 0 | 0 | 0 | 0 | 0 | 0 | 0 | 0 | 0 | 0 | 0 | 0 | 0 | 0 | 0 |
| M2 | 0.182 | 0 | 0.091 | 0.364 | 0.091 | 0 | 0 | 0 | 0 | 0 | 0 | 0 | 0 | 0 | 0 | 0 | 0 | 0 | 0 | 0 |
| M3 | 0.091 | 0.091 | 0 | 0.364 | 0.091 | 0 | 0 | 0 | 0 | 0 | 0 | 0 | 0 | 0 | 0 | 0 | 0 | 0 | 0 | 0 |
| M4 | 0 | 0 | 0 | 0 | 0 | 0 | 0 | 0 | 0 | 0 | 0 | 0 | 0 | 0 | 0.364 | 0 | 0 | 0 | 0 | 0 |
| T1 | 0.182 | 0.091 | 0.091 | 0 | 0 | 0.182 | 0.091 | 0.364 | 0 | 0 | 0 | 0 | 0 | 0 | 0 | 0 | 0 | 0 | 0 | 0 |
| T2 | 0 | 0 | 0 | 0 | 0.182 | 0 | 0.091 | 0.364 | 0 | 0 | 0 | 0 | 0 | 0 | 0 | 0 | 0 | 0 | 0 | 0 |
| T3 | 0 | 0 | 0 | 0 | 0.091 | 0.182 | 0 | 0.364 | 0 | 0 | 0 | 0 | 0 | 0 | 0 | 0 | 0 | 0 | 0 | 0 |
| T4 | 0 | 0 | 0 | 0 | 0 | 0 | 0 | 0 | 0 | 0 | 0 | 0 | 0 | 0 | 0.364 | 0 | 0 | 0 | 0 | 0 |
| C1 | 0 | 0 | 0 | 0 | 0 | 0 | 0 | 0 | 0 | 0 | 0 | 0 | 0.182 | 0 | 0.091 | 0 | 0 | 0 | 0 | 0 |
| C2 | 0 | 0 | 0 | 0 | 0 | 0 | 0 | 0 | 0 | 0 | 0 | 0 | 0 | 0.091 | 0 | 0.364 | 0 | 0 | 0 | 0 |
| C3 | 0 | 0 | 0 | 0 | 0 | 0 | 0 | 0 | 0 | 0 | 0 | 0.182 | 0 | 0 | 0 | 0 | 0 | 0.364 | 0 | 0 |
| C4 | 0 | 0 | 0 | 0 | 0 | 0 | 0 | 0 | 0 | 0 | 0.091 | 0 | 0 | 0 | 0 | 0 | 0 | 0.364 | 0 | 0 |
| C5 | 0 | 0 | 0 | 0 | 0 | 0 | 0 | 0 | 0.273 | 0 | 0 | 0 | 0 | 0 | 0 | 0 | 0 | 0 | 0 | 0 |
| C6 | 0 | 0 | 0 | 0 | 0 | 0 | 0 | 0 | 0 | 0.091 | 0 | 0 | 0 | 0 | 0 | 0.364 | 0 | 0 | 0 | 0 |
| C7 | 0 | 0 | 0 | 0 | 0 | 0 | 0 | 0 | 0.273 | 0 | 0 | 0 | 0 | 0 | 0 | 0 | 0 | 0 | 0 | 0 |
| C8 | 0 | 0 | 0 | 0 | 0 | 0 | 0 | 0 | 0.182 | 0 | 0 | 0 | 0 | 0 | 0.091 | 0 | 0 | 0 | 0 | 0 |
| C9 | 0 | 0 | 0 | 0 | 0 | 0 | 0 | 0 | 0 | 0 | 0 | 0 | 0.182 | 0 | 0 | 0 | 0 | 0 | 0 | 0 |
| C10 | 0 | 0 | 0 | 0 | 0 | 0 | 0 | 0 | 0 | 0 | 0 | 0 | 0 | 0 | 0 | 0 | 0 | 0 | 0.182 | 0.091 |
| C11 | 0 | 0 | 0 | 0 | 0 | 0 | 0 | 0 | 0.182 | 0 | 0 | 0 | 0.091 | 0 | 0 | 0.091 | 0 | 0 | 0 | 0 |
| C12 | 0 | 0 | 0 | 0.182 | 0 | 0 | 0 | 0 | 0 | 0 | 0 | 0 | 0 | 0 | 0 | 0 | 0 | 0.364 | 0 | 0 |
Appendix C. Total Influence Matrix T for Cross-Stage Risk Transmission
| M1 | M2 | M3 | M4 | T1 | T2 | T3 | T4 | C1 | C2 | C3 | C4 | C5 | C6 | C7 | C8 | C9 | C10 | C11 | C12 | |
| M1 | 0.078 | 0.131 | 0.131 | 0.487 | 0.230 | 0.046 | 0.025 | 0.110 | 0.064 | 0 | 0 | 0 | 0.012 | 0 | 0.223 | 0 | 0 | 0 | 0 | 0 |
| M2 | 0.231 | 0.047 | 0.130 | 0.512 | 0.156 | 0.032 | 0.017 | 0.074 | 0.063 | 0 | 0 | 0 | 0.011 | 0 | 0.219 | 0 | 0 | 0 | 0 | 0 |
| M3 | 0.141 | 0.119 | 0.036 | 0.471 | 0.137 | 0.028 | 0.015 | 0.065 | 0.058 | 0 | 0 | 0 | 0.010 | 0 | 0.200 | 0 | 0 | 0 | 0 | 0 |
| M4 | 0 | 0 | 0 | 0 | 0 | 0 | 0 | 0 | 0.107 | 0 | 0 | 0 | 0.019 | 0 | 0.373 | 0 | 0 | 0 | 0 | 0 |
| T1 | 0.241 | 0.136 | 0.136 | 0.187 | 0.121 | 0.226 | 0.122 | 0.534 | 0.077 | 0 | 0 | 0 | 0.014 | 0 | 0.269 | 0 | 0 | 0 | 0 | 0 |
| T2 | 0.047 | 0.026 | 0.026 | 0.036 | 0.217 | 0.060 | 0.116 | 0.507 | 0.058 | 0 | 0 | 0 | 0.011 | 0 | 0.203 | 0 | 0 | 0 | 0 | 0 |
| T3 | 0.030 | 0.017 | 0.017 | 0.024 | 0.141 | 0.213 | 0.032 | 0.504 | 0.057 | 0 | 0 | 0 | 0.010 | 0 | 0.197 | 0 | 0 | 0 | 0 | 0 |
| T4 | 0 | 0 | 0 | 0 | 0 | 0 | 0 | 0 | 0.107 | 0 | 0 | 0 | 0.019 | 0 | 0.373 | 0 | 0 | 0 | 0 | 0 |
| C1 | 0 | 0 | 0 | 0 | 0 | 0 | 0 | 0 | 0.080 | 0 | 0 | 0 | 0.196 | 0 | 0.098 | 0 | 0 | 0 | 0 | 0 |
| C2 | 0 | 0 | 0 | 0 | 0 | 0 | 0 | 0 | 0.089 | 0.008 | 0 | 0 | 0.016 | 0.092 | 0.044 | 0.4 | 0 | 0 | 0 | 0 |
| C3 | 0 | 0 | 0 | 0.007 | 0 | 0 | 0 | 0 | 0.021 | 0 | 0.017 | 0.185 | 0.011 | 0 | 0.005 | 0.007 | 0 | 0.452 | 0.082 | 0.041 |
| C4 | 0 | 0 | 0 | 0.007 | 0 | 0 | 0 | 0 | 0.019 | 0 | 0.092 | 0.017 | 0.010 | 0 | 0.005 | 0.007 | 0 | 0.417 | 0.076 | 0.038 |
| C5 | 0 | 0 | 0 | 0 | 0 | 0 | 0 | 0 | 0.295 | 0 | 0 | 0 | 0.054 | 0 | 0.027 | 0 | 0 | 0 | 0 | 0 |
| C6 | 0 | 0 | 0 | 0 | 0 | 0 | 0 | 0 | 0.089 | 0.092 | 0 | 0 | 0.016 | 0.008 | 0.044 | 0.4 | 0 | 0 | 0 | 0 |
| C7 | 0 | 0 | 0 | 0 | 0 | 0 | 0 | 0 | 0.295 | 0 | 0 | 0 | 0.054 | 0 | 0.027 | 0 | 0 | 0 | 0 | 0 |
| C8 | 0 | 0 | 0 | 0 | 0 | 0 | 0 | 0 | 0.223 | 0 | 0 | 0 | 0.041 | 0 | 0.111 | 0 | 0 | 0 | 0 | 0 |
| C9 | 0 | 0 | 0 | 0 | 0 | 0 | 0 | 0 | 0.054 | 0 | 0 | 0 | 0.192 | 0 | 0.005 | 0 | 0 | 0 | 0 | 0 |
| C10 | 0 | 0 | 0 | 0.017 | 0 | 0 | 0 | 0 | 0.048 | 0 | 0 | 0 | 0.026 | 0 | 0.012 | 0.017 | 0 | 0.034 | 0.188 | 0.094 |
| C11 | 0 | 0 | 0 | 0 | 0 | 0 | 0 | 0 | 0.244 | 0 | 0 | 0 | 0.135 | 0 | 0.030 | 0.091 | 0 | 0 | 0 | 0 |
| C12 | 0 | 0 | 0 | 0.188 | 0 | 0 | 0 | 0 | 0.037 | 0 | 0 | 0 | 0.013 | 0 | 0.072 | 0.006 | 0 | 0.376 | 0.068 | 0.034 |
References
- Ministry of Housing and Urban–Rural Development of the People’s Republic of China. 14th Five-Year Plan for Construction Industry Development; Ministry of Housing and Urban–Rural Development of the People’s Republic of China: Beijing, China, 2022.
- Wang, J.W.; Feng, G.; Sun, Y.H.; Wang, J. Safety Risk Assessment of Prefabricated Buildings Hoisting Construction: Based on IHFACS-ISAM-BN. Buildings 2022, 12, 811. [Google Scholar] [CrossRef] [Scilit]
- Forteza, F.J.; Seséa Carretero-Gómez, J.M. CONSRAT. Construction sites risk assessment tool. Saf. Sci. 2016, 89, 338–354. [Google Scholar] [CrossRef] [Scilit]
- Shen, L.; Tang, Y.W.; Mu, Y. Safety Evaluation of Component Hoisting in Prefabricated Residential Buildings Based on Cloud-BN. China Saf. Sci. J. 2019, 29, 147–153. [Google Scholar]
- Wang, Z.Q.; Zhang, Q.M.; Wang, G.Q. Safety Evaluation of Prefabricated Building Construction Based on FTA-SPA-Grey Clustering. Saf. Environ. Eng. 2018, 25, 166–173. [Google Scholar]
- Wang, X.A.; Bai, Y.P.; Wu, J.S. Research on Risk Control of University Building Construction Based on Improved Accident Cause “Egg” Model. J. Saf. Sci. Technol. 2025, 21, 12–20. [Google Scholar]
- Jiang, J.K.; Liu, Z.J.; Gu, Z.H. Safety Risk Assessment of Hoisting Construction of Prefabricated Buildings Based on Variable Weight Matter-Element Extension Model. Eng. J. Wuhan Univ. 2024, 57, 1251–1260. [Google Scholar]
- Pearl, J. Bayesian Networks: A model of self-activated memory for evidential reasoning. In Proceedings of the 7th Conference of the Cognitive Science Society, Irvine, CA, USA, 15–17 August 1985; Lawrence Erlbaum Associates: Hillsdale, NJ, USA, 1985; pp. 329–334. [Google Scholar]
- Jia, X.H.; Wang, H.S.; Cui, Y.M. Analysis of External Causes of Bus Accidents Based on Bayesian Network. Sci. Technol. Eng. 2021, 21, 9116–9122. [Google Scholar]
- Dong, M.; Shao, Q. An Improved Bayesian Network Based Risk Assessment Method for Foreign Object Debris at Airports. Sci. Technol. Eng. 2020, 20, 12644–12650. [Google Scholar]
- Chen, W.; Yang, Z.Z.; Xiong, W. DEMATEL-BN Model for Construction Safety Risk Transmission of Prefabricated Building Engineering. China Saf. Sci. J. 2020, 30, 1–6. [Google Scholar]
- Yang, W.A.; Li, J.X. Safety Risk Analysis of Hoisting Construction of Prefabricated Buildings Based on Dynamic Bayesian Network. J. Saf. Environ. 2024, 24, 1328–1336. [Google Scholar]
- Wang, D.; Yin, K.; Wang, H. Risk identification in prefabricated building construction safety systems based on STPA-TM. Reliab. Eng. Syst. Saf. 2025, 268, 112004. [Google Scholar] [CrossRef] [Scilit]
- Li, X.; Chen, R.; Chen, W. Safety-risk assessment system for prefabricated building construction in China. Eng. Constr. Archit. Manag. 2025, 32, 8073–8096. [Google Scholar] [CrossRef] [Scilit]
- Zhong, C.; Li, X. Analysis of safety influencing factors in prefabricated building hoisting based on an improved DEMATEL-ISM method. J. Build. Eng. 2026, 124, 115980. [Google Scholar] [CrossRef] [Scilit]
- Chang, L.; Zhao, S. Risk evaluation of prefabricated building construction based on PTF-VIKOR of prospect theory. Alex. Eng. J. 2025, 115, 147–159. [Google Scholar] [CrossRef] [Scilit]
- Liao, C.Y.; Zhang, M.Q.; Wu, S.S. Towards intelligent risk management in prefabricated buildings: A dynamic ontology-based bayesian network approach. Ain Shams Eng. J. 2026, 17, 104149. [Google Scholar] [CrossRef] [Scilit]
- Tian, Y.S.; Chen, Y.R.; Yan, N. Identifying and predicting delay risks in prefabricated construction: An explainable ensemble learning approach. Adv. Eng. Inform. 2026, 71, 104219. [Google Scholar] [CrossRef] [Scilit]
- Sun, Z.; Zhu, Z.; Xiong, R. Dynamic human systems risk prognosis and control of lifting operations during prefabricated building construction. Dev. Built Environ. 2023, 14, 100143. [Google Scholar] [CrossRef] [Scilit]
- Liu, W.; Feng, Z.; Hu, Y. Study on the measurement of the level of construction occupational health and safety management in prefabricated building: A case study of a practical training building. Eng. Constr. Archit. Manag. 2026, 33, 3352–3374. [Google Scholar] [CrossRef] [Scilit]
- Meng, F.; Cao, X. An intelligent framework for rework risk identification in prefabricated construction processes based on compliance checking. Eng. Constr. Archit. Manag. 2025, 32, 5066–5098. [Google Scholar] [CrossRef] [Scilit]
- Jeong, J.; Jeong, J. Probabilistic accident risk based on productivity for prefabricated structural system at large-scale industrial project. Expert Syst. Appl. 2025, 280, 127628. [Google Scholar] [CrossRef] [Scilit]
- Wang, L.; Cheng, Y.; Zhang, Y. Exploring the risk propagation mechanisms of supply chain for prefabricated building projects. J. Build. Eng. 2023, 74, 106771. [Google Scholar] [CrossRef] [Scilit]
- Wang, Y.; Li, Y.; Zhuang, J. Research on the green development path of prefabricated building industry based on intelligent technology. Eng. Constr. Archit. Manag. 2025, 32, 8390–8422. [Google Scholar] [CrossRef] [Scilit]
- Yang, J.J.; Alias, A.; Haron, N. Deep learning for safety risk management in modular construction: Status, strengths, challenges, and future directions. Autom. Constr. 2025, 169, 105894. [Google Scholar]
- Yuan, M.; Li, Z.; Li, X. Managing stakeholder-associated risks and their interactions in the life cycle of prefabricated building projects: A social network analysis approach. J. Clean. Prod. 2021, 323, 129102. [Google Scholar] [CrossRef] [Scilit]
- Zhang, C.; Zuo, Z.; Zhang, B. An Analysis of Key Influencing Factors for Prefabricated Building Hoisting Safety Based on the Fuzzy-Decision-Making Trial and Evaluation Laboratory and Analytic Network Process: Integrating Influence Mechanisms and Systemic Importance. Buildings 2026, 16, 747. [Google Scholar]
- Johansen, K.; Schultz, C.; Teizer, J. Knowledge graph exploitation to enhance the usability of risk assessment in construction safety planning. Adv. Eng. Inform. 2025, 65, 103305. [Google Scholar] [CrossRef] [Scilit]
- Han, Y.; Chen, M.; Li, N. Digital twin in construction safety management: Recent advances, challenges, and future directions from 4M1E perspective. Saf. Sci. 2025, 192, 107006. [Google Scholar] [CrossRef] [Scilit]
- Wan, P.; Wang, J.; Liu, Y. On Risk Probability of Prefabricated Building Hoisting Construction Based on Multiple Correlations. Sustainability 2022, 14, 4430. [Google Scholar] [CrossRef] [Scilit]
- Zhang, Z.; Duan, L.; Du, X. Risk Assessment of Prefabricated Building Projects Based on the G1-CRITIC Method and Cloud Model: A Case Study from China. Buildings 2025, 15, 2787. [Google Scholar] [CrossRef] [Scilit]
- Shen, Y.; Xu, M.; Lin, Y. Safety Risk Management of Prefabricated Building Construction Based on Ontology Technology in the BIM Environment. Buildings 2022, 12, 765. [Google Scholar] [CrossRef] [Scilit]
- Liu, Z.; Meng, X.; Xing, Z. Digital Twin-Based Safety Risk Coupling of Prefabricated Building Hoisting. Sensors 2021, 21, 3583. [Google Scholar] [CrossRef] [Scilit] [PubMed]
- Pan, Z.Y.; Wang, J.W.; Wang, J. Safety Risk Analysis for Prefabricated Building Hoisting Construction Based on STPA-BN. In ICCREM 2021; American Society of Civil Engineers (ASCE): Reston, VA, USA, 2021; pp. 171–180. [Google Scholar]
- Cao, D. Coupling Risk Assessment Method of Accident Causative Factors in Building Construction. J. Constr. Eng. Manag. 2025, 151, 04025184. [Google Scholar] [CrossRef] [Scilit]
- Xiang, P.; Yang, Y.; Yan, K. Identification of Key Safety Risk Factors and Coupling Paths in Mega Construction Projects. J. Manag. Eng. 2024, 40, 04024023. [Google Scholar] [CrossRef] [Scilit]
- Garbowski, T.; Staszak, N.; Kostrzewski, W.; Szymczak-Graczyk, A. Numerical and Experimental Validation of Homogenization Techniques for Bubble Deck Slabs. Civ. Environ. Eng. Rep. 2025, 35, 230–249. [Google Scholar] [CrossRef] [Scilit]
- GB/T 51231-2016; Technical Standard for Assembled Buildings with Concrete Structure. China Architecture & Building Press: Beijing, China, 2017.
- Qu, F.Q.; Chen, C.Y.; Yan, W. Quality Risk Assessment of Prefabricated Building Components Based on ANP-FUZZY. J. Civ. Eng. Manag. 2019, 36, 92–98. [Google Scholar]
- Li, C.Z.; Shen, G.Q.; Xu, X.; Xue, F.; Sommer, L.; Luo, L. Schedule risk modeling in prefabrication housing production. J. Clean. Prod. 2017, 153, 692–706. [Google Scholar] [CrossRef] [Scilit]
- Li, H.R.; Li, Q.M.; Lu, Y. Analysis of key safety risks in prefabricated building construction based on structural equation model. China Saf. Sci. J. 2019, 29, 171–176. [Google Scholar]
- Wang, J.W.; Pan, Z.Y.; Wang, J.; Yuan, M.T.; Liu, S. Safety risk analysis on hoisting construction of prefabricated building based on STPA and fuzzy BN. J. Saf. Sci. Technol. 2022, 18, 12–19. [Google Scholar]
- Li, Y.P.; Liu, M.Q.; Wang, F.; Li, R.G. Safety performance assessment of fabricated building project based on cloud model. China Saf. Sci. J. 2017, 27, 115–120. [Google Scholar]
- GB/T 6441-1986; Classification of Casualty Accidents for Enterprise Staff and Workers. National Standards Bureau: Beijing, China, 1986.
- Xiang, Y.; Tang, Y.; Zheng, H.Y. Analysis of Influencing Factors on Value for Money Evaluation in PPP Projects—Based on Network Analytic Hierarchy Process. Account. Mon. 2016, 26, 40–43. [Google Scholar]
- Cai, B.; Liu, H.; Xie, M. A real-time fault diagnosis methodology of complex systems using object-oriented Bayesian Networks. Mech. Syst. Signal Process. 2016, 80, 31–44. [Google Scholar] [CrossRef] [Scilit]
- Chen, F.; Xiang, Q.; Chen, X. Dynamic Risk Assessment of Control Units Based on Fuzzy DEMATEL-BN. J. Saf. Environ. 2023, 23, 35–43. [Google Scholar]
- Han, P.; Wang, M.; Zhao, Y. Risk Assessment of Logistics UAV Failure Based on Bayesian Network. J. Saf. Sci. Technol. 2020, 16, 178–183. [Google Scholar]
- Henrion, M. Some Practical Issues in Constructing Belief Networks. In Uncertainty in Artificial Intelligence, 3rd ed.; Kanal, L.N., Levitt, T.S., Lemmer, J.F., Eds.; North-Holland: Amsterdam, The Netherlands, 1989; Volume 3, pp. 161–173. [Google Scholar]
- Fang, Y.X.; Du, H.X.; Gan, P. A threshold determination method for DEMATEL based on Tsallis relative entropy. Chin. J. Eng. Math. 2023, 40, 207–218. [Google Scholar]
- Zadeh, L. Fuzzy sets. Inf. Control 1965, 8, 338–353. [Google Scholar] [CrossRef] [Scilit]
- Abbasbandy, S.; Hajjari, T. Weighted trapezoidal approximation-preserving cores of a fuzzy number. Comput. Math. Appl. 2010, 59, 3066–3077. [Google Scholar] [CrossRef] [Scilit]
- Li, M.; Wang, H.; Wang, D.; Shao, Z.; He, S. Risk assessment of gas explosion in coal mines based on fuzzy AHP and Bayesian Network. Process Saf. Environ. Prot. 2020, 135, 207–218. [Google Scholar] [CrossRef] [Scilit]
- Chen, Y.; Jin, R.; Zha, Y. Research on Schedule Delay Risk of Large Public Projects Based on Bayesian Network. J. Zhengzhou Univ. (Eng. Sci.) 2022, 43, 91–97. [Google Scholar]
- Kjaerulff, U.; van der Gaag, L.C. Making Sensitivity Analysis Computationally Efficient. arXiv 2013, arXiv:1301.3868. [Google Scholar] [CrossRef] [Scilit]
- Gogolik, S.; Kopras, M.; Szymczak-Graczyk, A.; Tschuschke, W. Experimental evaluation of the size and distribution of lateral pressure on the walls of the excavation support. J. Build. Eng. 2023, 73, 106831. [Google Scholar] [CrossRef] [Scilit]
- Walczak, Z.; Ksit, B.; Szymczak-Graczyk, A. Decision-support tools for diagnosing and selecting the optimal method of repairing buildings. Bull. Pol. Acad. Sci. Tech. Sci. 2024, 72, 1–12. [Google Scholar] [CrossRef] [Scilit]
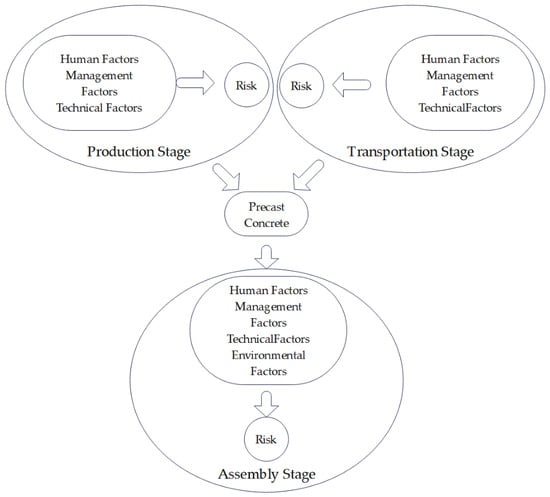
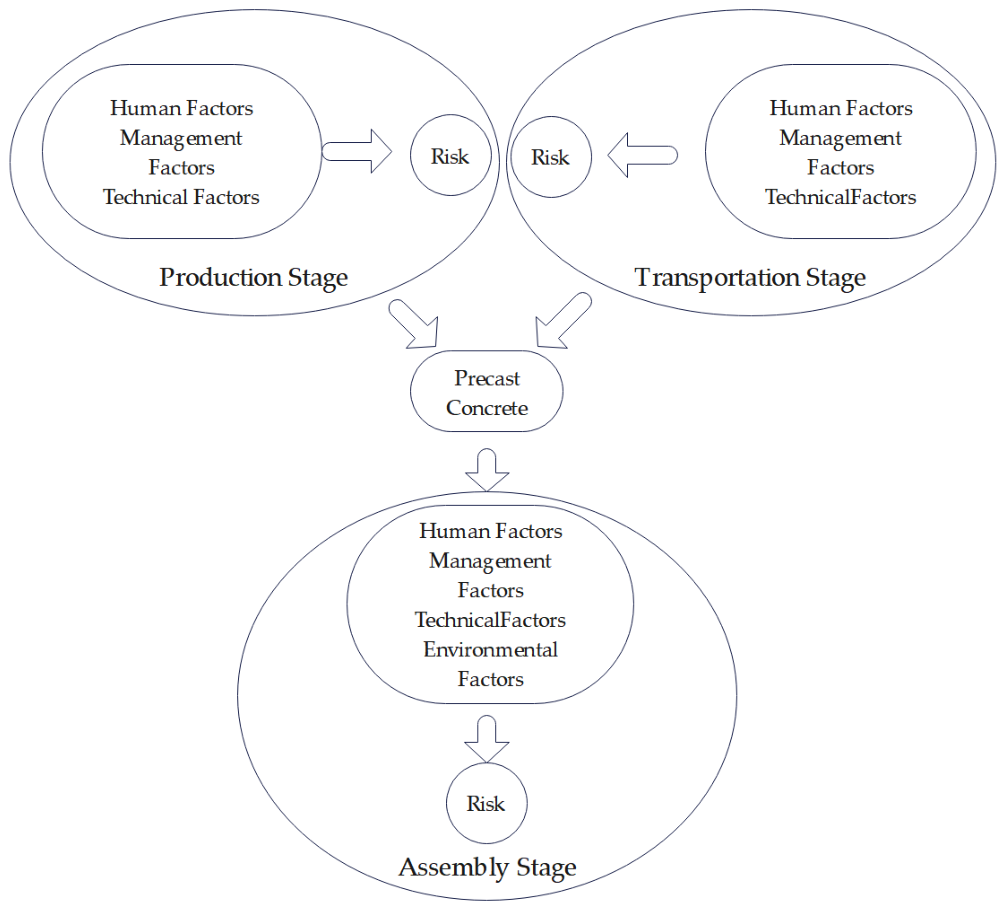
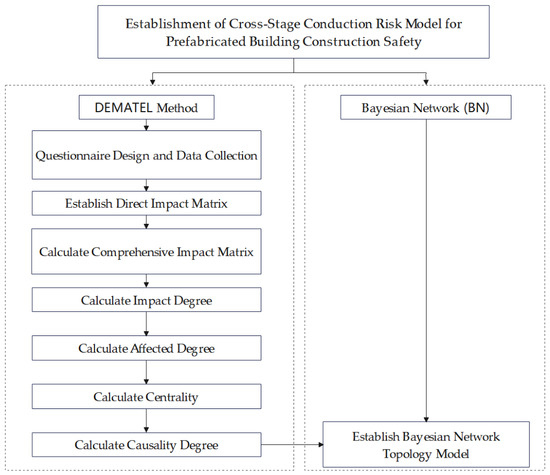
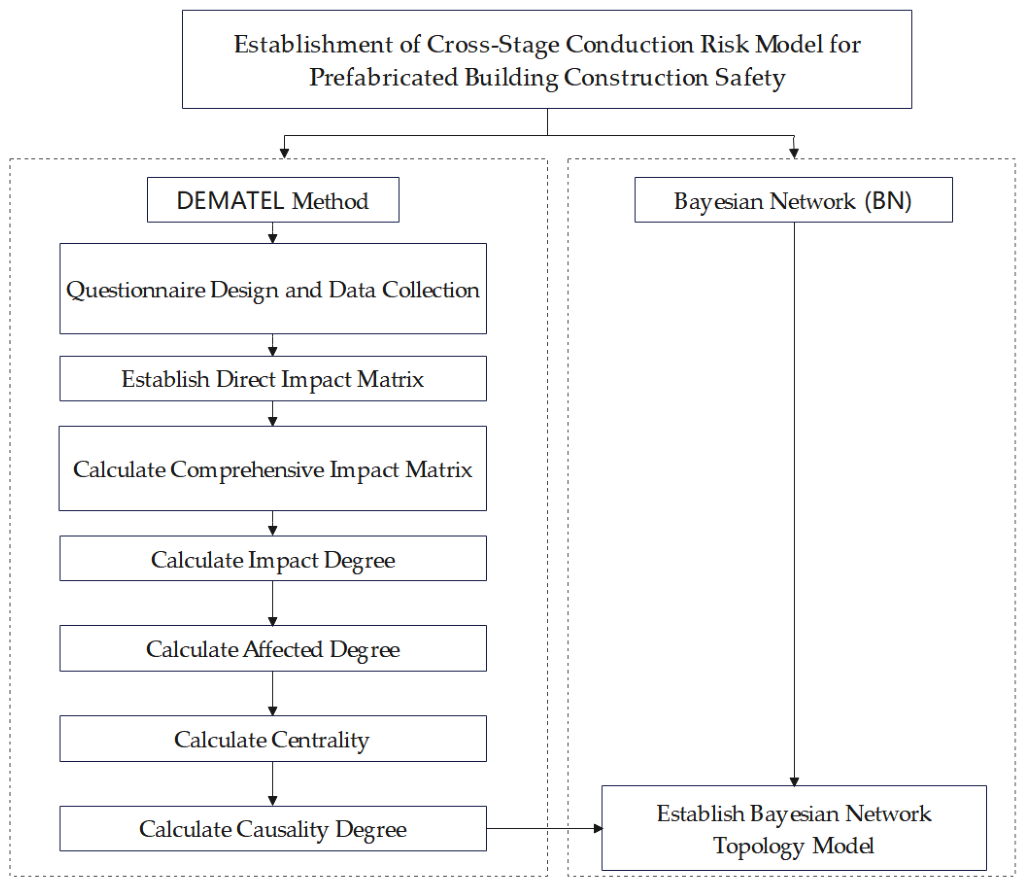
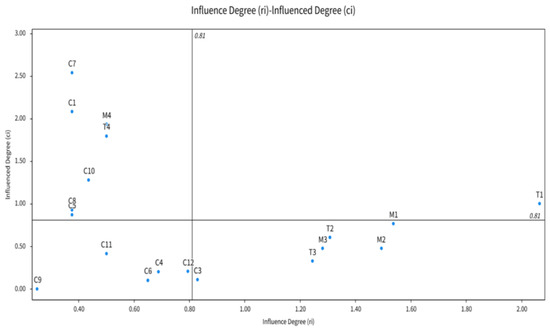
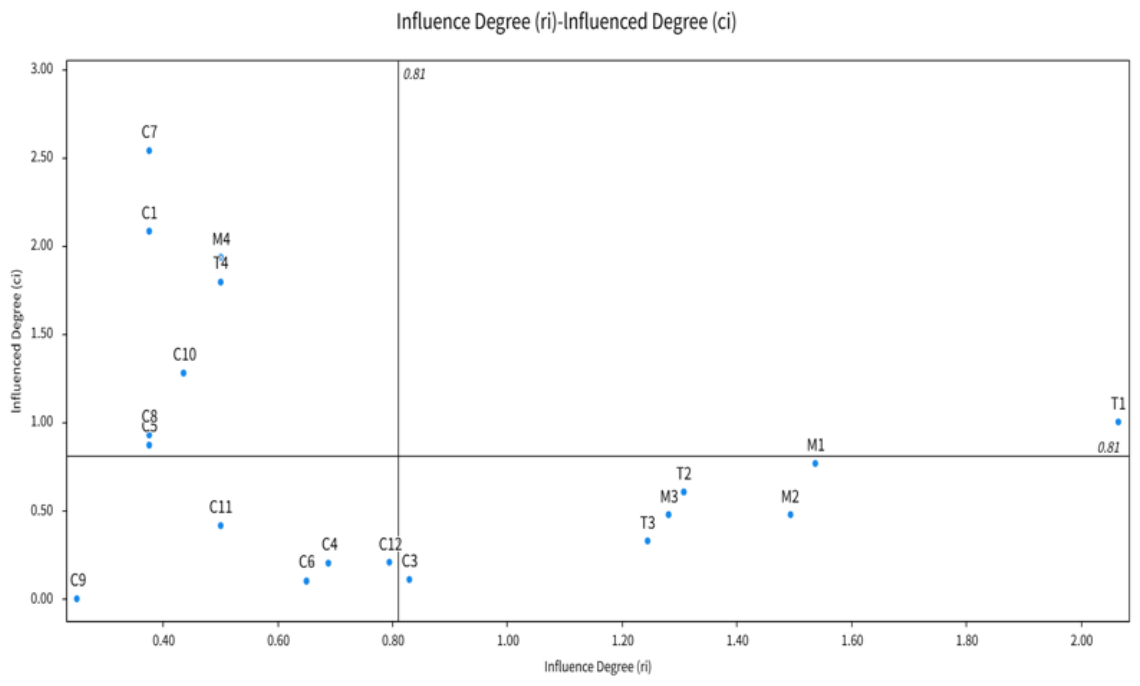
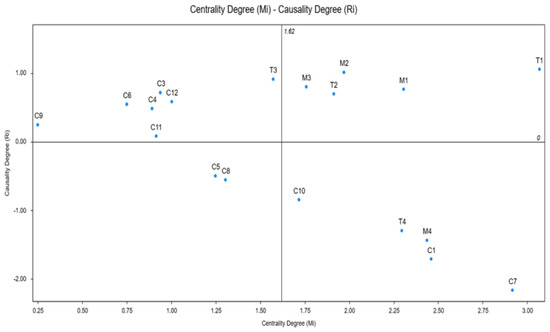
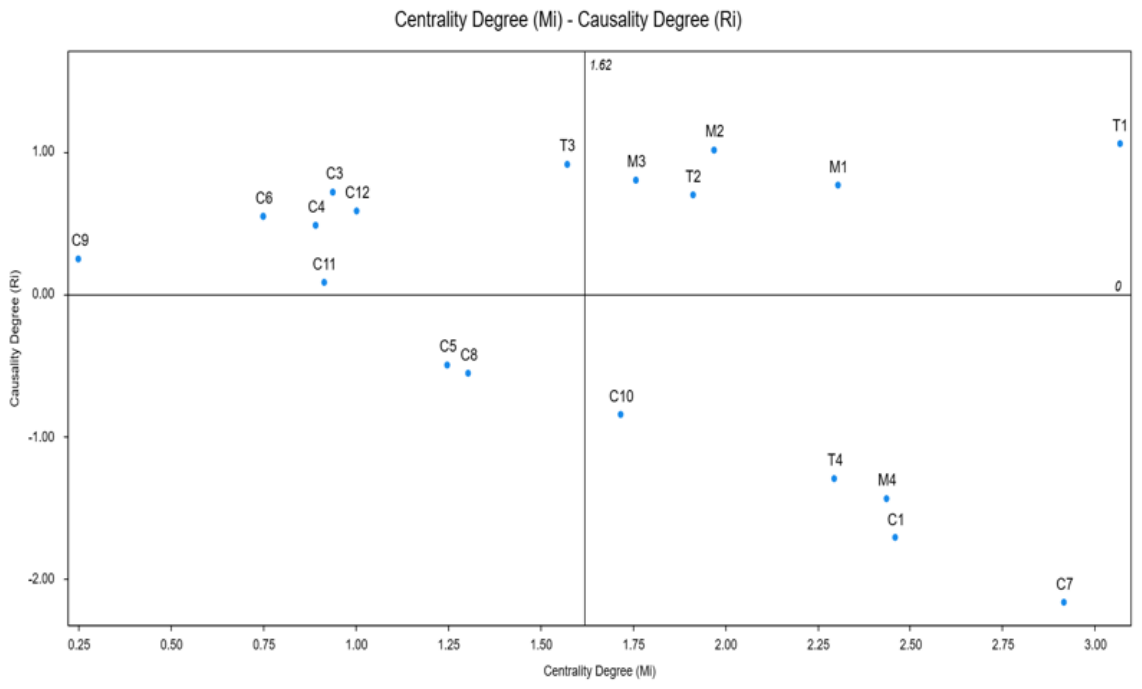
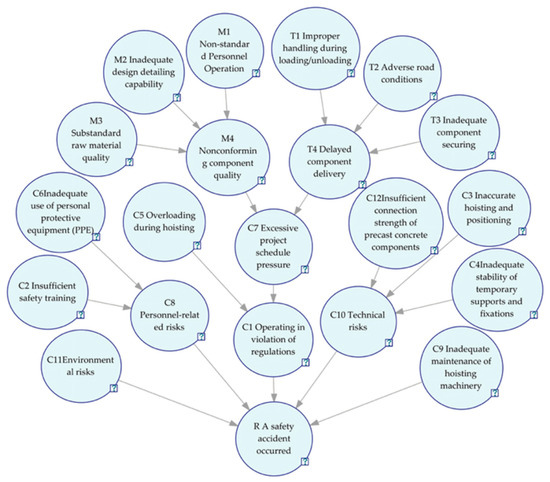
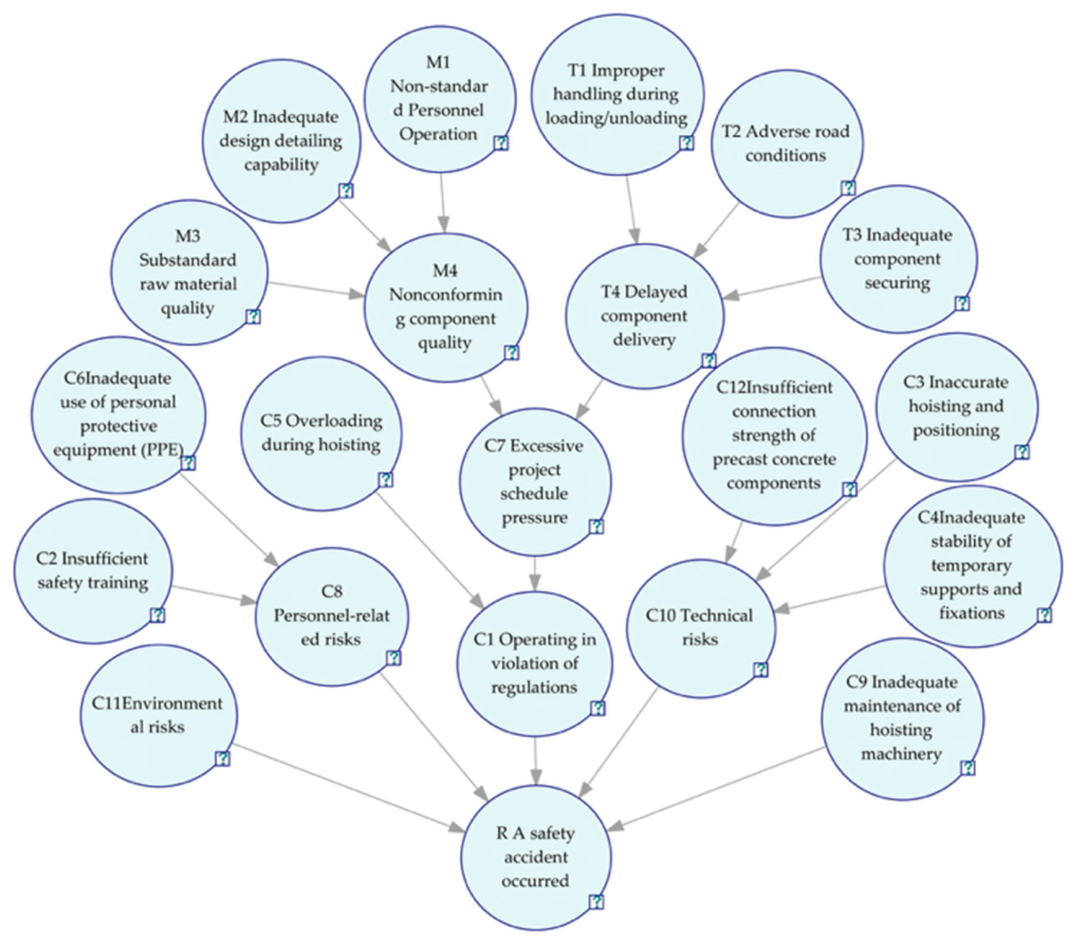
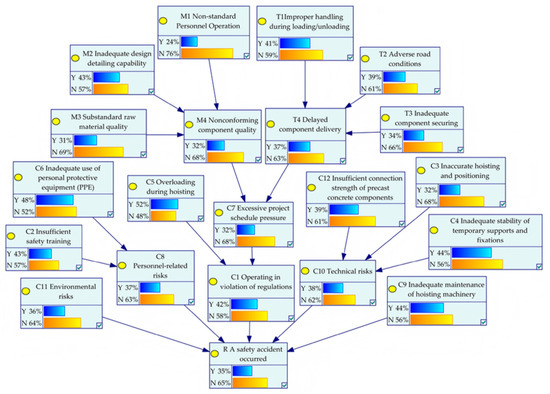
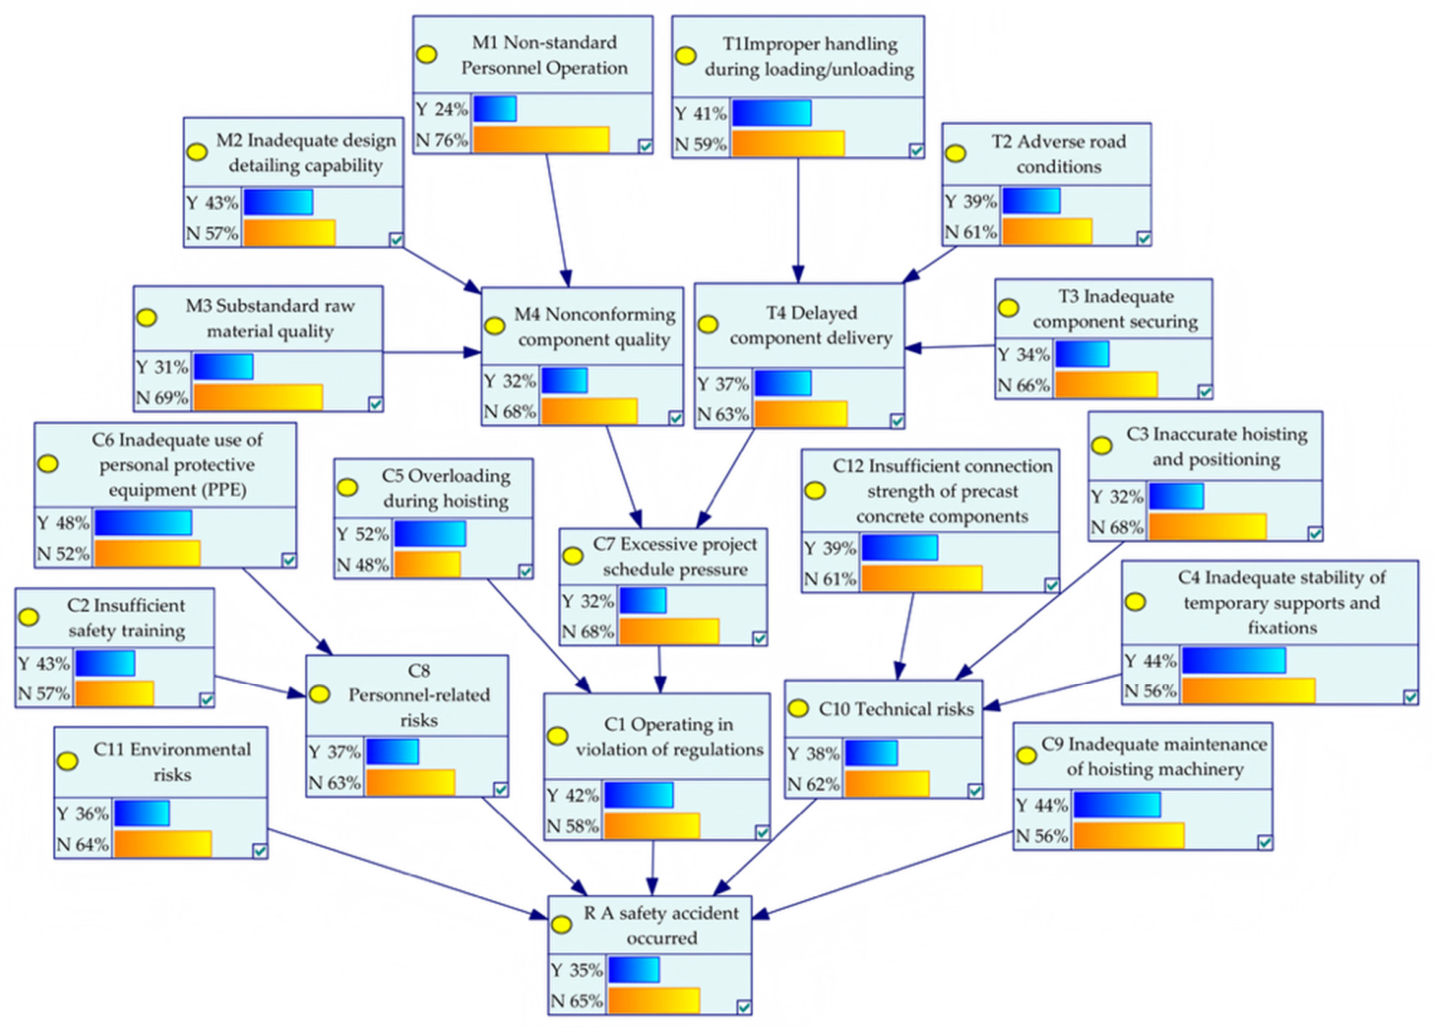
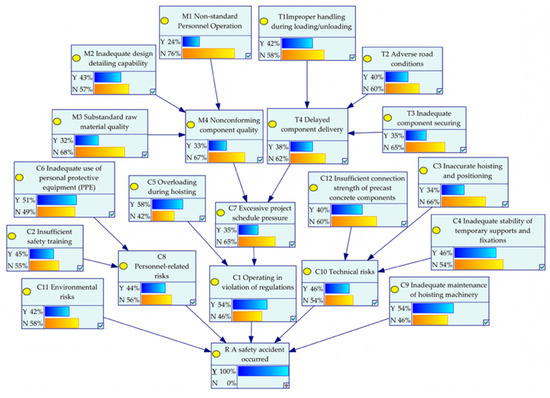
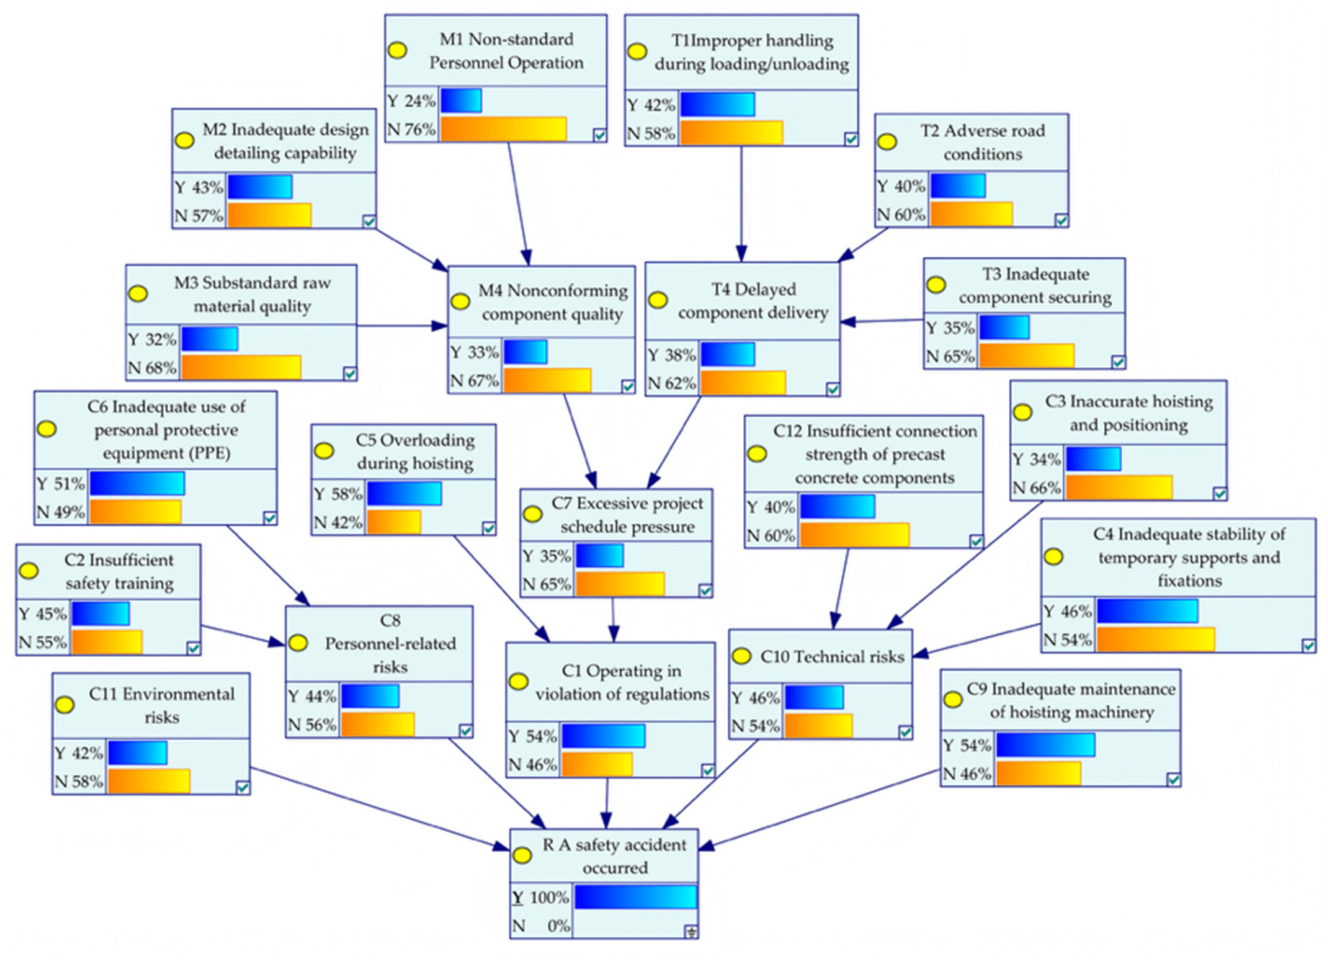
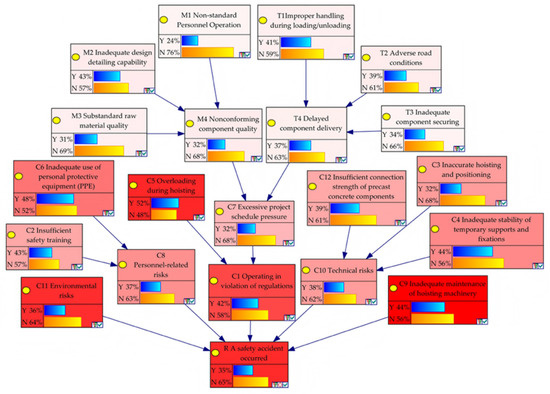
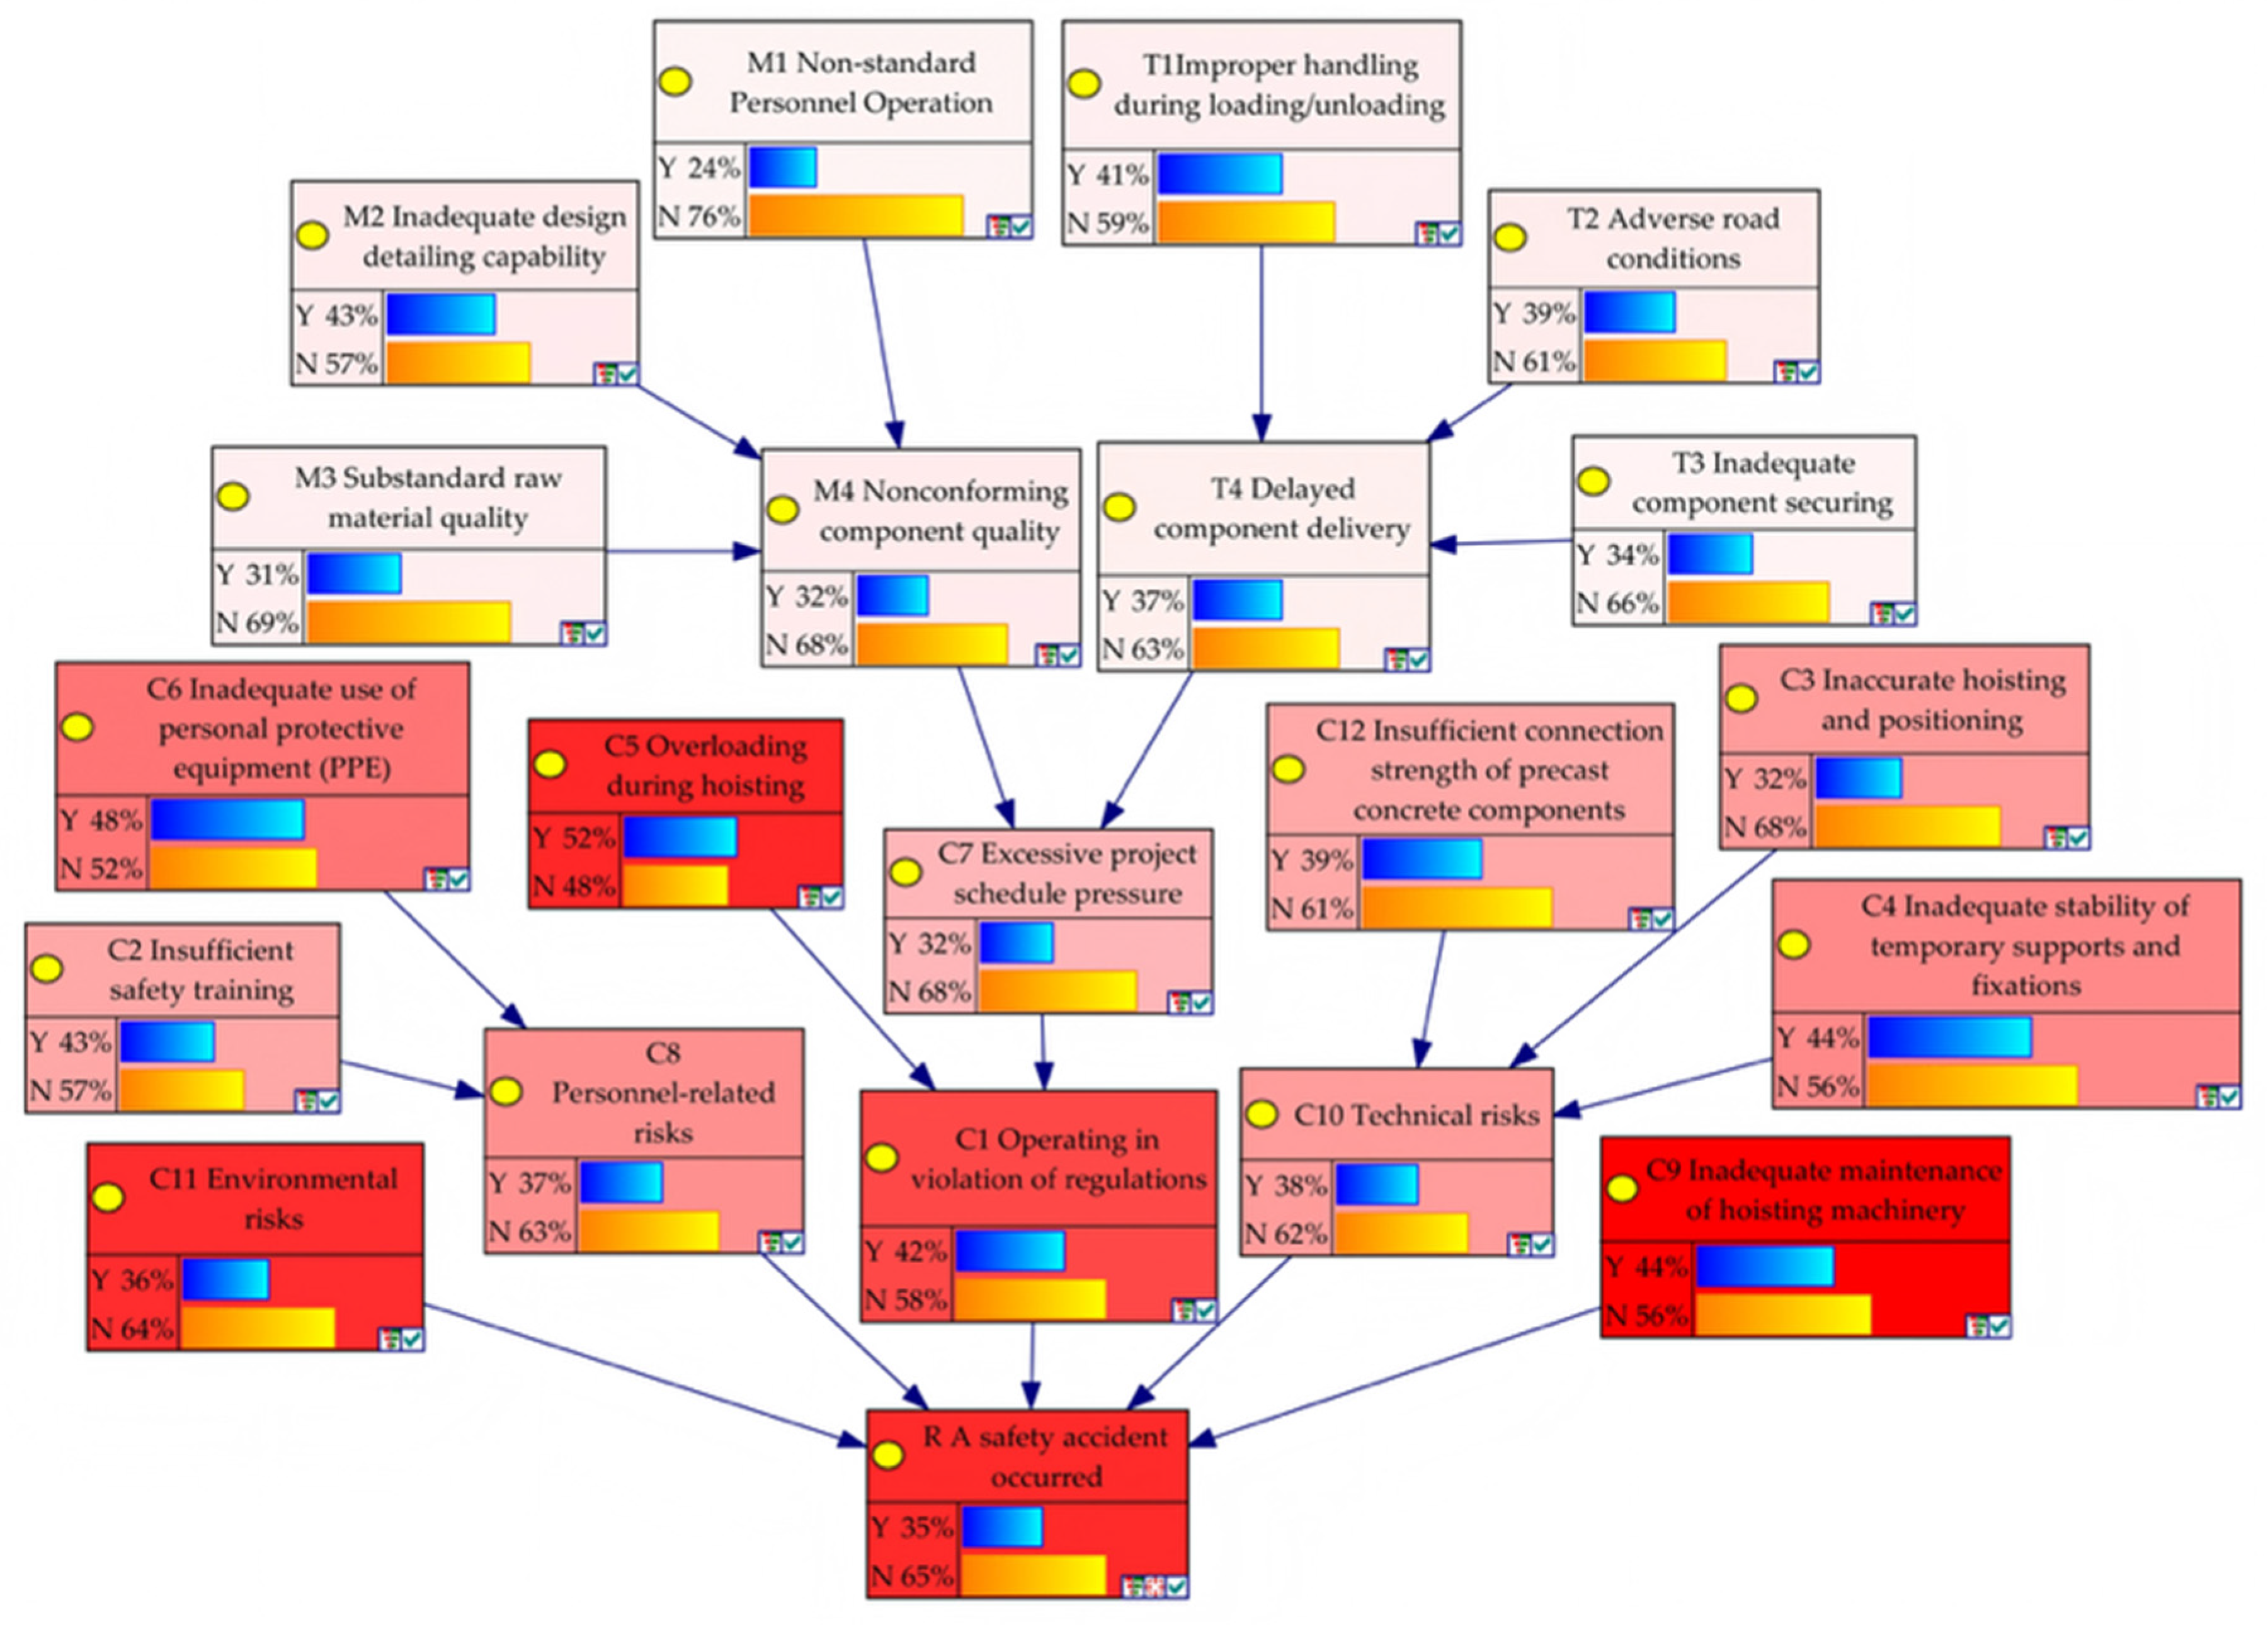
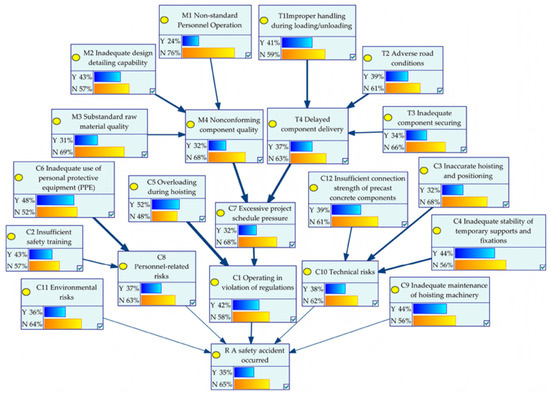
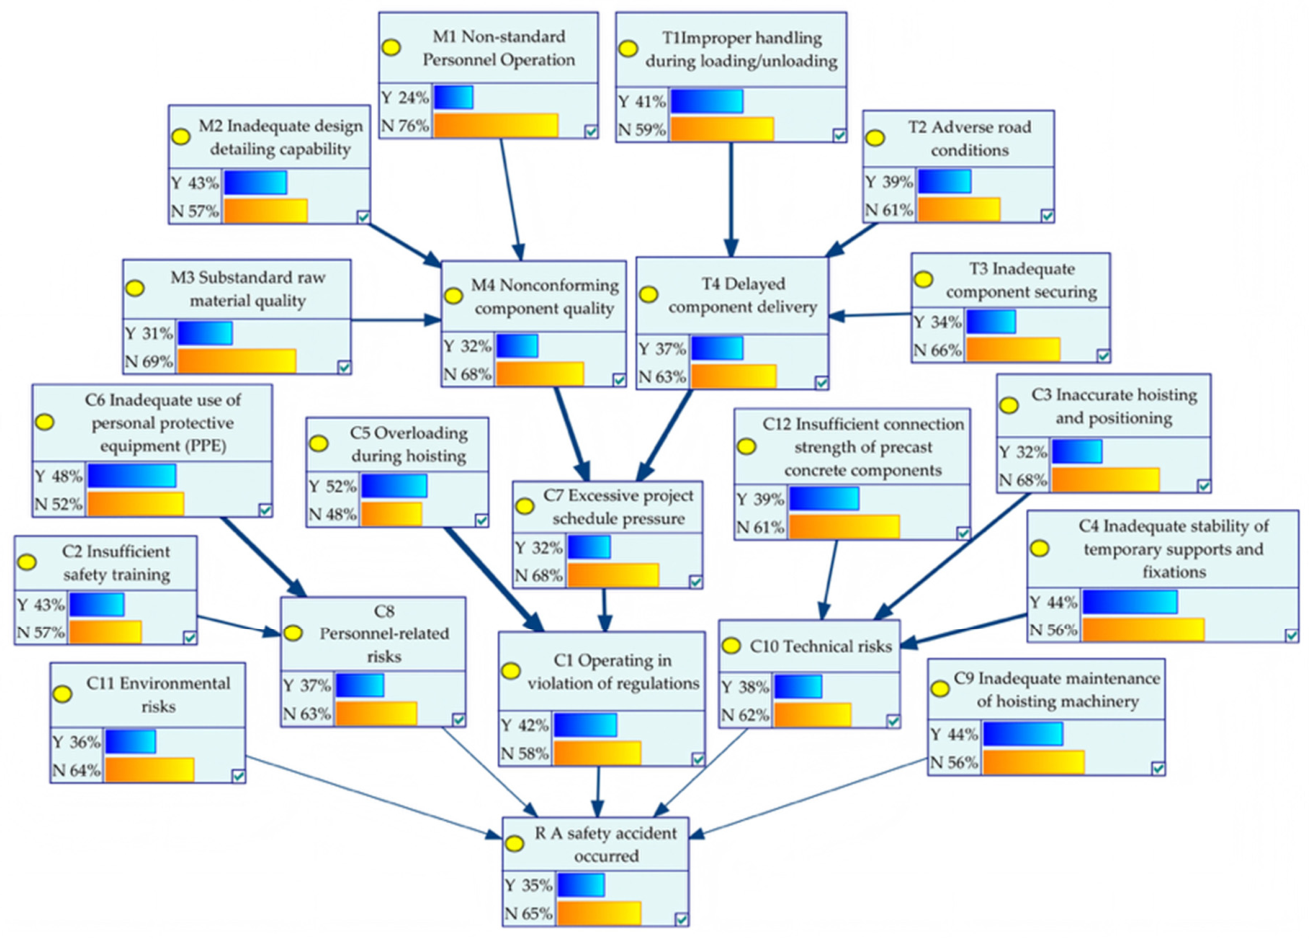
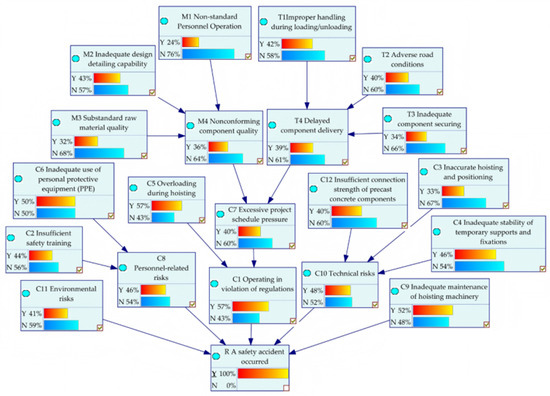
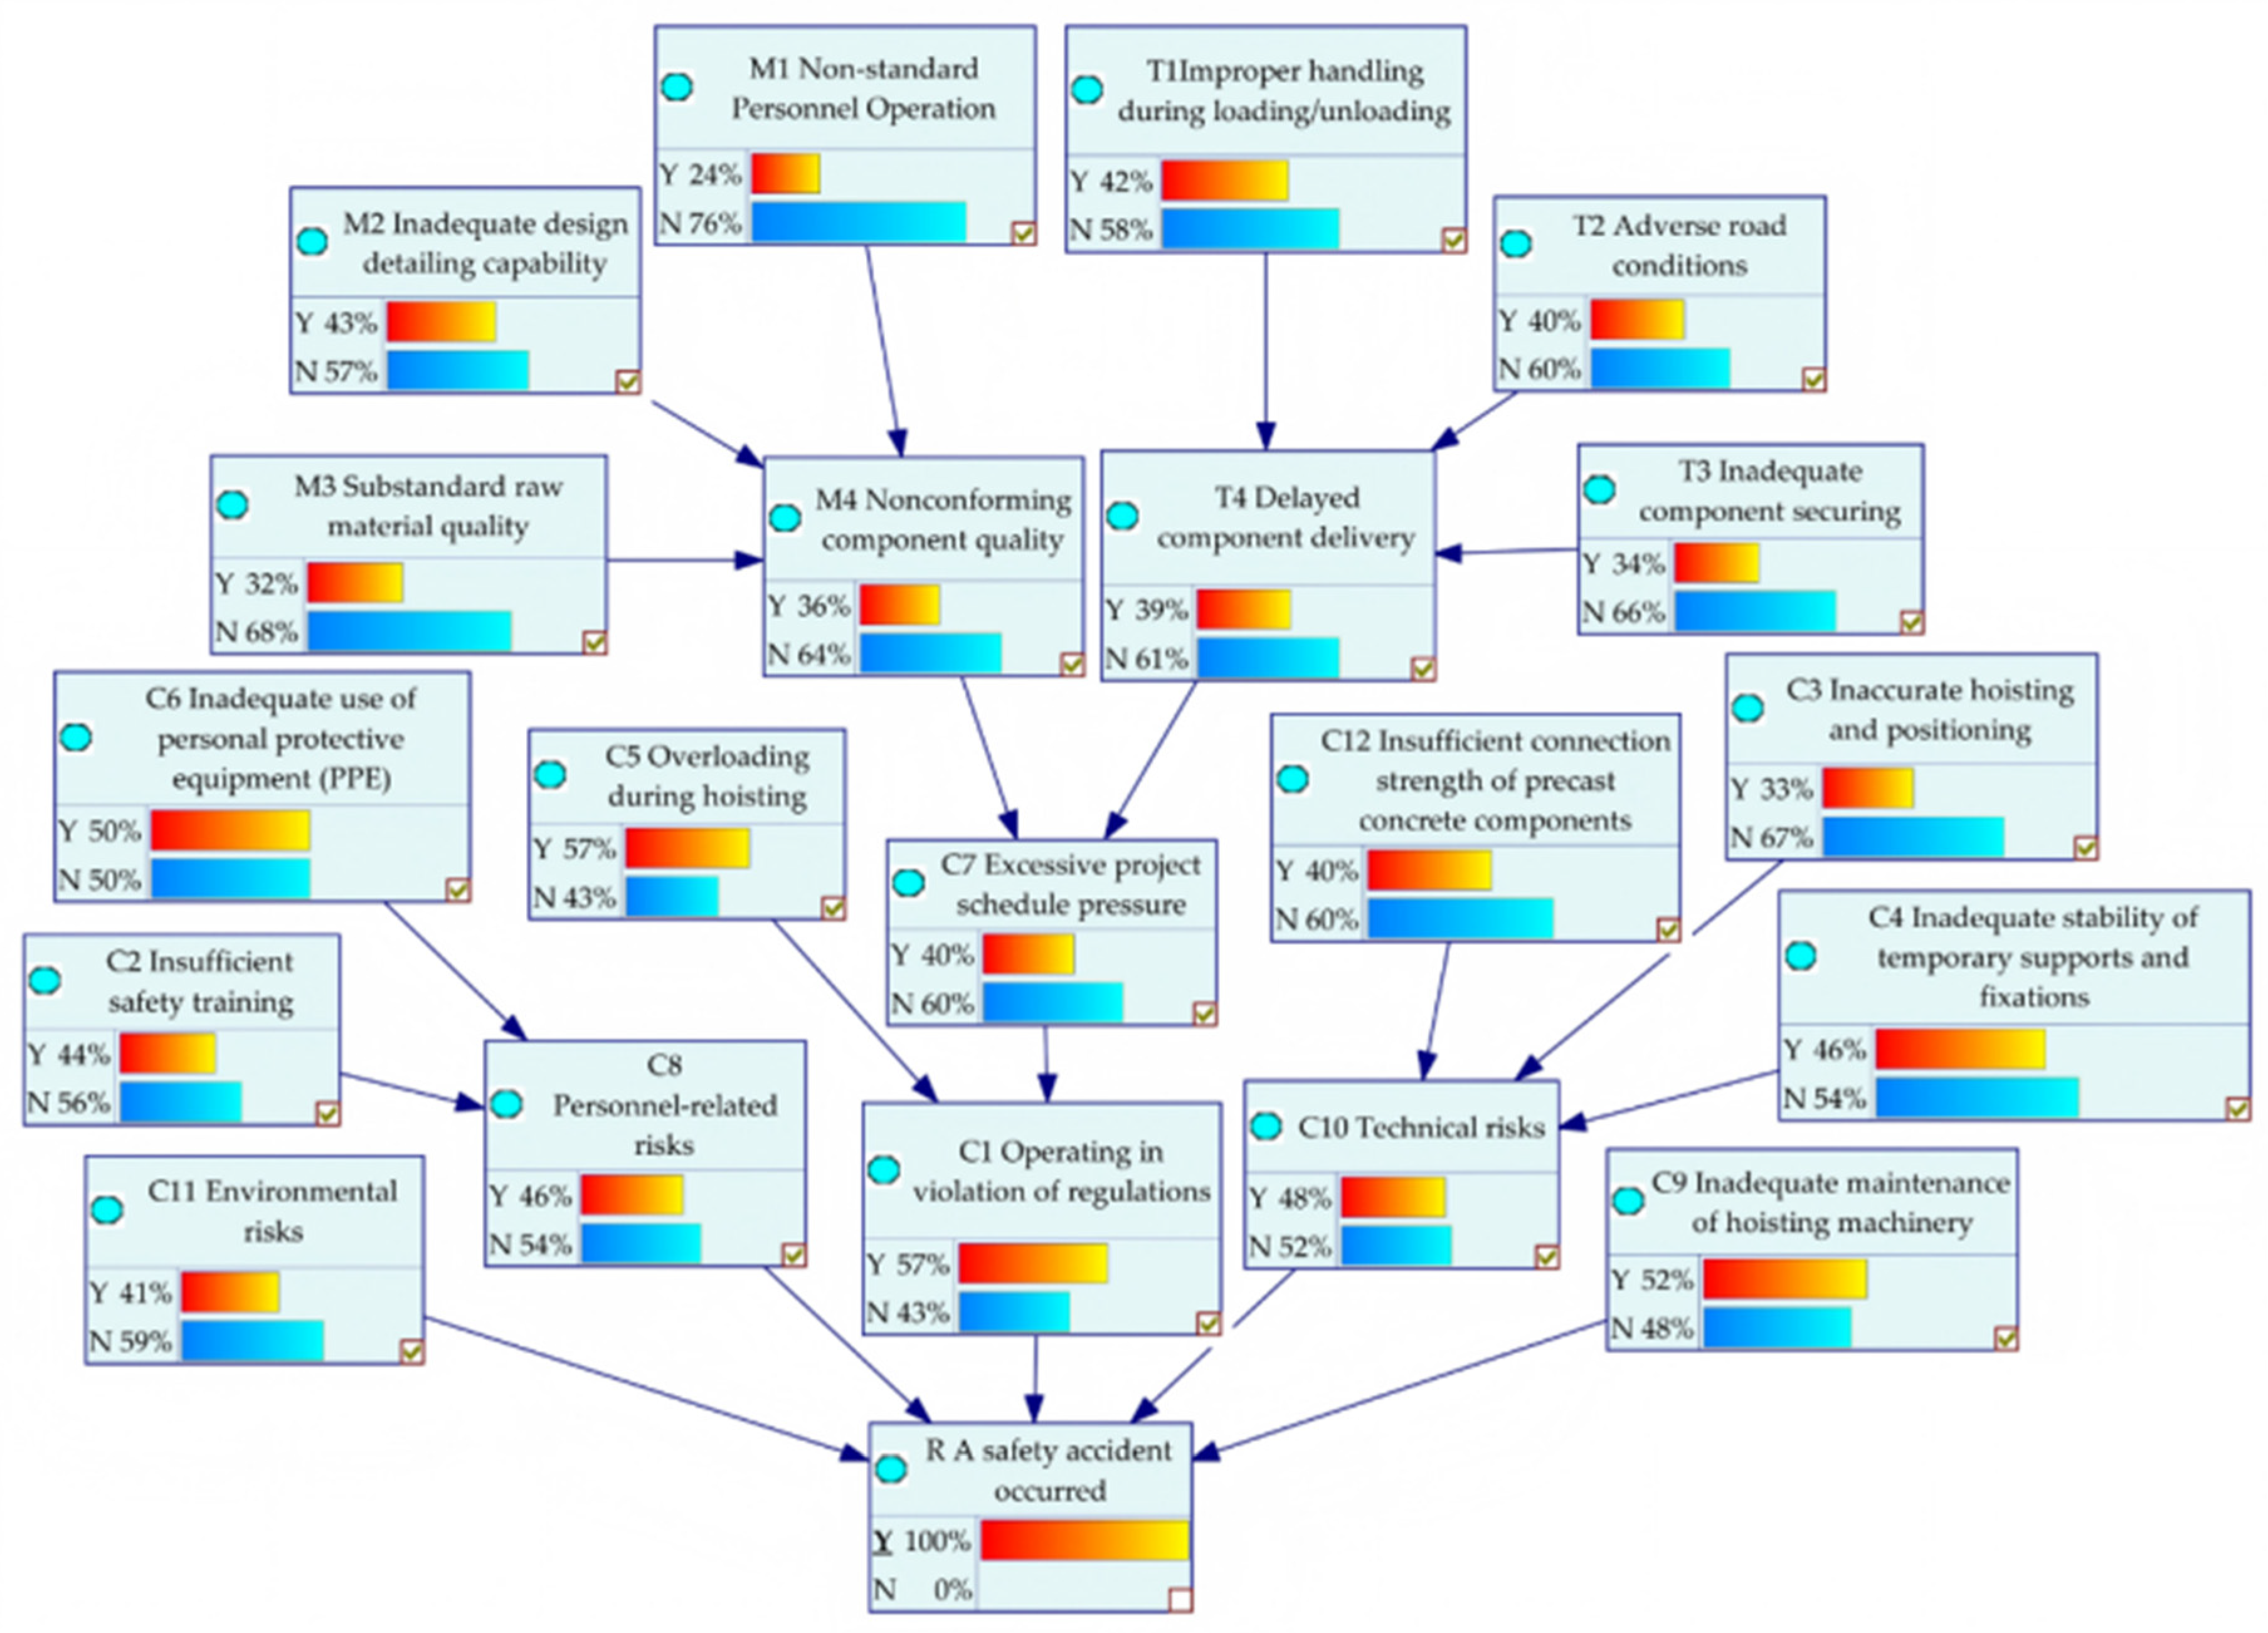

Disclaimer/Publisher’s Note: The statements, opinions and data contained in all publications are solely those of the individual author(s) and contributor(s) and not of MDPI and/or the editor(s). MDPI and/or the editor(s) disclaim responsibility for any injury to people or property resulting from any ideas, methods, instructions or products referred to in the content. |
© 2026 by the authors. Licensee MDPI, Basel, Switzerland. This article is an open access article distributed under the terms and conditions of the Creative Commons Attribution (CC BY) license.