


Abstract
This paper presents an investigation into the structural behavior of a suspension bridge exposed to an oil-tanker-truck fire. A coupled CFD-FEM analysis model is established to incorporate realistic oil-tanker fire scenarios and multiscale thermo-mechanical coupling, allowing the local thermal responses of critical components and global structural behavior of the suspension bridge to be captured within a unified framework. This model is validated to investigate thermal and structural responses on suspension bridges under different fire exposure lengths and locations influenced by transverse wind. Herein, this response embraces temperature rise, deflection progression, stress evolution in the main cable, force redistribution of hangers, and global failure evolution. Thereafter, failure assessment methods for main cables and hangers in suspension bridges exposed to oil-tanker-truck fires are proposed. The predominant results indicate that crosswind causes the flame to tilt toward and even fully envelop the main cable. Rapid temperature rise along the circumference of the main cable accelerates the degradation of cable load-carrying capacity, eventually leading to main cable rupture and global collapse of the suspension bridge. The proposed main-cable failure assessment method, based on fire exposure duration and surface temperature, can rapidly estimate the fire-resistance limit of main cables. Ruptured hangers lead to upward jumping of deflection in the main cable and a downward deflecting of the main girder. Force redistribution to adjacent hangers may trigger successive ruptures, and the force-based assessment method effectively evaluates the progressive collapse of a suspension bridge subjected to an oil-tanker-truck fire.
1. Introduction
Suspension bridges exhibit both significant aesthetic value and efficient utilization of materials [1]. Withstanding the enormous loads through the main cable, suspension bridges have the advantages of structural stability, light self-weight and large spans [2]. Therefore, they have widely served as major transportation infrastructure connecting critical economic nodes such as ports and cities [1,2]. A large number of goods are circulated through suspension bridges, and any structural damage may disrupt the transportation network and cause sizable socioeconomic losses. However, growing energy demand increases the density of oil-tanker trucks, thereby elevating the frequency of vehicle fires caused by overloading or collisions [1]. As the most severe types of transportation fire, oil-tanker fires pose a heightened threat to suspension bridges. The temperature peak could reach over 1000 °C under intense combustion [3].
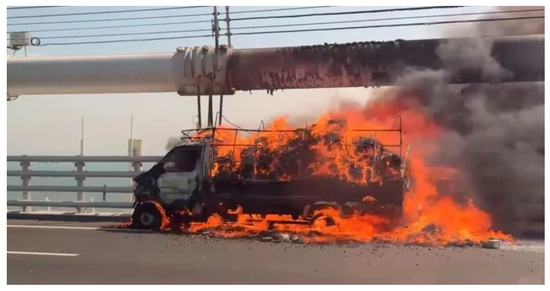
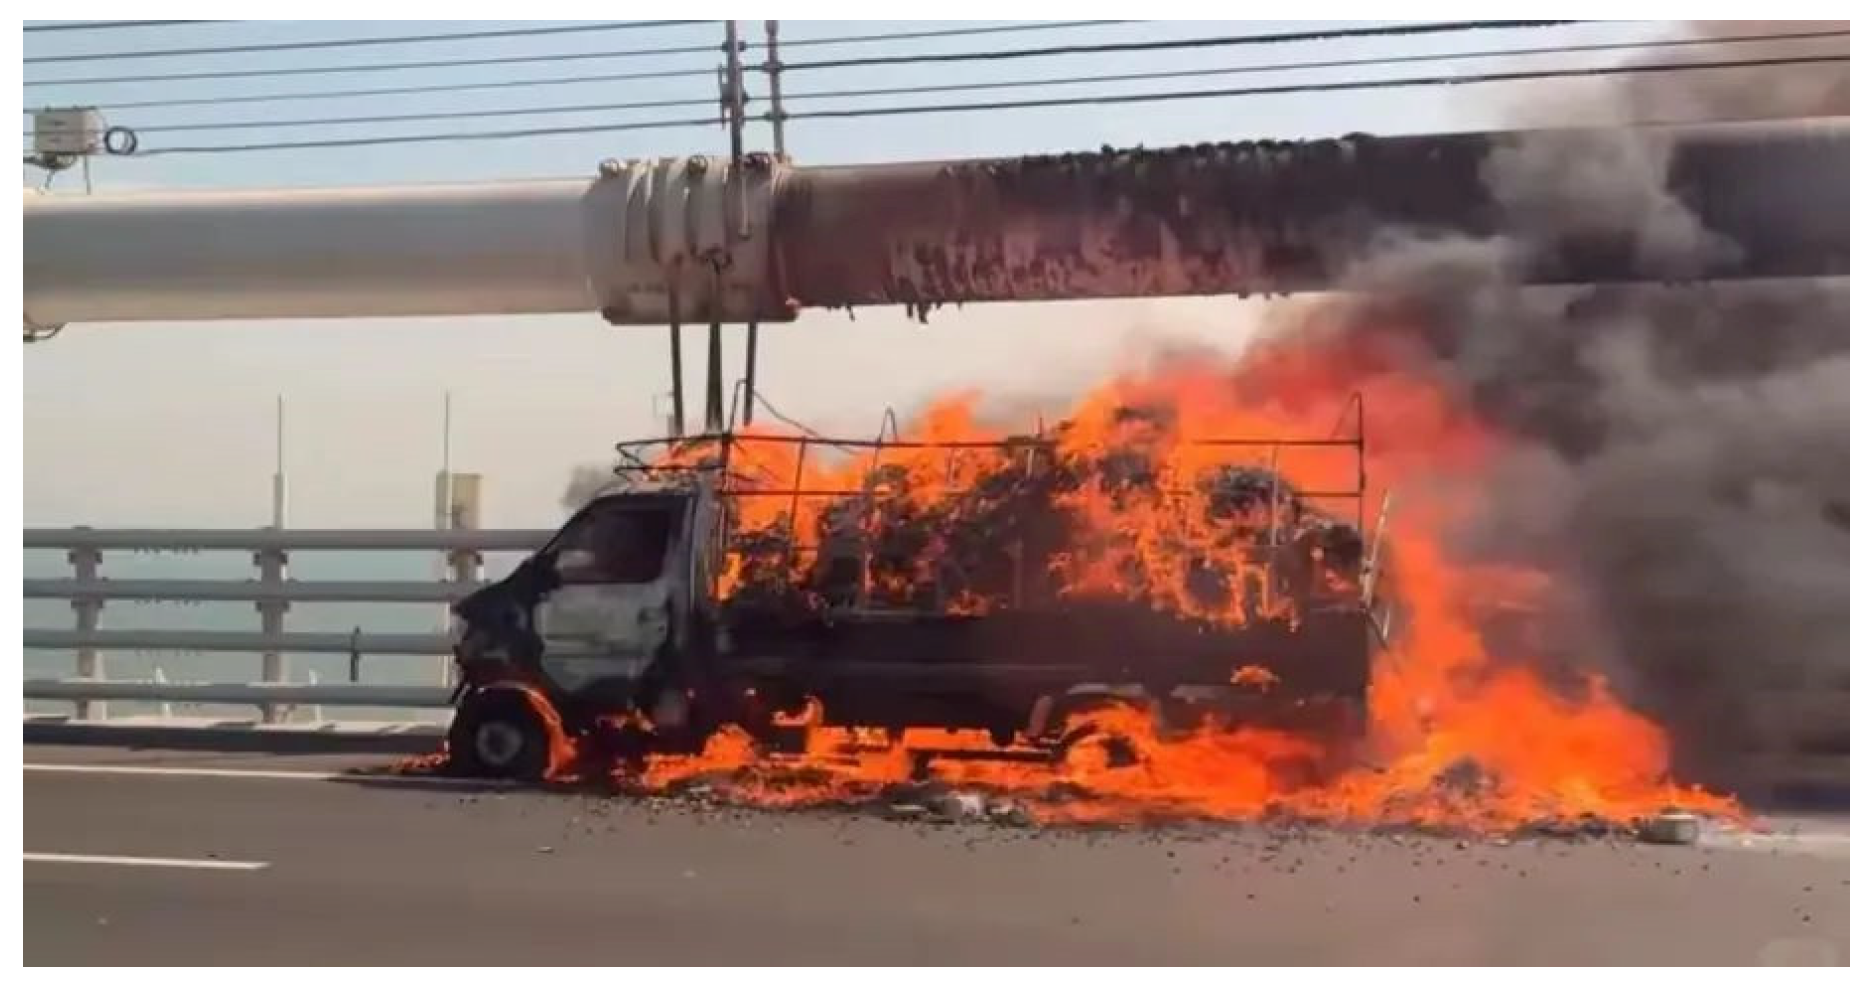
The application of high-strength steel has significantly expanded the span and enhanced the load-carrying capacity of suspension bridges. However, due to the high sensitivity of steel at elevated temperatures, the main cables and hangers rapidly lose capacity under fire exposure conditions [4,5]. On 25 October 2024, a small truck carrying retail food ignited on the Shenzhen–Zhongshan Link (see Figure 1). Distinct scorch marks were observed on the protective sheath of the main cable [6]. Although this event did not cause structural damage to the main cable, it was sufficient to highlight the severity and urgency of fire-safety issues in suspension bridges.
Figure 1.
Fire on suspension bridge [6].
Previous studies have provided valuable insights into the fire performance of steel bridge structures. Fire-resistance tests on simply supported steel bridge girders with different cross-sectional configurations, including box girders, truss girders, and steel–concrete composite girders, have revealed that the girder typology and fire scenarios significantly influence the thermal response, fire endurance, and resultant failure modes [1,7,8,9]. Furnace fire tests on steel cables have also greatly advanced the understanding of cable performance under fire [4,10,11,12]. Selamet et al. [4] carried out hydrocarbon fire tests on 19-parallel wire strand specimens, evaluated fire performance and concluded that fire protection should be considered once temperatures exceed 300 °C. Chen et al. [10] performed a battery of fire tests on suspension-bridge main cables and proposed design requirements for different fire protection types. In addition, Alos-Moya et al. [12] conducted open-air fire tests under a composite bridge deck, exposing the full bridge to several realistic fire scenarios. Ge et al. [13] conducted gasoline pool-fire tests to characterize the thermal response of hangers exposed to vehicle-fire scenarios. These tests demonstrate that structural fire response is highly sensitive to factors such as the fire location and wind speed, highlighting that non-uniform spatiotemporal fields in both flame and structure are intrinsic to realistic fire scenarios.
Researchers have further investigated the structural response of bridge components under realistic fire conditions through numerical simulation. Among the available approaches, the coupled computational fluid dynamics (CFD)–finite element method (FEM) analysis method provides an effective means of linking fire development with structural response. Alos-Moya et al. [14] captured the along-span non-uniform temperature distribution around a bridge through CFD models and validated the simulations against the temperatures measured in fire tests. Xu et al. [15] utilized a sequentially coupled CFD and FE simulation for thermo-mechanical analysis to evaluate the fire response of steel box girders subjected to real-fire exposure, and numerical results were validated against full-scale bridge fire tests. Although these studies have improved the understanding of thermal response, structural degradation, and fire resistance, their scope is limited to conventional girder bridges or isolated structural members. Compared with conventional girder bridges, the fire response of suspension bridges is much more complex. The non-uniform temperature field in suspension bridges not only causes different degrees of material degradation and restrained thermal expansion in key members but also induces significant force redistribution throughout the bridge system. Therefore, the structural behavior of fire-exposed suspension bridges cannot be interpreted simply as the isolated response of individual components. Instead, it should be analyzed as a system-level failure evolution incorporating localized member failures and the subsequent redistribution of internal forces.
A few studies have incorporated the entire bridge system into their analysis to capture the structural response of suspension bridges under fire. Yu et al. [16] determined the shortest failure time of the main cable and hanger within a fire-exposed double-layer suspension bridge, but the global structural mechanics were not clearly addressed. Gong and Cui et al. [17,18] evaluated the fire resistance of a suspension bridge based on the main girder and tower under different fire scenarios, respectively. Okur et al. [19] investigated the progressive collapse behavior of the Osmangazi Suspension Bridge under various loading conditions and hanger breakage situations and compared the structural responses of key components. Despite these advances, existing analyses remain largely focused on the fire resistance of specific components. The evolution of internal force redistribution in suspension bridges under localized vehicle fire exposure has not been sufficiently clarified. Also, studies on progressive collapse induced by hanger rupture have rarely incorporated fire-induced temperature fields and the associated deterioration of structural performance. Moreover, there is a lack of investigation into the coupled response among different structural components under fire, as well as limited insights into the failure sequence of critical members and the global failure modes of suspension bridges.
This study aims to investigate the fire response of a suspension bridge under localized fire exposure conditions and propose a failure assessment method. CFD models for oil-tanker fire environments and multiscale FE models based on local and full-bridge models are developed to explore failure mechanisms of suspension bridges under various fire scenarios. Taking into account key parameters such as the length, location of fire exposure and wind speed, the system-level thermal–structural response is analyzed. The evolution of temperature and deflection in steel girders and cables, together with stress and internal force redistribution, is measured and analyzed. Guided by these findings, the failure assessment method for a long-span suspension bridge exposed to fire is established, with emphasis on the load-bearing capacity degradation of the main cables and successive hanger rupture. Elucidation of the system-level thermal–structural coupling and progressive collapse mechanisms provides a reference for the design, inspection and evaluation of fire resistance.
2. Analysis Details
A coupled CFD-FEM analysis approach has been developed to track the behavior of a suspension bridge under combined local fire exposure and structural loads. The numerical approach involves the following steps: (1) Constructing the fire model of an oil-tanker truck utilizing CFD to accurately reproduce flame propagation in realistic fire scenarios; (2) Fitting the adiabatic surface temperature data extracted from fire models into unique temperature rise curves for each grid; (3) Developing a refined local segment model through ANSYS 2023R1 and then incorporating the grid-based heating curves for thermal analysis; (4) Integrating the local model into a multiscale full-bridge model to investigate the thermal and structural responses of the suspension bridge.
2.1. Selection of Typical Suspension Bridge
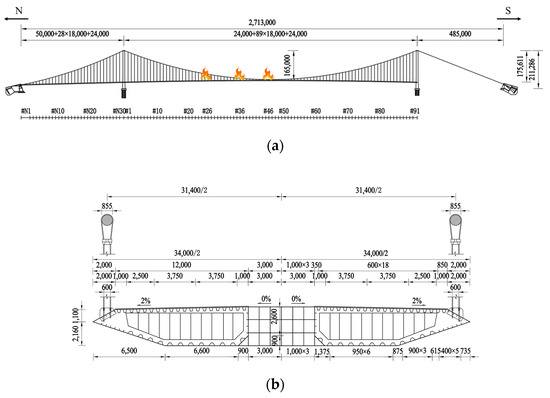
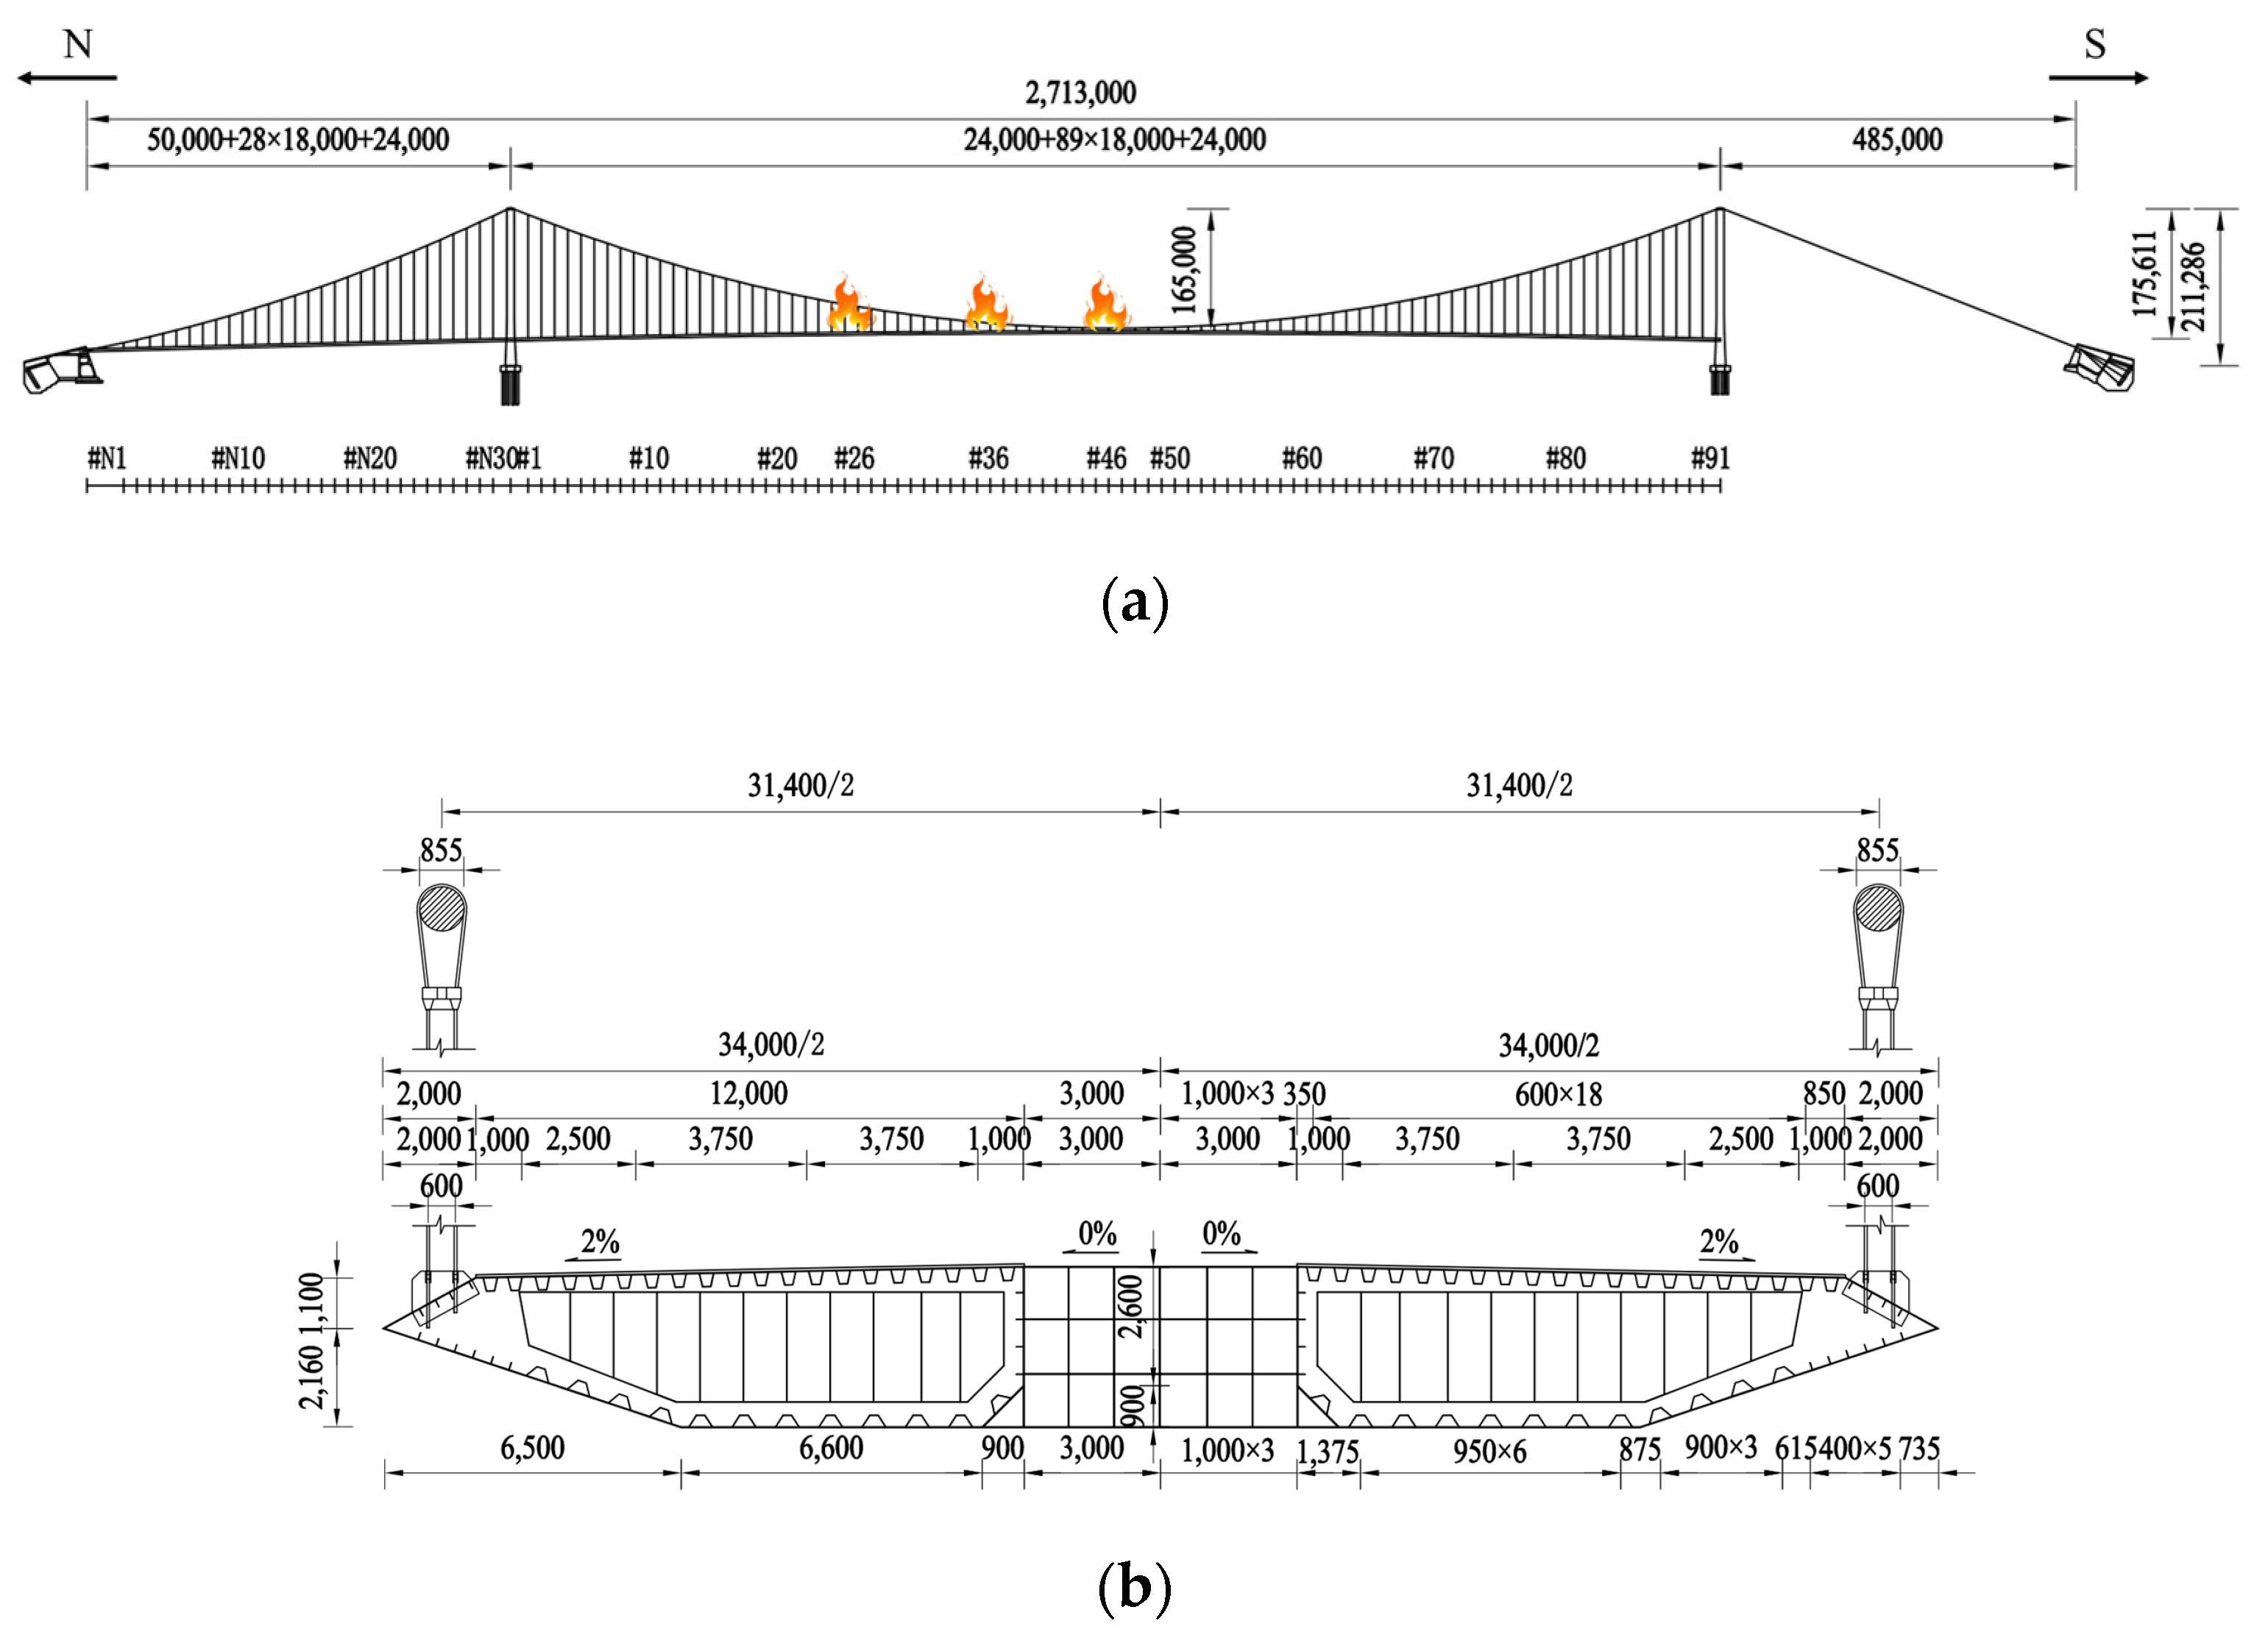
A typical long-span suspension bridge is selected for fire performance analysis. The main cable has a span configuration of 578 m + 1050 m + 485 m, as shown in Figure 2a. The main girder of the suspension bridge is assembled into segments, with a standard segment length of 18 m. The mid-span bridge segments are numbered from #1 to #91, while the north side span segments are numbered from #N1 to #N30. The main girder adopts a streamlined flat twin-box girder design, with a width of 34 m and a height of 3.5 m, as shown in Figure 2b. Each enclosed box girder is equipped with two 3.75 m wide traffic lanes and one 2.5 m wide emergency lane.
Figure 2.
Schematic of suspension bridge (Unit: mm): (a) elevation view; (b) cross-section view.
The main cables have a sag-to-span ratio of 1/10 and are constructed using high-strength prefabricated parallel wire strands (PPWS). Each strand consists of 127 high-strength steel wires, each with a diameter of 5.25 mm. The diameters of the main cables are 870 mm at the suspension span on the north side, 855 mm at the mid-span, and 860 mm at the approach span on the south side. The hangers are made of steel wire ropes with a diameter of 60 mm. The entire bridge is designed with a total of 238 hanger points, with two hangers bypassing the main cable and connecting to the main girder at every point. High-strength wires used in the main cable and hangers have a tensile strength of 1770 MPa. The main girder is fabricated from steel with a yield strength of 345 MPa.
2.2. Provision of Parameters
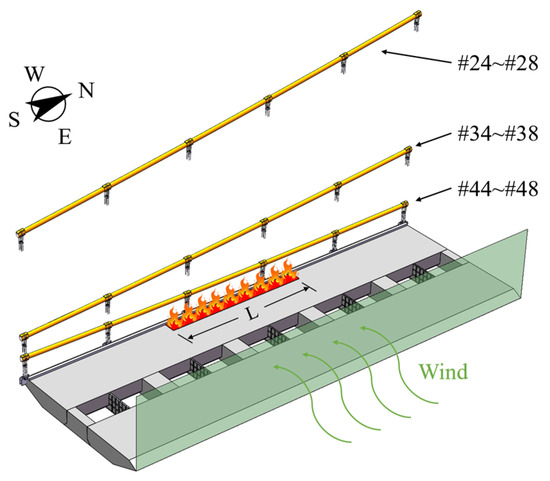
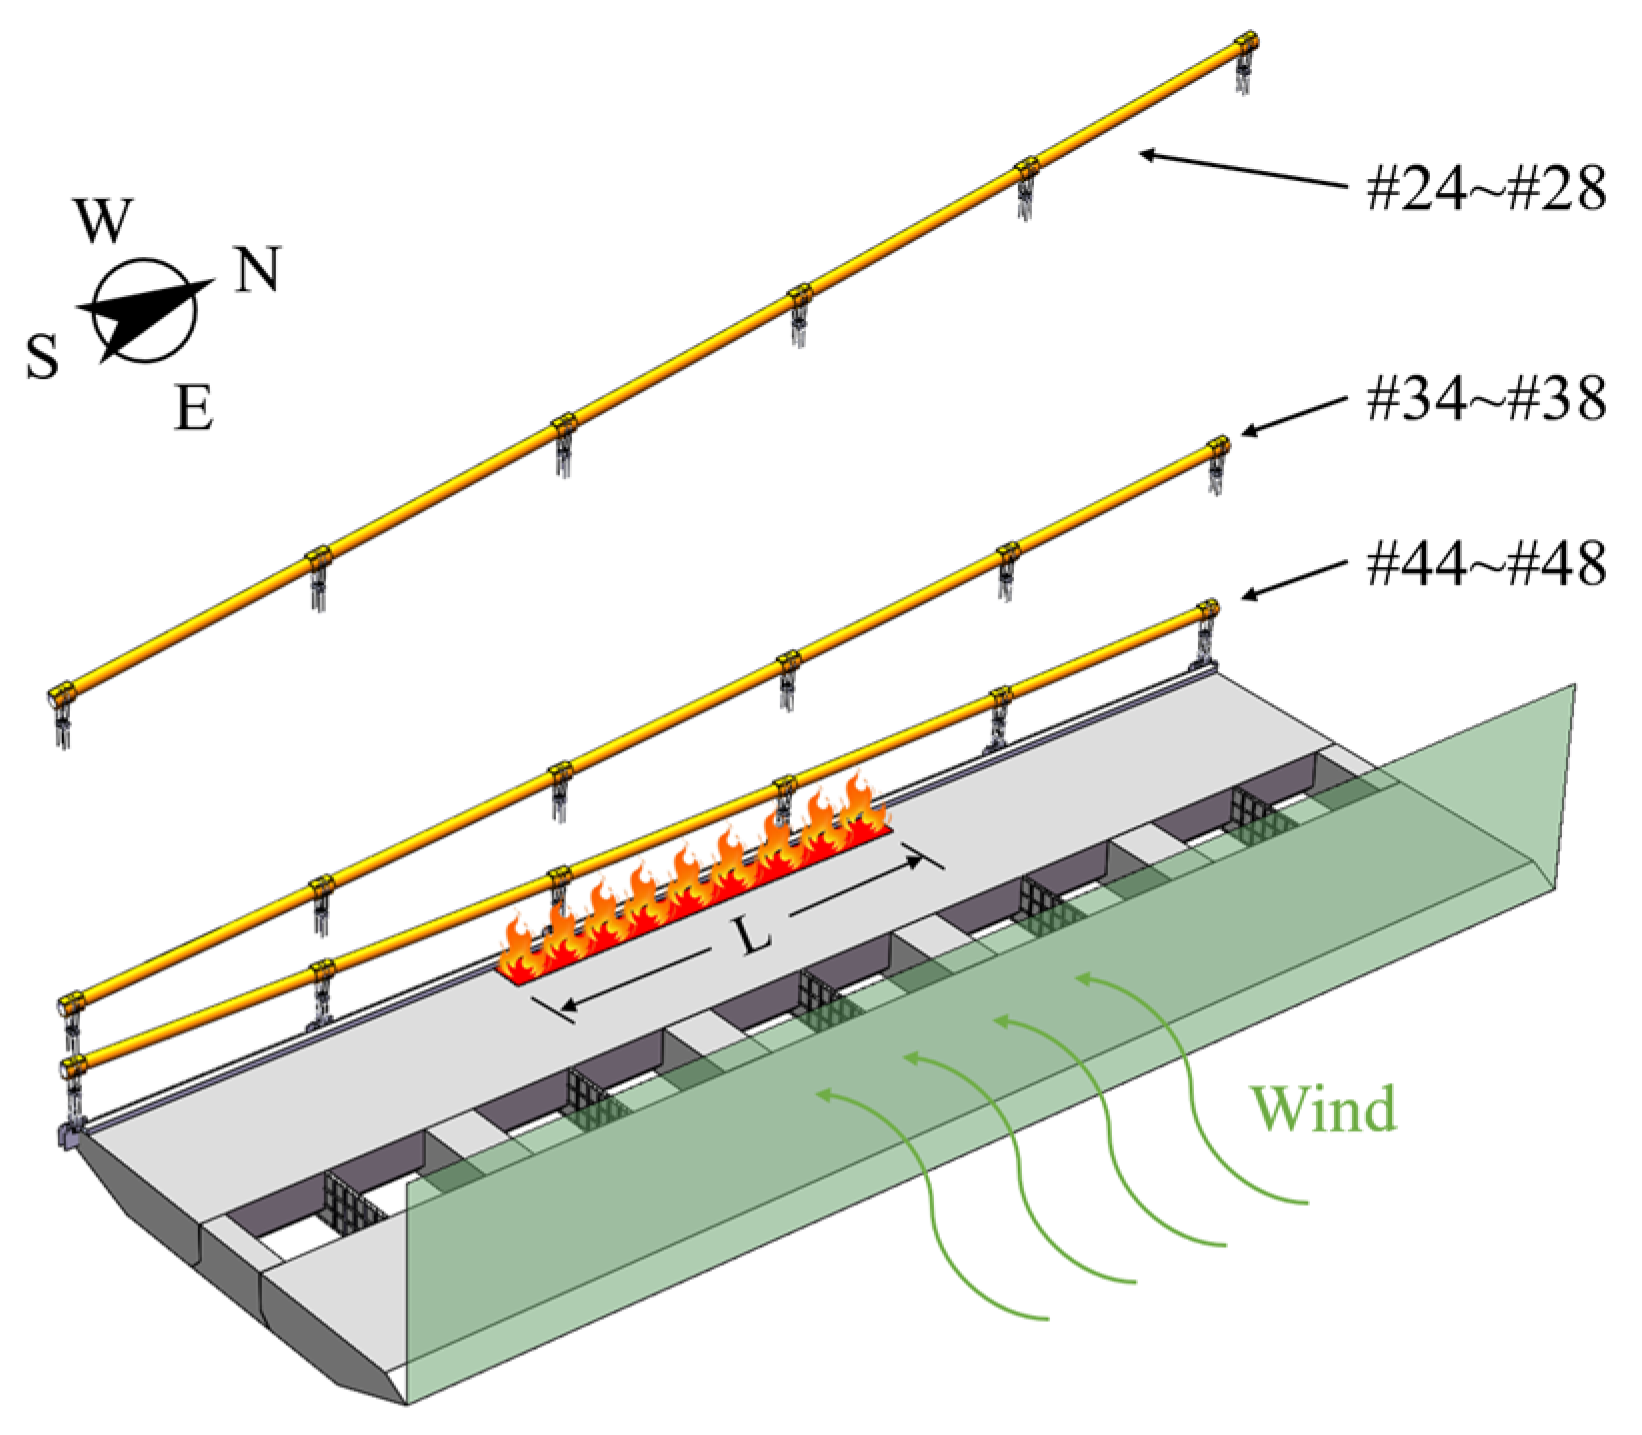
The impact of fire exposure length (L), exposure location, and wind speed on fire response in a long-span suspension bridge under localized fire conditions is evaluated utilizing the numerical procedure presented above. Figure 3 presents schematic fire scenarios on the bridge deck for research parameters.
Figure 3.
The schematic diagram of fire scenarios.
Fire exposure lengths of 10, 30, 50, and 70 m are considered to cover representative hanger-rupture cases when evaluating bridge response. Given the limited flame height, three fire exposure locations are selected to cover low, intermediate, and high cable elevations, as shown in Figure 2a and Figure 3: segment #46 at mid-span (cable elevation 3.6 m above deck), #36 at the one-eighth-span location (12.7 m), and #26 at the quarter-span location (41.9 m). Wind is a key factor governing the evolution of the fire plume and the resulting structural temperature distribution. Herein, a transverse wind from east to west is prescribed at 1, 3, and 5 m/s (see Figure 3). The analysis concentrates on wind-induced flame tilt and temperature characteristics, so wind is not considered as a mechanical load on the structure. Table 1 lists the parameters of fire scenarios.
Table 1.
Parameters of fire scenarios.
2.3. Fire Simulation
Fire models are established using Fire Dynamic Simulator (FDS version 6.7.6), an open-source code developed by the National Institute of Standards and Technology (NIST) [20,21]. This software can predict smoke flow rate, fire temperature, and gas concentration distribution. The program has been validated for its capability to accurately simulate intricate fire dynamics [20].
2.3.1. Fire Model
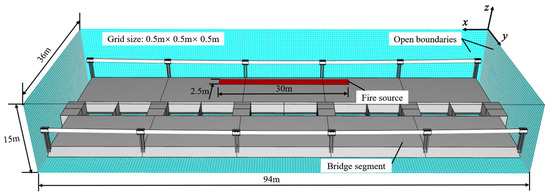
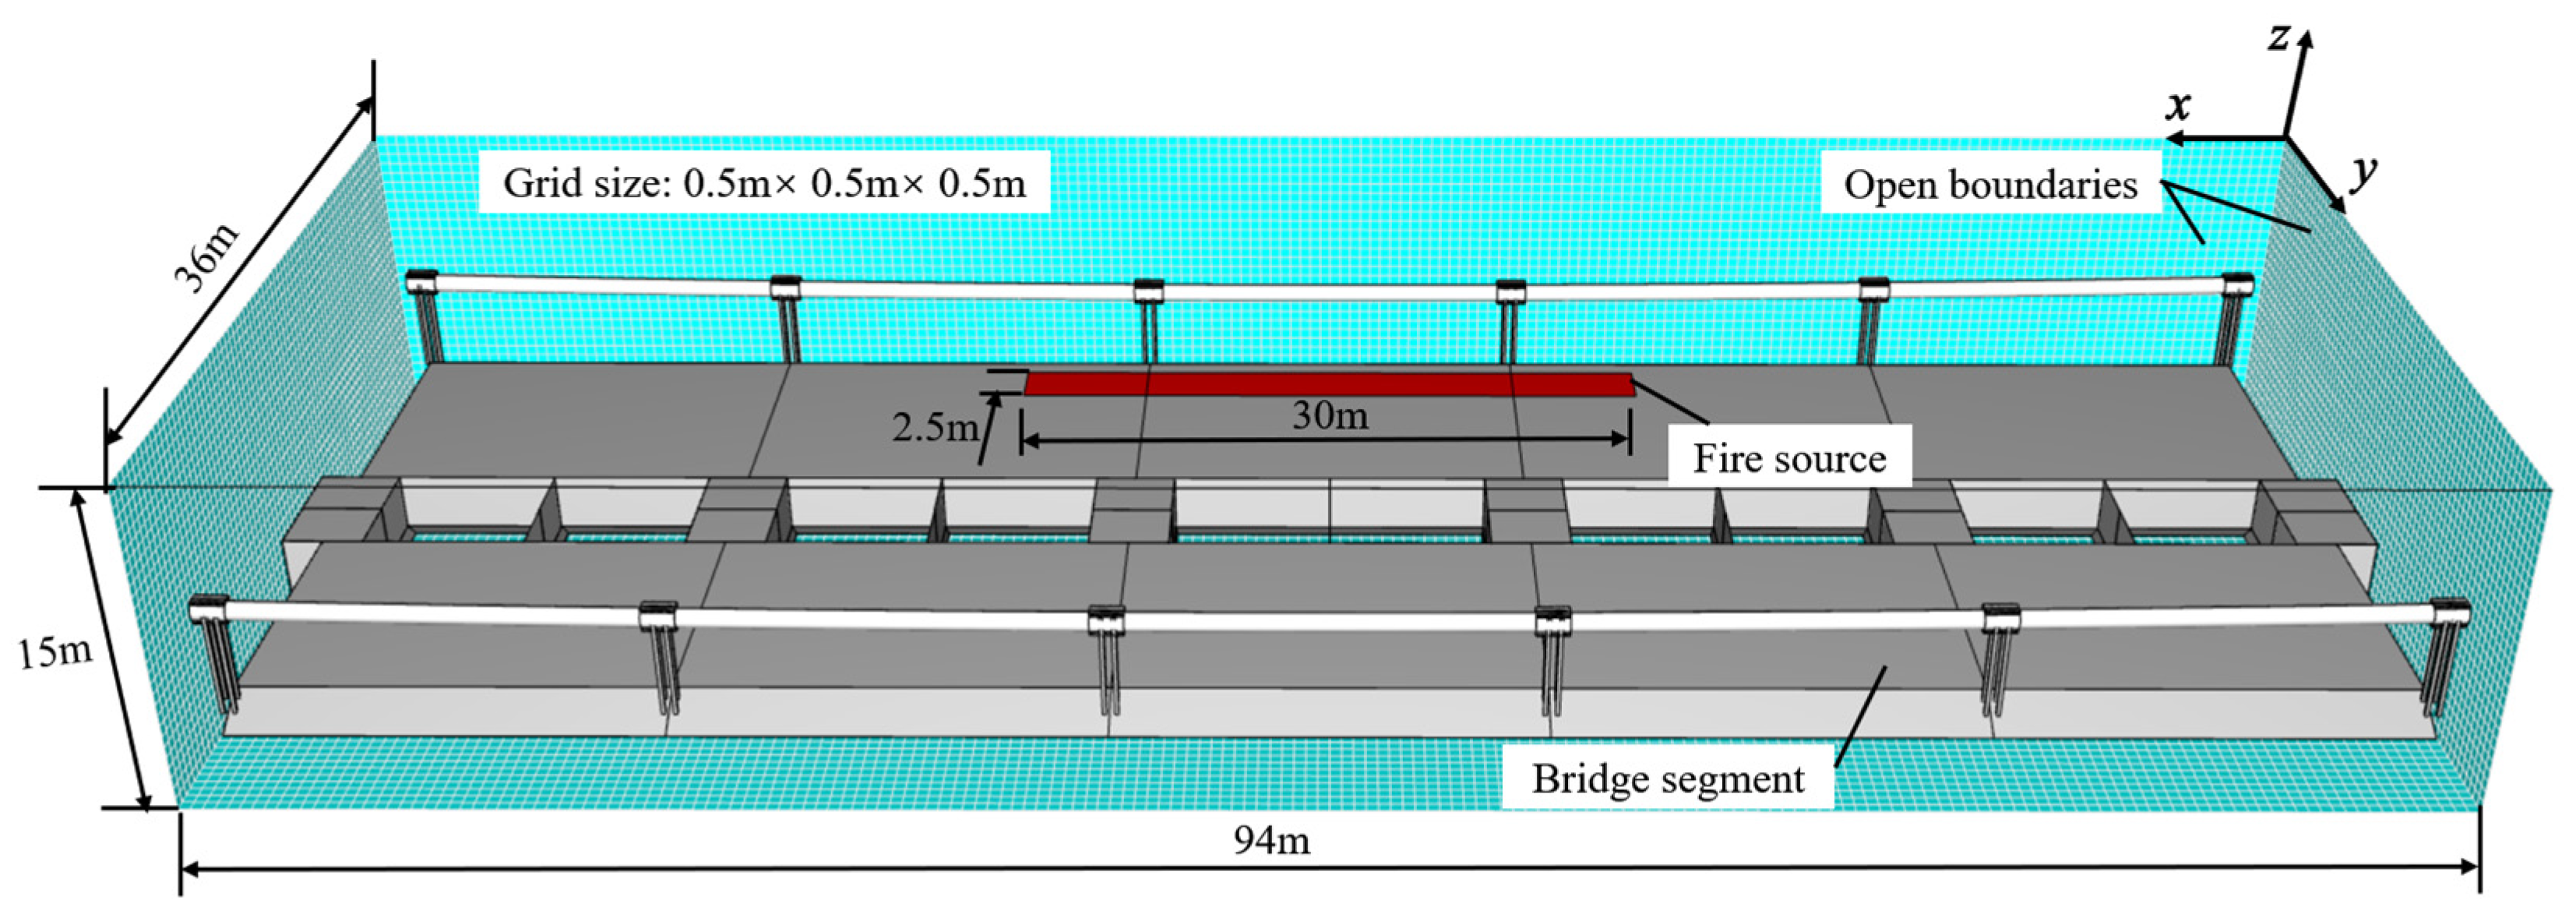
To ensure incident heat flux can be fully received by the structure in the computational domain, a local suspension bridge model comprising five consecutive standard segments is constructed, as shown in Figure 4. To minimize computational cost, the domain is optimized while ensuring sufficient resolution to accurately capture interaction among fires, structures, and the environment. The domain has dimensions of 94 m in the X-direction, 36 m in the Y-direction, and 15 m, 24 m, and 52 m (corresponding to cable elevations of 3.6 m, 12.7 m, and 41.9 m) in the Z-direction. All boundaries of the domain adopt “open” type boundary conditions; for wind cases, the “supply” type boundary condition is implemented on the +Y boundary.
Figure 4.
Fire model details (Unit: m).
Grid resolution in CFD simulations affects both computational accuracy and time cost. Higher resolution generally improves the accuracy of CFD simulations using the direct Navier–Stokes equations, but increases computational cost. According to NIST, the accuracy of fire simulations is strongly related to the ratio of the characteristic fire diameter D* to the grid size δx [21]. The specific formula is as follows:
In Equation (1), is the total heat release rate (kW), ρ∞ is the ambient density (kg/m3), cp is the specific heat of air at constant pressure (kJ⋅kg−1⋅K−1), and T∞ is the ambient temperature (K) [21]. The ratio D*/δx within the range of 4 to 16 is commonly adopted as a reference criterion for resolving fire plumes. According to the fire source investigated in this study, the calculated D*/δx value indicates that a grid size of 0.5 m provides an appropriate resolution in the computational domain. At a grid resolution of 0.5 m, the computational domain is discretized into 406,080 parallelepiped cells. Given the height in the Z-direction, the computational domain is divided into multiple grid regions. The regions far away from fire are discretized into larger grid sizes to reduce the number of grids while preventing a negative impact on computational accuracy.
Adiabatic surface temperature devices are placed at every surface grid on the main cable and hangers. Along the surface of the main girder, devices are spaced at 1 m. The adiabatic surface temperatures (ASTs) on the structural surface are recorded via devices and exported. The time history for each device is fitted separately to generate a heating curve. Then, these curves are imported into the appropriate surface elements of the local FE model as boundary conditions for the thermal analysis.
2.3.2. Combustion Parameters
The fuel carried by oil-tanker trucks is composed mainly of hydrocarbons. Therefore, the heptane (C7H16) combustion reaction is employed as a combustion model of oil-tanker truck fires. The heat release rate per unit area (HRRPUA) gradually increases following a t-squared growth model, reaching its maximum value (HRRPUAMAX) at 900 s, and then remains constant [14,22]. As the heat release rate generated per unit burning area of liquid fuel, the HRRPUAMAX of an oil pool fire is mainly governed by the fuel mass burning rate and the effective heat of combustion. For severe gasoline or heptane pool fires, the values of 2400–2500 kW/m2 have been commonly reported in large-scale pool fire experiments. Therefore, the HRRPUAMAX is taken as 2500 kW/m2 based on pool fire experiments and the published literature [14,22,23,24].
In the event of an oil-tanker collision and subsequent ignition, the incident frequently leads to secondary collisions and extensive fuel spillage [14,24]. In actual vehicle accidents, drivers instinctively steer their vehicles into the emergency lane to prevent causing further accidents for other vehicles. Due to the influence of cross slope and longitudinal slope, the leaked fuel will flow toward the roadway edge. Upon encountering the curb, it will form a rectangular oil pool. In July 2015, a tanker truck crash in Norway’s Skatestraum Tunnel released 16,500 L of gasoline. The fuel ignited and spread into a thin oil pool with a width of 0.5 m and a length of 450 m [24]. Accordingly, the fire incident caused by fuel leakage is idealized as a 2.5 m wide rectangular pool fire on the western emergency lane at mid-span. The leakage length ranges from 10 m to 70 m, corresponding to a peak total HRR range of 62.5 MW to 437.5 MW. This range covers small to extreme oil-tanker-truck fires reported in previous studies, thereby defining a physically meaningful fire scenario [25,26].
2.3.3. Validation of Fire Model
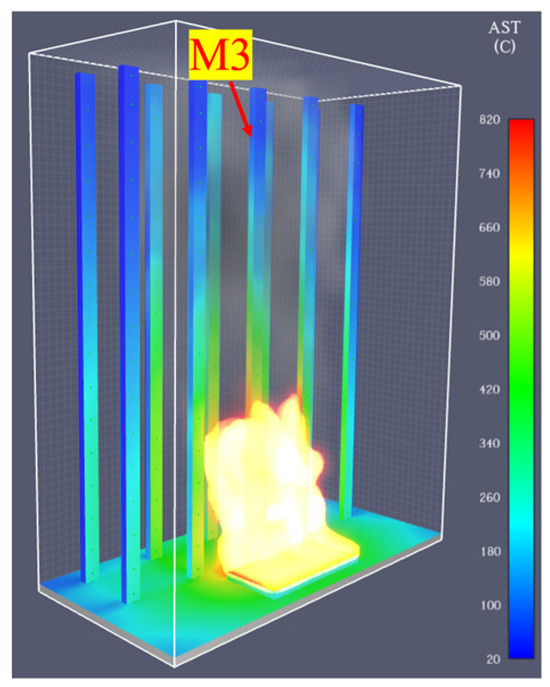
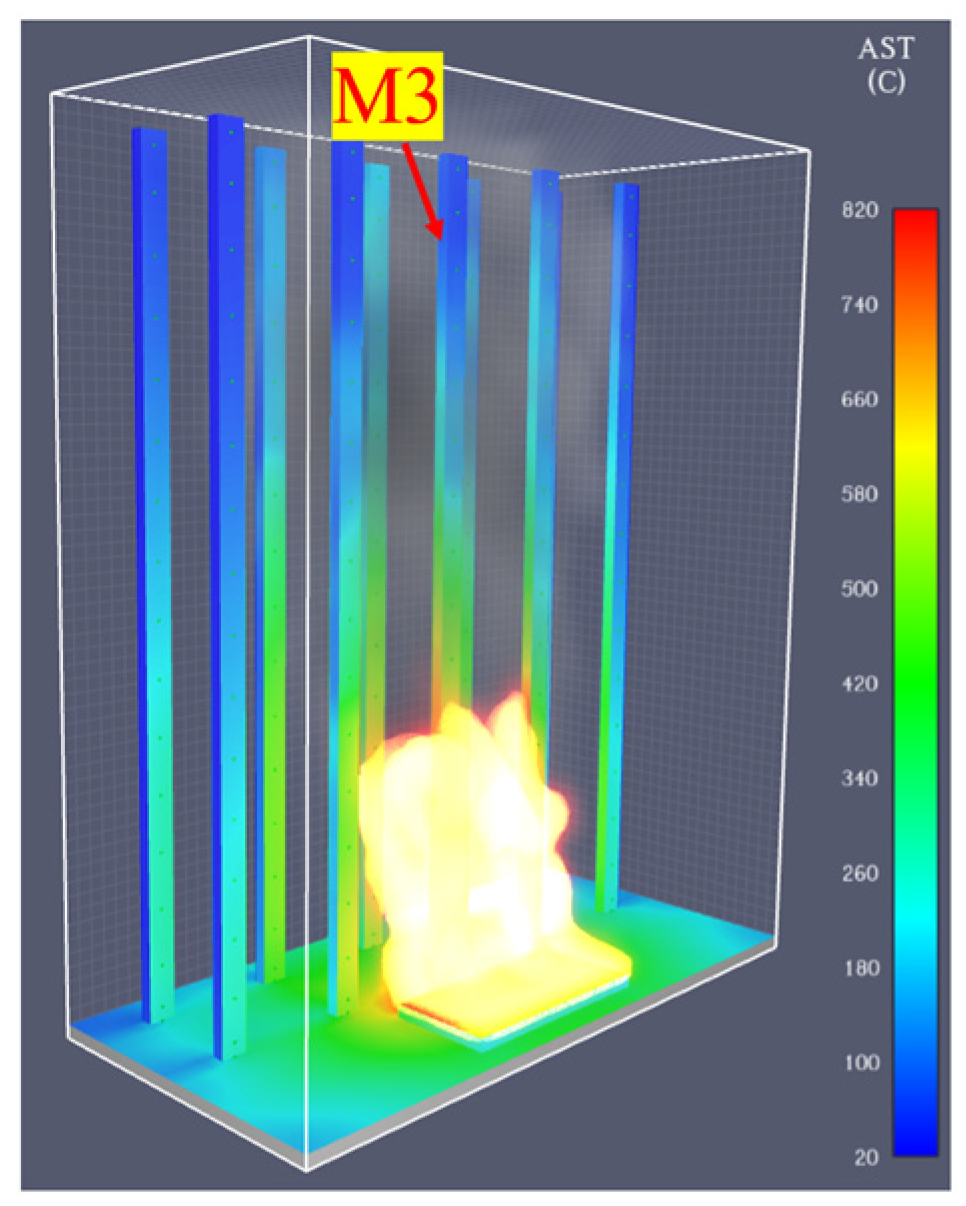
This CFD model was validated by the pool fire Test4 from the literature [27], as shown in Figure 5. The validation fire test was a 1:4 scaled fire test designed for the cable system of a suspension bridge based on similarity theory. The geometric scale, heat release rate and ambient wind speed were determined according to similarity criteria. Therefore, the scaled fire test retained the main physical mechanisms of full-scale bridge fires. Two thermocouple trees were arranged as substitutes for the hangers, each comprising 16 temperature measurement points. The oil-tanker-truck fire on the bridge deck was equivalently represented by a gasoline pool fire adjacent to the hangers. The HRR of the oil pool fire is calculated to be 3.125 MW, and the ambient wind speed is 1 m/s.
Figure 5.
Numerical CFD model for fire test.
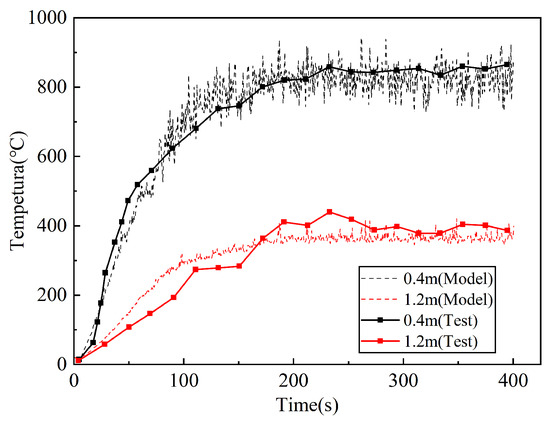
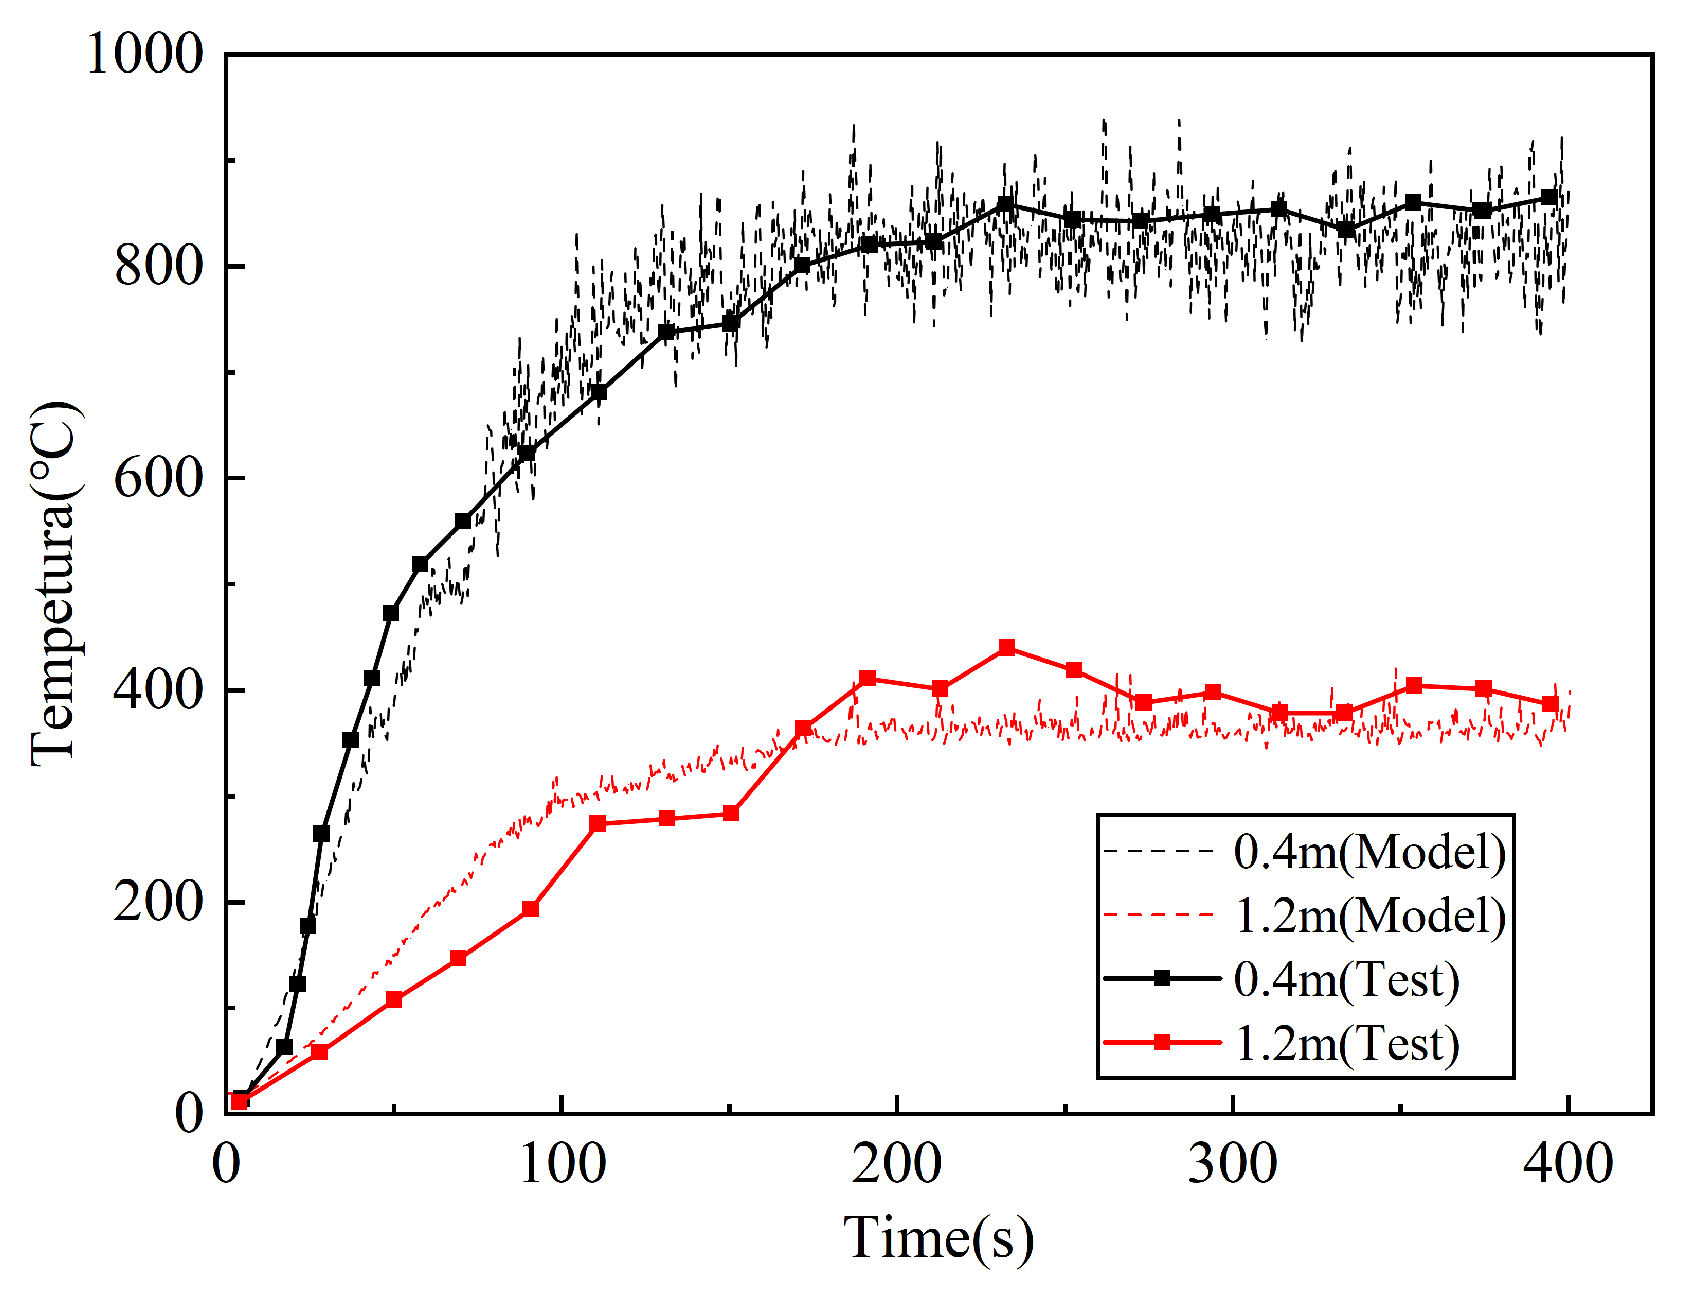
The temperatures measured at 0.4 m and 1.2 m of hanger M3 in the test were compared with the predicted data in the CFD model, as shown in Figure 6. Within the first 100 s of fire exposure, the measured temperature at 1.2 m is slightly higher than the predicted temperature, whereas at 0.4 m, the temperatures match closely. This discrepancy is mainly related to the flame morphology of the early development stage of the oil pool fire. The fire growth process in the CFD model is represented by an idealized t-squared HRR curve. In the pool fire test, the combustion rate, wall of oil pan, and cross wind could induce local flame posture and plume morphology before reaching HRRMAX. As a result, the local temperature in early fire may have slight deviations from the temperature predicted by the idealized CFD model. After the HRR reaches the peak and stabilizes, this discrepancy between the predicted and measured temperatures virtually disappears. Generally, the temperatures predicted in the CFD model agree well with experimental measurements. The simulated fire environment exhibits high reliability and fulfills the requirements for predicting the temperature in suspension bridge fire scenarios.
Figure 6.
Comparison of predicted and measured temperatures.
2.4. Multiscale Thermo-Mechanical FE Model
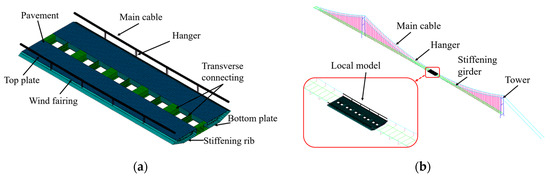
A three-dimensional multiscale numerical model is developed in ANSYS 2023R1 to evaluate the response of a suspension bridge under fire exposure conditions [1,7,8,9].
2.4.1. Discretization of Suspension Bridge
A sequentially coupled thermo-mechanical finite element analysis proceeds in two steps: thermal analysis and structural analysis. A refined local segment model is first established to perform the thermal analysis and then expanded to a full-bridge model. These two models are coupled through multi-point constraint equations, forming a multiscale model for structural analysis, as shown in Figure 7, aligned with these two steps.
Figure 7.
Multiscale FE model: (a) local segment model; (b) full-bridge model.
In the thermal analysis step, girders are discretized employing a 3-D SHELL131 element. The main cables, hangers, and concrete pavement are discretized using SOLID70 elements. Both element types have temperature degrees of freedom and support transient thermal analysis [1]. A coupled temperature degree-of-freedom (DOF) approach is employed at the connections between the main girder and hangers, as well as between hangers and the main cable, thereby enabling heat transfer across these interfaces.
In the structural analysis step, full-bridge models adopt twin-longitudinal-girder models, which are discretized utilizing three types of elements, namely BEAM188 for main girders and towers, LINK10 for the main cables and hangers, and MPC184 to enforce rigid links between the girders and hangers. In addition, the thermal elements in the local model are converted to structural SHELL181 and SOLID185 elements to capture phenomena of local large deformation and resulting stress fields [8].
Further, CONTA175 and TARGE170 contact pairs are employed to establish the mechanical interfaces between the full-bridge and local models, including the interfaces at girders and cables between these two models, as well as the hanger-to-girder interfaces within the local models, so that the multiscale model acts as an integrated system with compatible deformation and effective load transfer. To reduce computational cost, the hanger-to-main-cable connection is modeled by nodal coupling. In addition, the longitudinal dampers at both ends of the main girder are discretized as COMBIN14 elements to reproduce the prototype damping force [1,7,8,9].
2.4.2. Material Properties
Temperature-dependent thermal and mechanical properties for high-strength steel wire and structural steel are extracted from Eurocode 2 and 3 [28,29] and implemented in the finite element model. For main cables and hangers, the high-strength steel wires are modeled using the temperature-dependent material properties of prestressing steel specified in Eurocode 2 [28]. These properties include the specific heat, thermal conductivity, and thermal expansion, as well as the mechanical degradation of strength and elastic modulus at elevated temperatures. For girders, the temperature-dependent material properties of carbon steel are adopted from Eurocode 3 [29]. The specific heat of steel exhibits a pronounced peak between 700 and 800 °C, which is attributed to the combined latent-heat effects of the Curie transition and polymorphic transformation. Stress–strain relationships of the prestressing steel and carbon steel are established based on the material models specified in Eurocode 2 and 3 [28,29]. Through these temperature-dependent nonlinear stress–strain relationships, material nonlinearity is considered in the numerical model, enabling structural analysis to reflect the degradation of stiffness and strength at elevated temperatures.
2.4.3. Boundary Conditions
During the thermal analysis step, model surfaces are partitioned to conform to the device spacing, and the corresponding ASTs are prescribed as thermal boundary conditions. Heat transfer inside main girders is mainly through conduction, convection and cavity radiation. Radiative exchange within the box-girder cavities is realized using the cavity radiation matrix in ANSYS 2023R1. The main cable and hangers are modeled as solid circular cylinders, and radiation across inter-wire gaps is neglected. Following Eurocode 1 [30], the convective heat-transfer coefficient is recommended as 50 W/(m2·K). An effective emissivity of 0.7 is adopted for fire-exposed surfaces. And a Stefan-Boltzmann radiation constant of 5.67 × 10⁻⁸ W/(m2·K4) is applied to simulate radiative heat transfer.
In the structural analysis, the tower bases and main-cable anchorages are modeled with fixed boundary conditions. Except for the longitudinal dampers connected, both ends of the main girder are constrained in vertical and lateral displacements. Additional lateral restraint is enforced for the main girder at the tower locations.
2.4.4. Structural Loadings
Using a sequentially coupled thermo-mechanical analysis, the multiscale model is subjected to the combined effect of fire-induced temperature loads, dead load, and live load. The temperature field computed in the thermal analysis is applied to the structural model as nodal body loads. The dead load, namely the self-weight of the structure, is computed automatically in ANSYS 2023R1 as per geometry and density. The live load is determined using the lane-load scheme. According to the Highway Capacity Manual [31], a four-lane freeway retains only 58% of its capacity when one lane is blocked by a fire in the emergency lane. Thereafter, the fire response of the suspension bridge is evaluated with dead load plus 50% live load, neglecting the asymmetry between the two carriageways. Following the Chinese specification [32], a 552.42 kN concentrated load is enforced to the local segments, and a 16.11 kN/m uniform load is applied across the entire span.
2.4.5. Validation of FE Model
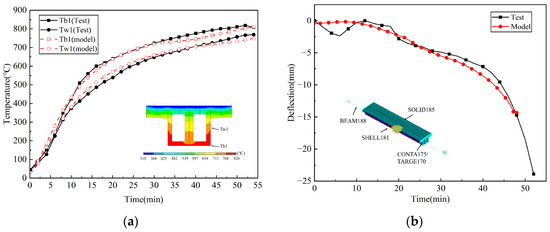
The FE model described above was validated using a continuous steel box girder tested under hydrocarbon fire exposure conditions [7]. The tested girder, BG2, was a 5 m long closed steel box girder, and a 2 m long region near the intermediate support was exposed to fire. In the number model, a 2.7 m long refined region was established around the fire-exposed support zone. SHELL131 and SOLID70 elements were used in thermal analysis to capture the non-uniform temperature field in the steel box girder. In the structural analysis, the unexposed regions on both sides were modeled by BEAM188 elements, and the refined local model was connected to beam-element regions through node-to-surface contact using CONTA175 and TARGE170 elements. This modeling configuration was used to evaluate the feasibility of the multiscale modeling strategy adopted in the suspension bridge model.
Figure 8 compares the predicted temperature and deflection for a continuous box girder with fire test measurements. It can be seen that the predicted temperatures and deflection align closely with the measured trends in the fire test. Slight deviations can be attributed to variations in actual fire test conditions and adopted temperature-dependent thermal parameters. The comparison indicates that the multiscale FE model can reasonably reproduce both the local thermal response and the global deformation trend of a continuous steel girder subjected to localized fire exposure.
Figure 8.
Comparison of predicted and measured data in girder: (a) temperature; (b) deflection.
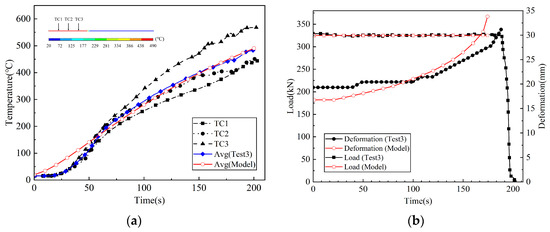
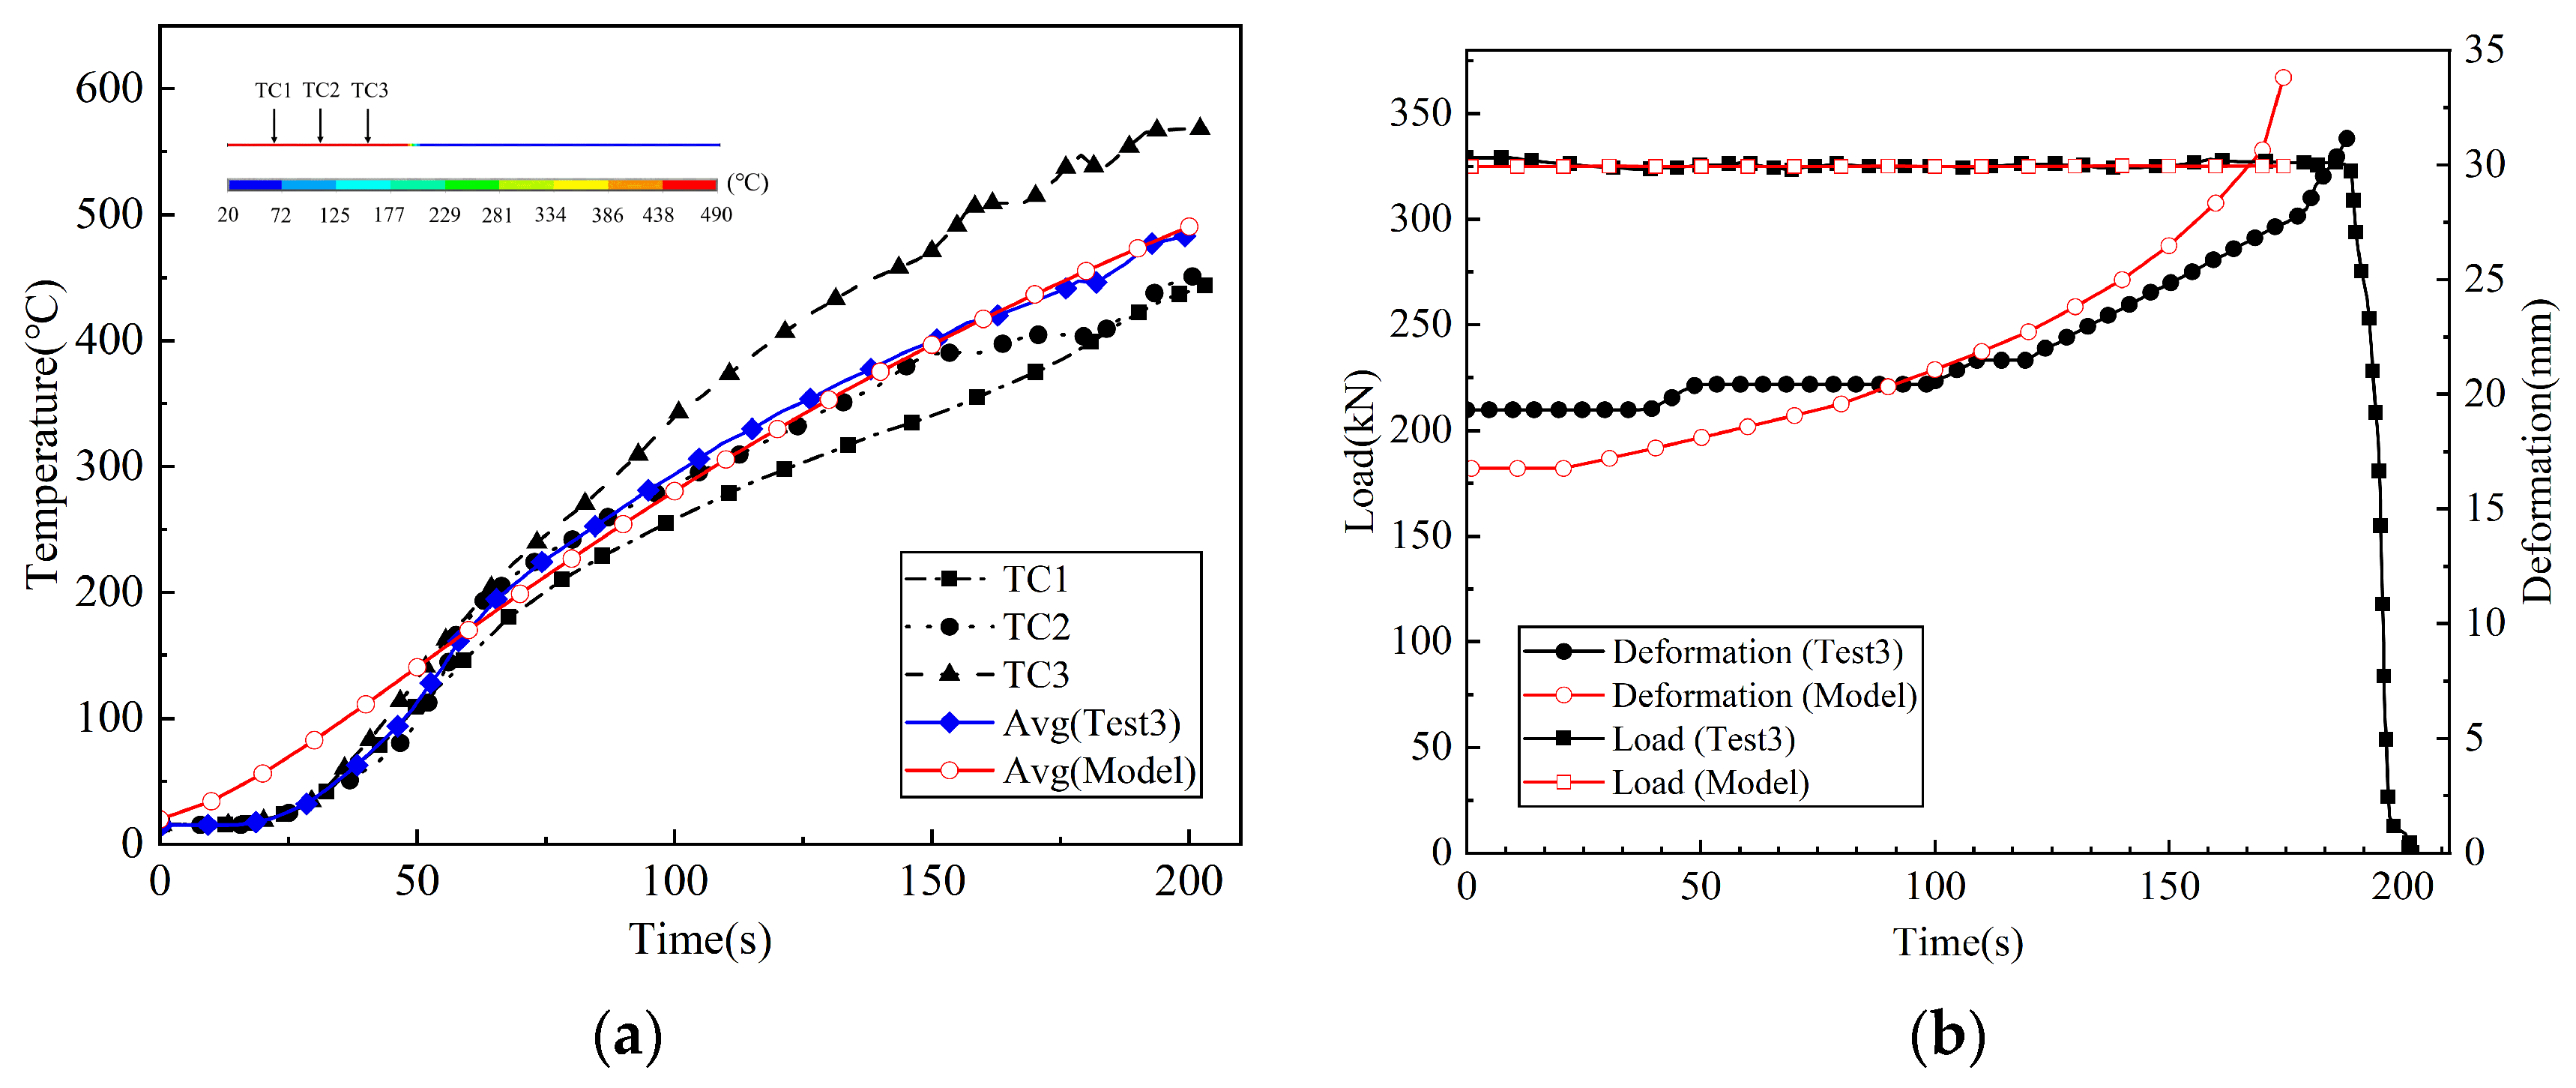
In the suspension bridge model, the main cables and hangers are simplified as uniform cylindrical components. To verify the applicability of this simplification, a cable fire test reported in the literature [4] was used for validation. The test cable consists of a parallel bundling of 19 high-strength galvanized steel wire strands, each measuring 4 m in length and 5.1 mm in diameter, with a tensile strength of 1860 MPa [4]. As shown in Test3, a 1.5 m long segment of test cable was locally exposed to fire inside a furnace [4]. In the numerical model, the cable was represented by an equivalent solid cylinder.
Figure 9 shows a comparison of predicted cable temperatures with temperature data measured in a fire test. It can be seen that the predicted cable temperature agrees well with the measured average temperature. Local differences between the predicted and measured temperatures are mainly attributed to the non-uniform temperature distribution in the furnace and the uncertainty of temperature-dependent thermal properties. The cable tension in the numerical model was consistent with that applied in the test, and the predicted elongation also follows the general trend of the measured results. The slight discrepancy in cable deformation is mainly attributed to the more uniform heating condition in the exposed region of the numerical model. Therefore, the equivalent solid-cylinder modeling method adopted for the main cables and hangers can reasonably represent the overall thermo-mechanical behavior of cable members in the full-bridge fire analysis.
Figure 9.
Comparison of predicted and measured data in cable: (a) temperature; (b) deflection.
3. Results and Discussion
3.1. Thermal Response
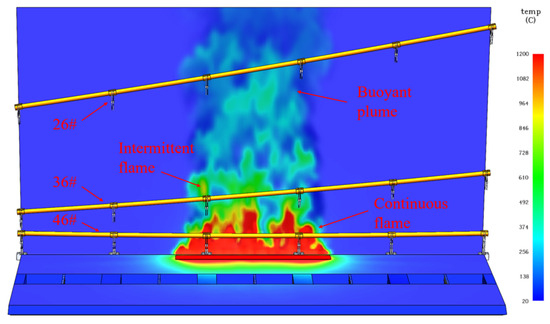
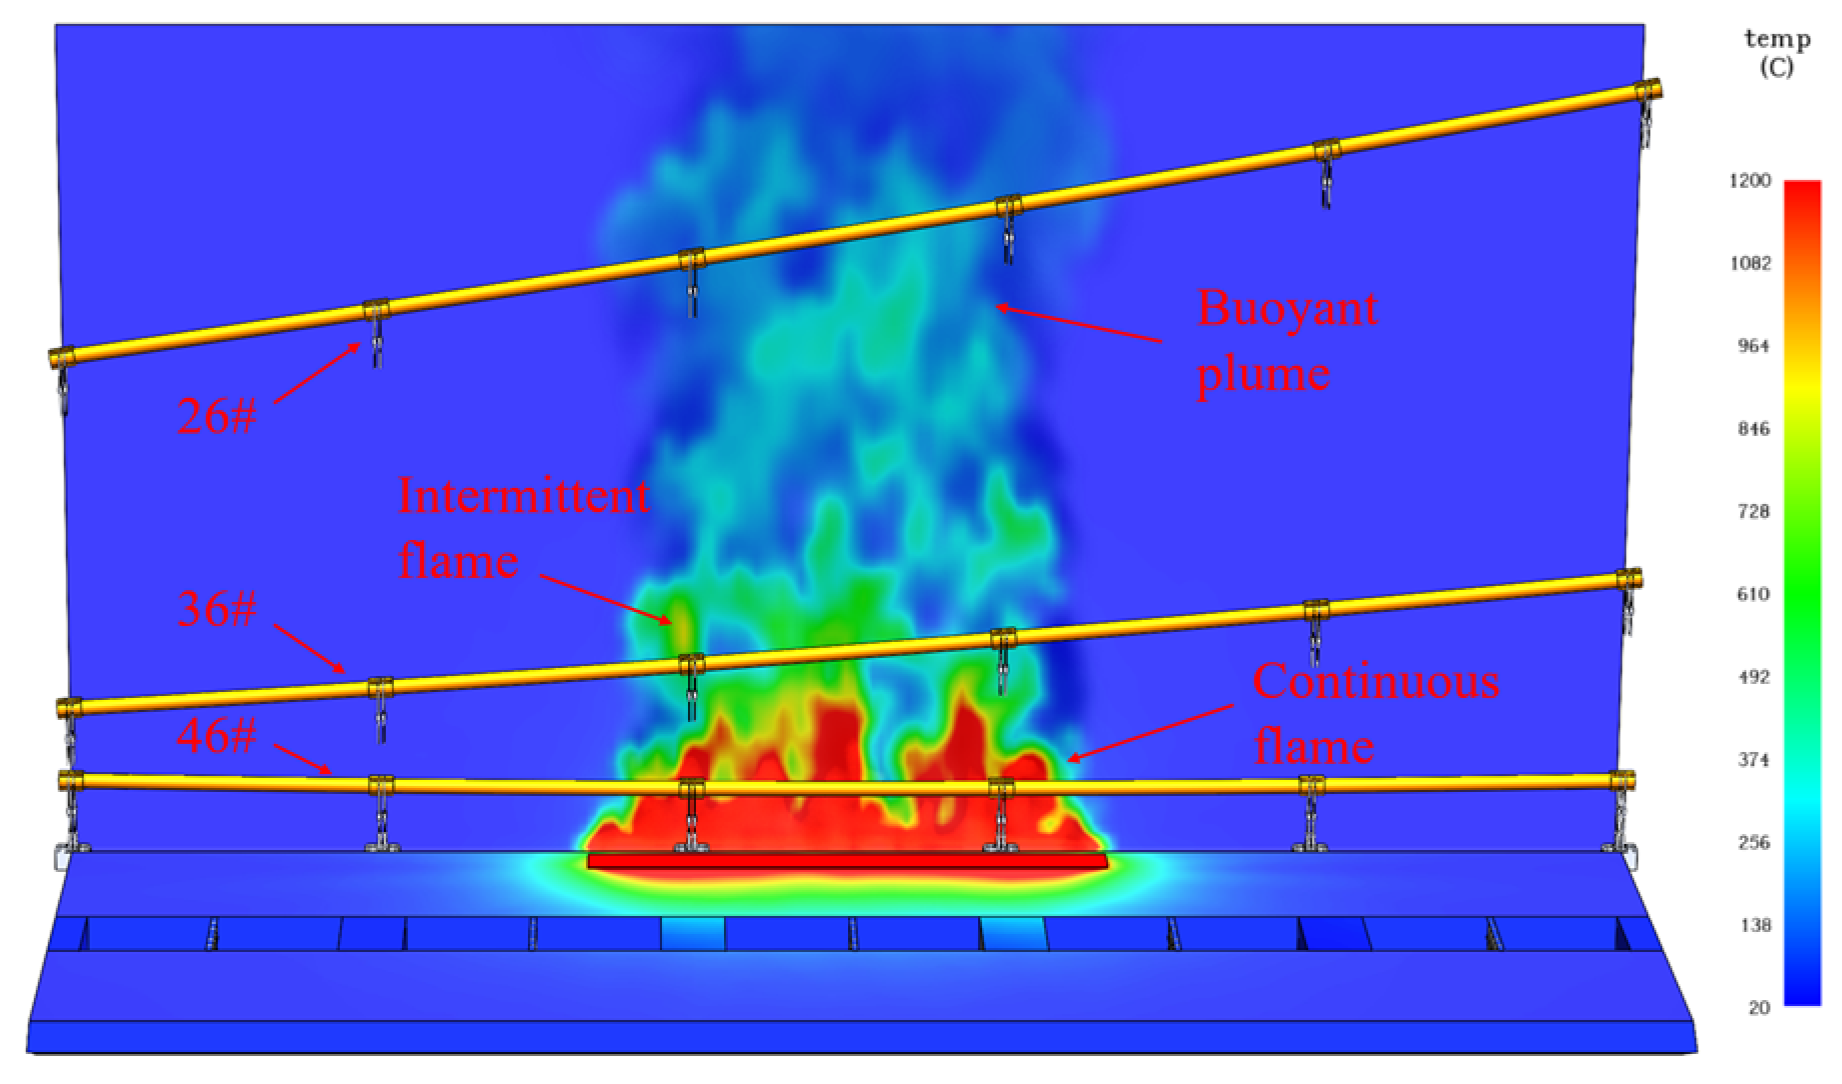
In realistic fire scenarios, temperature distribution across the suspension bridge is driven by the fire field and exhibits three-dimensional spatial variation, as is shown in Figure 10. The fire plume clearly divides into three regions: continuous flame, intermittent flame, and buoyant plume. When the fire is located at segment #46, the main cable at 3.6 m elevation is exposed to sustained direct flame impingement. And the main cable at 12.7 m experiences intermittent flame contact under the fire at segment #36. In contrast, when the fire is located at segment #26, the cable at 41.9 m is heated primarily by high-temperature gases and the rising smoke plume rather than by direct flames.
Figure 10.
Temperature distribution of fire field.
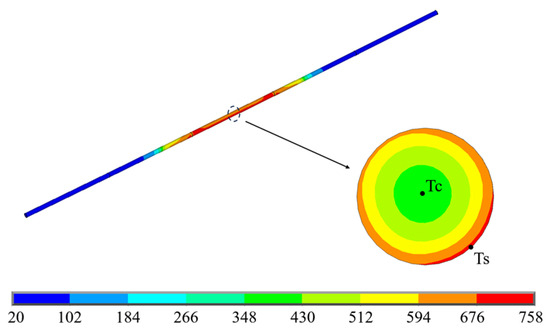
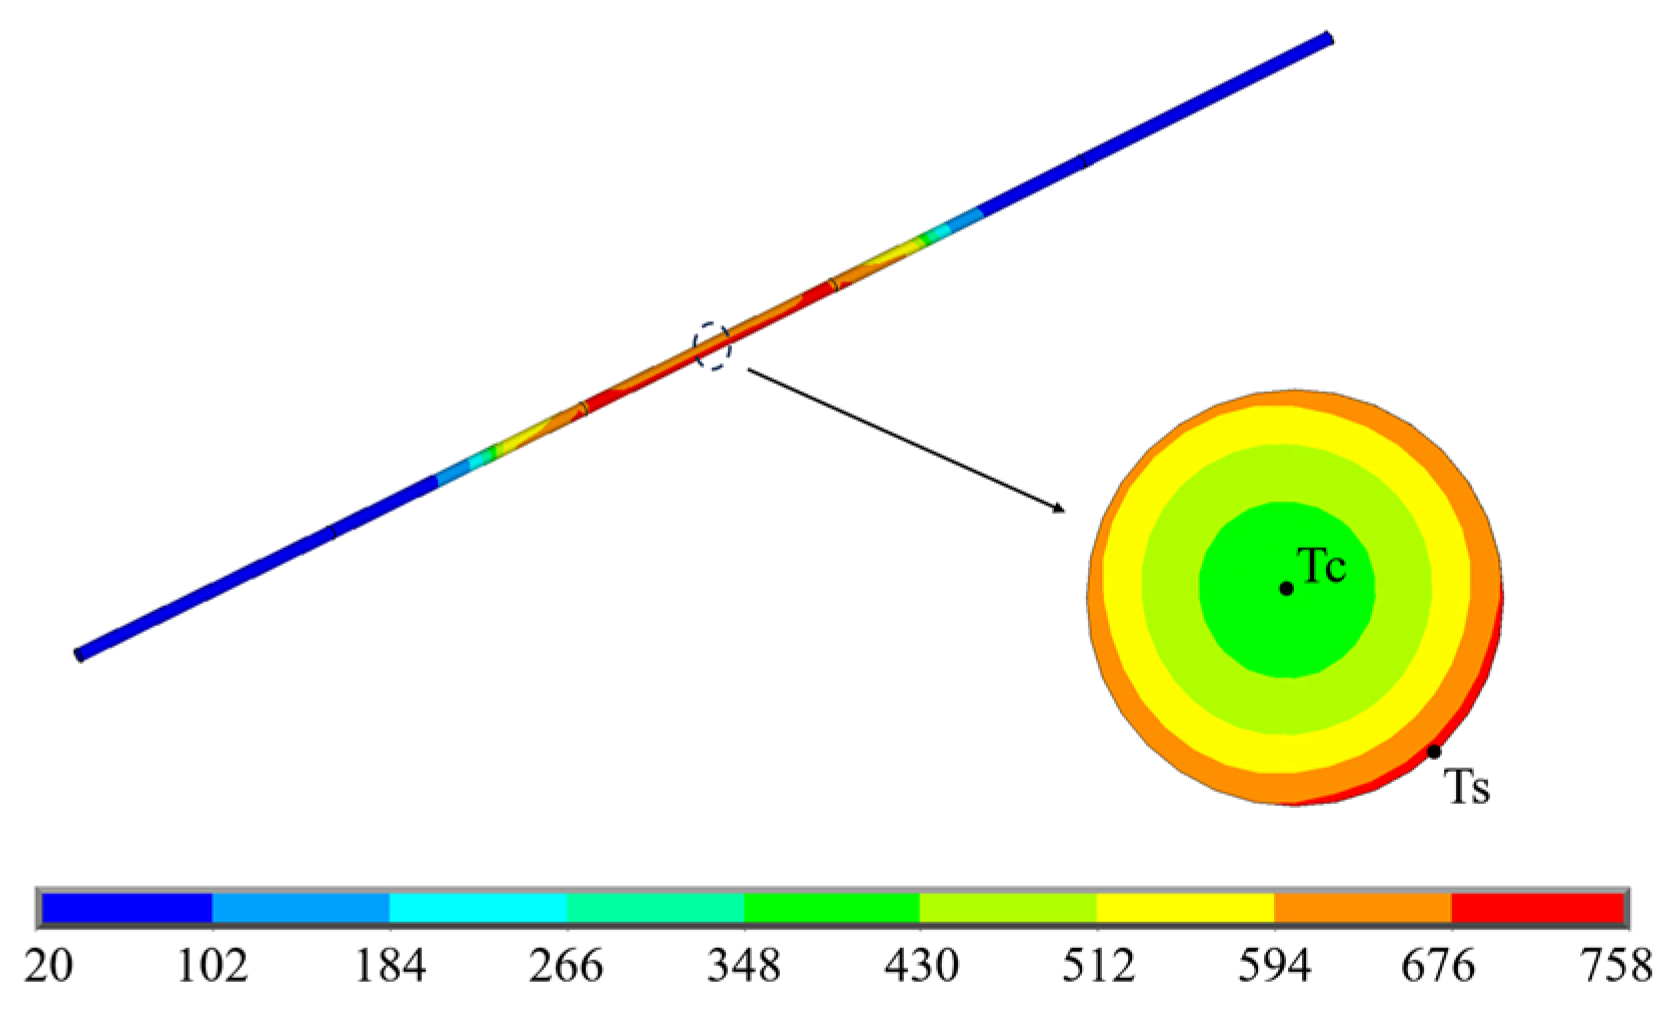
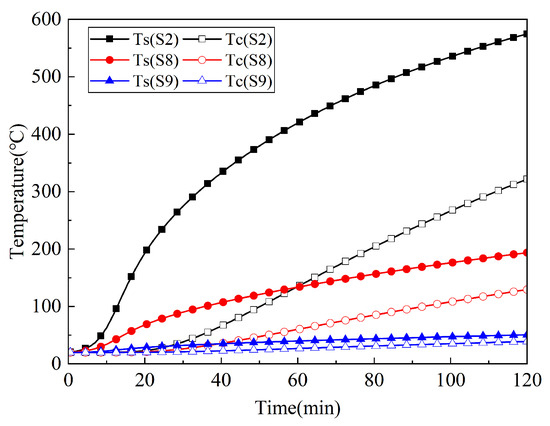
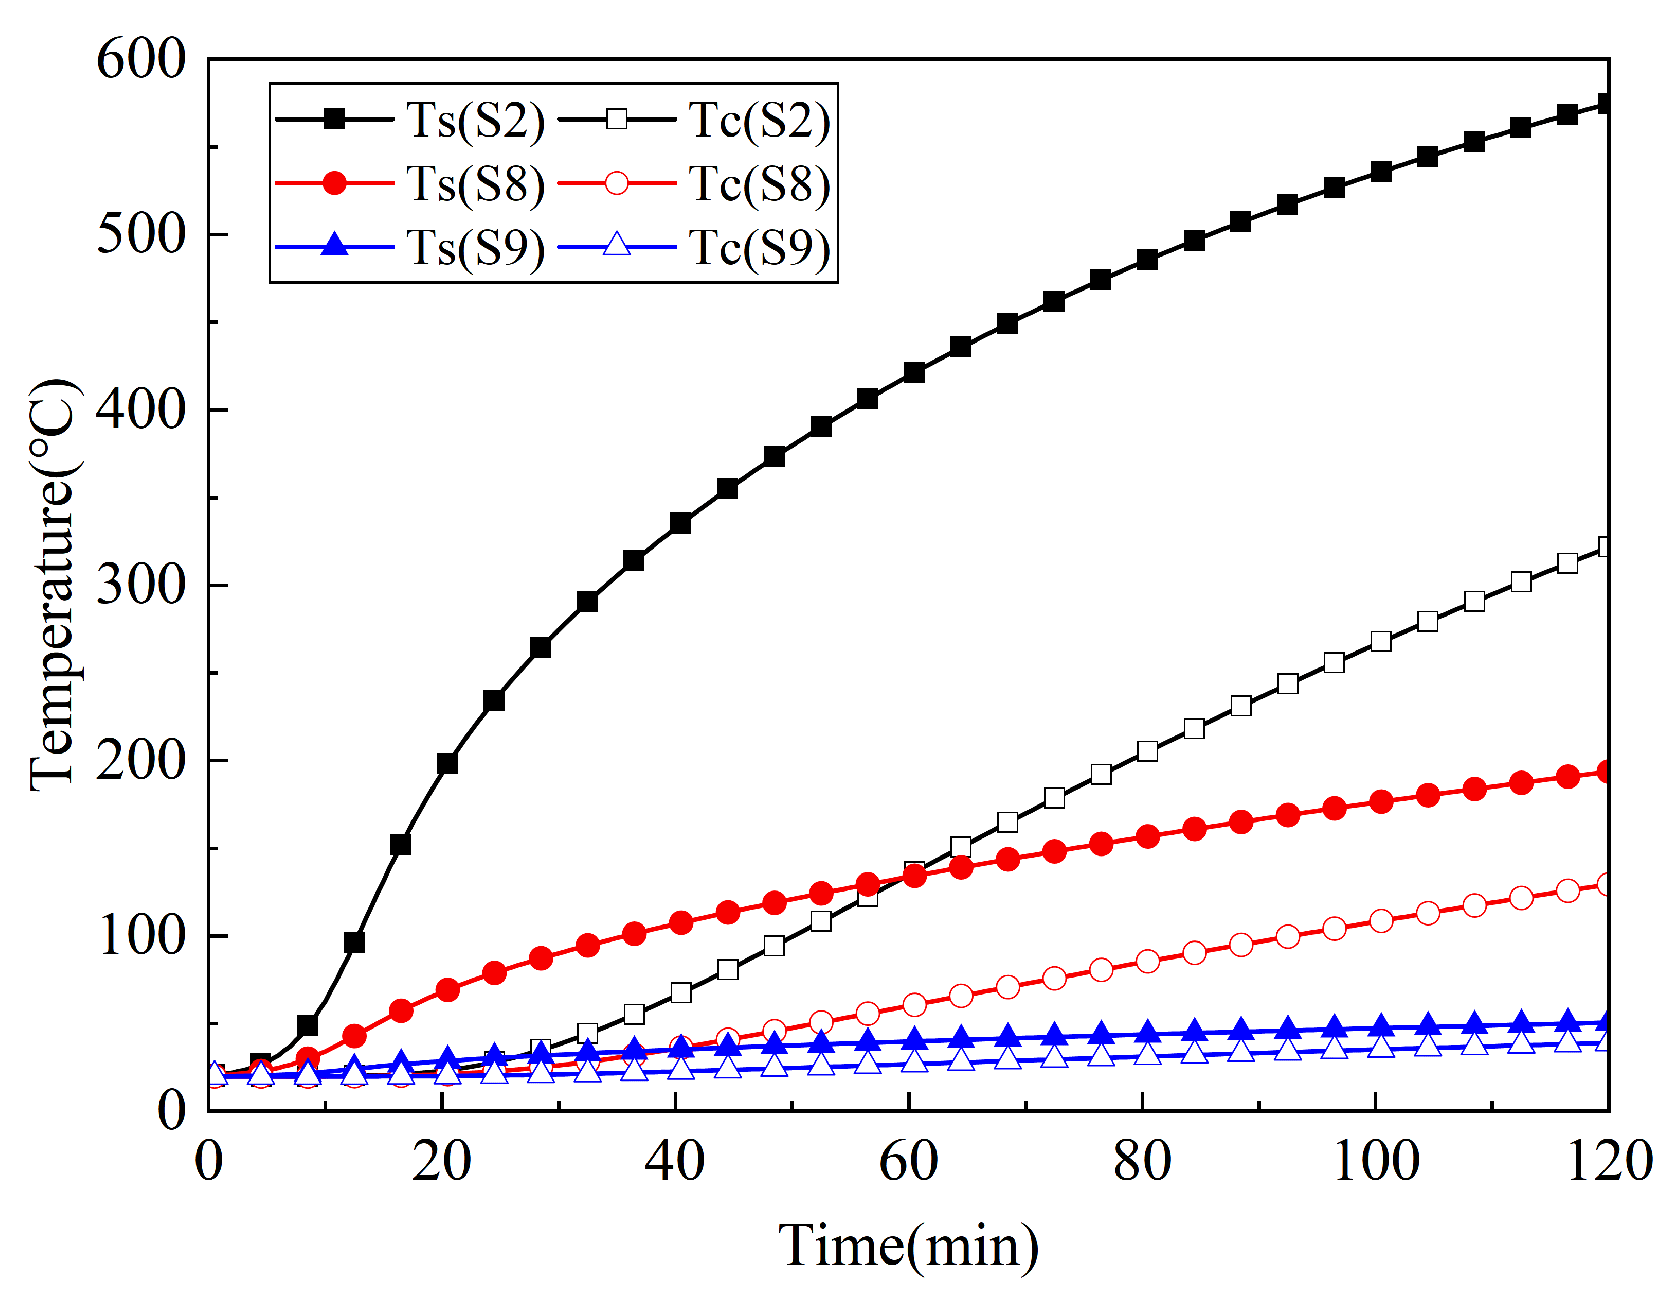
Figure 11 presents longitudinal and radial temperature contours for the main cable at a wind speed of 3 m/s. Temperature measurement points are placed at the mid-depth cross-section to monitor the temperature in the cable centroid (Tc) and the external surface (Ts). Figure 12 plots the temperature progression at measuring points for different segments. The surface temperature on the main cable exhibits a three-stage evolution under fire exposure: a slow initial rise, followed by a sharp increase, and then a decelerating growth toward a plateau. In scenario S2, Ts rises rapidly to 573 °C after 120 min of fire exposure, while Tc increases more gradually and reaches only 320 °C. This is due to the large cable diameter of 855 mm and slow heat conduction. Therefore, a significant temperature gradient is formed in the main cable. The temperature declines as cable elevation increases, while the surface heating trend remains essentially consistent across elevations.
Figure 11.
Temperatures of main cables (Unit: °C).
Figure 12.
Temperatures of main cables in different segments.
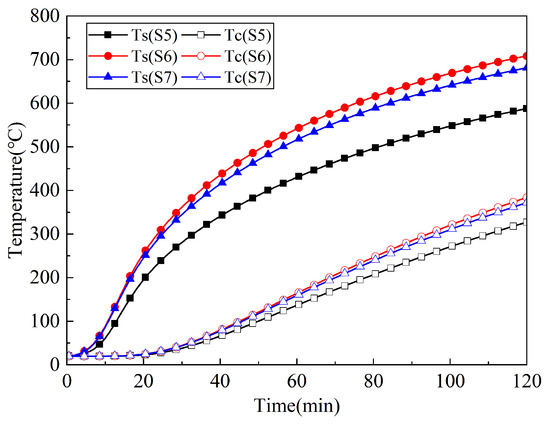
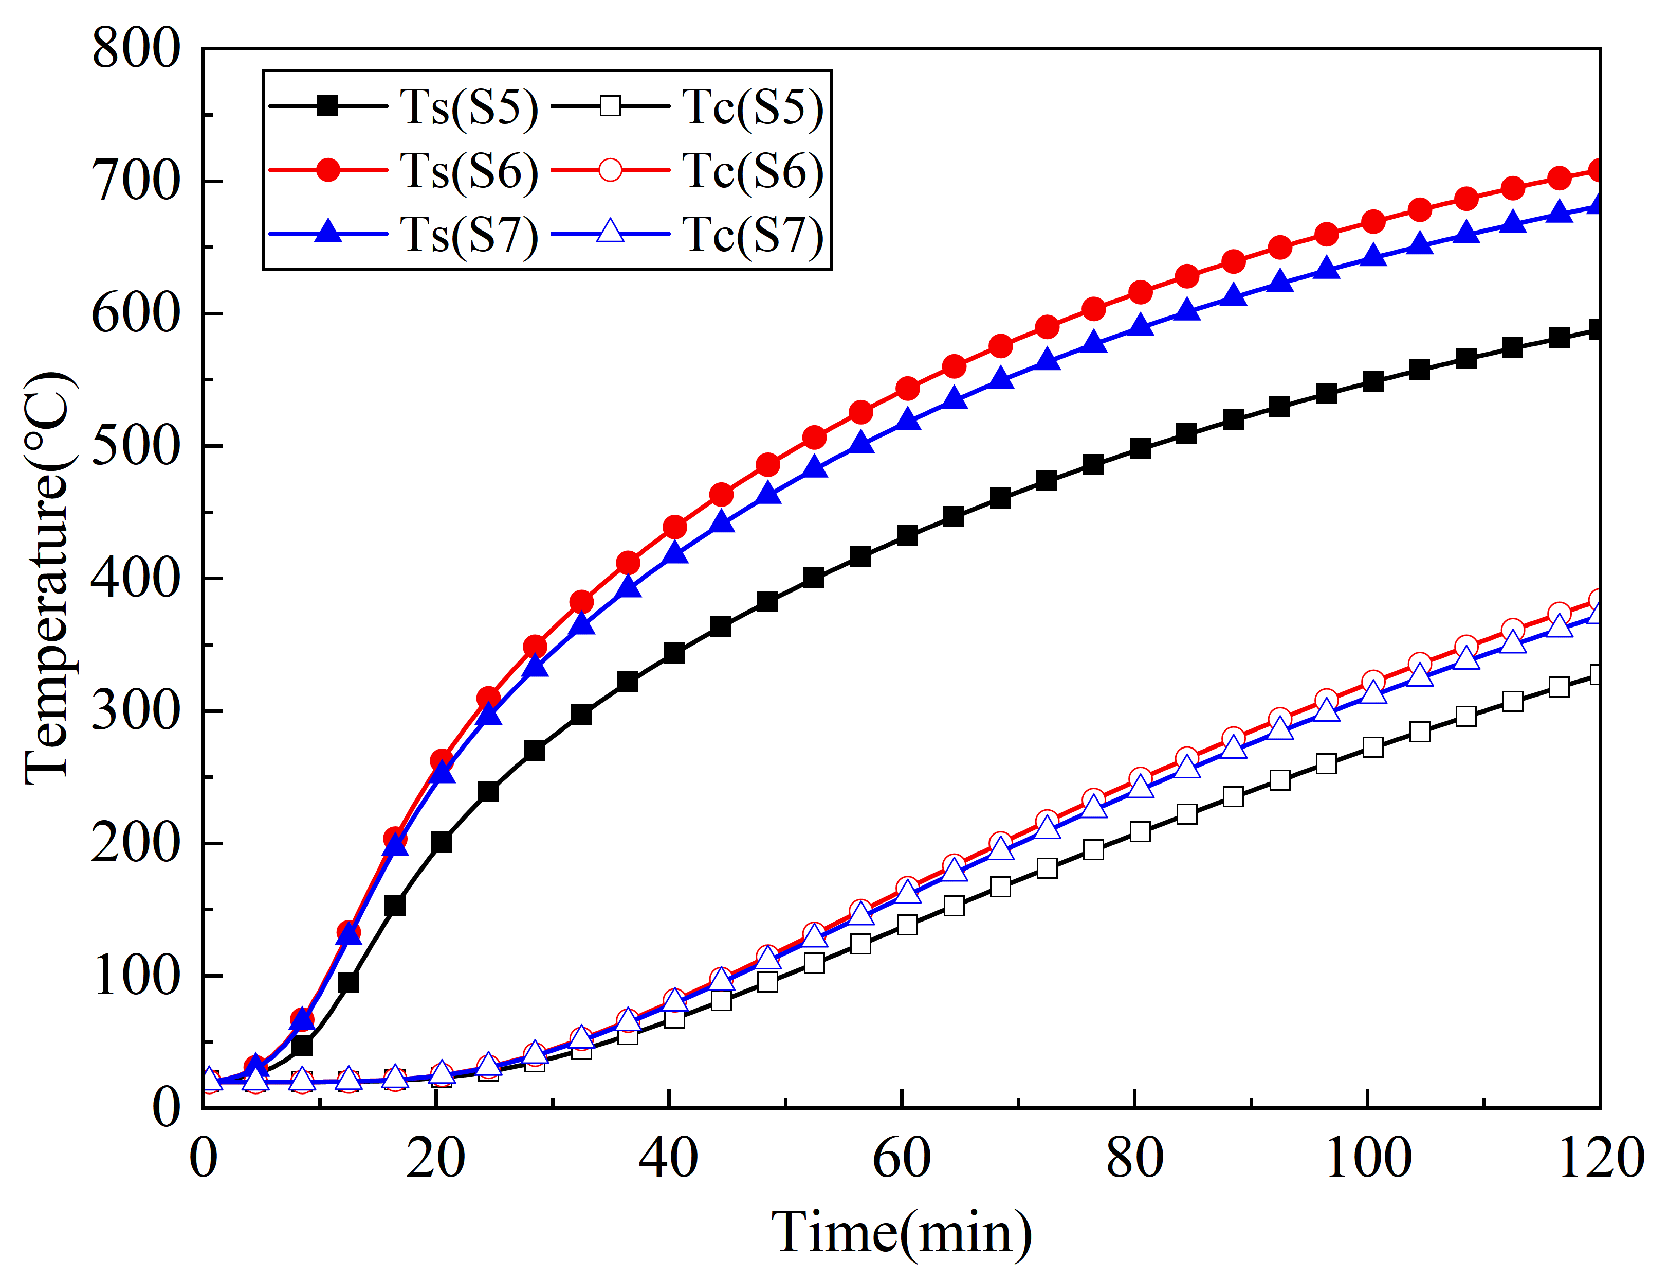
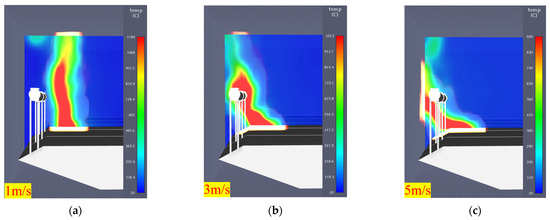
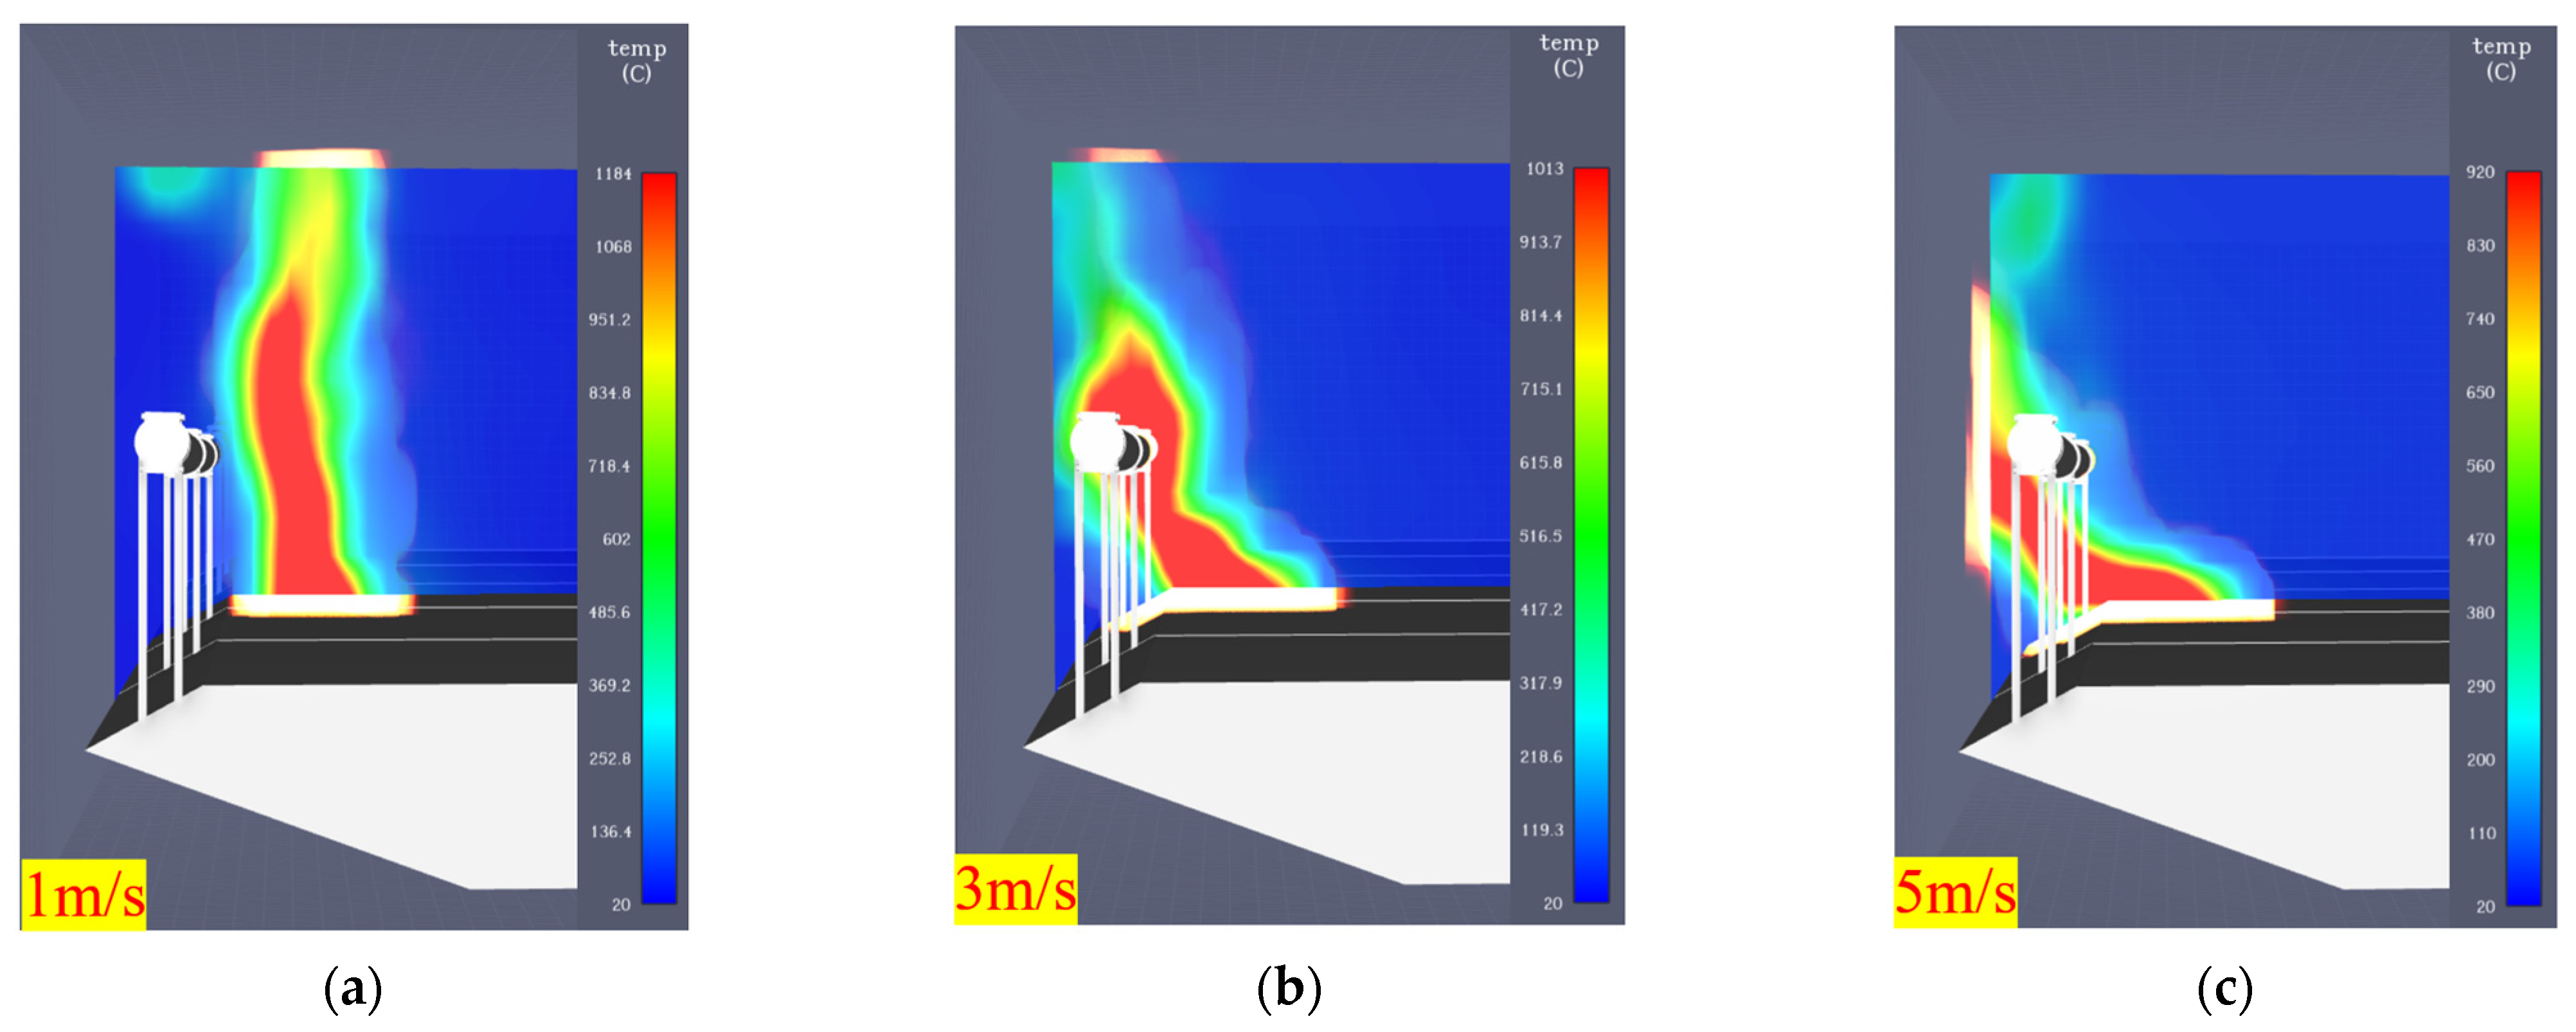
Figure 13 plots the temperature progression at measuring points for each wind case. Vertical slices of fire models with different transverse wind speeds are shown in Figure 14. Crosswind causes the flame to tilt, and the changes in the fire affect the temperature field of the suspension bridge. Under a 3 m/s crosswind, Ts(S6) rises above 700 °C. This is due to the fact that the flame angle is so large that the main cable is engulfed by the tilted flame and subjected to direct impingement. When subjected to a 5 m/s crosswind, the flame exhibits a large inclination angle and passes underneath the main cable.
Figure 13.
Temperatures of main cables at different wind speeds.
Figure 14.
Vertical slices of fire model with different transverse wind speeds: (a) S5; (b) S6; (c) S7.
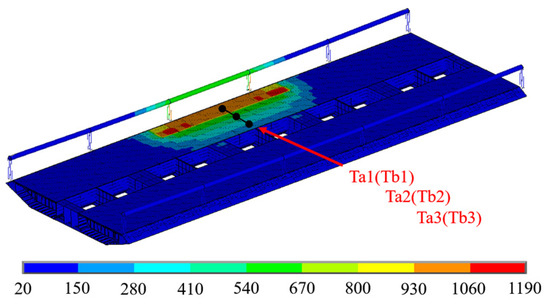
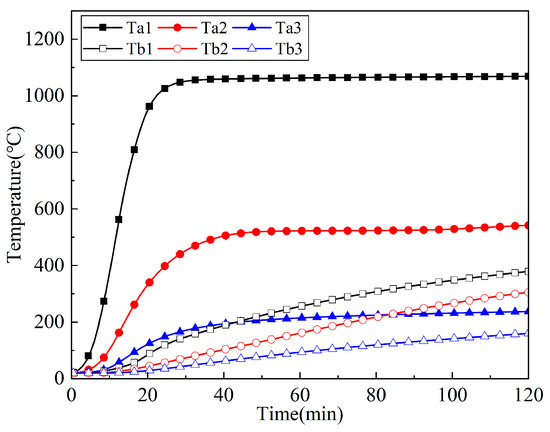
Figure 15 shows the temperature field of the suspension bridge segment in scenario S2. Although the fire occurs in the emergency lane, significant heating is observed in the other two lanes. To track heating evolution, temperature histories were recorded at the center of three lanes: Ta for the concrete pavement layer and Tb for the top plate. The temperature progression at the selected points is plotted as a function of fire exposure time, as depicted in Figure 16. The top plate peaks at 378 °C, while the pavement reaches 1064 °C on the emergency lane. This can be attributed to the high specific heat capacity of the pavement layer. Therefore, the temperature rapidly drops transversely, with the pavement on the adjacent lane only reaching 525 °C.
Figure 15.
Temperature distribution of bridge structure (Unit: °C).
Figure 16.
Temperature progression of pavement and deck.
3.2. Structural Response
Based on the predicted results generated from the structural analysis model, the failure evolution of the suspension bridge under fire exposure is analyzed in this section. The influence of different parameters on the fire response of the suspension bridge is explored, namely deflection progression, lateral deformation, hanger force and stress, and main-cable axial-force and stress evolution.
3.2.1. Failure Evolution
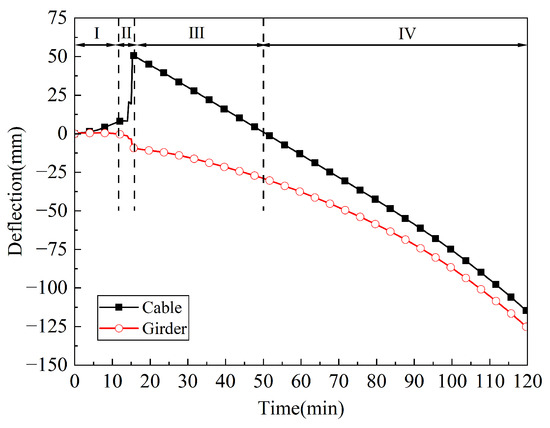
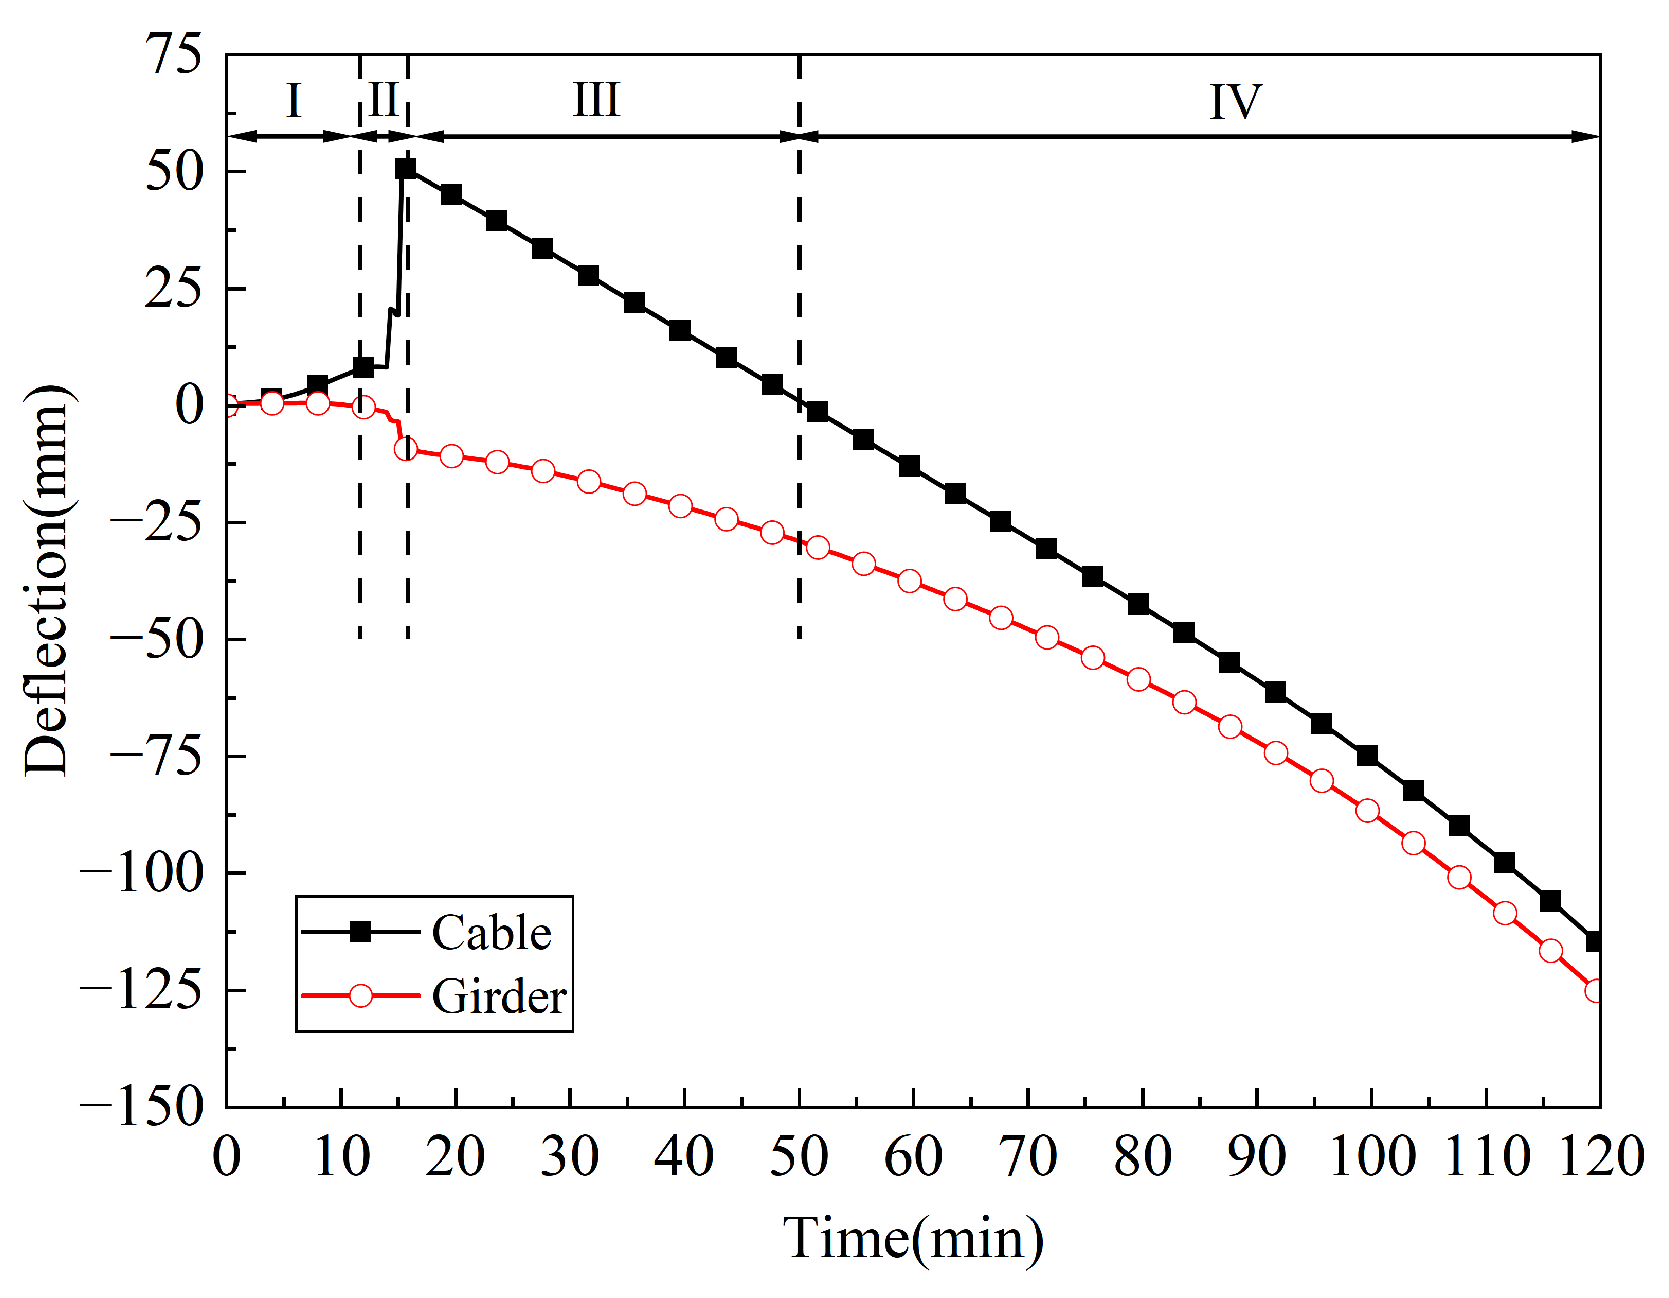
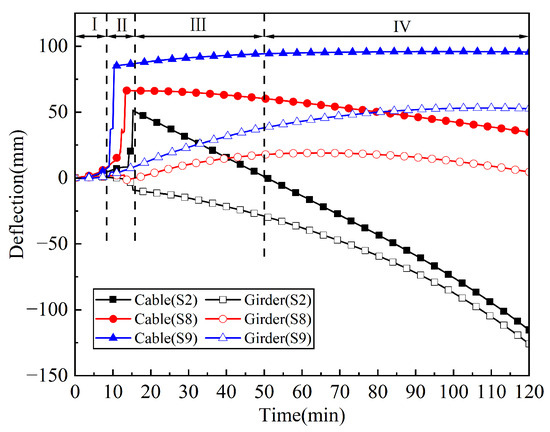
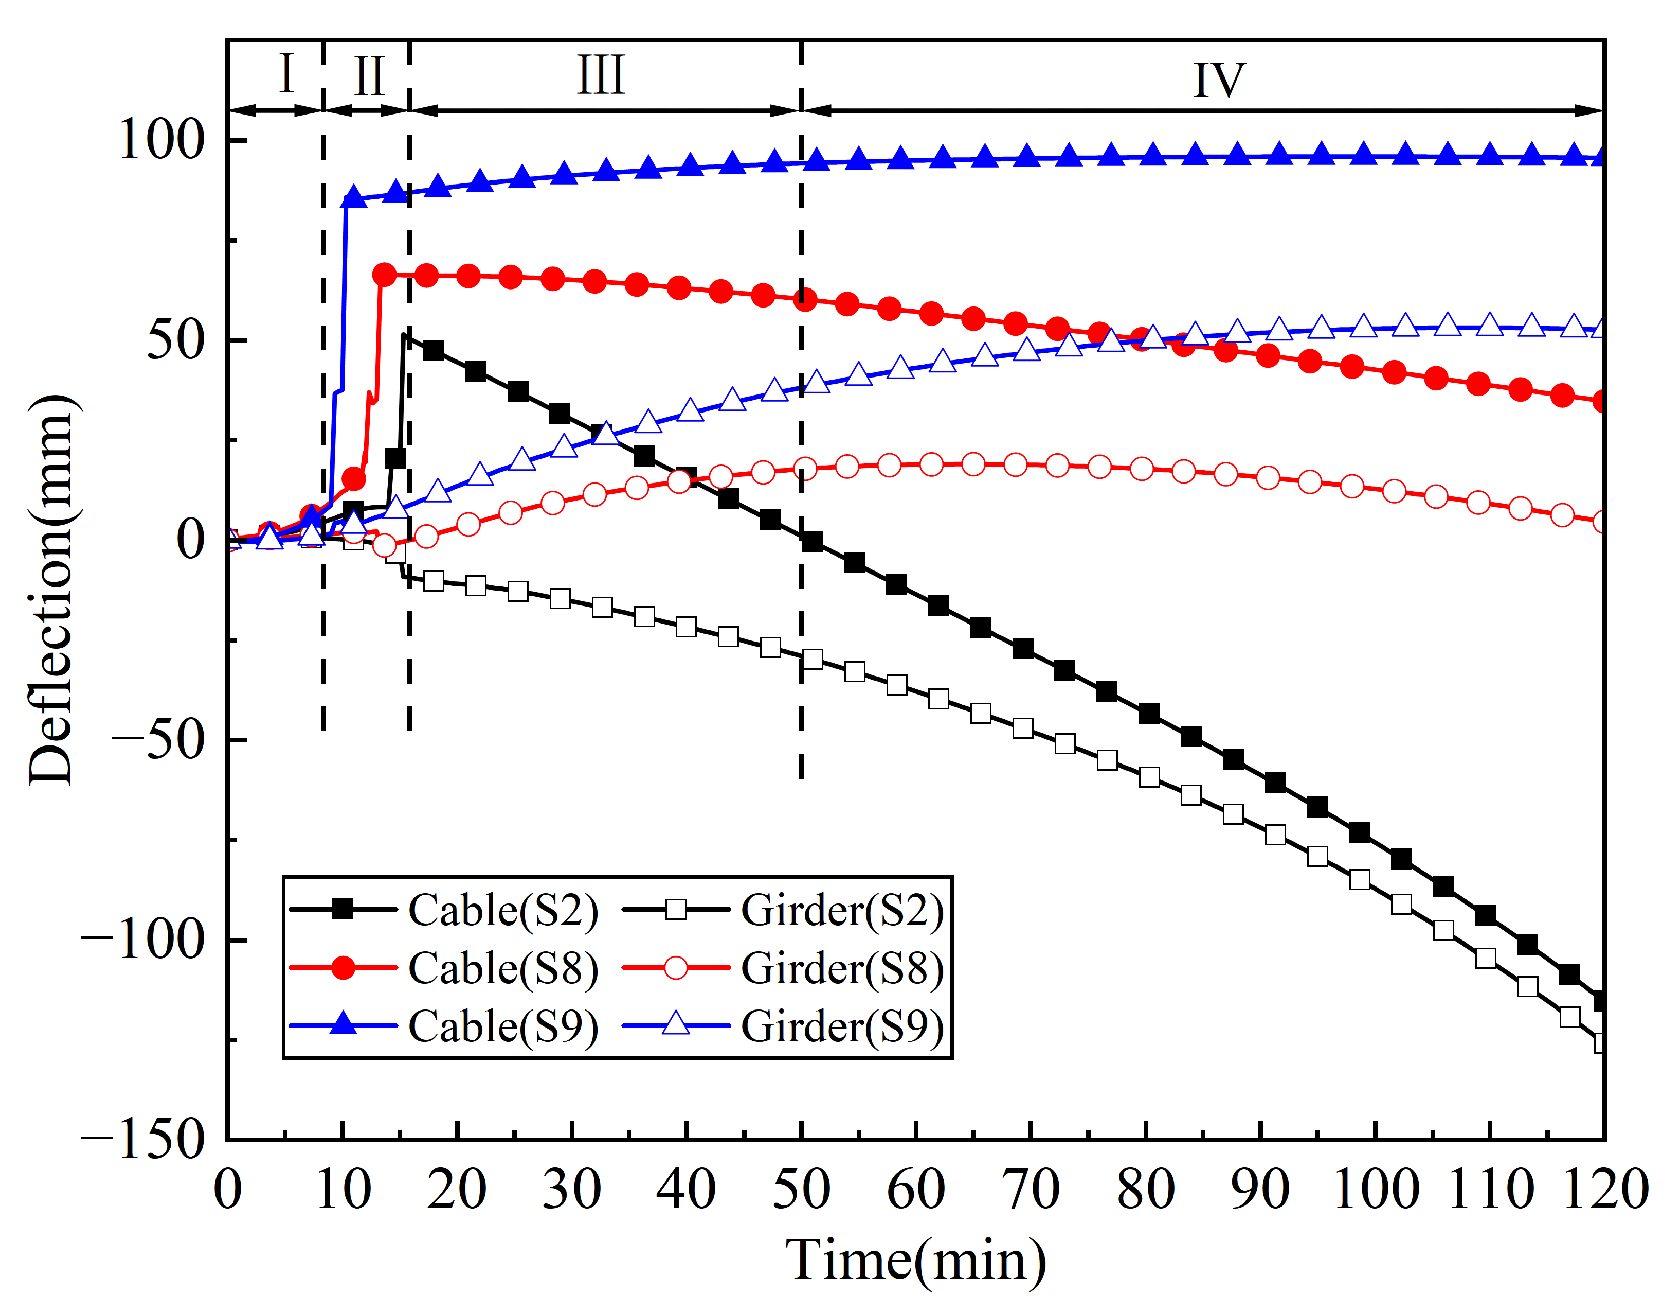
Baseline scenario S2 is adopted for analyzing the failure mode exhibited on the suspension bridge with fire exposure. The failure evolution of the main cable and main girder in S2 can be divided into four stages, namely, Stage I, Stage II, Stage III, and Stage IV, as shown in Figure 17. The failure process is interpreted according to the dominant structural response at different stages, including thermal deformation, hanger rupture, main cable yielding and system-level force redistribution.
Figure 17.
Deflection evolution of cables and girders.
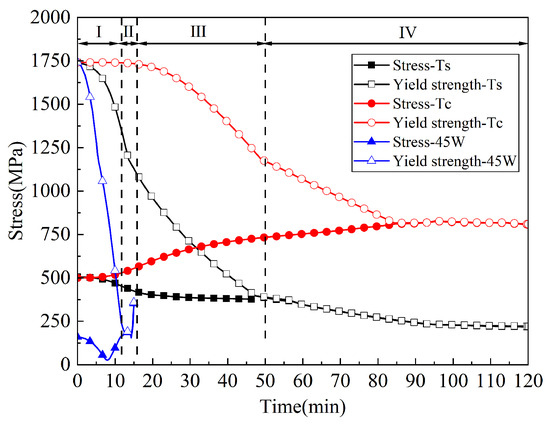
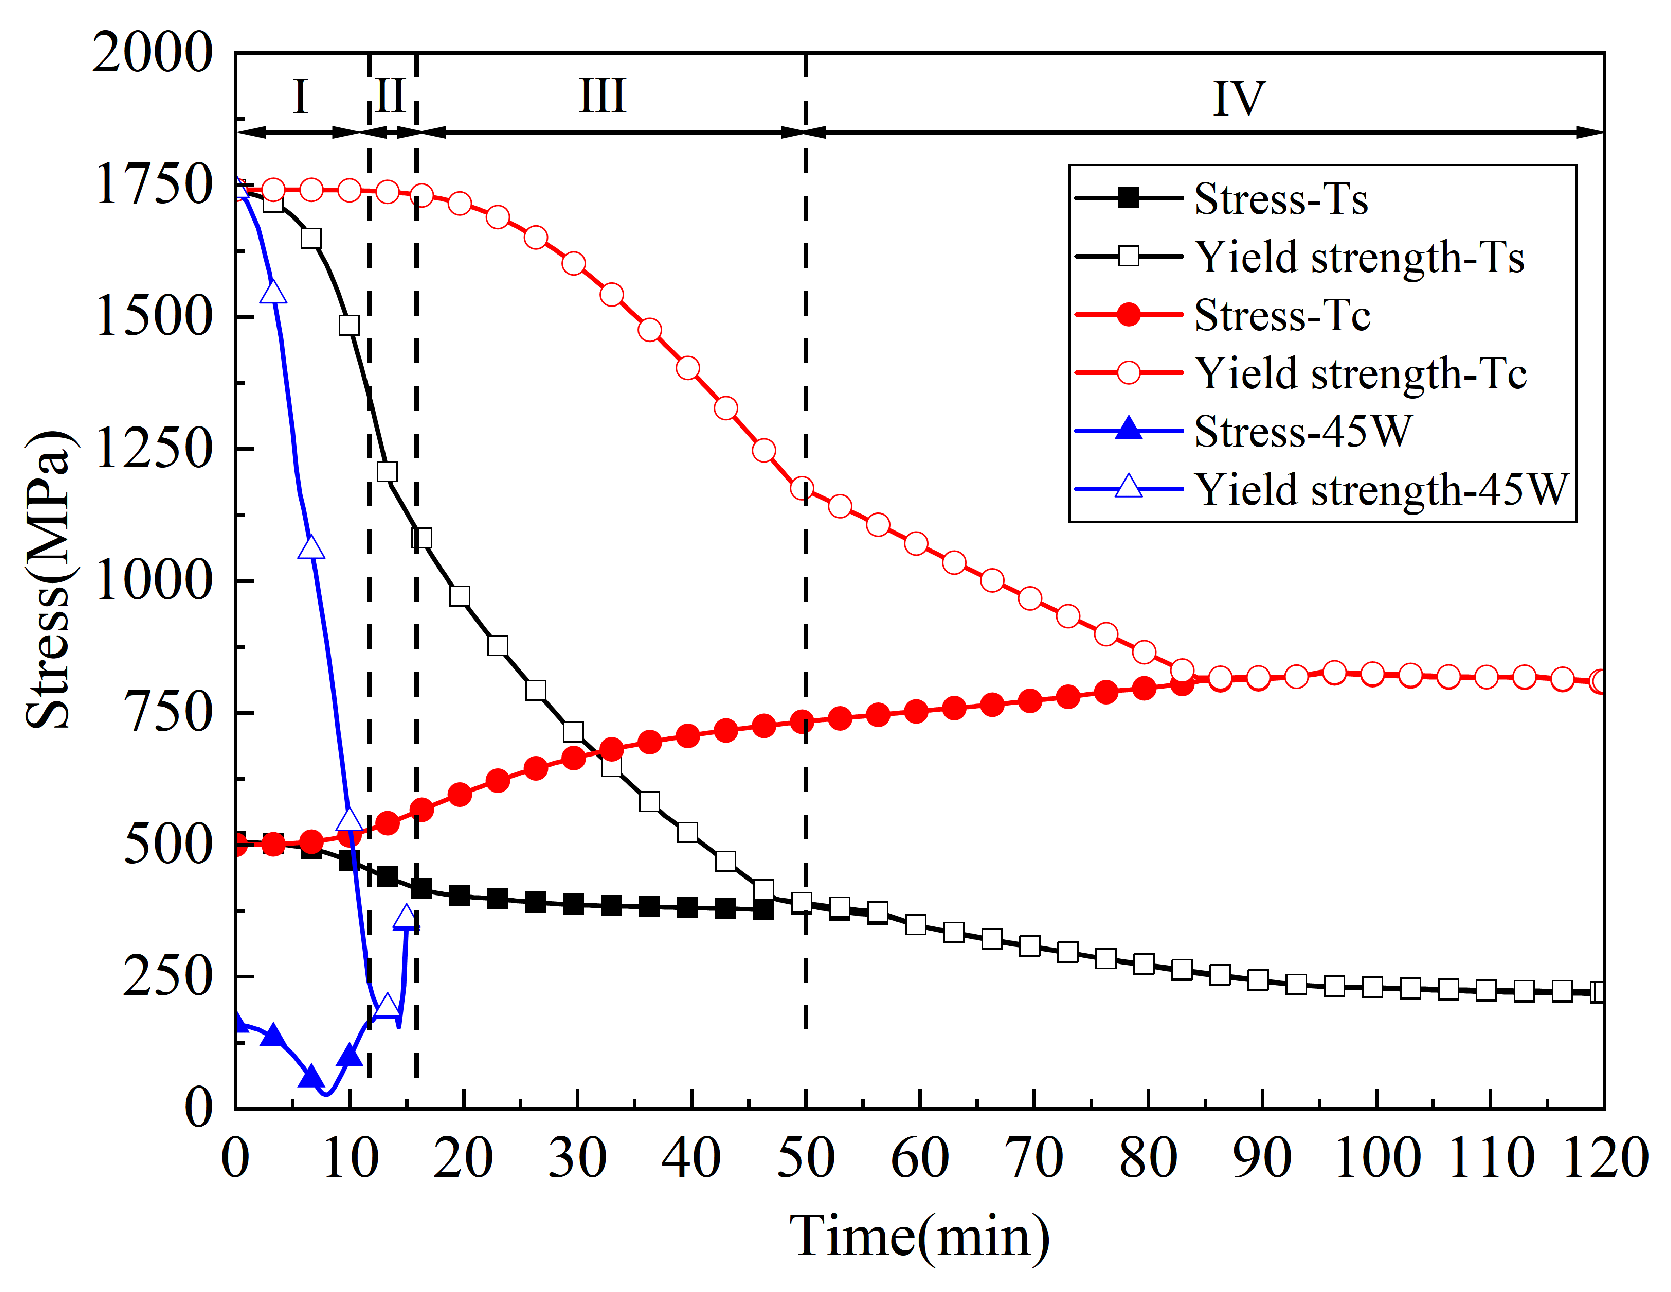
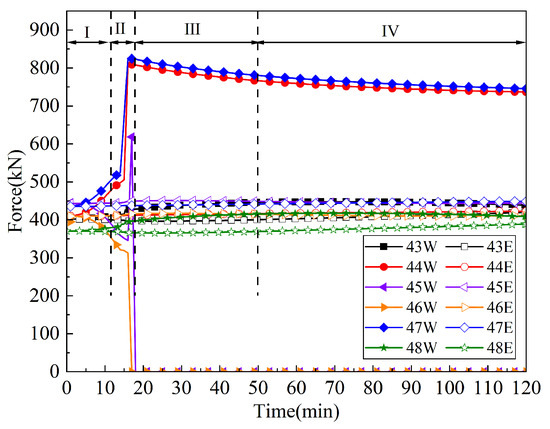
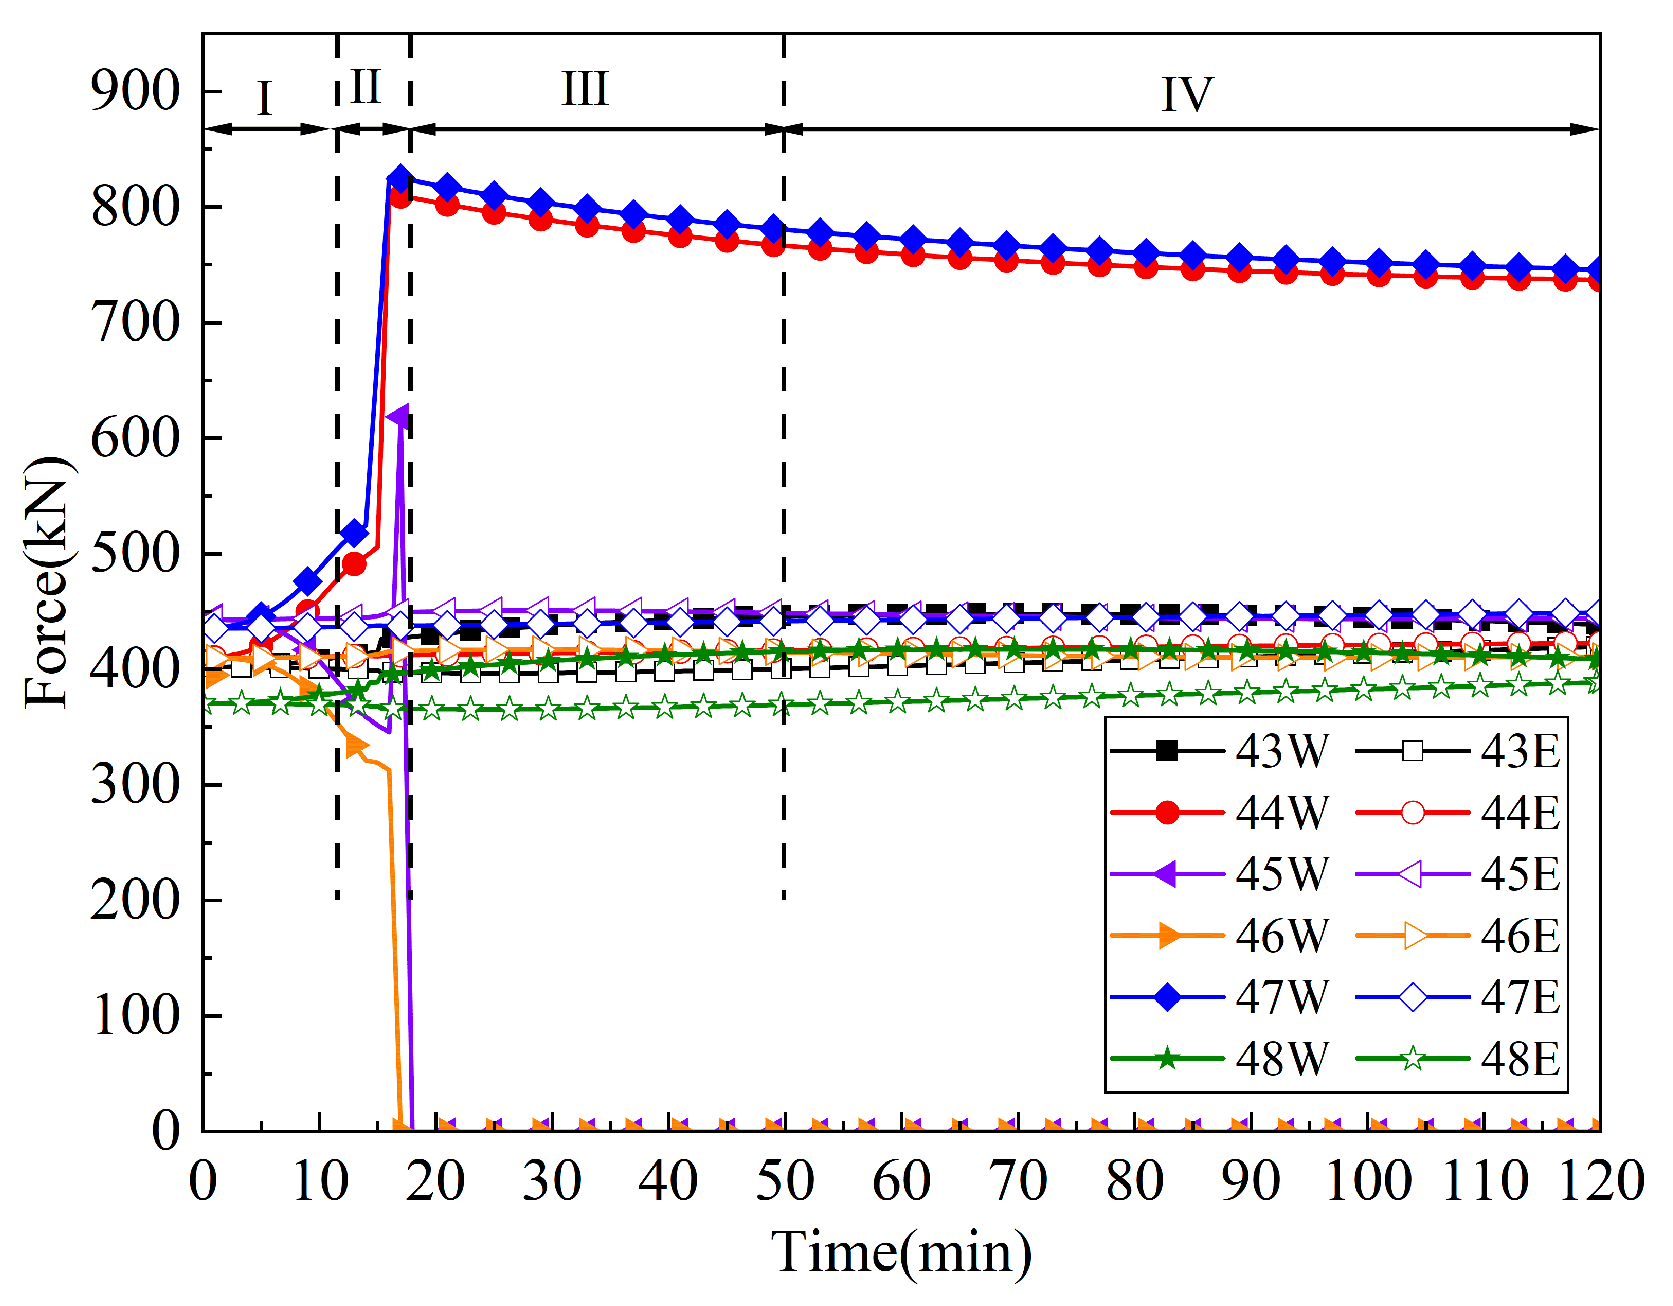
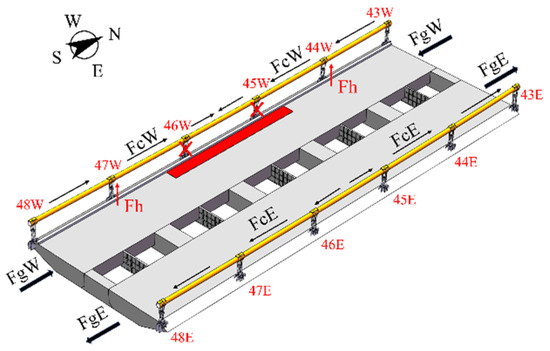
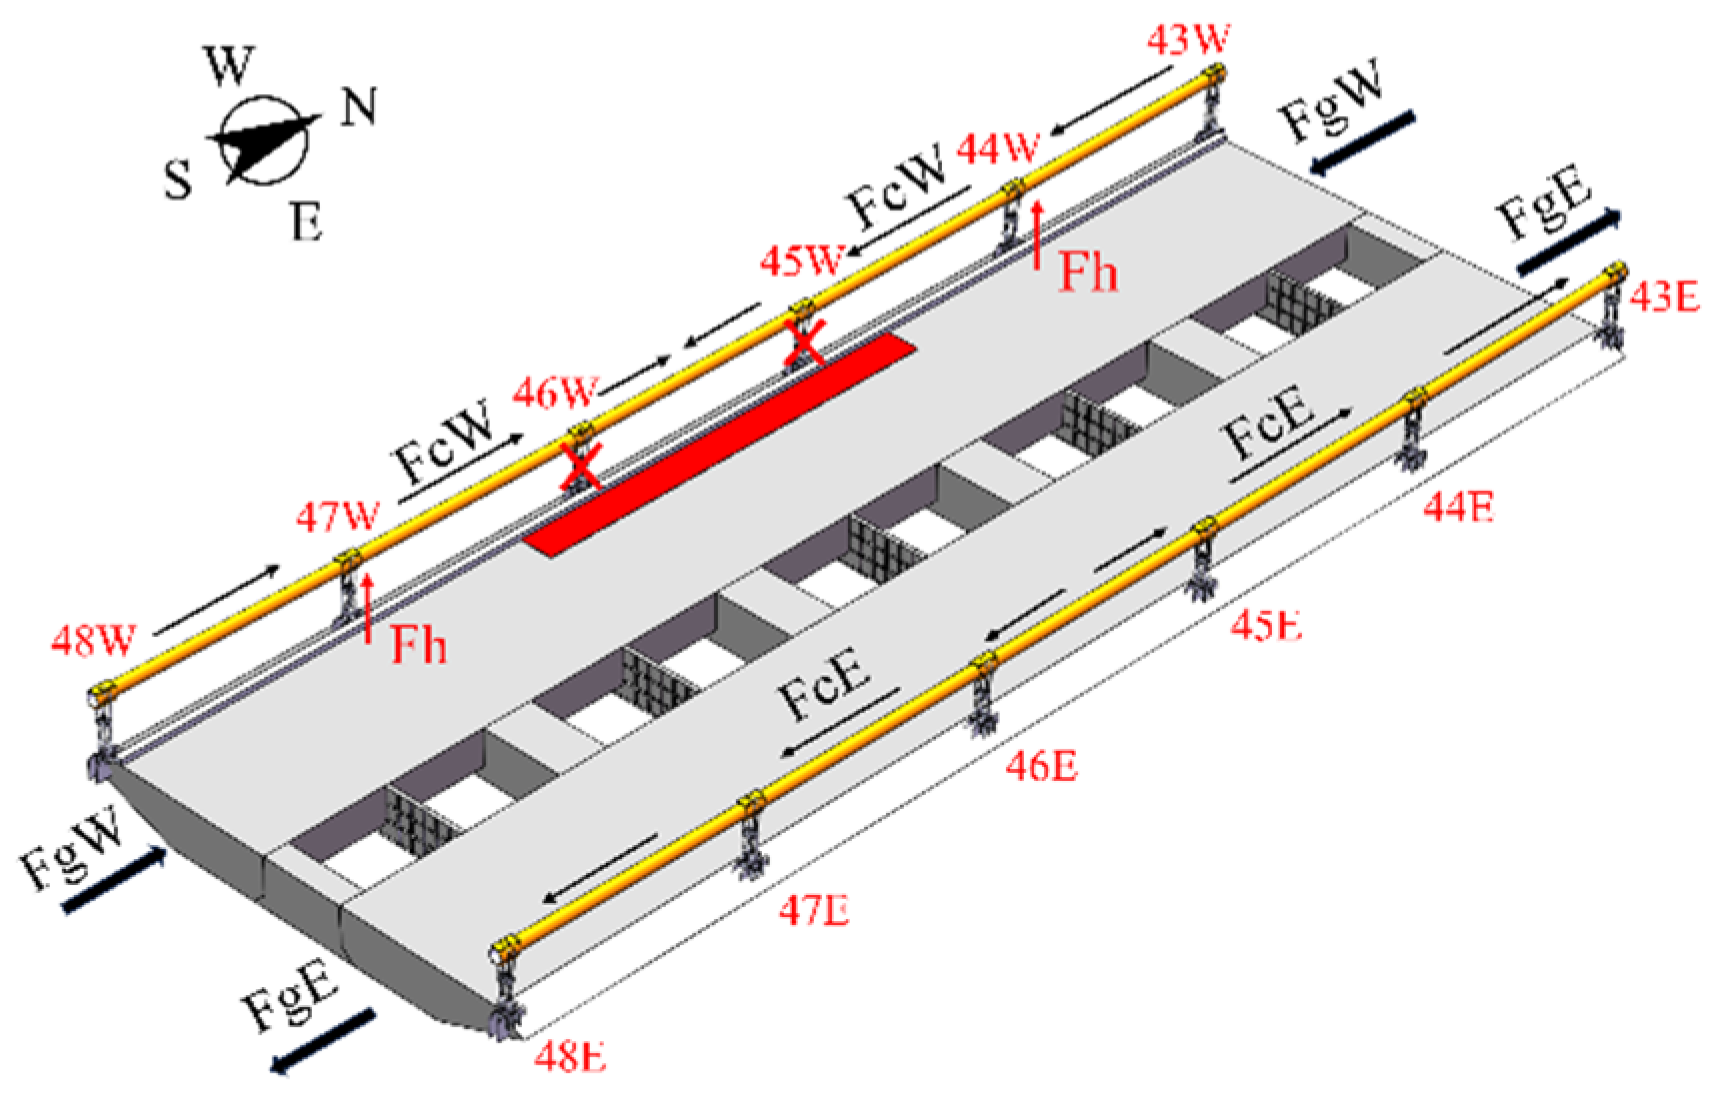
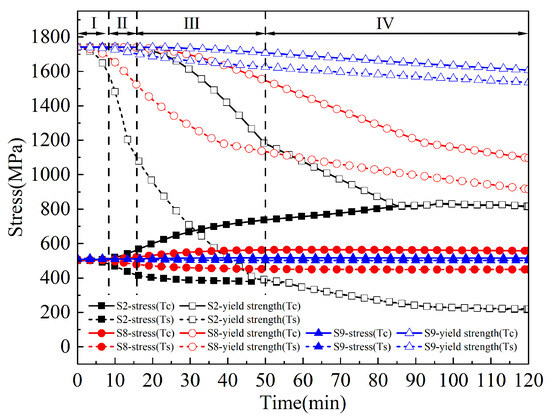
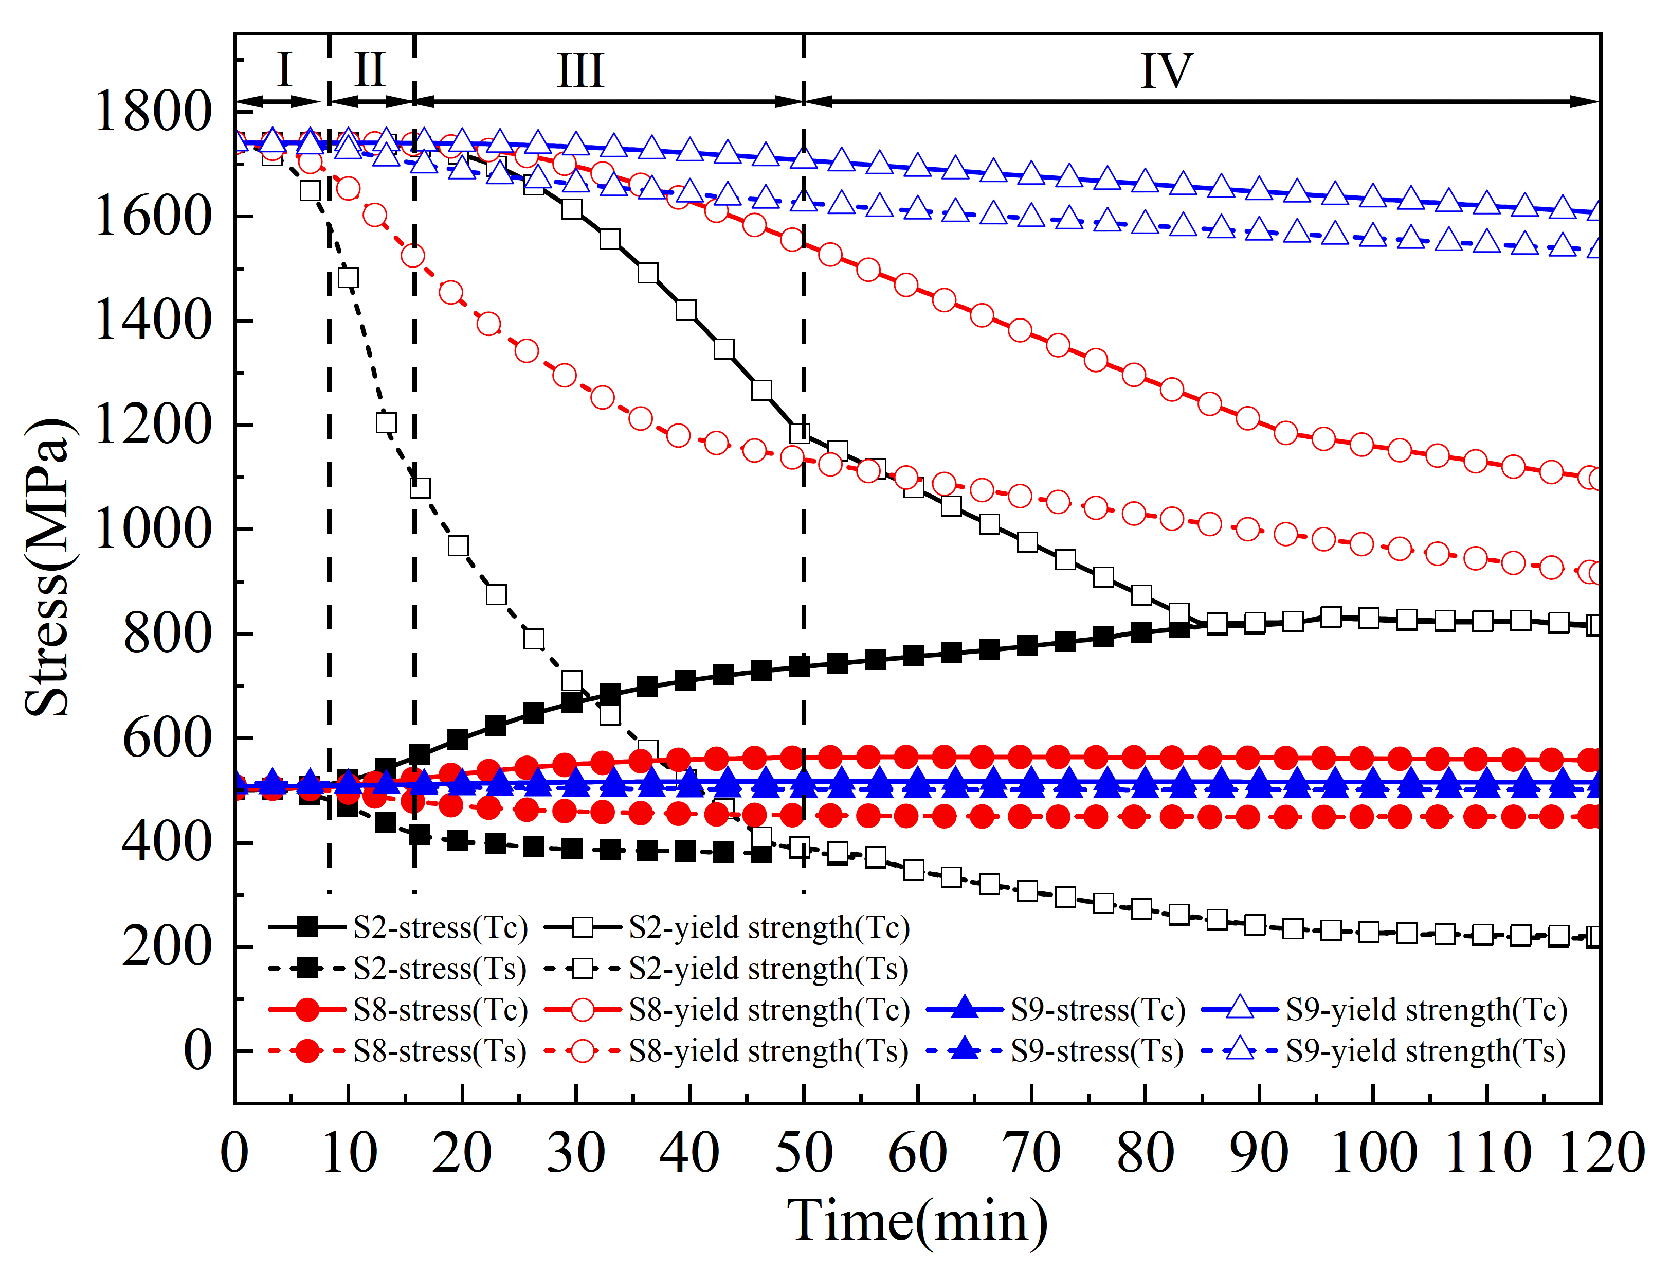
At Stage I (the first 12 min of fire exposure), the mid-span deflection of the main girder remains unchanged, whereas the main cables exhibit slight upward deflection. This can be attributed to the slow temperature rise observed in both the main cables and girders during the initial stage of fire exposure. By contrast, the rapid heating on hangers induces thermal elongation, causing the slight upward deflection of the main cable. Figure 18 illustrates the evolution of stress and yield strength in hangers and the main cable as a function of fire exposure time. After 10 min of fire exposure, hanger stress drops rapidly to the yield strength. This is due to the rapid degradation of hanger material properties at elevated temperatures. Both the 45W and 46W fire-exposed hangers showed a decrease in force within 12 min, as shown in Figure 19. Hanger IDs derive from the segment number and direction; for instance, the west-deck hanger on the north side of segment #46 is labeled 45W, as shown in Figure 20.
Figure 18.
Evolution of stress and yield strength for main cable and hanger bridge.
Figure 19.
Evolution of hanger force.
Figure 20.
Failure mode.
At Stage II (between 12 and 17 min of fire exposure), the mid-span deflections of the main cable and main girder exhibit step-like abrupt changes. This is due to the continuous breakage of hangers 45W and 46W. As compared to the former stage, the main cable rebounds upward abruptly by 42 mm, while the main girder develops a 9 mm downward deflection. It can be seen from Figure 19 that after 16 min of fire exposure, the hanger force in 46W drops abruptly from 312 kN to zero, while that in 45W first increases from 345 kN to 618 kN and then falls sharply to zero. Meanwhile, axial forces in 44W increase from 505 kN to 809 kN, and those in 47W increase from 524 kN to 824 kN. This occurs because 46W ruptured first, transferring its axial force to 45W and thereby triggering the rupture of 45W. As a result, the cable forces were redistributed once again to 44W and 47W.
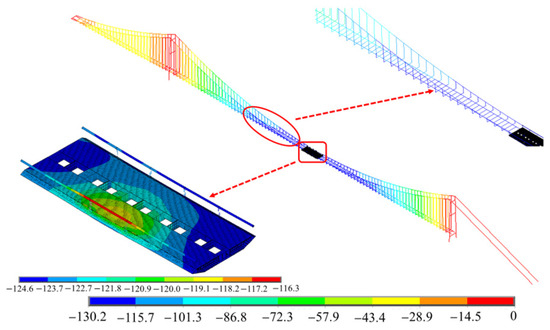
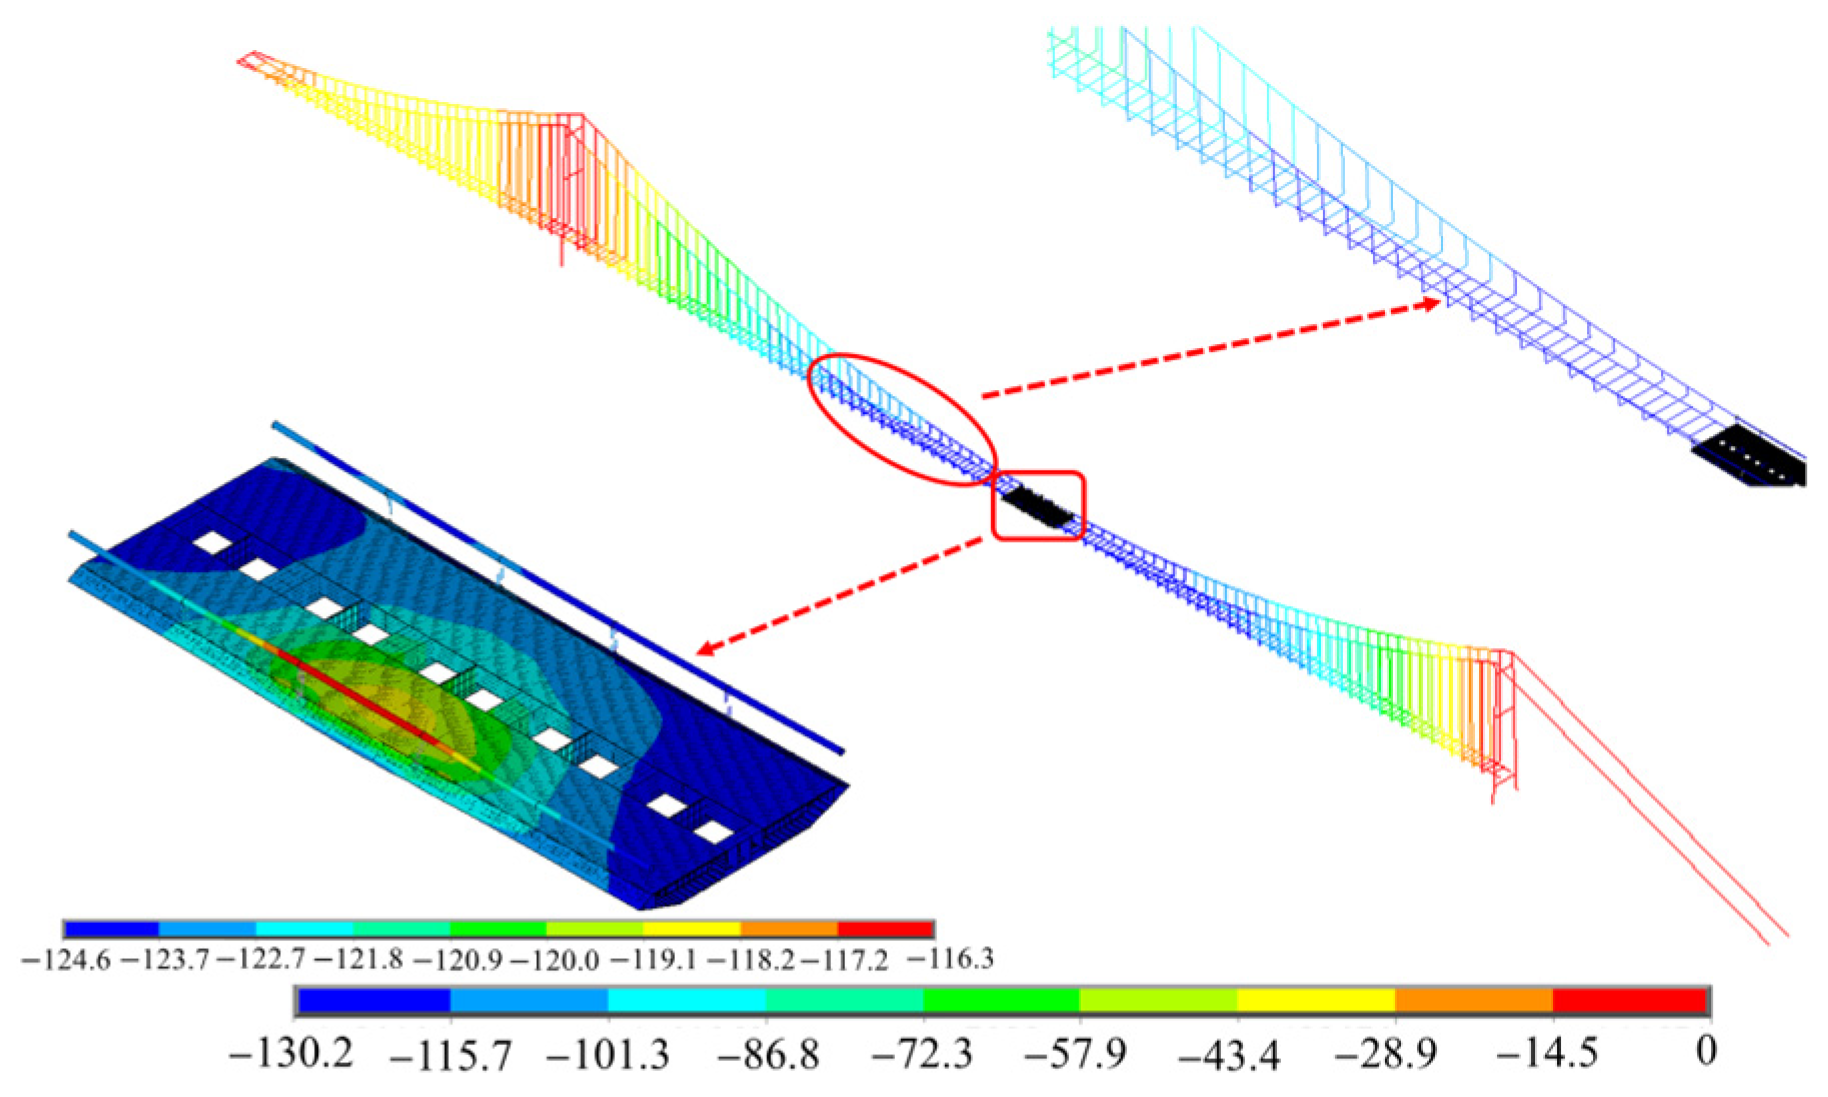
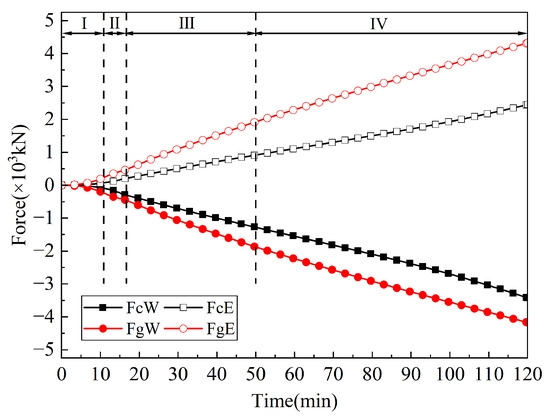
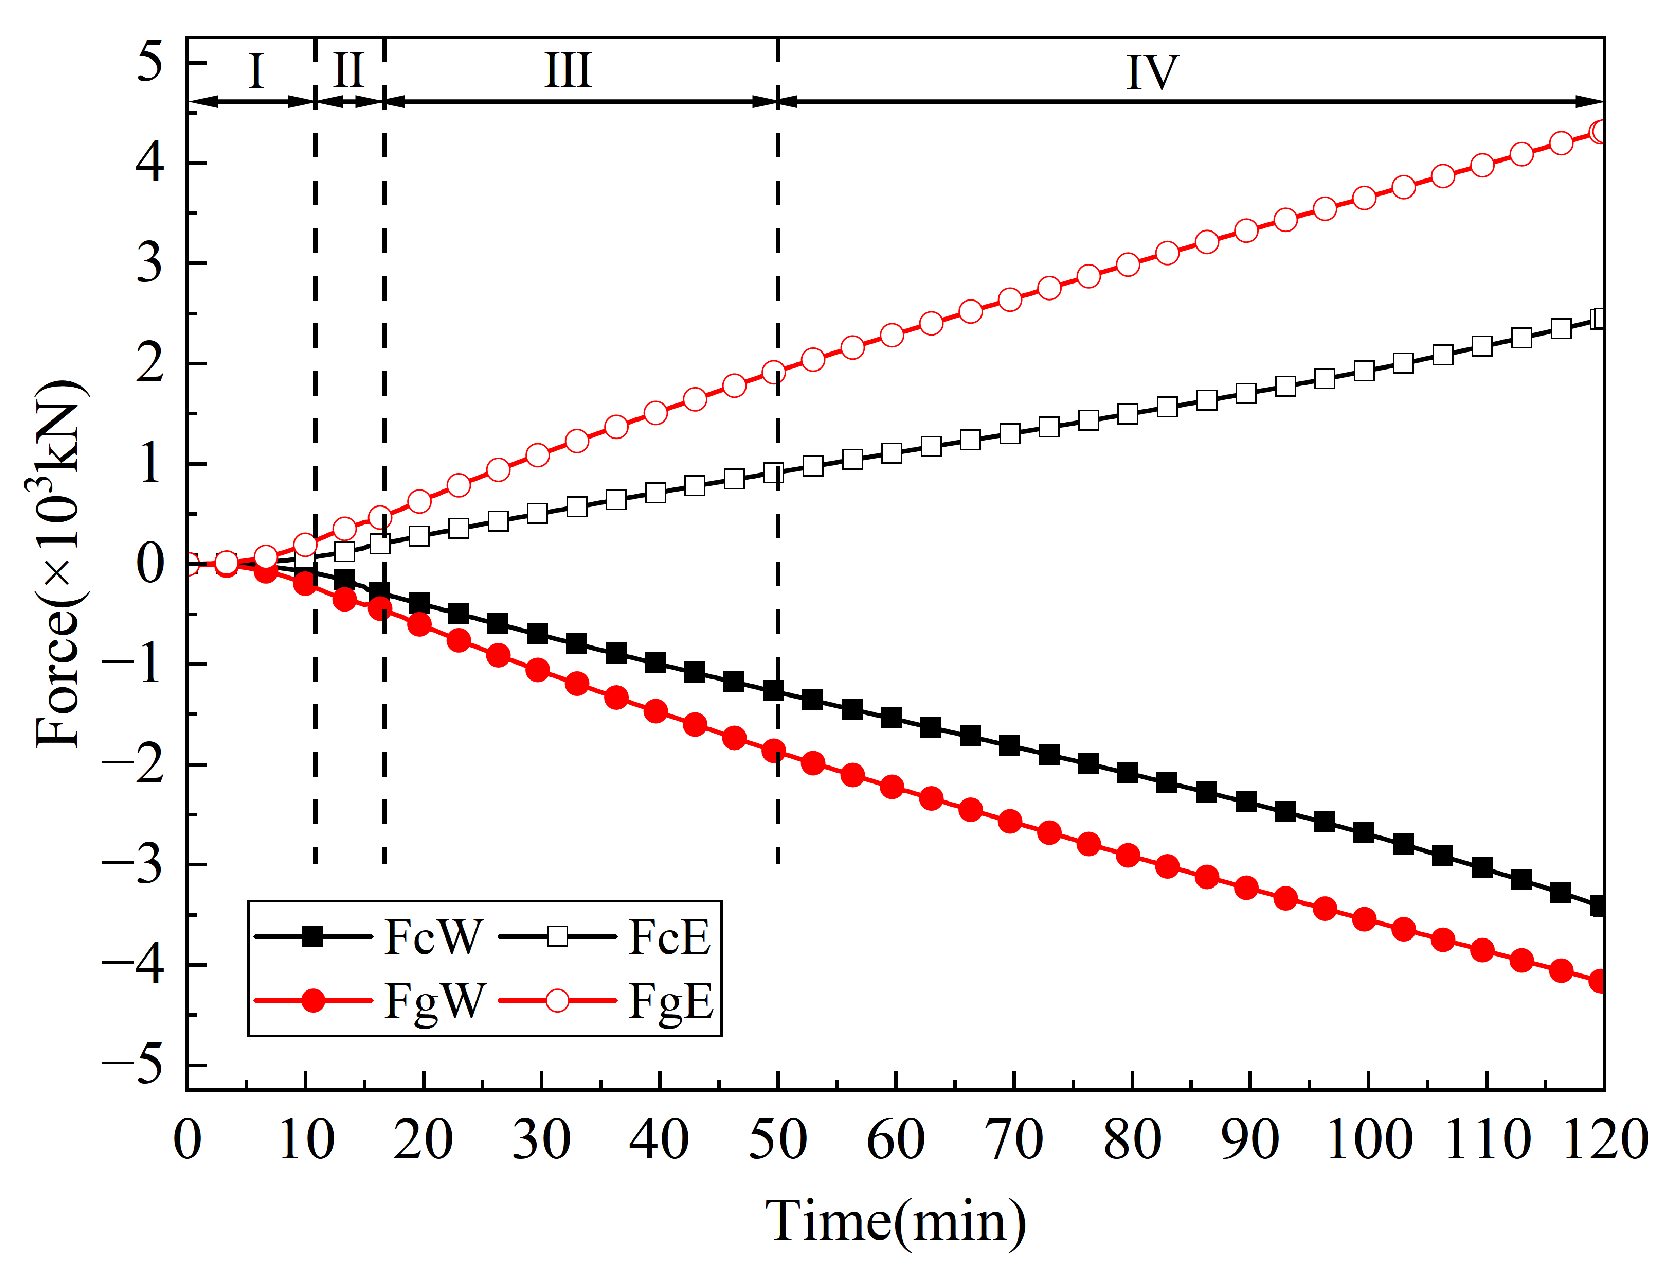
At Stage III (between 17 and 50 min of fire exposure), the deflection of the main cable and main girder increases linearly. However, the main girder shows a lower deflection rate than the main cable, as illustrated in Figure 21. This is due to the fact that the thermal expansion of the main cable leads to downward bending deformation, which in turn drives the main girder to deflect downward. Nevertheless, the significant temperature gradient within the main girder causes uneven thermal expansion, leading to an upward arching tendency in the top plate. As a result, the main girder shows a lower deflection rate than the main cable. Figure 22 shows the evolution of axial forces on the main cable and the main girder. It can be seen that the main cable and the main girder on the west side develop compressive force increments (FcW and FgW), and force equilibrium in turn raises the tensile demand on the east side. Meanwhile, the yield strength decreases continuously on the fire-exposed cable surface, and yielding initiates after 50 min of fire exposure.
Figure 21.
Deformation of suspension bridge (Unit: mm).
Figure 22.
Evolution of axial forces on main cable and main girder.
At Stage IV (after 50 min of fire exposure), nonlinear growth in deflection is observed in both the main cable and the main girder. As shown in Figure 18, the center of the main cable cross-section yields after 86 min of fire exposure. Meanwhile, the rate of downward deflection in the main girder subsequently matches that of the main cable. The severe downward deflection on the west side causes a significant lateral inclination in the suspension bridge. As the plastic zone expands, the axial force no longer sustained by the west main cable is progressively redistributed to the east main cable. Ultimately, the fire-exposed cable ruptures, triggering the global collapse of the suspension bridge.
This failure evolution is identified in S2, describing the progressive transition of the suspension bridge from local thermal effects to system-level failure. Although the structural response characteristics, such as stage duration and deformation amplitude, are influenced by the investigated parameters, this four-stage failure evolution provides a general interpretive framework for investigating the behavior of suspension bridges under local tanker-fire exposure.
3.2.2. Fire Exposure Length
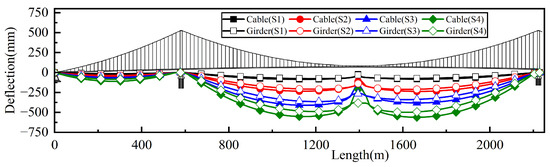
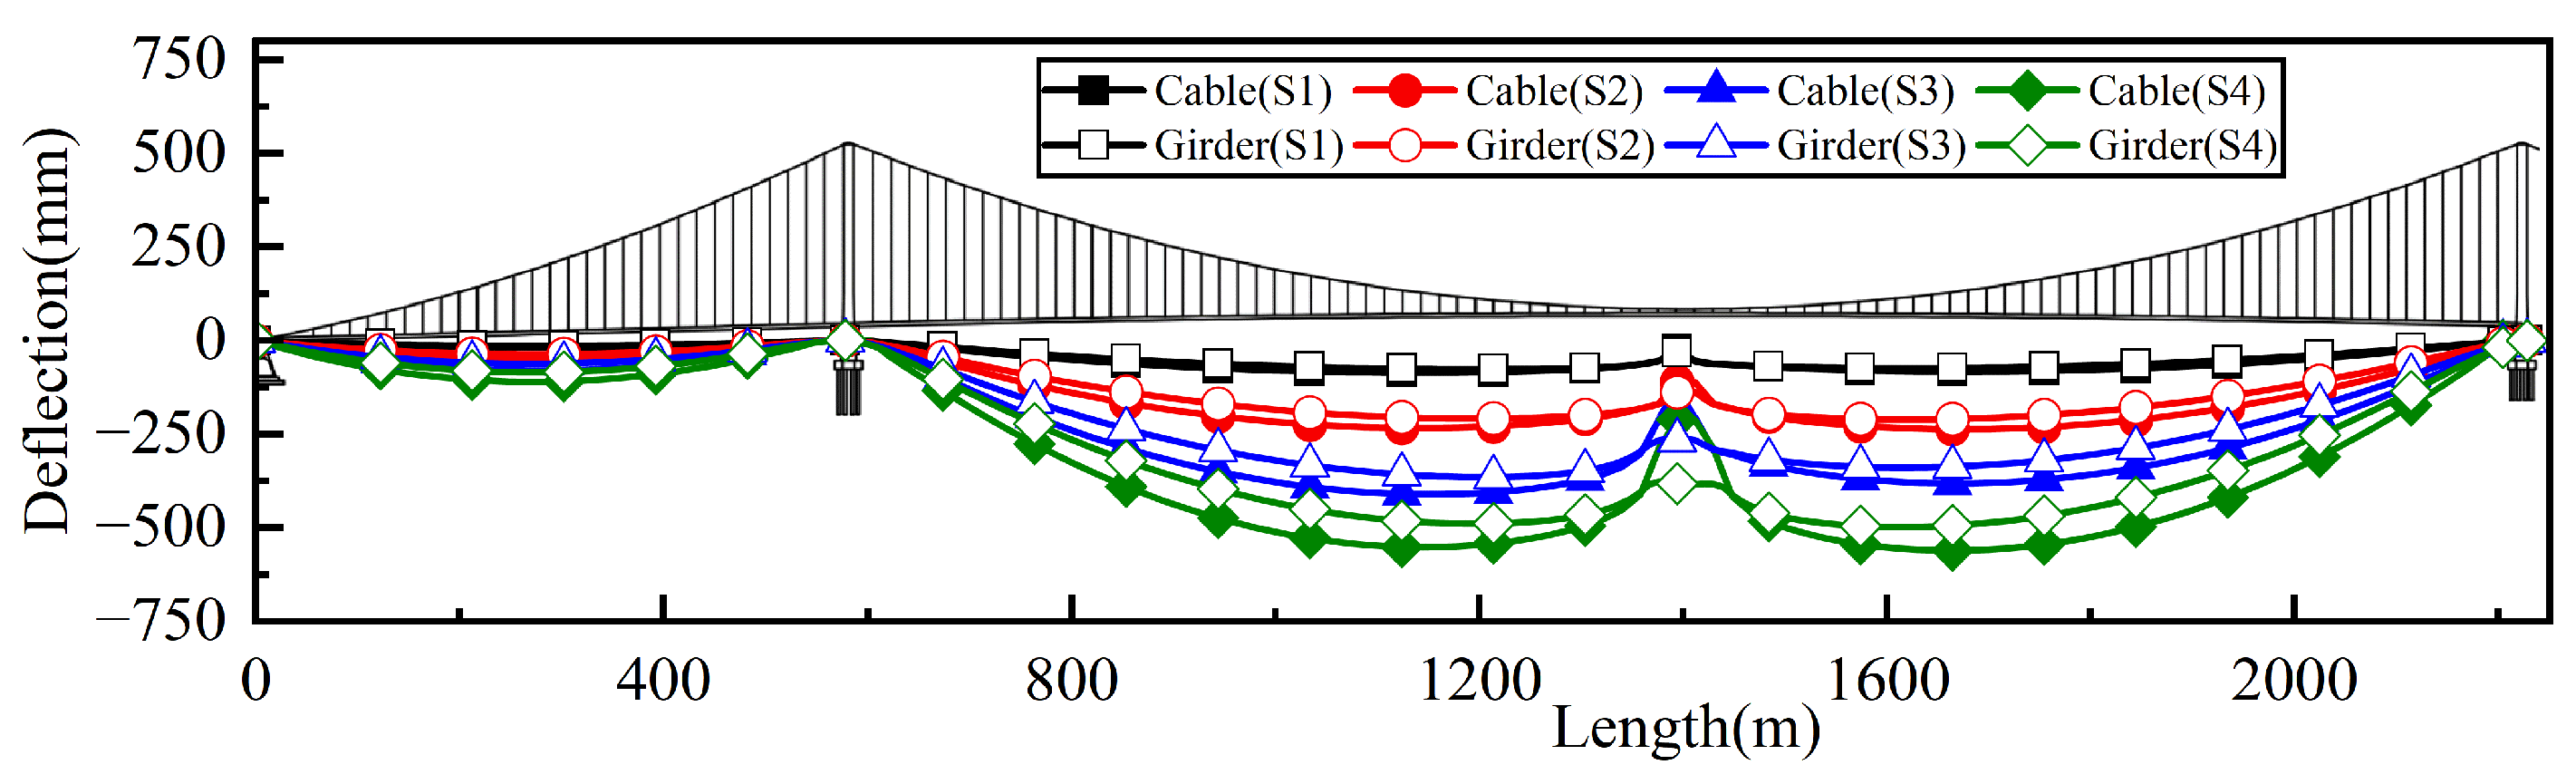
The fire exposure length (L), as defined in Figure 3, includes 10 m (S1), 30 m (S2), 50 m (S3), and 70 m (S4), covering 1 to 4 hangers. Figure 23 shows the deflection of cables and girders under different fire exposure lengths after 120 min of fire exposure. These deflections are the net values induced solely by fire loads, excluding the effects of self-weight and traffic loads. It can be seen that the main cable and main girder exhibit a similar deflection trend. For all fire scenarios, the maximum deflection in the entire bridge is located near #segments 34 and #58, away from the fire exposure region. The maximum deflections of the main girder reach 76 mm (S1), 210 mm (S2), 363 mm (S3), and 496 mm (S4), respectively. In contrast, deflections in the fire exposure region are merely 31 mm (S1), 129 mm (S2), 262 mm (S3) and 381 mm (S4). This phenomenon arises from the upward arching of the main girder in the fire-exposed region due to thermal expansion, which mitigates downward deflection. Further, the fire-exposed main cables show smaller deflections, including 24 mm (S1), 109 mm (S2), 168 mm (S3), and 210 mm (S4). This indicates that the rebound of the main cables under tension, subsequent to the loss of vertical restraint from the suspenders, exceeds the upward arching caused by the thermal expansion of the main girder.
Figure 23.
Deflection of cables and girders under different fire exposure lengths.
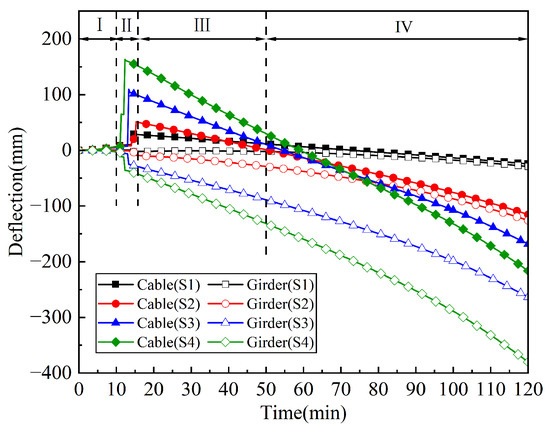
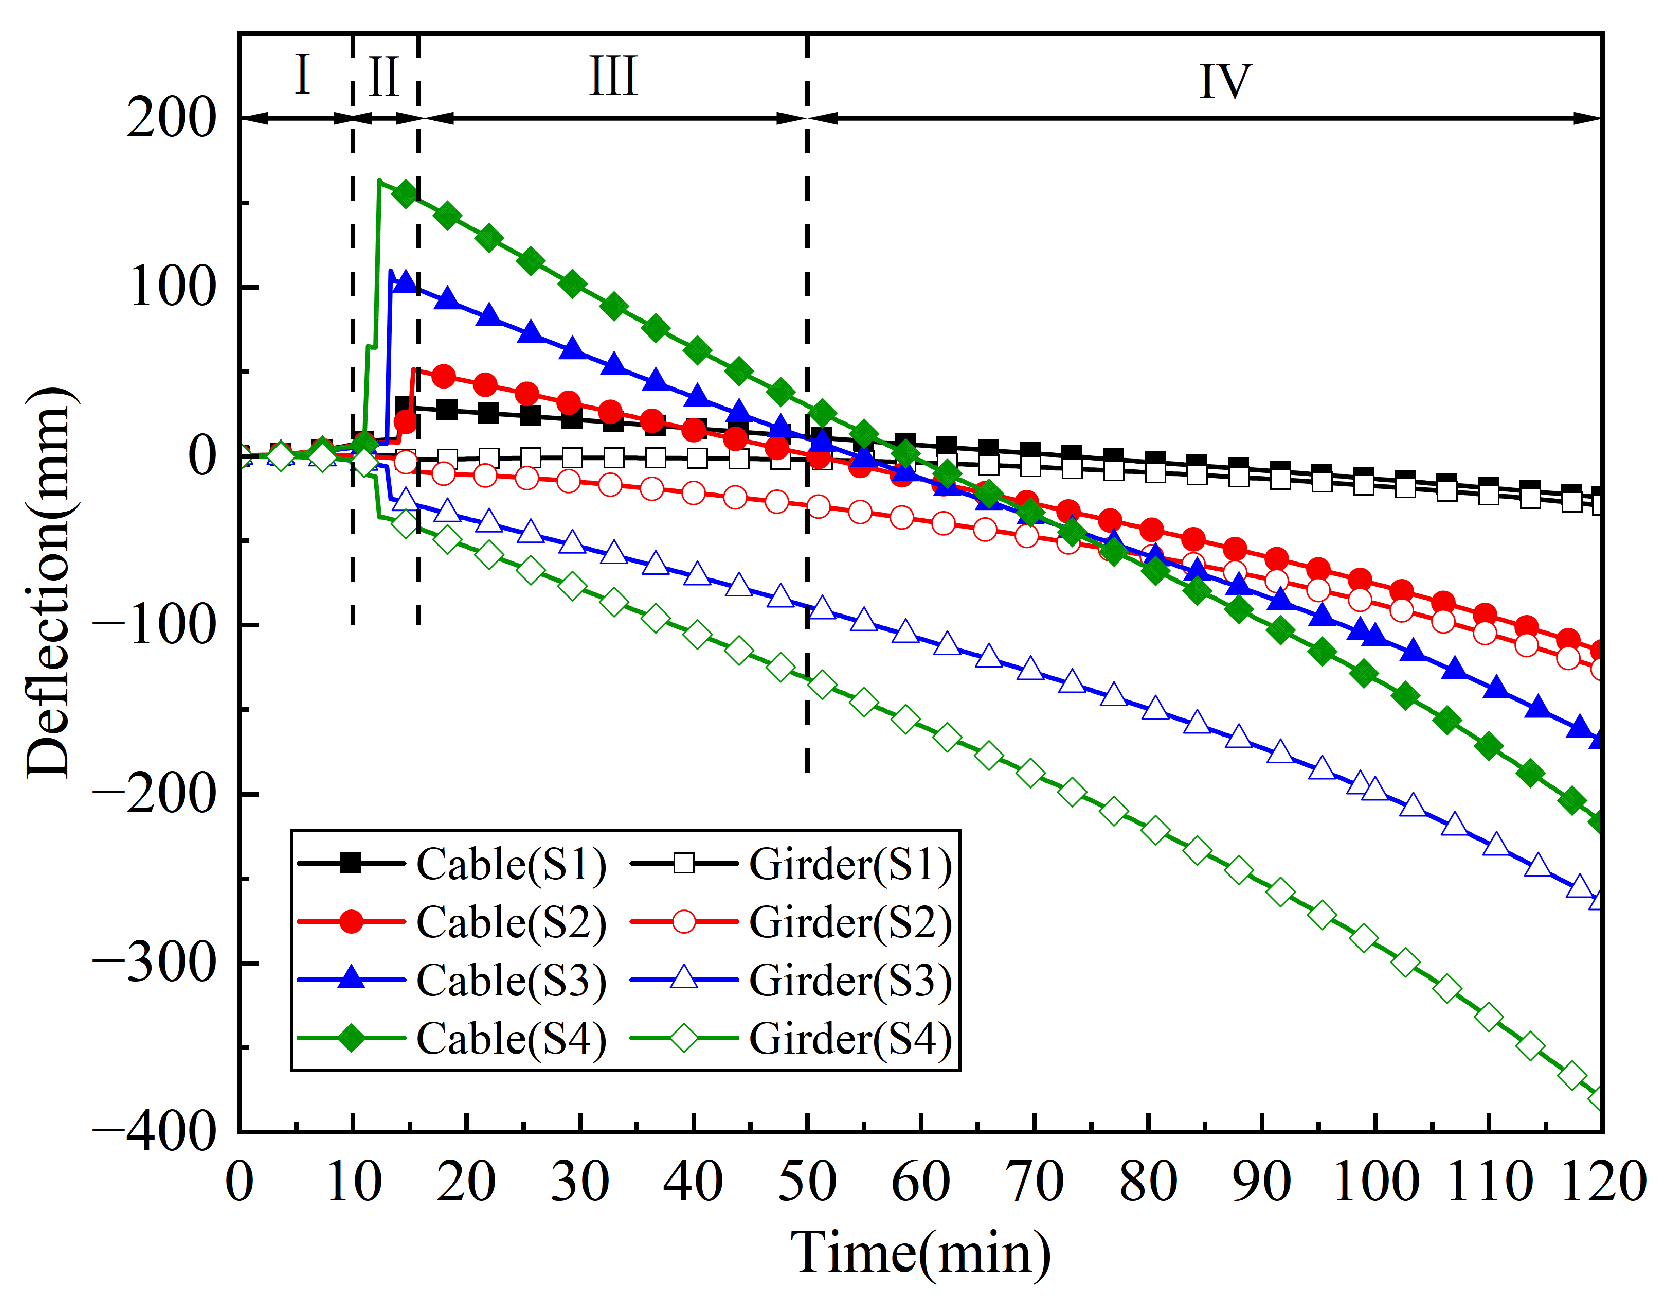
The deflection of fire-exposed main cables and main girders for different fire lengths is plotted as a function of fire exposure time, as shown in Figure 24. It can be seen that the failure of one hanger in S1 causes an upward rebound of 19 mm in the main cable and a downward deflection of 2 mm in the main girder. As the number of ruptured hangers increases, the rebounds of the main cable reach 43 mm (S2), 102 mm (S3), and 154 mm (S4), respectively, and the deflection of the main girder reaches 6 mm (S2), 21 mm (S3), and 34 mm (S4). During the next stages, the widespread fire exposure accelerates the degradation of structural performance, leading to a higher deflection speed of cables and girders. After 120 min, S1 settles to a 53 mm downward deflection of the main cable after rebounding and 26 mm for the main girder. By contrast, the deflection in S4 is much larger, reaching 377 mm for the main cable and 344 mm for the main girder. As the fire exposure length increases, the deflection discrepancy between the main girder and main cable expands. This phenomenon can be attributed to the growing number of fractured suspenders, which eliminates additional vertical constraints between the main cable and stiffening girder.
Figure 24.
Deflection evolution of cables and girders under different fire exposure lengths.
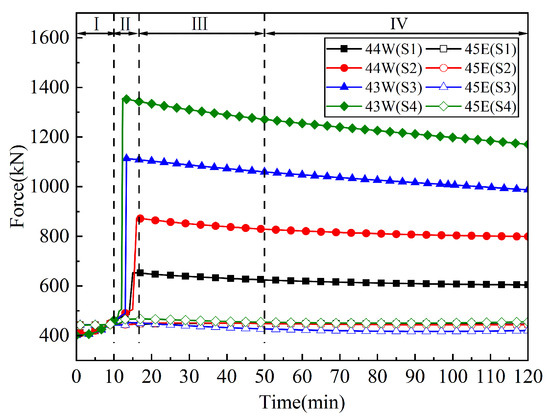
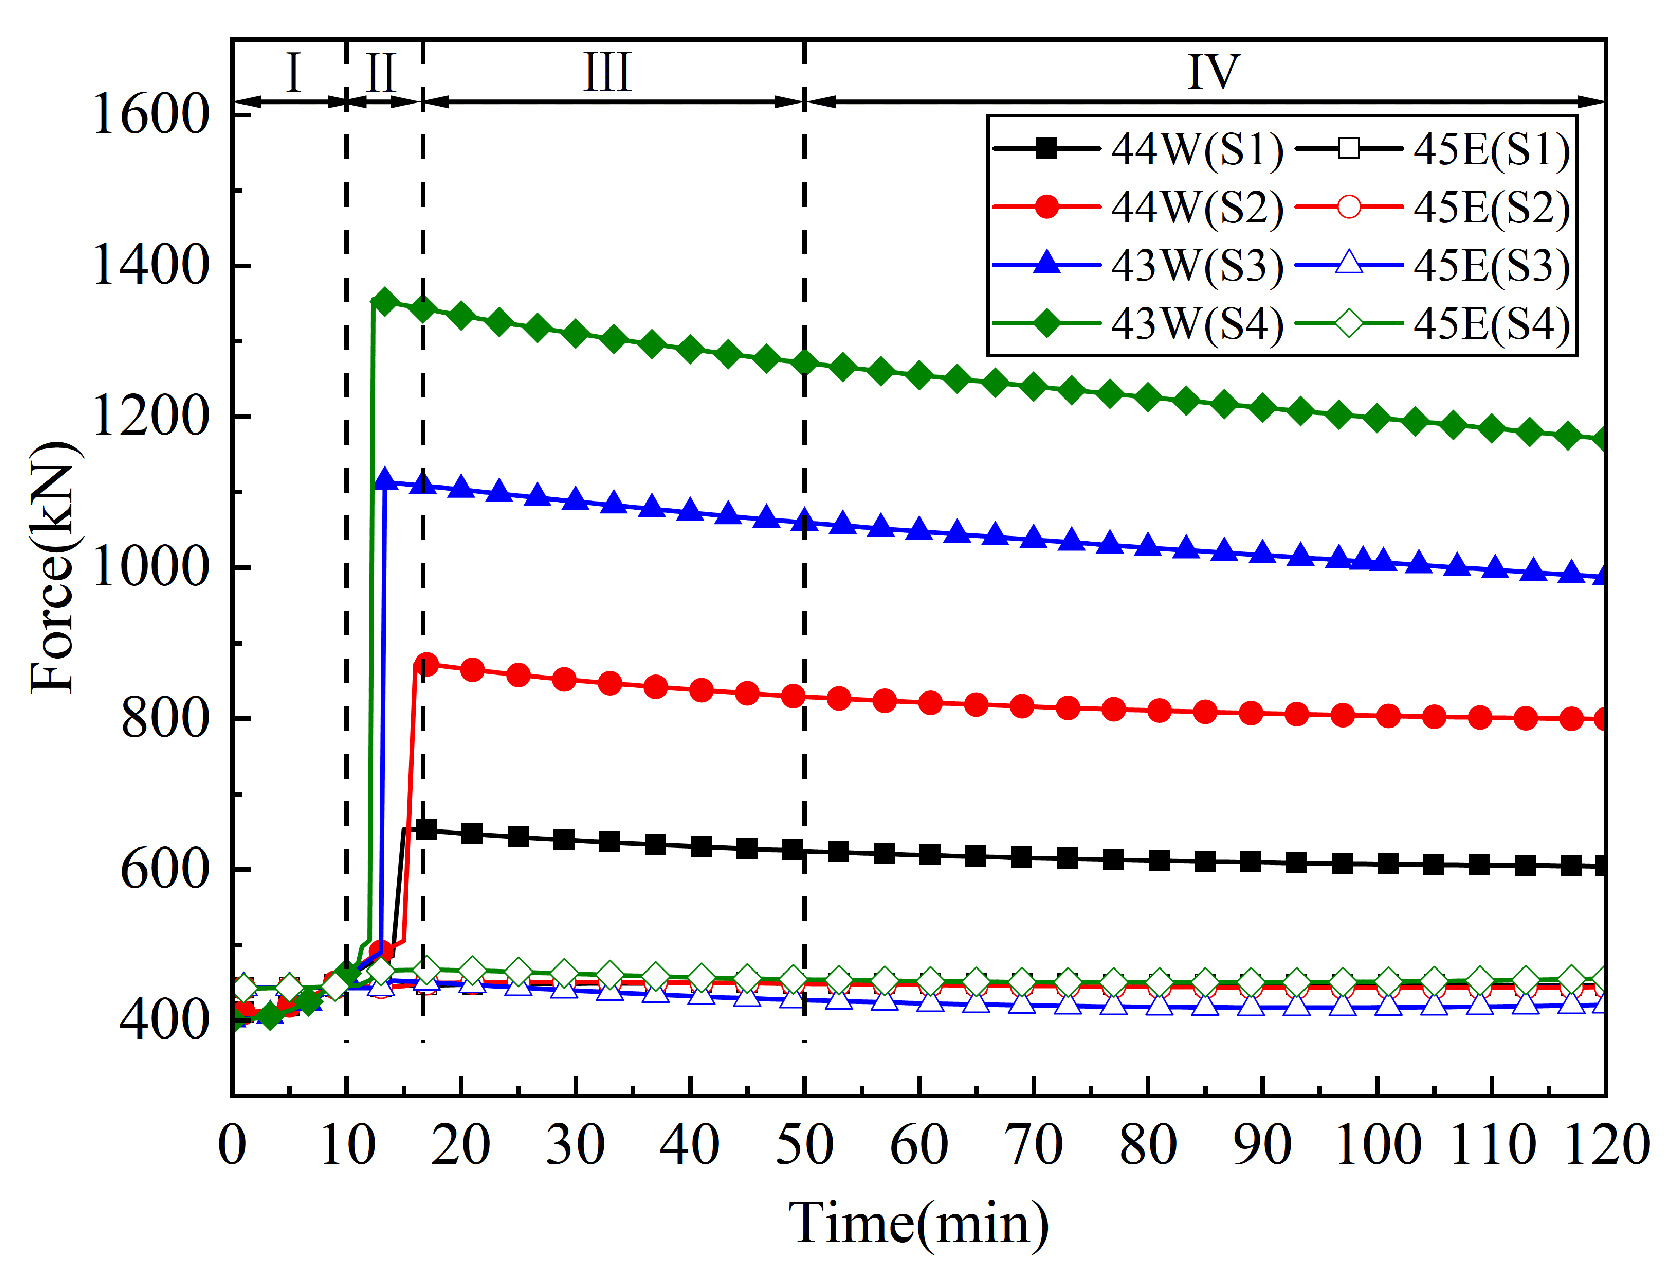
Figure 25 shows the evolution of hanger forces under different fire exposure lengths. At the initial fire exposure stages, each hanger carries about 400 kN in axial force. In Stage II, hanger 45W breaks, and the force of 44W increases from 485 kN to 652 kN in S1. In S2, rupture of 45W and 46W increases the force in 44W from 505 kN to 872 kN. In S3 and S4, rupture of 44W to 46W and 44W to 47W leads to the 43W(S3) increase from 490 kN to 1114 kN, and 43W (S4) changes from 497 kN to 1356 kN. This is due to the fact that when one hanger ruptures, the carried force is redistributed evenly to adjacent hangers. Over four successive ruptures in S4, the cumulative increase in neighboring hangers reaches about 850 kN. By contrast, east-side hangers opposite the rupture hangers show only a slight rise in force. As fire exposure progresses, internal forces undergo continuous redistribution, whereby hangers adjacent to the initial rupture progressively transfer their axial loads to neighboring hangers. In S4, hanger 43E exhibits a 22.4% decrease in axial force, reaching a residual value of 184 kN at 120 min.
Figure 25.
Evolution of hanger force with different fire exposure lengths.
3.2.3. Wind Speed
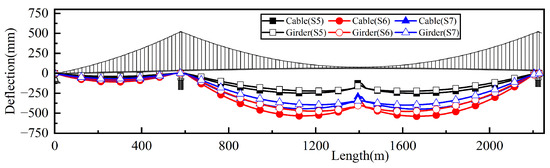
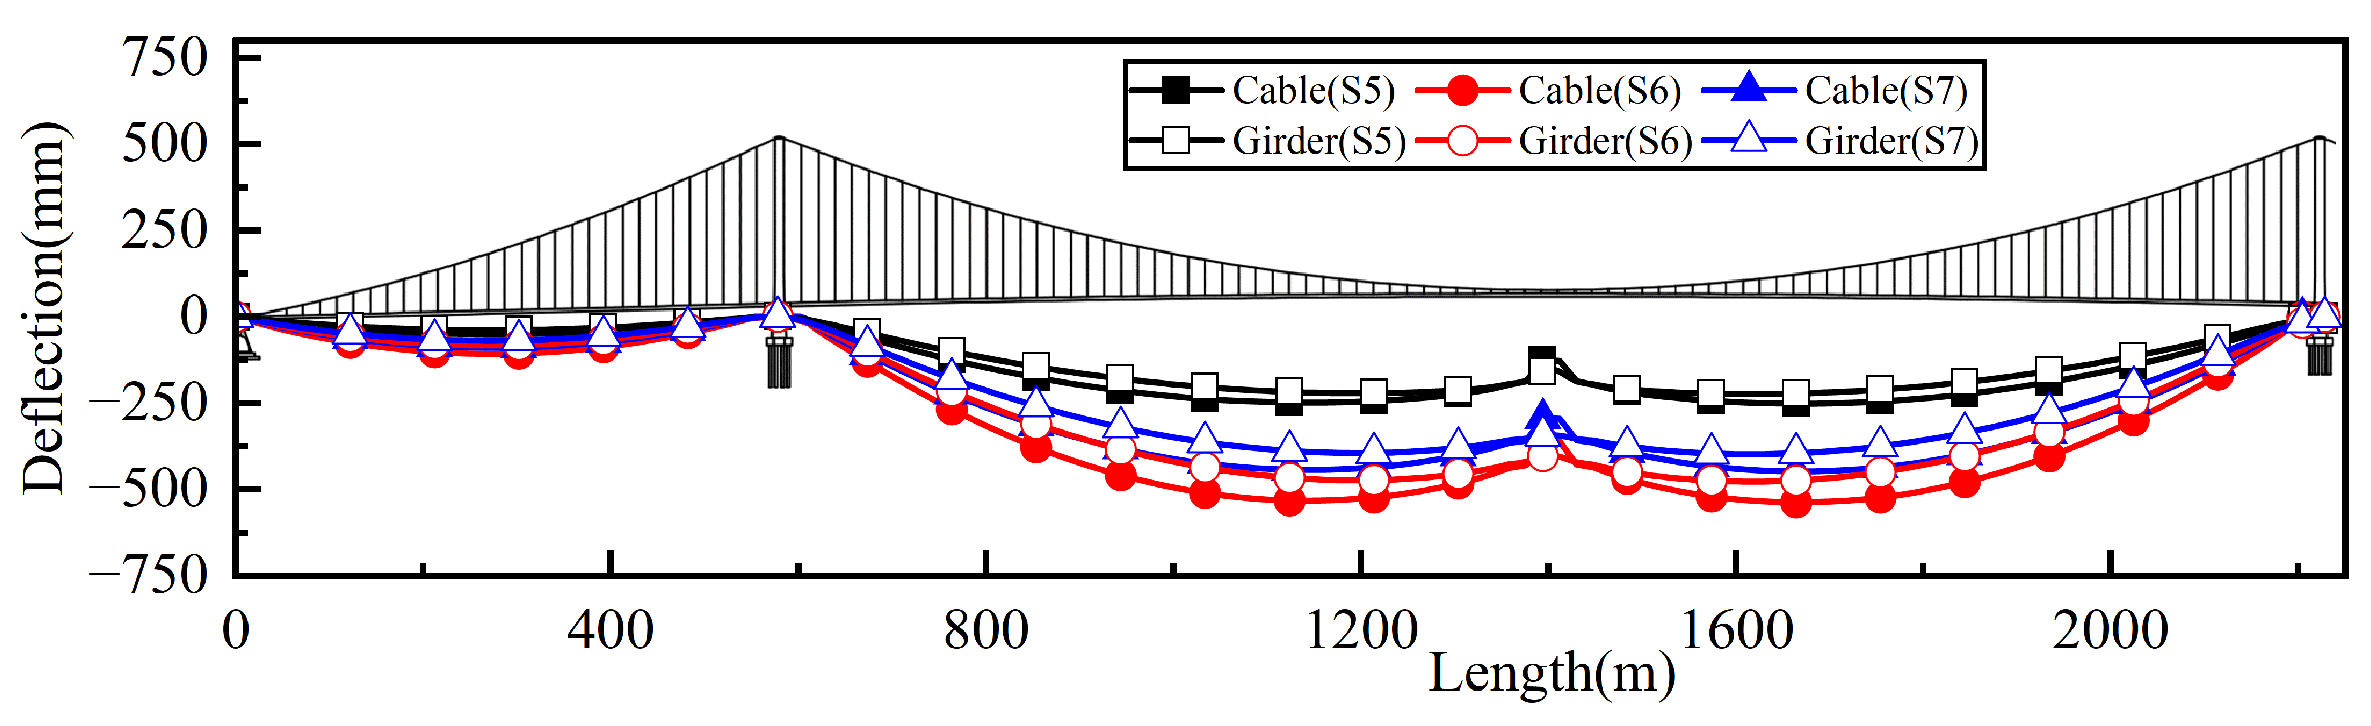
The wind speeds include 1 m/s (S5), 3 m/s (S6), and 5 m/s (S7), blowing transversely across the bridge from east to west. Figure 26 shows the deflection of cables and girders under different wind speeds after 120 min of fire exposure. The deflection data in S6 is taken from one minute before the failure of the main cable. The maximum deflection of the main girder is still located near segments #34 and #58, reaching 223 mm (S5), 472 mm (S6), and 397 mm (S7), respectively. In the fire exposure region, main cables and main girders show an upward displacement. The deflections on main girders reach 150 mm (S5), 403 mm (S6), and 342 mm (S7), while those of main cable are 125 mm (S5), 360 mm (S6), and 293 mm (S7), respectively. However, the significant 171 mm deflection difference between the main girder and the main cable observed in S4 no longer existed. This is because wind increases the flame inclination angle, thermal expansion and strength degradation of the main cable leads to severe downward deflection.
Figure 26.
Deflection of cables and girders under different wind speeds.
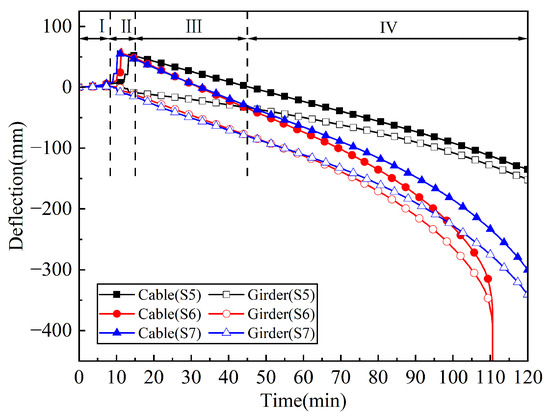
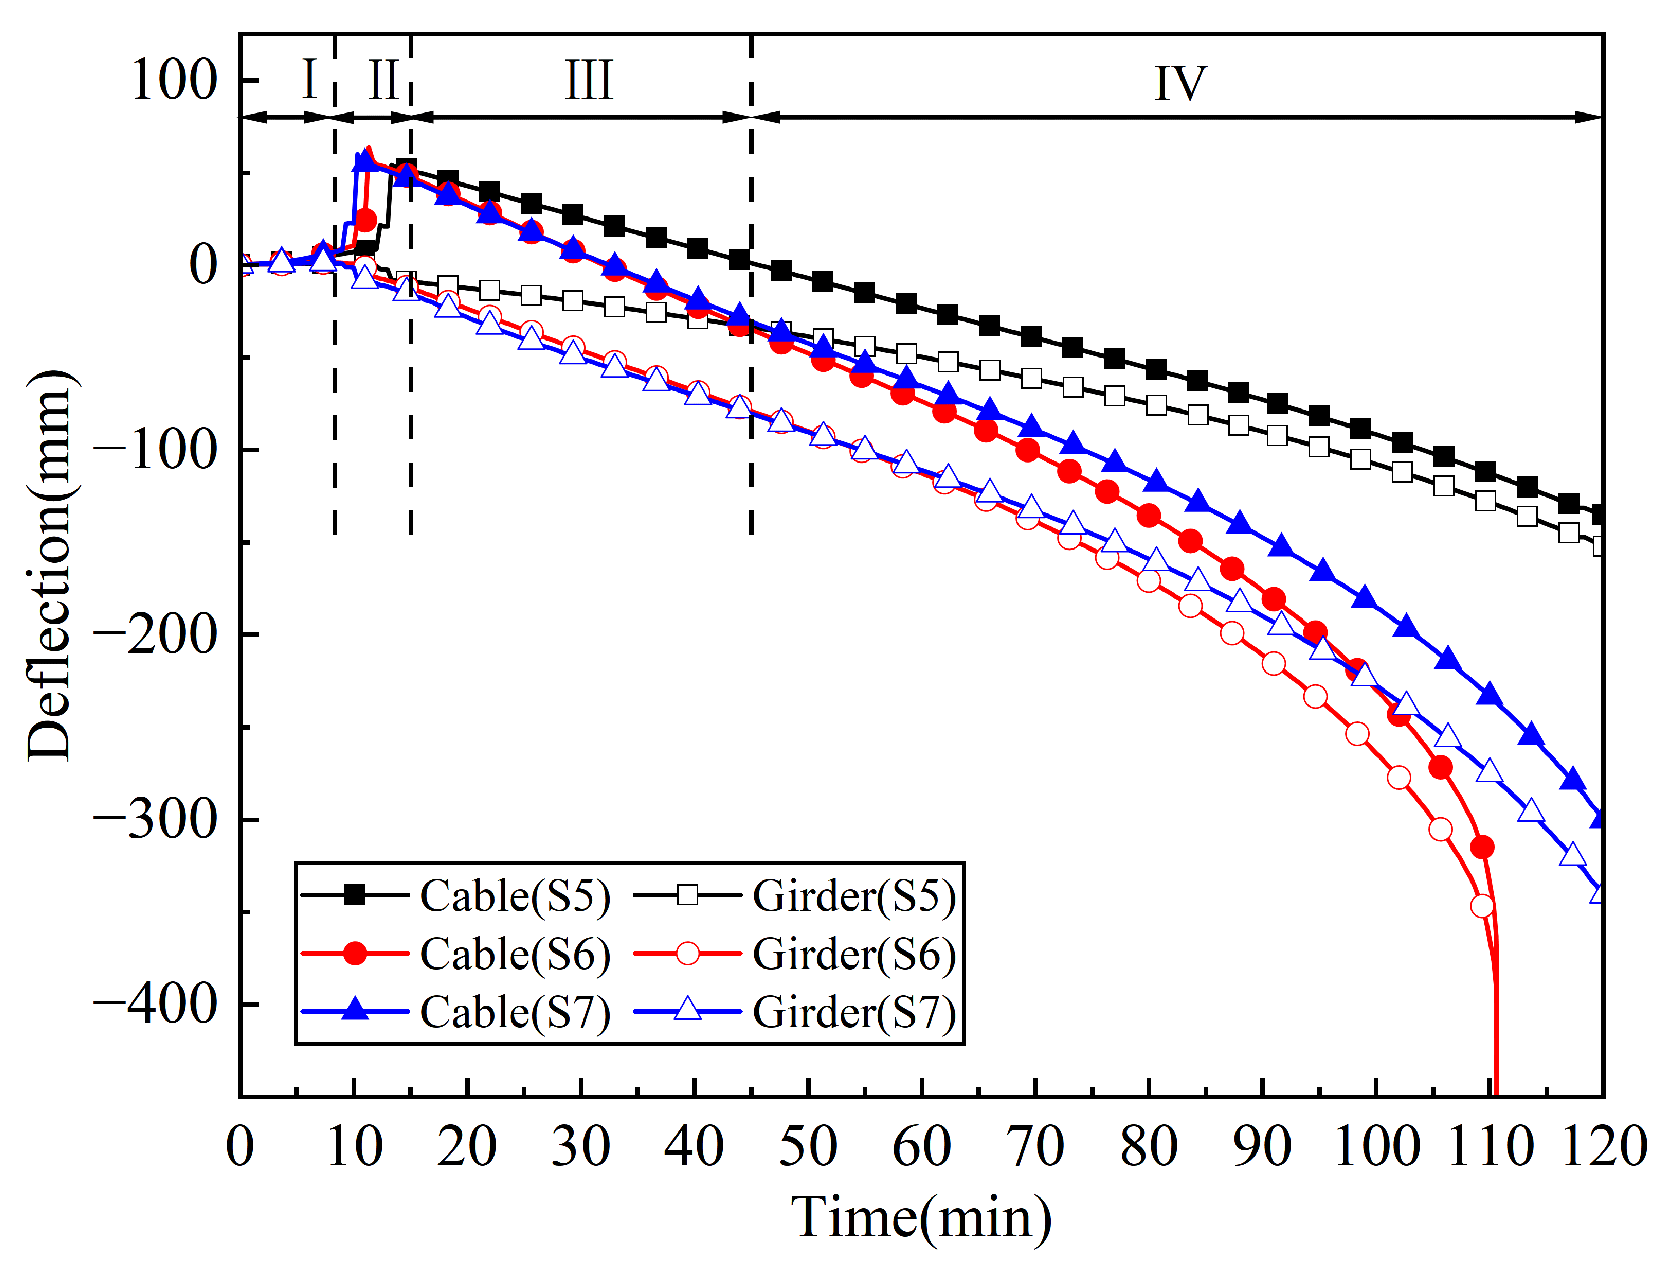
Deflection evolutions in the main cables and main girders under different wind speeds are presented in Figure 27. As wind speed increases, the time to hanger rupture decreases. The hanger rupture that occurred at 12 min in S5 is advanced to 10.5 min in S6 and further to 8 min in S7. This is attributed to the leeward tilt of the flames under transverse wind, and the heat received by the main cable and hangers is increased. During stage III and IV, the deflections of the main cable and main girder continue to accelerate. After 120 min of fire exposure, the main cable in S5 exhibits a downward deflection of 189 mm after the initial rebound and 144 mm in the main girder, and those in S7 reach 360 mm and 332 mm. In S6, the entire bridge collapses at 112 min, marking the most severe structural damage.
Figure 27.
Deflection evolution of cables and girders under different wind speeds.
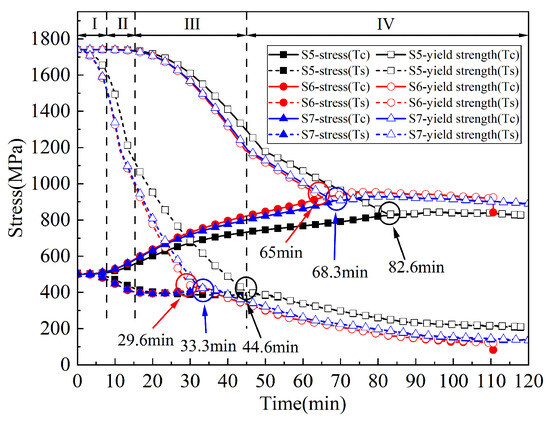
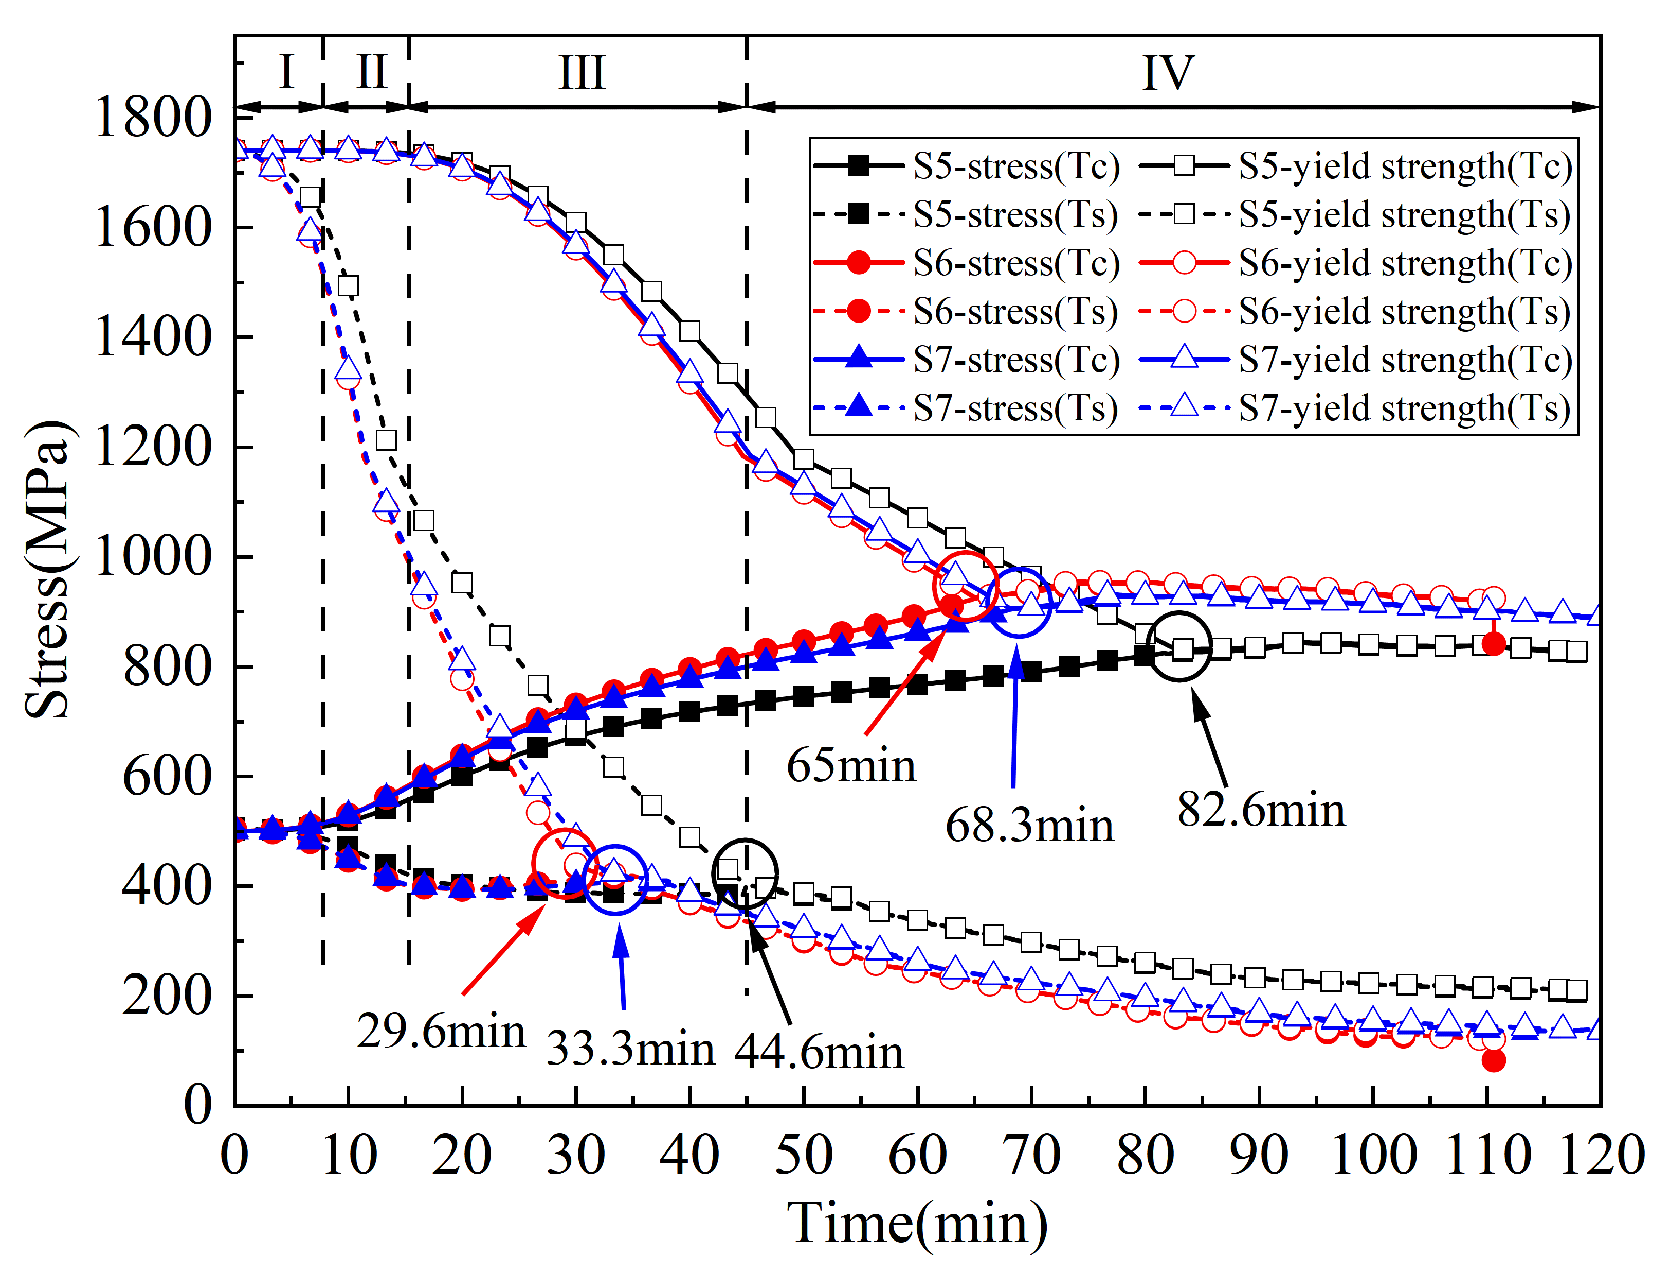
Figure 28 presents the evolution of stress and yield strength in the main cables under varying wind speeds. Specifically, the wind-inclined flame tilt accelerates the degradation of material strength. The surface stress of the main cable reaches the yield strength at 44.6 min in S5, while in S6 and S7, this time is advanced to 29.6 min and 33.3 min. This is attributed to the direct flame impingement on the cable surface under a 3 m/s crosswind, which accelerates the onset of plastic deformation by 40.8% relative to the no-wind case. Plasticity within the cable core develops as early as 65 min in scenario S6. In S5 and S7, it is also advanced to 68.3 min and 82.6 min, respectively. This is because even when the flame passes beneath the main cable at 5 m/s wind speed, there are still substantial hot plumes and smoke enveloping the main cable, keeping it at an elevated temperature.
Figure 28.
Stress and yield strength of main cable under different wind speeds.
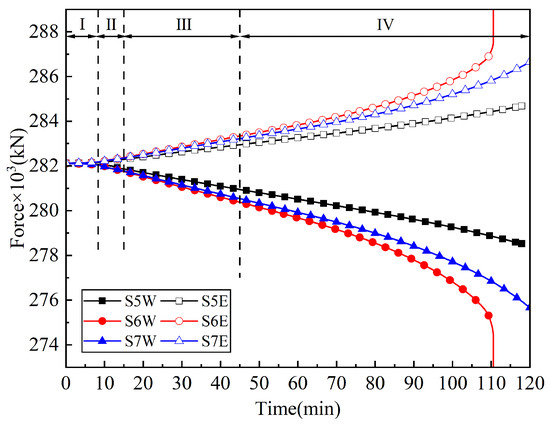
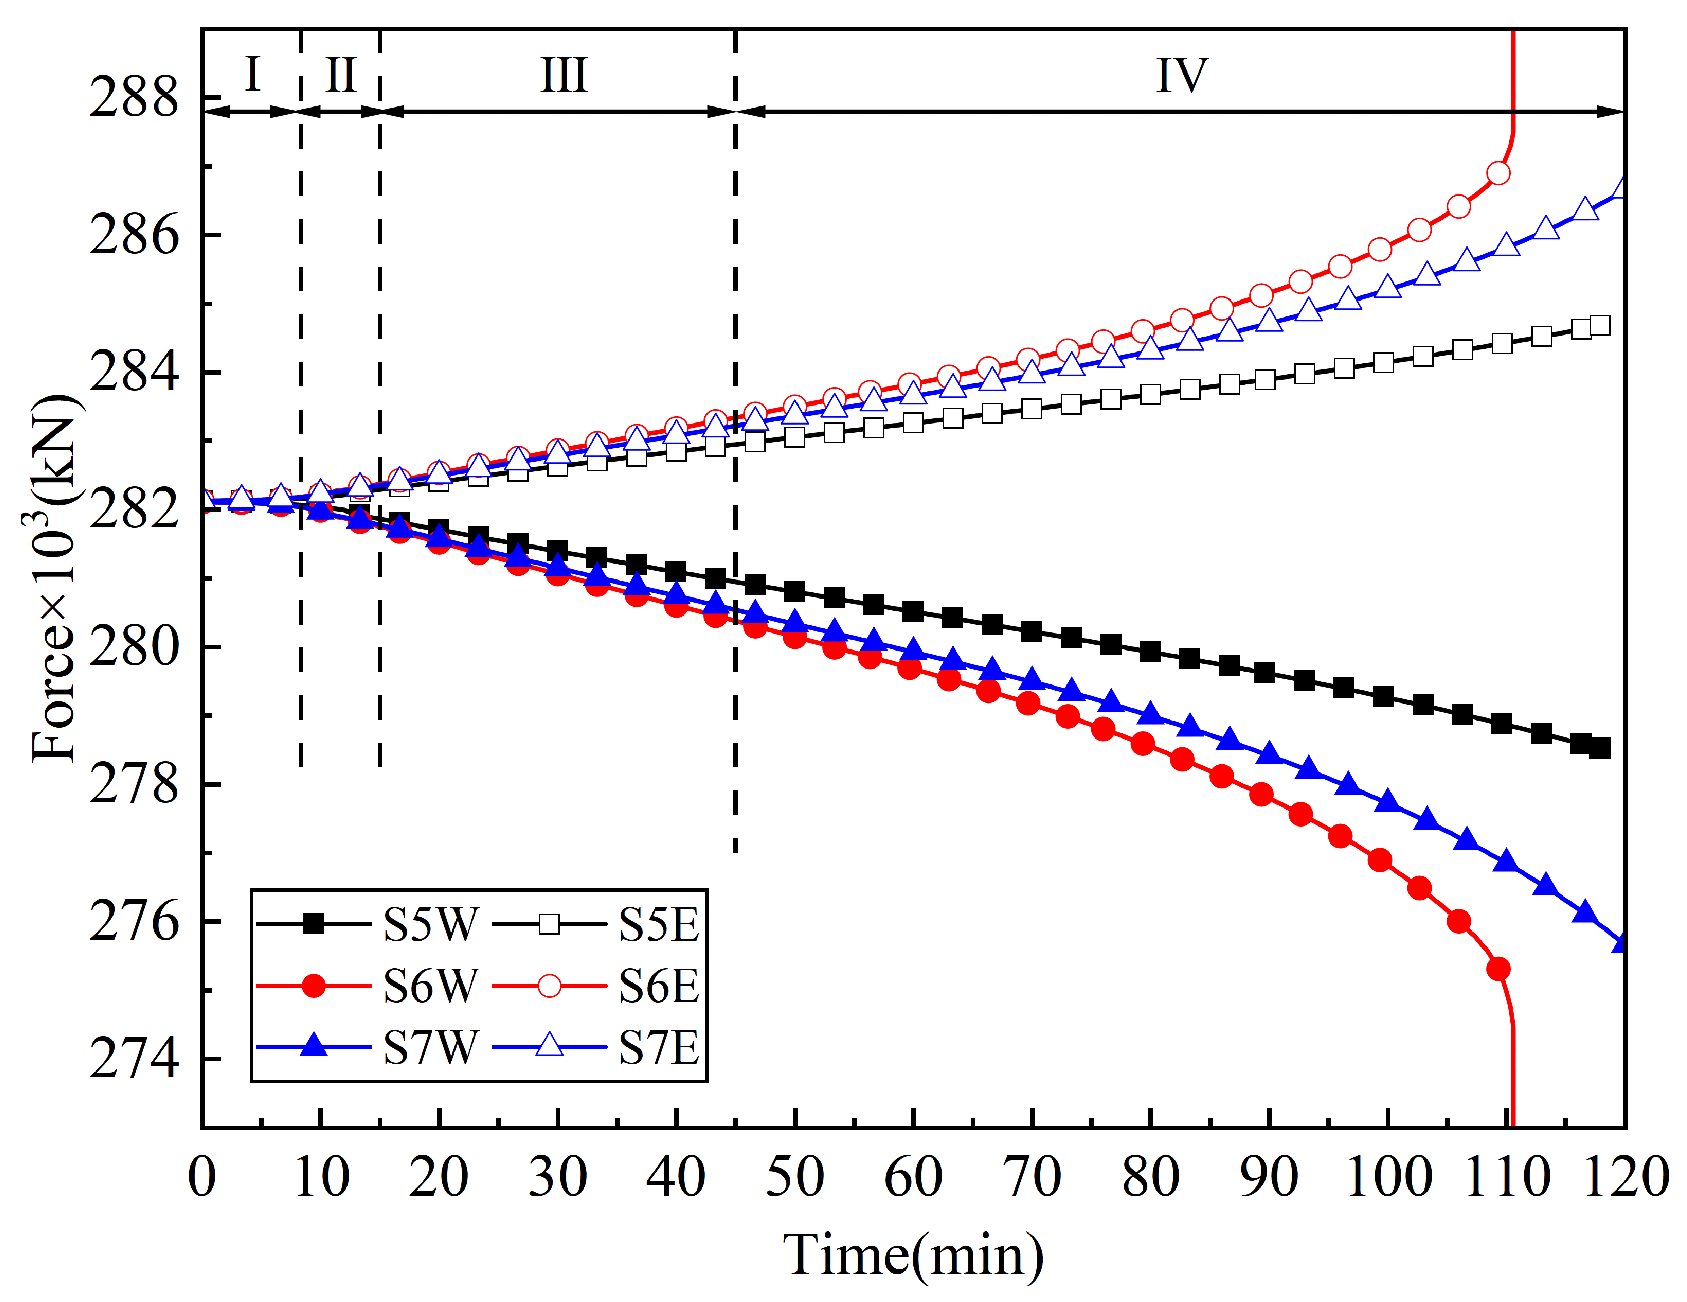
The evolution of axial force in the main cables under different wind speeds is compared, as shown in Figure 29. It is noteworthy that the wind effects amplify the rate of axial-force development of the main cable. During the first two stages of fire exposure, the axial force curves overlap, suggesting that the initial thermal response is dominated by thermal expansion. Beginning in Stage III, the cable forces in S6 and S7 remain in overlap but are redistributed from the west side to the east side at a faster rate than in S5. This stems from the west main cable heating up more rapidly in S6 and S7, resulting in a pronounced thermal expansion effect. In Stage IV, differences in cable force start to appear between S6 and S7. This corresponds to the emergence and expansion of plastic zones in the main cable structure in Figure 28. After 112 min of fire exposure, the cable in S6 can no longer carry the applied load and ruptures, thereby causing the collapse of the entire bridge.
Figure 29.
Evolution of axial forces on main cable at different wind speeds.
3.2.4. Fire Exposure Location
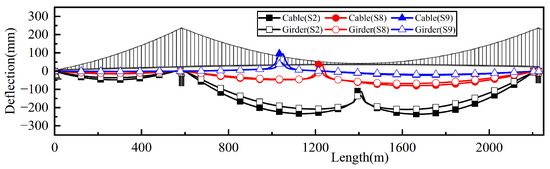
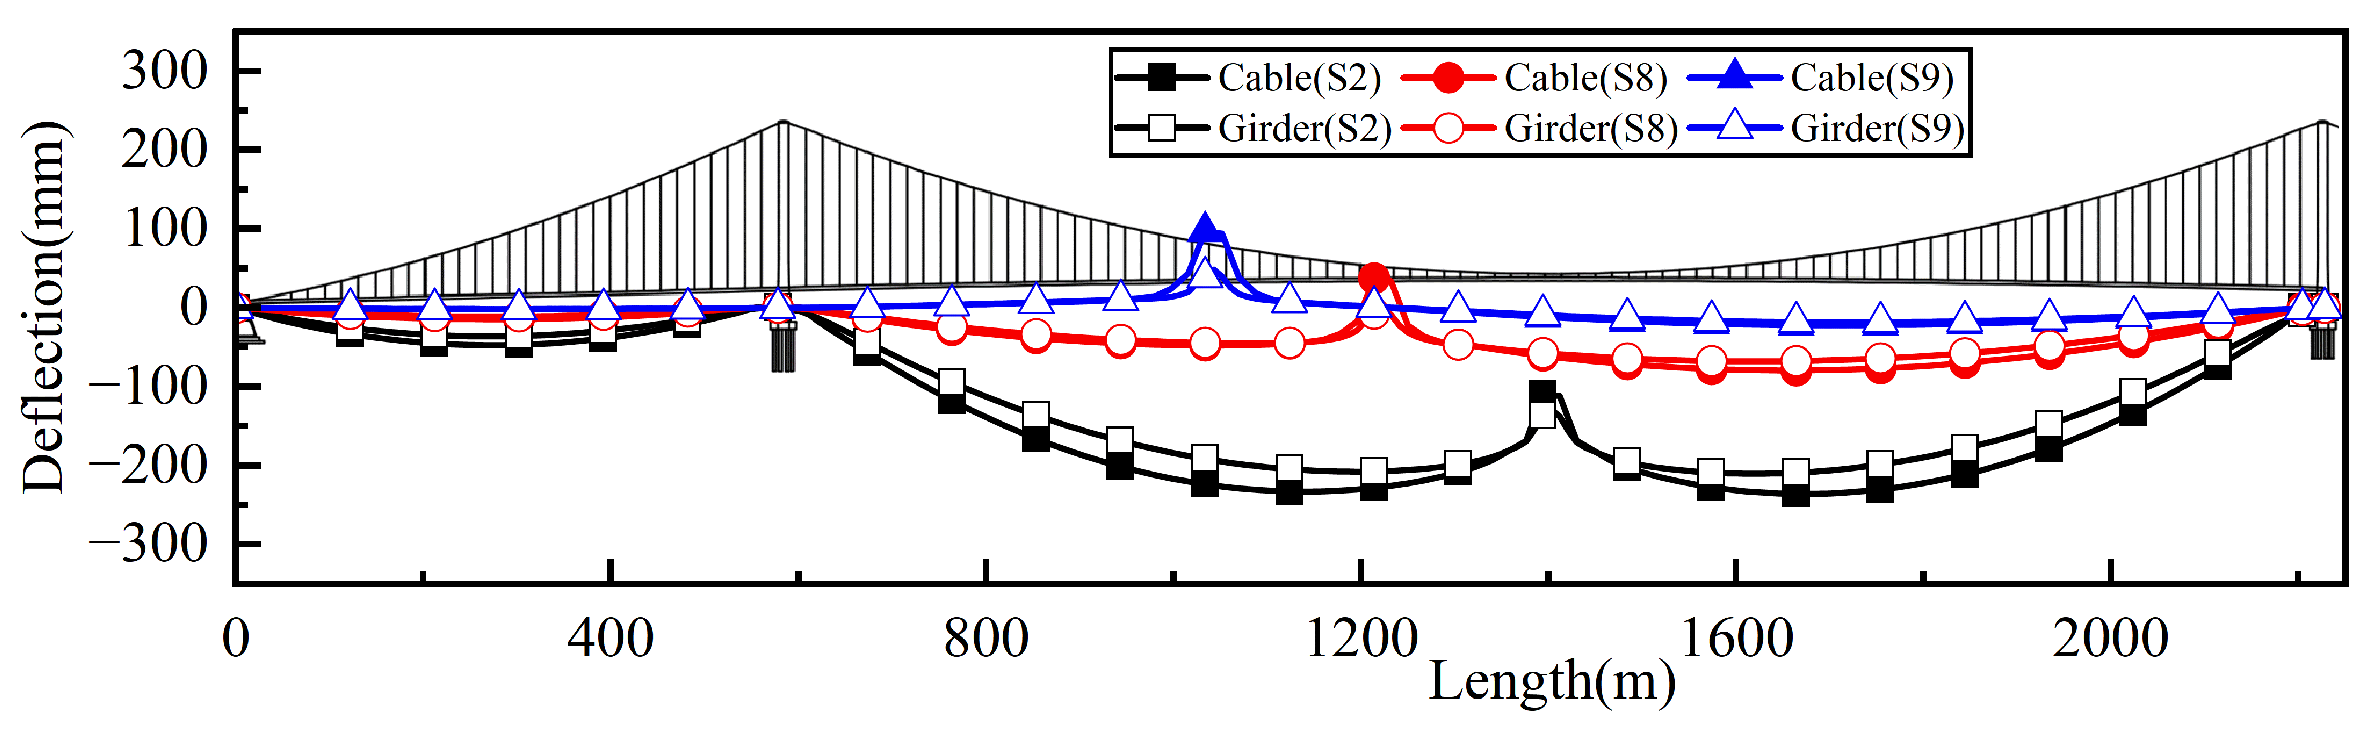
The impact of longitudinal fire exposure location on the fire response of the suspension bridge is investigated by considering three fire scenarios: segment #46 with the cable at 3.6 m (S2), segment #36 with the cable at 12.7 m (S8), and segment #26 with the cable at 41.9 m (S9). Figure 30 shows the deflection of cables and girders at different fire locations after 120 min of fire exposure. As the fire exposure locations move away from the mid-span, the influence of the fire exposure on the deflection of the entire bridge decreases significantly. The maximum deflections of the main girder are outside the fire exposure region, reaching 210 mm (S2), 68 mm (S8), and 18 mm (S9), respectively. But in the fire exposure region, notable upward displacements of the main cable and main girder are observed. Compared to the downward deflection of 129 mm and 109 mm for the main cable and main girder in S2, these components exhibit upward displacement in S8 and S9, reaching 0.6 mm (S8) and 49 mm (S9) for cables and 38 mm (S8) and 97 mm (S9) for girders. The results indicate that the closer the fire location is to the mid-span, the greater the deflections of the main cables and main girder. This is attributed to the lower elevation of the main cables near the mid-span, which leads to more severe fire-induced damage and consequently exerts a significant impact on the overall structural deflection and load-bearing capacity. This underscores the vulnerability of the main cables in the mid-span region under fire conditions.
Figure 30.
Deflection of cables and girders at different fire locations.
Figure 31 illustrates the deflection evolution of the main cables and the main girders at different longitudinal fire locations. In Stage II, the hangers rupture 3 min earlier in S8 than in S2, and the rebound of the main cable increases by 30%. In S9, rupture of the hanger occurs 5 min earlier, with a 67% increase in cable rebound. This can be attributed to the fact that as cable elevation increases, the main cable becomes steeper, which significantly raises the vertical force component. In the subsequent stages, the downward deflection of the main cable in S8 is also smaller than that in S2, reaching only 32 mm. Moreover, no downward deflection is observed in S9. This is attributed to the larger distance between the main cable and the flame zone, which mitigates the effects of thermal expansion and material degradation.
Figure 31.
Deflection evolution of cables and girders at different fire locations.
Figure 32 presents the evolution of stress and yield strength of the main cable exposed to different fire locations. Within the continuous flame zone, the main cable exhibits substantial degradation of material properties, with both its surface and core element yielding within 90 min. In contrast, material degradation in the intermittent flame zone is limited. Although thermal expansion causes structural deformation, the main cable exhibits no plastic yielding even after 120 min of fire exposure.
Figure 32.
Stress and yield strength of main cable exposed to different fire locations.
4. Provision of Failure Assessment Method
The failure of the main cable and hangers is critical to evaluating the collapse of the entire suspension bridge. As the most critical component of the suspension system, the main cable is extremely difficult to repair or replace. Worse still, main-cable rupture results in immediate global collapse. The above analysis indicates that the suspension system can sustain only a small number of hanger ruptures. However, when hanger rupture becomes widespread, the redistributed force from ruptured hangers exceeds the capacity of adjacent hangers, triggering further hanger failures and progressive overall collapse.
4.1. Temperature-Based Assessment in Main Cable
Current design codes commonly establish a critical temperature threshold of 300 °C for the fire protection of main cables [10]. Once the central temperature of the cable exceeds 300 °C, the high-strength steel wires across the entire cross-section experience severe strength degradation. However, the temperature at the center of the cross-section cannot be measured directly in a realistic fire. Therefore, a rapid method is proposed to estimate the center temperature from the ambient and surface temperatures, thereby providing an engineering tool for preliminary failure assessment of the main cable during fire exposure.
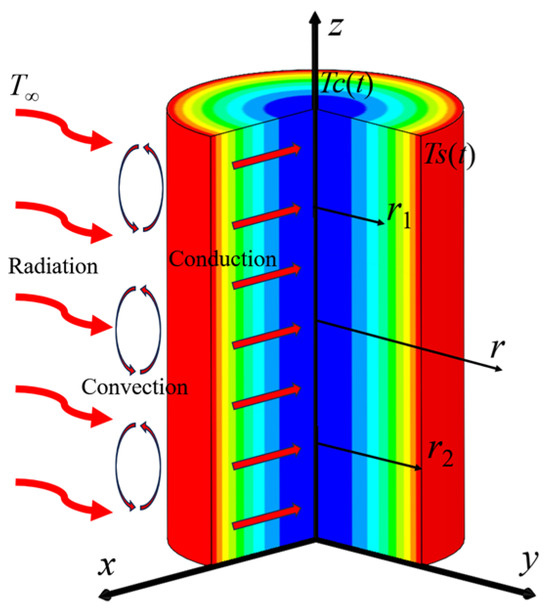
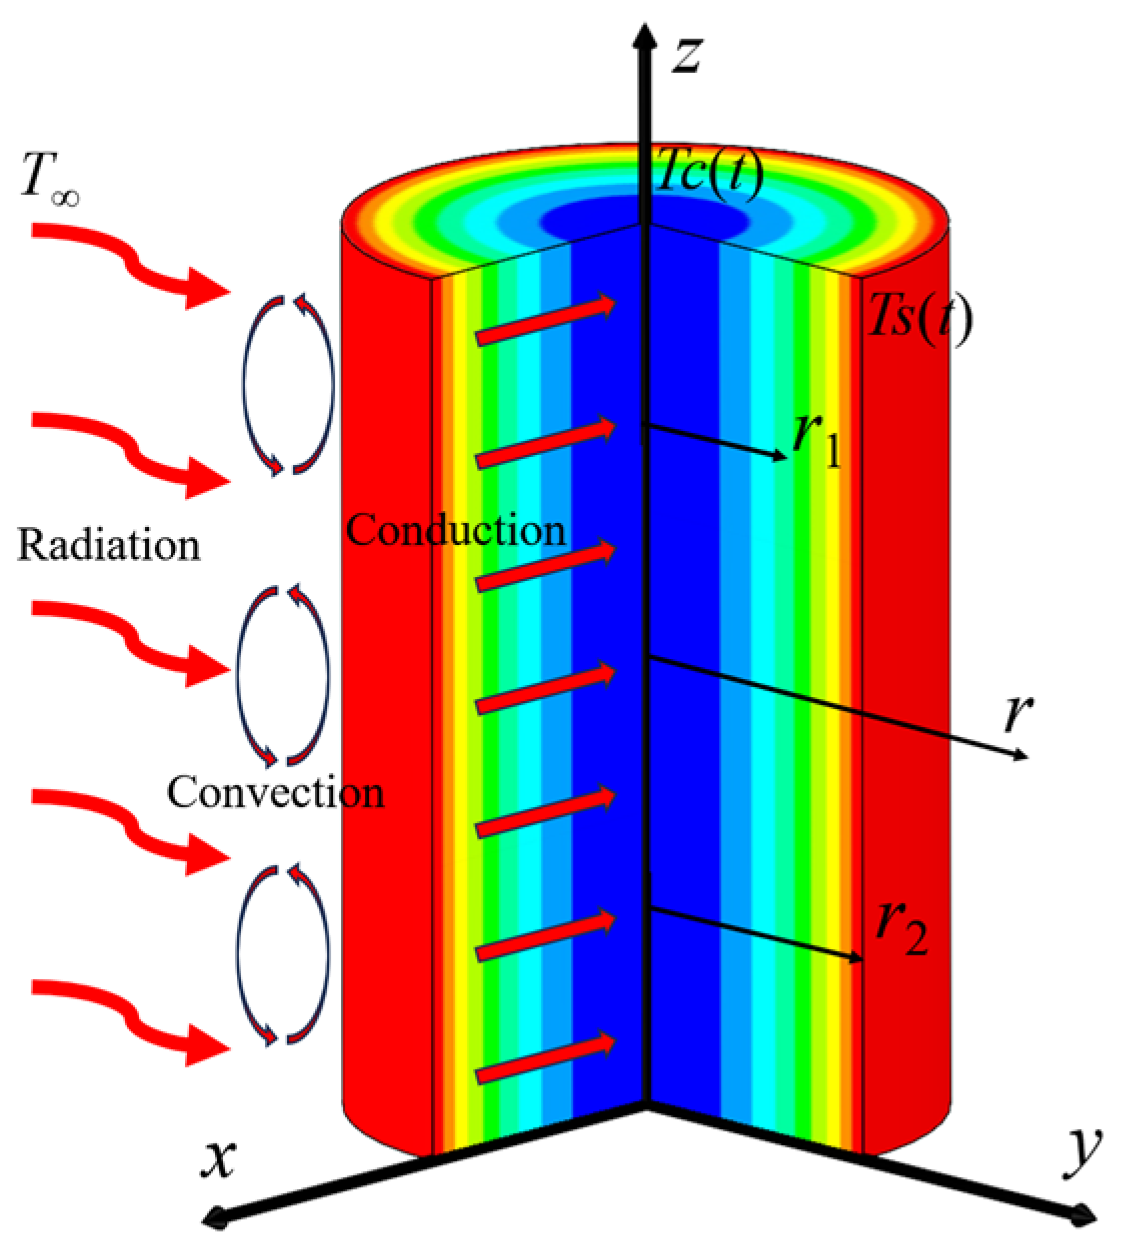
To estimate the time required for the main cable to reach the critical thresholds for fire-induced damage and failure, one-dimensional transient heat-conduction analyses are performed with combined radiative and convective surface heat transfer. Considering the worst-case fire condition, the flame is assumed to be large enough to envelop the cable, and uniform fire exposure boundary conditions are assumed around the main cable. The fire-exposed cable is idealized as a solid cylinder of radius R with an initial temperature T0. Temperature distribution is assumed to be axisymmetric about the cylinder axis, as shown in Figure 33. The one-dimensional transient heat-conduction equation in cylindrical coordinates is given as follows [33]:
Figure 33.
One-dimensional transient cylindrical heat-conduction model.
Equation (2) is solved subject to the initial condition and boundary conditions and , where, T(r,t) is the temperature in the cylinder cross-section, r is the radius, t is the time, α is the thermal diffusivity, λ is the thermal conductivity, ρ is the density, and c is the specific heat capacity [33].
Considering the radiative–convective heat transfer, the boundary condition at the cylindrical surface uses hc for convective coefficient, while radiation is replaced with an equivalent heat-transfer coefficient hr. Thus, the total surface heat-transfer coefficient ht includes both convection and radiation [33]:
In Equation (4), ε denotes the emissivity, σ is the Stefan–Boltzmann constant, Tr is the cylinder surface temperature, and T∞ is the ambient temperature.
During heating, the thermal properties of steel vary markedly with temperature. To ensure accurate prediction of thermal behavior under fire exposure, it is necessary to calculate the average thermal conductivity and average specific heat capacity during the heating process. Thermal conductivity is treated as nearly linear, so a representative value at the midpoint temperature is used. By contrast, specific heat shows pronounced nonlinearity, and an interval enthalpy average is adopted to preserve energy consistency throughout the analysis [33].
When Fo exceeds 0.2, the analytical solution admits the following approximation expression [34]:
In Equation (5), θ is the excess temperature (), η is the dimensionless radius (), Fo is the Fourier number (), Bi is the Biot number based on R (), μ1 is the first eigenvalue, namely the smallest positive root of the transcendental equation [34]. The approximate fitted expressions for μ1, J0(r) and J1(r) are given as follows [34]:
Setting r = 0 for the center and r = R for the surface, the formulas become:
Dividing Equation (9) by Equation (10) yields:
In Equation (11), Ts(t) = T(1,t), Tc(t) = T(0,t), then:
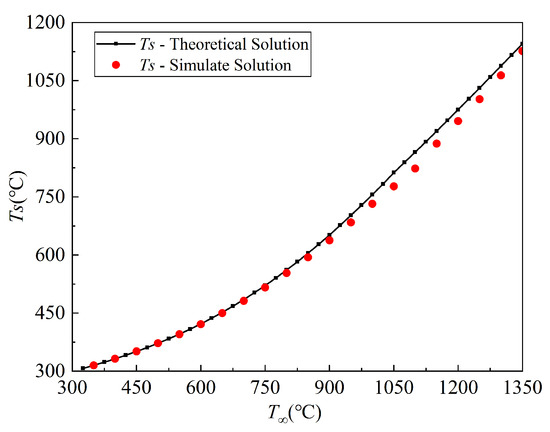
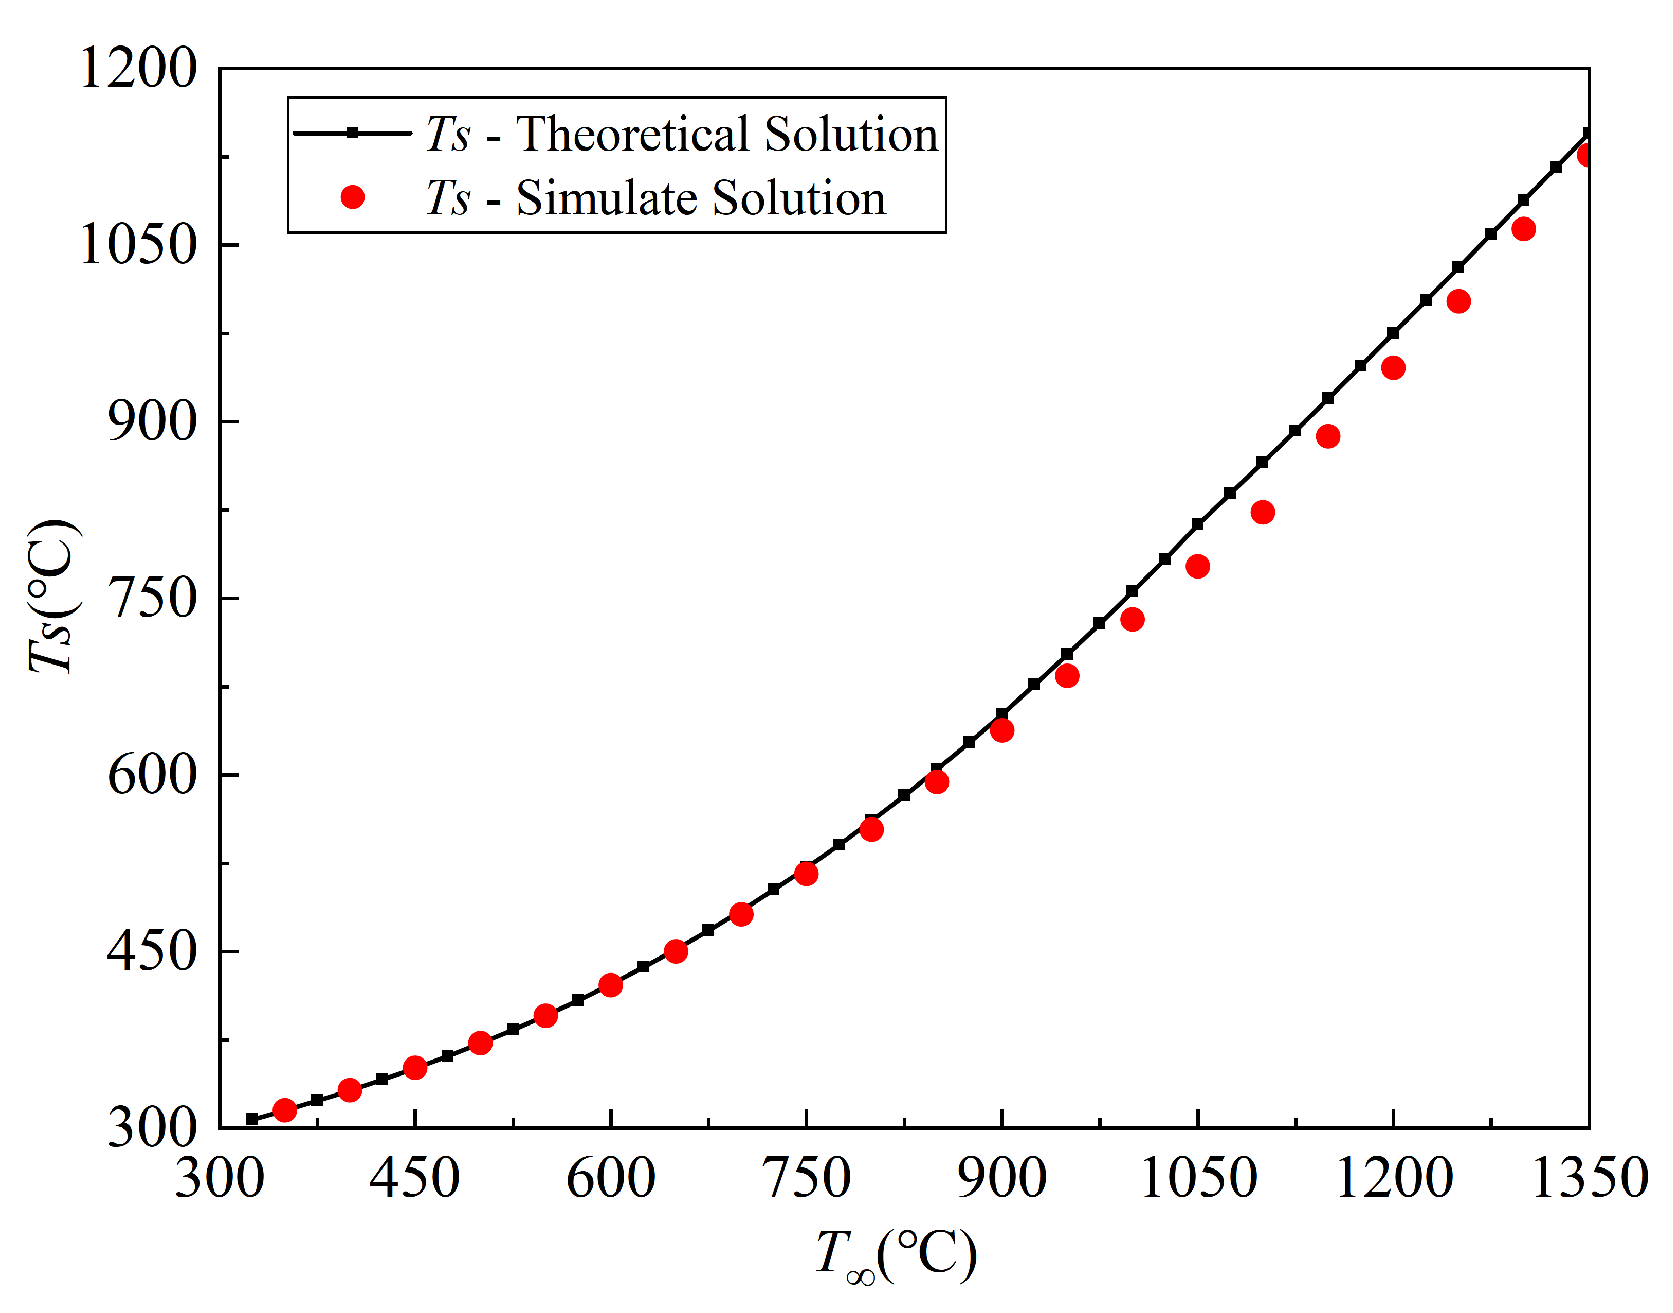
An explicit relation for Tc(t) in terms of Ts(t) and T∞ is obtained. Thus, once the surface temperature and the ambient temperature are known, the center temperature can be determined. Figure 34 plots the surface temperature required for the cylinder center to reach 300 °C, which is validated by numerical simulations. This figure serves as a rapid assessment, supporting early prediction of main-cable failure by comparing surface temperature and ambient temperature.
Figure 34.
Surface–ambient fire temperature correspondence chart at main-cable failure.
Similarly, with the known surface temperature and ambient temperature of the main cable, the fire-resistance time of the main cable can be further derived. Applying Equations (9) and (10) yields:
Subtracting these two expressions gives:
From Equation (13), it follows that:
Then, substitute Equation (15) into Equation (16) to obtain:
From Equation (17), Fo is calculated as:
Moreover, using , the fire-resistance time t is given by:
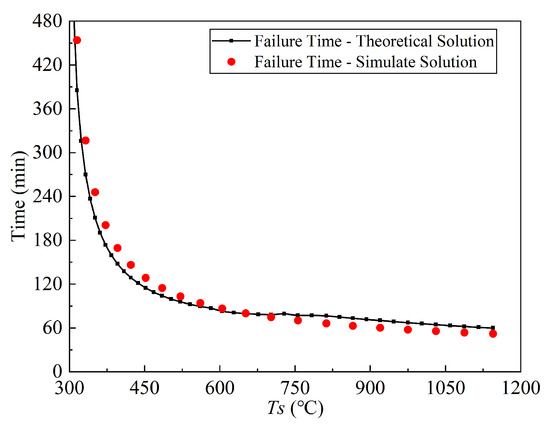
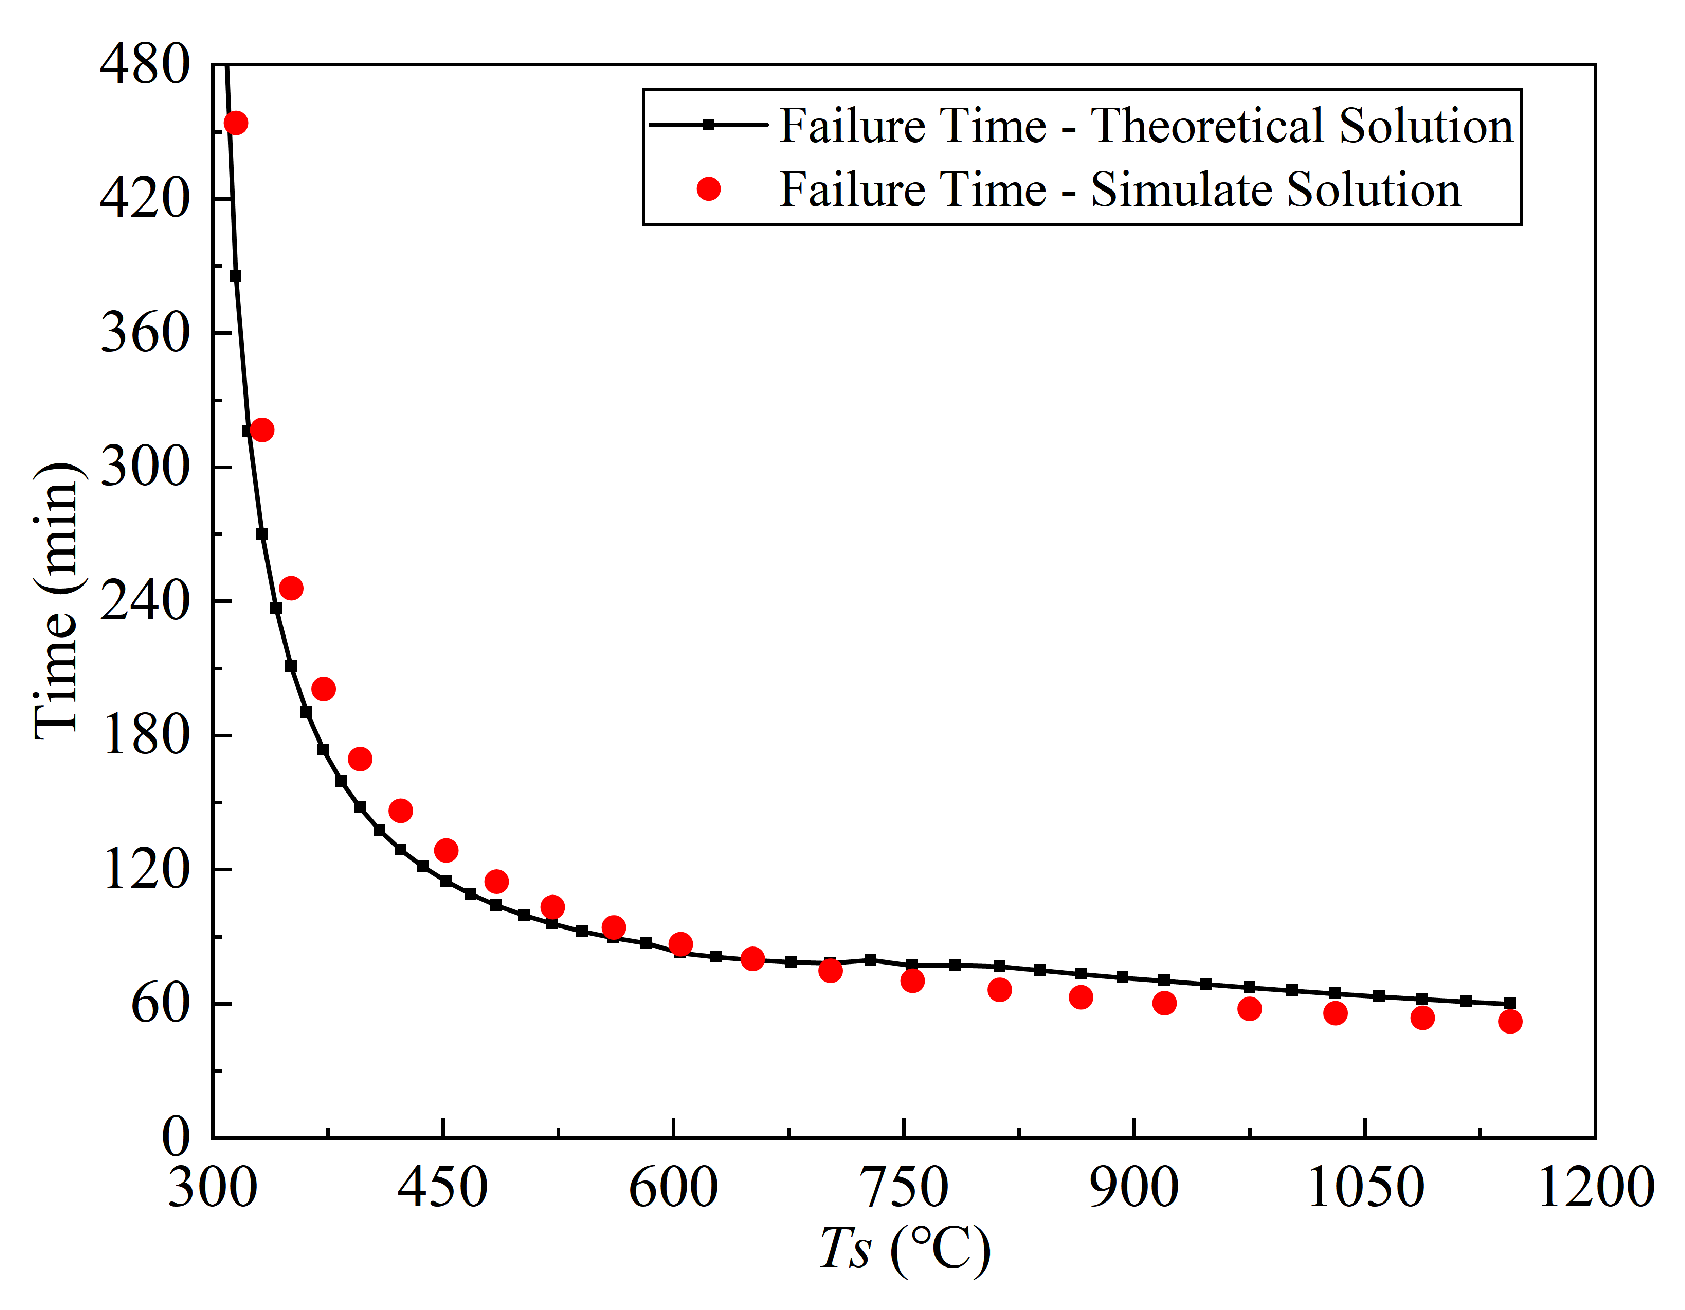
The time for Tc(t) to reach 300 °C under various prescribed surface temperatures is obtained, as shown in Figure 35. Numerical simulations confirm excellent agreement with the theoretical predictions. By comparing the Ts(t) and T∞ from Figure 34, the center temperature Tc(t) and corresponding failure time can be determined rapidly.
Figure 35.
Main cable failure time under different surface temperatures.
For comparative validation through collapse scenario (S6) and theoretical condition (T∞ = 850 °C), Tc(S6) of the main cable reaches 300 °C at 94 min, while Ts(S6) is 654 °C. By contrast, the theoretical prediction indicates that under 850 °C fire exposure, when Tc(t) reaches 300 °C, Ts(t) is 605 °C, and the corresponding fire-resistance time is 83 min. The deviations are 7.5% in Ts(t) and 11.7% in failure time to 300 °C, respectively. Given the transient growth phase required for the oil-tanker-truck fire to reach HRRPUAMAX, this level of accuracy is acceptable and ensures a conservative safety margin.
It should be noted that this temperature-based failure assessment method is mainly intended to provide a practical and conservative fire-safety estimate for the main cable under severe fire exposure. The applicability depends on the validity of equivalent uniform-heating and axisymmetric heat-conduction assumptions. In realistic bridge fires, wind direction, flame location, and shielding effects between structural components may result in non-uniform circumferential heating. Therefore, when a more accurate fire-resistance limit of the main cable is required, this method can provide a preliminary warning basis for subsequent refined three-dimensional thermal analysis.
4.2. Force-Based Assessment in Hanger
Hangers in a suspension bridge should be designed with adequate safety redundancy. As illustrated in Figure 20, when hangers rupture, the force is usually redistributed by adjacent hangers. Even so, this redistribution of forces has limitations. According to Eurocode 3 [35], the minimum breaking force (Fmin) of tension components should be determined:
where K is the minimum breaking force factor taking account of the spinning loss (K = 0.346), d is the nominal diameter of the rope in mm (d = 60 mm), and Rr is the rope grade in N/mm2 (Rr = 1770 N/mm2).
The minimum breaking force (Fmin) calculated is equal to 2200 kN. By calculating the ratio of minimum breaking force (Fmin) to the maximum hanger force (Fmax), the safety factor (γ) can be obtained:
According to the actual bridge design drawings and China code [32], it is required that the safety factor of the straddle-type hanger exceed 4.0. When replacing the hanger, the safety factor should be above 2.5. The safety factors γ of adjacent hangers, calculated after hanger rupture under the above conditions, are listed in Table 2.
Table 2.
Summary of safety factors for hangers.
When more than two hangers on one cable plane have ruptured, the safety factor γ drops below 2.5. In this condition, temporary anchorage is required before hanger replacement with auxiliary hangers. Once the number of ruptured hangers exceeds seven, γ falls below 1.0. And the adjacent hangers cannot sustain the redistributed force, thereby leading to progressive collapse of the suspension bridge. Accordingly, the force-based failure assessment for the hanger is proposed as follows: the system is deemed to have failed when multiple hangers reach γ below 1.0 and a hanger-failure cascade initiates and propagates. Notably, the proposed force-based failure assessment lies in the safety-factor-based evaluation framework using γ, rather than in a fixed number of ruptured hangers. For different suspension bridges, the critical number of ruptured hangers that may trigger progressive collapse depends on multiple factors, including hanger size, structural layout and load level.
5. Conclusions
The impact of fire exposure length and location, affected by wind speed, on fire response and failure evolution of a suspension bridge was evaluated utilizing validated coupled CFD-FE models. Temperature distribution, deflection progression, and force evolution in suspension bridges are investigated. Further, failure assessment methods based on main cables and hangers are established. Based on the results of the analysis, the following conclusions can be drawn:
(1) Localized fire exposure results in pronounced thermal nonuniformity. The main cable at mid-span is directly exposed to the continuous flame zone, with a surface temperature of 573 °C. Further, the surface temperature can reach 707 °C under a 3 m/s wind. The large diameter produces a strong radial temperature gradient, with inner–outer differences reaching 380 °C.
(2) The fire-induced failure evolves through four stages. Initially, the exposed hangers undergo thermal elongation until rupture, which leads to a redistribution of forces and an upward deflection of the main cable. As fire progresses, thermal expansion and material degradation of the main cable cause a gradual downward deflection in girder segments. This process culminates in the global collapse of the bridge, triggered by the rupture of the main cable.
(3) Increasing fire exposure length leads to consecutive hanger ruptures, thereby inducing a step-like rebound of the main cable and downward deflection of the main girder. The loss of vertical support due to hanger failure, together with the enlarged material degradation zone induced by the increased fire exposure length, significantly increases the magnitude and rate of deflection in the entire bridge.
(4) Transverse wind changes the fire intensity and spatial distribution of flame on the main cable and hangers. Increasing wind speed intensifies flame tilt, leading to direct flame impingement on hangers and thereby inducing earlier hanger rupture. At a wind speed of 3 m/s, the mid-span main cable is fully engulfed by tilted flame, leading to progressive failure and eventual collapse of the entire suspension bridge.
(5) The proposed temperature-based assessment method overcomes the practical difficulty of directly measuring the center temperature of the main cable cross-section in realistic fire scenarios. Results indicate that a main cable exposed to an 850 °C fire maintains load-carrying capacity during the initial 90 min, with failure occurring when surface temperature reaches 600 °C.
(6) The axial force released by ruptured hangers is sequentially redistributed to adjacent intact hangers. The resulting overload on these hangers triggers a progressive fracture. The collapse of the suspension bridge can be evaluated once consecutive hanger failures exceed a critical threshold of seven.
(7) This study mainly investigates the global structural response of suspension bridges, with main cables, hangers and girders considered as key components. The fire performance of local connection details, such as cable clamp and hanger anchorage, has not been examined. The fire behavior of steel wires inside the main cable and hangers requires further investigation.
Author Contributions
Methodology, Z.L. and G.Z.; validation, Z.L. and Y.D.; formal analysis, Z.L., X.X. and F.X.; writing—original draft, Z.L. and Y.D.; writing—review and editing, Z.L., G.Z. and M.L. All authors have read and agreed to the published version of the manuscript.
Funding
This research was funded by the National Natural Science Foundation of China (Grant No. 52378476) and the Fundamental Research Funds for the Central Universities (Grant No. 300102214401, 300102214903, 300102215711).
Data Availability Statement
The original contributions presented in this study are included in the article. Further inquiries can be directed to the corresponding authors.
Conflicts of Interest
The authors declare no conflicts of interest.
References
- Zhang, G.; Zhao, X.; Lu, Z.; Song, C.; Li, X.; Tang, C. Review and Discussion on Fire Behavior of Bridge Girders. J. Traffic Transp. Eng. (Engl. Ed.) 2022, 9, 422–446. [Google Scholar] [CrossRef] [Scilit]
- Huang, P.; Li, C. Review of the Main Cable Shape Control of the Suspension Bridge. Appl. Sci. 2023, 13, 3106. [Google Scholar] [CrossRef] [Scilit]
- Liu, Z.; Li, G.; Paya-Zaforteza, I.; Cai, C.S.; Huang, Q. Fire Hazards in Bridges: State of the Art, Recent Progress, and Current Research Gaps. J. Bridge Eng. 2023, 28, 03123003. [Google Scholar] [CrossRef] [Scilit]
- Selamet, S.; Ozer, A.Y.; Ildan, K.B. Experimental Study on the Fire Performance of Prestressed Steel Parallel Wire Strands. Eng. Struct. 2023, 280, 115709. [Google Scholar] [CrossRef] [Scilit]
- Kragh, E.; Narasimhan, H.; Jensen, J.L. Fire Protection of Bridge Cables. Struct. Eng. Int. 2020, 30, 530–533. [Google Scholar] [CrossRef] [Scilit]
- Southern Metropolis Daily. Truck Fire on the Shenzhen–Zhongshan Link: Official Notice States No Impact on Main Cables or Other Primary Load-Bearing Members. ZSNews, 25 October 2024. Available online: https://www.zsnews.cn/news/index/view/cateid/37/id/739398.html (accessed on 25 October 2024).
- Zhang, G.; Li, X.; Tang, C.; Song, C.; Yuan, Z. Experimental and Evolution Mechanism for Fire Resistance of Continuous Steel Box Girders. China J. Highw. Transp. 2023, 36, 58–70. [Google Scholar] [CrossRef]
- Zhao, X.; Zhang, G.; Tang, C.; Wang, S.; Lu, Z. Evaluating Fire Performance of through Continuous Composite Steel Warren-Truss Bridge Girders: Experimental and Numerical Investigation. Eng. Struct. 2025, 326, 119591. [Google Scholar] [CrossRef] [Scilit]
- Song, C.; Zhang, G.; Li, X.; Kodur, V. Experimental and Numerical Study on Failure Mechanism of Steel-Concrete Composite Bridge Girders under Fuel Fire Exposure. Eng. Struct. 2021, 247, 113230. [Google Scholar] [CrossRef] [Scilit]
- Chen, W.; Chen, X.; Shen, R.; Qi, D.; Li, Z. Fire resistance analysis and protection measures for cable components of suspension bridges. J. Constr. Steel Res. 2024, 220, 108852. [Google Scholar] [CrossRef] [Scilit]
- Robinson, J.; Brugger, A.; Sloane, M.; Betti, R. Experimental–Numerical Determination of the Effective Bulk Thermal Conductivity of Suspension Bridge Main Cables. J. Bridge Eng. 2022, 27, 04022120. [Google Scholar] [CrossRef] [Scilit]
- Alos-Moya, J.; Paya-Zaforteza, I.; Hospitaler, A.; Rinaudo, P. Valencia Bridge Fire Tests: Experimental Study of a Composite Bridge under Fire. J. Constr. Steel Res. 2017, 138, 538–554. [Google Scholar] [CrossRef] [Scilit]
- Ge, S.; Ni, Y.; Zhou, F.; Shen, W.; Li, J.; Guo, F.; Shi, B. Experimental Study of the Temperature Characteristics of the Main Cables and Slings in Suspension Bridge Fires. Int. J. Heat Mass Transf. 2024, 220, 124939. [Google Scholar] [CrossRef] [Scilit]
- Alos-Moya, J.; Paya-Zaforteza, I.; Hospitaler, A.; Loma-Ossorio, E. Valencia Bridge Fire Tests: Validation of Simplified and Advanced Numerical Approaches to Model Bridge Fire Scenarios. Adv. Eng. Softw. 2019, 128, 55–68. [Google Scholar] [CrossRef] [Scilit]
- Xu, C.; Liu, Z. Coupled CFD-FEM Simulation of Steel Box Bridge Exposed to Fire. Adv. Civ. Eng. 2022, 2022, 5889743. [Google Scholar] [CrossRef] [Scilit]
- Yu, M.; Chen, Q.; Yao, X.; Guo, X.; Hao, T.; Wang, H. High-Temperature Properties of a Long-Span Double-Deck Suspension Bridge under a Tanker Fire. Adv. Civ. Eng. 2021, 2021, 2631346. [Google Scholar] [CrossRef] [Scilit]
- Gong, X.; Agrawal, A.K. Safety of Cable-Supported Bridges during Fire Hazards. J. Bridge Eng. 2016, 21, 04015082. [Google Scholar] [CrossRef] [Scilit]
- Cui, C.; Chen, A.; Ma, R. Stability Assessment of a Suspension Bridge Considering the Tanker Fire Nearby Steel-Pylon. J. Constr. Steel Res. 2020, 172, 106186. [Google Scholar] [CrossRef] [Scilit]
- Okur, E.K.; Okur, F.Y.; Altunişik, A.C.; Günaydin, M.; Adanur, S. Progressive Collapse Assessment of Osmangazi Suspension Bridge Due to Sudden Hanger Breakage under Different Loading Conditions. Eng. Fail. Anal. 2023, 149, 107269. [Google Scholar] [CrossRef] [Scilit]
- Liu, Z.; Silva, J.C.G.; Huang, Q.; Hasemi, Y.; Huang, Y.; Guo, Z. Coupled CFD–FEM Simulation Methodology for Fire-Exposed Bridges. J. Bridge Eng. 2021, 26, 04021074. [Google Scholar] [CrossRef] [Scilit]
- McGrattan, K.; McDermott, R.; Vanella, M.; Hostikka, S.; Floyd, J. Fire Dynamics Simulator User’s Guide; National Institute of Standards and Technology: Gaithersburg, MD, USA, 2021; NIST SP 1019.
- Zhao, X.; Zhang, G.; Ding, Y.; Lu, Z.; Wang, S. An Approach for Predicting Fire Response of Steel Truss-Concrete Composite Bridge Girders Subjected to Semi-Open Fires. Eng. Struct. 2025, 335, 120390. [Google Scholar] [CrossRef] [Scilit]
- McGrattan, K.B.; Baum, H.R.; Hamins, A. Thermal Radiation from Large Pool Fires; National Institute of Standards and Technology: Gaithersburg, MD, USA, 2000; NIST IR 6546.
- Statens Havarikommisjon for Transport. Report on Fire in Tank Trailer in the Skatestraum Tunnel in Sogn og Fjordane, 15 July 2015 (Vei Report 2016/05); Statens Havarikommisjon for Transport: Lillestrøm, Norway, 2016; Available online: https://havarikommisjonen.no/Vei/Avgitte-rapporter/2016-05-eng (accessed on 15 April 2026).
- Ingason, H. Design Fire Curves for Tunnels. Fire Saf. J. 2009, 44, 259–265. [Google Scholar] [CrossRef] [Scilit]
- Ingason, H.; Li, Y.Z. Spilled Liquid Fires in Tunnels. Fire Saf. J. 2017, 91, 399–406. [Google Scholar] [CrossRef] [Scilit]
- Zhang, Z.; Xu, Y.; Wen, J.; Deng, W.; Ye, J.; Chen, W.; Li, Y.; Ni, Y. Experimental and Numerical Simulation Analysis of Fire-Induced Thermal Fields in Suspension Bridges Based on Similarity Theory. China J. Highw. Transp. 2025, 38, 284–294. [Google Scholar] [CrossRef]
- BS EN 1992-1-2:2004; Eurocode 2: Design of Concrete Structures. Part 1-2: General Rules. Structural Fire Design. BSI Standards Limited: London, UK, 2005.
- BS EN 1993-1-2:2005; Eurocode 3: Design of Steel Structures. Part 1-2: General Rules Structural Fire Design. BSI Standards Limited: London, UK, 2005.
- BS EN 1991-1-2:2002; Eurocode 1: Actions on Structures-Part 1-2: General Actions. Actions on Structures Exposed to Fire. BSI Standards Limited: London, UK, 2002.
- Transportation Research Board; National Academies of Sciences, Engineering, and Medicine. Highway Capacity Manual, 7th ed.; National Academies Press: Washington, DC, USA, 2022. [Google Scholar]
- JTG D60-2015; General Specifications for Design of Highway Bridges and Culverts. Ministry of Transport of the People’s Republic of China: Beijing, China, 2015.
- Bergman, T.L.; Lavine, A.S.; Incropera, F.P.; DeWitt, D.P. Fundamentals of Heat and Mass Transfer, 8th ed.; John Wiley & Sons: Hoboken, NJ, USA, 2017. [Google Scholar]
- Campo, A. Rapid Determination of Spatio-Temporal Temperatures and Heat Transfer in Simple Bodies Cooled by Convection: Usage of Calculators in Lieu of Heisler-Gröber Charts. Int. Commun. Heat Mass Transf. 1997, 24, 553–564. [Google Scholar] [CrossRef] [Scilit]
- BS EN 1993-1-11:2006; Eurocode 3: Design of Steel Structures. Part 1-11: Design of Structures with Tension Components. BSI Standards Limited: London, UK, 2006.

Disclaimer/Publisher’s Note: The statements, opinions and data contained in all publications are solely those of the individual author(s) and contributor(s) and not of MDPI and/or the editor(s). MDPI and/or the editor(s) disclaim responsibility for any injury to people or property resulting from any ideas, methods, instructions or products referred to in the content. |
© 2026 by the authors. Licensee MDPI, Basel, Switzerland. This article is an open access article distributed under the terms and conditions of the Creative Commons Attribution (CC BY) license.