Article

Coupled Thermo-Mechanical Modelling of Early-Age Interlayer Degradation in 3D-Printed Concrete

by
Joseph Osamwonyi Ediae
School of Engineering and the Built Environment, Anglia Ruskin University, Bishop Hall Lane, Chelmsford CM1 1SQ, UK
Buildings 2026, 16(11), 2148; https://doi.org/10.3390/buildings16112148
Submission received: 23 April 2026 / Revised: 22 May 2026 / Accepted: 22 May 2026 / Published: 27 May 2026
(This article belongs to the Section Building Materials, and Repair & Renovation)

Abstract

This study presents a coupled numerical–experimental investigation into the early-age thermo-mechanical behaviour of 3D-printed concrete (3DPC), with particular emphasis on strength development, interlayer bonding, and thermally induced cracking that govern structural buildability and performance. A coupled multiphysics modelling framework was developed in COMSOL Multiphysics by integrating hydration kinetics, maturity theory, thermo-mechanical coupling, and a cohesive-zone-based interlayer damage formulation through user-defined time-dependent constitutive relationships and domain activation functions. The model simulated the temporal evolution of temperature, stiffness, stress development, and interlayer degradation during the early-age printing process. The model simulates the temporal evolution of temperature, stiffness, and interlayer damage and was validated against experimental results from compression, interlayer bond, and fracture tests conducted under varying printing time gaps and curing temperatures. The results demonstrate that increasing interlayer deposition intervals up to 60 min leads to reductions of approximately 38% in interlayer bond strength and a significant reduction in apparent compressive strength exceeding 80% between 0 and 60 min deposition delay. It should be noted that this reduction primarily reflects interlayer-dominated failure and loss of structural continuity rather than intrinsic degradation of the bulk cementitious matrix, primarily due to hydration discontinuity, moisture loss, and progressive substrate stiffening. Elevated curing temperatures further intensify thermal gradients, resulting in higher residual stresses and increased crack susceptibility at interlayer interfaces. The numerical predictions showed good agreement with the experimental responses, with peak-force prediction errors below 5% and RMSE values of approximately 0.30–0.45 kN along the post-peak softening, confirming the reliability of the proposed modelling approach. The findings highlight the critical importance of printing continuity and thermal control in governing early-age structural performance and provide quantitative guidance for optimising process parameters in extrusion-based 3D concrete printing.

1. Introduction

The global construction industry, contributing approximately 6% of global GDP and employing nearly 7% of the workforce, remains constrained by labour shortages, inefficiencies, and environmental impacts associated with conventional methods [1,2]. Conventional concrete construction relies heavily on formwork, manual placement, and curing processes that collectively account for nearly half of total project costs and time, while generating significant material waste and environmental impact [3]. These limitations have accelerated research into automation and digital fabrication, with three-dimensional printing of concrete (3DPC) emerging as a promising alternative [1,2].
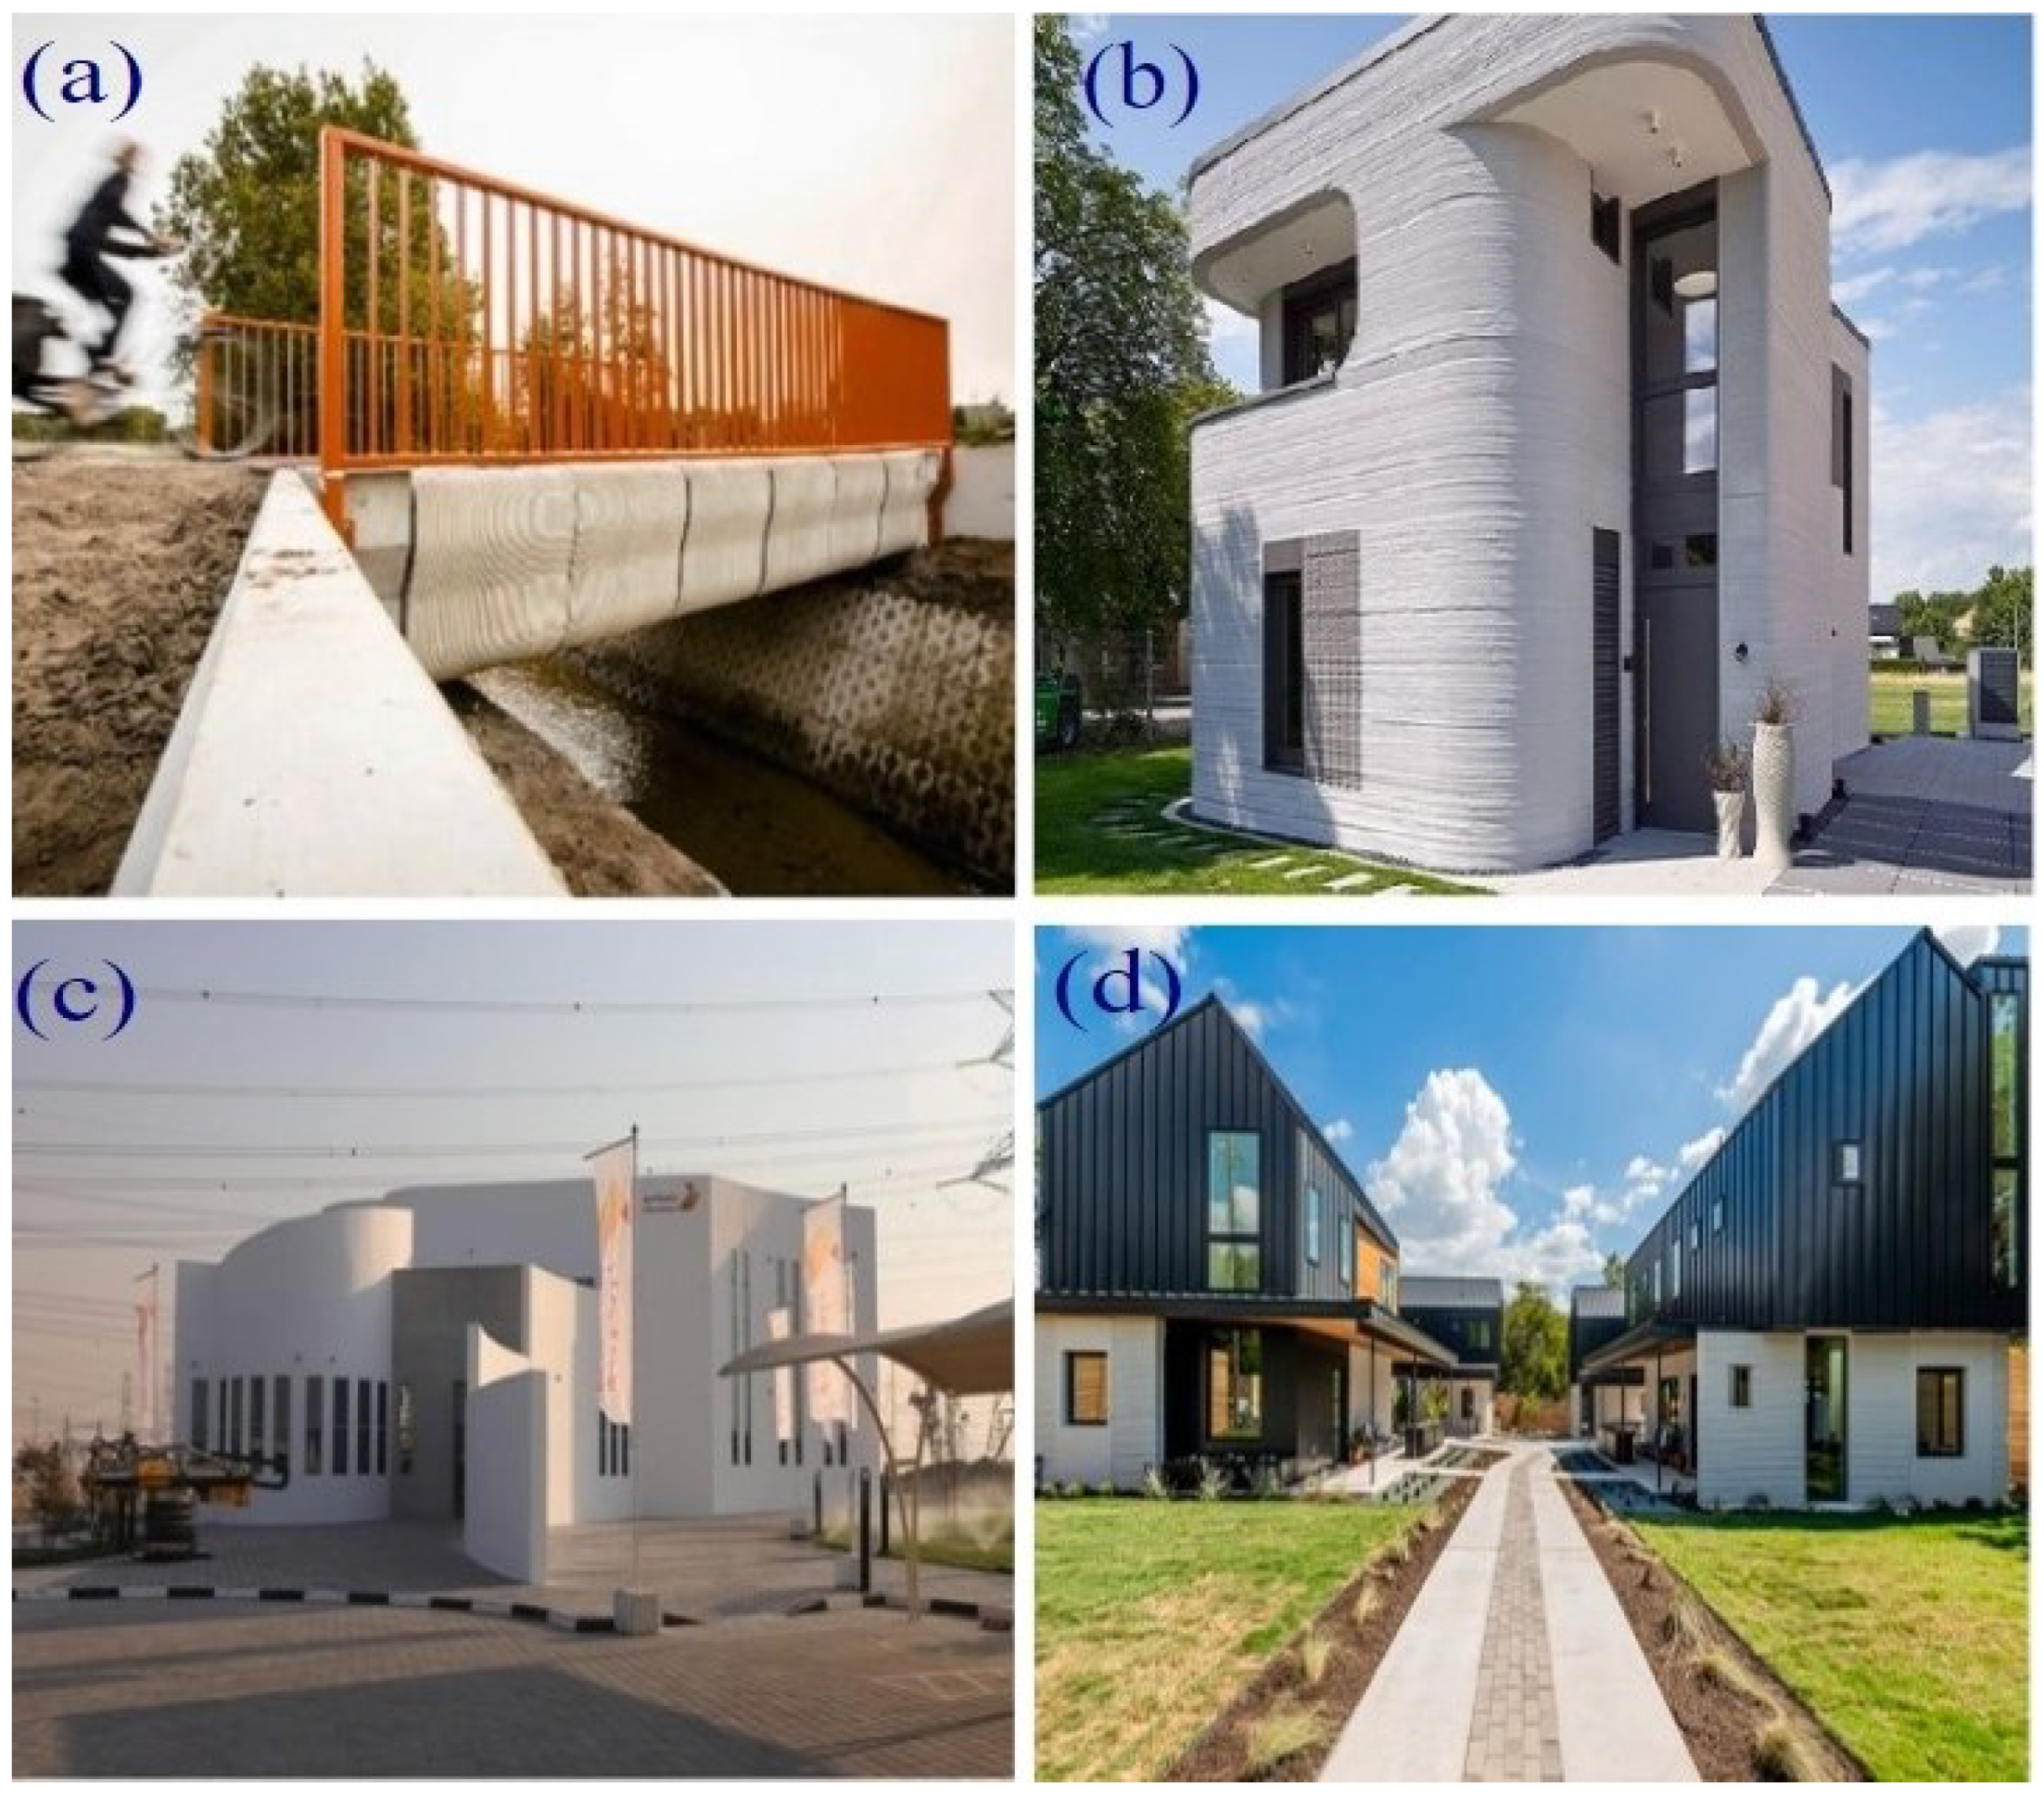
3DPC enables the direct fabrication of structural and architectural elements through layer-by-layer extrusion of a cementitious material, eliminating formwork and allowing freeform geometries with reduced labour requirements. The concept of 3DPC originated from the contour-crafting technique developed by Khoshnevis in the early 2000s, which established the principles of automated additive construction for civil applications [4]. Since then, developments in robotic systems, rheology control, and numerical simulation have expanded its applicability to residential, commercial, and infrastructure projects, as illustrated in Figure 1. Beyond conventional building applications, understanding the thermo-mechanical behaviour of 3D-printed concrete is increasingly important for emerging infrastructure systems including geothermal energy structures, underground tunnel linings, and automated construction in extreme environments. In such applications, layered cementitious materials may experience complex thermal gradients, restrained deformation, and coupled hydration processes that significantly influence long-term durability and structural stability. Thermo-mechanical and thermo-hydro-mechanical modelling frameworks have been widely used to capture such coupled multi-physics interactions in geomaterials and energy-related infrastructure systems [5,6,7,8,9].
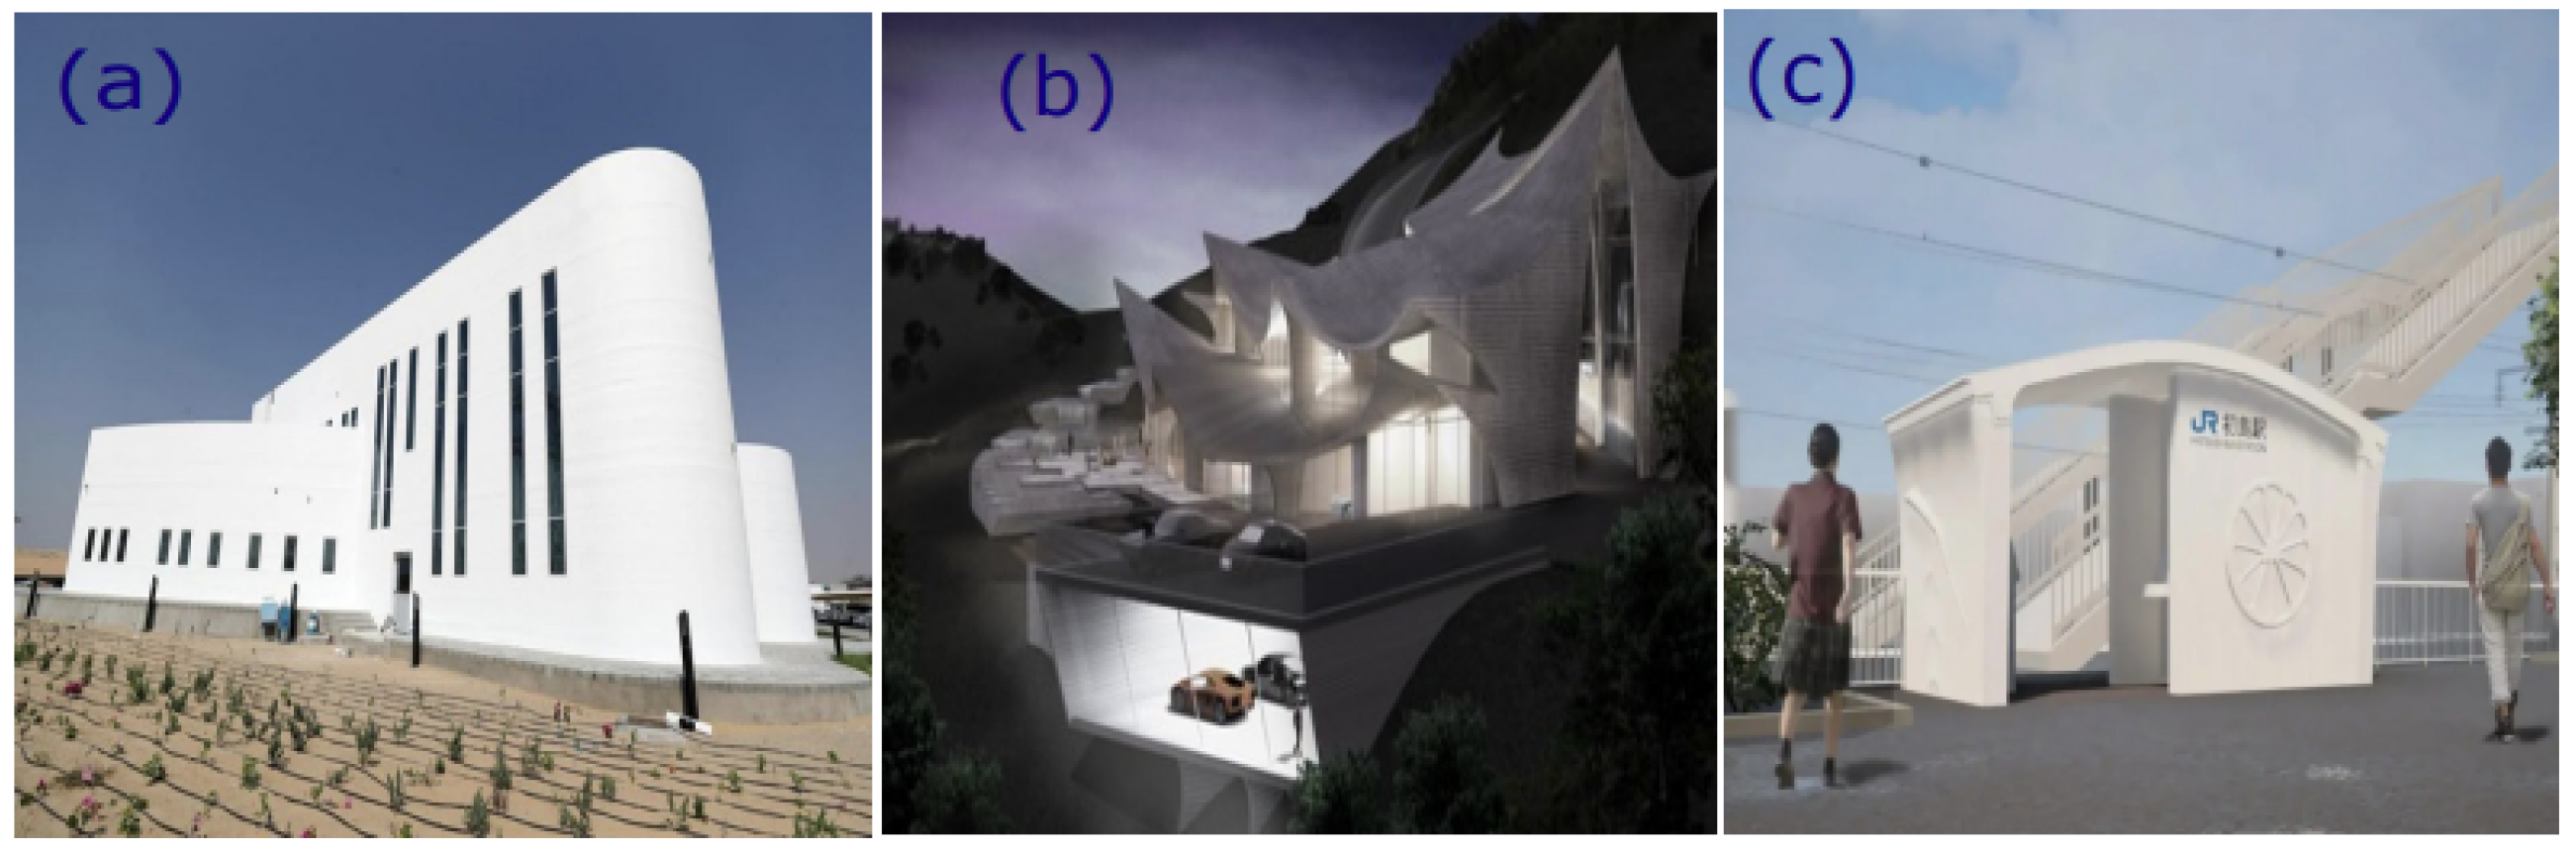
Recent milestones demonstrate the technological maturity of 3DPC (see Figure 2). Recent developments demonstrate the growing maturity of 3D concrete printing technology. Examples include the world’s largest 3D-printed building in Dubai (2024), a printed residential house in Malibu, California (2024), and the first 3D-printed railway station in Arida City, Japan (2025). These examples illustrate the range of structural and architectural applications of additive construction.
Despite its advantages, the early-age thermo-mechanical behaviour of 3D-printed concrete remains a critical challenge [15]. The stability of printed concrete, defined as its ability to support its own weight and subsequent layers during deposition, depends on the evolving rheology of the fresh mix; weak interlayer bonding can compromise mechanical integrity, and temperature gradients from hydration associated with early-age behaviour of 3D-printed concrete can induce early cracking [16,17,18,19]. Understanding and accurately predicting these phenomena is essential for ensuring the reliability and safety of the printed structures.
Existing research has primarily focused on isolated aspects of 3DPC behaviour, either the fresh-state rheology and printability, or the hardened-state mechanical behaviour, often neglecting the transition between the two from the fresh printed state to the hardened state. This early-age period, immediately following extrusion, governs the evolution of stiffness, strength, and thermal properties, which, in turn, determine buildability, stability and crack resistance. Comprehensive experimental–numerical studies addressing these transient interactions remain limited.
Although significant progress has been made in understanding the rheology, buildability, and hardened-state behaviour of 3D-printed concrete, important gaps remain in the prediction of coupled thermo-mechanical behaviour during the early-age period immediately after deposition. Existing studies have often treated hydration, thermal evolution, and interlayer bonding independently, despite their strong physical interaction during printing. Furthermore, limited attention has been given to the transient transition from fresh-state behaviour to mechanically load-bearing layered structures under variable deposition intervals and thermal conditions. In particular, the influence of hydration-driven stiffness evolution on interlayer stress development and crack initiation remains insufficiently understood.
This study addresses these gaps by developing a coupled experimental–numerical framework for predicting the early-age thermo-mechanical behaviour of extrusion-based 3D-printed concrete. The framework integrates hydration kinetics, maturity theory, thermo-mechanical coupling, and cohesive interlayer modelling within a finite-element environment. Experimental validation is performed using compression, interlayer bond, and fracture tests under varying printing delays and curing temperatures. The proposed approach aims to provide a physically consistent understanding of the interaction between thermal evolution, stiffness development, and interfacial degradation during early-age printing.

2. Materials and Methods

2.1. Constituent Materials

The printable concrete mixtures developed in this study were designed to achieve an optimal balance between extrudability and mechanical performance. All materials conformed to the relevant British and European standards. The main constituents of the printable concrete mix are cement, sand, fly ash, silica fume, water, and superplasticiser, which are discussed in this section.

2.1.1. Cement

Ordinary Portland Cement (OPC) CEM I 32.5R, conforming to [20], served as the principal binder. The Blaine fineness was approximately 360 m2/kg, and the specific gravity was 3.15. Table 1 summarises its chemical composition.

2.1.2. Supplementary Cementitious Materials and Admixture

Class F fly ash (FA) conforming to [21] and silica fume (SF) per [22] were incorporated to enhance workability and early-age strength. The combined replacement ratio was 30% (20% FA + 10% SF) by weight of cement. In addition, polycarboxylate-ether superplasticiser (SP) was used at 0.8% of binder weight to enhance dispersion and maintain pumpability.

2.1.3. Fine Aggregates

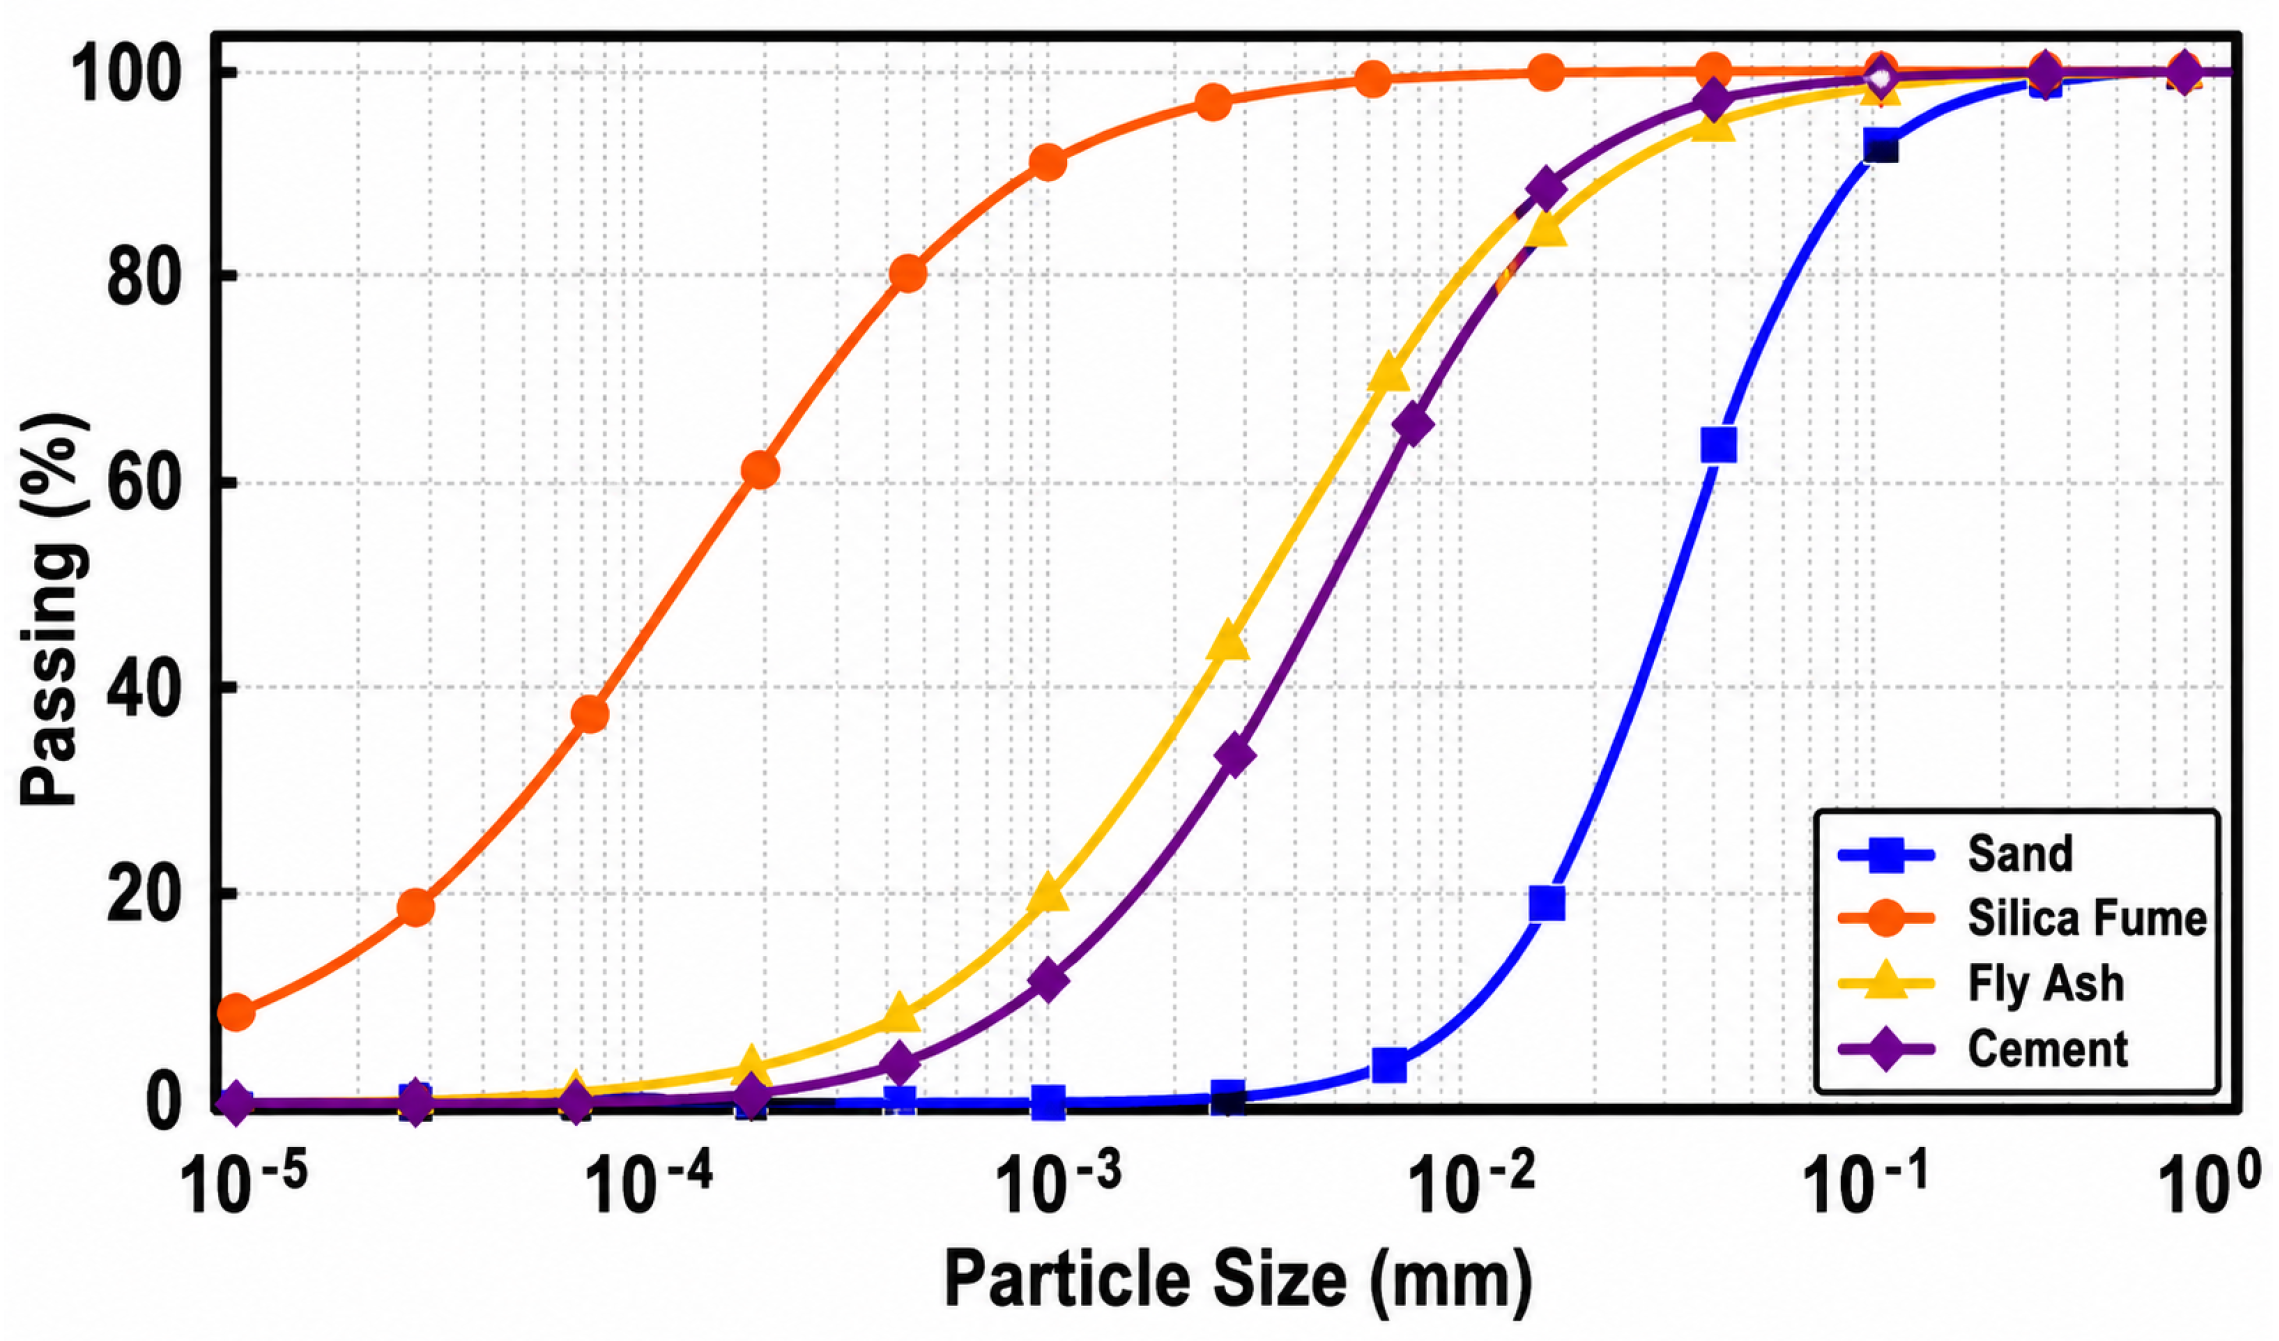
Locally sourced river sand with a maximum particle size of 2 mm and a fineness modulus of 2.4 was used. Sieve analysis (Figure 3) confirmed compliance with [23].

2.2. Mix Design and Mixing Procedure

The mixture proportions were selected to achieve a balance between pumpability, extrudability, buildability, and early-age strength development. The water-to-binder ratio was maintained at approximately 0.35 to ensure sufficient flowability while limiting segregation and excessive deformation after deposition. The combined use of fly ash and silica fume improved particle packing density and rheological stability, contributing to enhanced layer buildability and reduced bleeding during printing. Table 2 summarises the final mix proportions per m3.
Dry constituents were mixed for 7 min at low speed (60 rpm) in a Hobart mixer, followed by gradual addition of water and admixture over a 30-s period while continuing at low speed (60 rpm). The mixture was then mixed at a high speed (120 rpm) for 90 s, followed by a resting period of 60 s. Finally, the material was mixed for an additional 3 min at high speed before collection. The mixture was immediately transferred to the extrusion system to minimise premature stiffening. The mixture exhibited sufficient printability and buildability for stable layer deposition.

2.3. Testing of Fresh-State Properties

2.3.1. Setting Time

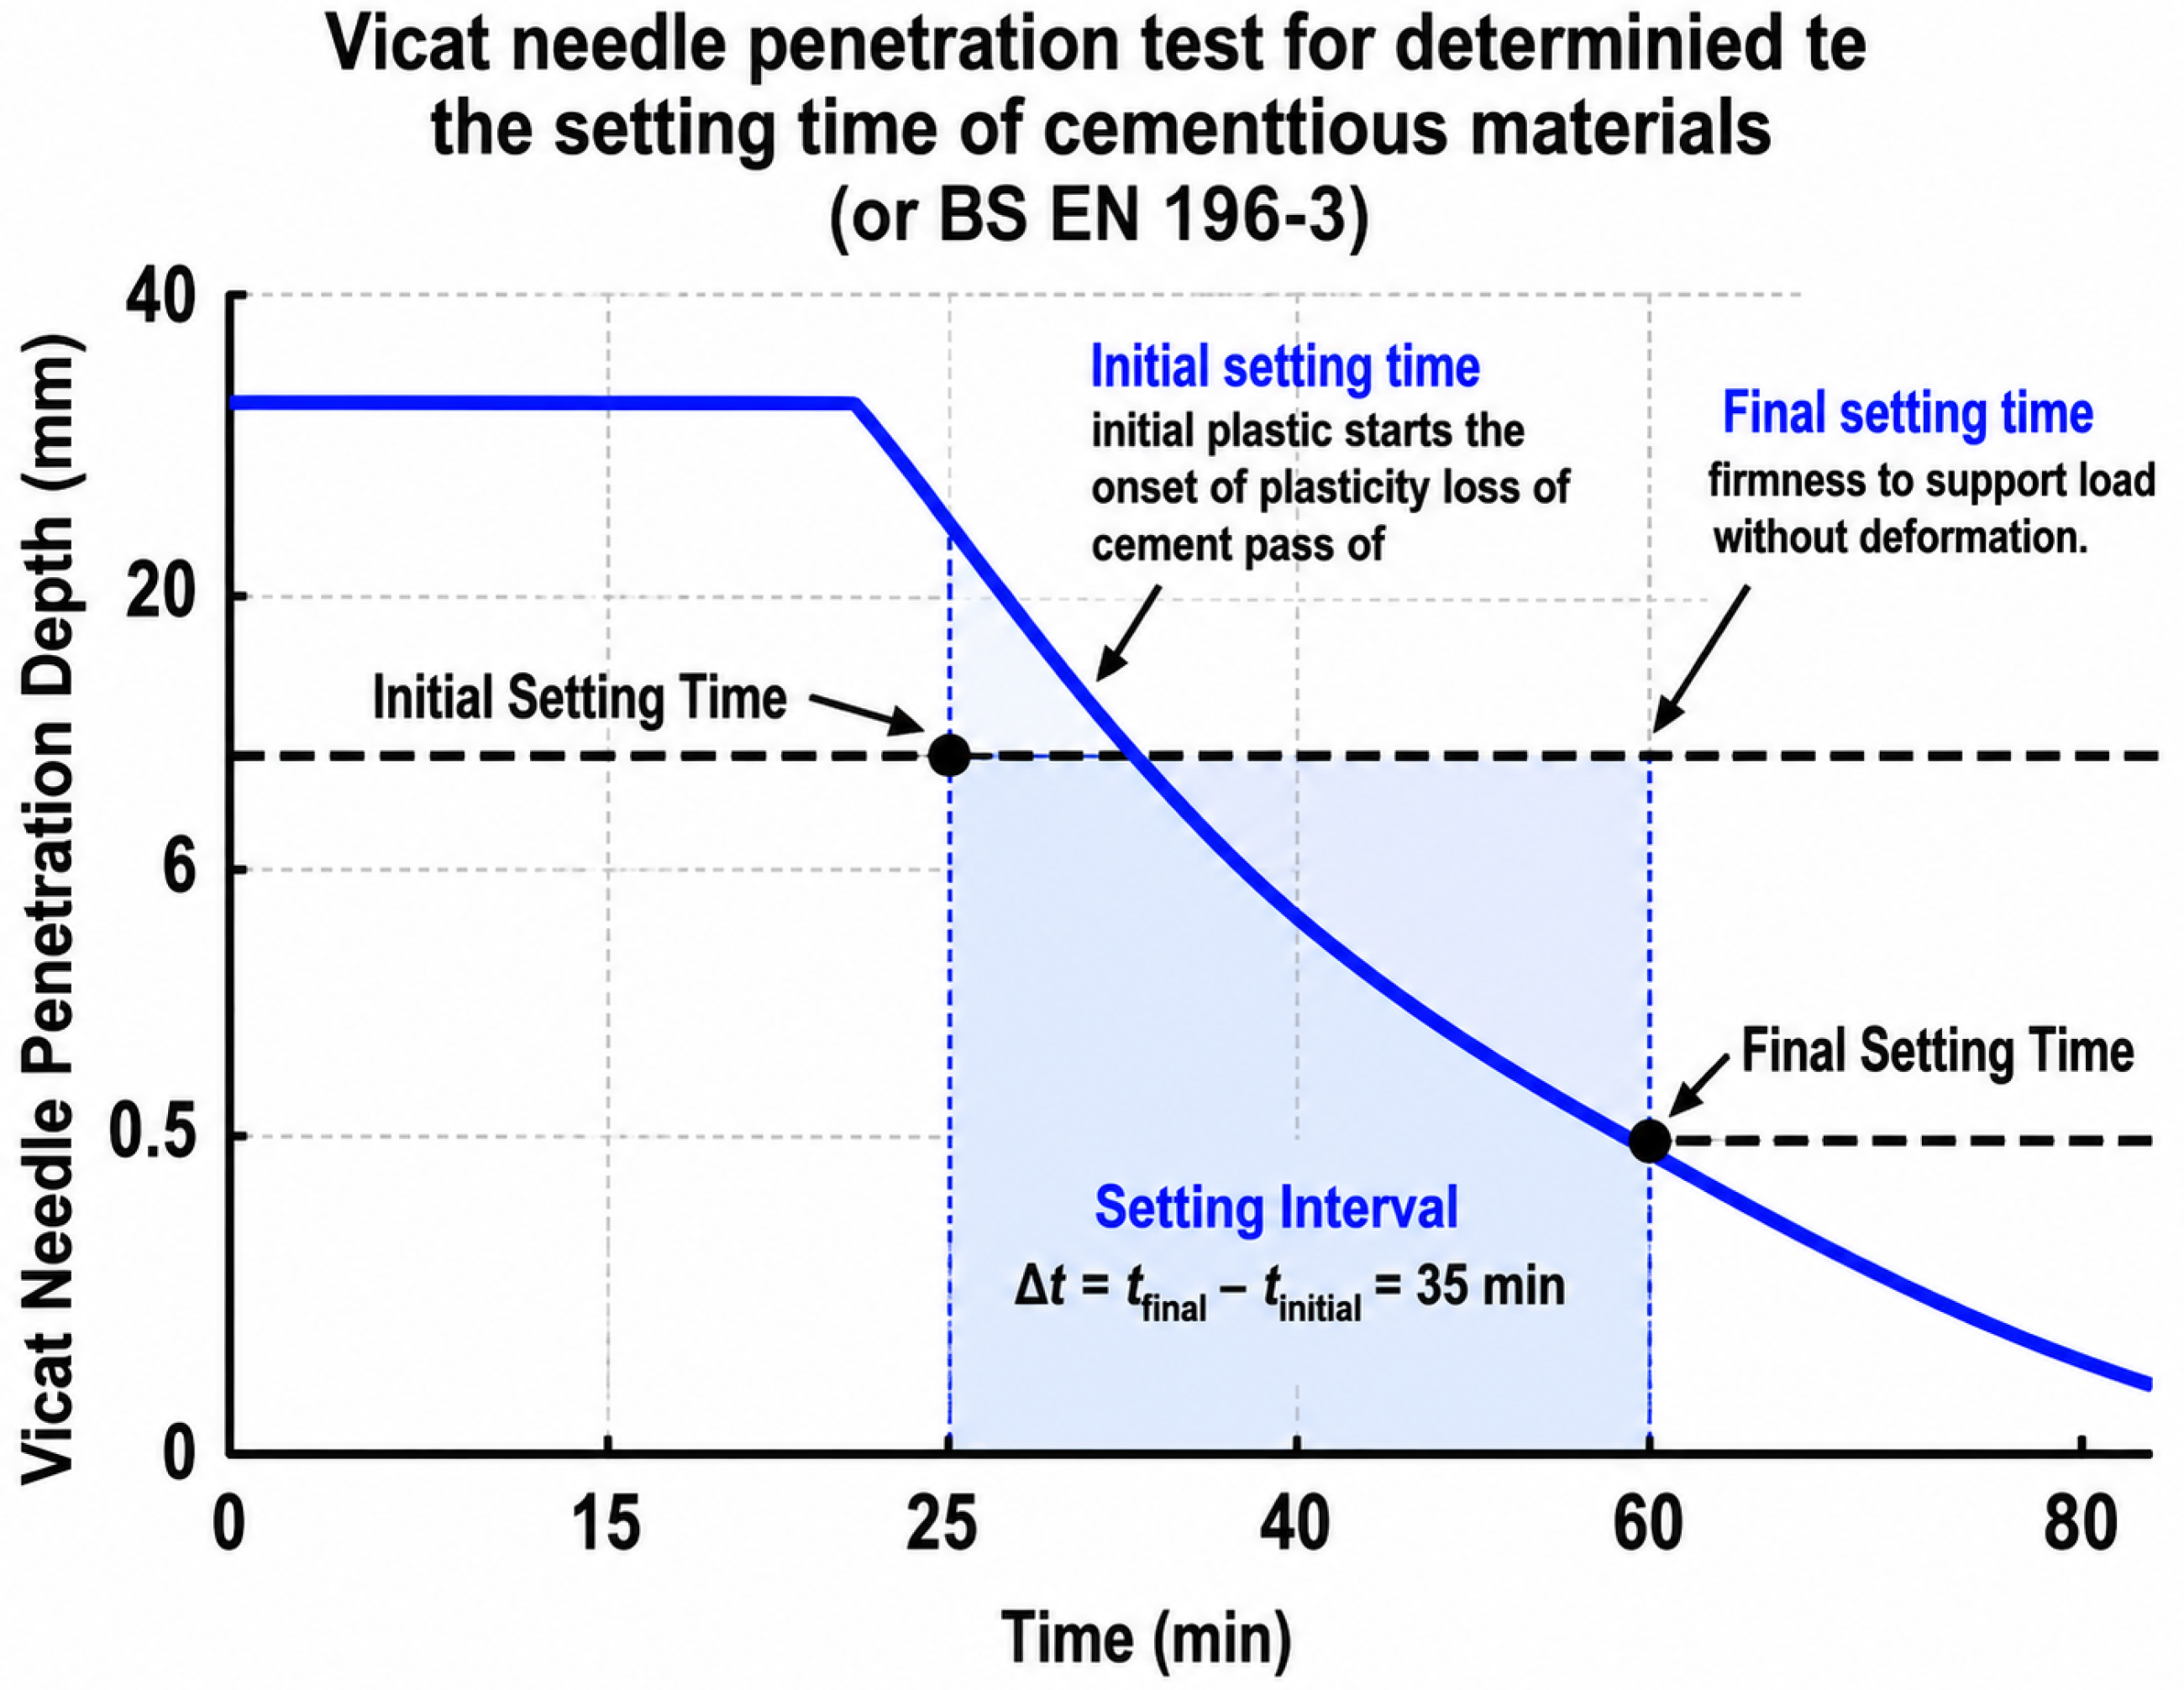
Initial and final setting times were measured using the Vicat apparatus [24]. Results indicated an initial setting of 25 min and a final setting of 60 min. This corresponds to a workable printing window of about 30–45 min for continuous deposition without loss of bonding or collapse risk, consistent with the required open time for printing (Figure 4).

2.3.2. Slump Flow

Flowability was measured using a mini-slump cone with 100 mm bottom diameter, 70 mm top diameter, and 60 mm height; the spread diameter after flow table drops was used to characterise pumpable, printable mixes workability, following procedures similar to [25,26]. Measured spread diameters ranged from 60 to 75 mm, confirming pumpable yet stable consistency.

2.3.3. Rheology

The rheological behaviour of fresh concrete for 3D printing is generally described by the Bingham model, which defines acceptable ranges of yield stress and plastic viscosity for printability. Rheological tests were conducted using a coaxial viscometer fitted with a 50 mm vane. To minimise wall-slip effects during rheological testing, a vane geometry was selected instead of smooth concentric cylinders, as vane systems are generally more suitable for highly thixotropic cementitious materials. In addition, testing was conducted at relatively low shear rates to reduce shear localisation near the container boundary. Although only a single vane geometry was employed, the obtained flow curves remained consistent across repeated measurements, indicating acceptable rheological stability for comparative analysis.
The flow curves of the fresh 3D-printed concrete were interpreted using both Bingham and Herschel–Bulkley models [27,28,29,30,31]:
τ = τ 0 + η p γ ˙
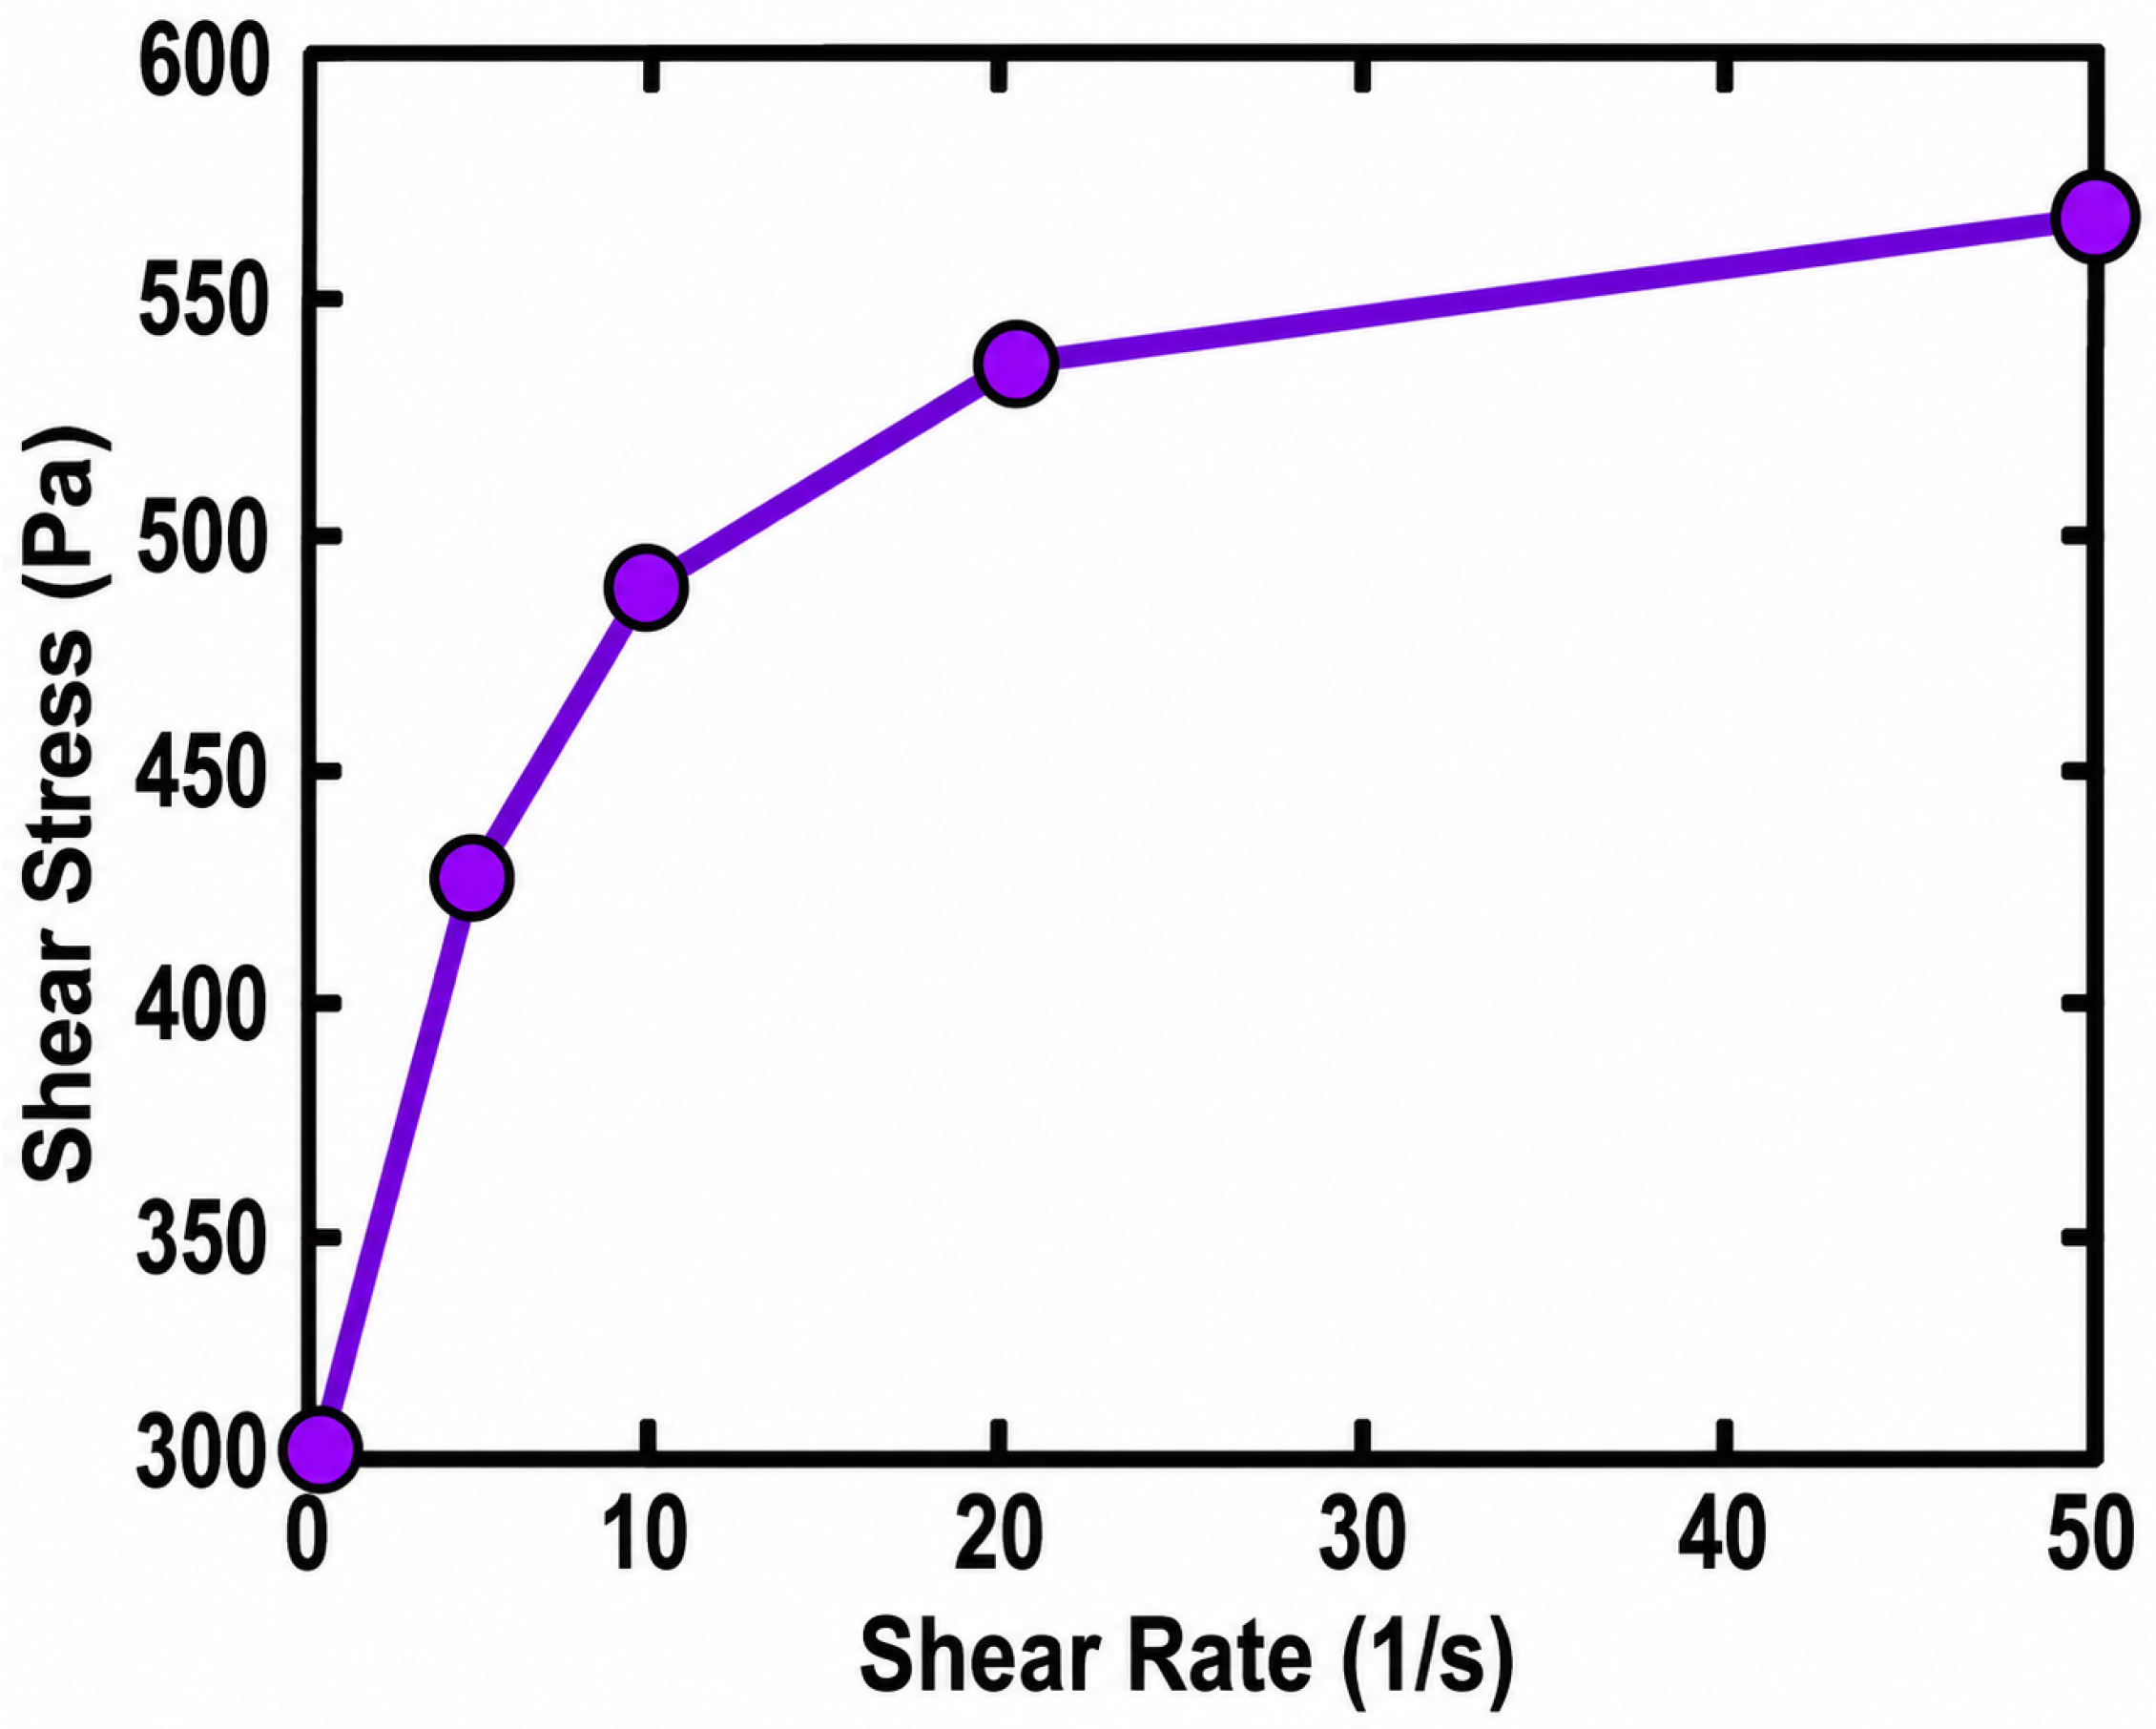
where τ is the shear stress, τ 0 is the yield stress, η p is the plastic viscosity, and γ ˙ is the shear rate. Figure 5 shows a representative flow curve indicating thixotropic behaviour.
The measured rheological parameters directly influenced the buildability and interlayer performance of the printed material. Increased yield stress contributed to shape retention and resistance to layer collapse, while plastic viscosity governed extrusion stability and filament continuity. In addition, rheological evolution during resting periods influenced the degree of fresh–fresh contact between successive layers and therefore affected interlayer bond development.

2.4. 3D Printing Setup and Printing Process

A semi-automated gantry-type printer was employed, featuring a piston-driven extrusion system and 20 mm nozzle. The system allows for variable printing speeds and deposition rates to accommodate different experimental conditions. For this study, a constant linear printing speed of 0.7 m/s was maintained with a layer height of 10 mm. The printer deposited successive layers (20 mm height) in a controlled environment at 20 ± 3 °C and 60% RH. Layer deposition intervals of 0, 10, 30, and 60 min were applied to investigate time-gap effects.

3D-Printed Concrete Sample Preparation

All specimens corresponding to short deposition intervals (0–30 min) were produced from a single batch to minimise variability in material composition and rheological behaviour. For longer delays (60 min), fresh material was prepared to maintain practical printability and extrusion consistency during deposition. To minimise batch-to-batch variability, identical mixing procedures, constituent proportions, environmental conditions, and resting times were maintained for all batches. Nevertheless, it is acknowledged that minor rheological differences between batches may have contributed to variability in the measured interlayer bond behaviour.

2.5. Compression Tests

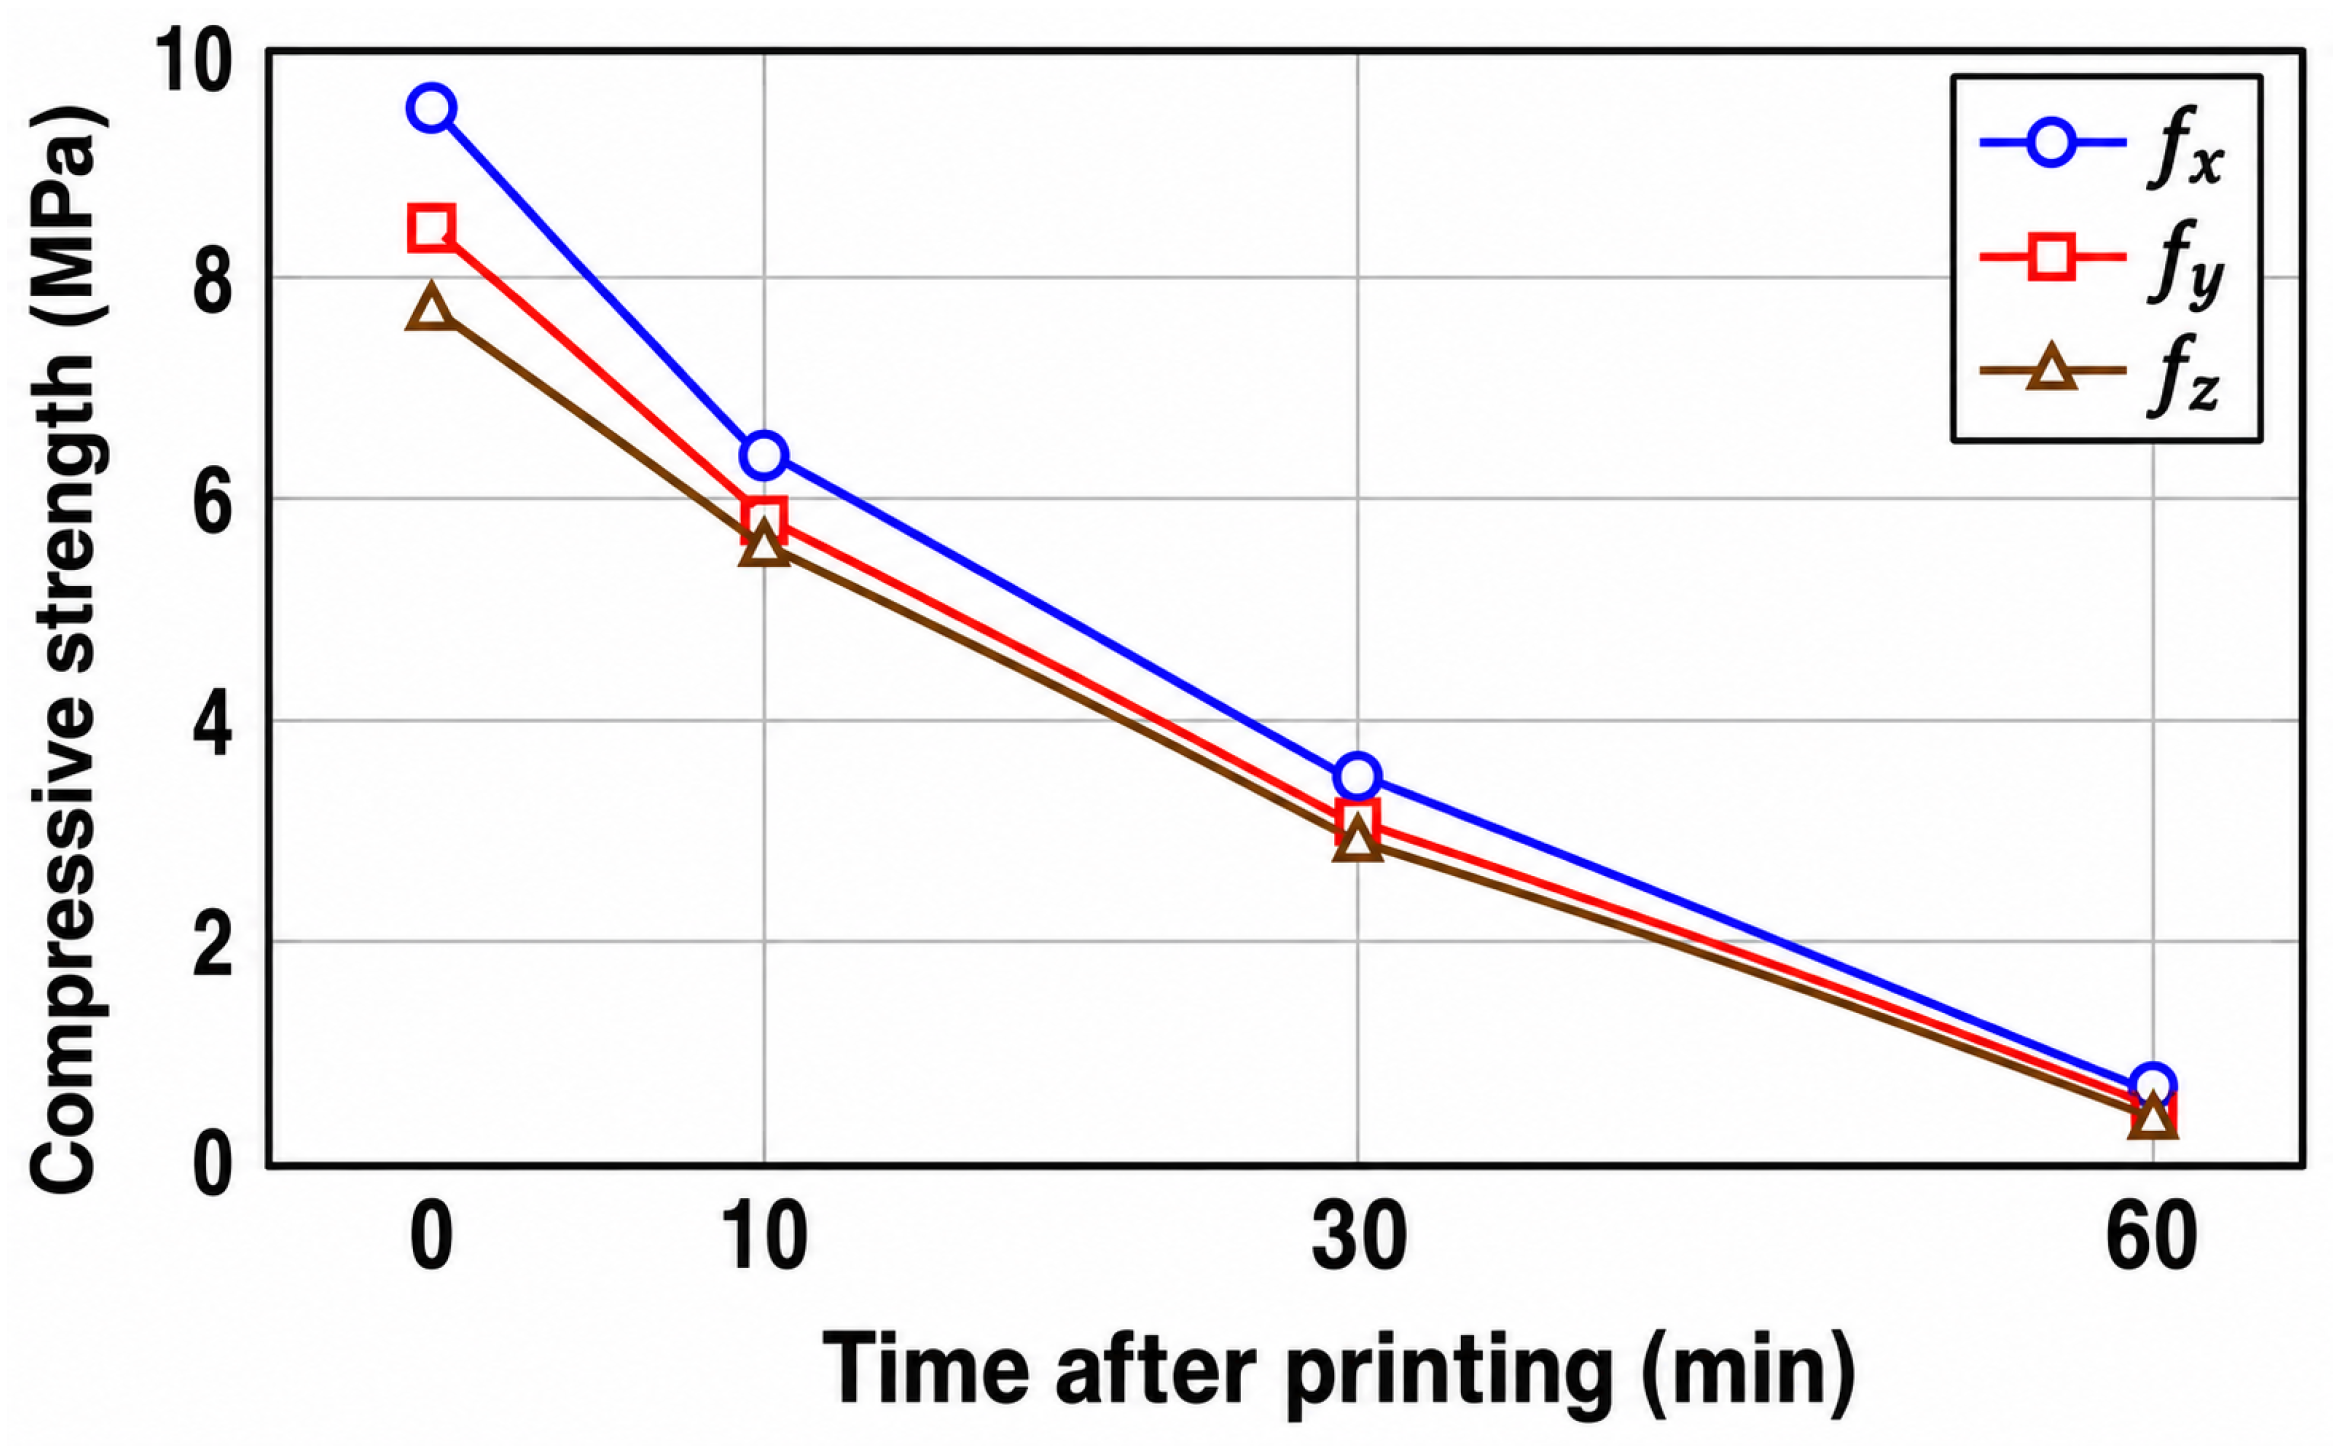
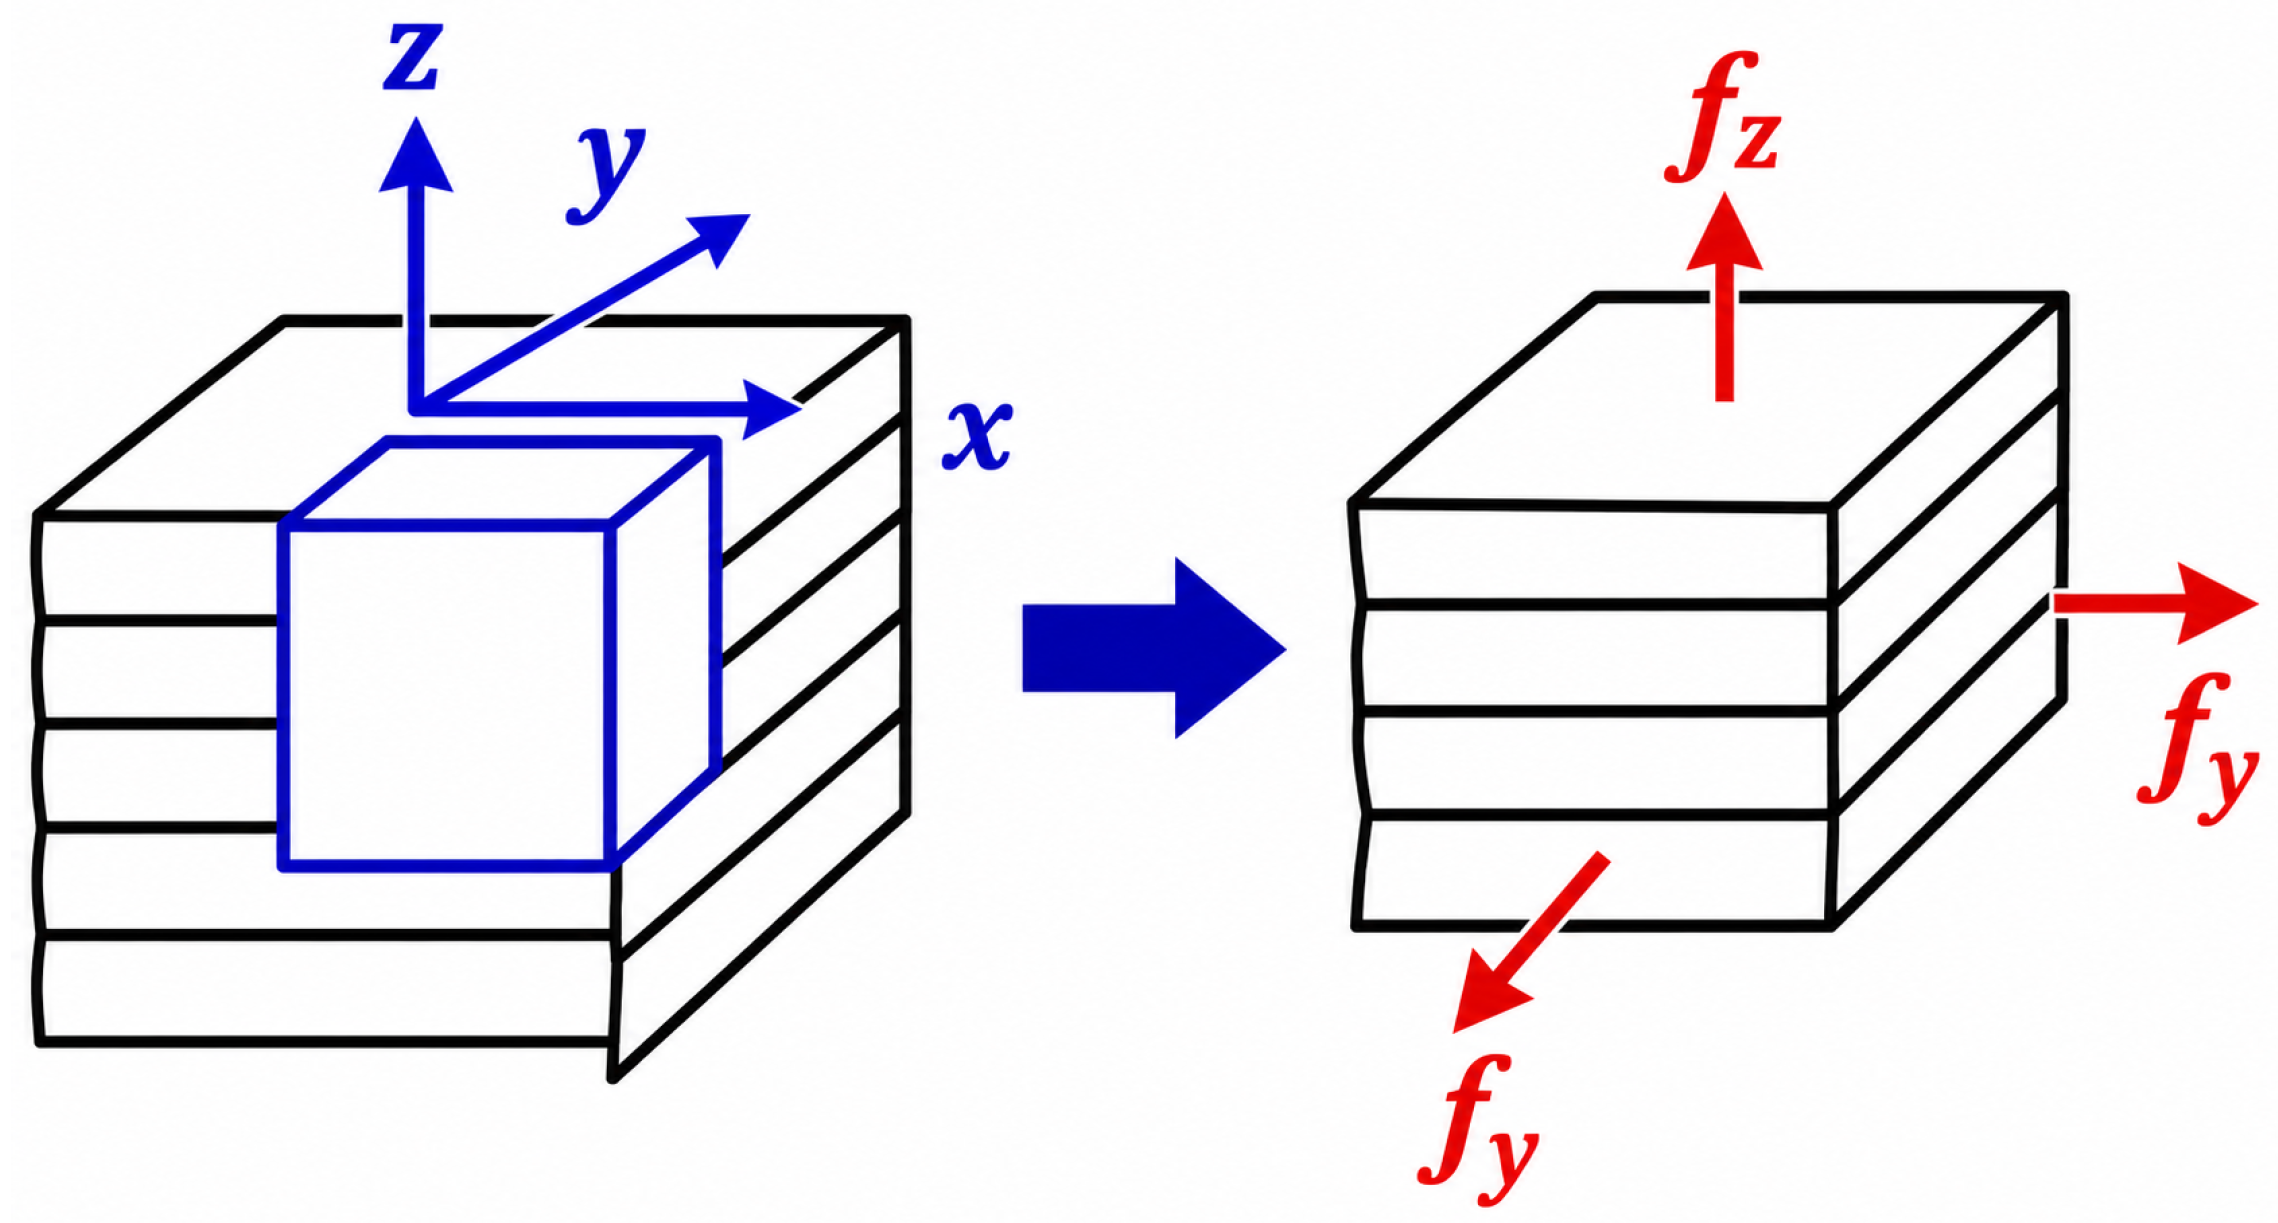
The compressive strength test results for 3DPC specimens subjected to loading in three orthogonal directions (X, Y, Z) (Figure 6) under 20 °C curing temperatures are presented in Table 3. For each testing condition, three specimens were tested and the average value is reported. The corresponding standard deviations were within 6–9% of the mean values.
A total of 15 cubic specimens of dimensions 50 mm × 50 mm × 50 mm were prepared for compression testing and loaded under displacement-controlled conditions at a constant loading rate of 0.5 mm/min and were tested for compressive strength evaluation. The reported values represent the mean compressive strength, and standard deviations are included to quantify the experimental scatter. The results reveal pronounced anisotropic behaviour in the mechanical properties of 3D-printed concrete. This directional dependence arises from the varying types and quantities of interlayer structures present in each cross-sectional plane, which represent inherent weaknesses in the printed specimens. The influence of these interlayer structures on the pore structure of 3DPC is identified as the primary mechanism responsible for the observed anisotropy [32]. Previous studies on 3DPC anisotropy have reported inconsistent findings, primarily due to variations in material composition, printing parameters, and specimen dimensions [33,34].
The rate of compressive strength development increases with curing temperature for all loading directions.
The substantial reduction in measured compressive response at long deposition delays primarily reflects interlayer-dominated failure behaviour and progressive loss of structural continuity between printed filaments rather than intrinsic degradation of the bulk cementitious matrix. The specimens exhibited preferential failure along weakened interlayer regions, leading to significantly reduced apparent compressive resistance under loading perpendicular to the interfaces. It is important to emphasise that the pronounced reduction observed in Table 3 does not represent a true loss of intrinsic compressive strength of the bulk material. Instead, it reflects the increasing dominance of weak interlayer regions, which govern failure behaviour under loading. Consequently, the measured compressive strength at longer time delays should be interpreted as an apparent structural response influenced by interfacial degradation rather than a material-level reduction in matrix strength.
For each testing condition, three specimens were tested and the average value is reported (Figure 7). The corresponding standard deviations were within 6–9% of the mean values.
A total of 15 specimens were tested for compressive strength evaluation. The reported values represent the mean compressive strength, and standard deviations are included to quantify the experimental scatter.

3. Modelling Approach

This section discusses the hydration of cement and the mechanical and thermal characteristics of the hydrated concrete.

3.1. Hydration Modelling and Maturity Theory

The maturity method is widely used to predict the strength development of cement-based materials, including 3D-printed concrete (3DPC), based on their curing history. The method relates mechanical properties to a maturity index that combines the effects of time and temperature during hydration. The evolution of strength with time is described using a hyperbolic function proposed by [35]:
S ( t ) = S u k T ( t t 0 ) 1 + k T ( t t 0 ) ,
where S ( t ) is the strength at age t, S u is the ultimate strength, t 0 is the final setting time, and k T is the temperature-dependent rate constant.
The hyperbolic maturity relationship in Equation (2) primarily captures the acceleration and deceleration phases of hydration-driven strength development and does not fully represent the dormant period immediately after mixing. In the present study, this limitation was mitigated by combining the maturity formulation with experimentally measured setting times obtained from Vicat testing. The final setting time t 0 [36,37] was used as the activation threshold for mechanical property evolution, while the first hour of printing was governed primarily through experimentally observed rheological behaviour and hydration kinetics rather than direct maturity-based strength prediction. Consequently, the model was intended to capture the transition from fresh-state deposition to early-age structural buildability rather than the purely plastic phase immediately after extrusion.
The temperature dependence of the hydration rate is described using an Arrhenius-type formulation [35]:
k T = A 0 exp E a R T ,
where A 0 is the pre-exponential factor, E a is the activation energy, R is the universal gas constant, and T is the absolute temperature.
The Arrhenius parameters used in the hydration model were adopted from previously published studies on rapid-hardening cementitious systems containing supplementary cementitious materials similar to those used in the present investigation [35,37,38]. The selected activation energy range was verified against the experimentally measured setting-time evolution and early-age strength development obtained for the OPC–FA–SF binder system adopted in this study. Although direct calorimetric calibration was not performed, the predicted hydration trends showed good agreement with the experimentally observed stiffness and strength evolution, supporting the applicability of the adopted parameters.
The equivalent age t e , accounting for variable curing temperatures, is computed as:
t e = 0 t exp E a R 1 T 1 T r d t ,
where T r is the reference temperature.
This formulation assumes that the effect of temperature on hydration kinetics follows an exponential law, enabling the translation of real-time curing conditions into an equivalent age at a reference temperature [39] according to Equation (3). Once the model parameters are calibrated using experimental data, the maturity method can be applied to predict mechanical performance under various thermal histories.

3.2. Finite Element Modelling Framework

The numerical model was developed in COMSOL Multiphysics (https://www.comsol.com/) to simulate the coupled thermal and mechanical behaviour of early-age 3D-printed concrete. Successively printed layers were represented as separate domains, activated at prescribed deposition times using smooth step functions to ensure that hydration, heat generation, and stiffness evolution commenced only after placement. The transient heat transfer problem, including internal heat generation due to cement hydration, is governed by:
ρ c p T t = · k T + Q h ,
where ρ is the material density, c p is the specific heat capacity, k is the thermal conductivity, T is the temperature, and Q h is the volumetric heat generation rate associated with hydration.
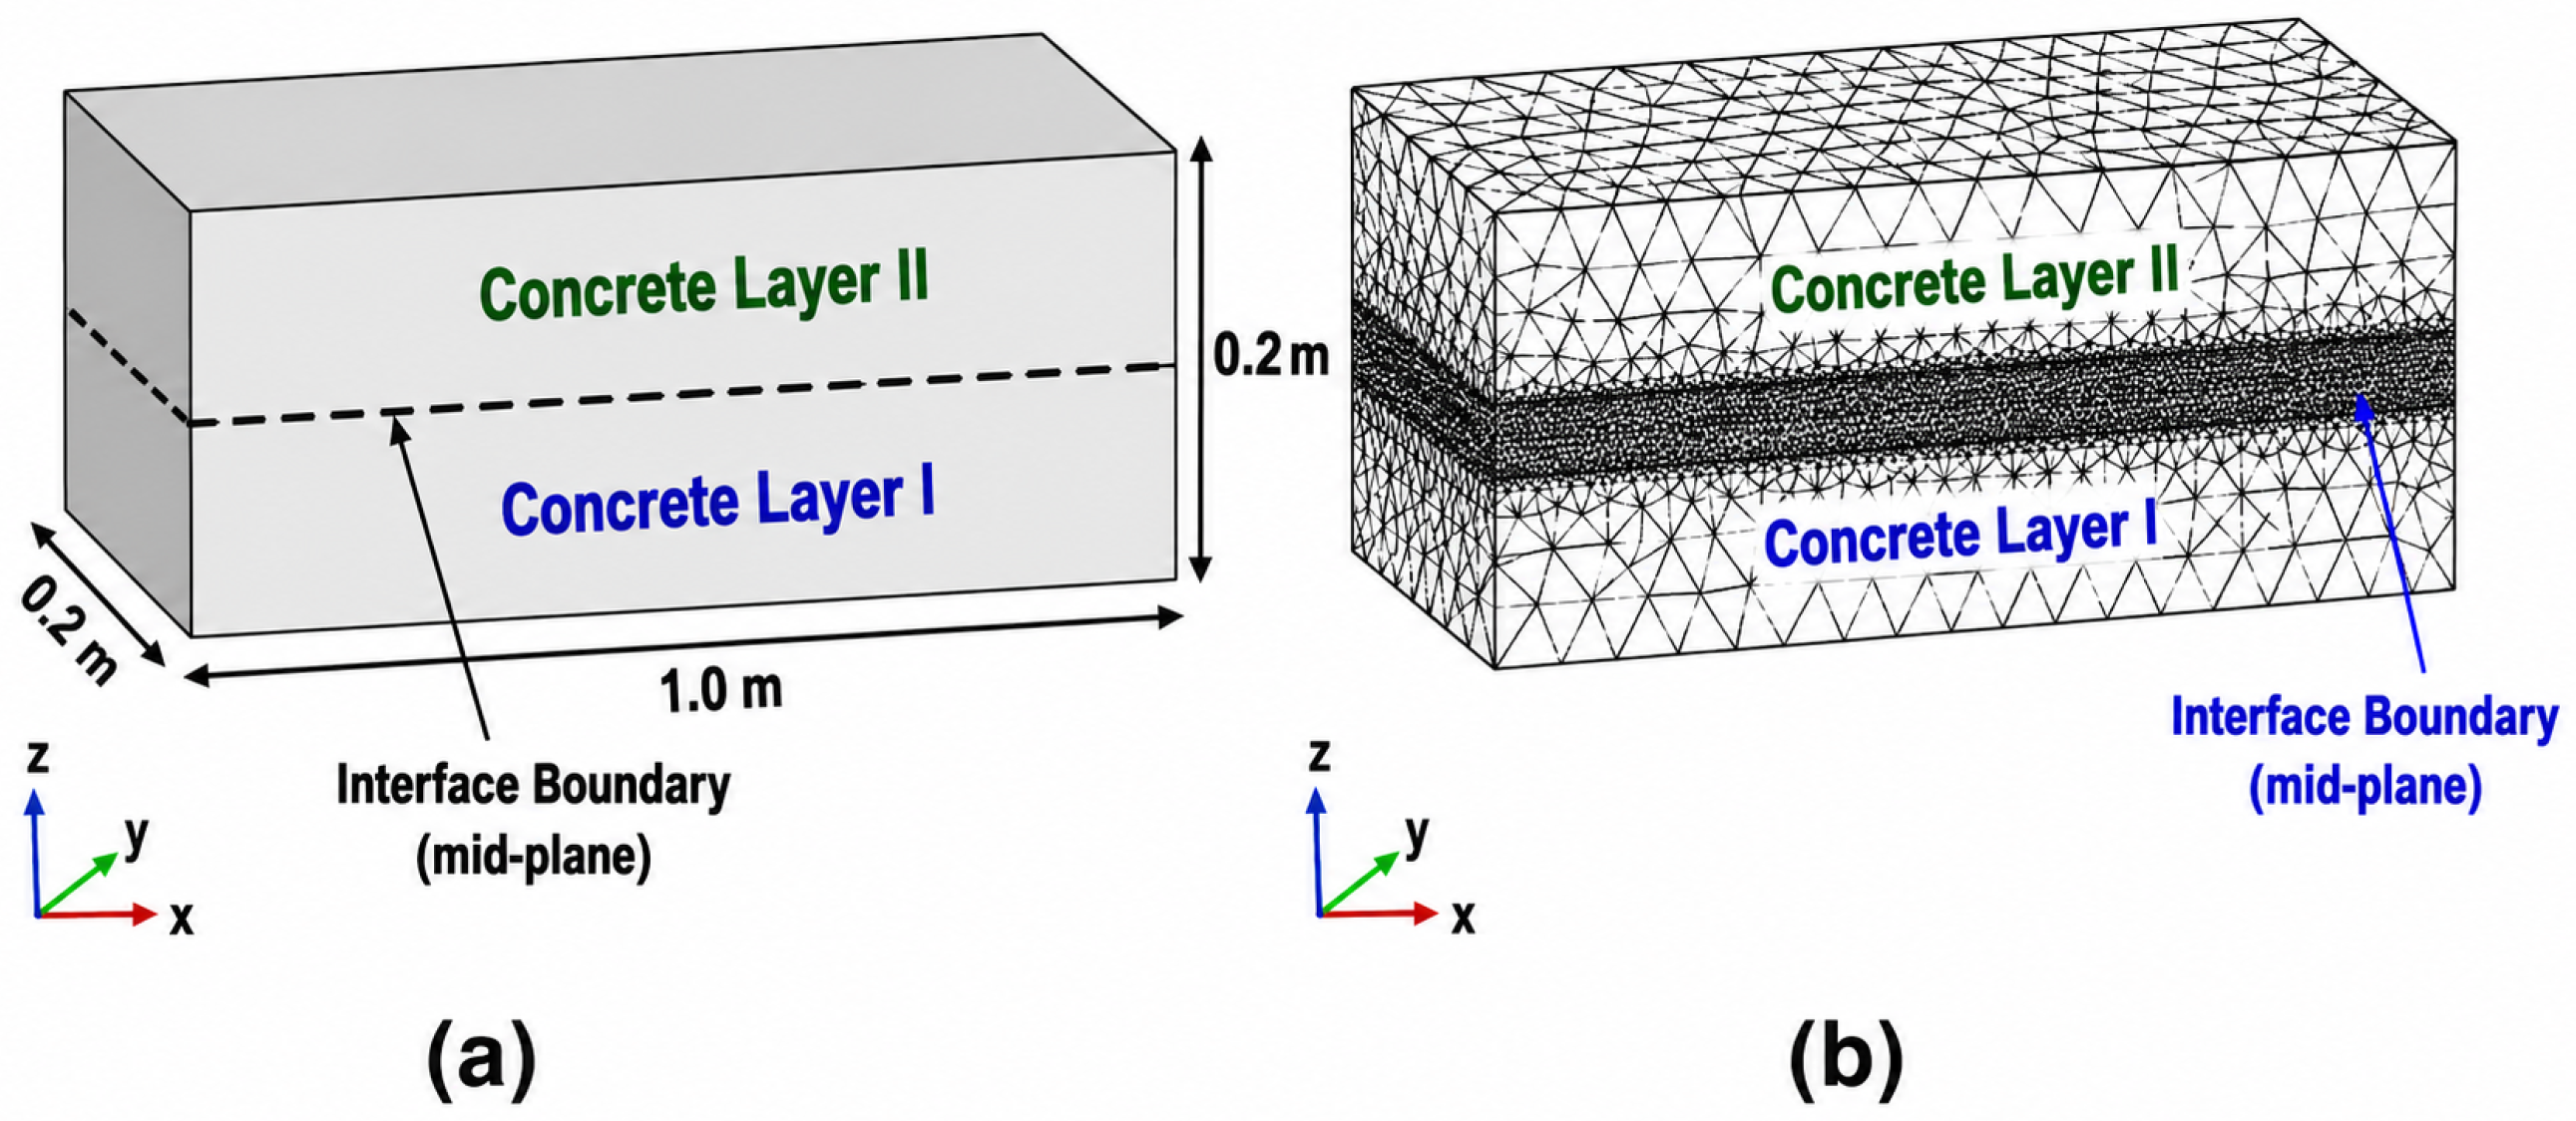
Two prismatic layers (1.0 m × 0.50 m × 0.50 m) were constructed as separate domains to replicate successive deposition passes or layered concrete (Figure 8). Material properties in Table 4 were assigned to the concrete domain considering both mechanical, interface element and thermal characteristics. For the heat transfer analysis, material properties were specified in consistent units with temperature in Celsius and time in minutes. A smooth step function was used to activate the upper layer at its printing time, ensuring that hydration, temperature rise and stiffness evolution began only after placement. The modelling strategy adopted a fully coupled time-dependent formulation, where the heat transfer and solid mechanics equations were solved sequentially within a segregated solver framework to improve stability.

Coupled Thermal–Mechanical Model

Heat transfer in solids governed the thermal field, with convective boundary conditions representing surface cooling. Hydration heat generation was defined using an Arrhenius-type kinetic model, Equation (3) and reference temperature of 20 °C, where the degree of hydration evolved through a domain ODE. The temperature-dependent hydration rate acted as a volumetric heat source. The resulting temperature field was used to compute maturity and the corresponding stiffness gain through a time-dependent modulus function. The model was discretised using a tetrahedral finite-element mesh. A coarser global mesh was applied to the bulk of each layer, while a locally refined mesh was generated around the interlayer region to better capture stress concentrations and early cracking. The thermo-mechanical formulation adopted in this study was primarily unidirectional, where the transient temperature field governed the evolution of hydration, maturity, stiffness, and thermal strain development. The resulting thermal strains were incorporated into the solid mechanics formulation through thermal expansion coupling. Mechanical deformation, however, did not influence the thermal field directly, and therefore feedback effects such as deformation-induced heat transfer changes were neglected.
ϵ t h = α T ( T T r )
where α T is the coefficient of thermal expansion and T r is the reference temperature. The mismatch in thermal strain between adjacent layers generated restrained tensile stresses at the interlayer interfaces, contributing to crack initiation during early-age hydration.
Mesh refinement studies confirmed that the chosen mesh density produced mesh-independent results for temperature gradients, interlayer tensile stresses and damage onset. Time integration used an adaptive time-stepping scheme, with small initial steps to stabilise the hydration and stiffness evolution at early-ages.
The final model captured the evolution of temperature, hydration, maturity, stiffness gain, stress development, interlayer bonding behaviour and the progression of cracking under combined thermal and mechanical effects. This modelling framework provides a realistic representation of early-age thermo-mechanical behaviour in layered 3D-printed concrete and offers insight into the influence of printing time intervals, thermal gradients and evolving material properties on structural performance.

3.3. Hydration Kinetics and Time-Dependent Properties

The degree of hydration α ( t ) is assumed to evolve according to an Arrhenius-based kinetic law:
d α d t = A exp E a R T ( 1 α ) n ,
where A is the pre-exponential factor, E a is the activation energy, R is the universal gas constant, T is the absolute temperature, and n is the reaction order. The evolution of mechanical properties is linked to the degree of hydration. The Young’s modulus is expressed as:
E ( t ) = E 4 α ( t ) α 28 0.5 ,
and the compressive strength as:
f c ( t ) = f c , 4 α ( t ) α 28 ,
where E 4 and f c , 4 are the Young’s modulus and compressive strength at 4 h, respectively, and α 28 is the degree of hydration at 28 days.
The coupled thermo-mechanical problem was solved using an implicit time-dependent segregated solver with adaptive time stepping. Relative and absolute tolerances of 10 3 and 10 6 , respectively, were adopted to ensure numerical stability during early-age hydration where rapid stiffness evolution occurs. Smaller initial time increments were employed during the first hour after deposition to accurately capture transient thermal gradients and hydration kinetics.

3.4. Material Properties

Material parameters used in the thermo-mechanical and cohesive interface models were determined through a combination of experimental measurements, analytical estimation, and calibration against published studies on extrusion-based 3D-printed concrete with comparable binder systems [38,40,41,42,43,44,45,46,47]. Bulk mechanical properties including compressive strength, elastic modulus, and tensile behaviour were constrained using the experimentally measured early-age response obtained in the present study. Cohesive interface parameters were subsequently calibrated to reproduce the experimentally observed interlayer bond degradation and force–crack opening displacement (F–CMOD) behaviour under varying deposition intervals. The final parameter set therefore represents a physically calibrated approximation rather than purely literature-derived values. The concrete used in simulations was a normal-weight, rapid-hardening cement (Class 32.5R), selected for its early strength gain and printability [41]. Key parameters are summarized below: Table 4 and Table 5.
Sensitivity analyses were additionally performed to evaluate the influence of key interface parameters, including tensile strength, fracture energy, and interface stiffness, on the predicted interlayer stress distribution and crack initiation behaviour. The selected parameter ranges produced stable numerical convergence and good agreement with the experimentally measuredforce–crack opening displacement (F–CMOD) responses.

3.5. Interlayer Cohesive Interface Model

The interface between consecutively printed layers was modelled using a zero-thickness cohesive zone formulation to capture progressive interlayer debonding. The traction–separation relationship is defined as:
T n T s = ( 1 d ) K n 0 0 K s δ n δ s ,
where T n and T s are the normal and shear tractions, δ n and δ s are the corresponding separations, K n and K s are the interface stiffnesses, and d is a scalar damage variable. Damage initiation follows a quadratic stress criterion:
T n T n 0 2 + T s T s 0 2 = 1 ,
where T n 0 and T s 0 are the tensile and shear interlayer strengths, respectively.

3.6. Time-Dependent Interlayer Properties

Due to the layer-by-layer nature of extrusion-based printing, interlayer bond properties evolve with hydration. The interfacial strength and fracture energy are defined as functions of the degree of hydration:
T n 0 ( t ) = T n , α ( t ) ,
T s 0 ( t ) = T s , α ( t ) ,
G c ( t ) = G c , α ( t ) ,
where T n , , T s , , and G c , are the fully matured interlayer properties. The hydration evolution governing these relationships follows a first-order kinetic law:
d α d t = k ( T ) ( 1 α ) ,
with a temperature-dependent rate constant:
k ( T ) = k 0 exp E a R T .
The delayed deposition of the upper filament was incorporated through a step function such that hydration and interlayer bond development in the upper layer commenced only after the prescribed printing time gap t g a p . This formulation enables the numerical model to capture the experimentally observed reduction in interlayer strength associated with increasing printing delay.

4. Results

4.1. Early-Age Maturity Development of 3D-Printed Concrete

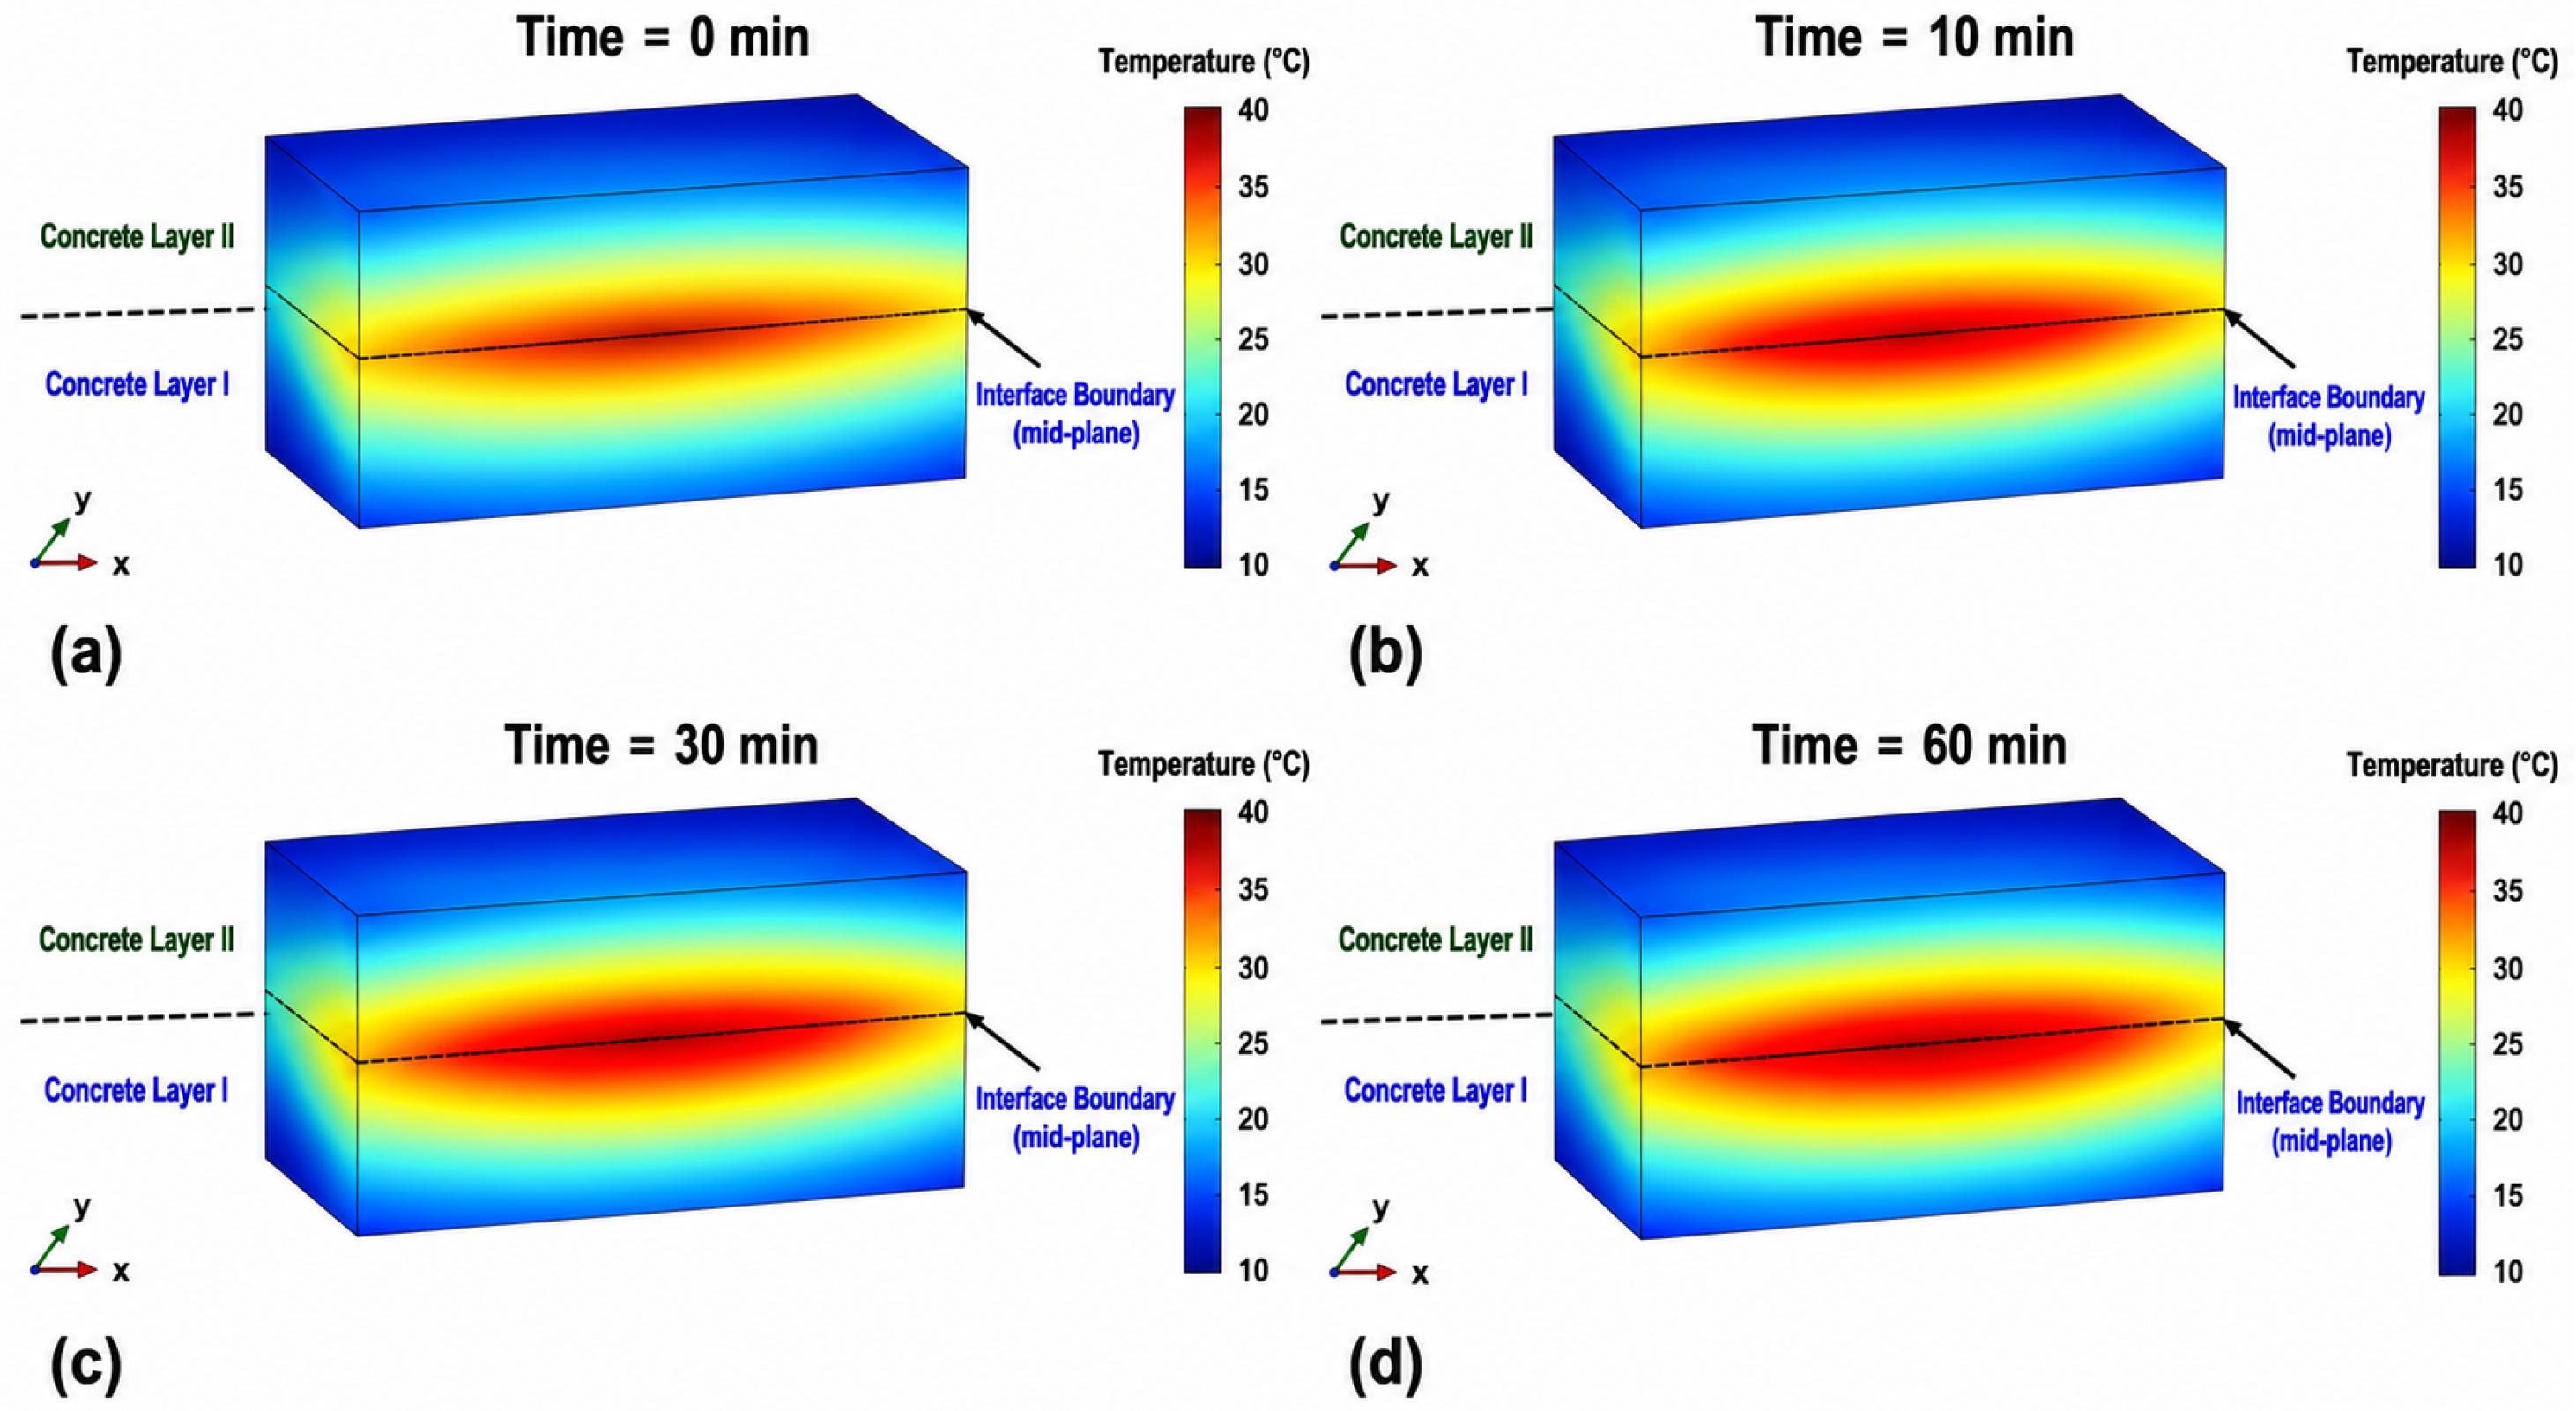
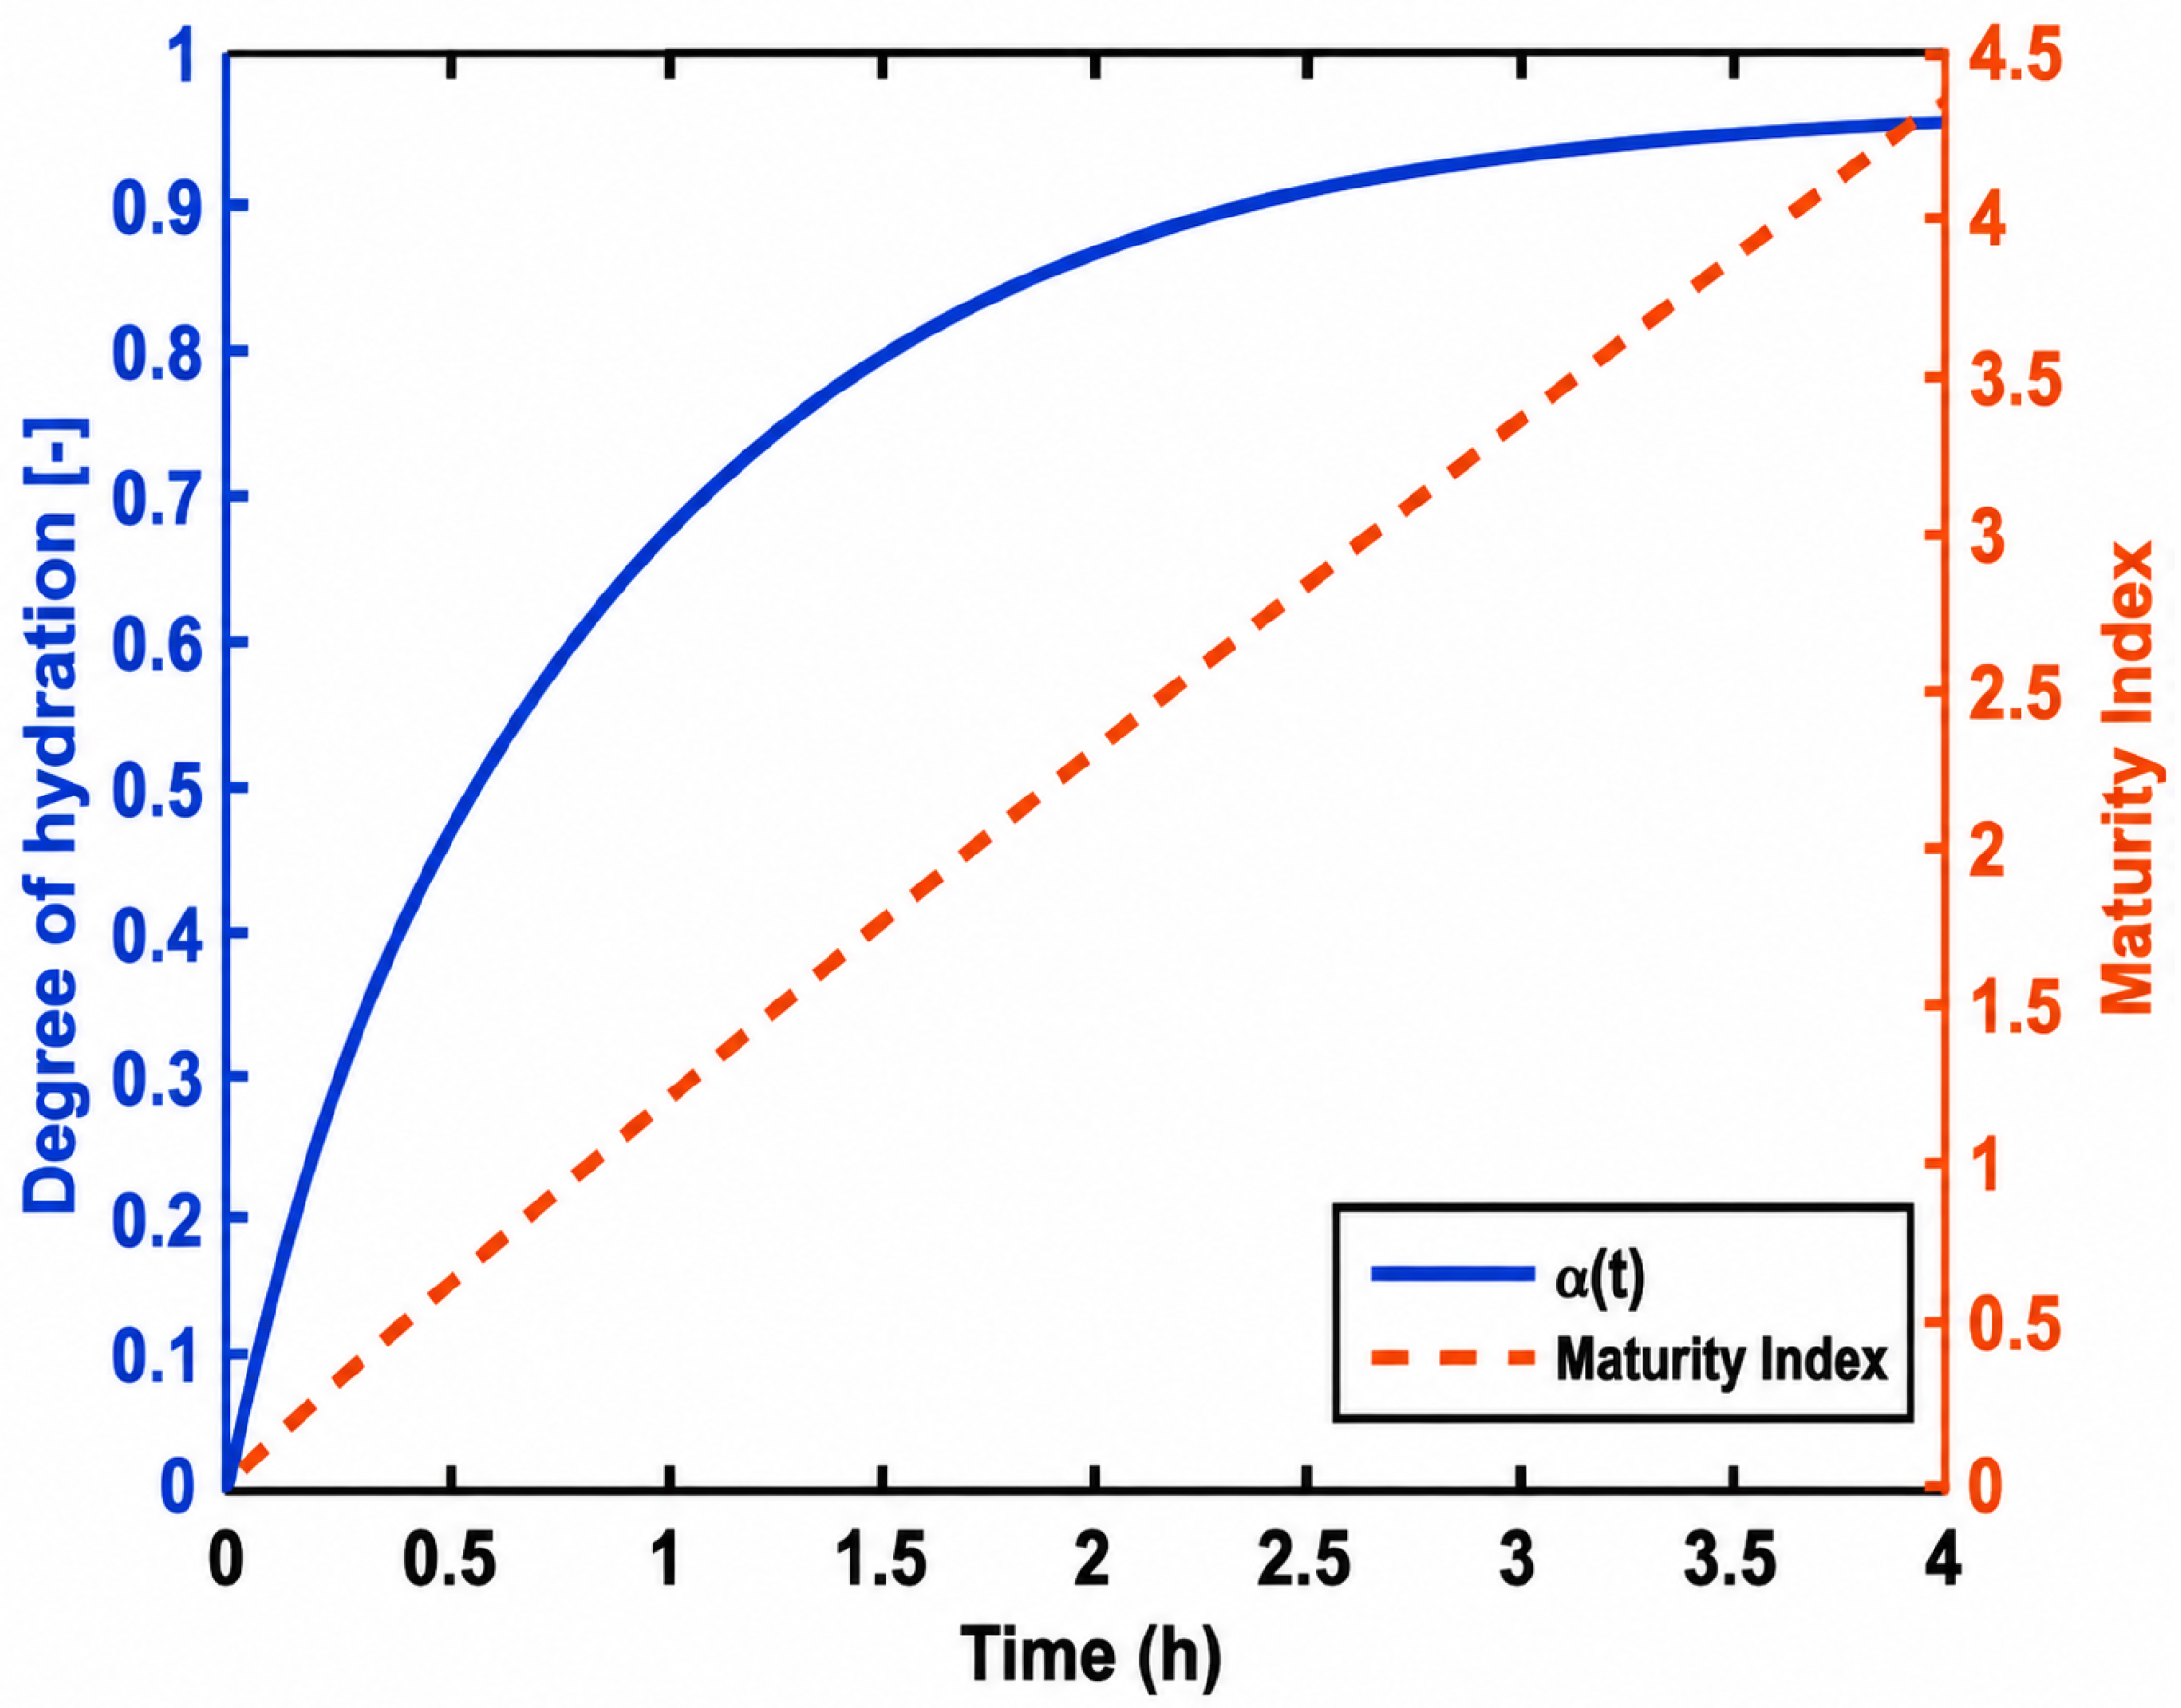
Figure 9 illustrate the transient temperature distribution within a 3D-Printed concrete simulation and Figure 10 illustrates the evolution of the degree of hydration and the associated maturity index of the 3D-printed concrete during the first four hours following deposition. The degree of hydration curve exhibits a rapid initial rise within the first 1–2 h, reflecting the dominant chemical reactions occurring as clinker phases dissolve and hydrate. This early acceleration phase marks the formation of a cohesive microstructure and the development of the green strength required to support successive printed layers. As time progresses, the hydration rate decreases and the curve approaches an asymptotic behaviour, consistent with the well-established transition from reaction-controlled to diffusion-controlled hydration.
The maturity evolution (Figure 10, plotted on the secondary axis) follows the hydration kinetics defined in Equation (7), with the nearly linear increase in maturity reflecting the temperature-dependent rate constant described by Equation (3). The maturity function provides a convenient scalar representation of the combined influence of temperature and hydration evolution on early-age thermo-mechanical behaviour. When interpreted alongside the hydration curve, the results indicate that most of the effective maturity governing early-age performance is accumulated within the first few hours, when both heat generation and hydration kinetics are at their peak. For 3D-printed concrete, this trend is particularly important: the rapid early-age development controls buildability, influences interlayer bonding performance, and dictates the transition from a pumpable and extrudable material to a load-bearing solid. Understanding this maturity evolution is therefore critical for optimising printing time gaps, ensuring geometric stability, and improving the structural integrity of layer-by-layer printed components.

4.2. Effect of Printing Time Gap on Interlayering

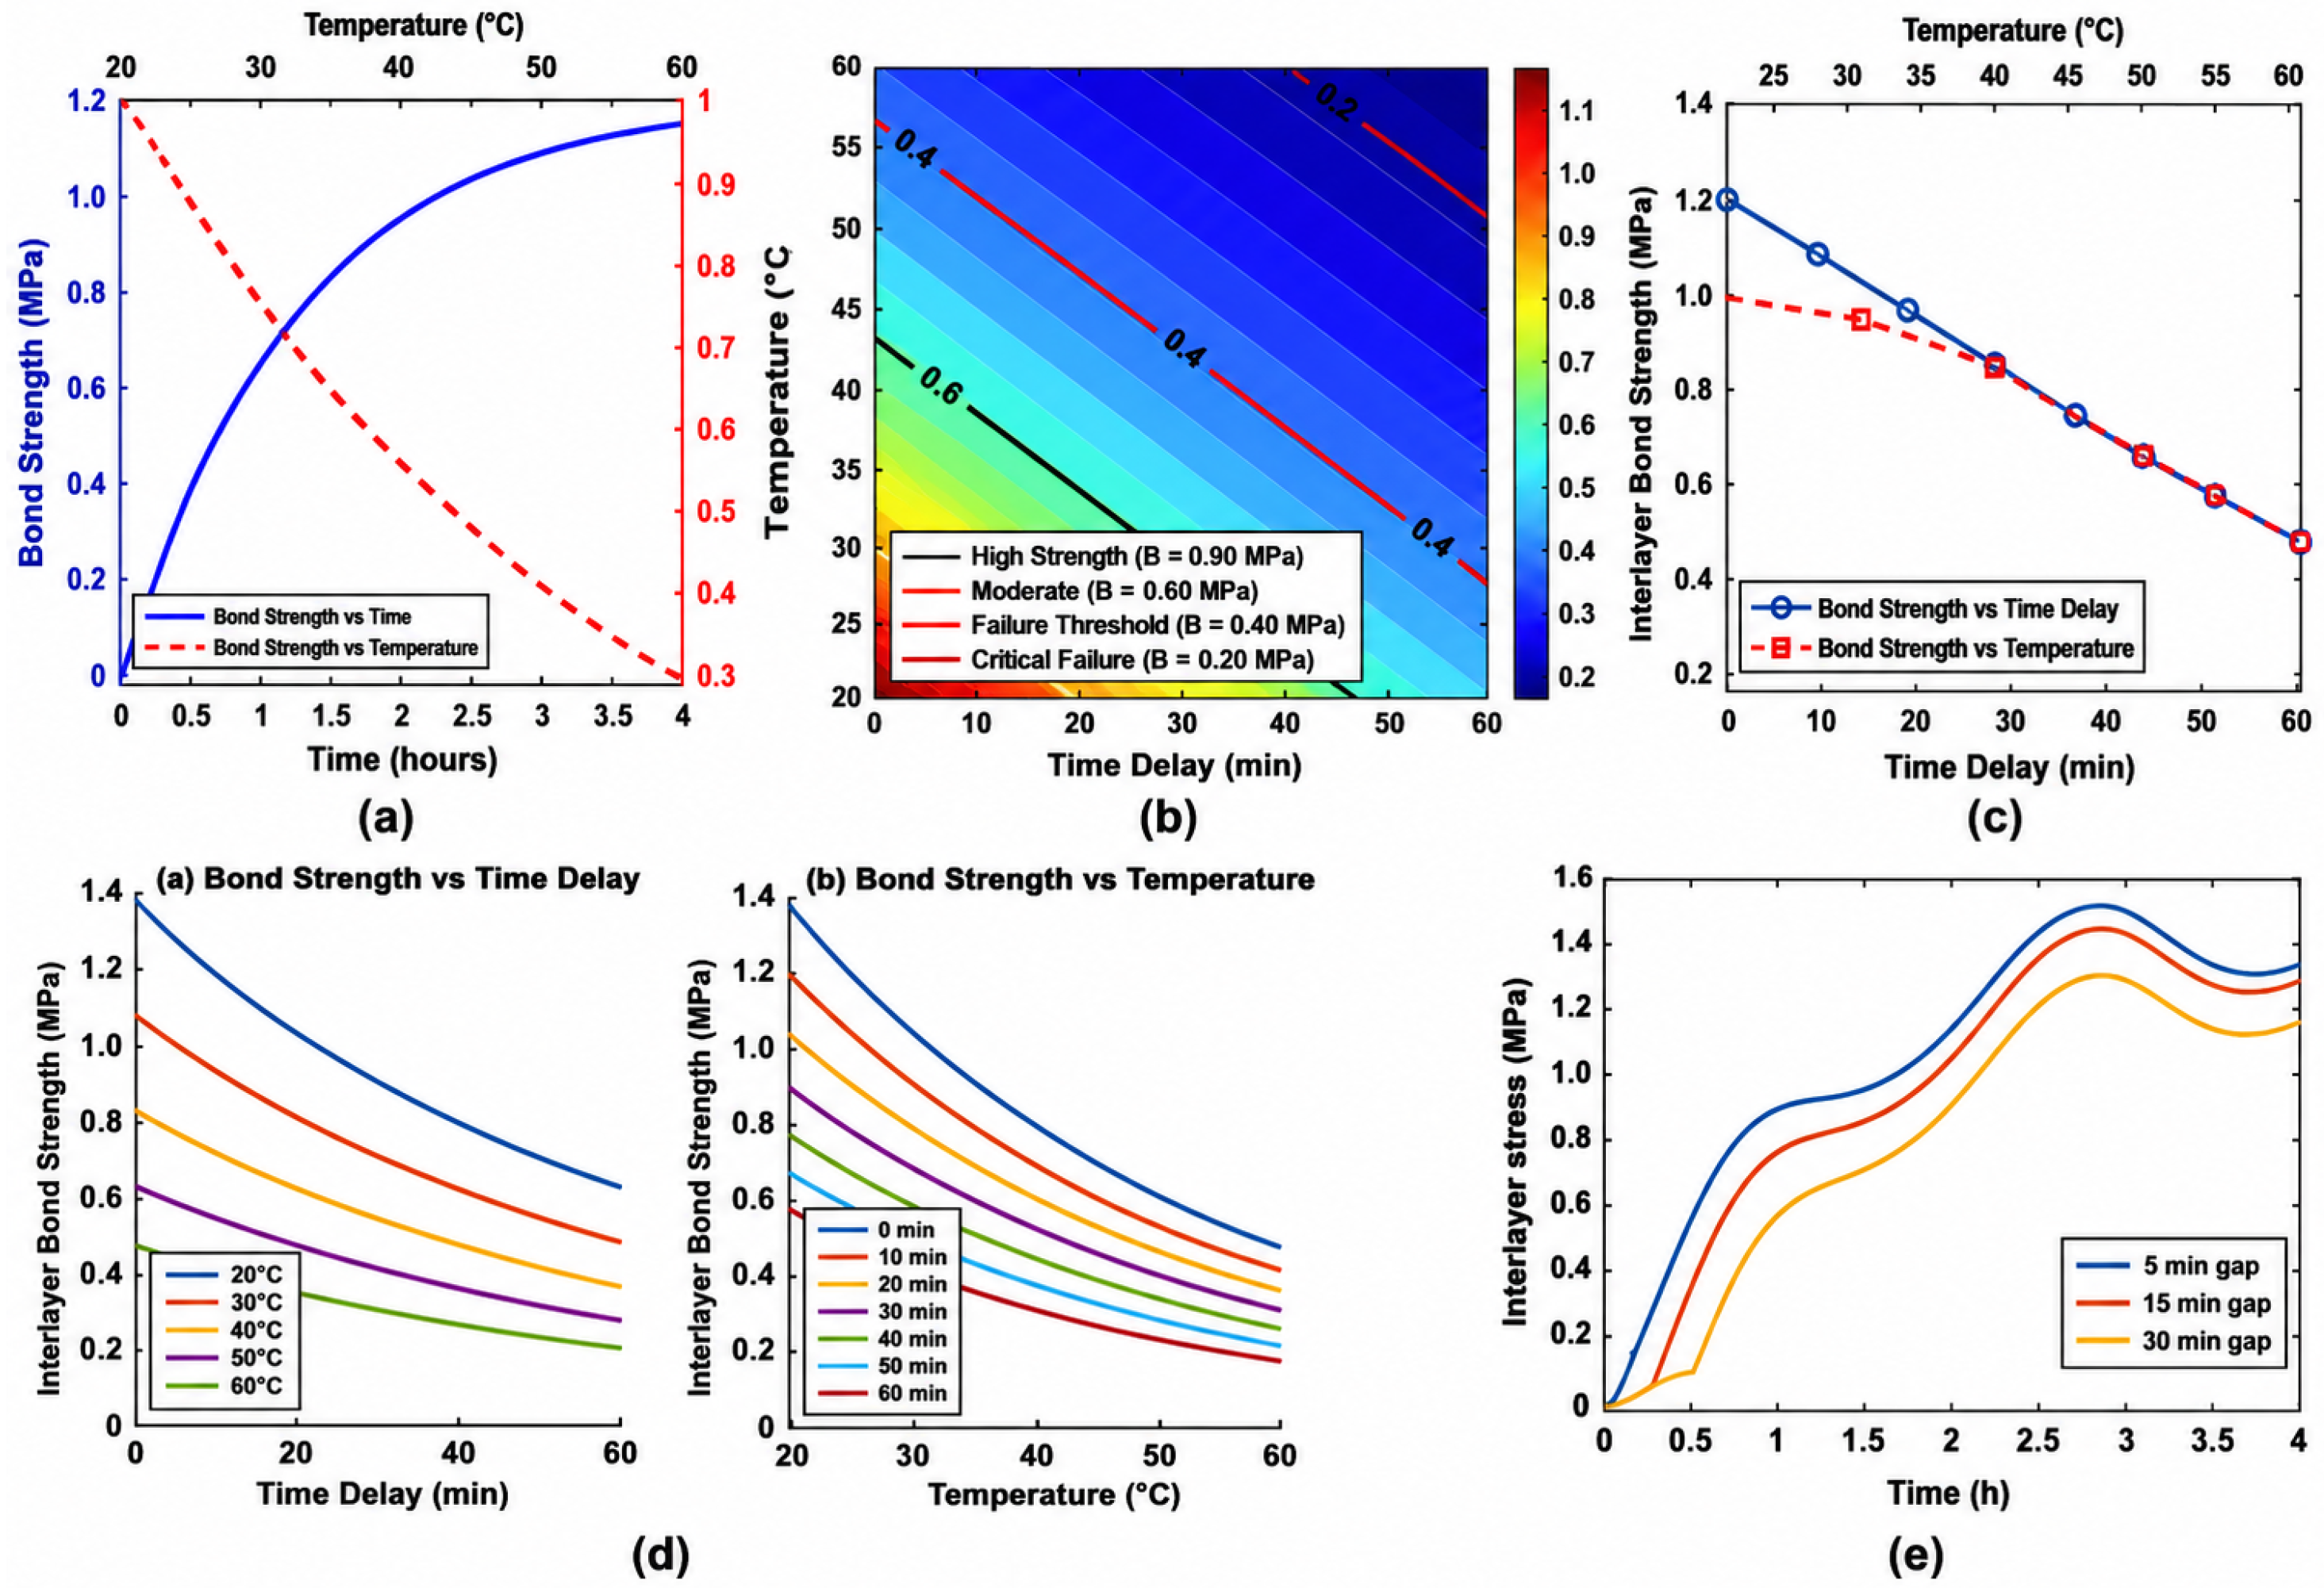
Figure 11 shows that longer time delays produce a decrease in the bond strength of the layers, with temperatures above ( Δ T 40 ° C ) intensifying the degradation due to accelerated hydration and reduced fresh–fresh contact. Figure 11b shows that even moderate temperature increases reduce the bond strength across all delay categories, with high-delay conditions (40–60 min) demonstrating the high sensitivity of 3D-printed concrete to time delay. These trends confirm that both delay and thermal exposure contribute exponentially to interlayer weakening at the early-age of printed concrete, which aligns with the failure zones identified in contour map regions combining long delays and elevated temperatures falling consistently within the simulated failure threshold (≈0.40 MPa), Figure 11b, demonstrating the importance of strict printing continuity and environmental control for maintaining structural integrity in 3D-printed concrete elements.

4.3. Interlayer Bond Strength Contour Map

The contour map of the interlayer bond strength in Figure 11b shows a strong sensitivity to the printing time delay and elevated temperature. Bond strength decreases exponentially across both dimensions, producing a clear transition from high-strength (>0.90 MPa) to moderate (0.60–0.90 MPa) and failure-prone zones (<0.60 MPa). The failure threshold of 0.40 MPa, based on simulation observation of the early-age interlayer, identifies a broad region of increased vulnerability where even small temperature increases or moderate delays significantly reduce interlayer cohesion and bond strength. Temperatures above 40 °C and delays beyond 30 min consistently fall within this failure envelope, demonstrating the compounding effect of thermal softening and hydration-driven stiffening of the substrate. The highest-risk region occurs when delays exceed 45 min at elevated temperatures, where predicted bond strength falls below 0.20 MPa, indicating a severe loss of fresh–fresh adhesion. These results highlight the importance of controlling environmental conditions and minimising printing interruptions to maintain structural continuity in 3D-printed concrete.

4.4. Interlayer Bond Strength as a Function of Time Delay and Temperature

The results in Figure 11 demonstrate that the interlayer bond strength is highly sensitive to both the printing time delay and the temperature. The reduction in interlayer bond strength with increasing printing time gap is consistent with the time-dependent evolution of interfacial properties defined in Equations (12)–(14), which directly link bond strength and fracture energy to the degree of hydration. This behaviour is consistent with typical early-age kinetics in 3D-printed concrete, where interlayer cohesion depends strongly on fresh–fresh contact and the availability of unhydrated binder at the interface. Temperature exerts a similarly detrimental influence: elevated temperatures accelerate surface drying and hydration, reducing moisture availability and weakening the chemical bridge between layers. The 3D surface and contour plots in Figure 11b illustrate a clear interaction between delay and temperature, with the combined effects producing a steep transition into a low-bond-strength “failure zone.”
Figure 11c shows that as the interval extends to 30 min, partial cooling of the lower layer reduces the thermal overlap and lowers the degree of hydration at the contact surface. The interface becomes stiffer and less reactive, generating a moderate temperature difference of about 40 °C and an 18 % reduction in bond strength relative to continuous deposition. When the delay reaches 60 min, the lower layer has almost fully dissipated its hydration heat, with Δ T exceeding 25 °C. Under these conditions, interlayer hydration becomes discontinuous, micro-porosity forms along the interface, and the predicted bond strength falls by nearly 38%. Both the experimental and simulated results confirm this monotonic reduction in interfacial strength with increasing printing time gap.

4.5. Force–Crack Propagation Behaviour

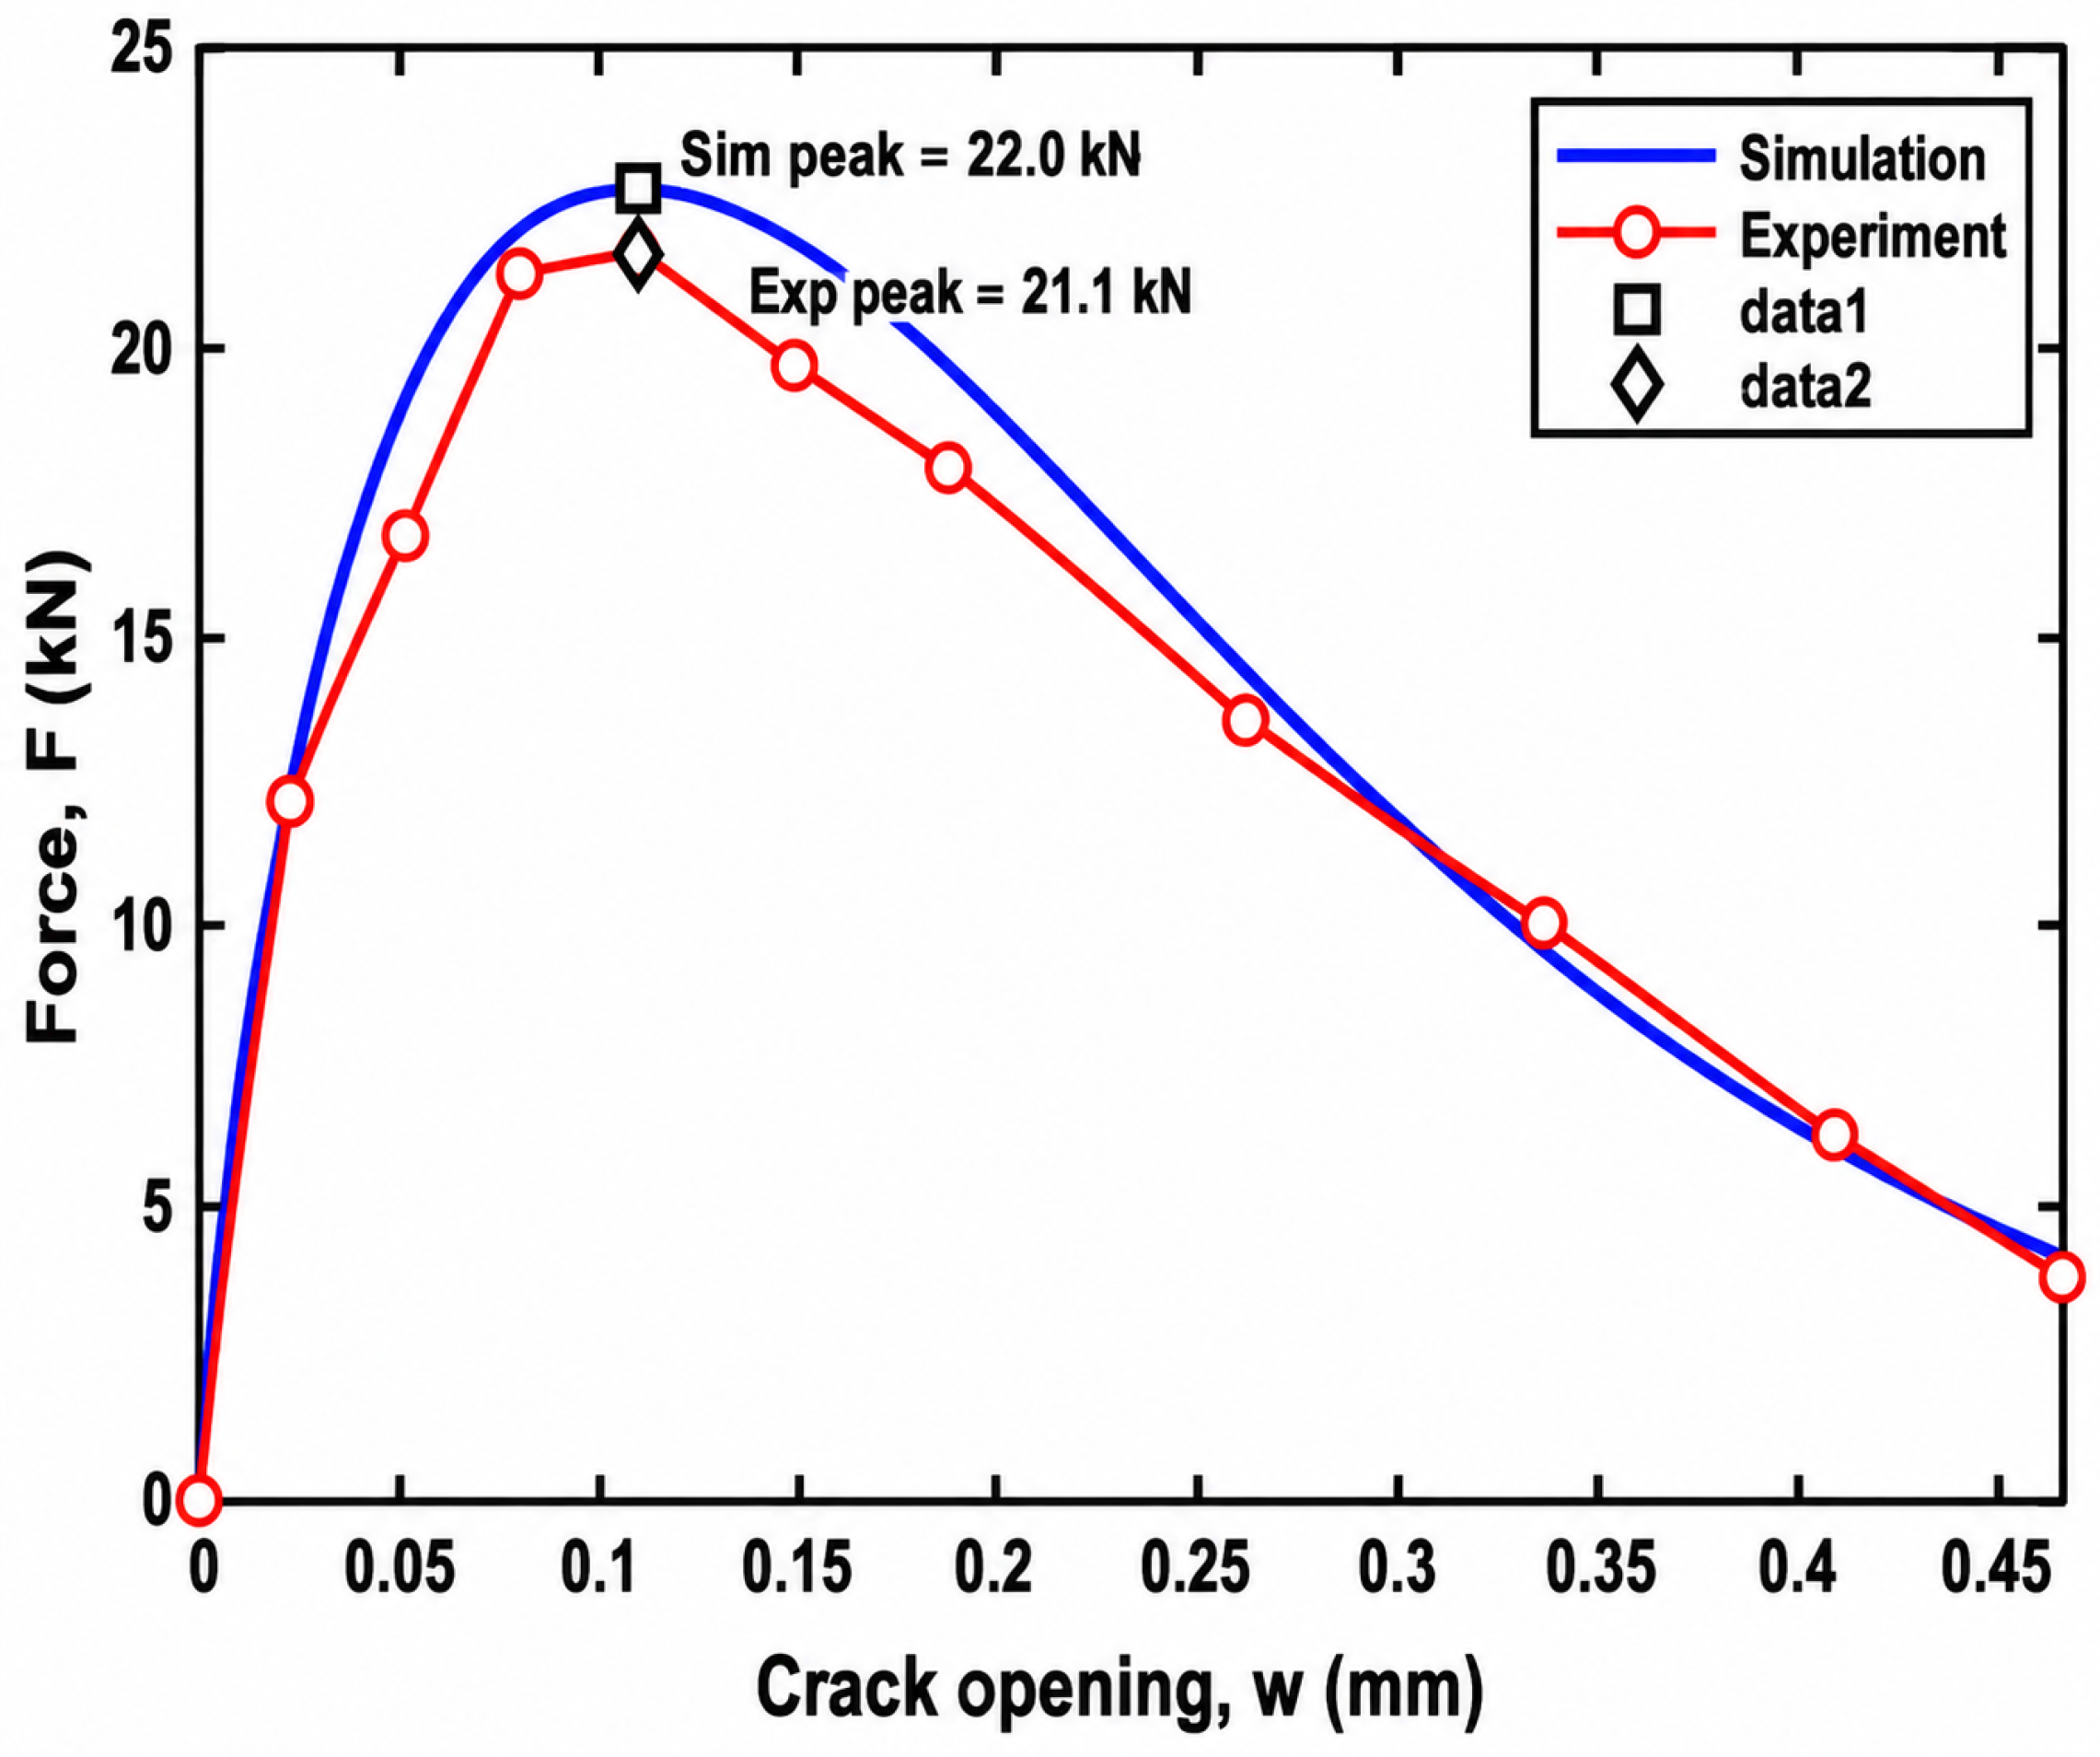
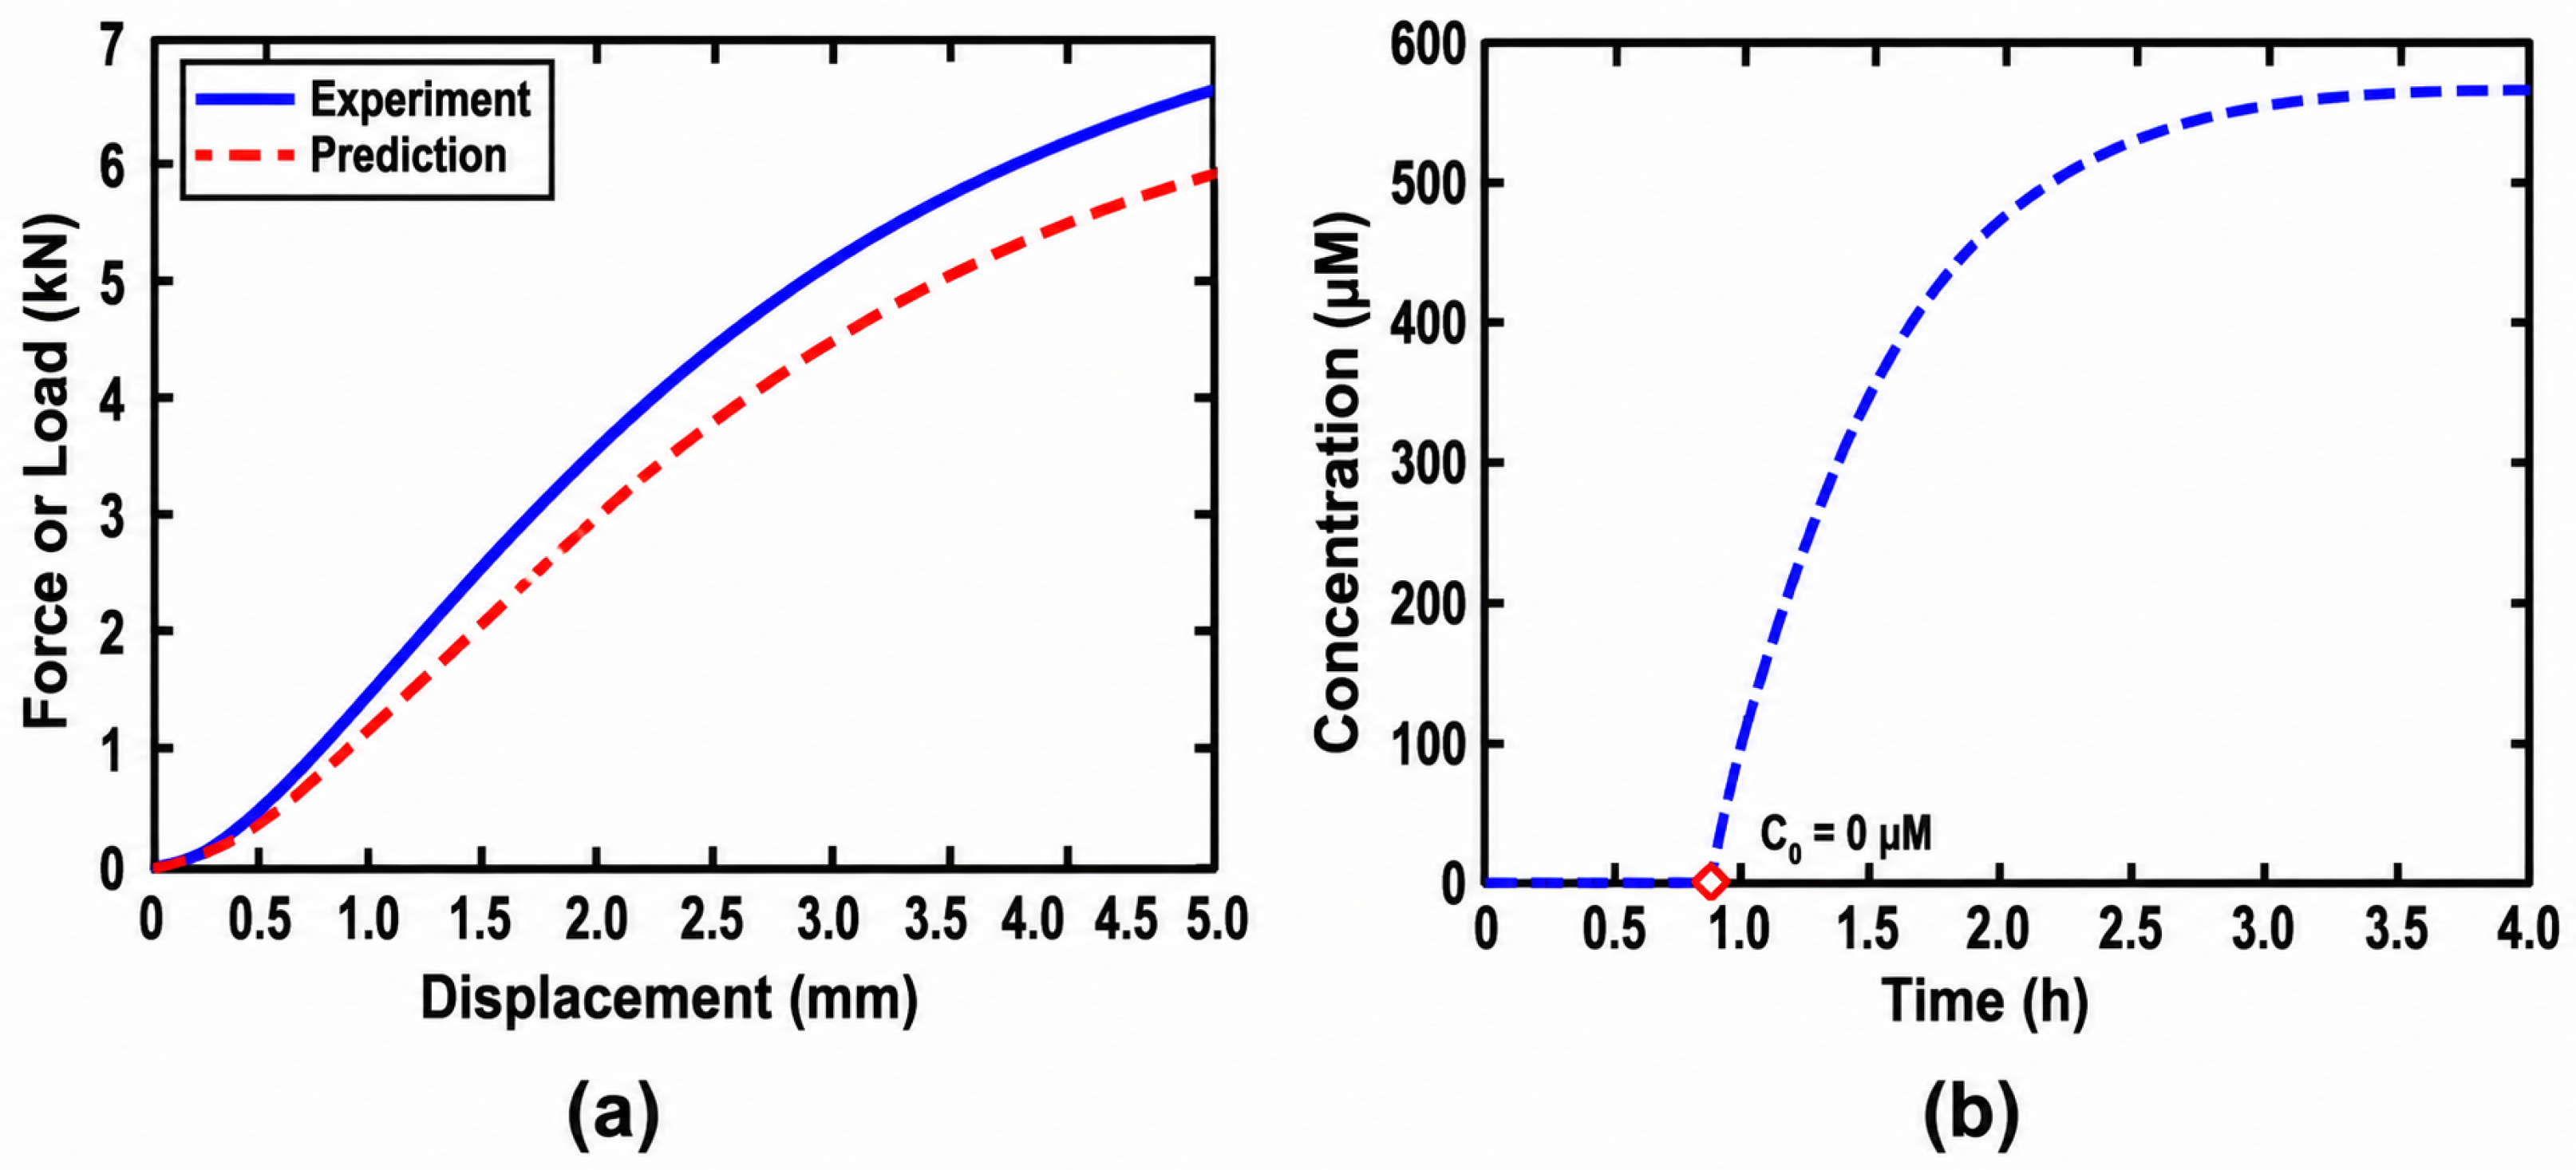
Figure 12 shows the force–crack propagation response on early-age 3D-printed concrete which shows good agreement between simulated and experimental force–crack responses. The force–crack opening displacement (F–CMOD) response exhibits a distinct peak followed by gradual softening, characteristic of quasi-brittle fracture behaviour. The numerical model slightly overestimates the peak force compared with the tests (by approximately 0.9%).
The initial linear portion of the force–crack opening displacement (F–CMOD) response corresponds to the elastic stiffness predicted by the time-dependent Young’s modulus given in Equation (8), while the post-peak softening behaviour is governed by the cohesive traction–separation law defined in Equation (10).
As shown in Figure 12, the simulated response closely follows the experimental trend, confirming the predictive capability of the thermal–mechanical framework. The initial linear region up to approximately 0.05 mm displacement corresponds to elastic deformation dominated by uniform stiffness growth during early hydration. The subsequent nonlinear region reflects the initiation and propagation of thermal microcracks caused by differential cooling between layers and the development of tensile zones at the interface. Peak load values reach approximately 22 kN in the simulation and 21.1 kN in the experiment, with both showing a similar softening slope after cracking, indicating good agreement in fracture energy and post-peak ductility. The root mean square error between the simulated and measured force values along the softening branch remains small (RMSE(softening) ≈ 0.30–0.45 kN).
The correlation between numerical and experimental data validates the implemented temperature-dependent constitutive model, demonstrating that the simulated thermal stress distribution accurately represents the physical behaviour of the printed material. This agreement confirms that the mechanical response of 3D-printed concrete at early-age is strongly influenced by local temperature gradients and hydration-driven stiffness evolution. Controlling these gradients through optimised layer scheduling, cooling management, and fibre reinforcement is therefore essential to minimise residual thermal stresses and prevent premature cracking in printed elements.
The degree of hydration increased rapidly during the first 6 h, reaching 60% completion within 24 h. Figure 10 illustrates spatial variation of α across layers for different printing intervals. Temperature and hydration gradients were most pronounced at interfaces subjected to long printing time gaps, correlating with micro-voids observed in physical samples.
Nevertheless, the close match between the numerical and experimental force–crack opening displacement (F–CMOD) response curves confirms that the implemented constitutive model, including time-dependent stiffness and fracture properties, is suitable for describing early-age fracture behaviour in 3D-printed concrete. This level of agreement provides confidence in using the model to investigate the influence of printing time gap, temperature history, and interlayer bond quality on structural performance under tensile and flexural loading. The experimental curve shown in Figure 12 represents the average response obtained from three repeated tests conducted under identical conditions. The root mean square error (RMSE) was calculated using the pointwise difference between simulated and experimental force values along the post-peak softening branch:
RMSE = 1 n i = 1 n F sim , i F exp , i 2
where F sim , i and F exp , i denote the simulated and experimental force values at each measurement point.

4.6. Thermal Stress Distribution and Crack Initiation

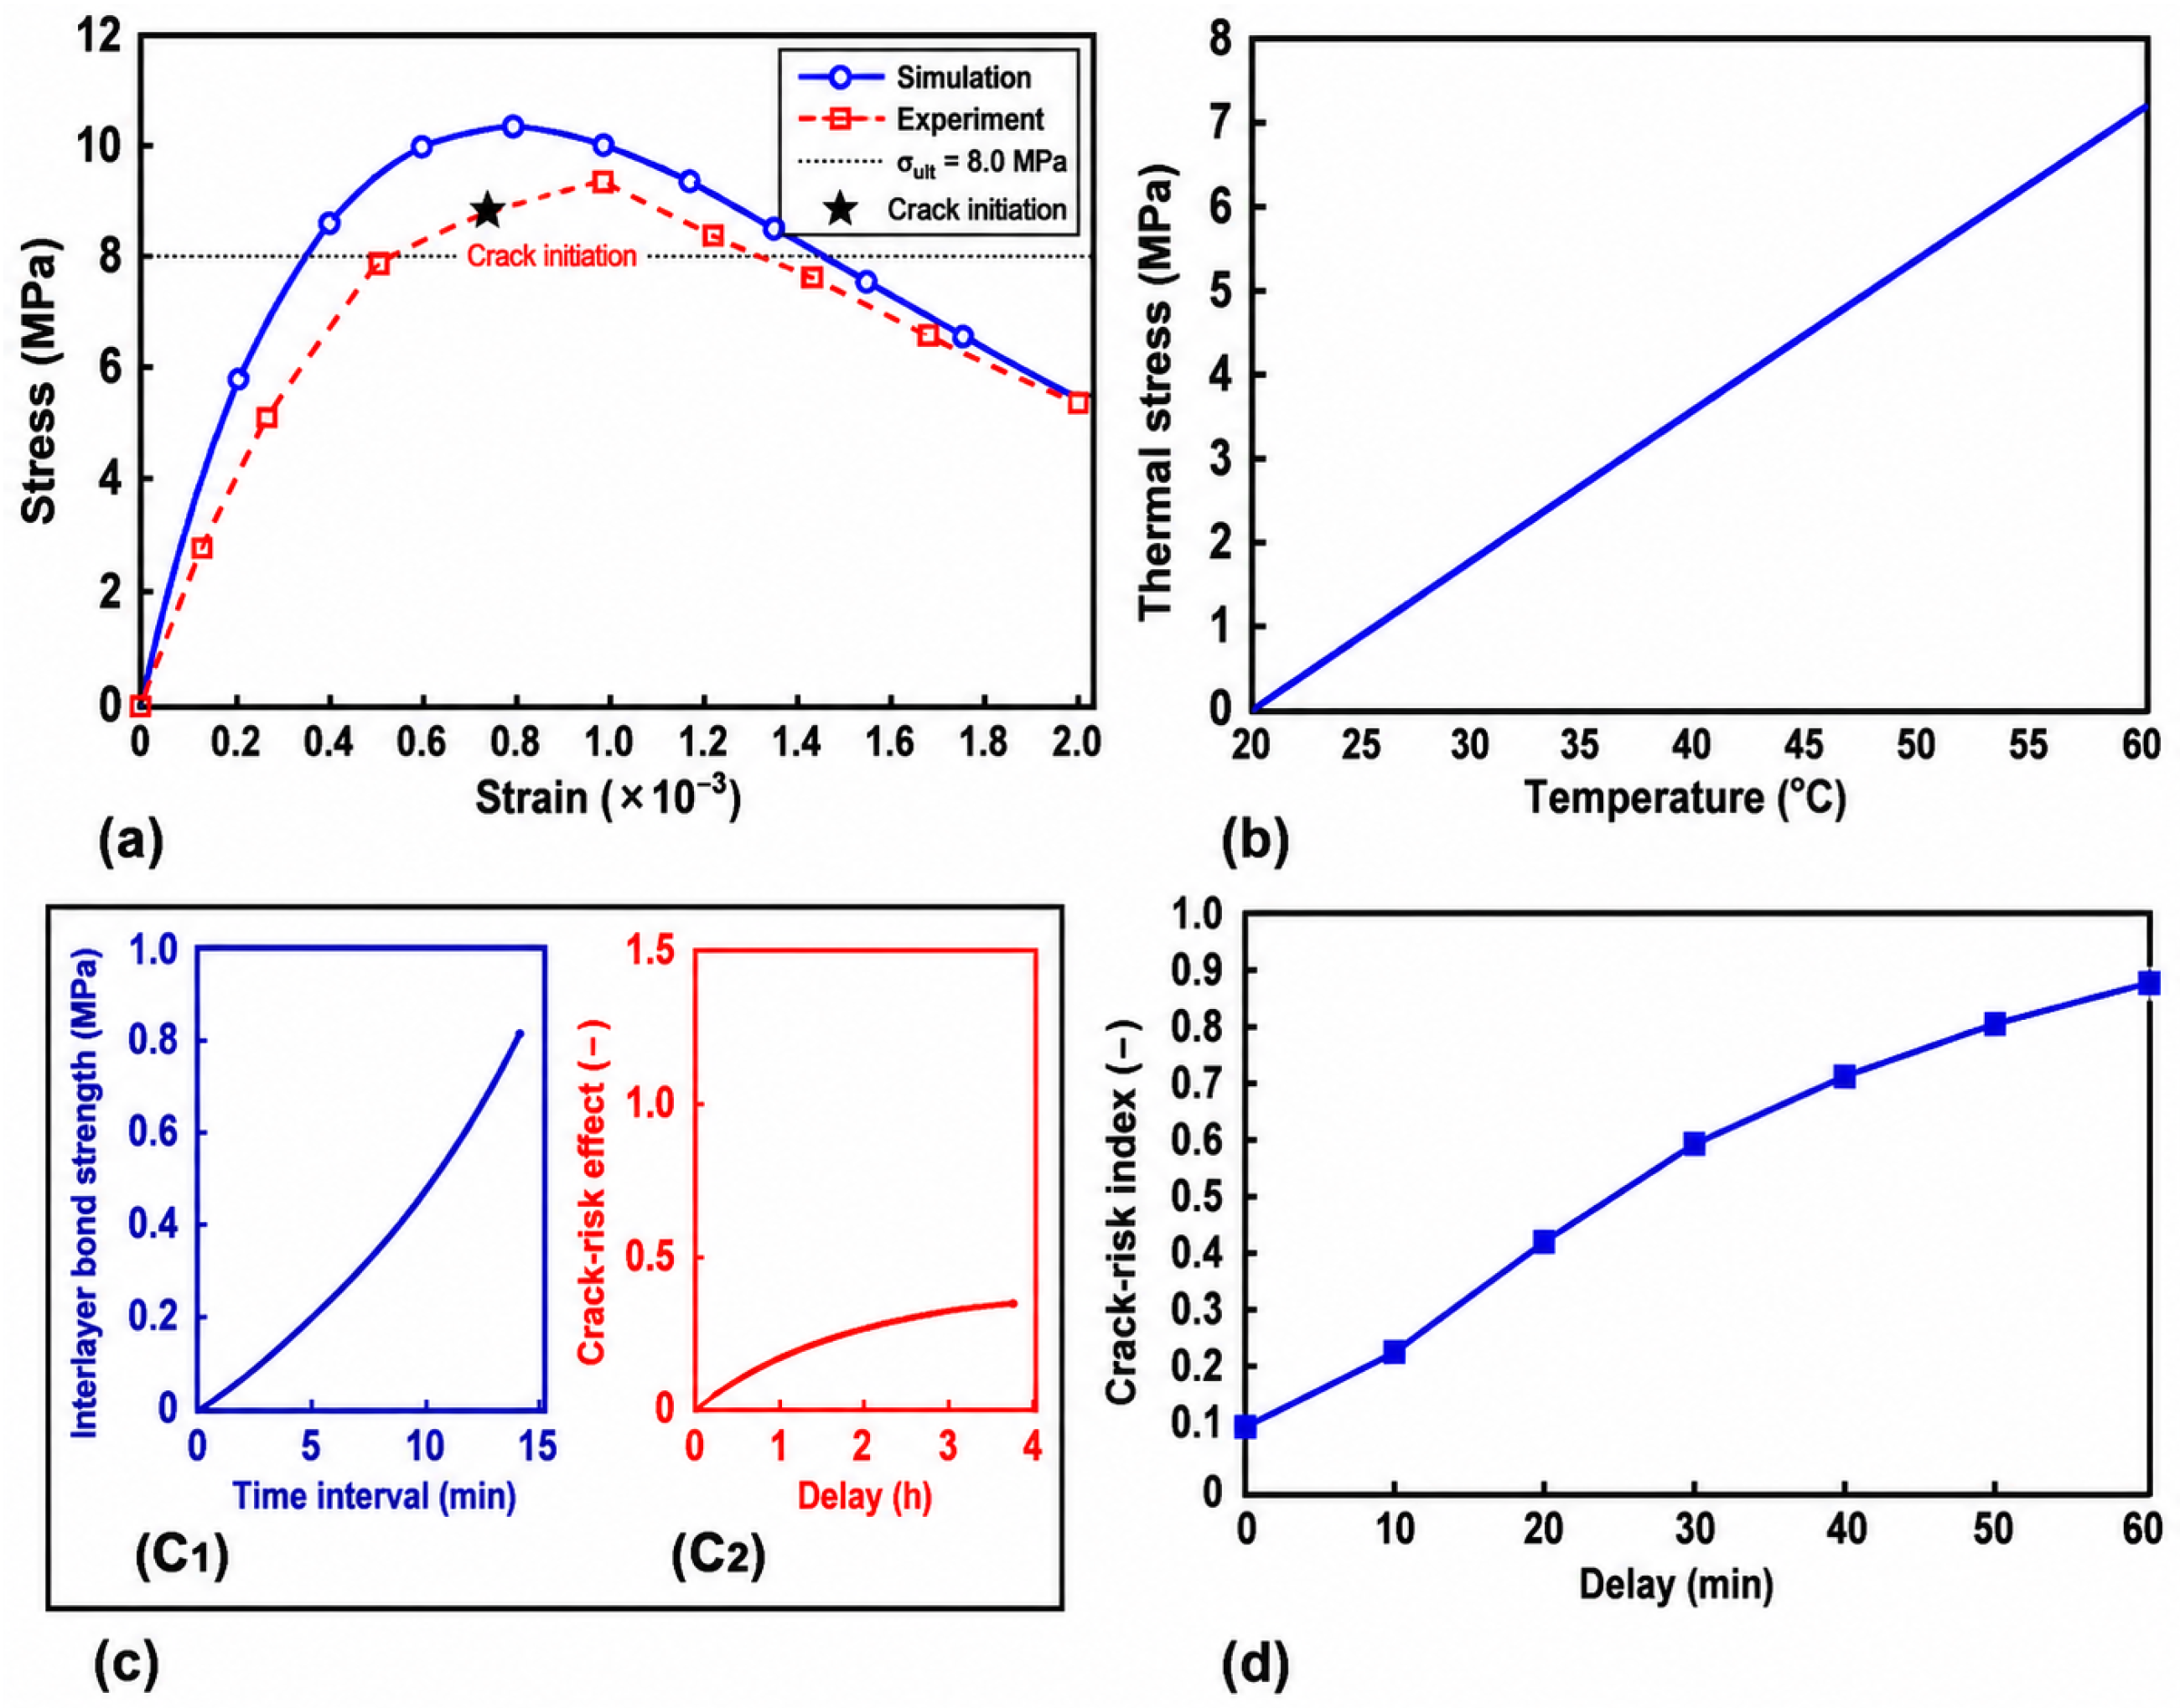
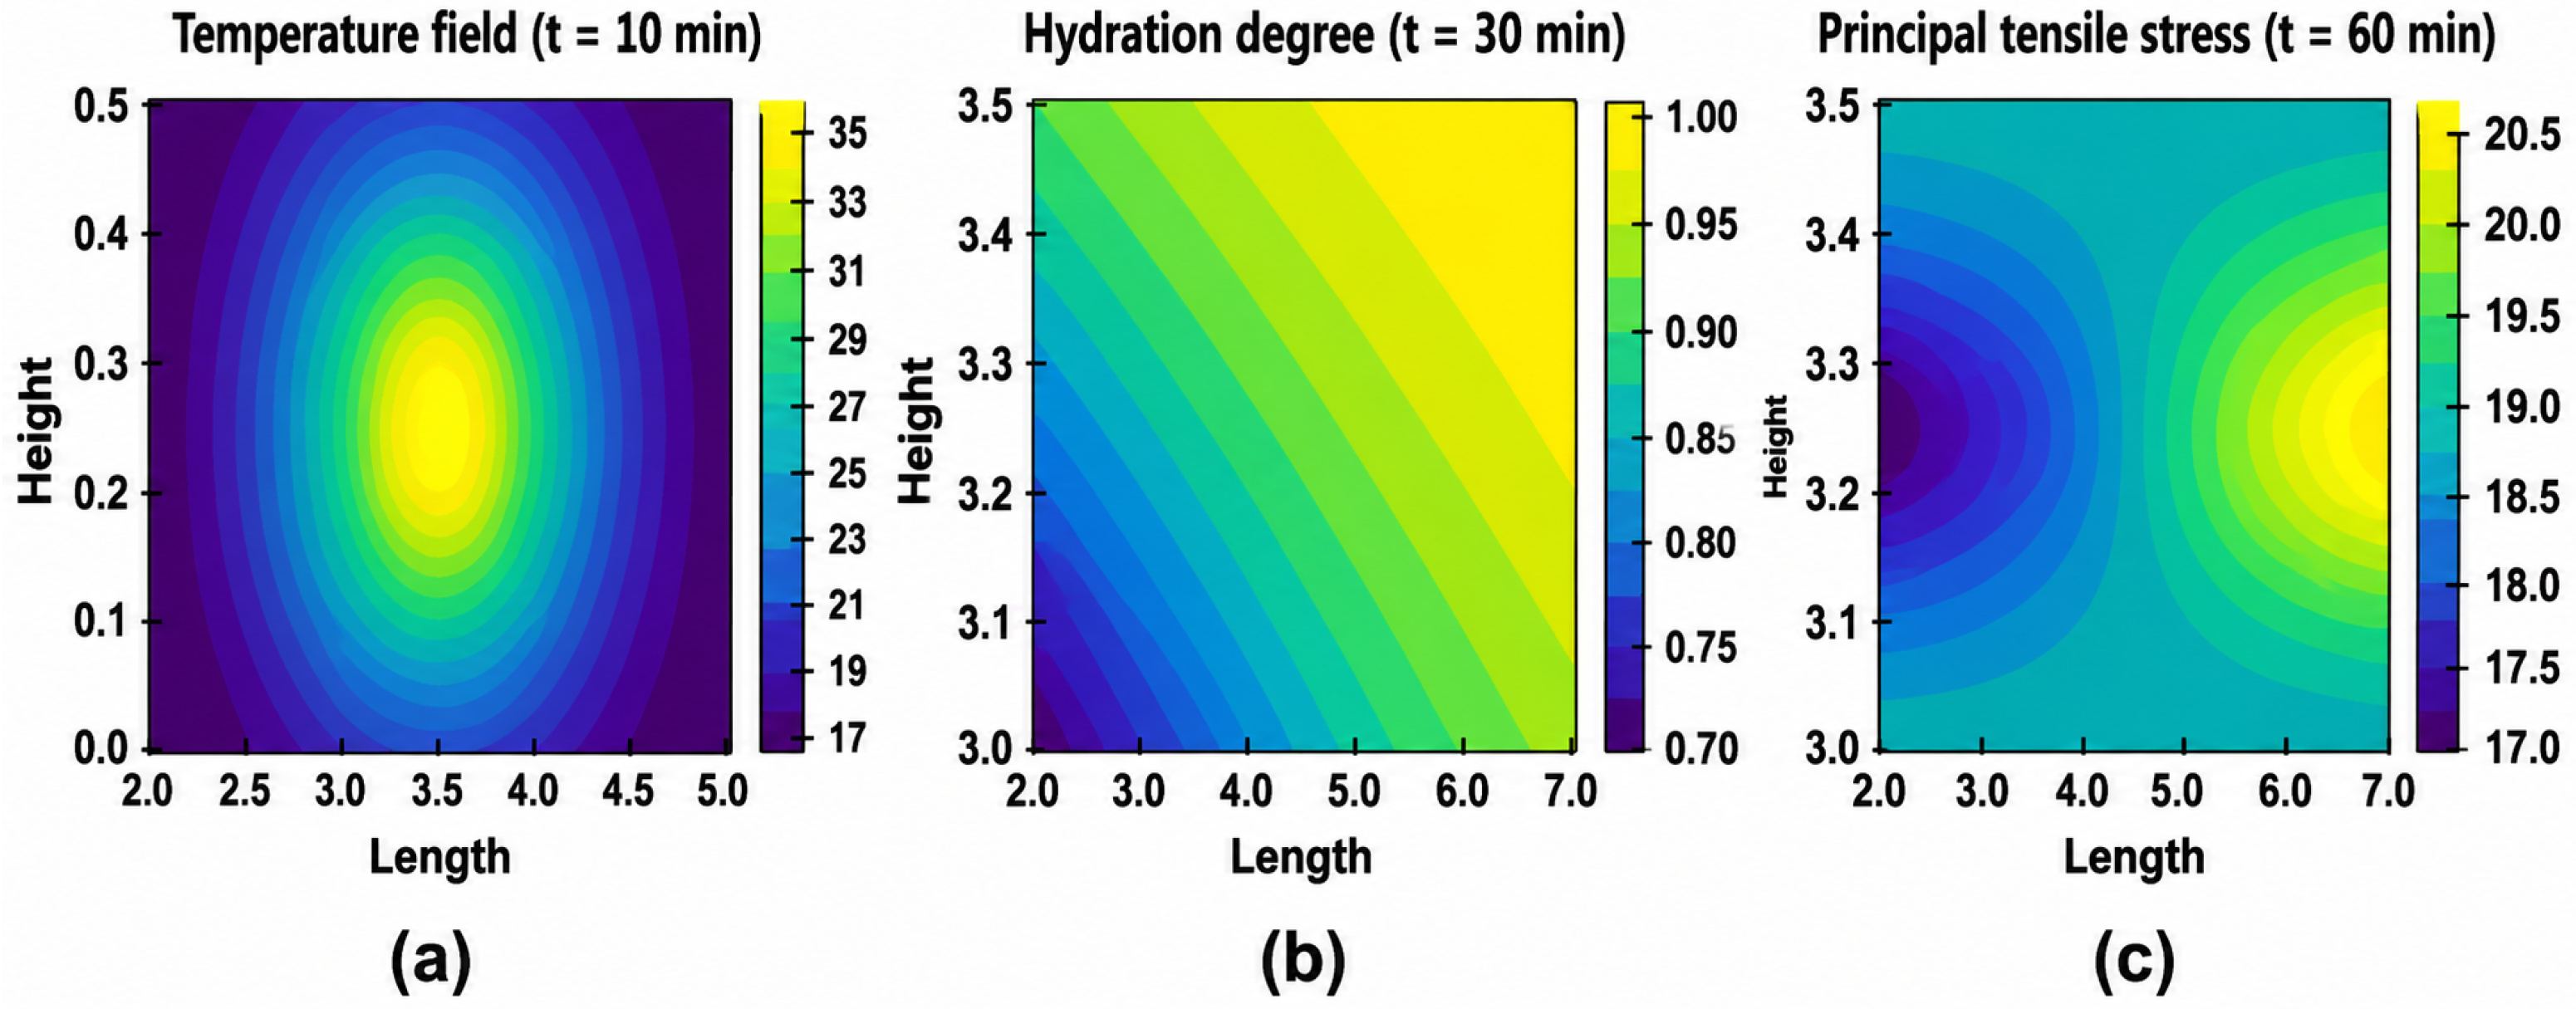
The thermal gradients responsible for crack initiation arise from the internal heat generation term in Equation (5), with restrained deformation occurring as stiffness evolves according to Equation (8). Figure 13 illustrates the coupled effects of time-dependent temperature gradients and the evolution of stiffness on the onset of thermal stresses and cracking in 3D-printed concrete of early-age. As successive layers undergo hydration, the exothermic heat release induces non-uniform temperature distributions through the printed element. The lower layers cool and contract while newly deposited material remains relatively warm and expands, generating restrained tensile stresses at the interfaces. This mismatch produces localised strain accumulation that may exceed the developing tensile strength of the early-age matrix, leading to interfacial cracking. To complement the interface-based results shown in Figure 13, full-field spatial contour plots are presented in Figure 14. These results clearly illustrate the coupling between hydration-induced heat generation, temperature gradients, and stress localisation. At early times, the temperature field remains relatively uniform; however, as hydration progresses, spatial gradients develop due to differential heat evolution between layers. This leads to progressively localised tensile stress concentrations at the interlayer interface, which correspond to the regions of highest crack susceptibility identified in Figure 13c. The combined analysis confirms that thermo-mechanical interaction plays a governing role in early-age cracking behaviour.
In Figure 13c, interlayer bond strength increases with shorter printing intervals due to continuous hydration and good thermal overlap between layers. However, when the printing time gap extends, the lower layer stiffens and loses reactivity, resulting in reduced bonding and higher thermal mismatch. Figure 13c confirms that crack susceptibility rises progressively with increasing delay time, as indicated by the growth in the crack-risk index from 0.1 at 0 min to nearly 0.9 at 60 min. These findings demonstrate that longer pauses between successive print passes allow substantial cooling and shrinkage of the lower layers, which significantly elevates the tensile stress concentration within the interfacial region.

4.7. Early-Age Mechanical Evolution of 3D-Printed Concrete

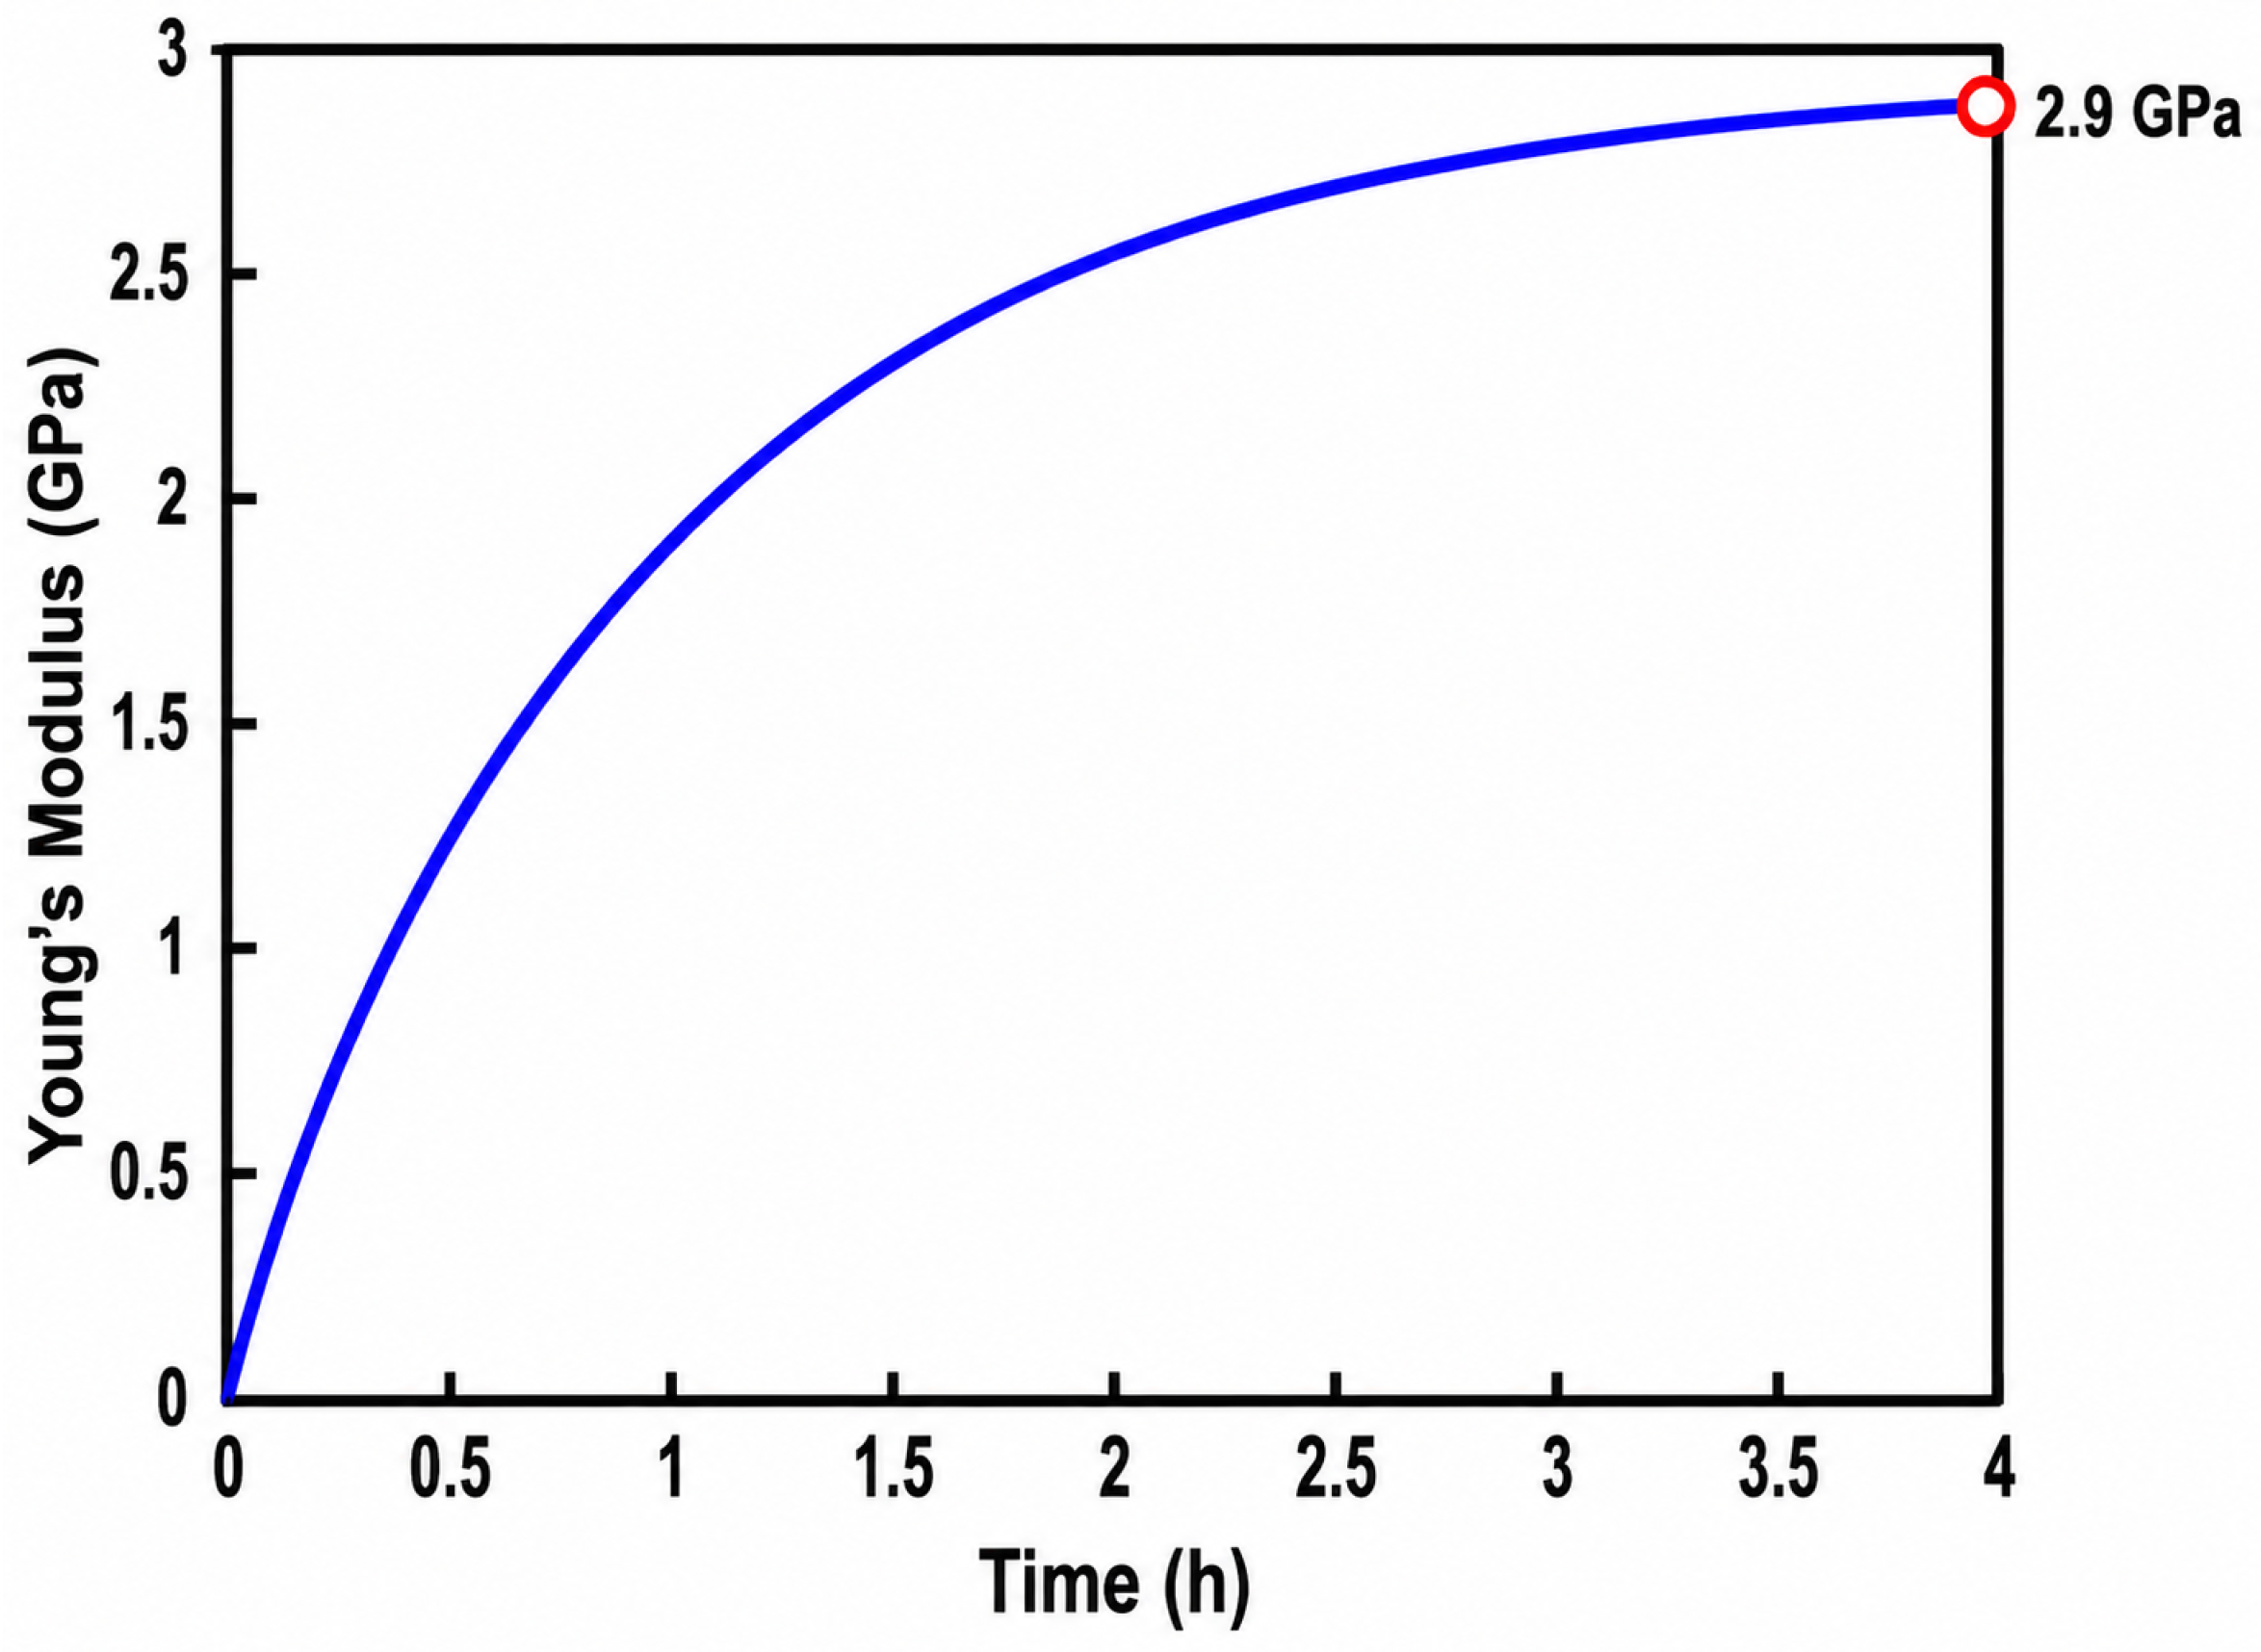
Figure 15 illustrates the evolution of the Young’s modulus of 3D-printed concrete within the first 24 h after printing. The results show a rapid increase in stiffness during the early hydration period, reflecting the transition of the material from a fresh, plastic state to a hardened, load-bearing structure. The rapid increase in Young’s modulus during the first 2–3 h is accurately captured by the hydration-dependent formulation in Equation (8), confirming the strong coupling between hydration progress and stiffness development at early-age. This early gain in rigidity is crucial for buildability, as it determines the material’s ability to support successive layers without deformation or collapse.
Between 3 and 4 h, the modulus continues to increase, reaching approximately 29 GPa as the hydration process progresses through the acceleration phase. During this period, the microstructure becomes denser and capillary porosity begins to close, producing a significant improvement in both elastic stiffness and compressive strength. The temperature rise observed in the corresponding thermal history curves contributes to faster hydration kinetics, further accelerating the mechanical development. Figure 15 illustrates the evolution of Young’s modulus during the first four hours after printing, corresponding to the acceleration phase of hydration and rapid stiffness development.

4.8. Energy Release and Failure Modes During Crack Propagation in 3D-Printed Concrete

Figure 16 illustrates the variation in energy release as a function of crack propagation length in 3D-printed concrete. The progressive increase in energy release with crack length reflects the cumulative dissipation of strain energy stored in the material as cracking advances. At the onset of cracking (below 2 mm), the energy release rate remains low, indicating that microcracks are confined to the interfacial transition zones and the weaker interlayer regions. As the crack extends, energy demand rises steeply, signifying the activation of multiple fracture processes including micro-bridging and matrix tearing.

5. Validation

Although good overall agreement was achieved, small discrepancies remain between the experimental and numerical responses (Table 6). These differences may be attributed to local material heterogeneity, variability in interlayer contact conditions, simplified representation of the printed geometry, and the omission of coupled moisture transport and shrinkage effects. In addition, the two-layer numerical simplification may underestimate cumulative thermal restraint effects present in the experimental four-layer specimens.

6. Discussion

The results show that the early-age behaviour of 3D-printed concrete is governed by a tightly coupled interaction between hydration kinetics, thermal evolution, and interlayer deposition conditions. Unlike conventionally cast concrete, which exhibits relatively homogeneous material development, extrusion-based 3D printing introduces inherent anisotropy and temporal discontinuities that significantly amplify sensitivity to both time-dependent and temperature-dependent processes.
The rapid increase in maturity and stiffness observed during the first few hours after deposition (Figure 10) confirms that early hydration governs the transition from a printable to a load-bearing state. This behaviour is consistent with established hydration theory; however, the present study extends existing knowledge by explicitly linking this stiffness evolution to interlayer bond formation and thermally induced stress development. The results indicate that early-age stiffness is not only a function of hydration progress but also a controlling factor in the mechanical compatibility between successive layers.
A central finding of this work is the pronounced reduction in interlayer bond strength with increasing printing time gap (Figure 11). While previous studies have primarily attributed this reduction to surface drying and loss of fresh–fresh contact, the present results provide a more comprehensive explanation. Specifically, the progressive stiffening of the previously deposited layer, driven by hydration, reduces interfacial deformability and limits chemical bonding. This transition from a cohesive, chemically active interface to a mechanically dominated, frictional interface results in a significant loss of bonding efficiency. The exponential decay in bond strength observed across increasing time delays therefore reflects not only interfacial conditions but also the evolving bulk material properties.
Temperature effects further intensify this behaviour. Elevated curing temperatures accelerate hydration kinetics, leading to faster strength development, but simultaneously increase thermal gradients within the layered system (Figure 13). These gradients induce restrained deformations between adjacent layers, generating tensile stresses that may exceed the developing tensile strength of the material. This mechanism is consistent with thermal cracking in conventional concrete, but is exacerbated in 3D-printed systems due to the presence of weak interlayer interfaces and anisotropic structural behaviour. The combined influence of time delay and temperature thus creates a critical interaction, where accelerated hydration and reduced interfacial compatibility act simultaneously to degrade structural integrity.
When the deposition delay approaches the experimentally determined final setting time (approximately 60 min), the interfacial bonding mechanism transitions from predominantly chemical fresh–fresh adhesion toward a mechanically governed interaction characterised by frictional resistance, limited hydration continuity, and mechanical interlocking. Under these conditions, the lower layer has undergone substantial stiffening and thermal dissipation, significantly reducing the availability of unhydrated binder and moisture required for effective chemical bonding. Consequently, the interface behaves increasingly as a cold joint rather than a monolithic hydrated transition zone.
The contour map of interlayer bond strength (Figure 11b) provides further insight into this interaction, identifying a clear transition from high-strength to failure-prone regions. The results show that temperatures above approximately 40 °C combined with deposition delays exceeding 30 min consistently lead to bond strength values within the failure threshold (<0.40 MPa). This demonstrates that printing time gap and curing temperature must be controlled simultaneously, as their coupled effect governs interlayer failure risk.
The strong agreement between numerical predictions and experimental force–crack opening displacement (F–CMOD) responses (Figure 12) validates the proposed modelling framework. The model accurately captures both peak load and post-peak softening behaviour, indicating that the incorporation of hydration-dependent stiffness evolution and cohesive interface modelling is essential for representing early-age fracture behaviour. This represents a significant improvement over existing approaches that treat interlayer bonding as static or empirically defined, without accounting for its time-dependent evolution.
Thermal stress analysis (Figure 13 and Figure 15) further reveals that crack initiation is primarily driven by the mismatch in thermal and mechanical states between layers. As the printing time gap increases, the previously deposited layer undergoes cooling and stiffening, while the newly deposited layer remains thermally active. This mismatch produces localised tensile stress concentrations at the interface, which act as preferential sites for crack initiation. The increase in crack-risk index with deposition delay confirms that interlayer timing is a dominant parameter controlling early-age cracking behaviour.
From a practical standpoint, the findings provide clear guidance for process optimisation. Maintaining interlayer deposition intervals below approximately 30–40 min is essential to preserve hydration continuity and minimise stiffness mismatch. In addition, controlling environmental conditions—particularly temperature—is critical to reducing thermal gradients and associated residual stresses. These findings are consistent with the experimental trends observed across all test conditions and provide quantitative thresholds for practical implementation.
Despite these contributions, several limitations should be acknowledged. The numerical model employed a simplified two-layer representation to reduce computational complexity and isolate the dominant interfacial thermo-mechanical mechanisms. Although this approach successfully captured the principal behaviour observed experimentally, additional layers in full-scale printed elements may produce cumulative thermal effects, increased structural restraint, and more complex stress redistribution patterns. Future work should therefore extend the framework toward multi-layer simulations representative of practical printing conditions. Furthermore, environmental effects such as moisture transport, evaporation, drying shrinkage, and capillary suction were not explicitly included in the present formulation. These mechanisms are known to strongly influence interlayer adhesion and microstructural development in extrusion-based concrete printing, particularly under elevated temperatures and long deposition delays. Their omission may therefore lead to partial overestimation of interlayer bond continuity and underestimation of local shrinkage-induced stress concentrations. Nevertheless, the current framework focused primarily on the coupled influence of hydration kinetics and thermal evolution during the early-age period. Future work should incorporate coupled thermo-hygro-mechanical modelling to more accurately capture moisture migration, drying-induced stiffness gradients, and shrinkage cracking. The experimental programme was conducted under controlled laboratory conditions, which may differ from field-scale printing environments where variability in temperature, humidity, and process interruptions is more pronounced.
Future research should therefore focus on extending the modelling framework to multi-layer and large-scale systems, where cumulative thermal effects and structural restraint become more significant. Incorporating coupled thermo-hygro-mechanical processes and advanced rheological models would further enhance predictive capability. In addition, the integration of real-time monitoring and data-driven control strategies could enable adaptive optimisation of printing parameters, improving reliability and scalability in practical applications.


7. Conclusions

This study developed and validated a coupled experimental–numerical framework for analysing the early-age thermo-mechanical behaviour of extrusion-based 3D-printed concrete, with a particular focus on interlayer degradation mechanisms. The results demonstrate that interlayer bond performance is governed by the combined effects of hydration-driven stiffness evolution, printing time delay, and thermal history. Increasing deposition intervals lead to progressive loss of interfacial continuity due to hydration discontinuity and substrate stiffening, while elevated curing temperatures intensify thermal gradients and restrained deformation. These coupled effects produce a clear transition from stable bonding conditions to failure-prone regimes when printing delays exceed approximately 30–40 min under elevated temperatures. The proposed modelling framework shows quantitative agreement with experimental observations, with peak response errors below 5% and low RMSE values across the fracture process. This confirms that integrating hydration-dependent material properties with cohesive interlayer modelling provides a physically consistent representation of early-age behaviour in layered cementitious systems. From a practical perspective, the findings highlight the necessity of controlling both printing continuity and thermal conditions to minimise interfacial weakening and crack susceptibility in 3D-printed concrete. While the present study adopts a simplified layered configuration and neglects moisture transport effects, it establishes a robust basis for future extensions toward fully coupled thermo-hygro-mechanical modelling and multi-layer structural simulations relevant to field-scale additive construction.

Funding

This research received no external funding.

Data Availability Statement

The original contributions presented in this study are included in the article. Further inquiries can be directed to the corresponding author.

Conflicts of Interest

The author declares no conflicts of interest.

Abbreviations

The following abbreviations are used in this manuscript:
3DThree-dimensional
3DPCThree-dimensional printed concrete
BS ENBritish Standard European Norm
CEM IOrdinary Portland cement
CZMCohesive zone model
FAFly ash
FEMFinite element method
OPCOrdinary Portland cement
ODEOrdinary differential equation
RHRelative humidity
SFSilica fume
SPSuperplasticiser

Nomenclature

APre-exponential factor in hydration kinetics
A 0 Pre-exponential factor in maturity-based rate constant
c p Specific heat capacity of concrete (J/kg·°C)
dScalar damage variable in cohesive zone model
E ( t ) Time-dependent Young’s modulus of concrete (N/mm2)
E 4 Young’s modulus at 4 h (N/mm2)
E a Activation energy for hydration (J/mol)
f c ( t ) Time-dependent compressive strength (N/mm2)
f c , 4 Compressive strength at 4 h (N/mm2)
f t Tensile strength of concrete (N/mm2)
f t , j Interlayer tensile strength (N/mm2)
f c , j Interlayer compressive strength (N/mm2)
G f I Mode-I fracture energy of bulk concrete (N/mm)
G f , j I Mode-I fracture energy of interlayer interface (N/mm)
G c Interlayer fracture energy (N/mm)
kThermal conductivity (W/m·°C)
k ( T ) Temperature-dependent hydration rate constant
k n c Normal stiffness of interlayer interface (N/mm3)
k s c Shear stiffness of interlayer interface (N/mm3)
Q h Volumetric heat generation rate from hydration (W/m3)
RUniversal gas constant (8.314 J/mol·K)
S ( t ) Strength at time t
S u Ultimate strength
tTime after printing
t 0 Final setting time
TAbsolute temperature (K)
T r Reference temperature (K)
T n , T s Normal and shear tractions at interface (N/mm2)
T n 0 , T s 0 Interlayer tensile and shear strengths (N/mm2)
α ( t ) Degree of hydration
α 28 Degree of hydration at 28 days
δ n , δ s Normal and shear separations at interface (mm)
η p Plastic viscosity (Pa·s)
ν Poisson’s ratio
ρ Density of concrete (T/mm3)
τ Shear stress (Pa)
τ 0 Yield stress (Pa)
γ ˙ Shear rate (s−1)

References

  1. Agenda, I. Shaping the Future of Construction: A Breakthrough in Mindset and Technology; World Economic Forum: Geneva, Switzerland, 2016; pp. 11–16. [Google Scholar]
  2. Barbosa, F.; Woetzel, J.; Mischke, J.; Ribeirinho, M.J.; Sridhar, M. Reinventing Construction: A Route to Higher Productivity; McKinsey Global Institute: Washington, DC, USA, 2017. [Google Scholar]
  3. Mechtcherine, V.; Bos, F.P.; Perrot, A.; da Silva, W.R.; Nerella, V.N.; Fataei, S.; Wolfs, R.J.M.; Sonebi, M.; Roussel, N. 3D-printed concrete: State-of-the-art, challenges, and opportunities. Cem. Concr. Res. 2020, 132, 106050. [Google Scholar]
  4. Khoshnevis, B. Automated construction by contour crafting—Related robotics and information technologies. Autom. Constr. 2004, 13, 5–19. [Google Scholar] [CrossRef]
  5. Tao, Y.; Ren, Q.; Vantyghem, G.; Lesage, K.; Van Tittelboom, K.; Yuan, Y.; De Corte, W.; De Schutter, G. Extending 3D concrete printing to hard rock tunnel linings: Adhesion of fresh cementitious materials for different surface inclinations. Autom. Constr. 2023, 149, 104787. [Google Scholar] [CrossRef]
  6. Ma, D.; Gao, X.; Zhang, J. Co-exploitation of mine-derived geothermal energy: Recent advances and emerging perspectives. GeoEnergy Commun. 2025, 1, 12. [Google Scholar] [CrossRef]
  7. Aung, Y.; Khabbaz, H.; Fatahi, B. Review on thermo-mechanical approach in the modelling of geo-materials incorporating non-associated flow rules. Adv. Transp. Geotech. 2016, 3, 331–338. [Google Scholar] [CrossRef]
  8. Zhang, G.; Liu, S.; Fei, Y.; Li, Y.; Guo, F. Thermo-hydro-mechanical coupling analysis of geothermal reservoirs: Optimizing extraction capacities by revealing influential factors. J. Geophys. Eng. 2024, 21, 1040–1055. [Google Scholar] [CrossRef]
  9. Jacquey, A.B.; Regenauer-Lieb, K. Thermomechanics for geological, civil engineering and geodynamic applications: Rate-dependent critical state line models. Acta Geotech. 2021, 54, 5355–5373. [Google Scholar] [CrossRef]
  10. Salet, T.A.M.; Ahmed, Z.Y.; Bos, F.P.; Laagland, H.L.M. Design of a 3D-printed concrete bridge by testing. Virtual Phys. Prototyp. 2018, 13, 222–236. [Google Scholar] [CrossRef]
  11. Liu, K.; Takasu, K.; Jiang, J.; Zu, K.; Gao, W. Mechanical properties of 3D-printed concrete components: A review. Dev. Built Environ. 2023, 16, 100292. [Google Scholar] [CrossRef]
  12. Apis Cor. Apis Cor—3D Printing Construction Technology. Available online: https://www.apis-cor.com (accessed on 7 November 2024).
  13. Architect Magazine. Function and Facts of 3D-Printed Housing. Available online: https://www.architectmagazine.com/technology/function-and-facts-of-3d-printed-housing_s (accessed on 5 November 2024).
  14. News Desk; Trending Desk. How Japan Built the World’s First 3D-Printed Railway Station in Just Six Hours. Available online: https://www.news18.com/explainers/how-japan-built-the-worlds-first-3d-printed-railway-station-in-just-six-hours-9296313.html (accessed on 14 April 2025).
  15. Tabassum, T.; Mir, A.A. A review of 3D printing technology—The future of sustainable construction. Mater. Today Proc. 2023, 93, 408–414. [Google Scholar] [CrossRef]
  16. Kazemian, A.; Yuan, X.; Cochran, E.; Khoshnevis, B. Cementitious materials for construction-scale 3D printing: Laboratory testing of fresh printing mixture. Constr. Build. Mater. 2017, 145, 639–647. [Google Scholar] [CrossRef]
  17. Wolfs, R.J.M.; Bos, F.P.; Salet, T.A.M. Early-age mechanical behaviour of 3D-printed concrete: Numerical modelling and experimental testing. Cem. Concr. Res. 2018, 106, 103–116. [Google Scholar] [CrossRef]
  18. Nerella, V.N.; Näther, M.; Iqbal, A.; Mechtcherine, V. Inline quantification of buildability performance of cementitious materials for digital construction. Cem. Concr. Compos. 2019, 95, 260–270. [Google Scholar] [CrossRef]
  19. Panda, B.; Ruan, S.; Unluer, C.; Tan, M.J. Investigation of early-age bond strength and failure modes of 3D-printed geopolymer mortars. Mater. Lett. 2021, 304, 130628. [Google Scholar]
  20. BS EN 197-1:2011; Cement—Part 1: Composition, Specifications and Conformity Criteria for Common Cements. British Standards Institution (BSI): London, UK, 2011.
  21. BS EN 450-1:2012; Fly Ash for Concrete—Part 1: Definition, Specifications and Conformity Criteria. British Standards Institution (BSI): London, UK, 2012.
  22. BS EN 13263-1:2005+A1:2009; Silica Fume for Concrete—Part 1: Definitions, Requirements and Conformity Criteria. British Standards Institution (BSI): London, UK, 2009.
  23. BS EN 12620:2013; Aggregates for Concrete. British Standards Institution (BSI): London, UK, 2013.
  24. BS EN 196-3:2016; Methods of Testing Cement—Part 3: Determination of Setting Times and Soundness. British Standards Institution (BSI): London, UK, 2016.
  25. Srinivas, D.; Shanmugam, P.; Sarkar, P. Printability, thermal and compressive strength properties of cementitious materials: A comparative study with silica fume and limestone. Materials 2022, 15, 8607. [Google Scholar] [CrossRef]
  26. Tay, Y.W.D.; Qian, Y.; Tan, M.J. Printability region for 3D concrete printing using slump and slump flow test. Compos. Part B Eng. 2019, 174, 106968. [Google Scholar] [CrossRef]
  27. Alonso-Cañon, S.; Alonso-Estébanez, A.; Yoris-Nobile, A.I.; Brunčič, A.; Blanco-Fernandez, E.; Castanon-Jano, L. Rheological parameter ranges for 3D printing sustainable concrete. Int. J. Adv. Manuf. Technol. 2025; in press.
  28. Jayathilakage, R.; Sanjayan, J.; Rajeev, P. Rheometry for concrete 3D printing: A review and an outlook. Cem. Concr. Compos. 2019, 103, 212–234. [Google Scholar] [CrossRef]
  29. Rehmanand, A.U.; Kim, J.H. 3D concrete printing: A systematic review of rheology, mix designs and mechanical properties. Buildings 2021, 11, 336. [Google Scholar] [CrossRef]
  30. Li, M.; Liu, Z.; Ho, J.Y.; Wong, T.N. Experimental investigation of fresh and time-dependent rheological properties of cementitious materials for 3D printing. Constr. Build. Mater. 2023, 391, 131889. [Google Scholar] [CrossRef]
  31. Najvani, M.A.D.; Murcia, D.H.; Soliman, E.; Taha, M.M.R. early-age strength and failure characteristics of 3D printable concrete. Constr. Build. Mater. 2023, 397, 132472. [Google Scholar] [CrossRef]
  32. Liu, C.; Zhang, R.; Liu, H.; He, C.; Wang, Y.; Wu, Y. Analysis of the mechanical performance and damage mechanism for 3D-printed concrete based on pore structure. Constr. Build. Mater. 2022, 314, 125572. [Google Scholar] [CrossRef]
  33. Wang, X.; Jia, L.; Jia, Z.; Zhang, C.; Chen, Y.; Ma, L. Optimization of 3D printing concrete with coarse aggregate. J. Build. Eng. 2022, 56, 104745. [Google Scholar] [CrossRef]
  34. Ji, G.; Xiao, J.; Zhi, P.; Wu, Y.C.; Han, N. Effects of extrusion parameters on properties of 3D printing concrete. Constr. Build. Mater. 2022, 325, 126740. [Google Scholar] [CrossRef]
  35. Tank, R.C.; Carino, N.J. Rate constant functions for strength development of concrete. ACI Mater. J. 1991, 88, 74–83. [Google Scholar] [CrossRef] [PubMed]
  36. Carino, N.J.; Volz, C.K. Early-age temperature effects on concrete strength prediction. ACI J. Proc. 1983, 80, 210–218. [Google Scholar]
  37. Tank, R.C.; Carino, N.J. Maturity functions for concretes made with various cements. ACI Mater. J. 1992, 89, 364–372. [Google Scholar] [CrossRef]
  38. Honorio, T.; Ma, G.; Bary, B.; de Larrard, F. Thermal properties of cement-based materials at early-ages: A review. Cem. Concr. Res. 2022, 151, 106634. [Google Scholar]
  39. Carino, N.J. The maturity method: Theory and application. Cem. Concr. Aggreg. 1984, 6, 61–73. [Google Scholar] [CrossRef]
  40. Panda, B.; Paul, S.C.; Le, T.N.; Lim, J.Y.; Tan, M.J. Effect of layer time interval on mechanical properties. Addit. Manuf. 2017, 16, 140–148. [Google Scholar]
  41. Klemczak, B.; Koniorczyk, M. Complex evaluation of early-age mechanical properties of concrete. Mater. Struct. 2018, 51, 1–16. [Google Scholar]
  42. Miri, Z.S.; Baaj, H.; Polak, M.A. Exploring interfaces in 3D-printed concrete through cohesive zone modelling. In Proceedings of the Canadian Society of Civil Engineering Annual Conference, 5–7 June 2024; Springer Nature: Cham, Switzerland, 2024; pp. 199–212. [Google Scholar]
  43. Kruger, J.; van Zijl, G. Lack-of-fusion in digital concrete fabrication: A review. Addit. Manuf. 2021, 37, 101654. [Google Scholar] [CrossRef]
  44. Le, T.T. Mechanical behaviour of 3D-printed concrete elements. Cem. Concr. Res. 2012, 42, 558–566. [Google Scholar] [CrossRef]
  45. Hambach, M.; Möller, H.; Neumann, T.; Volkmer, D. Portland cement paste with aligned carbon fibers exhibiting exceptionally high flexural strength. Cem. Concr. Res. 2016, 89, 80–86. [Google Scholar] [CrossRef]
  46. Klemczak, B.; Smolana, A.; Jędrzejewska, A. Modeling of heat and mass transfer in cement-based materials during hydration. Energies 2024, 17, 2513. [Google Scholar] [CrossRef]
  47. Zhu, B.; Pan, J.; Zhou, Z.; Cai, J. Mechanical properties of engineered cementitious composites beams fabricated by extrusion-based 3D printing. Eng. Struct. 2021, 238, 112201. [Google Scholar] [CrossRef]
Figure 1. Examples of 3D-printed concrete applications: (a) pedestrian bridge in Gemert, Netherlands [10]; (b) two-storey residential building [11]; (c) administrative building [11]; (d) multi-unit housing project [11].
Buildings 16 02148 g001
Figure 2. Recent milestones in large-scale 3D concrete printing: (a) Dubai 3D-printed building (2024) [12]; (b) Malibu residential house (2024) [13]; (c) 3D-printed railway station in Arida City, Japan (2025) [14], demonstrating the increasing maturity of construction-scale additive manufacturing.
Buildings 16 02148 g002
Figure 3. Particle size distribution of cement, fly ash, silica fume, and fine aggregates used in the 3D-printed concrete mixture.
Buildings 16 02148 g003
Figure 4. Determination of setting time using Vicat apparatus [24]. Results indicate an initial setting at approximately 25 min and a final setting at 60 min.
Buildings 16 02148 g004
Figure 5. Representative rheological behaviour of fresh 3D-printed concrete showing the relationship between shear stress and shear rate, highlighting thixotropic response and flow curve hysteresis.
Buildings 16 02148 g005
Figure 6. Orientation of loading directions (X, Y, Z) used in compressive strength testing of 3D-printed concrete specimens.
Buildings 16 02148 g006
Figure 7. Compressive strength development as a function of printing time delay (0, 10, 30, and 60 min) at 20 °C curing temperature in three orthogonal directions (X, Y, Z). Error bars represent standard deviation (n = 3 per condition).
Buildings 16 02148 g007
Figure 8. Finite element model developed in COMSOL Multiphysics: (a) layered geometry configuration; (b) tetrahedral mesh with local refinement at the interlayer interface.
Buildings 16 02148 g008
Figure 9. Spatial contour distributions of temperature in 3D-printed concrete at selected time instants: (a) t = 0 min; (b) t = 10 min; (c) t = 30 min; (d) t = 60 min. The colour map represents the temperature field (°C), illustrating the progressive development of hydration-induced thermal gradients within the layered domain.
Buildings 16 02148 g009
Figure 10. Evolution of degree of hydration and corresponding maturity index during the early-age period (0–4 h) of 3D-printed concrete, illustrating rapid hydration kinetics followed by progressive deceleration.
Buildings 16 02148 g010
Figure 11. Influence of printing time delay and curing temperature on interlayer bond strength of 3D-printed concrete: (a) Evolution of interlayer bond strength with printing time delay (0, 10, 30, 60 min) under different curing temperatures (20–60 °C); (b) Contour map showing the combined effect of temperature and delay on bond strength, highlighting high-strength, moderate-strength, and failure regions; (c) Variation in bond strength with printing delay at selected temperatures; (d) Variation in bond strength with temperature at selected deposition intervals; (e) Normalised bond strength reduction (%) relative to continuous printing (0 min delay), illustrating the exponential degradation of interlayer bonding with increasing delay and temperature.
Buildings 16 02148 g011
Figure 12. Comparison of experimental and numerical force–crack mouth opening displacement (F–CMOD) response of 3D-printed concrete under fracture loading, showing good agreement and similar post-peak softening behaviour.
Buildings 16 02148 g012
Figure 13. Coupled thermo-mechanical response governing crack initiation and interlayer degradation in 3D-printed concrete: (a) stress–strain response comparing numerical and experimental results, including peak stress and crack initiation point; (b) thermal stress as a function of temperature; (c) Early-age evolution of interlayer bond strength and crack risk: ( c 1 ) interlayer bond strength; ( c 2 ) Crack-risk effect; (d) rack-risk index as a function of printing time delay.
Buildings 16 02148 g013
Figure 14. Spatial contour distributions of thermo-mechanical fields at representative early-age stages: (a) Temperature field at t = 10 min showing localised heat generation from hydration; (b) Degree of hydration at t = 30 min illustrating non-uniform hydration progression across layers; (c) Principal tensile stress field at t = 60 min highlighting stress localisation near the interlayer interface. These contours demonstrate the strong coupling between hydration kinetics, thermal gradients, and stress development in 3D-printed concrete.
Buildings 16 02148 g014
Figure 15. Evolution of Young’s modulus and associated damage development during early-age hydration of 3D-printed concrete, indicating rapid stiffness gain within the first four hours.
Buildings 16 02148 g015
Figure 16. Evolution of energy release during crack propagation in 3D-printed concrete: (a) energy release as a function of crack opening displacement, showing good agreement between simulation and experimental results; (b) temporal evolution of energy release, highlighting crack onset and subsequent progressive fracture energy dissipation leading to saturation.
Buildings 16 02148 g016
Table 1. Chemical composition of OPC taken from the supplier manifest data sheet [20].
CompoundSymbolContent (%)
Tricalcium silicateC3S61.4
Dicalcium silicateC2S14.8
Tricalcium aluminateC3A6.7
Tetracalcium aluminoferriteC4AF9.0
GypsumCaSO4·2H2O4.1
Loss on ignition3.2
Table 2. Mixture proportions (kg/m3).
Mix IDOPCFASFSandWaterSP
3DPC650973311902756.5
Table 3. Compressive strength development at 20 °C curing temperature.
Time After Printing (min) f x (MPa) f y (MPa) f z (MPa)
09.68.47.7
106.35.85.6
303.53.23.1
600.60.60.5
Table 4. Cohesive interlayer interface parameters adopted in the finite element model to describe time-dependent bonding and progressive debonding between consecutively printed concrete layers.
ParameterValueUnit
Interlayer tensile strength, f t , j 0.6N/mm2
Interlayer compressive strength, f c , j 8.4N/mm2
Mode-I fracture energy,    G f , j I 0.063N/mm
Shear fracture energy, G f e 11 0.296N/mm
Cohesion, c c 2.96N/mm2
Friction angle, φ 36.87degree
Dilation angle, ψ 0degree
Residual friction angle, φ r 36.87degree
Normal stiffness, k n c 1.0 × 10 6 N/mm3
Shear stiffness, k s c 4.17 × 10 5 N/mm3
Degradation coefficient1.0
Confining stress 1.0 N/mm2
Plastic modulus, K p 0.0096N/mm2
Table 5. Material parameters for the total strain–based cracking model and thermal analysis used to simulate early-age thermo-mechanical behaviour of 3D-printed concrete.
ParameterValueUnit
Young’s modulus, E10,000N/mm2
Poisson’s ratio, ν 0.20
Density, ρ 2.15 × 10 6 T/mm3
Tensile strength, f t 1.0N/mm2
Compressive strength, f c 9.6N/mm2
Mode-I fracture energy, G f I 0.956N/mm
Compressive fracture energy, G c c 27.07N/mm
Crack bandwidth0.20mm
Crack orientationRotating
Tensile softening lawExponential
Poisson’s ratio reductionDamage-based
Lateral confinement effectNo
Thermal conductivity2.0W/m·°C
Specific heat capacity, c p 850J/kg·°C
where ρ = 2.15 × 10 6 T / mm 3 , which is equivalent to 2150 kg / m 3 .
Table 6. Comparison between experimental and numerical results for model validation.
ParameterExperimentalNumericalDifference (%)
Peak force (kN)21.122.04.3
CMOD at peak (mm)0.0520.0495.8
Fracture energy (N/mm)0.940.984.3
Interlayer bond strength (MPa)0.620.654.8
Peak temperature rise (°C)41.543.03.6
Young’s modulus at 4 h (GPa)28.129.03.2
Disclaimer/Publisher’s Note: The statements, opinions and data contained in all publications are solely those of the individual author(s) and contributor(s) and not of MDPI and/or the editor(s). MDPI and/or the editor(s) disclaim responsibility for any injury to people or property resulting from any ideas, methods, instructions or products referred to in the content.