


Abstract
Night ventilation coupled with thermal mass is an effective means of reducing overheating in passive buildings. Successful systems require a high airflow rate coupled with enhanced convective heat transfer to the thermal mass. This work presents results for enhanced convection when the primary thermal mass is in the ceiling. Such mass distribution occurs, for example, in multi-story apartments in developing economies. Experimental results are measured in a scale model of a typical room. The original contribution is the use of upward-directed ventilation at an angle of 30° to 40° from a window located at a typical distance below the ceiling. At scaled air change rates of 4.9 air changes per hour, the measured convective heat transfer coefficient at the ceiling was 7.7 W/m2 K. In contrast, when air flowed horizontally from the window, the heat transfer coefficient was 3.5 W/m2 K or less, indicating that substantial improvement was gained by directing airflow toward the ceiling. To link the experimental results to an application in a full-size building, an approximate model is presented to estimate the impact of directed night ventilation on the thermal mass (specifically the concrete slab ceiling) and room air temperatures. Coupling angled flow with nighttime ventilation, the ceiling slab and peak daytime air temperature can be reduced by 5 °C compared to horizontal ventilation from a window at conventional height. These results have enabled collaborators in Gujarat, India, to launch tests in a full-scale home serving a low-income community without access to air conditioning.
1. Introduction
Climate change is driving more frequent and intense heat waves, exposing billions of people to dangerous heat stress [1,2,3,4] and, especially for low- and middle-income countries in warmer climates [5], reduced productivity [6,7,8]. The greatest impacts occur in developing regions such as India, where vulnerable populations—including low-income households, infants, the elderly, and laborers—face elevated health risks and productivity losses [9,10,11,12].
In India, low-income households cannot afford air conditioner costs [13]. Managing indoor comfort, especially during peak temperatures in the afternoon, must, therefore, rely on sustainable design and passive techniques. One effective passive technique is using cooler nighttime air to cool down large exposed thermal masses within the building, in this case the concrete ceilings, to reduce daytime peak temperatures. This paper focuses on low-energy cooling through directed ventilation.
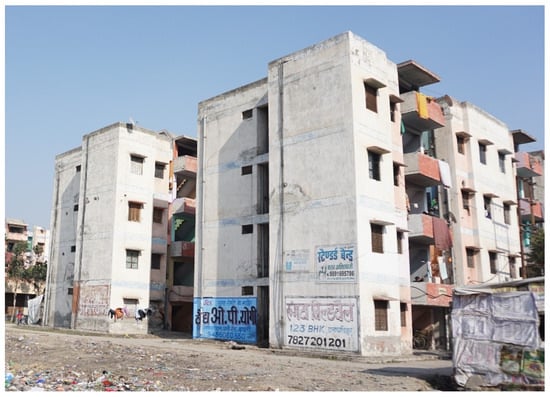
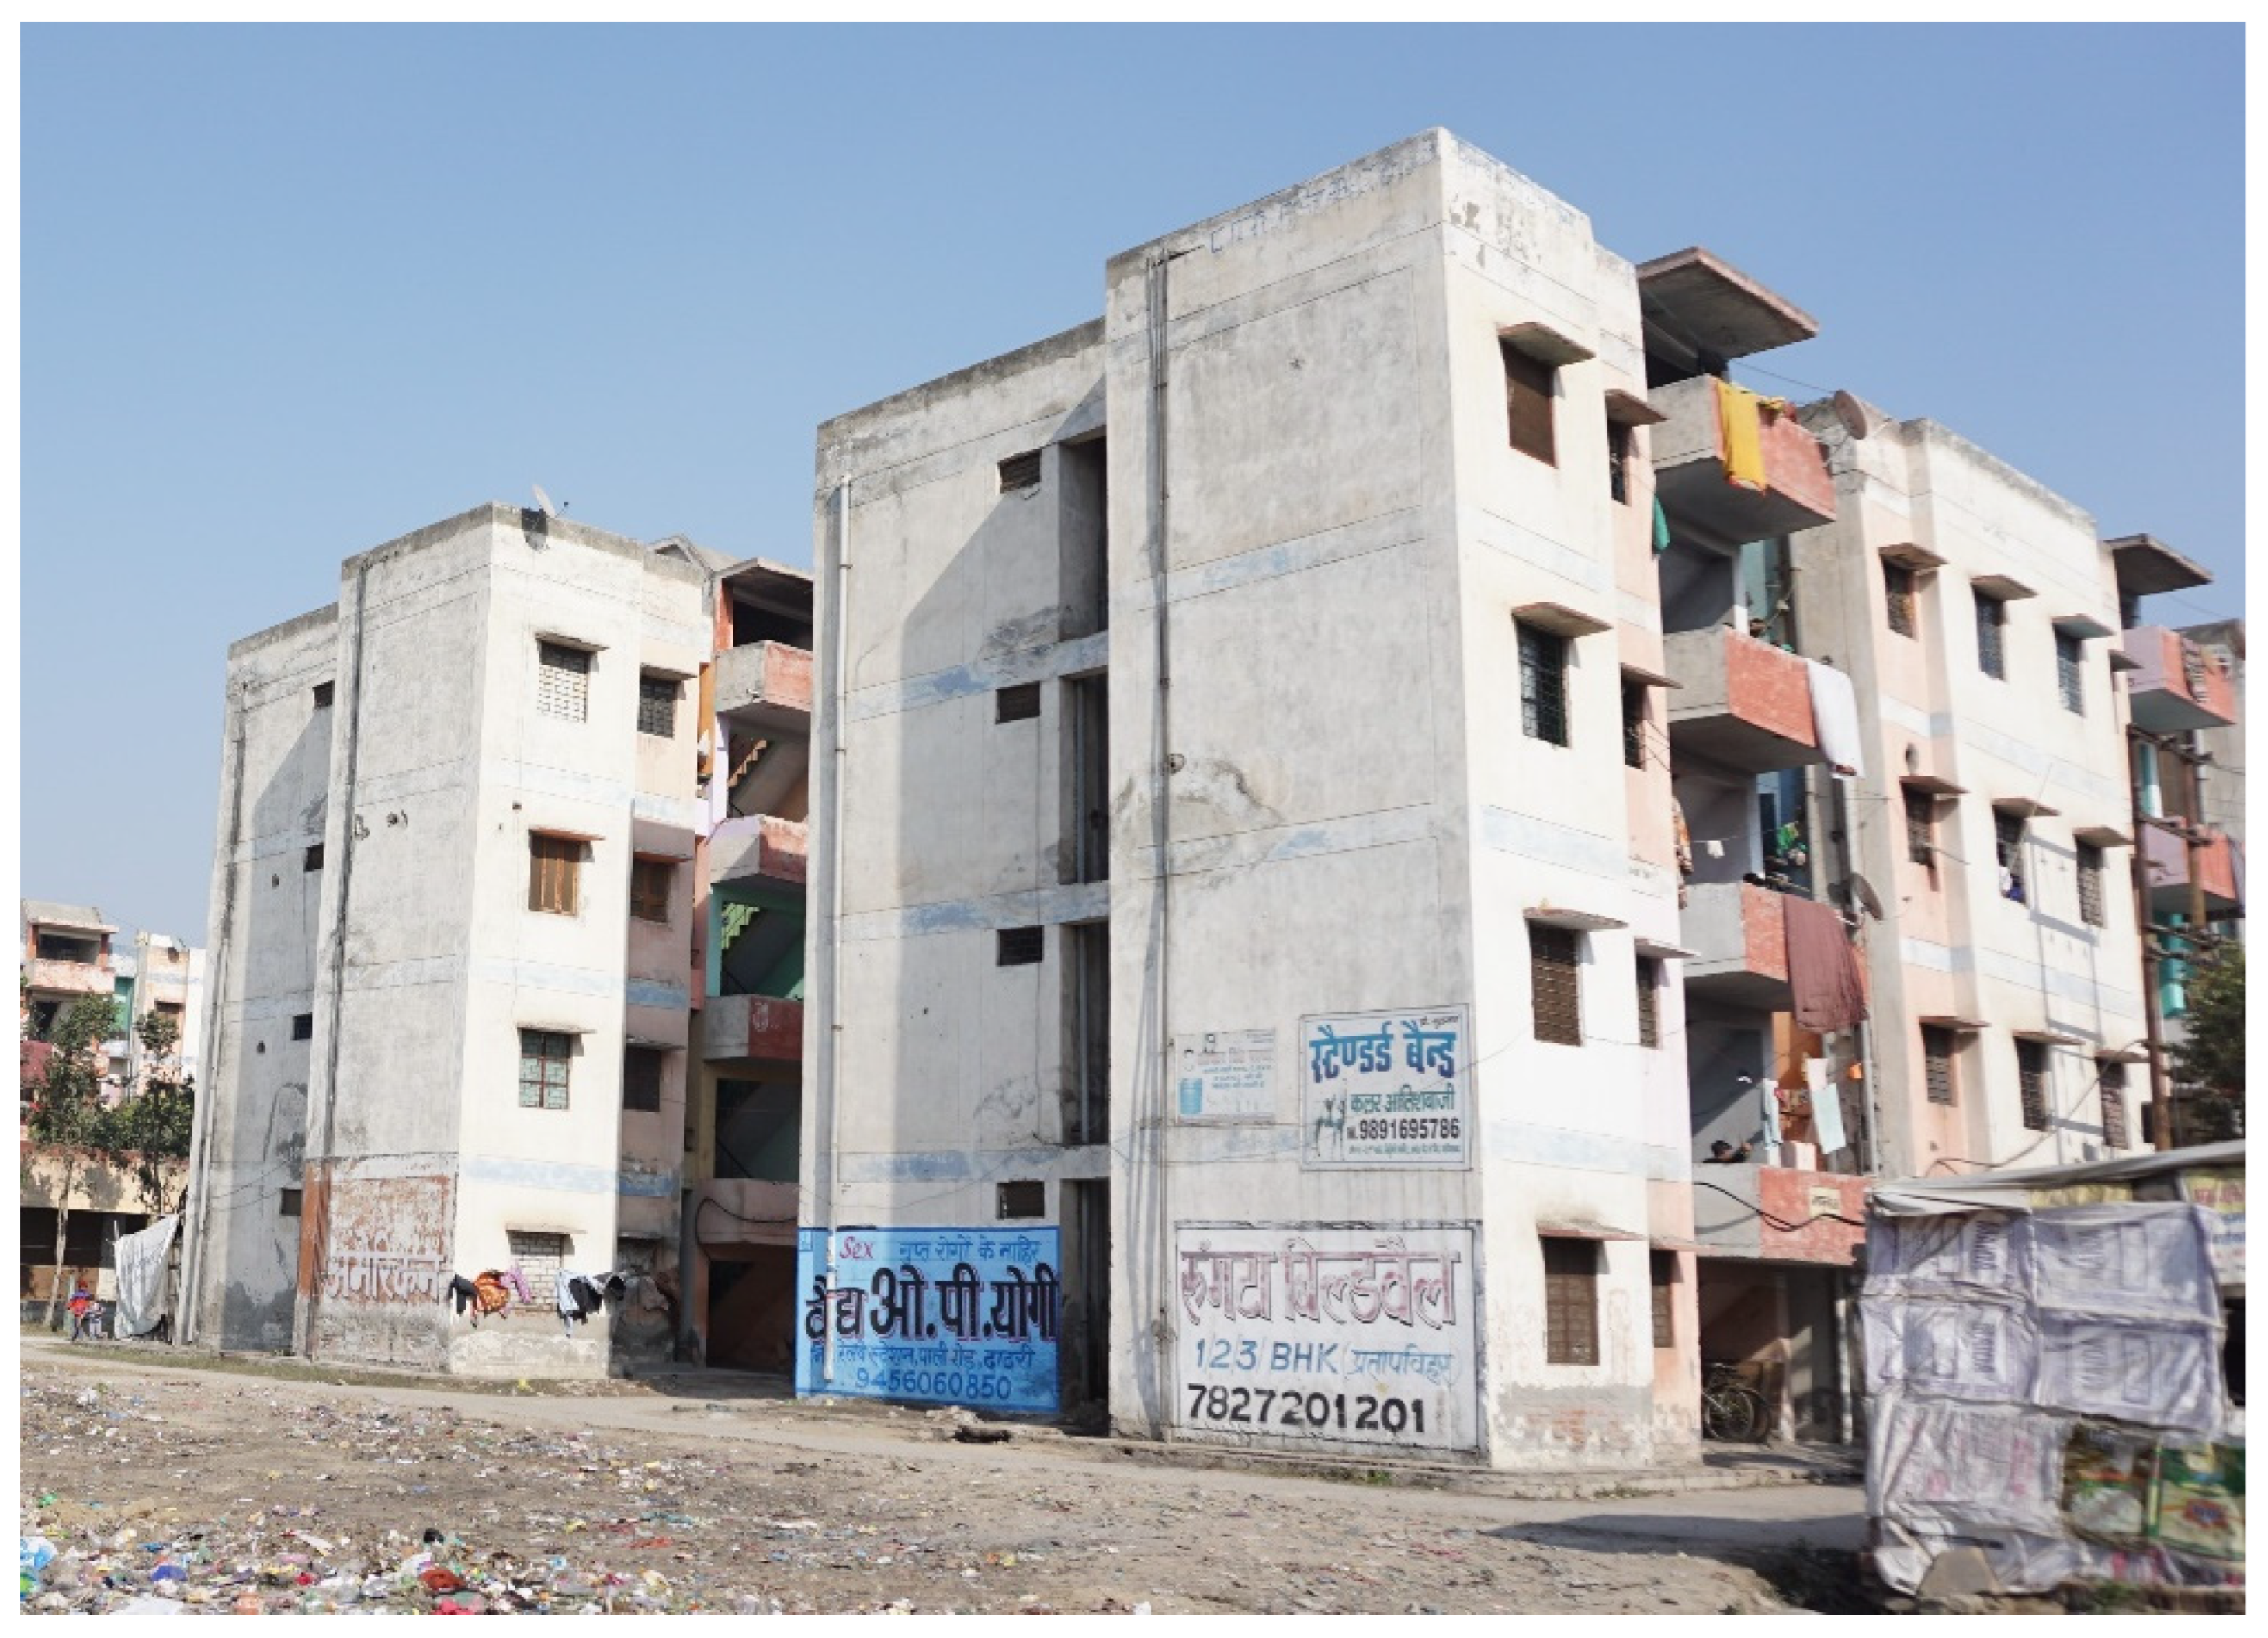
Figure 1 illustrates an example of a government-incentivized housing of the Economically Weaker Sector in small cities like Bhuj, India. Indicative of the category, the floor area is 28 m2 [14] and typically comprises two main rooms side-by-side, a kitchen, and a bathroom. In multi-story housing like the example in Figure 1, one of the most effective low-energy strategies for tenants is controlling ventilation. This paper explores these strategies and their impacts. Focusing on cooling homes in India, seven selected Indian cities are listed in Table 1 with temperature data for the second half of May (the hottest time of year) from ISHRAE Weather Files [15]. Bhuj’s weather is most similar to Ahmedabad’s. The large temperature swings between day and night (diurnal temperature swing) offer a good opportunity to use nighttime cooling of thermal mass to reduce high daytime temperatures indoors.
Figure 1.
Indian housing example where directed ventilation may be utilized.
Table 1.
Daily maximum, minimums, and diurnal temperature swing for six selected cities in India.
Table 1 shows that five large cities in India experience significant diurnal temperature swings. Mumbai is an exception, with smaller diurnal temperature swing due to its ocean proximity.
The concrete ceiling slab acts as a large thermal mass within a dwelling. In areas with large diurnal temperature swings, night ventilation can cool the slab, helping keep the interior cooler during the day when ventilation is reduced. Geros et al. showed that night ventilation in a multi-story office building lowered the interior air temperature by at least 4 °C relative to the non-naturally ventilated state, making it 6 °C cooler than the peak outdoor temperature [16]. The cool ceiling surface also lowers the mean radiant temperature, further lowering the human perception of temperature within a space. For this to work effectively, two factors are key: a high air change rate to cool the thermal mass and high convective heat transfer coefficient on the ceiling’s bottom surface. There are numerous full-scale experimental and numerical studies of natural ventilation in similar internal geometries [17]. However, these studies did not focus on convection to the ceiling. In typical designs, windows for ventilation are placed below the ceiling level. When cool night air enters, it moves horizontally under the ceiling but flows downward because it is denser. However, a layer of stagnant warm air stays between the ceiling and top of the window, regardless of air change rates. This stagnant air creates a barrier to convective heat transfer between the ceiling and incoming air, resulting in only a small temperature reduction in the ceiling at night. This has been confirmed by computational fluid dynamics (CFD) simulations of the natural ventilation potential [18]. This research explores ways to improve the convective heat transfer by directing airflow from the window up toward the ceiling. The present paper presents experimental results on convective heat transfer to a ceiling with air directed from an exterior window. The specific contribution of this paper is data for a new geometry, where the inlet air is directed upward at an angle toward the ceiling.
Few studies have focused on cooling ceiling slabs. Spitler, Pedersen, and Fisher [19] highlighted how the location of air inlets impacts heat extraction from a building and stressed the limitations of the well-mixed assumption in heat transfer models. Spitler et al. also presented experimental results correlating jet momentum with surface heat transfer coefficients for jets originating from ceiling diffusers, where the jet was flush with the ceiling. However, the authors of this paper could not find any previous heat transfer research in rooms where the air jet’s angle or position was adjusted based on a window inlet located at a distance below the ceiling.
Previous studies have looked at jets directed at surfaces at different angles, mostly in two-dimensional setups. Gao, Ewing, and Ching [20] discussed how the initial offset affects the mean heat transfer coefficient and how the heat transfer changes along the surface as the jet moves. However, applying these two-dimensional findings to three-dimensional spaces does not fully capture how a small diameter jet spreads along the ceiling surface. Others, including Sparrow and Lovell [21], Goldstein and Franchett [22], and Attalla and Salem [23], studied impinging jets on flat surfaces, but their focus was on fine details, not how it applies to larger surfaces like exposed ceiling slabs. These studies also did not consider the effect of diffusers at the jet exit, which would cause the jet to spread. Additionally, most of the literature cases focused on surfaces that are like a semi-infinite plane, whereas a building ceiling is constrained by walls, affecting how the flow behaves on the aggregate and along the edges. Experiments by Restrepo and Glicksman [24] have shown that the convection on a heated horizontal plate facing downward are dependent on the conditions at the edges of the plates.
At the building scale, the recent literature highlights the importance of ventilation timing [25,26], ventilation rates [27,28], and “good thermal contact” [29] for thermal buffering. They also show the advantages of cross-flow ventilation over single-sided ventilation [30] and suggest models to couple thermal mass and natural ventilation [31,32]. Yang and Yi focus on quantifying the impact of interior convective heat transfer [33], but do not provide practical methods to apply this theory. Other research discusses wall- [34,35] and ceiling-attached [36] air curtain ventilation systems, but do not address issues like thermal discomfort or integration with thermal massing. These systems require modification to the living space, which might not be affordable or feasible for the occupants.
Many studies on ventilation focus on conventional air inlet locations, often using an orthogonal inlet jet or not considering the impact of a warmer ceiling. Awbi and Hatton [37] examined how a heated ceiling affects the convective heat transfer coefficient in a room with stratified air. Beausoleil-Morrison [38] applied this work in an adaptive algorithm, but noted that the choice of convection model was more important than the predicted benefits of design measures [38]. A key issue is that many experiments are conducted on small, heated plates rather than in real enclosed spaces [39,40]. Goethals et al. studied how different inlet and exhaust configurations and different published models impact convective heat transfer [41,42]. That work paved the way for others [43,44,45] to quantify convective heat transfer coefficients along various surfaces based on different ventilation approaches, such as mixed ventilation, displacement ventilation, and diffuse ceiling ventilation [46]. While diffuse ceiling ventilation can improve energy efficiency and comfort, it is difficult to retrofit in multi-story buildings, especially for renters with temporary tenancies.
For multi-story buildings with concrete floors, successful night ventilation requires both a high nighttime air change rate and elevated convective heat transfer on the concrete ceiling [47]. These factors can cause occupant discomfort if not managed properly. Since the heat transfer at internal surfaces is uncertain [48], this research focuses on using cool night air to cool the underside of the concrete ceiling slab, helping moderate interior temperatures during the day. This approach is especially useful for high-rise building occupants who cannot make building changes and in areas without significant nighttime winds for cross-building airflow. To cool these buildings, air must be directed over the ceiling area without causing uncomfortable drafts. The directed airflow approach uses the higher temperature differential of the incoming air to extract heat from the ceiling slab (then subsequently exhausted) and improves comfort immediately, both by reducing night drafts on occupants and, long-term, by reducing daytime temperature peaks.
This paper’s contribution includes experimental results that enhance convective cooling of ceilings by use of inlet air directed upward from exterior windows. Previous work only considered horizontal flows of inlet air. The current results show a marked improvement in the convective heat transfer by directing the airflow upward. In addition, a simplified simulation provides a first estimate of the effectiveness of these changes when only convective heat transfer to the ceiling slab is considered.
The result of this study on upward-directed airflow has been used to design a full-scale prototype in low-income housing in Bhuj, Gujarat. The findings from this prototype study, which is just underway, will be presented in a future paper.
The next section describes the heat transfer experiment and instrumentation setup, which models a typical room geometry. Experimental results are then presented for a variety of oblique airflow angles and air velocities. These results are used in a simple simulation to estimate how effective night ventilation is at reducing daytime temperature extremes.
2. Methods
2.1. Method: Experimental Setup
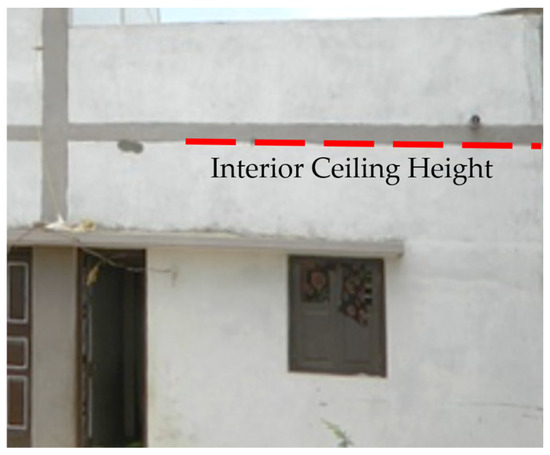
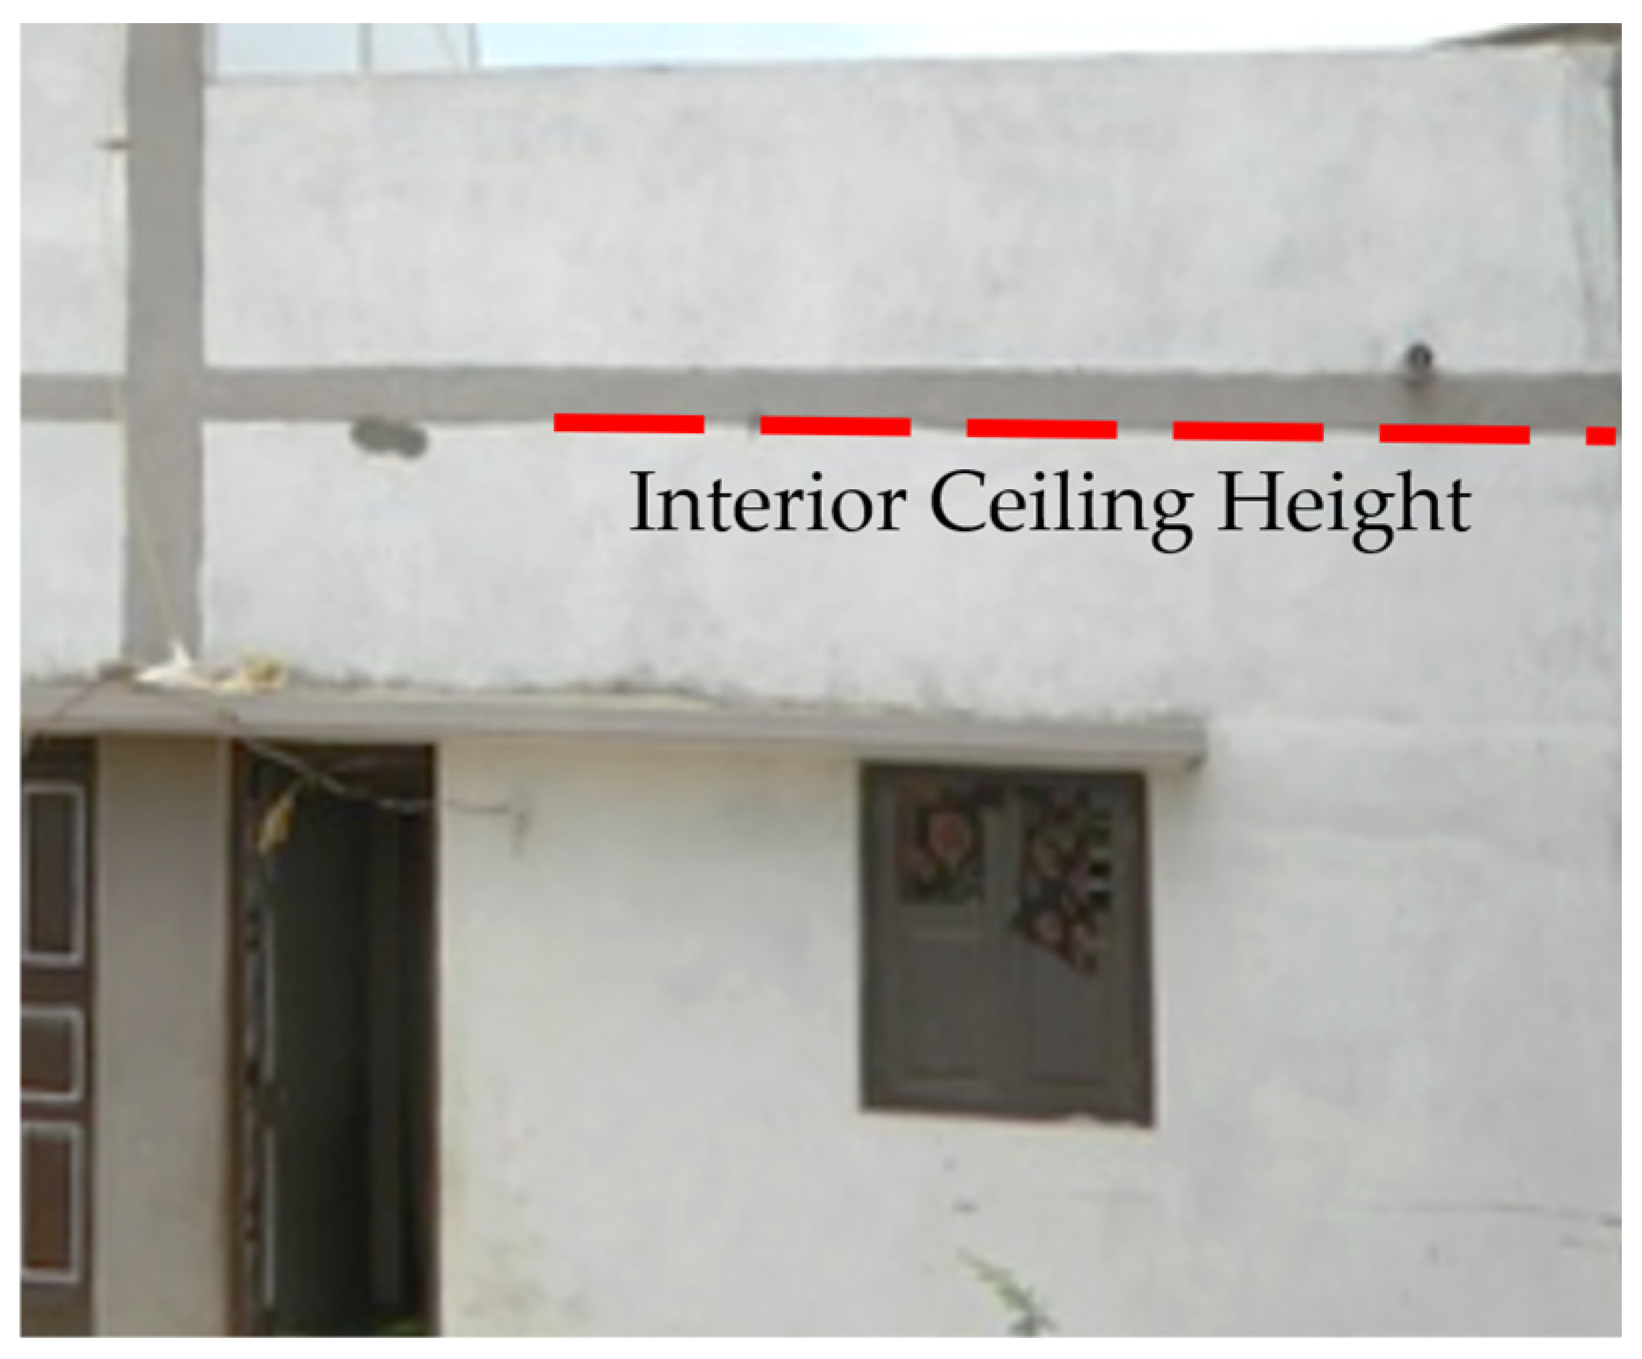
The experimental testing setup was based on existing homes in Bhuj, Gujarat, India. This approach helped with understanding the possibilities and limitations of the setup, ensuring it was realistic. These homes were built under the Indian government’s Housing for All scheme and are representative of the low-income housing typology in the area. Based on as-built plans, these homes have a total window-to-wall ratio of 10%. This is less than the 13.5% average reported for similar housing typologies in Guwahati, India [49], but is of the same order of magnitude. Importantly, for homeowners or tenants unable to modify the structure, the operable window represents a 2% window-to-wall ratio. In the region, the rear door (shown open in Figure 2) is typically kept closed for security, meaning that any ventilation must come through the window.
Figure 2.
As-built Bhuj housing, where the doors are typically left closed, the operable window represents a 2% window-to-wall ratio opening.
2.2. Methods: Construction
The testing approach in this work uses a scale model with a well-insulated test cell. The ceiling of the test cell is uniformly heated and heavily insulated on top to direct heat downwards into the space. The surfaces, except for the ceiling, have low thermal emissivity. Temperature measurements of the ceiling and internal surfaces help calculate the radiation component, which is then used to determine the convective heat transfer coefficient along the ceiling.
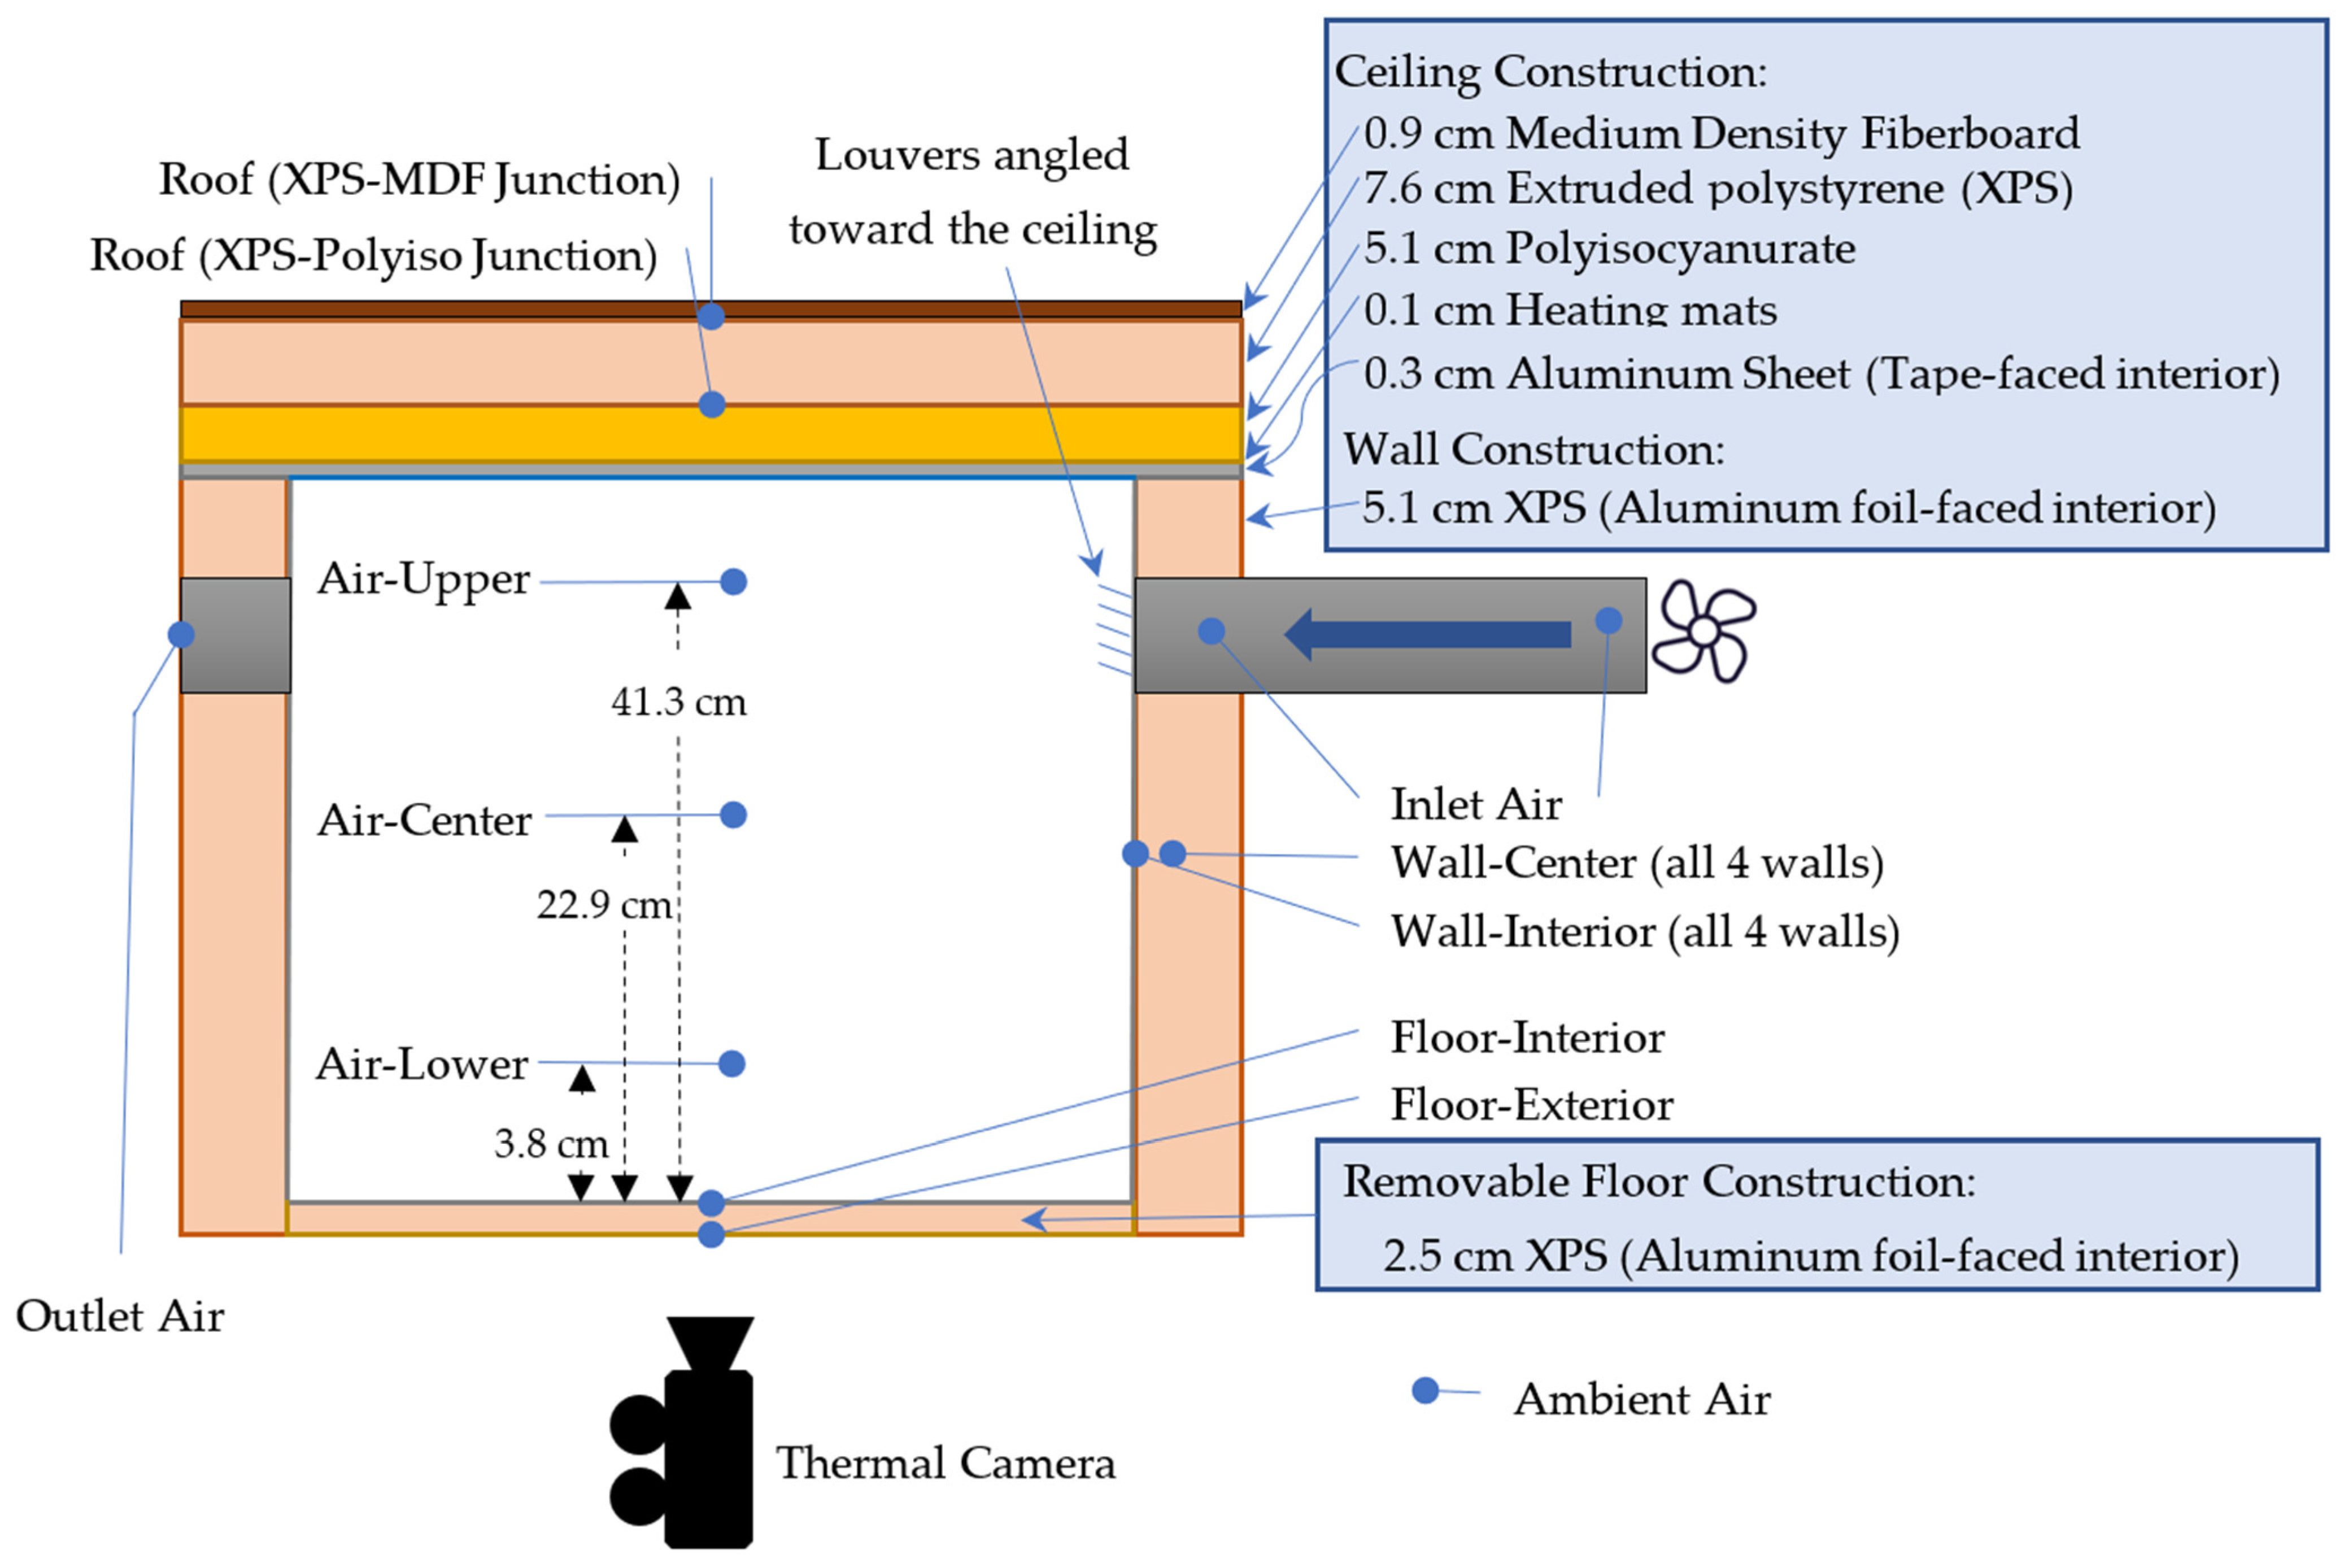
The test cell has interior dimensions of 0.86 m (34 in.) in width and length, and 0.45 m (17.5 in) in height, scaled 5.55:1 from a ground-floor living space in Bhuj. The test cell is housed in a temperature-controlled chamber and made of extruded polystyrene (XPS) with a removable bottom for infrared thermograms (thermal photographs). The walls are 7.6 cm (3 in.) of XPS with an aluminum foil radiant barrier on the inside. The floor is a 2.5 cm (1 in.) XPS sheet with an aluminum foil interior radiant barrier. The ceiling, starting from the inside, is made of a 0.3 cm (1/8 in.) sheet of aluminum faced with dark painter’s tape, a layer of electric resistive heaters, 5.1 cm (2 in.) of Polyisocyanurate (Polyiso) foam board, 7.5 cm (3 in.) of XPS, and 0.9 cm (11/32 in.) of medium-density fiberboard.
A 10.2 cm (4 in.) diameter circular air inlet was initially cut into the vertical centerline of the test cell wall, 2.5 cm (1 in.) below the top. For the second round of testing, the air inlet’s location was moved to match the scaled location along the wall, 10.2 cm from the ceiling. In the area’s existing construction (Figure 1 and Figure 2), windows are typically placed well below the ceiling level. For simplicity and ease of construction, it was assumed that the air outlet would be the same size and location as the air inlet.
The thermal conductivities of the materials are listed in Table 2. Heat flow measurements were taken using a Netzsch Heat Flow Meter (HFM) 436/3/1 Lambda (Burlington, MA, USA) with ±1 to 3% accuracy, following ASTM C518-21 and calibrated to NIST Standard Reference Material 1450d. Heating mats supplied a uniform heat flux above the aluminum sheet ceiling. Heat loss to the outside environment was calculated based on the one-dimensional conductive heat transfer through each of the faces using the thermal conductivity measured above and listed in Table 2 and the stabilized thermocouple measurements.
Table 2.
Summary of material thickness and thermal conductivity (Heat Flow Meter = HFM).
Internal radiative heat exchange was calculated using an assumed long-wave emissivity for the surface, applying a standard gray body approach without reflections (Table 3). All tests were performed at steady state, and all thermocouple measurement feeds were monitored to ensure stability prior to selecting a representative data point for data collection purposes.
Table 3.
Summary of material emissivities.
Thermocouple readings for air and mass temperatures were logged continuously during each experiment. The thermocouples were made from T-type special limit extension wire (Omega, Michigan City, IN, USA) and connected to a Campbell Scientific CR10X data logger through a Campbell Scientific AM25T thermocouple multiplexer (Campbell Scientific, Logan, UT, USA), recording data every two seconds for calibration and every ten seconds for the final testing. To check precision, the thermocouples were bundled together and placed in a heated bath for 12 h at 29.8 °C. Accuracy was verified via a 100 g sample of 99.999% Gallium (Fisher Scientific, Ward Hill, MA, USA) in a polyethylene bottle, checked periodically after the first six hours to confirm the Gallium existed in a two-phase state. Based on this, the thermocouple temperature accuracy is estimated at ±0.12 °C [57]. Radiation shields were not used due to the small size of the thermocouple beads (2 mm), which minimizes the radiative heat transfer effects as reported in [58].
Using the installed thermocouples, baseline testing of the test cell determined the conductive heat loss through the roof to the outside environment was on the order of 2.9% of total heat generation, the conductive heat loss through the four walls were on the order of 7.0% in total, and the conductive heat loss through the floor was on the order of 9.0%, leaving the remainder of the heat was lost through the ventilation. The heat lost through ventilation was further corroborated by the anemometer and thermocouple readings described below. The actual values varied based on testing iterations.
An anemometer (Testo 425, ±5% of reading +0.03 m/s, Testo is based in Lenzkirch, Germany) was used to measure air velocity in the supply duct. These measurements were validated by comparing them to a separate hot film benchtop setup. That setup used a 1.84 m long, 45 mm diameter pipe fed by compressed nitrogen gas via a two-stage regulator, with readings taken 40 diameters downstream, matching the manufacturer’s stated estimates [57].
Thermograms taken with a FLIR E8 thermal camera (±2% or 2 °C), manufactured in Stockholm, Sweden, were within 0.2 °C of the thermocouple reading values after adjusting for surface emissivity, optics, and reflected temperatures. Power variation in the heating mats was estimated at 1.5%, based on thermal and power metering. Time- and waveform-stable electrical inputs for the electrical resistance heating mats and instrumentation were ensured using a double-conversion uninterruptible power supply with a true sine inverter.
The thermocouple and energy meter data were collected without affecting the test cell’s operation, but capturing the thermograms required briefly removing the floor panel. To ensure that the captured thermograms represented steady-state conditions and not the transient effects of removing the floor, thermograms were taken over a longer period to track temperature changes with the floor removed. During this process, the ceiling temperature changed by less than 1.0 °C over three minutes, with the first 0.5 °C change occurring within the first minute. Therefore, thermograms used for results were taken within the first 15 s of removing the floor panel. Each test had at least eight hours between the start of testing and final data collection. Data were then downloaded three times at hourly intervals to ensure stability and accuracy, with the third data collection being used for reporting.
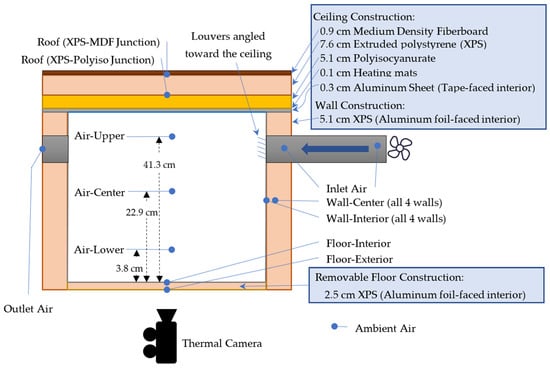
A total of 19 thermocouples were placed throughout the test cell to monitor heat flows through the walls and compare data to estimated values. Two thermocouples (inside and outside) were placed at the center of each of the four walls, the floor, and the roof. Additionally, two thermocouples were placed at the inlet air, one at the outlet air, and one outside the test cell to monitor the ambient air. Internally, three thermocouples were placed along the vertical centerline to measure air at different elevations. Figure 3 shows their locations.
Figure 3.
Test cell construction layers (arrows), temperature measurement points (circles: face, duct, or area-centered), and inlet louver position. The walls and floor are covered with aluminum foil directly on the inner surface, and the ceiling covered with painter’s tape.
To direct airflow, louvers were attached directly to the inlet orifice set at angles ranging from 0° to 60°. The louver depth (normal to the wall) was 1.7 cm, correlating with three times the anticipated turbulent integral length scale [59], assuming fully developed flow [60] and where the initial turbulence is effectively decorrelated for engineering purposes. The louvers featured a 0.9 cm spacing between the individual louvers, and the assembly covered the entire 10.2 cm (4 in.) diameter inlet to fit flush with the wall. The louvers were 3D-printed and measured at 0.12 cm thickness to scale match the 0.66 cm (0.26 in.) thick wood boards that would be used to construct a louver setup in the protype houses in Bhuj, India.
This work is limited in that it uses a single louver sizing over an inlet with a circular cross-section. Optimization of the louvers in terms of size and spacing is needed to further determine the impact on airflow, pressure drop, jet spread, and downstream turbulence. Further work will investigate this relationship and seek to determine how critical the dimensions are in relation to the velocity of the airstream and the shape of the inlet cross-section.
2.3. Methods: Test Parameters
The test cell was scaled to match a standard-sized Indian room (see Figure 1) and included louvers to study how the Reynolds number and airflow direction affect convective heat transfer. The Reynolds number, based on the window diameter and air velocity at the window [19,21], was used as the scaling factor since the inertial and viscous properties dominate convection in this downward-facing heating setup. Air properties were treated as constants and evaluated at the inlet location. For non-circular inlets, the Reynolds number should be based on the hydraulic diameter.
In typical scaled natural convection experiments, the governing dimensionless parameters should be the Reynolds number, the Archimedes number, and geometric similarity. However, achieving all of these in a scaled experiment would require a gas other than air [61]. In a detailed CFD simulation of an occupied room with horizontal side wall supply, similar to the present full-scale room geometry, Espinosa and Glicksman [18] showed the existence of a heated thermal layer near the ceiling when the Richardson number (the ratio of Grashof to Reynolds number squared) is 0.6, close to the value in the current full-size room. In the current test apparatus, the Richardson number is still lower than 0.6 since the length scale squared changes more than the temperature difference. This indicates a lower influence of natural convection compared to forced convection in the test apparatus. For the case in this manuscript, with a heated ceiling and cooler air entering through a window some distance below the ceiling, buoyancy effects are negligible. As a result, the dimensionless heat transfer coefficient (the Nusselt number) is a function of the Reynolds number, dimensionless geometric similarity ratios, and the constant Prandtl number.
This study does not apply to situations where airflow is not directed toward the ceiling or very low velocities are used, as buoyant forces would play a larger role in the flow and convective heat transfer. In those situations, the applicable Richardson values would be much larger than unity, where the forced convection effects are diminished.
A total of 44 cases were tested (see Appendix A: Table A1 for full catalog), with two different inlet positions (2.5 cm and 10.7 cm, or 1 in. and 4.2 in.), different Reynolds numbers (3950–45,710, representing 0.5 m/s–5.7 m/s), different inclination angles (0–60° toward the ceiling), and different horizontal diffuser angles (0–40°).
The test cell’s volume was 0.316 m3, and air change rates ranged from 46.16 to 526.25 air changes per hour (ACH), corresponding to 1.5 to 17.1 ACH in the full-sized home at the same Reynolds number.
For the tests with inlet location offset by 2.5 cm, Reynolds numbers were limited in scope, ranging from 6650 (0.86 m/s) to 7450 (0.96 m/s). Variations in airflow direction ranged from normal to the inlet wall (0° toward the ceiling) to 20° toward the ceiling, with horizontal spread ranging from 0° to 20°, both independently and in combination with the vertical variation.
The tests at the 10.7 cm offset were conducted at a broader range of Reynolds numbers, from 3950 (0.5 m/s) to 45,710 (5.7 m/s). These values were chosen to match those found in Bhuj homes, where the window’s hydraulic diameter is 0.56 m and the pedestal fan diameter is 0.45 m. A Reynolds number of 23,000 corresponds to an air velocity of 0.76 m/s in a full-sized building, which is considered too high if the air is aimed directly at people [62]. The 10.7 cm offset cases also varied the inclination angle from 0° to 60°, with horizontal spread ranging from 0° to 20°. No testing was conducted with the jet directed towards the floor, a nozzle to adjust velocity, or flow restricted at the inlet.
3. Results
3.1. Results: Evaluation
The convective heat transfer coefficient is calculated using the net convective heat transfer rate from the ceiling and the average ceiling temperature. The ceiling temperatures from the thermograms are adjusted for an emissivity of 0.877, reflected radiation, distance, and optics temperatures using FLIR Tools software (v5.13).
The heat flow from the ceiling into the space () is determined by the heating input power, minus the upward conduction through the ceiling, which is based on the thermocouple readings and material properties.
The convective heat transfer () from the ceiling to the air was calculated by subtracting the estimated radiative heat flow from the total heat flow into the space. The radiative heat flow was based on a gray-body radiative model using thermocouple data, the average ceiling temperature, and view factors and thermal emissivities of other internal surfaces. The view factors were calculated using a correlation for finite-aligned parallel rectangles, as described by Incropera et al. [52]. In this setup, the view factor from the ceiling to the floor was 0.41, and the remaining view factor to the walls was 0.59.
The convective heat transfer coefficient is based on the temperature difference between the ceiling and the inlet air temperature:
This coefficient can also be based on the ceiling temperature and the air temperature 3.7 cm below the ceiling:
These values are listed in Table 4 for the cases in Figure 4 and Appendix A. The associated Reynolds numbers for the airflow through the inlet are based on the inlet diameter ().
Table 4.
Thermogram descriptions and convective heat transfer coefficients for Figure 4.
Figure 4.
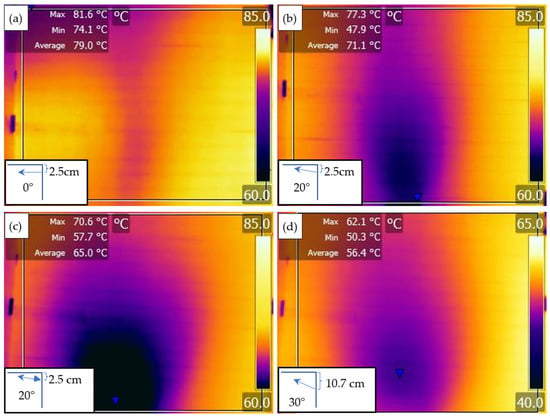
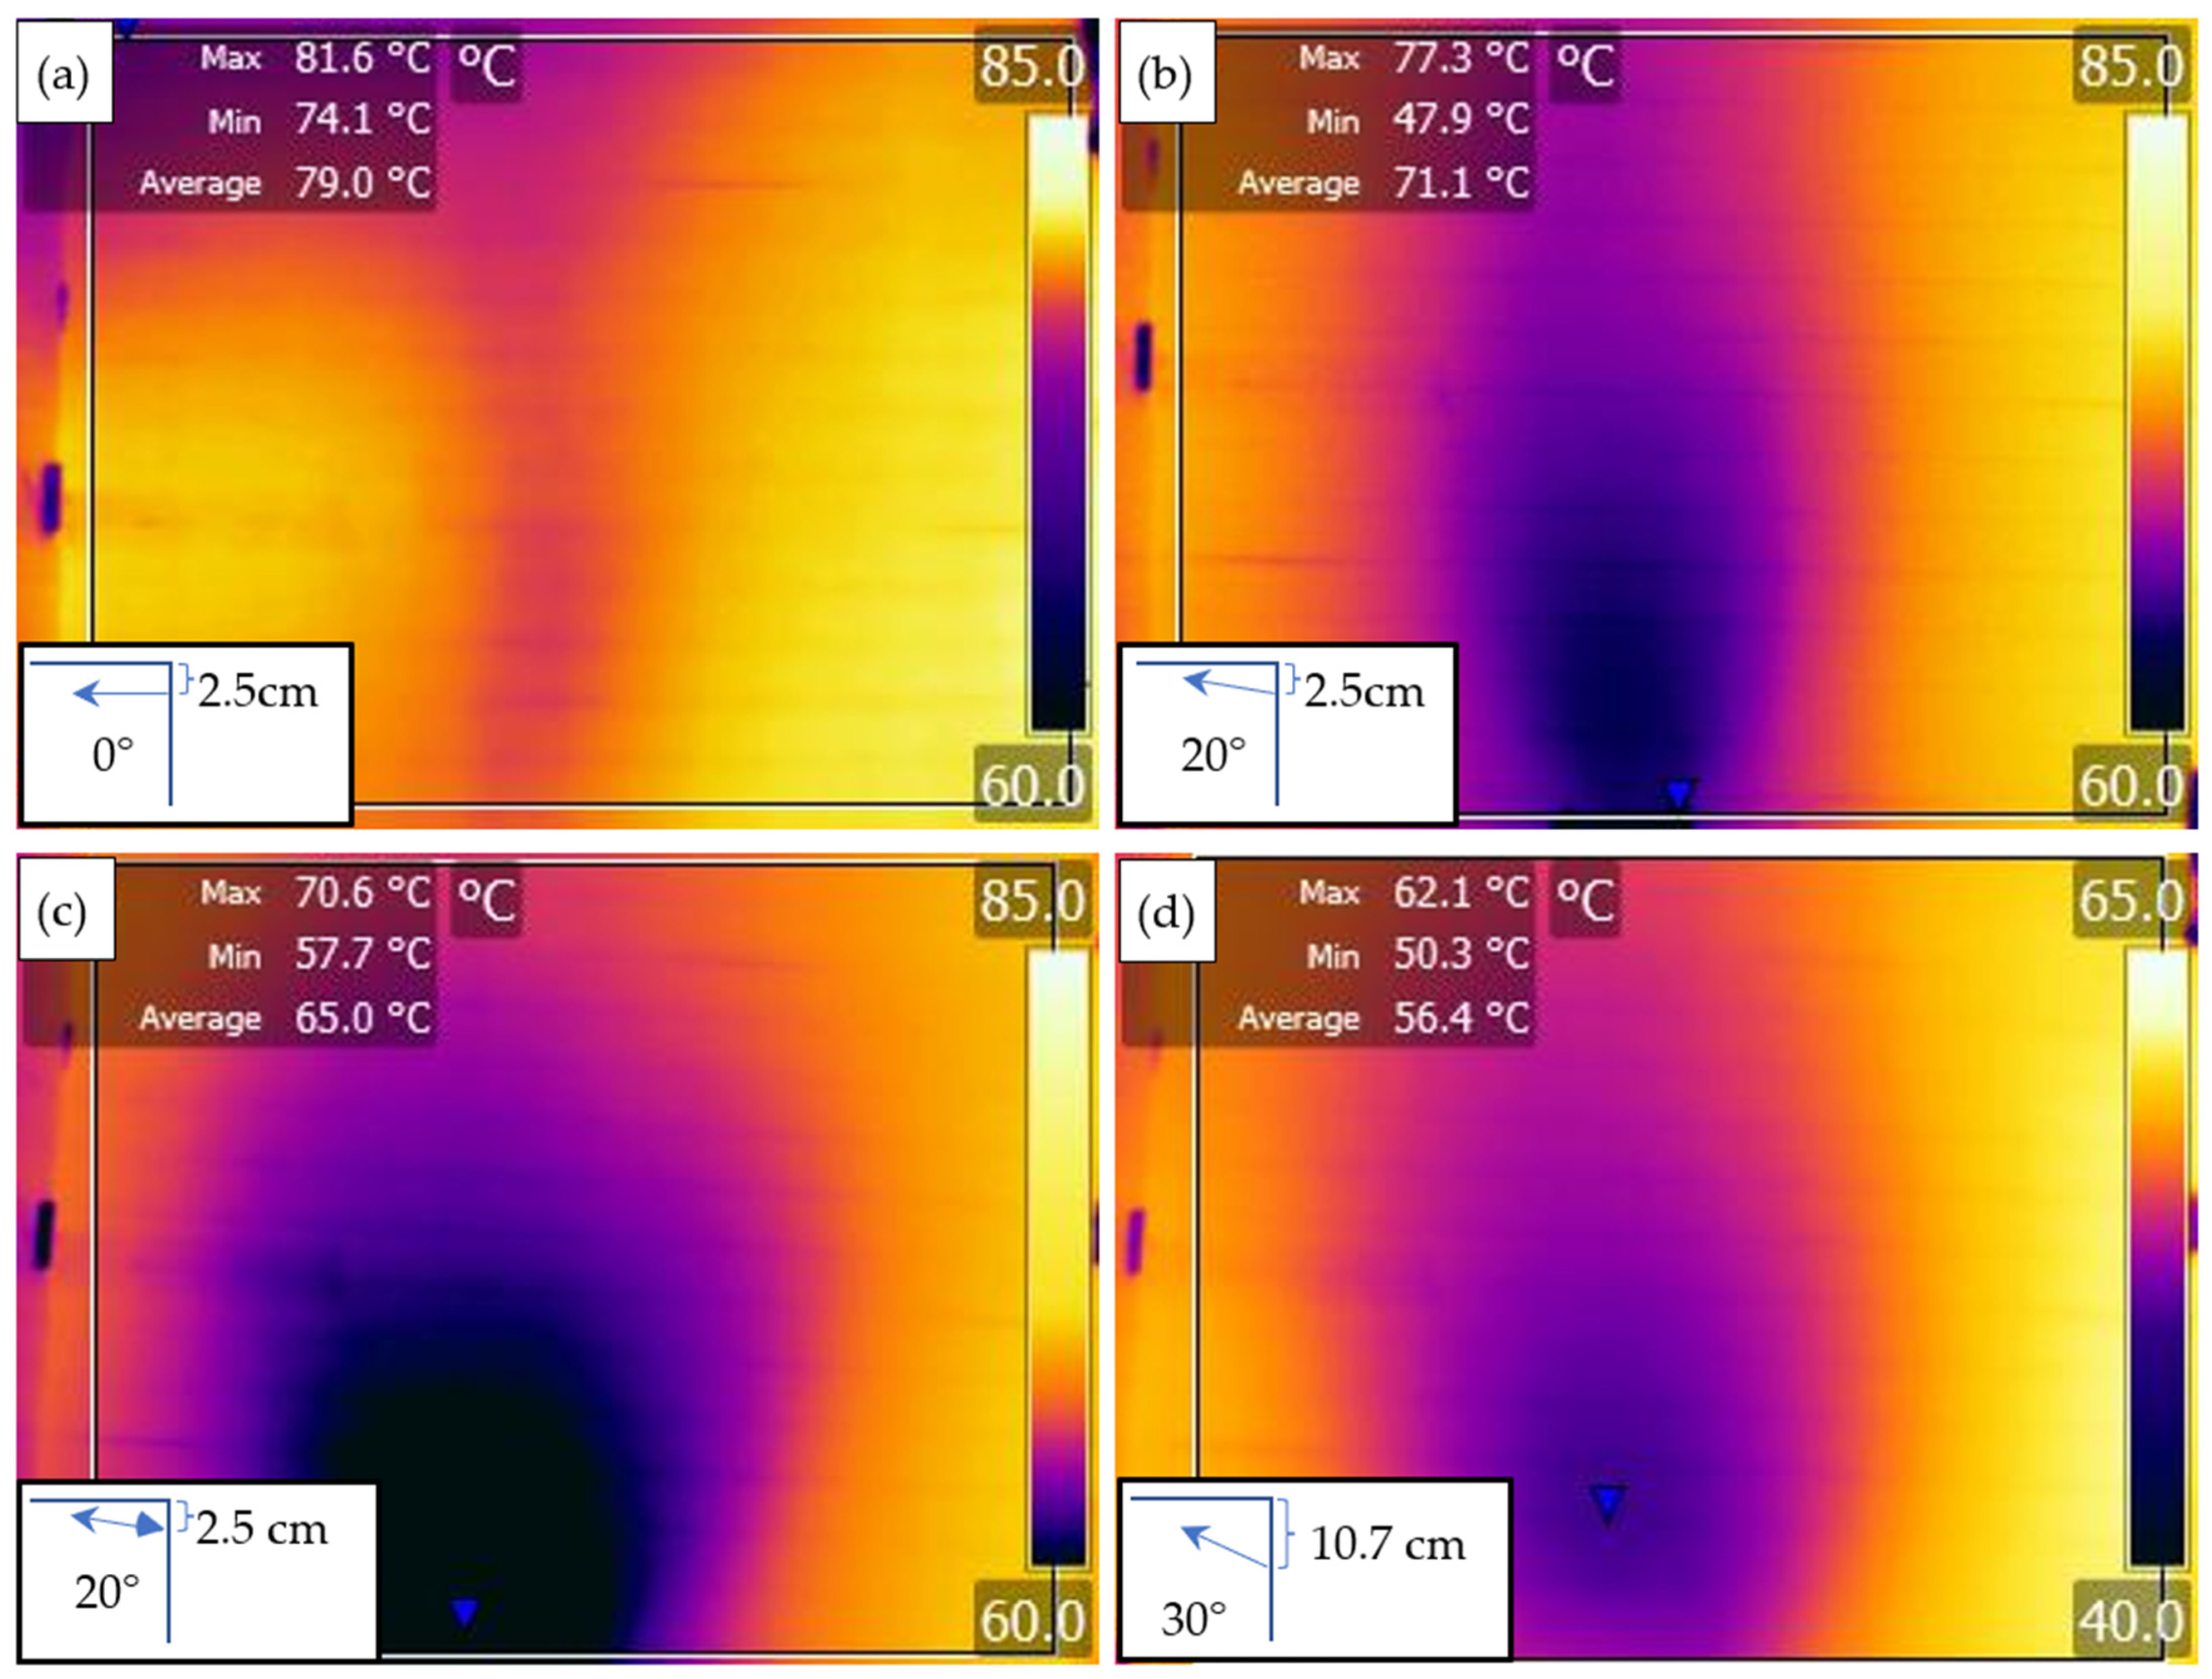
Selected thermograms. All air inlets at bottom of respective images (0.91 m/s, Reinlet ≈ 7050). (a) 2.5 cm offset with 0° inclination, (b) 2.5 cm offset with 20° inclination, (c) 2.5 cm offset with 20° inclination and 20° horizontal spread, and (d) 10.7 cm offset with 30° inclination.
3.2. Results: Experimental
One goal of this testing was to assess how airflow direction affects the convective coefficient. Figure 4 shows thermograms of the heated ceiling temperature distribution patterns for two different inlet heights and jet angles. All tests shown in Figure 4 were performed with the same heater power and inlet velocities. The ceiling heat flux and temperatures were higher than real-life conditions to improve accuracy. With steady-state heat generation, a lower ceiling temperature corresponds to a high convective heat transfer coefficient from the incoming air.
Figure 4a–c show temperature patterns with the inlet close to the ceiling. As the inlet jet angle is changed from horizontal to 20° upward, the ceiling temperature decreases, indicating a higher convective heat transfer coefficient. In Figure 4c, the jet also spreads horizontally, further increasing convection. Figure 4d shows the temperature pattern when the inlet is lowered to simulate a typical window setup. The color scale is adjusted to show the full temperature range. The combination of inclined air jet and horizontal air spread results in the highest convection cooling.
When the inlet is moved to a scaled position 10.7 cm from the ceiling, a similar jet flow is observed as with the 2.5 cm offset. However, with the air flowing horizontally through the window, there is no discernible effect on the ceiling temperature. This is important as it establishes a baseline for housing in Bhuj and reinforces that improvements in nighttime ventilation could enhance next-day comfort. While the jet does have some splashing effect on the far wall (at the top of the image), it does not significantly affect the ceiling temperature.
Figure 4 shows how changes in air distribution patterns improve heat transfer. With horizontal jet flow and an offset window (Figure 4a), the convective heat transfer coefficient is between 1.5 and 2 W/(m2·K), akin to a simple well-mixed approximation where the daily temperature profile of a building is dominated by external radiation and wind-driven convection. Moving the window closer to the ceiling increases the convective heat transfer to 2–3 W/(m2·K). In the higher offset case, with a tilted jet, convective heat transfer increases to 5–10 W/(m2·K) (see Figure 4). This significantly lowers the ceiling temperature, and with a higher air change rate (80 ACH in the scale model), the added heat is removed without raising the average air temperature. For the full-size room, the same Reynolds number results in 14.4 ACH.
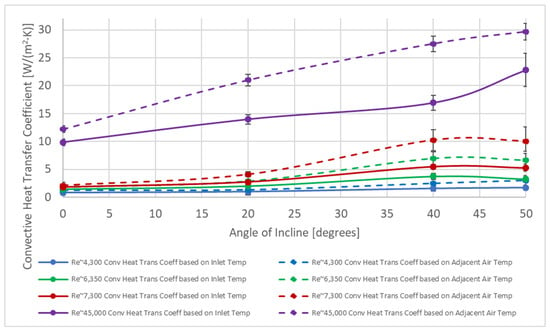
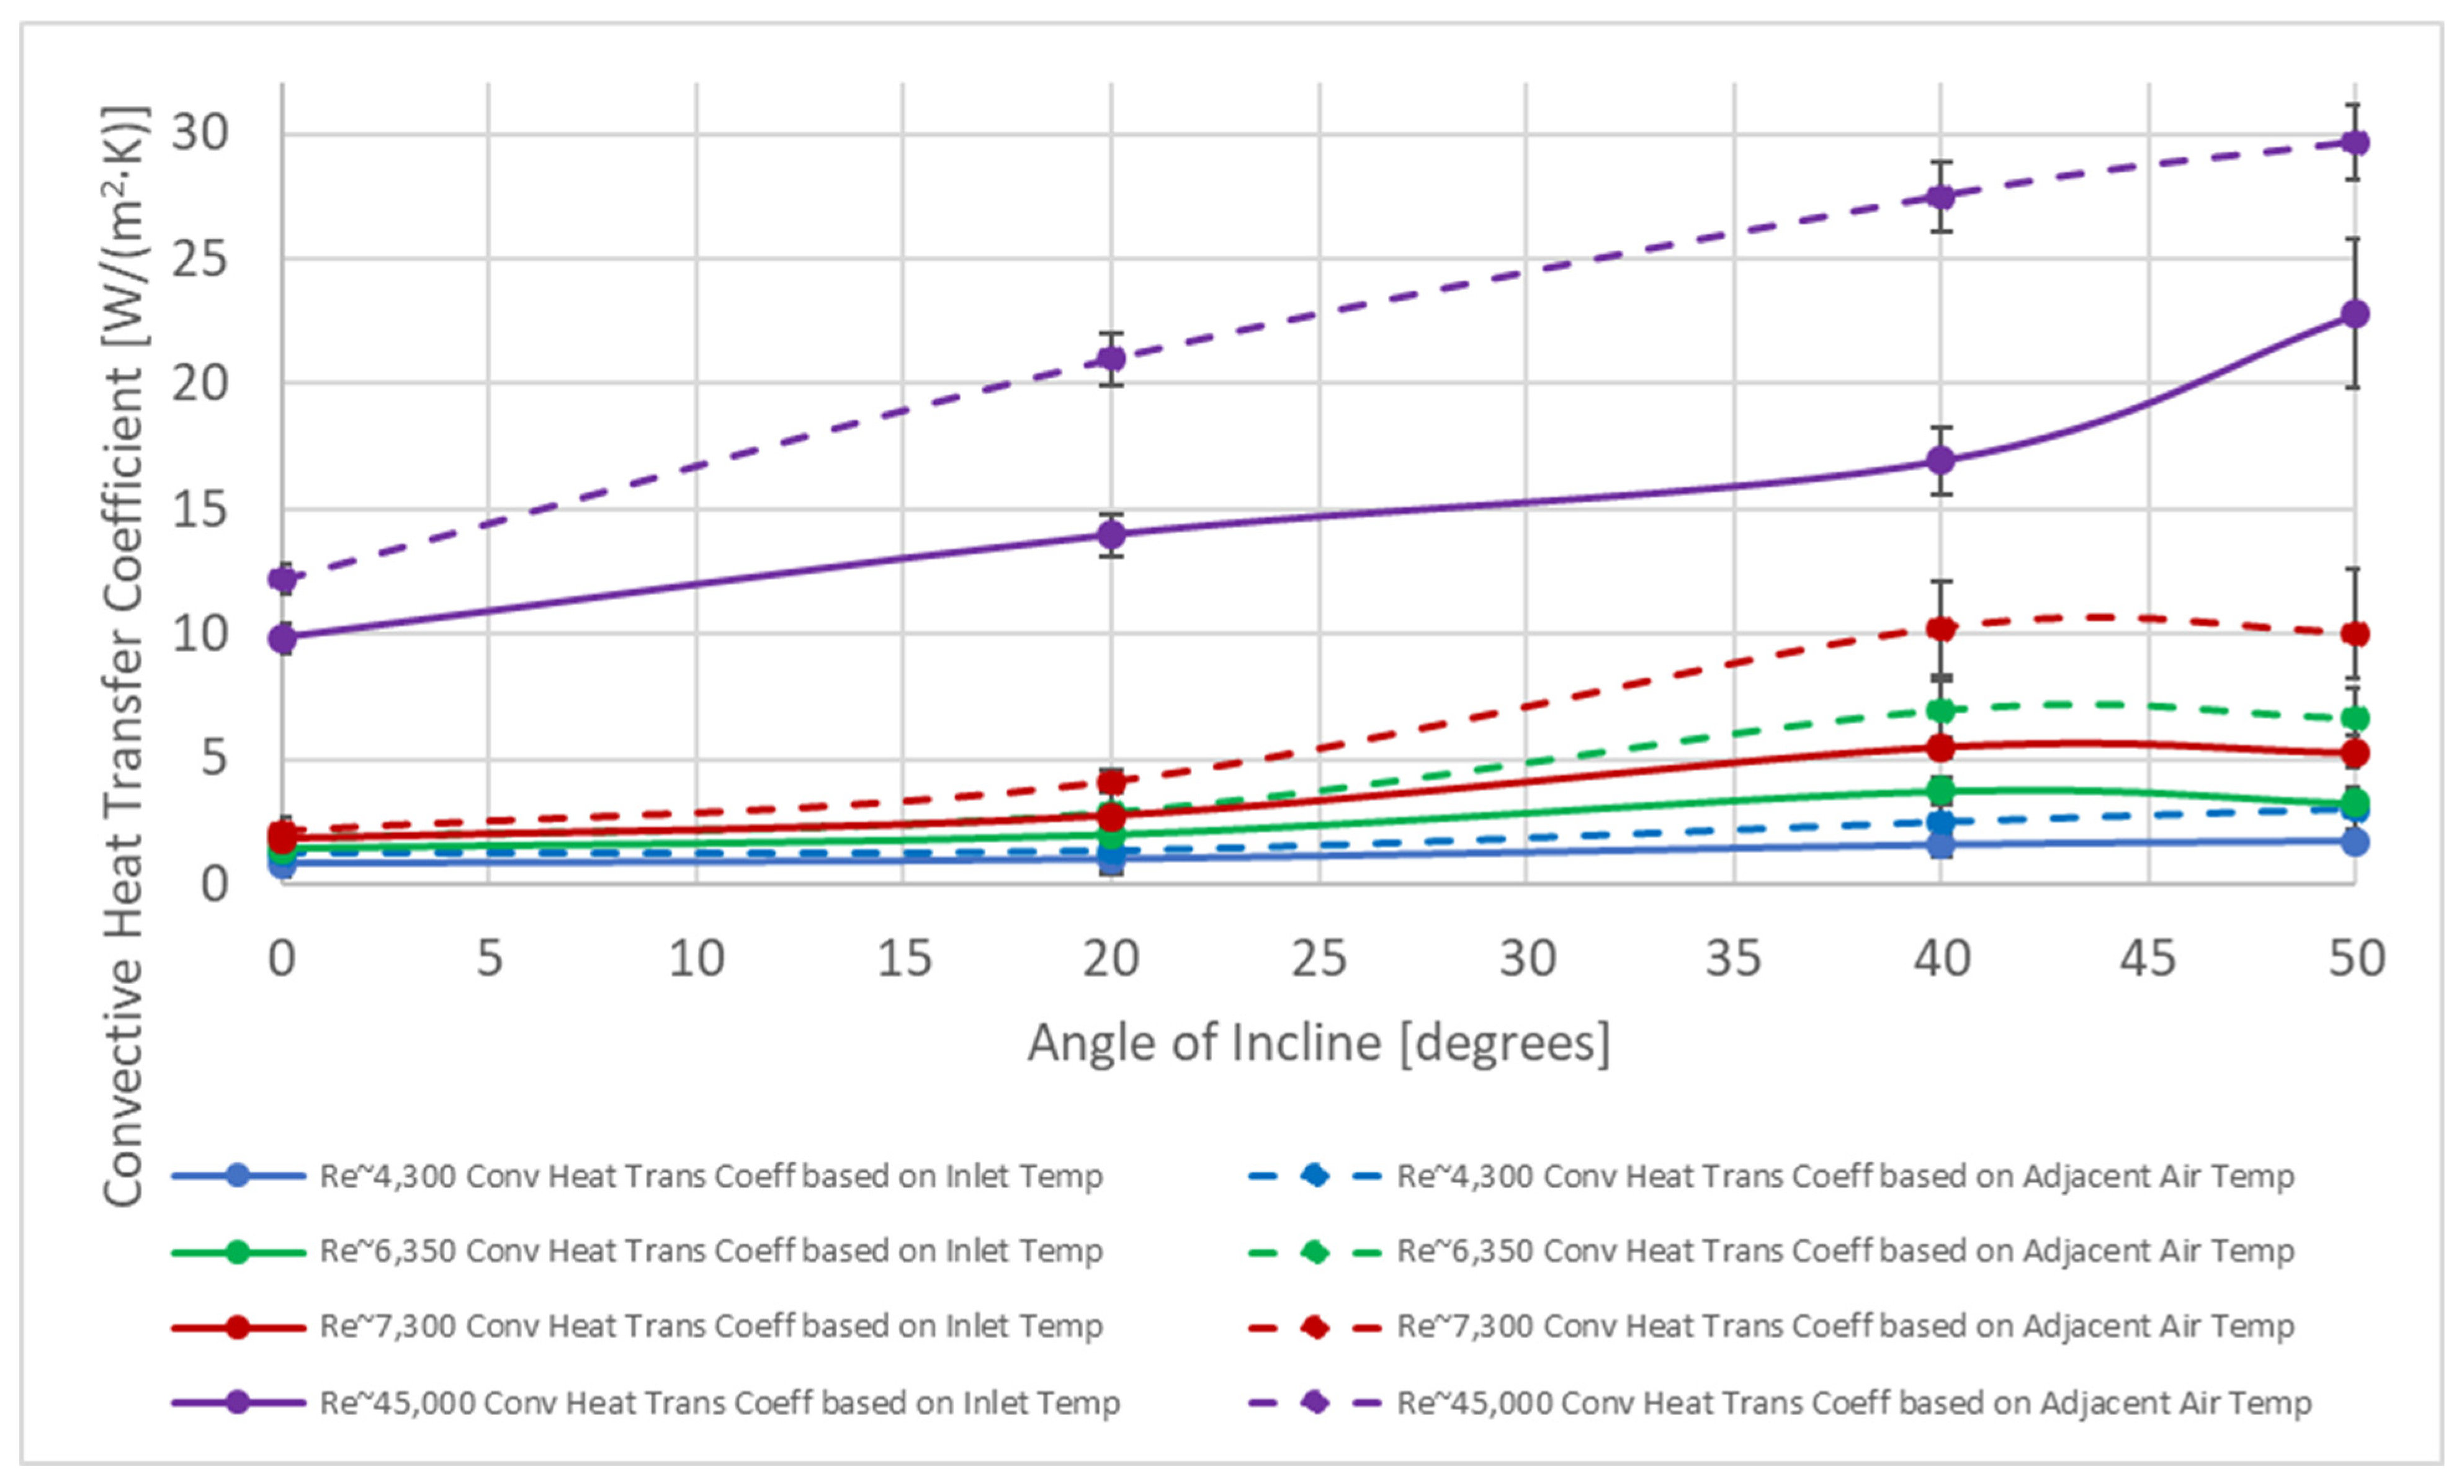
The experiment tested 44 different cases, varying air velocity, vertical inclination, inlet location, and horizontal distribution. The Reynolds number ranged from 3900 to 44,450 (0.50–5.7 m/s), vertical inclination varied from 0° to 60°, and horizontal distribution varied from 0° to 40° spread. For comparison, the theoretical natural convective coefficient of a downward-facing heated plate is 0.66 W/(m2·K) [55]. Figure 5 shows the results for the 10.7 cm offset case. With horizontal flow, the heat transfer coefficient at lower ventilation rates is 0.82 W/(m2·K).
Figure 5.
Influence of air speed and direction on convective heat transfer coefficient, with 10.7 cm offset of window from ceiling.
Figure 5 shows that as air velocity and inclination angle increase, the heat transfer coefficient also rises. For horizontal jet flow (0° inclination), as the Reynolds number increases from 4300 to 7300, the convective heat transfer coefficient more than doubles. The experiments indicate that heat transfer scales with velocity raised to the 1.2 power.
Increasing the jet inclination towards the ceiling has a much greater impact on the convection than moderate increases in air speed. Additionally, Figure 5 suggests there is a maximum limit for the convective heat transfer coefficient as the jet inclination increases at moderate airflow levels.
Figure 5 also shows the results at moderate and high Reynolds numbers. The heat transfer coefficient is based on the air temperature adjacent to the boundary layer on the ceiling surface. At Reynolds 45,000, the jet flow (0° incline) produces a 20% higher convective heat transfer coefficient than the lower Reynolds 7300 case with a 40° incline. At higher Reynolds numbers, the heat transfer coefficient continues to increase as the inclination rises. However, as shown in Figure 5, measurement uncertainty is higher at the low Reynolds number and for high inclination cases due to fewer tests at those conditions.
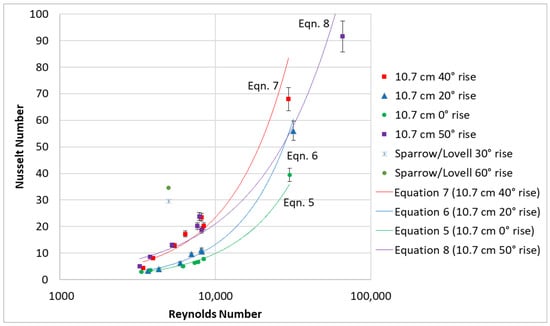
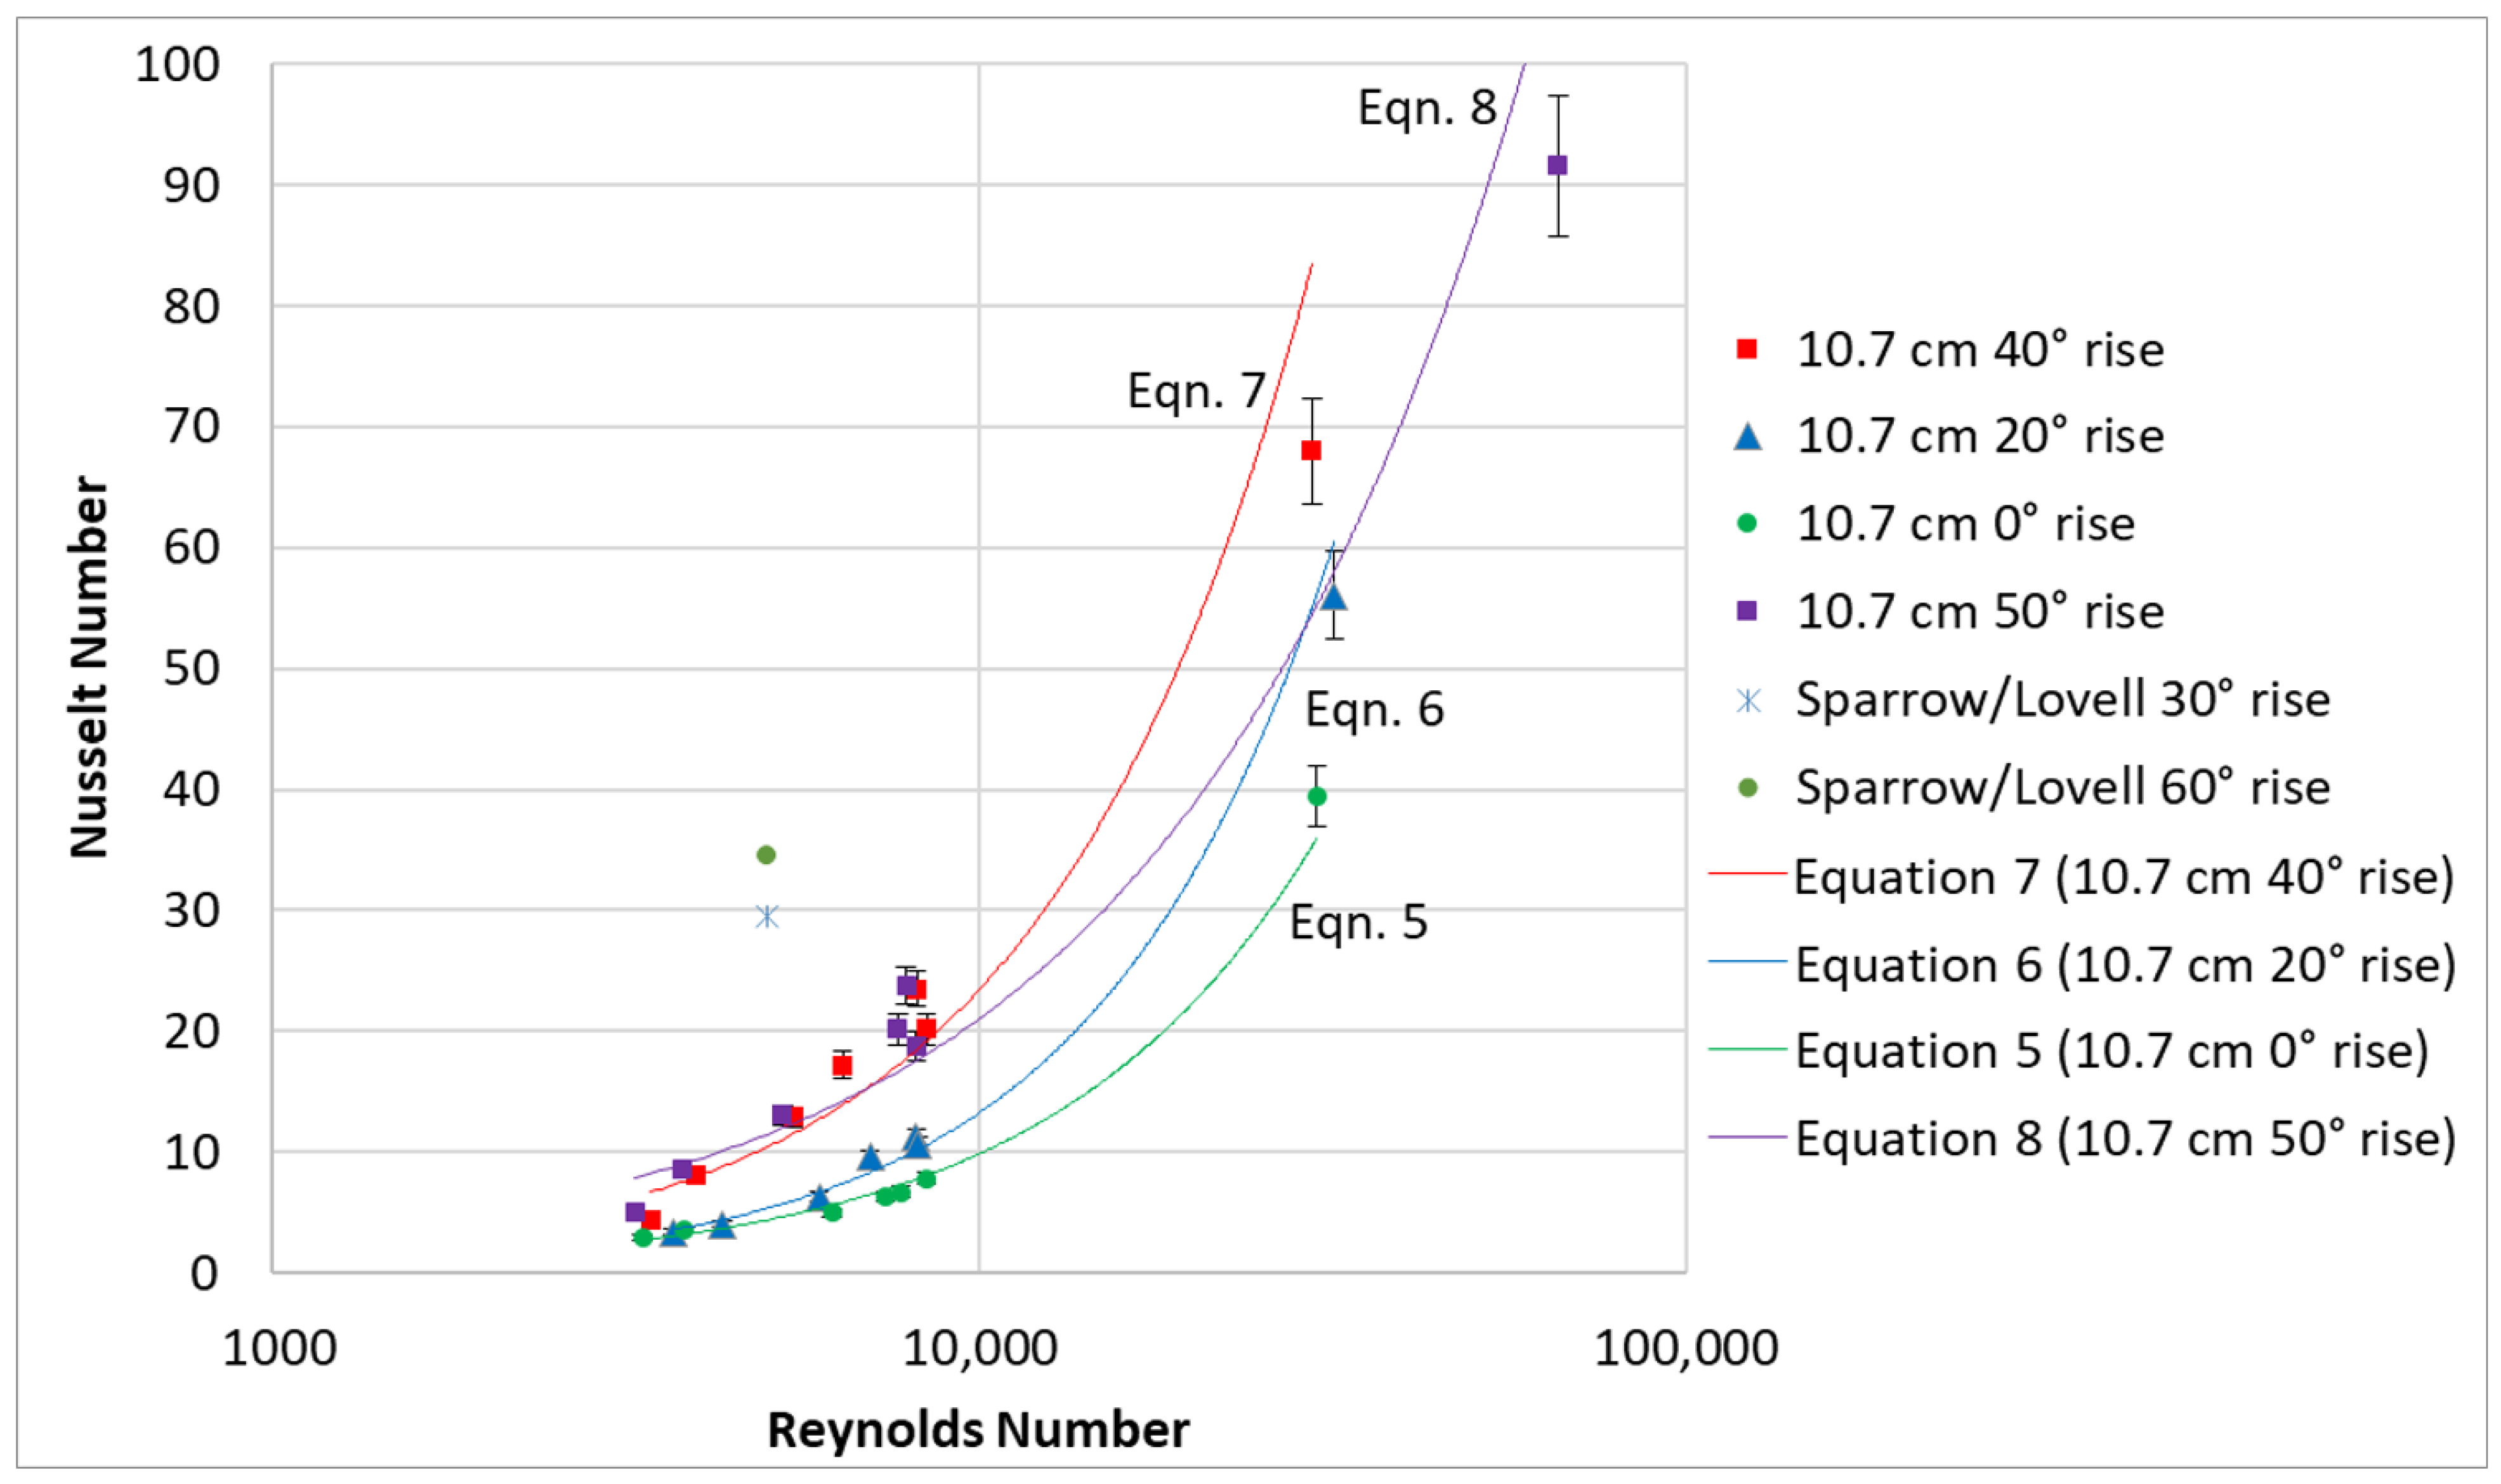
Figure 6 shows the relationship between the Nusselt number (based on the inlet air temperature) and the Reynolds number, using data from the experimental convective heat transfer, speed, and inclination angle. The Reynolds number characteristic length is the orifice diameter (10.2 cm.). This data shows a positive correlation between the Reynolds number and the Nusselt number as well as the positive effect of inclination angle on the Nusselt number. Since only one case was tested above a Reynolds number of 10,000, the authors suggest that the correlation is most reliable for Reynolds numbers of 3000 and 10,000. Future work is necessary to expand the applicability of these results prior to engineering design use. For these cases, air is assumed to have a constant Prandtl number of 0.71 due to the small variation in inlet temperatures.
Figure 6.
Log plot of Nusselt vs. Reynolds (characteristic length = orifice diameter, Nusselt number based on inlet air temperature).
The results can be approximated by
Figure 6 includes data points from Sparrow’s experiments using a flat plate inside a larger enclosure with unobstructed boundaries [21]. The Nusselt numbers from this work are about half to a third of those calculated from Sparrow. In contrast to Sparrow’s experiments, the ceiling in this experiment is physically bounded by walls. In the present experiment, the airflow along the ceiling decelerates as it approaches the walls and must pass through a constrained outlet at the rear, while in Sparrow’s case, the air can freely exit the plate in all directions.
This variation is similar to the findings of Restrepo and Glicksman [24], who found that when varying the edge conditions of a heated plate facing down, the natural convection heat transfer coefficient on the horizontal surface varied by up to thirty percent when thermal conditions were varied for vertical surfaces extended upward at the plate boundaries. It is expected that the heat transfer coefficients would vary by a larger percentage when vertical surfaces were extended downward at the plate boundaries, and by proxy, which illustrates the novelty of this manuscript. Variation in these data is also expected along with changing geometry, and more research beyond this first work is needed to understand the implications of the geometry as boundary conditions change.
3.3. Estimation of Nighttime Cooling for Multi-Story Building
To estimate the impact of enhanced convection to the ceiling, an approximate calculation for nighttime convective cooling is made, assuming that the ceiling acts like a middle floor in a multi-story building. Since the Biot modulus is less than one for an overwhelming majority of the testing-derived convective coefficients, the ceiling’s cooling effect can be estimated using a simple lumped model. The convective heat transfer to the slab includes both convection to the ceiling, and from the upper surface of the slab to the next floor, assuming both floors use the same cooling strategies and have the same indoor temperatures. As the center slabs of multi-story buildings will have similar temperatures under the same conditions, radiation is neglected. In a more precise simulation, radiation from the ceiling to the exterior walls should be included, along with the thermal transient behavior for those walls. This would require details of the building orientation, shading, and solar absorptivity of the exterior surface.
The convection coefficient for the ceiling, , is based on the experimental data, while the convection coefficient for the floor, , is assumed to be 1.76 W/(m2K) based on the geometry and orientation of an upward-facing heated plate without forced cooling [55]. This value will vary as a function of temperature, room size, and real-world geometric constraints at full-scale. Hence, the total effective heat transfer is
To estimate the thermal impact in a multi-story building with varying internal and ambient air temperatures, an energy balance is made for both the ceiling slab and the room, as shown in Equations (10) and (11). The temperature of the slab is then solved using Equation (12). For the ceiling slab, a lumped approximation is assumed.
where
is the thickness of the slab, assumed to be 0.1 m;
is the floor area of the space, assumed to be 12 m2 (for a 28 m2 two-room apartment);
is the product of density and specific heat of the concrete, assumed to be 1.8 × 10⁶ J/m3K;
is the temperature of the slab, in Celsius;
is time, in seconds;
is the heat that is absorbed into the slab from the room, in Watts;
is the total heat transfer coefficient based on the values shown in Table 5 for night and day;
is the temperature of the air within the room, in Celsius.
For the room interior, assuming well-mixed air and the only other thermal mass being the ceiling, an energy balance including an internal load yields
where
is the ventilation mass flow rate as shown in Table 5;
is the specific heat of the air;
is the outside air temperature that varies over the daytime;
is the internal heat load of the room, assumed to be 216 W from 7 a.m. to 10 p.m., and 162 W at all other times corresponding to two occupants.
Combining Equations (10) and (11) and solving for the ceiling slab temperature, this neglects heat transfer to the outside walls.
A full-scale building experiment is underway in Bhuj. Using Bhuj-specific weather data [63] for the warmest month-long timeframe (21 April–21 May), an iterative solver was applied to match the slab temperature at hour 24 with the slab temperature at hour zero (). Solutions were found to have total heat transfer coefficients ranging from 3.1 to 24.6 W/m2 K during the nighttime hours (7 p.m. to 8 a.m.) when the fan operates at a constant rate. A selection of the cases run and their heat transfer coefficients and air change rates are listed in Table 5. Daytime hours are defined from 8 a.m. to 7 p.m. The total heat transfer coefficient includes both convective and radiative components. While this simplified modeling approach does not capture all impacts, it highlights the relative differences in daily temperature using various nighttime heat transfer coefficients, including variations in the nighttime air change rate.
The total heat transfer coefficients () are based on the experimentally derived values mentioned earlier, and the air change rate is matched to the Reynolds number for the airflow through a circular inlet, using the same 5.55:1 scaling as the test chamber. Radiation is neglected based on the assumption that each slab has a lumped capacitance and experiences the same conditions throughout the building. The representative cases are listed in Table 5, with the results shown in Figure 7.
Figure 7.
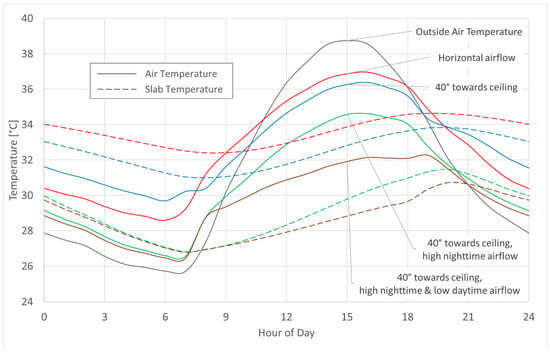
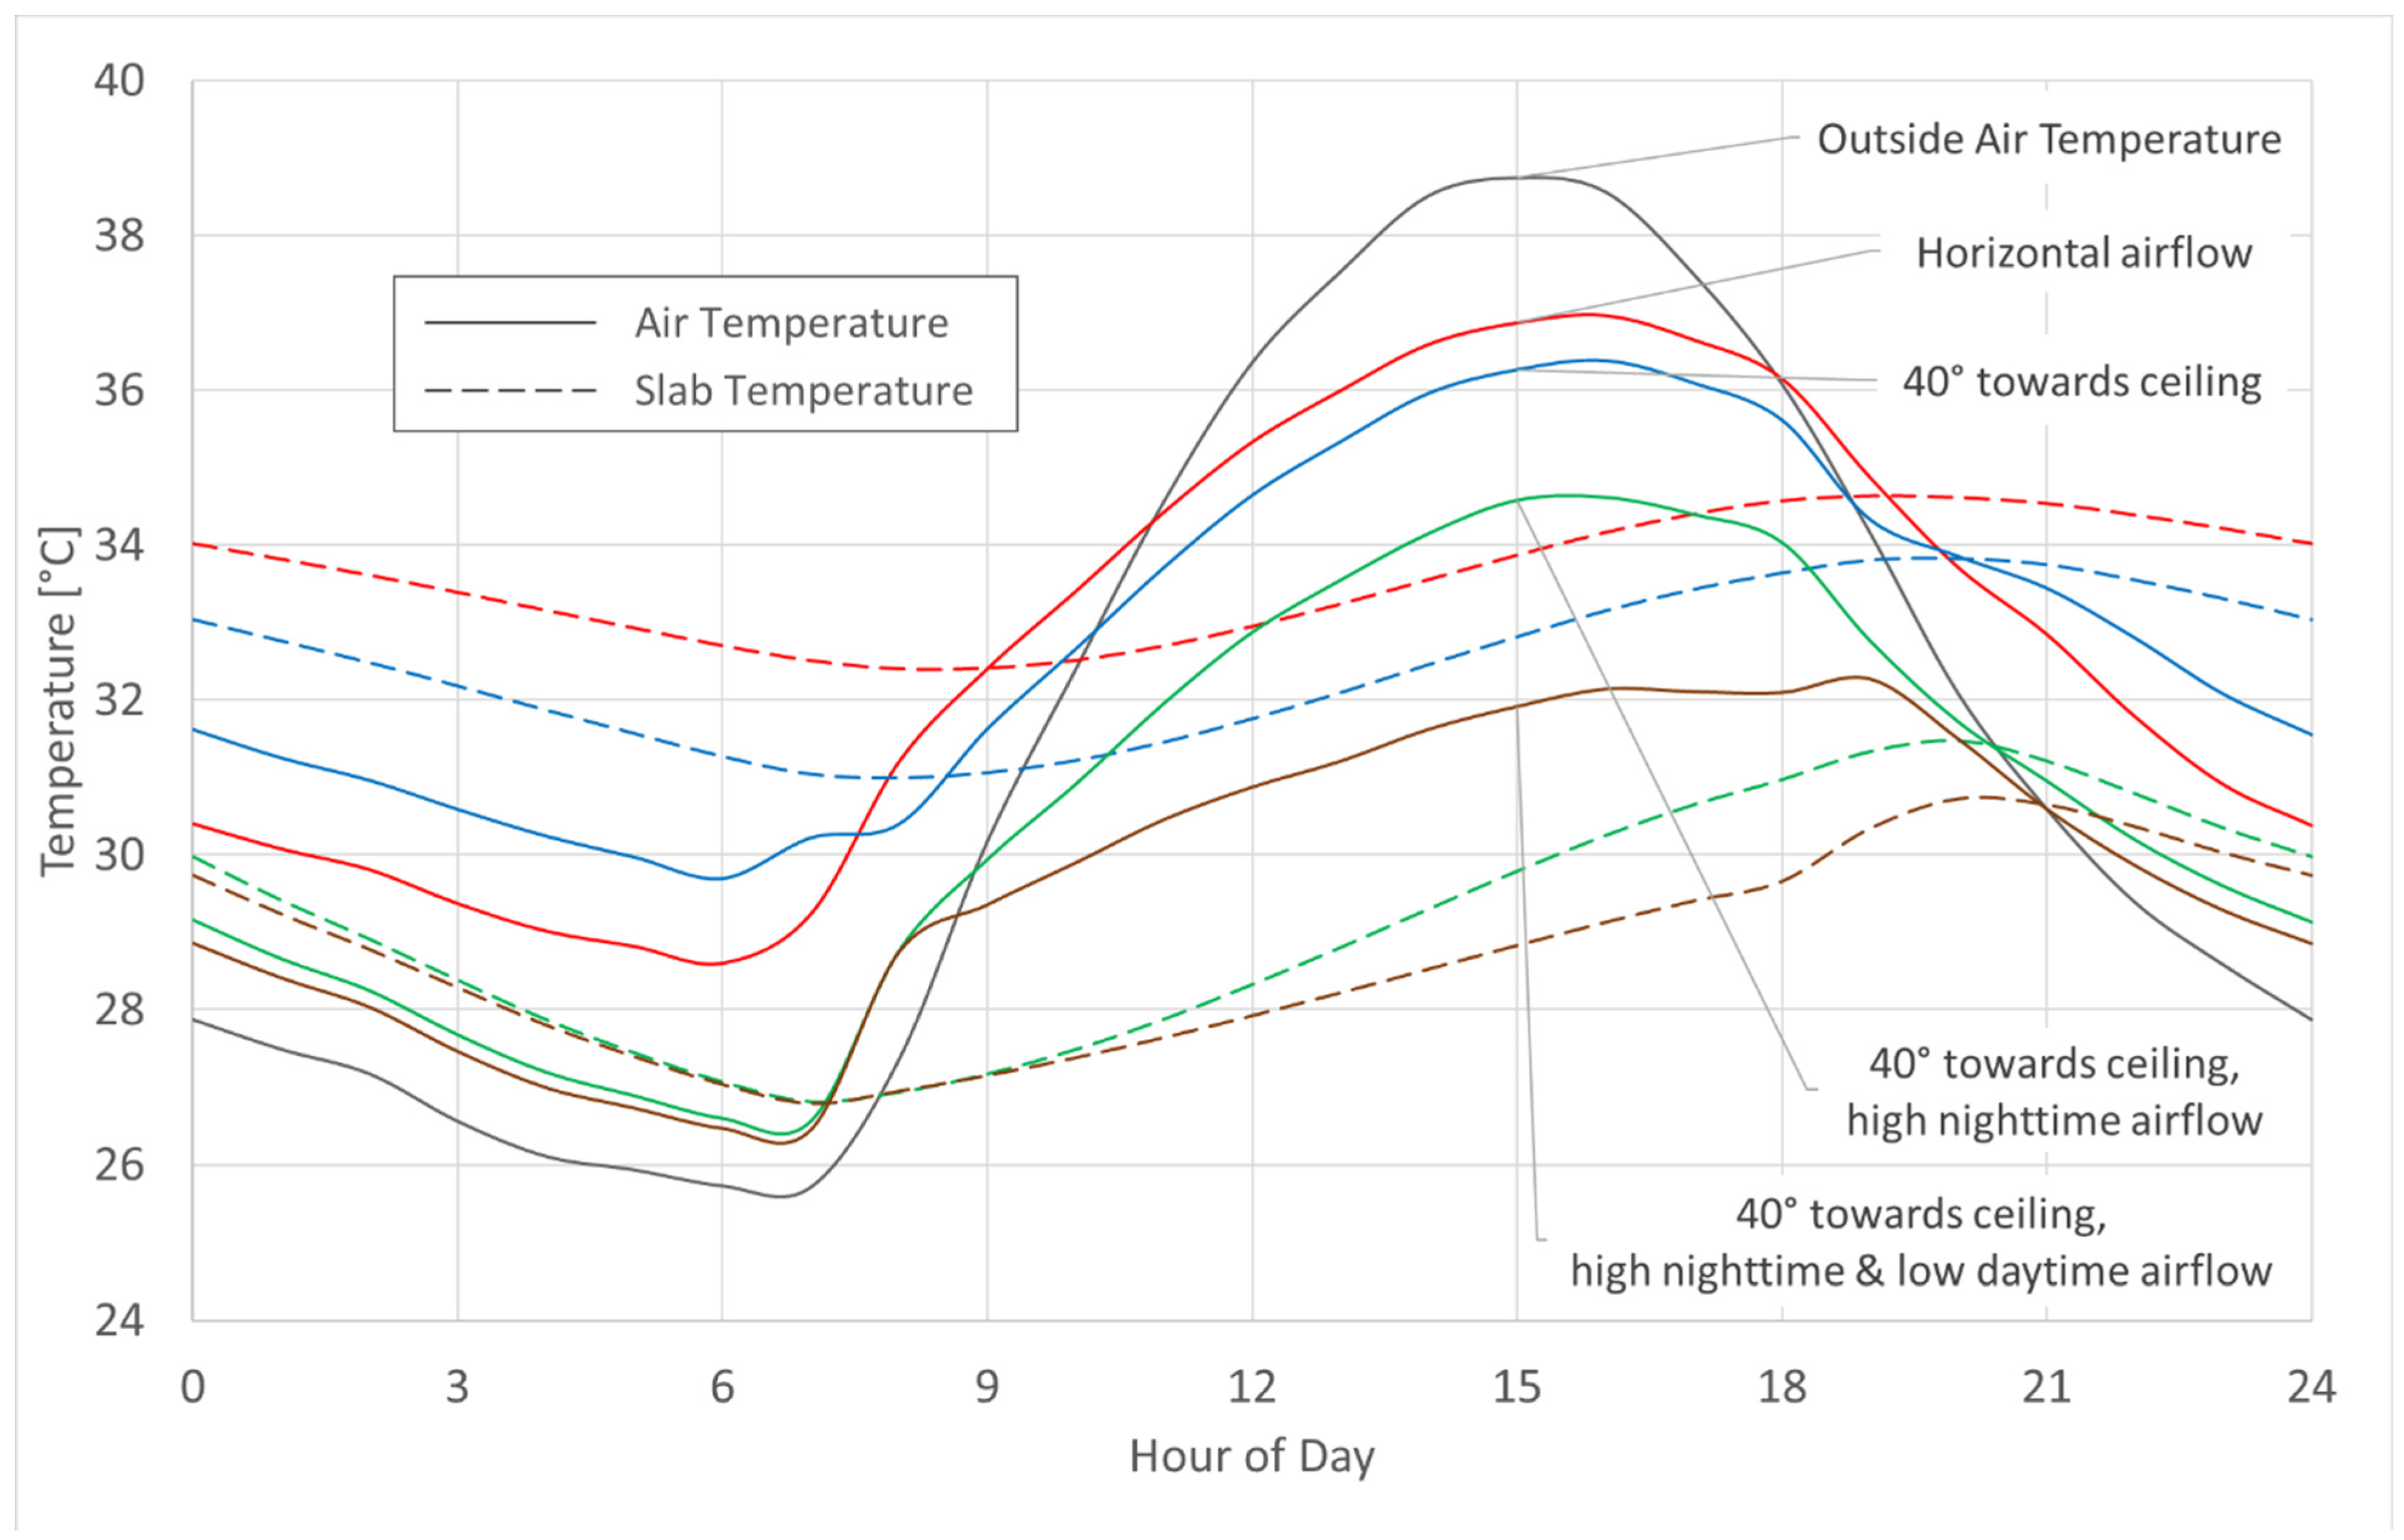
Modeled daily temperature profiles of room, slab, and outdoor air for a hypothetical multi-story unit in Bhuj, India, from 21 April to 21 May, with an internal heat generation varying between 162 W and 216 W, and showing the substantial improvement from high-ventilation conditions.
Table 5.
Figure 7 summary of inputs.
Figure 7 shows a selection of modeled daily profiles for the room and slab temperatures based on the iterative solver described above based on climate data from Bhuj, India. The selected profiles are intended to show the relative changes in temperatures at different times of the day based on airflow and total heat transfer differences. In line with the formulation of Equation (12), Figure 7 shows that the thermal performance of the system is the coupling of the total heat transfer coefficient and the airflow rate. These selections are intended to be illustrative of the scale of improvements. To carry out a more accurate simulation, heat transfer through the exterior walls by conduction, and radiation and convection to all the interior walls must be included.
Beginning at the baseline horizontal flow case (red), the redirection of the inlet air upwards by 40° (blue) increases the nighttime air temperature by 1.1 °C as the total heat transfer coefficient more than doubles. This redirection of air decreases the nighttime slab temperature by 1.5 °C, of which a 1.0 °C reduction holds throughout the subsequent day. The daytime air temperature remains cooler by 0.6 °C as compared to the baseline horizontal flow case. For the redirection of air at moderate flow rates, this cooling effect is significant relative to the 13.0 °C diurnal change in the weather condition.
As airflow increases substantially to 31.8 ACH (green), the overall heat rejection rate from the living space increases substantially, and the nighttime air temperature is within 1.0 °C of the ambient outside temperature. The daytime air temperature decreases a further 1.8 °C relative to the 40° inclination angle case or 2.4 °C from the baseline. The nighttime air temperature is then within 0.8 °C of the outside air temperature, which is significant, noting that the outside air temperature is the only mechanism for the slab to cool itself in this conceptualization of a multi-story housing building.
If a low daytime air change rate (1 ACH) is then held throughout the daytime hours (brown), both the air temperature and slab temperature achieve a 5.0 °C reduction in temperature as compared to the baseline horizontal flow case. The associated nighttime air temperature remains within 0.8 °C of the ambient environment and the slab temperature in the morning is within 1.3 °C of the ambient environment.
While upward-directed airflow can improve heat transfer coefficients, a lower air change rate limits the effectiveness of removing heat from the living space and may lead to higher nighttime air temperatures. To achieve significant improvement, both air redirection and increased air change rates are necessary, beyond just opening a window.
Figure 7 also shows that for low daytime airflow cases, the slab temperature is substantially lower than the air temperature, which suggests the use of a ceiling fan during the daytime could be used to enhance the convective heat transfer to the ceiling from the interior and better use the thermal capacitance of the ceiling slab to reduce daytime air temperatures. Future work will quantify the thermal comfort impact using standardized models, but even at the high airflow (Reynolds number 45,710), the air velocity downstream of the redirected air within the full-size building (1.19 m/s) is within acceptable limits according to ASHRAE 55 thermal comfort standards [62]. Future work will use the existing simplified model, coupled with the full-scale experimental validation, to define the flow rates necessary to keep nighttime room air temperatures at the same level as prior to the increased total heat transfer coefficient.
This scenario assumes a constant daytime heat generation rate. If exterior walls are uninsulated and have high solar absorptivity, solar heat gains will cause higher inside air temperatures. Further improvement is possible by increasing the heat transfer coefficient or reducing the air change rate during the day. Weatherization measures, and ceiling fan use and timing, may further reduce indoor temperatures and warrant further research.
4. Discussion
This paper quantifies the additional cooling that can be achieved by directing airflow as part of nighttime ventilation, which removes more heat than the traditional night flush methods and cools the ceiling slab for the next day. This work presents the first experimental results for the convective heat transfer coefficient of airflow directed upward from an open window toward the ceiling. This approach significantly improves nighttime ventilation by cooling the ceiling slab and reducing daytime indoor temperatures. In typical architecture, the window is some distance below the ceiling, so directing airflow horizontally results in minimal convective heat transfer to the ceiling.
Using a coupled lumped capacitance and energy balance model with the Bhuj’s weather data and applied to multi-story buildings, redirecting an inlet jet towards the ceiling at night lowers both slab and room air temperatures throughout the next day. By combining this with low daytime air change rates, redirected inlet air, and high nighttime air change rates, both peak daytime room temperatures and slab temperatures remain 5 °C cooler than a conventional horizontal air inlet at moderate airflows based on the 13 °C diurnal swing typical for Bhuj. This cooling reduces the need to adopt air conditioning, lowers occupant exposure to extreme heat, and decreases the risk of heat-related health issues. However, this approach is only effective in areas with large temperature swings between day and night and when nighttime air quality allows for the introduction of outside air.
This paper highlights that both the ventilation rate and targeted heat transfer coefficients are key to achieving thermal comfort. In single-story buildings, temperature reduction may be less significant because solar radiation dominates the slab temperature. However, rooftop solar radiation is not a major issue in multi-story buildings, where each floor reacts similarly. For apartment or condominium dwellers with limited ability to modify their space, the ceiling slab is an effective and readily accessible thermal mass for nighttime cooling, as it significantly impacts both indoor air and slab temperatures throughout the day.
Measurements were taken at angles between 0° and 60°, and the values not directly measured were inferred via the best curve fit shown in Figure 5 and are, therefore, expected to have higher uncertainty. Some results show greater uncertainty due to a wider spread of surface temperatures around the mean, which was the metric used in this paper. Note that, in the approximate simulation, a mean value for the heat transfer coefficient is used. Further research is needed to define the useful limits and optimal conditions (area, velocity, angle of inclination, and angle of horizontal spread) for diffusing the inlet jet across a ceiling. Additionally, the convective heat transfer coefficients in this paper are based on high temperature differences for data resolution purposes, and such temperature differences are not likely to be observed in practice. In the tests, the Richardson number was less than 0.6, indicating that buoyancy effects should be minimal. The Nusselt number correlations, based on the mean air temperature, are provided to assist with scaling purposes; however, further research involving full-scale testing and computational approaches is necessary to fully validate the correlations and determine the limits of Nusselt number length-scale applicability. Coupled with the lower temperature differences observed in practice, the additional cumulative effects present at larger scales may limit the effective ceiling area that can be cooled using this approach and reduce the total convective heat transfer. Further work is necessary to establish those limitations. In short, the inclusion of the additional impacts mentioned increases the uncertainty in the total cooling potential estimates.
This work used an idealized setup indicative of the building typology of interest and simplified for experimental purposes, but those idealizations do not necessarily apply universally. While the results offer a helpful guide for systems using diurnal ventilation coupled with thermal mass, the work is limited in scope, as other factors such as complex interior layouts, occupant behavior, asymmetrical exterior openings, and exhaust locations must be accounted for. The work is additionally limited by the testing variations run and constrained by the exposed ceiling slab. In practice, factors such as wind shear, stack effect, local obstructions, and varying building-external heat sources can affect system performance, even with a mechanical fan. Inside the living unit, walls, furniture, and partitions add thermal mass and disrupt air patterns, which may modify the system’s effectiveness. However, these features also present an opportunity for further research, focusing on different sub-spaces within a living unit to create cooler areas at different times of the day and exploring multi-zonal energy models, computational fluid dynamics, and occupant feedback in design. Where the projected temperature reduction is based on one modeled climatic condition, additional work is necessary to explore the application across different regions and the influence of wind, humidity, and cyclic cloud cover on nighttime radiative cooling.
For future research, the team is taking next steps to expand this work to test several homes in the Ramdev Nagar neighborhood in Bhuj, India. This new data will help guide implementation, local outreach, and refine the model. Future studies will explore using ceiling fans to direct air toward the ceiling, boosting the heat transfer coefficient when redirecting air is not possible. In these next steps, the authors recognize that ceiling fan use could reduce thermal comfort during operation, and full-scale testing with occupant feedback will be needed to maximize possible adoption levels. Further improvements for single-story buildings and top-floor units could be made by combining lighter-colored roofing with the increased convective cooling method described in this paper.
5. Conclusions
To moderate interior daytime temperature using night ventilation, both high nighttime air change rates and improved convection with the building’s thermal mass are needed. Horizontal ventilation through typical window placements does not provide much convection to the ceiling. However, directing air upward from the window toward the ceiling enhances the convective heat transfer coefficient, with some representative cases increasing from 3.5 W/m2 K to 7.7 W/m2 K. At high air redirection and flow rates, values reached a maximum of 24.6 W/m2 K. Using a simplified approach, when enhanced convection is combined with elevated nighttime and reduced daytime air change rates for a typical home in Bhuj, Gujarat, India, daytime temperatures can be reduced by 5 °C.
Author Contributions
Conceptualization, J.K. and L.G.; methodology, J.K. and L.G.; validation, J.K. and L.G.; formal analysis, J.K.; investigation, J.K.; resources, J.K. and L.G.; data curation, J.K.; writing—original draft preparation, J.K.; writing—review and editing, J.K. and L.G.; visualization, J.K.; supervision, L.G.; project administration, L.G.; funding acquisition, L.G. All authors have read and agreed to the published version of the manuscript.
Funding
Funding was provided by the MIT Tata Center for Technology and Design for work to be performed in and to benefit the Indian subcontinent. The sponsor had no role in the design, execution, interpretation, or writing of the study.
Institutional Review Board Statement
No ethical considerations are necessary for implementation of this research. This work was performed with a local collaborator and their on-staff social worker to ensure that all ideas and processes remained socially, culturally, and fiscally respectful of local homeowners providing initial perspectives and thoughts on potential adoption. In-person informational interviews were repeated by the female social worker in the absence of men to help reduce any gender-induced responses.
Data Availability Statement
The original contributions presented in this study are included in the article. Further inquiries can be directed to the corresponding author.
Acknowledgments
This work was made possible through a collaboration with the Hunnarshala Foundation to assess regional needs and opportunities. Notable contributors from the Hunnarshala Foundation include Tejas Kotak, Mahavir Acharya, and Pradip Rangani.
Conflicts of Interest
The authors declare no conflicts of interest.
Appendix A
Table A1.
Summary of as-tested experimental conditions and associated results.
Table Header Descriptions:
: Inlet air temperature, measured via thermocouple;
: Outlet air temperature, measured via thermocouple.
: Uppermost thermocouple temperature inside test cell, measured;
: Ceiling temperature, measured via thermal camera with appropriate adjustments for thermal reflectivity, thermal absorptivity, reflected temperature, et cetera.
: See Equation (2)
: The air velocity;
: The characteristic length based on the diameter of the inlet;
: The kinematic viscosity of the air, assumed to be a constant at 15.0 × 10⁻⁶ m2/sec.
: See Equation (3)
: See Equation (4)
References
- Hansen, J.; Sato, M.; Ruedy, R. Perception of climate change. Proc. Natl. Acad. Sci. USA 2012, 109, E2415–E2423. [Google Scholar] [CrossRef] [Scilit] [PubMed]
- Meehl, G.A.; Tebaldi, C. More intense, more frequent, and longer lasting heat waves in the 21st century. Science 2004, 305, 994–997. [Google Scholar] [CrossRef] [Scilit]
- Stocker, T.; Qin, D.; Plattner, G.-K.; Tignor, M.; Allen, S.K.; Boschung, J.; Nauels, A.; Xia, Y.; Bex, V.; Midgley, P. IPCC, 2013: Climate Change 2013: The Physical Science Basis. Contribution of Working Group I to the Fifth Assessment Report of the Intergovernmental Panel on Climate Change; Cambridge University Press: Cambridge, UK, 2013. [Google Scholar]
- Mora, C.; Dousset, B.; Caldwell, I.R.; Powell, F.E.; Geronimo, R.C.; Bielecki, C.R.; Counsell, C.W.W.; Dietrich, B.S.; Johnston, E.T.; Louis, L.V.; et al. Global risk of deadly heat. Nat. Clim. Change 2017, 7, 501–506. [Google Scholar] [CrossRef] [Scilit]
- Orlov, A.; Sillmann, J.; Aunan, K.; Kjellstrom, T.; Aaheim, A. Economic costs of heat-induced reductions in worker productivity due to global warming. Glob. Environ. Change 2020, 63, 102087. [Google Scholar] [CrossRef] [Scilit]
- Binazzi, A.; Levi, M.; Bonafede, M.; Bugani, M.; Messeri, A.; Morabito, M.; Marinaccio, A.; Baldasseroni, A. Evaluation of the impact of heat stress on the occurrence of occupational injuries: Meta-analysis of observational studies. Am. J. Ind. Med. 2019, 62, 233–243. [Google Scholar] [CrossRef] [Scilit]
- Yingdong, H.; Wenhua, C.; Zhe, W.; Hui, Z. Review of fan-use rates in field studies and their effects on thermal comfort, energy conservation, and human productivity. Energy Build. 2019, 194, 140–162. [Google Scholar] [CrossRef] [Scilit]
- Das, S. Temperature Increase, Labor Supply and Cost of Adaptation in Developing Economies: Evidence on Urban Workers in Informal Sectors. Clim. Change Econ. 2015, 6, 1550007. [Google Scholar] [CrossRef] [Scilit]
- Mazdiyasni, O.; AghaKouchak, A.; Davis, S.J.; Madadgar, S.; Mehran, A.; Ragno, E.; Sadegh, M.; Sengupta, A.; Ghosh, S.; Dhanya, C.T.; et al. Increasing probability of mortality during Indian heat waves. Sci. Adv. 2017, 3, e1700066. [Google Scholar] [CrossRef] [Scilit]
- Shuang, Y.; Jiangjiang, X.; Zhongwei, Y.; Anzhi, Z.; Yang, X.; Dabo, G.; Jiaru, H.; Jun, W.; Liang, C.; Yakun, K. Loss of work productivity in a warming world: Differences between developed and developing countries. J. Clean. Prod. 2019, 208, 1219–1225. [Google Scholar] [CrossRef] [Scilit]
- Ehsan, S.; Abbas, F.; Ibrahim, M.; Ahmad, B.; Farooque, A.A. Thermal Discomfort Levels, Building Design Concepts, and Some Heat Mitigation Strategies in Low-Income Communities of a South Asian City. Int. J. Environ. Res. Public Health 2021, 18, 2535. [Google Scholar] [CrossRef] [Scilit]
- Banerjee, R.; Maharaj, R. Heat, infant mortality, and adaptation: Evidence from India. J. Dev. Econ. 2020, 143, 102378. [Google Scholar] [CrossRef] [Scilit]
- Malik, J.; Bardhan, R.; Hong, T.; Piette, M.A. Contextualising adaptive comfort behaviour within low-income housing of Mumbai, India. Build. Environ. 2020, 177, 106877. [Google Scholar] [CrossRef] [Scilit]
- Nagpure, A.S.; Reiner, M.; Ramaswami, A. Resource requirements of inclusive urban development in India: Insights from ten cities. Environ. Res. Lett. 2018, 13, 025010. [Google Scholar] [CrossRef] [Scilit]
- ISHRAE. ISHRAE Weather Files [Online]. Available online: https://climate.onebuilding.org/about/default.html (accessed on 17 April 2025).
- Geros, V.; Santamouris, M.; Tsangrasoulis, A.; Guarracino, G. Experimental evaluation of night ventilation phenomena. Energy Build. 1999, 29, 141–154. [Google Scholar] [CrossRef] [Scilit]
- Singh, M.; Sharston, R. A literature review of building energy simulation and computational fluid dynamics co-simulation strategies and its implications on the accuracy of energy predictions. Build. Serv. Eng. Res. Technol. 2022, 43, 113–138. [Google Scholar] [CrossRef] [Scilit]
- Espinosa, F.D.; Glicksman, L.R. Determining thermal stratification in rooms with high supply momentum. Build. Environ. 2017, 112, 99–114. [Google Scholar] [CrossRef] [Scilit]
- Spitler, J.D.; Pedersen, C.O.; Fisher, D.E. Interior Convective Heat Transfer in Buildings with Large Ventilative Flow Rates. ASHRAE Trans. 1991, 97, 505–515. [Google Scholar]
- Gao, N.; Ewing, D.; Ching, C.Y. Heat transfer in turbulent planar offset attaching jets with small initial offset distances. Int. J. Heat Mass Transf. 2015, 83, 21–26. [Google Scholar] [CrossRef] [Scilit]
- Sparrow, E.M.; Lovell, B.J. Heat Transfer Characteristics of an Obliquely Impinging Circular Jet. Trans. ASME 1980, 102, 202–209. [Google Scholar] [CrossRef] [Scilit]
- Goldstein, R.J.; Franchett, M.E. Heat Transfer From a Flat Surface to an Oblique Impinging Jet. Trans. ASME 1988, 110, 84–90. [Google Scholar] [CrossRef] [Scilit]
- Attalla, M.; Salem, M. Experimental Investigation of Heat Transfer for a Jet Impinging Obliquely on a Flat Surface. Exp. Heat Transf. 2015, 28, 378–391. [Google Scholar] [CrossRef] [Scilit]
- Restrepo, F.; Glicksman, L. The effect of edge conditions on natural convection from a horizontal plate. Int. J. Heat Mass Transf. 1974, 17, 135–142. [Google Scholar] [CrossRef] [Scilit]
- Tuohy, P.; McElroy, L.; Johnstone, C. Thermal Mass, Insulation, and Ventilation in Sustainable Housing—An Investigation Across Climate and Occupancy. In Proceedings of the Ninth International IBPSA Conference, Montreal, QC, Canada, 15–18 August 2005. [Google Scholar]
- Manu, S.; Brager, G.; Rawal, R.; Geronazzo, A.; Kumar, D. Performance evaluation of climate responsive buildings in India—Case studies from cooling dominated climate zones. Build. Environ. 2019, 148, 136–156. [Google Scholar] [CrossRef] [Scilit]
- Solgi, E.; Fayaz, R.; Kari, B.M. Cooling load reduction in office buildings of hot-arid climate, combining phase change materials and night purge ventilation. Renew. Energy 2016, 85, 725–731. [Google Scholar] [CrossRef] [Scilit]
- Guo, R.; Heiselberg, P.; Hu, Y.; Zhang, C.; Vasilevskis, S. Optimization of night ventilation performance in office buildings in a cold climate. Energy Build. 2020, 225, 110319. [Google Scholar] [CrossRef] [Scilit]
- Holford, J.M.; Woods, A.W. On the thermal buffering of naturally ventilated buildings through internal thermal mass. J. Fluid Mech. 2007, 580, 3–29. [Google Scholar] [CrossRef] [Scilit]
- Lo, L.J.; Novoselac, A. Cross ventilation with small openings: Measurements in a multi-zone test building. Build. Environ. 2012, 57, 377–386. [Google Scholar] [CrossRef] [Scilit]
- Li, Y.; Yam, J.C.W. Designing Thermal Mass in Naturally Ventilated Buildings. Int. J. Vent. 2004, 2, 313–324. [Google Scholar] [CrossRef] [Scilit]
- Zhou, J.; Zhang, G.; Lin, Y.; Li, Y. Coupling of thermal mass and natural ventilation in buildings. Energy Build. 2008, 40, 979–986. [Google Scholar] [CrossRef] [Scilit]
- Yang, L.; Li, Y. Cooling load reduction by using thermal mass and night ventilation. Energy Build. 2008, 40, 2052–2058. [Google Scholar] [CrossRef] [Scilit]
- Ji, W.; Wang, H.; Du, T.; Zhang, Z. Parametric study on a wall-mounted attached ventilation system for night cooling with different supply air conditions. Renew. Energy 2019, 143, 1865–1876. [Google Scholar] [CrossRef] [Scilit]
- Yin, H.; Li, A. Study of attached air curtain ventilation within a full-scale enclosure: Comparison of four turbulence models. Indoor Built Environ. 2016, 25, 962–975. [Google Scholar] [CrossRef] [Scilit]
- Yin, H.; Li, Y.; Zhang, D.; Han, Y.; Wang, J.; Zhang, Y.; Li, A. Airflow pattern and performance of attached ventilation for two types of tiny spaces. Build. Simul. 2022, 15, 1491–1506. [Google Scholar] [CrossRef] [Scilit]
- Awbi, H.B.; Hatton, A. Natural convection from heated room surfaces. Energy Build. 1999, 30, 233–244. [Google Scholar] [CrossRef] [Scilit]
- Beausoleil-Morrison, I. The Adaptive Coupling of Heat and Air Flow Modelling Within Dynamic Whole-Building Simulation; University of Strathclyde: Glasgow, UK, 2000. [Google Scholar]
- Khalifa, A.-J.N. Natural convective heat transfer coefficient—A review: I. Isolated vertical and horizontal surfaces. Energy Convers. Manag. 2001, 42, 491–504. [Google Scholar] [CrossRef] [Scilit]
- Khalifa, A.-J.N. Natural convective heat transfer coefficient—A review: II. Surfaces in two- and three-dimensional enclosures. Energy Convers. Manag. 2001, 42, 505–517. [Google Scholar] [CrossRef] [Scilit]
- Goethals, K.; Breesch, H.; Janssens, A. Sensitivity analysis of predicted night cooling performance to internal convective heat transfer modelling. Energy Build. 2011, 43, 2429–2441. [Google Scholar] [CrossRef] [Scilit]
- Goethals, K.; Delghust, M.; Flamant, G.; De Paepe, M.; Janssens, A. Experimental investigation of the impact of room/system design on mixed convection heat transfer. Energy Build. 2012, 49, 542–551. [Google Scholar] [CrossRef] [Scilit]
- Artmann, N.; Jensen, R.L.; Manz, H.; Hesielberg, P. Experimental investigation of heat transfer during night-time ventilation. Energy Build. 2010, 42, 366–374. [Google Scholar] [CrossRef] [Scilit]
- Le Dréau, J.; Heiselberg, P.; Jensen, R.L. Experimental investigation of convective heat transfer during night cooling with different ventilation systems and surface emissivities. Energy Build. 2013, 61, 308–317. [Google Scholar] [CrossRef] [Scilit]
- Guo, R.; Heiselberg, P.; Hu, Y.; Johra, H.; Jensen, R.L.; Jønsson, K.T.; Peng, P. Experimental investigation of convective heat transfer for night ventilation in case of mixing ventilation. Build. Environ. 2021, 193, 107670. [Google Scholar] [CrossRef] [Scilit]
- Guo, R.; Hu, Y.; Heiselberg, P.; Johra, H.; Zhang, C.; Peng, P. Simulation and optimization of night cooling with diffuse ceiling ventilation and mixing ventilation in a cold climate. Renew. Energy 2021, 179, 488–501. [Google Scholar] [CrossRef] [Scilit]
- Santamouris, M.; Kolokotsa, D. Passive cooling dissipation techniques for buildings and other structures: The state of the art. Energy Build. 2013, 57, 74–94. [Google Scholar] [CrossRef] [Scilit]
- Artmann, N.; Manz, H.; Heiselberg, P. Parameter study on performance of building cooling by night-time ventilation. Renew. Energy 2008, 33, 2589–2598. [Google Scholar] [CrossRef] [Scilit]
- Barmal, A.; Roy, M.; Dasgupta, A. Energy use in Building Envelope of a Residential Apartment Building in the Warm and Humid Climate of Guwahati, Assam. Int. J. Innov. Technol. Explor. Eng. 2020, 9, 119–126. [Google Scholar] [CrossRef] [Scilit]
- Owens Corning. Foamular NGX 250: Publication 43522-P; Owens Corning Foam Insulation, LLC: Toledo, OH, USA, 2020. [Google Scholar]
- Johns Manville. AP Foil-Faced Polyisocyanurate Continuous Insulation: Technical Data Sheet; Johns Manville: Denver, CO, USA, 2022. [Google Scholar]
- Incropera, F.P.; Dewitt, D.P.; Bergman, T.L.; Lavine, A.S. Fundamentals of Heat and Mass Transfer, 6th ed.; John Wiley & Sons: Hoboken, NJ, USA, 2007. [Google Scholar]
- Gustavsen, A.; Berdahl, P. Spectral Emissivity of Anodized Aluminum and the Thermal Transmittance of Aluminum Window Frames. Nord. J. Build. Phys. 2003, 3, 1–12. [Google Scholar]
- Modest, M.F. Radiation Heat Transfer, 3rd ed.; Academic Press: Oxford, UK, 2013. [Google Scholar]
- American Society of Heating, Refrigerating, and Air-Conditioning Engineers. ASHRAE Handbook—Fundamentals; ASHRAE: Atlanta, GA, USA, 2017. [Google Scholar]
- Ražnjević, K. Handbook of Thermodynamic Tables; Begell House: New York, NY, USA, 1995. [Google Scholar]
- Kongoletos, J. Airflow in Interior Spaces: Implications on Comfort and Health; Massachusetts Institute of Technology: Cambridge, UK, 2022. [Google Scholar]
- de Podesta, M.; Bell, S.; Underwood, R. Air temperature sensors: Dependence of radiative errors on sensor diameter in precision metrology. Metrologia 2018, 55, 229–244. [Google Scholar] [CrossRef] [Scilit]
- Griffith, K.P.; Wei, N.J.; Bodenschatz, E.; Bewley, G.P. Control of long-range correlations in turbulence. Exp. Fluids 2019, 60, 55. [Google Scholar] [CrossRef] [Scilit]
- ANSYS, Inc. ANSYS Fluent User’s Guide: 2020 R1; ANSYS, Inc.: Canonsburg, PA, USA, 2020. [Google Scholar]
- Olson, D.A.; Glicksman, L.R.; Ferm, H.M. Steady-State Natural Convection in Empty and Partitioned Enclosures at High Rayleigh Numbers. ASME J. Heat Mass Transf. 1990, 112, 640–647. [Google Scholar] [CrossRef] [Scilit]
- ANSI/ASHRAE Standard 55-2017; Thermal Environmental Conditions for Human Occupancy. ASHRAE: Atlanta, GA, USA, 2017.
- Indian Society of Heating, Refrigerating and Air Conditioning Engineers (ISHRAE). Bhuj-Rudramata TMY3 Weather File (#426340); White Box Technologies: Moraga, CA, USA, 2014. [Google Scholar]

Disclaimer/Publisher’s Note: The statements, opinions and data contained in all publications are solely those of the individual author(s) and contributor(s) and not of MDPI and/or the editor(s). MDPI and/or the editor(s) disclaim responsibility for any injury to people or property resulting from any ideas, methods, instructions or products referred to in the content. |
© 2026 by the authors. Licensee MDPI, Basel, Switzerland. This article is an open access article distributed under the terms and conditions of the Creative Commons Attribution (CC BY) license.