Article

Quantitative Control of Wind Environment-Adaptive Spatial Form for Residential Districts in Cold-Region Valley-Type Cities Based on Orthogonal Experimental Design

School of Architecture and Urban Planning, Lanzhou Jiaotong University, Lanzhou 730070, China
*
Author to whom correspondence should be addressed.
Buildings 2026, 16(11), 2080; https://doi.org/10.3390/buildings16112080 (registering DOI)
Submission received: 13 April 2026 / Revised: 13 May 2026 / Accepted: 20 May 2026 / Published: 23 May 2026

Abstract

To address the mismatch between spatial form and wind environment of residential districts in cold-region valley-type cities, which leads to poor thermal comfort, low ventilation efficiency and high building energy consumption, this study takes Hongyun Runyuan, a typical large-scale residential district in Lanzhou, as the research case. Using orthogonal experimental design, nine spatial schemes were developed with three core morphological parameters (building orientation, spacing coefficient, enclosure degree), each set with three levels. CFD simulations via PHOENICS were performed to analyze the influence weight of each parameter on the winter wind environment at 1.5 m pedestrian height. Results show that building orientation exerts an extremely significant effect on the winter wind environment (p = 0.006), while the spacing coefficient and enclosure degree have no significant independent effects (all p > 0.05). The optimal scheme, featuring 10° east of south orientation, 1.1 spacing coefficient and 0.3 enclosure degree, can effectively meet the winter wind protection demand. The quantitative optimization strategies proposed in this study provide scientific support for wind-friendly residential planning and building energy efficiency improvement in cold-region valley-type cities.

1. Introduction

Rapid urbanization has driven the large-scale development of urban residential districts. As the core spatial carrier for urban residents’ daily activities, the living environment quality of residential districts directly determines residents’ quality of life and health status [1,2]. The wind environment is a core component of the microclimate system in urban residential districts. It not only directly affects residents’ outdoor thermal comfort, but also is closely associated with building heating and cooling energy consumption, indoor and outdoor air circulation efficiency, and pollutant dispersion capacity [3,4]. Cold-region cities are characterized by long, frigid winters and short, hot summers. Insufficient adaptability between the spatial layout of residential districts and the wind environment tends to trigger dual dilemmas: intensified cold air infiltration and a sharp surge in heating energy consumption in winter, as well as poor natural ventilation and deteriorated indoor thermal environment in summer. These issues severely hinder the improvement of residential living quality and the achievement of building energy efficiency targets [5,6].
As a typical cold-region valley-type city in northwest China, Lanzhou features a long and narrow belt-shaped terrain formed by the Yellow River traversing the urban area. Its local wind field is significantly affected by the valley funneling effect, making wind environment regulation far more challenging than that in plain cities. Local energy conservation and emission reduction planning explicitly requires the energy efficiency rate of residential buildings to be increased to 75%. However, the mismatch between the spatial form of existing residential districts and the wind environment has become a key bottleneck restricting the realization of this target [7]. Hongyun Runyuan is a typical large-scale high-rise residential district in Chengguan District, Lanzhou. Its current layout has multiple defects, including poor adaptability of building orientation to the prevailing winter wind direction, inadequate control of building spacing, and unreasonable enclosure degree setting. These defects have caused wind environment problems such as local airflow stagnation and pollutant accumulation in winter, and insufficient ventilation efficiency in summer within the district. Lanzhou’s unique valley terrain and climatic characteristics further aggravate the complexity of wind environment optimization for such residential districts [8].
Existing studies on the wind environment of urban residential districts have mostly focused on plain cities, where relatively mature theoretical and methodological systems for spatial form regulation have been established. However, significant gaps remain in research on valley-type cities globally. While European studies have investigated wind flow characteristics in Alpine valley cities such as Basel through large-scale field experiments like the Basel Urban Boundary Layer Experiment (BUBBLE), they have mainly focused on urban boundary layer dynamics and street canyon ventilation rather than residential district spatial form optimization [9]. On the one hand, most studies have not fully considered the superimposed effects of special wind field characteristics such as the valley funneling effect and mountain–valley wind circulation on the residential wind environment, making their conclusions difficult to directly apply to valley cities with strong topographic constraints. On the other hand, existing studies have mostly adopted single-factor analysis methods, lacking systematic quantitative research on the coupling mechanism of multiple morphological parameters. In particular, no scientific quantitative optimization method has been formed to address the contradictory wind environment regulation requirements in cold-region valley-type cities. In current planning and design practices of residential districts, there is also a widespread lack of systematic quantitative research on the coupling mechanism between spatial form and wind environment. Most practices rely on planners’ empirical judgment and lack scientific multi-scheme comparison and quantitative optimization methodologies [10,11,12,13,14,15]. Against this background, this study takes Hongyun Runyuan residential district in Lanzhou, a typical cold-region valley-type city, as the research object, and adopts a combined method of orthogonal experimental design and CFD numerical simulation. It systematically explores the influence mechanism of three core spatial morphological parameters (building orientation, building spacing coefficient, and residential district enclosure degree) on the wind environment of residential districts in cold-region valley-type cities, quantitatively analyzes the influence weight of each parameter, screens the optimal spatial form combination, and proposes targeted optimization strategies. This study aims to provide a scientific basis and practical reference for wind environment-friendly planning and design of residential districts in cold-region valley-type cities.

2. Materials and Methods

2.1. Overview of the Study Area

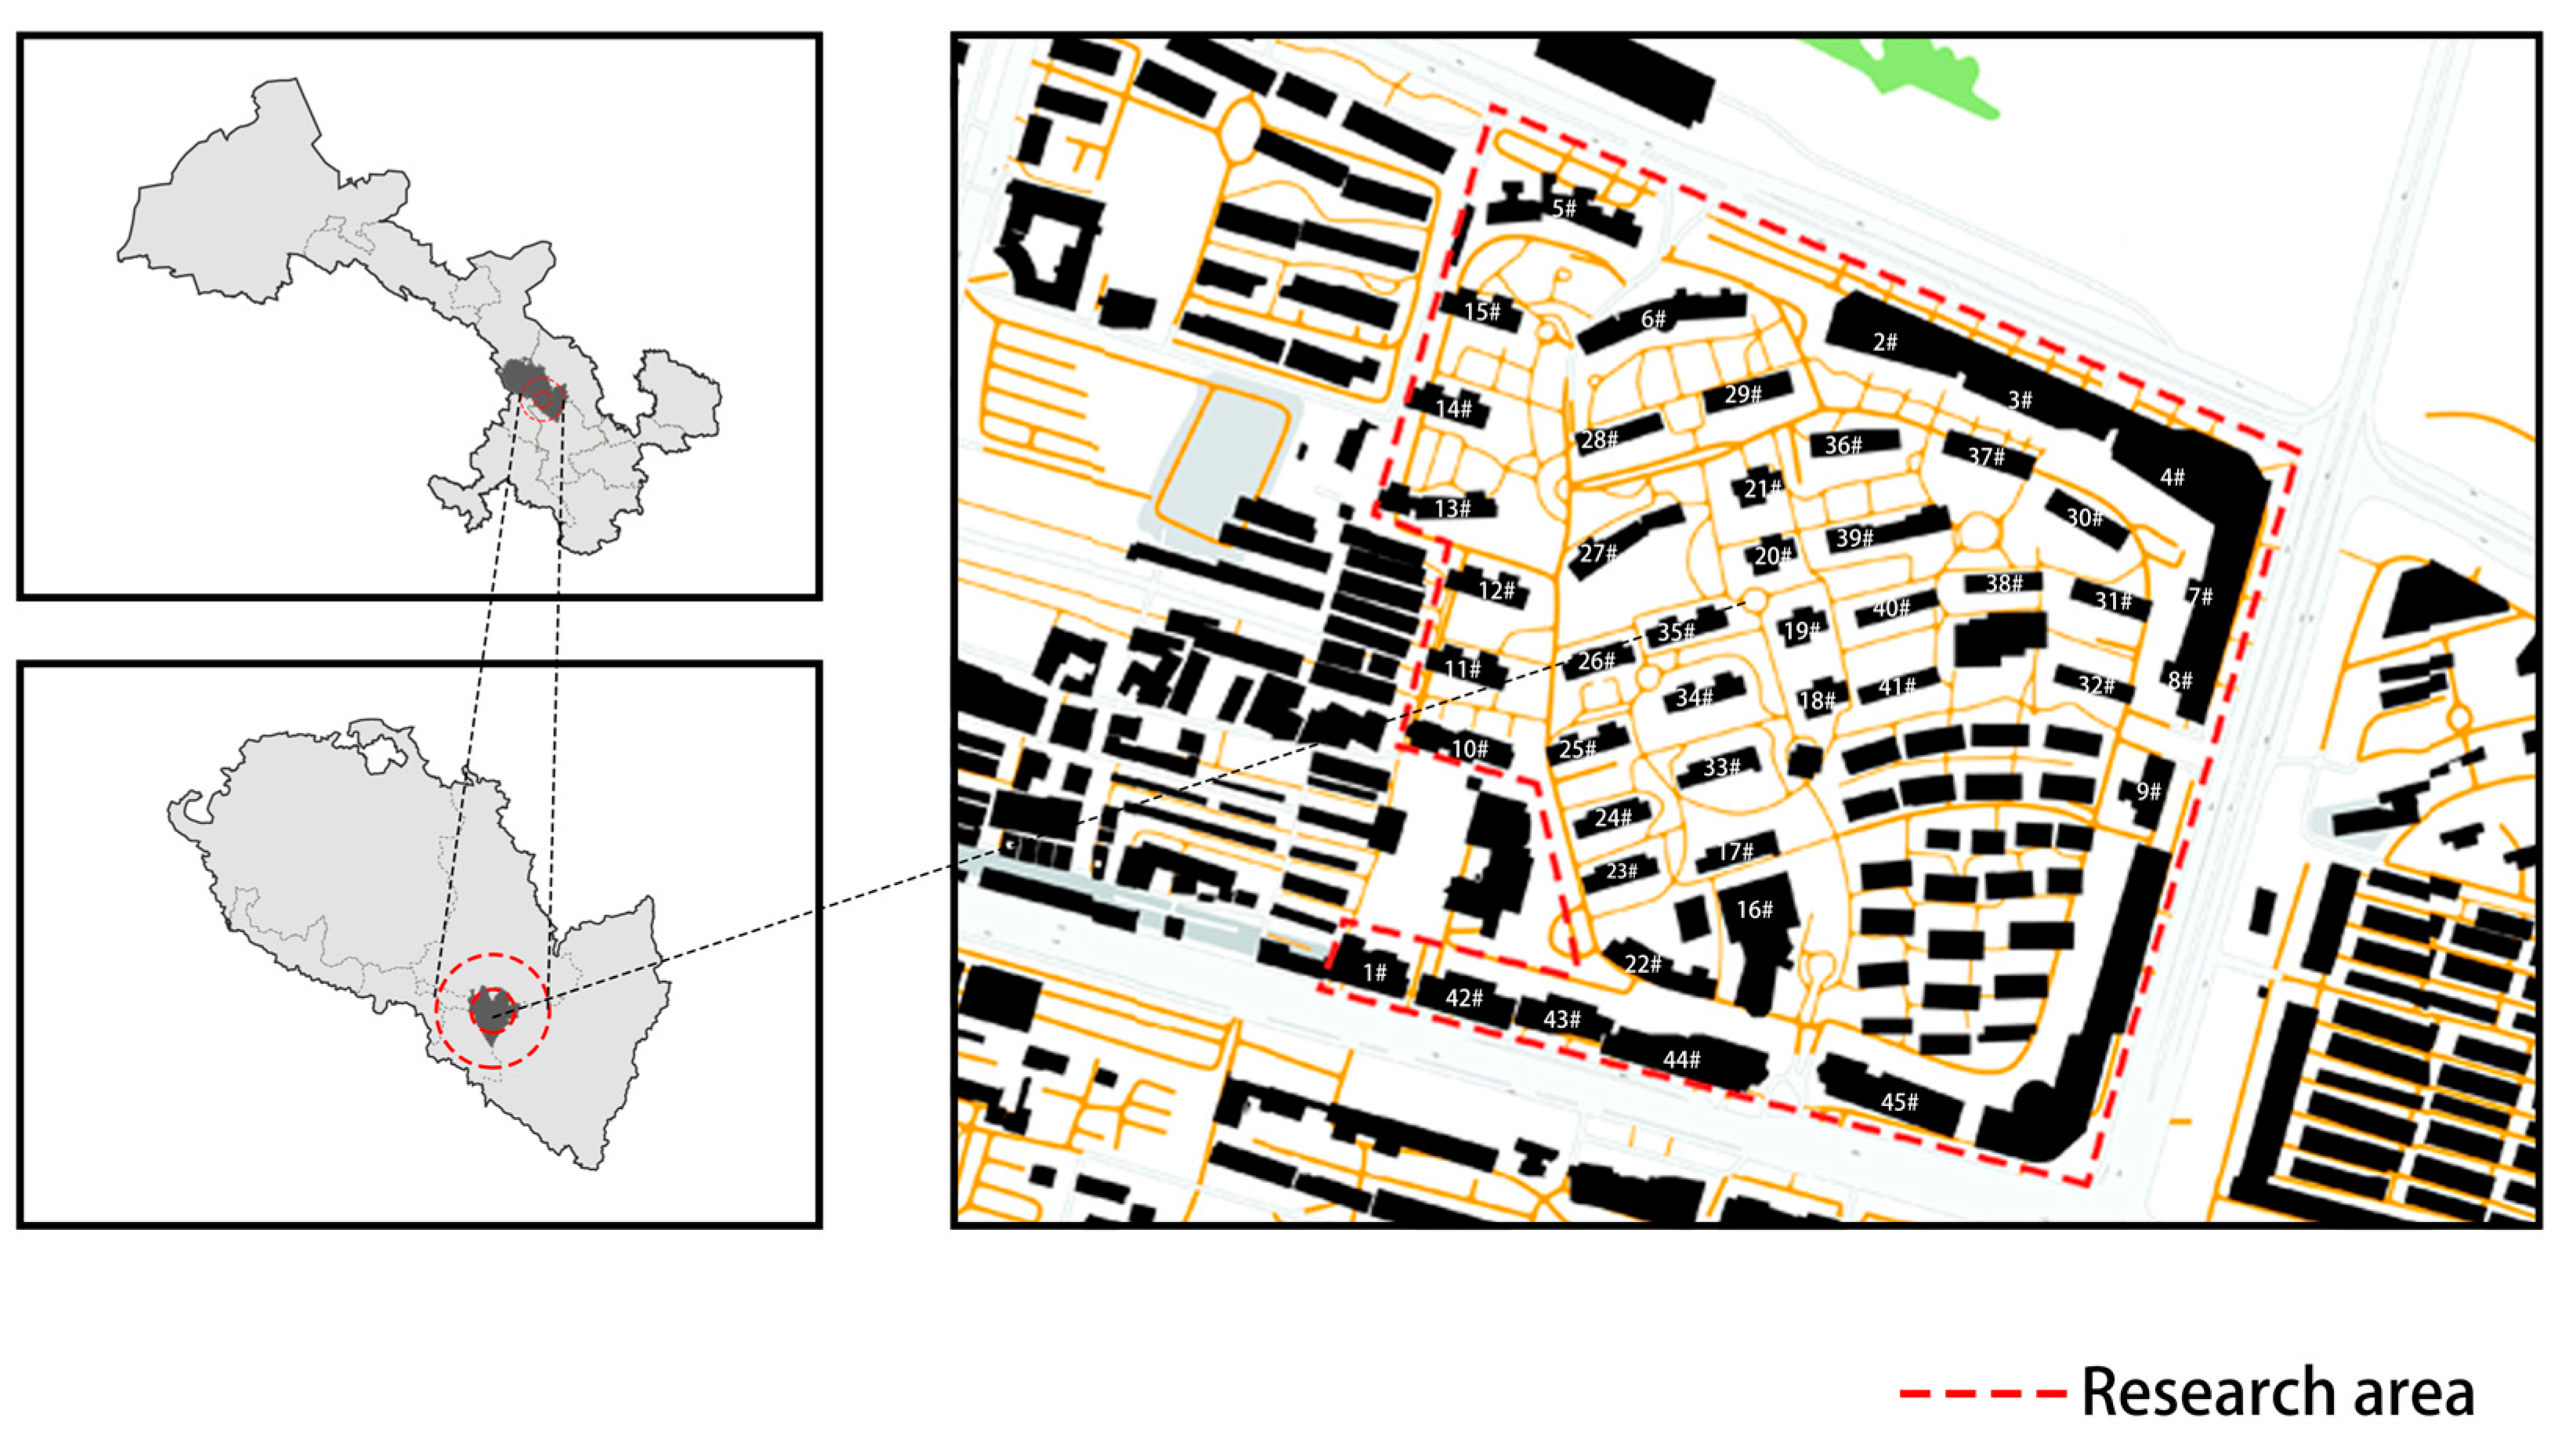
Lanzhou, the capital of Gansu Province, is located in the inland region of northwest China, at the transitional zone between the Loess Plateau and the Qinghai–Tibet Plateau. The Yellow River traverses the urban area, forming a unique valley landform characterized by “two mountains flanking a single river”, making it one of the most typical cities globally where such narrow and long valley terrain is coupled with a temperate continental climate. The urban built-up area extends in a long and narrow belt along the river valley, with its land use significantly constrained by the natural terrain and its local wind field strongly influenced by the valley funneling effect. The wind field distortion characteristics caused by this effect are the most prominent among similar cities (Figure 1) [16]. Previous studies on the wind environment of residential districts in valley-type cities have confirmed that urban layout under topographic constraints exerts a significant regulatory effect on the spatial distribution of the wind environment across building clusters [8].
Lanzhou has a temperate continental climate with the characteristics of arid and semi-arid climate zones, featuring four distinct seasons: cold and dry winters, hot and rainless summers, large diurnal temperature variations, and low annual precipitation concentrated in the summer. Under the combined influence of the valley terrain and continental climate, local architectural design must prioritize the dual requirements of thermal insulation and wind and sand resistance. Building orientation is generally set to first meet the demands of daylighting and winter wind protection, while the local microclimate differentiation caused by the valley terrain also puts forward differentiated requirements for the building layout and morphological design of residential districts [17]. As a typical cold-region city, Lanzhou shares commonality with other northern cold-region cities (e.g., Shenyang) in the core regulation objectives of residential district wind environment, and relevant research findings provide a theoretical reference for the parameter setting and result analysis of this study [18].
In Lanzhou, the prevailing wind direction in winter is east-northeast (ENE), with an average wind speed of 0.7 m/s; the prevailing wind direction in summer is north-northeast (NNE), with an average wind speed of 1.21 m/s (Figure 2). The Hongyun Runyuan residential district selected for this study is located in the Yantan Area of Chengguan District, Lanzhou. It is adjacent to the Yellow River Scenic Belt to the north with no topographic obstruction, meaning the winter prevailing wind directly acts on the north-facing building facades of the district across the Yellow River surface. The excessively small included angle between the orientation of some existing buildings and the winter prevailing wind direction further exacerbates the deterioration of the internal wind environment of the district.
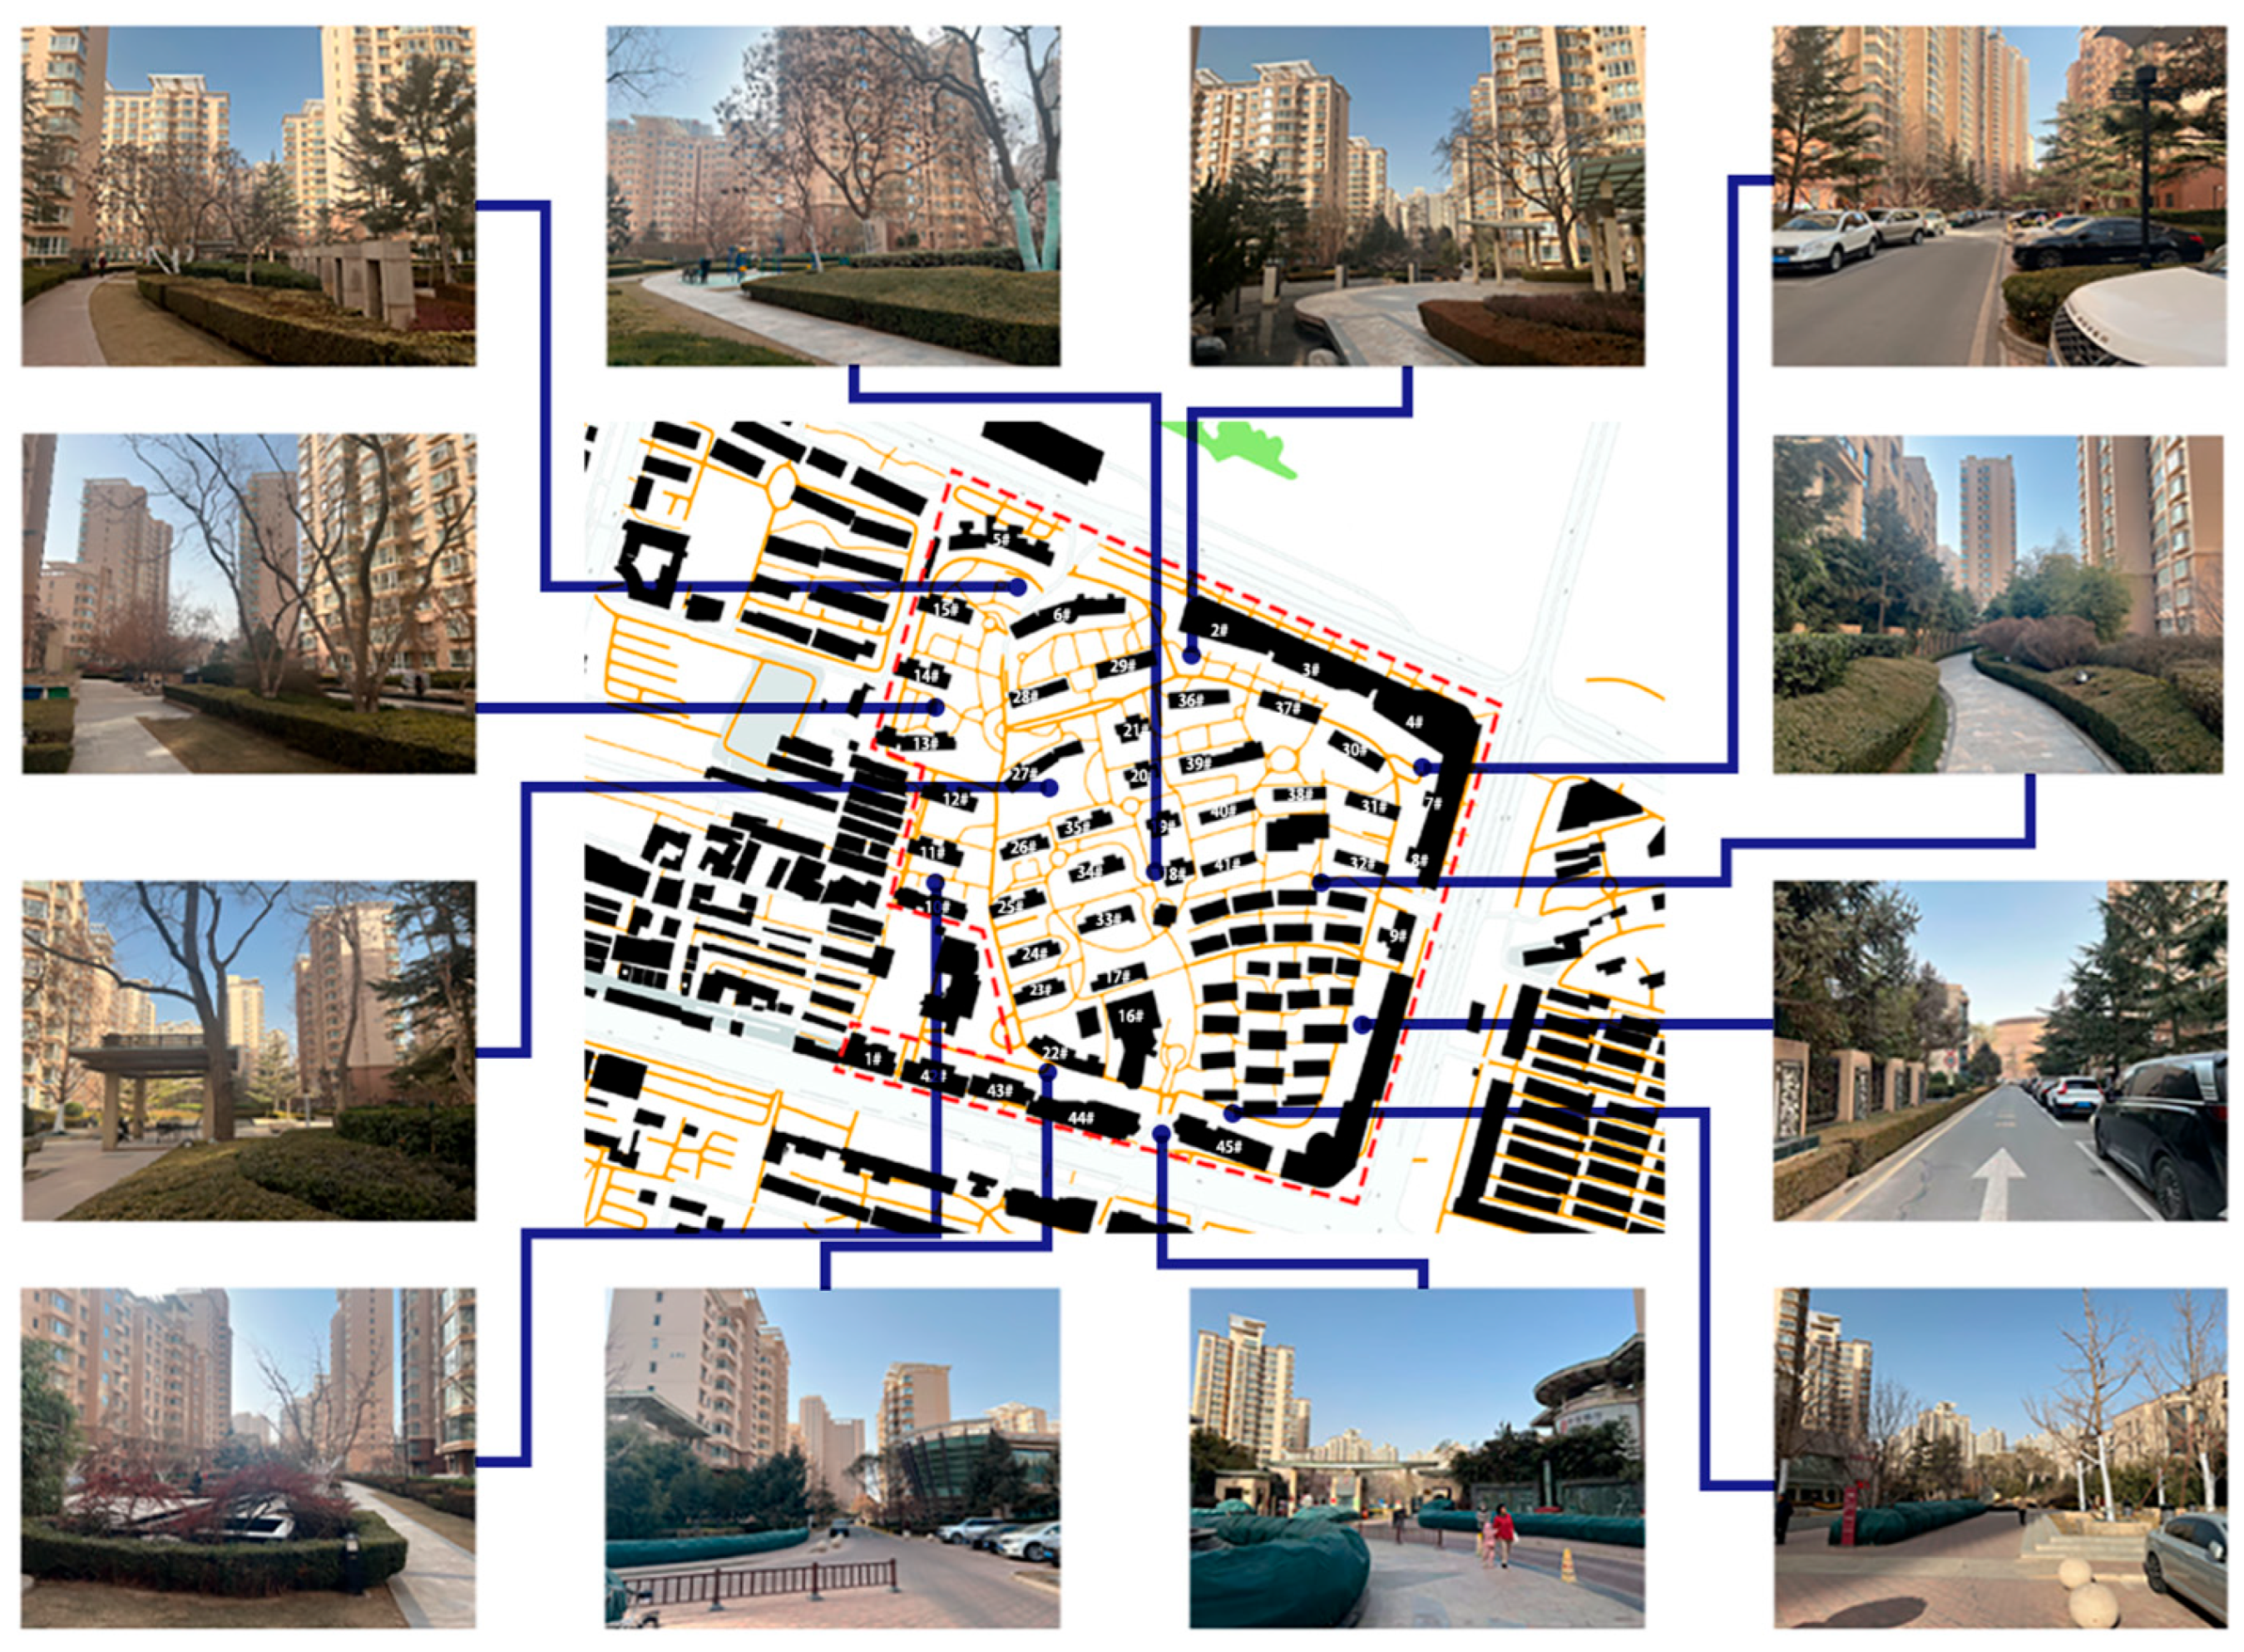
The Hongyun Runyuan residential district is located on the alluvial plain of the Yellow River Valley with an absolutely flat site and no local topographic undulations. It is bordered by Yanyuan Road to the east, North Tianshui Road to the west, South Binhe East Road to the south, and the Yellow River Scenic Belt to the north (Figure 3). It has a total land area of approximately 558 mu (37.2 ha), including a construction land area of 416 mu (27.73 ha), with a planned floor area ratio (FAR) of 2.0, a building density of approximately 25%, and a gross floor area (GFA) of around 600,000 m2. All these indicators fully comply with the mainstream requirements of the Standard for Urban Residential Area Planning and Design and local construction specifications of Lanzhou. As one of the largest and most standardized large-scale high-rise residential districts in Lanzhou, it contains 45 high-rise and mid-to-high-rise residential buildings with heights ranging from 30 m to 99 m. Specifically, the building stock comprises: 4 buildings of 33 storeys with a height of 99 m (Building #1–#4); 2 buildings of 22 storeys with a height of 66 m (Building #5–#6); 3 buildings of 19 storeys with a height of 57 m (Building #7–#9); 12 buildings of 18 storeys with a height of 54 m (Building #10–#21); 14 buildings of 14 storeys with a height of 42 m (Building #22–#35); 4 buildings of 12 storeys with a height of 36 m (Building #36–#39); 4 buildings of 11 storeys with a height of 33 m (Building #40–#43); and 2 buildings of 10 storeys with a height of 30 m (Building #44–#45). The building plans are predominantly rectangular, and the existing layout adopts a combined form of linear row arrangement with partial enclosed blocks, which is the most commonly used layout form for residential districts in Lanzhou and even other cold-region cities in northwest China, covering the spatial morphological characteristics of more than 90% of newly built residential districts in the local area. As a typical representative of waterfront residential districts distributed along both banks of the Yellow River in Lanzhou, such waterfront residential districts account for 62% of the total newly built residential districts in Lanzhou over the past decade, and their wind environment problems have extremely strong regional universality.

2.2. Analysis of Spatial Morphological Characteristics of the Research Object

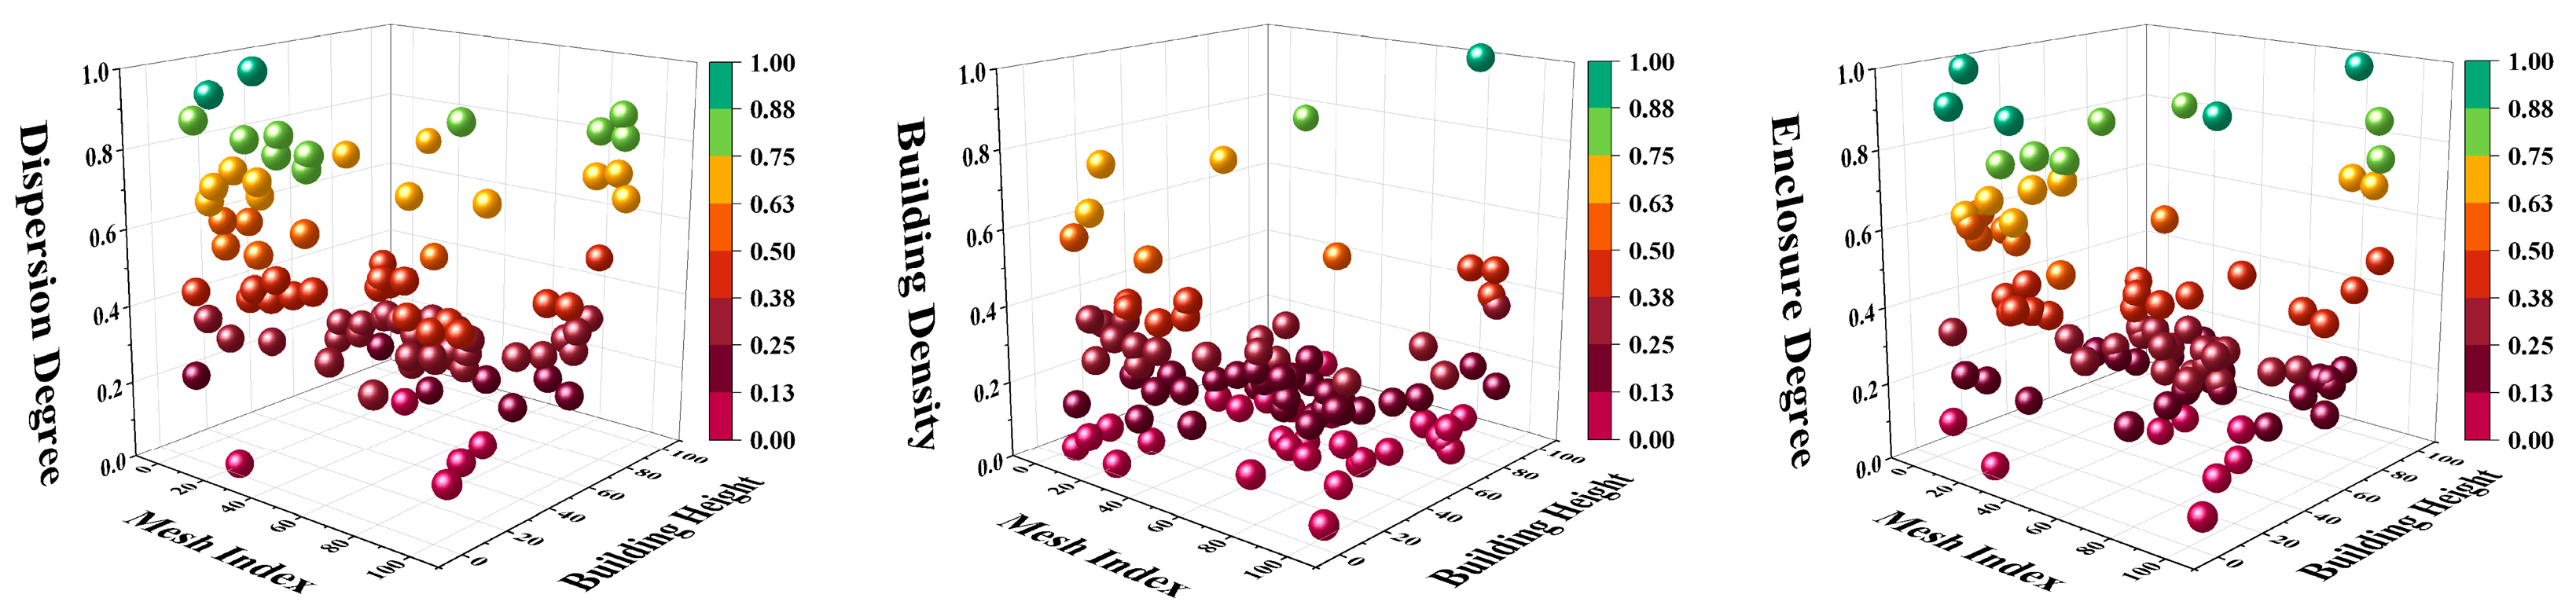
To accurately quantify the three-dimensional (3D) spatial differentiation characteristics of the research object’s spatial morphological parameters and clarify the spatial background of the residential district’s wind environment, this study took a single building as the basic analysis unit. Based on full measuring point data from wind environment simulation, a 3D scatter distribution model was established for three core indicators at the residential district level: building dispersion, building density, and enclosure degree. In this model, the X-axis represents the planar grid index, which covers all planar layout units across the entire district and reflects the horizontal spatial position of each building; the Y-axis denotes building height, matching the 30 m to 99 m building height gradient of the study area; the Z-axis corresponds to the quantified value of each indicator. The color of the scatter points shows a gradient from purplish red to turquoise as the indicator value increases, which can intuitively visualize the distribution law, coupling correlation, and differentiation characteristics of each parameter within the 3D space of the residential district (Figure 4).
Building dispersion, with the wind speed non-uniformity coefficient as its core quantitative indicator, directly characterizes the uniformity and turbulence degree of the wind field in the residential district, and its value exhibits a significantly positive correlation with airflow transmission resistance. The 3D distribution results showed that the building dispersion of the district presented significant spatial zonal differentiation characteristics. For buildings on the peripheral windward interface adjacent to the Yellow River on the north and east sides of the district, the dispersion was generally higher than 0.6, with values concentrated in the range of 0.6–1.0. Under the superimposed effect of the prevailing east-northeast (ENE) wind in winter and the valley funneling effect, this area has a large fluctuation amplitude of the wind field and significant flow around and vortex effects, making it a high-value section of ventilation resistance in the district. In contrast, the building dispersion inside the core clusters of the district was generally lower than 0.4, with values concentrated in the range of 0.0–0.4, where the wind field is stable and the airflow distribution has good uniformity, corresponding to the low-value area of ventilation resistance. Meanwhile, building dispersion showed a significantly positive correlation with building height: the higher the building height, the greater the dispersion of the surrounding wind field. Among them, the peak dispersion around the 99 m super-high-rise buildings can reach 1.0. The wind field distortion effect caused by high-rise buildings further amplifies the local ventilation resistance, making these areas key control points for wind environment regulation in the residential district.
Building density is a core morphological parameter that characterizes the spatial crowding degree of the residential district and quantifies the horizontal infiltration resistance of airflow, which directly determines the basic impedance value of airflow transmission. The 3D distribution results showed that building density in the district had a significantly negative correlation with building height. For buildings below 30 m, the surrounding building density was generally lower than 0.3, with values concentrated in the range of 0.0–0.2. Such buildings are mostly distributed within the core clusters of the district, where the proportion of space occupied by building footprints is low, reserving sufficient horizontal space for airflow transmission and corresponding to low-value areas of ventilation resistance. For mid-to-high-rise buildings above 50 m, the surrounding building density was mostly higher than 0.4, with the maximum value reaching 1.0 at the locations of 99 m super-high-rise buildings on the district edge, and values concentrated in the range of 0.4–1.0. These buildings are centrally arranged along the peripheral boundary of the district, forming a continuous high-density shielding interface that exerts a significant blocking and dissipation effect on the prevailing airflow, thus constituting the core high-value area of ventilation resistance in the district. In addition, the planar distribution of building density exhibited significant spatial coupling with building dispersion, and high-density areas synchronously corresponded to high-dispersion zones, which corroborates the driving effect of building density on the turbulence degree of the wind field.
The enclosure degree of the residential district characterizes the enclosure and closure level of the site by building facades, and is a core indicator determining the efficiency of airflow into and out of the residential district. The 3D distribution results showed that the enclosure degree of the district presented spatial zonal differentiation characteristics highly consistent with those of building dispersion and building density. The enclosure degree of measuring points at the peripheral boundary of the district was generally higher than 0.6, with values concentrated in the range of 0.6–1.0, corresponding to high-rise buildings of 50 m to 100 m. In this area, buildings are linearly arranged along the site boundary, forming a continuous enclosure barrier that exerts a significant blocking effect on the external prevailing airflow, thus constituting the high-impedance outer boundary for district ventilation. For measuring points in the internal clusters of the district, the enclosure degree was mostly concentrated in the range of 0.2–0.4, with no significant fluctuation in values with the change in building height. Buildings in this area are dominated by internal cluster layout with weak enclosure and closure of building facades, which provides open space for the infiltration and transmission of airflow inside the district, corresponding to the low-impedance internal ventilation area. Meanwhile, measuring points with an enclosure degree around 0.3 synchronously corresponded to low values of building dispersion and a reasonable range of building density, which clarifies the positive effect of low-enclosure layout on reducing ventilation resistance and improving airflow uniformity.
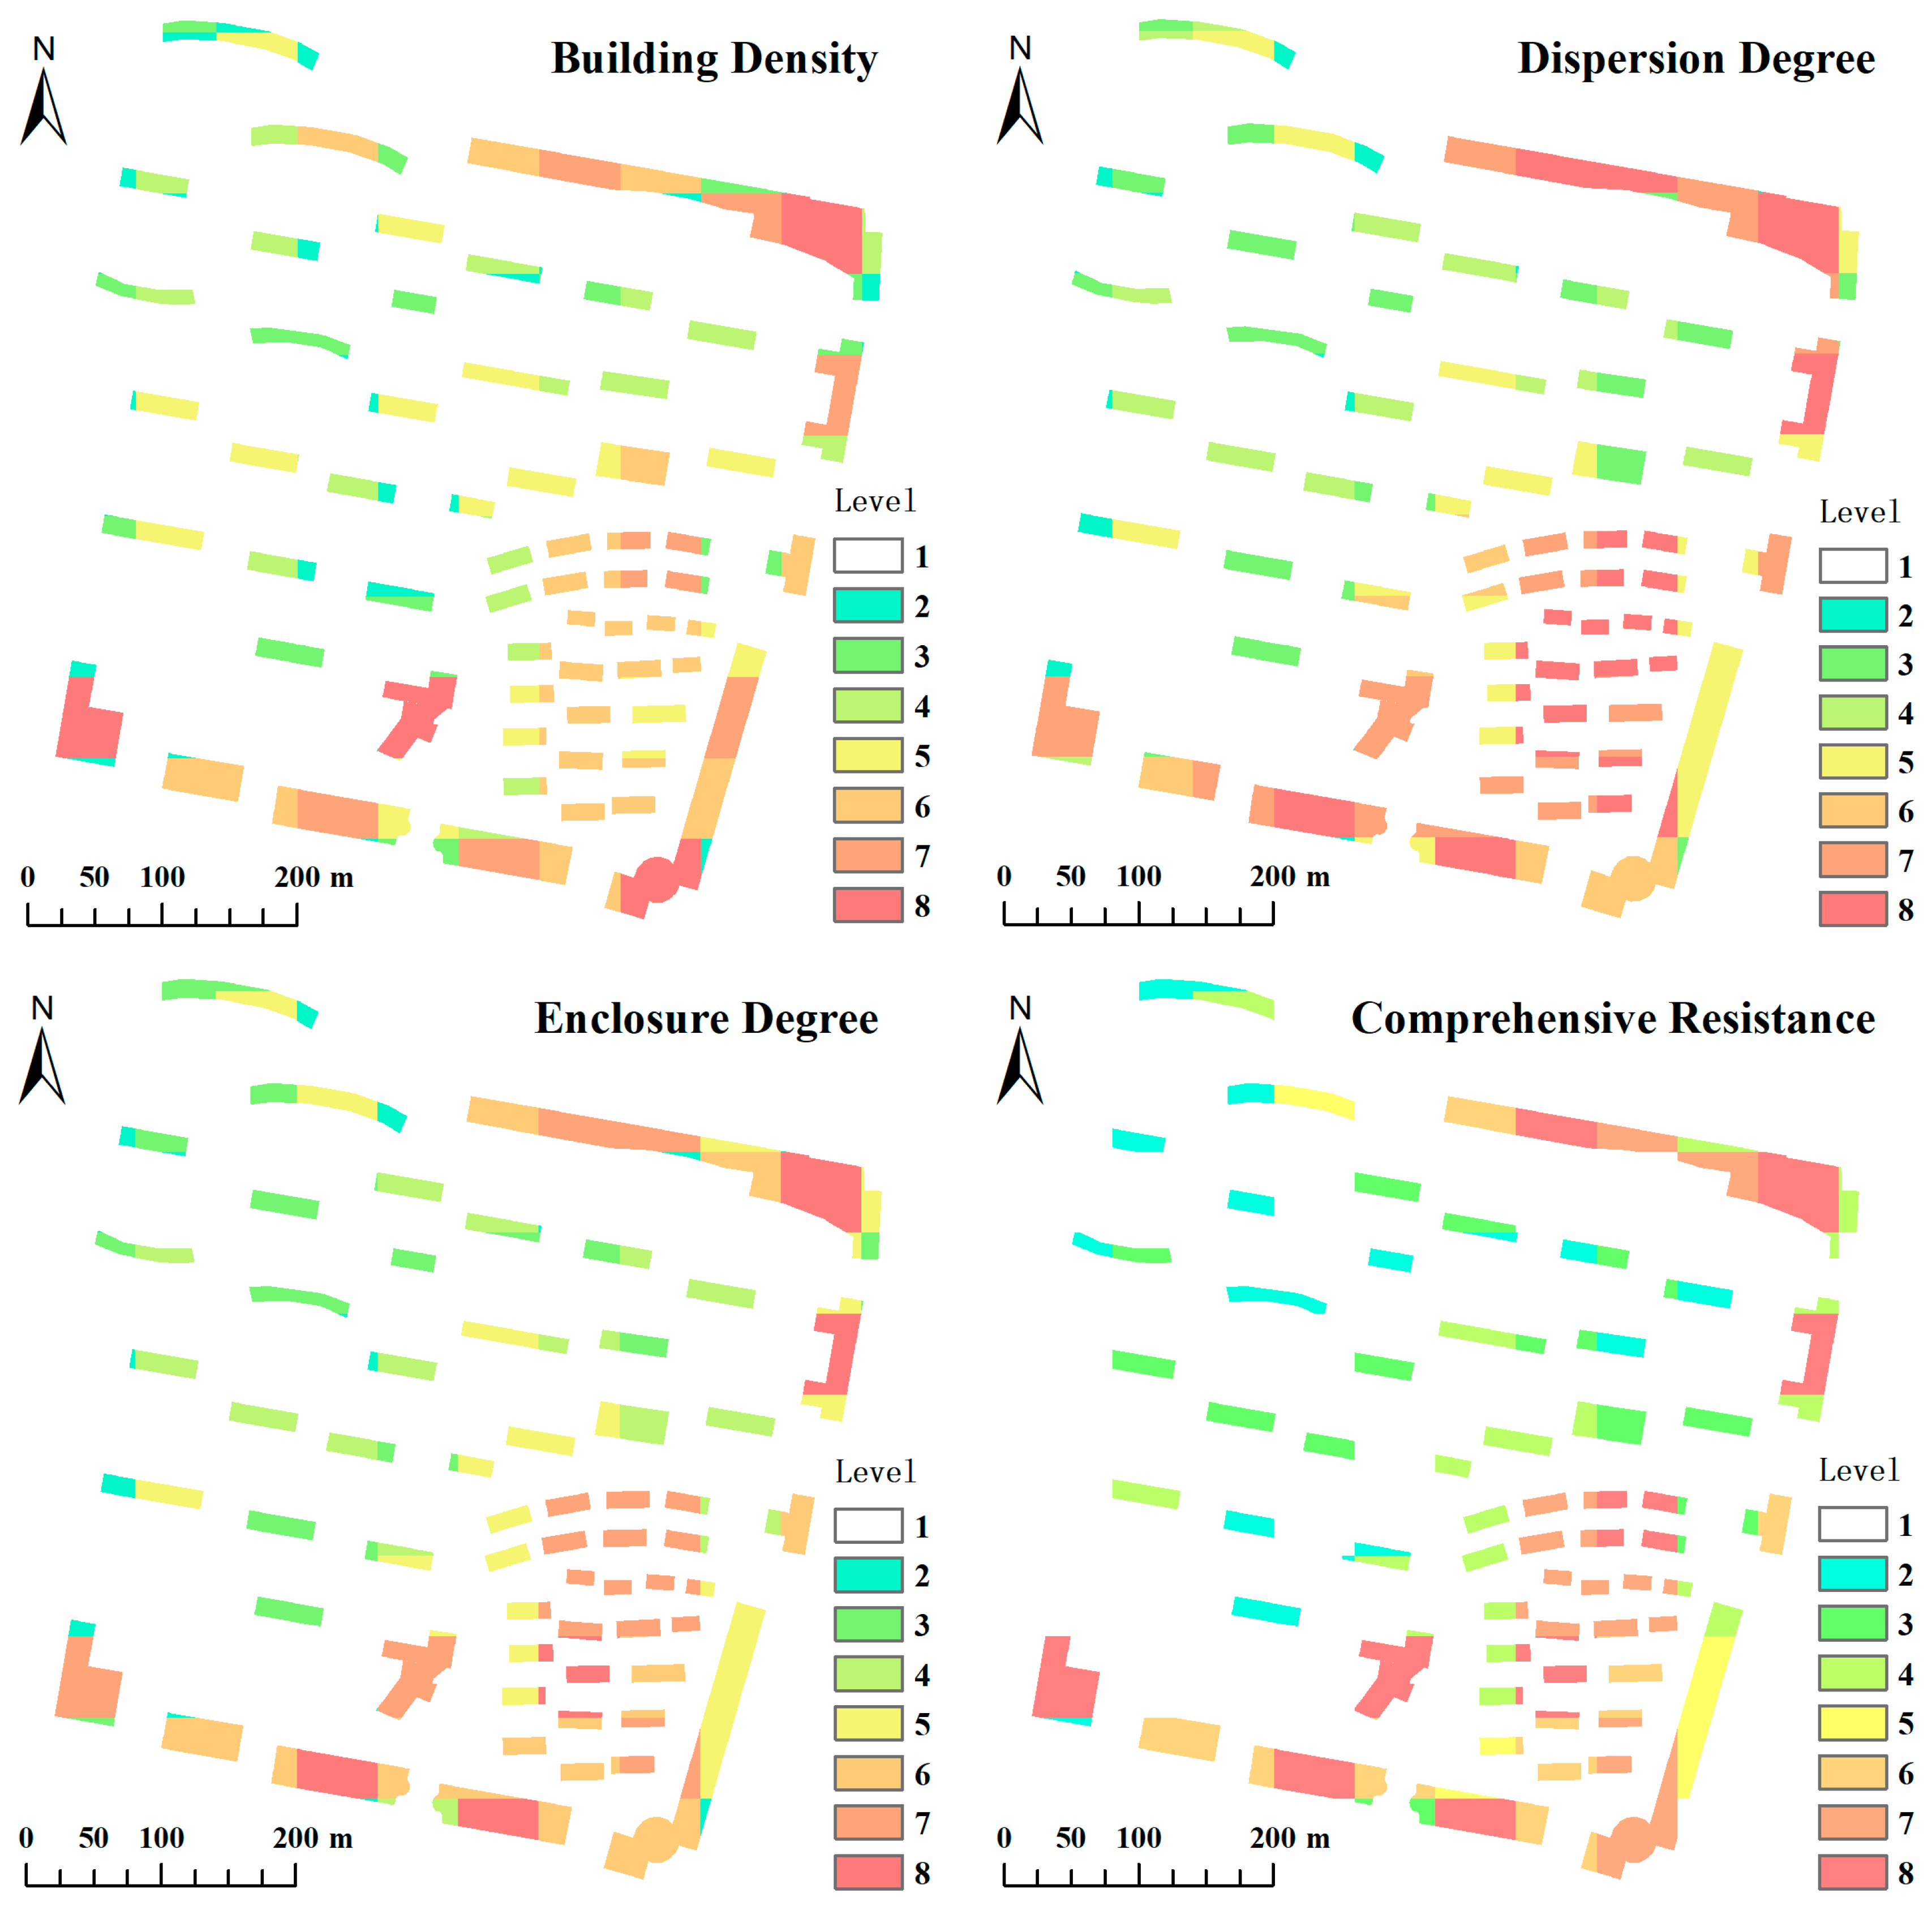
On this basis, a ventilation resistance analysis model was established based on circuit theory. With the support of GIS spatial analysis technology, a graded evaluation was conducted on core indicators including the windward surface effect and ventilation transmission capacity of each individual building in the residential district, and the grading results of building ventilation potential in the district were obtained (Figure 5). The grading values 1–8 in the figure correspond to the gradient change in building ventilation potential from low to high, which presents a significantly positive correlation with the wind environment quality of the residential district. Among them, buildings with Grade 1–3 are low ventilation potential buildings, which are concentrated in the core enclosed clusters of the residential district. This area is characterized by excessively high enclosure degree, poor adaptability of building orientation to the valley prevailing wind direction, and inadequate building spacing control. Subject to the significant shielding effect of surrounding buildings, it has high airflow transmission resistance, making it the core problematic section of the district with winter airflow stagnation, pollutant accumulation, and insufficient summer ventilation efficiency. Buildings with Grade 4–5 are medium ventilation potential buildings, distributed in the internal secondary clusters, which can meet the basic air exchange demand of the residential district. Buildings with Grade 6–8 are high ventilation potential buildings, concentrated on the windward interface adjacent to the Yellow River on the north and east sides of the district. With a high matching degree with the prevailing wind directions in both winter and summer, this area serves as the core interface for airflow input into the district and a key node for wind environment regulation. The above results clarified the spatial background characteristics of the residential district’s wind environment, and provided fundamental data support for the selection of factor levels in the subsequent orthogonal experiment and the setting of boundary conditions for wind environment simulation.
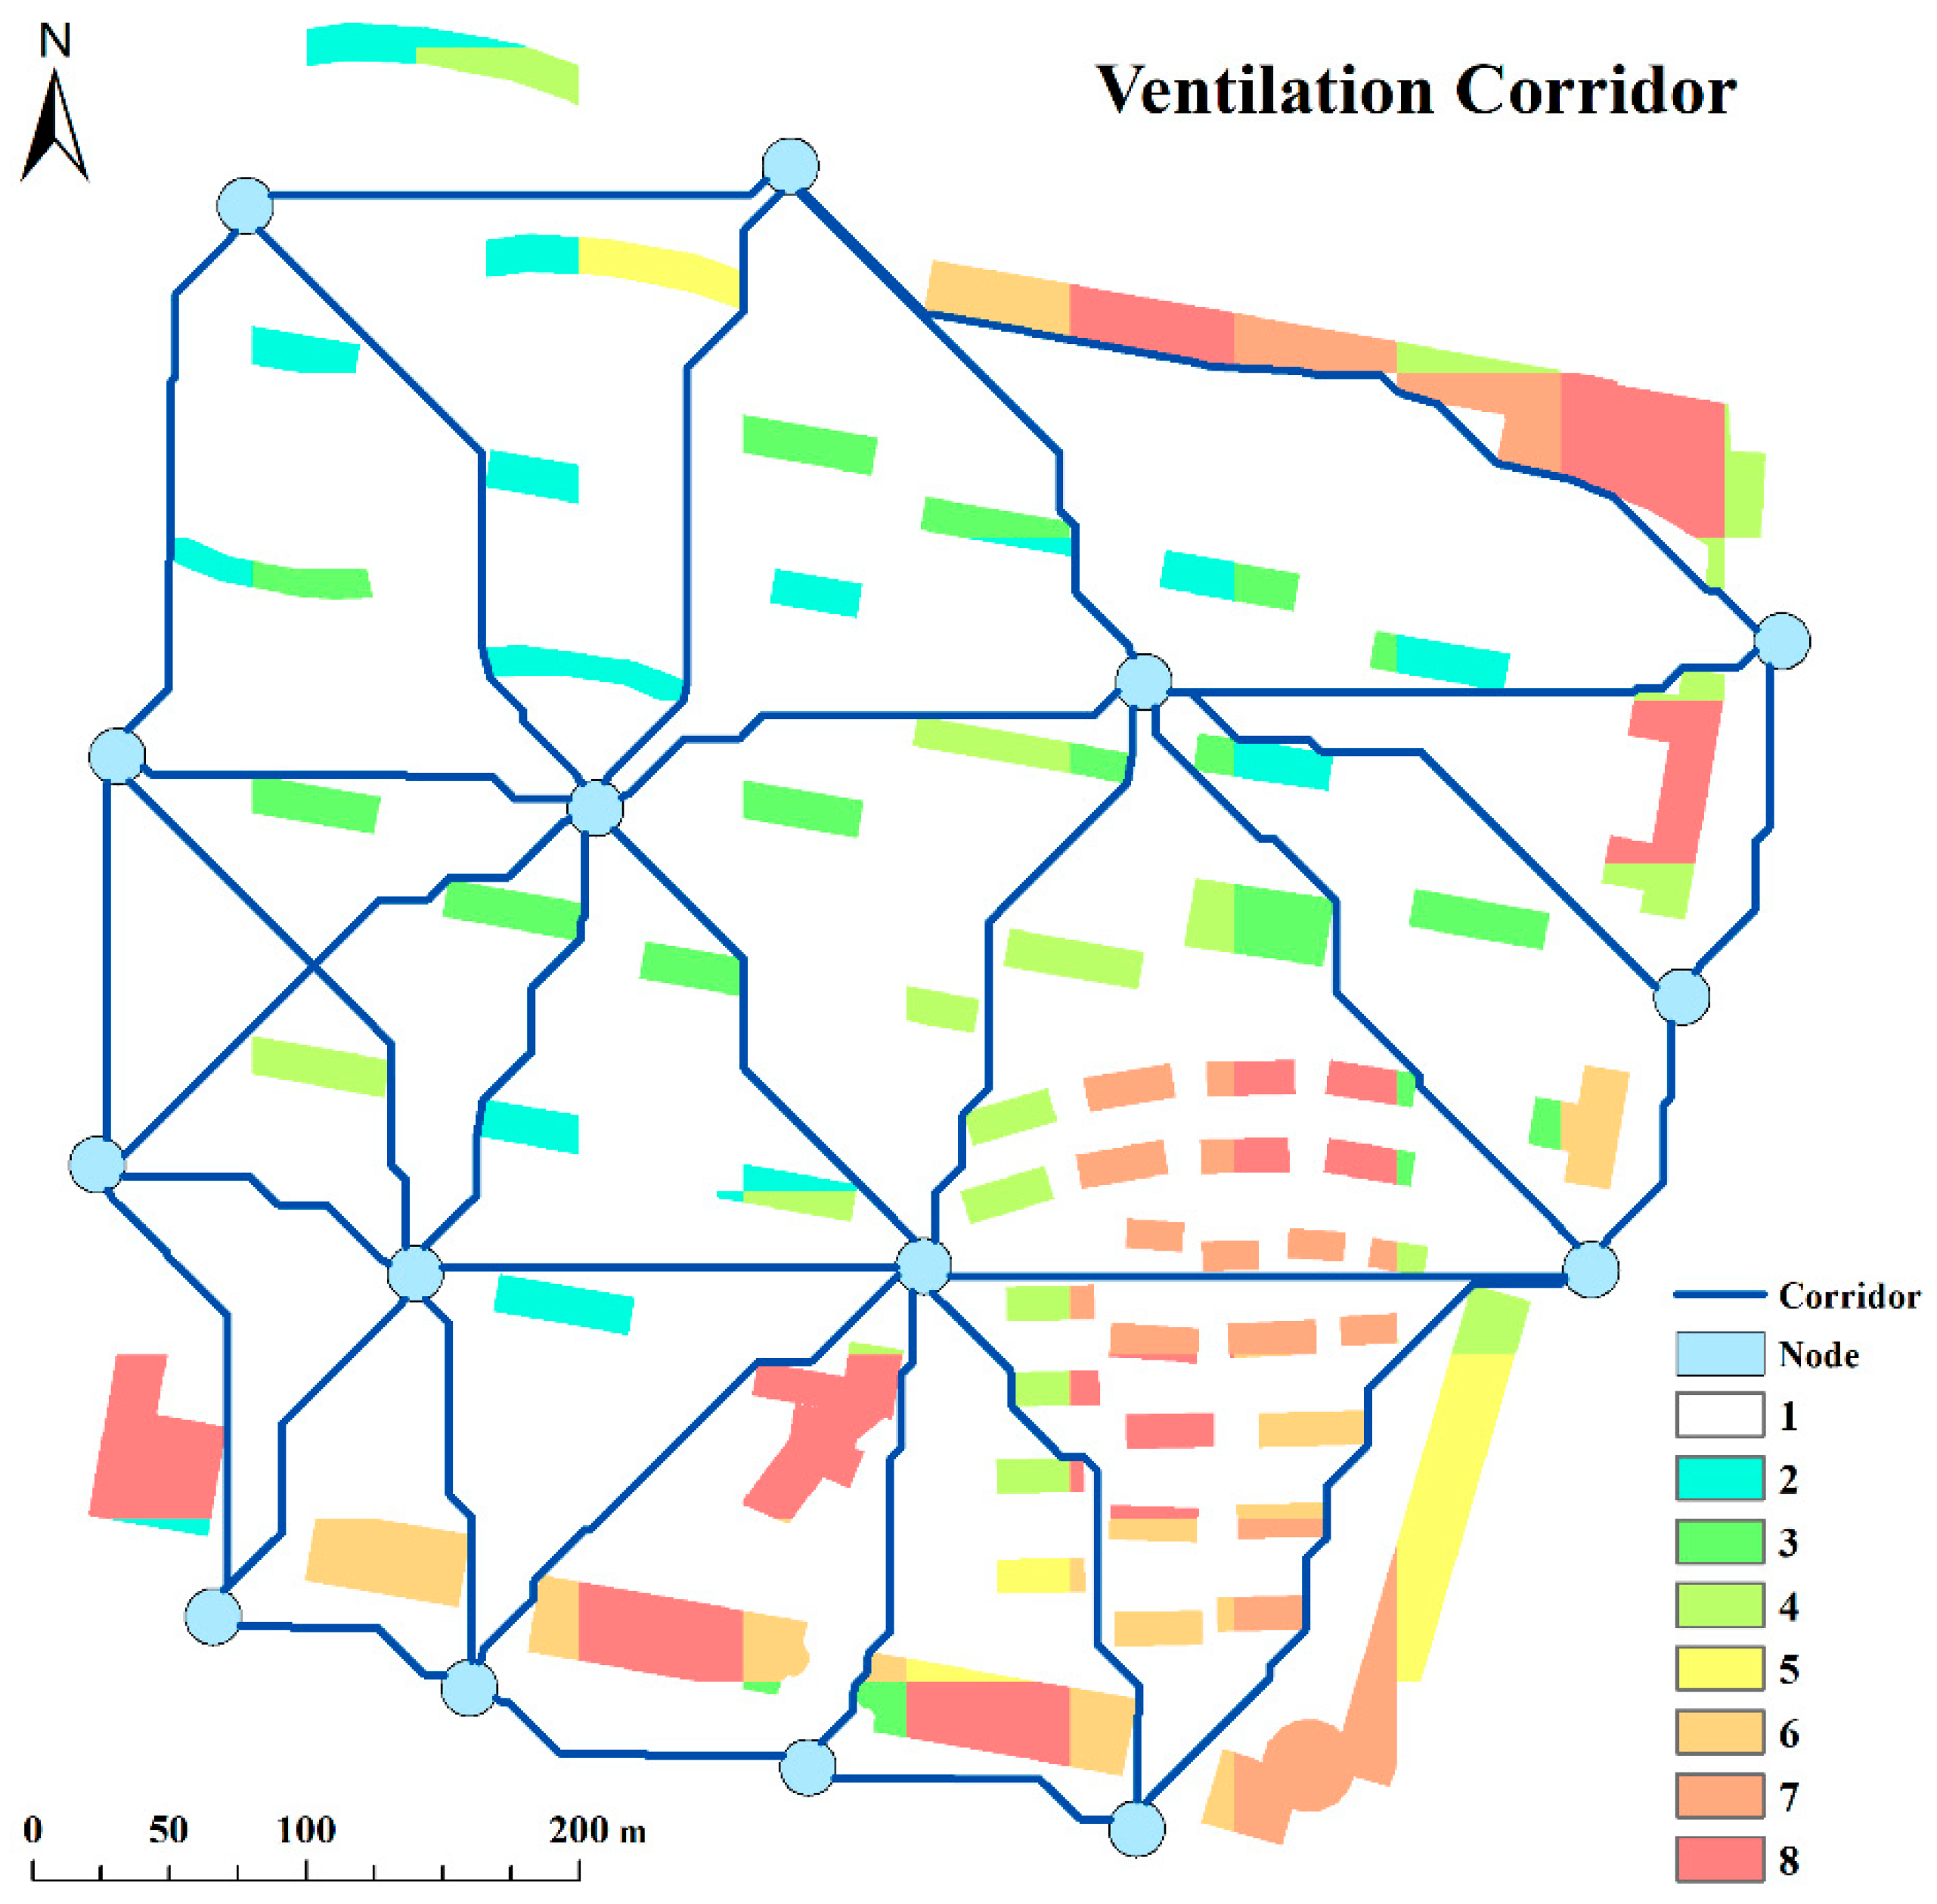
Meanwhile, based on the Least Cost Path (LCP) model derived from circuit theory, combined with the grading results of building ventilation potential and the characteristics of prevailing wind directions in winter and summer, the potential ventilation corridor system within the residential district was identified (Figure 6). The blue lines in the figure represent the core ventilation corridors inside the district, which form the main paths for airflow infiltration and transmission from the peripheral windward interface of the district to the internal clusters; the blue nodes denote the key ventilation nodes at corridor intersections, which are the core spatial points for wind environment regulation in the residential district. Combined with the winter and summer wind environment simulation results of the original scheme, the main corridors on the north and east sides of the district have a high matching degree with the summer prevailing wind direction, serving as the primary airflow channels for natural ventilation in summer. In contrast, the absence of secondary corridors within the core clusters of the district is the core spatial cause of local airflow stagnation and pollutant accumulation in winter. The corridor identification results accurately reveal the spatial mechanism underlying the advantages and disadvantages of the wind environment of the original scheme, and provide a path-level scientific basis for the optimal design of orthogonal experiment schemes and the formulation of spatial form regulation strategies for the residential district.

2.3. Research Methods

2.3.1. Orthogonal Experimental Design

Orthogonal experimental design is a multi-factor and multi-level optimization method based on probability theory and mathematical statistics. By arranging experiments via a standard orthogonal array, it replaces full factorial experiments with a small number of representative tests. While reducing the experimental workload, it can accurately quantify the relative importance of each factor’s influence on the test index and rapidly screen the optimal parameter combination [19,20,21]. Existing studies have confirmed that the technical approach combining orthogonal experimental design and CFD numerical simulation can effectively quantify the influence mechanism of residential district spatial morphological parameters on the outdoor wind environment, and provides a solid methodological foundation for the optimization of residential district wind environment [22,23,24].
In this study, three spatial morphological parameters that exert a core regulatory effect on the residential district wind environment (building orientation, building spacing coefficient, and residential district enclosure degree) were selected as experimental factors. Three horizontal gradients were set for each factor, and the L9(34) orthogonal array was adopted to construct 9 sets of residential district spatial form schemes, so as to conduct multi-scheme comparison and parameter optimization research.

2.3.2. Wind Environment Simulation

In this study, numerical simulation of the residential district wind environment was performed using PHOENICS 2019 software, an internationally accepted commercial CFD simulation software. Its dedicated FLAIR module enables accurate simulation of the outdoor wind environment of buildings, providing scientific support for building layout optimization and wind environment assessment [25]. A comprehensive review by Blocken et al. (2016) [26] has systematically evaluated the accuracy of wind tunnel and CFD techniques for pedestrian-level wind condition assessment, establishing standardized validation procedures and best practices for urban wind environment simulation. At present, CFD numerical simulation technology has been widely applied to the pedestrian-level wind environment assessment of high-rise building clusters, and relevant studies have provided a well-established technical framework for the parameter setting and result analysis of this simulation [27,28,29,30,31,32].
Based on high-resolution satellite imagery from Google Earth and field survey data, a 3D model of the residential district was established using SketchUp 2020. During the modeling process, elements with negligible impact on the wind field (including vegetation and small structures) were simplified, while the core building contours and spatial layout characteristics of the study area were fully retained. Furthermore, all buildings on the west, south, and east sides of the study area—particularly the 21 adjacent buildings on the west side—have been fully constructed and incorporated into the computational domain for mesh generation and numerical computation. The PHOENICS software adopted in this study is an internationally accepted commercial CFD simulation software, and the standard k-ε turbulence model used constitutes a universally accepted and mature technical system for wind environment simulation at urban block scale, which has been extensively validated and applied in the Load Code for the Design of Building Structures (GB 50009-2012) and a large number of similar studies at home and abroad [33].
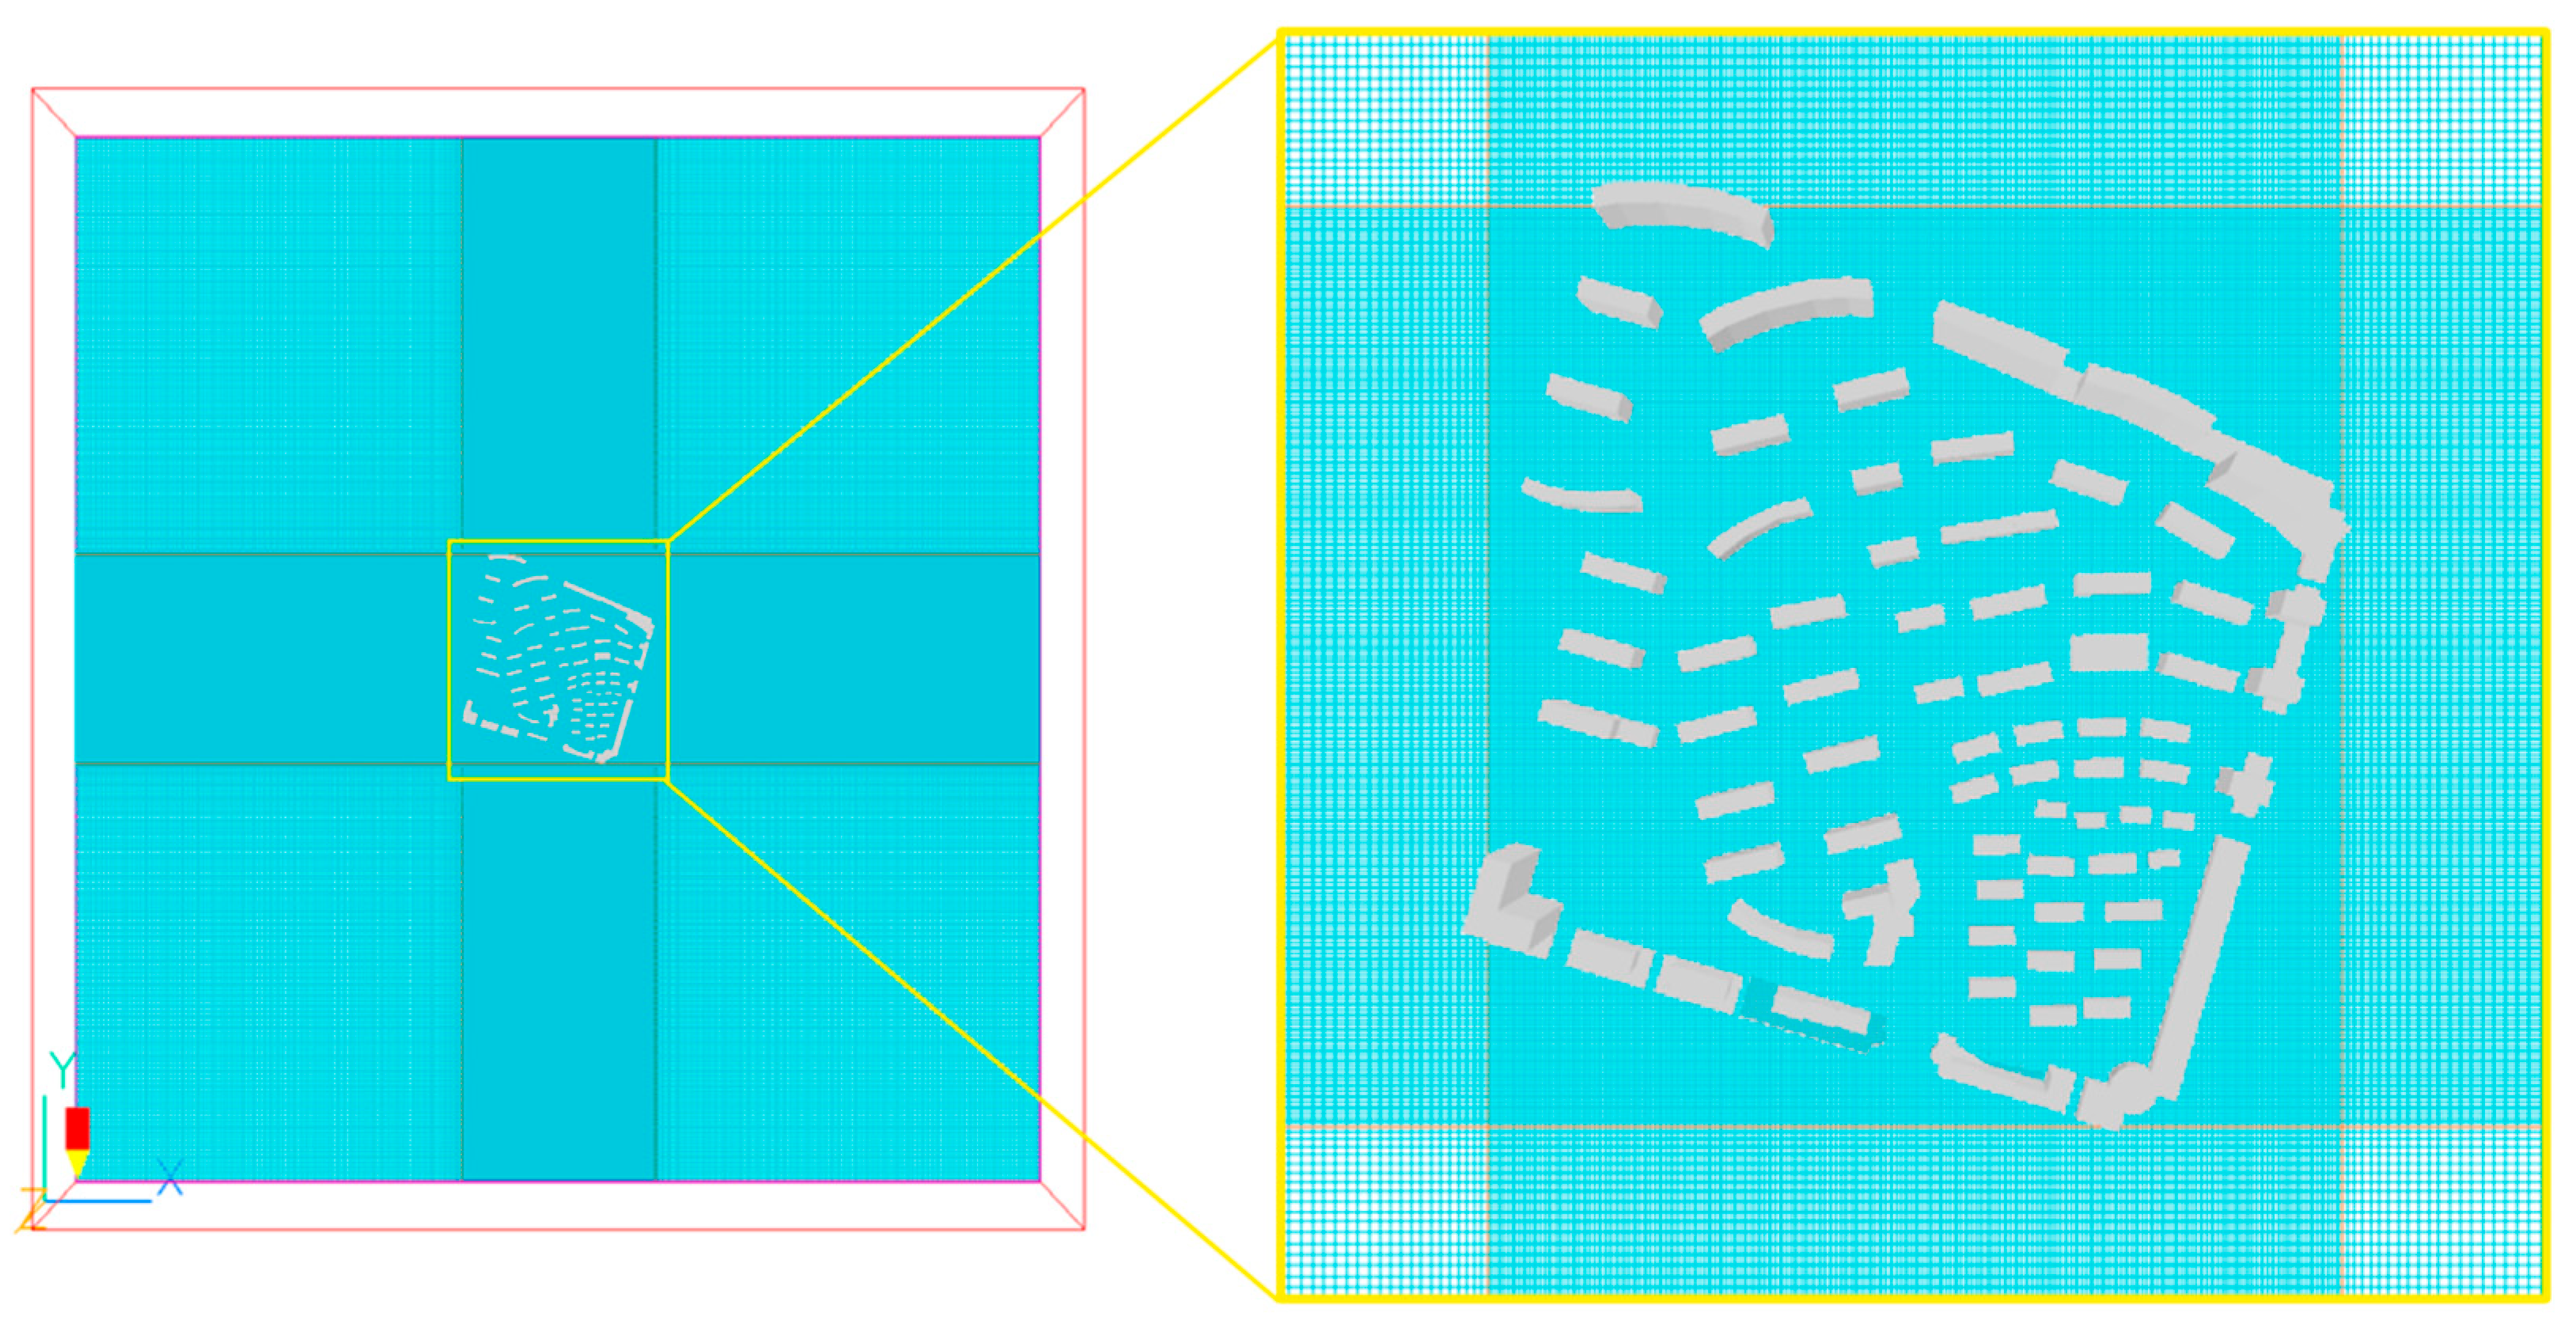
The dimensions of the computational domain were set in strict accordance with both the COST 732 Best Practice Guideline for urban CFD simulations and the Chinese industry standard Test and Evaluation Standard for Building Ventilation Performance (JGJ/T 449-2018) [34,35]. The lateral extension was set to 5 times the maximum building height, and the top height was set to 3 times the maximum building height, effectively avoiding the interference of boundary effects on the flow field. Specifically, the computational domain was 3250 m in length, 3000 m in width and 500 m in height. The building model was placed at the center of the computational domain, resulting in a blockage ratio of 2.6%, which strictly complies with the standard requirement that the blockage ratio should be less than 3% for CFD simulation. Mesh generation was performed using the PARSOL block-wise mesh refinement technique: the mesh size in the core building area was set to 5 m × 5 m with local encryption around building corners and edges, and the mesh was gradually coarsened in the peripheral area to balance simulation accuracy and computational efficiency (Figure 7).
The simulation boundary conditions were set in strict accordance with JGJ/T 449-2018. The inlet boundary adopted the velocity inlet boundary condition: the prevailing wind direction in winter is east-northeast (ENE) with an average wind speed of 0.7 m/s, and the wind speed profile follows a power-law distribution with an exponent α of 0.22, which strictly corresponds to terrain category C for dense urban built-up areas specified in GB 50009-2012 and fully matches the underlying surface characteristics of the study area [33]. The outlet boundary adopted the outflow boundary condition; the top and lateral sides of the computational domain adopted the symmetry boundary condition; and the ground and building surfaces adopted the no-slip wall boundary condition. The standard k-ε turbulence model was adopted, with a convergence criterion of 0.0001 and a maximum number of iterations of 10,000, to simulate the distribution characteristics of wind speed and wind pressure at the 1.5 m pedestrian height above ground in the residential district under the prevailing wind directions in winter and summer.

2.4. Wind Environment Evaluation Criteria

With reference to the Assessment Standard for Green Building (GB/T 50378-2019) and existing studies on pedestrian thermal comfort, the wind environment evaluation criteria for this study were established [36]. The arithmetic mean wind speed and wind speed non-uniformity coefficient were selected as the core evaluation indicators to quantify the wind environment quality and airflow distribution uniformity of the residential district (Table 1). The selection of these two indicators has sufficient scientific rationality and can fully support the core conclusions of this study. The average wind speed is the core basic indicator of wind environment research, the primary evaluation indicator specified in China’s Assessment Standard for Green Building and Standard for Testing and Evaluation of Building Ventilation Performance, and also the general core variable of similar studies published in journals such as Buildings. Combined with the average wind speed and wind speed non-uniformity coefficient, this study can completely characterize the core wind environment characteristics such as airflow infiltration, stagnation zone range and ventilation channels. Turbulence intensity and wind comfort index are both derivative indicators of average wind speed: turbulence intensity is the ratio of the root mean square of fluctuating wind speed to average wind speed, and wind comfort index also takes average wind speed as the core input parameter. The spatial distribution laws of both are essentially determined by the average wind speed. The core objective of this study is to quantify the regulation mechanism of spatial morphological parameters on the wind environment, and the average wind speed can eliminate additional interference and accurately reveal the essential coupling relationship between the two [37].

3. Design of the Orthogonal Experimental Scheme

The arithmetic mean wind speed and wind speed non-uniformity coefficient were selected as the core evaluation indicators to quantify the wind environment quality and airflow distribution uniformity of the residential district. Among them, the wind speed non-uniformity coefficient is a core parameter characterizing the uniformity of the airflow field. A smaller value indicates better uniformity of airflow distribution and superior wind environment quality in the residential district [18]. The calculation formulas of the indicators are as follows:
First, multiple measuring points were arranged in the working area, the wind speed at each measuring point was extracted, and the arithmetic mean value was calculated as:
v ¯ = n = 1 n v i n
where v ¯ is the arithmetic mean wind speed of the measuring points, m/s; v i is the wind speed at each measuring point, m/s; n is the total number of measuring points.
Second, the root mean square deviation of wind speed was calculated as:
σ v = n = 1 n ( v i v ¯ ) 2 n
where σ v is the root mean square deviation of wind speed.
Finally, the non-uniformity coefficient of wind speed was calculated as:
k v = σ v v ¯
where k v is the dimensionless non-uniformity coefficient of wind speed. A smaller k v value indicates better uniformity of airflow distribution [17,34].

3.1. Selection of Influencing Factors and Setting of Levels

Based on the model established via circuit theory, combined with the spatial morphological characteristics of the research object, the identified potential ventilation corridors, and the core requirements for wind environment regulation of residential districts in cold-region valley-type cities, three core spatial morphological parameters (building orientation, building spacing coefficient, and residential district enclosure degree) were selected as the experimental factors of the orthogonal test in this study. Three horizontal gradients were set for each factor, and the L9(34) orthogonal array was adopted for experimental design. The settings of each factor and level are shown below (Table 2):
Building orientation: Taking due south as the optimal reference orientation for building daylighting in northern China, combined with the characteristics of prevailing wind directions in winter and summer in Lanzhou, three levels were set: 10° west of south, due south, and 10° east of south, to explore the influence mechanism of the included angle between different orientations and the prevailing wind direction on the wind environment of the residential district.
Building spacing coefficient: Defined as the ratio of the spacing between front and rear buildings to the height of the shading building. With reference to the daylight spacing requirements for Lanzhou area specified in the Standard for Urban Residential Area Planning and Design (GB 50180-2018), three levels (0.9, 1.0, and 1.1) were set to balance daylighting requirements, ventilation efficiency, and land use efficiency [39].
Residential district enclosure degree: Defined as the ratio of the total length of building facades facing the outside of the site in the residential district to the total perimeter of the site. Combined with the layout characteristics of existing residential districts in Lanzhou, three levels (0.7, 0.5, and 0.3) were set to investigate the influence of different enclosure degrees on the airflow inflow and outflow efficiency and internal wind field distribution of the residential district.

3.2. Orthogonal Experimental Scheme

Orthogonal experimental design is based on the two core fundamental principles of uniform dispersion and neat comparability. By screening representative experimental combinations via a standardized orthogonal array, it can significantly reduce the number of required experiments while ensuring that the test results can effectively reflect the influence law of each factor on the experimental indicators. For the 3-factor and 3-level experimental system in this study, a full factorial experiment would require 27 groups of simulations. In contrast, only nine groups of experiments are needed by adopting the L9(34) orthogonal array, which achieves equal occurrence frequency of each level for all factors and full coverage of level combinations between any two factors, thus greatly improving research efficiency.
According to the L9(34) orthogonal array, different levels of the three experimental factors were combined to construct nine sets of spatial form schemes for the residential district (Table 3). For all schemes, only the three core parameters (building orientation, building spacing coefficient, and residential district enclosure degree) were adjusted, while all other control conditions remained completely consistent to ensure the validity and comparability of the experiments.

3.3. Extraction of Multi-Scheme Planning Layouts for the Large-Scale Residential District

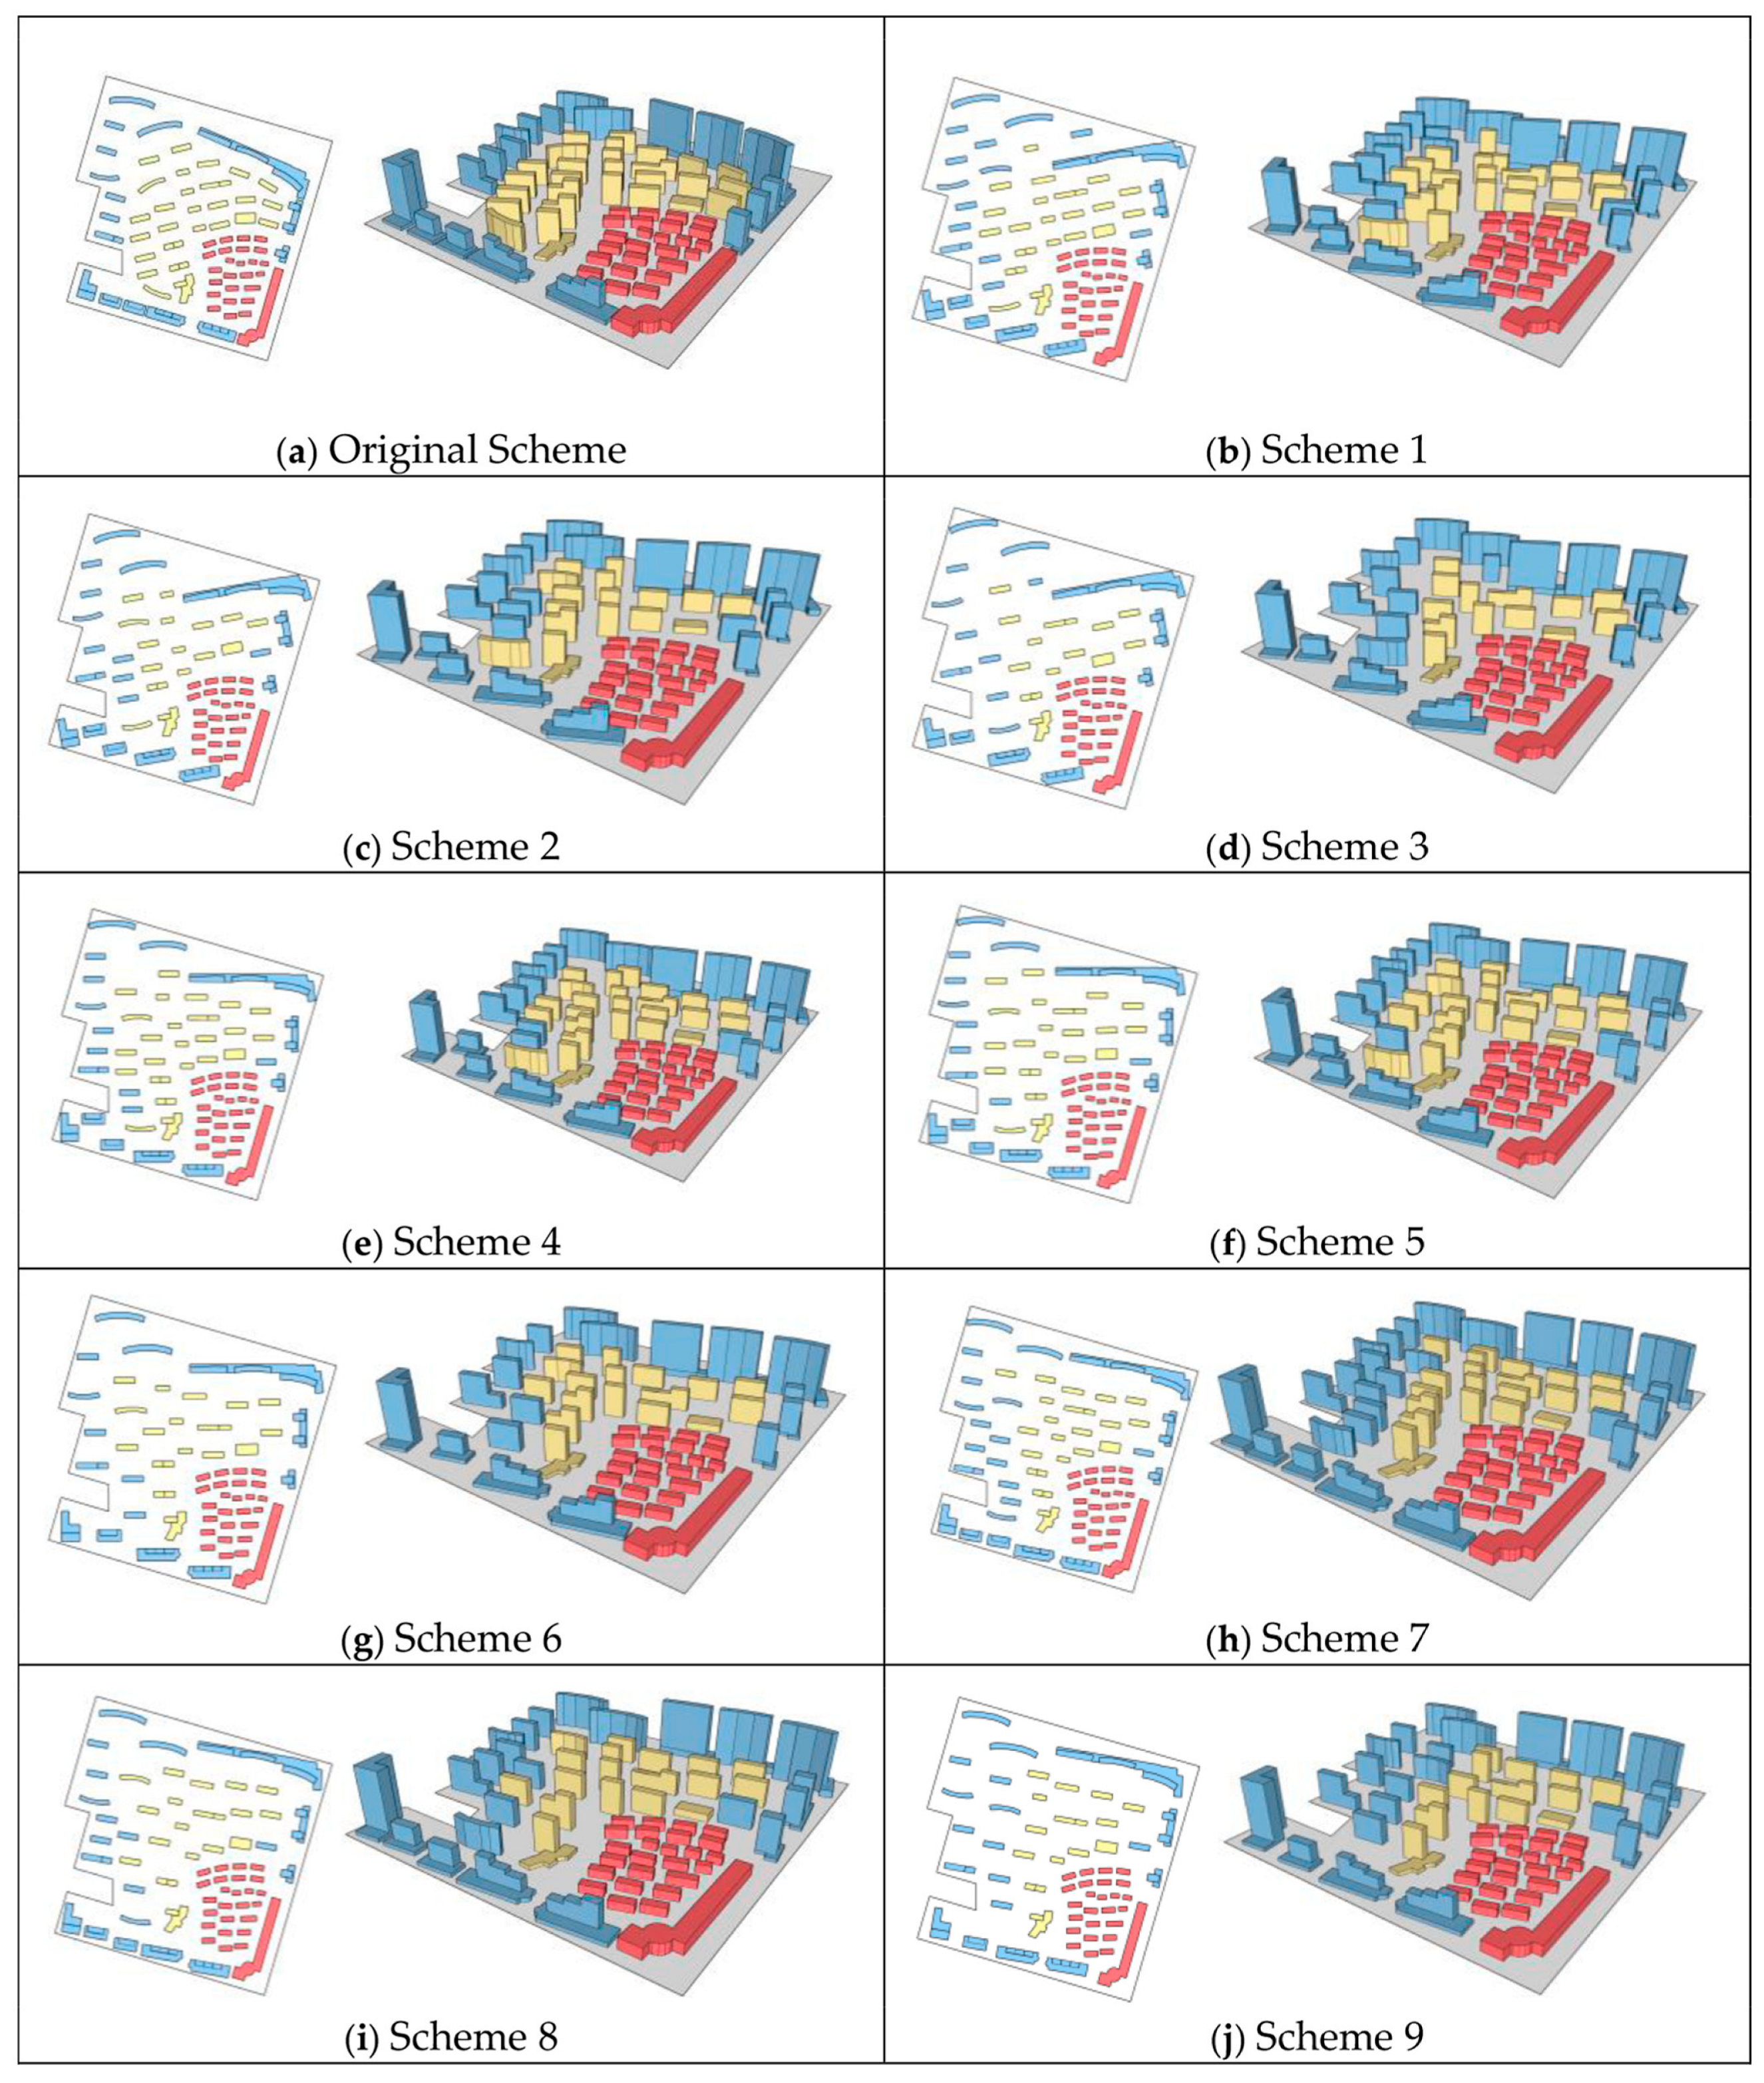
According to the L9(34) orthogonal array, the unit dimensions were extracted taking the large-scale Hongyun Runyuan residential district as the prototype. On the premise of complying with the Standard for Urban Residential Area Planning and Design (GB 50180-93, 2018 Edition) and meeting the mandatory daylighting requirements, nine planning schemes for the large-scale residential district were generated in addition to the original scheme (Figure 8) [39].

4. Simulation Results and Analysis

4.1. Simulation Results of the Original Scheme

4.1.1. Summer Wind Environment Simulation Results

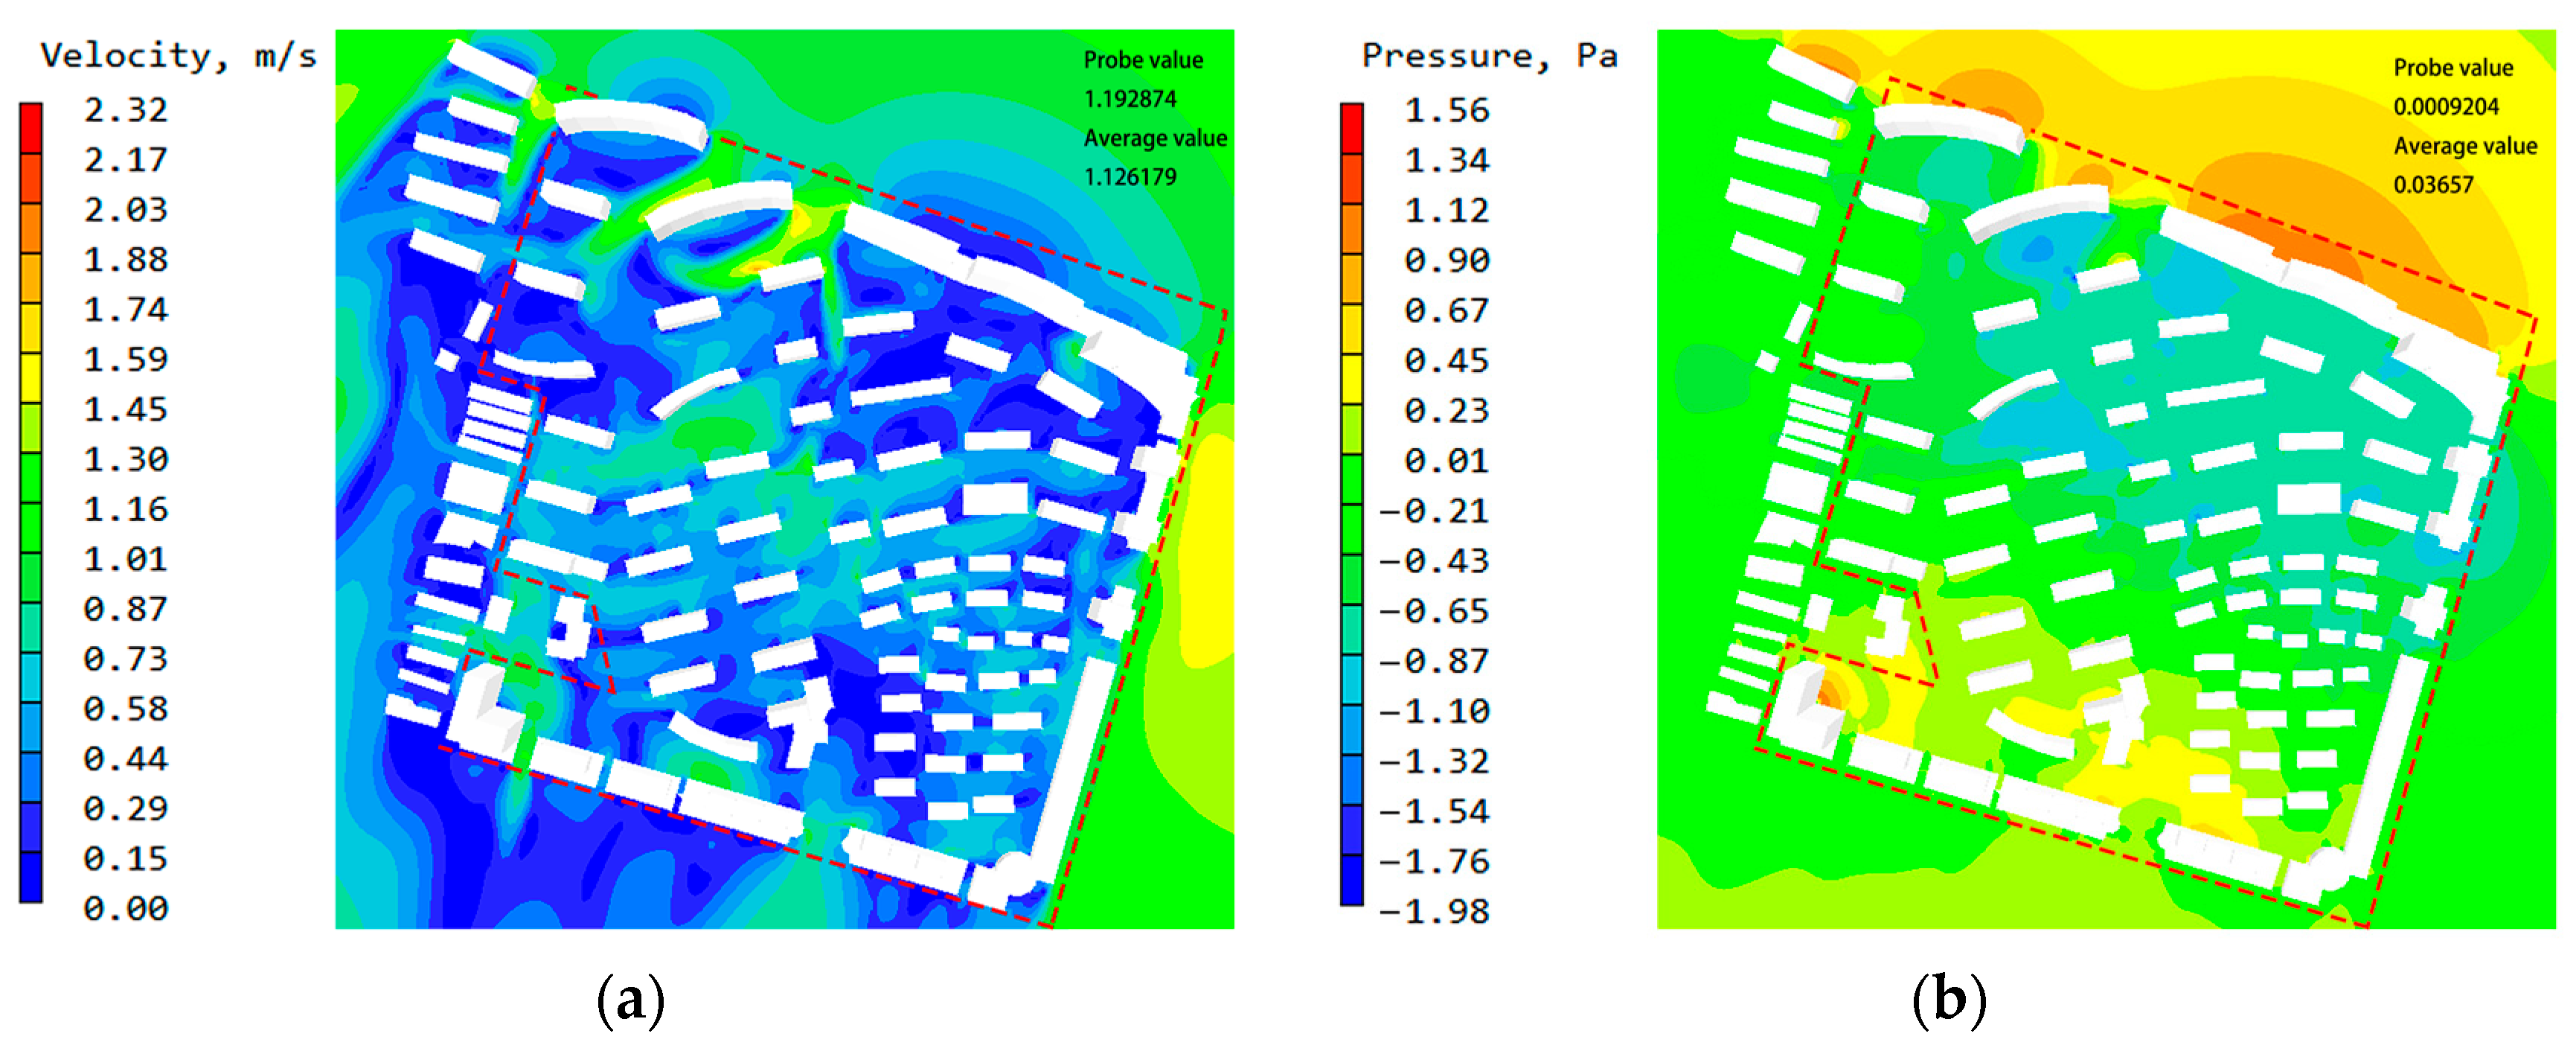
The original scheme exhibited a “high in peripheral areas, low in inner areas” spatial differentiation of wind speed distribution. The peripheral area, directly affected by the prevailing north-northeast (NNE) summer wind, had wind speeds above 0.825 m/s in most regions and served as the core airflow input zone. In the inner area, wind speed was significantly attenuated by building cluster shielding, with values concentrated in 0.481–0.894 m/s. Local high-wind-speed channels formed in building gaps, while low-wind-speed zones appeared on building leeward sides and within dense clusters.
The summer wind pressure field showed a significant hydrodynamic correlation with the wind speed field, with clear differentiation between positive and negative pressure zones. Stable positive pressure zones on building windward facades provided driving force for outdoor air infiltration, and negative pressure zones on leeward/lateral sides and cluster gaps created conditions for air discharge, forming an efficient “positive-pressure intake, negative-pressure exhaust” ventilation dynamic pattern (Figure 9).
Overall, the current layout has moderate adaptability to summer ventilation requirements. The peripheral windward interface provides sufficient airflow sources, and internal building gaps form airflow channels guiding wind into inner clusters, with wind speeds in most areas within the human comfort range.

4.1.2. Winter Wind Environment Simulation Results

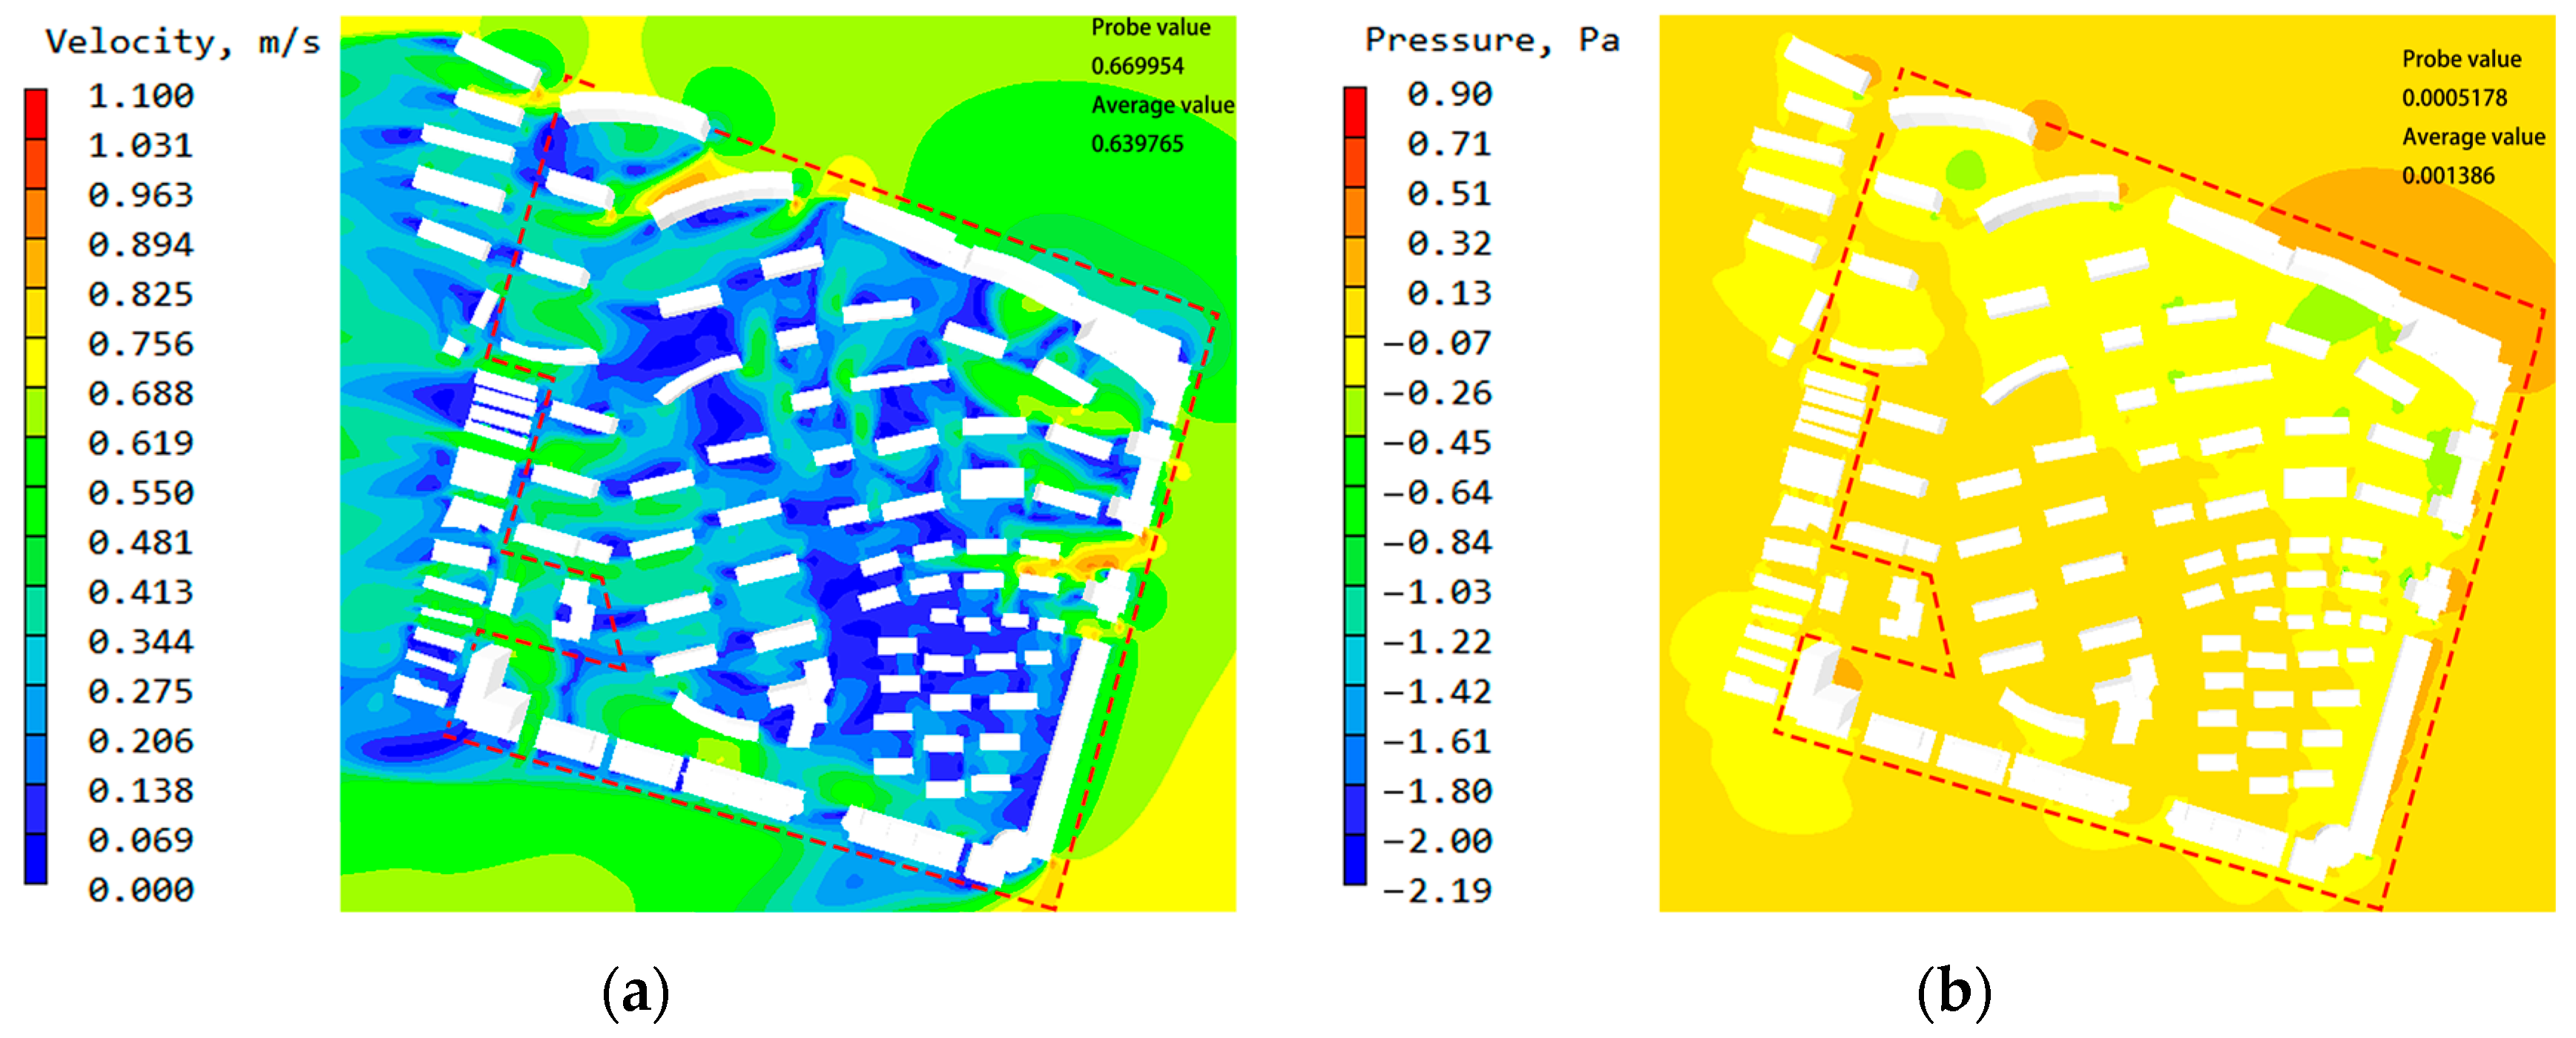
The average winter wind speed of the original scheme was only 0.640 m/s, significantly lower than that in summer. The overall wind field was dominated by low wind speeds with prominent spatial differentiation: peripheral wind speeds were concentrated in 0.344–0.550 m/s, while inner wind speeds were further attenuated to 0.069–0.481 m/s. Large-area calm zones (wind speed ≈ 0.069 m/s) appeared on building leeward sides and within dense clusters, showing severe airflow stagnation.
The winter wind pressure field was characterized by weak pressure difference driving, with faint differentiation between positive and negative pressure zones. Positive pressure zones were sporadically distributed on a few building windward facades with narrow ranges and low peaks, and negative pressure zones had limited coverage, failing to form an effective ventilation dynamic pattern and resulting in extremely low natural ventilation efficiency (Figure 10).
While the low winter wind field reduces cold air infiltration and heating energy consumption (meeting cold-region thermal insulation requirements), the large-area calm zones are prone to airflow stagnation and pollutant accumulation, which seriously impair indoor and outdoor air quality and residential comfort.

4.2. Simulation Results of Other Schemes

Affected by the Mongolian–Siberian High, Lanzhou has a strong and long-lasting winter monsoon, while the summer monsoon is weak due to topographic blocking. Given these climatic characteristics, the prevailing east-northeast (ENE) winter wind was selected as the simulation boundary condition. CFD numerical simulations were conducted for the nine orthogonal experimental schemes to analyze the wind speed distribution and ventilation performance at 1.5 m pedestrian height. The results are grouped by building orientation (the core influencing factor) as follows:

4.2.1. 10° West of South Orientation Group (Schemes 1–3)

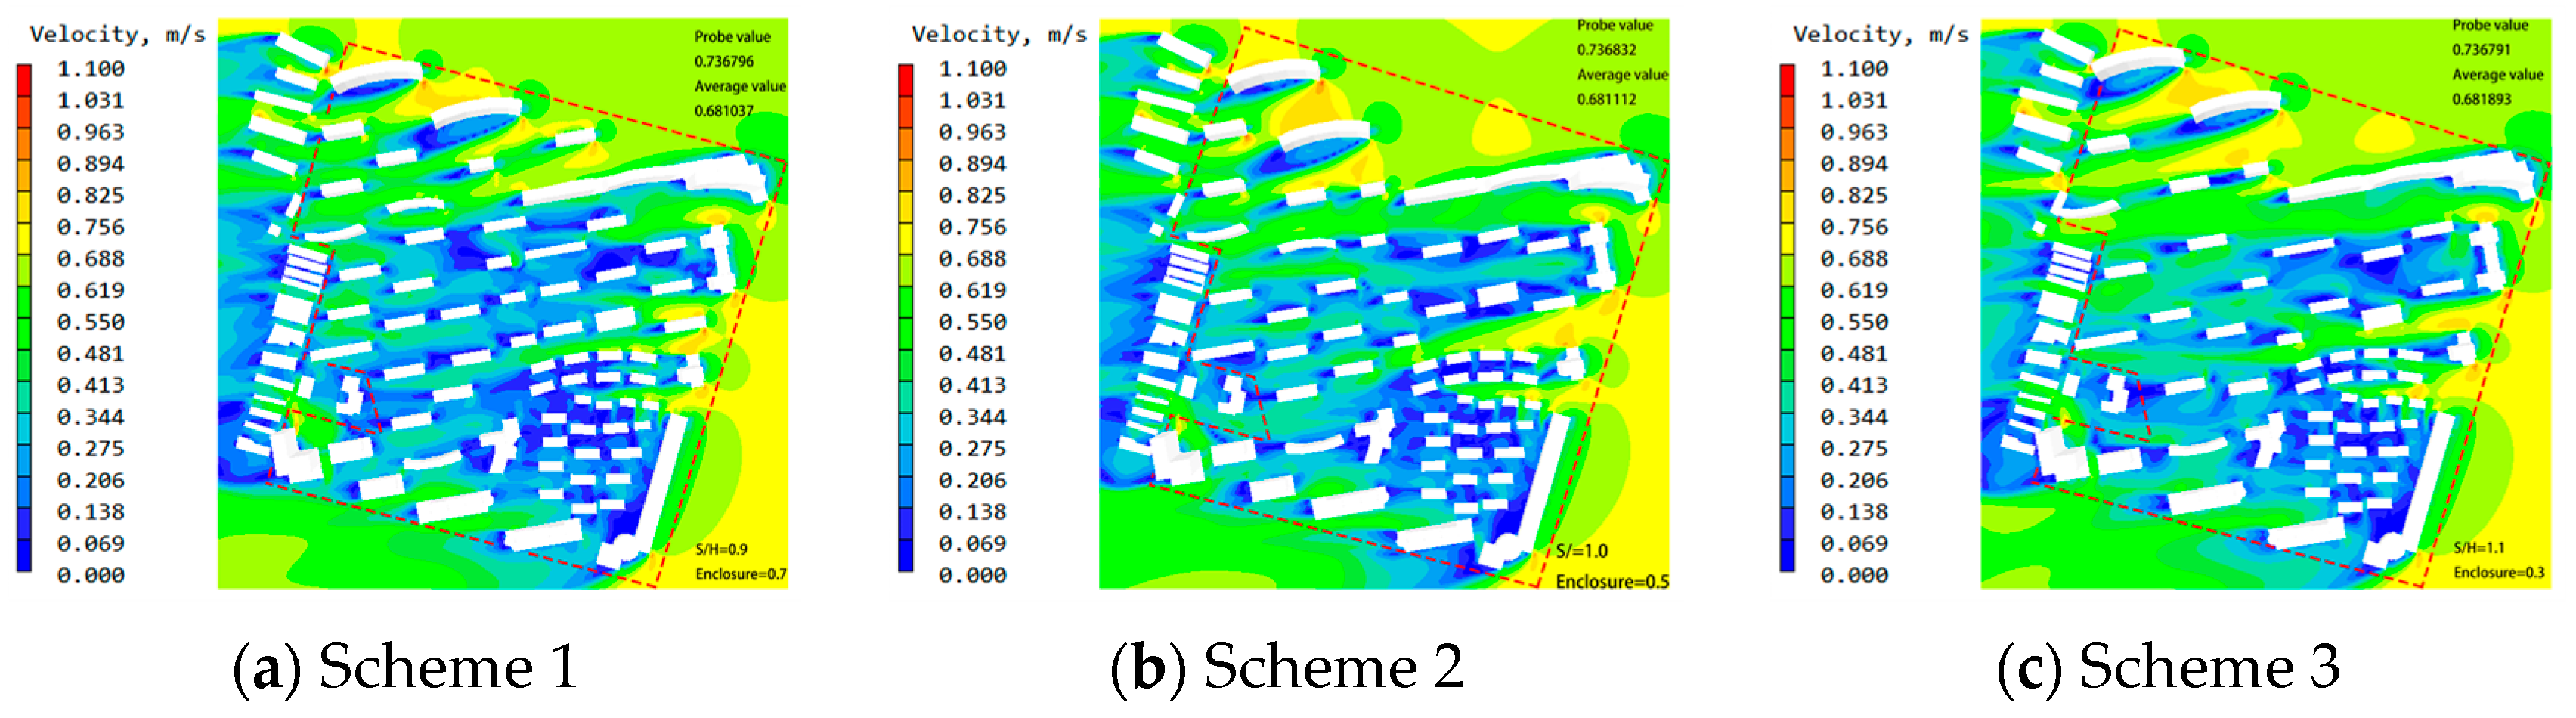
The average winter wind speed of this group ranged from 0.681 to 0.682 m/s, 6.4–6.6% higher than the original scheme (0.640 m/s). All schemes effectively eliminated large-area calm zones in the original layout and improved internal air exchange efficiency.
Scheme 1 (S/H = 0.9, enclosure = 0.7) formed through airflow channels along the building orientation at the northern edge, but had uneven wind speed distribution with local excessive wind speed on the north side.
Scheme 2 (S/H = 1.0, enclosure = 0.5) widened airflow transmission channels, with high-wind-speed areas expanding to both the eastern and northern edges, further enhancing overall ventilation but increasing thermal comfort fluctuations.
Scheme 3 (S/H = 1.1, enclosure = 0.3) achieved the highest average wind speed (0.682 m/s) among all schemes, with full airflow coverage across the district. However, more than 30% of the area had excessively high wind speed, which would increase heating energy consumption and windproof design difficulty (Figure 11).

4.2.2. Due South Orientation Group (Schemes 4–6)

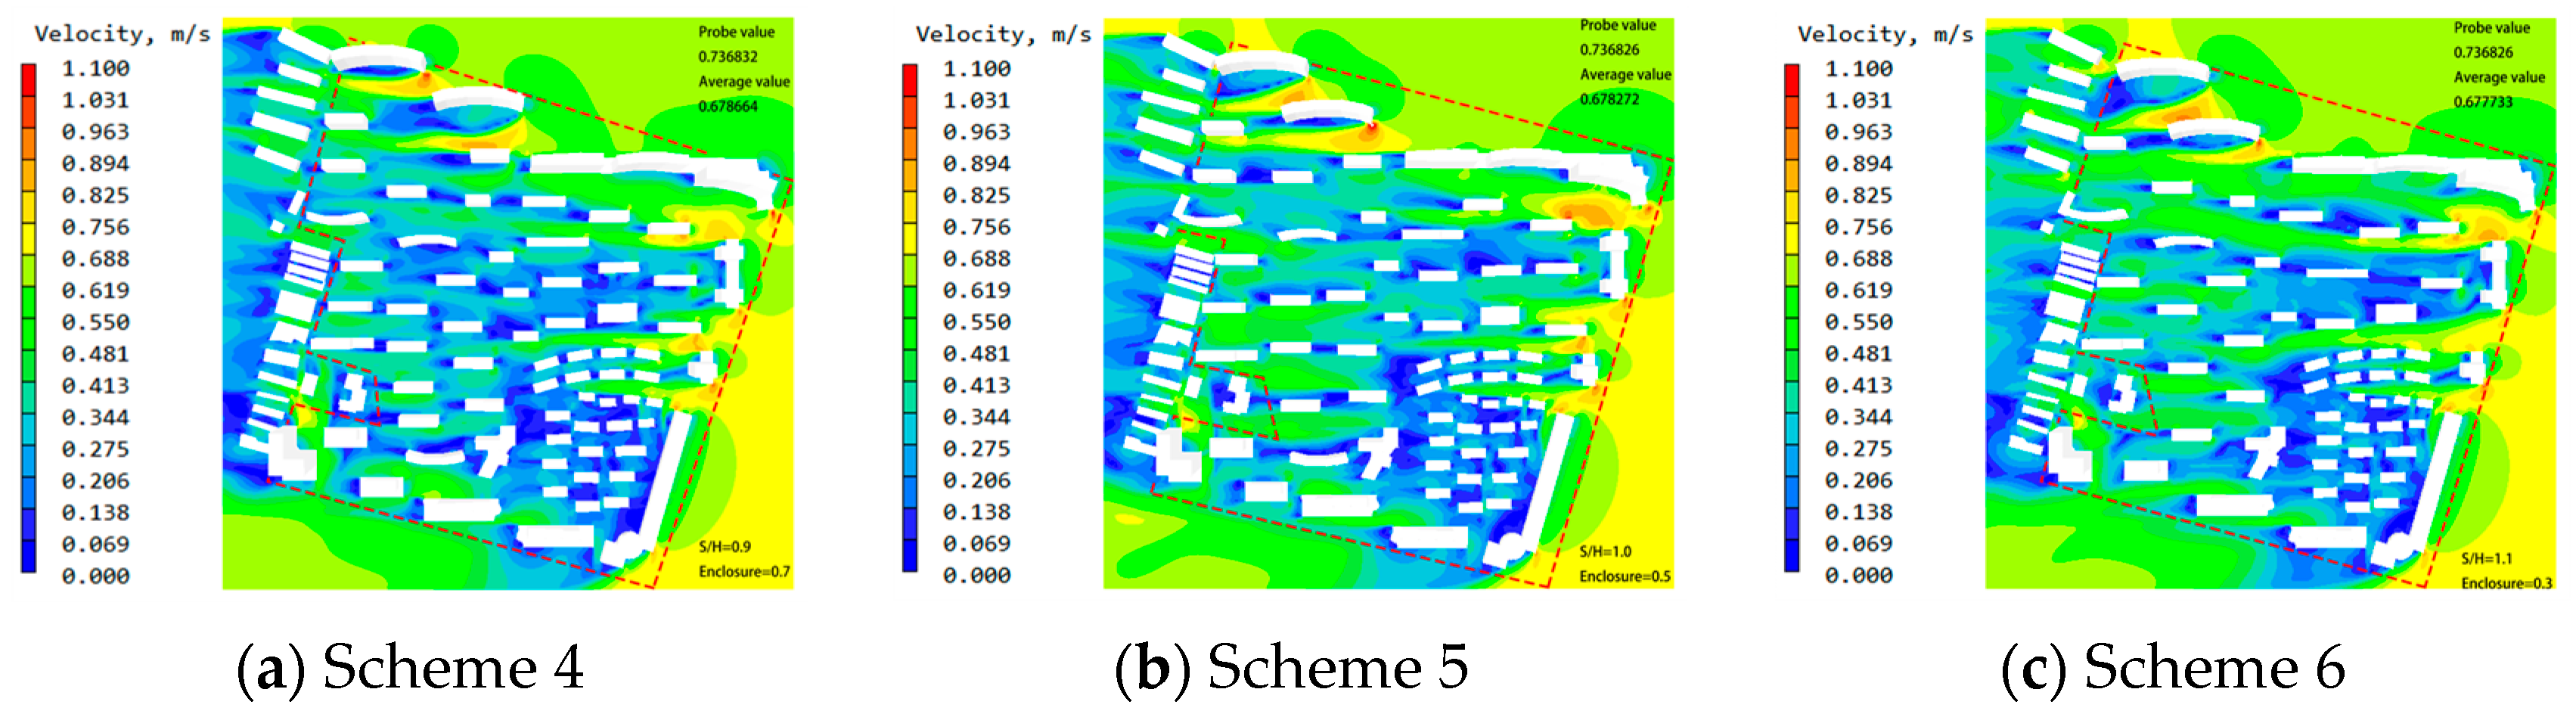
The average winter wind speed of this group ranged from 0.678 to 0.679 m/s, slightly lower than the 10° west of south group. The airflow infiltration depth was shallower, but the wind speed distribution was more uniform with better pedestrian thermal comfort.
Scheme 4 (S/H = 0.9, enclosure = 0.7) had high-wind-speed areas concentrated at the southern edge, with mild wind speed in the northern area, but insufficient air exchange frequency in the core district.
Scheme 5 (S/H = 1.0, enclosure = 0.5) balanced ventilation efficiency and comfort, with wind speed in most areas within the comfortable range, but slightly low ventilation performance in the western core area.
Scheme 6 (S/H = 1.1, enclosure = 0.3) had the mildest wind field distribution in this group, with no obvious high-wind-speed areas. It met the basic air renewal demand, but the overall ventilation efficiency was lower than that of Scheme 3 (Figure 12).

4.2.3. 10° East of South Orientation Group (Schemes 7–9)

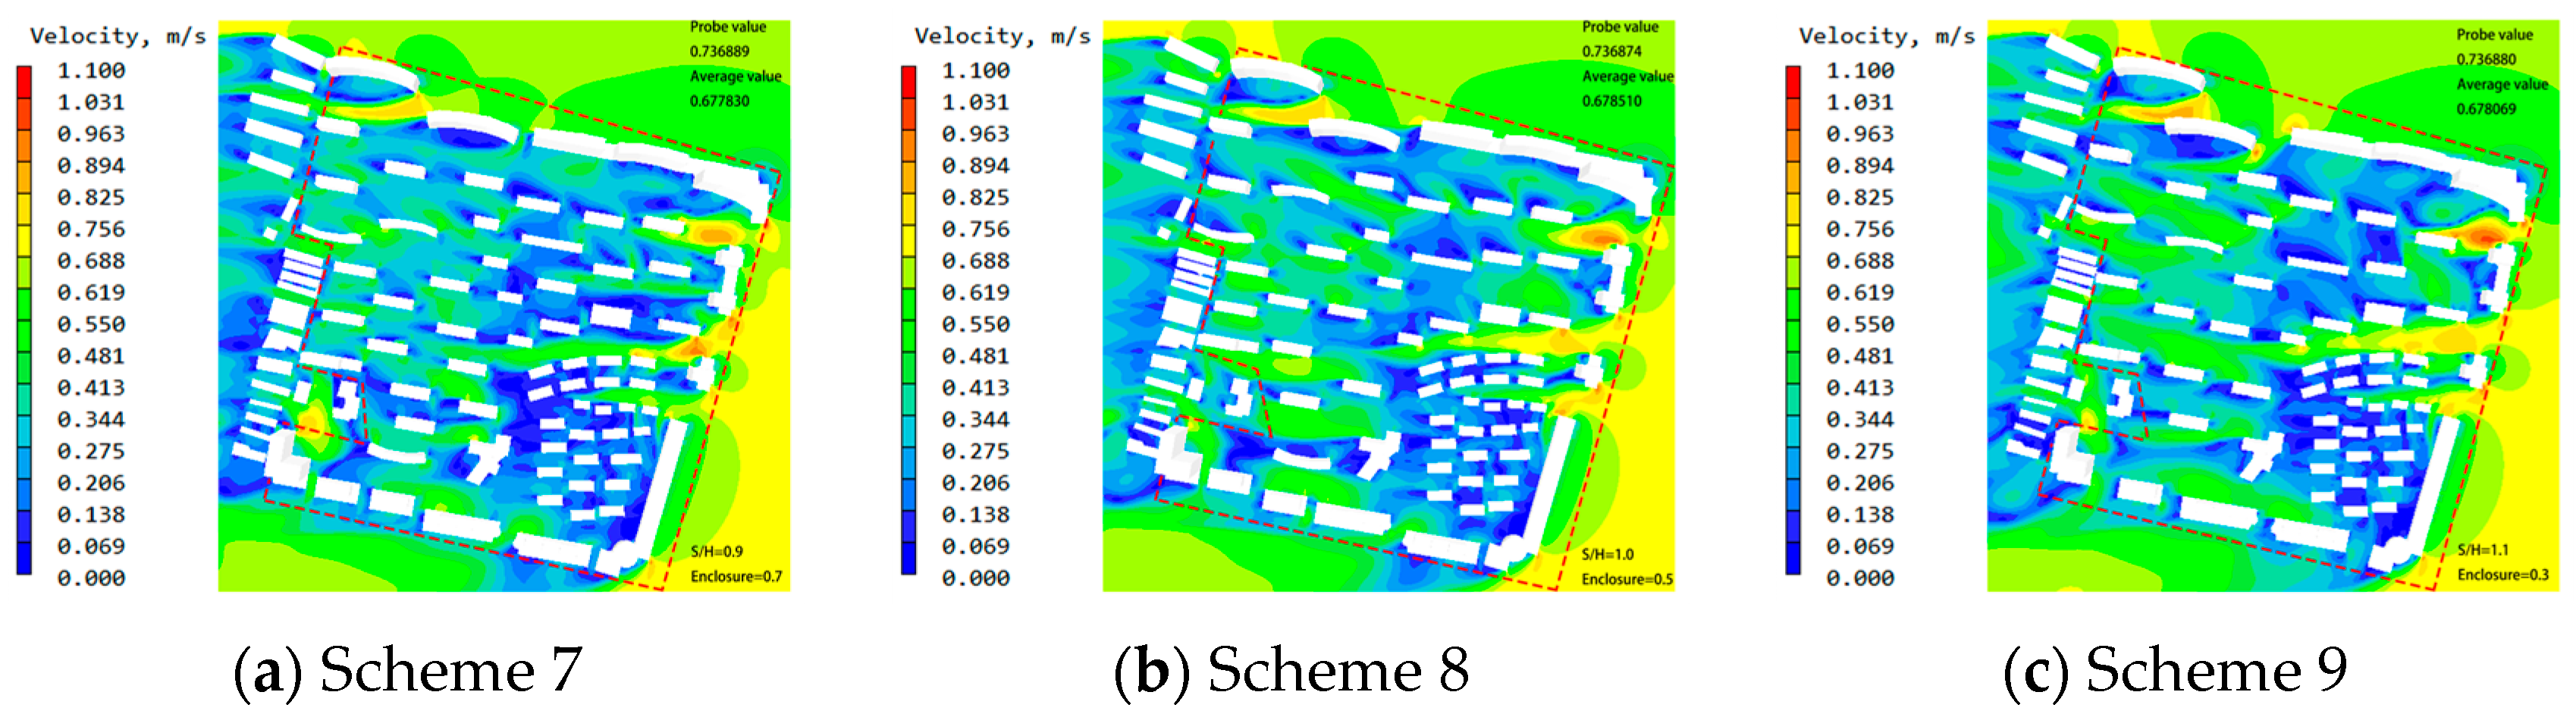
The average winter wind speed of this group ranged from 0.678 to 0.679 m/s, similar to the due south group. High-wind-speed areas were concentrated at the eastern edge, achieving a better balance between ventilation efficiency and thermal comfort.
Scheme 7 (S/H = 0.9, enclosure = 0.7) had sufficient ventilation at the eastern edge and mild wind speed in the western area, but significant east–west ventilation difference and poor overall uniformity.
Scheme 8 (S/H = 1.0, enclosure = 0.5) further improved internal air exchange rate, but the ventilation capacity of the western core area remained relatively weak.
Scheme 9 (S/H = 1.1, enclosure = 0.3) had the most uniform wind speed distribution in this group. It maintained stable wind speed in the core area, avoided large-area calm zones and strong wind zones, and achieved the best comprehensive wind environment quality among all nine schemes (Figure 13).
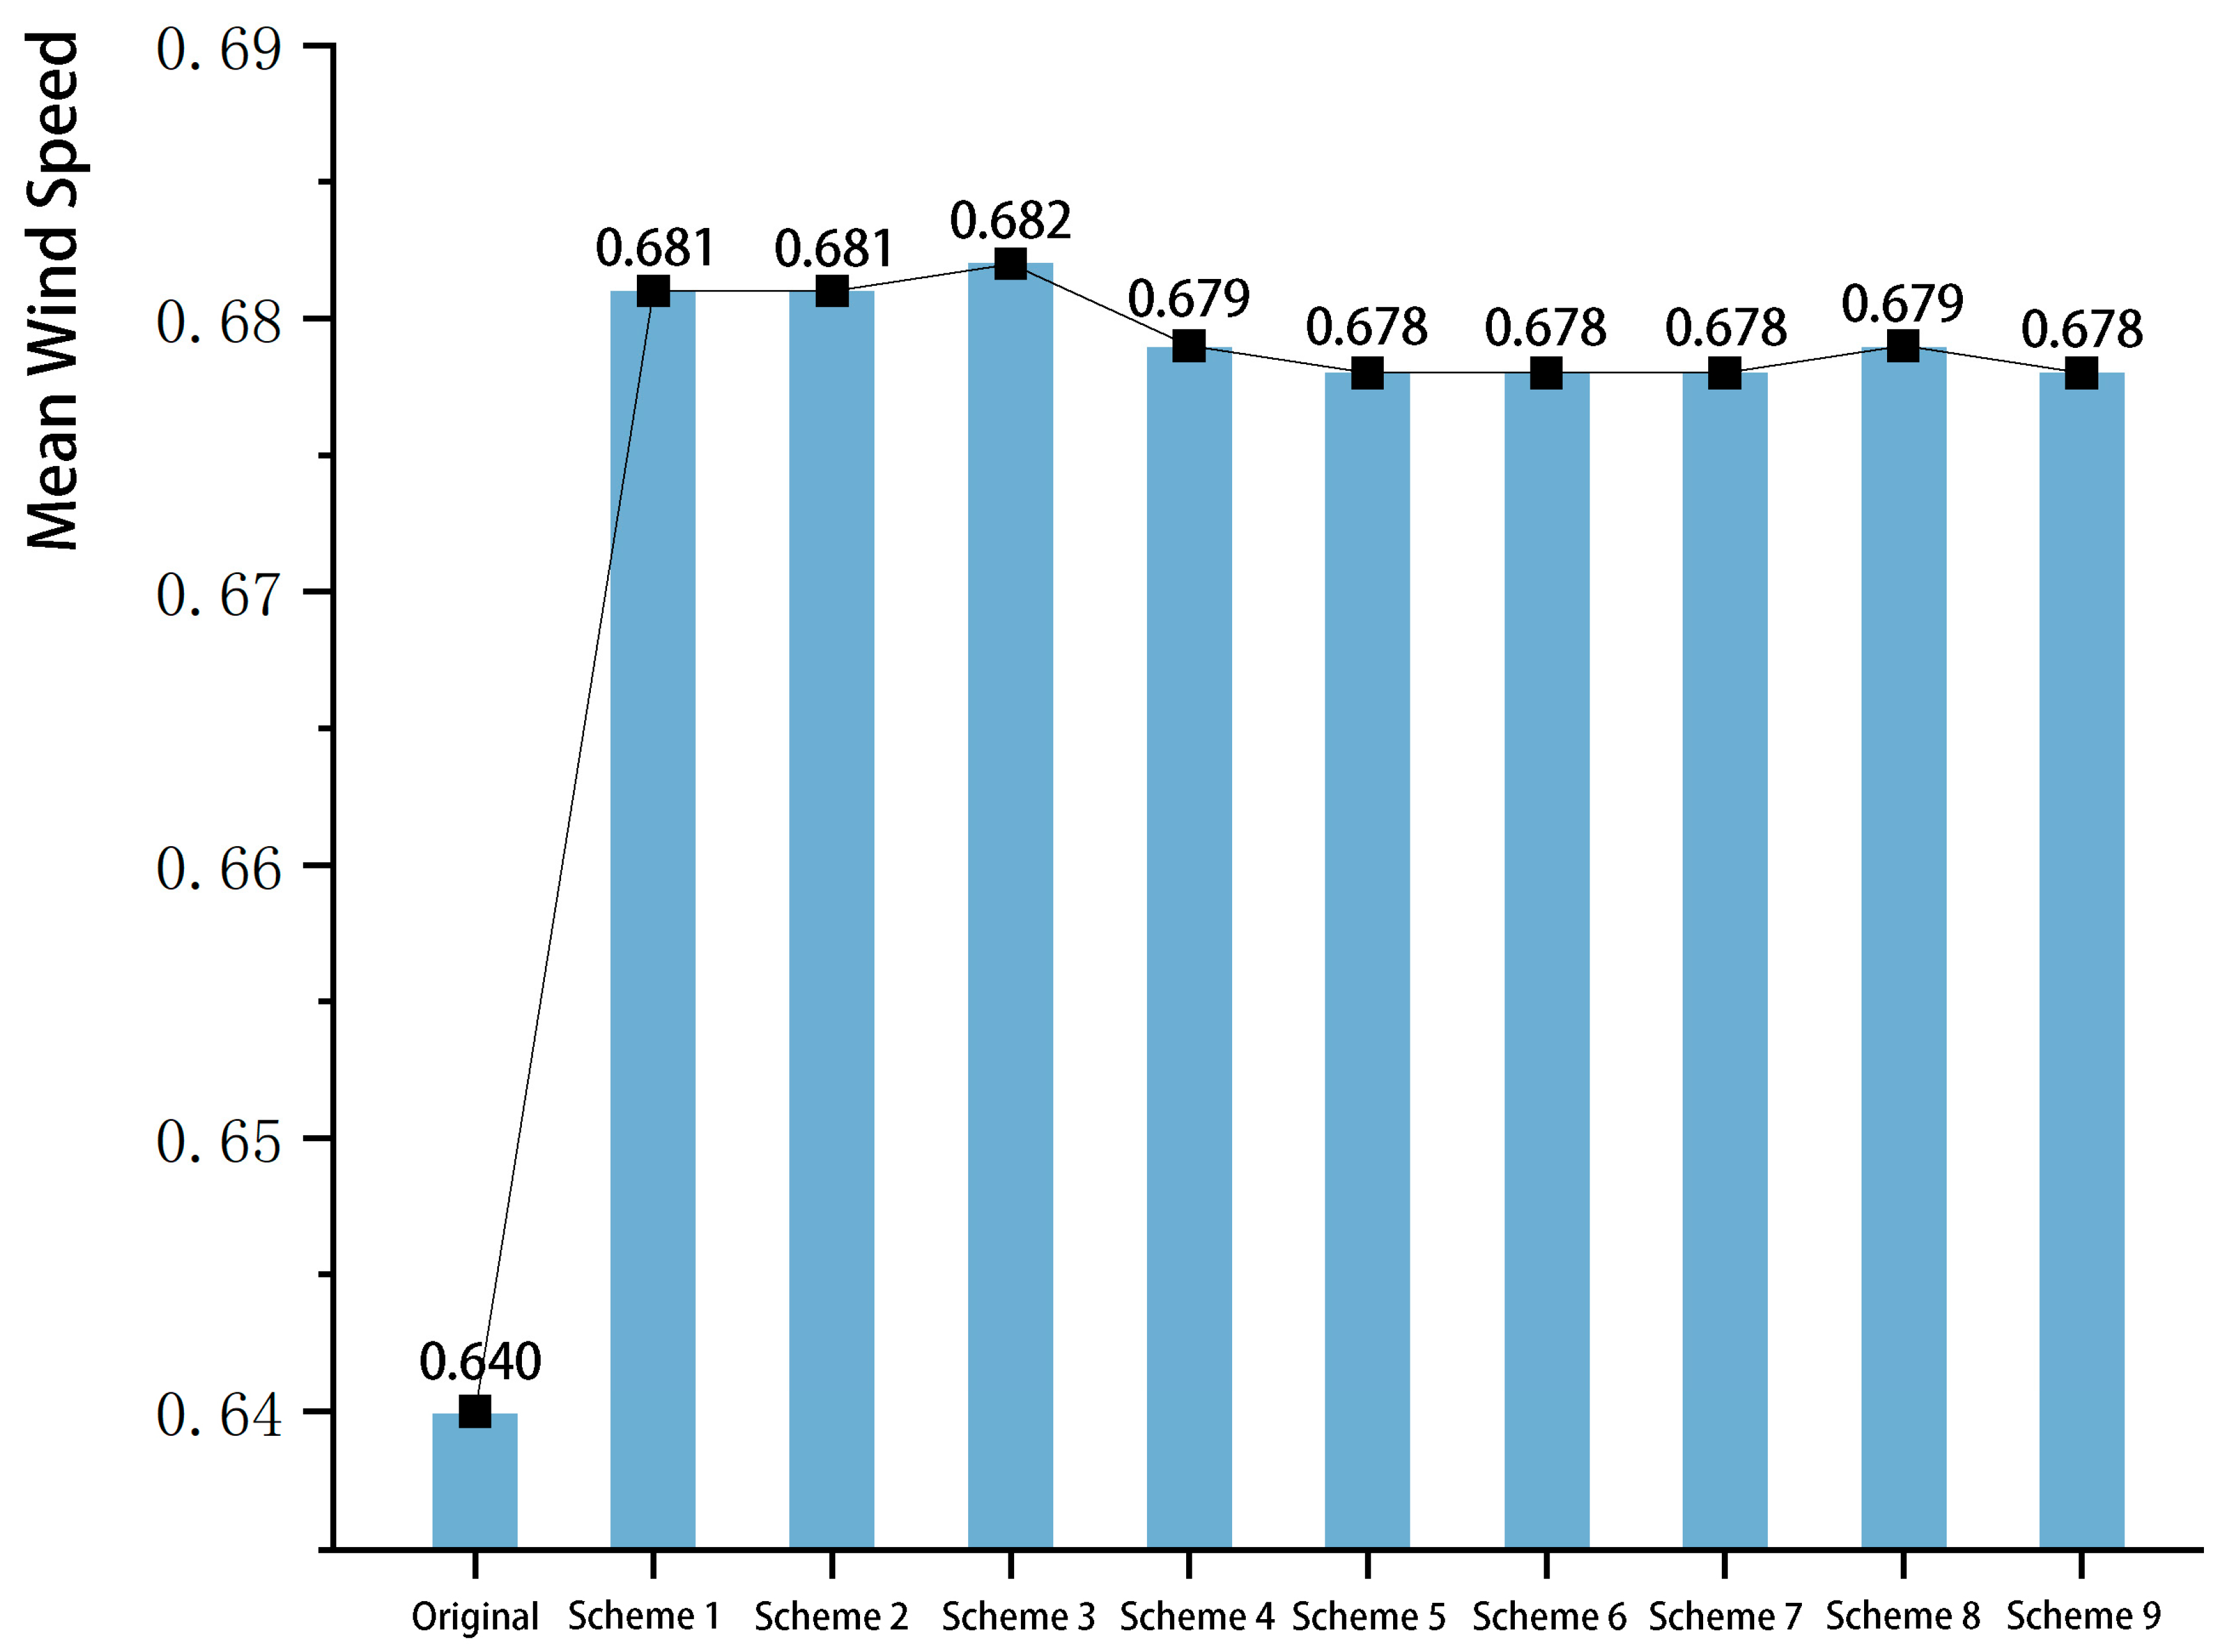
All nine orthogonal schemes significantly improved the winter wind environment compared with the original scheme: the original mean wind speed was 0.640 m/s, while the orthogonal schemes ranged from 0.678 m/s to 0.682 m/s, representing a 5.9–6.6% increase. This confirms that adjusting the three core morphological parameters effectively alleviates the large-scale airflow stagnation in the original layout (Figure 14).
Grouped by building orientation (the dominant factor), clear hierarchical differences were observed:
The 10° west of south group (Schemes 1–3) had the highest mean wind speed (average 0.681 m/s), consistent with the aerodynamic mechanism that a small angle between building facades and the prevailing ENE wind causes direct airflow impact.
The due south (Schemes 4–6) and 10° east of south (Schemes 7–9) groups had nearly identical mean wind speeds (average 0.678 m/s for both), as their moderate windward angles avoid strong frontal airflow impact.
Within each orientation group, the maximum difference in mean wind speed caused by varying spacing coefficient and enclosure degree was only 0.001 m/s. This preliminary result intuitively indicates that the independent effects of these two factors are negligible within the tested parameter ranges, which is fully consistent with the subsequent ANOVA results.

4.3. Analysis of the Influence Weight of Each Factor

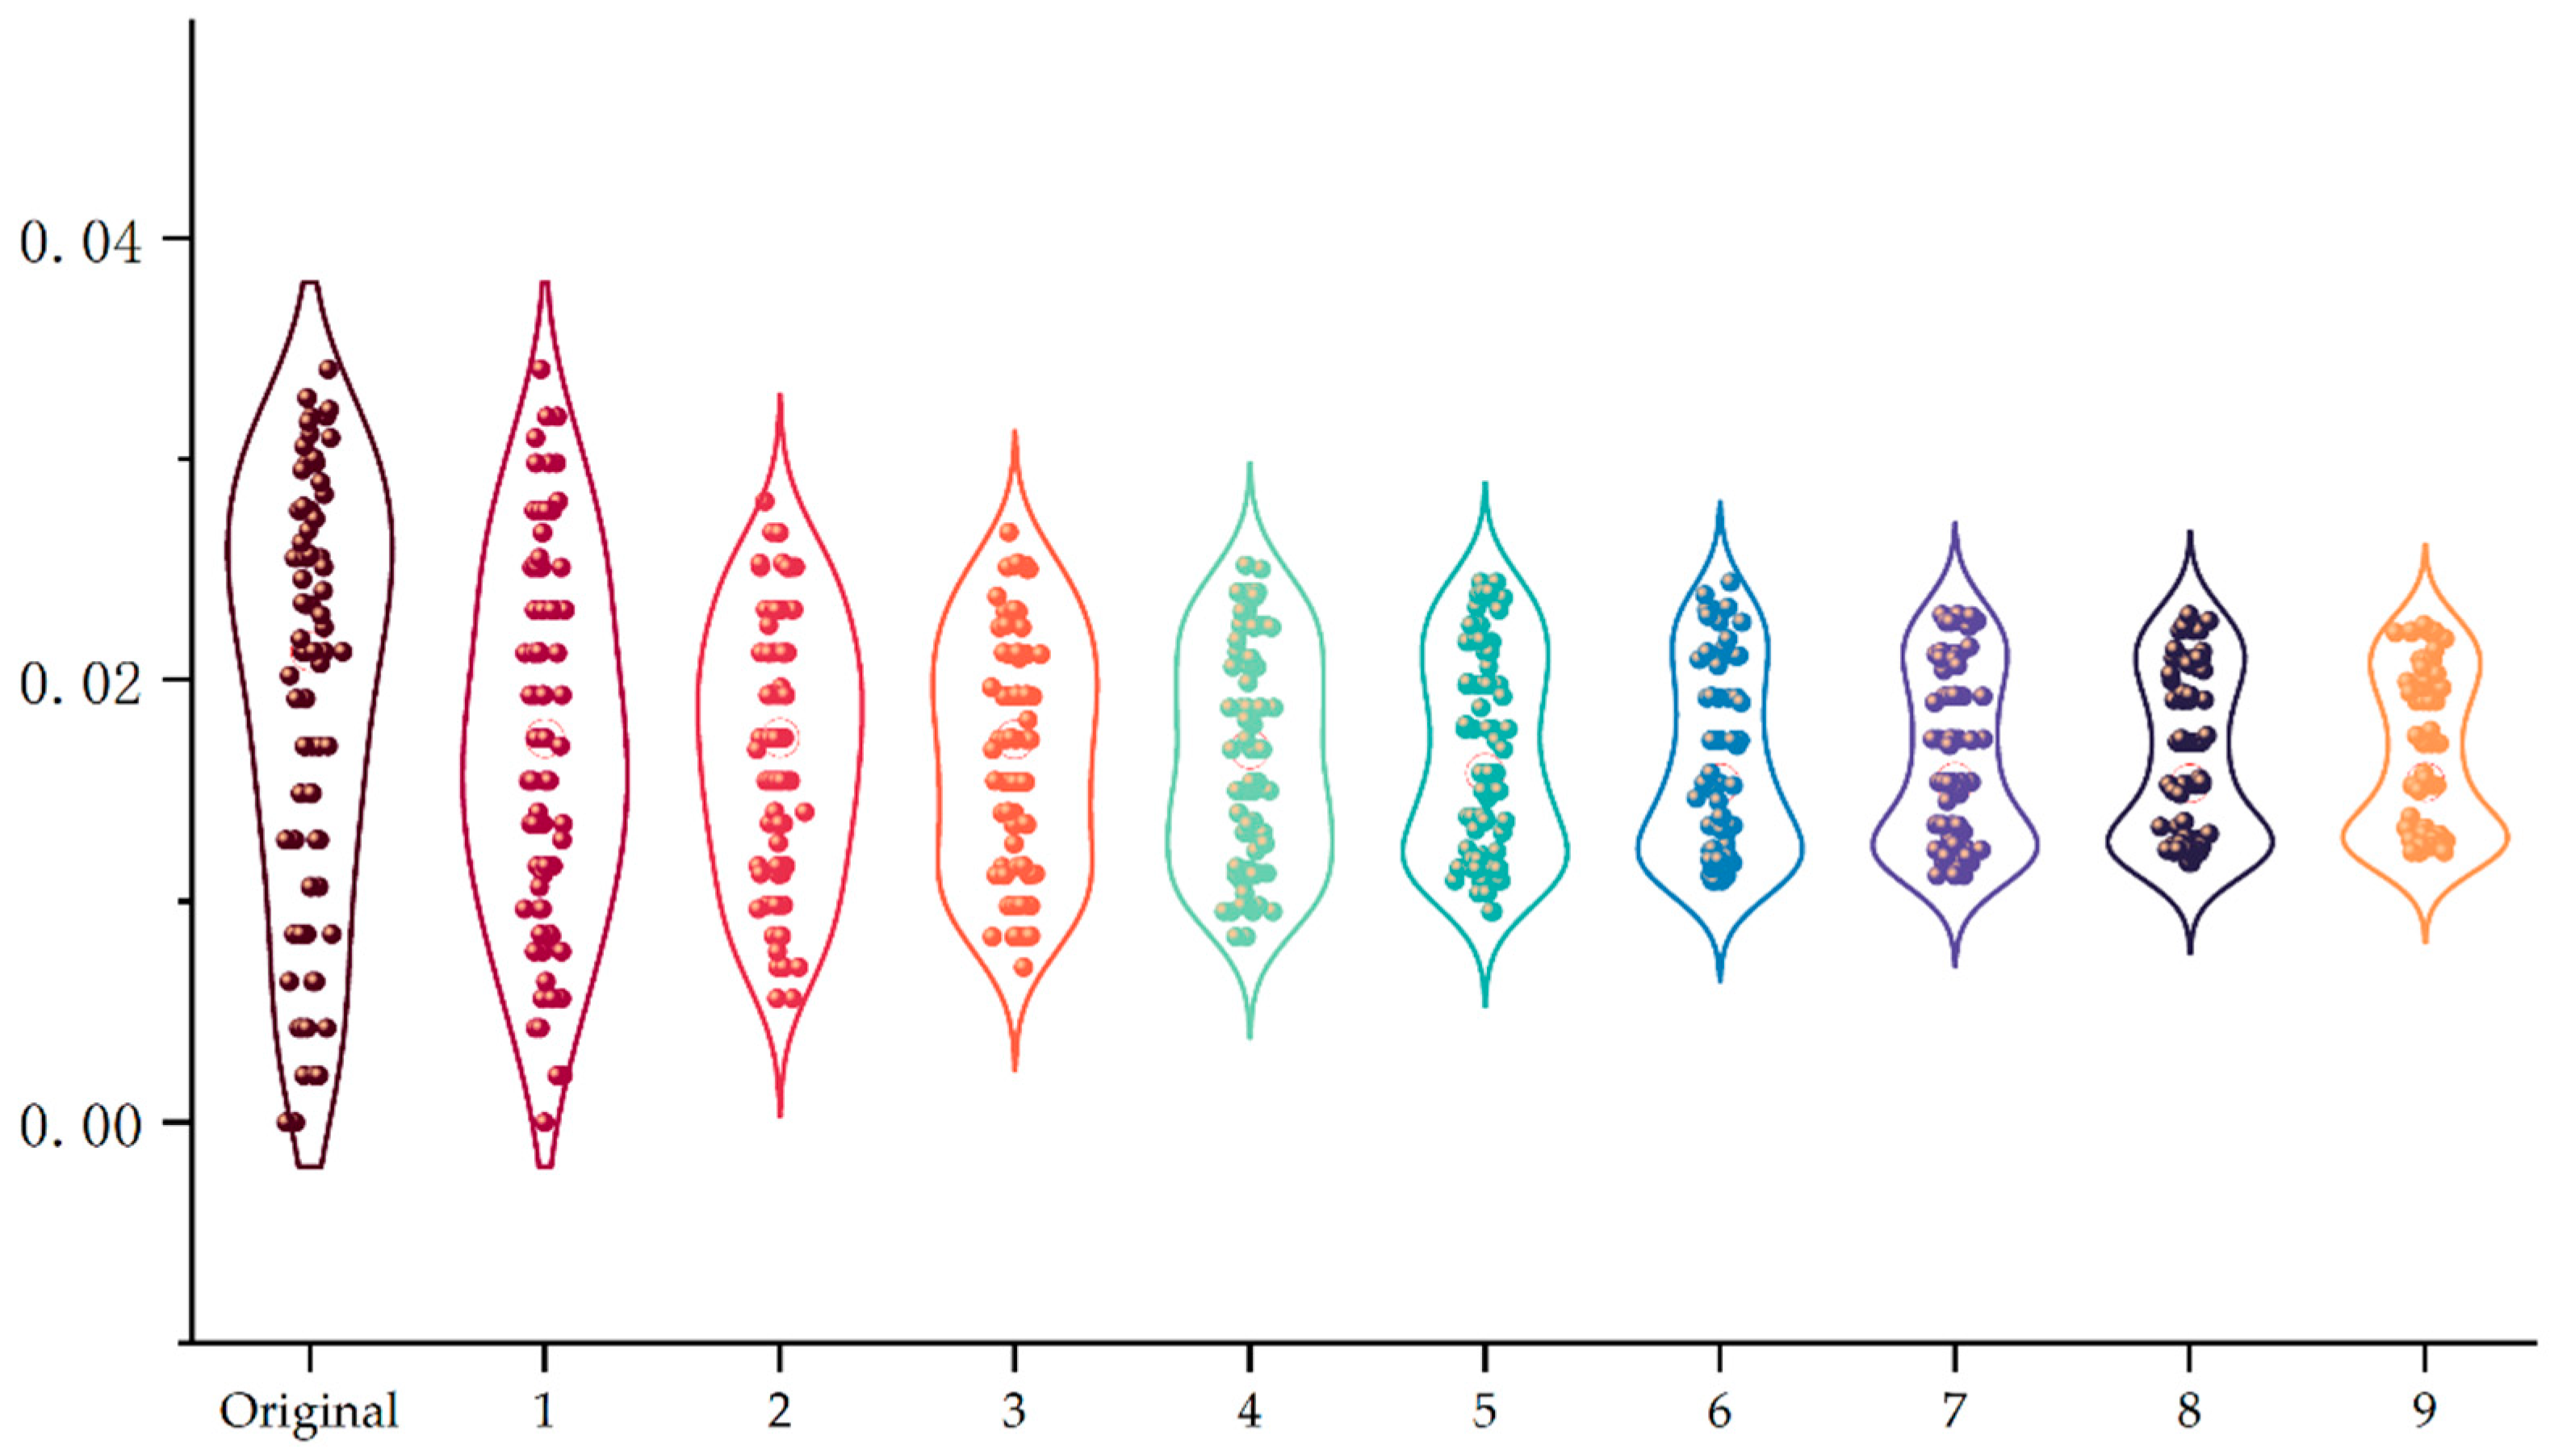
For the nine schemes, wind speed values from 240 measuring points were extracted for each scheme, and the arithmetic mean wind speed v ¯ (m/s) of each scheme was obtained through calculation.
After normalization and standardization of the wind speed data from 240 measuring points, a violin plot illustrating the wind speed distribution characteristics at winter pedestrian height under different levels of spatial morphological factors was generated (Figure 15). This plot clearly presents the distribution patterns and dispersion characteristics of wind speed corresponding to different levels of the three core factors: building orientation, building spacing coefficient, and residential district enclosure degree. Significant differentiation was observed in the three sets of wind speed distribution intervals associated with building orientation: under the level of 10° east of south, the wind speed distribution was the most concentrated with overall values within a comfortable and reasonable range; under the level of 10° west of south, the wind speed distribution had the widest interval and the highest degree of dispersion; and the wind speed distribution of the due south orientation fell between the two, which intuitively reflects the strong driving effect of building orientation on wind speed distribution. In contrast, the wind speed distribution patterns corresponding to the three levels of both building spacing coefficient and residential district enclosure degree were highly coincident, with no significant differences in distribution intervals and central tendency, indicating that the independent effects of these two factors on wind speed distribution were weak.
The orthogonal experimental design was conducted to investigate the effects of three factors, namely building orientation (A), building spacing coefficient (B), and residential district enclosure degree (C), on the mean winter wind speed. The results (Table 4) showed that the overall level of winter wind speed was stable at around 0.68 m/s, with a standard deviation of only 0.002, indicating minimal wind speed fluctuation under the experimental conditions and high data quality, which provided a reliable foundation for the subsequent factor effect analysis. Meanwhile, the level distribution of each factor was balanced, with each level accounting for 33.33% of the total number of experiments, which confirmed the randomness and representativeness of the experimental design and avoided deviation interference.
Single-factor analysis of variance (ANOVA) further revealed the main effects of each factor (Table 5). Building orientation (A) had an extremely significant effect on winter wind speed with an F-value of 13.4 and a p-value of 0.006 (p < 0.01), indicating that different orientations (i.e., 10° west of south, due south, and 10° east of south) led to significant differences in wind speed levels. This finding has important guiding implications for architectural design: priority optimization of building orientation can effectively regulate the winter wind environment of residential districts. In contrast, both the building spacing coefficient (B) and residential district enclosure degree (C) had an F-value of 0.154 and a p-value of 0.861, which is far above the significance level of 0.05. This indicates that within the parameter ranges set in this study, the independent effects of these two factors are not statistically significant, and their influence on the wind environment may be affected by interaction effects between factors or other uncontrolled variables.
From the perspective of aerodynamic mechanism, the significant effect of building orientation on the wind environment mainly stems from its coupling with the prevailing winter wind direction (ENE) in Lanzhou and the valley funneling effect. As a typical valley-type city, Lanzhou is traversed by the Yellow River from west to east, forming a narrow and long terrain characterized by “two mountains flanking a single river”. The prevailing northeast wind in winter is constrained by the valley terrain, resulting in an obvious funneling effect, which significantly amplifies the wind speed along the valley direction and keeps the wind direction relatively stable.
When the building orientation is 10° west of south, the angle between the windward facade of buildings and the prevailing winter wind direction (ENE) is small. The airflow directly impacts the windward facade of buildings, forming intense flow around and vortex effects around the buildings, which leads to uneven wind field distribution and excessive local wind speed, increasing winter cold air infiltration and building heating energy consumption. This is consistent with the findings of Javanroodi and Nik (2019), who confirmed that urban microclimate conditions dominated by wind speed and direction have a significant impact on building energy performance in cold climates [40]. When the building orientation is due south, the angle between the windward facade and the prevailing wind direction is moderate, and the airflow around effect is weakened to some extent, but there are still some local strong wind areas. When the building orientation is 10° east of south, the windward facade of buildings forms an angle of approximately 60° with the prevailing winter wind direction (ENE). At this time, the airflow can flow smoothly along the building facades, avoiding strong frontal impact and vortex formation. Meanwhile, it can guide the airflow to enter the interior of the residential district in an orderly manner, which not only effectively reduces the risk of winter cold air infiltration and local strong winds, but also ensures the basic ventilation demand inside the residential district and avoids the formation of large-area calm zones. In addition, the orientation of 10° east of south also takes into account the ventilation demand of the prevailing summer wind direction (NNE), which can guide the cool northeast wind into the residential district in summer.
Overall, this experiment preliminarily confirmed that building orientation is the key factor affecting winter wind speed, which supports the theoretical hypothesis in architecture that “building orientation determines ventilation efficiency”. This finding provides practical implications for residential district planning: in cold-region architectural design, priority should be given to south-oriented layout to reduce wind speed and improve thermal comfort, while the optimization of building spacing and enclosure degree can be placed in a secondary position.

4.4. Determination of the Optimal Scheme

The adopted L9 orthogonal array consists of three factors and three levels, and a total of 27 schemes should be obtained in theory through permutation and combination. Whether the optimal scheme is included in the nine typical schemes extracted via simulation can be verified by calculating the sum of values of each factor and the range of the arithmetic mean values of each factor (Table 6).
The calculation method is as follows: First, the results of Scheme 1, 4 and 7, Scheme 2, 5 and 8, and Scheme 3, 6 and 9 were summed up respectively. That is, the test results of each factor were divided into three groups, denoted by K1, K2 and K3 respectively, and the calculation results were recorded under the three factors: A (layout), B (height) and C (combination), respectively (Table 7).
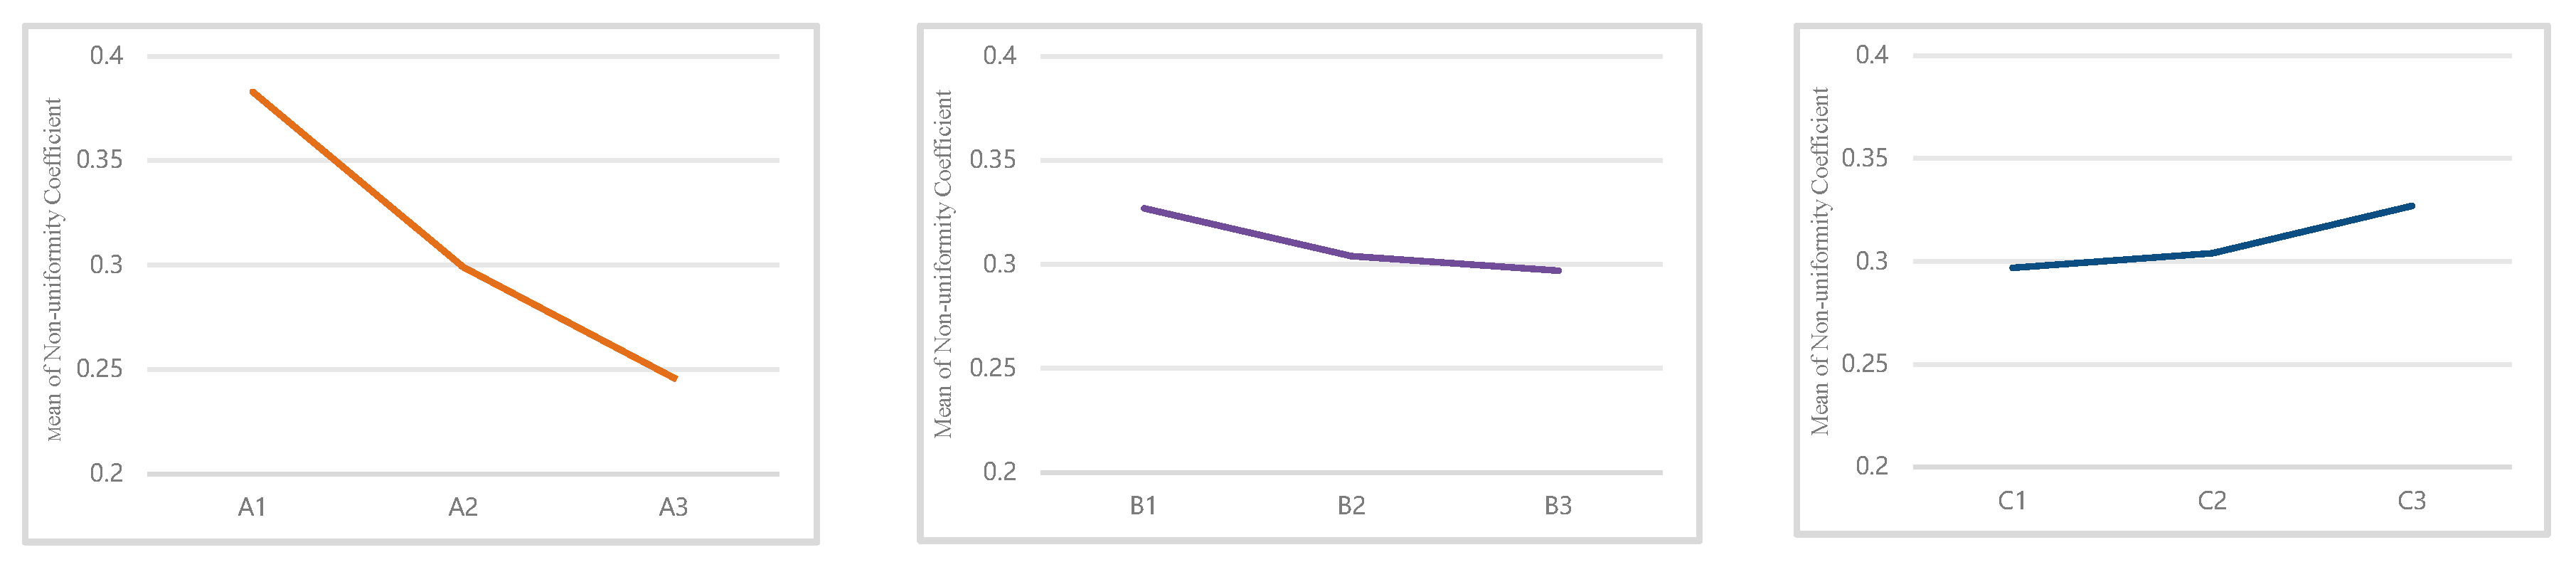
Second, the arithmetic mean value of each factor was calculated respectively. On this basis, the range R of each factor was obtained by subtracting the minimum value from the maximum value of the arithmetic mean values of each factor, namely Ra = 0.137, Rb = 0.030, Rc = 0.030 (Table 8). The larger the range of a factor, the higher the importance of the factor.
The calculation results confirmed that the priority order of influencing factors to be considered in the planning of large-scale residential districts was consistent with that of the single-factor analysis. Specifically, building orientation exerted the greatest influence on the wind environment of the large-scale residential district, followed by building spacing coefficient and residential district enclosure degree. To further intuitively demonstrate the representativeness of the experimental schemes, the correlation between factor levels and the evaluation index was plotted with the factor level as the abscissa and the mean value of the index as the ordinate (Figure 16). It can be seen that the optimal combination is A3B3C1, which is completely consistent with the combination mode of Scheme 9 selected in the orthogonal experimental design. This method further verified the representativeness and effectiveness of the extracted typical planning schemes.

5. Spatial Morphology Optimization of Residential Districts

Combined with the Standard for Urban Residential Area Planning and Design (GB 50180-93, 2018 Edition) and the simulation analysis of ventilation improvement effects in the orthogonal experimental design, spatial morphology optimization strategies for residential districts adapted to the cold climate characteristics of Lanzhou were summarized [35,39].
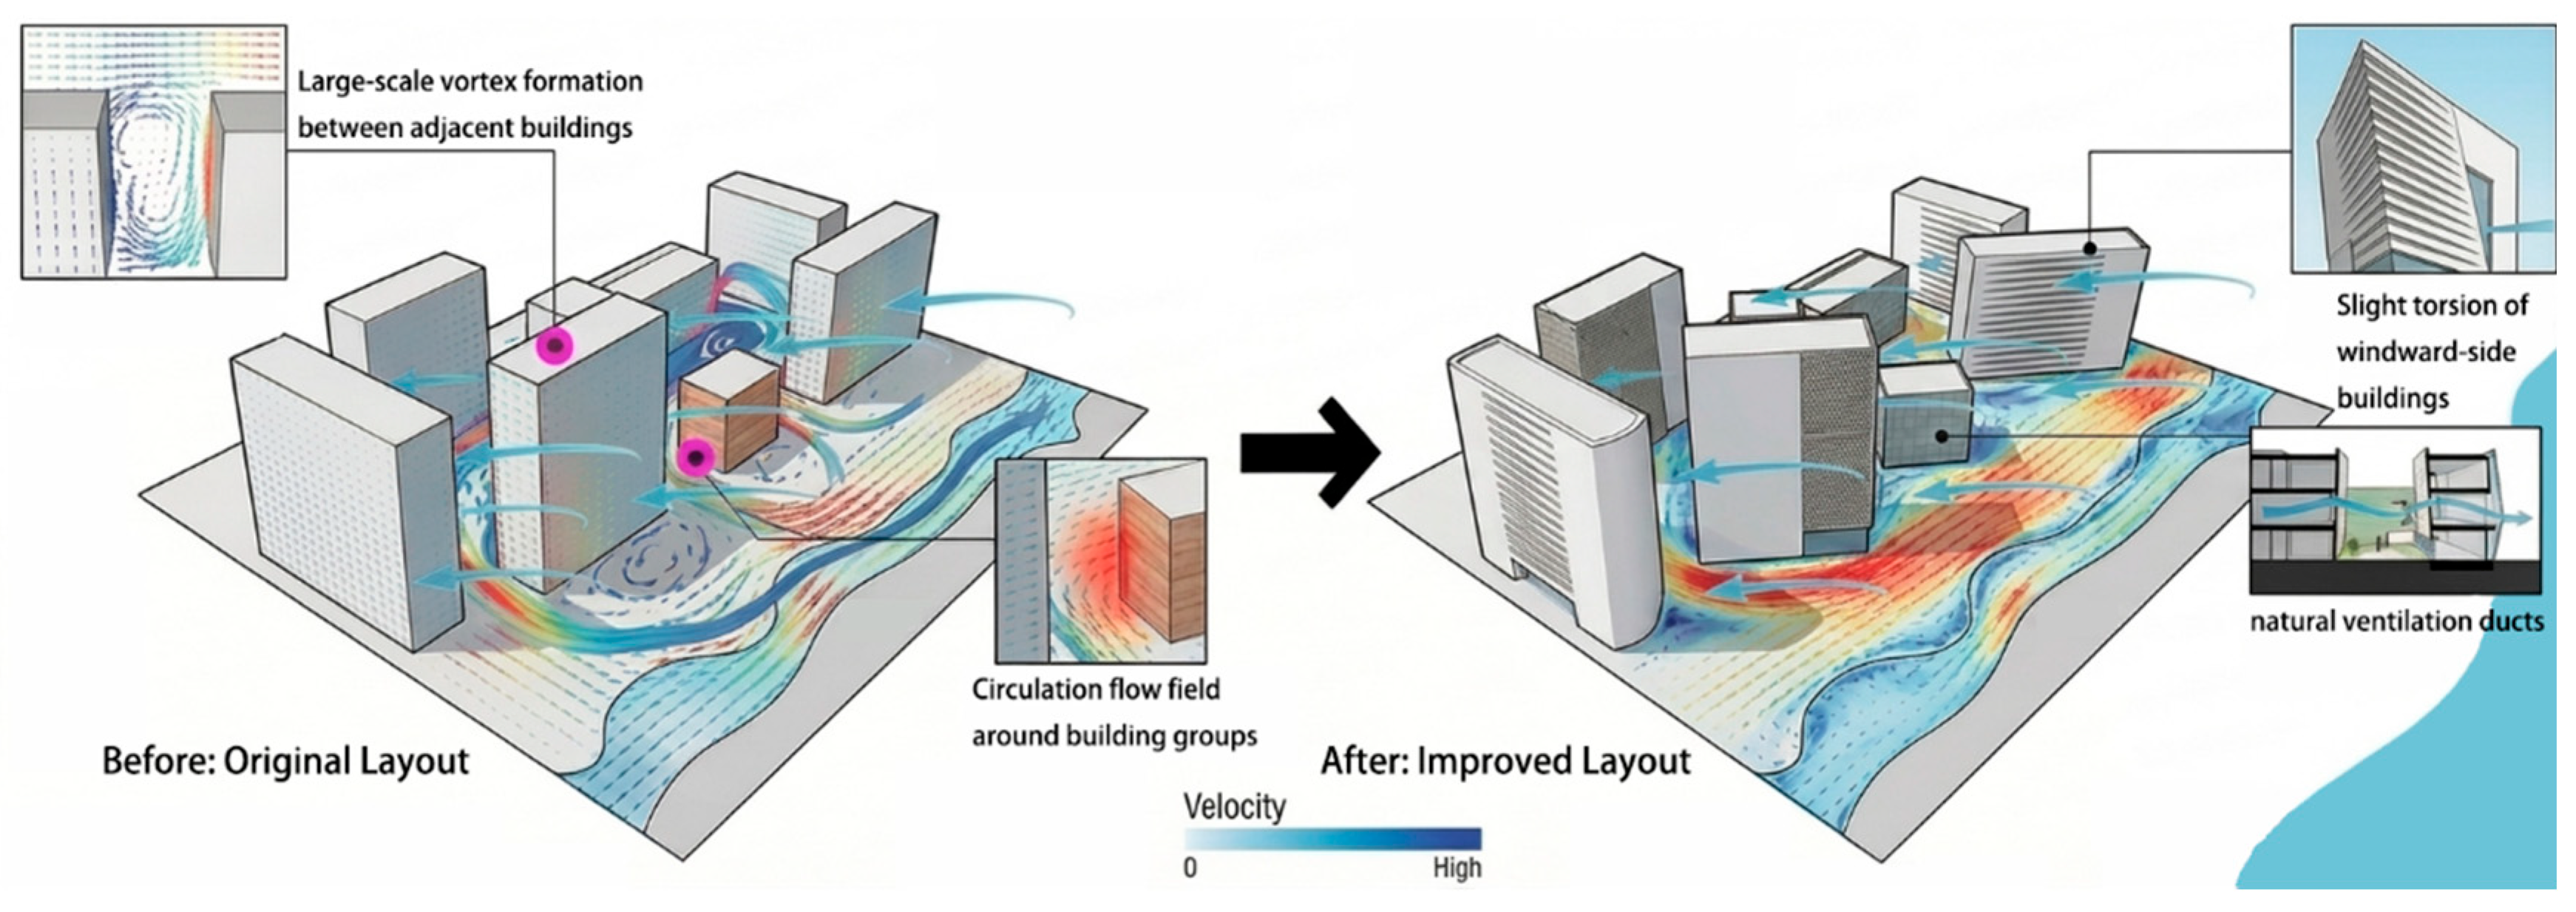
Optimizing the building orientation of the front-row buildings on the windward side of residential districts is the core measure for wind environment regulation in residential districts of cold-region valley cities. This study confirmed that building orientation has an extremely significant effect on the wind environment (p = 0.006), making it the primary step in optimization. Waterside building clusters along the Yellow River in Lanzhou are affected by the valley funnel effect. In the original layout, the poor adaptability between building orientation and the prevailing wind direction tends to form large-scale vortices between adjacent buildings, causing airflow turbulence and stagnation, and leading to a dilemma in dual-season wind environment regulation in winter and summer.
Based on the optimal orientation of 10° east of south obtained in this study, optimizing the angle of windward buildings and adding wind-guiding interfaces can reshape the windward facade to eliminate harmful vortices, construct main ventilation corridors coupled with the prevailing valley wind direction, and form a stable circulating flow field around building clusters. This realizes gradient energy dissipation and orderly organization of incoming valley wind, and balances the dual demands of wind protection in winter and ventilation in summer (Figure 17).
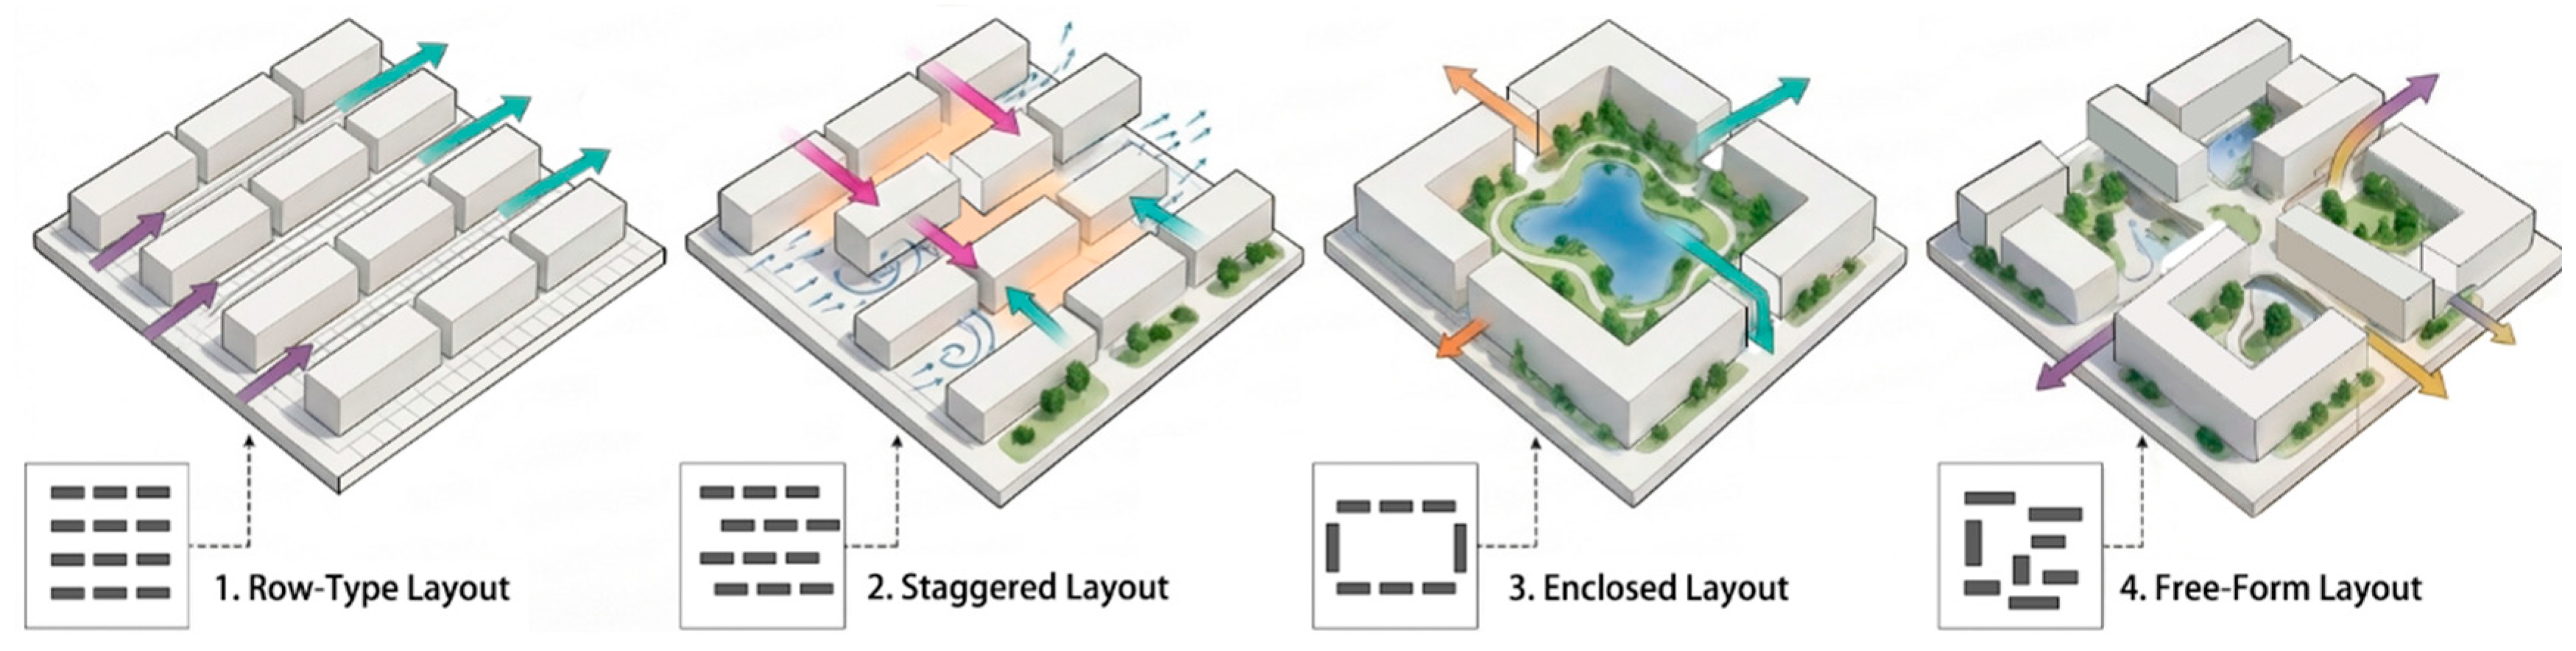
Although the independent effect of the building spacing coefficient on the residential district wind environment is not significant, reasonable regulation is an important prerequisite for ensuring ventilation performance. Based on the experimental conclusions, the building spacing coefficient of residential districts in Lanzhou should be controlled at the optimal level of 1.1, with 1.0 as the minimum control threshold. Considering the differences in wind environment adaptability among different residential layout forms, the application of dense linear layouts should be reduced, and the proportion of staggered layouts should be increased to break the continuous windward shielding interface and reserve through channels for airflow transmission. This regulation method can not only meet Lanzhou’s winter daylighting standards, reserve sufficient space for airflow circulation, and avoid ventilation obstruction caused by excessively small spacing, but also prevent land waste caused by excessively large spacing, balancing ventilation efficiency, daylighting requirements, and land use intensification (Figure 18).
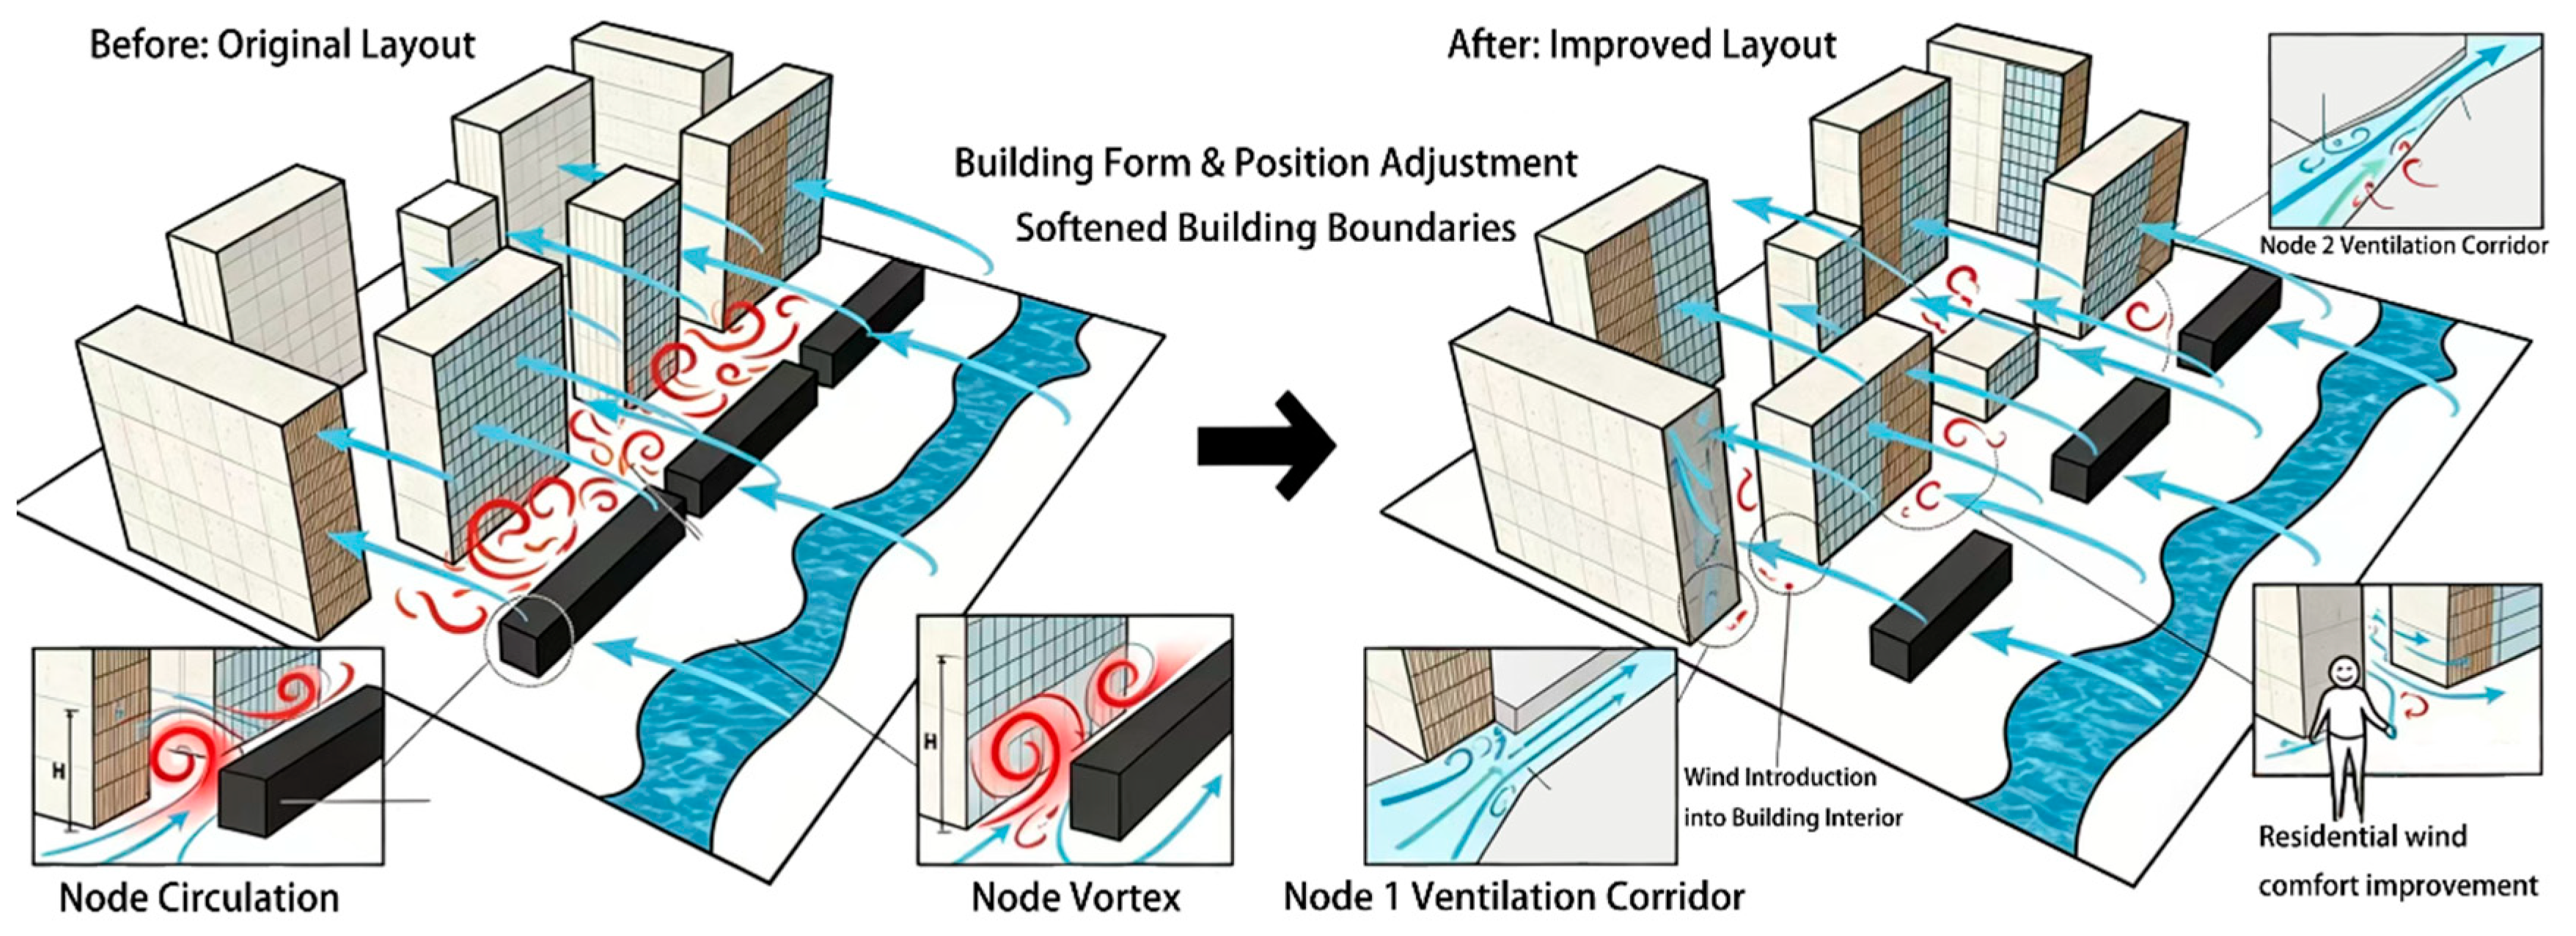
The enclosure degree of residential districts and building width are the core elements for wind environment regulation in cold-region river valley high-density residential areas, requiring coordinated optimization of multiple objectives. This study determined that 0.3 is the optimal value of residential enclosure degree, and 0.5 is the upper limit control value for high-density residential areas. Meanwhile, the width of residential units should be controlled within a reasonable range; the coordination of these two factors can balance the needs of summer ventilation and winter thermal insulation. The original layout of riverfront residential districts in Lanzhou often leads to internal wind shadow areas and stagnant eddies due to excessively high enclosure degree and closed interfaces. Based on the coordinated control mechanism, by optimizing building layout, softening building boundaries, adding wind guiding nodes and ventilation corridors, the air flow is guided to penetrate uniformly into the interior of the residential district. This realizes the orderly organization of the wind field and bidirectional regulation in winter and summer, and improves the human settlement quality of cold-region waterfront residential districts while ensuring land use efficiency (Figure 19).

6. Discussion

6.1. Scientific Explanation of the Research Results

This study found that building orientation is the core dominant factor affecting the winter wind environment of residential districts in cold-region valley-type cities, exerting an extremely significant effect (p = 0.006). This conclusion is consistent with the research results of other cold-region cities such as Shenyang and Harbin. For example, Zhang et al.’s study on the wind environment of residential districts in Shenyang also showed that the influence of building orientation on the average winter wind speed is far greater than that of building spacing and layout forms [18]. However, the influence weight of building orientation in this study is higher than that in plain cities. This is because the prevailing wind direction in valley cities is more constrained by topography and thus more stable, and the influence of the angle between building orientation and prevailing wind direction on the wind field is significantly amplified by the valley funneling effect.
In contrast, the independent effects of building spacing coefficient and enclosure degree are not significant in this study, which is different from the research results of some plain cities. The main reason for this difference lies in the unique valley terrain and climatic characteristics of Lanzhou: the prevailing wind direction in winter in Lanzhou is east-northeast (ENE), and affected by the valley funneling effect, the wind speed is relatively high and the wind direction is stable, making the angle between building orientation and prevailing wind direction the most critical factor determining the wind field distribution. In plain cities, however, the winter wind direction is more variable, so the regulatory effects of building spacing and enclosure degree on the wind field are relatively more obvious. In addition, the optimal orientation of 10° east of south proposed in this study is highly consistent with the optimal building daylighting orientation in Lanzhou (5–15° east of south), indicating that this orientation can simultaneously meet the dual demands of daylighting and wind protection, and has strong practical application value.
Regarding the reasons for the insignificant independent effects of spacing coefficient and enclosure degree, this study believes there are two main points: 1. The parameter ranges set in this study (spacing coefficient 0.9–1.1, enclosure degree 0.3–0.7) are all within the allowable ranges of current national standards, and residential districts in Lanzhou generally adopt high-density layouts, resulting in limited amplitude of parameter changes. 2. The shielding effect of the north and south mountains of the valley weakens the influence of a single parameter on the overall wind field. However, two-factor interaction analysis shows that the combination of these two parameters with building orientation will significantly affect the wind environment, so they still need to be valued in planning and design.

6.2. Research Limitations

6.2.1. Limitations of Research Methods

This study adopted the L9(34) orthogonal experimental design, which has the advantages of fewer experiments, high efficiency and strong representativeness in multi-factor and multi-level comparisons. It can quickly screen key influencing factors and optimal parameter combinations with less simulation workload, which is suitable for the preliminary exploratory needs of this study. However, it also has obvious limitations: the standard orthogonal array cannot cover all 27 factor combinations and cannot fully reveal three-factor and higher-order interaction effects. Therefore, the conclusions drawn mainly reflect the independent main effects and partial second-order interaction effects of each factor, and the more complex multi-factor coupling mechanism still needs to be further studied through full factorial experiments, response surface methodology or iterative numerical simulation. The conclusions of this paper can provide priority control indicators and quantitative intervals for planning and design, and leave an interface for subsequent research on higher-order interaction effects.

6.2.2. Limitations of Research Content

This study still has the following limitations: 1. The regulatory effects of vegetation and water bodies on the wind environment were not considered, and subsequent studies can supplement the research on the coupling between green space layout and wind environment. 2. The specific impact of wind environment on building energy consumption was not quantitatively analyzed, and subsequent studies can supplement energy consumption simulation to improve the research system. 3. The optimization strategies are mainly aimed at new residential districts, and their applicability to the renovation of existing residential districts needs further study.

6.2.3. Sensitivity Analysis and Uncertainty Discussion

The three parameters selected in this study, namely building orientation, building spacing coefficient, and residential district enclosure degree, are the standard core parameters for research on the wind environment of residential districts in cold-region cities, and their rationality has been confirmed by a large number of representative studies published in journals such as Buildings and Sustainability. Among them, building orientation is the primary regulatory factor for the wind environment in valley-type cities, while the spacing coefficient and enclosure degree are key indicators for balancing daylighting and ventilation, and controlling airflow inflow and outflow efficiency, respectively [5,8].
The uncertainties of this study mainly originate from the following aspects: 1. Numerical errors inherent in CFD simulation, including grid discretization errors, turbulence model errors, etc. 2. Uncertainties in input parameters, such as the representativeness of meteorological data. 3. Errors caused by model simplification, such as ignoring the influences of vegetation and topographic details. Despite the above uncertainties, the errors in this study are controlled within an acceptable range, and the research results have high reliability and reference value.

6.3. Implementability of Optimization Strategies

Aiming at the implementability issue of the “10° east of south” orientation in actual planning, this study proposes the following hierarchical solutions:
For new residential districts: clarify the control requirements for building orientation at the stage of regulatory detailed planning, allow a reasonable deviation of ±5°, and conduct comprehensive coordination in combination with daylighting standards;
For the renovation of existing residential districts: do not require building rotation, but compensate for the deficiency of orientation by adjusting the layout of building clusters, adding windbreak structures, and optimizing ventilation corridors.

7. Conclusions

Taking Hongyun Runyuan Residential District in Lanzhou as a case study, this study systematically investigates the effects of three core spatial morphological parameters (building orientation, spacing coefficient, and enclosure degree) on the wind environment of residential districts in cold-region valley-type cities by adopting a combined method of orthogonal experimental design and CFD numerical simulation. The main conclusions are as follows:
  • Building orientation is the core dominant factor affecting the winter wind environment of residential districts in cold-region valley-type cities, exerting an extremely significant effect (p = 0.006). Within the parameter ranges set in this study (spacing coefficient: 0.9–1.1, enclosure degree: 0.3–0.7), the independent effects of building spacing coefficient and enclosure degree are not significant (all p > 0.05).
  • The optimal spatial form combination for residential districts in cold-region valley-type cities is: 10° east of south orientation, 1.1 spacing coefficient, and 0.3 enclosure degree. This scheme features uniform wind speed distribution without large-area calm zones or strong wind zones, can effectively meet the winter wind protection demand, and achieves the best comprehensive wind environment quality.
  • According to the topographic and climatic characteristics of the cold-region valley in Lanzhou, a quantitative optimization strategy is proposed, which takes building orientation optimization as the core, and is supported by building spacing control, residential district enclosure degree regulation, and group layout optimization. The optimal value range of each parameter is clarified, which can provide a scientific basis for wind environment-friendly planning and design of residential districts in cold-region valley-type cities.

Author Contributions

Conceptualization, P.C. and S.J.; methodology, P.C. and S.J.; software, S.J. and C.Z.; validation, S.J.; formal analysis, P.C., C.Z. and S.J.; investigation, P.C. and S.J.; resources, P.C. and S.J.; data curation, S.J. and C.Z.; writing—original draft preparation, S.J.; writing—review and editing, P.C. and C.Z.; visualization, S.J.; supervision, P.C.; project administration, P.C.; funding acquisition, P.C. All authors have read and agreed to the published version of the manuscript.

Funding

This research was funded by the Gansu Provincial Science and Technology Department. The project title is: “Study on Microclimate and Energy Consumption Simulation Optimization of Residential Space in Lanzhou under Low-Carbon Target”, grant number No. 26YFFA044.

Data Availability Statement

The original contributions presented in the study are included in the article, further inquiries can be directed to the corresponding author.

Conflicts of Interest

The authors declare no conflicts of interest.

References

  1. Liu, Z.; Li, J.; Xi, T. A Review of Thermal Comfort Evaluation and Improvement in Urban Outdoor Spaces. Buildings 2023, 13, 3050. [Google Scholar] [CrossRef]
  2. Fumihiko, S. Shrinkage Does Not Follow Population Decline on a Regional Scale: Planning and Reality of Residential Area in Japan. Land 2024, 13, 1543. [Google Scholar] [CrossRef]
  3. Fang, H.; Ji, X.; Wang, J.; Lu, J.; Yang, M.; Li, J.; Duan, Z. Numerical Simulation and Optimization of Outdoor Wind Environment in High-Rise Buildings Zone of Xuzhou City. Buildings 2025, 15, 264. [Google Scholar] [CrossRef]
  4. Wang, Z.; Huang, T.; Wang, Y.; Dai, S.; Zeng, Y.; Chen, J.; Tang, F. Evaluation of the Impact of Courtyard Layout on Wind Effects on Coastal Traditional Settlements. Land 2024, 13, 1813. [Google Scholar] [CrossRef]
  5. Lu, M.; Song, D.; Shi, D.; Liu, J.; Wang, L. Effect of High-Rise Residential Building Layout on the Spatial Vertical Wind Environment in Harbin, China. Buildings 2022, 12, 705. [Google Scholar] [CrossRef]
  6. Zuo, C.; Liang, C.; Chen, J.; Xi, R.; Zhang, J. Machine Learning-Based Urban Renovation Design for Improving Wind Environment: A Case Study in Xi’an, China. Land 2023, 12, 739. [Google Scholar] [CrossRef]
  7. Tian, L.; Peng, C. Countermeasures for Improving the Outdoor Wind Environment of Residential Areas in Lanzhou Region Based on CFD Simulation. Sci. Technol. Ind. 2024, 24, 264–269. [Google Scholar] [CrossRef]
  8. Xi, Z.; Liang, W.; Tian, Z. Simulation of Convective Heat Transfer on Exterior Wall Surfaces of Row-Type Residential Buildings in Valley Cities Under Multi-Directional Wind Environment: A Case Study of Xining City. Build. Sci. 2020, 36, 174–179+188. [Google Scholar] [CrossRef]
  9. Rotach, M.W.; Vogt, R.; Bernhofer, C.; Batchvarova, E.; Christen, A.; Clappier, A.; Feddersen, B.; Gryning, S.E.; Martucci, G.; Mayer, H.; et al. Urban boundary layer characteristics in a valley city: The Basel Urban Boundary Layer Experiment (BUBBLE). Bound. Layer Meteorol. 2005, 116, 375–405. [Google Scholar] [CrossRef]
  10. Zhao, L.; Zhang, Y.; Li, Y.; Feng, Z.; Wang, Y. Correlations of Spatial Form Characteristics on Wind–Thermal Environment in Hill-Neighboring Blocks. Sustainability 2024, 16, 2203. [Google Scholar] [CrossRef]
  11. Zhu, W.; Zhang, Q. Study on spatial morphology of cold area settlements based on microclimate parameterized model. Adv. Eng. Technol. Res. 2022, 2, 400. [Google Scholar] [CrossRef]
  12. Li, K.; Xia, T.; Li, W. Evaluation of Subjective Feelings of Outdoor Thermal Comfort in Residential Areas: A Case Study of Wuhan. Buildings 2021, 11, 389. [Google Scholar] [CrossRef]
  13. Ji, H.; Li, Y.; Li, J.; Ding, W. A Novel Quantitative Approach to the Spatial Configuration of Urban Streets Based on Local Wind Environment. Land 2023, 12, 2102. [Google Scholar] [CrossRef]
  14. Zhang, D.Y.; Yang, L.; Feng, L.Y.; Liu, J.; Hong, X.C. Optimizing Green Spaces Significantly Improves Wind Environment and Accessibility in County Towns. Land 2025, 14, 730. [Google Scholar] [CrossRef]
  15. Ye, Z.; Zhou, D.; Xu, Y. Planning Strategies for Large-Scale Residential Areas in Xi’an City Based on Wind Environment Evaluation. Planners 2016, 32, 112–117. [Google Scholar] [CrossRef]
  16. Cao, P.; Li, T. Optimization Study of Outdoor Activity Space Wind Environment in Residential Areas Based on Spatial Syntax and Computational Fluid Dynamics Simulation. Sustainability 2024, 16, 7322. [Google Scholar] [CrossRef]
  17. Zhao, Z.; Zhang, S.; Peng, Y. Analysis of Winter Environment Based on CFD Simulation: A Case Study of Long–Hu Sand Feng Shui Layout at Jiangxi Bailudong Academy Complex. Buildings 2023, 13, 1101. [Google Scholar] [CrossRef]
  18. Zhang, J.; Zhang, X. Pedestrian-Level Wind Environment Assessment of Shenyang’s Residential Areas through Numerical Simulations. Sustainability 2021, 14, 380. [Google Scholar] [CrossRef]
  19. Fan, L.; Ren, S.; Ma, Y.; Liu, Q. The Coupling Relationship between Building Morphology and Outdoor Wind Environment in the High-Rise Dormitory Area in China. Energies 2023, 16, 3655. [Google Scholar] [CrossRef]
  20. Xue, S.; Chao, X.; Wang, K.; Wang, J.; Xu, J.; Liu, M.; Ma, Y. Impact of Canopy Coverage and Morphological Characteristics of Trees in Urban Park on Summer Thermal Comfort Based on Orthogonal Experiment Design: A Case Study of Lvyin Park in Zhengzhou, China. Forests 2023, 14, 2098. [Google Scholar] [CrossRef]
  21. Al-Kharusi, G.; Dunne, N.J.; Little, S.; Levingstone, T.J. The Role of Machine Learning and Design of Experiments in the Advancement of Biomaterial and Tissue Engineering Research. Bioengineering 2022, 9, 561. [Google Scholar] [CrossRef] [PubMed]
  22. Zheng, J.; Zhang, H.; Liu, Z.; Zheng, B. Research on Microclimate Performance Simulation Application and Scheme Optimization in Traditional Neighborhood Renewal—A Case Study of Donghuali District, Foshan City. Sustainability 2024, 16, 1899. [Google Scholar] [CrossRef]
  23. Bereitschaft, B.; Scheller, D. How Might the COVID-19 Pandemic Affect 21st Century Urban Design, Planning, and Development? Urban Sci. 2020, 4, 56. [Google Scholar] [CrossRef]
  24. Xue, Y.; Hong, L.; Qing, S. Research on Optimization Strategies of Wind Environment in High-Rise Residential Areas. Ind. Constr. 2013, 43, 9–11. [Google Scholar]
  25. Bert, B. Computational Fluid Dynamics for urban physics: Importance, scales, possibilities, limitations and ten tips and tricks towards accurate and reliable simulations. Build. Environ. 2015, 91, 219–245. [Google Scholar] [CrossRef]
  26. Blocken, B.; Stathopoulos, T.; van Beeck, J.P.A. Pedestrian-level wind conditions around buildings: Review of wind-tunnel and CFD techniques and their accuracy. J. Wind. Eng. Ind. Aerodyn. 2016, 156, 124–157. [Google Scholar] [CrossRef]
  27. Yang, Y.; Jin, X.; Yang, L.; Hai, J.; Xu, M.; Zong, Z. Research on Simulation and Optimization Design of Pedestrian Wind Environment in High-Rise Building Complexes. Build. Sci. 2011, 27, 4–8. [Google Scholar] [CrossRef]
  28. Abdelrahman, M.; Sherif, A.I.; Hany, M.A.K.; Mohamed, A.B. Examining the pedestrian-level wind environment around high-rise buildings using CFD simulations. Effect of Height and Shape. IOP Conf. Ser. Earth Environ. Sci. 2025, 1530, 012013. [Google Scholar] [CrossRef]
  29. Feng, Y. Investigating wintertime pedestrian wind environment and user perception in dense residential neighbourhood in a city of hot-summer and cold-winter climate zone, China. Indoor Built Environ. 2017, 26, 392–408. [Google Scholar] [CrossRef]
  30. Ruo, L.; Jun, C. Numerical Simulation of the Relationship Between Plane Layout of High-Rise Buildings and Wind Environment. Build. Struct. 2021, 51, 1757–1762. [Google Scholar]
  31. Peng, Z.; Chen, Y.; Deng, W.; Lun, I.Y.F.; Jiang, N.; Lv, G.; Zhou, T. An Experimental and Numerical Study of the Winter Outdoor Wind Environment in High-Rise Residential Complexes in a Coastal City in Northern China. Buildings 2022, 12, 2011. [Google Scholar] [CrossRef]
  32. Chen, X.; Hu, H.; Xu, Z.; Wu, Z.; Ma, R.; Wang, X. Wind comfort criteria and numbers of wind directions: The dual impact mechanism on pedestrian wind comfort evaluation in Qingdao, China. Build. Environ. 2025, 280, 113103. [Google Scholar] [CrossRef]
  33. GB 50009-2012; Load Code for Building Structures. Ministry of Housing and Urban-Rural Development of the People’s Republic of China, China Architecture & Building Press: Beijing, China, 2012.
  34. JGJ/T 449-2018; Standard for Testing and Evaluation of Building Ventilation Effect. Ministry of Housing and Urban-Rural Development of the People’s Republic of China, China Architecture & Building Press: Beijing, China, 2018.
  35. Franke, J.; Hellsten, A.; Schlünzen, H.; Carissimo, B. The COST 732 Best Practice Guideline for CFD simulation of flows in the urban environment: A summary. Int. J. Environ. Pollut. 2011, 44, 419–427. [Google Scholar] [CrossRef]
  36. GB/T 50378-2019; Assessment Standard for Green Building. Ministry of Housing and Urban-Rural Development of the People’s Republic of China, China Architecture & Building Press: Beijing, China, 2019.
  37. Wu, F.; Wang, Z.; Miao, S.; Xu, C.; Sun, C.; Chen, C. Optimization Strategies of Urban Design Based on Microclimate Environment Improvement: A Case Study of Wanping City in Beijing. Urban Dev. Stud. 2022, 29, 34–40. [Google Scholar] [CrossRef]
  38. Ji, S.; Wu, Z.; Xi, K.; Huan, T.; Yan, L. Research on Energy-Saving Planning and Design of Multi-Story Residential Areas in Cold Regions Based on Multi-Factor Coupling of Wind, Solar and Energy Consumption. Build. Energy Effic. 2024, 52, 161–169. [Google Scholar] [CrossRef]
  39. GB 50180-2018; Standard for Urban Residential Area Planning and Design. Ministry of Housing and Urban-Rural Development of the People’s Republic of China, China Architecture & Building Press: Beijing, China, 2018.
  40. Javanroodi, K.; Nik, V.M. Impacts of Microclimate Conditions on the Energy Performance of Buildings in Urban Areas. Buildings 2019, 9, 189. [Google Scholar] [CrossRef]
Figure 1. Research area.
Buildings 16 02080 g001
Figure 2. Annual wind rose diagram of Lanzhou City [16].
Buildings 16 02080 g002
Figure 3. Research object.
Buildings 16 02080 g003
Figure 4. 3D scatter distribution characteristics of building dispersion, building density and residential enclosure degree.
Buildings 16 02080 g004
Figure 5. Identification of building ventilation potential.
Buildings 16 02080 g005
Figure 6. Identification of potential ventilation corridors.
Buildings 16 02080 g006
Figure 7. Mesh generation of the computational domain.
Buildings 16 02080 g007
Figure 8. Schematic diagram of the orthogonal test scheme models.
Buildings 16 02080 g008
Figure 9. Cloud charts of wind speed and wind pressure distribution in the residential district in summer. (a) Cloud chart of summer wind speed distribution. (b) Cloud chart of summer wind pressure distribution.
Buildings 16 02080 g009
Figure 10. Cloud charts of wind speed and wind pressure distribution in the residential district in winter. (a) Cloud chart of winter wind speed distribution. (b) Cloud chart of winter wind pressure distribution.
Buildings 16 02080 g010
Figure 11. Winter wind environment simulation contour maps of Scheme 1, Scheme 2 and Scheme 3 at 1.5 m above ground level.
Buildings 16 02080 g011
Figure 12. Winter wind environment simulation contour maps of Scheme 4, Scheme 5 and Scheme 6 at 1.5 m above ground level.
Buildings 16 02080 g012
Figure 13. Winter wind environment simulation contour maps of Scheme 7, Scheme 8 and Scheme 9 at 1.5 m above ground level.
Buildings 16 02080 g013
Figure 14. Optimization plan average wind speed trend bar chart.
Buildings 16 02080 g014
Figure 15. Violin plots of wind speed distribution at pedestrian height in winter under different levels of spatial morphological factors.
Buildings 16 02080 g015
Figure 16. Relationship analysis diagram between levels of each influencing factor and evaluation indexes.
Buildings 16 02080 g016
Figure 17. Schematic diagram of building orientation optimization.
Buildings 16 02080 g017
Figure 18. Schematic diagram of residential layout patterns.
Buildings 16 02080 g018
Figure 19. Schematic diagram of enclosure degree interface optimization.
Buildings 16 02080 g019
Table 1. Pedestrian wind comfort criteria [38].
Wind Speed (m/s)BeaufortHuman Perception and ImpactWalking Restriction Degree
<1.50–1 Beaufort Scale (Calm–Light Air)No perceptible wind; summer stuffiness.No restriction; suitable for long stay.
1.5–3.32 Beaufort Scale (Light Breeze)Gentle face breeze; comfortable.Walking-friendly; optimal activity wind speed.
3.4–5.43 Beaufort Scale (Gentle Breeze)Leaves rustle; clothing sways slightly.Generally comfortable; discomfort risk with long exposure.
5.5–7.94 Beaufort Scale (Moderate Breeze)Noticeable wind resistance; slight extra effort for walking.Posture adjustment needed; umbrella-holding difficulty.
8.0–10.75 Beaufort Scale (Fresh Breeze)Headwind walking difficulty; flying dust and debris.Notable discomfort; head bowing for wind shelter.
>10.8≥6 Beaufort Scale (Strong Wind)Balance difficulty; safety risks.Dangerous; avoid outdoor activities.
Table 2. Influencing factors of the L9(34) orthogonal array.
ItemLevel
123
Impact FactorBuilding Orientation10° West of SouthDue South10° East of South
Spacing-to-Height Ratio0.91.01.1
Residential District Enclosure Degree0.30.50.7
Table 3. Numerical simulation cases of the L9(34) orthogonal array.
SchemeBuilding OrientationSpacing-to-Height RatioResidential District Enclosure Degree
1113
2122
3131
4213
5222
6231
7313
8322
9331
Table 4. Preprocessing of the arithmetic mean of wind speed for each case.
VariableNMinMaxMeanStandard DeviationMedian
v ¯ 90.6780.6820.680.0020.679
Table 5. Single-factor analysis.
CharacteristicCharacteristicNumber of Cases (n)Score
( k ¯ ± s)
Sum of SquaresDegree of
Freedom
Mean SquareTest Statisticp Value
A (Building Orientation: 1 = S10° W, 2 = Due S, 3 = S10° E)130.68 ± 0.000.00002420.000012F = 13.40.006 **
230.68 ± 0.00
330.68 ± 0.00
B (S/H Ratio: 1 = 0.9, 2 = 1.0, 3 = 1.1)130.68 ± 0.000.000000320.00000015F = 0.1540.861
230.68 ± 0.00
330.68 ± 0.00
C (Enclosure Ratio: 1 = 0.3, 2 = 0.5, 3 = 0.7)130.68 ± 0.000.000000320.00000015F = 0.1540.861
230.68 ± 0.00
330.68 ± 0.00
Note: Analyzed characteristics: 3. ** p < 0.01. Statistical methods: Student’s v-test was used for comparison between two groups, and one-way analysis of variance (ANOVA) was used for comparison among three or more groups.
Table 6. Coefficient of non-uniformity for each case.
SchemeOriginal123456789
k v 0.7860.3940.3720.3840.3230.2950.2790.2640.2460.229
Table 7. Level totals (K values) for each influencing factor.
Factor k 1 k 2 k 3
A1.1500.8970.739
B0.9810.9130.892
C0.8920.9130.981
Table 8. Arithmetic mean of K values of each factor.
Factor k 1 ¯ k 2 ¯ k 3 ¯
A0.3830.2990.246
B0.3270.3040.297
C0.2970.3040.327
Disclaimer/Publisher’s Note: The statements, opinions and data contained in all publications are solely those of the individual author(s) and contributor(s) and not of MDPI and/or the editor(s). MDPI and/or the editor(s) disclaim responsibility for any injury to people or property resulting from any ideas, methods, instructions or products referred to in the content.