


Abstract
With global warming and the increasing frequency of extreme heat events, heat health risk assessment (HHRA) has become a critical topic in climate change studies. However, the study themes, methods, and governance orientation of HHRA vary significantly across spatial scales, limiting the comparability and practical integration of assessment outcomes. This study conducts a review of the HHRA literature from 2007 to 2025, analyzing publication trends and evolving research paradigms. The results indicate the following: (1) rapid growth in the field with a notable shift from identifying static vulnerabilities to adopting “Hazard–Exposure–Vulnerability–Adaptability” (HEVA) frameworks, particularly at the micro-scale; (2) a clear scale-dependent hierarchy in assessment focus, where macro-scale studies identify regional trends, meso-scale research targets urban spatial heterogeneity and green–blue infrastructure, and micro-scale assessments emphasize housing conditions and individual perceptions; and (3) machine learning has been widely applied to capture complex nonlinear mechanisms and threshold effects. Finally, this study further emphasizes the importance of establishing a full-process feedback mechanism from macro-level early warning to meso-scale planning and micro-scale intervention, bridging the gap between regional policy and community-level action and providing a theoretical foundation for building climate-resilient cities.
1. Introduction
Global warming has significantly increased the frequency and intensity of heat waves and extreme heat events. Meanwhile, rapid urbanization has further exacerbated urban thermal environment problems. According to the Intergovernmental Panel on Climate Change (IPCC) 2023 report, the global average temperature in 2021 rose by 1.1 °C compared to pre-industrial levels, and temperatures will continue to rise in the coming decades [1]. Furthermore, global urbanization is still accelerating. Currently, more than half of the world’s population lives in urban areas [2], and this proportion is predicted to reach 68% by 2050 [3,4,5]. The combined effects of global warming and rapid urbanization will continue to exacerbate the risk of human exposure to heat stress and lead to more complex health risks.
Extreme heat events pose both direct and indirect risks to human health [6]. On the one hand, they can lead to heat-related illnesses such as heatstroke and heat exhaustion; on the other hand, they can exacerbate chronic diseases, such as cardiovascular and respiratory illnesses, leading to an increase in mortality rates [7]. In addition, prolonged exposure to high temperatures is associated with adverse mental health consequences such as anxiety and depression [8,9]. These risks are particularly pronounced among heat-sensitive populations such as the elderly (≥65 years), young children (≤5 years), those with chronic diseases, and outdoor workers [10]. Currently, at least 3.3 billion people, approximately 40% of the world’s population, are classified as highly vulnerable to heat-related risks, with developing countries being the most severely impacted [11]. Furthermore, significant differences exist in the degree of exposure and vulnerability among different population groups, resulting in noticeable socio-spatial heterogeneity in heat-related hazards. Therefore, heat health risk assessment (HHRA) is becoming increasingly important for understanding and mitigating the impacts of extreme heat. Against this background, HHRA has become a topic of common concern across multiple disciplines, including environmental science, geography, urban planning, and public health. With the deepening integration of these fields, evaluation methods are becoming increasingly diversified. In the field of geography and urban planning, HHRA is primarily conducted through composite indices such as the Heat Vulnerability Index (HVI) and Heat Risk Index (HRI), which integrate climate conditions, population characteristics, and urban environment factors [11,12,13]. The conceptual foundation of these indices is closely related to the evolution of risk and vulnerability frameworks proposed by the IPCC.
In the IPCC Third Assessment Report [14], vulnerability was defined as a function of the exposure to climatic impacts, system sensitivity, and adaptive capacity, which laid the foundation for subsequent risk-oriented analyses. Based on this, the Fourth Assessment Report introduced a risk management perspective by emphasizing the integrated roles of impacts, adaptation, and mitigation [15]. Then, a major conceptual structure, “hazard–exposure–vulnerability”, was proposed in the Fifth Assessment Report [16], which is consistent with the Crichton Risk Triangle [17], and established a widely adopted framework for climate risk assessment. The Sixth Assessment Report further refined this framework by clarifying that vulnerability is both a component of risk as well as an important independent analytical dimension. Additionally, the report also highlighted the growing importance of adaptation capacity and response mechanisms [11]. These developments have greatly promoted the development of HHRA. Under this evolving theoretical context, the HRI has been increasingly applied to characterize thermal environmental risks, while the HVI has developed into a comprehensive index integrating exposure, sensitivity, and adaptive capacity [18], reflecting a more systematic understanding of human heat risk.
According to the IPCC framework, in thermal environment studies, heat health risk (hereinafter referred to as “risk” or “the risk”) refers to the potential negative consequences of extreme heat events on humans or ecosystems [15]. Within this framework, hazard refers to extreme heat events that endanger life or health. Exposure describes the degree to which individuals or populations are in contact with such hazards [19]. Vulnerability reflects the tendency of individuals or groups to be adversely affected by extreme heat, encompassing multiple dimensions, including sensitivity (or susceptibility) and adaptability [4,16]. Sensitivity represents the inherent susceptibility of individuals to heat-related hazards, while adaptability refers to the capacity to deal with or recover from the impact of heat-related stress or illness. Adaptability is often considered as a moderating factor that offsets vulnerability by reducing sensitivity [20].
Current studies and literature reviews on HHRA primarily focus on several key aspects, including the definition of heat waves, the composition of assessment frameworks, and their practical applications and development, as well as the establishment and classification of indicator systems [21,22]. However, the risks posed by extreme heat events exhibit strong spatial variability and involve complex interactions across both local and global scales, as well as within individual regions [11]. Research themes, key concerns, and the selection of indicators, frameworks, and methods vary across different spatial scales, potentially leading to divergent conclusions. For example, at the meso-scale, Shanghai demonstrates a high concentration of heat health risk within the Yangtze River Delta, whereas at the macro-scale, intra-urban risk inequality appears less pronounced [23]. A multiscale assessment of Zhengzhou demonstrates a significant scale effect in HHRA; the higher the spatial scale, the stronger the heterogeneity [24]. Furthermore, since the goal of HHRA is to support policymaking, the spatial scale plays a crucial role in shaping governance priorities and intervention strategies. Macro-scale assessments can identify national or regional heat risk patterns, support the designation of priority areas, and provide evidence for early warning systems and resource allocation. Meso-scale assessments can translate broad risk patterns into urban planning and governance actions, such as optimizing land use, public service distribution, green–blue infrastructure, and emergency response capacity. Micro-scale assessments can further identify vulnerable communities, daily exposure environments, and specific intervention targets, thereby supporting more precise public health protection and community-level adaptation. Therefore, multiscale HHRA is not only a methodological issue but also a necessary basis for establishing a hierarchical governance system from national policy formulation to local implementation; a systematic review of HHRA studies at different spatial scales is necessary.
Recent studies have increasingly focused on the spatial scale classification of HHRA. For example, Ye et al.’s systematic review defines the macro-scale as the national and urban agglomeration levels, the regional scale as the provincial, metropolitan, and city levels, and the local scale as the community and street levels, while also advocating the incorporation of residential indoor thermal environments into local-scale HHRA [21]. Gong et al. define the macro-perspective as the national scale, individual city-level areas such as census areas, administrative divisions, and studies based on local climate zones (LCZs) as the city scale, and finally the community scale as the smallest analytical scale [25]. However, their study does not involve cross-scale comparisons. Liu et al. conducted a long-term spatiotemporal analysis of heat health risk across regional, provincial, and city scales, but did not address the micro-scale [26].
Unlike existing review studies that only call for attention to scale or focus on the identification of environmental factors at specific scales, and empirical studies that merely use scale as research background, this approach differs from other approaches by adopting a more widely accepted classification framework. The study defines the macro-scale as nations, regions, urban agglomerations, and provinces (or states); the meso-scale as cities, counties, and districts; and the micro-scale as census areas, sub-districts, townships, towns, streets, blocks, communities, and neighborhoods [27]. This study has achieved a systematic improvement in the evaluation perspective and made key additions in terms of the breadth and depth of the research. Based on this classification, this study aims to systematically review the current status and development trends of HHRA from a multiscale perspective. The main objectives are as follows: (1) To analyze the overall development trend of HHRA research by examining the temporal trends, disciplinary distribution, and geographical distribution. (2) To comparatively evaluate the differences across spatial scales in terms of assessment frameworks, indicator selection, methodological approaches, and risk governance strategies. (3) To identify the characteristics and limitations of current studies at different scales through cross-scale analysis, and propose future directions for HHRA optimization, to provide a theoretical foundation for improving urban resilience to extreme climate events.
2. Materials and Methods
2.1. Literature Screening
This review followed the Preferred Reporting Items for Systematic reviews and Meta-analyses (PRISMA) guidelines, as shown in Figure 1. The study selected high-impact databases such as the SSCI (Social Sciences Citation Index), SCI-EXPANDED, AHCI (Science Citation Index Extended), and ESCI, databases covered by the core collection of WOS, ensuring the completeness and high quality of the article data. Our search terms were TS = (Heat* risk assessment OR vulnerability assessment). The initial search yielded 2373 articles. Considering that the IPCC explicitly proposed the perspective of “risk management” in its 2007 Fourth Assessment Report, the temporal scope of this review was restricted from 2007 to 2025. After removing duplication, the number of articles was reduced to 1950. Then, more detailed screening was conducted based on the following criteria to ensure the quality and relevance of the selected studies. The inclusion criteria were as follows: (1) empirical studies using the HRI or HVI assessment frameworks, (2) studies explicitly describing relevant conceptual definitions; and (3) studies focusing on outdoor thermal environments. The exclusion criteria included: (1) non-empirical studies; (2) studies that were not consistent with the research topic, or studies that were related to the topic but did not adopt the HRI or HVI assessment frameworks, or focused only on a single factor; and (3) studies not targeting human subjects, such as those on air pollution, floods, indoor thermal environments, animals, microorganisms, or chemical composition. Based on the above criteria, an initial screening of titles and abstracts was conducted, with 1783 irrelevant articles excluded. Then, full-text screening was performed to further assess the eligibility of the remaining studies; one author conducted the initial full-text assessment, while another author reviewed and verified the results. In addition, the JBI critical appraisal checklist was used as a reference to evaluate the methodological quality of the literature and to ensure the reliability of the research findings [28]. As a result, 81 articles were excluded during the full-text screening stage, and 86 articles were ultimately included in this review. Furthermore, the reference lists of the included studies were cross-checked to avoid omitting potentially relevant literature.
Figure 1.
Literature search and screening process.
2.2. Content Extraction and Analysis
To systematically analyze existing studies, the following key information was extracted from each study: (1) basic information including publication year and journal; (2) geographical information such as study area, country, and spatial scale; (3) assessment framework and indicator selection; (4) methodological approaches; and (5) main conclusions and governance strategies. Considering that relevant studies cover multiple spatial scales, and that scale differences profoundly influence the mechanism of the heat health risk, this study adopts spatial scale as the core classification dimension. Accordingly, the retrieved articles were organized into four categories: macro-scale, meso-scale, micro-scale, and cross-scale integration.
3. Results
3.1. Features of All Selected Articles
3.1.1. Publication Trends and Disciplinary Distribution of Key Journals
Figure 2 shows the publication trends of studies related to HHRA. Overall, the number of publications shows an upward trend. Between 2011 and 2017, the number of studies remained relatively limited, but preliminary explorations of HHRA had begun. From 2018 to 2022, the number of publications increased slightly. After 2023, the number of publications grew rapidly, indicating that HHRA has received increasing attention in recent years.
Figure 2.
Trends in the number of related study publications.
Regarding the journals distribution (Figure 3), the highest number of articles published was Sustainable Cities and Society, with a total of 13 articles. The second group consists of Urban Climate and Science of the Total Environment, with nine and six articles, respectively. The remaining journals were each with 3–5 articles published. In addition, based on the disciplinary focus and thematic orientation of the journals, the publications can be broadly summarized into three categories: (1) Urban climate and sustainability, which emphasize the impacts of urban climate phenomena on urban systems and explore strategies for adaptation and mitigation through planning, design, and governance. There was a total of 25 related studies, accounting for about 29% of the studies included. (2) Environmental and public health perspectives focus on the effects of high temperatures on human health, particularly in terms of morbidity and mortality. This category includes 20 related articles, accounting for about 23% of the total included studies. (3) The spatial geography perspective focuses on the spatial distribution of heat-related risks, revealing geographical patterns and spatiotemporal heterogeneity.
Figure 3.
Distribution of publications across journals.
3.1.2. Geographic (Country-Level) Distribution and Scale
Figure 4a demonstrates the regional distribution, quantity, and proportion of relevant studies. It shows that HHRA-related research has been conducted across multiple countries worldwide, with Asia accounting for the most, followed by Europe and North America. Regarding the spatial scale (Figure 4b), the development of studies generally began in the order of micro-scale, meso-scale, macro-scale, and cross-scale, in 2011, 2014, 2019, and 2024, respectively. Overall, before 2022, the number of publications at each scale was relatively limited; after 2022, the number of publications increased significantly across all scales, especially at the micro-scale. This growth can be attributed to the advances in multi-source remote sensing technologies and the availability of high-resolution socioeconomic data, as well as the growing need to enhance urban thermal resilience. Micro-scale studies accounted for approximately 63.95% of the total studies, followed by meso-scale (19.77%), macro-scale (12.79%), and cross-scale (3.49%) studies (Figure 4c).
Figure 4.
Geographic (country) distribution and scale classification: (a) regional and national distribution of relevant study publications; (b) number of publications at different spatial scales; (c) proportion of different study frameworks.
3.2. Extraction and Classification of Assessment Frameworks, Indicators, Methods, and Governance Strategies
Through full-text screening, it was found that the assessment frameworks used in existing studies can be broadly divided into three types (Figure 5): (1) The HRI framework, which consists of three core components—hazard, exposure, and vulnerability [16]. (2) The HEVA framework, which separates adaptability from vulnerability within the analytical structure [29]. In this framework, vulnerability is more related to the sensitivity of the population, and it also appears in the form of HESA. This expanded framework consists of the development direction of the future risk assessment framework proposed in the AR6. (3) The HVI framework, which focuses on vulnerability as an independent structure, consisting of exposure, sensitivity, and adaptability [14,30].
Figure 5.
The risk conceptual frameworks: (a) HRI framework; (b) HVI framework; (c) HEVA framework, and the future framework in AR6.
This study further compiled the indicators adopted across different assessment frameworks and statistically analyzed their cumulative frequency of use. Considering that the HRI and HEVA frameworks usually include the hazard component, while the HVI framework does not define hazard as an independent dimension, the indicators for the HVI, HRI, and HEVA were compiled separately [20]. Due to the similarities between the HRI and HEVA frameworks, they were grouped together (HRI and HEVA), and their commonly used indicators were categorized into four dimensions: hazard, exposure, sensitivity, and adaptability. It should also be noted that indicators related to environmental characteristics and population structure are complex; therefore, the same type of indicator may simultaneously coexist in multiple components [21]. Existing studies have identified six main categories of indicators related to hazards: (1) intensity, frequency, and duration of heat waves or extreme heat events calculated based on temperature data [22]; (2) land surface temperature (LST) calculated based on remote sensing images [31]; (3) surface or atmospheric urban heat island intensity (SUHII/UHI) [32]; (4) meteorological indicators such as humidity, air quality, and wind speed, which are often used in combination with the first category [33,34]; (5) thermal comfort indicators such as the Universal Thermal Climate Index (UTCI), Physiological Equivalent Temperature (PET), Wet Bulb Globe Temperature (WBGT) and so on [35,36]; and (6) environmental characteristics that have a certain impact on LST, such as building density, floor area ratio, and land cover attributes [37,38,39,40]. Exposure indicators can generally be summarized into five categories: (1) population size; (2) population structure and occupation; (3) dynamic population distribution [41,42]; (4) environmental characteristics (including both two-dimensional and three-dimensional built environment intensity, as well as natural environmental elements); and (5) public infrastructure and housing conditions. Sensitivity indicators are primarily subdivided by population characteristics, including age (e.g., elderly population ≥ 65, children ≤ 14, etc.), gender, health condition, race, social isolation (e.g., unemployment, retirement, or living alone), and education level (illiteracy rate, etc.). Adaptability indicators typically include environmental characteristics, socioeconomic conditions, and education level (e.g., higher education rate) [43]. Among these, environmental characteristic indicators often include more factors and can be further divided into two main categories: built environment (e.g., construction intensity, housing conditions [44], and public infrastructure [45]) and natural environment [46].
The HVI framework is generally composed of three components: exposure, sensitivity, and adaptability. Since exposure in the HVI framework is usually defined based on the severity of heat hazards [47], indicators commonly used to represent hazard in the HRI and HEVA framework are often used to characterize exposure in the HVI framework, such as the intensity, frequency, duration of heat waves and extreme heat events, LST, meteorological indicators, and environmental characteristics. Furthermore, compared with the HRI and HEVA framework, the sensitivity indicators in the HVI framework incorporate a broader range of factors, including environmental characteristics, socioeconomic conditions, population size, population structure and population occupation. Consequently, there is an overlap between sensitivity, exposure, and adaptability indicators, meaning that a single type of indicator may appear across multiple components simultaneously. In addition, the adaptability indicators in the HVI framework may also include the capacity to access information, which is built upon those used in the HRI and HEVA frameworks.
Furthermore, to further clarify methodological differences across spatial scales, a systematic review of the specific methods used at four key stages of the assessment phase was conducted. These four stages are: (1) data collection and processing; (2) framework selection and indicator construction; (3) spatial analysis and correlation analysis; and (4) the formulation of mitigation and adaptation strategies.
3.3. Characteristics of Studies at Different Spatial Scales
3.3.1. Status of Studies on Heat Health Risk at the Macro-Scale
Macro-scale studies often focus on regions, countries, urban agglomerations, areas, and provinces (states), with an emphasis on temporal dynamics or spatial differences in the distribution of heat health risk. Regarding framework selection, approximately 63.6% of studies use the HRI framework, while 36.4% use the HVI framework, often assigning equal weights to the components within each framework. In terms of indicator selection, commonly used indicators are mostly national meteorological data and statistical data, generally treating the population as a homogeneous whole, with only a few studies considering health condition, gender ratio, etc. (Figure 6a). In addition, under the HVI framework, some indicators used to characterize heat hazards are often included in exposure, such as the intensity, frequency, and duration of heat waves and extreme heat events, as well as meteorological and thermal comfort indicators (Figure 6b).
Figure 6.
The scale heterogeneity plot of indicator selection under different assessment frameworks shows several types of indicators commonly used for each risk component in 86 studies. The bar chart and numbers represent the frequency of each indicator in studies at different scales. (a) HRI and HEVA framework; (b) HVI framework.
From a methodological perspective, existing studies have effectively revealed cross-regional risk differences through spatial analysis methods such as spatial autocorrelation (global/local Moran’s index) and hotspot detection (Getis–Ord Gi*). In addition, descriptive statistics and time series analysis are commonly employed to analyze the evolution patterns of long-term series (Figure 7) [48,49]. This study found that the conclusions of related studies generally highlight the spatial differentiation and long-term evolution patterns of heat health risk at the macro-scale. For example, Zeng et al. found that outdoor heat health risk in China exhibits a clear north–south gradient, with the risk level in high-risk areas continuously increasing over time [50]. In response to these empirical findings of spatial heterogeneity, a variety of macro-governance strategies have been proposed, such as national policy interventions, regional coordination, and spatial optimization of multiple development centers, aiming to address regional risk imbalances through resource allocation (Figure 8) [51].
Figure 7.
Study processes at different spatial scales.
Figure 8.
Risk governance strategies at different spatial scales.
3.3.2. Status of Studies on Heat Health Risk at the Meso-Scale
Meso-scale studies often focus on the spatial differentiation of heat health risk within cities, using individual cities, districts, or counties as the primary units of analysis [52]. Early studies in this domain mainly used the HVI framework, while studies using the HRI framework gradually increased after 2017. Overall, approximately 70.6% of studies used the HRI framework, while 23.5% used the HVI framework. Regarding the determination of indicator weights, methods such as equal weighting, a combination of subjective and objective methods, principal component analysis, and entropy weighting are commonly employed [53,54,55].
In terms of indicator selection (Figure 6), LST indicators acquired from remote sensing data have been widely used in assessing hazard, with related studies often employing multiple indicators simultaneously to characterize heat hazards. Simultaneously, studies utilize various environmental characteristic indicators to finely depict the exposure environment. Furthermore, we have found that many studies no longer treat the population as a homogeneous whole and place greater emphasis on using dynamic population distribution to accurately reflect the population exposure situation. For example, some studies have conducted HHRA for specific populations such as the elderly and outdoor workers; therefore, these studies also use population structure and occupational indicators such as elderly population density and the proportion of outdoor workers to characterize exposure [56].
In terms of analytical methods (Figure 7), traditional approaches such as Pearson correlation analysis, multiple linear regression, and geographically weighted regression are widely used to examine the relationships between indicators and heat health risk. In recent years, with the development of machine learning and deep learning, more and more studies have adopted models such as XGboost, Catboost, and LightGBM to explore the nonlinear relationships between risk and its driving factors [57,58]. Furthermore, previous research has shown that there are interconnections among different components of risk at the meso-scale; the mitigation and adaptation measures proposed in these studies often exhibit integrated effects [59]. For highly urbanized central areas, hazard and exposure are generally reduced through improving the urban environment, such as enhancing shading and applying cooling materials. In contrast, for less urbanized suburbs or rural areas, the adaptability is improved by optimizing urban spatial layout (e.g., green space combination, infrastructure provision, and resource allocation) and guiding functional planning (e.g., dispersing vulnerable populations) [60,61]. In addition, these studies also often focus on specific vulnerable groups and propose specific recommendations to reduce regional sensitivity or vulnerability (Figure 8).
3.3.3. Status of Studies on Heat Health Risk at the Micro-Scale
At the micro-scale, cities are often subdivided based on census areas, sub-districts, townships, towns, streets, blocks, communities, neighborhoods, or major roads segments to explore the risk levels and driving factors across different types of areas [62]. Regarding framework selection, approximately 65% of studies use the HRI framework, followed by the HVI framework in 25%. In addition to the weighting methods commonly used in macro-scale and meso-scale studies, weighting methods like the analytic hierarchy process (AHP) and CRITIC are also used to determine indicator weights [63,64,65,66]. To better examine the relationships between population attributes and external interventions, such as policies and environment conditions, some recent studies have advocated separating vulnerability into sensitivity and adaptability, leading to the use of the HEVA or HESA frameworks [66,67]. In this framework, vulnerability emphasizes population sensitivity. Adaptability is represented using indicators of socioeconomic conditions, the availability of public infrastructure, and natural resources. By decomposing vulnerability, these studies elevate adaptability from an implicit factor to an independent analytical dimension, allowing for the quantification of its corresponding indicators at a more refined scale, thus propelling HRI studies towards a more granular community scale.
Under the HRI and HEVA frameworks (Figure 6a), in addition to the LST, the intensity, frequency, and duration of heat waves and extreme heat events, as well as thermal comfort indicators, are widely used, reflecting the focus on human thermal comfort in micro-scale studies. Among sensitivity indicators, age is used most frequently, nearly twice as common as education level (ranked second), followed by social isolation and gender. For adaptability, socioeconomic conditions are the most widely used indicators, followed by housing conditions, natural environment and public infrastructure. Under the HVI framework (Figure 6b), micro-scale studies uniquely incorporate environmental indicators such as NDBI and road density in exposure.
Based on the findings of the methodology review, micro-scale studies employ a wider range of analytical approaches (Figure 7). For example, spatial autocorrelation analysis, geographically weighted regression, and the Gini coefficient are used to assess the equity of risk distribution, while spatial heterogeneity is explored based on dominant driving factors. In addition, linear regression-based models, such as correlation analysis, variance analysis, multiple linear regression, and ordinary least squares, are widely used to examine the relationships between indicators and risk [68]. In recent years, machine learning and deep learning methods have increasingly been applied to identify key driving factors, as well as their nonlinear relationships and threshold effects with risk indicators [69]. Based on this refined empirical evidence, strategies proposed at the micro-scale are more refined and generally have higher operability and implementability. For example, Liu et al. introduced a minimum area threshold of 0.25 km2 for green space planning at the community scale, and proposed accessibility standards of 1500 m and 530 m for blue and green infrastructure, respectively. By increasing the density of blue–green space nodes within this range, residents’ adaptability can be improved more directly by enhancing the cooling efficiency of community nodes [70].
3.3.4. Status of Studies on Heat Health Risk at the Cross-Scale
Single-scale studies often exhibit inconsistencies due to differences in spatial scale and analytical resolution. For example, an older neighborhood identified as high-risk at the city level may present relatively low risk when examined at the neighborhood scale. Similarly, at the inter-city scale, environmental and socioeconomic factors tend to play a dominant role, whereas within cities, factors such as local temperature conditions and the availability of medical resources have a more significant influence. These discrepancies suggest that single-scale analyses may either obscure local specificities or fail to capture broader, generalizable patterns. In recent years, some studies have begun to conduct cross-scale integrated HHRA studies (Table 1), aiming to develop mitigation and adaptation strategies across multiple spatial levels. To address scale mismatches, cross-scale studies typically define multiple spatial scales and frequently employ high-spatial-resolution data as an auxiliary means to resample mismatched data into a unified grid. Regarding data fusion methods, the HRI framework can effectively integrate different types of data. Zhang et al.’s research also employed a population-weighted exposure modeling approach, combining population distribution data with the Modified Thermal Humidity Index (MTHI) to quantitatively assess residents’ actual heat exposure risk [24]. Wu et al.’s research used a random forest (RF) model to fuse nighttime light data, land use and land cover data (LULC), the Digital Elevation Model (DEM), and road network density to estimate gridded population density [23]. Xie et al.’s research assessed the three components of heat health risk at the city level, while incorporating adaptation components at the old neighborhood level, using methods such as questionnaires, and matching more refined data in the adaptation assessment of old neighborhoods [4]. However, practical applications still face some bottlenecks. Obtaining refined data is difficult; currently, there is a lack of micro-data at the community, street, or household level, such as the outdoor activity time of vulnerable populations, which limits the development of more targeted and refined governance strategies. Furthermore, existing research indicates that spatial risk is influenced by the variable surface multi-regional adaptation problem (MAUP). Compared with single-scale studies, cross-scale research has yielded several distinctive insights, such as the finding that risk levels for the same area may vary across different scales, and that the key drivers of risk inequality differ depending on the scale of analysis. However, despite these advances, the number of cross-scale HHRA studies remains relatively limited, and a standardized assessment framework and methodological workflow have not yet been established.
Table 1.
Cross-scale fusion studies summary.
4. Discussion
4.1. Spatial Scale Profoundly Affects the Identification of Heat Health Risk
Spatial scale has a profound impact on the assessment logic of heat health risk. Existing studies have shown that the choice of scale largely determines the study’s subjects, analytical framework, indicator system, and ultimate governance orientation in the assessment process. With the continuous deepening of study perspectives, scholars have gradually realized that the heat health risk is not a phenomenon that can be fully described at a single scale, and the risk structure and intervention focus revealed by different scales are significantly variant.
Changes in spatial scale often alter the primary drivers of risk, even affecting the interpretation of the risk itself. At the macro-scale, heat health risk is usually interpreted through broad climatic gradients, regional development levels, and large-scale socioeconomic differences [71]. This is because macro-scale data are generally aggregated at national, provincial, or urban agglomeration levels, making them suitable for identifying long-term trends and regional inequalities but less capable of revealing local exposure pathways. At the meso-scale, studies are increasingly shifting towards intra-urban differentiation. Urban morphology, land use structure, public service accessibility, and the spatial distribution of vulnerable populations become more important because they directly shape the uneven distribution of heat exposure and adaptation resources within cities. This scale is more effective in revealing risk differences across different areas within a city. At the micro-scale, studies further refine the analysis to specific spatial units such as communities, street canyons, and residential environments. The risk is further reconstructed around community infrastructure, street environments, housing quality, local thermal comfort, and the daily activity environments of vulnerable groups. Therefore, areas identified as high-risk at the city scale may exhibit higher adaptability at the micro-scale due to better accessibility to medical facilities and blue–green spaces. Overall, the trend indicates that the focus of HHRA is shifting from regional averages to more refined characterization based on location and specific populations. The significant increase in the number of micro-scale studies observed in this review, as well as the emergence of cross-scale studies in recent years, indicates that the field is gradually moving towards downscaling and context-sensitive risk identification.
This cross-scale comparison also reveals several important trade-offs. Macro-scale assessments have strong comparability and broad policy relevance, but they may obscure neighborhood-level inequality and individual exposure differences. Micro-scale assessments provide more precise and actionable evidence for local intervention, but their findings are often difficult to generalize across cities or regions. Meso-scale studies can bridge regional strategy and local action, but they are highly sensitive to the choice of analytical units, such as administrative districts, grids, LCZs, or neighborhoods. However, the classification of spatial scales still lacks a unified and clearly defined standard. In the field of HHRA, there is no universal consensus on scale division. Existing studies often divide scales according to different logics, such as classification based on administrative districts, spatial area, or grid scales [72,73,74,75]. Some studies also use LCZs, streets, or communities as analytical units. Furthermore, in some studies, although the analysis is conducted at finer spatial scales, the conclusions are generalized to broader urban patterns, resulting in inconsistencies in scale interpretation. This ambiguity in classification logic not only affects the interpretation of results but also weakens the applicability of findings to planning practice.
Another trade-off exists between spatial coverage and exposure accuracy. In practical assessment processes, structural mismatches among data resolution, analytical units, and strategic targets remain a significant bottleneck restricting further development [76]. Population and socioeconomic variables are typically available only at census or administrative scales, while remote sensing technologies, although providing LST data over a wide area, still have a gap between their spatial resolution and the assessment of human thermal comfort. In contrast, data obtained from on-site sensors or wearable devices can more accurately reflect individual-level heat exposure, but their spatial coverage is limited and difficult to generalize to urban scales. This difference among data sources leads to inconsistencies in the scale of indicators in many current HHRA studies, making direct comparisons between study results difficult and limiting the ability of study conclusions to be translated into urban planning and public health policies [77].
Furthermore, a strong coupling exists between the spatial and temporal scales, which further increases the complexity of HHRA. For example, in micro-scale environments such as streets, urban canyons, or building complexes, risk often manifests as rapid fluctuations on diurnal or even hourly timescales [78], while at the macro-scale, changes in risk are more reflected in interannual or long-term climate trends. If the correspondence between the temporal and spatial scales is not properly addressed, even with spatial data alignment, it is difficult to accurately depict the true risk formation process. Therefore, cross-scale studies not only need to address the integration of spatial scales but also need to focus on temporal synchronization to improve the accuracy and interpretability of HHRA.
4.2. Studies on the Assessment Frameworks and Reconstruction of the Indicator Systems
Another important finding of this study is that the differences in assessment frameworks and indicator systems across different scales reflect a profound shift in how we perceive heat health risk. Current studies primarily rely on several typical assessment frameworks, including the HRI framework based on the hazard–exposure–vulnerability logic, the HVI framework centered on vulnerability assessment, and extended frameworks such as HEVA that separate adaptability from vulnerability. Although these frameworks share many indicators, they have different analytical emphases. Overall, the HRI framework is the most widely used, especially in meso-scale studies. By integrating heat hazards, population or environmental exposure, and socioeconomic vulnerability, the HRI is suitable for identifying the spatial distribution of overall heat health risk. The HVI framework is the second most commonly used framework and is more frequently applied in macro-scale vulnerability assessments. It focuses on identifying social or demographically vulnerable groups, but in practice, many HVI studies incorporate thermal environment indicators, such as LST, heatwave intensity, or thermal comfort indices, into the exposure dimension. This has led to increasing overlap between the HVI and HRI in empirical applications [79]. In contrast, HEVA and its variants are more often used in micro-scale and cross-scale studies. By separating adaptability from vulnerability, these frameworks allow researchers to evaluate the role of community resources, infrastructure, housing conditions, medical accessibility, and other adaptation-related factors more directly [80]. Therefore, framework selection should depend on both spatial scale and policy purpose. At the macro-scale, HRI or HVI frameworks can be used to support regional comparison, early warning, and strategic resource allocation, because large-scale studies often rely on standardized climatic, demographic, and socioeconomic indicators. At the meso-scale, the HRI is generally more suitable for linking intra-urban heat hazards with population distribution, land use, and service accessibility, thereby supporting urban planning and spatial governance. At the micro-scale, HEVA-type frameworks are more appropriate when the assessment aims to evaluate community-level intervention priorities, because adaptability-related indicators can be measured more specifically. This suggests that each indicator should be assigned according to its theoretical role in the risk formation process. For example, population density may represent exposure when it measures the number of people located in heat-prone areas, but it should not be treated as sensitivity unless it reflects the susceptibility of a particular population group. Similarly, green space can reduce hazard by lowering local temperature, but it can also enhance adaptability when it improves residents’ access to cooling resources. Clarifying such conceptual roles is essential for improving the comparability and policy relevance of HHRA studies.
This pattern indicates that HHRA studies are gradually shifting from simply identifying vulnerable populations to a more contextual understanding, that is, risk is formed through the interaction between disaster conditions, demographic characteristics, and environmental support systems. In early studies or large-scale assessments, indicators typically focused on macroeconomic variables such as climate background, population density, and broad socioeconomic factors. Their core objective was not to identify potential vulnerable groups, but rather to define regional risks. However, as study scales have become more refined, indicator systems have begun to incorporate more variables reflecting specific living environments and daily behavioral conditions, such as housing conditions, indoor bathing and sanitation facilities, per capita room area, road density, distance to medical facilities, accessibility to green spaces, and the availability of shading infrastructure [81]. Furthermore, greater attention is being paid to human comfort and physiological perception, with more studies incorporating human thermal comfort indicators such as PET and the UTCI. Simultaneously, with the emergence of new data sources such as mobile signaling data, social media data, and micro-sensors, some studies are also incorporating dynamic population distribution and real-time environmental data into their assessment systems, making risk identification more closely aligned with real-world scenarios.
However, different studies exhibit significant differences in classifying similar variables. For example, socioeconomic indicators, education level, occupation type, unemployment rate, or infrastructure accessibility may be categorized as components of exposure, sensitivity, vulnerability, or adaptability in different frameworks. This inconsistency in classification indicates a lack of unified conceptual standards for cross-scale indicator attribution. Therefore, even when studies use similar data sources, the resulting spatial patterns of risk and policy recommendations may differ significantly due to differing underlying conceptual models. Furthermore, overlapping or collinear effects often exist between various environmental and social variables, further complicating the identification of dominant risk factors. Therefore, future studies need to establish clearer indicator classification principles and reduce overlapping interference between indicators through statistical methods or theoretical frameworks.
Against this backdrop, constructing a hierarchical indicator system that combines standardization and flexibility is considered an important approach to bridging general HHRA with local governance practices. This system can consist of two types of indicators: one type comprises core indicators with clear concepts and high universality, used to reflect climate background, population structure, and basic socioeconomic conditions, thus ensuring the comparability of studies results across different regions; the other type consists of contextualized indicators selected based on regional environment, social structure, and urban development characteristics, to enhance the explanatory power of the assessment results for local issues. For example, in coastal cities, distance from the coastline or the impact of sea breezes can be included in the indicator system; in mountainous cities, topographical factors such as slope, aspect, or altitude can be considered; for cities with a high degree of aging, the distribution of elderly care facilities and the proportion of elderly people can be emphasized; and in cities rich in historical and cultural heritage, such as Madurai, Bilbao, Athens, or Rome, the preservation status of historical and religious buildings and their thermal environment conditions may also become important indicators [82]. This combination of standard indicators and contextual indicators can ensure comparability while improving the adaptability of assessment results to specific urban contexts. Therefore, establishing a scalable assessment framework and indicator system is a crucial foundation for achieving cross-scale HHRA. At the macro-scale and meso-scale, studies can prioritize the use of HRI or HVI frameworks to quickly identify regional risk and determine the correlation strength of major risk factors. At the micro-scale, frameworks such as HEVA can be used to conduct refined risk diagnosis for specific communities or neighborhoods, incorporating more detailed environmental and social indicators.
Furthermore, recent studies have increasingly emphasized incorporating adaptability and social responsiveness into independent evaluation dimensions. In the common HRI framework, adaptability is often treated as a separate component to evaluate the proactive response and recovery capabilities of social systems in the face of extreme heat events. For example, in micro-scale studies, indicators such as air conditioning penetration, the number of community cooling facilities, and the accessibility of public cooling facilities can reflect residents’ adaptability to heat environments. Future studies can also focus more on the recovery speed after extreme heat events, the response efficiency of early warning systems, and the self-regulation capabilities of social systems, which are highly consistent with the “response” concept emphasized in the IPCC Sixth Assessment Report. Quantifying the social response process allows HHRA to extend beyond simple risk identification to include the assessment of risk governance capabilities.
4.3. Transformation of Methodological Approach and Driving Mechanism Analysis
This study further reveals a strong consistency in the choice of methods used in the HHRA studies, but the focus differs across scales. At the macro-scale, studies typically emphasize identifying regional patterns and long-term evolution trends, thus employing descriptive statistics, time series analysis, spatial autocorrelation analysis, and hotspot detection to reveal spatial differences and patterns of risk across large scales. At the meso-scale, studies shift their focus to explaining spatial heterogeneity within cities, with regression analysis, weighted overlay methods, and comprehensive index models widely used to analyze risk differences between different regions. At the micro-scale, studies pay more attention to local environmental mechanisms, such as street canyons, building microenvironments, and individual activity environments. Therefore, more refined spatial analysis methods, environmental observation data, and rapidly developing machine learning models are increasingly being introduced to capture complex nonlinear relationships and threshold effects. These methodological differences reflect the distinct study objectives at different scales: macro-scale studies focus on identifying regional patterns and meso-scale studies focus on explaining urban heterogeneity, while micro-scale studies focus more on local mechanisms and their supporting role in precise interventions.
Despite the continuous enrichment of methods in recent years, existing studies still largely focus on spatial identification and correlation analysis, with relatively insufficient mechanistic explanations. Many studies have effectively answered questions about which regions have a high level of risk and which variables are statistically associated with risk. However, studies on how disaster intensity, exposure level, sensitivity, and adaptability interact across time and space to ultimately shape risk outcomes remain limited. Heat health risk is a dynamic process resulting from the combined effects of multiple factors, including climate events, urban morphology, behavioral exposure, infrastructure accessibility, and social vulnerability. Relying solely on static overlay or correlation analyses can lead to neglecting the temporal variations in extreme heat events and the differences in the ability of different groups to cope with extreme heat. Therefore, future studies need to gradually shift towards explaining mechanisms to describe the complex interplay between disaster processes and social responses across time and space.
Furthermore, the current study still suffers from significant shortcomings in cross-scale fusion. Although cross-scale studies have gradually increased in recent years, the overall number remains limited. Macro-climate background, meso-urban morphology, and micro-individual exposure are often studied separately, resulting in a fragmented knowledge system and hindering the formation of a systematic risk governance strategy. To address this limitation, geospatial tools have demonstrated a strong ability to integrate different technologies. First, spatial analysis using geospatial tools can transform multi-source data into components within a framework; for example, LST retrieved from remote sensing imagery can be converted into a heat hazard. Second, geospatial tools can unify data from different statistical scales, such as macro and micro, under a single scale or spatial unit for overlay calculations. Furthermore, geospatial tools can perform equal-weighted or weighted overlay analyses. This process transforms discrete geographic information into a continuous risk gradient. In addition, different analytical tools have their own advantages and limitations in specific methodological applications. For example, map overlay analysis can visually present the spatial distribution pattern of risk and is suitable for risk identification at different scales; the equity index can reveal the uneven spatial distribution of risk, but it is difficult to quantify the strength of correlations between specific variables; correlation analysis and regression models can identify statistical relationships between variables, but traditional linear models often struggle to capture complex nonlinear effects; and machine-learning-based indicator ranking or feature importance analysis can identify key risk drivers, making assessment results closer to real-world scenarios, but it also fails to directly reflect the unequal distribution of risk.
Future studies need to strengthen cross-scale fusion at the methods level, such as enhancing multi-source data fusion by combining remote sensing data, census data, street-scale built environment indicators, traffic data, and field measurement data to link the spatial location of climate background, urban morphology, and individual behavior. Secondly, studies should place greater emphasis on dynamic and process-oriented methods, such as evolutionary analysis, scenario simulation, and path analysis, to better characterize the formation and evolution of risk.
4.4. Risk Governance Requires the Construction of a Cross-Scale Collaborative Framework
The rev results of this study indicate that existing studies have proposed various strategies for managing heat health risk, but these strategies remain unevenly distributed across different scales and often lack systematic connections. Empirical evidence shows that macro-scale studies typically support broad adaptation policies, regional coordination, and strategic resource allocation; meso-scale studies focus more on urban planning responses, such as green space allocation, land use optimization, ventilation corridor design, and public service distribution; and micro-scale studies tend to focus on highly targeted interventions, including shading facilities, cooling centers, housing renovations, improving pedestrian thermal comfort, and protecting specific vulnerable groups. This difference confirms that governance strategies are also scale-dependent; no single scale can comprehensively address the complexity of risk.
However, a meta-analysis of the 86 empirical studies included revealed that a major shortcoming of the current studies is the insufficient link between assessment and governance. The review results showed that strategies proposed at different scales are often independent rather than integrated. Macro-scale assessments can identify high-level risk areas, but they do not always provide sufficient guidance for community-level interventions. Micro-scale studies can provide insights into local exposure and vulnerability, but their findings are often difficult to generalize to urban or regional policy frameworks. This results in a continued disconnect between risk identification and governance implementation, as well as between strategic planning and local action.
Therefore, based on the aforementioned empirical findings and limitations, this study proposes that future HHRA requires a cross-scale collaborative governance framework. Within this framework, we propose that at the macro-scale, the main tasks should be early warning, inter-regional comparison, and then the delineation of key protection zones for heat health risks based on risk index classification, so as to provide a spatial reference for the priority of resource allocation and infrastructure investment at the national or provincial level. At the meso-scale, there should be a focus on translating risk information into planning and spatial governance tools. For example, local climate zones (LCZs) can be superimposed with medical facility accessibility to optimize the layout of emergency medical facilities. At the micro-scale, interventions should focus on reducing actual exposure and improving resilience through community cooling strategies and environmental improvements. For example, in newly built communities, clear area thresholds and maximum service distances for blue–green spaces should be set to directly improve the community environment. At the same time, public health education can be carried out, and there should be targeted support for the elderly, children, outdoor workers, and low-income groups. Simultaneously, a feedback mechanism was suggested to be established so that the effectiveness of local interventions can provide a basis for planning decisions at the meso-scale and macro-scale [30]. By connecting multiple scales, HHRA can evolve from a diagnostic tool into a practical governance tool.
5. Conclusions
This study reviewed 86 studies related to HHRA, analyzing the characteristics and differences in assessment frameworks, indicator selection, methodological approaches, and risk governance strategies across different spatial scales. The results indicate that the HHRA frameworks are shifting from the HRI and HVI to the HEVA framework, separating adaptability from the concept of vulnerability and shifting the focus of assessment from characterizing the sensitive features of a population to actively identifying the ability of a region or individual to cope with risks. With increasing attention to public health, the number of HHAR studies has steadily increased, and the field has evolved from traditional environmental science toward deeper integration with urban planning, public health, and geographic information science. Meanwhile, the research focus has gradually shifted to the micro-scale, enabling more refined identification of spatial heterogeneity in risk. Furthermore, cross-scale integrated studies are emerging. These developments have also driven the diversification of indicator selection and methodology. Macro-scale studies focus on broad variables such as climatic conditions and socioeconomic factors. Methods such as descriptive statistics and spatial autocorrelation are widely used to identify regional patterns and long-term evolutionary trends, thereby providing macro-level guidance for regional coordination and resource allocation. Meso-scale studies further incorporate additional variables such as the built environment, infrastructure, and service accessibility to better capture intra-urban differences. Methodologically, regression analysis, weighted aggregation approaches, and composite index models are commonly employed to support targeted intervention strategies. Micro-scale studies place greater emphasis on housing quality, daily activity environments, and local environmental mechanisms. Accordingly, methodological approaches at this scale are more diverse, incorporating fine-scale spatial analysis, in situ environmental observations, and, in recent years, rapidly developing machine learning models to capture complex nonlinear relationships and threshold effects, thereby supporting highly targeted and implementable interventions. However, this study found that several knowledge gaps remain. First, there is still no widely accepted standard for defining macro-, meso-, and micro-scale HHRA, which limits the comparability of findings across studies. Second, most studies remain single-scale assessments, and cross-scale validation is rarely conducted. As a result, it remains unclear whether high-risk areas identified at one scale remain high-risk when examined at another scale. Third, temporal synchronization has not received sufficient attention. Macro-scale studies often focus on annual or long-term trends, whereas micro-scale risks may fluctuate hourly or diurnally. Fourth, many studies identify statistical associations between indicators and risk but provide a limited explanation of the mechanisms through which hazard, exposure, sensitivity, and adaptability interact.
Furthermore, this study still has some limitations. The current database was chosen because it has high-quality peer-review standards, ensuring the rigor of the included research articles. However, this database primarily indexes high-impact English journals, which may overlook relevant research from non-English-speaking regions. Therefore, addressing these gaps requires a shift from static spatial overlay toward process-oriented, multi-source, and cross-scale analytical frameworks. Simultaneously, future research could expand its search scope to include more databases, such as Scopus and PubMed, to more comprehensively cover the relevant literature.
Author Contributions
Conceptualization, Y.P. and Z.W.; methodology, J.R.; software, J.R.; validation, Y.P. and Y.L.; formal analysis, J.R.; writing—original draft preparation, J.R.; writing—review and editing, Y.P. and Y.I.; visualization, J.R. and Y.P.; supervision, Z.W.; funding acquisition, Y.P. All authors have read and agreed to the published version of the manuscript.
Funding
This research was funded by the Science Research Project of Hebei Education Department, grant number BJ2025256.
Data Availability Statement
None.
Conflicts of Interest
The authors declare no conflicts of interest.
References
- Calvin, K.; Dasgupta, D.; Krinner, G.; Mukherji, A.; Thorne, P.W.; Trisos, C.; Romero, J.; Aldunce, P.; Barrett, K.; Blanco, G.; et al. IPCC, 2023: Climate Change 2023: Synthesis Report. Contribution of Working Groups I, II and III to the Sixth Assessment Report of the Intergovernmental Panel on Climate Change [Core Writing Team, H. Lee and J. Romero (Eds.)]; First; Intergovernmental Panel on Climate Change (IPCC): Geneva, Switzerland, 2023. [Google Scholar]
- Department of Economic and Social Affairs. World Urbanization Prospects: The 2018 Revision; United Nations: New York, NY, USA, 2019. [Google Scholar]
- Ma, L.; Huang, G.; Johnson, B.A.; Chen, Z.; Li, M.; Yan, Z.; Zhan, W.; Lu, H.; He, W.; Lian, D. Investigating Urban Heat-Related Health Risks Based on Local Climate Zones: A Case Study of Changzhou in China. Sustain. Cities Soc. 2023, 91, 104402. [Google Scholar] [CrossRef] [Scilit]
- Xie, Y.; Xu, F.; Ye, Q.; Zhai, Z.; Yang, H.; Feng, X.; Shi, J.; Hu, W. Spatial Distribution of Old Neighborhoods Based on Heat-Related Health Risks Assessment: A Case Study of Changsha City, China. Sustain. Cities Soc. 2024, 114, 105740. [Google Scholar] [CrossRef] [Scilit]
- Tian, P.; Li, J.; Cao, L.; Pu, R.; Wang, Z.; Zhang, H.; Chen, H.; Gong, H. Assessing Spatiotemporal Characteristics of Urban Heat Islands from the Perspective of an Urban Expansion and Green Infrastructure. Sustain. Cities Soc. 2021, 74, 103208. [Google Scholar] [CrossRef] [Scilit]
- Yang, X.; Gao, W.; Zhang, Q.; Li, S.; Fu, F.; Li, N. Analyzing the Environment Characteristics of Heat Exposure Spaces from the Humanistic Perspective and Spatial Improvement Approaches in Central Beijing, China. Buildings 2022, 12, 138. [Google Scholar] [CrossRef] [Scilit]
- Zha, F.; Lu, L.; Wang, R.; Zhang, S.; Cao, S.; Baqa, M.F.; Li, Q.; Chen, F. Understanding Fine-Scale Heat Health Risks and the Role of Green Infrastructure Based on Remote Sensing and Socioeconomic Data in the Megacity of Beijing, China. Ecol. Indic. 2024, 160, 111847. [Google Scholar] [CrossRef] [Scilit]
- Huang, H.; Zhang, S.; Xiong, S.; Shi, C. Health Risk Assessment and Influencing Factors Analysis of High Temperatures on Negative Emotions. Buildings 2022, 12, 1040. [Google Scholar] [CrossRef] [Scilit]
- Thompson, R.; Hornigold, R.; Page, L.; Waite, T. Associations between high ambient temperatures and heat waves with mental health outcomes: A systematic review. Public Health 2018, 161, 171–191. [Google Scholar] [CrossRef] [Scilit]
- Yao, X.; Jin, S.; Zhao, Z.; Sun, R.; Wang, C.; Yu, Z. A Novel Integrated Socio-Ecological-Economic Index for Assessing Heat Health Risk. Ecol. Indic. 2024, 169, 112840. [Google Scholar] [CrossRef] [Scilit]
- Intergovernmental Panel on Climate Change (IPCC). Climate Change 2022—Impacts, Adaptation and Vulnerability: Working Group II Contribution to the Sixth Assessment Report of the Intergovernmental Panel on Climate Change, 1st ed.; Cambridge University Press: Cambridge, UK, 2023; ISBN 978-1-00-932584-4. [Google Scholar]
- Estoque, R.C.; Ooba, M.; Seposo, X.T.; Togawa, T.; Hijioka, Y.; Takahashi, K.; Nakamura, S. Heat Health Risk Assessment in Philippine Cities Using Remotely Sensed Data and Social-Ecological Indicators. Nat. Commun. 2020, 11, 1581. [Google Scholar] [CrossRef] [Scilit] [PubMed]
- Lin, Y.; Zeng, H. How to Identify Urban Heat Inequity? A Systematic Literature Review of Scales, Indicators, Pathways, and Future Directions. Sustain. Cities Soc. 2026, 137, 107130. [Google Scholar] [CrossRef] [Scilit]
- Watson, R.T.; Albritton, D.L.; Intergovernmental Panel on Climate Change (Eds.) Climate Change 2001: Synthesis Report; Cambridge University Press: Cambridge, UK; New York, NY, USA, 2001; ISBN 978-0-521-80770-8. [Google Scholar]
- Bernstein, L.; IPCC (Eds.) Climate Change 2007: Synthesis Report: A Report of the Intergovernmental Panel on Climate Change; IPCC: Geneva, Switzerland, 2008; ISBN 978-92-9169-122-7. [Google Scholar]
- Field, C.B.; Barros, V.R.; Intergovernmental Panel on Climate Change (Eds.) Climate Change 2014: Impacts, Adaptation, and Vulnerability: Working Group II Contribution to the Fifth Assessment Report of the Intergovernmental Panel on Climate Change; Cambridge University Press: New York, NY, USA, 2014; ISBN 978-1-107-64165-5. [Google Scholar]
- Crichton, D. The Risk Triangle. In Natural disaster management; Ingleton, J., Ed.; Tudor Rose: London, UK, 1999; pp. 102–103. [Google Scholar]
- Ahmed, I.; Van Esch, M.; Van Der Hoeven, F. Heatwave Vulnerability across Different Spatial Scales: Insights from the Dutch Built Environment. Urban Clim. 2023, 51, 101614. [Google Scholar] [CrossRef] [Scilit]
- Tomlinson, C.J.; Chapman, L.; Thornes, J.E.; Baker, C.J. Including the Urban Heat Island in Spatial Heat Health Risk Assessment Strategies: A Case Study for Birmingham, UK. Int. J. Health Geogr. 2011, 10, 42. [Google Scholar] [CrossRef] [Scilit] [PubMed]
- Xu, C.; Wei, R.; Tong, H. A Systematic Review of Methodological Advances in Urban Heatwave Risk Assessment: Integrating Multi-Source Data and Hybrid Weighting Methods. Sustainability 2025, 17, 3747. [Google Scholar] [CrossRef] [Scilit]
- Ye, J.; Yang, F. Towards Multi-Scale and Context-Specific Heat Health Risk Assessment—A Systematic Review. Sustain. Cities Soc. 2025, 119, 106102. [Google Scholar] [CrossRef] [Scilit]
- Yao, Y.; Lu, L.; Guo, J.; Zhang, S.; Cheng, J.; Tariq, A.; Liang, D.; Hu, Y.; Li, Q. Spatially Explicit Assessments of Heat-Related Health Risks: A Literature Review. Remote Sens. 2024, 16, 4500. [Google Scholar] [CrossRef] [Scilit]
- Wu, H.; Zhao, C.; Zhu, Y.; Pan, Y. A Multiscale Examination of Heat Health Risk Inequality and Its Drivers in Mega-Urban Agglomeration: A Case Study in the Yangtze River Delta, China. J. Clean. Prod. 2024, 458, 142528. [Google Scholar] [CrossRef] [Scilit]
- Zhang, H.; Zhang, J.; Fediuk, R.; Qi, R.; Xu, J.; Bai, H.; Guo, Y. Multiscale Assessment of Thermal Comfort, Exposure, Inequality, and Heat Risk in Zhengzhou. Sci. Rep. 2025, 15, 15588. [Google Scholar] [CrossRef] [Scilit]
- Gong, F.-Y.; Yang, Z.; Deng, S. Fine-Scale Assessment of Diurnal Heat Health Risk Based on Satellite and Street View Images. Cities 2025, 162, 105963. [Google Scholar] [CrossRef] [Scilit]
- Liu, J.; Wang, X.; Yan, J.; Zhao, X.; Chen, W.; Yin, L.; Zhang, B. Cross-Scale Long-Term Spatiotemporal Dynamics and Influencing Indicators of Summer Urban Heat Risk in Mega-Urban Agglomeration. J. Clean. Prod. 2025, 536, 147165. [Google Scholar] [CrossRef] [Scilit]
- Oke, T.R.; Mills, G.; Christen, A.; Voogt, J.A. Urban Climates, 1st ed.; Cambridge University Press: Cambridge, UK, 2017; ISBN 978-1-139-01647-6. [Google Scholar]
- Aromataris, E.; Fernandez, R.; Godfrey, C.; Holly, C.; Khalil, H.; Tungpunkom, P. Umbrella Reviews. In JBI Manual for Evidence Synthesis; Aromataris, E., Lockwood, C., Porritt, K., Pilla, B., Jordan, Z., Eds.; JBI: Temple, GA, USA, 2024; ISBN 978-0-648-84882-0. [Google Scholar]
- Guo, F.; Fan, G.; Zhao, J.; Zhang, H.; Dong, J.; Ma, H.; Li, N. Urban Heat Health Risk Inequality and Its Drivers Based on Local Climate Zones: A Case Study of Qingdao, China. Build. Environ. 2025, 275, 112827. [Google Scholar] [CrossRef] [Scilit]
- Szagri, D.; Nagy, B.; Szalay, Z. How Can We Predict Where Heatwaves Will Have an Impact?—A Literature Review on Heat Vulnerability Indexes. Urban Clim. 2023, 52, 101711. [Google Scholar] [CrossRef] [Scilit]
- Wang, Z.; Ishida, Y.; Mochida, A. Effective Factors for Reducing Land Surface Temperature in Each Local Climate Zone Built Type in Tokyo and Shanghai. Remote Sens. 2023, 15, 3840. [Google Scholar] [CrossRef] [Scilit]
- Zhu, W.; Yuan, C. Urban Heat Health Risk Assessment in Singapore to Support Resilient Urban Design—By Integrating Urban Heat and the Distribution of the Elderly Population. Cities 2023, 132, 104103. [Google Scholar] [CrossRef] [Scilit]
- Barriopedro, D.; García-Herrera, R.; Ordóñez, C.; Miralles, D.G.; Salcedo-Sanz, S. Heat Waves: Physical Understanding and Scientific Challenges. Rev. Geophys. 2023, 61, e2022RG000780. [Google Scholar] [CrossRef] [Scilit]
- Wang, Z.; Ishida, Y.; Peng, Y.; Ren, J.; Mochida, A. Exploring the Heat Balance Characteristics in Shanghai by Using the WRF Model Coupled with Local Climate Zone Scheme. Sustain. Cities Soc. 2025, 124, 106295. [Google Scholar] [CrossRef] [Scilit]
- Dong, J.; Peng, J.; He, X.; Corcoran, J.; Qiu, S.; Wang, X. Heatwave-Induced Human Health Risk Assessment in Megacities Based on Heat Stress-Social Vulnerability-Human Exposure Framework. Landsc. Urban Plan. 2020, 203, 103907. [Google Scholar] [CrossRef] [Scilit]
- Yang, L.; Yang, C.; Zhou, W.; Chen, X.; Wang, C.; Liu, L. Mapping the Spatial and Seasonal Details of Heat Health Risks in Different Local Climate Zones: A Case Study of Shanghai, China. Remote Sens. 2024, 16, 3513. [Google Scholar] [CrossRef] [Scilit]
- Shan, Z.; An, Y.; Xu, L.; Yuan, M. High-Temperature Disaster Risk Assessment for Urban Communities: A Case Study in Wuhan, China. Int. J. Environ. Res. Public Health 2021, 19, 183. [Google Scholar] [CrossRef] [Scilit]
- Zou, B.; Fan, C.; Li, J.; Wang, M.; Liao, Y.; Zhou, X. Assessing the Impact of Land Use Changes on Urban Heat Risk under Different Development Scenarios: A Case Study of Guangzhou in China. Sustain. Cities Soc. 2025, 130, 106532. [Google Scholar] [CrossRef] [Scilit]
- Guo, A.; Yang, J.; Xiao, X.; Xia (Cecilia), J.; Jin, C.; Li, X. Influences of Urban Spatial Form on Urban Heat Island Effects at the Community Level in China. Sustain. Cities Soc. 2020, 53, 101972. [Google Scholar] [CrossRef] [Scilit]
- Han, D.; An, H.; Wang, F.; Xu, X.; Qiao, Z.; Wang, M.; Sui, X.; Liang, S.; Hou, X.; Cai, H.; et al. Understanding Seasonal Contributions of Urban Morphology to Thermal Environment Based on Boosted Regression Tree Approach. Build. Environ. 2022, 226, 109770. [Google Scholar] [CrossRef] [Scilit]
- Chen, K.; McAneney, J.; Blong, R.; Leigh, R.; Hunter, L.; Magill, C. Defining Area at Risk and Its Effect in Catastrophe Loss Estimation: A Dasymetric Mapping Approach. Appl. Geogr. 2004, 24, 97–117. [Google Scholar] [CrossRef]
- Chen, B.; Xie, M.; Feng, Q.; Wu, R.; Jiang, L. Diurnal Heat Exposure Risk Mapping and Related Governance Zoning: A Case Study of Beijing, China. Sustain. Cities Soc. 2022, 81, 103831. [Google Scholar] [CrossRef] [Scilit]
- Huang, H.; Lu, Z.; Fan, X.; Zhai, W.; Zhang, L.; Xu, D.; Liu, Z.; Li, Y.; Ye, X.; Qin, H.; et al. Urban Heatwave, Green Spaces, and Mental Health: A Review Based on Environmental Health Risk Assessment Framework. Sci. Total Environ. 2024, 948, 174816. [Google Scholar] [CrossRef] [Scilit]
- Wang, Q.; Zhang, Y.; Ban, J.; Zhu, H.; Xu, H.; Li, T. The Relationship between Population Heat Vulnerability and Urbanization Levels: A County-Level Modeling Study across China. Environ. Int. 2021, 156, 106742. [Google Scholar] [CrossRef] [Scilit]
- Yang, Y.; Zhao, N. Vulnerability Assessment of Urban Agglomerations to the Risk of Heat Waves in China since the 21st Century. Environ. Pollut. 2023, 336, 122443. [Google Scholar] [CrossRef] [Scilit]
- Zhang, R.; Yang, J.; Ma, X.; Xiao, X.; Xia, J.C. Optimal Allocation of Local Climate Zones Based on Heat Vulnerability Perspective. Sustain. Cities Soc. 2023, 99, 104981. [Google Scholar] [CrossRef] [Scilit]
- Zou, Q.; Yang, J.; Zhang, Y.; Bai, Y.; Wang, J. Variation in Community Heat Vulnerability for Shenyang City under Local Climate Zone Perspective. Build. Environ. 2025, 267, 112242. [Google Scholar] [CrossRef] [Scilit]
- Zhang, C.; Yang, Y.; Yu, L. Assessing Urban Surface Thermal Environment and Heat Health Risk in Chinese Cities: A Twenty-Year Study. Urban Clim. 2025, 59, 102304. [Google Scholar] [CrossRef] [Scilit]
- Sun, H.; Chen, Y.; Li, K.; Gao, S. Spatio-Temporal Assessment of Heat Health Risk in Chinese Metropolitan Cities Based on the Modified Multi-Indicators Coupled Risk Framework. Sustain. Cities Soc. 2024, 108, 105451. [Google Scholar] [CrossRef] [Scilit]
- Zeng, P.; Shi, D.; Helbich, M.; Sun, F.; Zhao, H.; Liu, Y.; Che, Y. Gender Disparities in Summer Outdoor Heat Risk across China: Findings from a National County-Level Assessment during 1991–2020. Sci. Total Environ. 2024, 921, 171120. [Google Scholar] [CrossRef] [Scilit]
- Bradford, K.; Abrahams, L.; Hegglin, M.; Klima, K. A Heat Vulnerability Index and Adaptation Solutions for Pittsburgh, Pennsylvania. Environ. Sci. Technol. 2015, 49, 11303–11311. [Google Scholar] [CrossRef] [Scilit]
- Chen, Q.; Ding, M.; Yang, X.; Hu, K.; Qi, J. Spatially Explicit Assessment of Heat Health Risk by Using Multi-Sensor Remote Sensing Images and Socioeconomic Data in Yangtze River Delta, China. Int. J. Health Geogr. 2018, 17, 15. [Google Scholar] [CrossRef] [Scilit]
- Zhu, Q.; Liu, T.; Lin, H.; Xiao, J.; Luo, Y.; Zeng, W.; Zeng, S.; Wei, Y.; Chu, C.; Baum, S.; et al. The Spatial Distribution of Health Vulnerability to Heat Waves in Guangdong Province, China. Glob. Health Action 2014, 7, 25051. [Google Scholar] [CrossRef] [Scilit] [PubMed]
- Wu, X.; Liu, Q.; Huang, C.; Li, H. Mapping Heat-Health Vulnerability Based on Remote Sensing: A Case Study in Karachi. Remote Sens. 2022, 14, 1590. [Google Scholar] [CrossRef] [Scilit]
- Xuan, J.; Li, S.; Huang, C.; Zhang, X.; Mao, R. Spatiotemporal Dynamics of Heat-Related Health Risks of Elderly Citizens in Nanchang, China, Under Rapid Urbanization. Land 2025, 14, 1541. [Google Scholar] [CrossRef] [Scilit]
- Zhang, W.; Zheng, C.; Chen, F. Mapping Heat-Related Health Risks of Elderly Citizens in Mountainous Area: A Case Study of Chongqing, China. Sci. Total Environ. 2019, 663, 852–866. [Google Scholar] [CrossRef] [Scilit] [PubMed]
- He, Z.; Wu, Z.; Herzog, O.; Hei, J.; Li, L.; Li, X. Compound Health Effects and Risk Assessment of Extreme Heat and Ozone Air Pollution under Climate Change: A Case Study of 731 Urban Areas in China. Sustain. Cities Soc. 2025, 119, 106084. [Google Scholar] [CrossRef] [Scilit]
- Liu, Q.; Zhang, H.; Wang, Y.; Jiang, K.; Shen, X.; Chen, Z.; Gao, Y.; Shen, Y.; Guo, Y. Unraveling Nonlinear and Interactive Drivers of Urban Heat-Related Health Risks in a Mountainous Coastal City. Sustain. Cities Soc. 2026, 136, 107081. [Google Scholar] [CrossRef] [Scilit]
- Wu, H.; Xu, Y.; Zhang, M.; Su, L.; Wang, Y.; Zhu, S. Spatially Explicit Assessment of the Heat-Related Health Risk in the Yangtze River Delta, China, Using Multisource Remote Sensing and Socioeconomic Data. Sustain. Cities Soc. 2024, 104, 105300. [Google Scholar] [CrossRef] [Scilit]
- Huang, H.; Ma, J.; Yang, Y. Spatial Heterogeneity of Driving Factors for Urban Heat Health Risk in Chongqing, China: A New Identification Method and Proposal of Planning Response Framework. Ecol. Indic. 2023, 153, 110449. [Google Scholar] [CrossRef] [Scilit]
- Xiang, Z.; Qin, H.; He, B.-J.; Han, G.; Chen, M. Heat vulnerability caused by physical and social conditions in a mountainous megacity of Chongqing, China. Sustain. Cities Soc. 2022, 80, 103792. [Google Scholar] [CrossRef] [Scilit]
- Dong, W.; Liu, Z.; Zhang, L.; Tang, Q.; Liao, H.; Li, X. Assessing Heat Health Risk for Sustainability in Beijing’s Urban Heat Island. Sustainability 2014, 6, 7334–7357. [Google Scholar] [CrossRef] [Scilit]
- Baqa, M.F.; Lu, L.; Guo, H.; Song, X.; Alavipanah, S.K.; Nawaz-ul-Huda, S.; Li, Q.; Chen, F. Investigating Heat-Related Health Risks Related to Local Climate Zones Using SDGSAT-1 High-Resolution Thermal Infrared Imagery in an Arid Megacity. Int. J. Appl. Earth Obs. Geoinf. 2025, 136, 104334. [Google Scholar] [CrossRef] [Scilit]
- Song, J.; Huang, B.; Kim, J.S.; Wen, J.; Li, R. Fine-Scale Mapping of an Evidence-Based Heat Health Risk Index for High-Density Cities: Hong Kong as a Case Study. Sci. Total Environ. 2020, 718, 137226. [Google Scholar] [CrossRef] [Scilit]
- Lan, H.; Zhang, H.; Gao, J.; Bai, J.; Wang, H.; Lu, C.; Geng, H. Heat Risk Assessment in Arid Zones Based on Local Climate Zones: A Case of Urumqi, China. Buildings 2025, 15, 1672. [Google Scholar] [CrossRef] [Scilit]
- Zhang, Y.; Wu, J.; Zhong, K.; Zhou, S.; Yuan, Y.; Wang, Q.; Liu, Y. Influence of Urban Morphological Characteristics on Street-Level Urban Heat Risk: A Geographically Weighted Machine Learning Approach. Buildings 2026, 16, 725. [Google Scholar] [CrossRef] [Scilit]
- Guo, R.; Guo, F.; Dong, J.; Wang, Z.; Zheng, R.; Zhang, H. Finer-Scale Urban Health Risk Assessment Based on the Interaction Perspective of Thermal Radiation, Human, Activity, and Space. Front. Archit. Res. 2024, 13, 682–697. [Google Scholar] [CrossRef] [Scilit]
- Eminoğlu, Y.; Çelik, H.M. Diagnosing Urban Heat Vulnerability through Multiscale Spatial Modelling: Evidence from Istanbul for Climate-Resilient Cities. Sustain. Cities Soc. 2026, 138, 107190. [Google Scholar] [CrossRef] [Scilit]
- Liao, S.; Liu, Z. Explaining and Reducing Urban Heat Islands Through Machine Learning: Evidence from New York City. Buildings 2026, 16, 186. [Google Scholar] [CrossRef] [Scilit]
- Liu, Q.; Hang, T.; Wan, M.; Song, Y. Advancing Climate Justice for Vulnerable Groups: Optimizing Spatial Configuration of Urban Blue–Green Infrastructure to Mitigate Heat Risks Leveraging Explainable Machine Learning. Sustain. Cities Soc. 2026, 140, 107228. [Google Scholar] [CrossRef] [Scilit]
- Li, Y.; Tsouknida, E.; Collins, T.; Bateson, A.; Tang, R.; Burman, E. Thermal Resilience in the Built Environment: A Critical Review. Sustain. Cities Soc. 2026, 138, 107180. [Google Scholar] [CrossRef] [Scilit]
- Chen, K.; Zhou, L.; Chen, X.; Ma, Z.; Liu, Y.; Huang, L.; Bi, J.; Kinney, P.L. Urbanization Level and Vulnerability to Heat-Related Mortality in Jiangsu Province, China. Environ. Health Perspect. 2016, 124, 1863–1869. [Google Scholar] [CrossRef] [Scilit] [PubMed]
- Sun, Y.; Li, Y.; Ma, R.; Gao, C.; Wu, Y. Mapping Urban Socio-Economic Vulnerability Related to Heat Risk: A Grid-Based Assessment Framework by Combing the Geospatial Big Data. Urban Clim. 2022, 43, 101169. [Google Scholar] [CrossRef] [Scilit]
- Hulley, G.; Shivers, S.; Wetherley, E.; Cudd, R. New ECOSTRESS and MODIS Land Surface Temperature Data Reveal Fine-Scale Heat Vulnerability in Cities: A Case Study for Los Angeles County, California. Remote Sens. 2019, 11, 2136. [Google Scholar] [CrossRef] [Scilit]
- Zhang, H.; Gao, J.; Zhao, J.; Guo, F.; Bai, J.; Wang, Z.; Zhu, P. Applicability of Local Climate Zones in Assessing Urban Heat Risk—A Survey of Coastal City. Cities 2025, 164, 106068. [Google Scholar] [CrossRef] [Scilit]
- Elmarakby, E.; Elkadi, H. Prioritising Urban Heat Island Mitigation Interventions: Mapping a Heat Risk Index. Sci. Total Environ. 2024, 948, 174927. [Google Scholar] [CrossRef] [Scilit]
- Yang, J.; Sun, J.; Ge, Q.; Li, X. Assessing the Impacts of Urbanization-Associated Green Space on Urban Land Surface Temperature: A Case Study of Dalian, China. Urban For. Urban Green. 2017, 22, 1–10. [Google Scholar] [CrossRef] [Scilit]
- Wang, J.; Zhang, M. Diurnal-Nocturnal Heat Health Risk Assessment at the Block Scale: Integrating Urban Functional Zones and Local Climate Zones. Sustain. Cities Soc. 2025, 130, 106609. [Google Scholar] [CrossRef] [Scilit]
- Li, F.; Yigitcanlar, T.; Nepal, M.; Nguyen, K.; Dur, F.; Li, W. Mapping Heat Vulnerability in Australian Capital Cities: A Machine Learning and Multi-Source Data Analysis. Sustain. Cities Soc. 2025, 119, 106079. [Google Scholar] [CrossRef] [Scilit]
- Hu, K.; Yang, X.; Zhong, J.; Fei, F.; Qi, J. Spatially Explicit Mapping of Heat Health Risk Utilizing Environmental and Socioeconomic Data. Environ. Sci. Technol. 2017, 51, 1498–1507. [Google Scholar] [CrossRef] [Scilit] [PubMed]
- Su, X.; Wang, F.; Zhou, D.; Zhang, H.; Su, X.; Wang, F.; Zhou, D.; Zhang, H. Heat Health Risk and Adaptability Assessments at the Subdistrict Scale in Metropolitan Beijing. Int. J. Disaster Risk Sci. 2022, 13, 987–1003. [Google Scholar] [CrossRef] [Scilit]
- Kumari, R.M.; Kitchley, J.L. A Framework to Assess the Contextual Composite Heat Vulnerability Index for a Heritage City in India—A Case Study of Madurai. Sustain. Cities Soc. 2024, 101, 105119. [Google Scholar] [CrossRef] [Scilit]
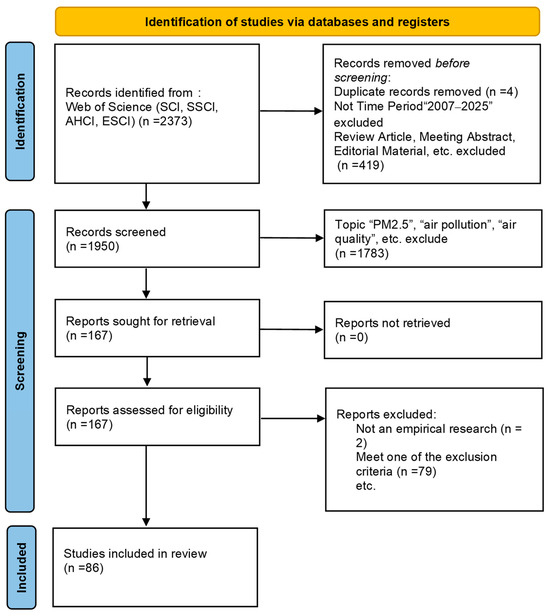
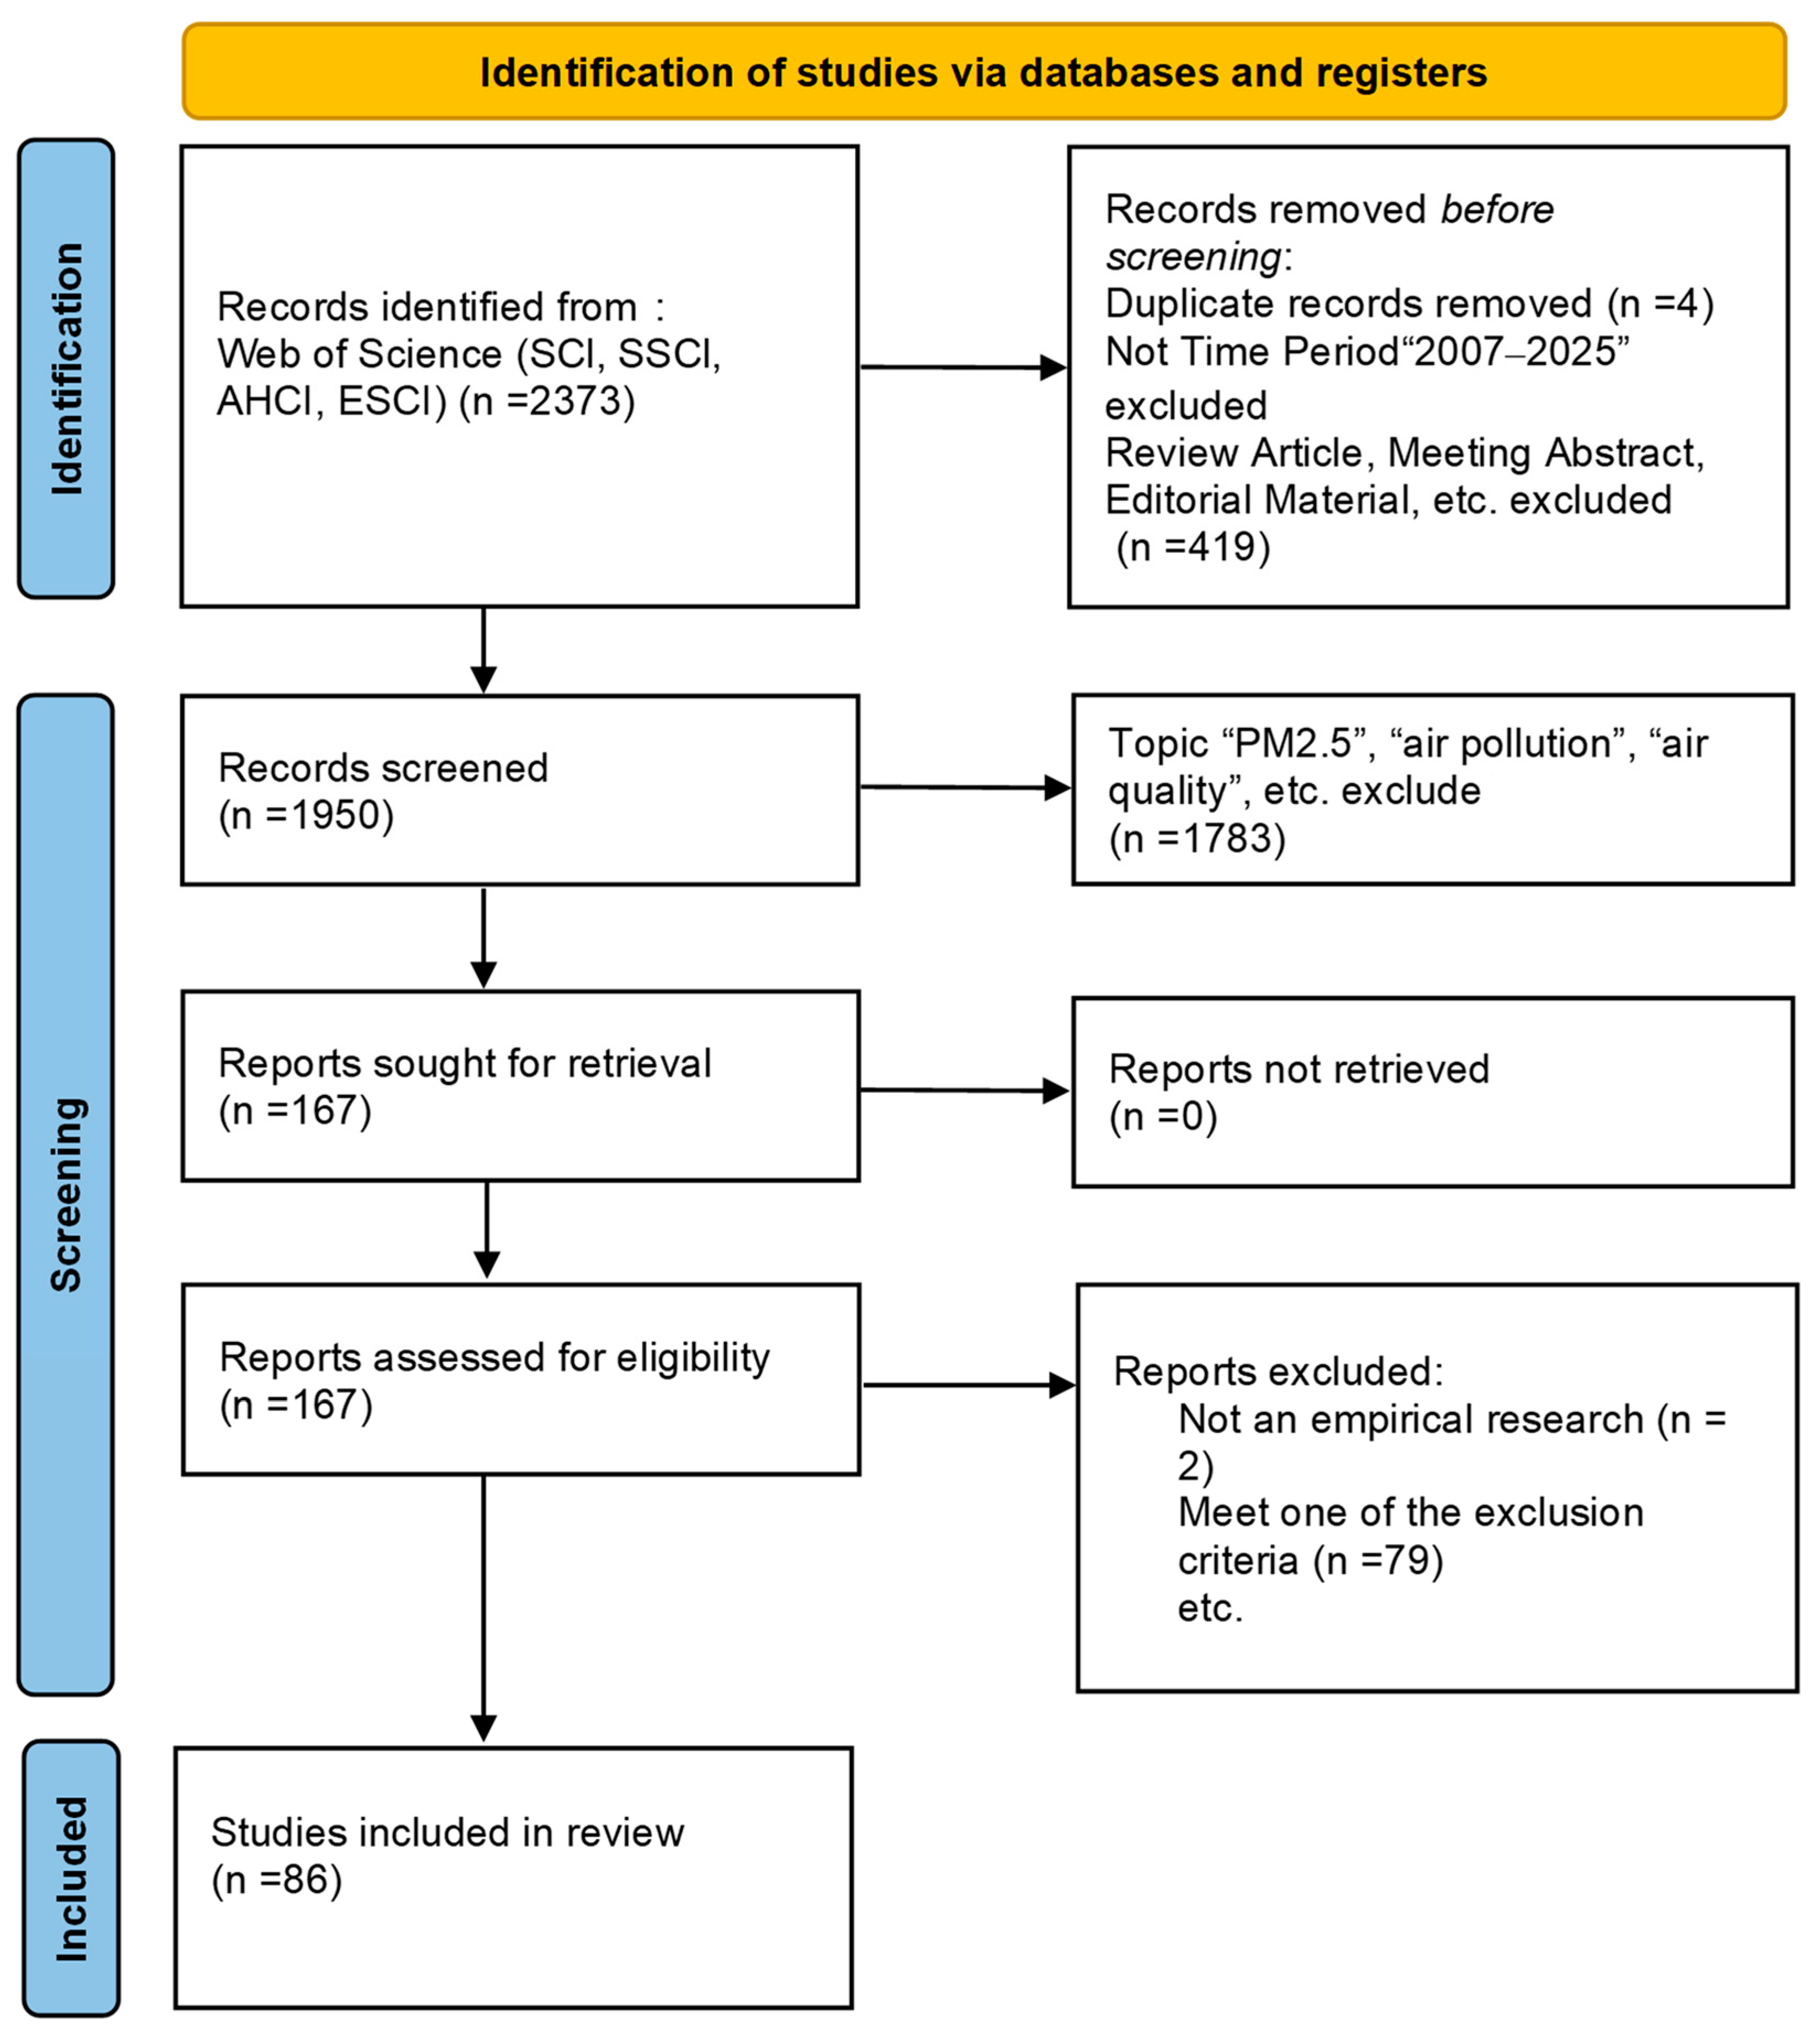
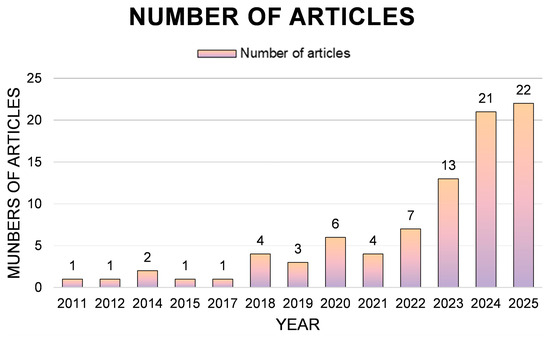
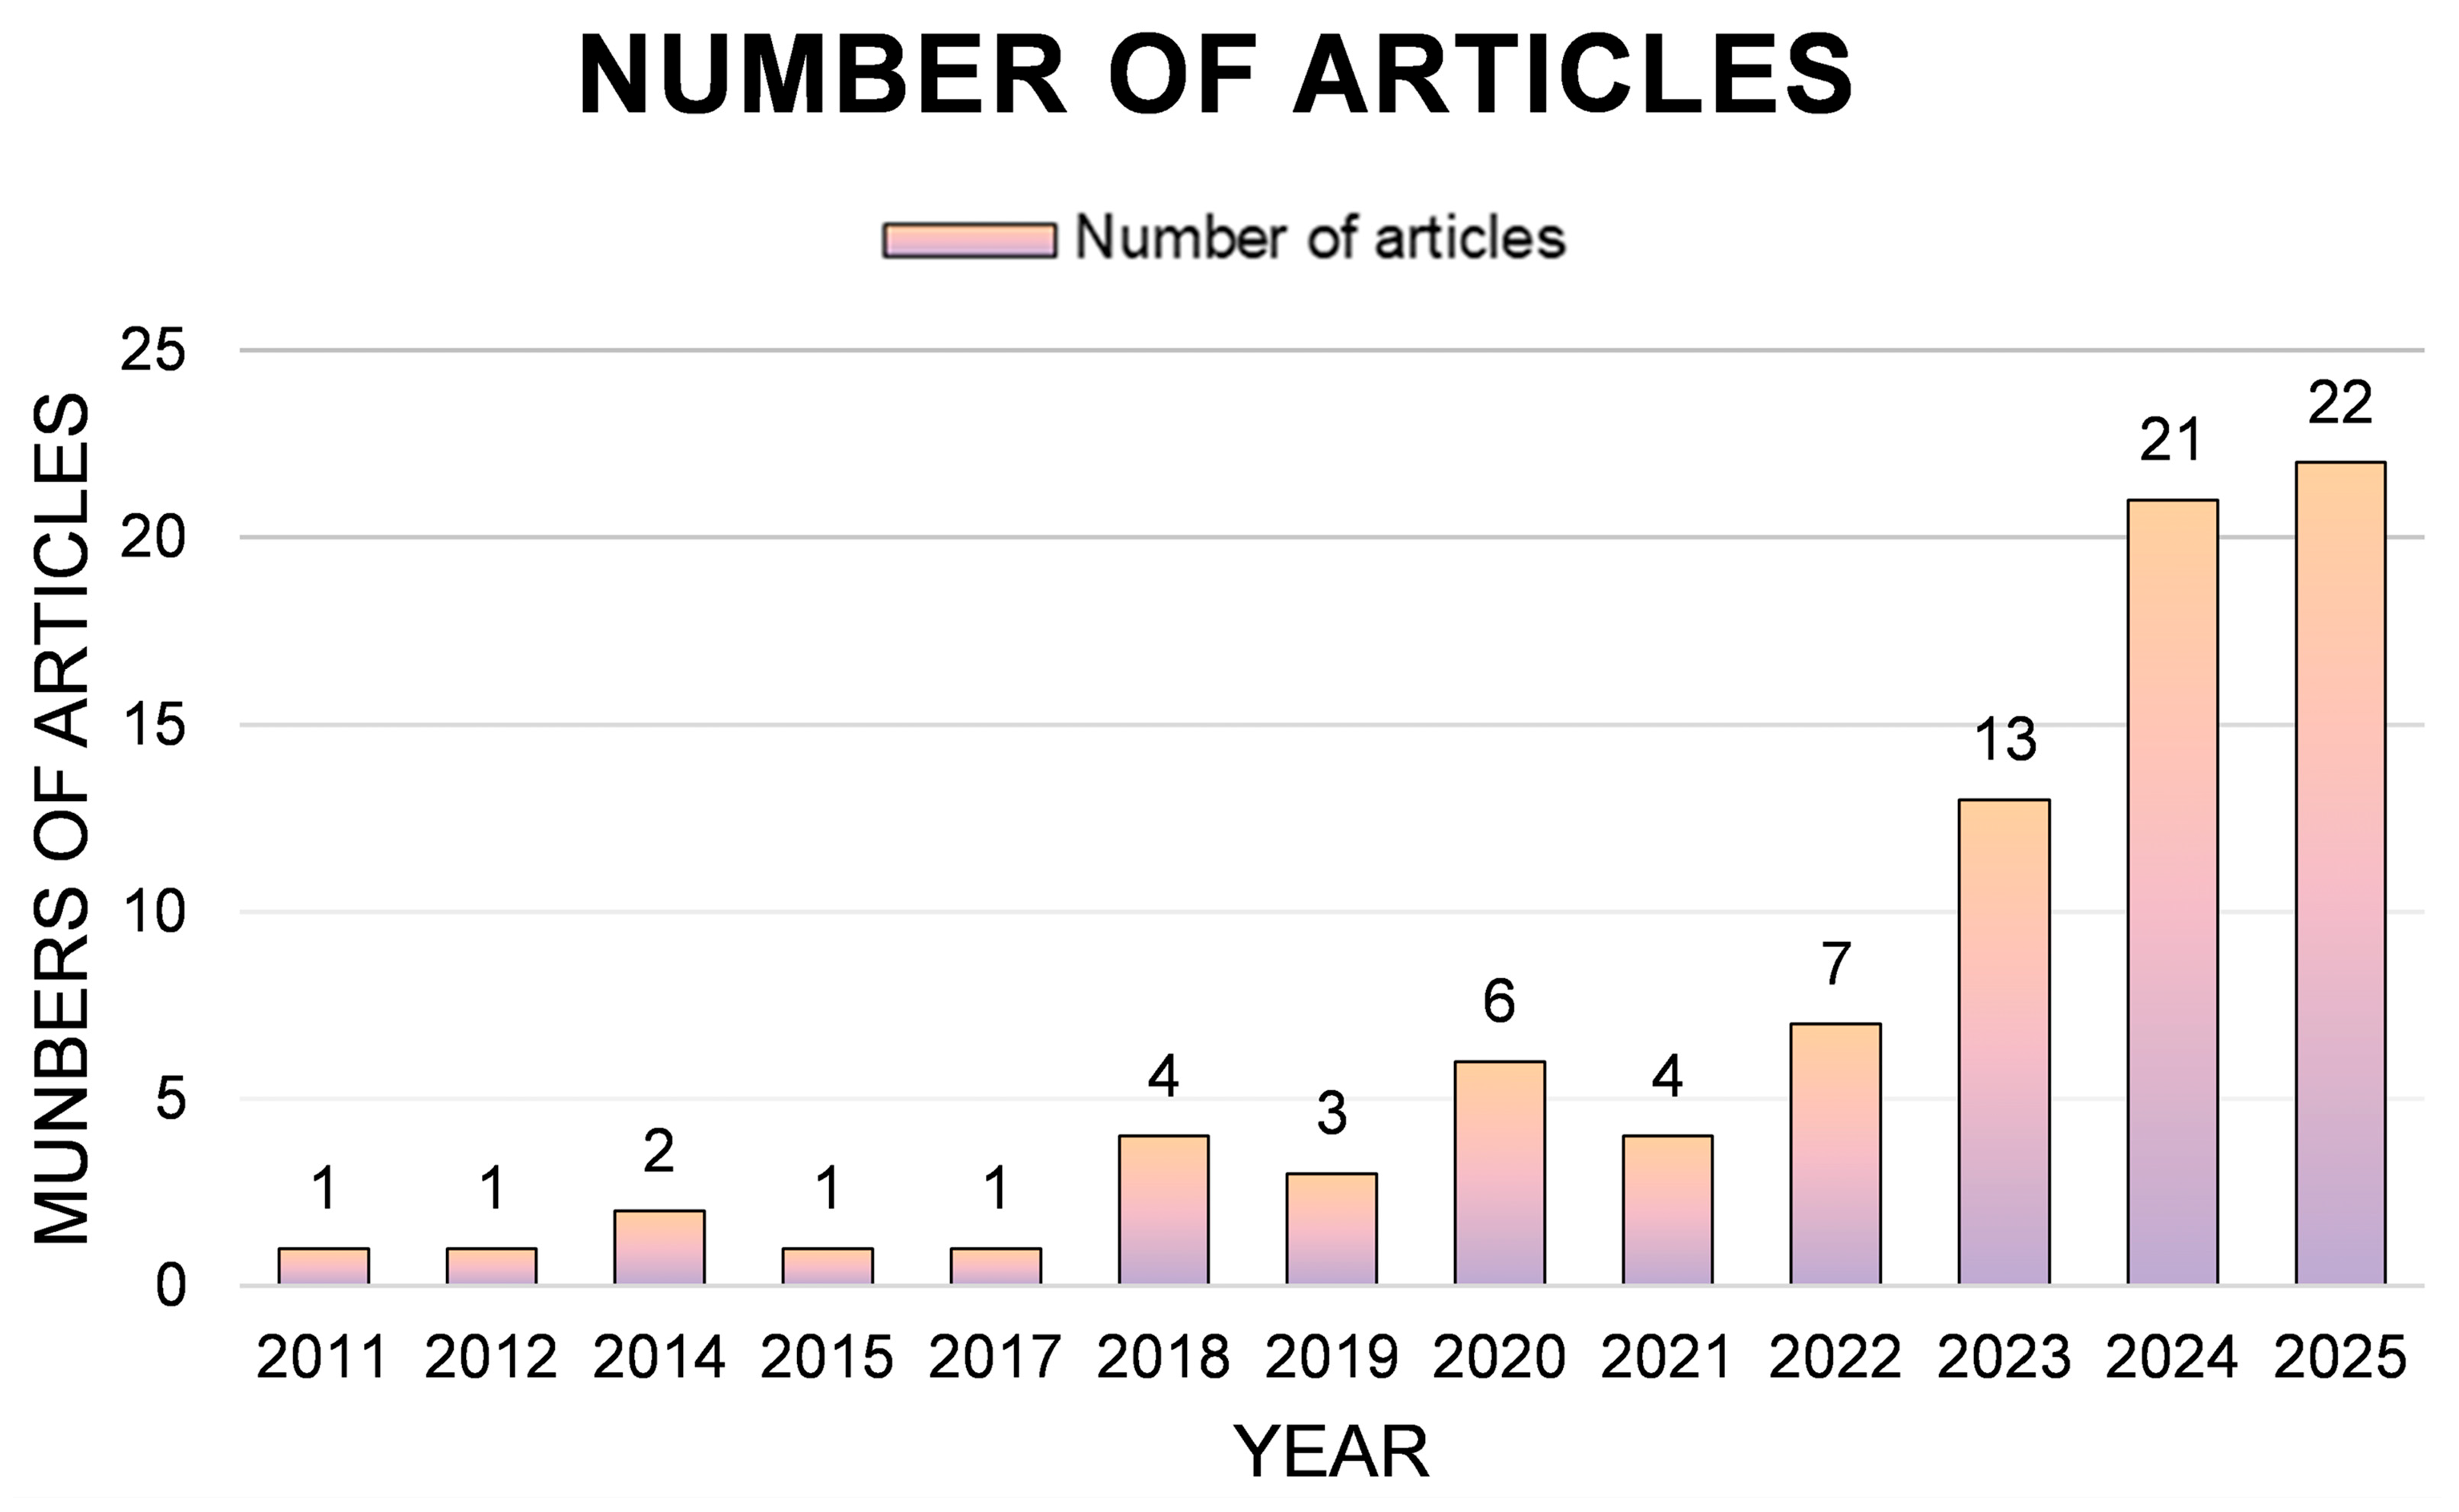
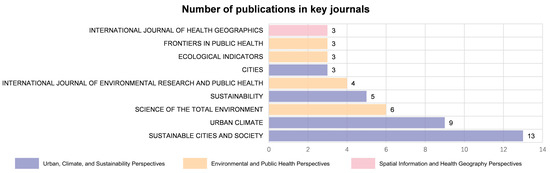
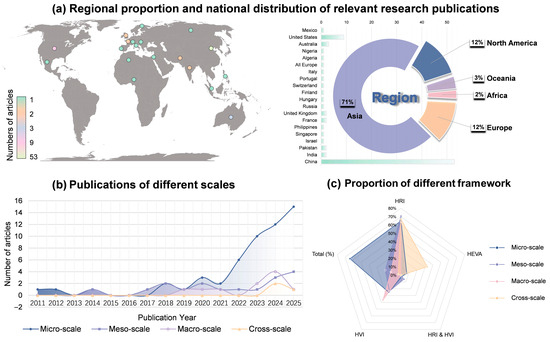
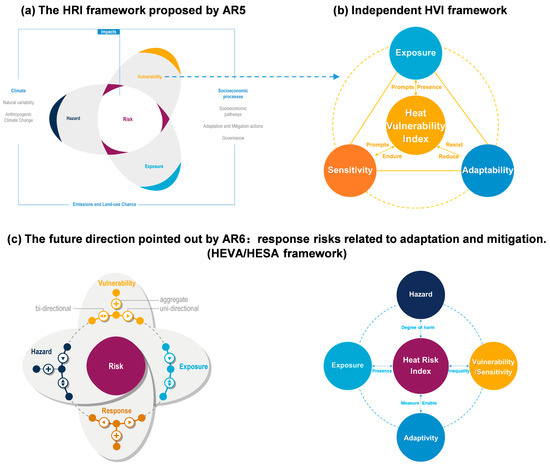
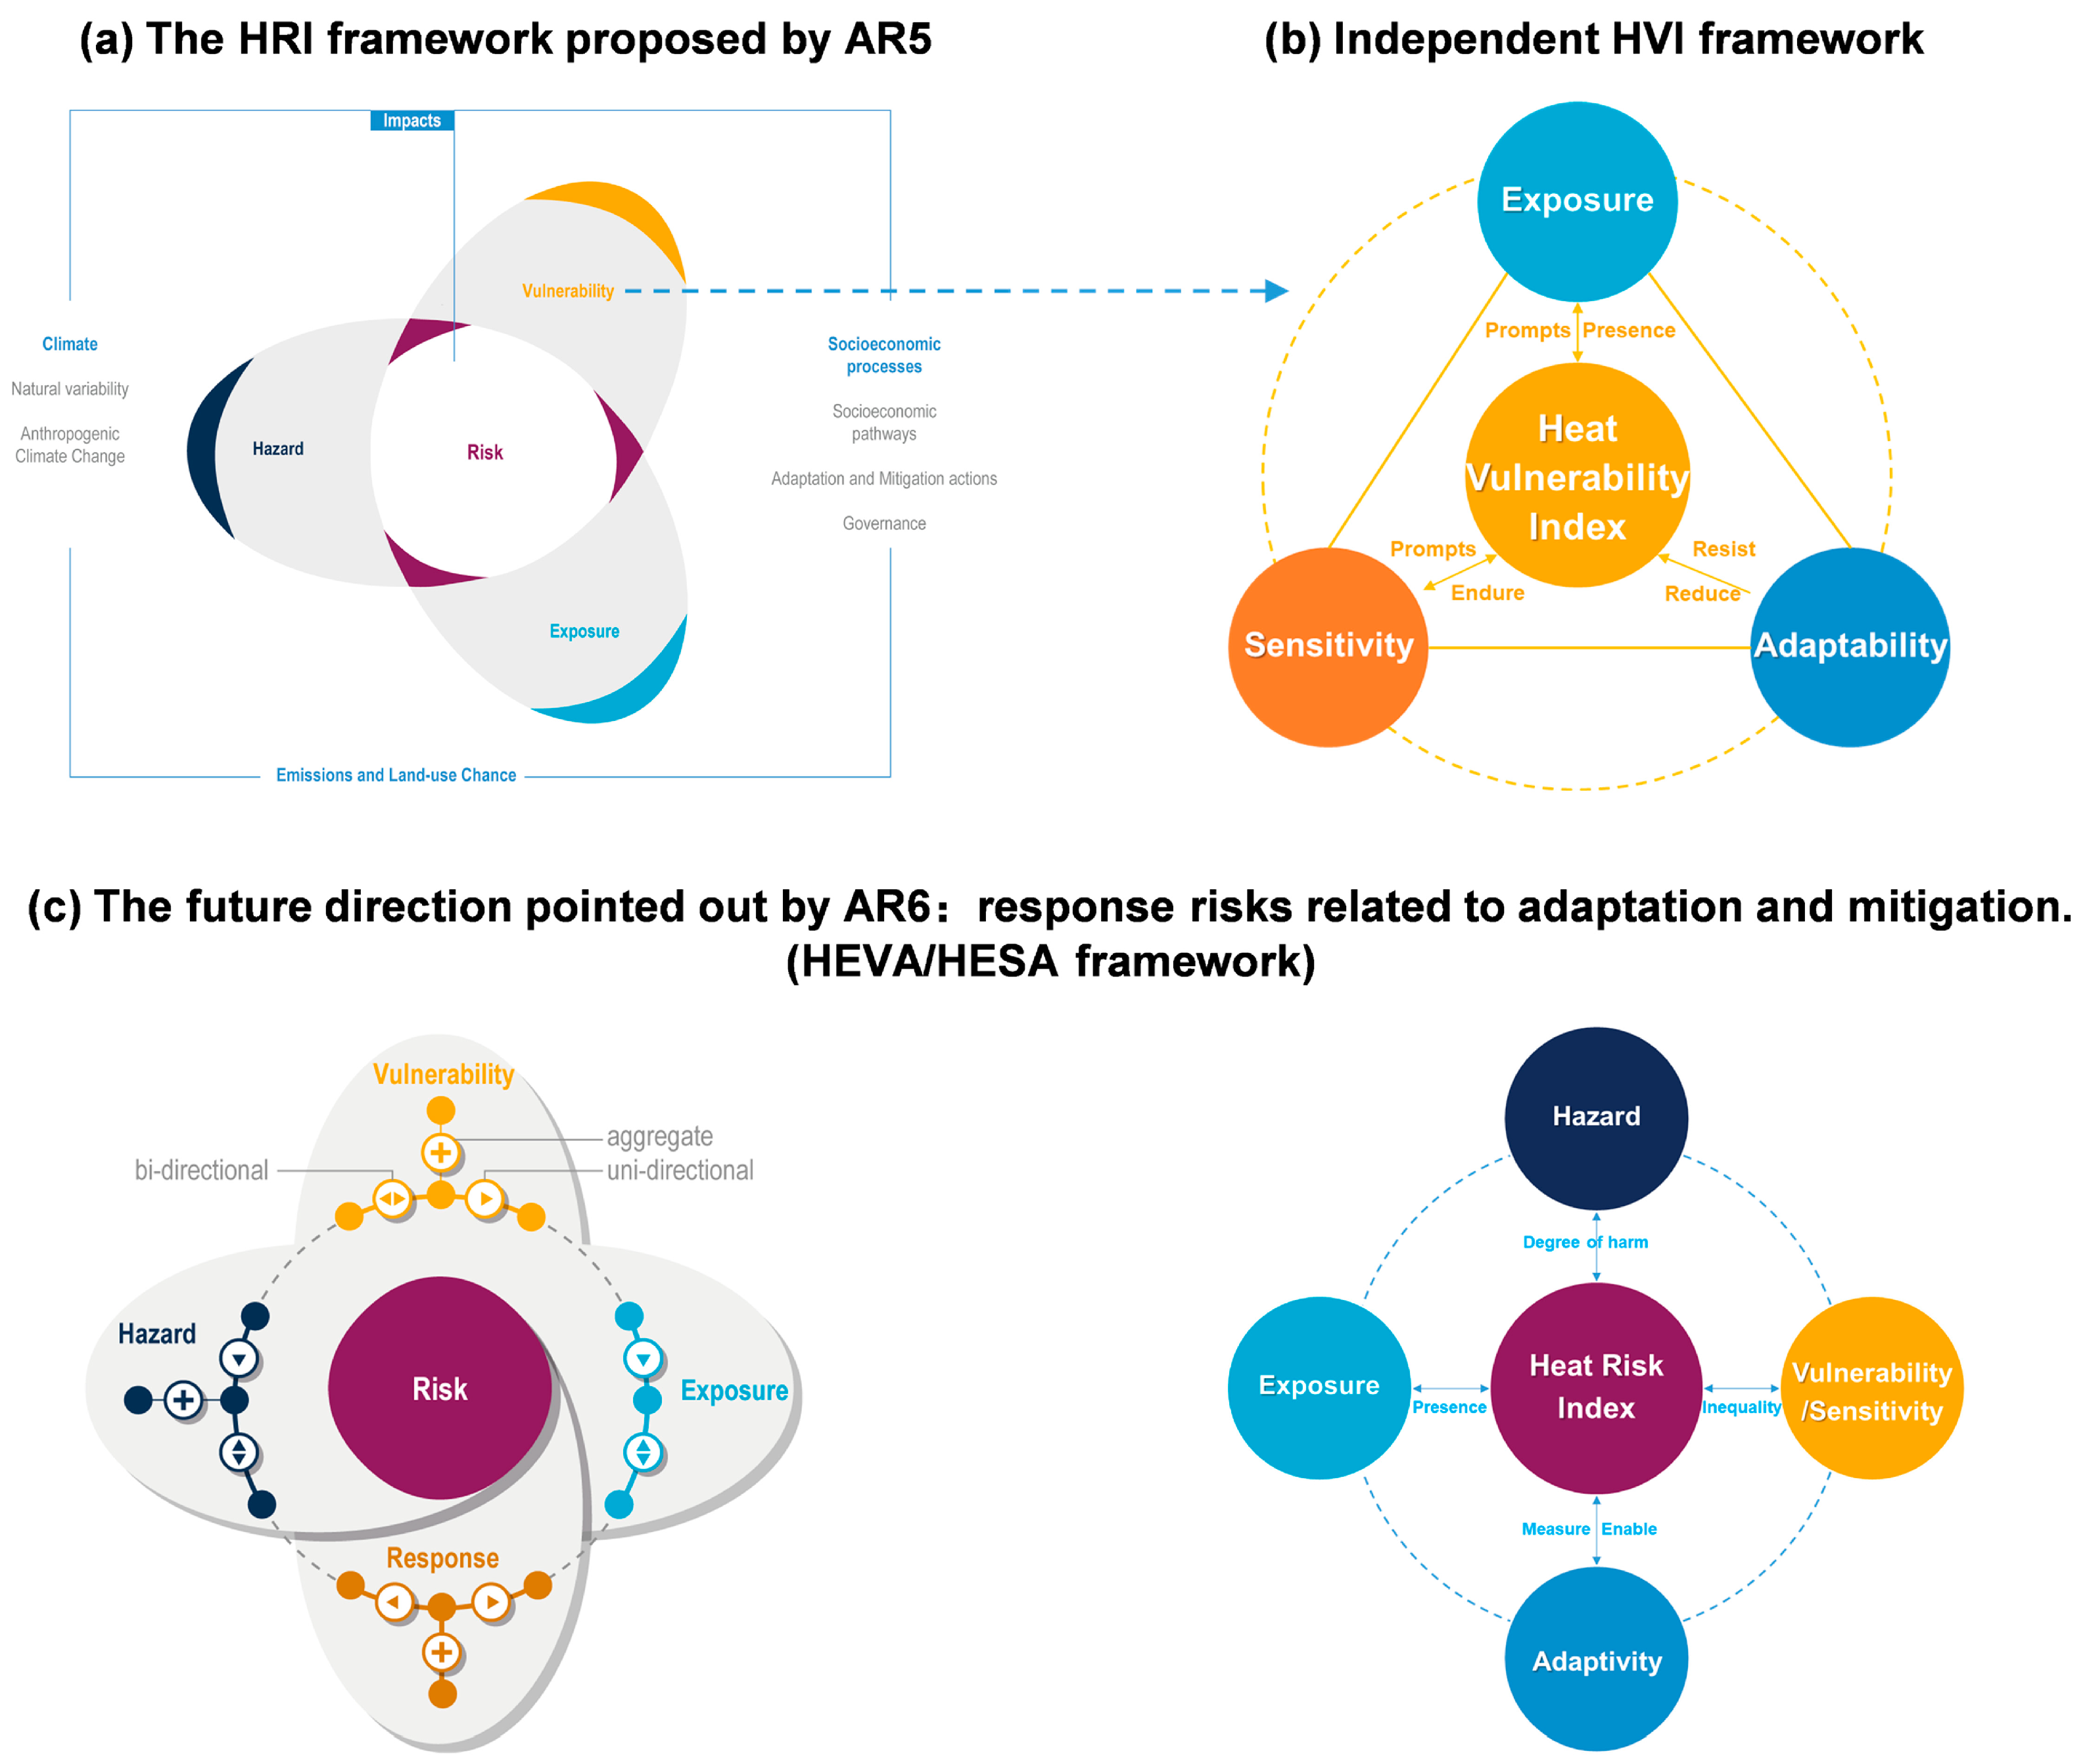
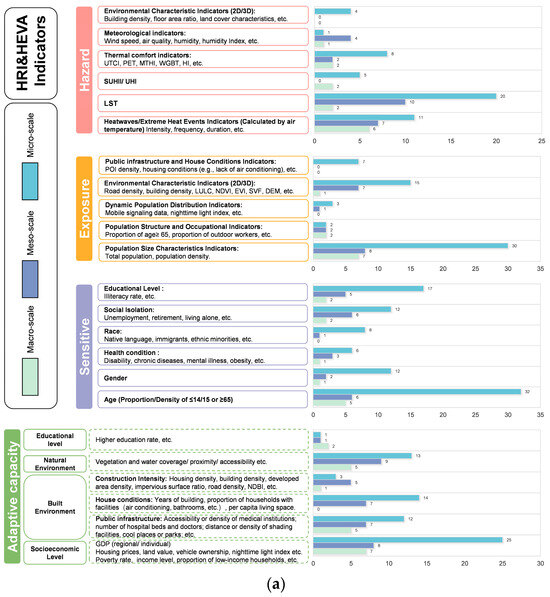
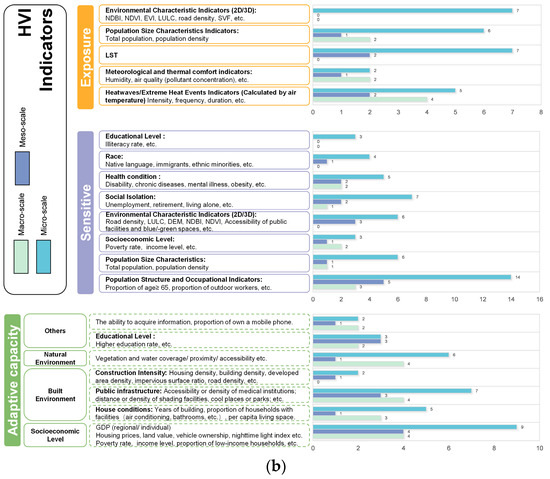
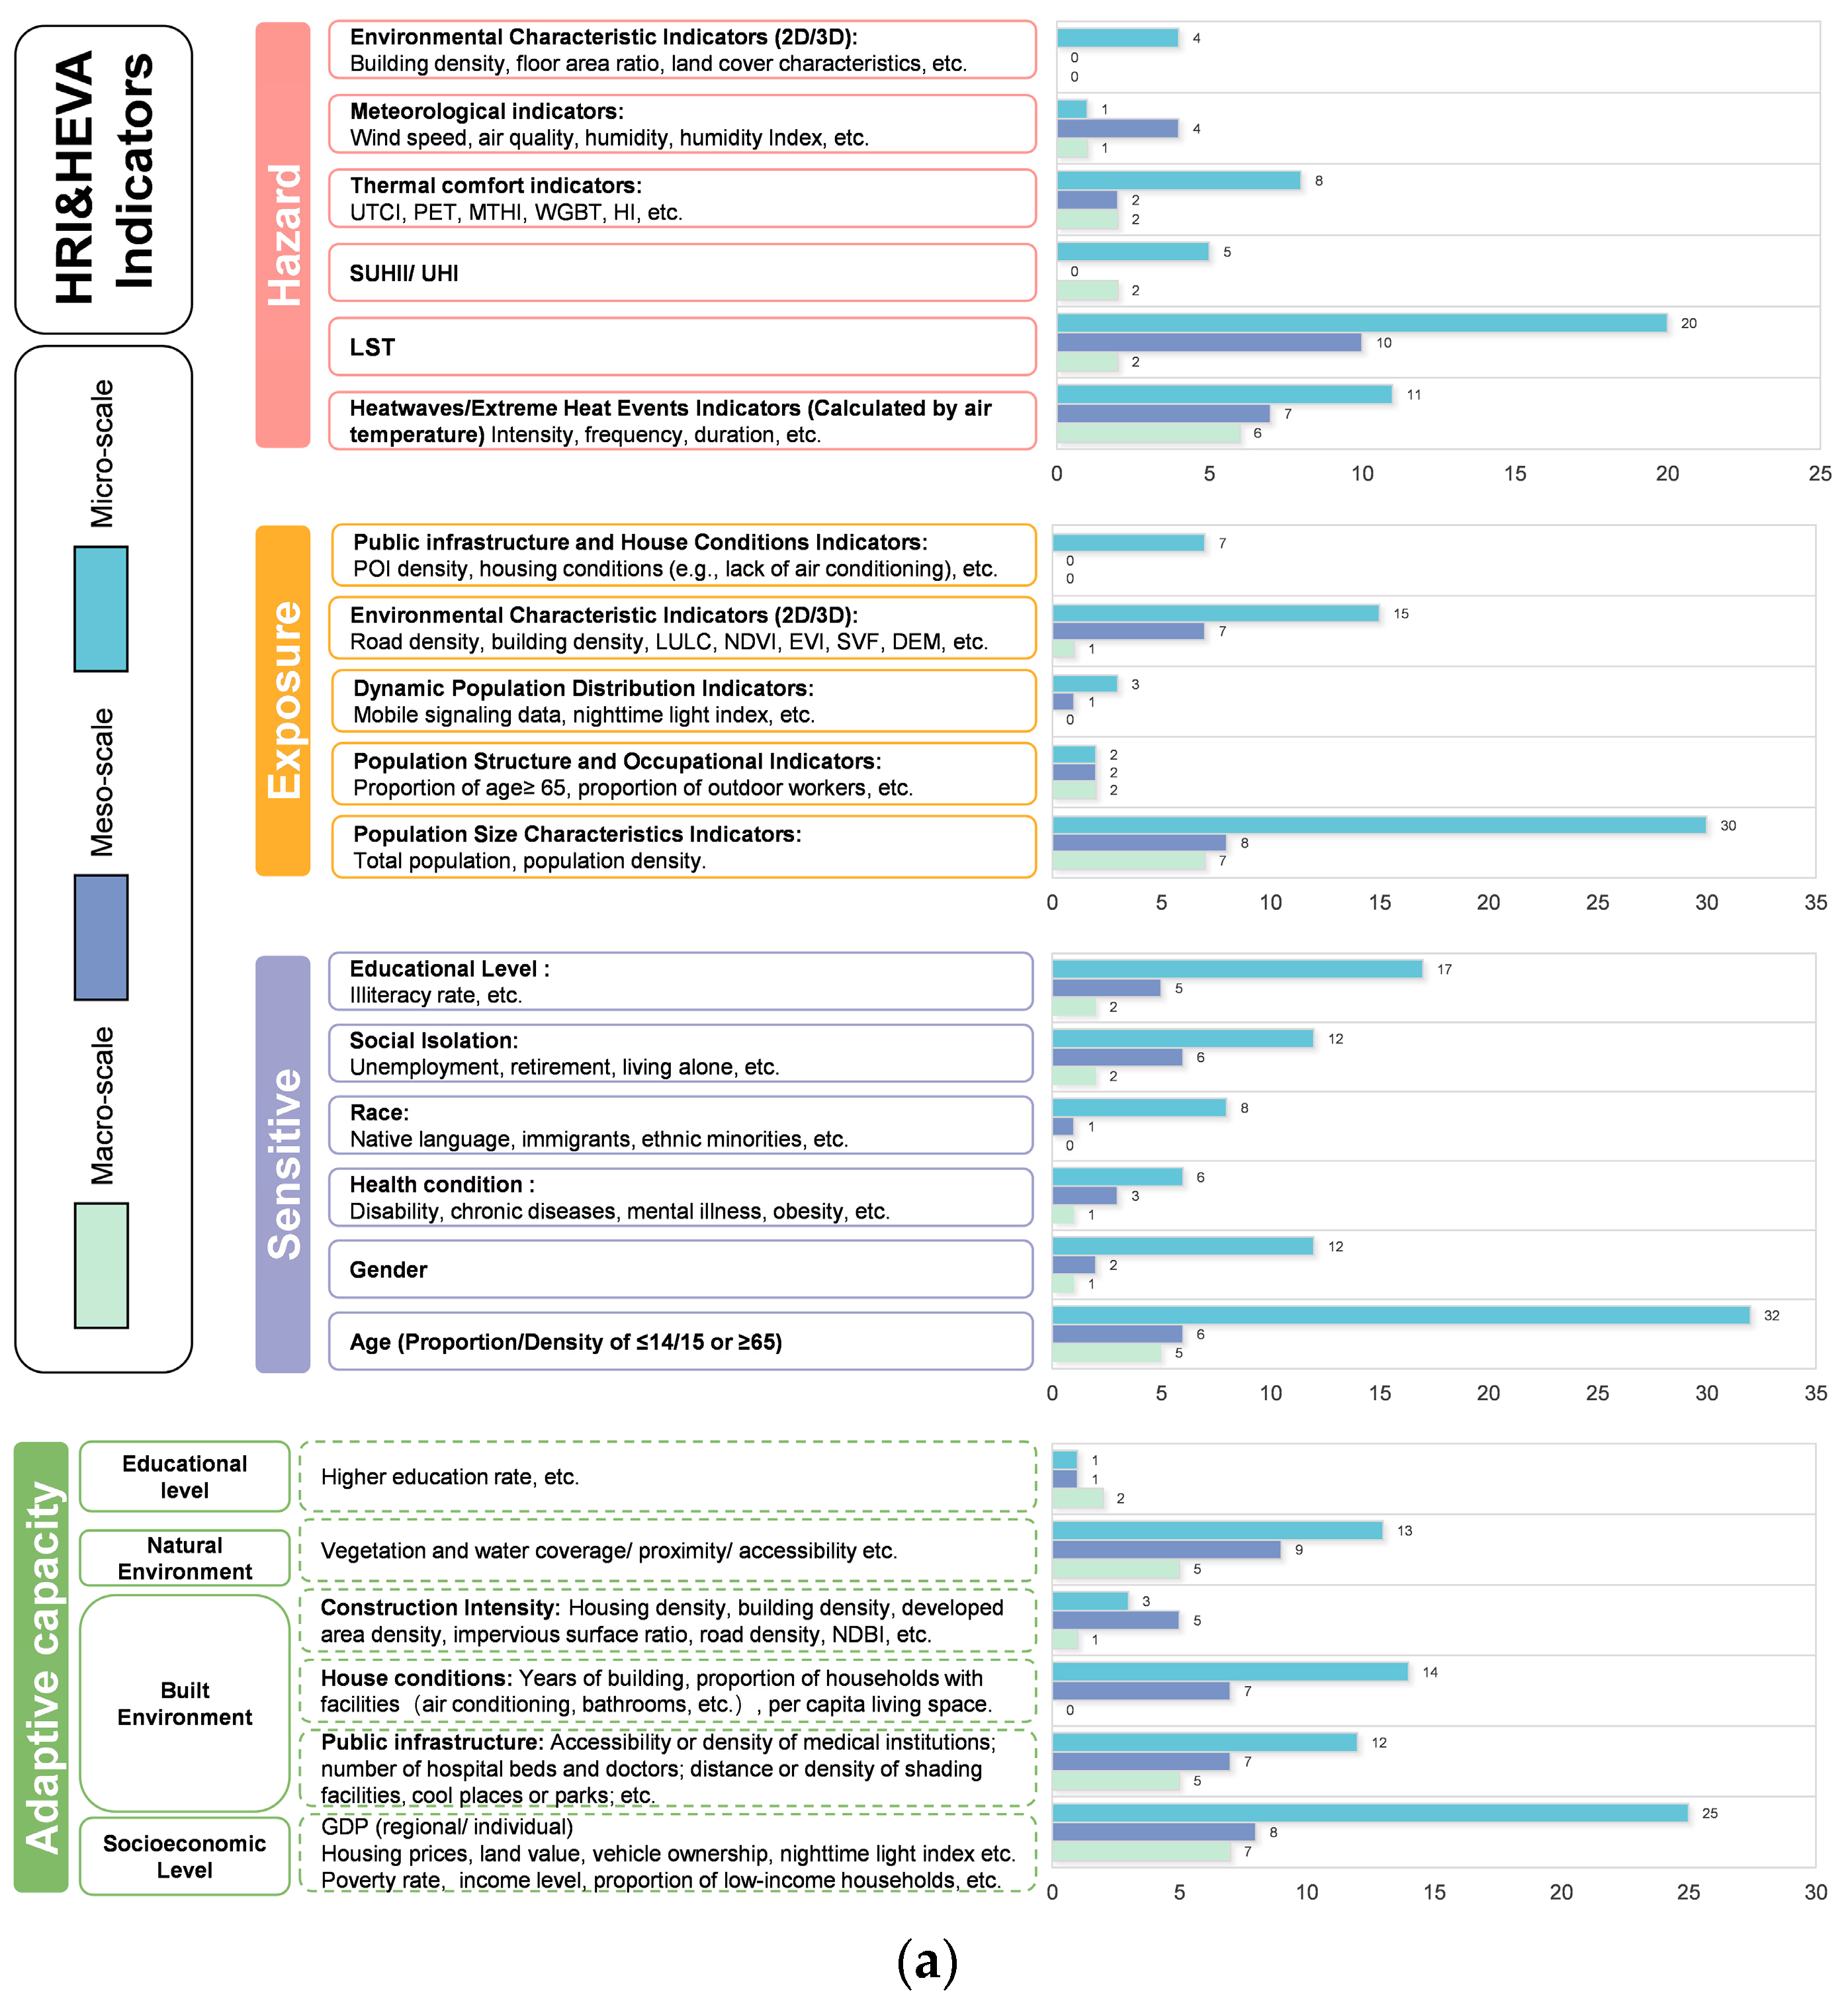
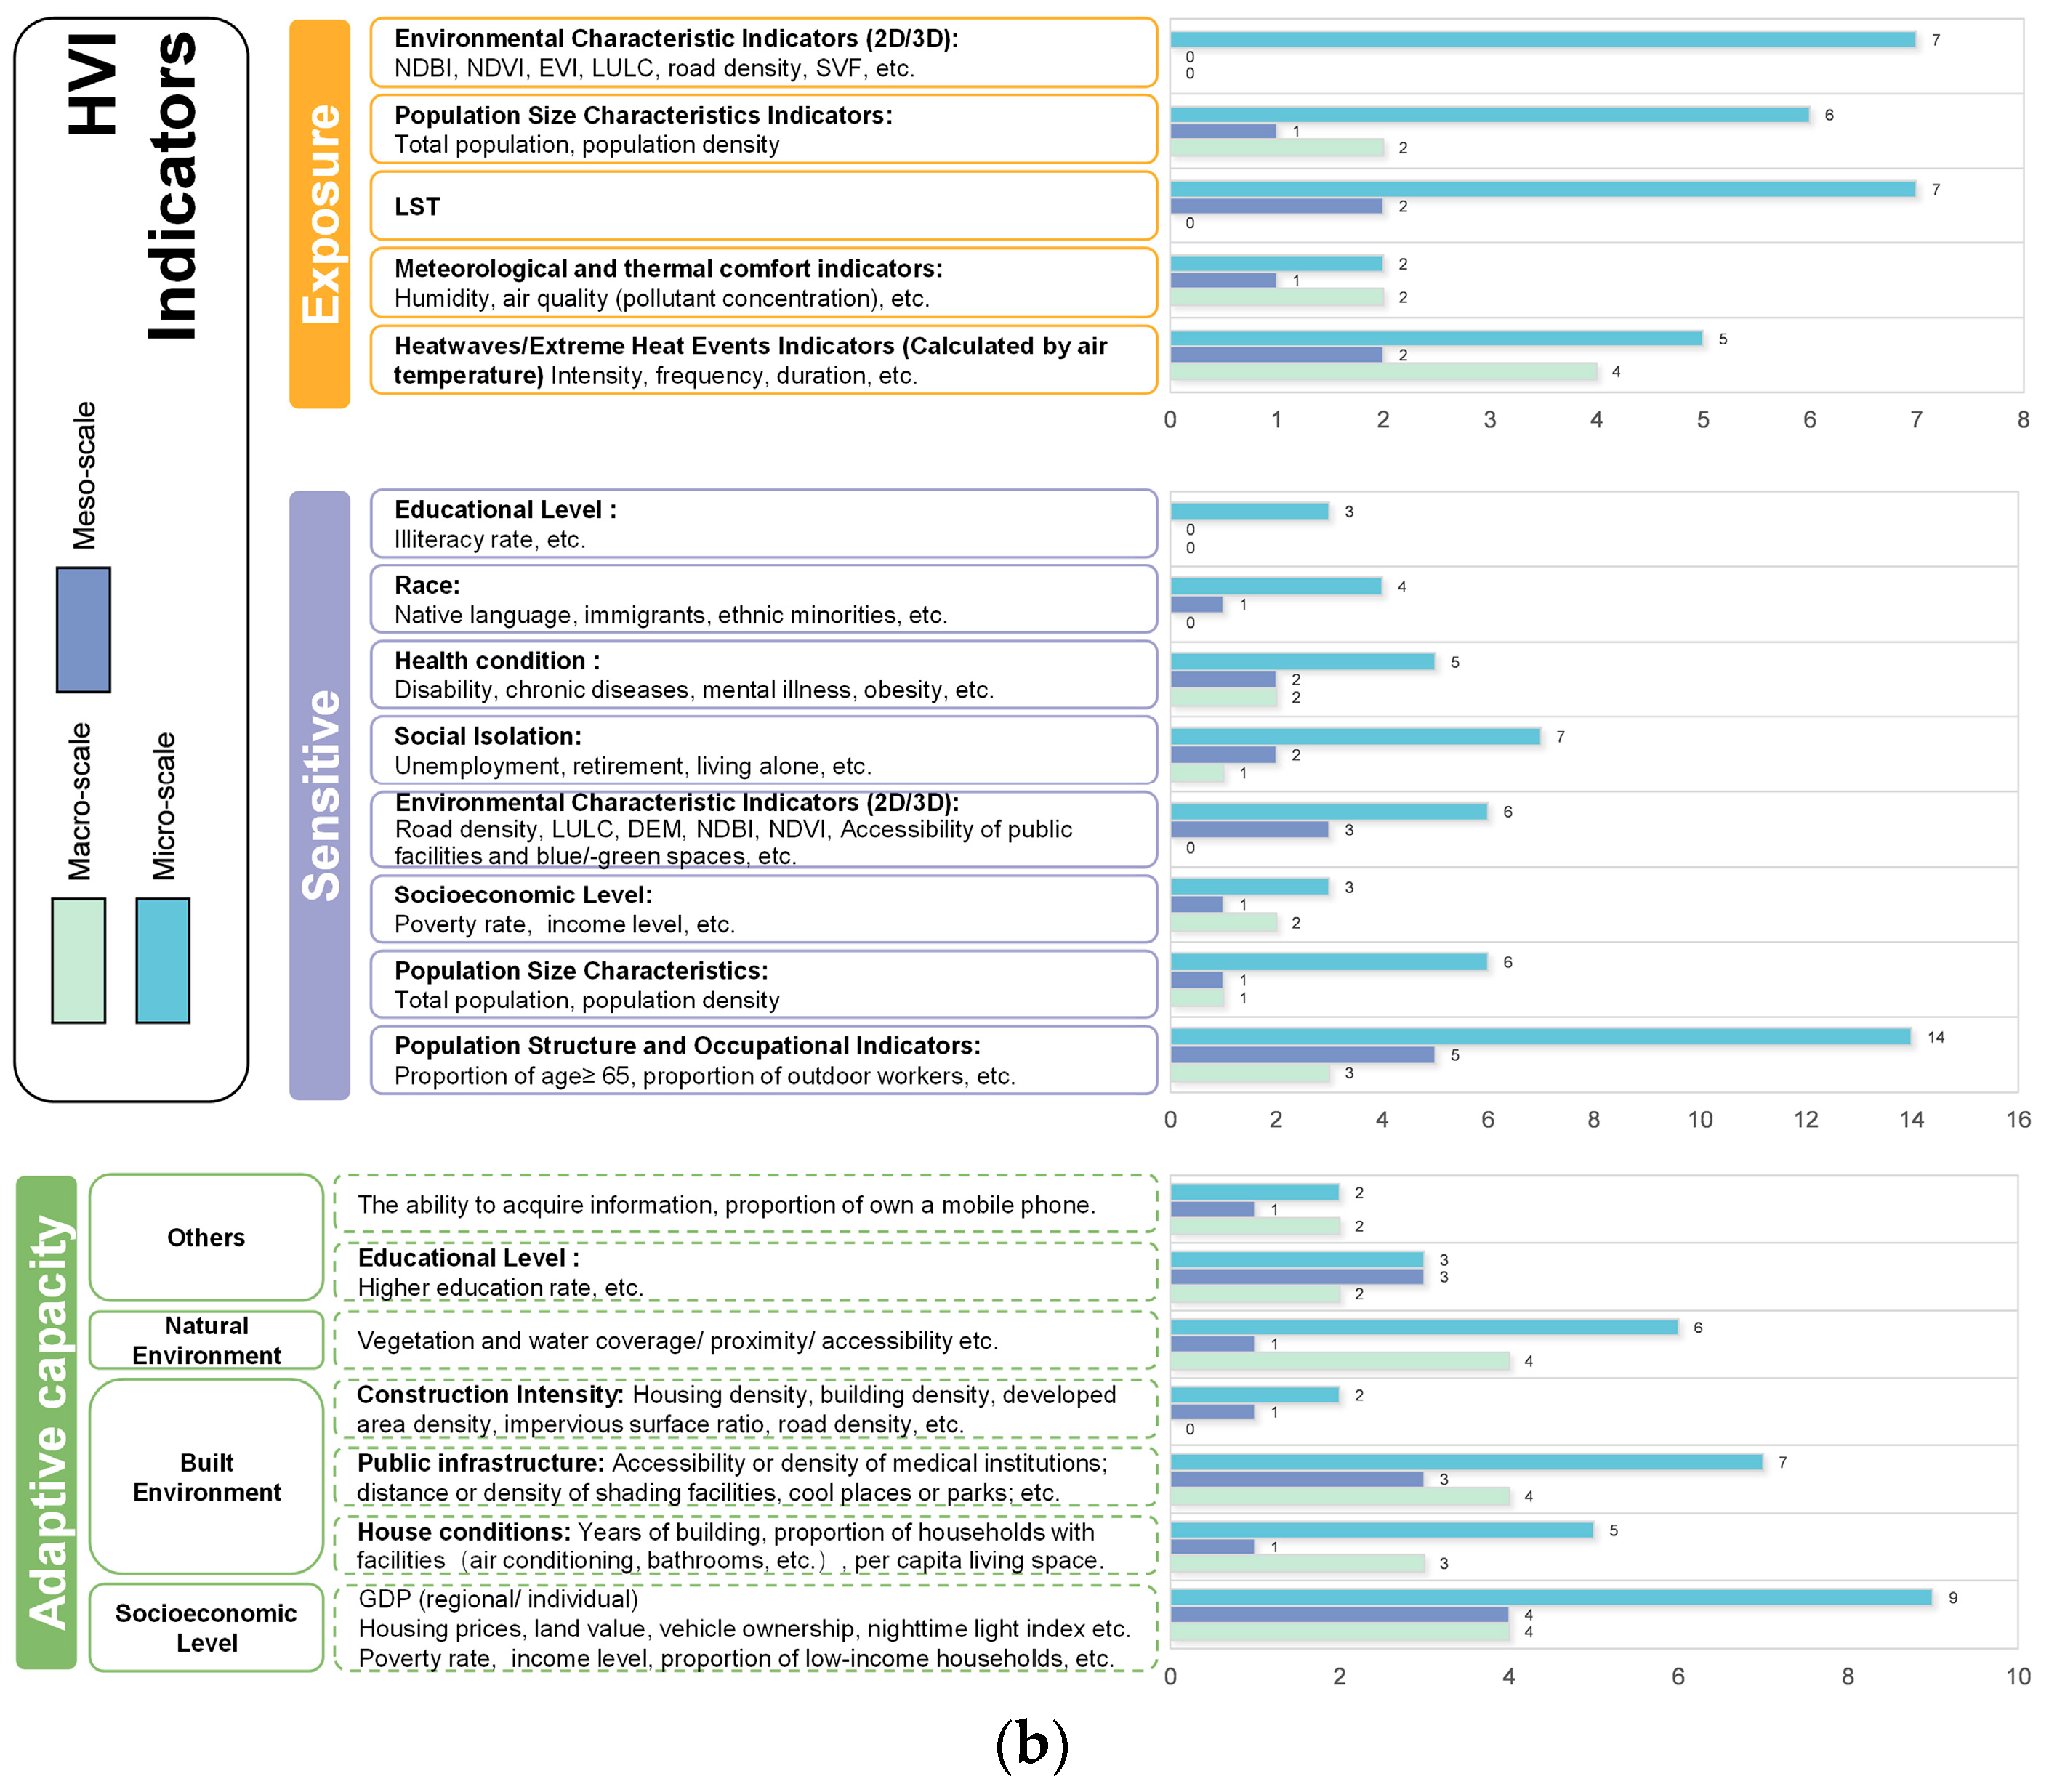
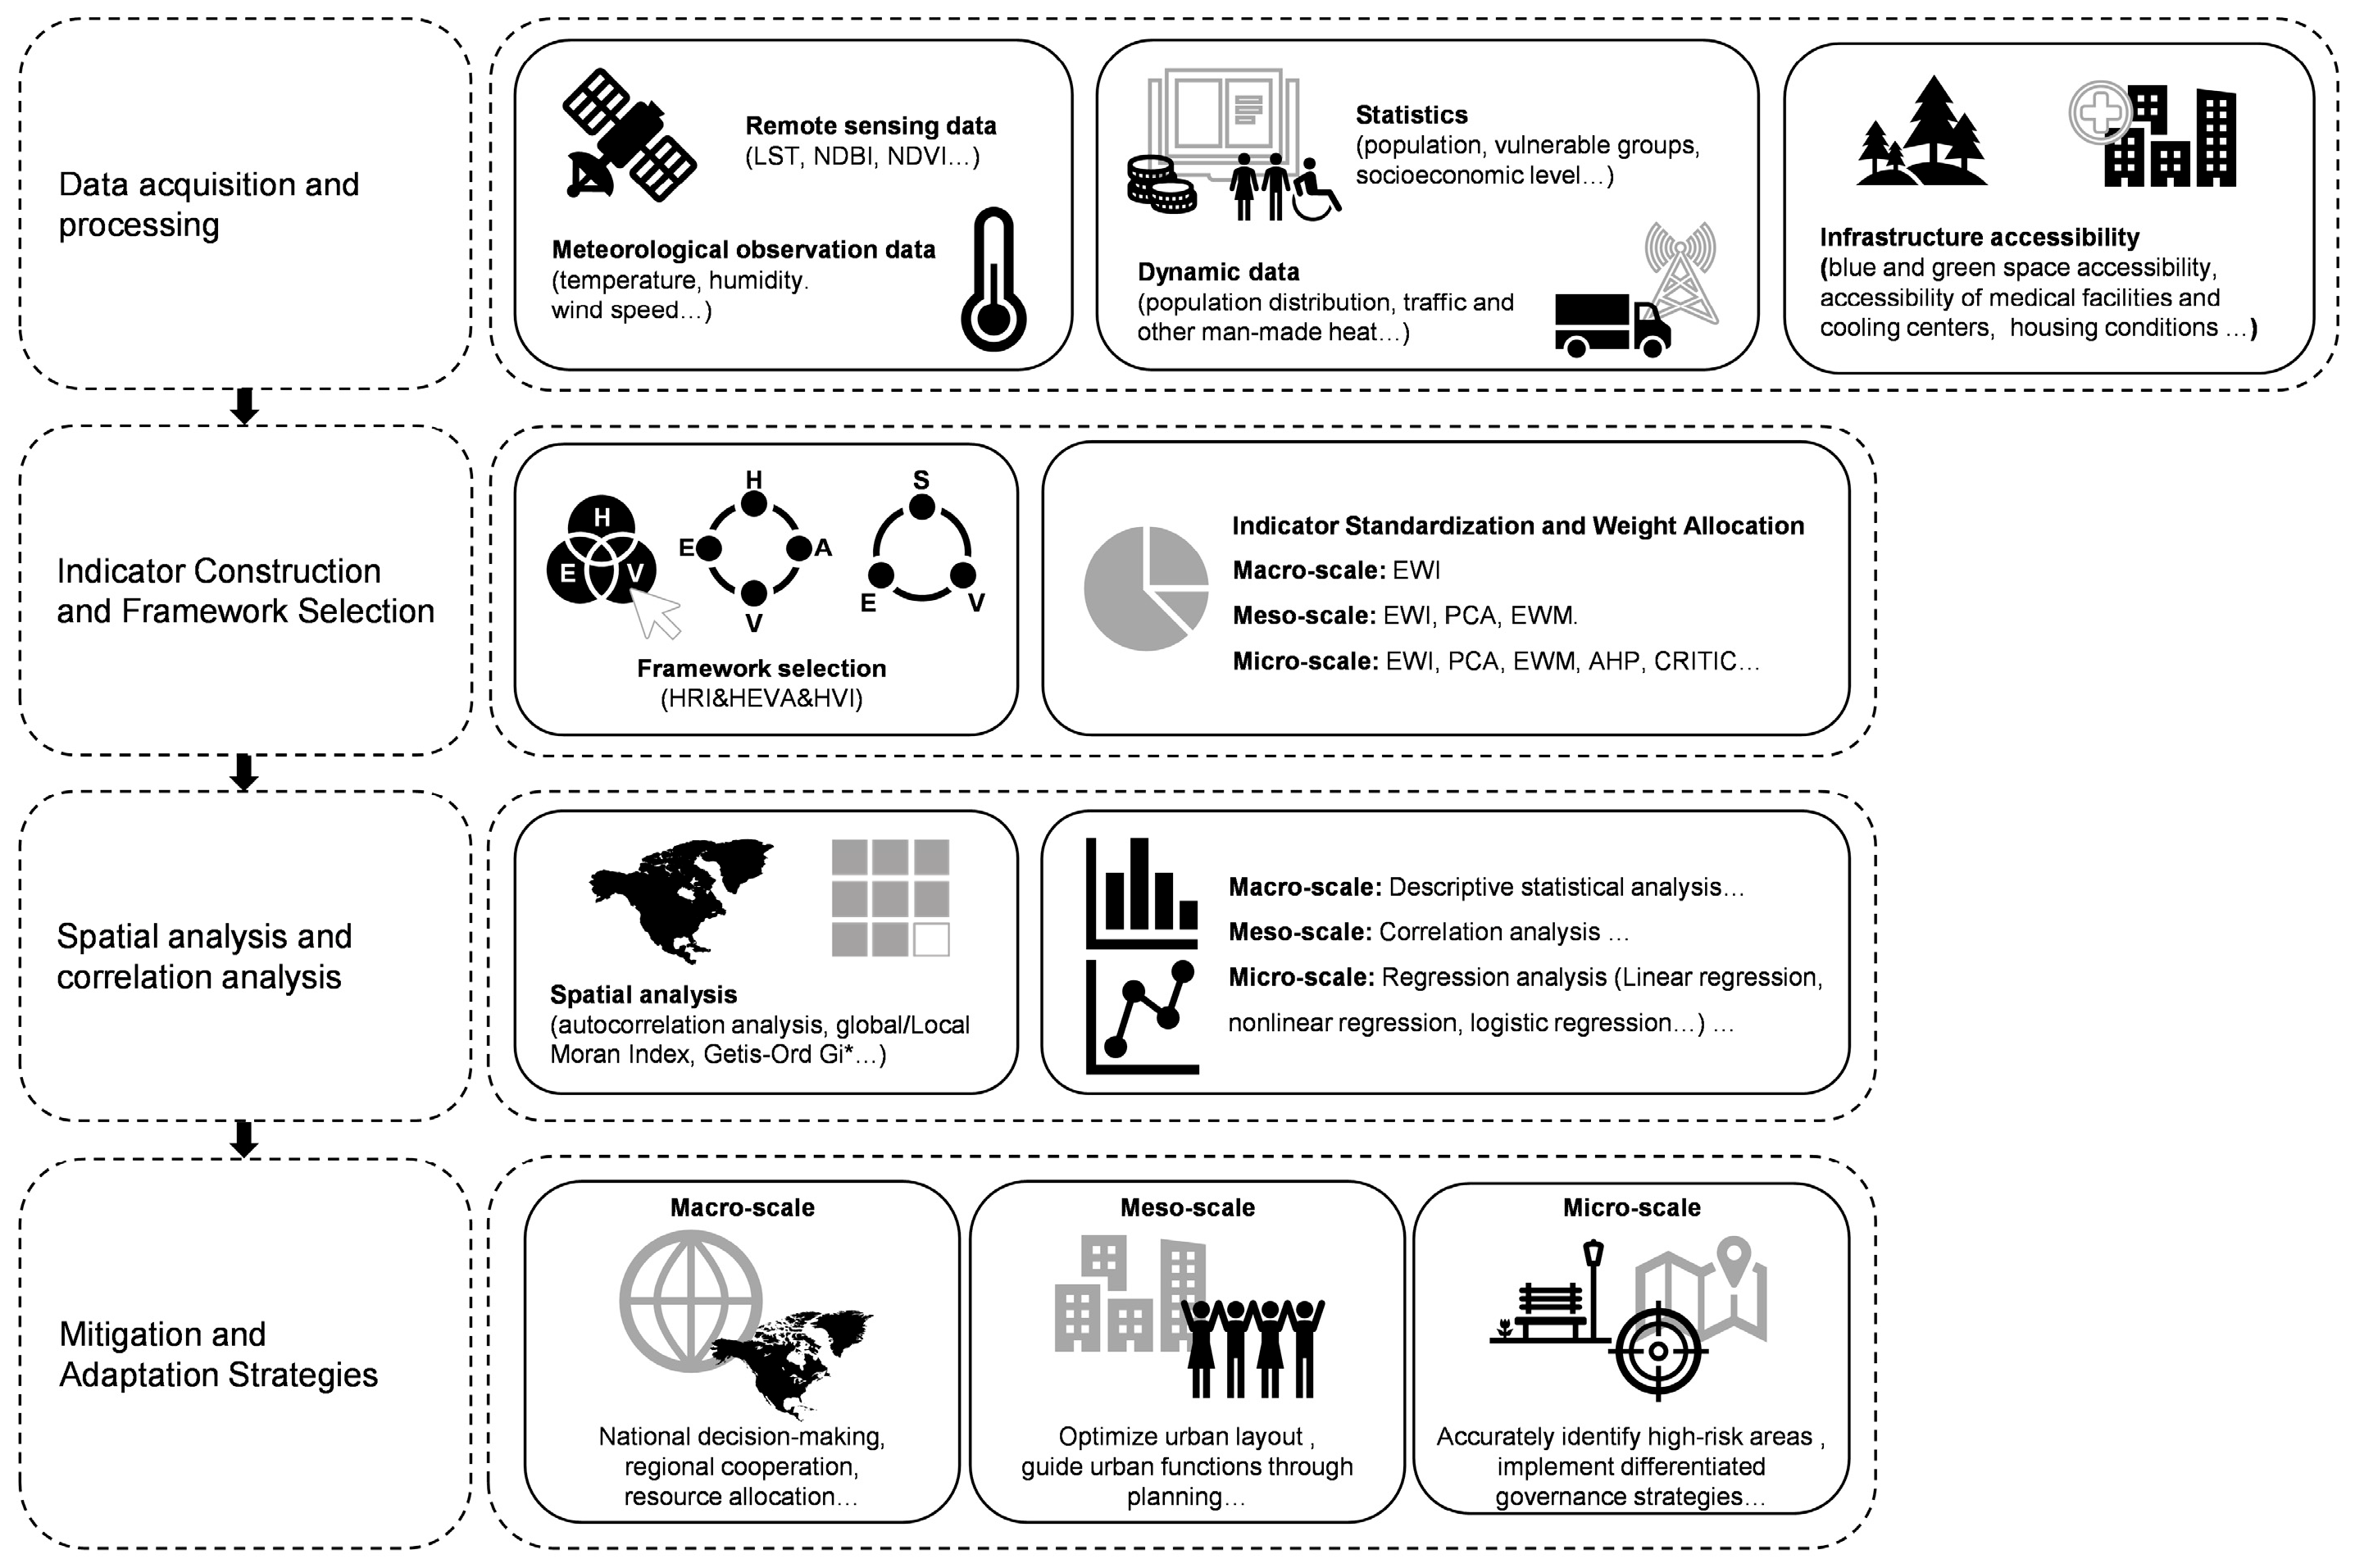
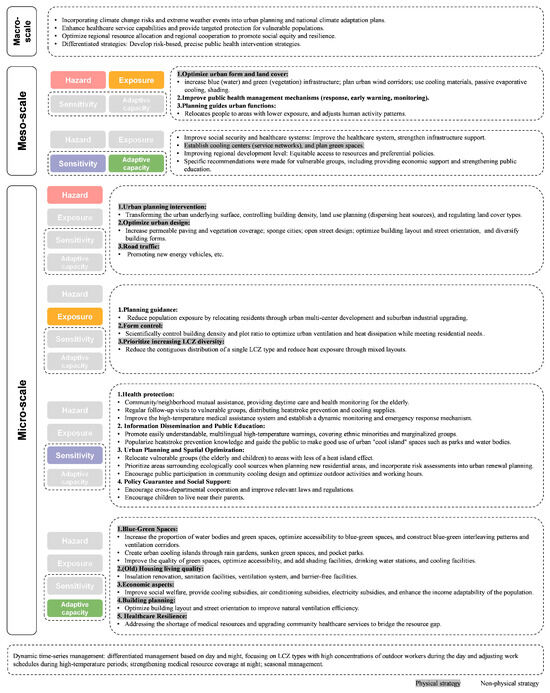
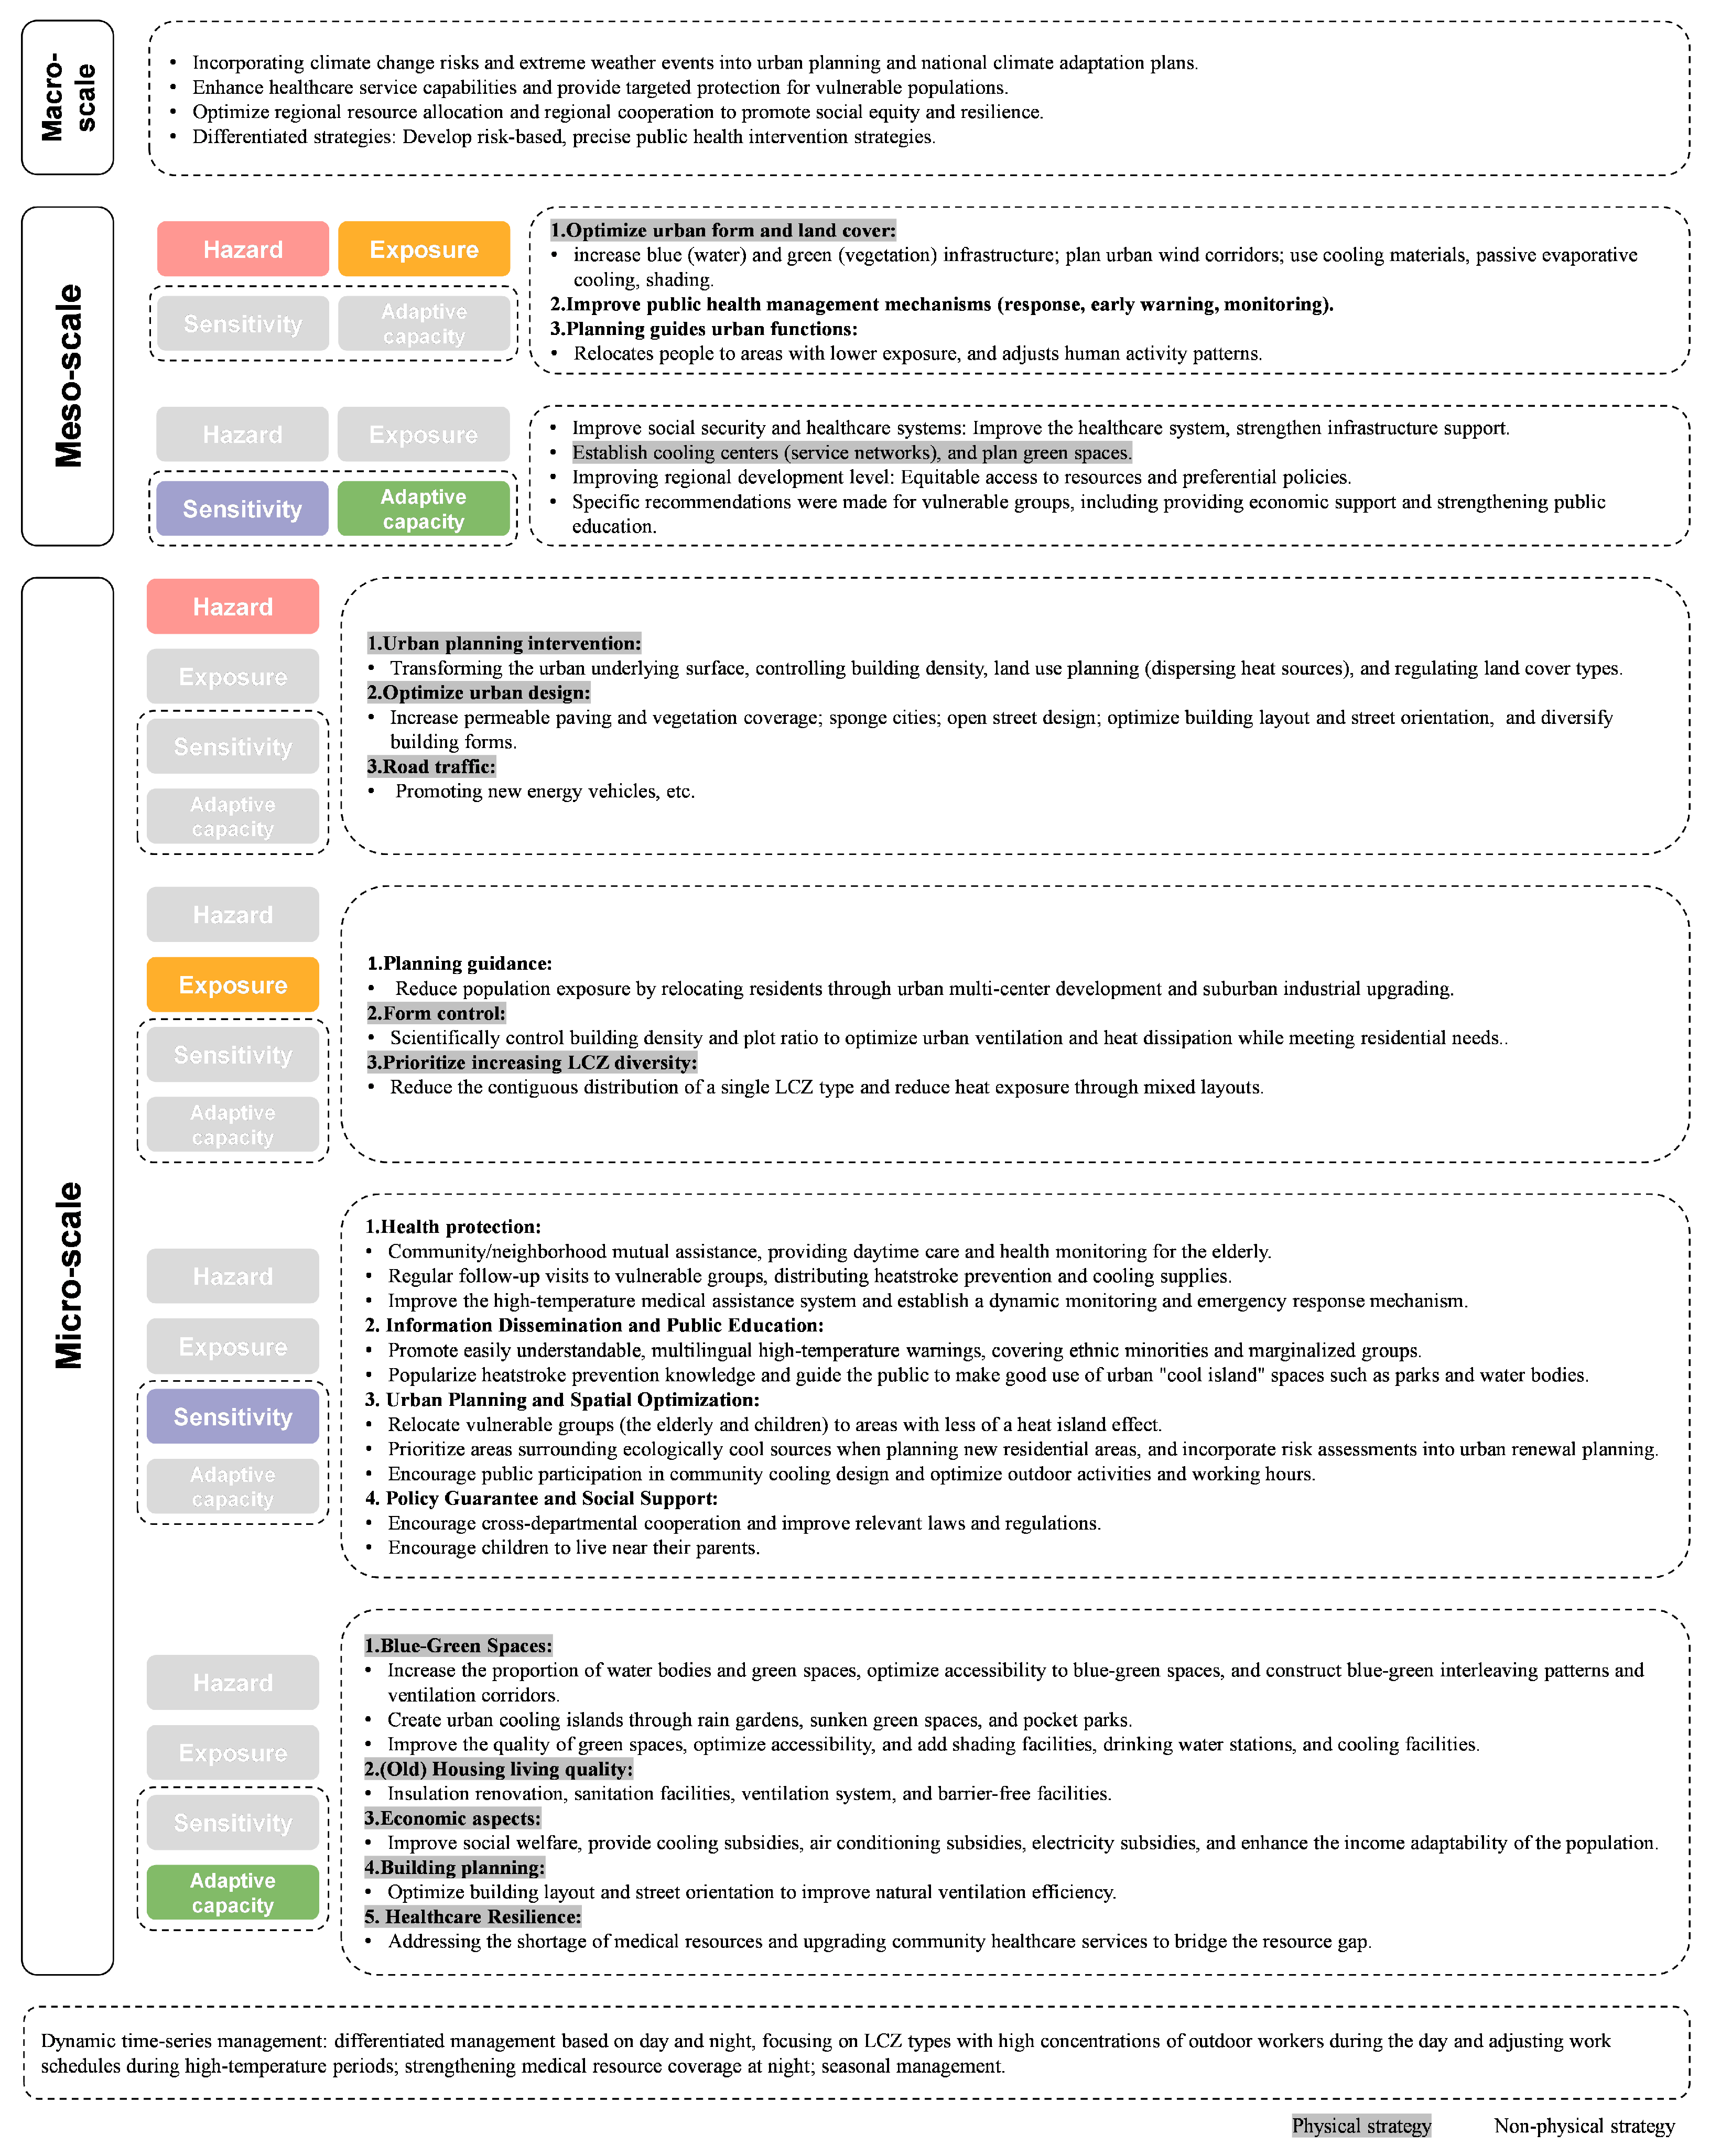

Disclaimer/Publisher’s Note: The statements, opinions and data contained in all publications are solely those of the individual author(s) and contributor(s) and not of MDPI and/or the editor(s). MDPI and/or the editor(s) disclaim responsibility for any injury to people or property resulting from any ideas, methods, instructions or products referred to in the content. |
© 2026 by the authors. Licensee MDPI, Basel, Switzerland. This article is an open access article distributed under the terms and conditions of the Creative Commons Attribution (CC BY) license.