


Abstract
In hot and humid regions, urban underground utility tunnels are susceptible to high temperature and humidity due to moist inlet air, cable heat dissipation, and limited ventilation jointly affecting the internal environment. To address this issue, an alternating ventilation strategy, in which fan operation is periodically reversed to switch between air supply and exhaust, is proposed. Compared to conventional mechanical ventilation, this strategy overcomes the constraints of unidirectional airflow and mitigates thermal and humidity stratification, with low retrofit requirements and good adaptability. Ventilation performance was evaluated using non-guarantee rates for temperature and relative humidity, i.e., the ratio of the number of measurement points where the temperature/relative humidity exceeds 40 °C/65% to the total number of measurement points in the utility tunnel (TNGR and RHNGR), non-uniformity coefficients (KT and KRH), and mean temperature (Tm). The alternating mode outperformed the conventional mode, reducing TNGR by 6.0% and Tm by 0.3 °C while improving temperature and humidity distributions and lowering cable temperatures. Although the reduction in Tm appears modest, it is practically meaningful because it helps weaken thermal stratification and local overheating, improves cable operating conditions, and may reduce the need for high-airflow operation when tunnel temperatures approach the permissible limit. Response surface methodology was further used to optimize the alternating ventilation parameters, indicating that the recommended fan commutation frequency is 2 under different inlet air temperatures. CFD validation confirmed the effectiveness of the optimized scheme. At an inlet air temperature of 35 °C, KRH decreased from 11.9% to 11.0% and Tm decreased from 37.5 °C to 36.9 °C.
1. Introduction
With the acceleration of urbanization, underground space resources are becoming increasingly scarce. Urban underground utility tunnels, as an important infrastructure that effectively integrates various pipelines such as electricity, water supply, and communications, have been developed rapidly [1,2,3].
The ventilation capacity of utility tunnels is limited, resulting in poor air circulation [4]. Lei et al. [5] monitored thermal and humidity conditions in utility tunnels and found that, under natural ventilation conditions, air velocity was low and airflow was largely stagnant. The high-temperature conditions within the cable compartments of utility tunnels have attracted considerable attention [6]. During routine operation, power cables generate a large amount of heat, and the thermal load on cable systems continues to increase with the growth in urban electricity demand [7,8]. High temperatures reduce cable performance. If heat is not dissipated in time, the tunnel temperature continues to rise, affecting power-supply stability [9,10], accelerating insulation aging [11,12,13,14,15], and potentially triggering fires [16,17]. In addition, excessively high humidity within integrated utility tunnels can lead to a deterioration of sanitary conditions [18,19]. Reference [19] indicates that in humid regions, condensation is likely to form on the inner walls of utility tunnels, which may lead to equipment corrosion and potential operational safety hazards. Excessive humidity compromises the operational safety of instruments and equipment within the pipe gallery, shortens their service life, and increases operating costs [20]. Therefore, effective control of temperature and humidity inside utility tunnels is essential for maintaining their safety and reliability [21].
Ventilation systems, rapidly developing technical systems installed in underground infrastructure, play an important role in improving the thermal environment of utility tunnels [22,23]. Effective ventilation serves as a reliable means of ensuring the safety and reliability of underground architectural spaces [24,25,26]. For instance, reference [26] proposed a hybrid natural–mechanical ventilation mode for tunnels during the operational transition period in high-geothermal environments, and developed a generally applicable method for determining the optimal number of operating fans. The research approach and methodology provide a useful reference for the ventilation optimization of utility tunnels in the present study. Meanwhile, research in the field of mine ventilation has provided important methodological references for ventilation control in underground enclosed spaces. Mine ventilation systems have long focused on key issues such as ventilation network assessment, wind resistance fault diagnosis, and optimization of air volume distribution under actual working conditions. The research ideas and technical methods can be extended to ventilation control and safe operation of integrated utility tunnels. For example, Shen et al. [27] constructed a machine learning fault diagnosis model based on WGAN-div and ResNet to address the problem of windage alteration in mine ventilation systems under unbalanced sample conditions, providing a new approach for intelligent monitoring and safety control of underground space ventilation systems; in Nguyen et al. [28], combining field measurements and numerical simulations, the operation mode of the main ventilation station of the coal mine ventilation system is evaluated and optimized. Its network analysis and air volume control methods have reference value for the optimization of the integrated pipe gallery ventilation system. In recent years, many scholars have studied the ventilation system of underground buildings based on numerical simulation, and their focus has gradually extended from general underground spaces to specific scenarios such as integrated pipe corridors. In terms of ventilation efficiency evaluation, Ahn et al. [29] found through the study of mechanical ventilation system in underground parking lots that the ventilation method combining downward air supply and near-ground air supply is the most efficient. However, Li et al. [30] pointed out in their study on air movement in an underground hydropower station that simply increasing the wind speed cannot effectively improve the indoor air exchange effect, suggesting that the ventilation effect is affected by the coupling of multiple factors. For integrated pipe corridors, a typical underground enclosed space, researchers have further focused on cable heat dissipation and temperature and humidity distribution. Wang et al. [31] analyzed the influence of ventilation volume, cable location and other factors on the temperature field of the compartment, and the results showed that a reasonable ventilation system design can maintain cable performance and improve the temperature field. On this basis, Wang et al. [32] used a combination of numerical simulation and experimental verification to compare the velocity field and temperature field differences between conventional integrated pipe corridors and those with added fireproof compartments, and found that opening an additional fireproof door can reduce the average temperature in the pipe corridor by 3.25 °C (air exchange rate 2 times/hour). Wang et al. [33] conducted a numerical study on the thermal environment of the heating compartment in a utility tunnel under mechanical ventilation conditions. They found that, under extreme conditions, the air temperature in the first 50 m of a ventilation interval could fall below 0 °C. They proposed using piston wind generated in an adjacent subway tunnel as the ventilation air source to improve the thermal environment of the heating compartment. In addition, some scholars have tried new ventilation schemes. Although the wall-attached ventilation studied by Li et al. [34] can provide high ventilation efficiency and uniform velocity field, it requires many ventilation openings to be arranged above the inner wall of the pipe gallery, which limits its practical engineering application. In summary, existing research has made some progress in improving the ventilation performance of integrated pipe galleries, but the system optimization of temperature and humidity coupling characteristics under high temperature and high humidity environments is still insufficient.
Although the aforementioned ventilation studies provide important references for the ventilation design of utility tunnels, large-scale retrofitting of existing tunnels is challenging due to practical engineering constraints. Currently, utility tunnels in high-temperature, high-humidity regions, designed with traditional mechanical supply and exhaust ventilation systems, often exhibit persistent high-temperature zones caused by heat accumulation [35]. Existing research shows a relative scarcity of studies on the thermal and humidity distribution characteristics within utility tunnels in high-temperature, high-humidity regions. Consequently, there is a lack of effective guidance on technical measures aimed at improving the ventilation performance of existing operational utility tunnels.
This study proposes an alternating ventilation strategy based on existing ventilation facilities. Unlike conventional mechanical ventilation with unidirectional airflow, piston wind ventilation that depends on traffic induced piston effects [33], and wall-attached ventilation that relies on guided attached jets [34], the proposed strategy periodically reverses the airflow direction, thereby alternating the air supply and exhaust functions. This operation can weaken the stable temperature and humidity stratification that tends to develop under unidirectional ventilation. To address the problems of high temperature, high humidity, and local overheating in utility tunnels located in hot and humid regions, the proposed method regulates the internal temperature and humidity environment by optimizing fan control logic rather than simply increasing the air change rate. It does not require major structural modification of the tunnel and remains compatible with existing ventilation facilities. Therefore, it may provide a practical retrofit option for existing utility tunnels with relatively low implementation difficulty.
This paper uses numerical simulation to analyze the conventional ventilation scheme for an integrated utility tunnel compartment nearing commissioning in a hot and humid region. Based on the existing ventilation infrastructure, an alternating ventilation scheme is proposed and further investigated. The main objectives are to: (1) analyze the thermal and humidity fields under conventional ventilation; (2) evaluate the ability of alternating ventilation to improve the internal environment; and (3) examine the coupled effects of air change per hour (ACH), fan commutation frequency (FCF), and inlet air temperature (Ti) to determine suitable operating parameters. The results are expected to provide guidance for ventilation, retrofitting and design optimization of existing utility tunnels and similar underground structures in hot and humid regions.
2. Methodology
2.1. Mathematical Modeling
In this study, an underground utility tunnel located in southern China was selected as the study object. The total length of the utility tunnel is 360 m, and ventilation openings connecting to the outdoor environment are installed at both ends of the tunnel. A normally open fire door has been installed at the midpoint along the tunnel length, while the tunnel walls are constructed of concrete. The tunnel contains 10 kV power cables, 110 kV power cables, communication cables, and water supply pipelines; a schematic model of the studied tunnel is shown in Figure 1. Based on previous studies [32,34,36], which showed that the volume of cable supports and pipe supports inside the tunnel are relatively small and have a negligible influence on airflow, they were neglected in the model. The cross-sections of cable trays were simplified to rectangles, while those of cables and water supply pipelines were simplified as circles and that of the utility tunnel was simplified to a rectangle with a width and height of 3 m. This geometric simplification was based on previous research methods [32,34,36] and common CFD practices. The detailed structures of cable trays and pipes may influence local airflow separation, near-wall turbulence, and heat transfer around cables to some extent. However, compared with the dominant effects of cable heat release, longitudinal ventilation, and the throttling and mixing effects of fire doors, these local geometric details have a limited influence on the macroscopic airflow field and the overall temperature and humidity distribution. Therefore, simplified geometry was adopted to reduce mesh complexity and computational cost while maintaining the main thermal and flow characteristics of the utility tunnel.
Figure 1.
Model of underground utility tunnel.
2.2. Governing Equations
The flow and heat transfer of moist air inside the utility tunnel are governed by the conservation equations of mass, momentum, energy, and species [37], as follows:
where is the fluid density (); , , and are the velocity components in the x, y, and z directions (); is time (s); is the velocity vector (); is the pressure (Pa); is the dynamic viscosity (); is the gravitational acceleration (); is the temperature (°C); is the thermal conductivity ; is the internal heat source (); and is the specific heat capacity at constant pressure ().
Component conservation equation:
where is the mass fraction of water vapor; is the effective diffusion coefficient of water vapor; is the source term of water vapor; is the turbulent viscosity; and is the turbulent Schmidt number.
2.3. Simulation Conditions and Solution Settings
2.3.1. Simulation Conditions
The ventilation strategies investigated in this study included conventional ventilation and alternating ventilation. In the conventional mode, fresh air is supplied through a fixed inlet at one end of the tunnel and exhausted through a fixed outlet at the other end. The alternating ventilation scheme, as illustrated in Figure 2, is defined as a ventilation mode in which the airflow direction is periodically reversed at fixed time intervals based on conventional ventilation. Specifically, after a period of mechanical air supply at the inlet, the fan was reversed, and the supply mode was switched to exhaust. Correspondingly, after a period of mechanical exhaust at the outlet, the fan was reversed, and the exhaust mode was switched to supply. The number of airflow reversals within 30 min (excluding the 30th minute) is defined as the fan commutation frequency (FCF). For example, if the airflow direction is reversed every 10 min (i.e., at 10, 20, and 30 min), the FCF is 2. For comparison, the numerical simulation conditions were set as listed in Table 1.
Figure 2.
Schematic diagram of alternate ventilation air flow path.
Table 1.
Simulation conditions and parameter settings.
The fan reversing frequency (FCF) is based on the air exchange time τ (τ = V/Q, where V is the tunnel volume and Q is the volumetric airflow) and is set to be shorter than the air exchange time τ. For example, for ACH = 4 h−1 (baseline condition), τ is 15 min, which means that under the condition of ACH = 4 h−1, it takes about 15 min for the air in the tunnel to be completely replaced. If FCF = 2 (reversing at 10 min, 20 min, and 30 min), this switching cycle (10 min) is set to be shorter than the air exchange time τ = 15 min to ensure that the airflow direction has been reversed before the tunnel is completely flushed with fresh air. This design aims to disrupt the stable thermal and moisture stratification formed under unidirectional ventilation and enhance mixing without waiting for complete air exchange.
2.3.2. Boundary Conditions and Solution Settings
In the simulations, both the air inlet and outlet were specified as velocity boundary conditions. In Fluent, reversing the airflow direction is achieved by modifying the sign of the velocity value: a positive velocity value indicates airflow entering the computational domain, corresponding to supply air; a negative velocity value indicates airflow leaving the computational domain, corresponding to exhaust air. During the calculation process, by switching the signs of the velocities at the two ports, the airflow direction can be reversed, completing the switching between supply and exhaust functions, thus achieving the effect of reversible ventilation. Based on previous studies [38,39,40] and relevant standards [41], the initial temperature and humidity in the utility tunnel prior to ventilation were assumed to represent the most unfavorable conditions, with the initial temperature set to 40 °C and the initial relative humidity set to 100%. The Species Transport Model can solve the mass fractions of individual components during transport processes and is well-suited to describe air–water vapor transport; therefore, this model was adopted to simulate the mixing and transport of water vapor and air. Internal components, such as cables, were treated as no-slip boundaries, and the tunnel walls were also assigned no-slip boundary conditions [42]. Considering that the tunnel crown was located 15–22 m below ground level, with a large cross-sectional area of 3 m × 3 m, the internal airflow velocity was low, and near-wall air temperature and flow fluctuations were relatively stable, with the wall temperature being minimally influenced by the internal air temperature and humidity. Wang et al. [32] assumed a spatially uniform, constant wall temperature in their numerical simulations, while Ma et al. [36] applied the average wall temperature measured along the tunnel length as the thermal boundary condition. Based on previous studies and to simplify the model, the tunnel walls were specified as constant-temperature boundaries. According to long-term field measurements, the annual fluctuation in the in-service tunnel wall temperature is approximately 0.3 °C; therefore, the wall temperature was set to the measured average of 28.2 °C in this study, and the relative humidity of the inlet air was set to 65%. Components such as water-supply pipes conveying ambient-temperature water and communication supports, which have a negligible influence on ventilation heat transfer, were treated as adiabatic boundaries. The heat generation rates of the 10 kV and 110 kV cables were set to 17.1 W/m and 33.2 W/m, respectively [43].
The governing equations were solved using the PISO algorithm implemented in the commercial software ANSYS Fluent 2022. The Boussinesq approximation was applied to the air density term to better represent the influence of cable heat release on air density variations inside the utility tunnel. The residuals of all governing equations were controlled below 10−3, while a stricter convergence criterion of 10−6 was adopted for the energy equation. By continuously monitoring the numerical variation in the average tunnel temperature, it was confirmed that the temperature fluctuation remained within ±0.01 °C over a calculation period of 30 s, while the mass flow deviation at the tunnel inlet and outlet remained within 5% [24]. All key parameters reached a stable state, ensuring the reliability and accuracy of the simulation results. The tunnel walls were defined as concrete, and the working fluid inside the tunnel was air. The thermophysical properties of the main materials are listed in Table 2.
Table 2.
Thermophysical properties of primary materials.
2.4. Grid-Independent Verification
The mesh size directly affects the accuracy of the numerical results and also determines the total number of cells. In theory, a finer mesh leads to more accurate simulation results. However, mesh refinement significantly increases the number of grid elements, resulting in longer computational time and greater resource demands. Therefore, it was necessary to determine an appropriate mesh resolution that ensured both computational efficiency and numerical accuracy [44,45].
A hybrid mesh consisting of tetrahedral and hexahedral elements was adopted in this study. This meshing approach, embedded in Fluent Meshing, is a mature technique and is well compatible with the Fluent solver, enabling accurate numerical simulations. Five different mesh resolutions were generated for the studied utility tunnel, and local mesh refinement was applied around the cables to improve the accuracy of the numerical results. The five mesh configurations contained approximately 8.29, 10.31, 12.32, 14.68, and 15.59 million cells, respectively. The mesh configuration is illustrated in Figure 3. The ventilation simulation results obtained using different mesh resolutions are shown in Figure 4. The temperature and humidity distributions obtained from the five mesh resolutions exhibited similar trends, characterized by an increase in temperature with increasing distance from the air inlet and higher relative humidity in regions with lower temperatures. The simulation results obtained with 8.29 million cells showed noticeable deviations from those of the other meshes, with a temperature difference of approximately 0.5 °C and a relative humidity difference of about 1.5%. The number of grid cells increased to 10.31 million; further increasing the grid count to reduce the grid size had a negligible impact on the temperature and humidity simulation results. The simulation outcomes remained largely stable. Subsequent simulations were conducted using a grid size of 10.31 million grid cells.
Figure 3.
Schematic diagram of the utility tunnel mesh configuration.
Figure 4.
Grid independence verification. (a) Temperature independent characterization; (b) Relative humidity independent characterization.
2.5. Time Step Independence Verification
To ensure the accuracy and efficiency of the calculations, time-step independence verification was performed for the numerical simulations. The simulated temperature and relative humidity under different time steps are shown in Figure 5. When the time step was set to 0.02 s, both the temperature and relative humidity remained largely unchanged with further reduction in the time step. Therefore, considering both computational accuracy and time cost, a time step of 0.02 s was selected for this study.
Figure 5.
Time step independence verification. (a) Temperature independent characterization; (b) Relative humidity independent characterization.
2.6. Numerical Model Experimental Validation
To further validate the reliability of the numerical model, an in-service utility tunnel was selected for on-site measurements of temperature, humidity, and air velocity. The selected tunnel is located on a street adjacent to the target tunnel and shares identical external climatic conditions. Its cross-sectional width and height are 4.6 m and 3.0 m, respectively, and the total length of the measurement section is 100 m. The measurement section started at the first normally open fire door (air inlet), passed through the second normally open fire door, and ended at the third normally open fire door (air outlet). The length and width of each normally open fire door opening are both 2.2 m. An impeller anemometer was used to measure air velocity at different positions across the three normally open fire doors. A multifunctional measuring instrument was employed to measure temperature and humidity at the fire door sections, and the locations of the air velocity and thermo-hygrometric measurement points are shown in Figure 6a. A temperature data logger was used to measure the temperatures of the air and tunnel walls at cross-sections located at different distances from the air inlet. The multifunctional measuring instrument was also used to measure the air humidity distribution at cross-sections located at different distances from the air inlet. The distributions of the measurement points and measurement cross-sections are illustrated in Figure 6a,b, respectively. Prior to measurement, all measuring instruments were calibrated in accordance with operating specifications. During the measurement process, each data point was measured three times to ensure the validity of the measurement values. The specifications of the main measuring instruments used in this study are listed in Table 3, and the statistical uncertainties of the measured parameters are summarized in Table 4. The results showed that the standard uncertainties for key parameters (air velocity, temperature, and humidity) were low, highlighting the accuracy of the measured data. In combination with similar ventilation conditions and environmental settings, these results provided the numerical model with robust reliability and applicability in predicting the tunnel flow field and temperature and humidity environment.
Figure 6.
Geospatial configuration of field measurement sites in the utility tunnel. (a) Measurement points; (b) Spatial distribution of monitoring positions along the tunnel.
Table 3.
The information on the instrument parameters used.
Table 4.
Statistical uncertainty of measurement parameters.
Selecting an appropriate turbulence model is critical for numerical simulations of airflow in utility tunnels. To identify the most suitable turbulence model, numerical simulations were conducted using five turbulence models, including the Standard, RNG, and Realizable k–ε models, as well as the Standard and SST k–ω models. The simulated temperature and humidity results were compared with measured tunnel data to select the optimal turbulence model. The in situ tunnel ventilation consisted of mechanical supply and exhaust, with an air change per hour (ACH) of 4 h−1 and an inlet temperature of 28.9 °C.
A comparison of simulation results obtained from different turbulence models and field measurements from the utility tunnel is shown in Figure 7. As shown in the figure, the temperature and humidity distributions predicted by the five turbulence models agree well with the field measurements. The deviations between the simulated and measured humidity values are within 2.5%, while the temperature deviations are within 1.5%. Among the tested models, the Realizable k–ε model exhibits the smallest deviation from the experimental data, with humidity and temperature deviations of less than 1.5% and 1.3%, respectively. The Realizable k–ε model provides improved predictions for jet-influenced free flows and boundary layer flows and has been widely applied in simulations of utility tunnels. Therefore, the Realizable k–ε model was selected as the turbulence model for this study.
Figure 7.
Turbulence modeling selection methodology. (a) Simulated temperature fields from turbulence modeling; (b) Predicted relative humidity profiles by turbulence closure schemes.
It should be noted that the validation experiment was conducted in an adjacent utility tunnel rather than in the exact target tunnel. The validation tunnel differs from the target tunnel in length and cross-sectional dimensions, which may affect the absolute airflow velocity and local flow details at specific locations. However, the two tunnels have similar cable heat loads, approximately 50 W/m, and similar wall temperatures, approximately 28 °C. Therefore, the main physical mechanisms governing the thermal and humidity environment, including buoyancy-induced stratification caused by cable heat release, airflow mixing induced by fire doors, and wall heat transfer, are consistent between the two tunnels. In addition, the mesh independence analysis and turbulence model validation indicate that the Realizable k–ε model and the constant wall-temperature boundary condition can reasonably reproduce these core mechanisms. Therefore, although the validation does not represent an exact one-to-one reproduction of the target tunnel, it supports the reliability of the model in predicting the temperature and humidity distribution trends of similar utility tunnels.
2.7. Evaluation Indicators
2.7.1. Temperature and Relative Humidity Non-Guaranteed Rate
Relevant regulations specify that the temperature inside utility tunnels should not exceed 40 °C [41]. In this study, the temperature non-guarantee rate (TNGR) was used to evaluate the thermal and hygrometric environments inside the utility tunnel under different ventilation schemes. The TNGR is defined as the ratio of the number of measurement points where the temperature exceeds 40 °C to the total number of measurement points in the utility tunnel. A lower TNGR indicates better ventilation performance inside the utility tunnel. The TNGR is calculated as follows:
Hong et al. [39] suggested that the recommended relative humidity range for utility tunnels is 60–70%. In this study, the relative humidity non-guarantee rate (RHNGR) was employed to evaluate the humid environment inside the utility tunnel. The RHNGR is defined as the ratio of the number of measurement points with relative humidity exceeding 65% to the total number of measurement points in the utility tunnel. A lower RHNGR indicates better ventilation performance inside the utility tunnel. The calculation formula for this evaluation index is given as follows:
2.7.2. Temperature and Relative Humidity Non-Uniformity Coefficient
The non-uniformity coefficient is one of the important indicators for evaluating airflow organization [30]. Along the height direction (Y-axis) of the utility tunnel, ten horizontal planes were uniformly arranged. On each horizontal plane, ten monitoring points were uniformly distributed along the width direction (X-axis) at intervals of 1 m along the length direction (Z-axis). The simulated values at all monitoring points on each calculation cross-section were used to calculate the temperature non-uniformity coefficient () and the relative humidity non-uniformity coefficient () of the utility tunnel. Lower values of the non-uniformity coefficients indicate better uniformity of airflow distribution. The calculation formulas for and are given as follows:
where and are the temperature and relative humidity at each monitoring point on the calculation cross-section, respectively; and are the average temperature and average relative humidity of the calculation cross-section, respectively; n is the total number of monitoring points on the calculation cross-section.
2.7.3. Average Temperature
The average temperature (Tm) of the utility tunnel provides a more appropriate basis for comparing the overall temperature distribution under different operating conditions. Under identical air supply conditions, a lower indicates more effective ventilation and heat dissipation. This study uses the arithmetic mean of all monitoring points as the average temperature of the utility tunnel at the calculation time, with obtained through numerical simulation post-processing.
3. Results and Discussion
3.1. Air Temperature Distribution Within the Utility Tunnel
As shown in Figure 8a,b, the air temperature and humidity distributions are subsequently analyzed on two cross-sections along the X and Y directions, as well as at spatial locations along three measurement lines in the Z direction. The two cross-sections correspond to the mid-plane of the utility tunnel in the horizontal and vertical directions, located at Y = 1.5 m and X = 1.5 m, respectively. Measurement line 1 is located at the uppermost region of the utility tunnel, near the 10 kV power cable, at X = 0.4 m and Y = 2.3 m. Measurement line 2 is positioned at the center of the utility tunnel, with coordinates X = 1.5 m and Y = 1.4 m. Measurement line 3 is located above the water supply pipe at the mid-position, at X = 2.55 m and Y = 0.9 m.
Figure 8.
Schematic diagram of monitoring section and measurement line positions.
Figure 9 presents the temperature contour distributions at a typical cross-section of the utility tunnel under the conventional ventilation mode for three inlet air temperatures (25 °C, 30 °C, and 35 °C). The arrows indicate the airflow direction, and the simulated air change rate is 4 h−1. As shown in the figure, the air temperature within the tunnel gradually increases along the axial direction, and the overall temperature level rises with increasing inlet air temperature. This phenomenon arises from the coupling of buoyancy-driven natural convection and momentum transport from forced ventilation. In the Y-direction, the temperature in the upper region is significantly higher than that in the lower region, forming a pronounced thermal stratification. This is because heat dissipation from the cables heats the surrounding air, causing it to expand, decrease in density, and rise under buoyancy forces. In contrast, denser cold air sinks to compensate for the imbalance, eventually forming a stable “warmer upper and cooler lower” stratification. As the inlet air temperature increases, the initial air density decreases, further enhancing buoyancy and accentuating stratification. In the X-direction, the temperature on the left side is higher than that on the right, which is directly related to the difference in cable loads. The 110 kV cables on the left release more heat than the 10 kV cables on the right, resulting in a higher volumetric heat release rate and a greater temperature rise in the left-side air. Meanwhile, the forced airflow enters from the left side and continuously absorbs heat from the cables along its path, causing the temperature to accumulate along the flow direction and further intensifying the “higher on the left and lower on the right” temperature difference.
Figure 9.
Temperature contour distribution at a typical cross-section of the utility tunnel under the conventional ventilation mode.
In the Z-direction, the tunnel exhibits an alternating temperature distribution pattern of “low–high–low–high,” primarily caused by the flow obstruction and throttling effects of the fire doors. On the one hand, the fire doors act as physical barriers that hinder the movement of high-temperature air in the upper region on the upstream side along the Z-direction. On the other hand, when the airflow passes through the fire doors, the cross-sectional area of the tunnel suddenly contracts. According to the continuity equation, the air velocity near the floor increases significantly (as shown in Figure 10). As a result, the low-temperature air near the bottom is entrained into the downstream region, enhancing air mixing and reducing the downstream temperature difference. Furthermore, heat accumulation zones were observed above the downstream ventilation sections, and the high-temperature region on the left side was larger than that on the right. As the inlet air temperature increased, both the extent of these zones and the peak temperature increased. Heat accumulation was also found above the upstream side of the fire door, indicating the combined effects of thermal buoyancy and the blocking effect of the fire door. Overall, increasing the inlet air temperature from 25 °C to 35 °C raised the overall temperature level inside the utility tunnel and significantly enlarged the high-temperature zones near the upstream side of the fire door and the downstream ventilation sections. This is mainly attributed to the enhanced thermal buoyancy at higher inlet air temperatures, which promotes hot air accumulation in the upper part of the tunnel and aggravates the local thermal environment.
Figure 10.
Velocity contour distribution at a typical cross-section of the utility tunnel under the conventional ventilation mode.
Figure 11 shows the temperature contour of the utility tunnel at the 30th minute under the alternating ventilation mode, with a supply air temperature of 30 °C, an FCF of 1 cycle, and an ACH of 4 h−1. Figure 12 presents the temperature contour distributions at key cross-sections under the same conditions, comparing the alternating ventilation mode with the conventional ventilation mode. As shown in the figure, the overall temperature distribution pattern under the alternating ventilation mode is generally similar to that observed under the conventional ventilation mode. Overall, the temperature near the air inlet is significantly lower than that near the air outlet. Along with the airflow direction, the air temperature gradually increases downstream. The temperature in the upper region of the tunnel is noticeably higher than that in the lower region. The temperature on the left side is higher than that on the right side. High-temperature accumulation occurs above the upstream side of the fire door and in the downstream ventilation sections, while the fire door promotes a more uniform air temperature distribution on the downstream side. Compared with the conventional ventilation mode under the same inlet air conditions, the alternating ventilation mode results in a more uniform cross-sectional temperature distribution inside the utility tunnel. Furthermore, high-temperature accumulation alternates between the two ends of the utility tunnel and the areas near the fire doors, which helps prevent specific sections from remaining exposed to high temperatures for long periods and thereby improves the internal thermal environment of the tunnel.
Figure 11.
Temperature contour distribution at a typical cross-section of the utility tunnel under the alternating ventilation mode.
Figure 12.
Temperature contour distributions at typical cross-sections of the utility tunnel under alternating ventilation (ACH = 4 h−1, Ti = 30 °C, FCF = 1) and conventional ventilation (ACH = 4 h−1, Ti = 30 °C). (a) alternating ventilation mode, Z = 10 m; (b) alternating ventilation mode, Z = 90 m; (c) alternating ventilation mode, Z = 170 m; (d) alternating ventilation mode, Z = 190 m; (e) alternating ventilation mode, Z = 270 m; (f) alternating ventilation mode, Z = 350 m; (g) conventional ventilation mode, Z = 10 m; (h) conventional ventilation mode, Z = 90 m; (i) conventional ventilation mode, Z = 170 m; (j) conventional ventilation mode, Z = 190 m; (k) conventional ventilation mode, Z = 270 m; (l) conventional ventilation mode, Z = 350 m.
Figure 13 illustrates the temperature distributions along each measurement line under conventional and alternating ventilation modes at different inlet air temperatures (ACH = 4 h−1, FCF = 1). As shown in the figure, measurement line 1, located in the upper region of the utility tunnel and adjacent to the 10 kV cables, exhibits higher temperatures than measurement line 2 due to the combined effects of thermal buoyancy and cable heat dissipation. Measurement line 3, positioned in the lower region of the utility tunnel, shows significantly lower temperatures than measurement lines 1 and 2. Consistent with the temperature contour distribution, the temperature in the air inlet zone is significantly lower than that in the air outlet zone. Along the airflow direction, the temperature gradually increases and eventually exceeds 40 °C in the downstream section, where heat accumulation leads to the formation of high-temperature zones. At the fire door located in the middle section of the utility tunnel, a sharp drop in air temperature is observed along all measurement lines, followed by a gradual increase downstream. This temperature drop is most pronounced for measurement line 1, followed by measurement line 3, while it is relatively insignificant for measurement line 2. This can be attributed to the fact that measurement line 1 is located near the tunnel ceiling, where airflow is obstructed and locally retained by the wall at the fire door. Measurement line 3 is also affected by the wall obstruction, but it is located in the lower region of the tunnel and is therefore less influenced. In contrast, measurement line 2 is positioned near the center of the normally open fire door, where the airflow is least disturbed compared with the other two lines. As the inlet air temperature increases, the air temperature along the measurement lines also rises, and the tunnel length over which the temperature exceeds 40 °C becomes longer. Under the same inlet air condition (30 °C), the alternating ventilation mode exhibits a shorter section where the temperature exceeds 40 °C, indicating that alternating ventilation can effectively reduce the overall air temperature along the measurement lines within the utility tunnel.
Figure 13.
Air temperature distribution along the measurement lines. (ACH = 4 h−1, FCF = 1).
3.2. Relative Humidity Distribution of Airflow Within the Utility Tunnel
Figure 14 and Figure 15 show the relative humidity contour distributions of the utility tunnel under various operating conditions for the conventional and alternating ventilation modes, respectively. Figure 16 presents the relative humidity contour distributions at key cross-sections for both ventilation modes. As observed, the relative humidity near the air inlet is significantly higher than that near the exhaust, gradually decreasing along the airflow direction. This is because heat dissipation from the cables raises the air temperature; with constant moisture content, the relative humidity decreases as temperature rises. Meanwhile, because the air velocity near the ground is low (Figure 10) and no heat sources are present in this region, the air temperature remains relatively low (Figure 9). Consequently, thermal buoyancy is weak, resulting in relatively high humidity and further reinforcing the vertical stratification characterized by lower humidity in the upper region and higher humidity in the lower region. In the Z-direction, the fire doors in the central region of the tunnel indirectly enhance downstream airflow mixing, resulting in a more uniform distribution of relative humidity. Under constant inlet relative humidity, higher inlet air temperatures correspond to higher air moisture content. Consequently, when the inlet air temperature is higher, the temperature rise inside the tunnel is greater, and the buoyancy effect is stronger, which accentuates the vertical stratification of both temperature and relative humidity. In the X-direction, the relative humidity on the left side is lower than that on the right, which is directly related to the temperature gradient caused by the difference in cable loads. The 110 kV cables on the left release more heat, leading to locally higher temperatures and lower relative humidity, whereas the 10 kV cables on the right release less heat, resulting in lower temperatures and higher relative humidity. Along the tunnel’s axial direction, the relative humidity exhibits a “lower on the left, higher on the right” distribution pattern.
Figure 14.
Relative humidity contour distribution under the conventional ventilation mode.
Figure 15.
Relative humidity contour distribution under the alternating ventilation mode.
Figure 16.
Relative humidity contour distributions at key cross-sections of the utility tunnel under alternating (ACH = 4 h−1, Ti = 30 °C, FCF = 1) and conventional ventilation (ACH = 4 h−1, Ti = 30 °C). (a) alternating ventilation mode, Z = 10 m; (b) alternating ventilation mode, Z = 90 m; (c) alternating ventilation mode, Z = 170 m; (d) alternating ventilation mode, Z = 190 m; (e) alternating ventilation mode, Z = 270 m; (f) alternating ventilation mode, Z = 350 m; (g) conventional ventilation mode, Z = 10 m; (h) conventional ventilation mode, Z = 90 m; (i) conventional ventilation mode, Z = 170 m; (j) conventional ventilation mode, Z = 190 m; (k) conventional ventilation mode, Z = 270 m; (l) conventional ventilation mode, Z = 350 m.
Figure 17 shows the relative humidity distributions along each measurement line under conventional and alternating ventilation modes at different inlet air temperatures (ACH = 4 h−1, FCF = 1). As observed, the humidity distributions along the measurement lines reflect trends consistent with those seen in the contour maps. Under the conventional ventilation mode, the relative humidity decreases in the order of measurement line 3, measurement line 2, and measurement line 1. The humidity near the air inlet is significantly higher than that near the air outlet, and it gradually decreases along the airflow direction. A sharp increase in relative humidity is observed at the fire door location. Under inlet air temperatures of 30 °C and 35 °C, certain regions near the air inlet and local areas near the air outlet exhibit relative humidity values exceeding 65%. For measurement line 3, at an inlet air temperature of 35 °C, the axial length over which relative humidity exceeds 65% is the longest. Moreover, under the alternating ventilation mode, the relative humidity along all measurement lines remains mostly below 65%, indicating that this mode provides better control of airflow humidity.
Figure 17.
Air relative humidity distribution along the measurement lines. (ACH = 4 h−1, FCF = 1).
3.3. Evaluation Index Analysis
To further evaluate the ventilation performance of the utility tunnel, the assessment indices defined in Section 2.6 are used to compare the temperature and humidity distributions under conventional and alternating ventilation modes. Ten horizontal planes are selected within the utility tunnel, uniformly distributed from Y = 0.15 m to Y = 2.85 m at an interval of 0.3 m. On each horizontal plane, 3600 measurement points are uniformly sampled, and the corresponding data are used to evaluate the non-uniformity coefficient and the dissatisfaction rate.
The average temperature non-uniformity coefficient () and relative humidity non-uniformity coefficient () under various operating conditions are shown in Figure 18. Their distribution can be analyzed from cable heat dissipation, temperature and humidity stratification, and airflow organization. At a height of 1.35 m, both coefficients increase significantly. This plane is close to the 110 kV cables (see Figure 8), which dissipate much more heat per unit length than the 10 kV cables. As a result, a local high-temperature and low-humidity zone forms nearby. The fluctuations in temperature and humidity at this height are amplified, leading to higher and values. Apart from the 1.35 m plane, the non-uniformity coefficients generally increase with height. This is directly related to buoyancy-induced thermal stratification. The upper air forms high-temperature, low-humidity regions due to buoyancy, while the lower air remains cooler and more humid. As the inlet air temperature rises, and tend to decrease. Higher inlet temperatures strengthen buoyancy effects and intensify temperature and humidity stratification. At the same time, the high-temperature zones expand, which reduces and . Under conventional ventilation, the average values are 11.8%, 9.3%, and 7.4% for inlet temperatures of 25 °C, 30 °C, and 35 °C, respectively. The corresponding values are 21.9%, 16.7%, and 11.9%. Under alternating ventilation with a 30 °C inlet, the average and are 9.0% and 16.5%, respectively. Compared with conventional ventilation, alternating ventilation clearly reduces both and . It also improves the spatial uniformity of temperature and humidity. The main mechanism is that alternating ventilation changes the airflow direction inside the tunnel. This disrupts the stable temperature and humidity stratification formed under conventional ventilation and creates a more uniform field of flow. In addition, reversing the airflow enhances mixing and transverse transport of heat and moisture. This weakens the accumulation of high-temperature, low-humidity air and improves the overall uniformity of the tunnel’s temperature and humidity distribution.
Figure 18.
Kt and KRH under different ventilation conditions.
Figure 19 illustrates the average temperature not guaranteed rate (TNGR) and relative humidity not guaranteed rate (RHNGR) within the utility tunnel under different operating conditions. The average TNGR reaches its maximum at a height of 1.35 m, and the non-guaranteed rates in the upper region of the tunnel are generally higher than those near the bottom. Moreover, both TNGR and RHNGR increase with increasing inlet air temperature. Under the same inlet air temperature, the average TNGR under the alternating ventilation mode is slightly lower than that under the conventional ventilation mode. Along the Y direction, TNGR exhibits a distribution characterized by higher values in the middle and lower values on both sides. In contrast, RHNGR shows the opposite trend, with lower values in the middle and higher values on both sides. For the conventional ventilation mode at inlet air temperatures of 25 °C, 30 °C, and 35 °C, and for the alternating ventilation mode at 30 °C, the corresponding average TNGR values are 7.9%, 15.1%, 20.6%, and 14.2%, respectively, while the average RHNGR values are 3.2%, 6.1%, 27.3%, and 6.0%. Compared with the conventional ventilation mode under the same operating conditions, the alternating ventilation mode reduces TNGR by 0.9% (an improvement of nearly 6%) and RHNGR by 0.1% (an improvement of 1.6%), indicating that the alternating ventilation mode provides a more uniform temperature and humidity environment within the utility tunnel.
Figure 19.
TNGR and RHNGR under different ventilation conditions.
In addition, the simulation results indicate that the average air temperature (Tm) under the conventional ventilation mode is 34.4 °C, 36.0 °C, and 37.5 °C for inlet air temperatures of 25 °C, 30 °C, and 35 °C, respectively. In comparison, a Tm of 35.7 °C is obtained under the alternating ventilation mode at an inlet air temperature of 30 °C. When the inlet air temperature is fixed at 30 °C, the alternating ventilation mode reduces Tm by 0.3 °C compared with the conventional ventilation mode, indicating an improvement in the average thermal environment within the utility tunnel. Overall, compared with the conventional ventilation mode, the alternating ventilation mode exhibits improved performance in terms of Kt, KRH, TNGR, RHNGR, and Tm, demonstrating that the alternating ventilation strategy can provide superior ventilation effectiveness in utility tunnels.
3.4. Optimization of Alternating Ventilation Scheme Based on the Response Surface Method
3.4.1. Experimental Design
Response surface methodology (RSM) is a statistical technique widely used for experimental design, analysis, and optimization. RSM requires relatively low computational resources and is well-suited for addressing multi-parameter problems; therefore, it has been extensively applied in engineering design optimization [46,47]. To improve ventilation performance, this study further optimizes the alternating ventilation mode using RSM. The technical roadmap is shown in Figure 20.
Figure 20.
Technical roadmap of the response surface optimization.
In this study, response surface experiments were designed using Design-Expert 13 software, and the Box–Behnken design (BBD) method was adopted. Kang et al. [48] demonstrated that the ACH significantly influences air distribution in utility tunnels. According to the Technical Code for Urban Utility Tunnel Engineering [41], the ACH under normal ventilation conditions should not be less than 2 h−1, and, for emergency ventilation, except for natural gas compartments, the ACH should not be less than 6 h−1. The fan commutation frequency (FCF) is a critical parameter. We note that when the ACH is 4 h−1, τ = 15 min. If FCF = 2, the switching cycle is 10 min, ensuring that the airflow direction changes before the tunnel is fully flushed, allowing the commutated airflow to interact with the stratified airflow remaining from the previous stage. If the FCF is higher (e.g., FCF = 3, switching cycle = 7.5 min), the fan commutation is too frequent, resulting in more additional energy consumption and mechanical wear. Therefore, the FCF is limited to 0–2 (switching cycle 15–10 min), covering a range from “no commutation” (FCF = 0) to “commutation once every 2/3 τ” (FCF = 2). Gao et al. [49] reported that the inlet air temperature (Ti) has a pronounced effect on the temperature distribution within utility tunnels. Given the local climatic conditions in the study area, Ti was set at 25–35 °C. Accordingly, ACH, Ti, and FCF were selected as the three dominant factors affecting the ventilation performance of the utility tunnel. The corresponding factor levels are listed in Table 5, while the remaining parameters were kept consistent with previous settings. The experimental results are presented in Table 6.
Table 5.
Factors and Levels for RSM Experiments.
Table 6.
Results of the RSM Experiments.
3.4.2. Response Surface Model
After performing numerical simulations for the 13 experimental cases defined by the response surface experimental design, the results are statistically analyzed using Design-Expert 13 software. In this section, analysis of variance (ANOVA) is employed to examine the response surface methodology (RSM) models for different evaluation indices. Previous analyses indicate that KRH and Tm exhibit relatively pronounced variation with changes in the investigated variables and can thus effectively illustrate the humidity and temperature distributions within the utility tunnel. Therefore, KRH and Tm were selected as the response variables for the response surface analysis. Previous analysis showed that, compared with TNGR and RHNGR, KRH and Tm exhibited more significant fluctuations with the changes of the studied variables, and KRH and Tm were more effective in reflecting the uniformity of the overall humidity and temperature distribution in the public tunnel. In accordance with the research method of Li et al. [34], KRH and Tm were finally selected as the response variables for response surface analysis.
The effects of the three variables on KRH are analyzed using a quadratic model, and the corresponding results are summarized in Table 7. In this analysis, the p-value is used as the criterion for statistical significance, with lower p-values indicating stronger effects. It can be observed that, among the three variables, Ti and ACH have statistically significant effects on KRH. The final equation for KRH in terms of actual factors is expressed as follows:
Table 7.
ANOVA results for the TNGR response surface model.
The response surface for KRH is presented in Figure 21. As shown, Ti, ACH, and FCF all exhibit the same trend in their effects on KRH. Specifically, KRH gradually decreases with increasing Ti, ACH, and FCF.
Figure 21.
The influence of parameters on KRH.
The effects of the three variables on Tm were analyzed using a quadratic model, and the corresponding results are summarized in Table 8. It can be observed that, among the three variables, Ti and ACH have statistically significant effects on Tm. The final equation for Tm in terms of actual factors is expressed as follows:
Table 8.
ANOVA Results for the Tm Response Surface Model.
The response surface for Tm is presented in Figure 22. As shown, Tm decreases with increasing ACH and FCF, indicating a negative correlation between these variables and Tm. Conversely, Tm increases with increasing Ti, indicating a positive correlation between Ti and Tm.
Figure 22.
The influence of parameters on Tm.
3.4.3. Optimization Results and Verification
The suitable parameters for the alternating ventilation mode at different inlet air temperatures were determined using Design-Expert 13 software, and the resulting design conditions were subsequently validated using Fluent 2022 R1. Since ACH is directly related to the energy consumption of tunnel ventilation fans and both energy efficiency and a satisfactory internal ventilation environment, the study was conducted with ACH fixed at 4 h−1. In Design-Expert 13, KRH and Tm were simultaneously minimized, with equal importance assigned to both responses, yielding optimal results of 25 °C, 30 °C, and 35 °C for Ti, as summarized in Table 9. It can be observed that, compared to the conventional ventilation mode, the optimized scheme improves KRH by 1.4–7.6% and reduces Tm by 0.2–0.6 °C across different Ti conditions, indicating enhancements in both KRH and Tm for each optimized scenario. For Ti = 35 °C, KRH decreased from 11.9% to 11.0%, representing a 7.6% improvement, while Tm decreased from 37.5 °C to 36.9 °C, a reduction of 0.6 °C. The optimized results across different operating conditions consistently show FCF = 2, indicating that, within the range considered in this study, setting FCF to 2 yields the best ventilation performance for the alternating ventilation mode. The optimization results show that FCF = 2 (switching cycle = 10 min) is shorter than the ventilation time (τ = 15 min), which improves the uniformity of temperature and humidity. This confirms that the choice of FCF is indeed related to the characteristic time scale (τ) of the system and verifies the physical principle behind the parameter selection.
Table 9.
The results of response surface optimization.
For the operating condition not previously simulated in Table 9 (i.e., Ti = 30 °C, ACH = 4 h−1, and FCF = 2 times), a numerical simulation was conducted using Fluent 2022 R1, yielding Tm = 35.6 °C and KRH = 16.1. The results of the three RSM-optimized scenarios were compared with their corresponding simulation results, with only minor deviations observed. When Ti is 30 °C, the deviation of KRH reaches its maximum, with a maximum value of 1.3%, which is less than 5% [50]. This indicates a good agreement between the response surface optimization results and the numerical simulation outcomes.
4. Comprehensive Discussion
The thermal and moisture stratification phenomenon of “hot at the top and cold at the bottom, hot on the left and cold on the right” observed in this study, as well as the thermal accumulation phenomenon in the near exhaust area, is consistent with the research conclusions of Wang et al. [33] and Li et al. [34] in similar utility tunnel, verifying that the buoyancy effect dominated by cable heat dissipation is the key mechanism causing this stratification. In addition, the fire door barrier effect observed in this study strengthens the disturbance of downstream airflow and improves the local airflow uniformity. Similar performance was also observed in the flow field characteristics of relay fan ventilation (RFV) and wall-attached ventilation (WAV) studied by Li et al. [34], which may be a useful inspiration for improving the airflow uniformity inside the utility tunnel. At the solution level, the characteristics of several different ventilation strategies are shown in Table 10, which reveals the applicable boundaries of different ventilation optimization strategies. While “increasing the number of air changes” is applicable to a wide range of scenarios, it significantly increases energy consumption and may be limited in humid and hot regions due to the high temperature and humidity of the inlet air [19]. “Piston-wind ventilation” relies on piston-wind generated in subway tunnels as the ventilation air source and is suitable for special scenarios. Wall-attached ventilation has a significant effect on improving the environment of utility tunnels and has obvious advantages in new construction and large-scale renovation projects. However, in existing utility tunnels where space is limited and large-scale renovation cannot be carried out without interruption of operation, alternating ventilation has certain advantages in terms of low renovation requirements.
Table 10.
Characteristics of different ventilation strategies in underground utility tunnels.
The optimization results of this study show that FCF = 2 is the best choice within the range of experimental parameters. However, the optimal FCF may be closely related to the inlet air parameters, tunnel length, cross-sectional dimensions, and heat source intensity. Future research needs to explore the robustness of this strategy under different geometric and thermal conditions to form a more universal design guideline.
Although this study shows that the alternating ventilation mode produces only a modest absolute temperature reduction of 0.3 to 0.6 °C, its engineering significance is reflected in several respects. First, the decrease in ambient temperature increases the temperature difference for heat exchange at the cable surface, which is conducive to lowering cable temperature. Second, the main advantage of this strategy lies in its ability to actively weaken thermal and humidity stratification, as indicated by the reductions in Kt and KRH, thereby helping to suppress localized cable overheating. For power cables, maintaining a uniform operating temperature and avoiding local hot spots are particularly important, because these factors help delay the thermal aging of insulation materials and preserve current carrying capacity [11,12]. According to the Arrhenius-IPM electrothermal life model, under a constant electric field, a 0.3–0.6 °C decrease in service temperature near the rated temperature of 90 °C corresponds to an approximately 2.5–5.0% increase in normalized cable life, indicating that small thermal reductions can still be meaningful when cables operate close to the allowable temperature limit [51]. In addition, the improved humidity distribution, reflected by the reduction in RHNGR, helps decrease the risk of condensation on the inner walls of the tunnel and on metal components, thereby reducing corrosion and maintenance demand [19]. This is beneficial to long-term operational safety and maintenance management. Finally, from an engineering perspective, when rising outdoor temperatures cause the tunnel temperature to approach or exceed the permissible limit, the usual response is to increase the ventilation rate. Under the same conditions, alternating ventilation can maintain a lower average temperature than conventional ventilation, which means that outdoor temperatures 0.3 to 0.6 °C higher can be tolerated before additional ventilation is required. As a result, the operating duration of high airflow conditions may be reduced, although the associated energy implications require further quantitative assessment.
It should be noted that the practical implementation of alternating ventilation strategies in engineering applications requires careful evaluation of their potential energy and operational implications. Fan reversal may increase energy consumption, mainly because of the surge current at startup and the temporary operation of the fan in a relatively inefficient state during the startup process. Although the reversal frequency adopted in this study is relatively low, it may still lead to additional operating energy consumption and accelerate the mechanical wear of fan components. These potential drawbacks, however, may be mitigated through technical improvement and operational optimization. For example, variable frequency drive control can be employed to enable reversal without shutdown, thereby reducing the additional energy consumption associated with repeated startup. In addition, the air change rate may be further optimized, while maintaining indoor environmental requirements, to reduce daily operating energy consumption. Future research should therefore focus on developing adaptive control strategies that dynamically adjust the reversal frequency and air change rate according to real time indoor and outdoor environmental conditions, such as inlet air temperature and cable load, to achieve a better balance between environmental control and energy efficiency. Moreover, fan selection, including the applicability of reversible fans, as well as the establishment of appropriate periodic maintenance schedules, should be regarded as important prerequisites for practical engineering application.
Furthermore, this study, focusing on the consistency of the internal spatial environment of the utility tunnel, selected KRH and Tm as optimization objectives in the response surface methodology (RSM) analysis. It should be noted that TNGR and RHNGR are important safety-related indicators, and using TNGR and RHNGR as optimization objectives is also essential. Therefore, future research could focus on optimizing ventilation parameters based on safety risk control.
5. Conclusions
In this study, a CFD-based numerical model of a utility tunnel was established to investigate temperature and humidity distributions under conventional and alternating ventilation modes. Additionally, the alternating ventilation scheme was optimized using response surface methodology, aiming to provide guidance for temperature and humidity environment assessment and ventilation strategy optimizations in existing utility tunnels. The main conclusions drawn from the data analysis are as follows:
(1) Under the conventional ventilation mode, the air temperature along the tunnel axis gradually increases, exceeding the standard temperature near the tunnel exit. Higher inlet air temperatures lead to larger regions exceeding the standard. Driven by buoyancy effects induced by cable heat dissipation, pronounced temperature and humidity stratification is observed within the utility tunnel. Compared with the alternating ventilation mode, the uniformity of temperature and humidity is poorer. Under the conventional ventilation mode, a clear thermal–humidity stratification forms, leading to gradual temperature increase along the axis and potential exceedance of the standard limit near the outlet. This mode shows poorer uniformity of the environmental parameters.
(2) Under the alternating ventilation mode, the distributions of air temperature and relative humidity in the utility tunnel show improvement. The uniformity of the temperature and humidity fields is improved. This mode suggests a way to address some limitations of conventional unidirectional ventilation. It can actively disrupt temperature and humidity stratification within the tunnel and shows advantages of low retrofit difficulty and good adaptability to varying operating conditions. Compared to conventional ventilation mode, the temperature at the measuring points along the line was lower under the same intake air temperature. Both non-uniformity coefficients and non-guarantee rates are improved; TNGR decreases from 15.1% under conventional ventilation to 14.2%, an improvement of 6.0%, and the average tunnel temperature (Tm) is reduced by 0.3 °C.
Alternating ventilation demonstrates improvements in the distribution of air temperature and relative humidity, resulting in a more uniform environmental field. By periodically changing the airflow direction, this strategy helps mitigate the thermal and moisture stratification observed in conventional unidirectional ventilation. Numerical results obtained under the conditions studied show that, at the same inlet air temperature (30 °C), the alternating mode reduces the temperature non-guarantee rate (TNGR) from 15.1% to 14.2% (a relative improvement of approximately 6.0%) and lowers the tunnel’s mean temperature (Tm) by 0.3 °C. These improvements, coupled with minimal structural modifications (requiring only adjustments to the control logic), suggest that alternating ventilation may serve as a potential ventilation optimization option for improving the thermal environment of existing utility tunnels, particularly focusing on enhancing spatial uniformity.
(3) The optimal results for the alternating ventilation mode were achieved based on the response surface method. For different inlet air temperatures (Ti), the recommended fan commutation frequency is suggested to be 2, meaning that the airflow direction reverses every 10 min within a 30 min ventilation period. For Ti = 35 °C, ACH = 4 h−1, and FCF = 2 times, the optimized alternating ventilation scheme reduced KRH and Tm from 11.9% and 37.5 °C under the conventional mode to 11.0% and 36.9 °C, respectively, corresponding to a 7.6% improvement in KRH and a 0.6 °C reduction in Tm. CFD simulations supported validation for the optimized alternating ventilation scheme, with a maximum relative error of 1.3%, which is within an acceptable range for engineering evaluation.
It should be noted that, although the results of this study provide useful reference value, several limitations remain. First, the geometric model simplifies the cross-sections of cables and pipes into regular shapes, and the resulting effects on local flow and heat transfer were not fully captured. This simplification may affect the prediction of the near-wall flow field, local flow resistance, and the non-uniformity coefficients of temperature and humidity. Second, the assumption of constant cable heat generation ignores dynamic variations in electrical load, which may make the simulated environment appear more stable than actual operating conditions. Third, the tunnel walls were treated as constant-temperature boundaries, without considering the possible feedback of internal temperature and humidity variations on wall heat transfer. In addition, the extra energy consumption and equipment wear associated with frequent fan reversals were not evaluated, and the techno-economic feasibility of this strategy therefore requires further quantitative assessment. Furthermore, the optimization of safety metrics (TNGR and RHNGR) was not evaluated in the optimization of the alternating ventilation scheme. Overall, these limitations highlight the need for further research and provide guidance for continued improvement and expansion of the current findings.
Future research should focus on several aspects. Frequent fan reversal may increase energy consumption during fan start-up and shutdown and may also accelerate mechanical wear. Therefore, future studies should develop adaptive control strategies for alternating ventilation under dynamic meteorological conditions. Fan performance curves and energy simulation tools can be combined to evaluate the annual energy consumption and economic feasibility of the system. In addition, small-scale experimental platforms should be established to validate the numerical model, the geometric model should be further refined, and the applicability of this strategy should be tested under different climate conditions and variable load scenarios to support a more comprehensive assessment of its engineering feasibility. Furthermore, from the perspective of safety risk control, the alternating ventilation scheme should be optimized. Through the exploration and discussion of the above research directions, the performance of alternating ventilation in utility tunnels may be further improved, supporting its broader application across a wider range of utility tunnel systems.
Author Contributions
X.L. (Xingyou Li): Conceptualization, Methodology, Investigation, Writing—original draft. S.H.: Software, Validation, Formal analysis, Visualization. Q.Z.: Methodology, Resources, Supervision, Writing—Review and Editing. M.Z.: Investigation, Formal analysis. W.W.: Investigation, Resources. P.S.: Formal analysis, Validation. B.S.: Resources, Validation. X.L. (Xi Liu): Conceptualization, Project administration, Supervision, Resources, Funding acquisition, Writing—Review and Editing. All authors have read and agreed to the published version of the manuscript.
Funding
This research received no external funding.
Data Availability Statement
The original contributions presented in this study are included in the article. Further inquiries can be directed to the corresponding author. During the preparation of this work the authors used ChatGPT-5.4 model in order to check the grammar. After using this tool/service, the authors reviewed and edited the content as needed and take full responsibility for the content of the published article.
Conflicts of Interest
The authors declare no conflicts of interest.
Nomenclature
| Symbols | |
| x-direction velocity, | |
| y-direction velocity, | |
| z-direction velocity, | |
| time, | |
| velocity vector, | |
| gravity coefficient, | |
| specific heat capacity, | |
| thermal conductivity, | |
| effective diffusion coefficient of water vapor | |
| source term of water vapor | |
| pressure, | |
| internal heat source, | |
| thermal diffusion source term, | |
| temperature, °C | |
| mass fraction of water vapor | |
| Ti | inlet air temperature, °C |
| temperature non-uniformity coefficient | |
| relative humidity non-uniformity coefficient | |
| average temperature, °C | |
| average relative humidity | |
| n | total number of monitoring points |
| Greek symbols | |
| turbulent viscosity | |
| density, | |
| dynamic viscosity, | |
| turbulent Schmidt number | |
| Abbreviation | |
| ACH | air change per hour |
| ANOVA | analysis of variance |
| CFD | computational fluid dynamics |
| FCF | fan commutation frequency |
| TNGR | temperature non-guarantee rate |
| RHNGR | relative humidity non-guarantee rate |
| RSM | response surface methodology |
References
- Liu, M.; Zhou, Y.; Li, J.; Chen, Y.; Zhao, S.; Xu, T.; Wang, F.; Zhuang, Z. An experimental study on the combustion characteristics of YJV and YC cables in urban utility tunnels. Case Stud. Therm. Eng. 2025, 69, 105986. [Google Scholar] [CrossRef] [Scilit]
- Xu, Z.-D.; Liu, X.; Xu, W.; Sun, B.; Liu, X.; Xu, D. Analysis on the disaster chain evolution from gas leak to explosion in urban utility tunnels. Eng. Fail. Anal. 2022, 140, 106609. [Google Scholar] [CrossRef] [Scilit]
- Sun, B.; Liu, X.; Xu, Z.-D.; Xu, D. An Improved Updatable Backpropagation Neural Network for Temperature Prognosis in Tunnel Fires. J. Perform. Constr. Facil. 2022, 36, 04022012. [Google Scholar] [CrossRef] [Scilit]
- Mi, H.; Liu, Y.; Jiao, Z.; Wang, W.; Wang, Q. A numerical study on the optimization of ventilation mode during emergency of cable fire in utility tunnel. Tunn. Undergr. Space Technol. 2020, 100, 103403. [Google Scholar] [CrossRef] [Scilit]
- Lei, W.; Sun, J.; Wang, D.; Tai, C.; Jing, X.; Li, A.; Xu, L. Study on thermal and humidity environmental characteristics and predictive temperature modeling for power cabins in utility tunnels. Therm. Sci. Eng. Prog. 2025, 66, 104020. [Google Scholar] [CrossRef] [Scilit]
- Zheng, X.; Cai, G.; Guo, J.; Gao, W.; Huang, Y.; Tong, X. Combustion characteristics and thermal decomposition mechanism of the flame-retardant cable in urban utility tunnel. Case Stud. Therm. Eng. 2023, 44, 102887. [Google Scholar] [CrossRef] [Scilit]
- Canto-Perello, J.; Curiel-Esparza, J.; Calvo, V. Criticality and threat analysis on utility tunnels for planning security policies of utilities in urban underground space. Expert Syst. Appl. 2013, 40, 4707–4714. [Google Scholar] [CrossRef] [Scilit]
- Xu, D.; Li, Y.; Yang, X.; Zhong, H.; Li, J.; Li, J.; Huang, Y. Enhancing resilience in urban utility tunnels power trans-mission systems: Analysing temperature distribution in near-wall cable fires for risk mitigation. Tunn. Undergr. Space Technol. 2024, 152, 105911. [Google Scholar] [CrossRef] [Scilit]
- Bai, Y.; Zhou, R.; Wu, J. Hazard identification and analysis of urban utility tunnels in China. Tunn. Undergr. Space Technol. 2020, 106, 103584. [Google Scholar] [CrossRef] [Scilit]
- Peng, F.-L.; Qiao, Y.-K.; Yang, C. Building a knowledge graph for operational hazard management of utility tunnels. Expert Syst. Appl. 2023, 223, 119901. [Google Scholar] [CrossRef] [Scilit]
- Li, L.; Gao, J.; Zhong, L.; Zhang, K.; Zhao, X. Aging phenomena in non-crosslinked polyolefin blend cable insulation material: Electrical treeing and thermal aging. Front. Chem. 2022, 10, 903986. [Google Scholar] [CrossRef] [Scilit] [PubMed]
- Ding, M.; He, W.; Wang, J.; Wang, J. Performance evaluation of cross-linked polyethylene insulation of operating 110 kV power cables. Polymers 2022, 14, 2282. [Google Scholar] [CrossRef] [Scilit]
- Ocłoń, P.; Rerak, M.; Rao, R.V.; Cisek, P.; Vallati, A.; Jakubek, D.; Rozegnał, B. Multiobjective optimization of under-ground power cable systems. Energy 2021, 215, 119089. [Google Scholar] [CrossRef] [Scilit]
- Wang, J.; Jin, H.; Yang, Z.; Zhao, B.; Ma, X.; Ji, K. Study on finite element analysis of the external heat resistance of cables in ductbank. Energy Rep. 2020, 6, 322–329. [Google Scholar] [CrossRef] [Scilit]
- Gao, Z.; Zhao, P.; Fan, Y.; Chen, Y. Influence of the closed end on the smoke propagation and temperature profile in urban utility tunnel fires. Tunn. Undergr. Space Technol. 2024, 150, 105852. [Google Scholar] [CrossRef] [Scilit]
- Zhang, T.; Wang, X.; Wang, Z.; Li, J.; An, W.; Xu, F.; An, W. Study on cable flame spread in utility tunnel under different reverse ventilation and cable layer spacing. Tunn. Undergr. Space Technol. 2025, 162, 106671. [Google Scholar] [CrossRef] [Scilit]
- Ye, K.; Zhou, X.; Zheng, Y.; Liu, H.; Tang, X.; Cao, B.; Huang, Y.; Chen, Y.; Yang, L. Estimating the longitudinal maximum gas temperature attenuation of ceiling jet flows generated by strong fire plumes in an urban utility tunnel. Int. J. Therm. Sci. 2019, 142, 434–448. [Google Scholar] [CrossRef] [Scilit]
- Zhang, Y.; Wu, D.; Kong, Q.; Li, A.; Li, Y.; Geng, S.; Dong, X.; Liu, Y.; Chen, P. Exposure level and distribution of air-borne bacteria and fungi in an urban utility tunnel: A case study. Tunn. Undergr. Space Technol. 2020, 96, 103215. [Google Scholar] [CrossRef] [Scilit]
- Wang, J.; Feng, X.; Zeng, X.; Chen, J.; Shi, T.; Zhang, G.; Liao, J. Research on the effectiveness of ventilation and de-humidifier on preventing condensation risk of urban utility tunnel. Int. J. Vent. 2025, 24, 277–291. [Google Scholar] [CrossRef] [Scilit]
- Wu, D.; Zhang, Y.; Li, A.; Kong, Q.; Li, Y.; Geng, S.; Dong, X.; Liu, Y.; Chen, P. Indoor airborne fungal levels in select-ed comprehensive compartments of the urban utility tunnel in Nanjing, Southeast China. Sustain. Cities Soc. 2019, 51, 101723. [Google Scholar] [CrossRef] [Scilit]
- An, W.; Tang, Y.; Liang, K.; Cai, M.; Wang, T.; Wang, Z. Study on temperature distribution and CO diffusion induced by cable fire in L-shaped utility tunnel. Sustain. Cities Soc. 2020, 62, 102407. [Google Scholar] [CrossRef] [Scilit]
- Seong, N.-C.; Kim, J.-H.; Choi, K.-B. CFD analysis of temperature and relative humidity distribution as air flow rate variation in the underground utility pipe tunnel. J. Korean Inst. Archit. Sustain. Environ. Build. Syst. 2017, 11, 273–282. [Google Scholar] [CrossRef] [Scilit]
- Zhou, Y.; Yang, Y.; Mao, Z.; Bu, R.; Gong, J.; Wang, Y.; Yi, L. Analytical and numerical study on natural ventilation performance in single- and gable-slope city tunnels. Sustain. Cities Soc. 2019, 45, 258–270. [Google Scholar] [CrossRef] [Scilit]
- Li, J.; Li, A.; Hou, Y.; Zhang, C.; Yang, C.; Zhang, X.; Che, J.; Guo, J. Air distribution and thermal environment optimization on subway platform using an innovative attached ventilation mode. Build. Environ. 2021, 204, 108226. [Google Scholar] [CrossRef] [Scilit]
- Li, J.; Li, A.; Zhang, C.; Wu, D.; Guo, J.; Yin, Y.; Wang, T. Analysis and optimization of air distribution and ventilation performance in a generator hall using an innovative attached air supply mode. Build. Environ. 2022, 216, 108993. [Google Scholar] [CrossRef] [Scilit]
- Leng, Z.; Yuan, Y.; Cao, X. Characteristics of natural-mechanical ventilation in high-geothermal tunnels during operational transition period. Appl. Therm. Eng. 2025, 280, 128223. [Google Scholar] [CrossRef] [Scilit]
- Shen, Z.; Yan, M.; Zhao, D. Machine learning model for windage alteration fault diagnosis of mine ventilation system under unbalanced samples. Min. Miner. Depos. 2025, 19, 72–80. [Google Scholar] [CrossRef] [Scilit]
- Nguyen, C.H.; Vu, T.T.; Le, D.T.; Do, S.A.; Dao, C.V.; Le, P.Q. Assessment of the ventilation system and solutions for improving the ventilation network at Khe Cham Coal Mine, Vietnam. Eng. J. Satbayev Univ. 2025, 147, 20–29. [Google Scholar] [CrossRef] [Scilit]
- Ahn, S.-J.; Kwon, H.-M.; Kim, G.-H.; Yang, J.-H. Study of securing required ventilation rates and improving mechanical ventilation systems for underground parking lots. J. Asian Archit. Build. Eng. 2018, 15, 659–665. [Google Scholar] [CrossRef] [Scilit]
- Li, A.; Ren, T.; Yang, C.; Xiong, J.; Tao, P. Numerical simulation, PIV measurements and analysis of air movement influenced by nozzle jets and heat sources in underground generator hall. Build. Environ. 2018, 131, 16–31. [Google Scholar] [CrossRef] [Scilit]
- Wang, J.; Liu, X.; Chen, S.; Jiang, H.; Fang, G.; Chen, W.; Deng, S. Reduced-scale model study on cable heat dissipation and airflow distribution of power cabins. Appl. Therm. Eng. 2019, 160, 114068. [Google Scholar] [CrossRef] [Scilit]
- Wang, S.; Yin, H.; Kang, Y.; Deng, X.; Yang, C.; Li, A. The role of opened fire doors in enhanced heat exchange of long-distance utility tunnels. Tunn. Undergr. Space Technol. 2024, 145, 105592. [Google Scholar] [CrossRef] [Scilit]
- Wang, X.; Zhang, T.; Tan, Y.; Liu, Z. Piston-wind ventilation strategy for thermal environment improvement of heat-supply compartment in utility tunnels. Case Stud. Therm. Eng. 2022, 30, 101790. [Google Scholar] [CrossRef] [Scilit]
- Li, J.; Li, A.; Zhang, C.; Guo, J.; Yin, Y.; Wang, T.; Fan, Y.; Hou, Y. Comparative studies and optimizations of air distribution of underground building ventilation systems based on response surface methodology: A case study. J. Build. Eng. 2023, 75, 106952. [Google Scholar] [CrossRef] [Scilit]
- Zhang, X.-H.; Guan, Y.-X.; Fang, Z.; Liao, Y.-F. Fire risk analysis and prevention of urban comprehensive pipeline corridor. Procedia Eng. 2016, 135, 463–468. [Google Scholar] [CrossRef] [Scilit]
- Ma, H.; Zhou, X.; Huang, J. Effect of ventilation on thermal and humidity environment of the underground utility tunnel in the plum rain season in southern China: Field measurement and CFD simulation. Undergr. Space 2023, 13, 301–315. [Google Scholar] [CrossRef] [Scilit]
- Ye, K.; Tang, X.; Zheng, Y.; Ju, X.; Peng, Y.; Liu, H.; Wang, D.; Cao, B.; Yang, L. Estimating the two-dimensional thermal environment generated by strong fire plumes in an urban utility tunnel. Process Saf. Environ. Prot. 2021, 148, 737–750. [Google Scholar] [CrossRef] [Scilit]
- Shi, Y.; Hong, J.; Lin, S.; Xu, J. Study on effective duration of ventilation and dehumidification in comprehensive pipe gallery. Chin. J. Undergr. Space Eng. 2021, 17, 626–636. [Google Scholar] [CrossRef]
- Hong, J.; Lin, S.; Shi, Y. Numerical simulation of ventilation and dehumidification in integrated compartment of coastal utility tunnel. Sci. Technol. Eng. 2019, 19, 195–203. [Google Scholar] [CrossRef]
- Liu, T.; Fan, Y.; Wang, H.; Tian, G.; Zhang, X.; Niu, B.; Wu, S. Influence of ventilation modes and air velocity on temperature and humidity fields in utility tunnels. Gas Heat 2021, 41, 7–12+41–42. [Google Scholar] [CrossRef]
- Ministry of Housing and Urban-Rural Development of the People’s Republic of China. Technical Code for Urban Utility Tunnel Engineering; China Planning Press: Beijing, China, 2015. Available online: https://kns.cnki.net/kcms2/article/abstract?v=8XsFQqBkIey4XHCA56Zwfom9aF3gxtCoTIXQC5d0Z_7Jw-kX46TBX9Kzsap7VTw0JHgTKR6afEeXrk2lMIPreTwgueFAwLq58kl6m_JjpNJqlNpSFzI0sacscsi9xAaQDYI54t8K7JLa3Q_5GxcJ5kaWm1nSzHJC-EVf7chWPi7xWWUxpN1_dQ==&uniplatform=NZKPT&language=CHS (accessed on 6 December 2025).
- Wang, W.; Zhu, Z.; Jiao, Z.; Mi, H.; Wang, Q. Characteristics of fire and smoke in the natural gas cabin of urban underground utility tunnels based on CFD simulations. Tunn. Undergr. Space Technol. 2021, 109, 103748. [Google Scholar] [CrossRef] [Scilit]
- Qiu, H. Study on Ventilation Rate of Urban Underground Utility Tunnel; Southwest Jiaotong University: Chengdu, China, 2018; Available online: https://kns.cnki.net/kcms2/article/abstract?v=8XsFQqBkIex2MElgCkG6J5toqrbep6SDFFOkhRY6QzpwcSfvKY3TctCKxqVYlgh5oFNuUEmO2TKGxR0wUcNyD7aj0mZXeLKGb1RMPSTd1AAfj6BZB38bZXHjTGNLlcqjNxAp-Rtw0lVj4_wLjjCzH-cqz8fImoo3PNh6YUaXKxFv7AkaeUyt00nAjVrr82ID&uniplatform=NZKPT&language=CHS (accessed on 6 December 2025).
- Yin, H.; Huo, Y.; Wang, Y.; Ji, D.; Wang, J.; Ma, Z.; Li, A. Numerical investigation on mechanisms and performance of column attachment ventilation for winter heating. Build. Environ. 2021, 202, 108025. [Google Scholar] [CrossRef] [Scilit]
- Han, O.; Li, A. Velocity distribution of wall-attached jets in slotted-inlet ventilated rooms. Build. Environ. 2021, 194, 107708. [Google Scholar] [CrossRef] [Scilit]
- Osman, H.; Said, E.A.; Al-Bahrani, M.; Zahmatkesh, S. Effect of composite membrane flux behavior on oily wastewater treatment: Predicting and optimizing based response surface methodology and AI. J. Water Process Eng. 2024, 60, 105072. [Google Scholar] [CrossRef] [Scilit]
- Li, W.; Li, W.; Xiong, Z.; Zhang, P. Controllable acetylation of cellulose nanocrystal by uniform design and response surface methodology. Carbohydr. Polym. 2024, 333, 121990. [Google Scholar] [CrossRef] [Scilit]
- Kang, Y.; Yin, H.; Wang, S.; Deng, X.; Yang, C.; Hu, Z.; Li, A. Analyzing temperature distribution in cable cabins within utility tunnels: Developing effective ventilation strategies for local thermal environment enhancement. Appl. Therm. Eng. 2024, 249, 123406. [Google Scholar] [CrossRef] [Scilit]
- Gao, B. Prediction and analysis of cooling and energy saving effect of underground tunnel ventilation of utility tunne. J. Build. Energy Effic. 2022, 50, 130–140. [Google Scholar] [CrossRef]
- Zhang, Z.; Shi, W.; Zhang, S.; Zhang, J.; Wang, B.; Guo, F.; Li, S. Investigation on improving the heat exchange efficiency of an ocean thermal engine with snowflake-like fins. Phys. Fluids 2025, 37, 063609. [Google Scholar] [CrossRef] [Scilit]
- Mazzanti, G. The Combination of Electro-Thermal Stress, Load Cycling and Thermal Transients and Its Effects on the Life of High Voltage Ac Cables. IEEE Trans. Dielectr. Electr. Insul. 2009, 16, 1168–1179. [Google Scholar] [CrossRef] [Scilit]
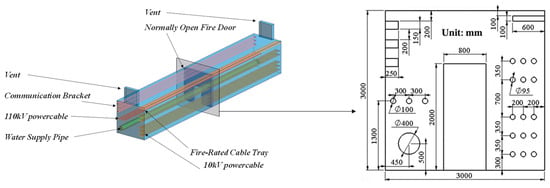
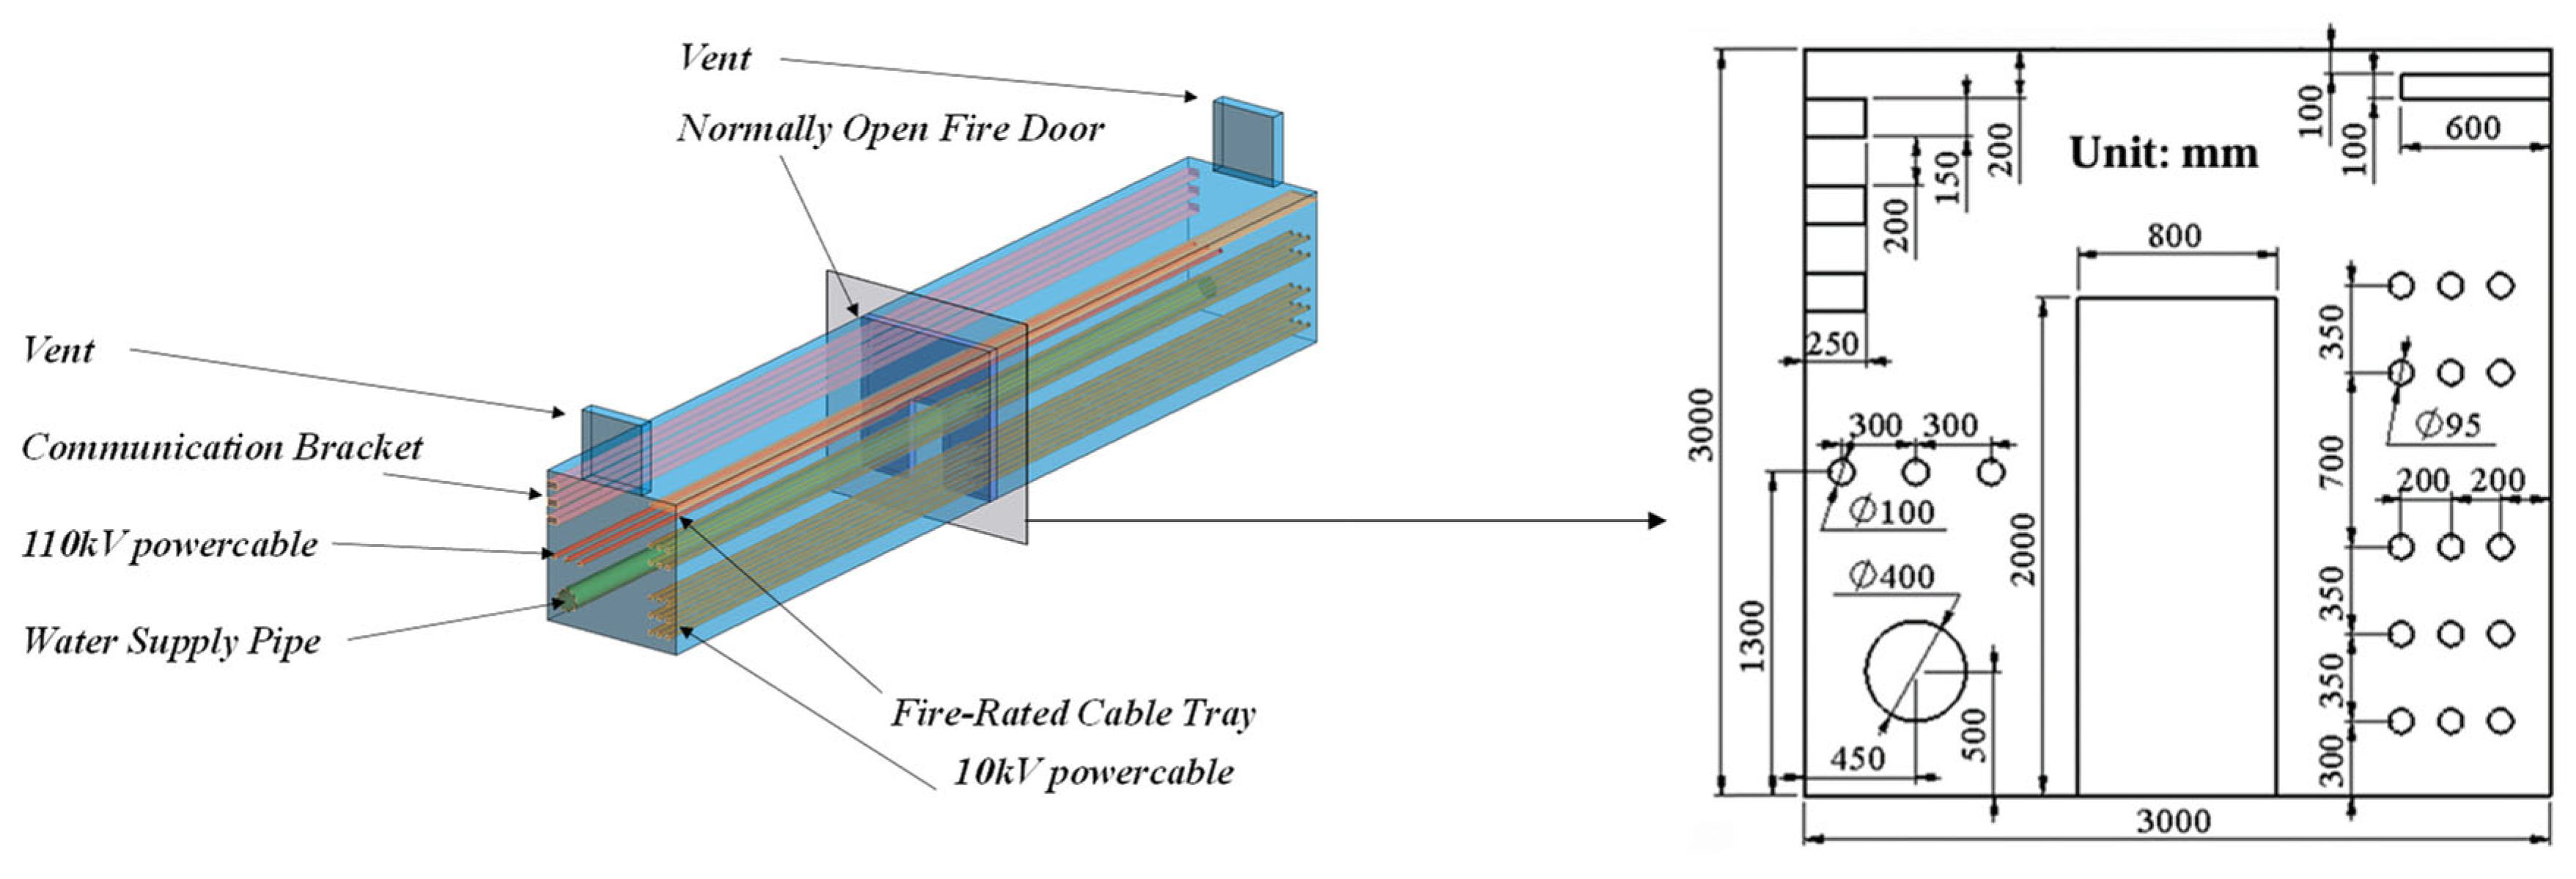
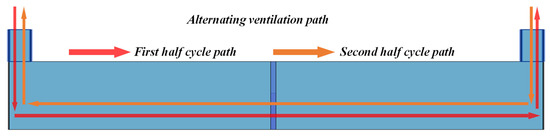
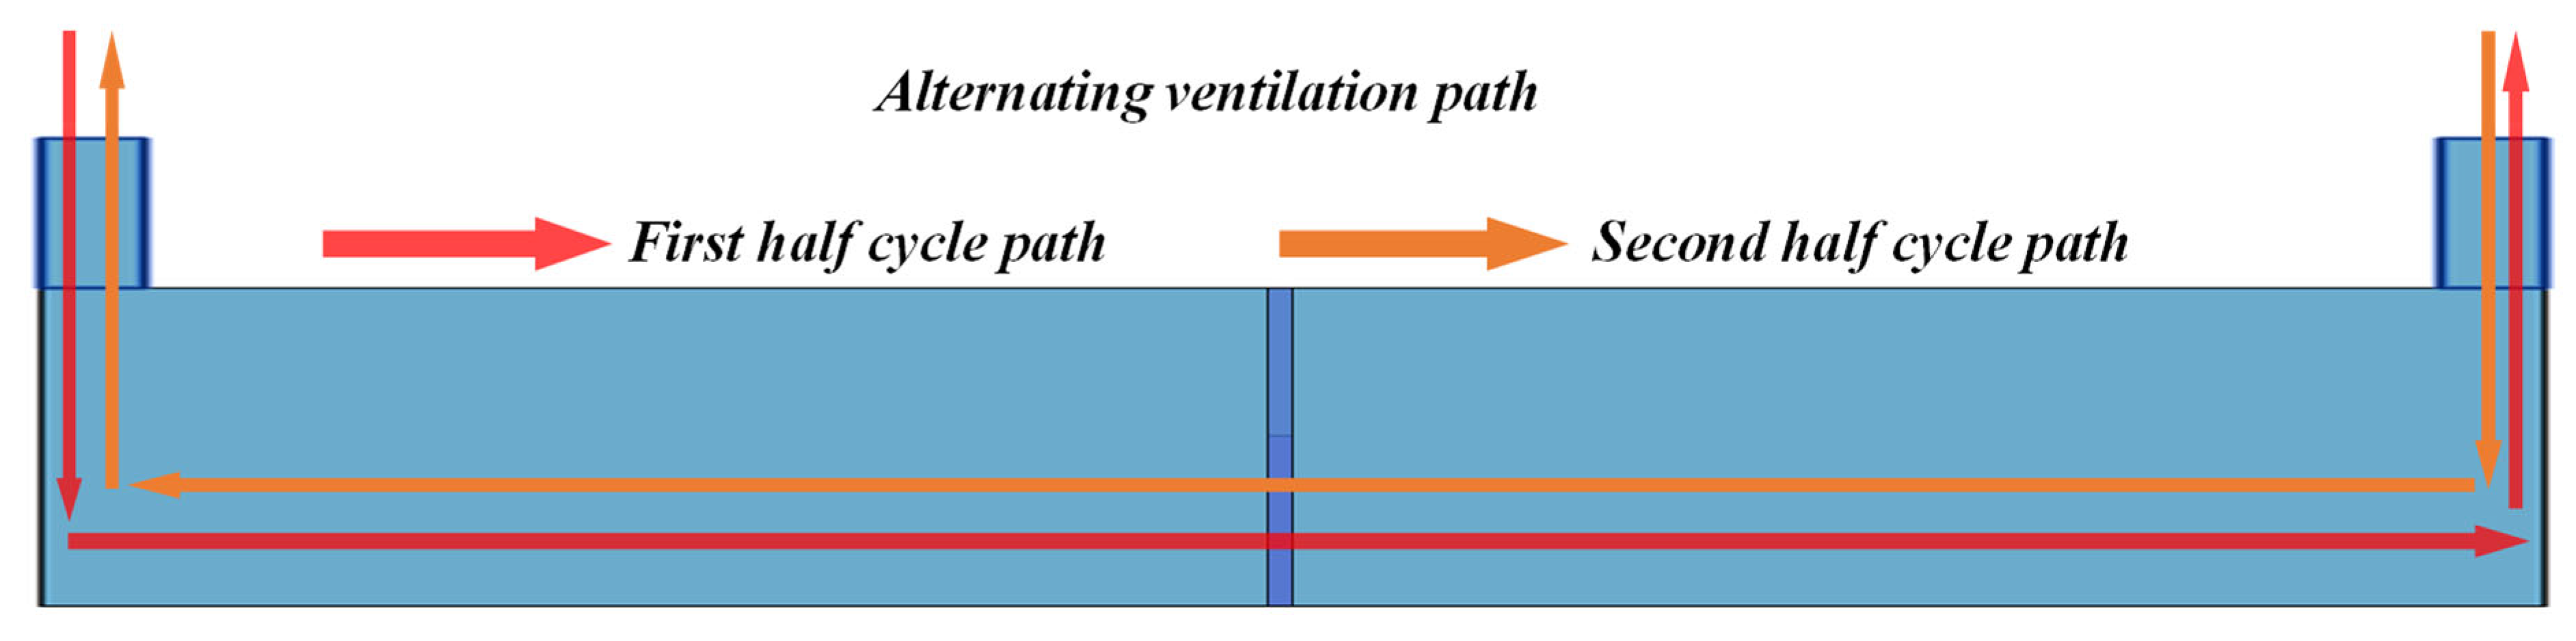
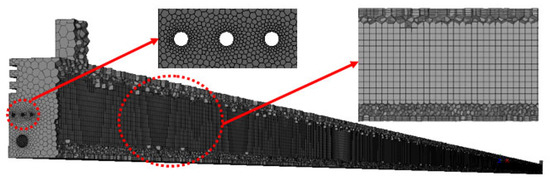
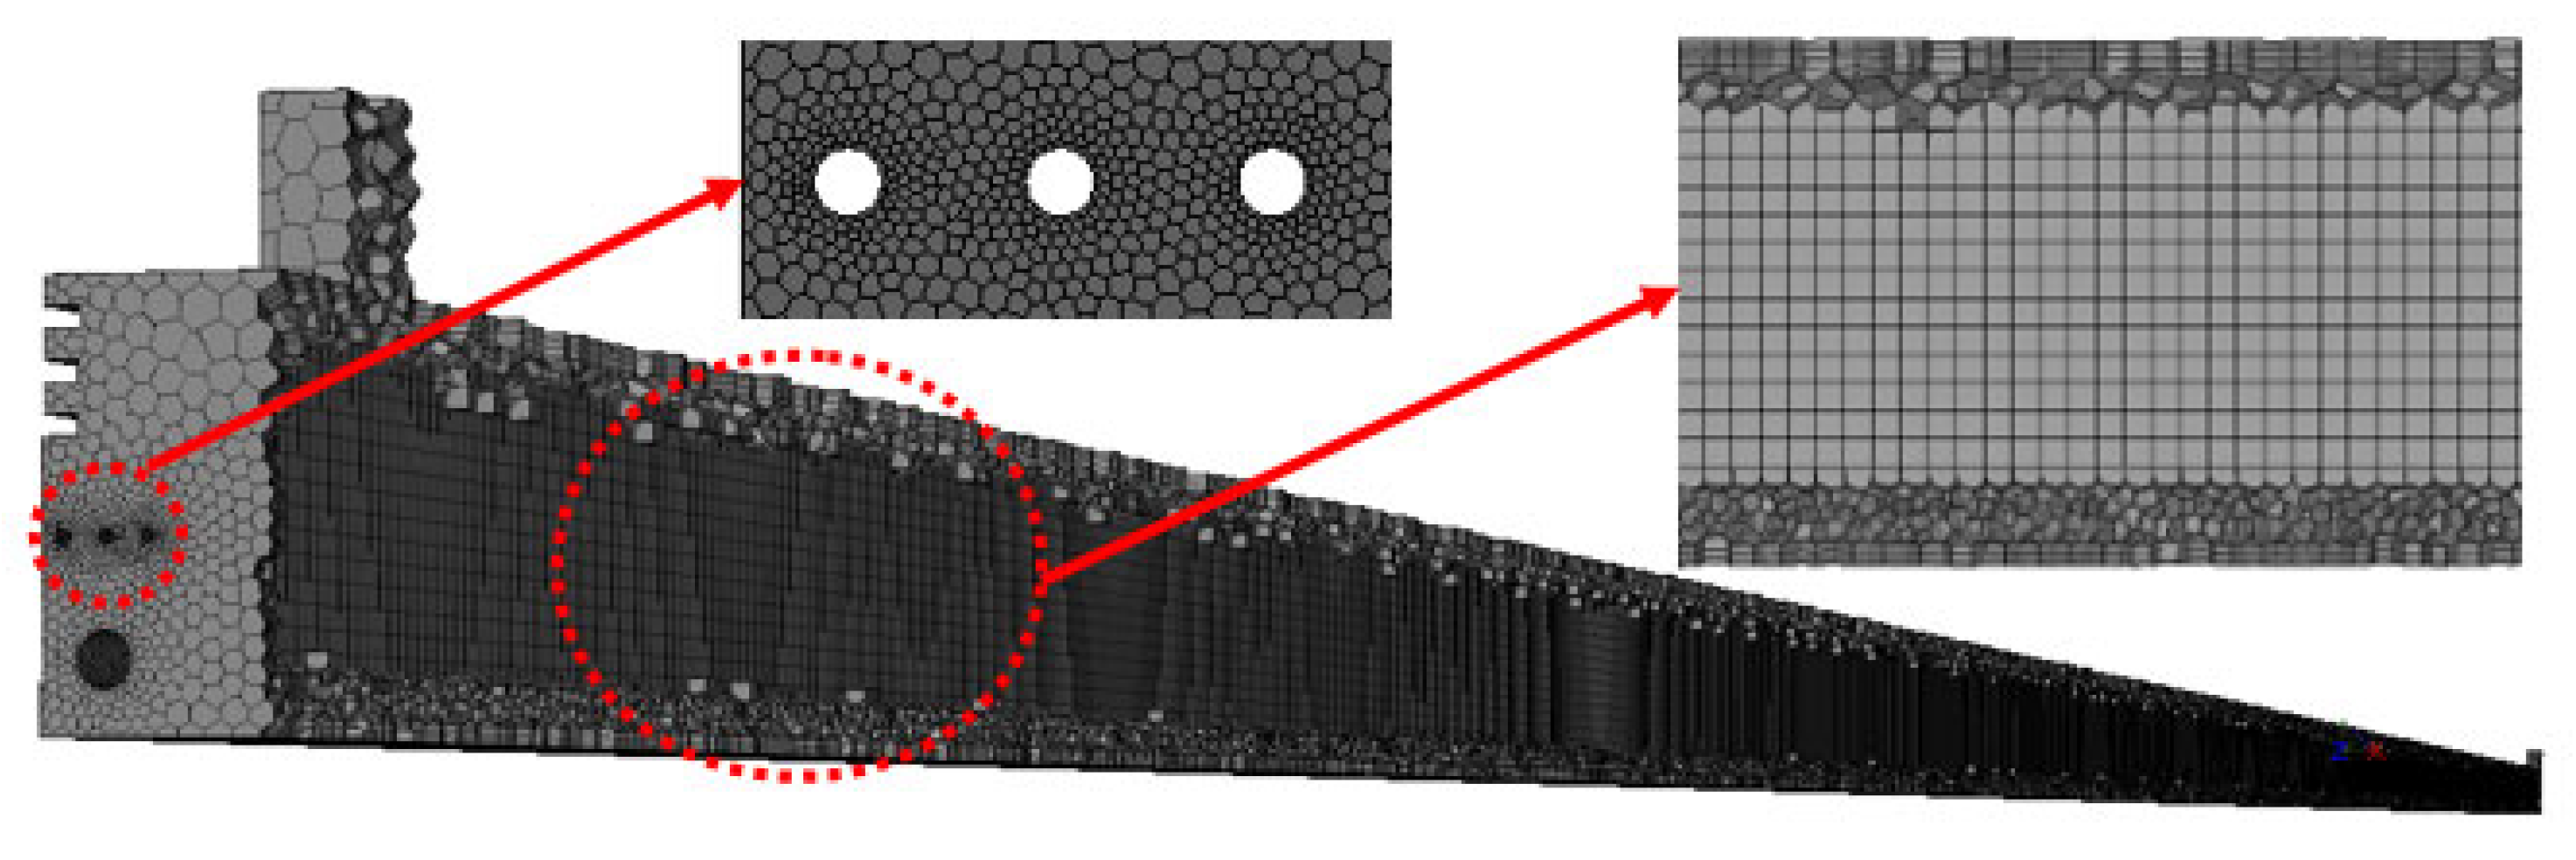
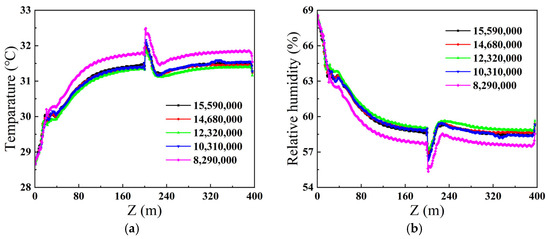
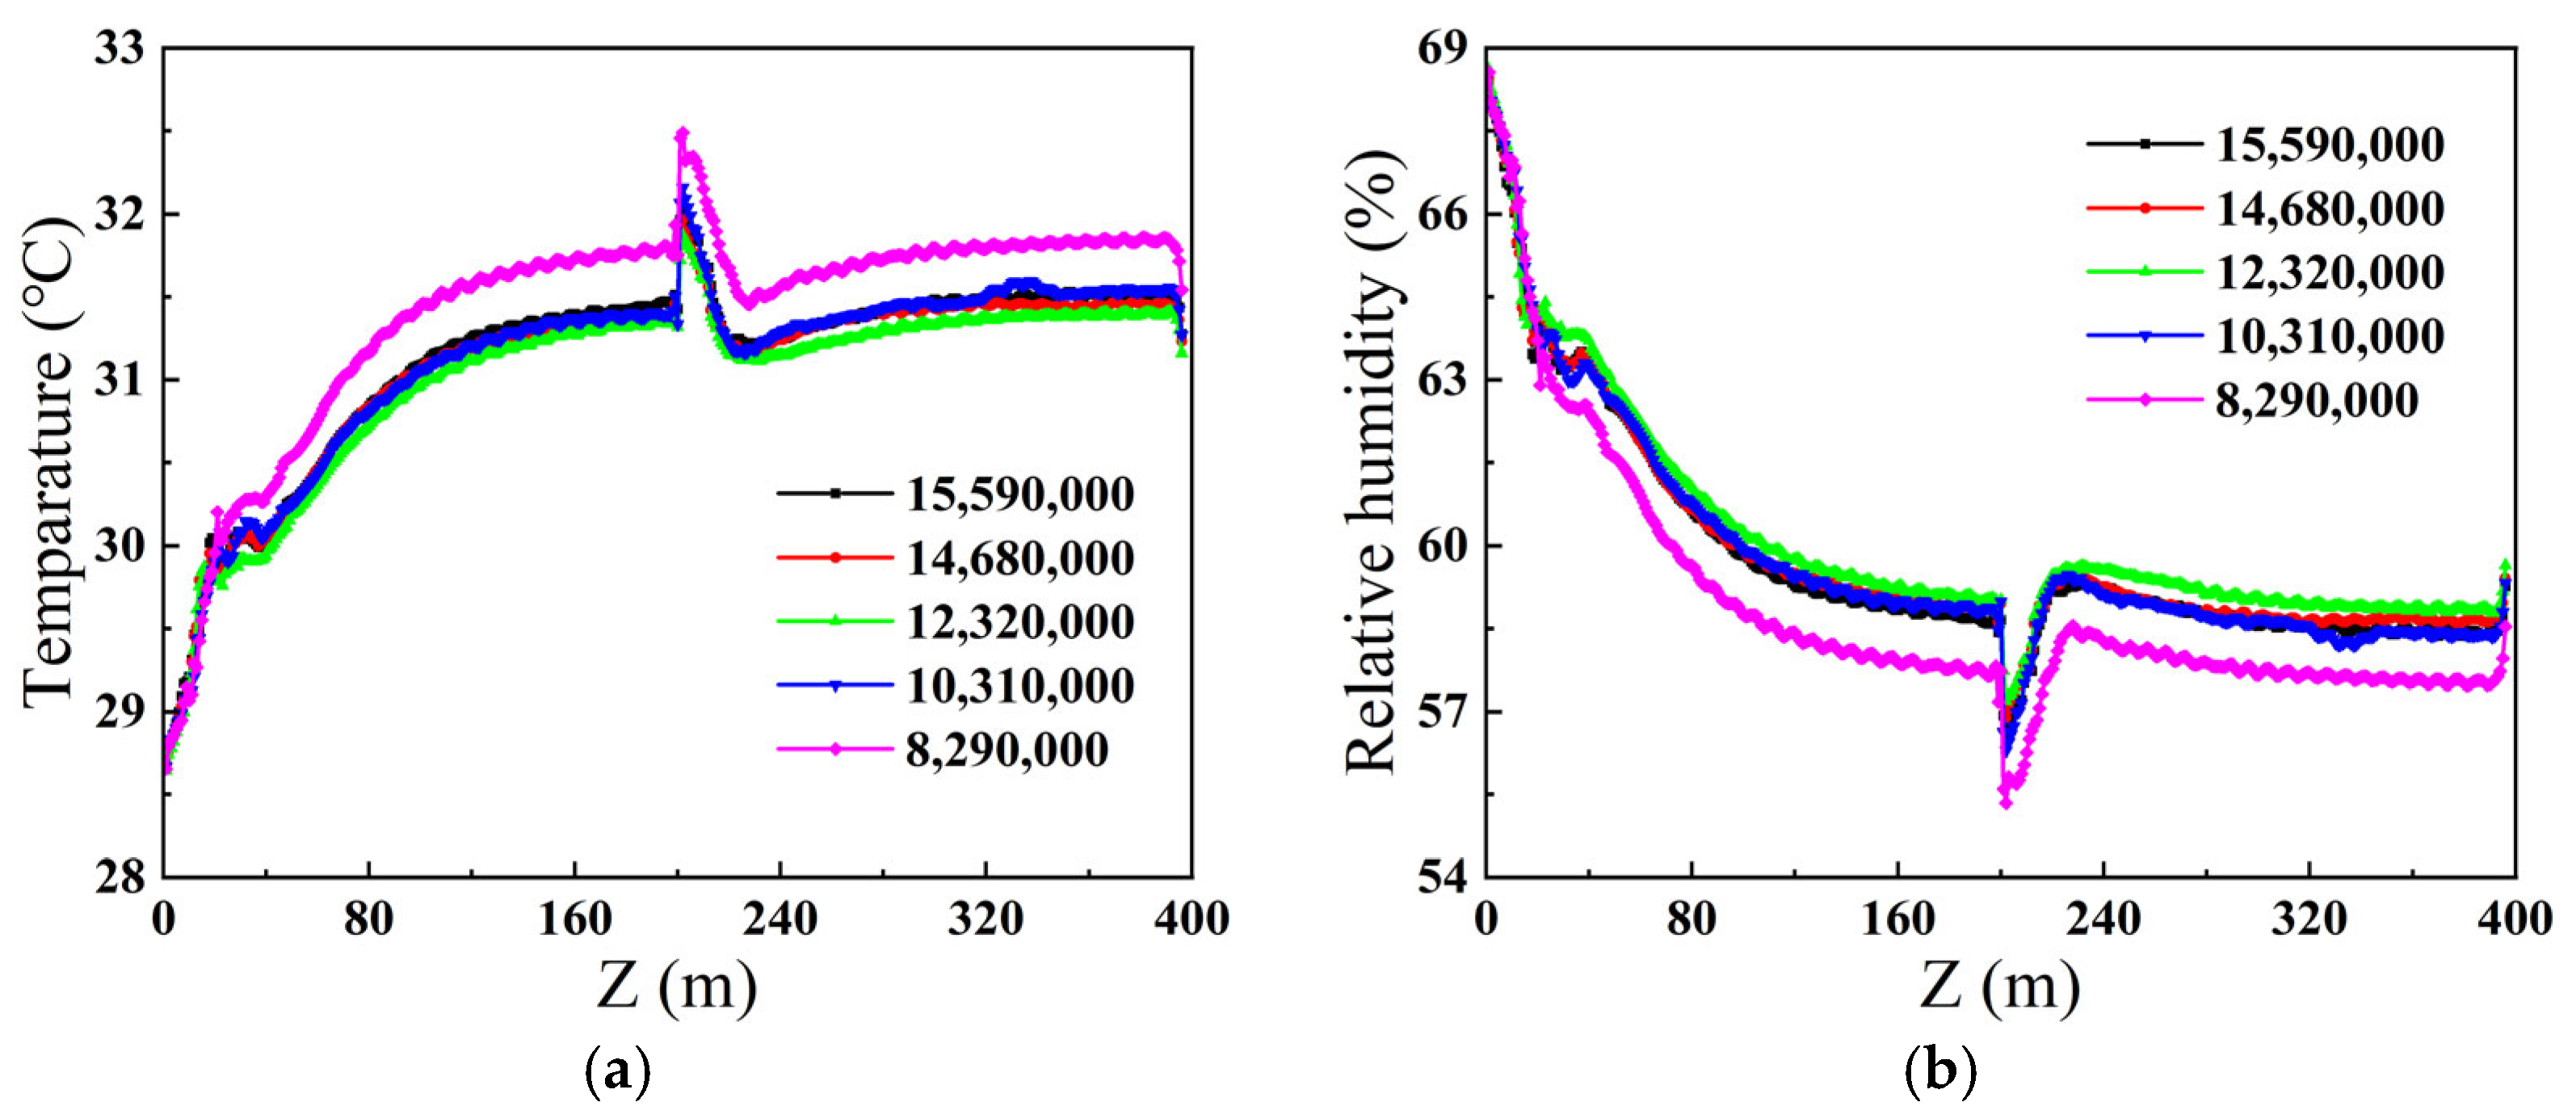
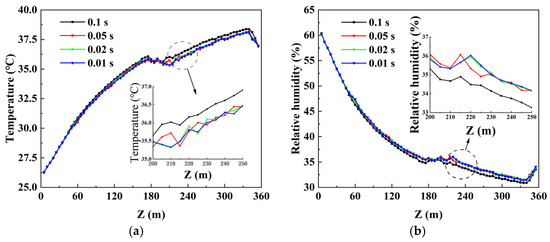
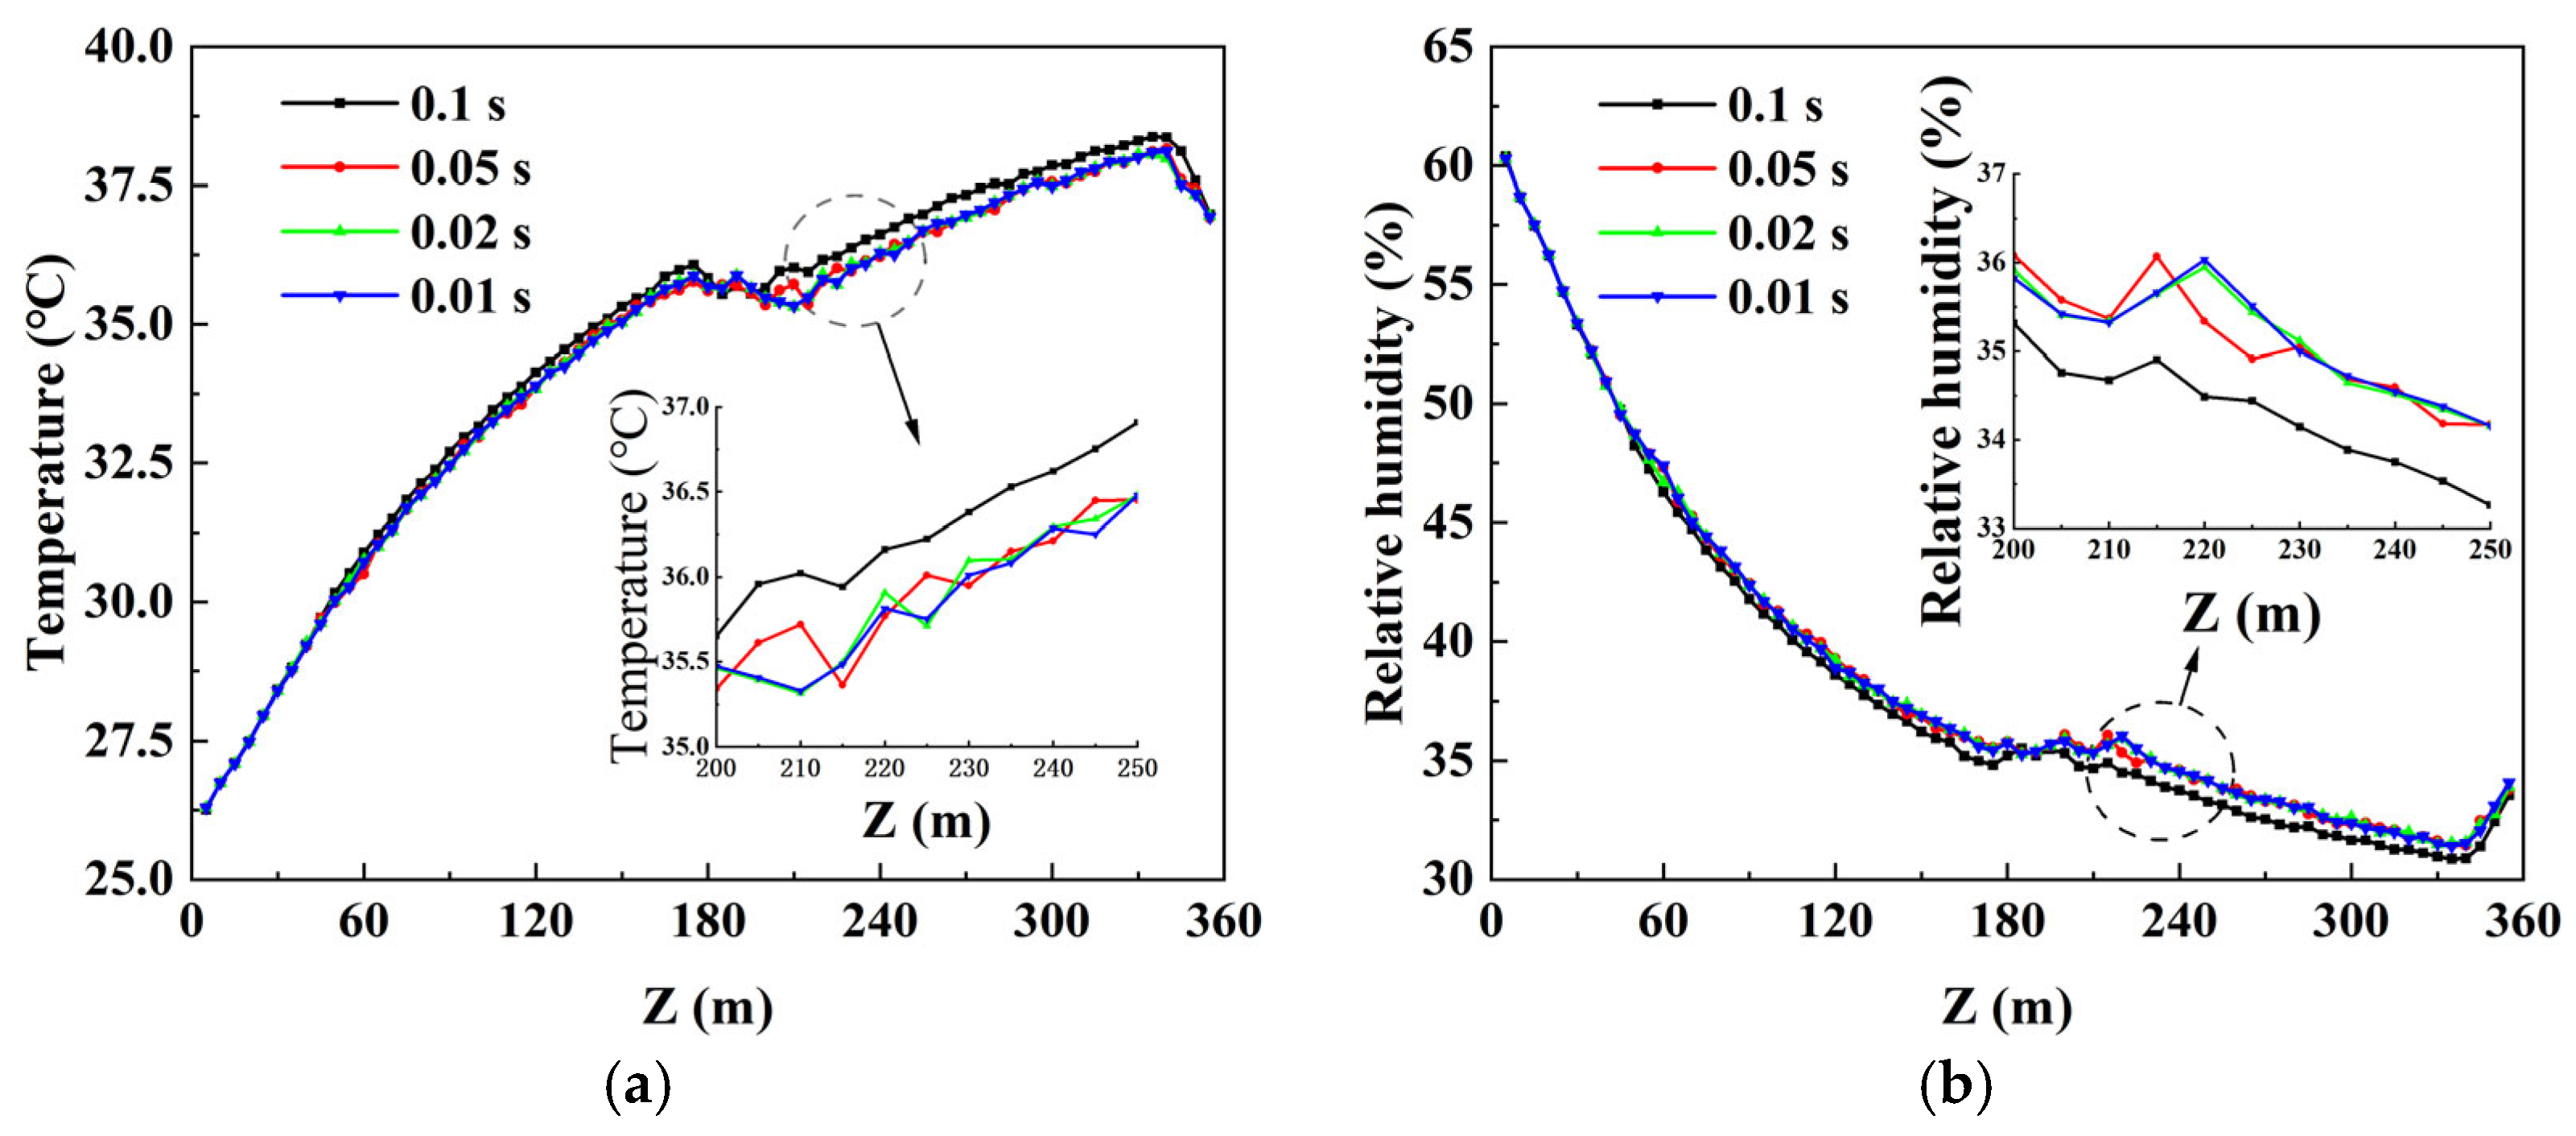
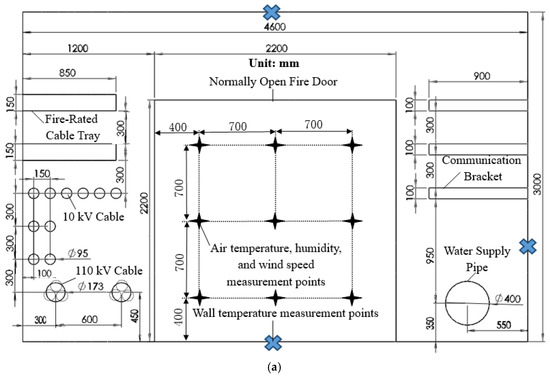

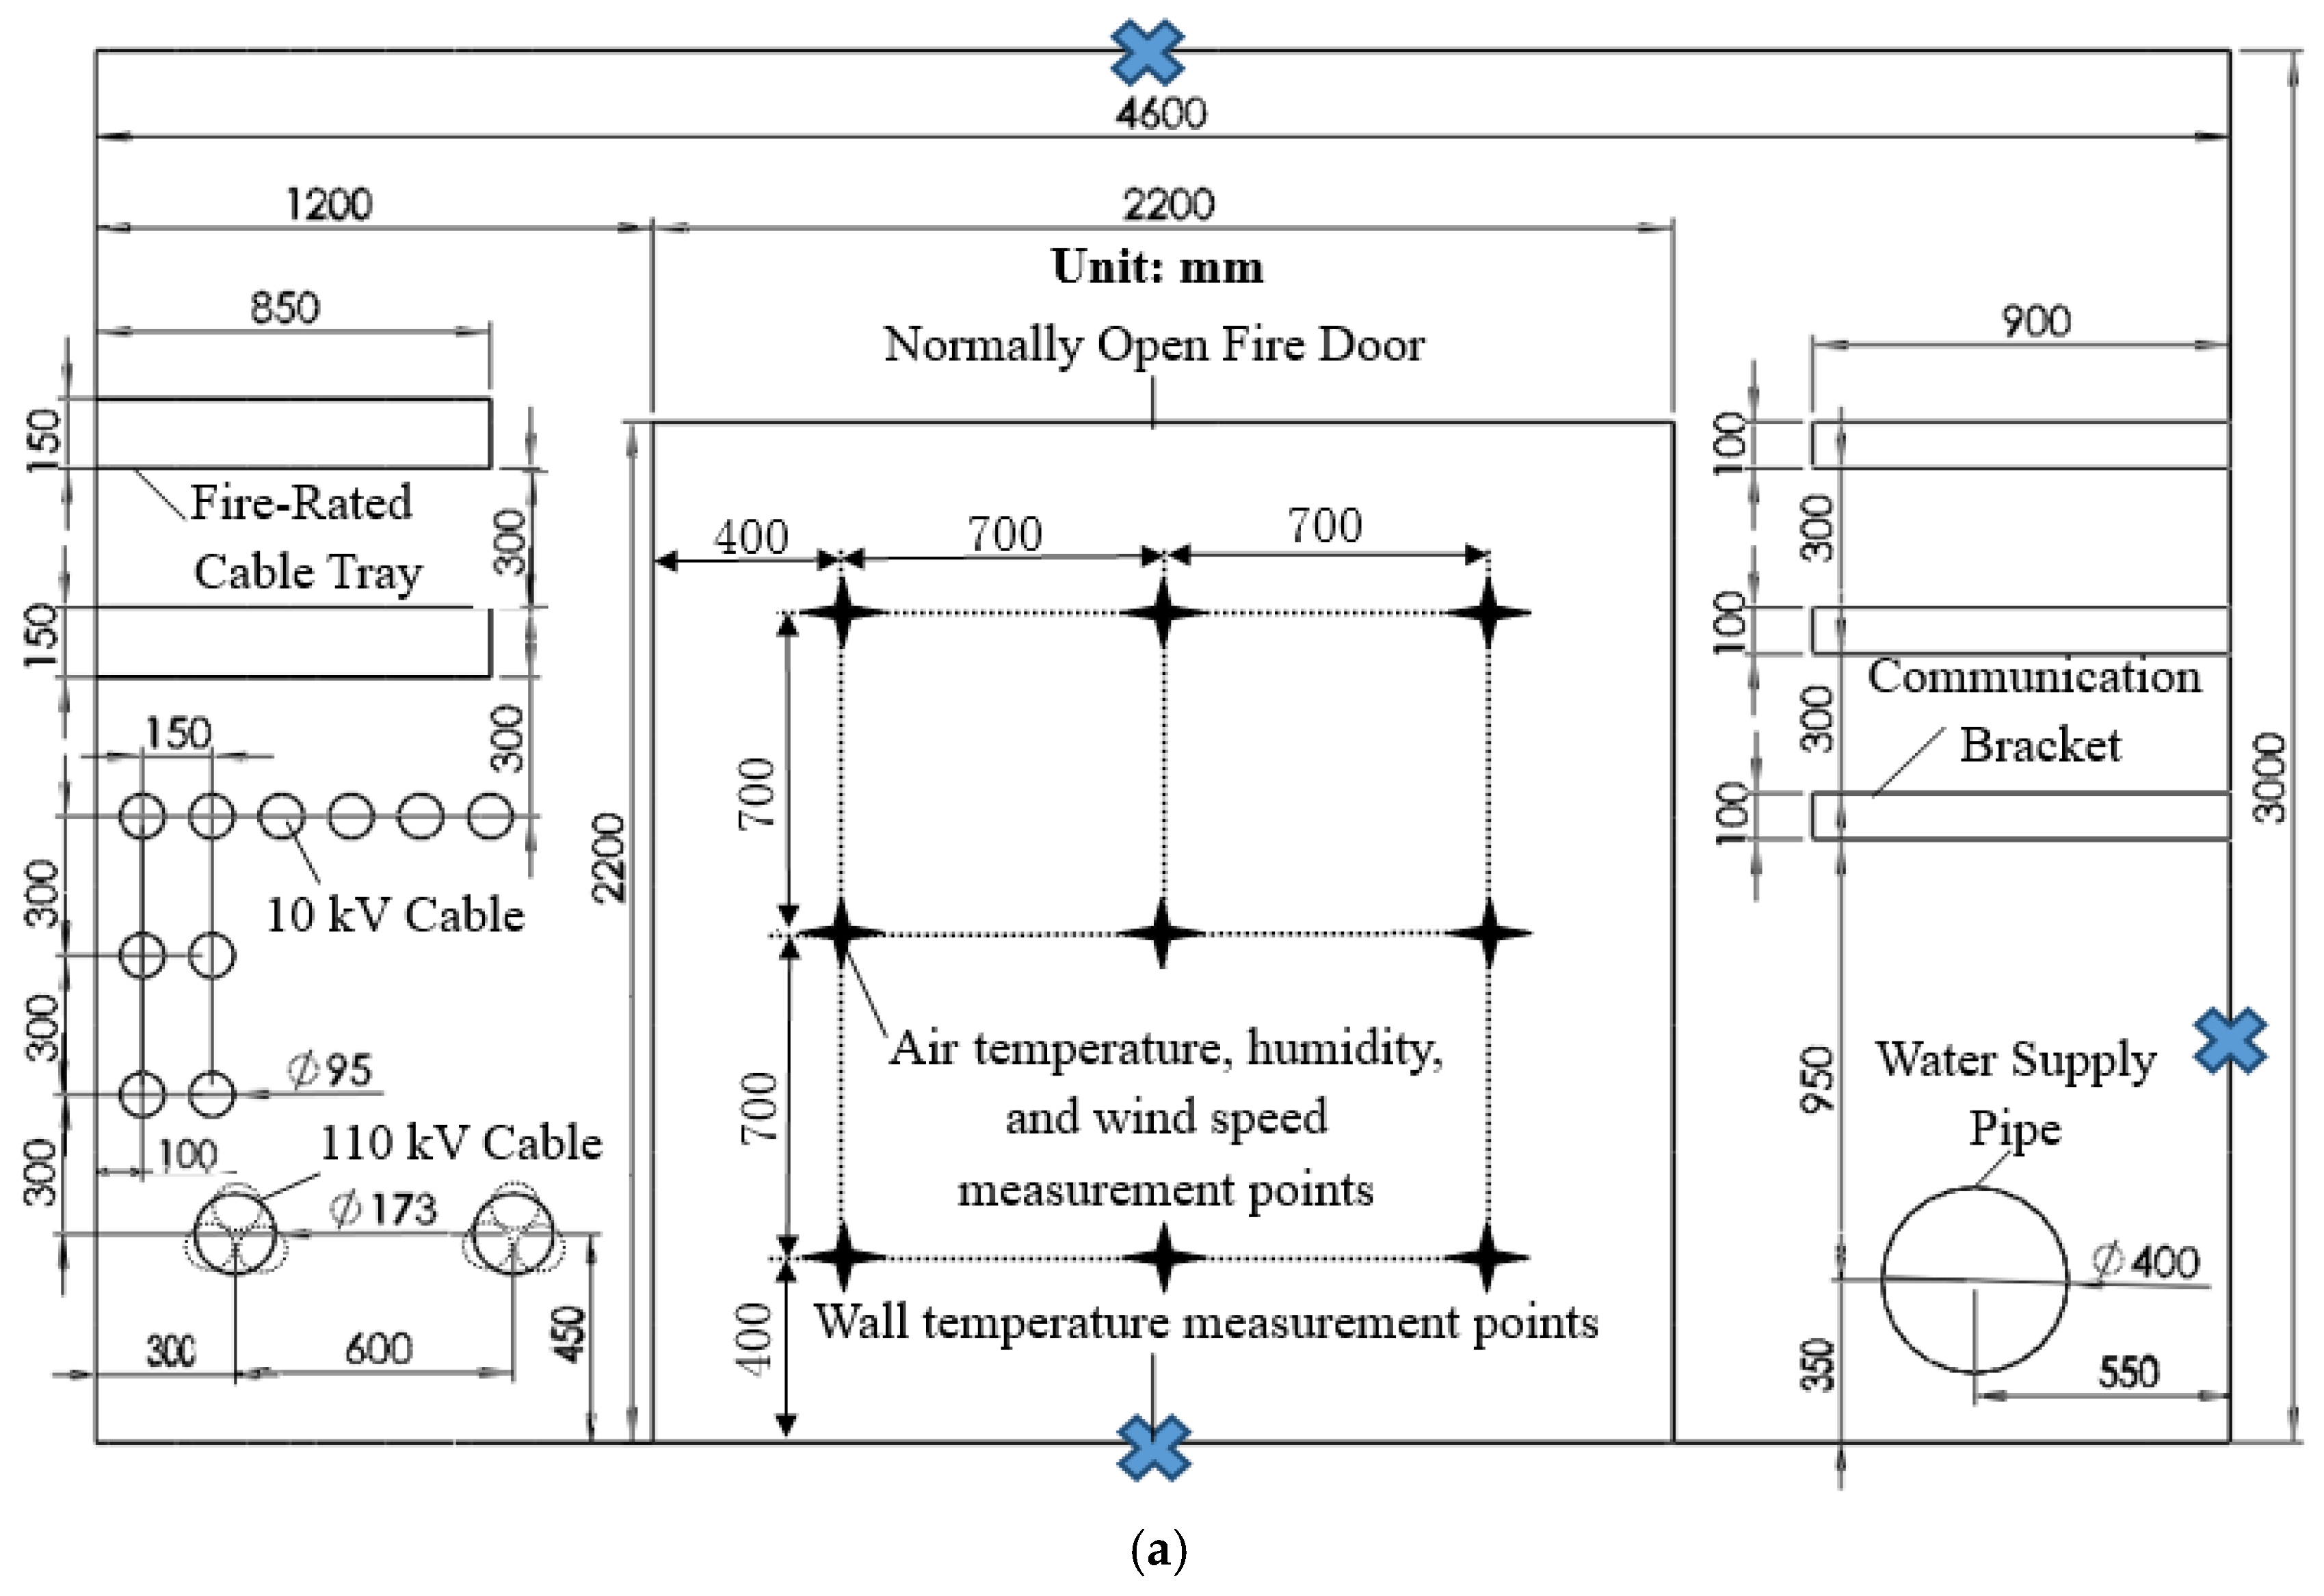

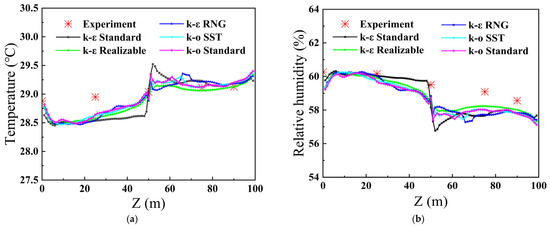
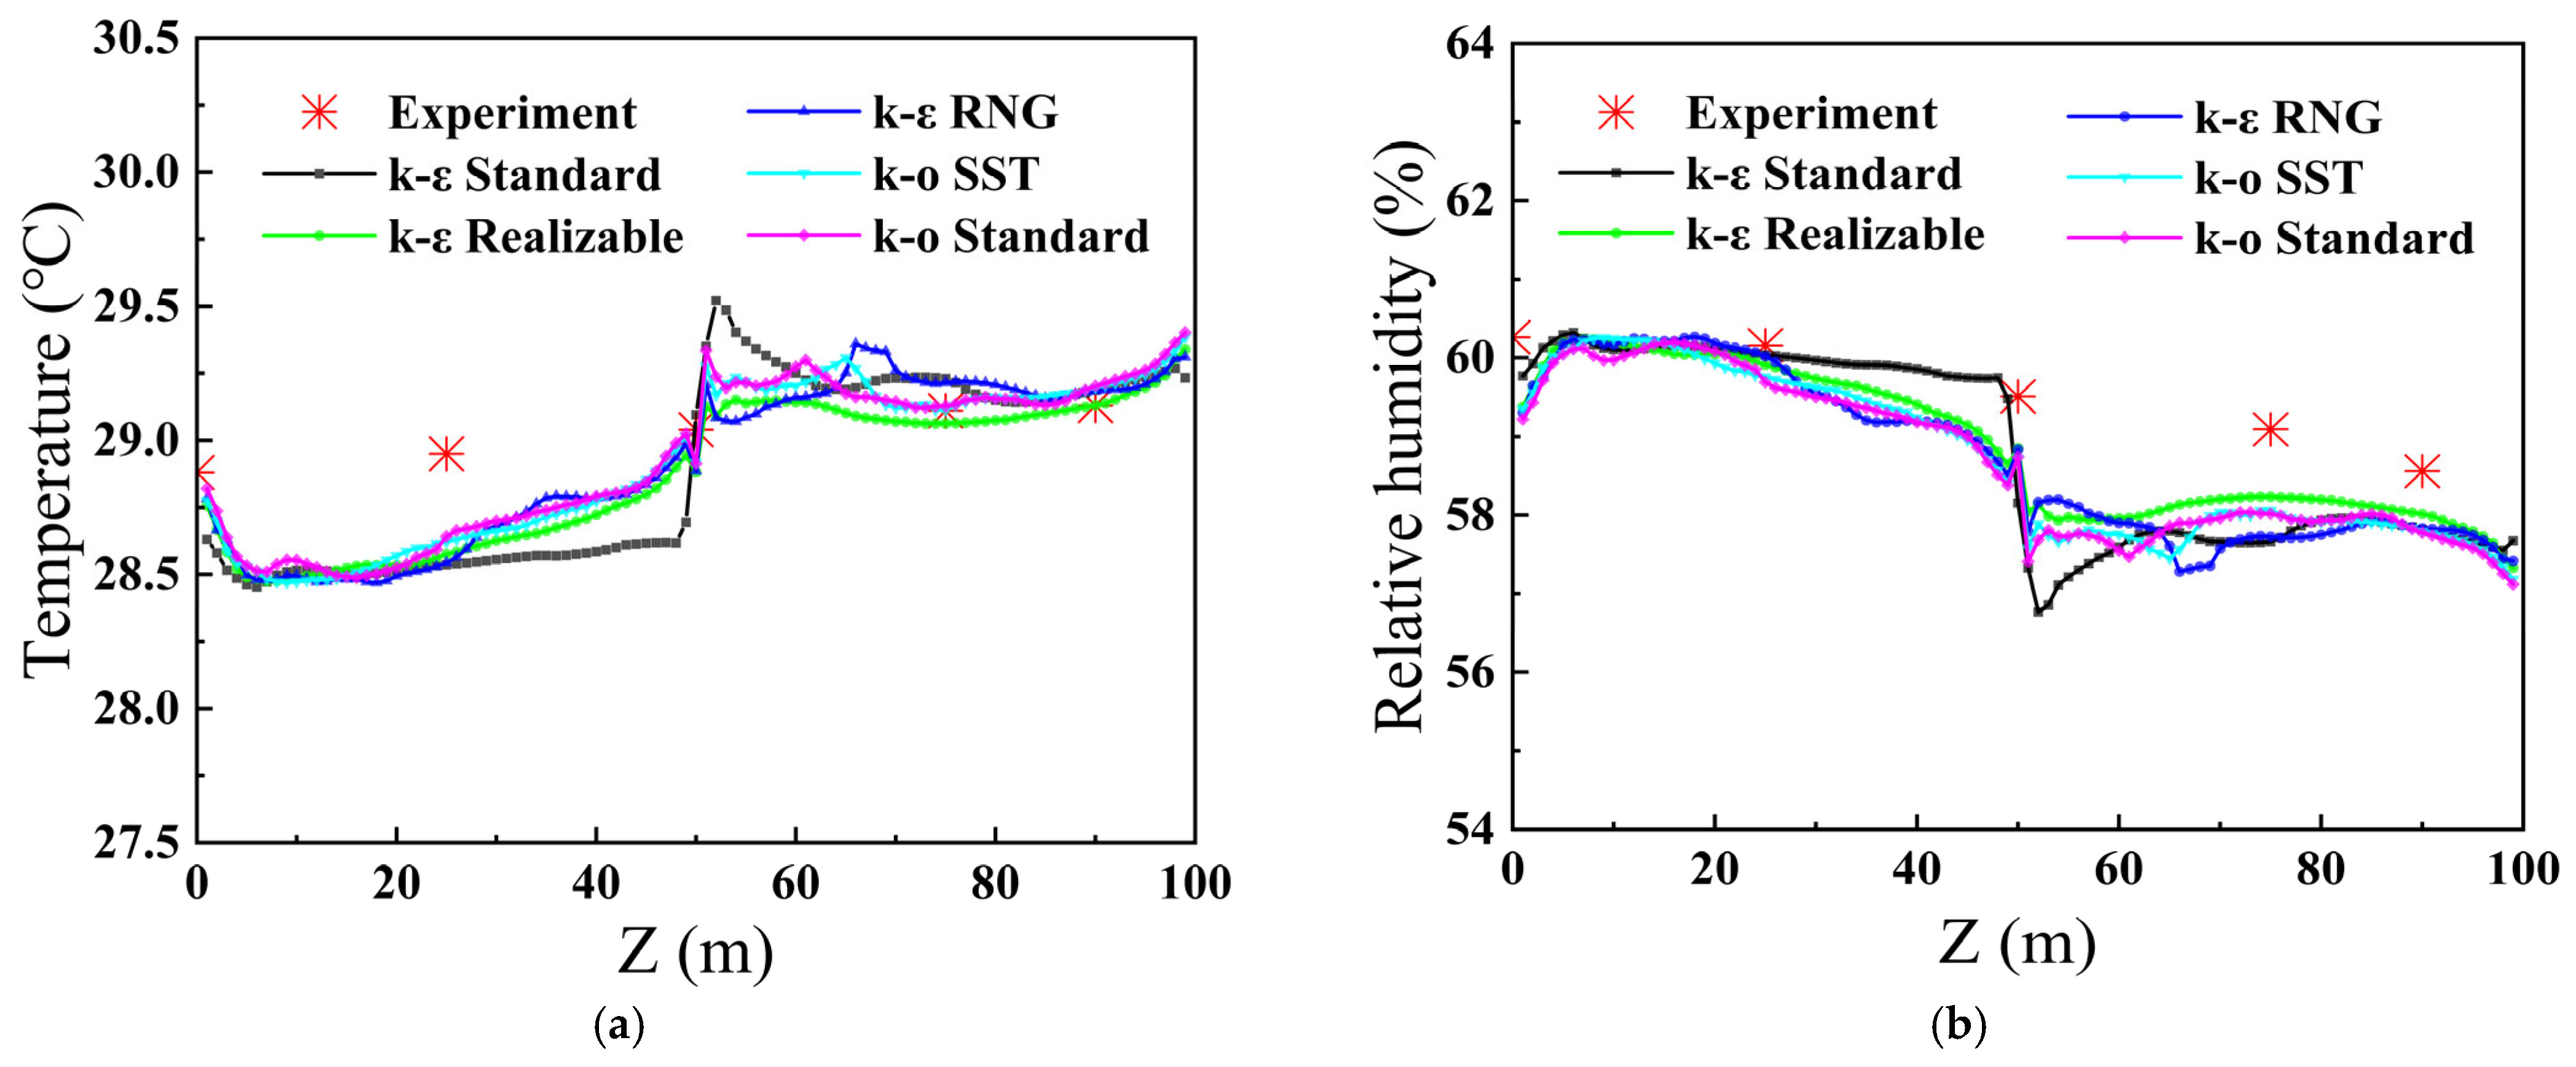
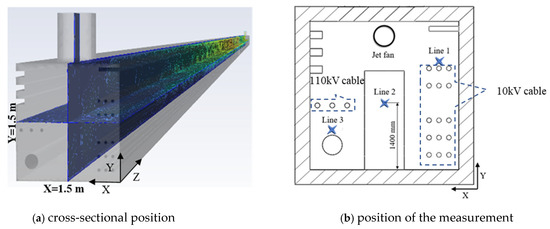
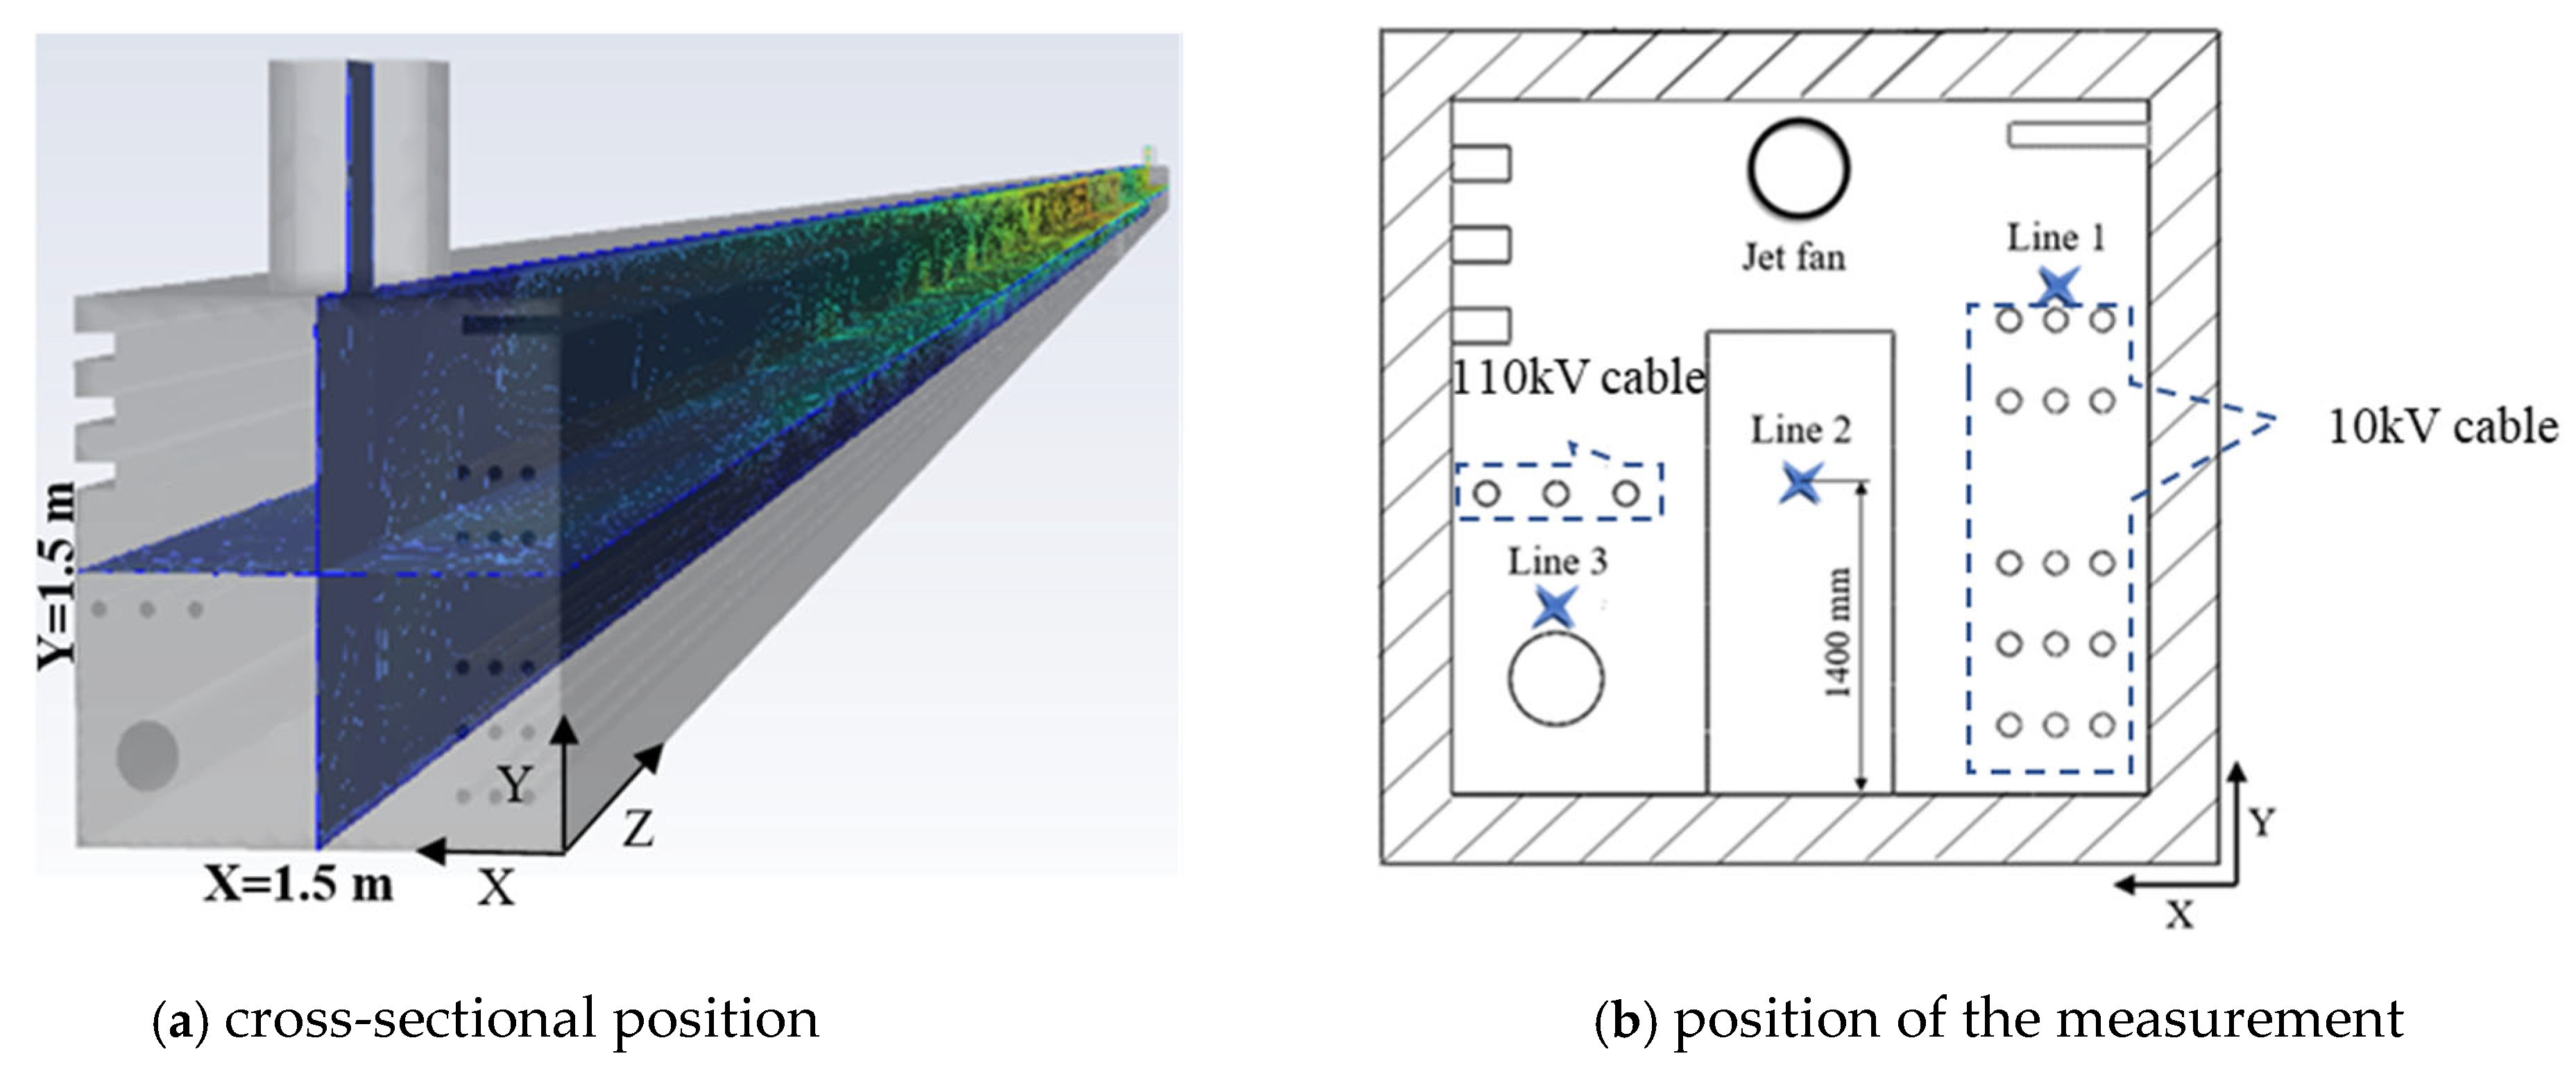
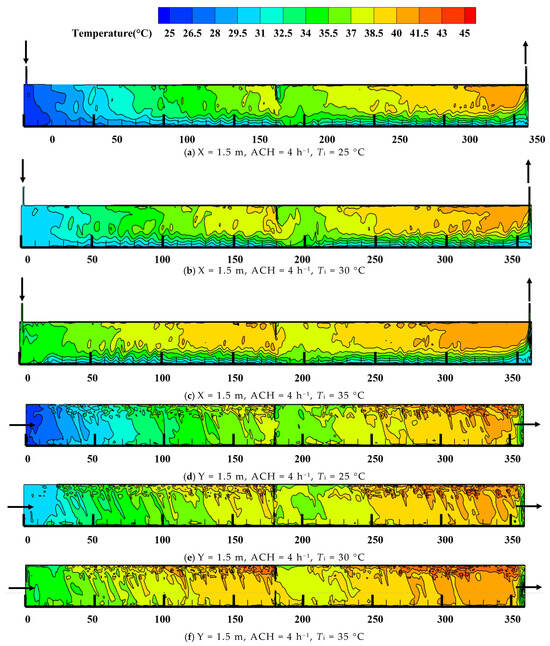
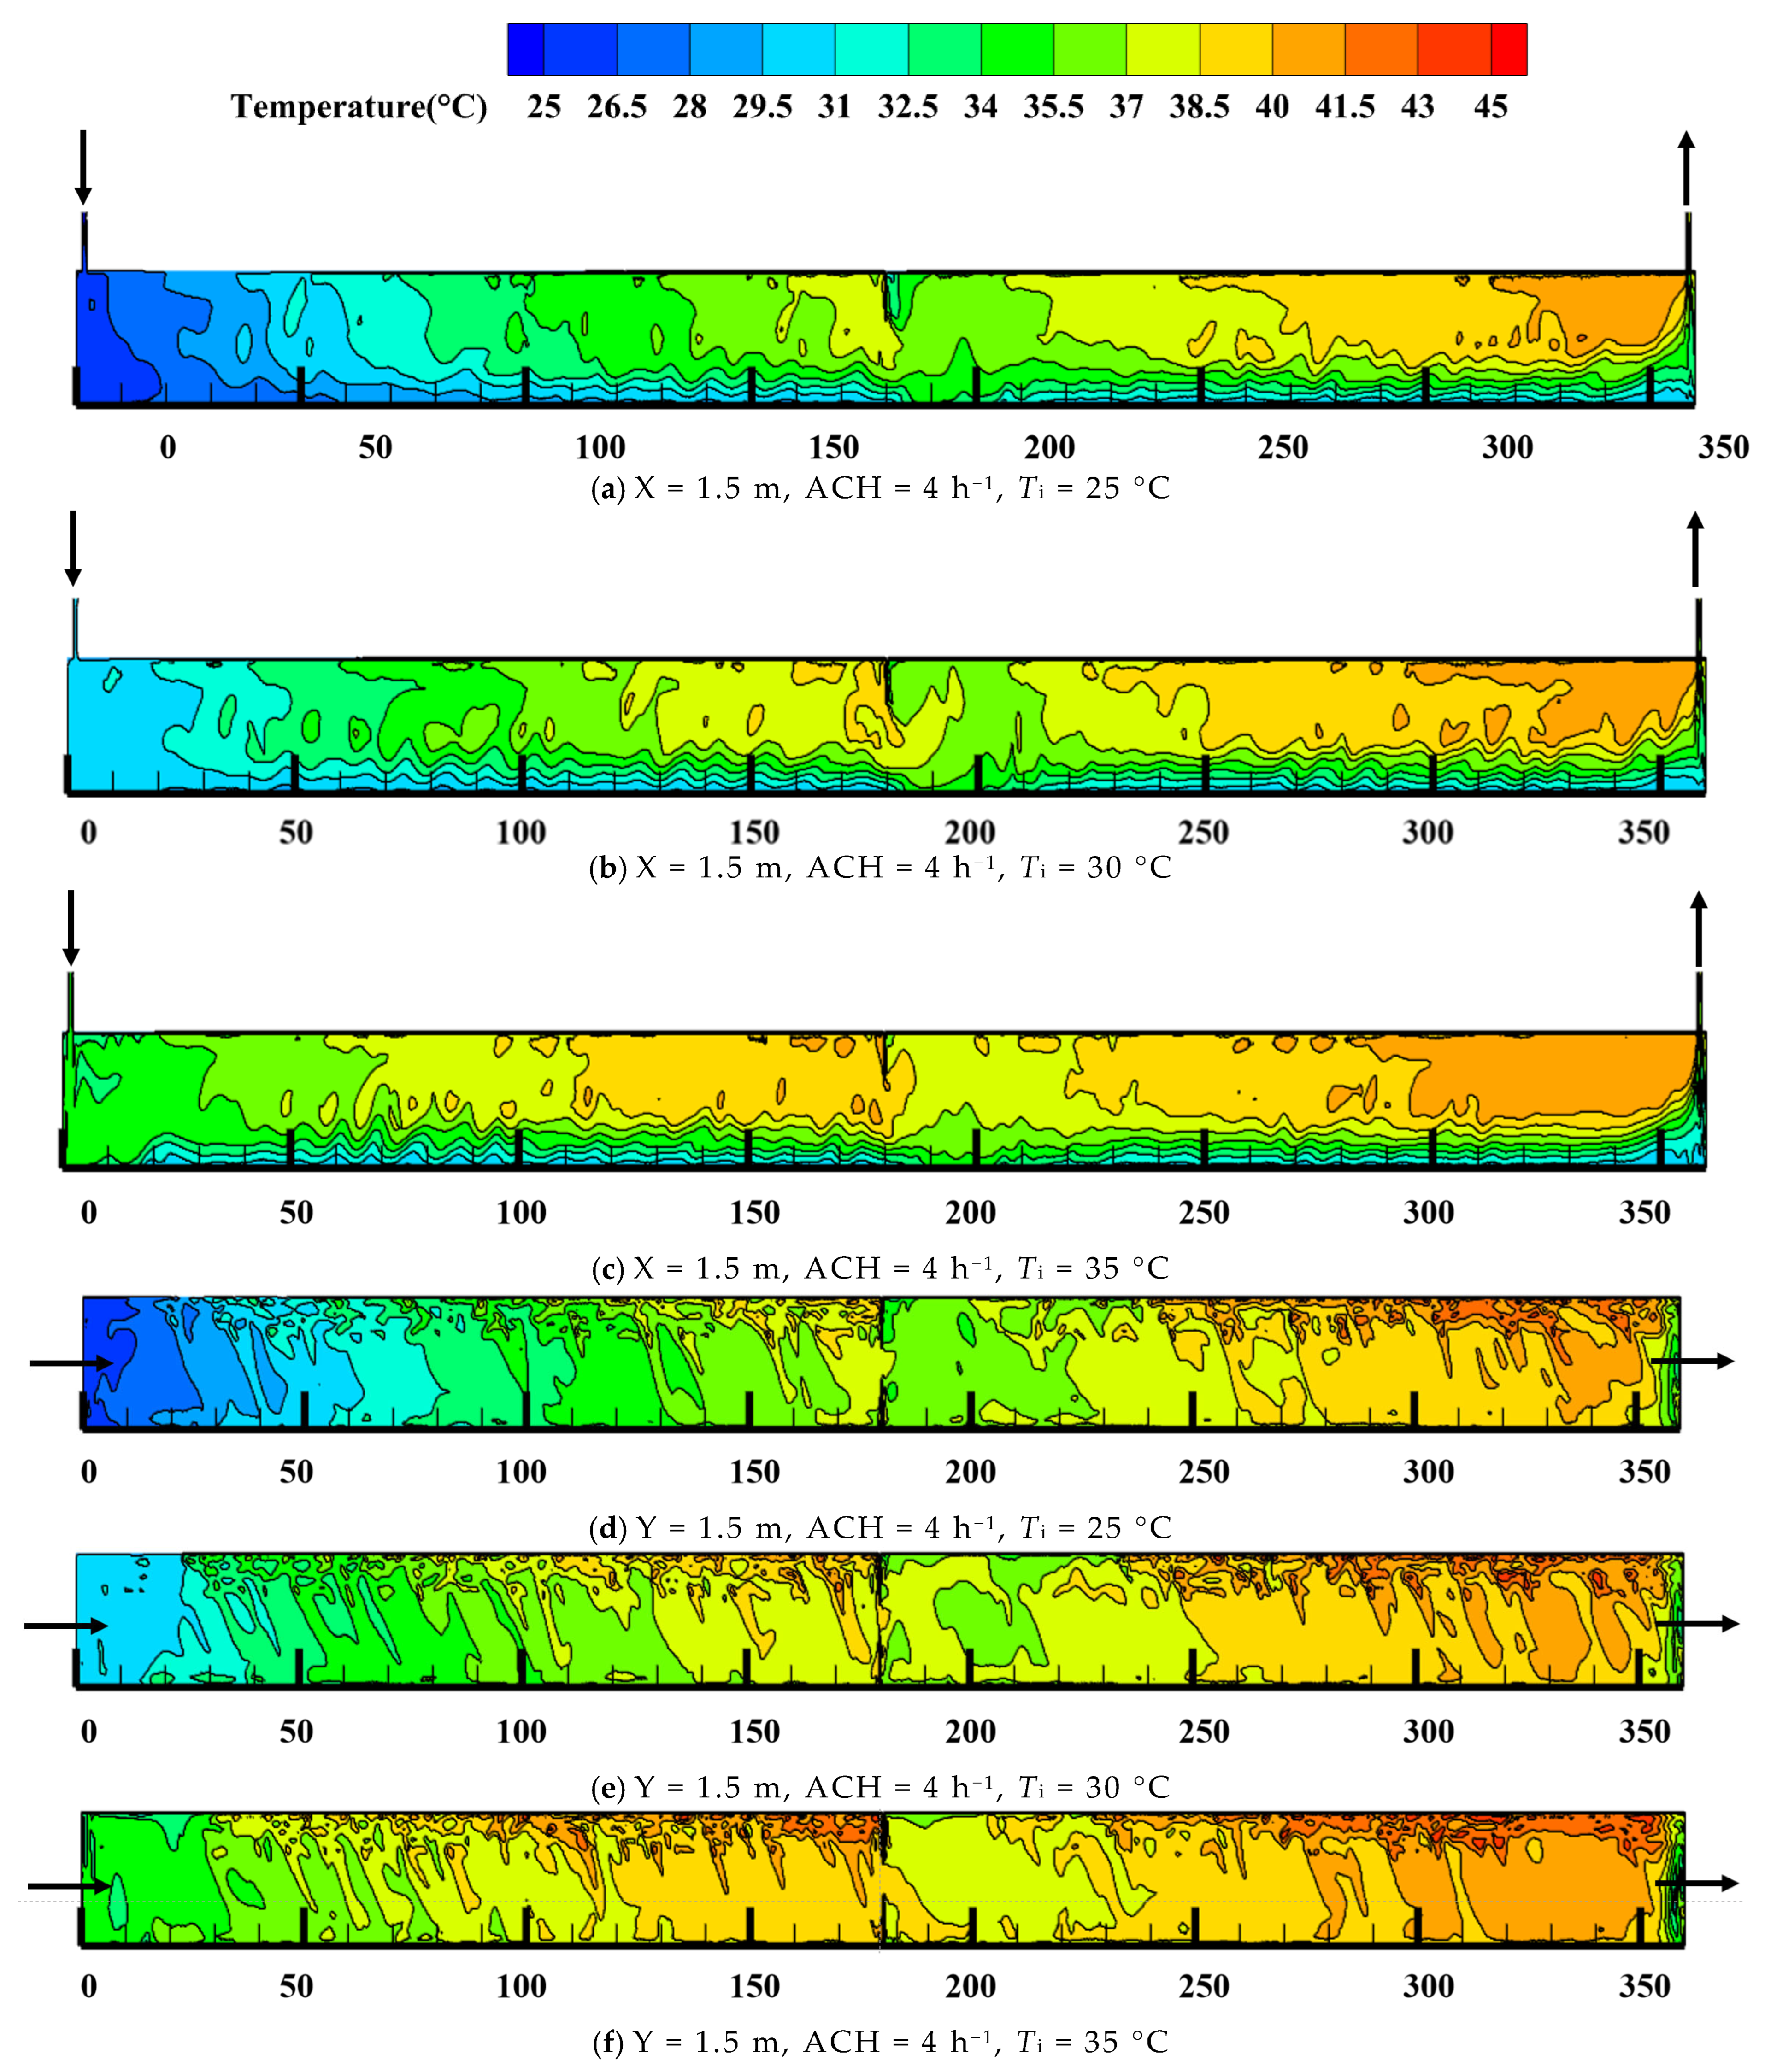
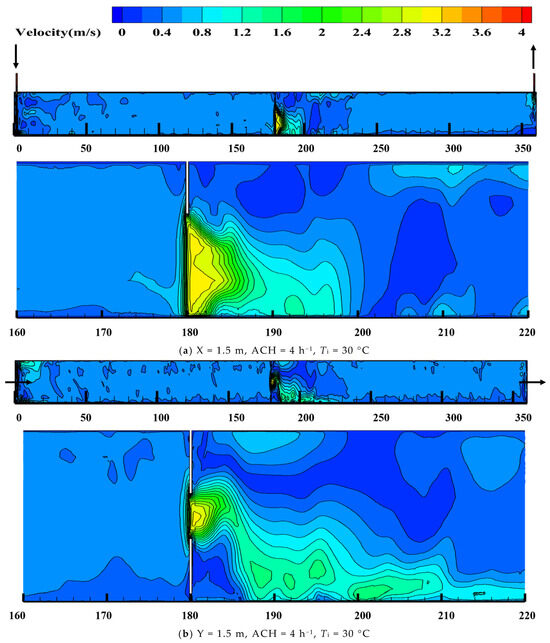
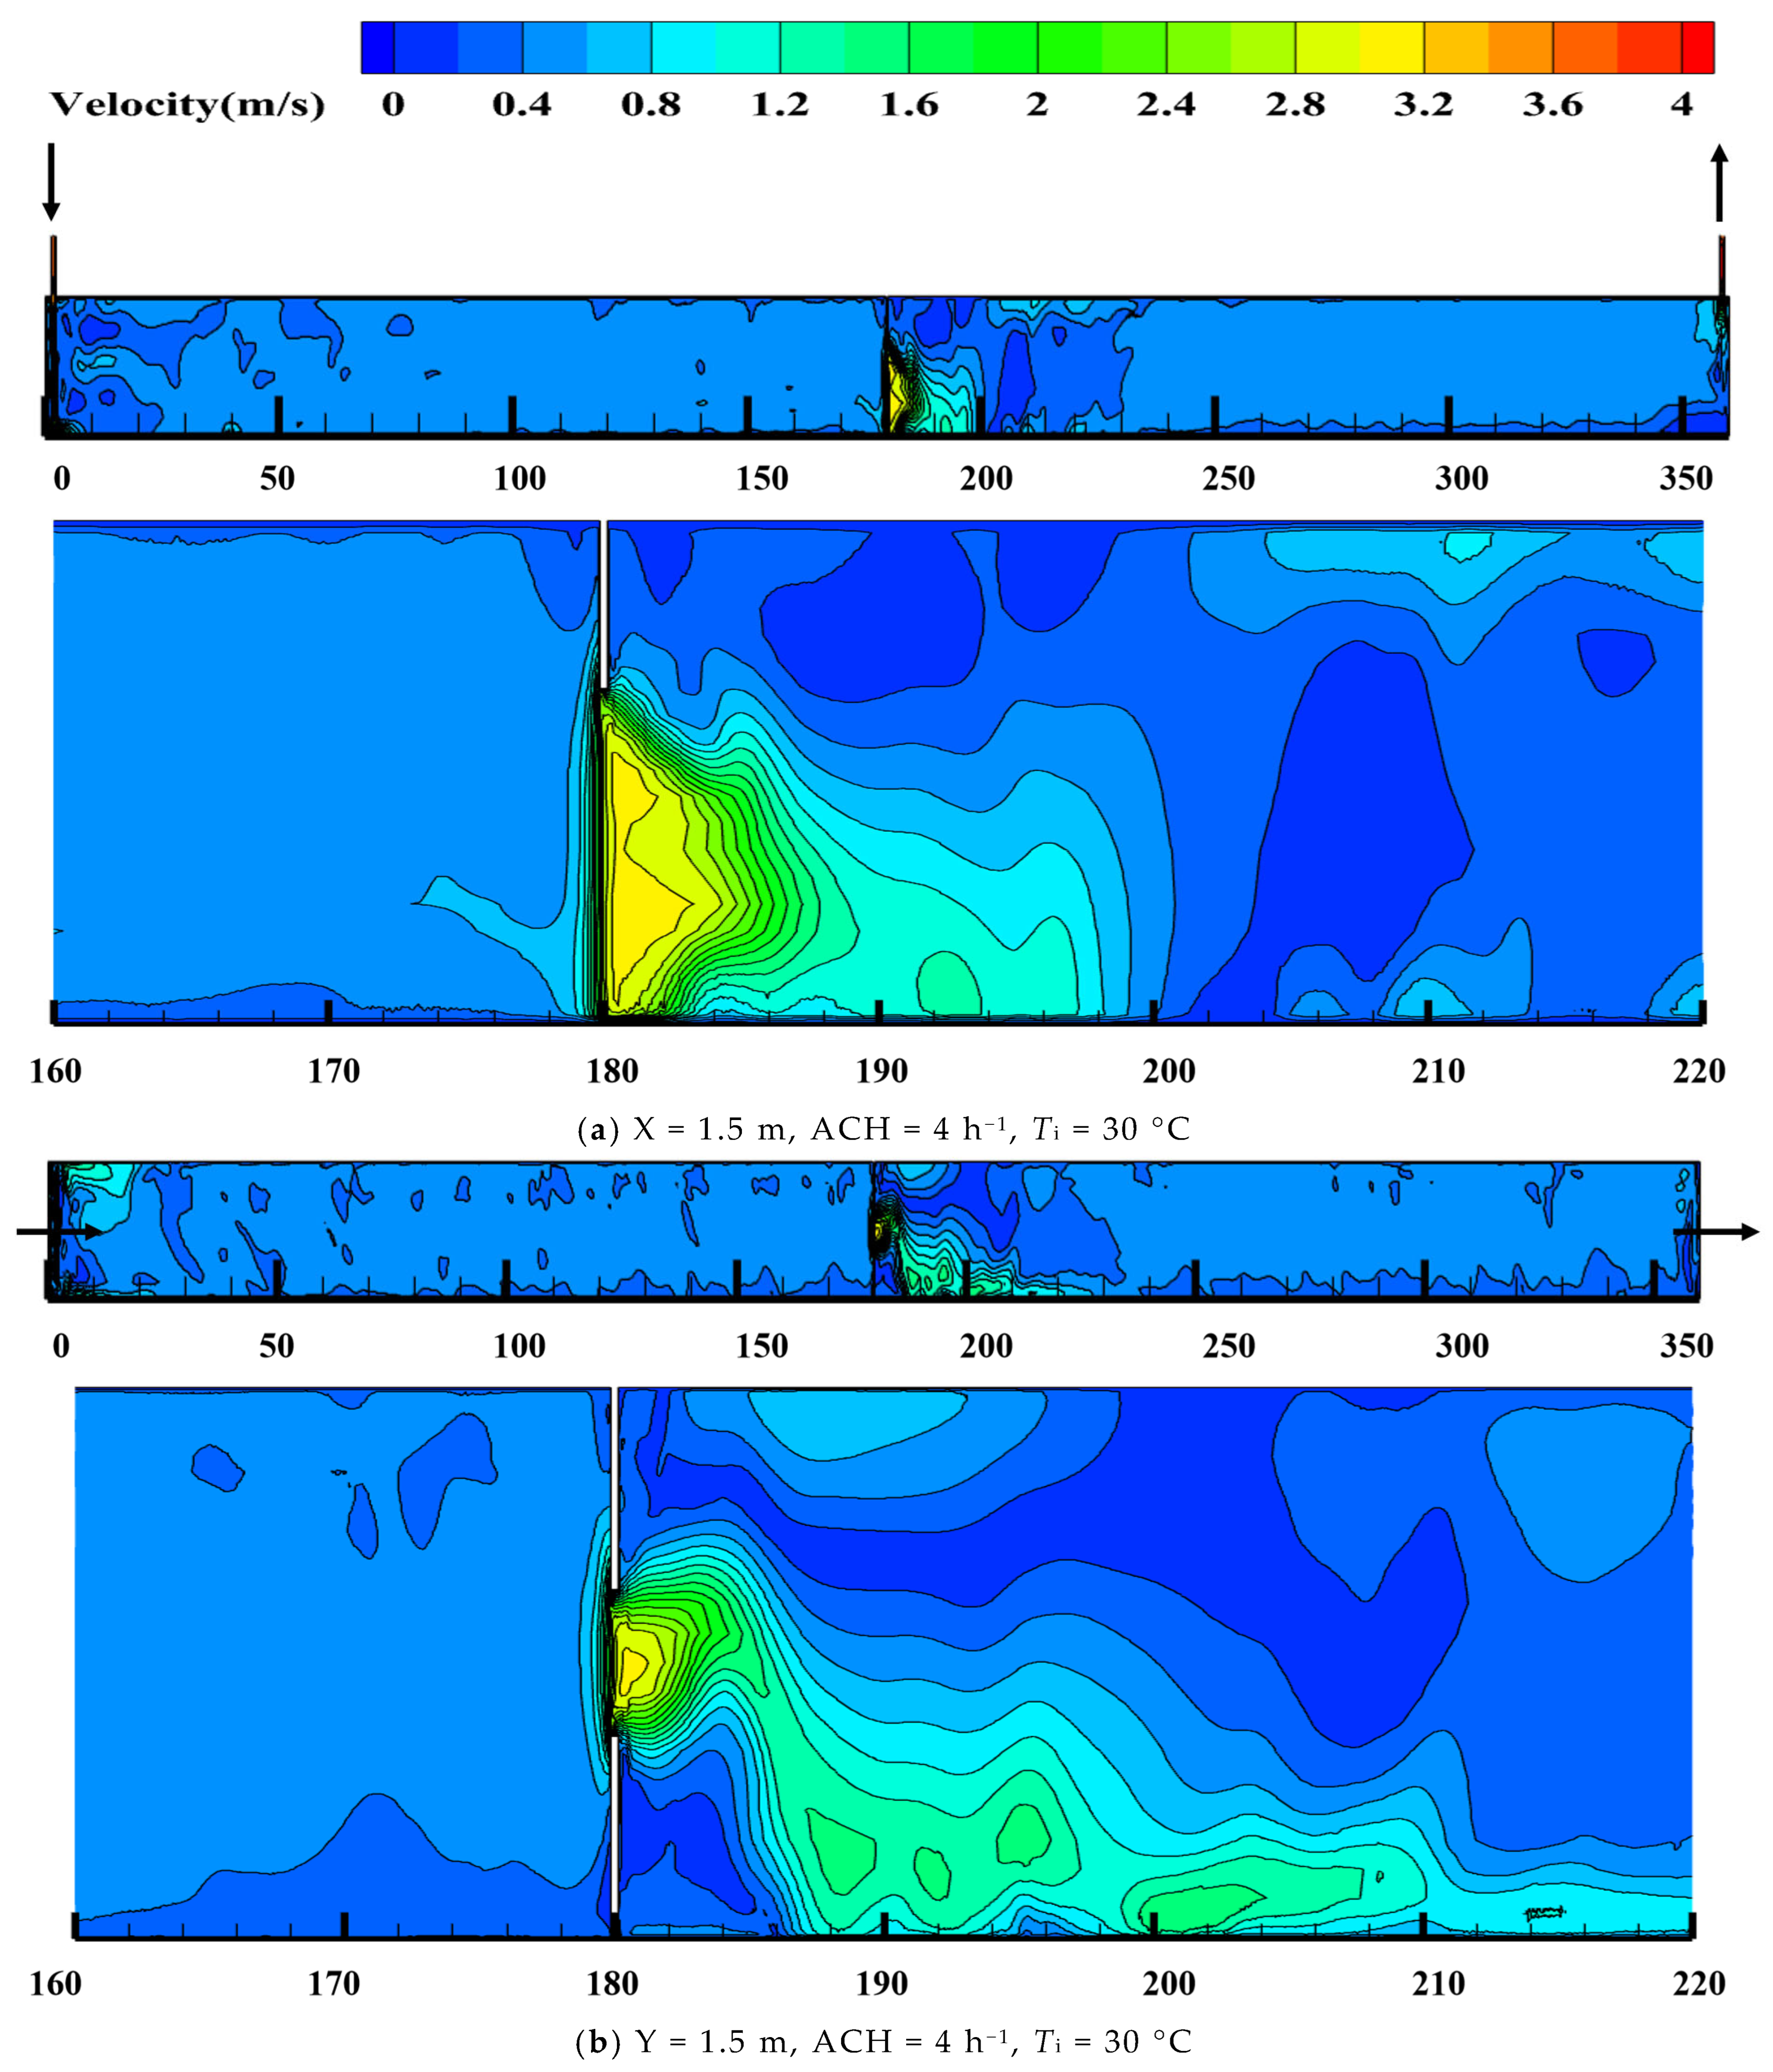
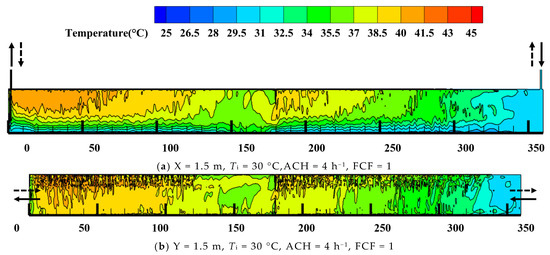
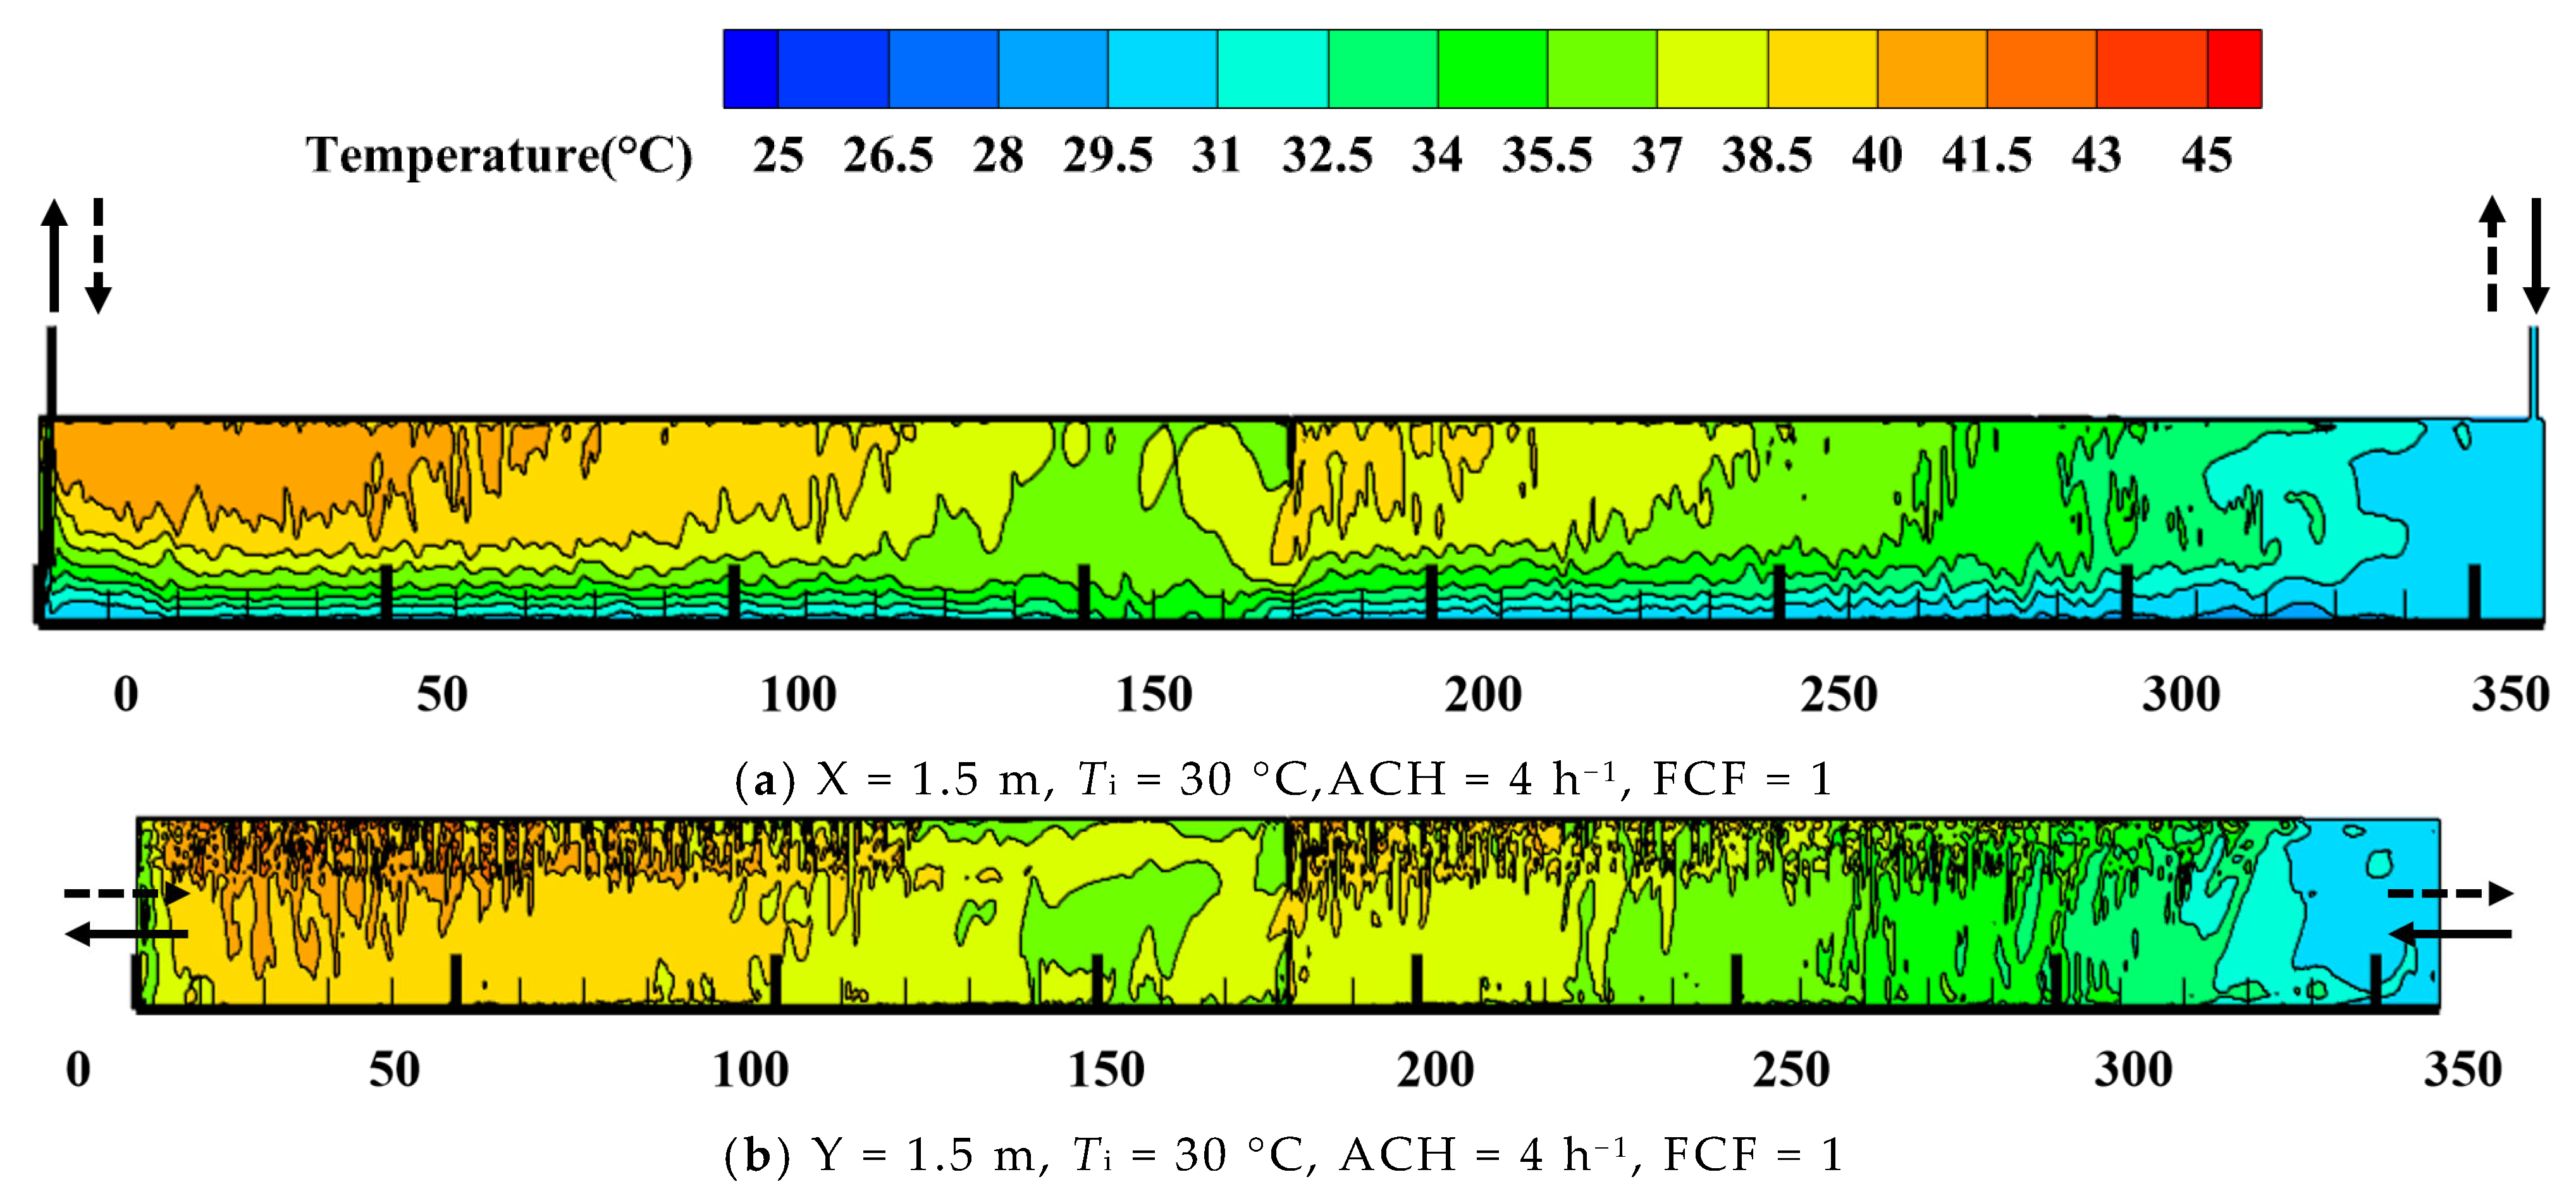
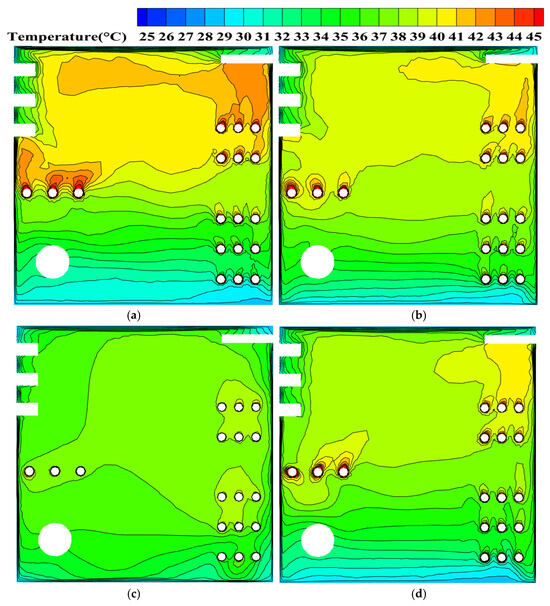
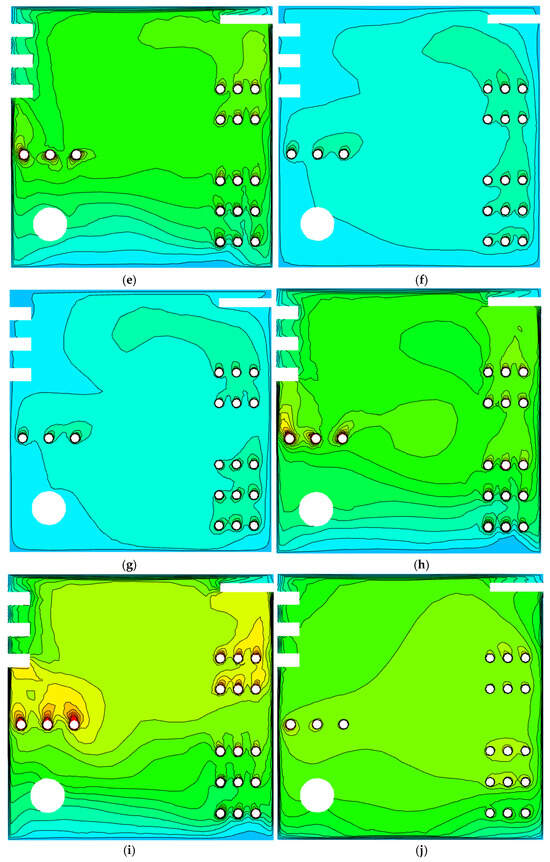
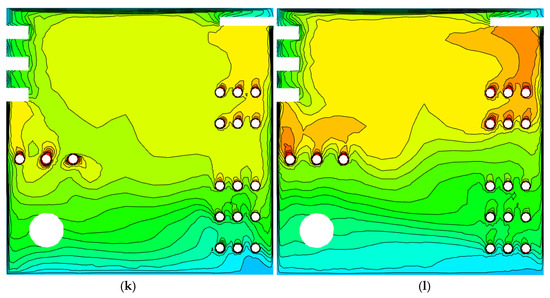
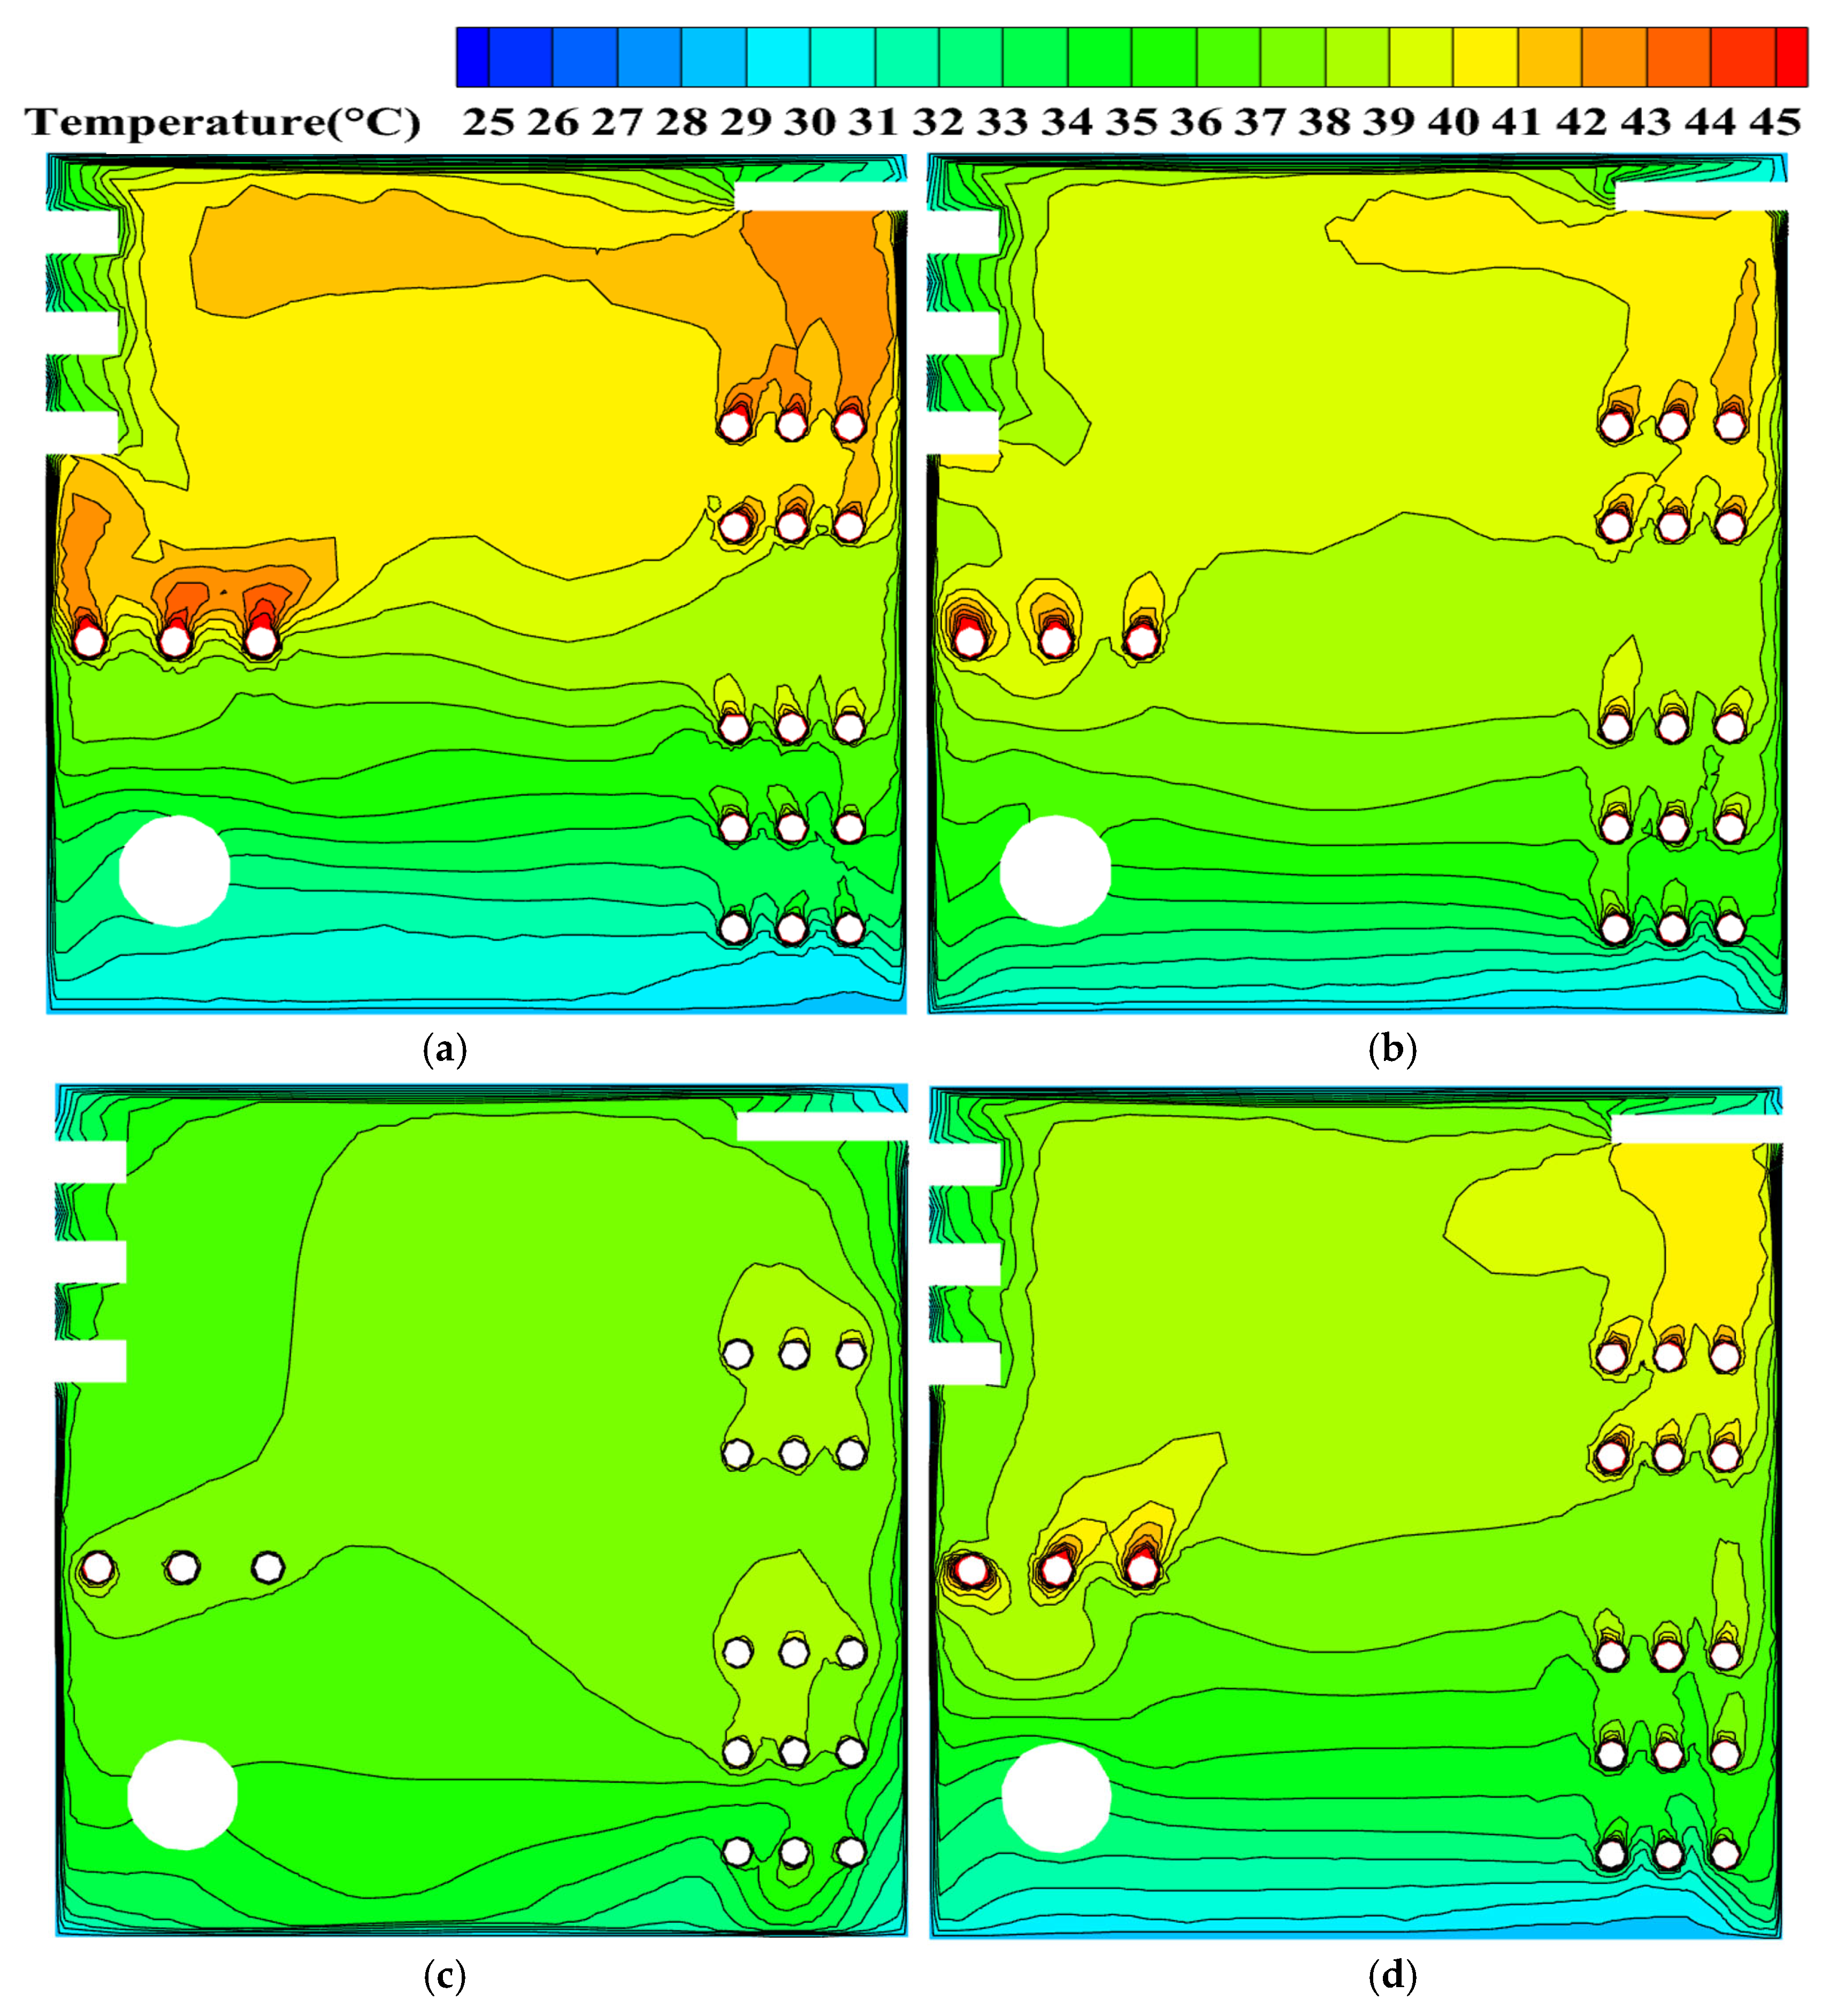
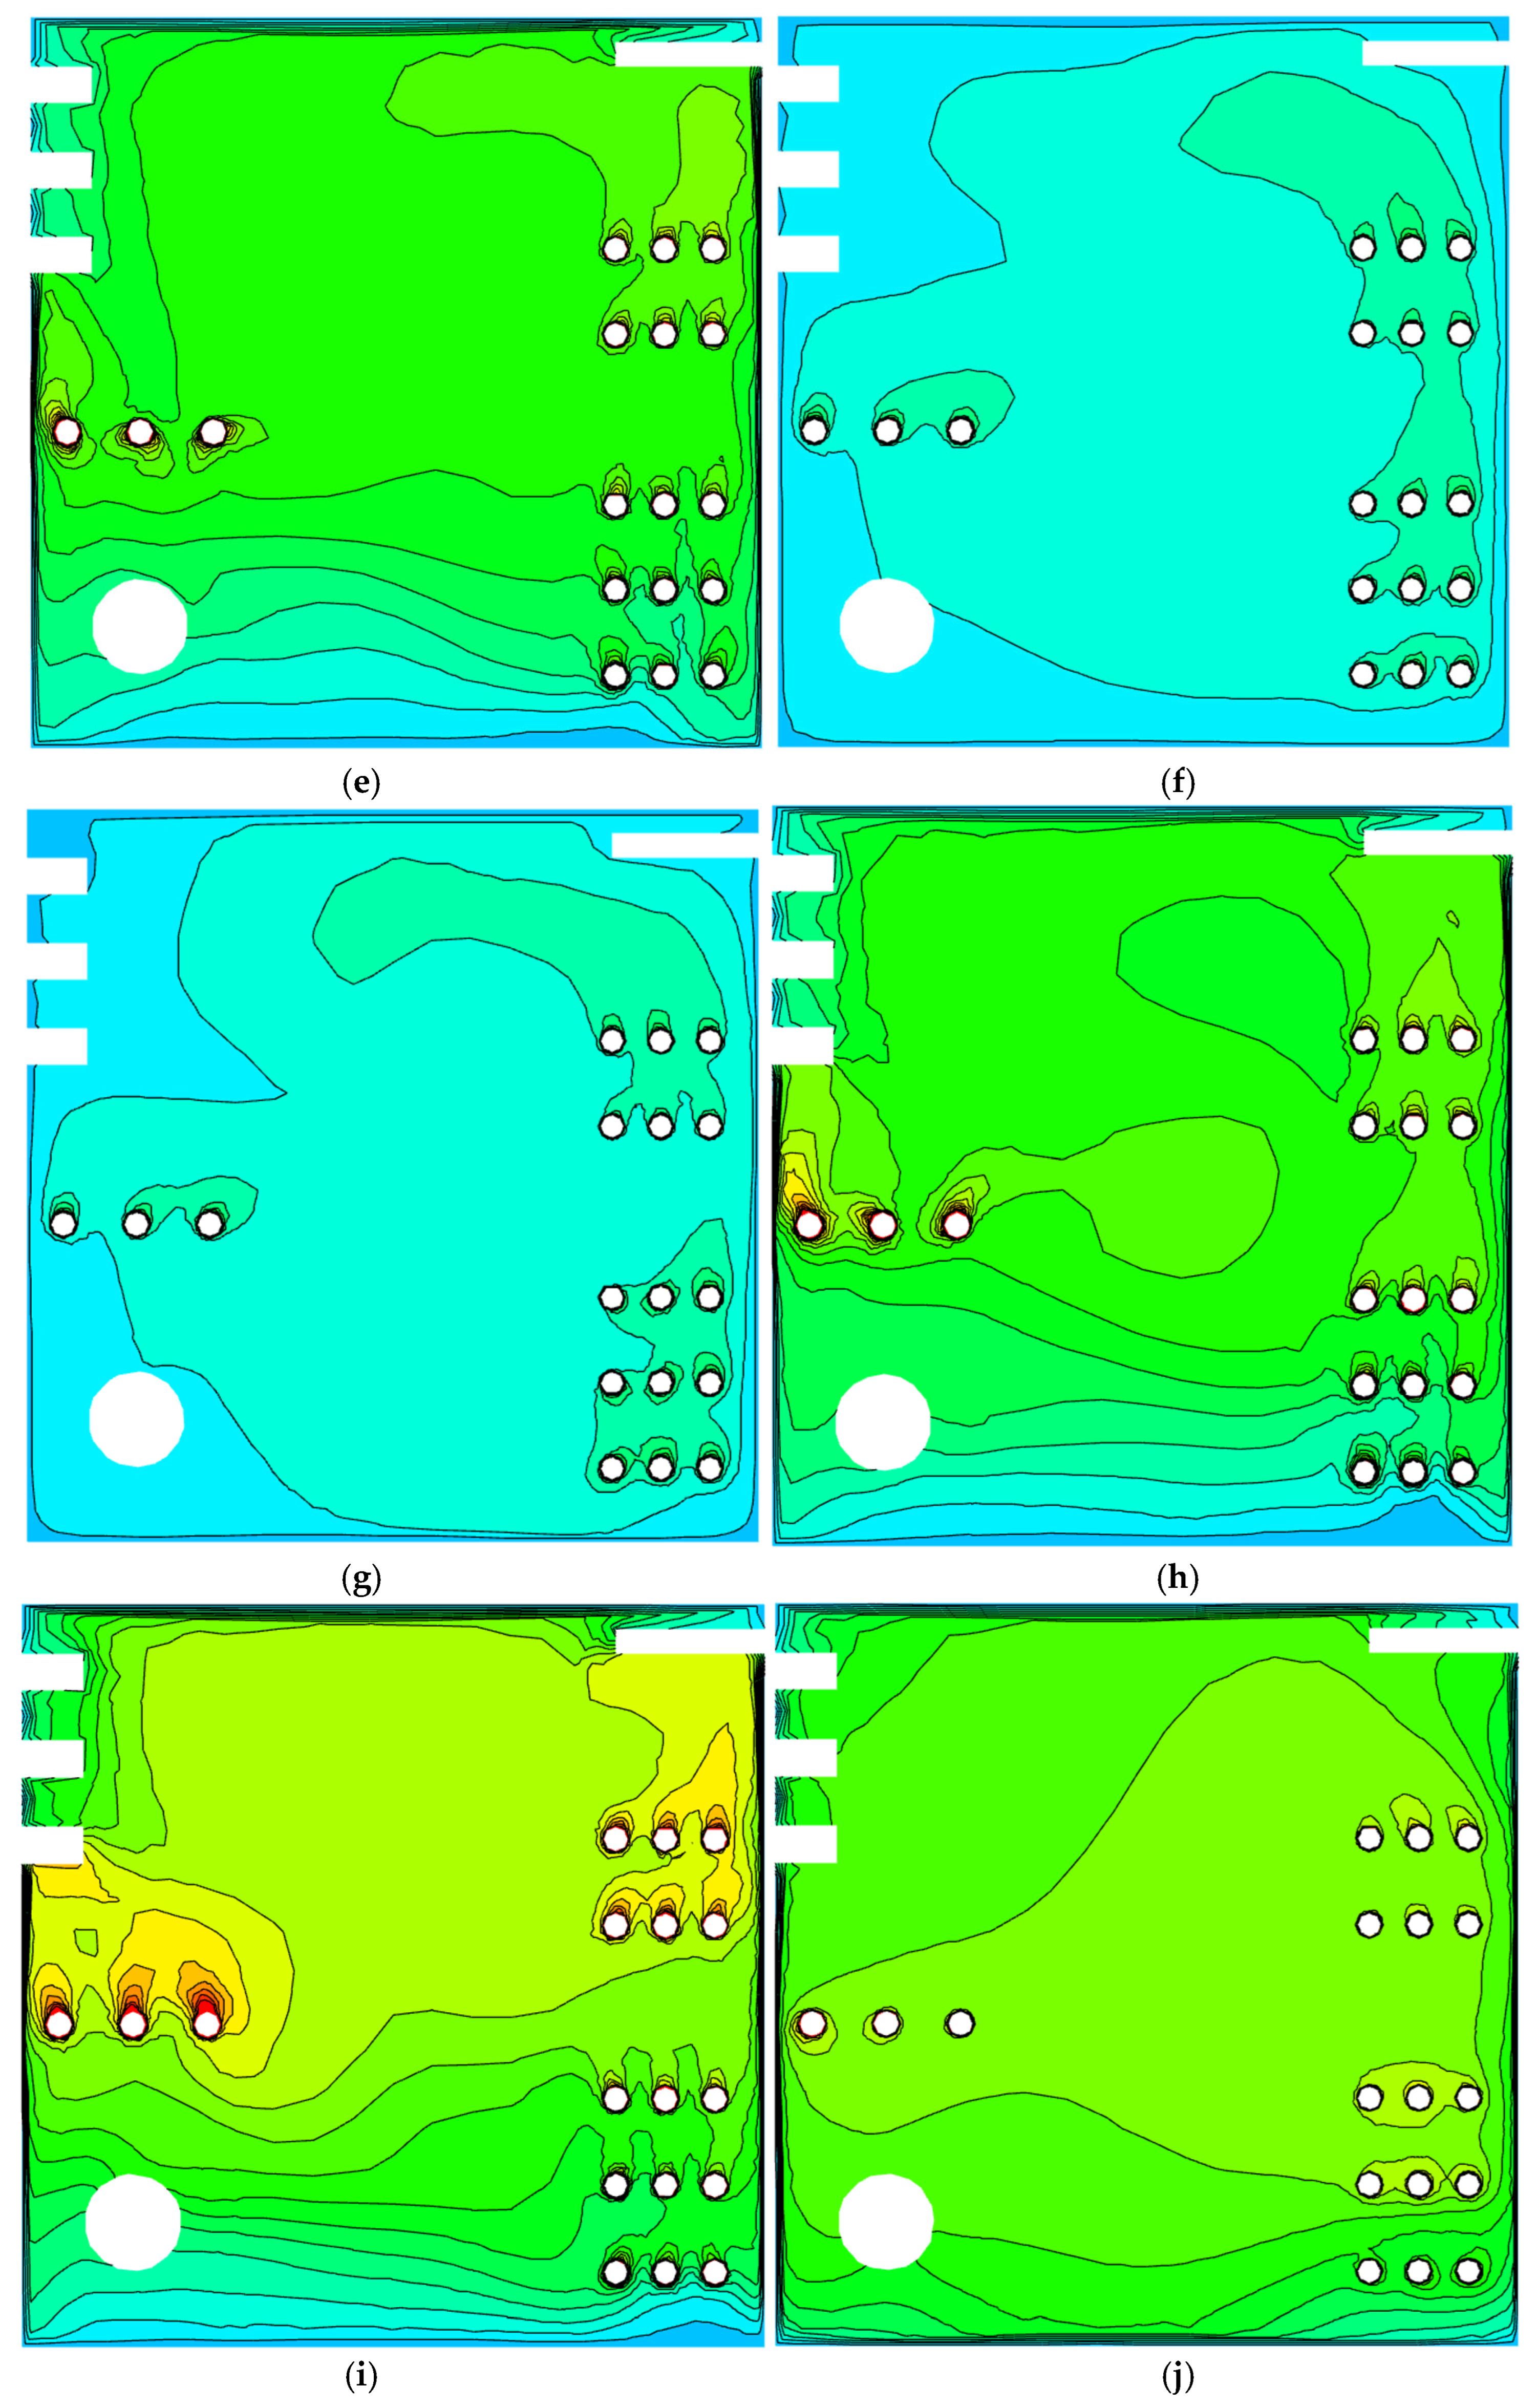
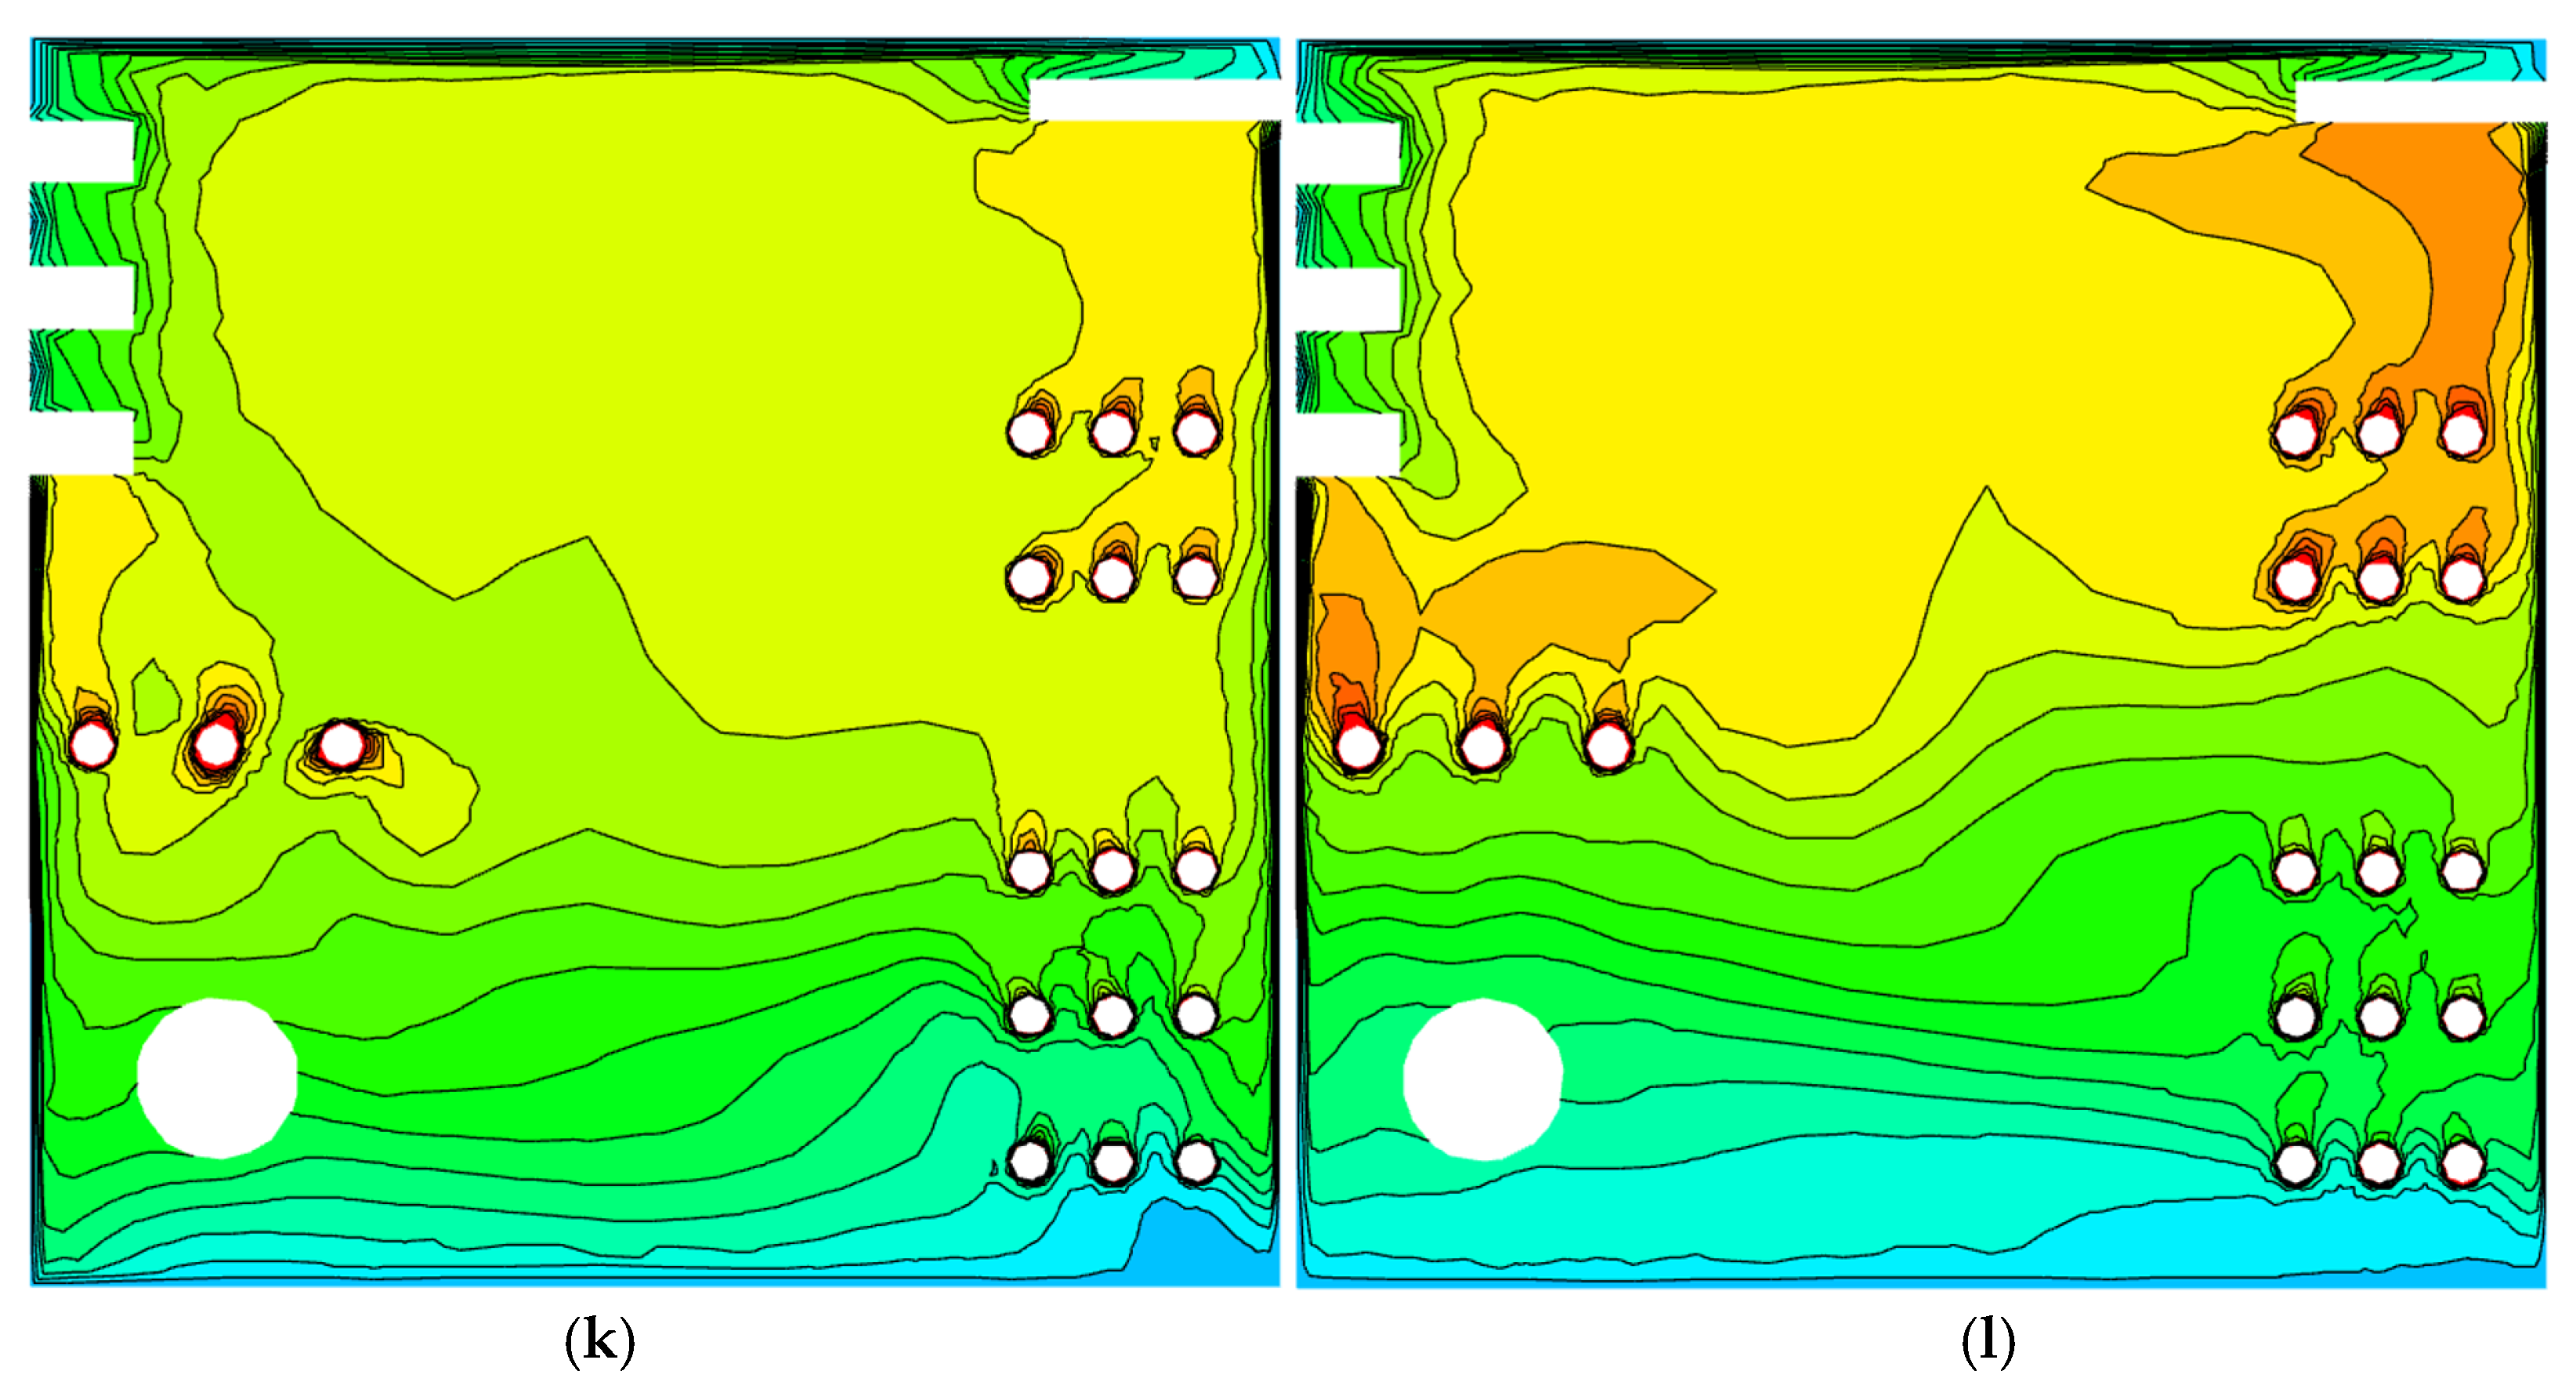
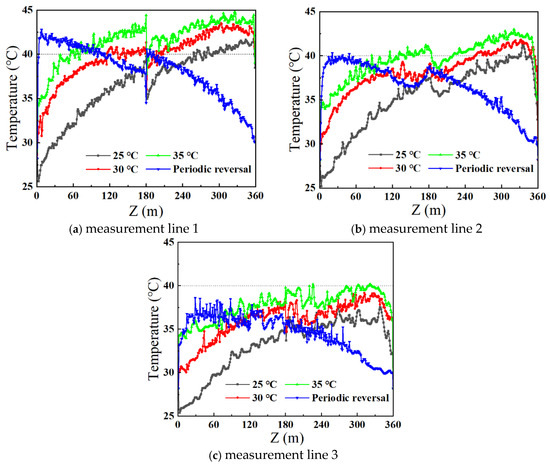
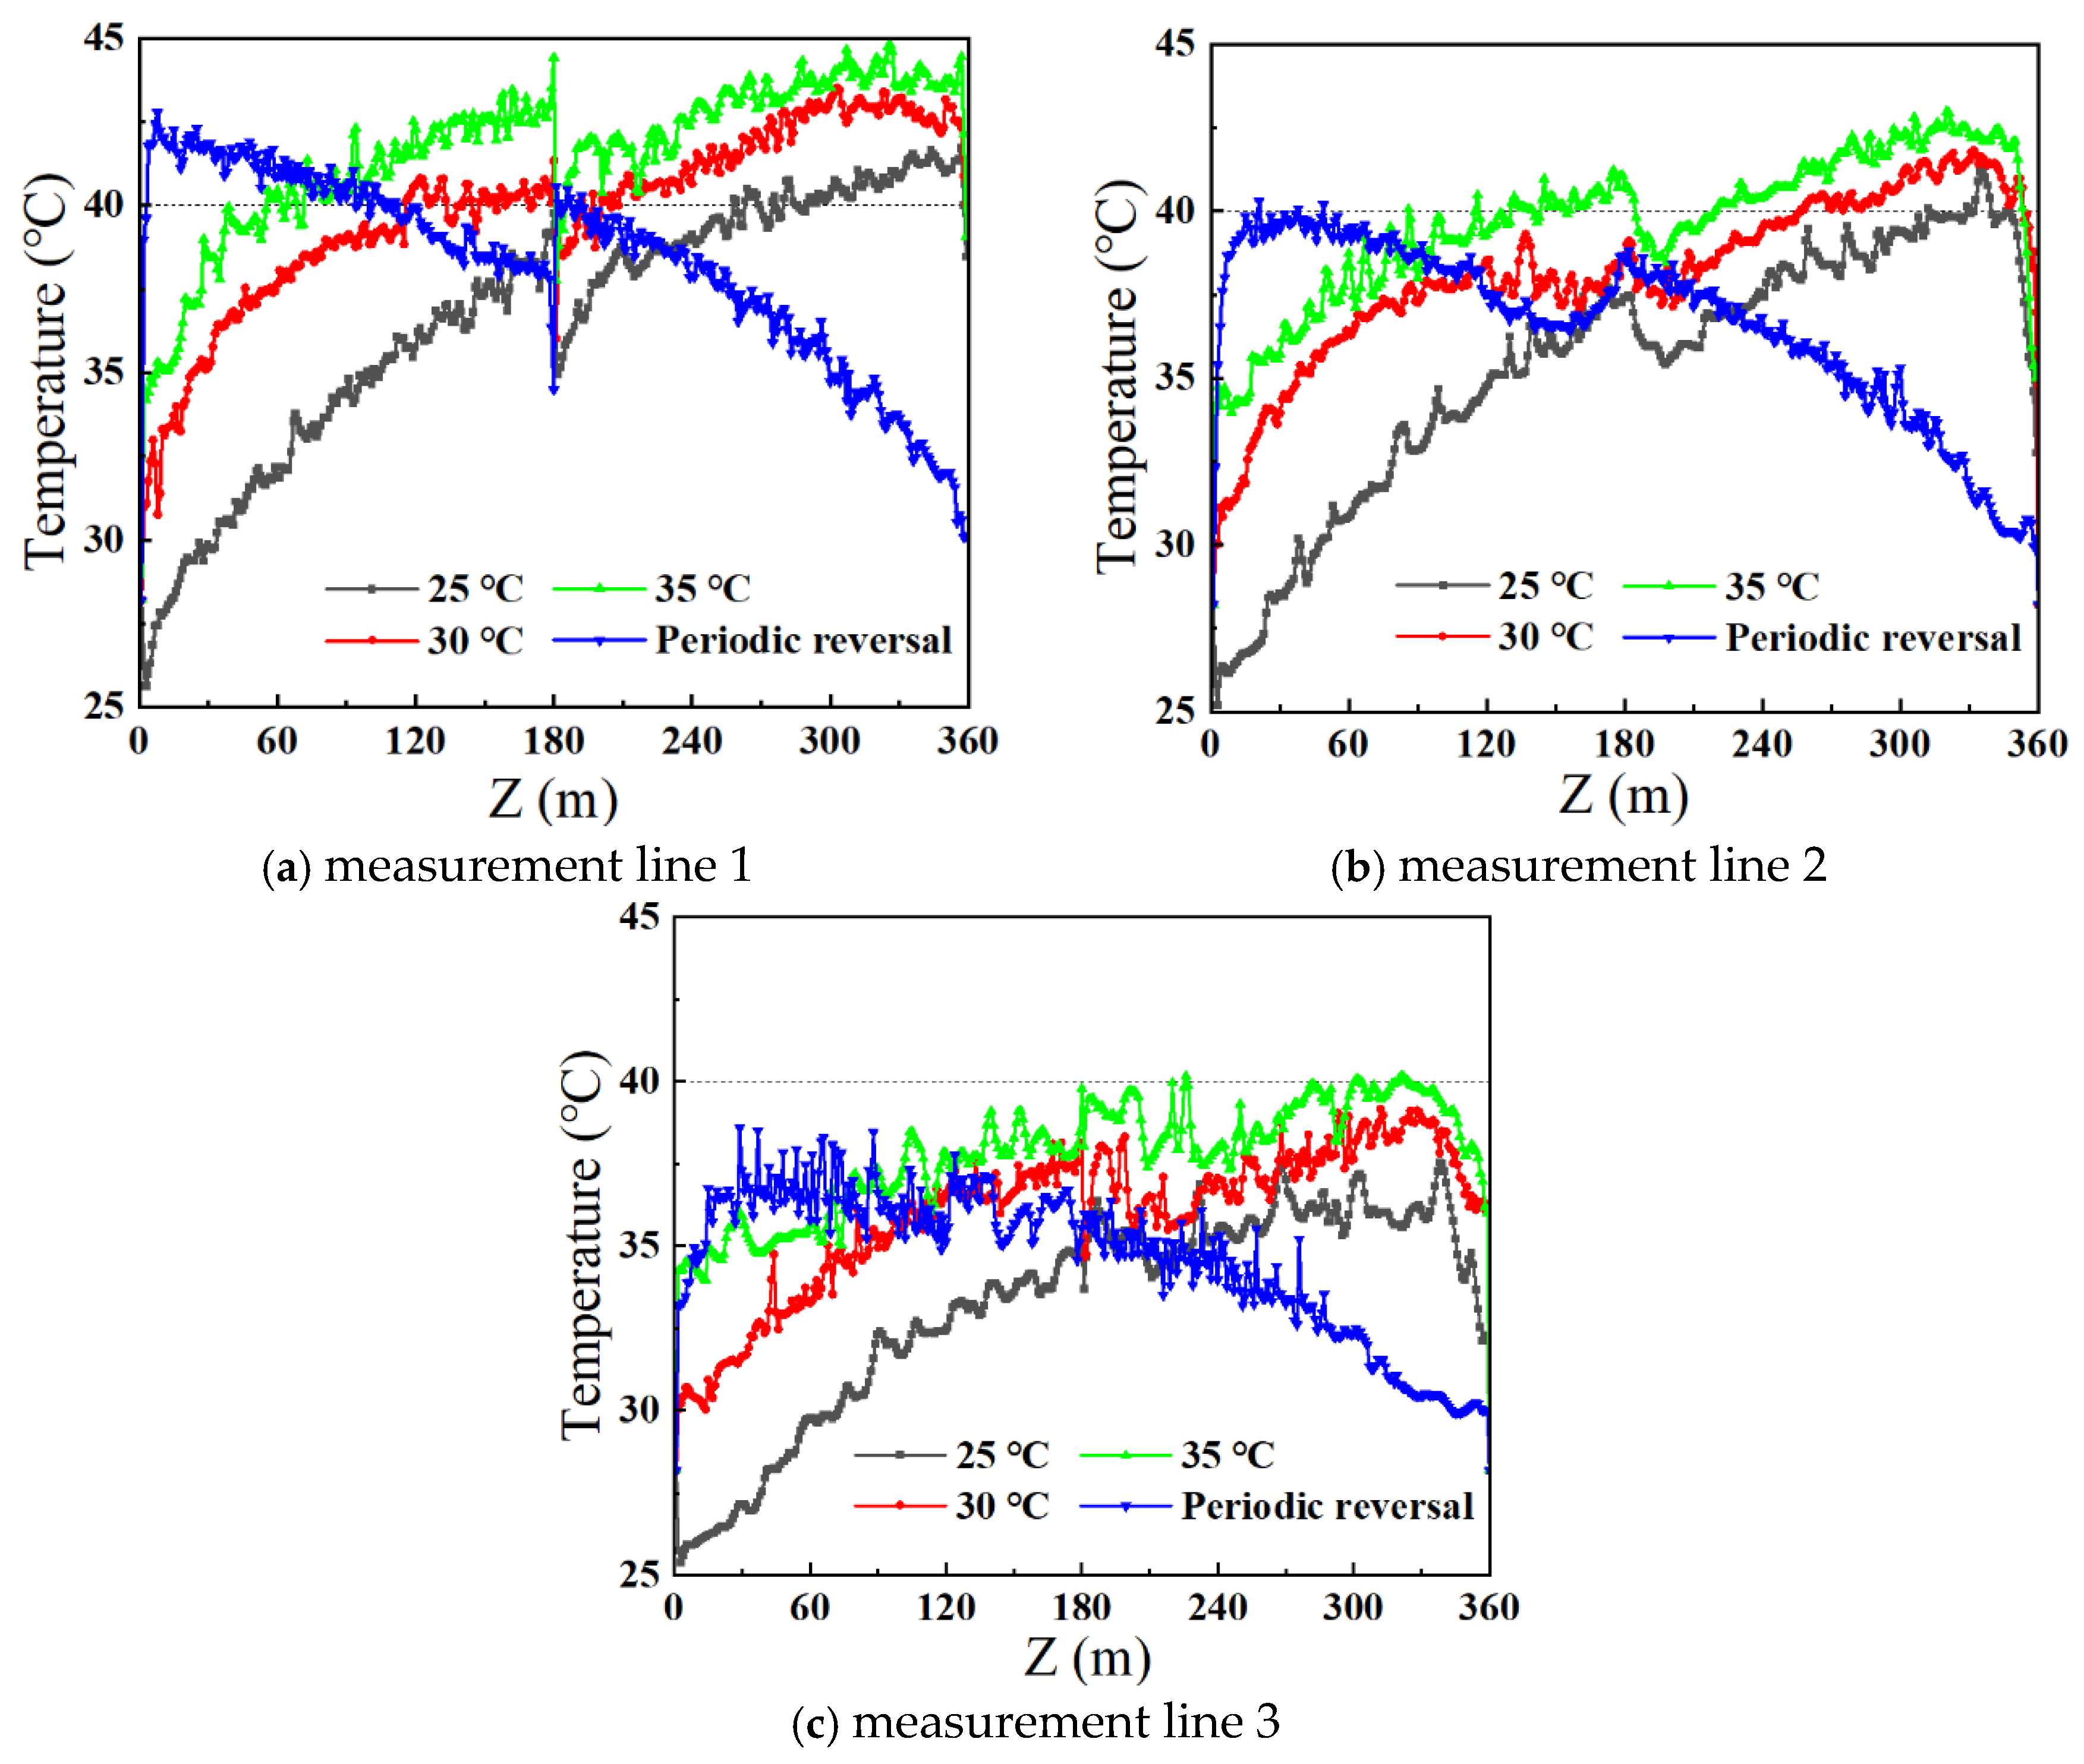
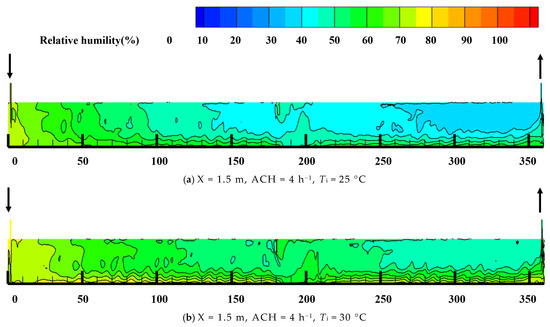
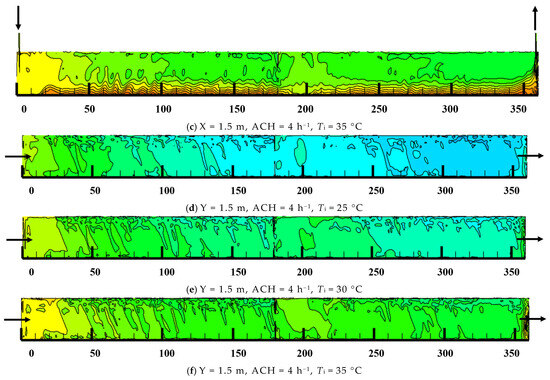
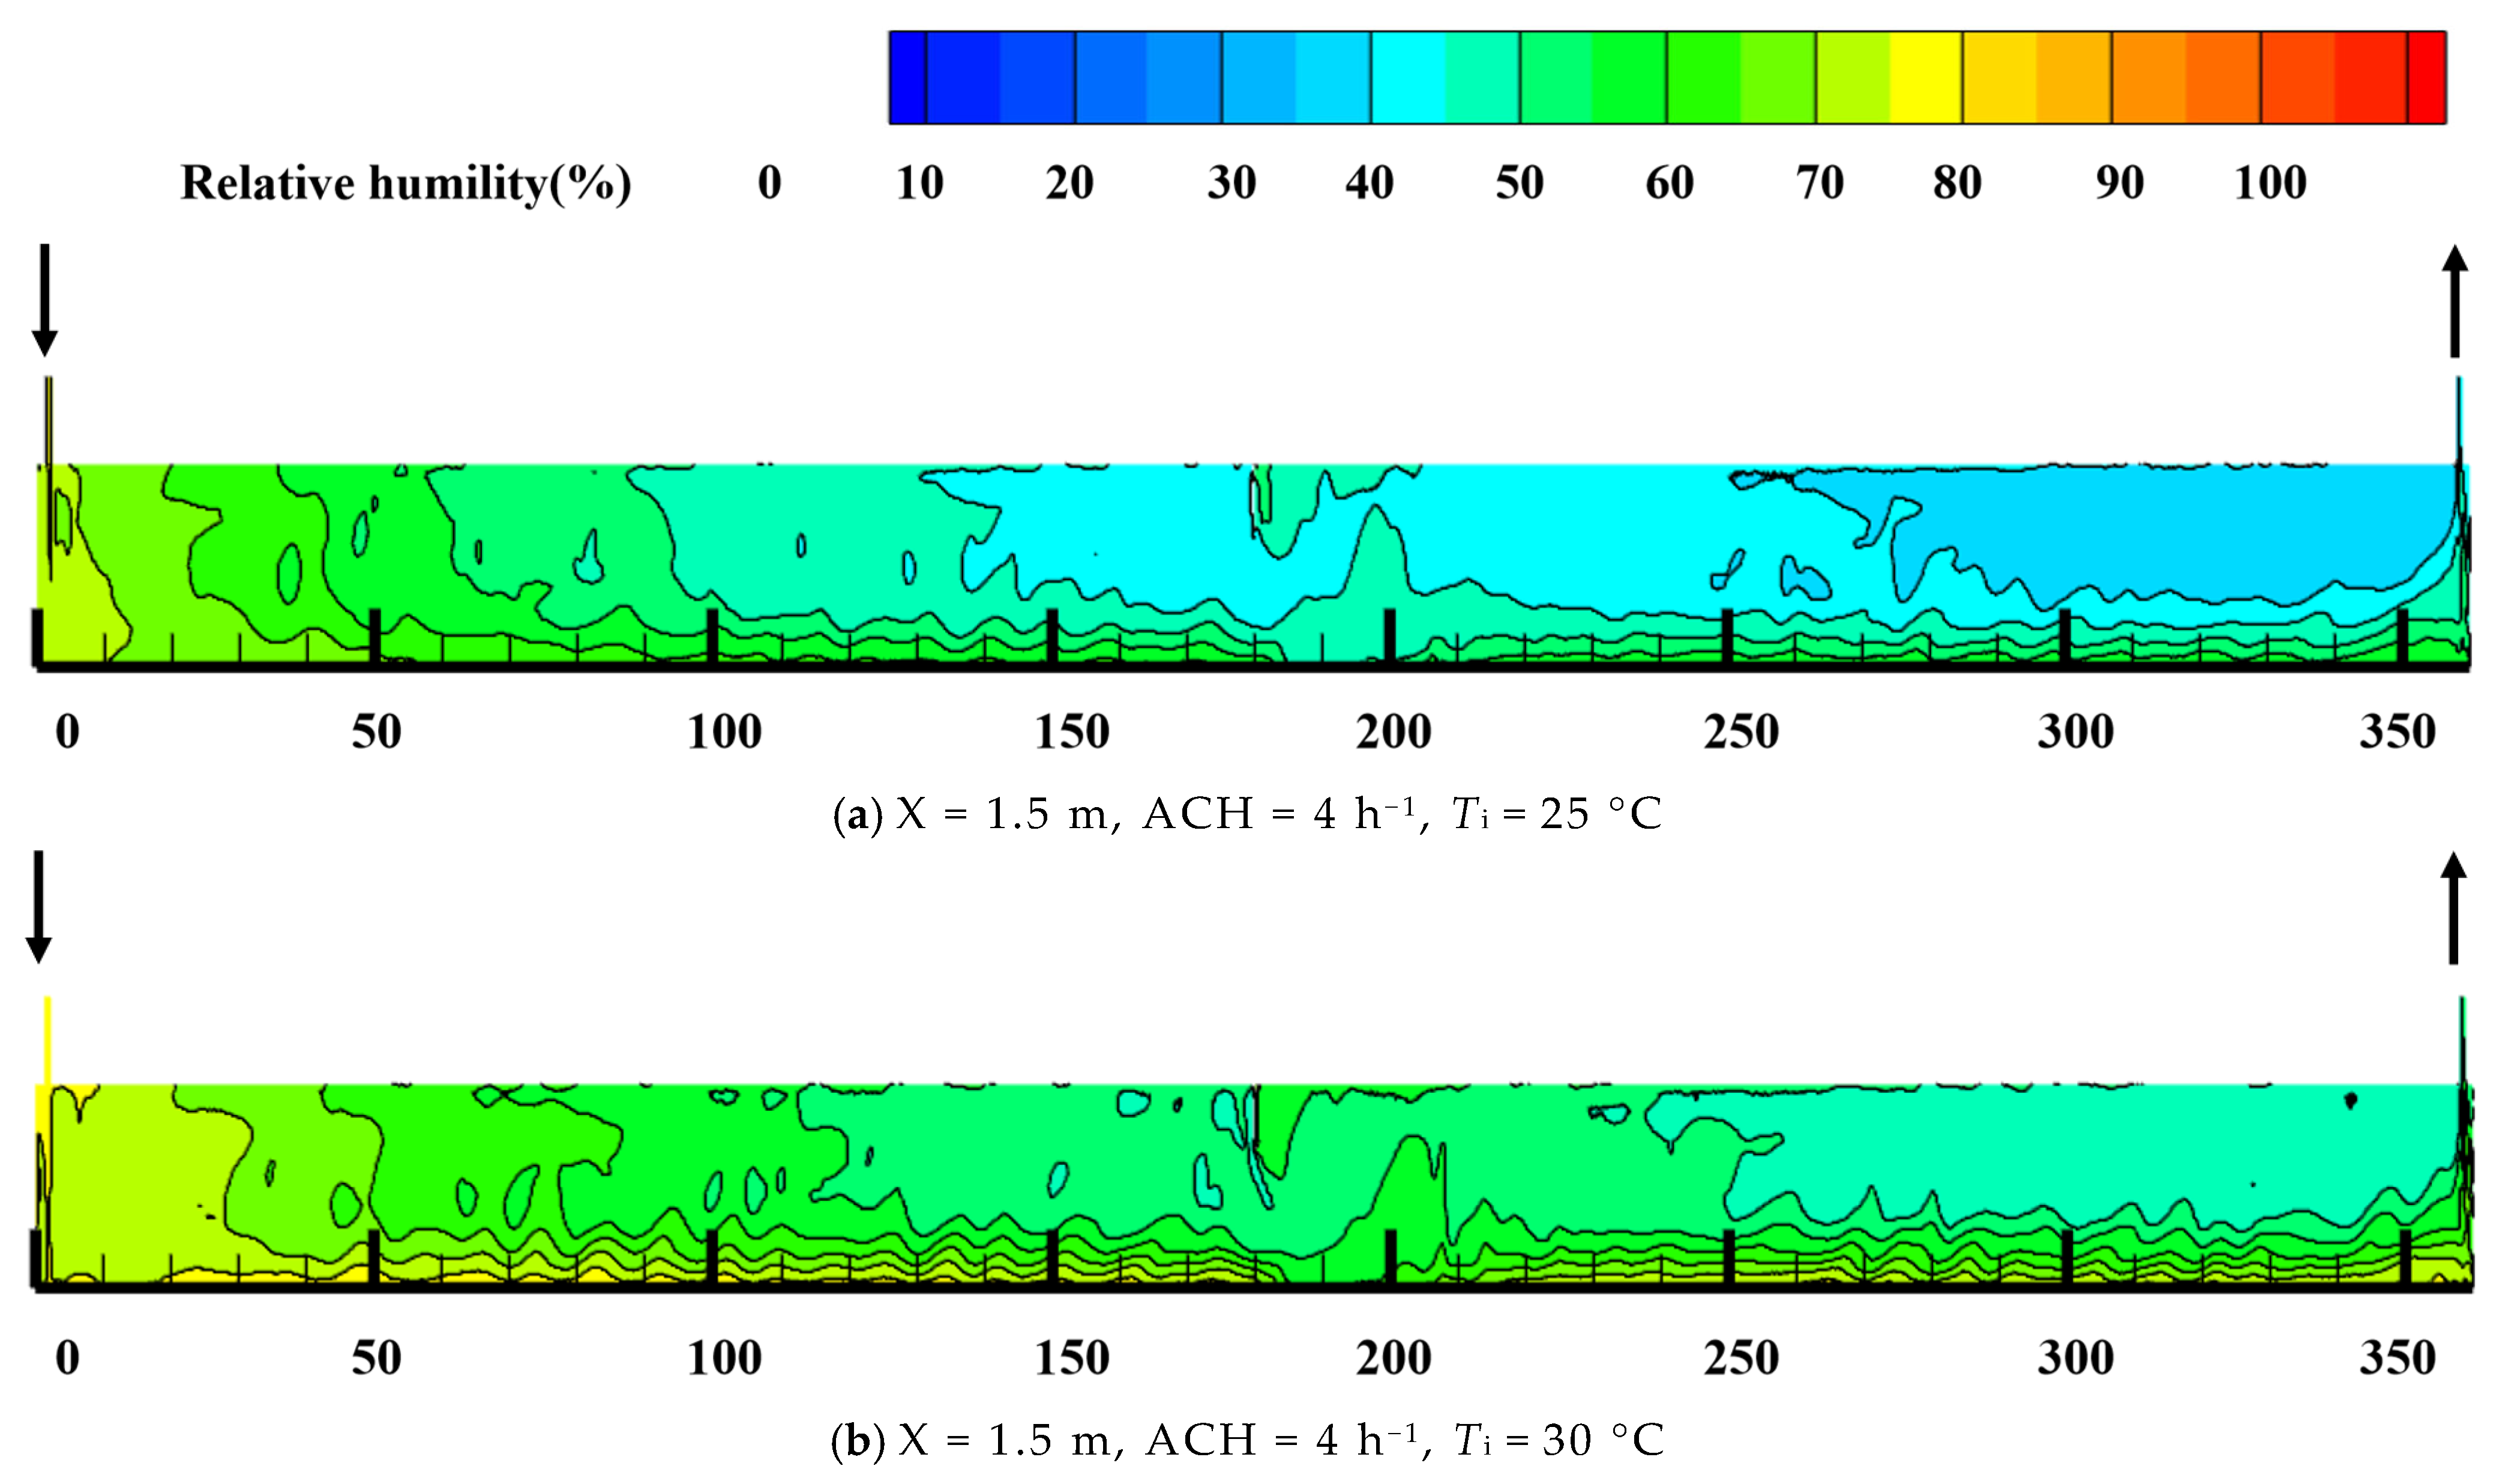
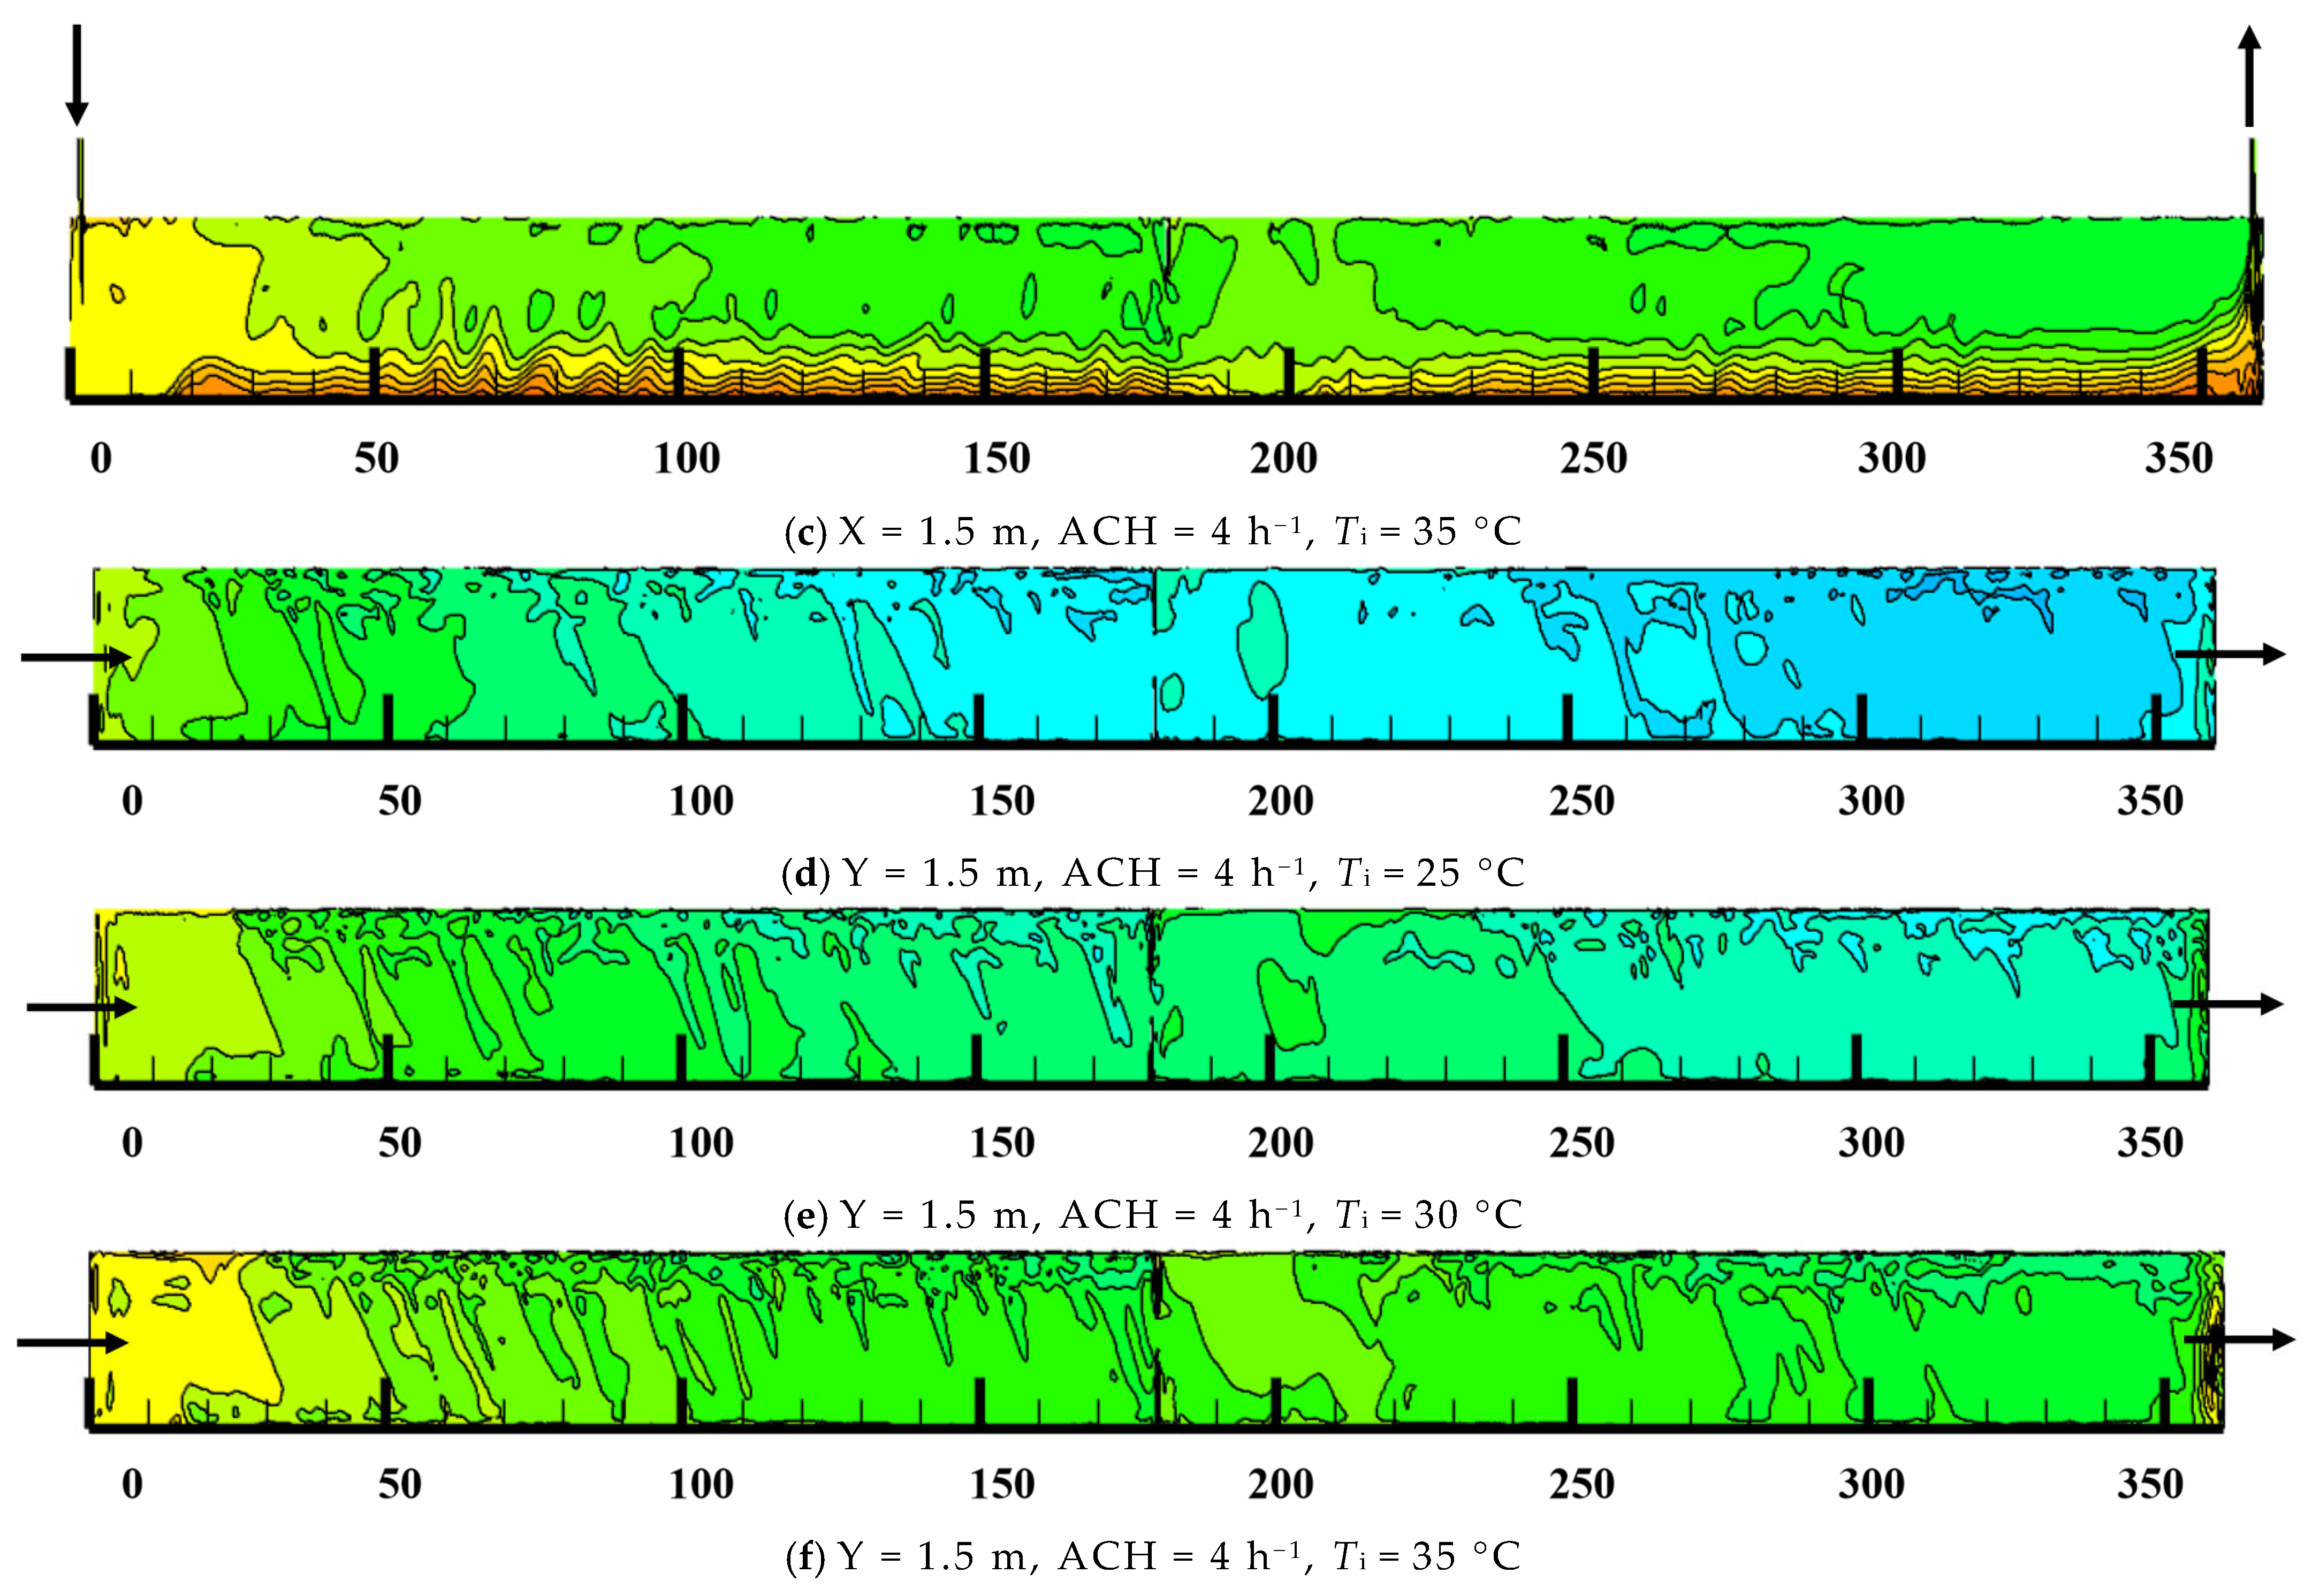
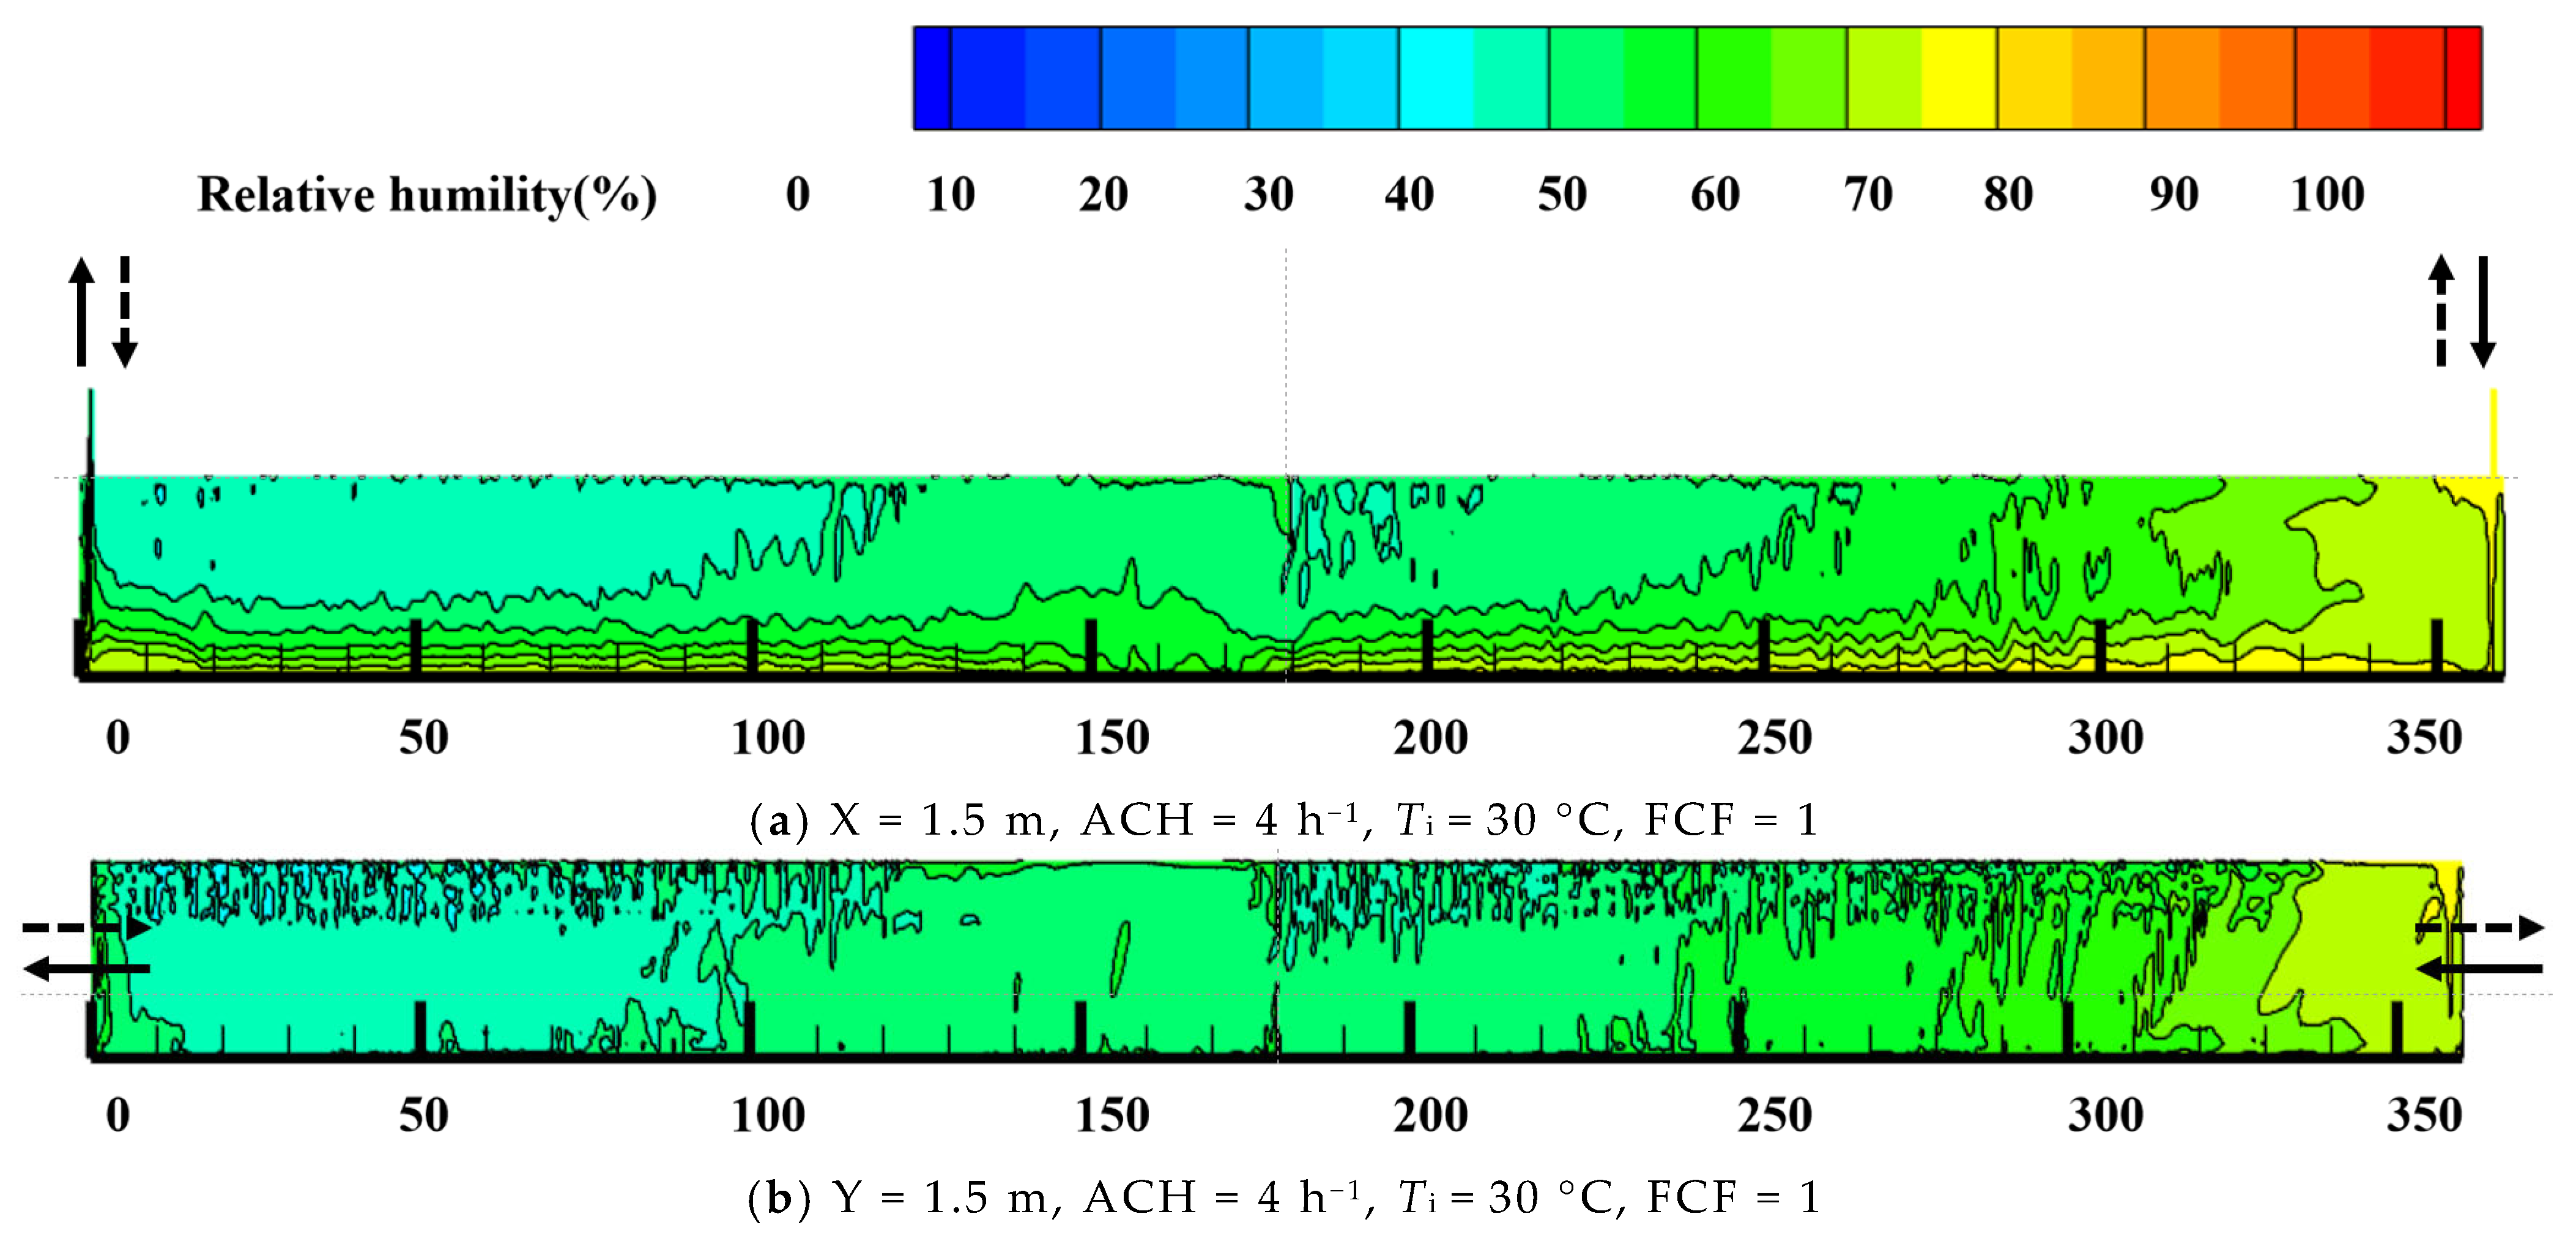
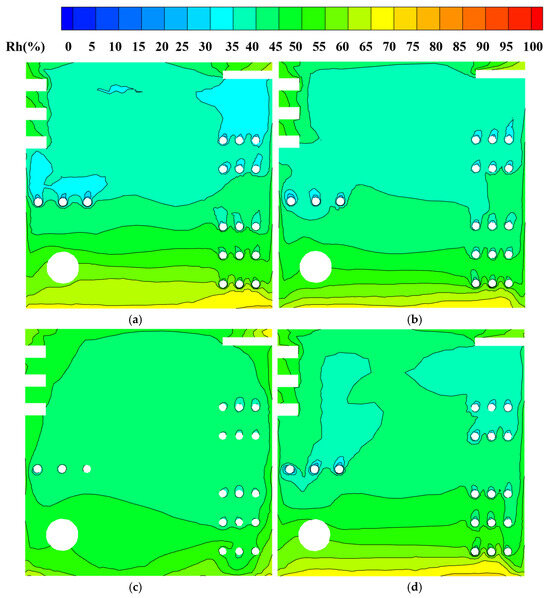
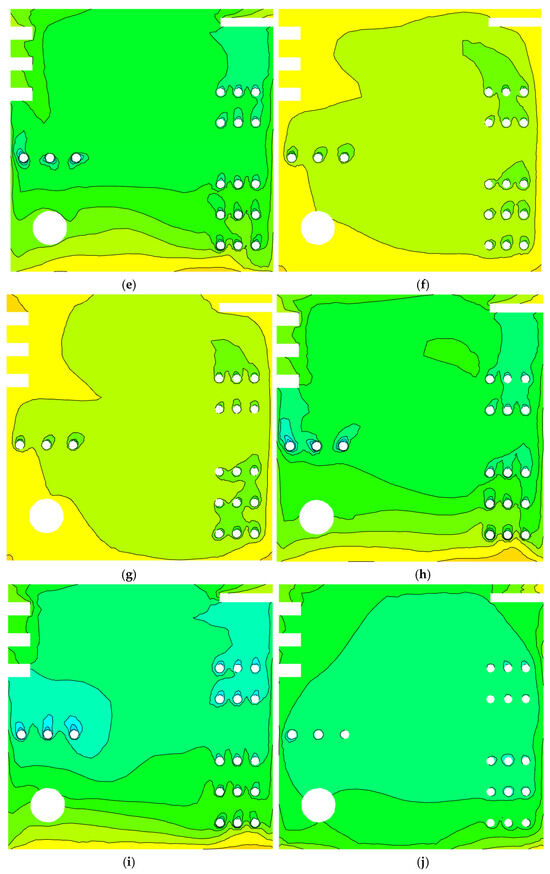
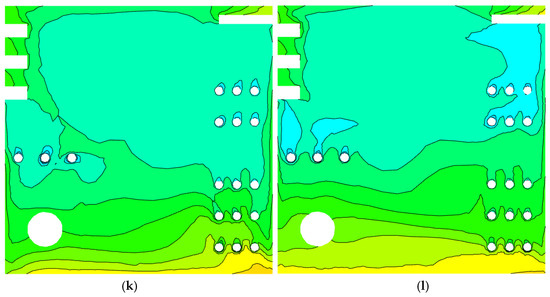
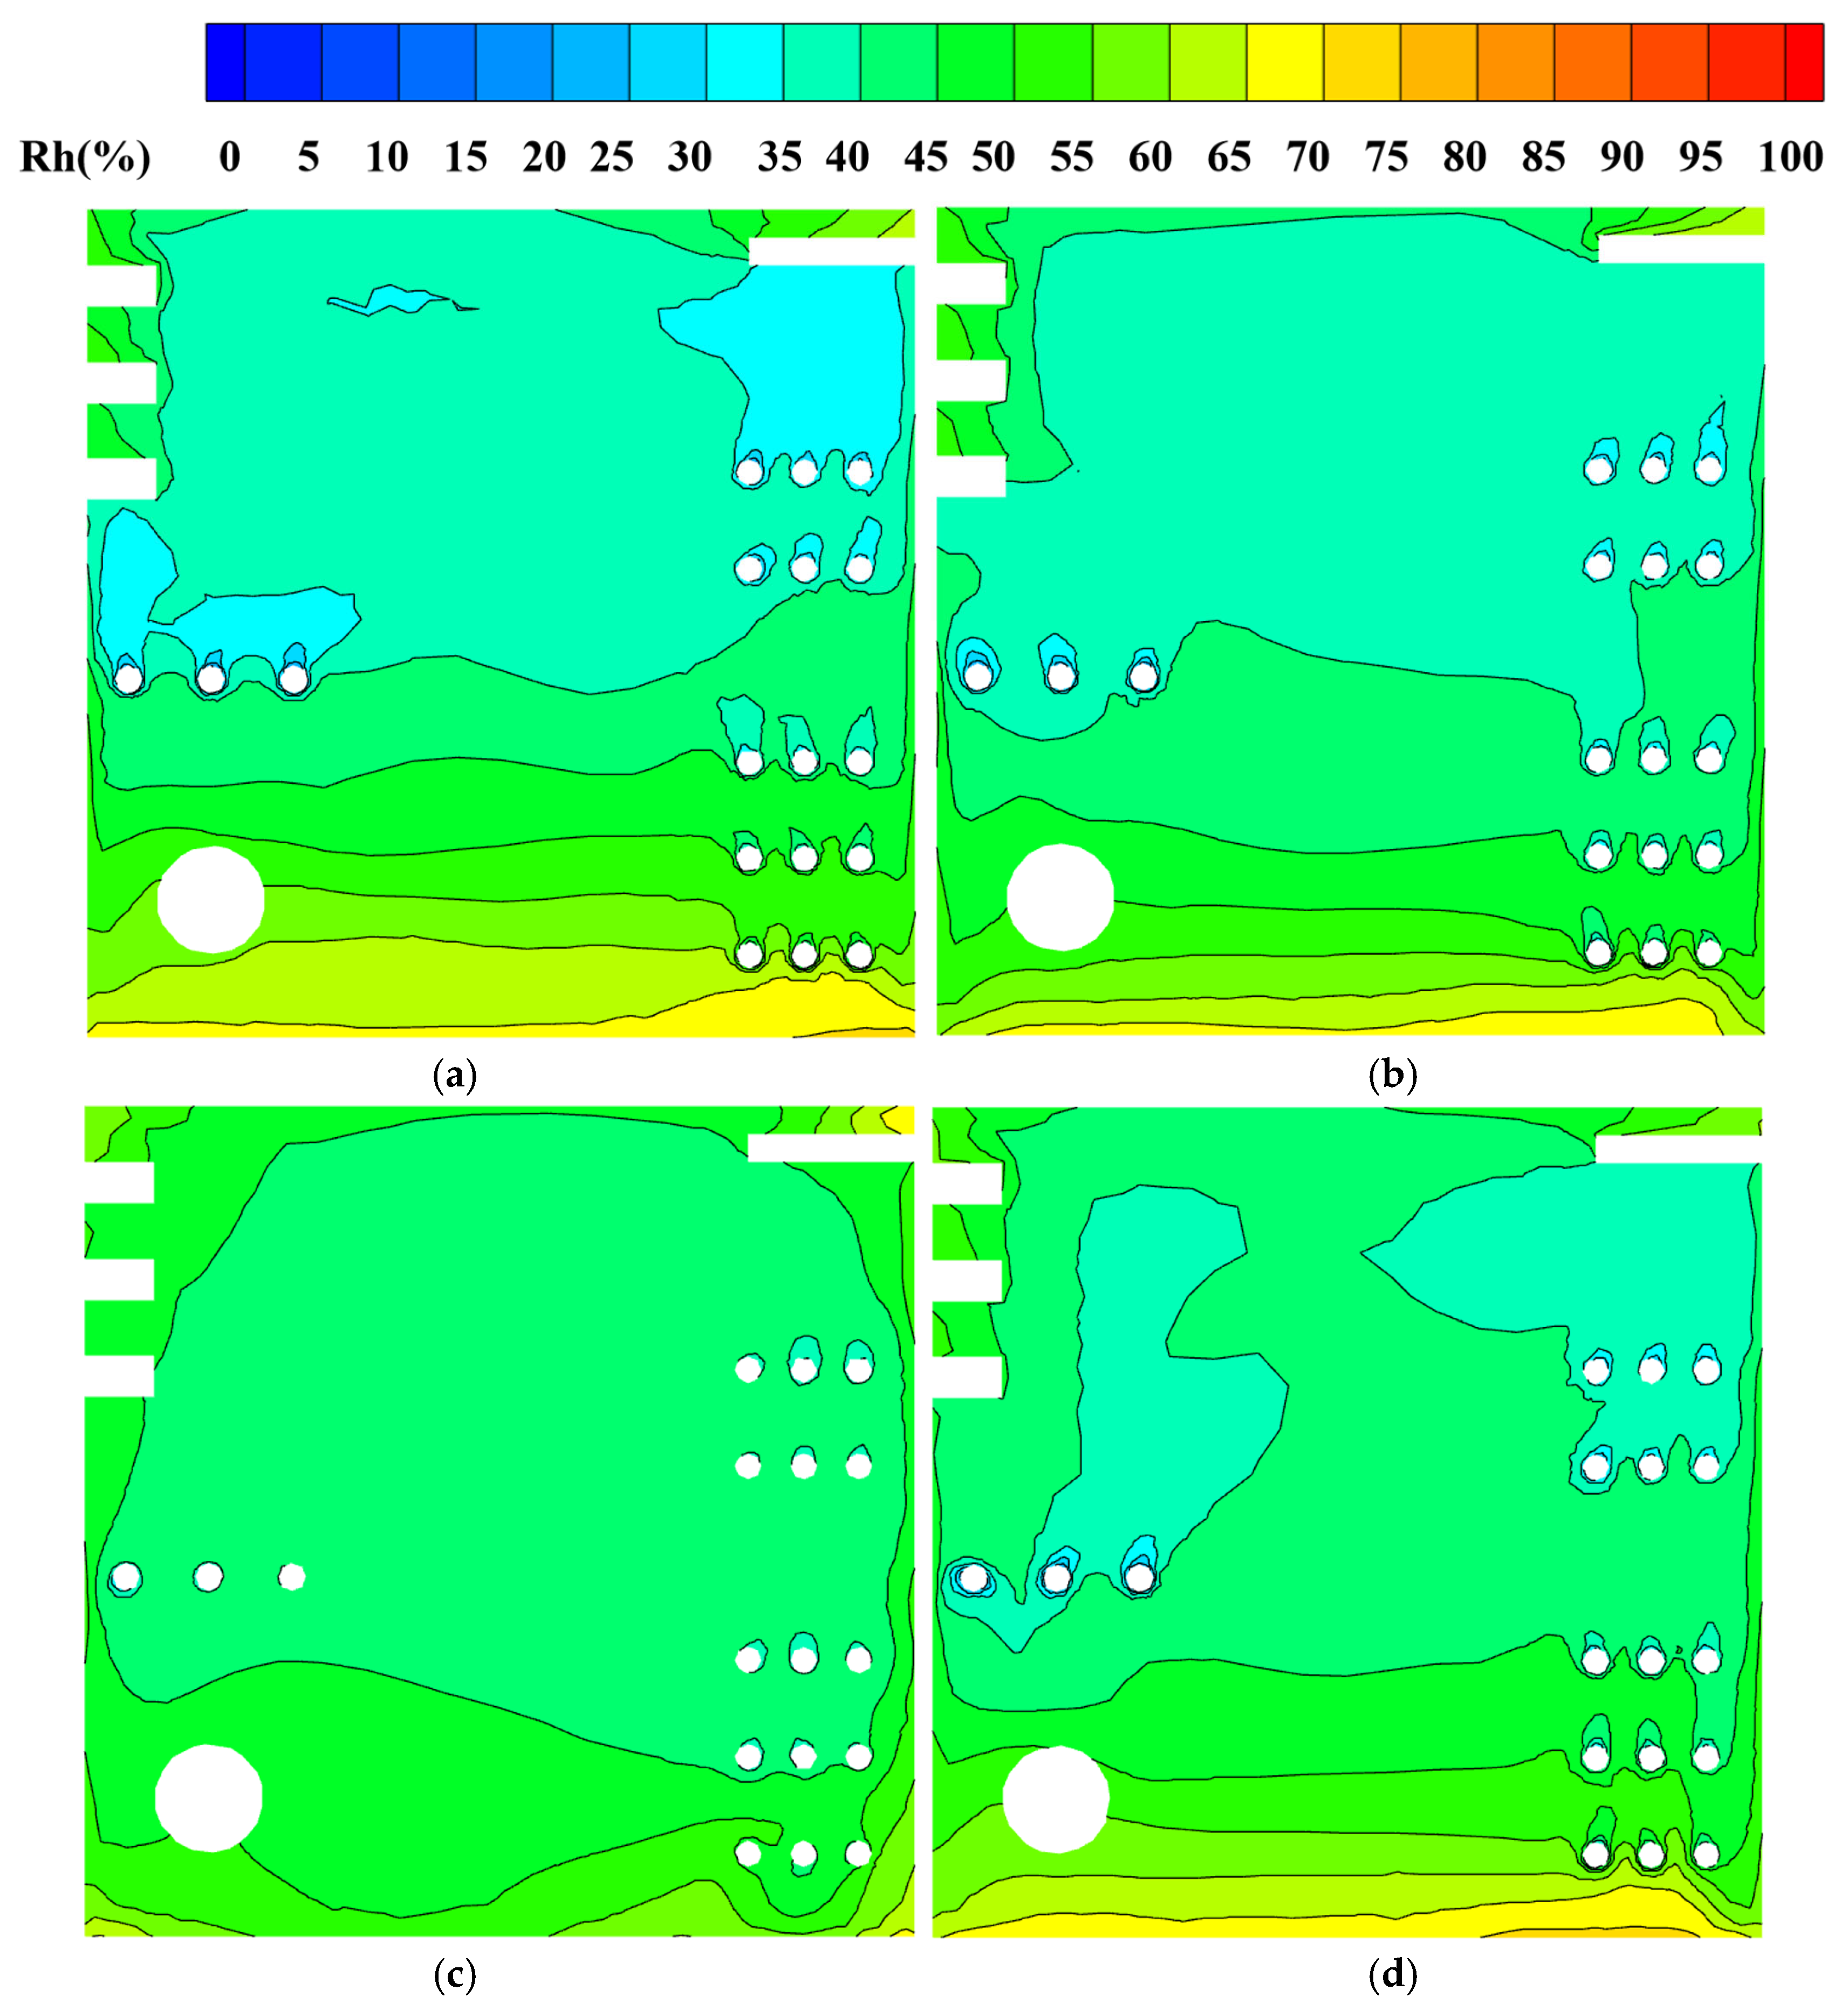
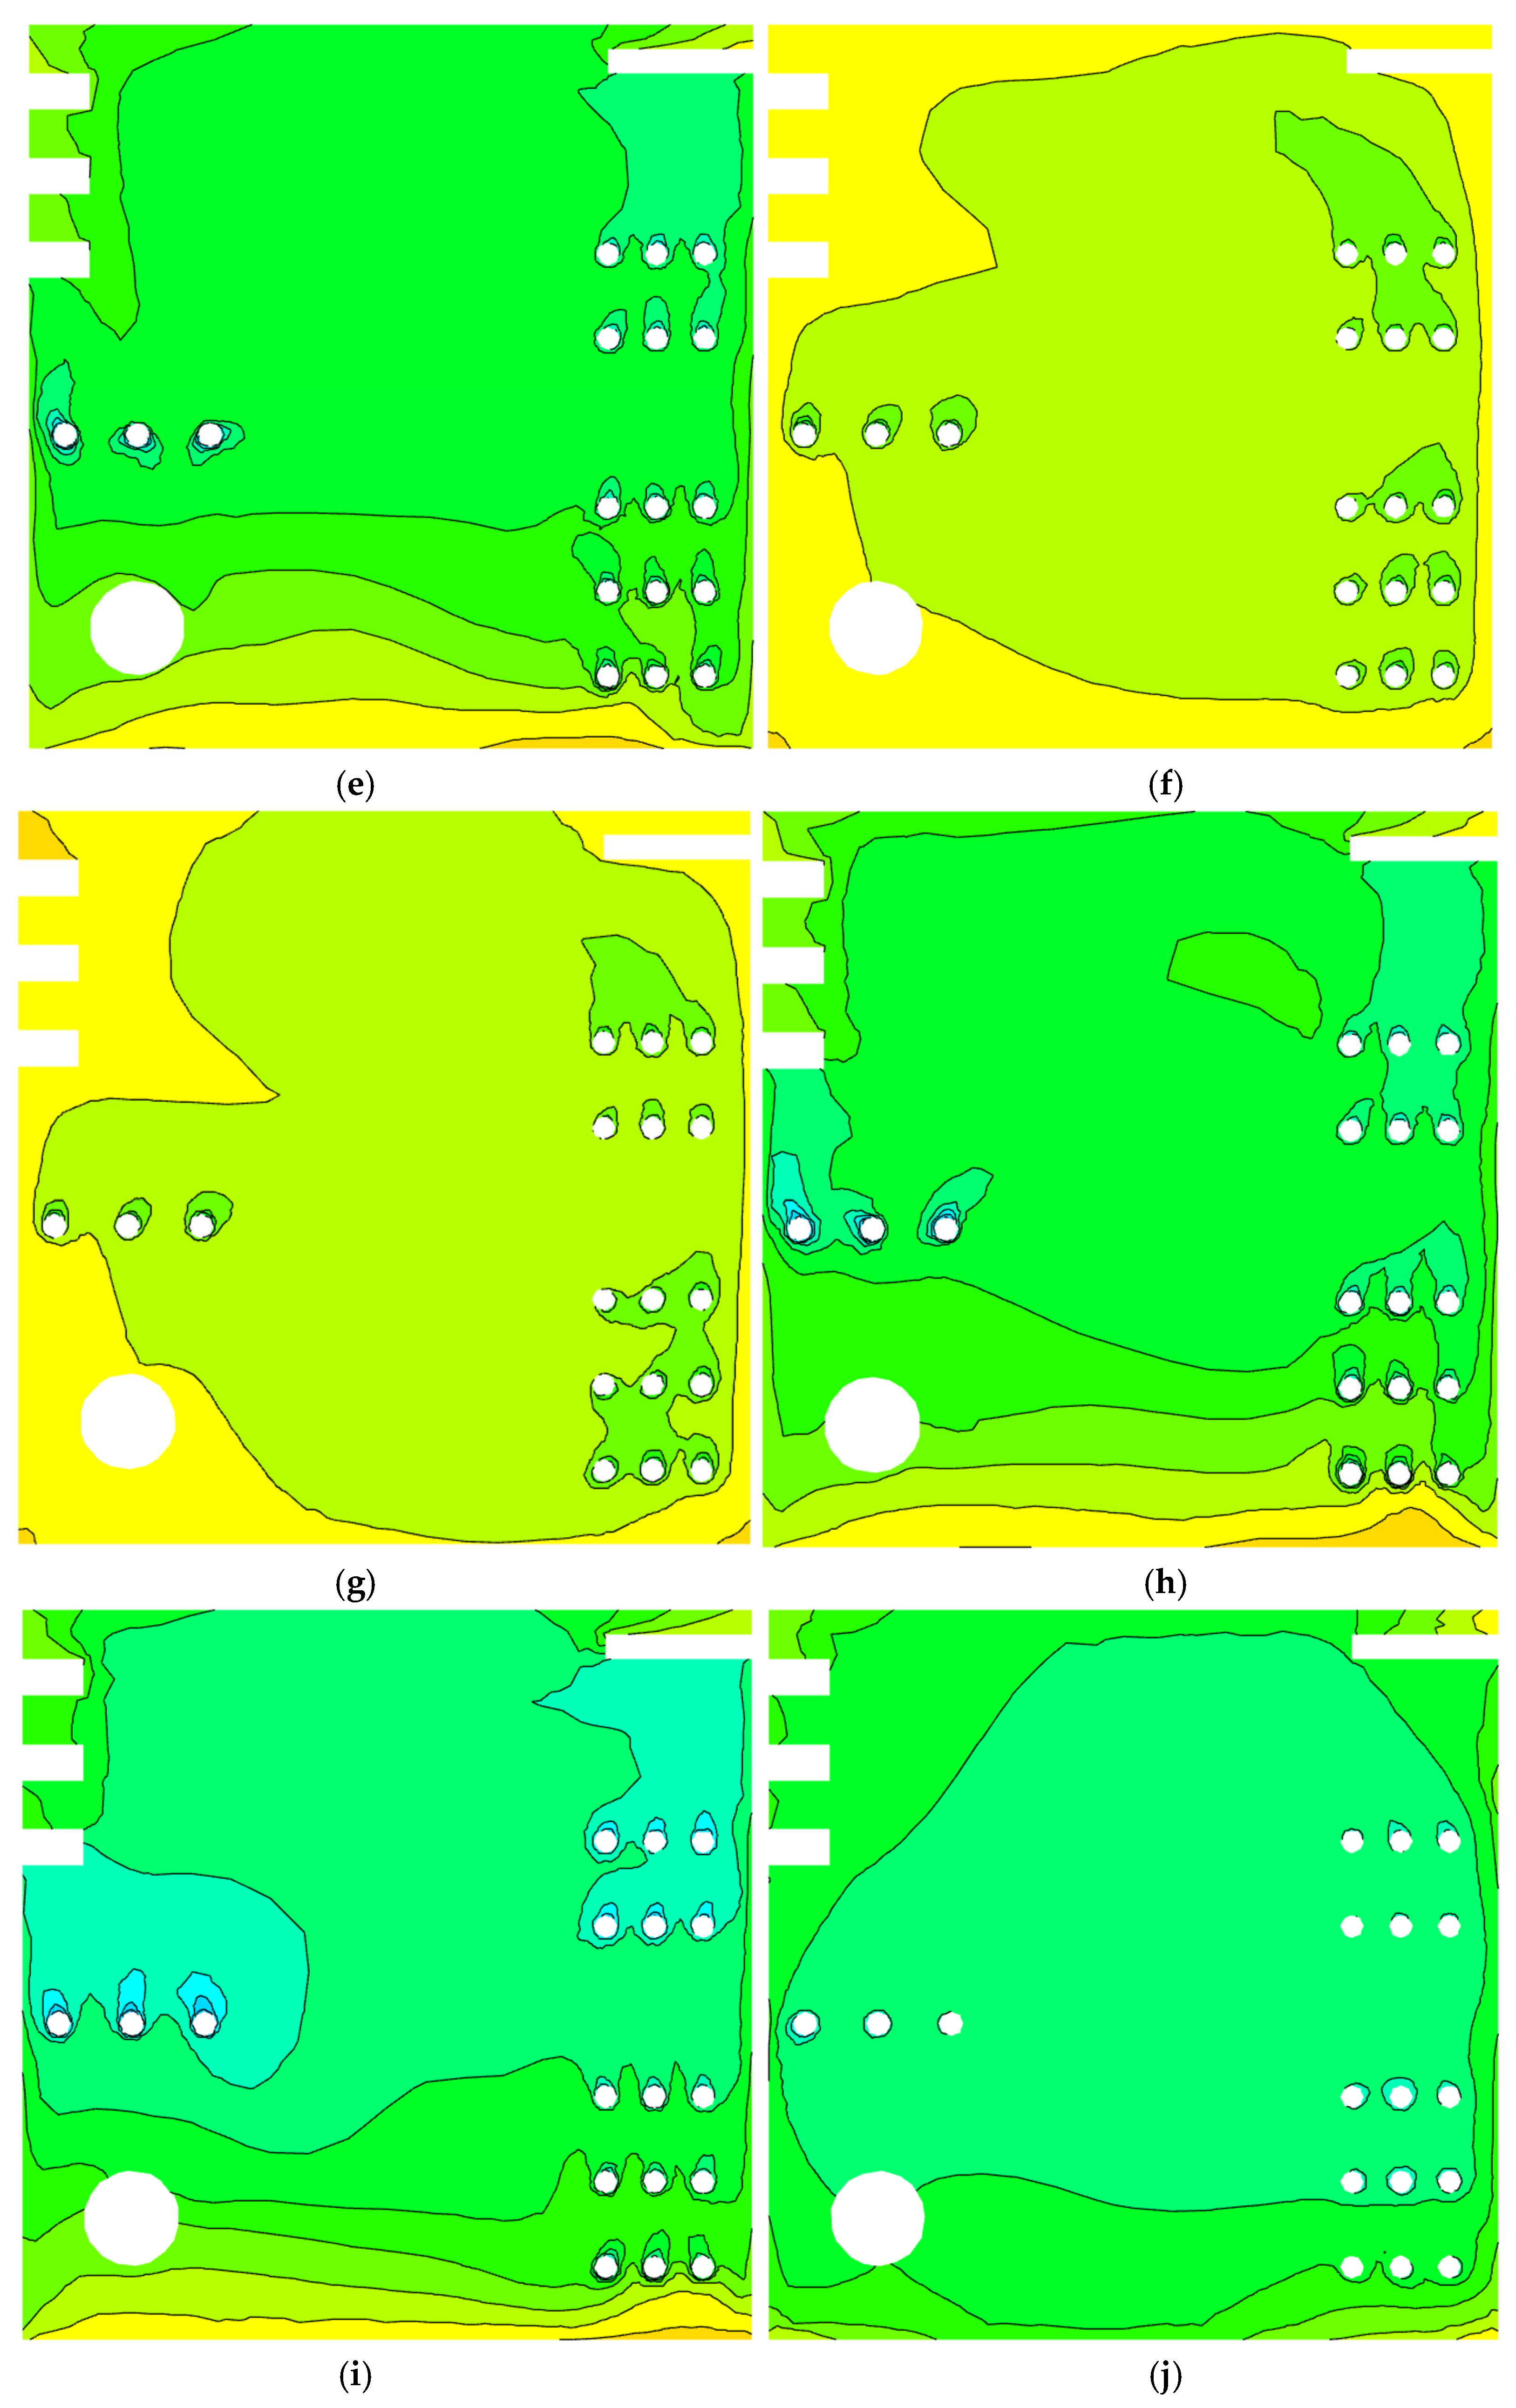
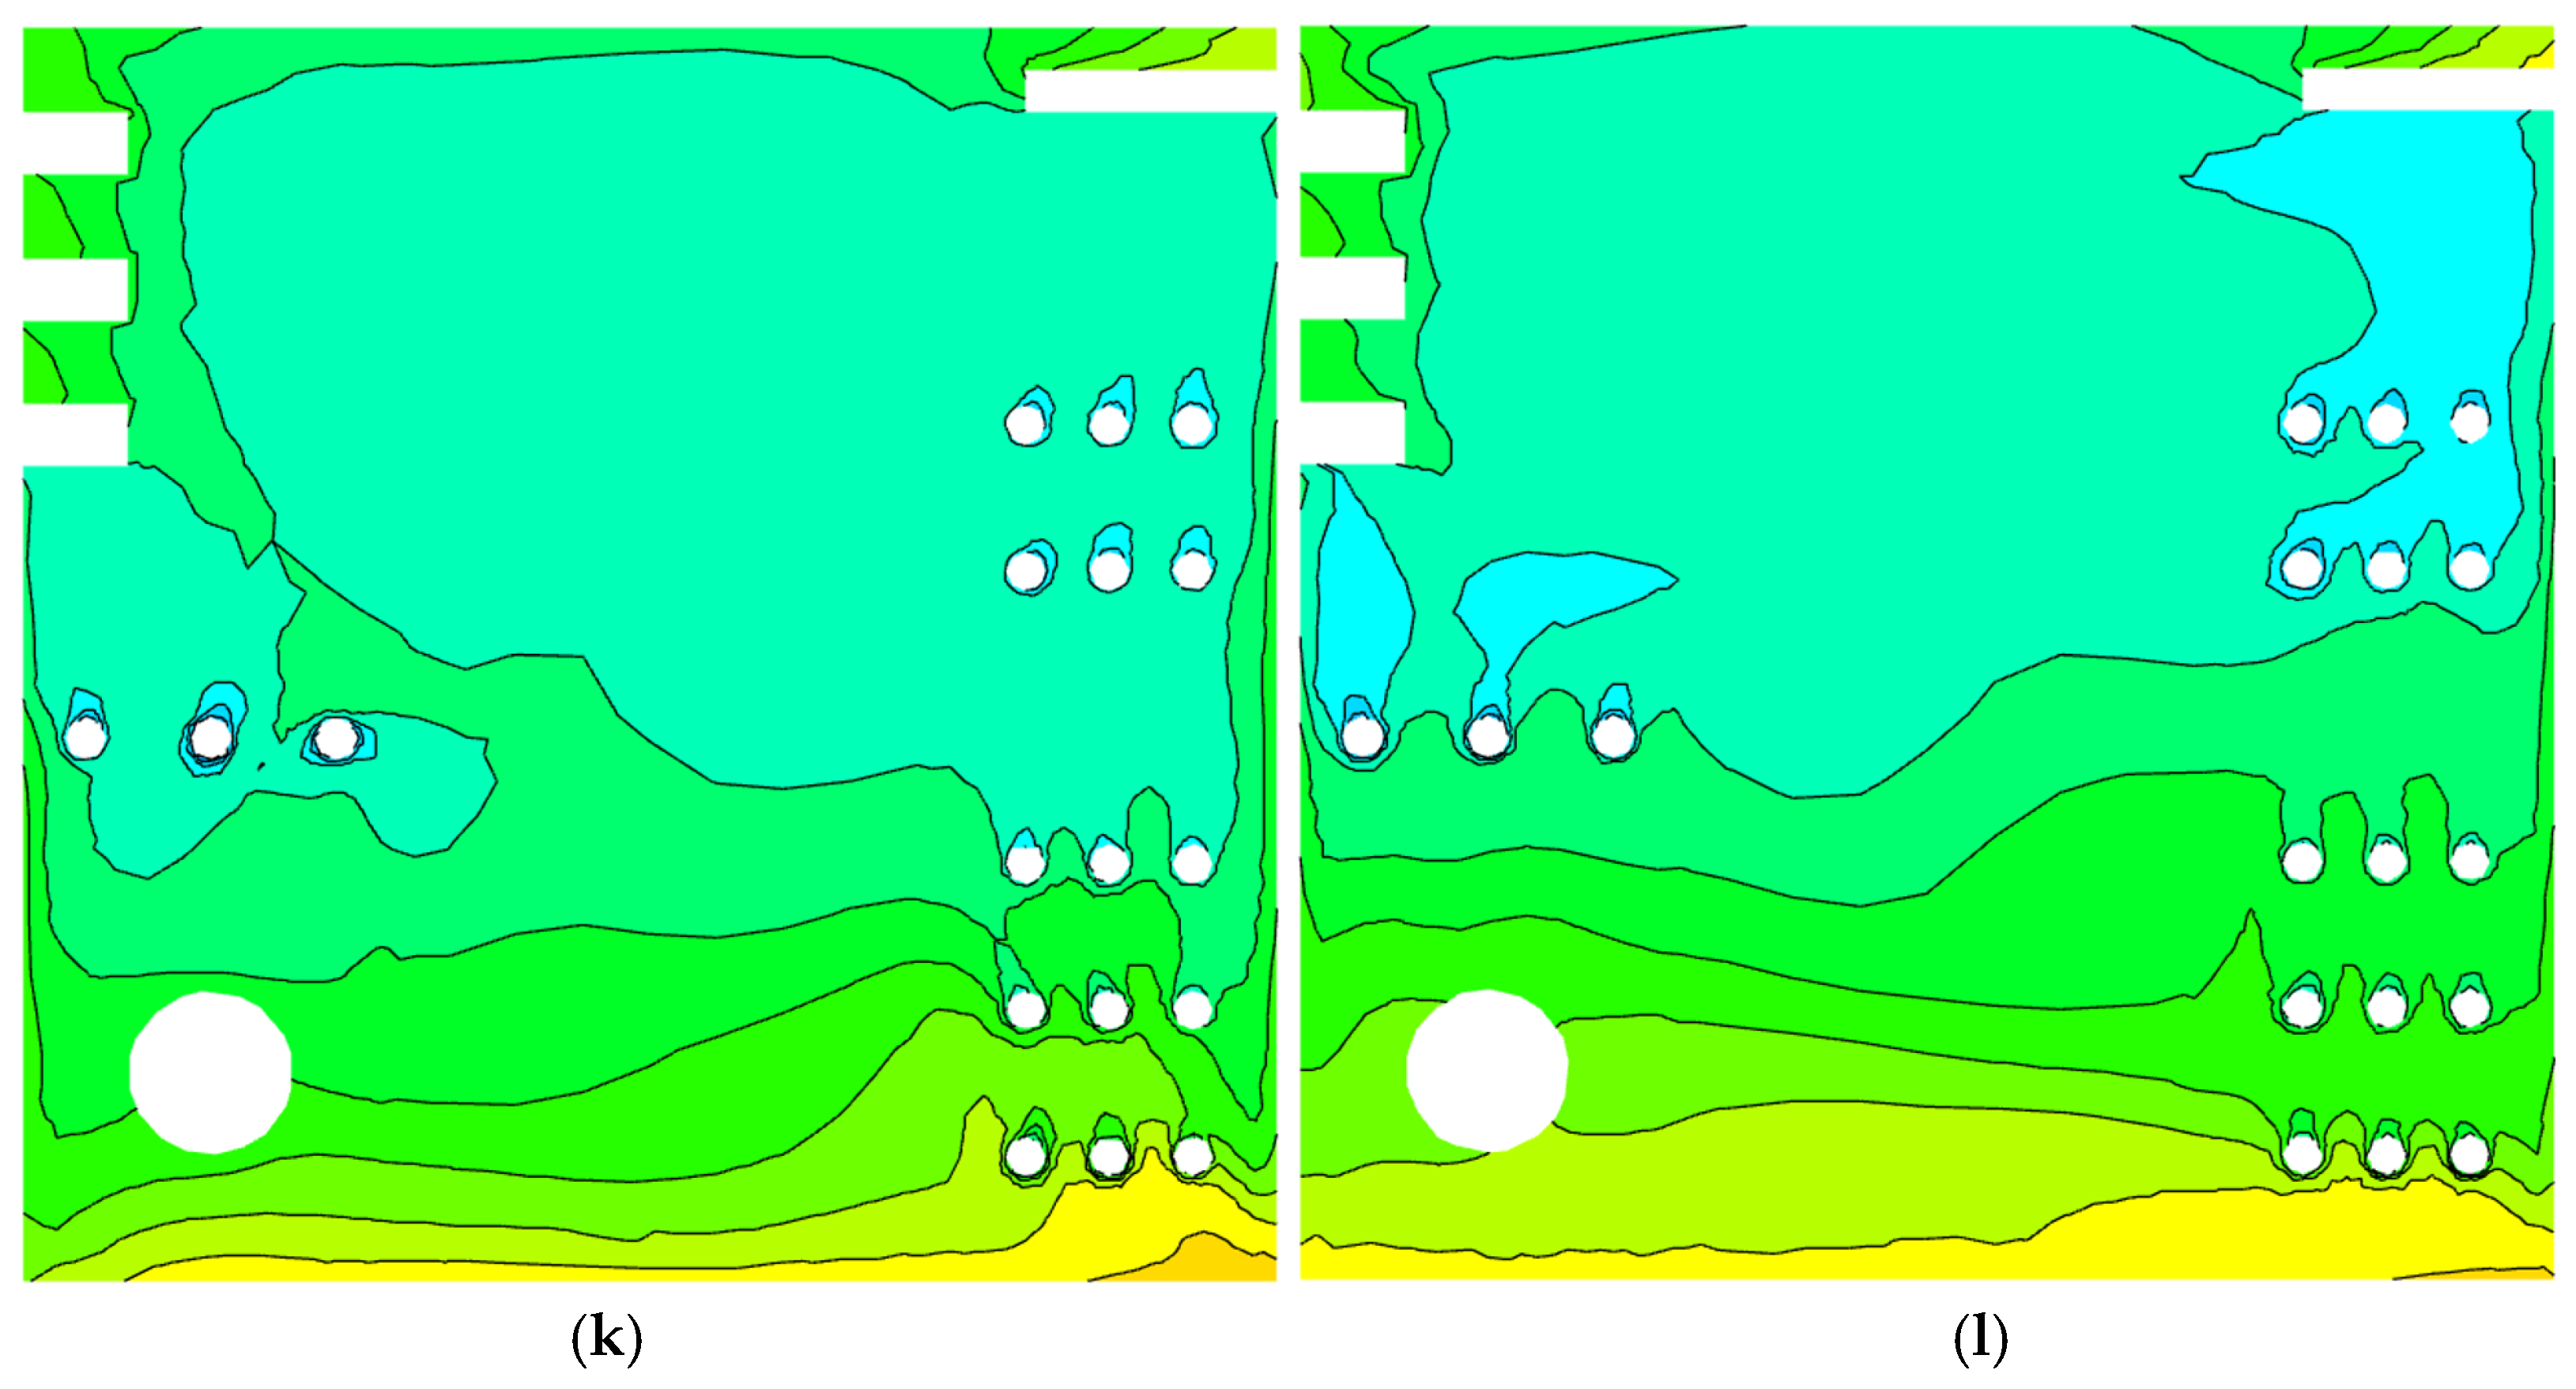
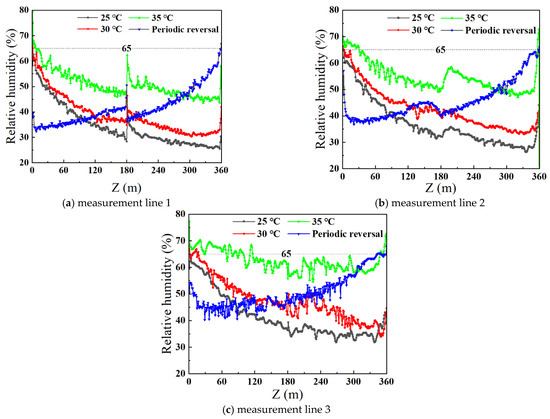
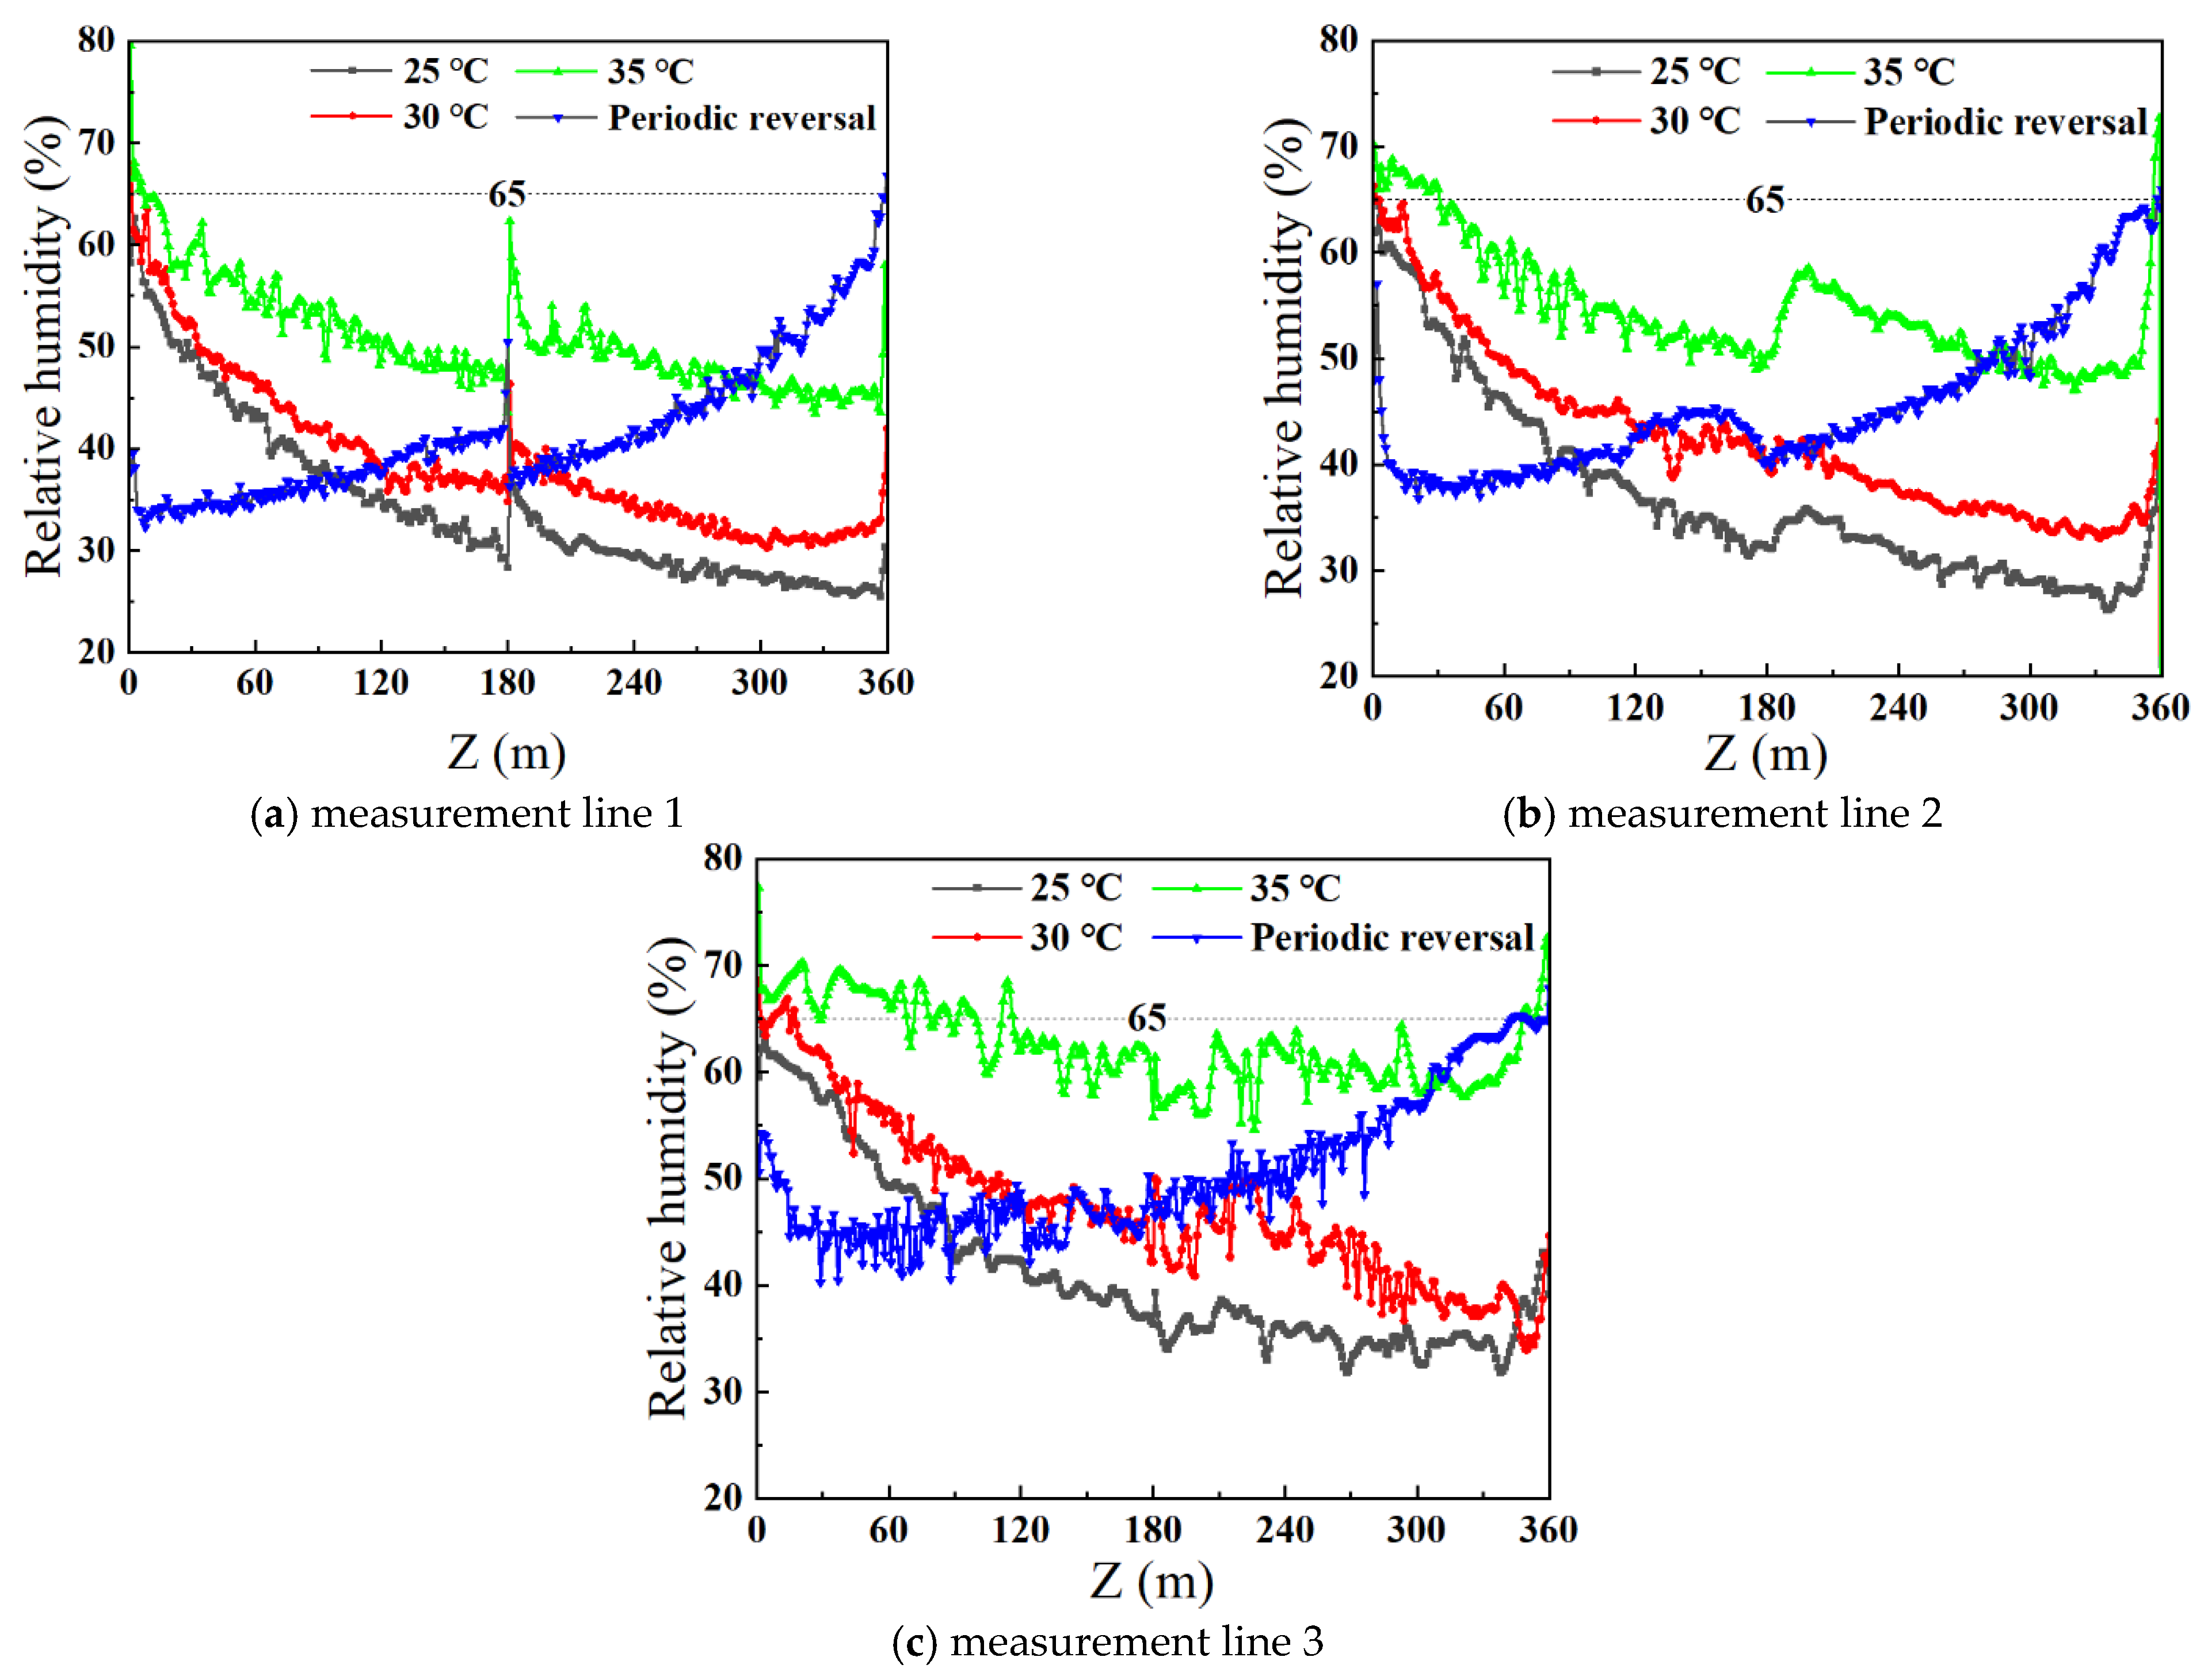
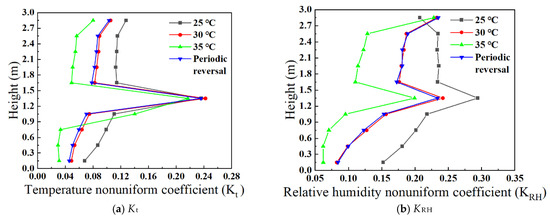
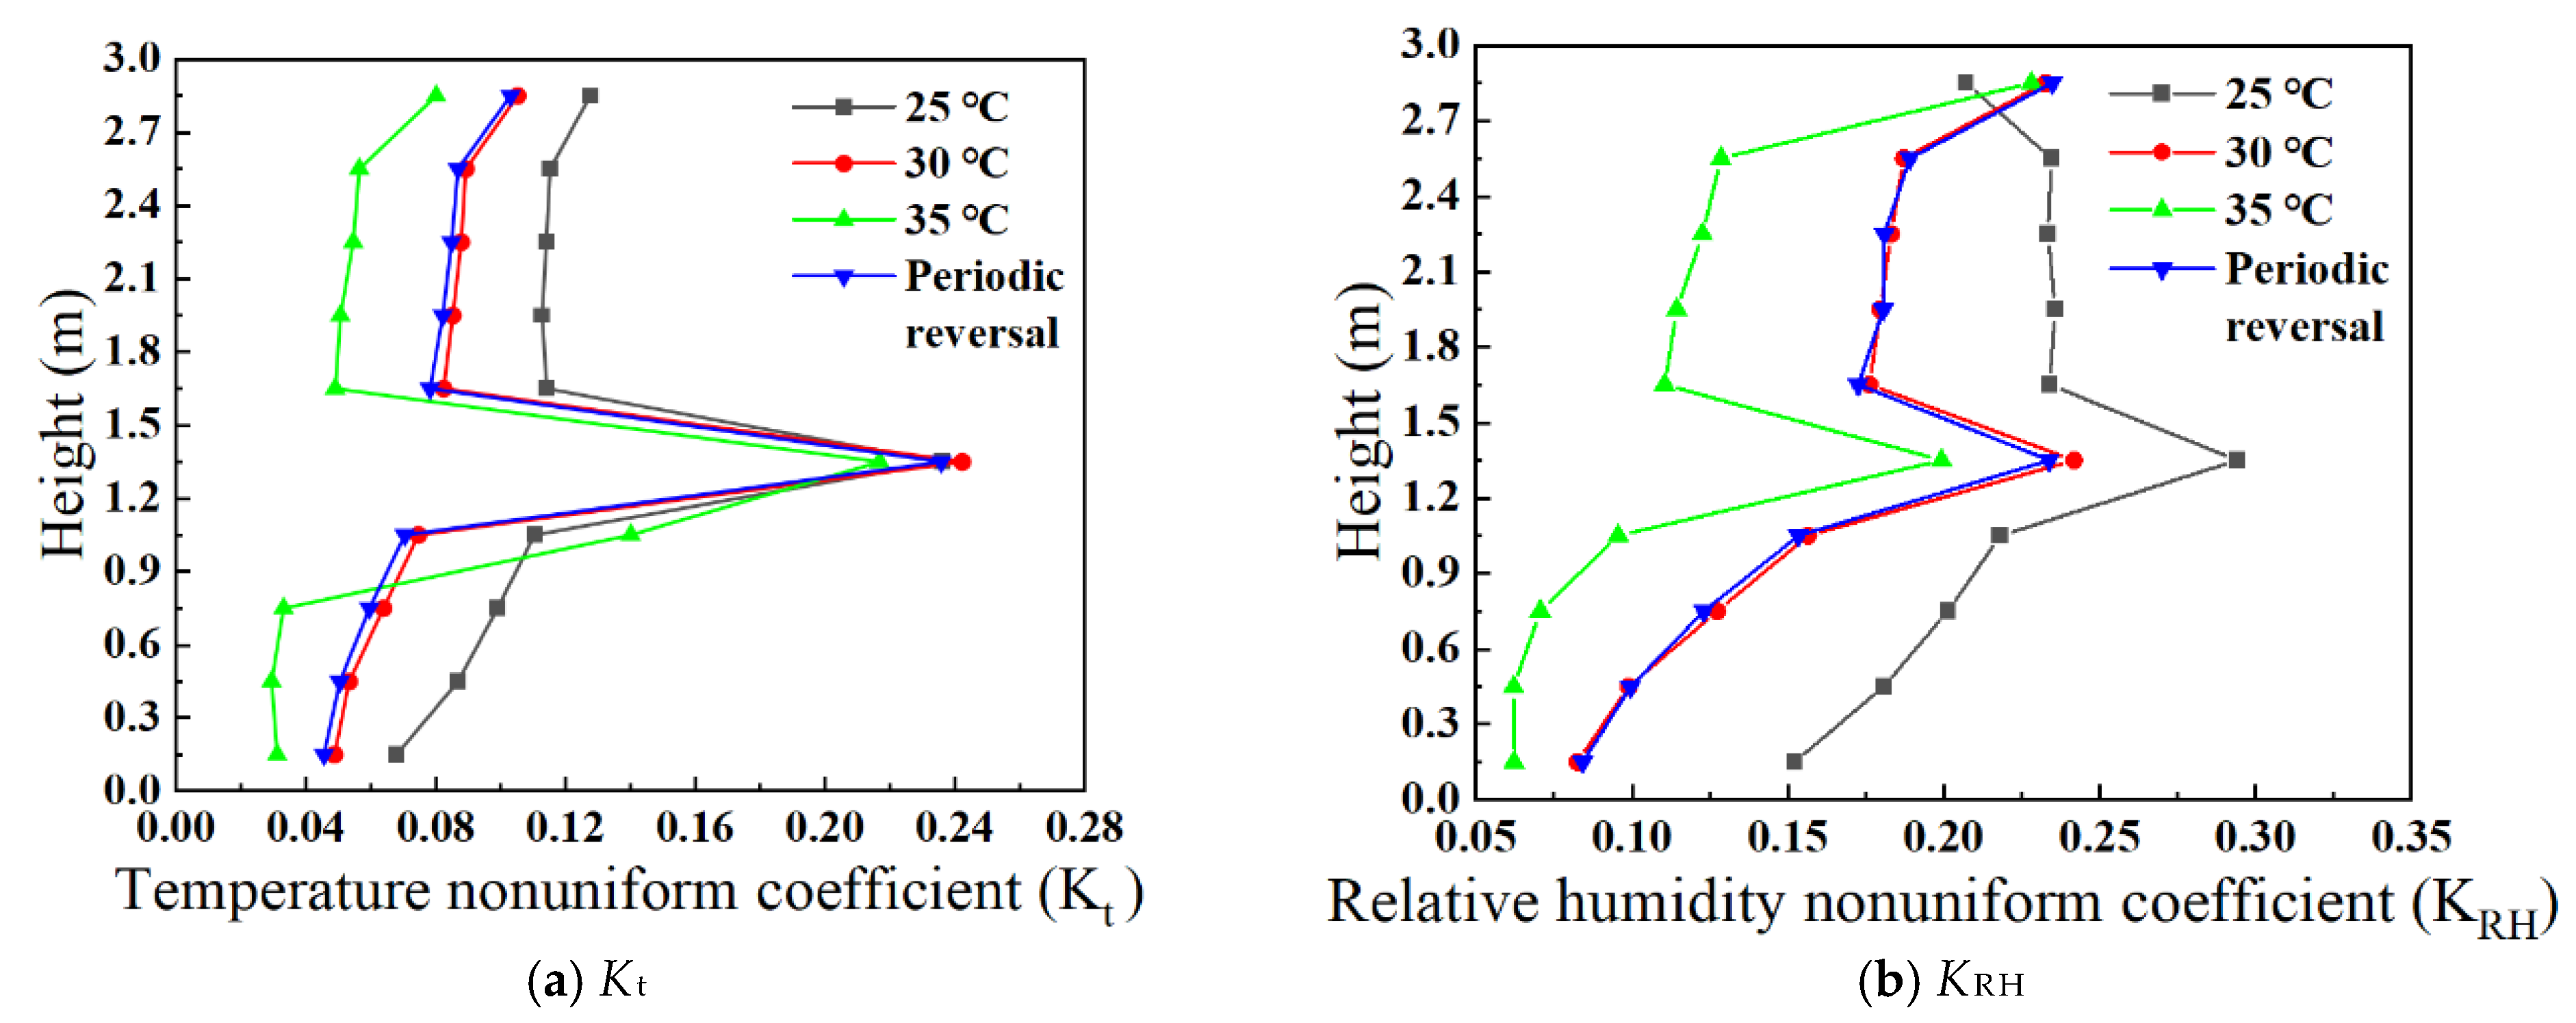
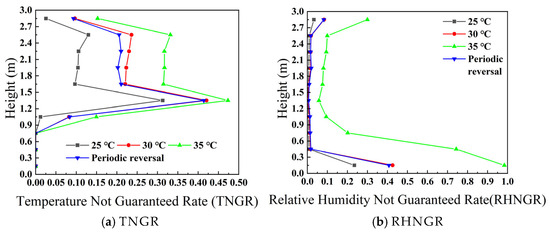
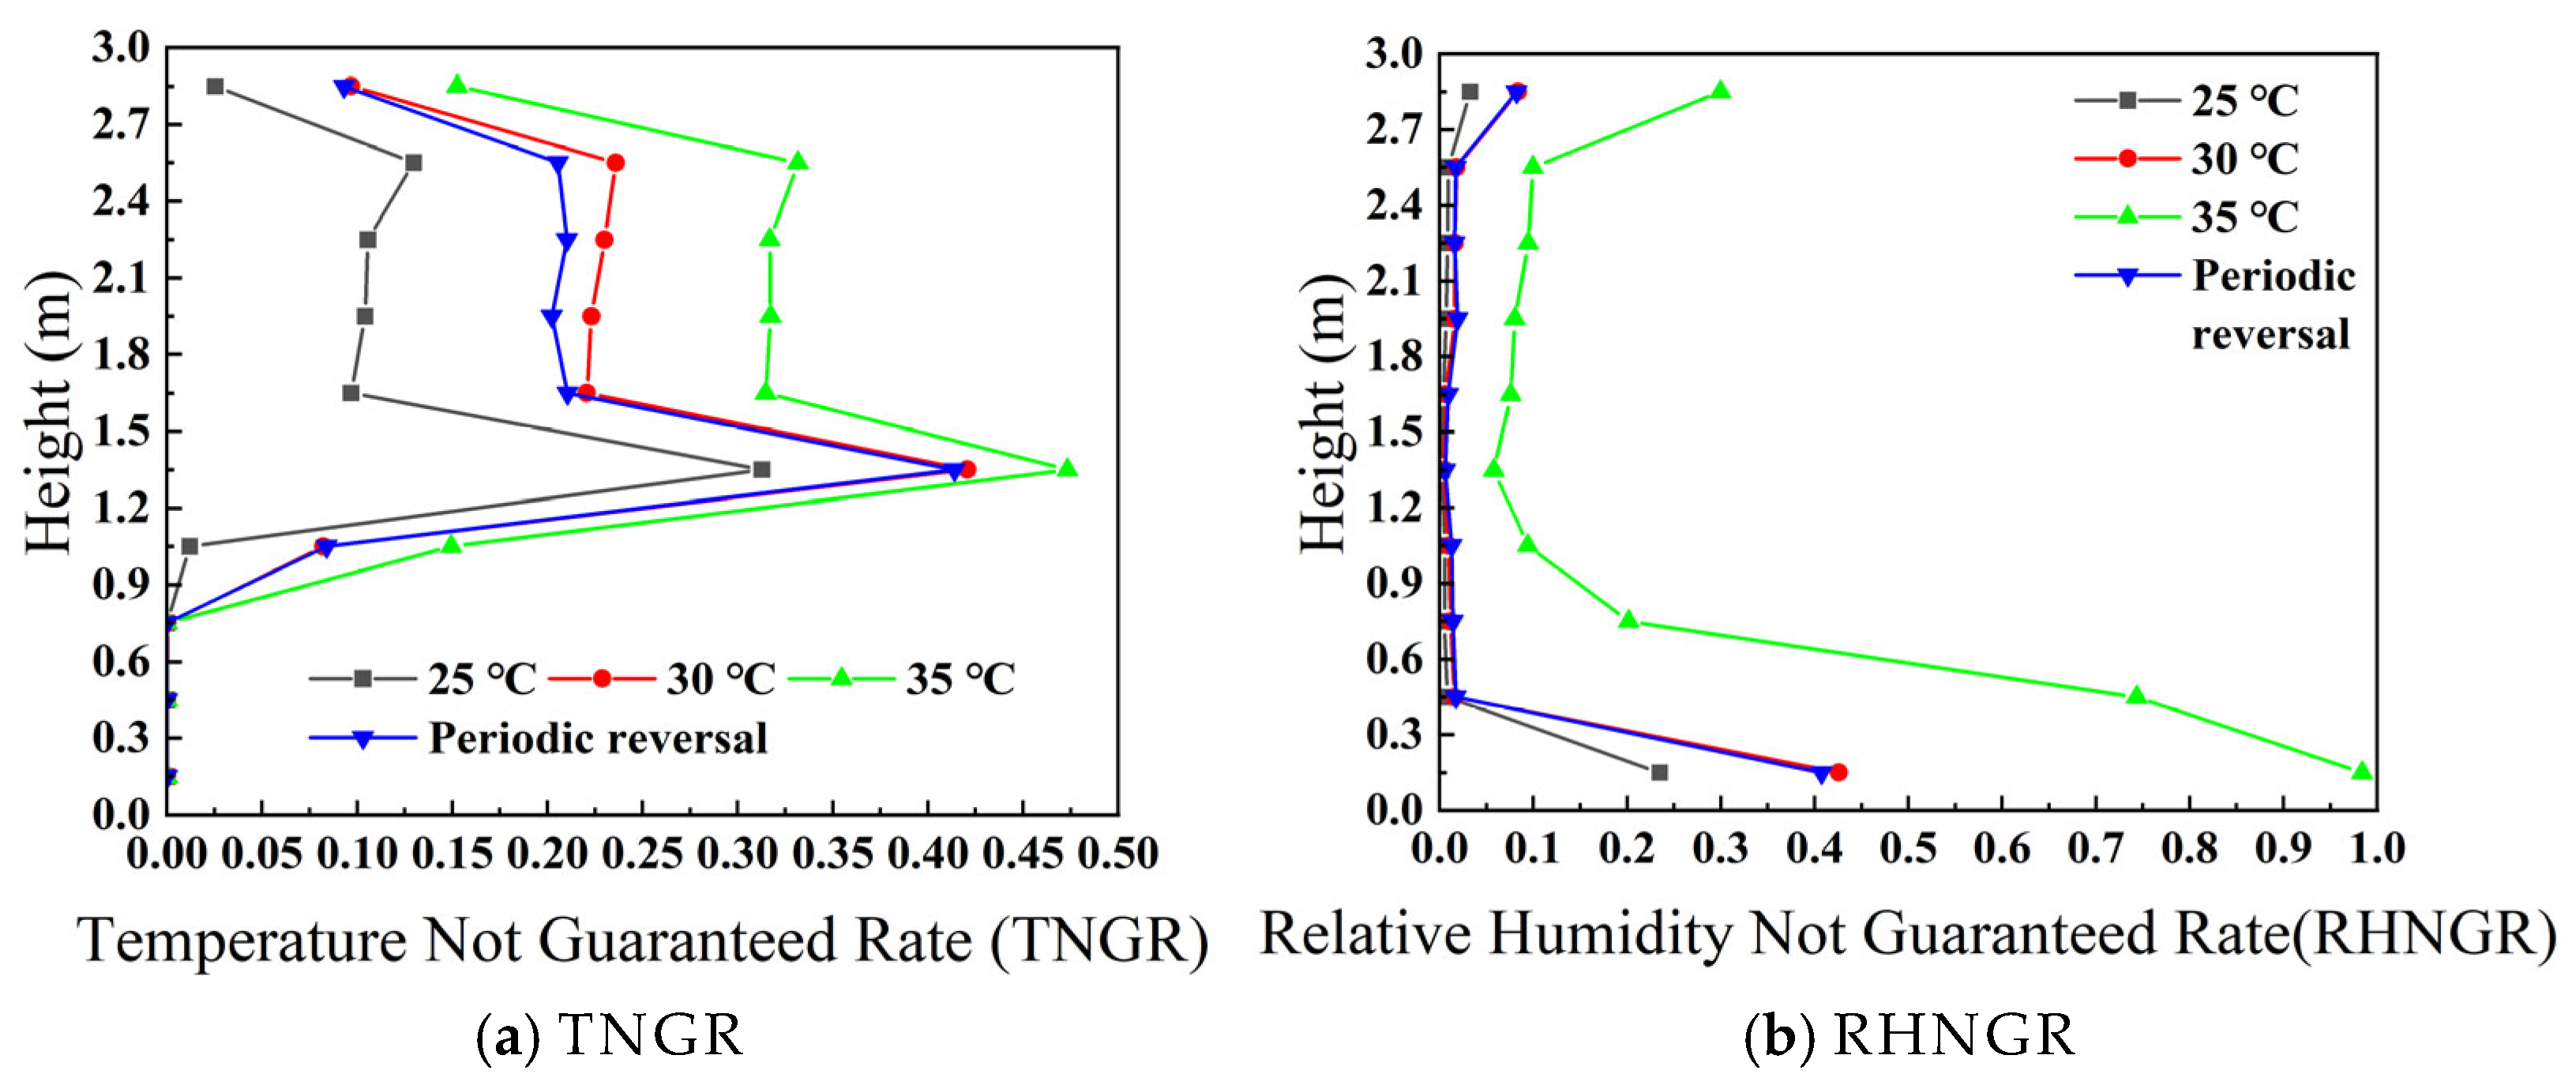
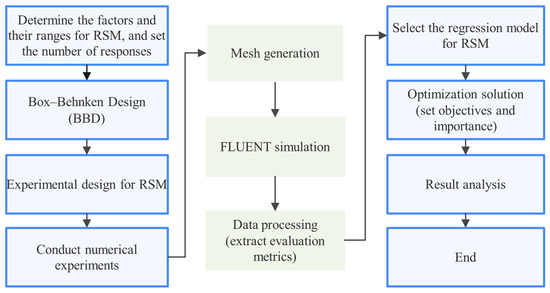
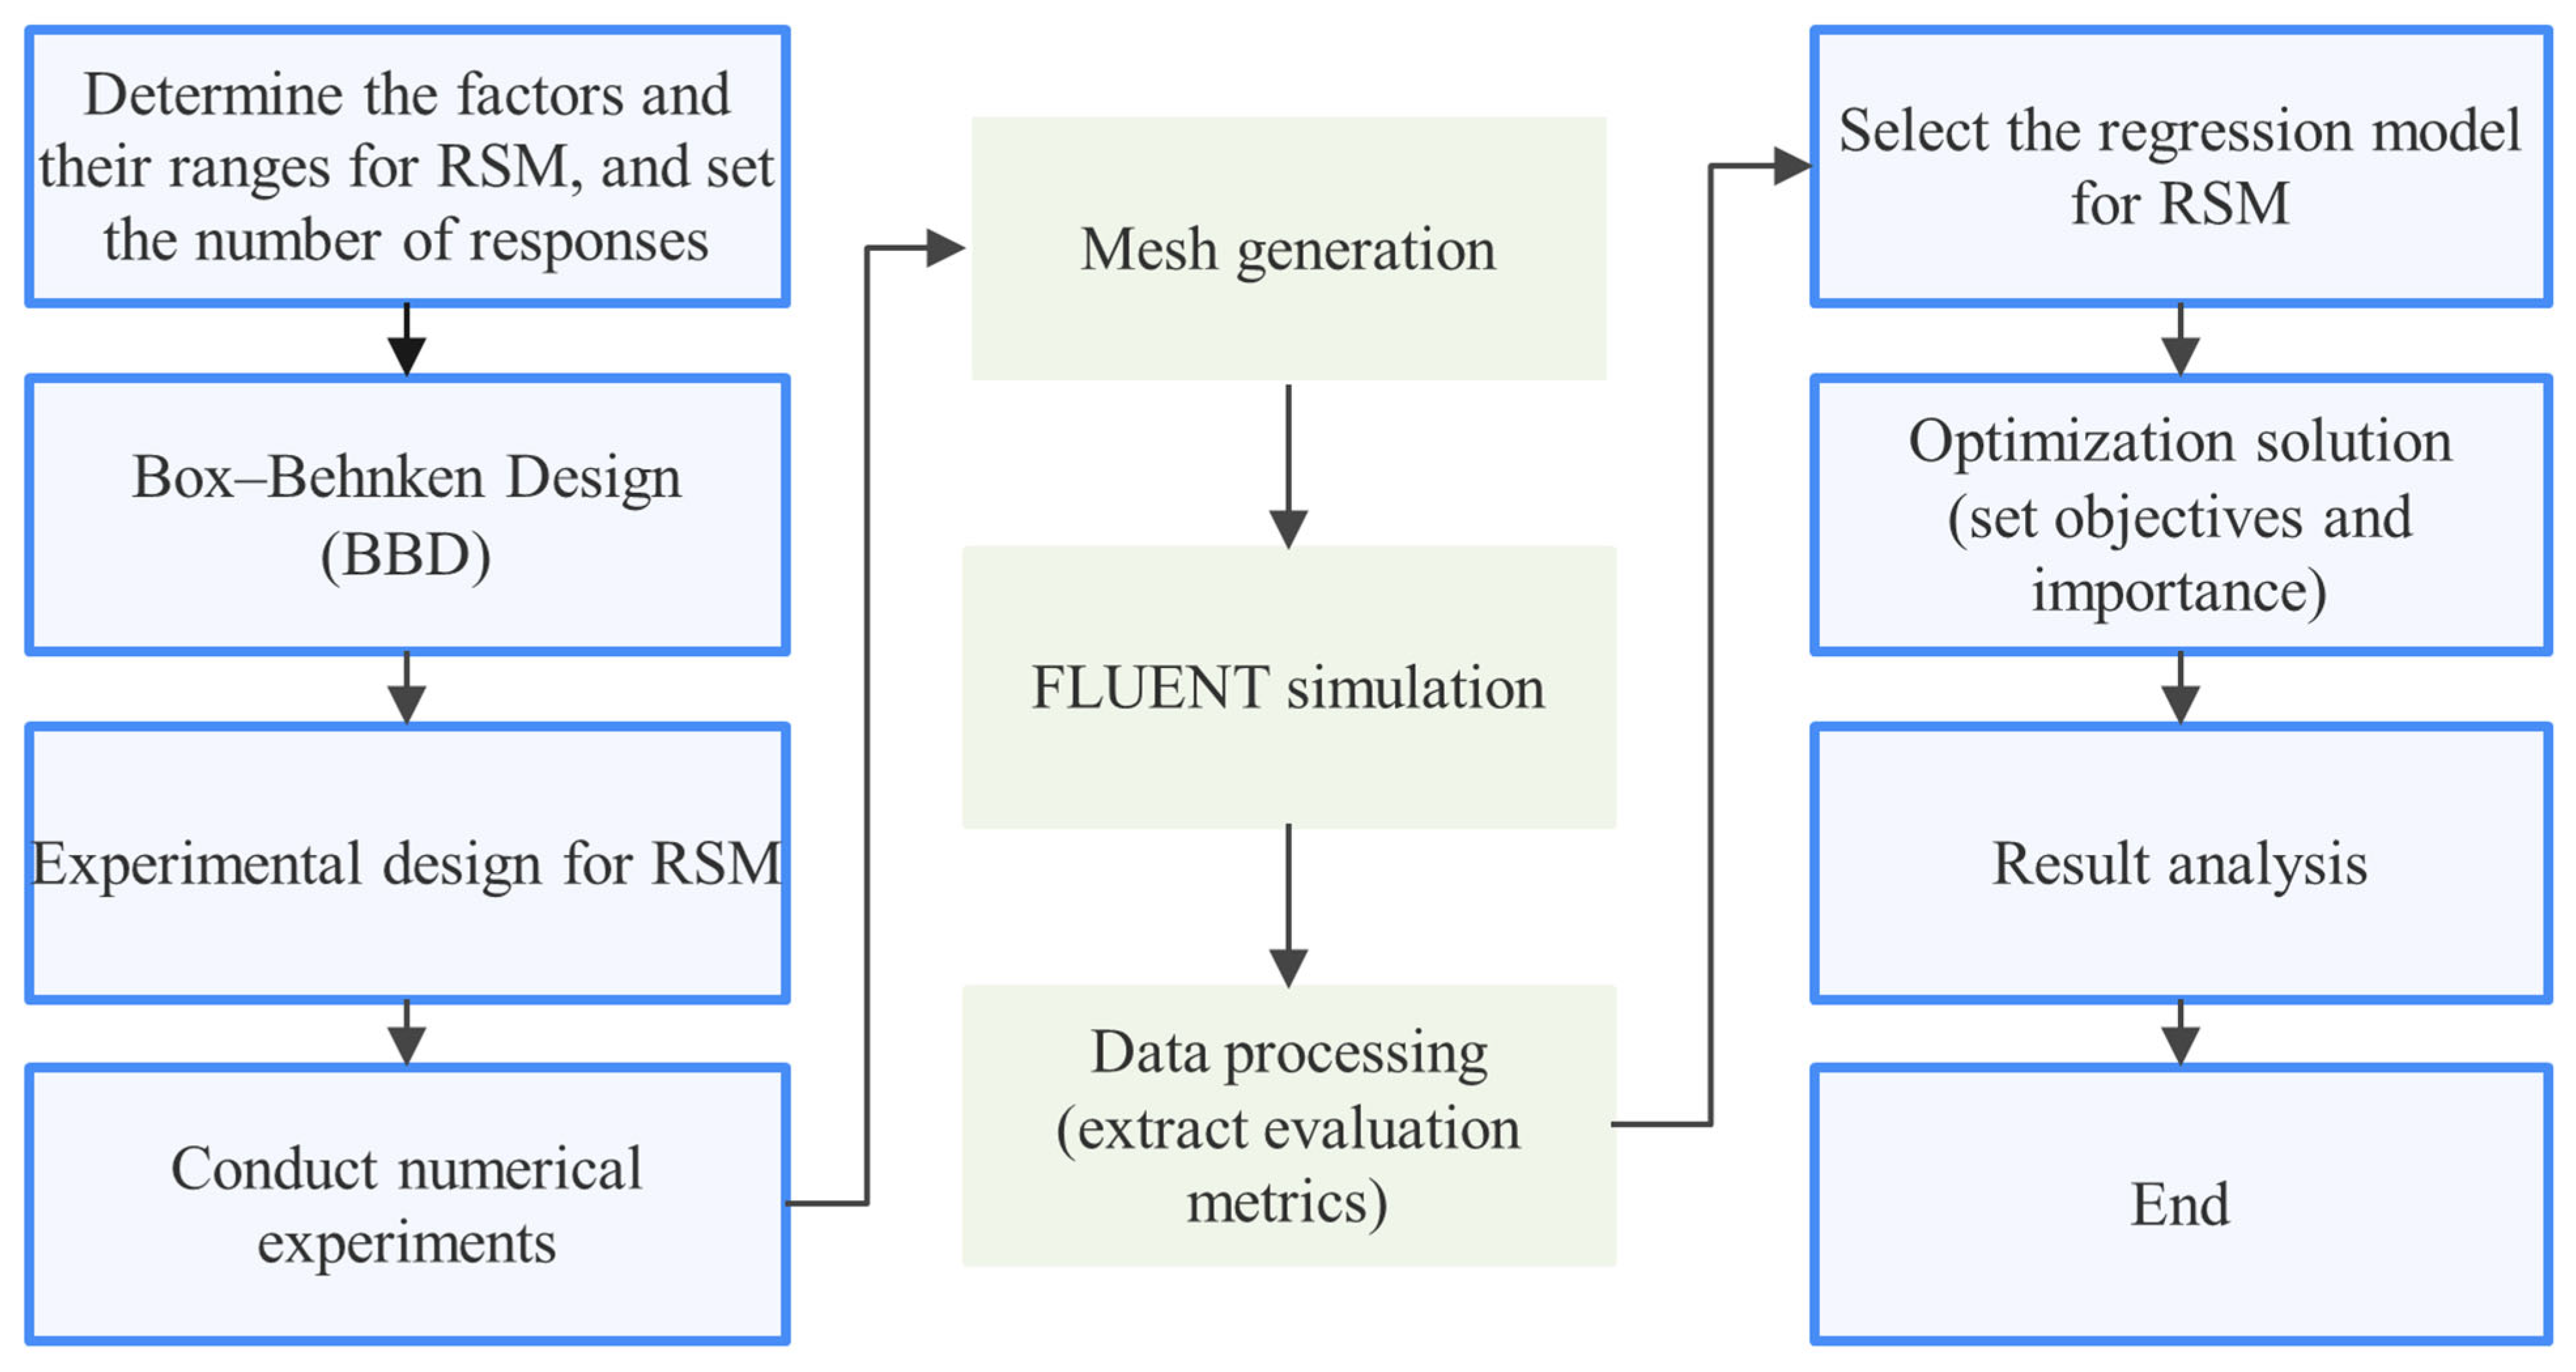
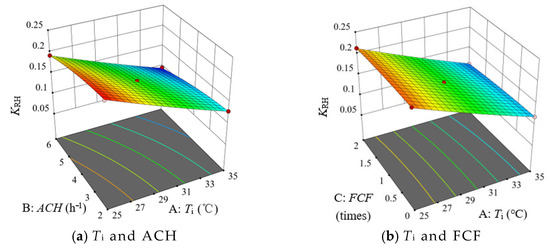
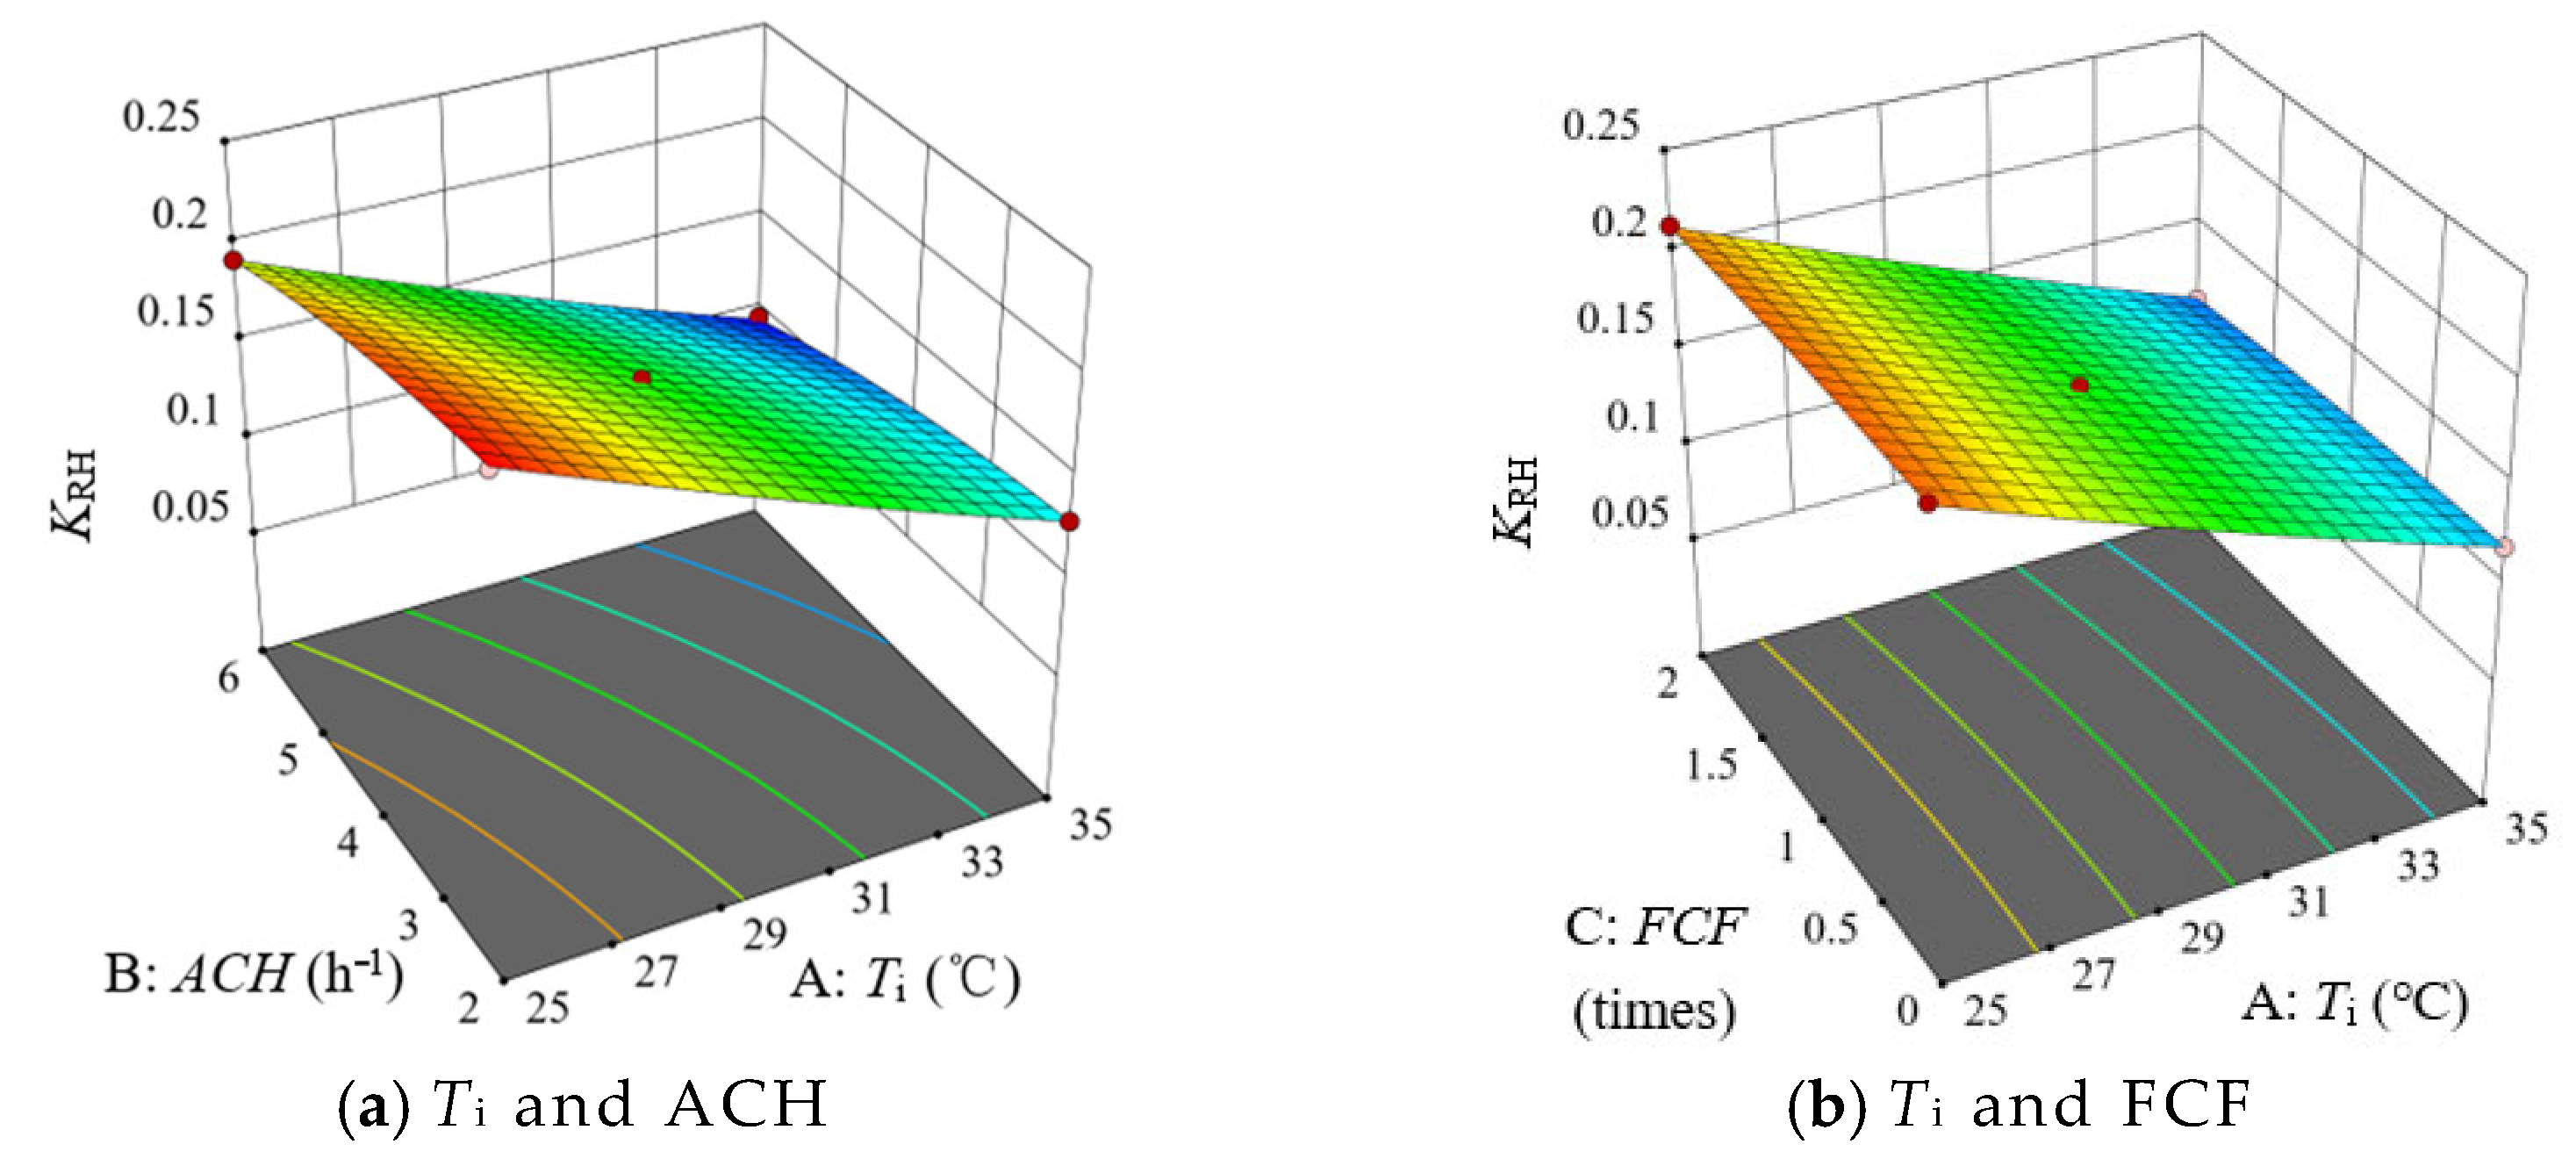
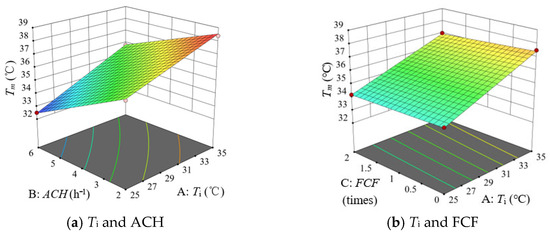
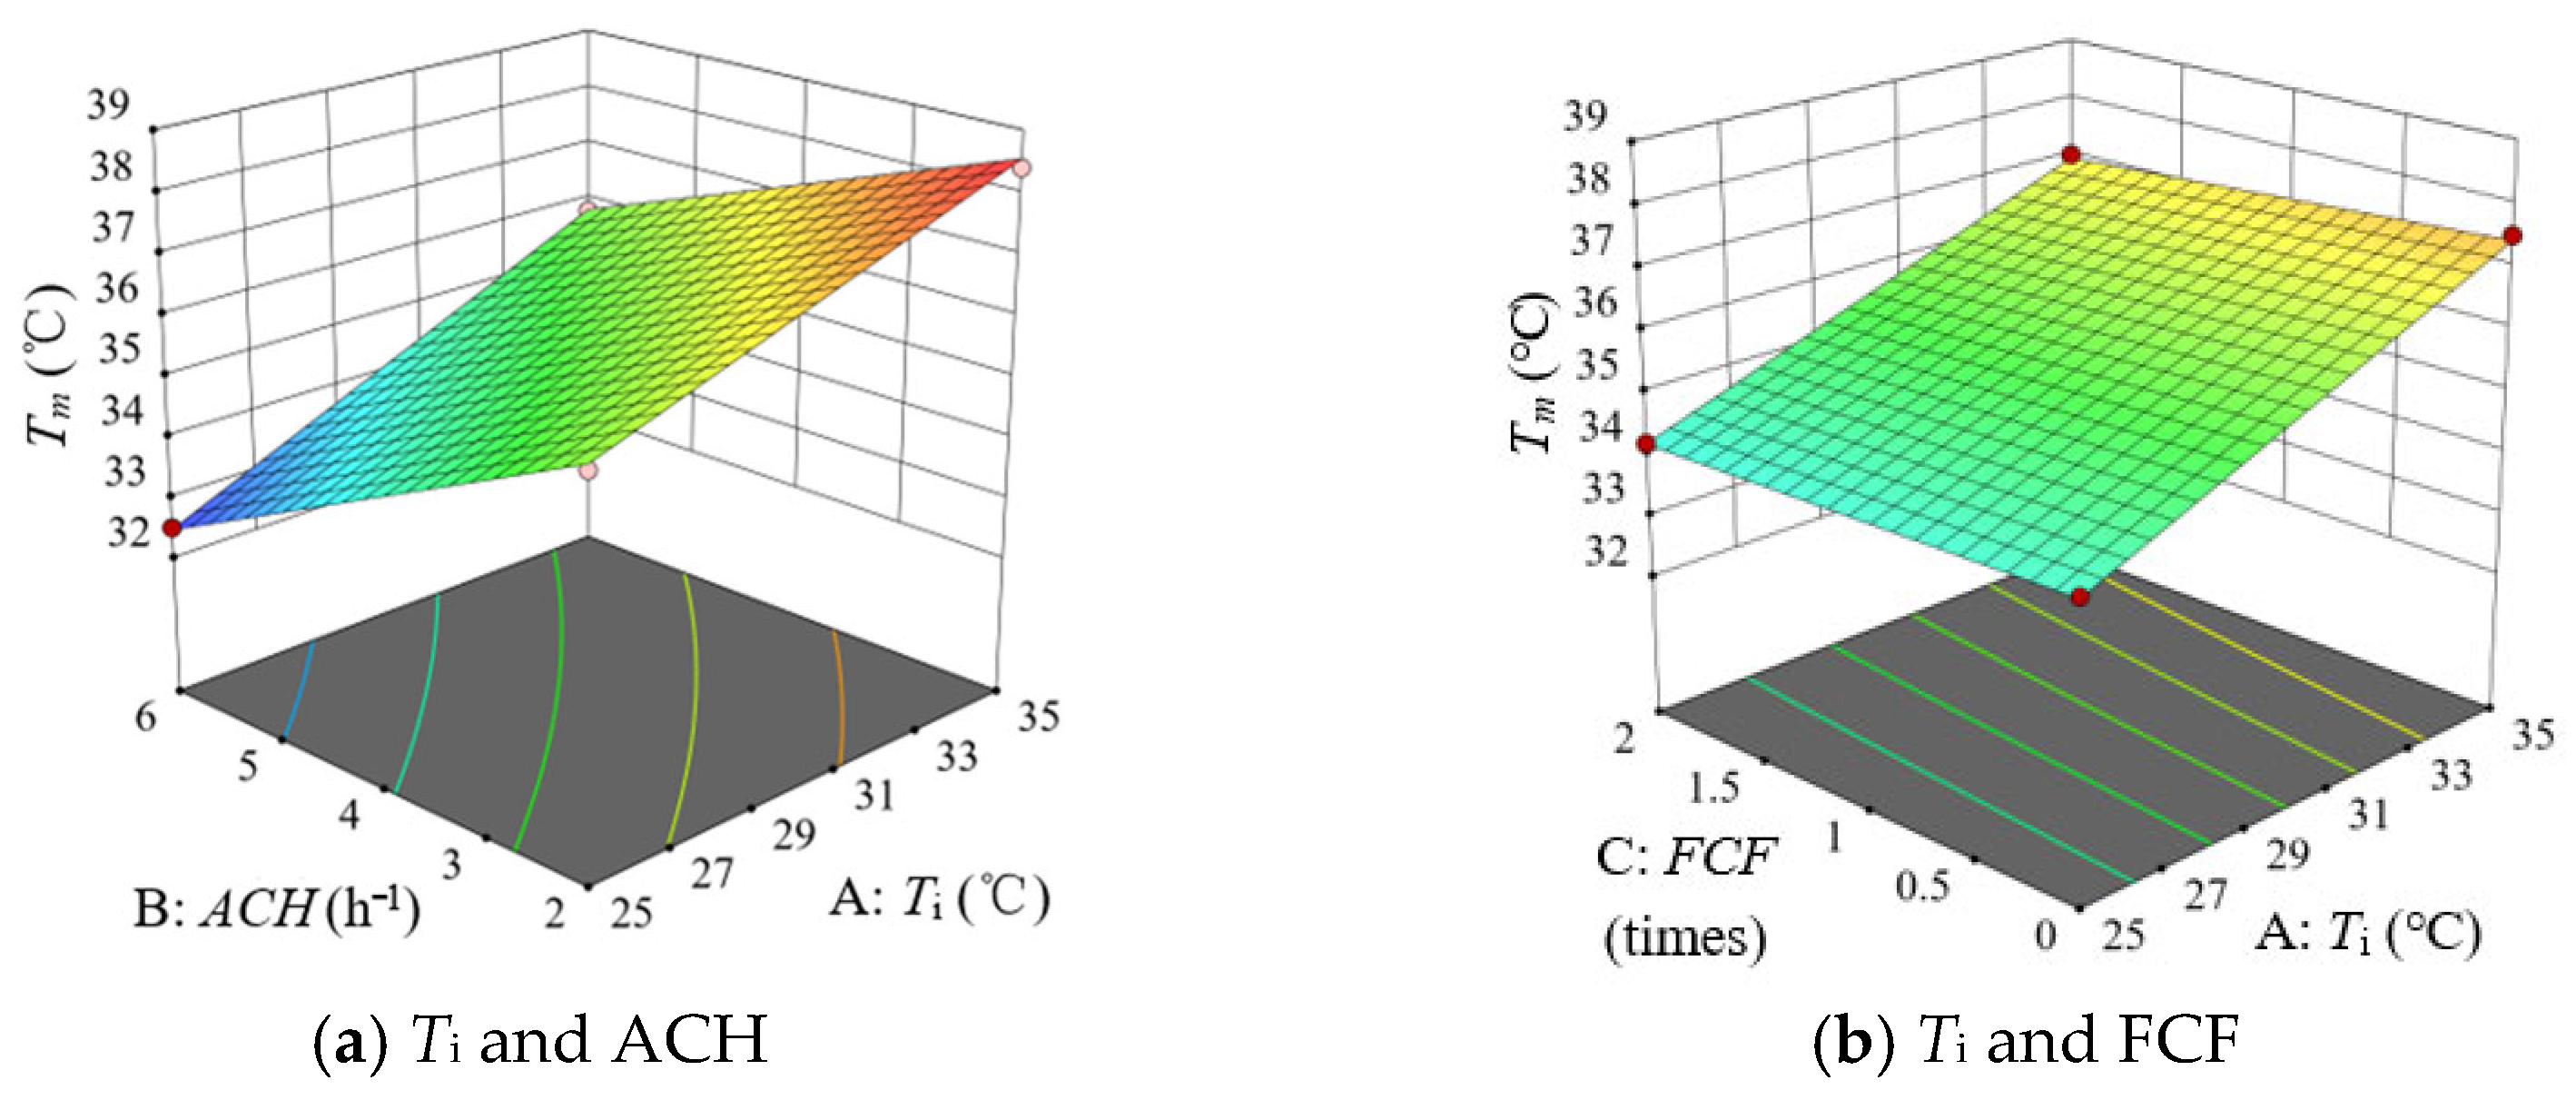

Disclaimer/Publisher’s Note: The statements, opinions and data contained in all publications are solely those of the individual author(s) and contributor(s) and not of MDPI and/or the editor(s). MDPI and/or the editor(s) disclaim responsibility for any injury to people or property resulting from any ideas, methods, instructions or products referred to in the content. |
© 2026 by the authors. Licensee MDPI, Basel, Switzerland. This article is an open access article distributed under the terms and conditions of the Creative Commons Attribution (CC BY) license.