Article

A Case of Rural Revitalization in China: Rural Landscape Characteristics, Visual Attention and Physiological Responses Based on Multimodal Data


1
School of Architecture and Urban Planning, Anhui Jianzhu University, Hefei 230601, China
2
Graduate School of Horticulture, Chiba University, Matsudo 271-8510, Japan
*
Author to whom correspondence should be addressed.
Buildings 2026, 16(10), 2036; https://doi.org/10.3390/buildings16102036
Submission received: 20 March 2026 / Revised: 15 May 2026 / Accepted: 16 May 2026 / Published: 21 May 2026
(This article belongs to the Section Architectural Design, Urban Science, and Real Estate)

Abstract

This study investigates how different rural landscape types shape visual attention and physiological responses, with the aim of informing more targeted rural landscape renewal. Four typical rural landscape types in the suburbs of Hefei, China, were examined: Flat Farmland (FF), Hilly Forest (HF), Developed Plain (DP), and Water-network Lowland (WNL). All four study villages are project villages in the suburban area of Hefei where rural revitalization is currently being advanced. This study therefore treats them as empirical cases within the context of rural revitalization in China, using them to examine perceptual differences among rural landscape types and their implications for rural landscape renewal. A two-stage research design was adopted to balance field realism and laboratory control. In the first stage, 40 representative scene images were selected by combining field video records with fluctuations in on-site skin conductance response (SCR). In the second stage, laboratory experiments were conducted while participants viewed the selected images, during which eye-tracking, skin conductance, and heart rate data were recorded simultaneously. These measures were used to characterize visual attention allocation and autonomic physiological responses across different rural landscape types, rather than to directly measure landscape preference. For Area of Interest (AOI) analysis, each image was coded into six landscape element categories: vegetation, buildings, roads, sky, vernacular buildings, and water bodies. The results revealed significant typological differences in overall visual search patterns and autonomic responses. Gaze hotspots were concentrated on identifiable targets and boundary regions in the foreground and midground, whereas the sky attracted relatively limited attention. FF primarily emphasized vernacular buildings and farmland boundaries, HF emphasized settlement interfaces and spatial transition nodes, DP emphasized road junctions and facilities along routes, and WNL emphasized water bodies and water–land interface zones. These findings suggest that a two-stage multimodal design can provide supporting evidence for understanding type-specific perceptual responses and can support more targeted strategies for rural landscape renewal.

1. Introduction

1.1. Research Background and Study Objectives

Rural landscapes perform both productive and ecological functions and are closely linked to residents’ well-being, the appeal of rural areas, and local identity [1]. Studies from restorative and preference perspectives suggest that perceived naturalness varies across rural landscape types and, together with specific landscape elements, is associated with measurable psychological and physiological responses [2]. Earlier studies mainly focused on overall impressions and experiential judgments, whereas more recent work has paid greater attention to individual landscape elements. By combining visual attention data with physiological signals, these studies have provided a clearer basis for explaining differences in landscape evaluation [3]. This shift has been supported by recent technological advances, especially the wider availability of wearable eye-tracking devices and physiological sensors. At the same time, presentation methods such as virtual reality (VR) panoramic materials, together with image segmentation, feature quantification, and modeling techniques, have improved the reliability of element-level analysis and made it easier to relate experimental findings to landscape design [4].
However, existing research still rarely provides a systematic comparison of perceptual differences across rural landscape types within a typological framework. Research that combines scene identification in real-world settings with multimodal validation under controlled laboratory conditions remains especially limited.
In recent years, rural landscape classification has moved beyond single land-use categories and descriptive typologies, placing greater emphasis on integrated identification based on landscape character assessment frameworks [5]. Related studies indicate that rural landscape typology should take both natural and cultural characteristics into account, and that their overlay analysis helps identify landscape heritage types and their spatial extent [6]. Other studies have developed identification frameworks from environmental, cultural, and socioeconomic dimensions, showing that typological classification depends on the combined support of multidimensional indicators [7]. At the regional scale in China, landscape character identification also commonly combines characteristic-factor screening with clustering methods to improve the comprehensiveness and regional adaptability of classification results [8].
From this perspective, the four types used in this study—Flat Farmland-type, Hilly Forest-type, Developed Plain-type village, and Water-network Lowland-type—are not treated as a preset universal classification system. They are defined as four representative rural landscape types derived from the combined differences among the peri-urban Hefei sample sites in topography, dominant land use and industrial characteristics, hydrological spatial patterns, and urbanization influence.
Against the background of ongoing rural revitalization in China, this study conducts a comparative analysis of four representative project villages in the peri-urban area of Hefei. The four villages differ in natural terrain, industrial characteristics, and spatial landscape features, and each corresponds to a distinct rural landscape type. They therefore serve as case samples for research on rural landscape renewal.
This study does not aim to construct a direct causal mechanism of landscape evaluation. Instead, it focuses on identifying differences among rural landscape types and uses a two-stage design—real-world scene screening followed by controlled laboratory validation—to examine and refine differences in visual attention allocation and physiological responses across types. In this study, restorative responses and physiological indicators are used as supporting and cross-validating evidence rather than as direct substitutes for perceptual evaluation [9].
The study adopts a research design that combines field-based localization with laboratory validation. In the first phase, SCR and video playback were used in real rural settings to identify key scenes associated with group-level emotional fluctuations and to screen stimuli. In the second phase, the selected scene stimuli were subjected to detailed validation under controlled laboratory conditions, with simultaneous collection of eye-tracking and physiological data to balance ecological validity and experimental control [10].
At the level of statistical inference, stimulus images were used as the basic unit of analysis in order to ensure relatively clear independence in category comparisons. Multimodal indicators were aggregated and characterized on this basis, and between-group differences among the four rural categories were then tested accordingly. At the landscape-element level, vegetation, buildings, roads, sky, vernacular buildings, and water bodies were categorized as Areas of Interest (AOIs) for mechanism validation, thereby revealing distinct patterns of visual attention allocation and autonomic nervous system responses across different rural types [11].
The objectives of this study are to: (1) compare differences among the four rural landscape types using multimodal indicators; (2) identify the specific patterns and distinguishing features of visual attention and physiological responses across types at the AOI element level; and (3) extract element-based cues and optimization directions for rural landscape renewal from these typological findings. With these objectives, the study focuses on contextual validation and typological refinement of existing perceptual relationships rather than on proposing a new universal theoretical model.
For design and conservation practice, these typological findings are expected to provide a preliminary metric-informed checklist for improving existing rural areas. By combining gaze hotspots, AOI-based attention patterns, and physiological response indicators, the study identifies landscape elements, nodes, boundaries, and interfaces that may deserve priority attention in renewal practice. These cues are not intended as universal design rules, but as a cautious decision-support tool for identifying which existing features may be conserved, clarified, or carefully renewed.
The remainder of this paper is organized as follows: Section 1 reviews related research and presents the research framework; Section 2 introduces the study area, experimental design, and data processing; Section 3 reports the empirical results; and Section 4 discusses the findings and their practical implications.

1.2. Literature Review

To further clarify the theoretical foundation of this study, the following review examines relevant research on rural landscape perception and restoration, eye-tracking, the application of physiological indicators, and multimodal cross-validation. Previous studies have shown that natural environments can support both physical and psychological recovery, and some relatively consistent patterns have also been reported at the level of individual landscape components [1]. For example, studies in urban parks have found that higher green coverage is often associated with stronger perceived restoration and changes in physiological indicators such as electrodermal activity (EDA) and heart rate variability (HRV), suggesting that vegetation may contribute to recovery through its visually calming qualities [10]. In neuroscience and multimodal studies of rural and natural settings, the degree of naturalness, landscape type, and compositional elements influence environmental restorative potential and result in distinguishable differences in eye-tracking and physiological measures [12]. From the perspective of spatial renovation, the changes in physiological indicators and visual behavior before and after the renovation align with improvements in subjective experience, providing empirical evidence for the chain linking design to perception and physiological responses [13]. At the same time, mechanism-testing studies suggest that environmental effects are typically modest and highly context-dependent; different factors may lead to fluctuations in indicators or no significant changes. Therefore, when interpreting mechanisms, one must rely more cautiously on corroborating evidence from multiple sources [14]. Accordingly, there remains a lack of systematic comparisons across rural landscape types, particularly in terms of how visual attention allocation and physiological responses vary across different typological contexts.
Traditional surveys and expert evaluations can quickly yield evaluative rankings, but they struggle to capture real-time visual attention processes or identify the key factors that shape perceptual responses [15]. Eye-tracking provides objective evidence of gaze behavior and can identify process-related information such as the objects of attention, gaze patterns, and duration of gaze, thereby addressing the aforementioned shortcomings [9].
In the fields of architecture and urban design, pioneering work by Ann Sussman, Justin B. Hollander, Alexandros A. Lavdas, and colleagues has emphasized the value of eye-tracking and biometric tools for understanding how people respond to the built environment. Cognitive approaches to architecture have introduced psychology and neuroscience as useful references for interpreting human responses to buildings and places [16]. Related work has framed biometric tools as an evidence-based foundation for improving the public realm [17]. Empirical studies have further shown that eye-tracking can reveal how design characteristics in neighborhood environments organize visual attention [18]. Visual Attention Software and eye-tracking emulation methods have also been explored as tools for identifying visually salient areas in built environment images [19,20]. These studies support the use of eye-tracking not only as a technical measurement method, but also as a design-oriented tool for interpreting visual experience.
Another relevant design reference is Christopher Alexander’s early work on design patterns. In A Pattern Language, Alexander, Ishikawa, and Silverstein presented recurring spatial patterns for towns, buildings, and construction as practical design knowledge [21]. The pattern “Access to Water” is particularly relevant to the water–shoreline and water–land interfaces examined in this study, because these interfaces are not only visual elements but also potential carriers of access, staying, and landscape experience. These design patterns do not serve as direct evidence for the physiological or eye-tracking results of the present study. They are used here as a design-oriented framework for translating metric-based findings into more readable implications for rural renewal.
In research on public spaces such as streets and parks, eye-tracking technology is widely used in the areas of preference and rehabilitation, and shows a trend toward interdisciplinary collaboration and multimodal integration [22]. In research on rural public spaces, heatmaps and Area of Interest (AOI) analysis are commonly used to distinguish differences in visual appeal among elements such as buildings, greenery, landmarks, and facilities. These analyses are then used to interpret experiential dimensions such as a sense of safety, publicness, and willingness to linger, thereby informing recommendations for spatial optimization [11]. Furthermore, cross-validating quantitative methods—such as semantic segmentation—with subjective evaluations and eye-tracking results enables preference research to move beyond descriptive analysis toward mechanistic explanations and predictive modeling [23]. However, eye-tracking metrics do not simply correlate with landscape preferences. “Longer fixation times” may indicate greater attractiveness of a feature, but they may also reflect higher information complexity, greater cognitive load, or increased difficulty in visual search [15]. Hotspots help identify salient objects, but salience does not equate to preference; preferences may still be influenced more by overall characteristics [13]. Research indicates that initial attention is more likely to be driven by low-level visual salience, whereas later-stage evaluation relies more on sustained processing and integrated assessment; therefore, a distinction should be made between the mechanisms of initial attention capture and later evaluative processing [24]. Accordingly, relying solely on eye-tracking metrics is often insufficient to fully account for psychological changes; cross-validation of multimodal evidence is increasingly becoming a more robust research strategy [9].
Within a multimodal cross-validation framework, physiological indicators provide an important complement to eye-tracking evidence. Metrics such as EDA and HRV can characterize states of arousal, stress, and relaxation under autonomic regulation, and demonstrate a certain degree of sensitivity in virtual or controlled natural exposure settings [10]. Previous studies have also found potential statistical associations between subjective recovery scores and skin conductance levels, HRV indicators, and the proportion of gaze directed at specific elements, providing evidence for a chain of interpretation that links landscape elements and visual attention to physiological responses and ultimately to evaluation outcomes [10]. In environments such as forest parks, different spatial types have been shown to differ in subjective restoration ratings, skin conductance responses, and eye-movement patterns [25]. Research on campus blue-green spaces has also shown that skin conductance responses are sensitive to environmental stimuli and can therefore provide useful physiological support for interpreting restorative mechanisms [26]. However, some studies have found that physiological indicators do not always correspond closely to questionnaire-based preferences. Instead, these signals may reflect arousal or attentional engagement rather than preference itself. These findings therefore need to be cross-checked against multiple forms of evidence and interpreted with caution [27]. In addition, the experimental medium and mode of presentation can affect how far the results can be interpreted and generalized. Photographs, videos, panoramic images, and virtual reality do not provide equivalent perceptual experiences, and differences between media may affect perceptual consistency and the credibility of generalization [28]. Reflective surfaces such as water can reshape the distribution of visual attention, alter spatial perception, and influence emotional responses [29]. Cloud cover and the visible proportion of the sky may also affect preference judgments [30]. Color and seasonal conditions may also alter the relationship between visual behavior and preference, which means that important differences in stimulus materials should be controlled or reported clearly [24]. At the same time, advances in modeling tools have made it easier to translate element-level quantitative results into planning strategies and performance measures. For example, semantic segmentation can be combined with subjective evaluation and eye-tracking validation to rank landscape elements by their relative influence and to build predictive models [23]. Panoramic images and semantic segmentation can support interpretive frameworks based on a more comprehensive field of view [31]. Response surface analysis and machine learning methods help identify multi-factor interactions, thresholds, and the law of diminishing marginal returns, providing a basis for refined design [32]. Some studies have also shown that certain eye-tracking metrics can be used to predict esthetic ratings [33]. Overall, although relevant research has made progress in areas such as the recovery effect, factor quantification, eye-tracking and physiological measurements, and model translation, there remains a lack of systematic approaches in the rural context that integrate factor mechanism identification, multimodal validation, comparisons across rural types, and the translation of strategies. In particular, there is a shortage of empirical studies that cross-validate eye-tracking and physiological signals through a two-stage verification process [1,10,23,28].
Based on the above literature review and the exploratory-confirmatory design of this study, the following hypotheses are proposed for testing under the present stimulus conditions:
H1. 
Under the present stimulus conditions, the four rural landscape types are expected to differ in overall visual-search organization indicators (Number of Blinks, NB; Number of Eye Saccades, NES) and autonomic physiological arousal indicators (Skin Conductance, SC; Heart Rate, HR).
H2. 
Across the four rural landscape types, visual hotspots are expected to be concentrated mainly on clearly identifiable targets and their boundary areas in the foreground and midground, whereas background elements such as the sky are expected to receive relatively limited attention.
H3. 
Hotspot objects are expected to show relatively stable typological tendencies across different rural landscape types.
H4. 
Under the present stimulus conditions, different rural landscape types may exhibit corresponding but not necessarily identical differences in eye-tracking and physiological measures, thereby providing complementary multimodal evidence for their perceptual response patterns.

2. Materials and Methods

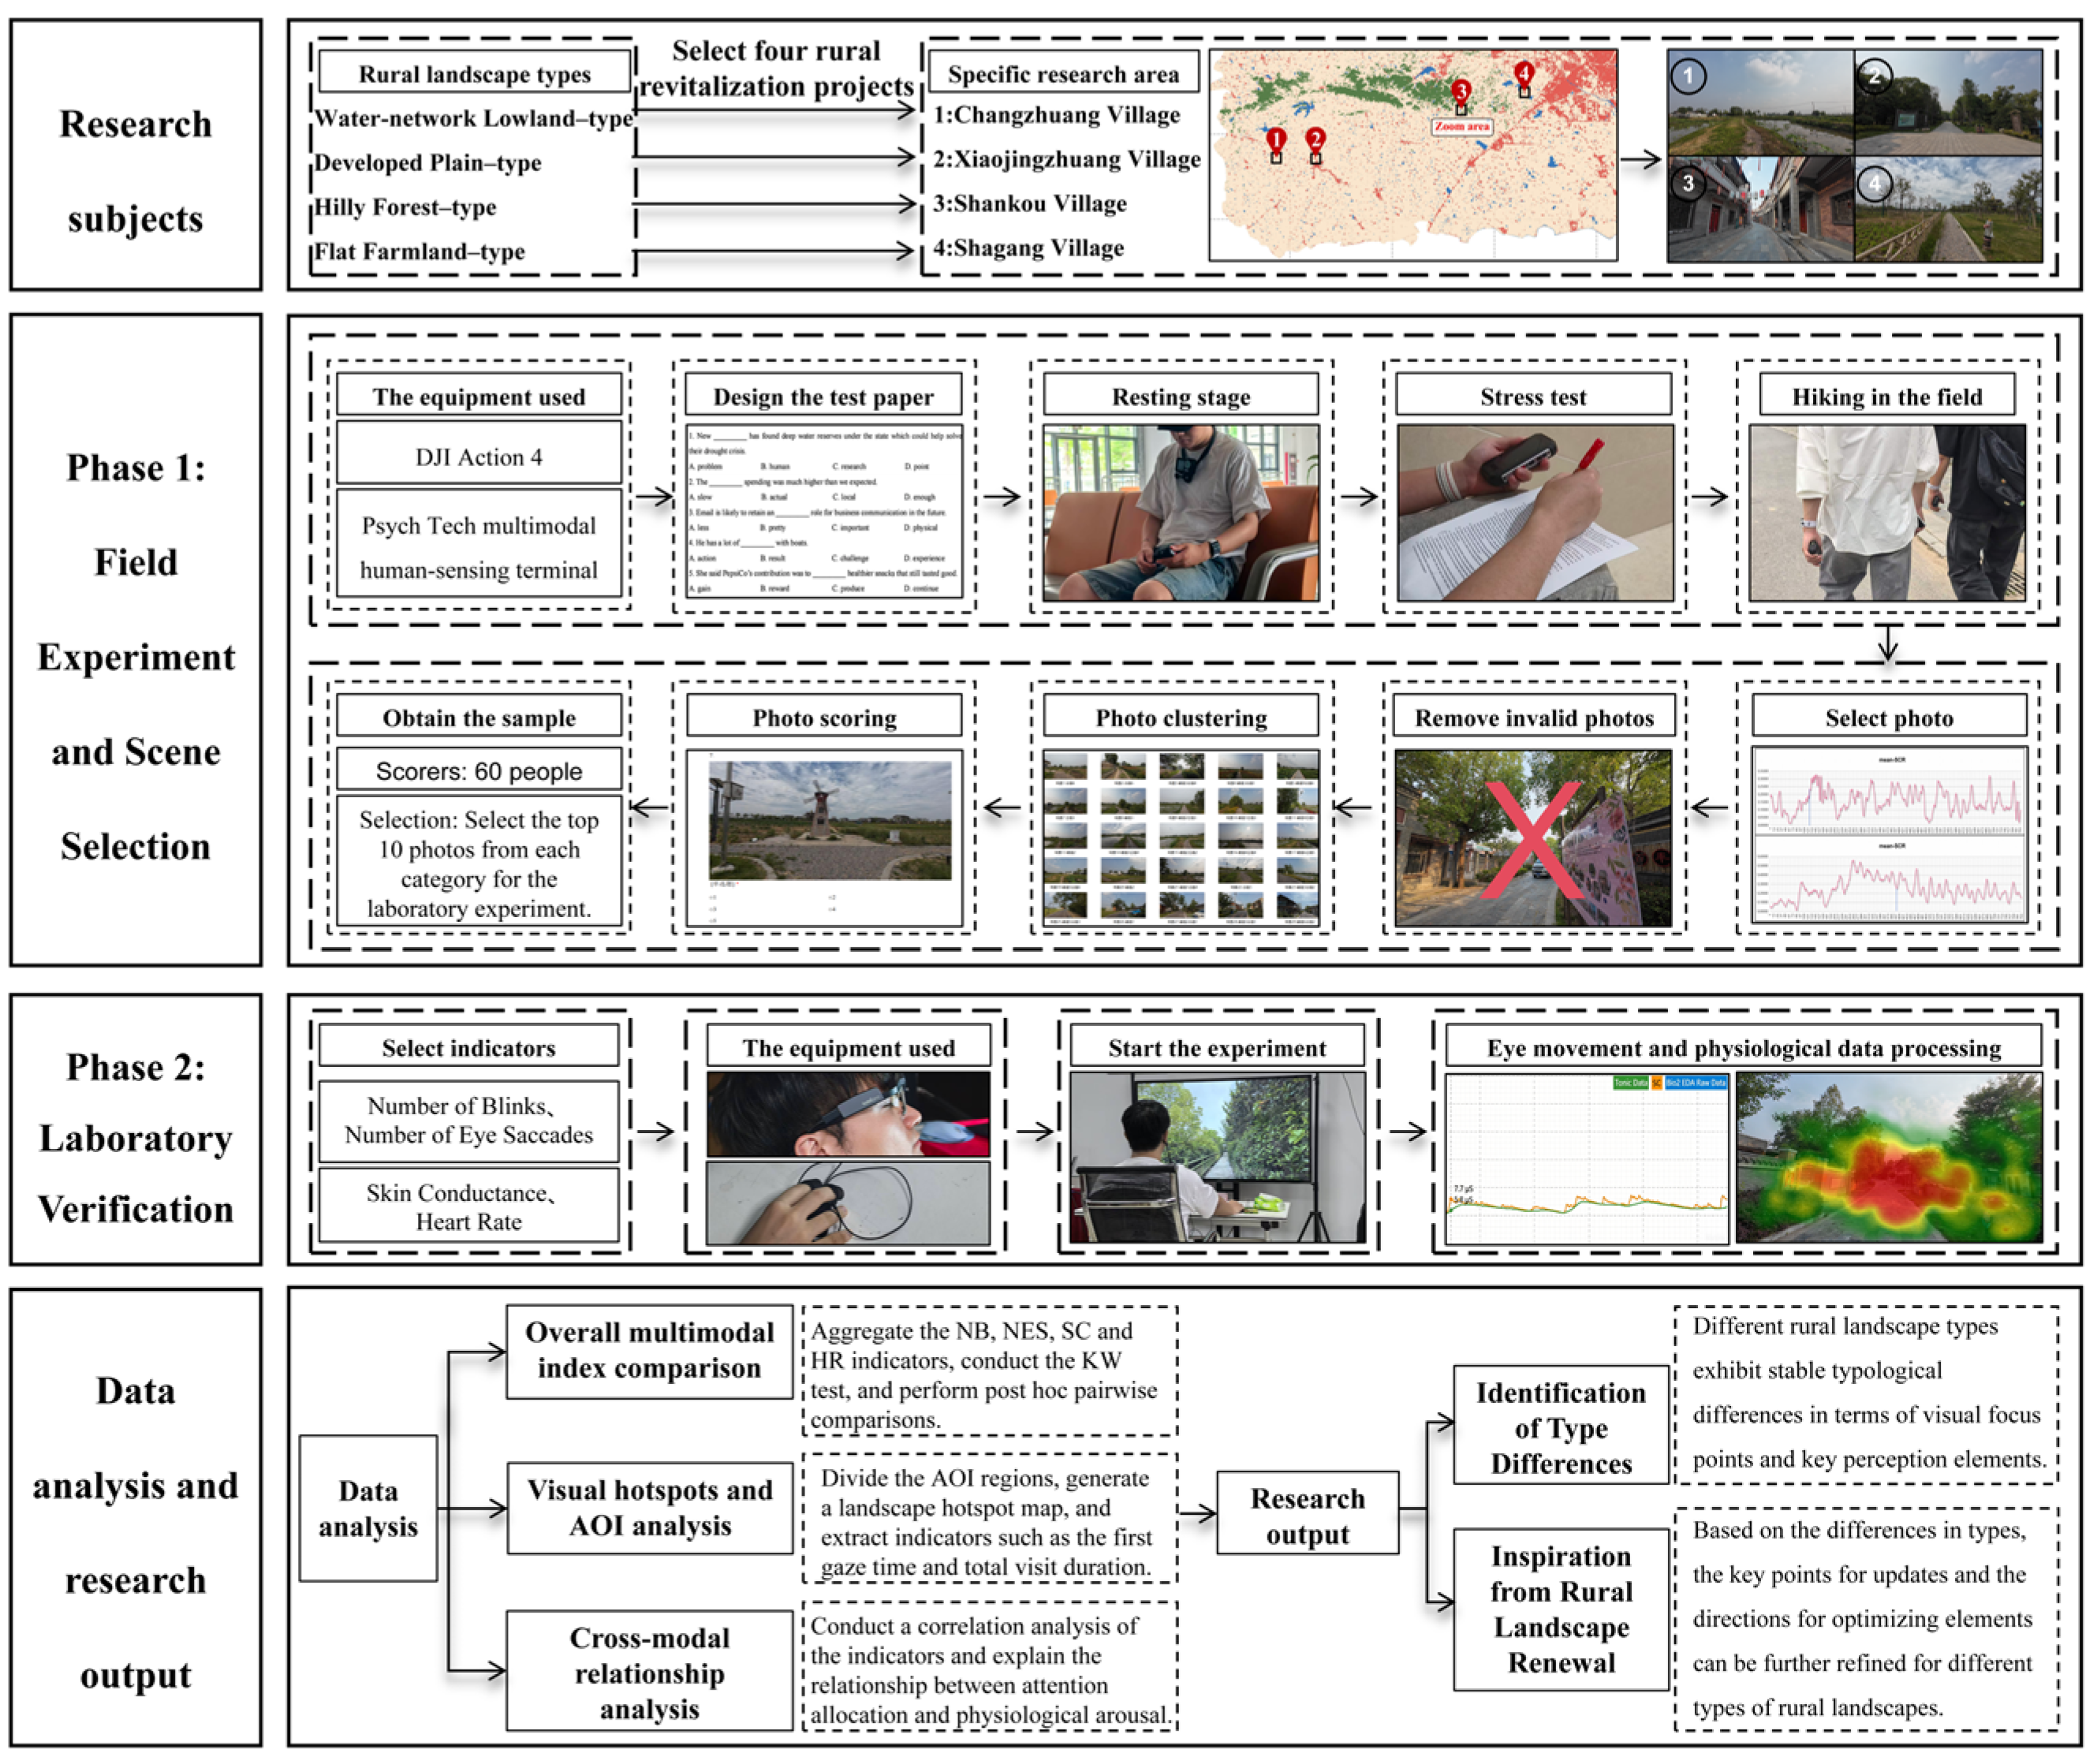
This study adopts a two-stage design of real-world scene screening followed by controlled laboratory validation. In Phase 1, SCR peaks and troughs were combined with synchronized video playback to identify candidate scene units during real rural walking. These candidate scenes were then screened through online ratings within each rural landscape type to generate representative stimulus materials.
In Phase 2, the selected scenes were presented under controlled laboratory conditions. Eye-tracking, SC, and HR data were collected simultaneously, and heatmaps and AOI analysis were used to describe hotspot locations, hotspot objects, and element-level attention allocation patterns. This design was intended to balance field realism and experimental control, but the findings should be understood as controlled comparative evidence based on representative scene materials rather than as a full reproduction of on-site experience (Figure 1).

2.1. Phase 1: Field-Based Stimulus Extraction

2.1.1. Study Sites and Participants

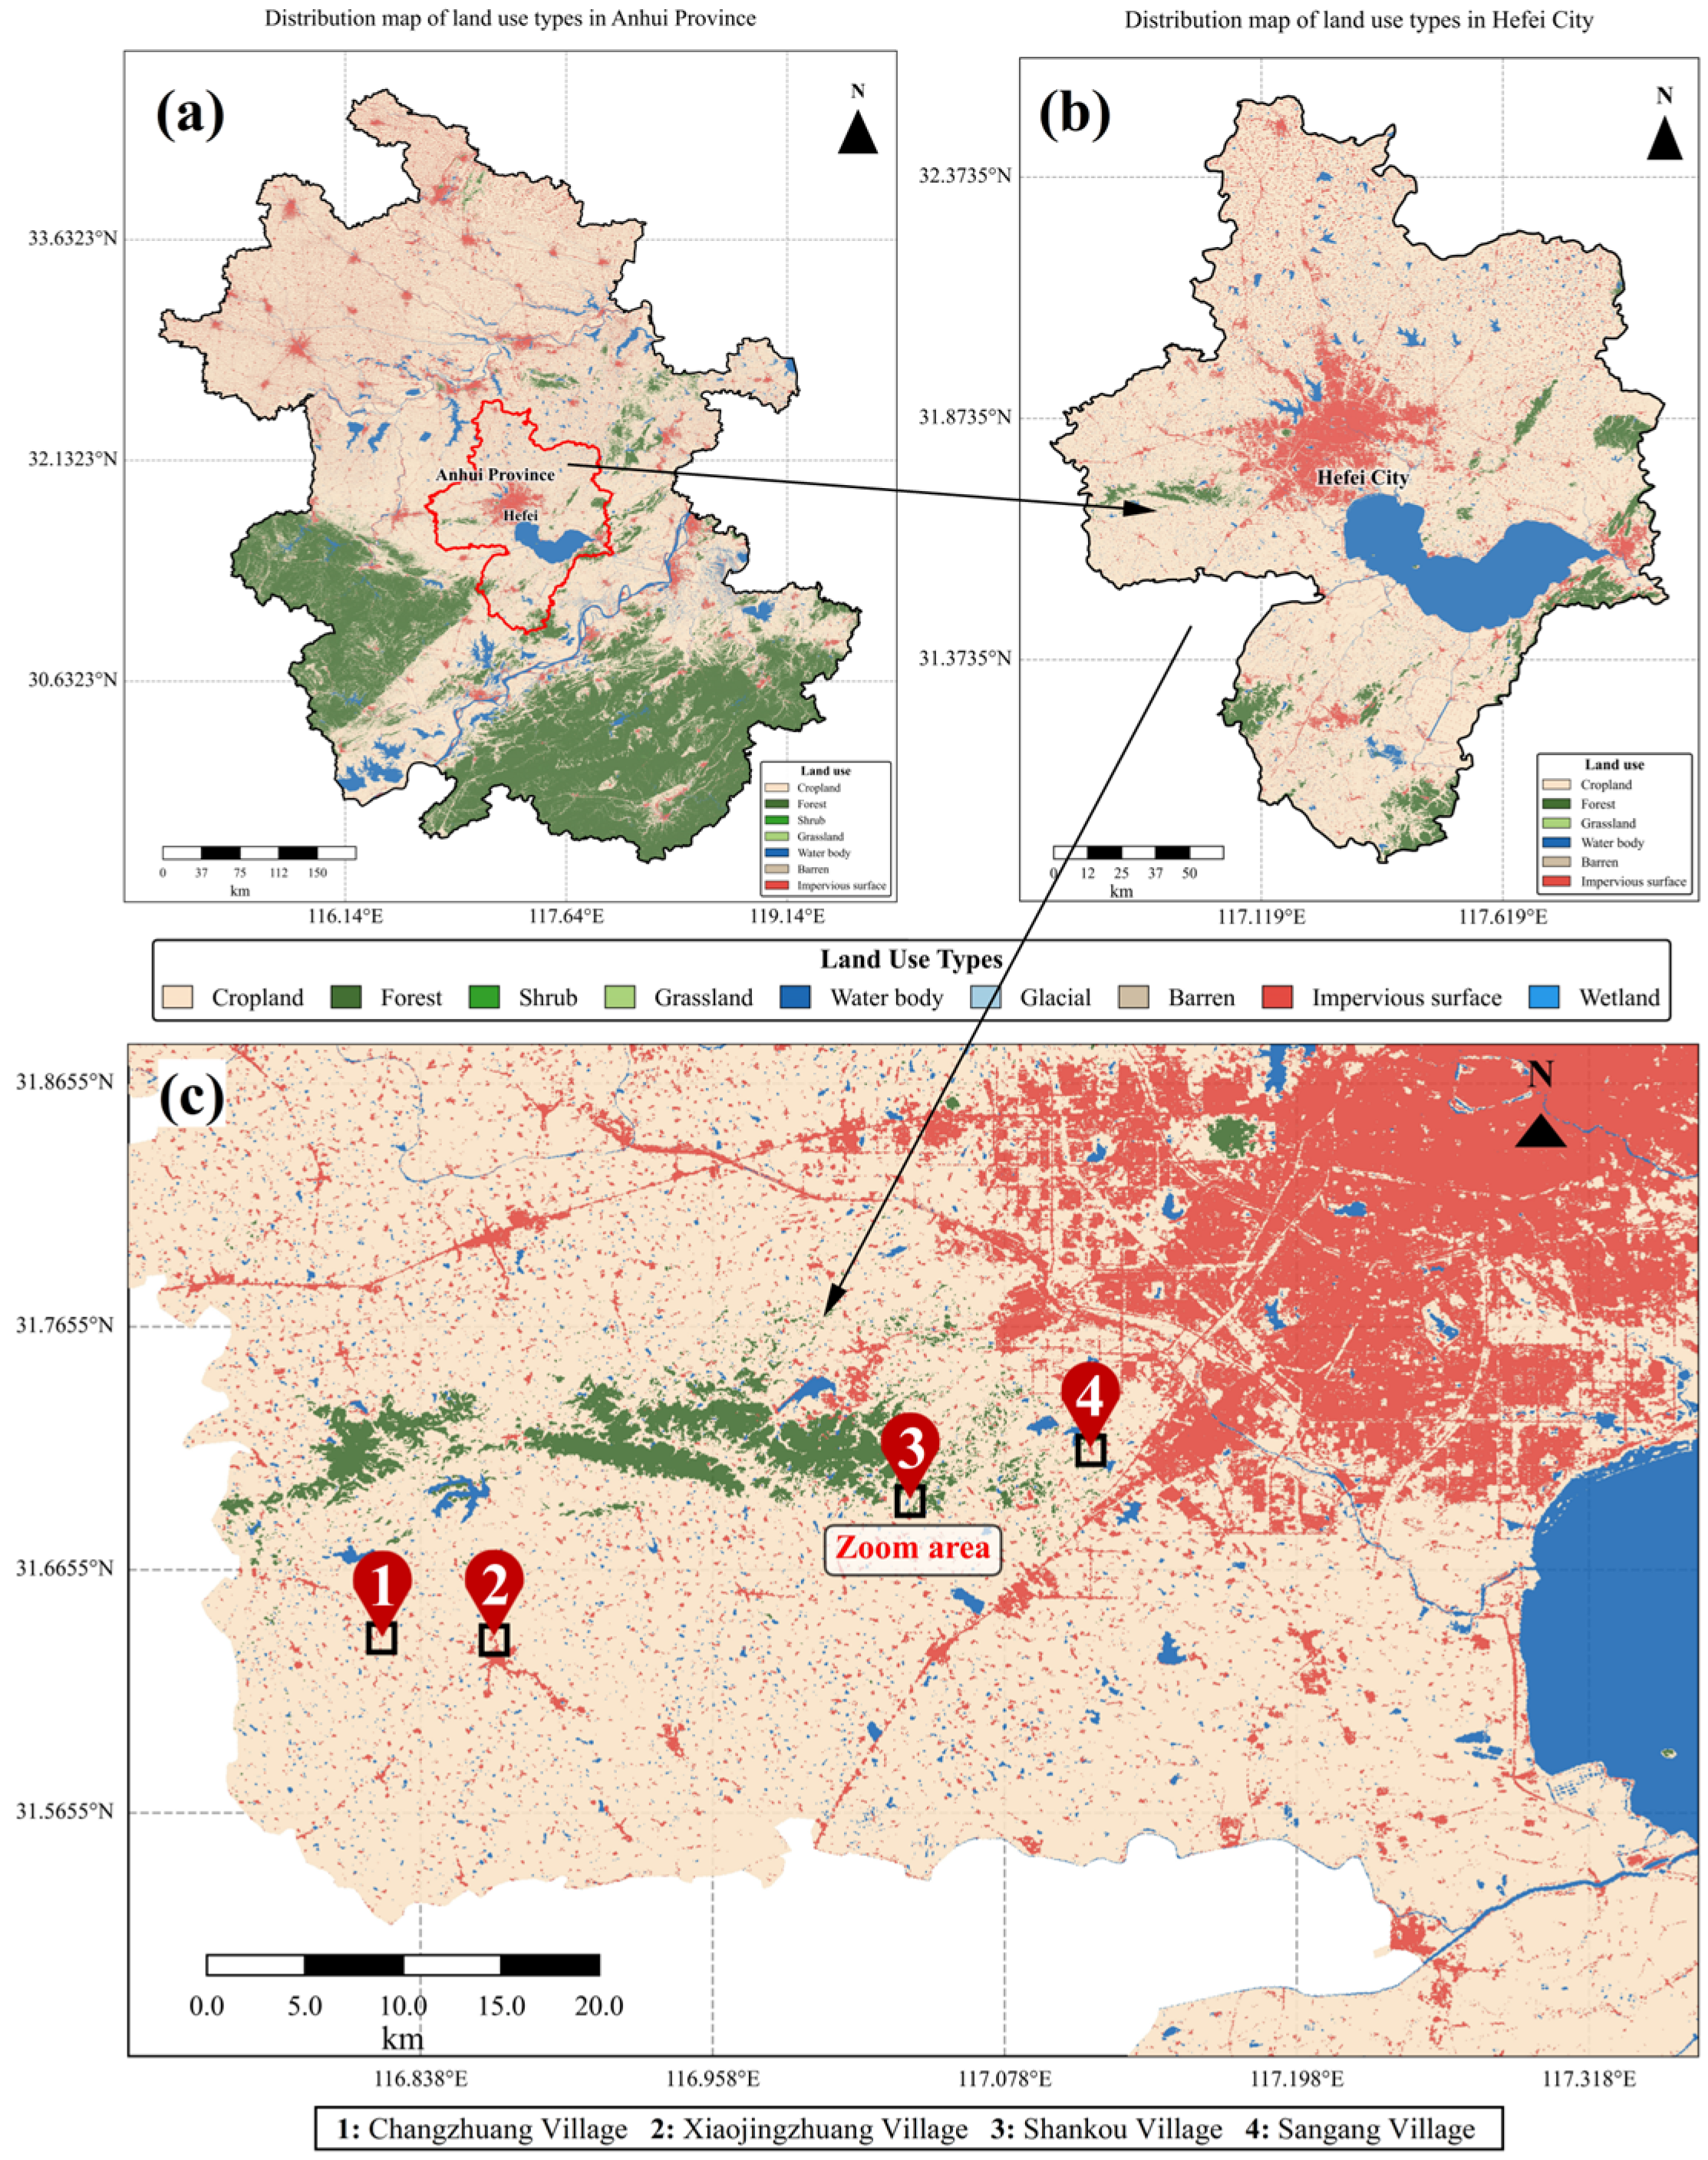
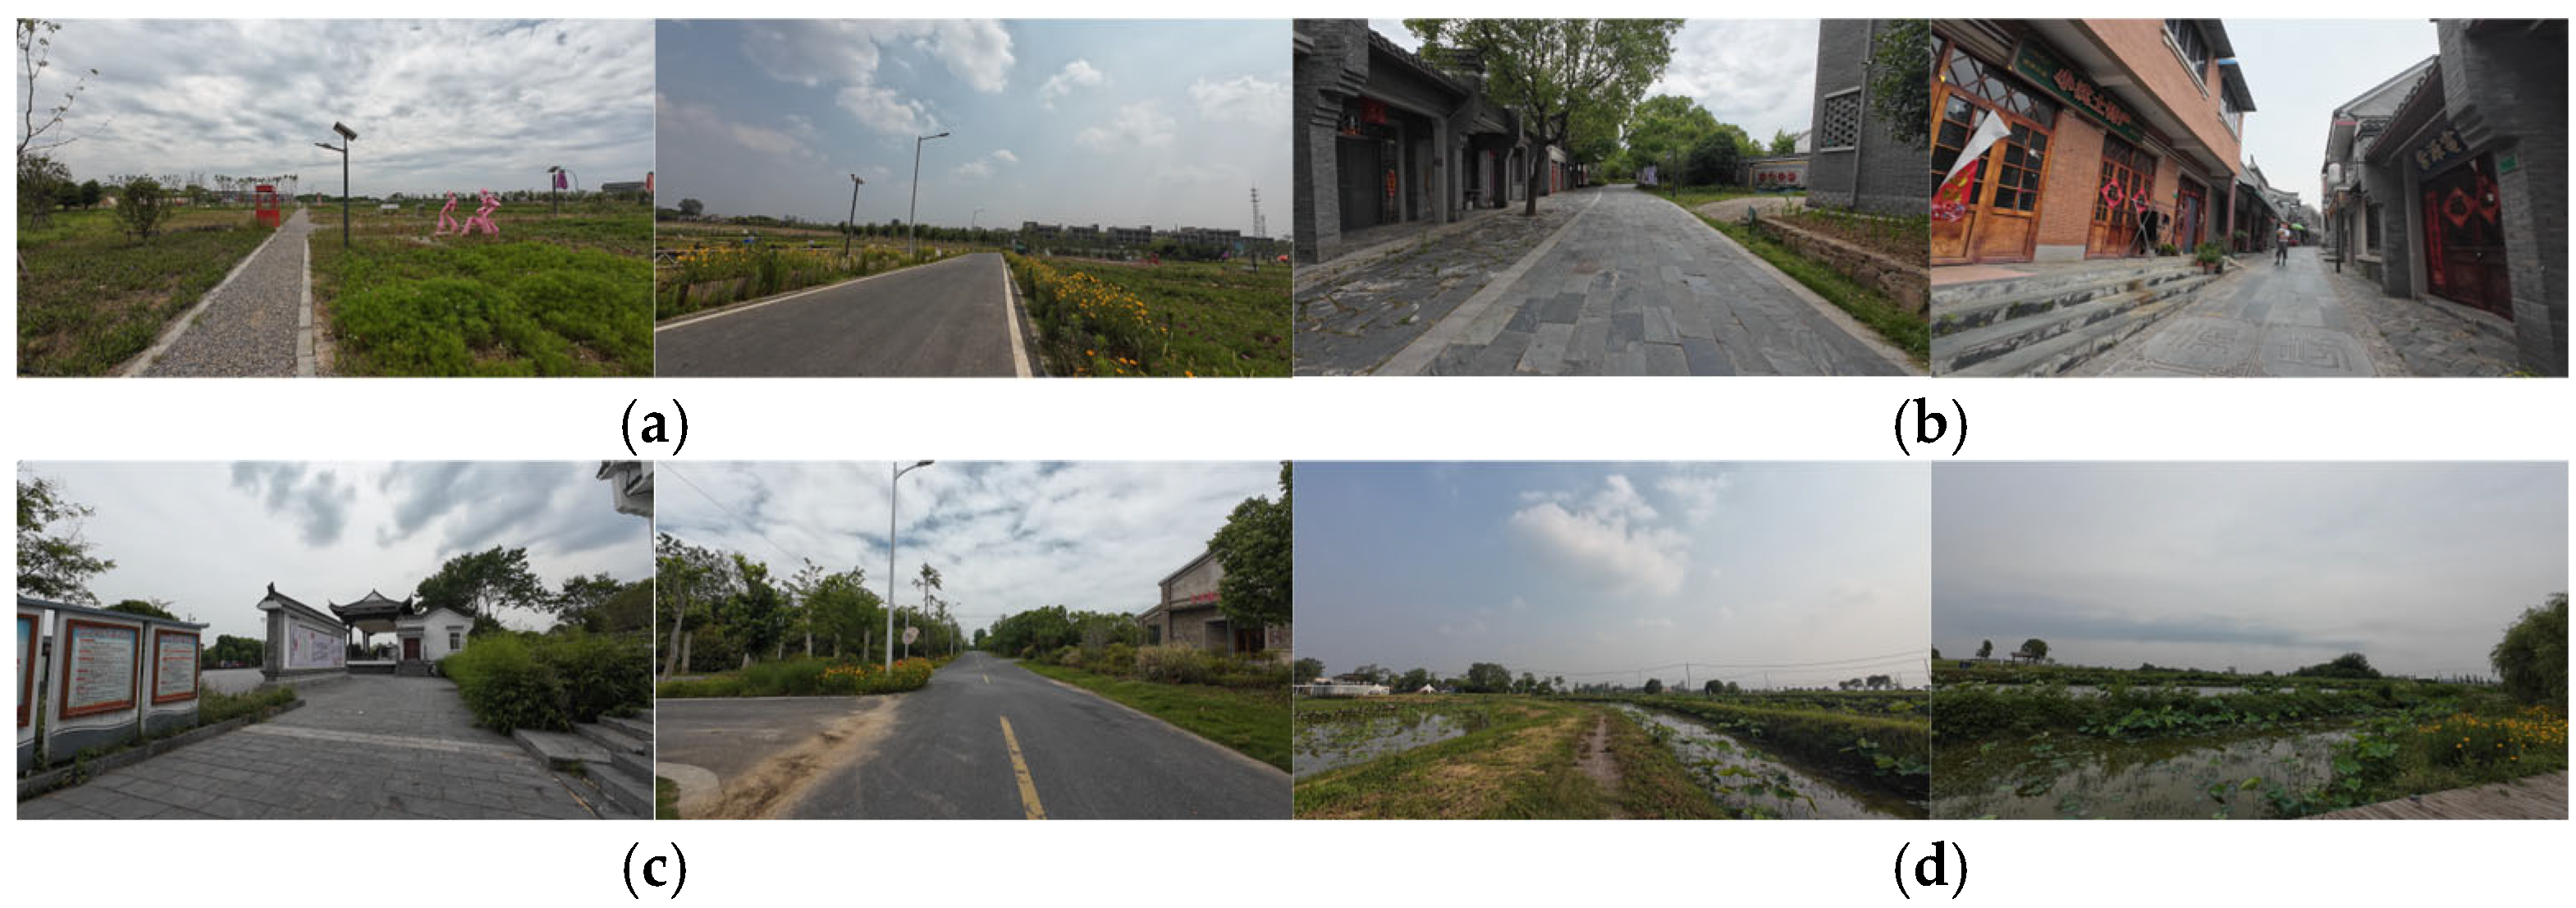
This study selected four representative rural revitalization project villages in the suburbs of Hefei as study sites. All four sites are situated within the broader context of rural revitalization and have undergone varying degrees of rural environmental improvement, landscape enhancement, or spatial renewal in recent years. They can therefore be treated as empirical cases of rural landscape renewal under the background of rural revitalization in China. The four sites were classified according to natural geography, industrial characteristics, and degree of urbanization: Sangang Village in Shangpai Town (Flat Farmland type, FF; Type A), Shankou Village under the Zipengshan Administrative Committee (Hilly Forest type, HF; Type B), Xiaojingzhuang Village in Shannan Town (Developed Plain type, DP; Type C), and Changzhuang Village in Shannan Town (Water-network Lowland type, WNL; Type D) (Figure 2 and Figure 3). Prior to the formal experiment, the research team conducted preliminary surveys and pilot observations in all four villages and selected one representative rural landscape route in each village [34]. The field experiment adopted a small-sample exploratory design [35]. Participants were 10 graduate students majoring in landscape-related fields at Anhui Jianzhu University (5 males and 5 females; see Supplementary Material S1). The main purpose of this stage was not to conduct formal statistical inference on the four rural landscape types, but to identify candidate scenes associated with group-level emotional fluctuations in real walking settings and to generate stimulus materials for the second-stage laboratory validation. The Phase 1 sample should therefore be understood as an exploratory sample used for candidate scene identification and stimulus construction, rather than as the primary sample for the final comparative analysis across types.

2.1.2. Equipment and Data Acquisition

Field SCR data were collected using the PsychTech multimodal human-sensing terminal (Beijing PsychTech Technology Co., Ltd., Beijing, China) to characterize transient arousal changes elicited by environmental stimuli [36]. Generally speaking, an increase in SCR indicates heightened arousal (including positive, negative, or neutral emotional stimuli), while a decrease in SCR indicates reduced arousal or overall relaxation in the subject [37]. A chest-mounted camera recorded video throughout the experiment, providing precise spatiotemporal alignment for the SCR data collected by the multimodal sensing device (Supplementary Material S2).

2.1.3. Field Procedure

The field experiment was conducted in May 2025. After informed consent was obtained and the equipment was fitted, participants underwent resting state baseline recording. A brief standardized cognitive task was then introduced to impose a certain level of cognitive load before the formal walking experiment, avoiding an abrupt transition from a low-arousal resting state to the subsequent walking process and improving procedural consistency at the beginning of the experiment. To examine the effect of the standardized cognitive task on participants’ initial arousal level before the formal walking experiment, mean-SCR values from the last 60 s of the resting stage and the last 60 s of the cognitive task stage were compared for each participant in the four villages. Because each data point represented 2 s, each stable end-window consisted of the last 30 data points. For each participant, the mean-SCR value over the final 60 s was calculated for both stages. The paired differences between the cognitive task stage and the resting stage were then tested for normality using the Shapiro–Wilk test. Paired-samples t-tests were used when the paired differences were normally distributed, whereas Wilcoxon signed-rank tests were used when the normality assumption was not met.
The mean-SCR values in the resting stage and the cognitive task stage were 0.0334 ± 0.0351 and 0.0562 ± 0.0672 in Sangang Village, 0.1008 ± 0.0923 and 0.1349 ± 0.0829 in Shankou Village, 0.0134 ± 0.0299 and 0.0240 ± 0.0353 in Xiaojingzhuang Village, and 0.1610 ± 0.1027 and 0.1736 ± 0.1093 in Changzhuang Village, respectively. In all four villages, mean-SCR was higher during the cognitive task stage than during the resting stage. The stage differences were not statistically significant in Sangang Village (Wilcoxon, p = 0.333), Shankou Village (paired-samples t-test, p = 0.194), Xiaojingzhuang Village (Wilcoxon, p = 0.959), or Changzhuang Village (paired-samples t-test, p = 0.696). Accordingly, this task was treated as a standardized cognitive load procedure introduced before the formal walking experiment, rather than as a stress induction procedure supported by significant physiological evidence.
Participants subsequently walked along a predetermined route at a constant speed while SCR and synchronized video data were recorded continuously. After the walk, all recordings were exported for further analysis. To minimize interference from diet, stimulants, social interaction, and fatigue, uniform protocols were established for the experimental schedule and procedures (Supplementary Material S3).

2.1.4. Stimulus Screening and Data Processing

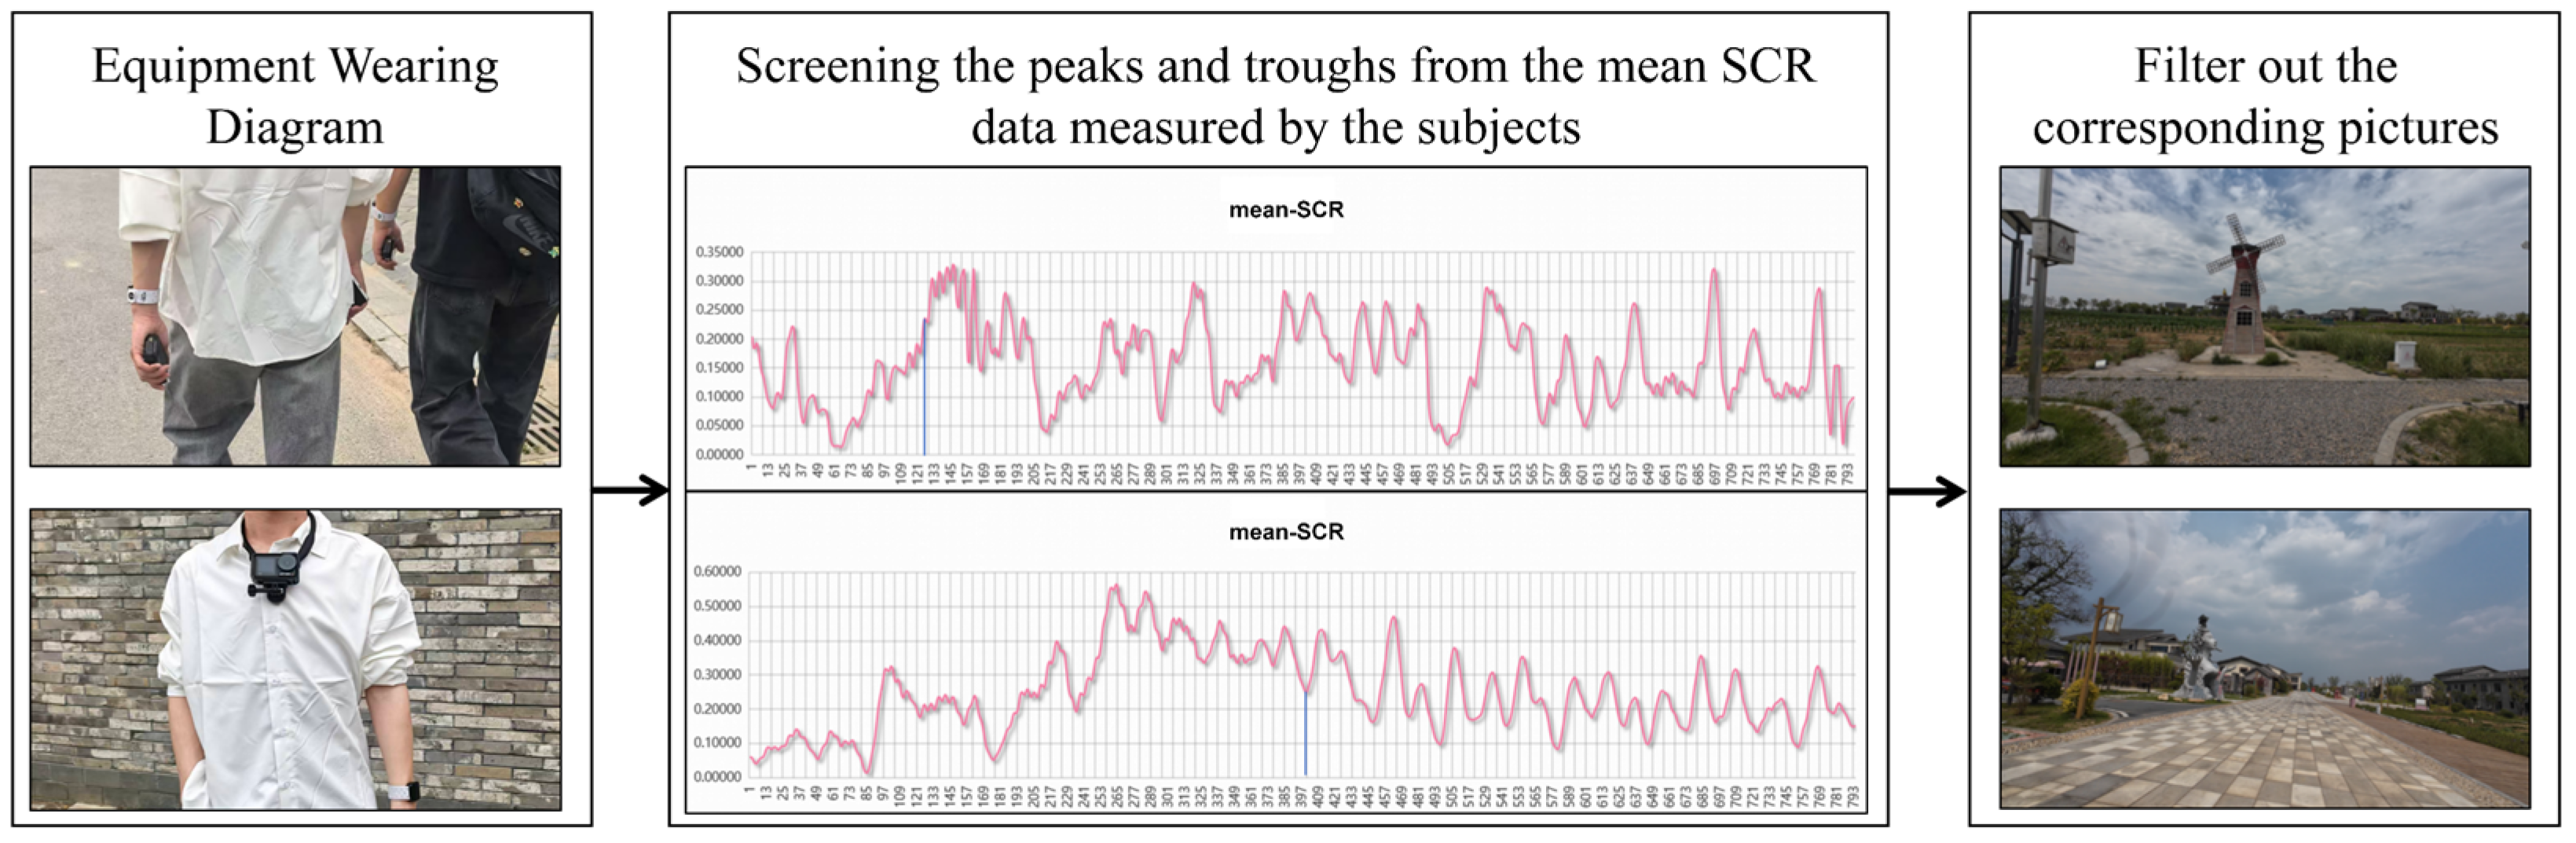
Because outdoor environments contain multiple uncontrolled sources of interference, SCR peaks and troughs were manually identified and verified in relation to the corresponding field scenarios [35].
In real walking settings, continuous walking itself may exert a background influence on SCR. Research on active travel and outdoor ambulatory measurement has shown that these physiological signals are often affected by physical exertion, walking speed, and environmental exposure at the same time [38]. Wearable EDA/SCR recording in dynamic settings is also susceptible to motion artifacts and noise interference [39]. Given these characteristics, this study did not attempt to isolate the continuous walking component from each individual peak. Instead, it reduced the influence of this potential confound through a preset route, a relatively consistent walking task, synchronized SCR and video recording, and the exclusion of discrete interference events that could be clearly identified. Therefore, Phase 1 SCR data were used to identify candidate scenes associated with group-level emotional fluctuations, rather than to make strict peak-by-peak causal attributions [40,41].
After data collection, landscape images corresponding to key fluctuation moments associated with SCR peaks and troughs were extracted from the synchronized video recordings (Figure 4). Peaks mainly corresponded to moments of increased arousal, whereas troughs reflected decreases in arousal or relatively relaxed states. Both were therefore used to characterize significant physiological fluctuations at the group level. These candidate images were then screened through questionnaire ratings to determine the final stimulus set for the laboratory phase (Supplementary Material S4).
In Phase 1, SCR peaks and troughs were used to identify candidate scene units associated with group-level emotional fluctuations and, after time-window clustering and deduplication, to form a candidate image pool. All candidate images were then rated on a 1–5 scale by 60 raters. Within each of the four rural landscape types, the images were ranked by mean score, and the 10 highest-scoring images in each type were retained, yielding the final set of 40 formal stimulus images used in Phase 2.

2.2. Phase 2: Laboratory Validation

2.2.1. Stimulus Materials

Phase 2 served as the formal laboratory validation stage and provided the main sample for the multimodal comparative analysis in this study. A total of 45 university students were recruited for this stage. After excluding invalid eye-tracking or physiological records, 40 valid participants were retained for the subsequent analysis. Compared with the small-sample exploratory screening design in Phase 1, Phase 2 carried the main analytical task of comparing differences in visual attention and physiological responses across the four rural landscape types under uniform stimulus conditions.
The second phase of the experiment was conducted using the 40 images selected in the first phase. The uppercase letters A, B, C, and D represent the four rural landscape types, namely FF, HF, DP, and WNL. Ten images were retained for each category and coded as A1–A10, B1–B10, C1–C10, and D1–D10, with a resolution of 1920 × 1080 pixels. After excluding invalid blank records, 40 valid stimulus images were retained for analysis.
Static images were used in Phase 2 to ensure uniform stimulus conditions for cross-type comparison. They provided consistent viewpoints, presentation durations, and compositions across participants and allowed the six AOI categories to be delineated using the same criteria, thereby improving comparability in typological and element-level analyses [42]. Phase 2 was designed to validate representative scenes under controlled conditions rather than to reproduce the full perceptual experience of on-site visits.
The laboratory experiment was conducted in the Landscape Ecology Laboratory of Anhui Jianzhu University [43]. At the landscape-element level, each image was coded into six AOI categories—vegetation, buildings, roads, sky, vernacular buildings, and water bodies—according to uniform criteria. The corresponding eye-tracking and physiological metrics were then extracted to compare differences across these six landscape-element categories under the four rural landscape types (Supplementary Material S1). In this article, the term “vernacular buildings” refers to vernacular architecture that is strongly associated with local identity and embodies local building traditions. Such structures typically feature local materials and traditional craftsmanship, and reflect local cultural wisdom and environmental adaptation [44]. By contrast, the term “buildings” refers to general buildings that do not possess the above vernacular characteristics, so as to avoid semantic overlap [45].

2.2.2. Equipment and Measures

(1)
Physiological indicators
Physiological data were collected using the ErgoLAB smart wearable physiological recorder (KingFar International Inc., Beijing, China). Skin conductance (SC) from the electrodermal activity (EDA) signal and average heart rate (HR) from the heart rate variability (HRV) signal were selected as physiological indicators [46,47].
(2)
Eye-tracking metrics
Eye-tracking data from participants were collected using the Tobii Pro Glasses 2 wearable eye tracker (KingFar International Inc., Beijing, China). Two eye-tracking metrics for the entire image and four local metrics for the AOI were selected for analysis (Table 1) [48].

2.2.3. Experimental Procedure

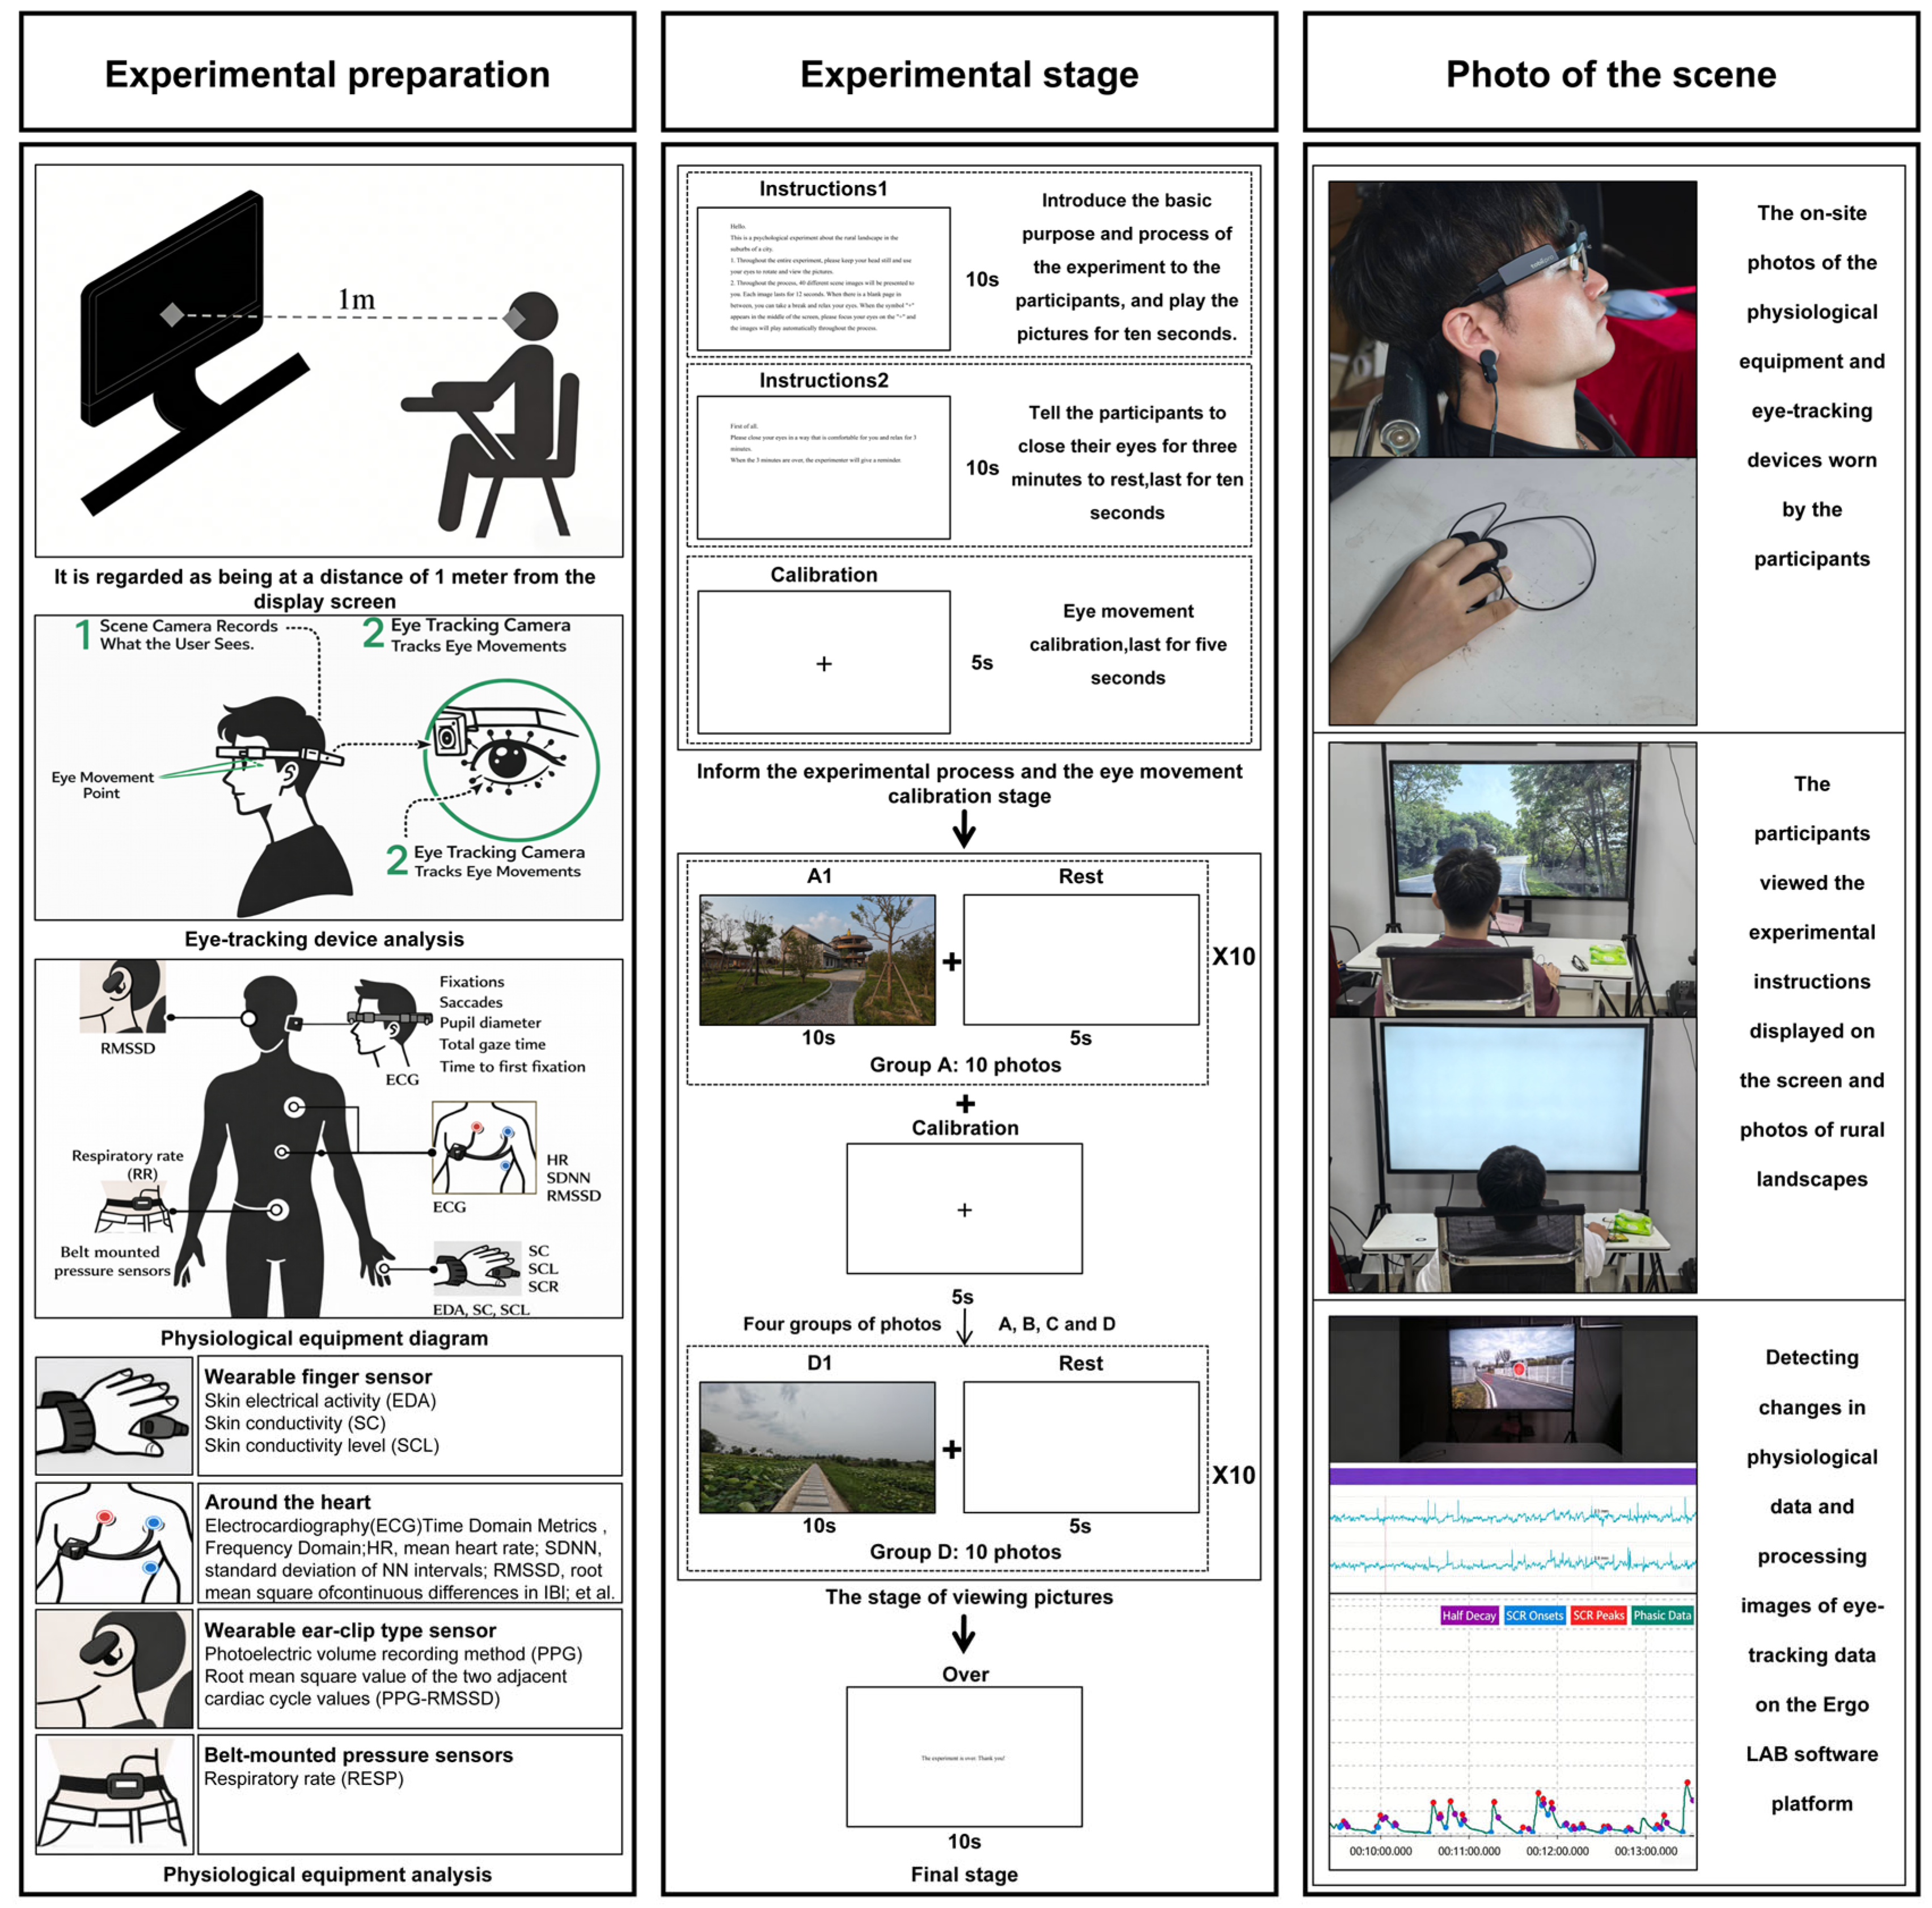
Prior to the experiment, participants were asked to arrive at the laboratory in advance to acclimate to the environment and to become familiar with the procedure. The experiment consisted of four phases: equipment fitting and calibration, baseline recording, stimulus presentation and data acquisition, and debriefing and data backup (Figure 5). During the measurement stage, the 40 images were presented in four blocks of 10, with each block corresponding to one rural landscape type. Each image was displayed for 10 s, with a 5 s blank screen inserted between adjacent images to reduce carryover effects from the preceding stimulus. To control primacy effects, recency effects, and block-order bias, the presentation order of the four blocks was counterbalanced using a 4 × 4 balanced Latin square design. Within each block, the 10 images were presented in a fixed numerical order. The eye tracker was recalibrated after each 10-image block to ensure recording stability (Supplementary Material S5).

2.2.4. Data Processing and Statistical Analysis

Eye-tracking and physiological data were processed and analyzed using the ErgoLAB 3.0 and IBM SPSS Statistics 27.0 platforms. Raw eye-tracking signals were denoised using a sliding-window filter [49]. Physiological signals were processed using high-pass, low-pass, and band-reject filters [50]. Data normality was examined using the Shapiro–Wilk test, and nonparametric statistical methods were adopted for variables that did not meet the assumption of normality.
The statistical analysis aimed to compare differences among rural landscape types at the stimulus level rather than to infer participant-level individual differences. Therefore, stimulus images were used as the basic unit of analysis, and the metrics for each image were aggregated across participants to yield 40 independent stimulus-level observations (10 per category). These observations were then used to compare the distribution of each metric across the four rural landscape types.
Under this statistical design, the findings primarily reflect differences among representative scene images across rural landscape types under controlled viewing conditions, rather than stable psychological traits or long-term perceptual processes at the individual level. Using stimulus images as the unit of inference improves the independence of typological comparisons, but it also limits the study’s ability to explain individual differences, within-group heterogeneity, and continuous psychological processes across stages.
Group differences were tested using the Kruskal–Wallis H test (α = 0.05), followed by post hoc pairwise comparisons when the overall test was significant [51]. Spearman rank correlation analyses were conducted between NB, NES and HR, SC using the 40 stimulus images as the statistical units. Gaze positions from all participants viewing the 40 images were visualized in ErgoLAB as heatmaps (red indicates high gaze density, yellow indicates moderate density, and green indicates low density) [52]. Regions of interest (AOIs) were defined in ErgoLAB, and the corresponding AOI metrics were extracted for analysis [53].

2.2.5. Ethics Approval and Informed Consent

The study was approved by the Science and Technology Ethics Committee of Anhui Jianzhu University. Written informed consent was obtained from all participants prior to data collection.

3. Results

3.1. Overall Differences in Eye-Tracking and Physiological Indicators

3.1.1. Differences in Eye-Tracking Indicators

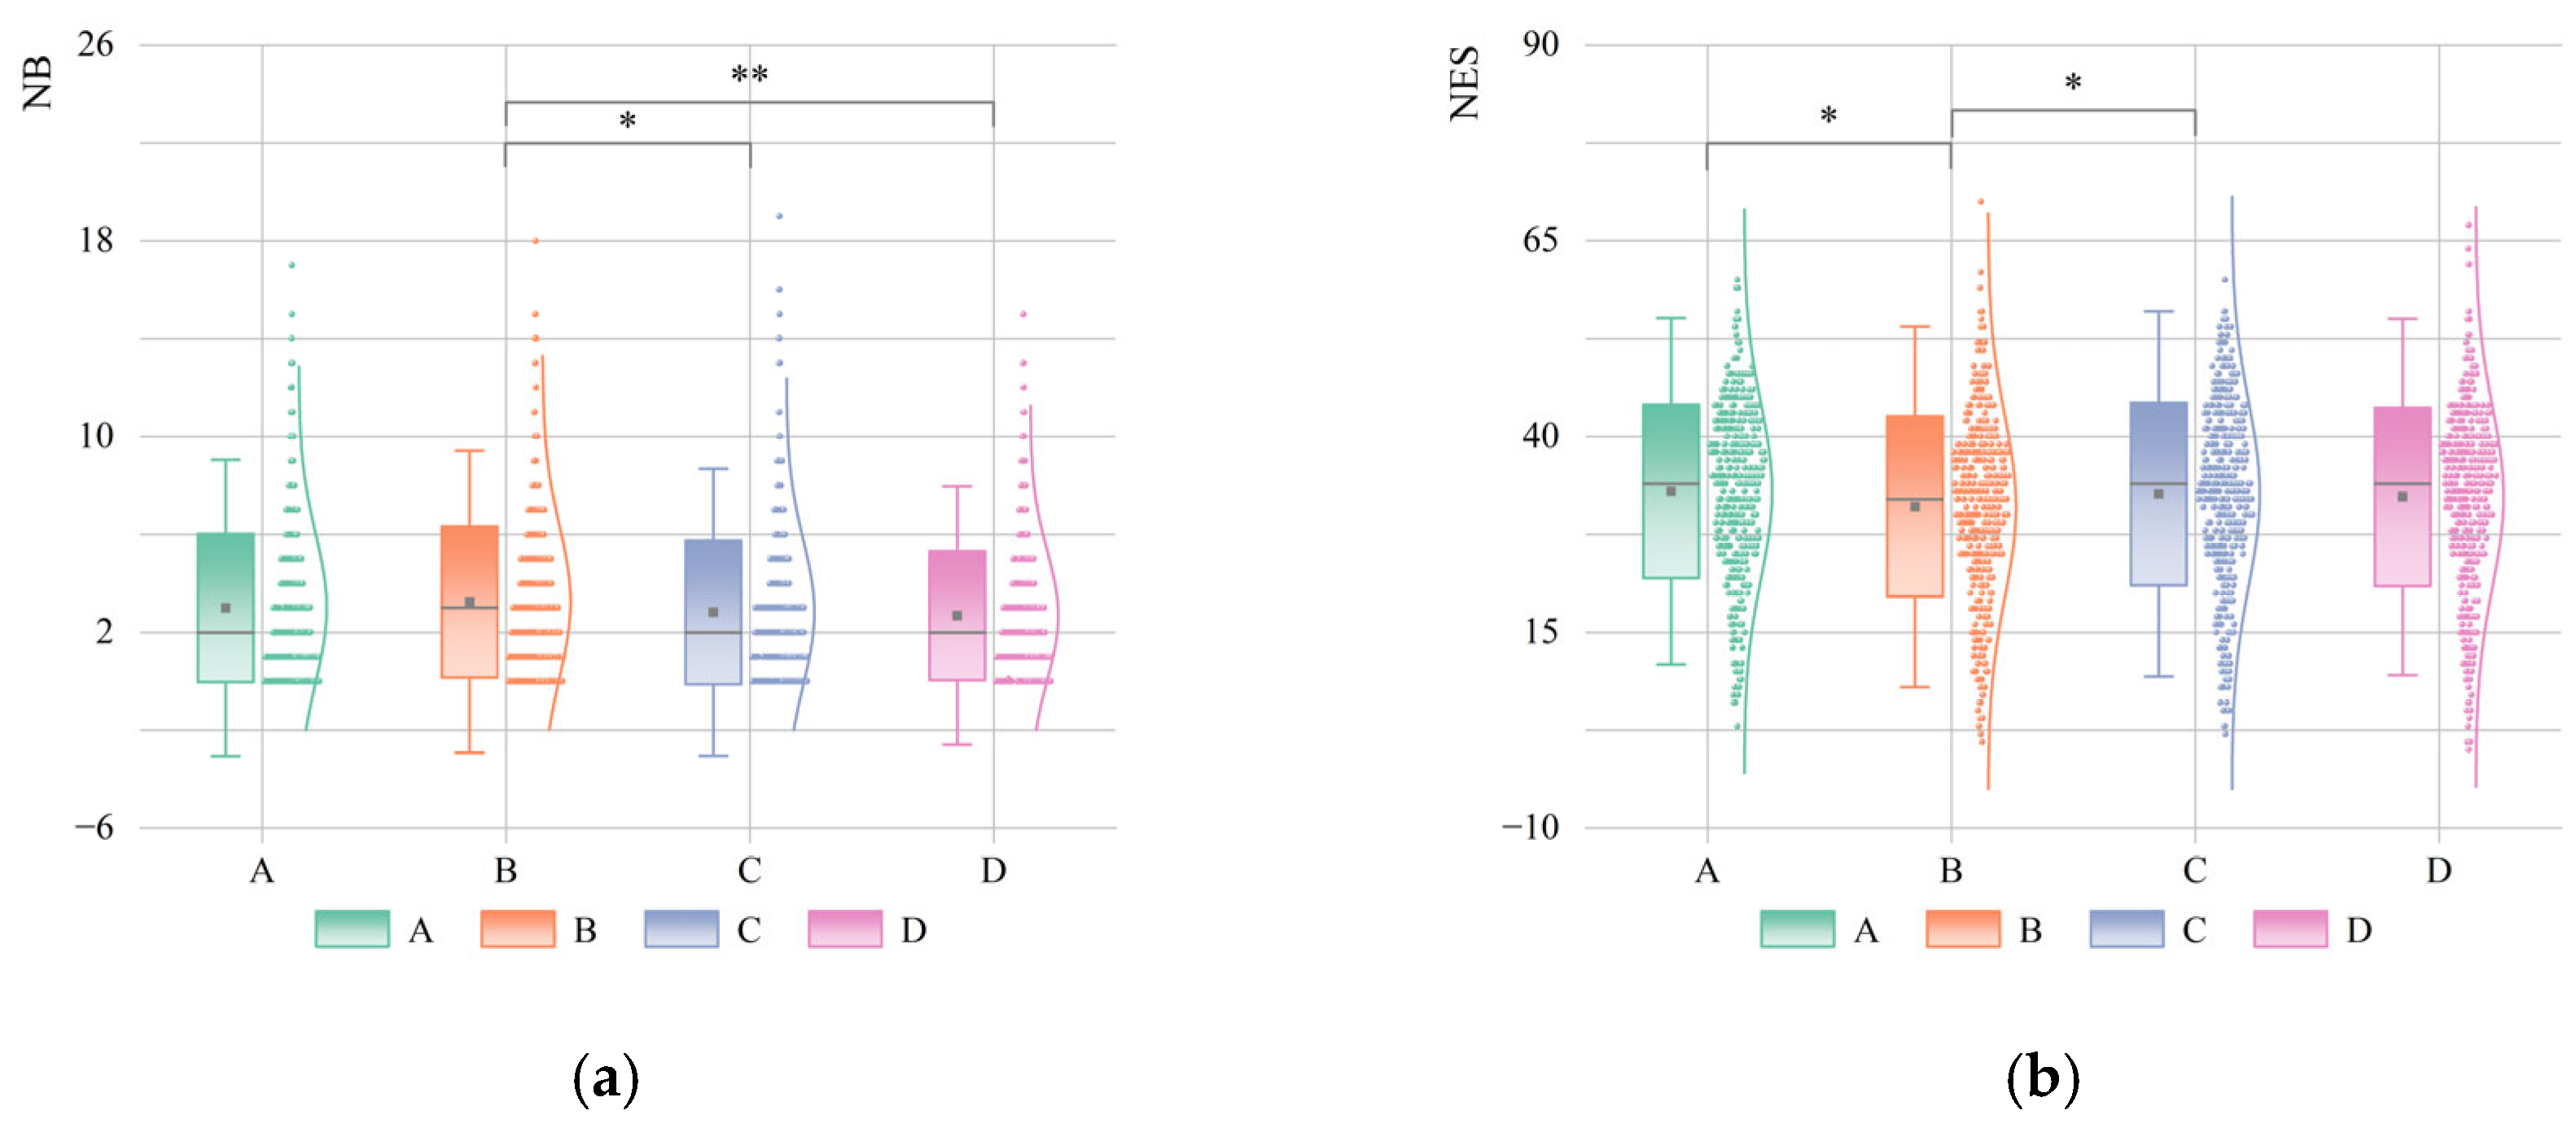
Significant differences were observed in both Number of Blinks (NB) and Number of Eye Saccades (NES) across the four rural landscape types (Figure 6). For NB, the overall difference among the four types was significant (p = 0.034). Pairwise comparisons showed that HF had a significantly higher NB than DP (p = 0.042) and a highly significantly higher NB than WNL (p = 0.005). For NES, the overall difference was also significant (p = 0.049). Pairwise comparisons indicated significant differences between FF and HF (p = 0.014) and between HF and DP (p = 0.048). These results suggest that the four rural landscape types differ in overall visual search organization under the same stimulus-viewing conditions.

3.1.2. Differences in Physiological Indicators

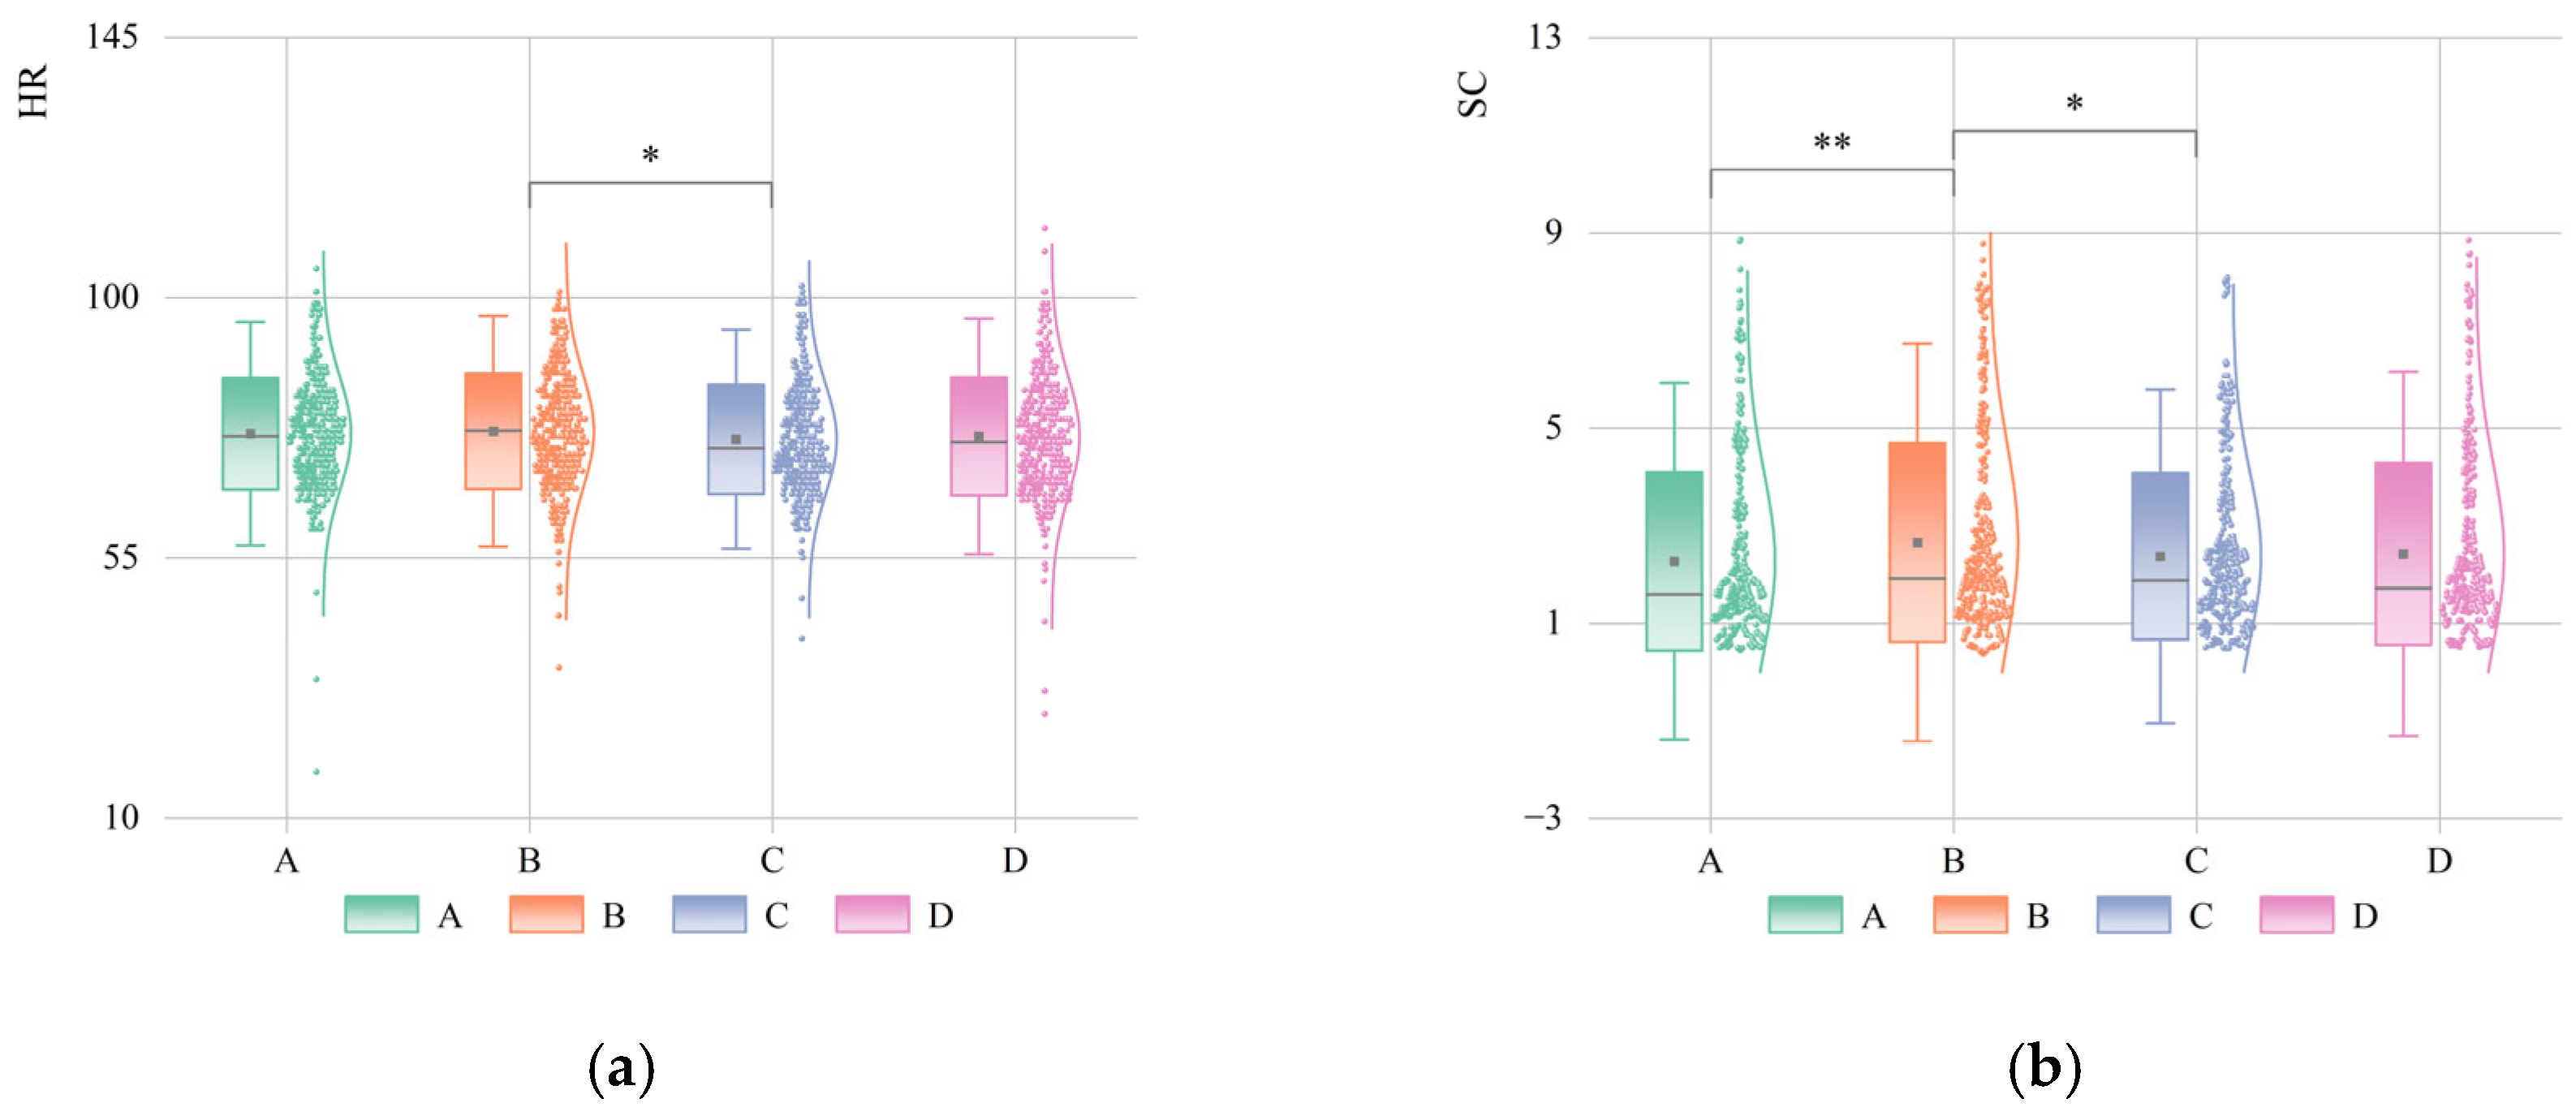
Significant differences were also found in the physiological indicators across the four rural landscape types (Figure 7). For heart rate (HR), the overall group difference was significant (p = 0.049), and post hoc comparisons showed a significant difference between HF and DP (p = 0.044). For skin conductance (SC), the overall difference among the four types was significant (p = 0.014). Pairwise comparisons indicated a highly significant difference between FF and HF (p = 0.005) and a significant difference between HF and DP (p = 0.030). These findings indicate that different rural landscape types can elicit distinguishable autonomic responses under controlled laboratory conditions.

3.1.3. Associations Between Eye-Tracking and Physiological Indicators

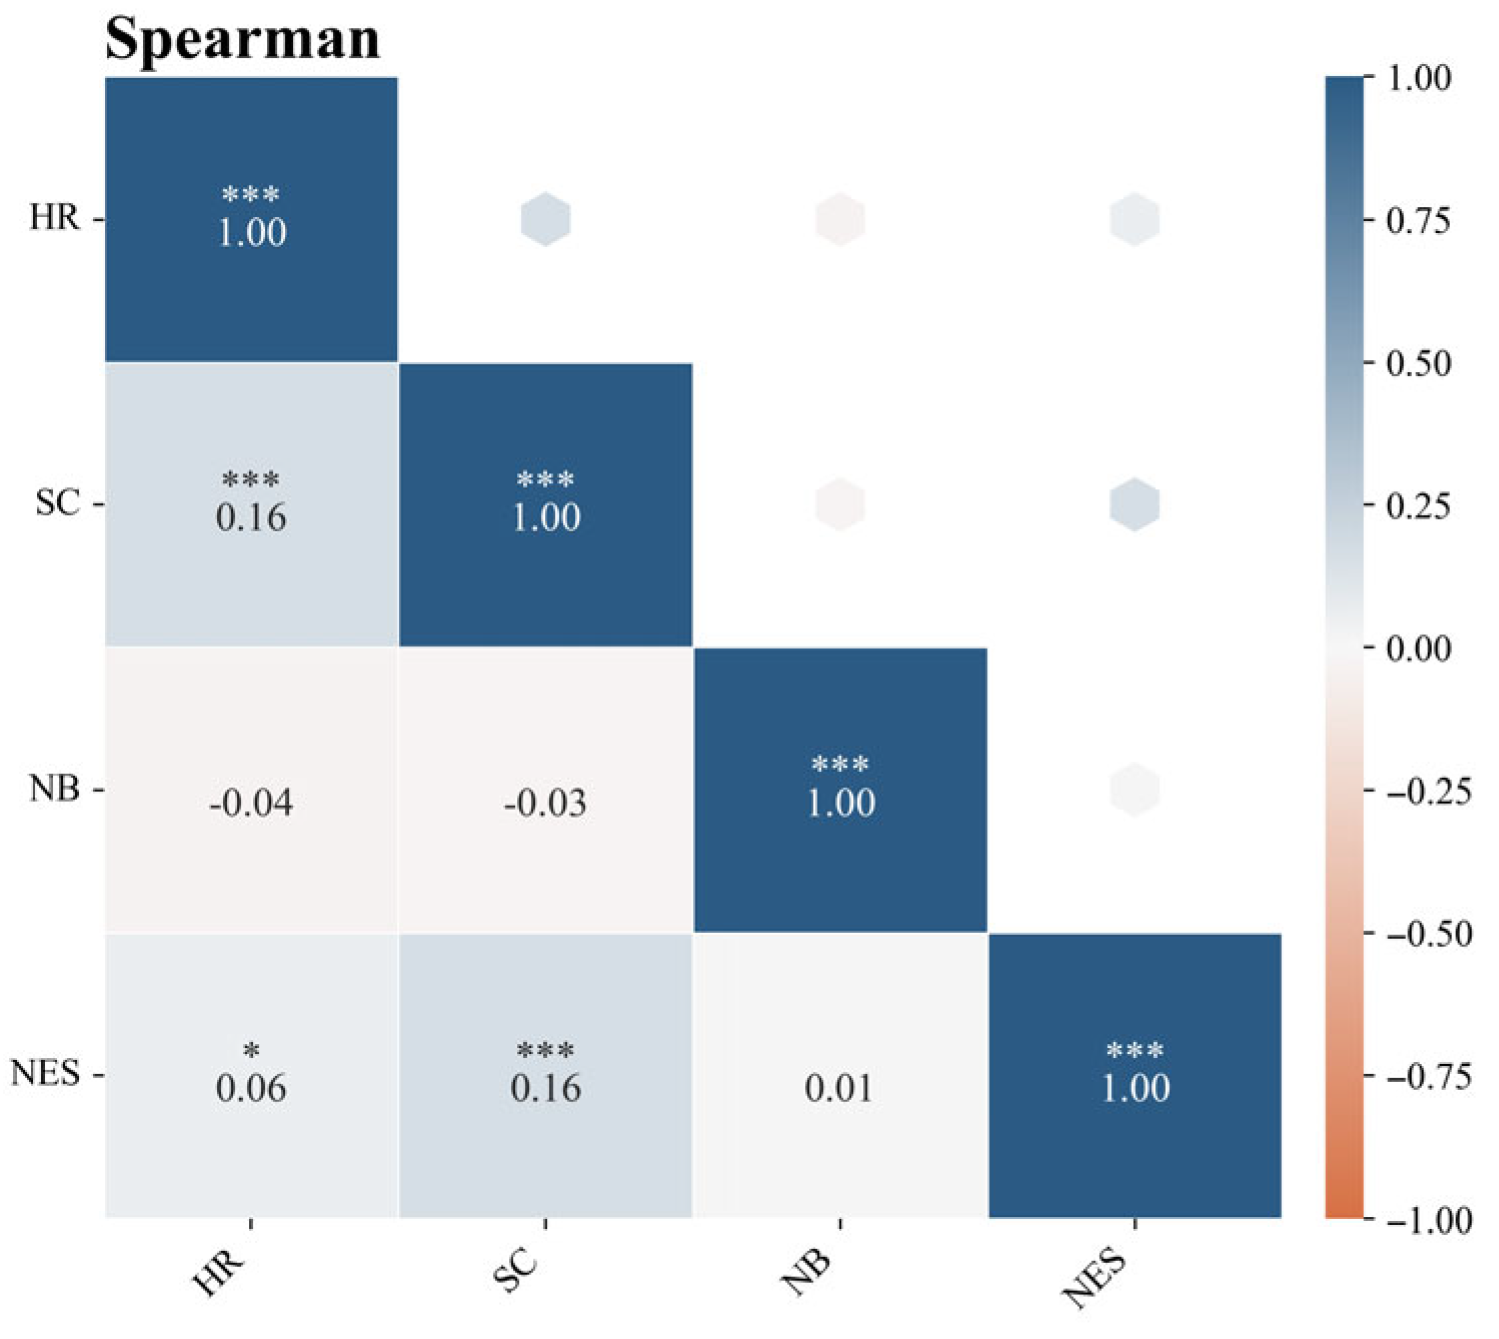
To further examine the cross-modal relationships between eye-tracking and physiological measures, this study conducted Spearman rank correlation analyses between NB, NES and HR, SC using the 40 stimulus images as the statistical units (Figure 8). The results showed a significant positive correlation between NB and HR (ρ = 0.39, p < 0.05) and a significant negative correlation between NES and SC (ρ = −0.46, p < 0.01). By contrast, the correlations between NB and SC and between NES and HR were not statistically significant. These findings indicate that the relationships between eye-tracking and physiological measures are not uniformly consistent, but instead show selective associations among specific indicators.

3.2. Type-Specific Patterns of Visual Attention

3.2.1. Distribution of Visual Hotspots Across Rural Landscape Types

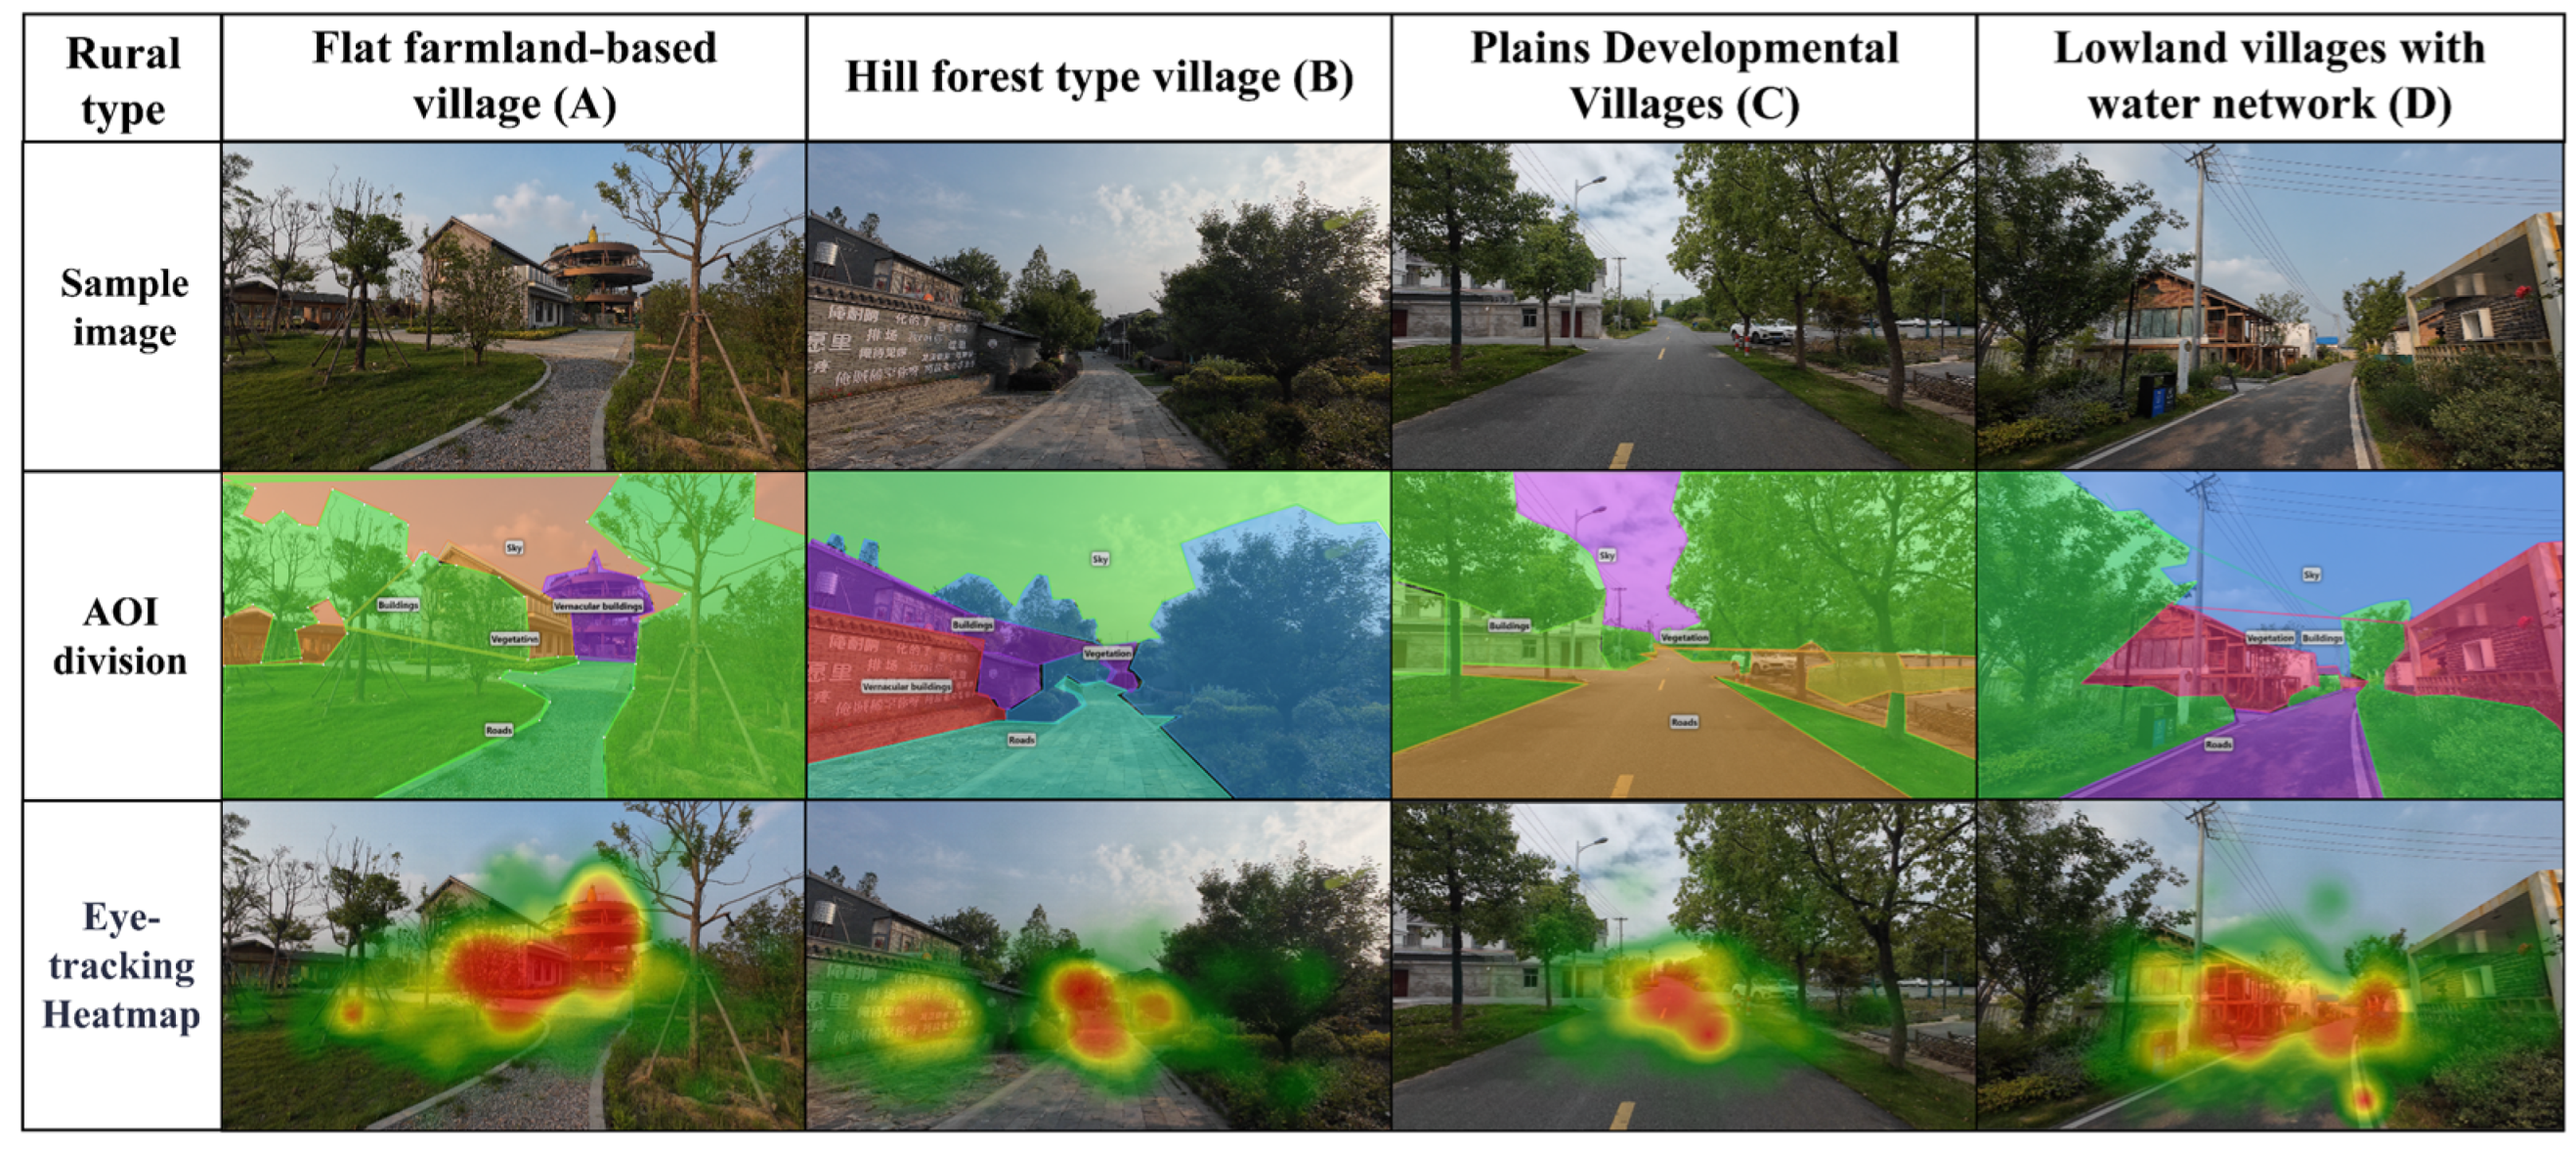
Figure 9 shows clear differences in the distribution of gaze hotspots among the four rural village types. Overall, gaze hotspots were concentrated mainly in the foreground and midground, especially around easily identifiable objects and their immediate surroundings, whereas those in the sky were sparse and scattered.
In type A, gaze hotspots were concentrated mainly on vernacular buildings and their adjacent areas, with secondary hotspots appearing at the tops of vegetation and along field edges. Hotspots related to roads formed band-like patterns along the direction of travel and were often located along road centerlines or at turning points. By contrast, hotspots in buildings were fewer and more locally distributed.
In type B, hotspots were concentrated at key points along the facades of buildings and along the visual perspective lines of streets and alleys. In some scenes, vernacular buildings also attracted dense hotspots. Vegetation hotspots were located mainly near tree canopies and forest edges. Hotspots related to roads appeared in linear or block-like patterns and were typically found near entrances to buildings or major turning points.
In type C, hotspots were primarily distributed at road intersections and their vicinity, forming concentrated hotspots at facilities along the routes; vegetation hotspots mostly appear in tree canopies, shrub edges, and at the junctions with roads or structures; buildings form secondary hotspots in some scenes.
In type D, hotspots were primarily concentrated in water-related areas, particularly nearshore water surfaces, floating and emergent vegetation zones, and the water–land interface; vegetation hotspots are mostly concentrated in prominent areas such as shoreline thickets, shrubbery, and isolated tree canopies; road hotspots still exhibit a strip-like distribution along the direction of travel; distinctive structures exhibit higher-density hotspots at local nodes; architectural hotspots are generally weak and occur primarily in localized areas; there are few hotspots in the sky region.

3.2.2. AOI-Based Differences Across Landscape Elements

Table 2 presents the distribution of AOI metrics for six landscape elements across the four rural landscape types mainly in the form of descriptive statistics. The occurrence of AOI categories was not fully consistent across stimulus images, and some landscape elements were absent from certain image types. For this reason, no unified significance testing was conducted for all AOI indicators. Instead, the mean distributions were used to identify attention allocation patterns at the landscape-element level across different rural types and to provide supplementary evidence for the typological comparison.
Across the six AOI categories, the mean distributions showed different attention allocation patterns among A, B, C, and D. For vegetation, A showed longer first fixation time than C and higher average gaze duration than B and C, whereas C showed higher total visit duration than D and higher inspection count than A. For buildings, C showed longer first fixation time than D, D showed higher total visit duration than C, and B showed higher average gaze duration and inspection count than C. For roads, D showed longer first fixation time than C, B showed higher total visit duration and inspection count than D, and C showed higher average gaze duration than D. For sky, C showed longer first fixation time than D, whereas D showed higher total visit duration and inspection count than C and higher average gaze duration than B. For vernacular buildings, B showed longer first fixation time than A, A showed higher total visit duration and inspection count than D, and C showed higher average gaze duration than D. For water bodies, A showed longer first fixation time than D, whereas D showed higher total visit duration, average gaze duration, and inspection count than C. These descriptive patterns should be interpreted together with Table 2, because some AOI categories were absent from certain stimulus types and were therefore not included in all comparisons.

4. Discussion

4.1. Typological Differences in Overall Visual Search

This study found that different rural landscapes elicit distinct patterns of visual search organization; significant differences were detected in both Number of Blinks and Number of Eye Saccades (p < 0.05), with the differences being particularly pronounced in comparisons between HF and other types. This indicates that the rural landscape does indeed alter overall search rhythms and search organization. Generally, saccades reflect the process characteristics of visual search and scanning, whereas blinking is more closely associated with attention maintenance, visual comfort, or information processing states; however, its significance varies depending on the task and stimulus material [54]. This study detected significant differences even in experimental conditions involving static images and timed viewing, suggesting that overall eye-tracking metrics are context-dependent with respect to stimulus presentation and viewing tasks. This implies that the interpretation of overall eye-tracking differences must take into account both the stimulus medium and the viewing context, which is consistent with findings showing that the relationships among eye-tracking metrics change in dynamic contexts [55].
Furthermore, this study found that heatmap hotspots were predominantly concentrated around easily identifiable objects in the foreground and midground, as well as their boundary regions. Additionally, HF more frequently formed distinct hotspots at settlement interface details and spatial transitions, and exhibited more pronounced differences in search organization across overall metrics. This suggests that interface details and spatial transition cues may trigger more sustained search behavior and phased information processing. This is consistent with the conclusion drawn from studies of historic districts that the more complex and dispersed the elements of an interface are, the longer it takes to recognize them [56]. Furthermore, the AOI results from this study indicate that the average gaze duration and number of gazes directed at building elements vary across different types, with the hilly forest type exhibiting higher values; the hotspots on the heatmaps are also more concentrated on the facades of settlements. This suggests that in some types, gaze patterns are driven either by general buildings or by vernacular buildings, depending on the scene composition, which is consistent with the conclusion that the form and arrangement of buildings can significantly alter visual preferences and gaze distribution [57].
In this study, significant differences were primarily observed in process-based eye-tracking metrics such as NB and NES, whereas the patterns of significant differences in physiological arousal metrics such as HR and SC were not entirely consistent. This suggests that the experiential dimensions reflected by different metrics do not correspond one-to-one, and that overall differences in eye-tracking patterns do not equate to differences in preference. This finding is consistent with previous research on traditional village tourism, which has shown that the relationship between eye-tracking metrics and emotional experiences exhibits specific characteristics and is influenced by landscape type; thus, a single eye-tracking metric cannot simply be used to substitute for judgments regarding experience [58].

4.2. Typological Differences in Physiological Arousal

This study found that there were significant differences in both HR and SC across the four rural landscape types (p < 0.05). Specifically, the difference in HR was more pronounced between HF and DP, while the difference in SC was more evident among FF, HF, and between HF and DP. This indicates that visual stimuli from different rural landscape types elicit varying levels of autonomic nervous system arousal, and differences in landscape environments can translate into detectable physiological arousal differences. Furthermore, this study found that significant changes in HR and SC did not occur simultaneously across all comparison groups, suggesting that different physiological indicators may exhibit varying sensitivities to the same visual stimulus. This result is consistent with findings from studies on the restorative effects of waterfront environments, in which significant differences were found in subjective evaluations, whereas SCR and HRV showed no significant differences. This suggests that the sensitivity of physiological indicators is influenced by context and measurement methods [59].
In interpreting these indicators, this study found that although differences in arousal between conditions could be detected, the indicators did not always change in parallel, which suggests that physiological signals can be ambiguous. This interpretation is consistent with studies on forest transparency showing that changes in pupil diameter may reflect cues related to safety or stress, rather than attraction to the landscape itself [60]. In addition, this study suggests that, when interpreting SC differences, “arousal intensity” should not be treated as directly equivalent to “liking”, which is in line with findings from color preference experiments [61].

4.3. Type-Specific Patterns of Visual Hotspots

This study also found consistent differences among the four rural landscape types in the categories of objects and spatial locations where gaze hotspots were clustered. Hotspots are predominantly concentrated on identifiable objects and their boundary areas in the foreground and midground. This suggests that attention tends to focus on objects with clear semantic meaning and distinct contours. This finding is consistent with the conclusion from previous studies on rural landscape heatmaps, which indicate that hotspots in high-visual-quality scenes typically concentrate on semantically distinct objects such as fields, topography, and settlement structures [62].
Similar observations have been reported in built environment eye-tracking studies. Eye-tracking research on traditional neighborhood design has shown that specific design characteristics can attract different patterns of visual attention [18]. Eye-tracking emulation software has also been proposed as a way to identify visually salient areas in urban design analysis [19]. Visual Attention Software can generate fixation probability maps for built environment images and help identify areas that are likely to attract early attention [20]. Biometric studies of building façades suggest that window arrangement and façade composition may affect implicit visual engagement [63]. Broader reviews of eye-tracking research further indicate that this method can help reveal responses to buildings and their constituent elements [64]. These studies support the interpretation that hotspots in the present study are not merely technical artifacts of the heatmaps. They indicate which rural landscape elements are more likely to structure visual exploration and attentional engagement. In this sense, vernacular buildings, field boundaries, road nodes, settlement interfaces, and water–shoreline areas can be understood as rural counterparts to the visually engaging elements identified in previous built environment studies.
In FF, hotspots are mainly concentrated on easily identifiable near-ground nodes such as vernacular buildings and field boundaries, indicating that attention in this type is more readily captured by production-related recognition cues and nodal features. This is consistent with evidence from field studies on pilgrimage routes, which suggests that different motivations or goals can alter preferences for element selection and enhance attention to near-ground nodes [65].
In HF, hotspots are concentrated on details of settlement interfaces and key nodes at spatial turning points, indicating that attention in this type relies more on interface details and turning cues for organization. This is consistent with the conclusion of traditional village cultural landscape studies that buildings are the strongest elements of visual attention [66]. However, this study also observed that prominent hotspots on buildings do not necessarily correspond to higher preference and should be interpreted within context, which is consistent with findings from blue-space studies showing that, in water-dominated scenes, excessive visual attention to buildings may negatively affect preference [67].
In DP, hotspots are more frequently distributed at road intersection nodes and along sequences of facilities in the direction of the route, indicating that the organization of linear space and the rhythm of nodes are more prominent in this type. This is consistent with findings from studies on children’s street environments showing that roads and their associated facilities may trigger more frequent saccadic interference and higher emotional arousal [68]. This suggests that road hotspots may represent not only spatial orientation functions but also a certain degree of cognitive load.
In WNL, hotspots are concentrated on water bodies and vegetation areas at the water–land interface, and often fall on interface details such as shoreline vegetation and waterside platforms. This is consistent with the view emphasized in waterfront environment studies that the “water–shoreline interface” is a key carrier of experience [59]. It is also consistent with findings from studies on satisfaction with waterfront environments, which suggest that key influencing factors often involve the configuration density of aquatic plants and the characteristics of waterfront paving [69].

4.4. AOI Processing Patterns Across Six Landscape Elements

This study found that gaze behavior toward different types of landscape elements exhibits distinct process differences, which can be summarized as three stages: initial gaze, sustained processing, and repeated visits. This process exhibits distinct combinatorial characteristics across the four types of rural landscapes. Furthermore, distinguishable combinatorial differences were detected across all six AOIs. This aligns with the research approach in wetland park studies, which combines pixel-level quantification of landscape elements with eye-tracking and subjective evaluations to demonstrate that objective parameters correspond to different eye-tracking patterns. Methodologically, this confirms the feasibility of using AOI metrics to explain differences in attention allocation and perceptual responses [70].
With regard to vegetation factors, this study shows that differences in vegetation perception are not concentrated in a single indicator, but rather manifest as varying combinations of earlier or later processing and more frequent revisits across different types; therefore, they cannot be explained solely by overall green coverage. This is consistent with findings from research on understory spatial structure, which suggests that branch characteristics and planting patterns alter preferences and influence the visual information processing process [71]. At the same time, this study found that vegetation also exhibits typological differences in terms of revisit characteristics, which aligns with the conclusion from studies on the visual quality of plant landscapes that enhanced vertical stratification and color contrast in plant communities, encouraging observers to revisit the area more frequently [72]. Furthermore, research findings indicating that the visual properties of plants themselves can alter the depth of information processing provide a plausible explanation for the differences in vegetation AOIs observed in this study [73].
With regard to buildings and vernacular buildings, this study found that, for some landscape types, differences appeared in both initial gaze and sustained processing metrics. This suggests that variation among AOIs may be related either to visual salience or to differences in the depth of semantic processing. This pattern is consistent with findings that the complexity of architectural forms can significantly alter gaze structure and psychological responses [57]. In addition, this study found that longer processing times do not necessarily indicate stronger preference; instead, they may reflect greater cognitive effort. This is also consistent with studies on historic districts, which suggest that recognition takes longer when elements are more complex and dispersed, and that attractiveness should be distinguished from cognitive load [56].
With regard to water bodies, this study found that the WNL type exhibited more pronounced sustained processing and more repeated visits to water-related AOIs. However, this gaze preference did not show a simple one-to-one correspondence with physiological arousal measures such as HR and SC. This result is consistent with studies on the restorative effects of waterfront environments, which suggest that environmental features can influence recovery outcomes by shaping visual behavior, whereas subjective evaluations may not always align with physiological indicators [59]. Note that variations in the AOI of water bodies should be interpreted comprehensively within the overall structure of the shoreline boundary and the contextual setting.

4.5. Interpreting the Attention–Arousal Relationship

The results of this study show that visual attention allocation and physiological arousal may converge in some contexts and diverge in others. The significance of this finding does not lie in proposing a new theoretical relationship, but in further supporting the view in existing research that attention and arousal are not linked through a simple one-to-one correspondence. Attention mainly reflects attentional allocation, search organization, and information processing during viewing. Longer fixations, delayed disengagement, or more repeated visits may indicate stronger attention, but they may also reflect greater complexity, higher cognitive load, or a longer recognition process. Arousal mainly reflects autonomic nervous system activation. In this study, increases in SC or HR are therefore interpreted as heightened arousal rather than as direct indicators of liking or preference.
On this basis, no single eye-tracking indicator, physiological indicator, or simple combination of the two is treated as a proxy for preference. Preference is discussed more cautiously as an evaluative dimension that requires multiple lines of evidence. The correlation analysis supports this interpretation. Using the 40 stimulus images as the statistical units, NB was significantly positively correlated with HR, whereas NES was significantly negatively correlated with SC. The remaining eye-tracking–physiological pairs were not significant. These results suggest that cross-modal relationships are selective rather than uniformly consistent, and that multimodal evidence is better understood as complementary support than as direct substitution.

4.6. Implications for Type-Oriented Rural Landscape Renewal

In FF, hotspots are concentrated near vernacular buildings and along field edges. Hotspots related to roads form band-like patterns along the direction of travel and often appear near the road centerline or at turning points. These patterns suggest that nodes, boundaries, and the orientation of roads act as key cues in guiding attention. The AOI results further show that FF displays more pronounced processing and visitation patterns for vernacular buildings. This finding is in line with the view that positive anthropogenic elements may be positively coupled with preference or ecological goals [74]. Accordingly, FF revitalization should prioritize a small number of highly recognizable nodes to guide perception, while avoiding large-area replacement with high-density paving.
In HF, hotspots are concentrated on the facades of buildings within the settlement, at key points along street and alley sightlines, and near major turning points. The AOI results further show that buildings receive more pronounced processing and visitation in HF. This pattern is consistent with the view that complex and dispersed interfaces increase the cost of recognition [56]. Accordingly, HF updates may be improved by clarifying interface hierarchies, establishing visual anchors at turning points, and simplifying wayfinding cues.
In DP, hotspots are concentrated mainly at road intersections and along sequences of facilities, suggesting that node rhythm is more pronounced in linear spaces. The AOI results further show that DP exhibits more sustained processing and visitation in relation to vegetation. This pattern is consistent with previous findings that color richness and environmental harmony can influence visual appraisal and sustained attentional processing [72]. Accordingly, DP updates should focus on coordinating node rhythm, reducing the density of visually disruptive facilities, and optimizing the arrangement of vegetation layers and colors to improve overall experiential quality.
In WNL, hotspots are concentrated on nearshore water surfaces, emergent and floating vegetation zones, and the water–land interface. The AOI results further show that water bodies receive more sustained processing and repeated visits, indicating that the shoreline interface is a key carrier of attention and experience in this type. This pattern is consistent with studies showing that the density of aquatic plant distribution and the characteristics of waterfront paving are important influencing factors [69]. Accordingly, WNL optimization should prioritize the spatial organization of interfaces that support water access and lingering, so that these spaces are recognizable, conducive to lingering, and likely to attract repeated visits, rather than relying only on superficial waterfront beautification.
Based on these type-specific findings, the following metric-informed design and conservation cues can be derived. First, in FF landscapes, existing vernacular buildings, field edges, and road turning points should be treated as priority visual anchors. Design interventions should strengthen the legibility of these nodes and boundaries, while conservation work should avoid replacing them with large areas of visually uniform hard paving. Second, in HF landscapes, settlement facades, street-and-alley sightlines, and spatial transition points should be treated as key carriers of visual organization. Design interventions should clarify interface hierarchies and wayfinding cues, while conservation work should retain recognizable settlement edges and locally distinctive building interfaces. Third, in DP landscapes, road intersections, route-side facilities, and vegetation interfaces should be treated as key elements for improving spatial order. Design interventions should reduce visually disruptive facility density and coordinate vegetation layers, while conservation work should protect existing vegetation structures that contribute to sustained visual processing. Fourth, in WNL landscapes, nearshore water surfaces, aquatic vegetation, and the water–land interface should be treated as priority areas for conservation and careful renewal. Design interventions should improve water accessibility and opportunities for staying near the shoreline, while conservation work should preserve existing water-related interfaces that show sustained attention and repeated visits. Together, these cues provide a preliminary tool for moving from metric results to rural landscape renewal decisions. They help identify where existing landscape qualities may be conserved, where spatial order may be improved, and where design intervention should be more cautious.
These cues also resonate with Alexander’s pattern language approach, although they are derived from different types of evidence. In particular, the WNL finding that nearshore water surfaces and the water–land interface attracted sustained attention is closely related to the pattern “Access to Water”. This pattern provides a useful design vocabulary for interpreting why shoreline accessibility, waterside staying spaces, aquatic vegetation, and water–land transition zones should be treated as priority areas for conservation and careful renewal. Similarly, the findings concerning field edges, settlement interfaces, road nodes, and staying spaces can be cautiously interpreted alongside patterns such as common land, positive outdoor space, path organization, building fronts, and activity pockets [21]. The present study does not test Alexander’s patterns directly. Instead, it provides metric-informed evidence that may help identify which existing rural spatial patterns deserve conservation, clarification, or careful renewal.

4.7. Limitations and Future Research Directions

This study has several limitations. First, the sample composition limits the generalizability of the findings. Phase 1 included 10 landscape-related graduate students and was used mainly for candidate scene identification and stimulus screening. In Phase 2, 40 valid participants were retained, most of whom were young university students. This sample structure improved comparability under controlled experimental conditions, but the generalization of the findings to villagers, tourists, older adults, and other non-specialist groups requires further validation. In particular, landscape-related training may have increased participants’ sensitivity to spatial order, interface details, and AOI-related visual cues. By contrast, the broader comparative conclusion that the four rural landscape types show distinguishable typological differences remains relatively more stable. The findings are therefore better understood as providing insight for rural landscape comparison in broader public contexts [66].
Second, the two-stage design defines the interpretive boundary of the findings. Phase 1 was used mainly for candidate scene identification and contextual anchoring, whereas Phase 2 was conducted under uniform visual stimulus conditions for typological comparison and multimodal validation. Because candidate scene identification in Phase 1 relied partly on SCR fluctuations, and SC and HR were measured again in Phase 2, the second-stage results should not be interpreted as a fully independent physiological validation. They are better understood as controlled comparative evidence based on representative scene materials. The final statistical analysis used aggregated stimulus images as the basic unit. The results therefore mainly reflect typological differences at the level of representative scenes and do not directly support inferences about individual differences, continuous psychological processes across stages, or stronger mechanistic relationships.
Third, the AOI analysis was limited by the structure of the stimulus materials. The composition of landscape elements was not fully consistent across images, and some AOI categories were absent in certain rural types. For this reason, a unified significance test was not conducted for all AOI indicators, and a complete landscape element × rural type interaction model was not established. The AOI results should therefore be treated as descriptive and supplementary evidence for element-level attention allocation, rather than as strong statistical inference. The use of image-level analysis was intended to avoid treating repeated observations from 40 participants viewing 40 images as mutually independent samples, thereby reducing the risk of pseudoreplication. At the same time, this strategy limited the effective sample size to 40 stimulus images, with 10 images in each group. As a result, the statistical support for multi-indicator significance testing, interaction analysis, and subsequent multiple comparisons in the AOI analysis was constrained. Future research could expand the sample of representative scenes, improve the AOI data structure, and conduct more systematic significance testing, interaction modeling, and statistical power evaluation.
Fourth, the indicator system can be further expanded. In terms of the indicator system, the physiological indicators examined in this study are limited to SC and HR, which are the most fundamental and reliable physiological indicators [75]. Future studies could introduce more specific independent variables—such as geometric shapes—under controlled conditions to examine the pathways linking form composition and attention to physiological responses, and to compare these findings with existing evidence [76]. At the level of feature structure and semantics, this study identified typological differences in attention using six categories of AOIs; however, the feature structure and semantic variables could be further refined. Future research could combine semantic segmentation with statistical modeling to examine the explanatory power of feature proportions on attention and emotional responses, and to enhance comparability in the context of metric heterogeneity [77]. Regarding behavioral validation, this study draws inferences based on the “attention–arousal” mutual reinforcement mechanism; however, further distinction and integration between subjective evaluations and actual behavioral intentions are still needed. Tourism behavior and place psychological models suggest that a clear distinction should be made between the evaluation and response levels, and mediating variables such as esthetic experiences can be introduced to stabilize the mechanism chain [78]. At the same time, incorporating public preferences into planning decisions may alter the optimal spatial configuration, and factors related to a sense of place may also serve as mediators between perception and experience; these can be incorporated into the model in subsequent stages and used for policy translation.
Finally, Phase 2 used static visual stimuli. This choice helped maintain consistency in stimulus content, presentation duration, and AOI delineation, and improved comparability across rural landscape types. At the same time, the findings mainly reflect attention allocation and physiological responses under visually dominant conditions. Existing research has shown that place perception in real environments is shaped not only by vision, but also by nonvisual inputs such as sound and smell [79]. Cross-modal studies further indicate that auditory input can influence visual judgment [80]. Research on place perception has also found that evaluations incorporating sound are often closer to on-site experience than those based on visual input alone and can reduce visual bias to some extent [81]. The present findings should therefore be understood as controlled evidence of perceptual differences across rural landscape types under visually dominant conditions, rather than as direct equivalents of integrated perceptual experience in real rural environments. Future research could incorporate multisensory information such as video, sound, and olfactory recording to further test the stability of these findings across different media and sensory conditions.

5. Conclusions

This study examined four typical rural landscape types in the suburbs of Hefei through a two-stage design that combined field-based scene screening with laboratory validation. Eye-tracking, SC, HR, heatmaps, and AOI analysis were used to characterize differences in visual attention and physiological responses across rural landscape types. The main contribution of this study is to provide controlled comparative evidence within a rural landscape typology framework and to translate these findings into implications for type-oriented rural landscape renewal. The main conclusions are as follows:
(1)
Different rural landscape types show clear differences in overall visual search characteristics and autonomic physiological responses, indicating that rural environmental type is an important contextual factor shaping visual processing organization and physiological arousal, and gives rise to distinct response patterns at the macro level.
(2)
The heatmap results show that visual attention is mainly concentrated on identifiable targets and their boundaries in the foreground and midground, while background elements such as the sky receive less attention. The objects of attention showed clear type-specific differences across rural landscape types: FF emphasizes production-landscape recognition nodes and field boundaries; HF focuses on details of settlement interfaces and spatial turning points; DP mainly attends to road nodes and sequences of facilities along the route; and WNL takes water bodies and the water–land interface zone as its core areas of attention.
(3)
AOI analysis further indicates that different types of rural landscapes exhibit variations in the structure of attention allocation across six types of features, and the gaze process can be summarized as three stages: initial focus, sustained processing, and repeated visits. Differences in the configuration of these stages across rural landscape types indicate that different rural landscape types exhibit identifiable typological differences in element-level attentional processing sequences.
(4)
The combination of eye-tracking and physiological data enabled this study to characterize perceptual responses to rural landscapes through two lines of evidence—visual attention processes and physiological arousal—thereby providing a more comprehensive multimodal basis for typological interpretation and contextual validation. Only some of the key eye-tracking and physiological indicators showed significant correlations, suggesting that the relationship among multimodal measures is better characterized by selective coupling and complementary support than by a uniformly consistent linear correspondence.
(5)
Based on typological evidence, this study argues that the priorities for revitalization differ across various types of rural settlements: for villages with flat terrain and a primarily agricultural economy, the focus should be on optimizing the identification of key nodes within the agricultural landscape and the order of field boundaries; for villages situated in hilly terrain with prominent forest backdrops, the focus should be on guiding and integrating settlement interfaces and spatial transition nodes; for villages in highly developed plain areas, the focus should be on controlling the landscape rhythm of road, node, and facility systems, as well as optimizing the organization of greening layers; for lowland villages crisscrossed by waterways, the focus should be on the coordinated arrangement of waterfront interfaces and elements in the water-land transition zone, as well as improving accessibility.
These findings can be further translated into a preliminary type-oriented conservation and renewal checklist. In FF landscapes, vernacular buildings, field edges, and road turning points should be retained or clarified as visual anchors. In HF landscapes, settlement facades, street-and-alley sightlines, and transition points should be conserved as carriers of spatial legibility. In DP landscapes, road intersections, route-side facilities, and vegetation structures should be coordinated to reduce visual disorder and improve sequence perception. In WNL landscapes, nearshore water surfaces, aquatic vegetation, and water–land interfaces should be carefully conserved and renewed to support access, lingering, and repeated visual engagement. These implications remain preliminary and context-dependent, but they extend the practical value of the experiment beyond technical measurement.

Supplementary Materials

The following supporting information can be downloaded at: https://www.mdpi.com/article/10.3390/buildings16102036/s1, Supplementary File: Supplementary Material S1–S5, including additional references cited in the supplementary materials [82,83,84,85,86,87,88].

Author Contributions

Conceptualization, K.Z. and W.N.; methodology, K.Z. and J.X.; software, K.Z. and Z.L.; validation, K.Z. and Y.J.; formal analysis, K.Z.; investigation, K.Z. and J.X.; resources, W.N.; data curation, K.Z.; writing—original draft preparation, K.Z.; writing—review and editing, J.X., W.N. and G.L.; visualization, K.Z.; supervision, W.N. and G.L.; project administration, W.N.; funding acquisition, W.N. All authors have read and agreed to the published version of the manuscript.

Funding

This work was supported by the National Natural Science Foundation of China (Grant No. 52378001), the National Education and Teaching Reform Research Project of China for Professional Degree Programs in Landscape Architecture (Grant No. LAJGXM2025046), and the Anhui Provincial Teaching Innovation Team in Behavior and Environment (Grant No. 2024cxtd078).

Institutional Review Board Statement

This study was conducted in accordance with the Declaration of Helsinki and approved by the Science and Technology Ethics Committee of Anhui Jianzhu University (Approval No.: 2026004; approval date: 23 June 2025).

Informed Consent Statement

Written informed consent was obtained from all participants involved in the study.

Data Availability Statement

The data presented in this study are available on request from the corresponding author. The data are not publicly available due to ethical restrictions and privacy considerations related to the physiological data of human participants.

Acknowledgments

The authors would like to thank the study participants and research assistants who contributed to data collection.

Conflicts of Interest

The authors declare no conflicts of interest.

References

  1. Shen, H.; He, X.; He, J.; Li, D.; Liang, M.; Xie, X. Back to the Village: Assessing the Effects of Naturalness, Landscape Types, and Landscape Elements on the Restorative Potential of Rural Landscapes. Land 2024, 13, 910. [Google Scholar] [CrossRef]
  2. Shi, M.; Wang, R.; Zhang, L. Novel Insights into Rural Spatial Design: A Bio-Behavioral Study Employing Eye-Tracking and Electrocardiography Measures. PLoS ONE 2025, 20, e0322301. [Google Scholar] [CrossRef]
  3. Zou, J.; Jiang, H.; Ying, W.; Qiu, B. Scenic Influences on Walking Preferences in Urban Forest Parks from Top-View and Eye-Level Perspectives. Forests 2024, 15, 2020. [Google Scholar] [CrossRef]
  4. Latini, A.; Marcelli, L.; Di Giuseppe, E.; D’Orazio, M. Investigating the Impact of Greenery Elements in Office Environments on Cognitive Performance, Visual Attention and Distraction: An Eye-Tracking Pilot-Study in Virtual Reality. Appl. Ergon. 2024, 118, 104286. [Google Scholar] [CrossRef]
  5. Nevzati, F.; Veldi, M.; Külvik, M.; Bell, S. Analysis of Landscape Character Assessment and Cultural Ecosystem Services Evaluation Frameworks for Peri-Urban Landscape Planning: A Case Study of Harku Municipality, Estonia. Land 2023, 12, 1825. [Google Scholar] [CrossRef]
  6. Hong, Z.; Cao, W.; Chen, Y.; Zhu, S.; Zheng, W. Identifying Rural Landscape Heritage Character Types and Areas: A Case Study of the Li River Basin in Guilin, China. Sustainability 2024, 16, 1626. [Google Scholar] [CrossRef]
  7. Pan, Y.; Piras, F.; Wang, Z.; Lai, M.; Agnoletti, M.; Santoro, A. A Methodological Framework for Identifying Traditional Rural Landscapes Based on Environmental, Cultural, and Socio-Economic Indicators-the Case Study of China. Sci. Rep. 2025, 15, 18650. [Google Scholar] [CrossRef]
  8. Wu, Y.; Pan, Y.; Li, M.; Sun, Y. Construction of Regional Rural Landscape Character Identification System: A Case of a Riverine Area along the Middle Reaches of the Yangtze River, China. Ecol. Indic. 2025, 177, 113760. [Google Scholar] [CrossRef]
  9. Evans, D.; Chamberlain, B. In Pursuit of Eye Tracking for Visual Landscape Assessments. Land 2024, 13, 1184. [Google Scholar] [CrossRef]
  10. Weng, Y.; Chen, Q.; Lin, X.; Chi, Y.; Li, K. Restorative Effects of Small Urban Parks: A Multi-Method Study Using Eye-Tracking and Psychophysiological Measures in Fuzhou, China. Front. Public Health 2025, 13, 1667502. [Google Scholar] [CrossRef]
  11. Ren, H.; Yang, F.; Zhang, J.; Wang, Q. Evaluation of Cognition of Rural Public Space Based on Eye Tracking Analysis. Buildings 2024, 14, 1525. [Google Scholar] [CrossRef]
  12. Yang, H.; Zhang, S. Impact of Rural Soundscape on Environmental Restoration: An Empirical Study Based on the Taohuayuan Scenic Area in Changde, China. PLoS ONE 2024, 19, e0300328. [Google Scholar] [CrossRef]
  13. Miller, P.A. Eye-Tracking and Visual Preference: Maybe Beauty Is in the Eye of the Beholder? Land 2024, 13, 598. [Google Scholar] [CrossRef]
  14. Levy, C.M.; Riederer, A.M.; Simpson, C.D.; Gassett, A.J.; Gilbert, A.J.; Paulsen, M.H.; Silva, L.K.; Bhandari, D.; Newman, C.A.; Blount, B.C. Forest Terpenes and Stress: Examining the Associations of Filtered vs. Non-Filtered Air in a Real-Life Natural Environment. Environ. Res. 2025, 276, 121482. [Google Scholar] [CrossRef] [PubMed]
  15. Liu, L.; Wu, M.; Ma, Y. Review of the Application of Eye-Tracking in Landscape Research. J. Hum. Settl. West China 2021, 36, 125–133. [Google Scholar] [CrossRef]
  16. Sussman, A.; Hollander, J. Cognitive Architecture: Designing for How We Respond to the Built Environment; Routledge: London, UK, 2021. [Google Scholar]
  17. Hollander, J.B.; Sussman, A. (Eds.) Urban Experience and Design: Contemporary Perspectives on Improving the Public Realm; Routledge: New York, NY, USA, 2020. [Google Scholar]
  18. Hollander, J.B.; Sussman, A.; Purdy Levering, A.; Foster-Karim, C. Using Eye-Tracking to Understand Human Responses to Traditional Neighborhood Designs. Plan. Pract. Res. 2020, 35, 485–509. [Google Scholar] [CrossRef]
  19. Hollander, J.B.; Sussman, A.; Lowitt, P.; Angus, N.; Situ, M. Eye-Tracking Emulation Software: A Promising Urban Design Tool. Archit. Sci. Rev. 2021, 64, 383–393. [Google Scholar] [CrossRef]
  20. Lavdas, A.A.; Salingaros, N.A.; Sussman, A. Visual Attention Software: A New Tool for Understanding the “Subliminal” Experience of the Built Environment. Appl. Sci. 2021, 11, 6197. [Google Scholar] [CrossRef]
  21. Alexander, C.; Ishikawa, S.; Silverstein, M. A Pattern Language: Towns, Buildings, Construction; Oxford University Press: New York, NY, USA, 1977. [Google Scholar]
  22. Yuan, L.; Yang, Z.; Wang, X.; Bai, C.; Wen, F. A Systematic Review of Research on Urban Streets and Parks Based on Eye-Tracking Technology. Appl. Sci. 2025, 15, 9305. [Google Scholar] [CrossRef]
  23. Zhang, X.; Xiong, X.; Chi, M.; Yang, S.; Liu, L. Research on Visual Quality Assessment and Landscape Elements Influence Mechanism of Rural Greenways. Ecol. Indic. 2024, 160, 111844. [Google Scholar] [CrossRef]
  24. Lin, W.; Mu, Y.; Zhang, Z.; Wang, J.; Diao, X.; Lu, Z.; Guo, W.; Wang, Y.; Xu, B. Research on Cognitive Evaluation of Forest Color Based on Visual Behavior Experiments and Landscape Preference. PLoS ONE 2022, 17, e0276677. [Google Scholar] [CrossRef] [PubMed]
  25. Sun, Y.; Ding, Y.; Lei, M.; Mao, L. Restoration Evaluation of National Forest Park in Greater Khingan Mountains Region, China. Sustainability 2024, 16, 11022. [Google Scholar] [CrossRef]
  26. Wang, X.; Chen, Z.; Ma, D.; Zhou, T.; Chen, J.; Jiang, X. Relationship between Visual and Thermal Comfort and Electrodermal Activity in Campus Blue–Green Spaces: A Case Study of Guangzhou, China. Sustainability 2023, 15, 11742. [Google Scholar] [CrossRef]
  27. Wang, X.; Zhu, B.; Chen, Z.; Ma, D.; Sun, C.; Wang, M.; Jiang, X. Landscape Perception in Cultural and Creative Industrial Parks: Integrating User-Generated Content (UGC) and Electrodermal Activity Insights. Sustainability 2024, 16, 9228. [Google Scholar] [CrossRef]
  28. Fei, X.; Wu, Y.; Wang, M.; Dong, J.; Wang, G. A Comparative Study of the Perception of Traditional Villages between Different Media. Sci. Rep. 2025, 15, 16062. [Google Scholar] [CrossRef]
  29. Sun, M.; Bao, Y. Effects of Reflecting Water on Viewers’ Visual Attention, Spatial Perception, and Emotional Responses: A Case Study in Chinese Heritage Garden. npj Herit. Sci. 2025, 13, 26. [Google Scholar] [CrossRef]
  30. Erich, T.; Lavdas, A.A.; Uta, S. Assessing Landscape Aesthetic Values: Do Clouds in Photographs Influence People’s Preferences? PLoS ONE 2023, 18, e0288424. [Google Scholar] [CrossRef]
  31. Jiang, X.; Li, X.; Wang, M.; Zhang, X.; Zhang, W.; Li, Y.; Cong, X.; Zhang, Q. Multidimensional Visual Preferences and Sustainable Management of Heritage Canal Waterfront Landscape Based on Panoramic Image Interpretation. Land 2025, 14, 220. [Google Scholar] [CrossRef]
  32. Zhou, C.; Teng, J.; Liu, C.; Zhang, Y.; Ouyang, B.; Zeng, T.; Gong, H.; Zhang, C. Landscape Preferences of Recreational Walkways in Urban Green Spaces: Bada Shanren Meihu Scenic Area, China. Sustainability 2025, 17, 9931. [Google Scholar] [CrossRef]
  33. Li, Y.; Luo, H.; Sun, S.; Wang, K.; Zhao, Q. Visual Quality Assessment of Rural Landscapes Based on Eye-Tracking Analysis and Subjective Perception. Sustainability 2025, 18, 161. [Google Scholar] [CrossRef]
  34. Korpilo, S.; Nyberg, E.; Vierikko, K.; Ojala, A.; Kaseva, J.; Lehtimäki, J.; Kopperoinen, L.; Cerwén, G.; Hedblom, M.; Castellazzi, E.; et al. Landscape and Soundscape Quality Promote Stress Recovery in Nearby Urban Nature: A Multisensory Field Experiment. Urban For. 2024, 95, 128286. [Google Scholar] [CrossRef]
  35. Lv, X.; Feng, P.; Chen, Q.; Huang, X.; Fu, X. Peaks and Troughs: Are Heart Rate Cues More Attractive to Tourists? Tour. Manag. 2025, 108, 105098. [Google Scholar] [CrossRef]
  36. Dawson, M.E.; Schell, A.M.; Filion, D.L. The Electrodermal System. In Handbook of Psychophysiology; Cambridge Handbooks in Psychology; Cacioppo, J.T., Tassinary, L.G., Berntson, G.G., Eds.; Cambridge University Press: Cambridge, UK, 2016; pp. 217–243. [Google Scholar]
  37. Ulrich, R.S.; Simons, R.F.; Losito, B.D.; Fiorito, E.; Miles, M.A.; Zelson, M. Stress Recovery during Exposure to Natural and Urban Environments. J. Environ. Psychol. 1991, 11, 201–230. [Google Scholar] [CrossRef]
  38. Bigazzi, A.; Ausri, F.; Peddie, L.; Fitch, D.; Puterman, E. Physiological Markers of Traffic-Related Stress during Active Travel. Transp. Res. Part F Traffic Psychol. Behav. 2022, 84, 223–238. [Google Scholar] [CrossRef]
  39. Kong, Y.; Hossain, M.B.; Peitzsch, A.; Posada-Quintero, H.F.; Chon, K.H. Automatic Motion Artifact Detection in Electrodermal Activity Signals Using 1D U-Net Architecture. Comput. Biol. Med. 2024, 182, 109139. [Google Scholar] [CrossRef] [PubMed]
  40. Cerwén, G.; Hägerhäll, C.M. Psychophysiological Research in Real-World Environments: Methodological Perspectives from the SLU Multisensory Outdoor Laboratory. Front. Psychol. 2025, 16, 1432180. [Google Scholar] [CrossRef]
  41. Korkmaz, D.; Knauth, K.; Brands, A.; Schmeck, M.; Büning, P.; Peters, J. Ambulatory Physiological Measures Obtained under Naturalistic Urban Mobility Conditions Have Acceptable Reliability. Sci. Rep. 2025, 15, 28940. [Google Scholar] [CrossRef]
  42. Měkota, T. Using Eye Tracking to Study Reading Landscape: A Systematic Review. Auc Geogr. 2024, 59, 120–136. [Google Scholar] [CrossRef]
  43. Wei, N.; Jiangxu, J.; Mimi, W.; Jin, S.; Gang, L. Research on the Impact of Panoramic Green View Index of Virtual Reality Environments on Individuals’ Pleasure Level Based on EEG Experiment. Landsc. Archit. Front. 2022, 10, 36–51. [Google Scholar] [CrossRef]
  44. Mouraz, C.P.; Ferreira, T.M.; Silva, J.M. Building Rehabilitation, Sustainable Development, and Rural Settlements: A Contribution to the State of the Art. Environ. Dev. Sustain. 2024, 26, 24937–24956. [Google Scholar] [CrossRef]
  45. Bodach, S.; Lang, W.; Hamhaber, J. Climate Responsive Building Design Strategies of Vernacular Architecture in Nepal. Energy Build. 2014, 81, 227–242. [Google Scholar] [CrossRef]
  46. Preuss Mattsson, N.; Coppi, S.; Chancel, M.; Ehrsson, H.H. Combination of Visuo-Tactile and Visuo-Vestibular Correlations in Illusory Body Ownership and Self-Motion Sensations. PLoS ONE 2022, 17, e0277080. [Google Scholar] [CrossRef]
  47. Park, B.J.; Tsunetsugu, Y.; Kasetani, T.; Hirano, H.; Kagawa, T.; Sato, M.; Miyazaki, Y. Physiological Effects of Shinrin-Yoku (Taking in the Atmosphere of the Forest)—Using Salivary Cortisol and Cerebral Activity as Indicators. J. Physiol. Anthropol. 2007, 26, 123–128. [Google Scholar] [CrossRef]
  48. Orquin, J.L.; Holmqvist, K. Threats to the Validity of Eye-Movement Research in Psychology. Behav. Res. Methods 2018, 50, 1645–1656. [Google Scholar] [CrossRef] [PubMed]
  49. Brandstetter, J.; Knoch, E.M.; Gauterin, F. Low-Cost Eye-Tracking Fixation Analysis for Driver Monitoring Systems Using Kalman Filtering and OPTICS Clustering. Sensors 2025, 25, 7028. [Google Scholar] [CrossRef] [PubMed]
  50. Josef, M.C.; Annika, E.; Tobias, W.O. Acute Stress Reduces Out-Group Related Safety Signaling during Fear Reinstatement in Women. Sci. Rep. 2020, 10, 2092. [Google Scholar] [CrossRef]
  51. Elliott, A.C.; Hynan, L.S. A SAS® Macro Implementation of a Multiple Comparison Post Hoc Test for a Kruskal–Wallis Analysis. Comput. Methods Programs Biomed. 2011, 102, 75–80. [Google Scholar] [CrossRef] [PubMed]
  52. Xiao, Y.; Fang, J.; Zhang, H.; Li, Q.; Zhang, Y. Construction and Analysis of a Packaging Design Preference Model Using Eye-Tracking Degree of Preference. Sci. Rep. 2026, 16, 6080. [Google Scholar] [CrossRef]
  53. Ágoston, G.; Borbála, T.; Katalin, O.; Fruzsina, E.; Anna, G.; Ildikó, K.; József, T. Visual Fixation Patterns During Viewing of Half-Face Stimuli in Adults: An Eye-Tracking Study. Front. Psychol. 2018, 9, 2478. [Google Scholar] [CrossRef]
  54. Lohani, M.; Zummo, L.; Roberts, A.G.; Blodgett, G.R. Applying Mobile Eye Tracking to Measure Real-Time Engagement and Enhance Informal Learning at Environmental Exhibits. Front. Psychol. 2025, 16, 1607029. [Google Scholar] [CrossRef]
  55. Cheng, S.; Lang, L.; Yang, X. Construction of an Evaluation and Analysis Model for Urban Waterfront Interface Morphology Based on Crowd Dynamic Visual Attention: A Case Study of the Nanjing Youth Olympic Area. Landsc. Archit. 2024, 31, 30–38. [Google Scholar] [CrossRef]
  56. Jiang, X.; Wu, X.; Chen, F.; Chen, Z.; Li, Z. Visual Perception of Environmental Elements Analysis in Historical District Based on Eye-Tracking and Semi-Structured Interview: A Case Study in Xining, Taishan. Buildings 2025, 15, 1554. [Google Scholar] [CrossRef]
  57. Wang, X.; Che, B.; Zhu, R. Eye-Tracking and Psychological Analysis: The Impact of Building Shape on Visitor Visual Preference. Buildings 2024, 14, 2733. [Google Scholar] [CrossRef]
  58. Ye, F.; Yin, M.; Cao, L.; Sun, S.; Wang, X. Predicting Emotional Experiences through Eye-Tracking: A Study of Tourists’ Responses to Traditional Village Landscapes. Sensors 2024, 24, 4459. [Google Scholar] [CrossRef]
  59. Zhou, S.; Lin, C.; Huang, Q. Enhancing Restoration in Urban Waterfront Spaces: Environmental Features, Visual Behavior, and Design Implications. Buildings 2025, 15, 2567. [Google Scholar] [CrossRef]
  60. Li, C.; Du, C.; Ge, S.; Tong, T. An Eye-Tracking Study on Visual Perception of Vegetation Permeability in Virtual Reality Forest Exposure. Front. Public Health 2023, 11, 1089423. [Google Scholar] [CrossRef]
  61. Huang, T.; Zhou, S.; Chen, X.; Lin, Z.; Gan, F. Colour Preference and Healing in Digital Roaming Landscape: A Case Study of Mental Subhealth Populations. Int. J. Environ. Res. Public Health 2022, 19, 10986. [Google Scholar] [CrossRef] [PubMed]
  62. Yao, X.; Sun, Y. Using a Public Preference Questionnaire and Eye Movement Heat Maps to Identify the Visual Quality of Rural Landscapes in Southwestern Guizhou, China. Land 2024, 13, 707. [Google Scholar] [CrossRef]
  63. Salingaros, N.A.; Sussman, A. Biometric Pilot-Studies Reveal the Arrangement and Shape of Windows on a Traditional Façade to Be Implicitly “Engaging”, Whereas Contemporary Façades Are Not. Urban Sci. 2020, 4, 26. [Google Scholar] [CrossRef]
  64. Rosas, H.J.; Sussman, A.; Sekely, A.C.; Lavdas, A.A. Using Eye Tracking to Reveal Responses to the Built Environment and Its Constituents. Appl. Sci. 2023, 13, 12071. [Google Scholar] [CrossRef]
  65. Xu, M.; Liu, J.; Wang, R.; Lu, S.; Xu, F. The Relationship between Visitors’ Motivation and Landscape Preference for the Pilgrimage Route on the Mount Miaofeng, China. PLoS ONE 2024, 19, e0314194. [Google Scholar] [CrossRef]
  66. Luo, Y.; Shen, S.; Zhan, W. Evaluation of Cultural Landscape Experience in Zhangguying Village Based on Semantic Differential and Eye-Tracking Analysis. Chin. Landsc. Archit. 2022, 38, 98–103. [Google Scholar] [CrossRef]
  67. Luo, W.; Yuan, Y.; Wang, L. Effects of Urban Blue Spaces on Relaxation and Preference in a Neuroscience Experiment: Based on Functional near-Infrared Spectroscopy and Eye-Tracking Technology. Chin. Landsc. Archit. 2025, 41, 47–54. [Google Scholar] [CrossRef]
  68. Sheng, K.; Liu, L.; Wang, F.; Li, S.; Zhou, X. An Eye-Tracking Study on Exploring Children’s Visual Attention to Streetscape Elements. Buildings 2025, 15, 605. [Google Scholar] [CrossRef]
  69. Lyu, M.; Wang, S.; Shi, J.; Sun, D.; Cong, K.; Tian, Y. Visual Satisfaction of Urban Park Waterfront Environment and Its Landscape Element Characteristics. Water 2025, 17, 772. [Google Scholar] [CrossRef]
  70. Wang, M.; Tong, H.; Chen, J.; Liu, F.; Li, M.; Yu, X.; Lin, S.; Dong, J. How Landscape Element Characterization Affects Aesthetic Preferences and Visual Attention in Urban Wetland Park Recreation Spaces. Sci. Rep. 2025, 16, 838. [Google Scholar] [CrossRef]
  71. Chen, B.; Li, S. Effects of Forest Interior Spatial Structure Characteristics on Visual Perception and Preference: Based on Tree Arrangement, Branching Characteristics, and Clear Bole Height. J. Chin. Urban For. 2023, 21, 43–51. [Google Scholar]
  72. Zhang, W.; Wang, H.; Liu, J. Visual Quality Evaluation of Plant Landscapes in Xi’an Huancheng West Park. J. Chin. Urban For. 2025, 23, 81–88. [Google Scholar]
  73. Ding, N.; Zhong, Y.; Li, J.; Xiao, Q. Study on Selection of Native Greening Plants Based on Eye-Tracking Technology. Sci. Rep. 2022, 12, 1092. [Google Scholar] [CrossRef]
  74. Zhang, J.; Zhu, X.; Gao, M. The Relationship between Habitat Diversity and Tourists’ Visual Preference in Urban Wetland Park. Land 2022, 11, 2284. [Google Scholar] [CrossRef]
  75. Jang, E.-H.; Byun, S.; Park, M.-S.; Sohn, J.-H. Reliability of Physiological Responses Induced by Basic Emotions: A Pilot Study. J. Physiol. Anthropol. 2019, 38, 15. [Google Scholar] [CrossRef]
  76. Liu, Y.; Wang, H.; Li, W.; Li, Y. Effects of Green-Wall Layouts on Psychological and Physiological Responses in Office Environments: A Virtual-Environment Study. Front. Psychol. 2025, 16, 1711317. [Google Scholar] [CrossRef] [PubMed]
  77. Xu, Z.; Marini, S.; Mauro, M.; Maietta Latessa, P.; Grigoletto, A.; Toselli, S. Associations between Urban Green Space Quality and Mental Wellbeing: Systematic Review. Land 2025, 14, 381. [Google Scholar] [CrossRef]
  78. Zhang, T.; Jiang, Y.; Liu, D.; Zeng, S.; Sheng, P. Natural or Human Landscape Beauty? Quantifying Aesthetic Experience at Longji Terraces Through Eye-Tracking. J. Eye Mov. Res. 2025, 18, 15. [Google Scholar] [CrossRef] [PubMed]
  79. Shi, Y.; Kong, X.; Lu, X.; Xu, J.; Liu, M. Developing Multisensory Olfactory and Auditory Perception Methods for a Dynamic Market Environment. J. Asian Archit. Build. Eng. 2026, 1–23. [Google Scholar] [CrossRef]
  80. Odgaard, E.C.; Arieh, Y.; Marks, L.E. Cross-Modal Enhancement of Perceived Brightness: Sensory Interaction versus Response Bias. Percept. Psychophys. 2003, 65, 123–132. [Google Scholar] [CrossRef]
  81. Le, Q.H.; Moon, H.; Ho, J.; Ahn, Y. From Seeing to Hearing: A Feasibility Study on Utilizing Regenerated Sounds from Street View Images to Assess Place Perceptions. Build. Environ. 2025, 269, 112468. [Google Scholar] [CrossRef]
  82. Ichihashi, T.; Hirabayashi, Y.; Nagahara, M. Potential Utility of a 4K Consumer Camera for Surgical Education in Ophthalmology. J. Ophthalmol. 2017, 2017, 1–5. [Google Scholar] [CrossRef]
  83. Liu, H.; Wu, G.; Liu, M. Measurement of Environmental Restorative Effects and Perceptual Preference from the Perspective of Privacy-Related Activities:A Case Study of Waterfront Public Spaces in Guilin. New Archit. 2025, 108–113. [Google Scholar]
  84. Figner, B.; Murphy, R.O. Using Skin Conductance in Judgment and Decision Making Research. In A Handbook of Process Tracing Methods; Schulte-Mecklenbeck, M., Kühberger, A., Ranyard, R., Eds.; Psychology Press: New York, NY, USA, 2011; pp. 163–184. [Google Scholar]
  85. Hou, J.; Wang, Y.; Zhang, X.; Qiu, L.; Gao, T. The effect of visibility on green space recovery, perception and preference. Trees For. People 2024, 16. [Google Scholar] [CrossRef]
  86. Chan, H.-Y.; Boksem, M.A.; Venkatraman, V.; Dietvorst, R.C.; Scholz, C.; Vo, K.; Falk, E.B.; Smidts, A. Neural Signals of Video Advertisement Liking: Insights into Psychological Processes and Their Temporal Dynamics. J. Mark. Res. 2023, 61, 891–913. [Google Scholar] [CrossRef]
  87. Luo, W.; Yuan, Y.; Wang, L.; Wu, L. Attention and Emotional Effects of Visual Features in Waterfront Spaces: Evidence from an Eye-Tracking Experiment among College Students. J. Sun Yat-Sen Univ. Nat. Sci. Ed. 2025, 64, 207–217. [Google Scholar] [CrossRef]
  88. Ogino, A.; Ikematsu, Y. Mood Estimation Method in a Group Using Smartwatches to Support Positive Tourism Experiences. Int. J. Affect. Eng. 2022, 21, 33–42. [Google Scholar] [CrossRef]
Figure 1. Overall experimental flowchart. Note: In the embedded eye-tracking heatmap, red indicates high gaze density, yellow indicates moderate gaze density, and green indicates low gaze density.
Buildings 16 02036 g001
Figure 2. Map of the study area. (a) Distribution map of land use types in Anhui Province. (b) Distribution map of land use types in Hefei City. (c) Zoom area of Hefei City.
Buildings 16 02036 g002
Figure 3. Current Status Map of the Study Site. (a) Current Map of Sangang Village; (b) Current Map of Shankou Village; (c) Current Map of Xiaojingzhuang Village; (d) Current Map of Changzhuang Village.
Buildings 16 02036 g003
Figure 4. Flowchart of the image screening process for Experiment 1.
Buildings 16 02036 g004
Figure 5. Flowchart for Experiment 2.
Buildings 16 02036 g005
Figure 6. Box Plot of the Eye-tracking Metrics. Note: A–D represent FF, HF, DP, and WNL, respectively. On the vertical axis, NB denotes Number of Blinks, and NES denotes Number of Eye Saccades. The horizontal line within each box indicates the median, the square indicates the mean, and the scattered points represent individual observations. * p < 0.05 and ** p < 0.01 indicate significant differences. (a) Box Plot of the Number of Blinks Metric; (b) Box Plot of the Number of Eye Saccades Metric.
Buildings 16 02036 g006
Figure 7. Box Plot of the Physiological Metrics. Note: A–D represent FF, HF, DP, and WNL villages, respectively. On the vertical axis, HR denotes average heart rate (bpm), and SC denotes skin conductance (μS). The horizontal line within each box indicates the median, the square indicates the mean, and the scattered points represent individual observations. * p < 0.05 and ** p < 0.01 indicate significant differences. (a) Box Plot of the HR Metric; (b) Box Plot of the SC Metric.
Buildings 16 02036 g007
Figure 8. Cross-modal correlation analysis. Note: NB = Number of Blinks; NES = Number of Eye Saccades; HR = Heart Rate; SC = Skin Conductance. The values shown in the figure are Spearman correlation coefficients (ρ). Color indicates the direction and strength of the correlation. Asterisks indicate significance levels (* p < 0.05). The “***” symbols on the diagonal indicate self-correlations of each variable and are not interpreted.
Buildings 16 02036 g008
Figure 9. Representative eye-tracking heatmaps for the four rural landscape types. Note: In the heatmaps, red indicates high gaze density, yellow indicates moderate gaze density, and green indicates low gaze density. In the AOI delineations, colors are used only to distinguish different AOI categories and do not represent data values.
Buildings 16 02036 g009
Table 1. Experimental Parameters and Their Meanings.
TypeIndicatorMeanings
Physiological indicatorsSC (μS)Higher values generally indicate stronger sympathetic arousal under the current viewing conditions.
HR (bpm)Heart rate reflects autonomic activation and may vary with arousal, stress, or attentional engagement.
Eye-tracking metricsNB (n)Number of blinks within a stimulus segment; changes in blink frequency may reflect variation in attention maintenance, visual fatigue, or processing state, depending on the task context.
NES (n)Number of eye saccades within a stimulus segment; this metric reflects the intensity and organization of visual exploration under comparable viewing conditions.
AOI First Fixation Time (s)Time elapsed from stimulus onset to the first fixation within the AOI; shorter times indicate earlier attention capture.
Total AOI Visit Duration (s)Total time spent viewing the AOI; longer duration may indicate more sustained processing or greater attentional engagement.
AOI Average Gaze Duration (s)Average fixation duration within the AOI.
AOI Inspection Count (n)Total number of visits to the AOI.
Note: Skin Conductance (SC), Heart Rate (HR), Number of Blinks (NB), Number of Eye Saccades (NES); Area of Interest (AOI).
Table 2. Analysis of mean AOI values.
Stimulus Type
(Mean ± SD)
VegetationBuildingsRoads
ABCDABCDABCD
AOI First Fixation Time(s)1.30 ± 1.851.00 ± 1.630.78 ± 1.581.04 ± 1.712.28 ± 2.551.56 ± 2.202.64 ± 2.380.92 ± 1.651.82 ± 2.261.87 ± 2.231.80 ± 2.202.52 ± 2.48
Total AOI Visit Duration(s)3.06 ± 2.742.97 ± 2.584.17 ± 2.762.88 ± 2.450.80 ± 1.362.11 ± 2.180.31 ± 0.602.16 ± 2.701.44 ± 1.802.00 ± 2.161.96 ± 2.190.84 ± 1.14
AOI Average Gaze Duration(s)0.38 ± 2.550.29 ± 0.410.29 ± 0.220.30 ± 0.370.25 ± 1.990.28 ± 0.570.11 ± 0.200.18 ± 0.570.27 ± 0.390.28 ± 0.460.31 ± 0.520.23 ± 0.35
AOI inspection count(n)7.00 ± 5.856.81 ± 5.219.33 ± 5.906.87 ± 5.222.21 ± 3.175.47 ± 4.841.08 ± 1.684.89 ± 6.173.74 ± 4.134.67 ± 4.644.34 ± 4.622.24 ± 2.70
Stimulus Type
(Mean ± SD)
SkyVernacular BuildingsWater Bodies
ABCDABCDABCD
AOI First Fixation Time(s)2.12 ± 2.732.18 ± 2.742.33 ± 2.931.65 ± 2.681.89 ± 2.222.39 ± 2.522.44 ± 2.592.35 ± 2.422.90 ± 2.44-3.78 ± 2.442.34 ± 2.18
Total AOI Visit Duration(s)0.35 ± 0.890.33 ± 0.800.24 ± 0.670.39 ± 1.001.30 ± 1.821.10 ± 1.641.03 ± 1.520.79 ± 1.250.83 ± 1.05-0.39 ± 0.511.78 ± 1.85
AOI Average Gaze Duration(s)0.11 ± 0.200.09 ± 0.160.08 ± 0.190.12 ± 0.200.21 ± 0.300.19 ± 0.180.23 ± 0.340.18 ± 0.310.29 ± 0.53-0.15 ± 0.240.24 ± 0.29
AOI Inspection Count(n)1.02 ± 2.011.06 ± 2.020.74 ± 1.591.16 ± 2.303.19 ± 4.082.68 ± 3.232.69 ± 3.402.09 ± 2.832.10 ± 1.99-1.34 ± 1.444.56 ± 4.17
Note: “- “ indicates that the corresponding AOI category was absent in that stimulus type and was therefore not included in the comparison.
Disclaimer/Publisher’s Note: The statements, opinions and data contained in all publications are solely those of the individual author(s) and contributor(s) and not of MDPI and/or the editor(s). MDPI and/or the editor(s) disclaim responsibility for any injury to people or property resulting from any ideas, methods, instructions or products referred to in the content.