


Abstract
To investigate the shear performance of steel fiber-reinforced high-strength concrete (SFRHSC) corbels subjected to concentrated loading, an experimental program was executed on six specimens featuring welded anchorage for the upper longitudinal reinforcement. The control variables included shear span-to-depth ratios of 0.2 to 0.5 and steel fiber volume fractions of 0%, 0.75%, and 1.50%. During the testing phase, strain evolution within the steel reinforcement and concrete matrix was monitored to analyze the structural deformation sequence and ultimate failure modes. Anchored in the Mohr–Coulomb failure criterion and the foundational strut-and-tie model (STM) framework, a softened strut-and-tie calculation approach for corbel shear capacity was formulated; this method explicitly accounts for the softening effect of the steel fiber-reinforced concrete (SFRC) and incorporates a size effect correction. The established shear capacity calculation model, alongside STM-based provisions from ACI 318-19, EN 1992-1-1, and CSA A23.3-19, was deployed to forecast the shear capacities of the six fabricated specimens and 18 additional units sourced from existing literature. Ultimately, a rigorous comparative analysis was conducted between the theoretical predictions generated by each method and the empirical test data. The results indicate that the failure process of the SFRHSC corbels primarily involves three distinct stages: initial cracking, through cracking, and ultimate failure. The addition of steel fibers can alleviate stress concentration at cracks and limit crack growth, thereby improving the tensile performance of the cracked concrete. Test results indicate that the strain in the longitudinal tensile reinforcement increased with the shear span-to-depth ratio but decreased as the steel fiber volume fraction increased. At the point of specimen failure, all longitudinal tensile reinforcement had reached the yield strength, while the horizontal stirrups only partially yielded. The concrete strain distribution across the normal section of the corbel did not follow the plane section assumption. Furthermore, incorporating steel fibers increased both the cracking load and the ultimate load of the corbel normal sections. The mean value of the experimental-to-predicted ratios obtained from the STM provisions of various international codes was 1.453, with a variance of 0.029, indicating conservative calculation results. In contrast, the mean value of the experimental-to-predicted ratios for the calculation model developed in this study was 1.048, with a variance of 0.004, demonstrating closer agreement with the experimental results and less dispersion. Simultaneously, by explicitly considering the softening effect in SFRHSC and the size effect, it provides a better prediction for the shear capacity of corbels.
1. Introduction
Corbels are vertical load-transferring components widely used in buildings and civil infrastructure. Characterized by a shear span-to-depth ratio typically less than 1, they are also subjected to horizontal loads resulting from concrete shrinkage, thermal deformation, creep, and the impact of overhead crane operations [1,2]. In practical engineering applications, corbels are required to possess high load-bearing capacity and crack resistance. SFRHSC is a high-toughness construction material known for its excellent crack resistance, strength enhancement, and toughening properties [3]. The application of SFRHSC in corbel components effectively improves their shear capacity and ductility, while also optimizing the reinforcement detailing. Extensive research efforts globally have been directed toward investigating the mechanical behavior inherent to SFRC corbels. By executing vertical loading tests on reinforced SFRC corbels, Fattuhi [4,5] deduced that integrating steel fibers simultaneously augments both the ductility and strength of these elements. Concurrently, their load-bearing capacity was analytically forecasted by deploying both the bending model and the truss model frameworks. In a complementary inquiry targeting the flexural performance of corbels, Campione et al. [6] demonstrated that the synergistic incorporation of fibers alongside the strategic configuration of stirrups substantially elevates both the load-carrying capacity and ductility of the concrete members. Furthermore, this investigation culminated in the formulation of a simplified calculation model specifically tailored to evaluate the shear strength of fiber-reinforced concrete corbels.
To forecast the shear strength of SFRC and glass fiber-reinforced concrete corbels lacking transverse reinforcement, Kurtoglu et al. [7] formulated an empirical equation utilizing symbolic regression (SR), subsequently validating its broader applicability. In an exploration of the mechanical properties and failure mechanisms of SFRHSC, Gao Junfeng et al. [8] demonstrated that the integration of steel fibers significantly enhances both the diagonal cracking load and the ultimate load of the corbels, effectively mitigating their inherent brittleness. Through a series of shear tests on reinforced SFRC corbels, Gao Danying et al. [9] established that steel fibers exert a negligible influence on the ultimate failure modes, leading to the derivation of a specialized calculation formula for the shear capacity of reinforced SFRC corbels. Furthermore, based on shear performance evaluations of double-sided supported SFRHSC corbels, Li Shushan et al. [10] concluded that concrete corbels with low shear span-to-depth ratios are characterized by two predominant failure modes: diagonal compression failure and diagonal shear failure. Their findings indicate that while the bearing capacity of the corbels demonstrates an inverse relationship with the shear span-to-depth ratio, strategic increments in the reinforcement ratio and steel fiber volume fraction substantially bolster both the load-carrying capacity and the ductility of the structural members.
Corbel components contain disturbed regions (D-regions) and are therefore categorized as D-region members. Due to the combined influence of geometric discontinuities and abrupt loading transitions, corbels typically exhibit a nonlinear strain profile that fundamentally deviates from the “plane section assumption” inherent to classical bending theory [11]. The structural integrity of these members is predominantly governed by complex shear mechanisms rather than flexural actions [12]. Consequently, conventional sectional design methodologies founded upon the Euler–Bernoulli hypothesis are largely inapplicable to such components. The STM has emerged as a robust lower-bound plastic analysis technique [13]. By abstracting the internal force transmission paths within a corbel into a discrete truss system, the STM comprises longitudinal reinforcement ties, concrete compressive struts, and the interconnecting nodal zones.
The STM is globally recognized as a practical and viable framework for predicting the shear capacity of D-region members, and has been formally integrated into major design codes, including the American ACI 318-19 [14], the European EN 1992-1-1 [15], and the Canadian CSA A23.3-19 [16]. Subsequently, the scientific community has pursued continuous refinements to this framework. Ali et al. [17] proposed a modified STM that explicitly accounts for the degradation of concrete compressive strength in response to escalating tensile strains. Russo et al. [18] developed a shear strength calculation model derived from the superposition of a strut-and-tie mechanism (comprising cracked concrete and primary reinforcement) and a horizontal truss mechanism provided by the stirrups. Building upon the foundational STM, Hwang and Lee introduced the Softened Strut-and-Tie Model (SSTM) to incorporate the softening characteristics of concrete under compression, a model whose validity has been substantiated across diverse structural member analyses [19,20,21,22].
Utilizing the Mohr–Coulomb failure criterion, Tan et al. [23] established a specialized STM for the bottom nodal zones of deep beams, accurately capturing the softening effect induced by transverse tensile strains. Kassem et al. [24] formulated a framework analogous to the SSTM, grounded in a secant stiffness approach that comprehensively integrates strain compatibility equations with the constitutive laws of both reinforcement and cracked concrete. Building on these advancements, specialized theoretical research has targeted steel fiber reinforced concrete (SFRC) D-region members. By integrating the softened STM with the discrete shear contribution of steel fibers, Li et al. [25] developed a predictive model specifically tailored for SFRHSC corbels. Mustafa et al. [26] achieved enhanced predictive precision for the ultimate capacity of SFRC corbels through multi-parameter coupling optimization. Furthermore, Zhang et al. [27] utilized a simplified softened STM to adjust the diagonal strut inclination and formulate fiber tensile stress equations, resulting in a shear capacity evaluation method applicable to SFRC beam–column joints.
The current study executes an empirical evaluation targeting the shear behavior inherent to six distinct SFRHSC corbels. Throughout the testing phase, the progressive failure process characterizing these structural elements was systematically monitored, in parallel with the strain profiles propagating across both the reinforcing steel and the concrete matrix. Grounded strictly in the Mohr–Coulomb failure criterion, a specialized analytical methodology for quantifying the shear capacity was constructed utilizing the STM framework. This formulation explicitly integrates the softening effect exhibited by the SFRC, while subsequently incorporating a dedicated mathematical calibration to address the structural size effect. To validate the proposed framework, the newly established shear capacity estimation model—alongside the normative STM directives prescribed by the American code ACI 318-19, the European code EN 1992-1-1, and the Canadian code CSA A23.3-19—was deployed to forecast the ultimate bearing limits. This predictive execution was applied to the subset of 6 internally tested units, alongside an external validation database encompassing 18 previously documented specimens sourced from existing literature [28]. Ultimately, a rigorous quantitative juxtaposition was performed to evaluate the deviations between the analytically forecasted thresholds and the empirically recorded laboratory outcomes.
Both the SSTM proposed in this paper and the existing SSTM [19,20,21,22] are developed on the basis of the STM with consideration of the softening effect of concrete. However, there are essential differences in the establishment of their mechanical models. To transfer shear forces within corbel members, existing SSTM utilize both diagonal and horizontal mechanisms. Deriving the shear capacity in these models entails a relatively cumbersome iterative procedure that explicitly couples force equilibrium equations, material constitutive laws, and compatibility equations. In contrast, the SSTM proposed in this paper is a calculation model established based on the classic Mohr–Coulomb failure criterion, adopting the composite tensile strength considering the tensile contribution of steel fibers, and incorporating size effect correction. On the basis of ensuring clear theoretical basis and distinct mechanical concepts, this model is also relatively simple in calculation.
2. Experimental Program
2.1. Materials
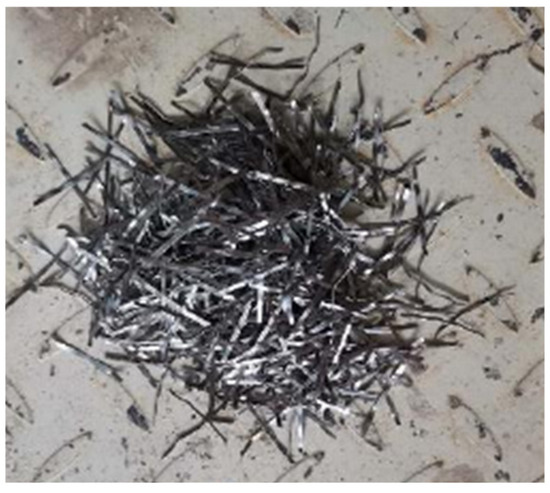
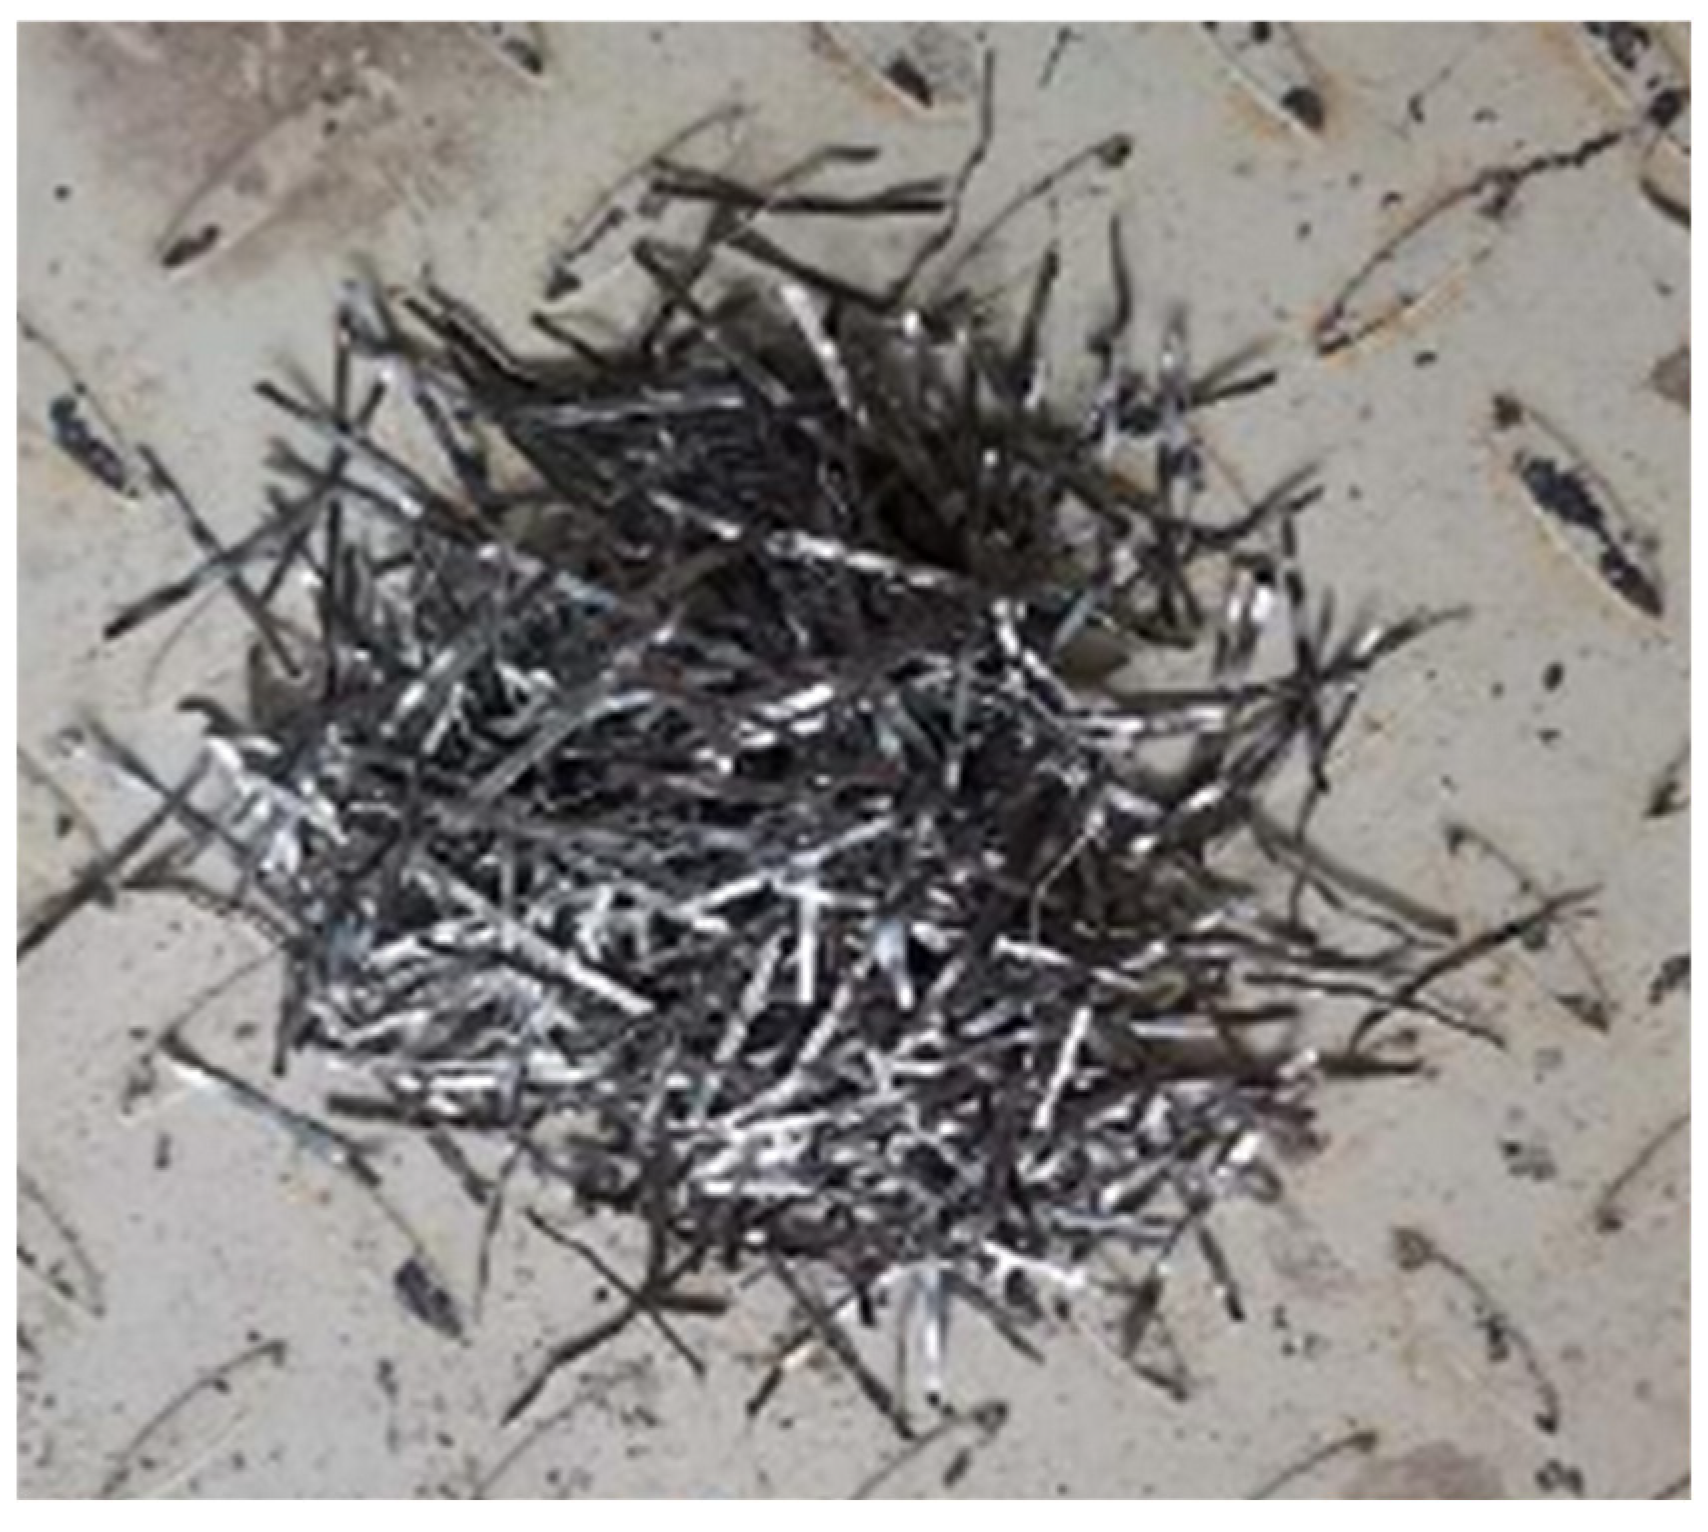
Formulated in compliance with the CECS 38:2004 standard [29], Grade C60 SFRHSC constituted the base material for this empirical investigation. The concrete matrix integrated well-graded medium-coarse sand as the fine aggregate, alongside crushed stone possessing a maximum particle diameter of 20 mm as the coarse aggregate, utilizing 42.5-grade ordinary Portland cement as the primary binding agent. Milled steel fibers—featuring a length of 32 mm, a diameter of 0.75 mm, and an equivalent aspect ratio of 42.7 (illustrated in Figure 1)—were introduced into the mixture, with the definitive SFRHSC proportions detailed in Table 1. To systematically evaluate the mechanical profile, six cubic and six prismatic test blocks were cast concurrently with the main components. The cubic units facilitated the quantification of cube compressive and tensile strengths, while the prisms were implemented to extract the axial compressive strength and linear elastic modulus; these empirically derived mechanical parameters are cataloged in Table 1. Regarding structural reinforcement, 12 mm-diameter HRB400 rebars were configured as the longitudinal elements, supplemented by 10-mm-diameter HPB300 rebars functioning as transverse stirrups. The specific mechanical attributes acquired for these steel reinforcements are documented in Table 2.
Figure 1.
Milled steel fibers used in the study.
Table 1.
Mix proportions and mechanical properties of the SFRHSC.
Table 2.
Mechanical properties of the steel reinforcement.
2.2. Specimen Design and Instrumentation
An experimental program was formulated involving the casting of six SFRHSC corbel specimens, individually labeled from CW01 through CW06. Each structural unit was strictly engineered to incorporate a welded anchorage system tailored for the longitudinal reinforcement. The parametric investigation was driven by two principal independent variables: the shear span-to-depth ratio (denoted as λ) and the steel fiber volume fraction (denoted as ). To systematically isolate the effects of these parameters, the test subjects were segregated into two comparative cohorts. Cohort one, encompassing specimens CW01 through CW04, was subjected to an ascending series of shear span-to-depth ratios—specifically 0.2, 0.3, 0.4, and 0.5—while fixing the steel fiber volume fraction at a uniform baseline of 1.5%. Conversely, cohort two, uniting specimens CW02, CW05, and CW06, preserved a strict shear span-to-depth ratio of 0.3, evaluating a decrementing progression of steel fiber dosages at 1.5%, 0.75%, and 0%, respectively. Regarding the unified geometric configurations, every tested corbel shared an identical cross-sectional width measuring 200 mm, coupled with an exterior cantilevered height of 200 mm and an overarching total height reaching 450 mm.
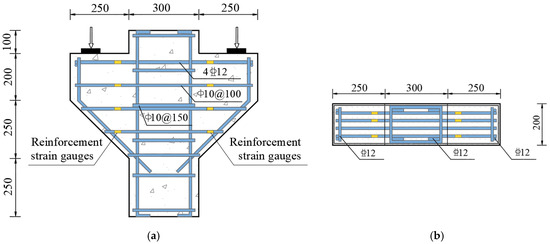
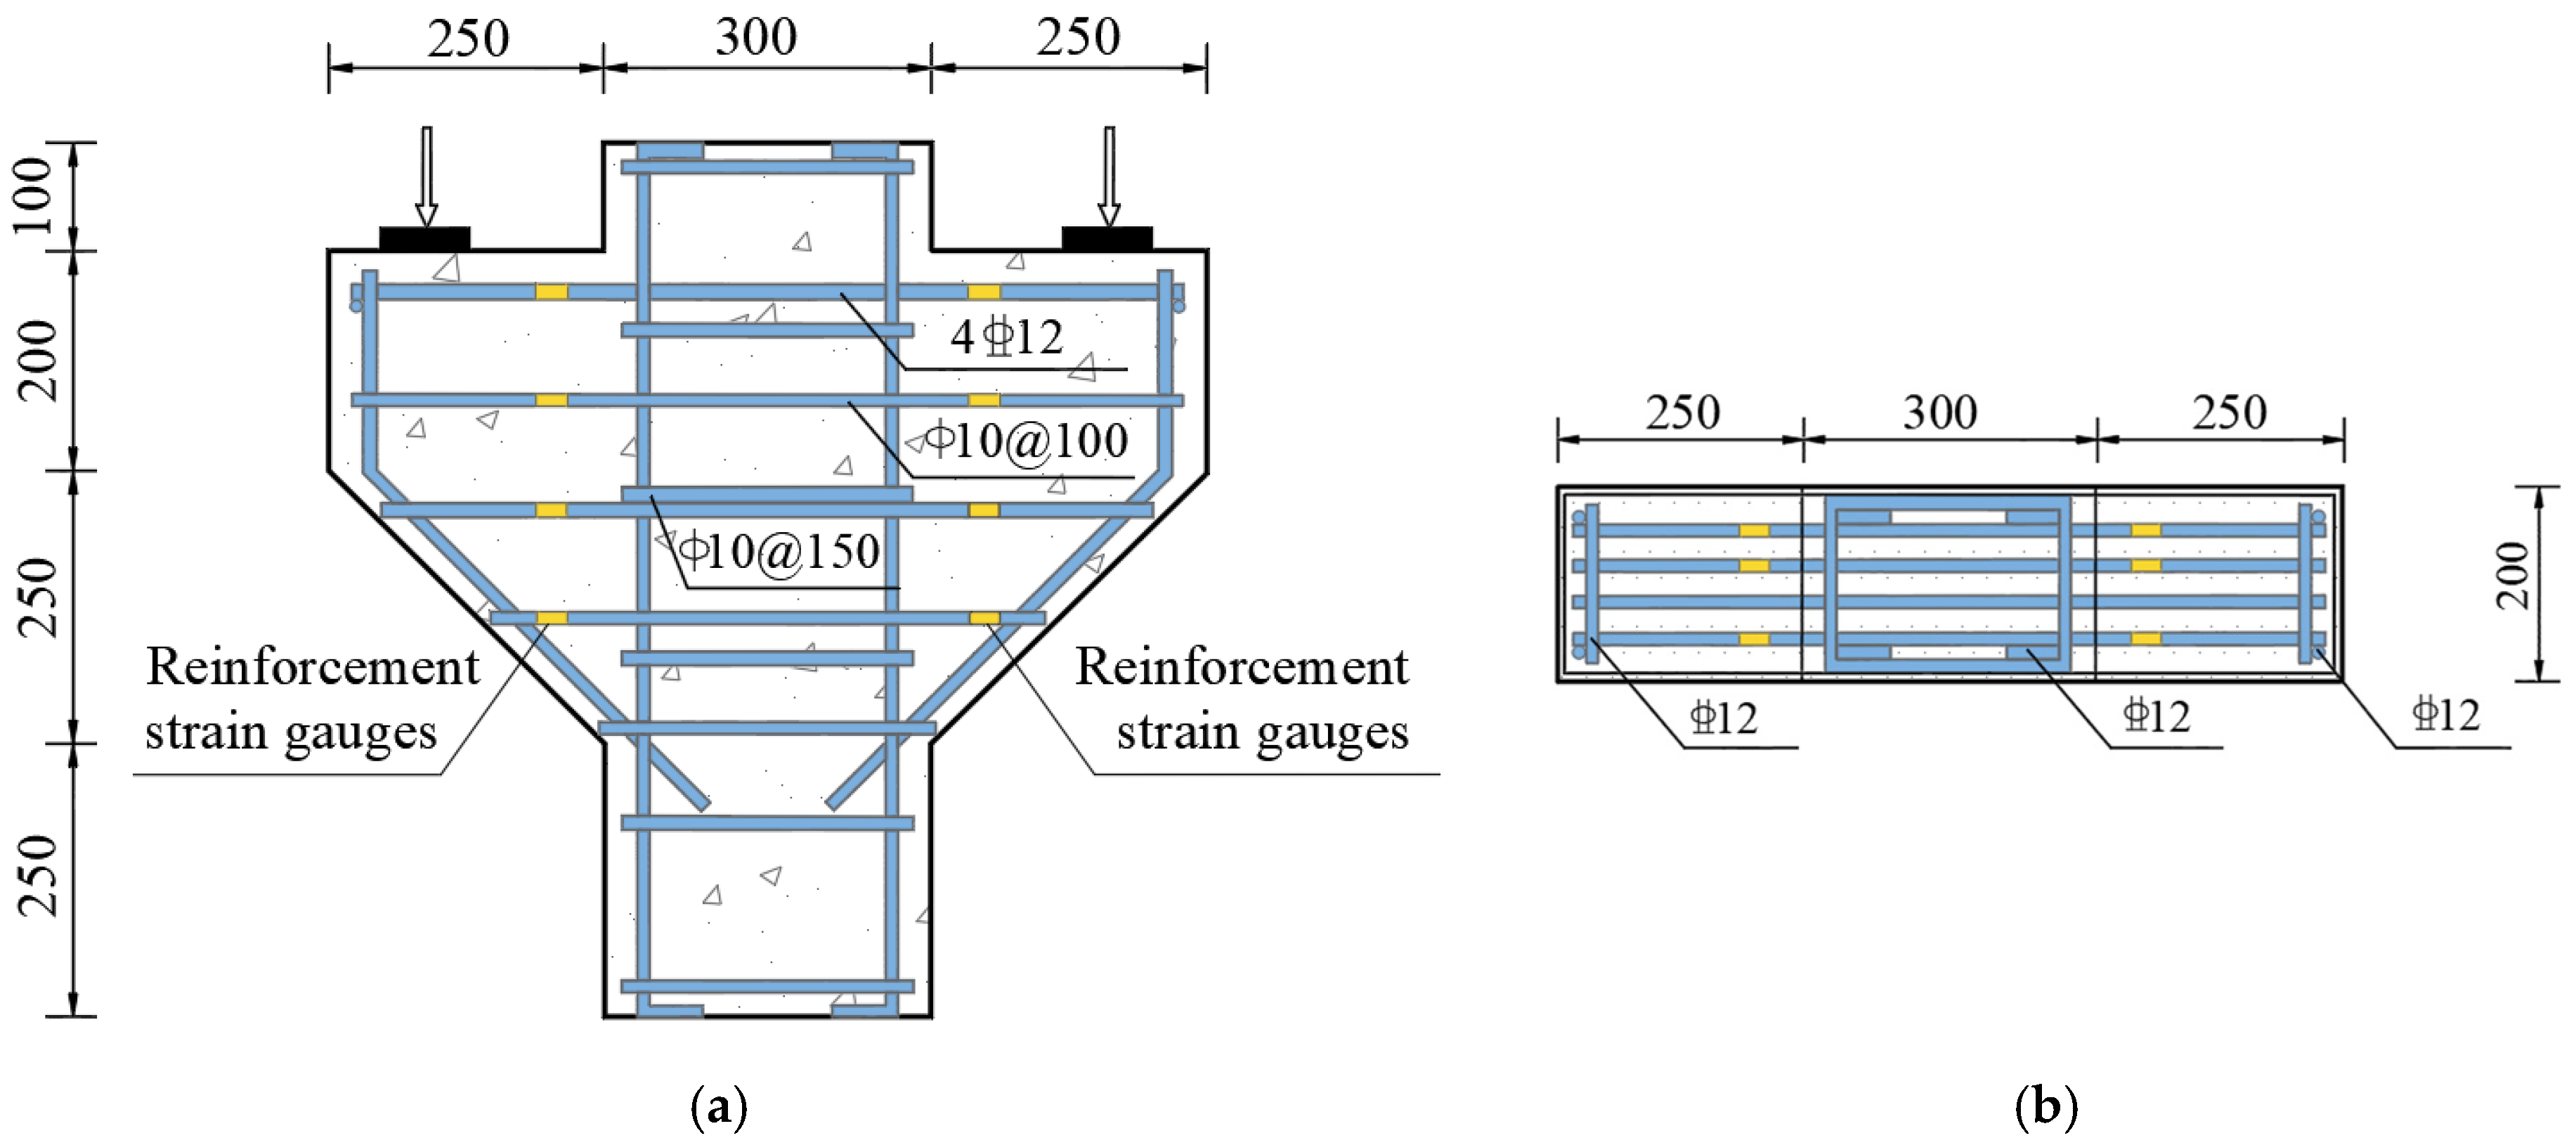
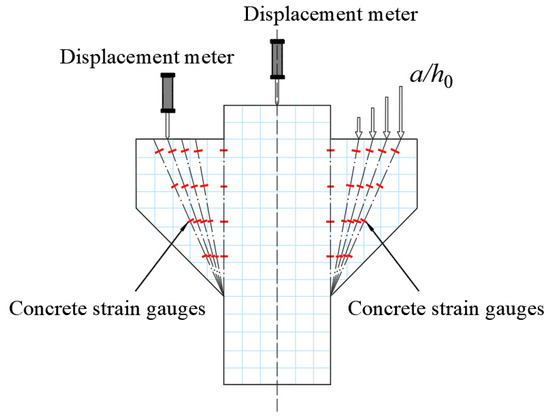
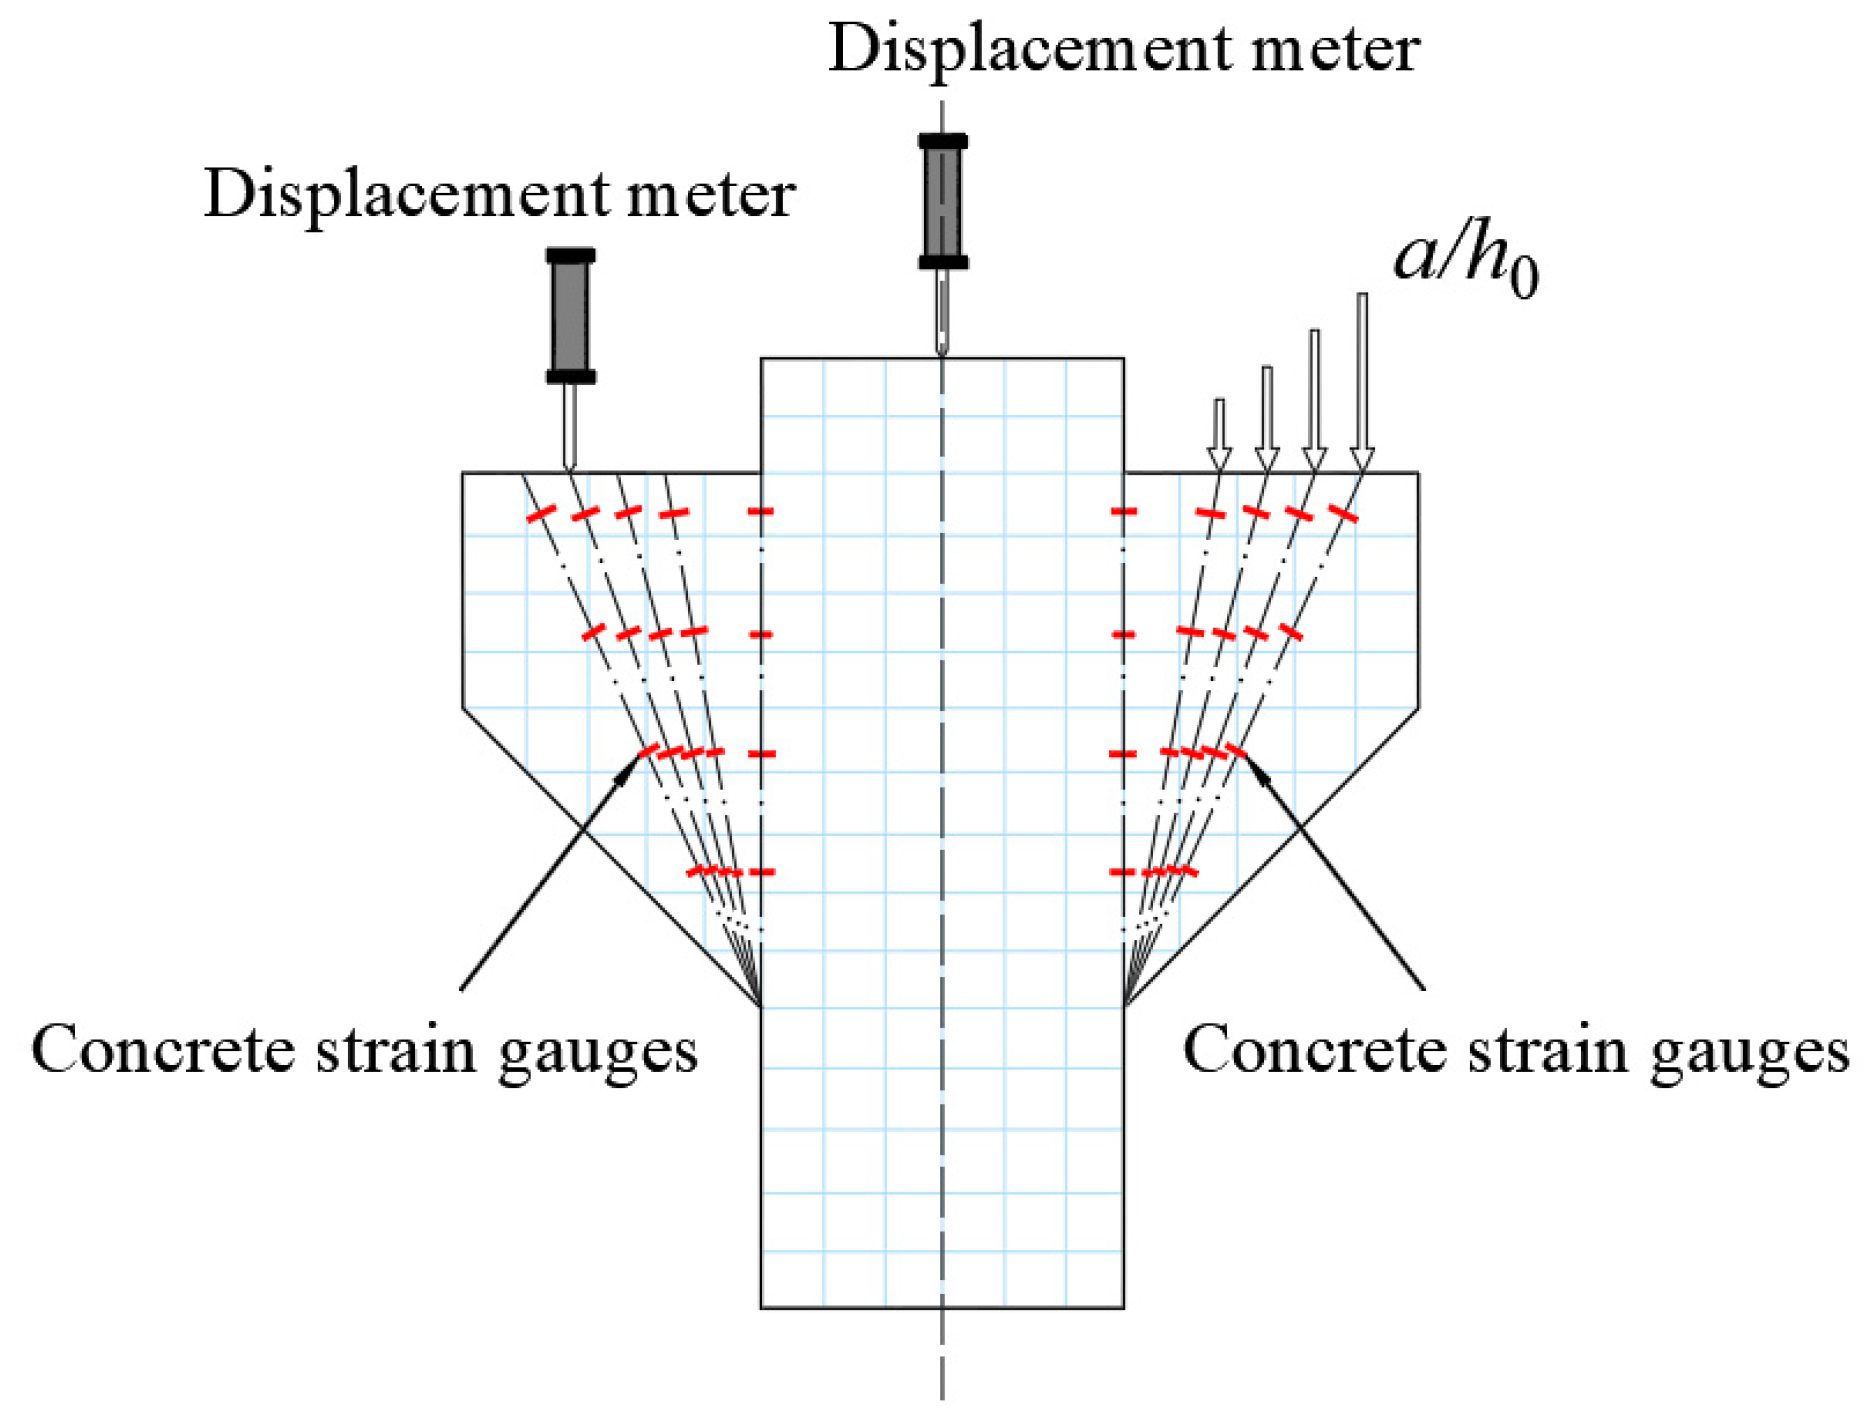
All corbels had a cross-sectional width of 200 mm, a cantilevered height of 200 mm, and a total height of 450 mm. The reinforcement configuration was identical for all specimens. Four 12 mm-diameter HRB400 steel bars were arranged longitudinally as tensile reinforcement, anchored by welding, resulting in a reinforcement ratio of 0.55%. For transverse reinforcement, ten 10 mm-diameter HPB300 stirrups were provided, corresponding to a reinforcement ratio of 0.78%. Strain tracking throughout the applied loading sequence was accomplished via the symmetric installation of six sensing gauges onto the longitudinal tension rebars, utilizing a 100 mm offset from the lower column boundary (leaving a single longitudinal bar unmonitored). Adopting a comparable spatial layout, the strain sensors allocated to the transverse stirrups were uniformly deployed on both sides, maintaining an identical 100 mm offset from the column junction. Similarly, strain gauges on the stirrups were also positioned at 100 mm from the column junction and distributed evenly on both sides. Figure 2 depicts the dimensions, reinforcement details, and strain gauge arrangement for the corbel specimens, with the corresponding design parameters tabulated in Table 3. Executing real-time strain surveillance across the normal and diagonal concrete sections, while simultaneously regulating the empirical procedure, necessitated the symmetric attachment of sixteen concrete strain sensors onto critical failure-prone regions of every specimen. As illustrated in Figure 3, this bilateral layout systematically assigned eight gauges to the normal plane and another eight to the inclined interface (with positioning dependent upon the shear span-to-depth ratio). To systematically quantify load-induced deflections and capture support settlement, three displacement transducers were instrumented at the primary column and the bilateral supporting bases (Figure 3). All dynamic data streams emanating from the metallic and concrete strain sensors, alongside the displacement metrics, were continuously logged utilizing an IMP data acquisition terminal. Crack widths were observed using a KON-FK(N) crack width microscope with a minimum scale division of 0.01 mm.
Figure 2.
Reinforcement details and strain gauge arrangement of the corbel specimen. (a) Front view; (b) top view.
Table 3.
Design Parameters of the Corbel Specimens.
Figure 3.
Layout of concrete strain gauges and displacement transducers.
2.3. Loading Protocol
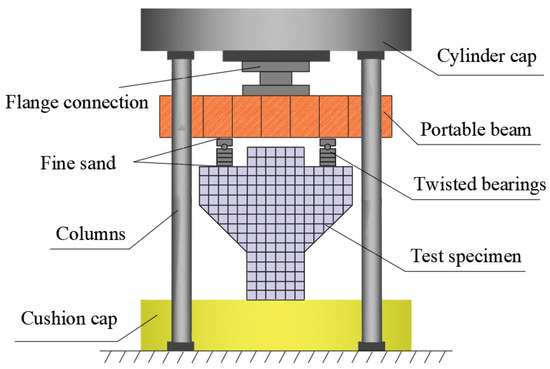
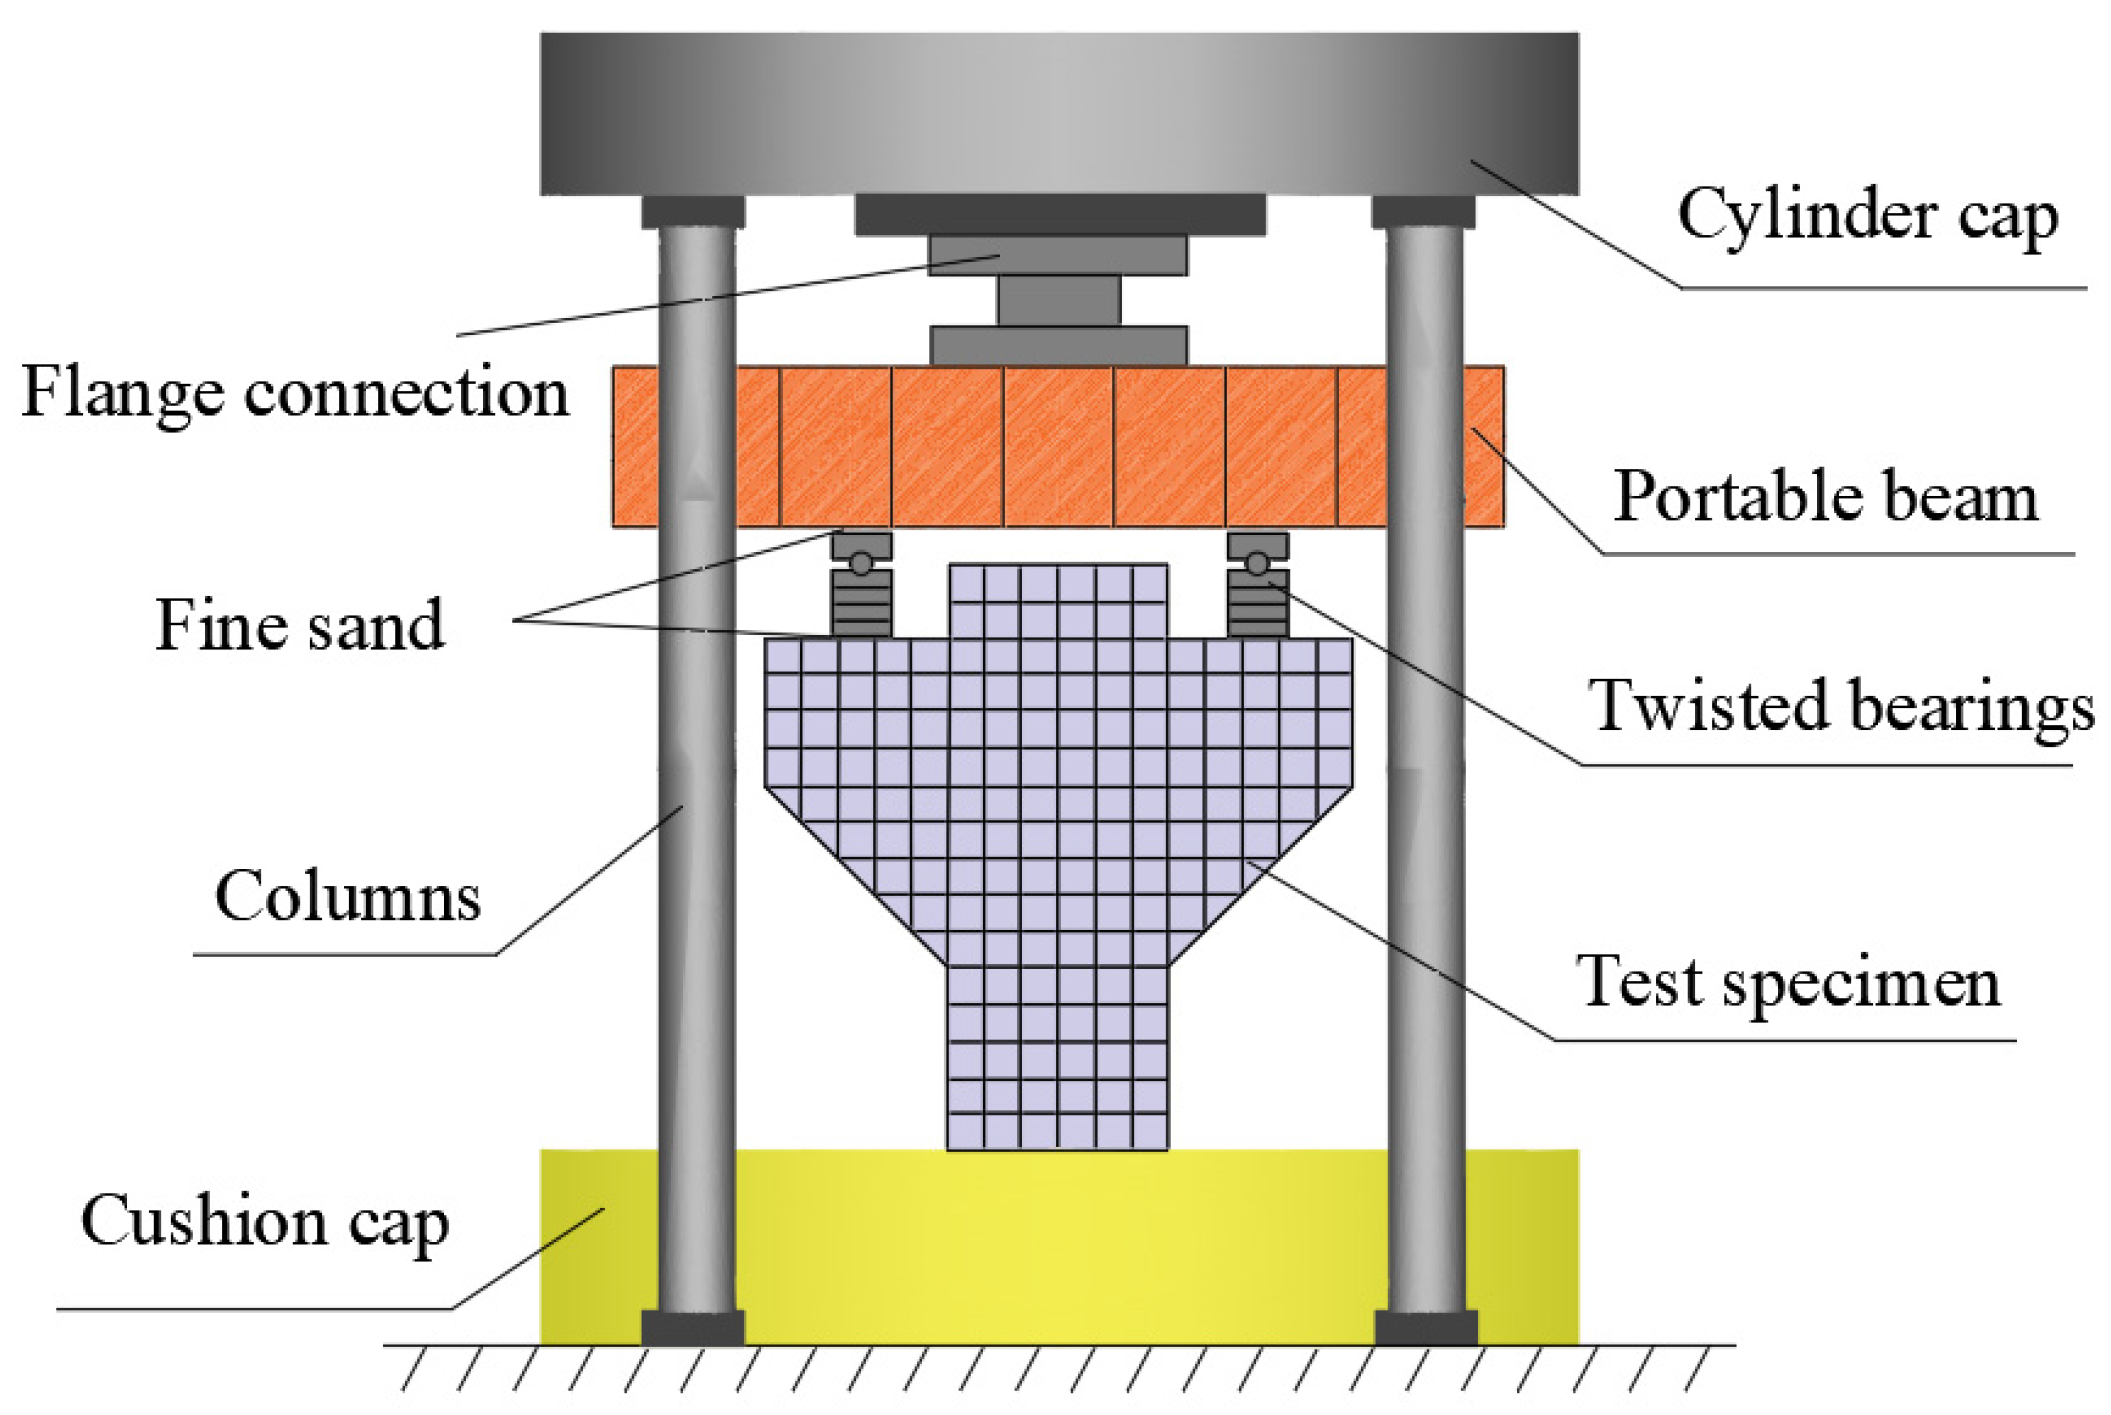
Symmetrical loading was administered utilizing a 500-ton three-beam, four-column hydraulic press, which featured a platen measuring 400 mm × 80 mm × 20 mm. A non-rigid constraint characterized the contact boundary between the press and the loading point; specifically, a circular shaft was deployed to remove horizontal restraint, thereby guaranteeing a strictly vertical loading trajectory. Furthermore, to preclude stress concentrations, the interfaces separating the specimen, the loading molds, and the hydraulic press were uniformly leveled with fine sand, as depicted in Figure 4. Prior to formal loading, a preloading step of 30 kN was applied to seat the specimen, compact any gaps, level the loading assembly, and verify the proper functioning of all instruments. After preloading, all data acquisition channels were zeroed. Subsequently, formal loading commenced in increments of 60 kN up to a total load of 480 kN. Each load level was maintained for 2 min to allow readings to stabilize before data were recorded. Beyond 480 kN, the load increment was increased to 100 kN per step until specimen failure. Following failure, during the unloading phase, data were recorded each time the load was reduced in 100-kN decrements until the test concluded at a load of 800 kN.
Figure 4.
Test setup for loading.
3. Experimental Results and Analysis
3.1. Failure Process and Modes
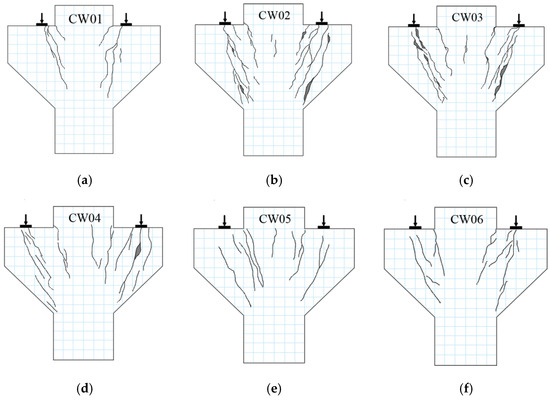
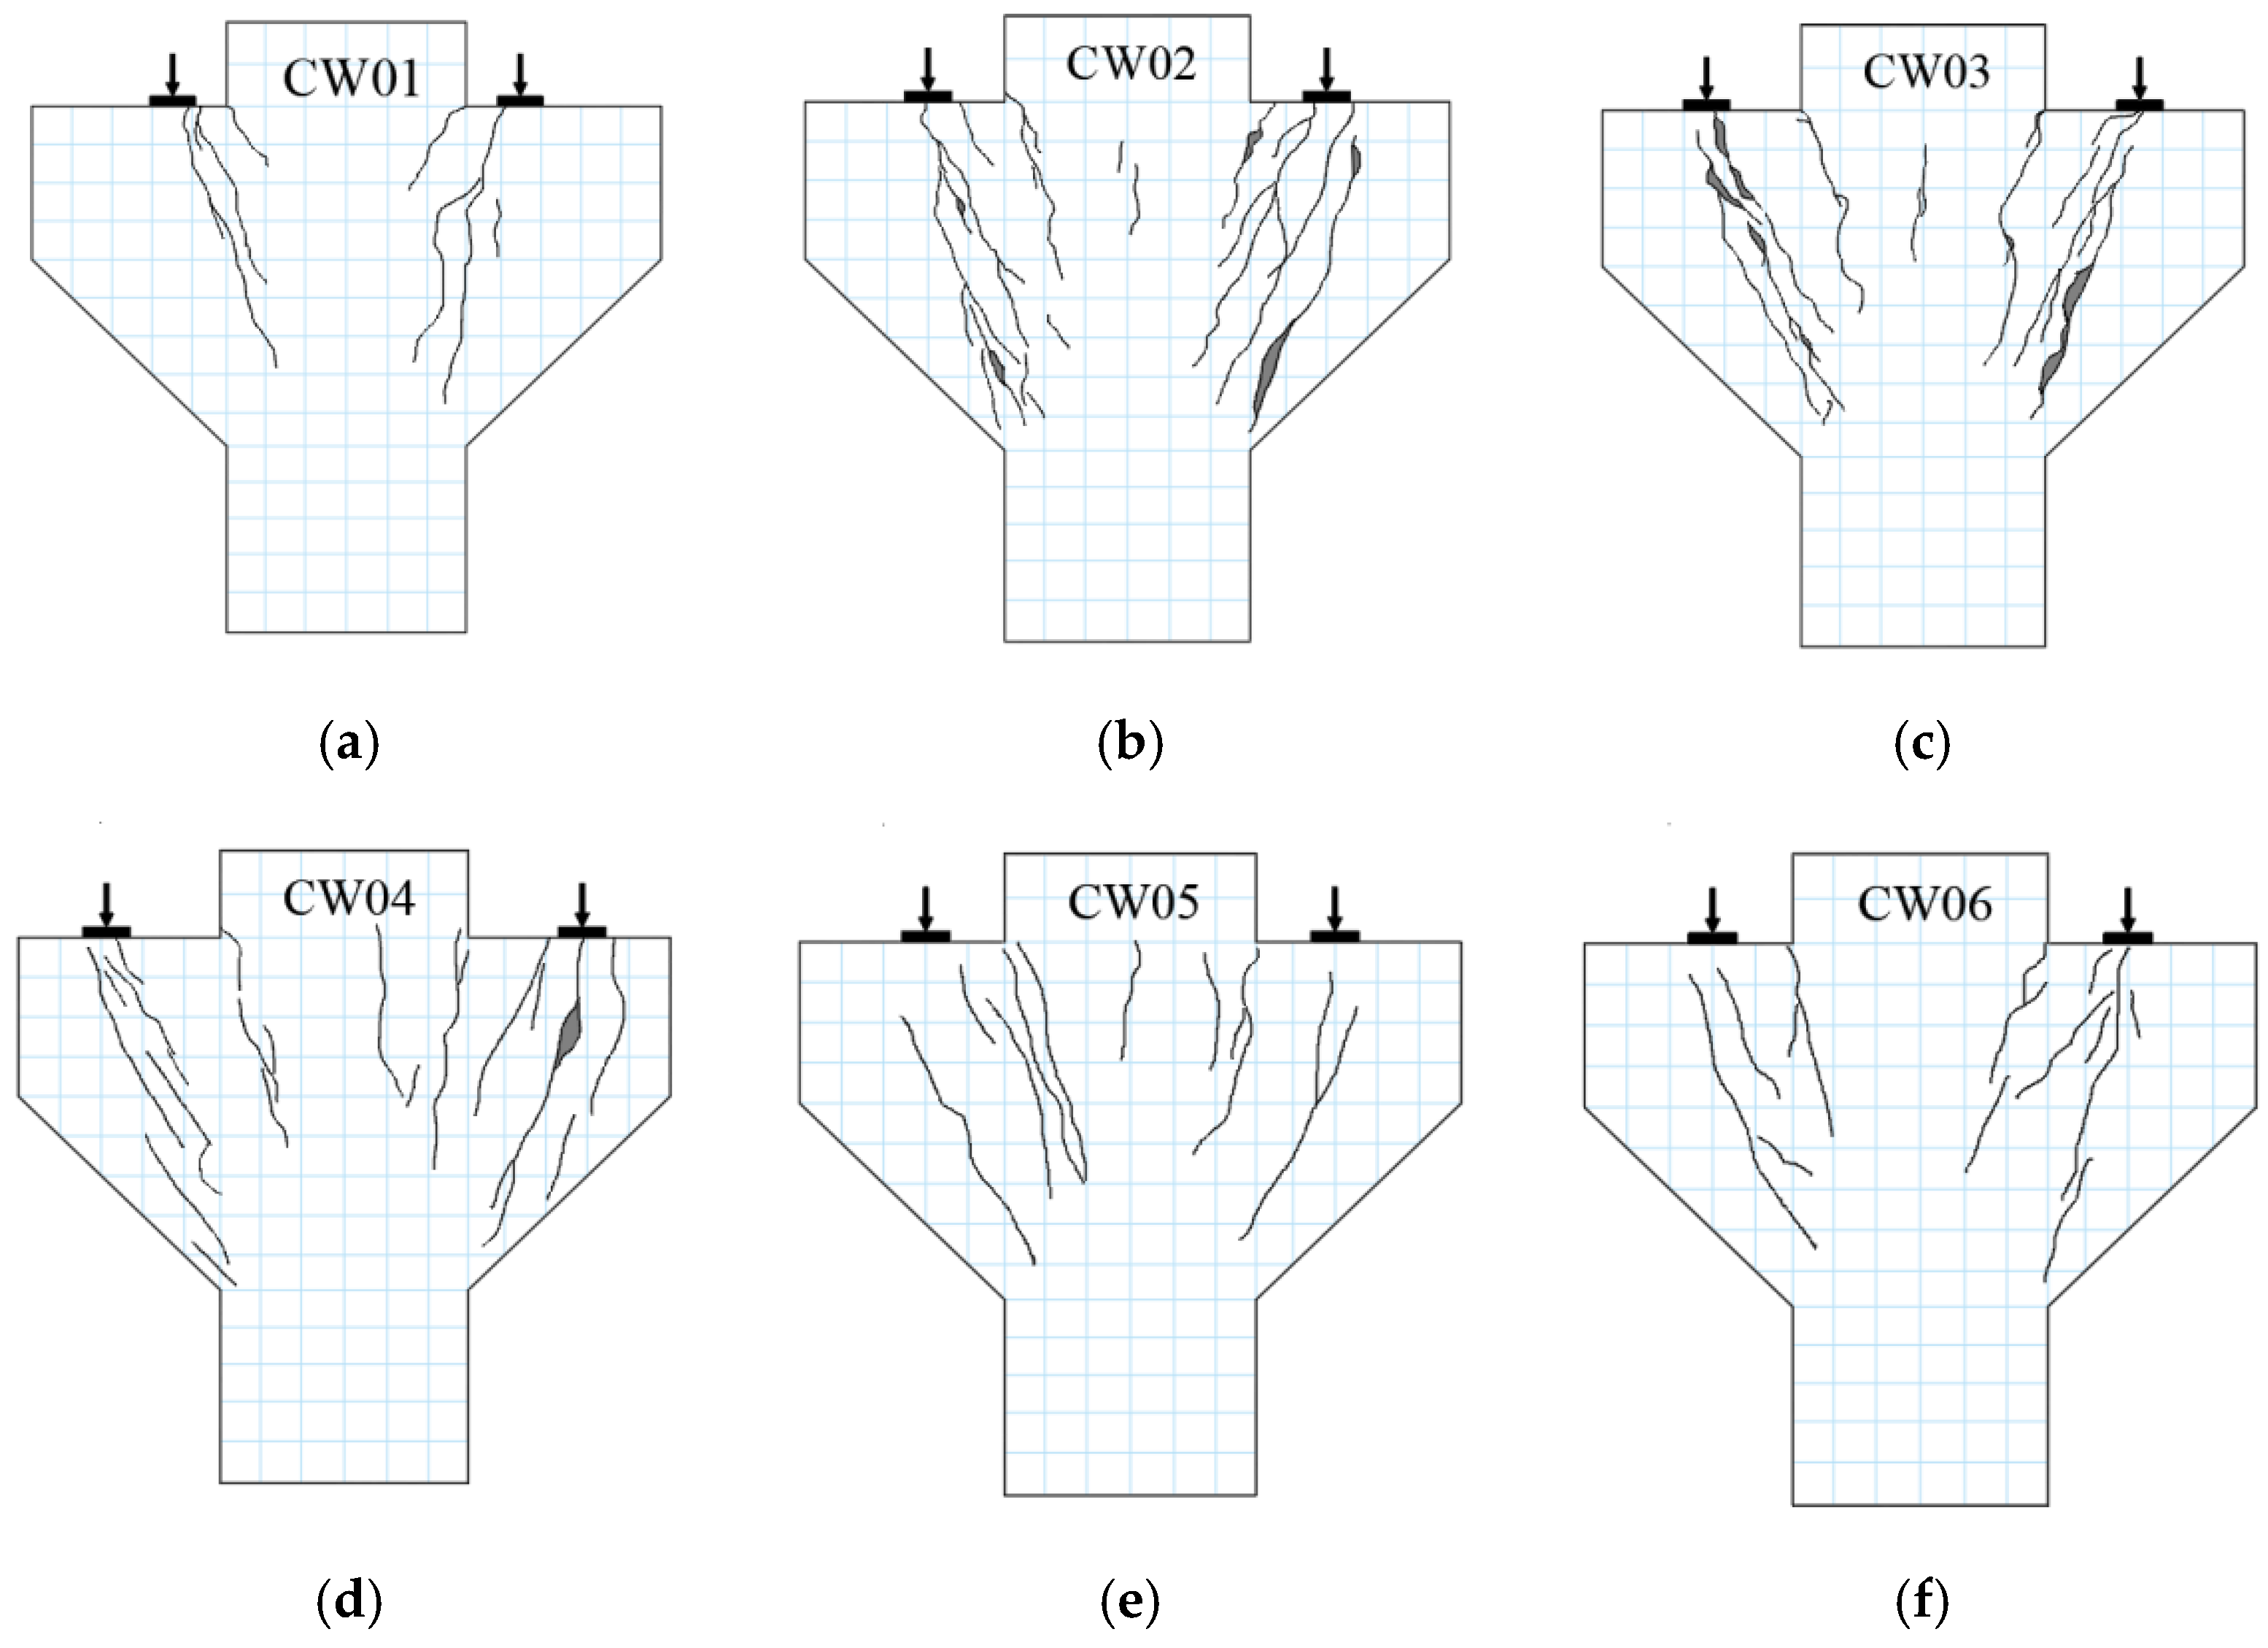
For an individual specimen, the progression from initial loading to final failure primarily encompassed three distinct stages: initial cracking, through cracking, and ultimate failure. The observed failure patterns were as follows: At the onset of loading, no cracking was observed. Upon attaining an applied load of roughly 150 to 200 kN, the initiation of vertical cracks was observed at the column–corbel interface, observed on either the left or right side. As the load increased, existing cracks exhibited a tendency to widen, and new cracks formed, increasingly displaying a symmetric pattern on both sides. The emergence of the initial diagonal crack was recorded at a load magnitude roughly two to three times the cracking threshold, propagating along the axis connecting the load application point to the cantilever base—an orientation geometrically parallel to the compressive strut within the STM. With further load increase, reaching about 74% to 82% of the ultimate load, a dense network of short, inclined cracks developed within the region of the external compression strut. These cracks began to interconnect and propagate through the section, maintaining a symmetric distribution. Concurrently, crack widths increased significantly, reaching magnitudes on the order of millimeters. As the load approached the ultimate load, cracks continued to widen, with some multiplying in width. At this juncture, a continuous diagonal crack spanning from the load application point to the base of the corbel could be distinctly observed. This was immediately followed by a distinct sound of concrete crushing, leading to the final failure of the specimen. The progressive crack evolution alongside the corresponding failure configurations for each tested unit is visually documented in Figure 5. As observed from the crack propagation in the three specimens (CW02, CW05, and CW06) with different steel fiber volume fractions, the addition of steel fibers effectively suppresses crack coalescence and macroscopic crack extension, dispersing concentrated stresses. The cracking pattern of the specimens’ transitions from a single wide crack to multiple fine and dense short cracks, significantly reducing the overall crack propagation rate. These observations indicate that the robust interfacial adhesion between the steel fibers and the concrete matrix mitigates localized stress concentrations at crack sites and restrains progressive fracture propagation, which in turn upgrades the tensile capacity of the cracked concrete and augments the global shear performance of the SFHSC corbels.
Figure 5.
Failure modes of the specimens. (a) CW01; (b) CW02; (c) CW03; (d) CW04; (e) CW05; (f) CW06.
3.2. Reinforcement Strain
3.2.1. Longitudinal Reinforcement Strain
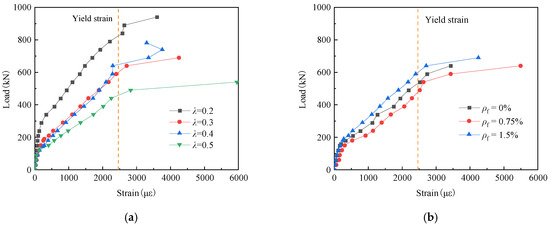
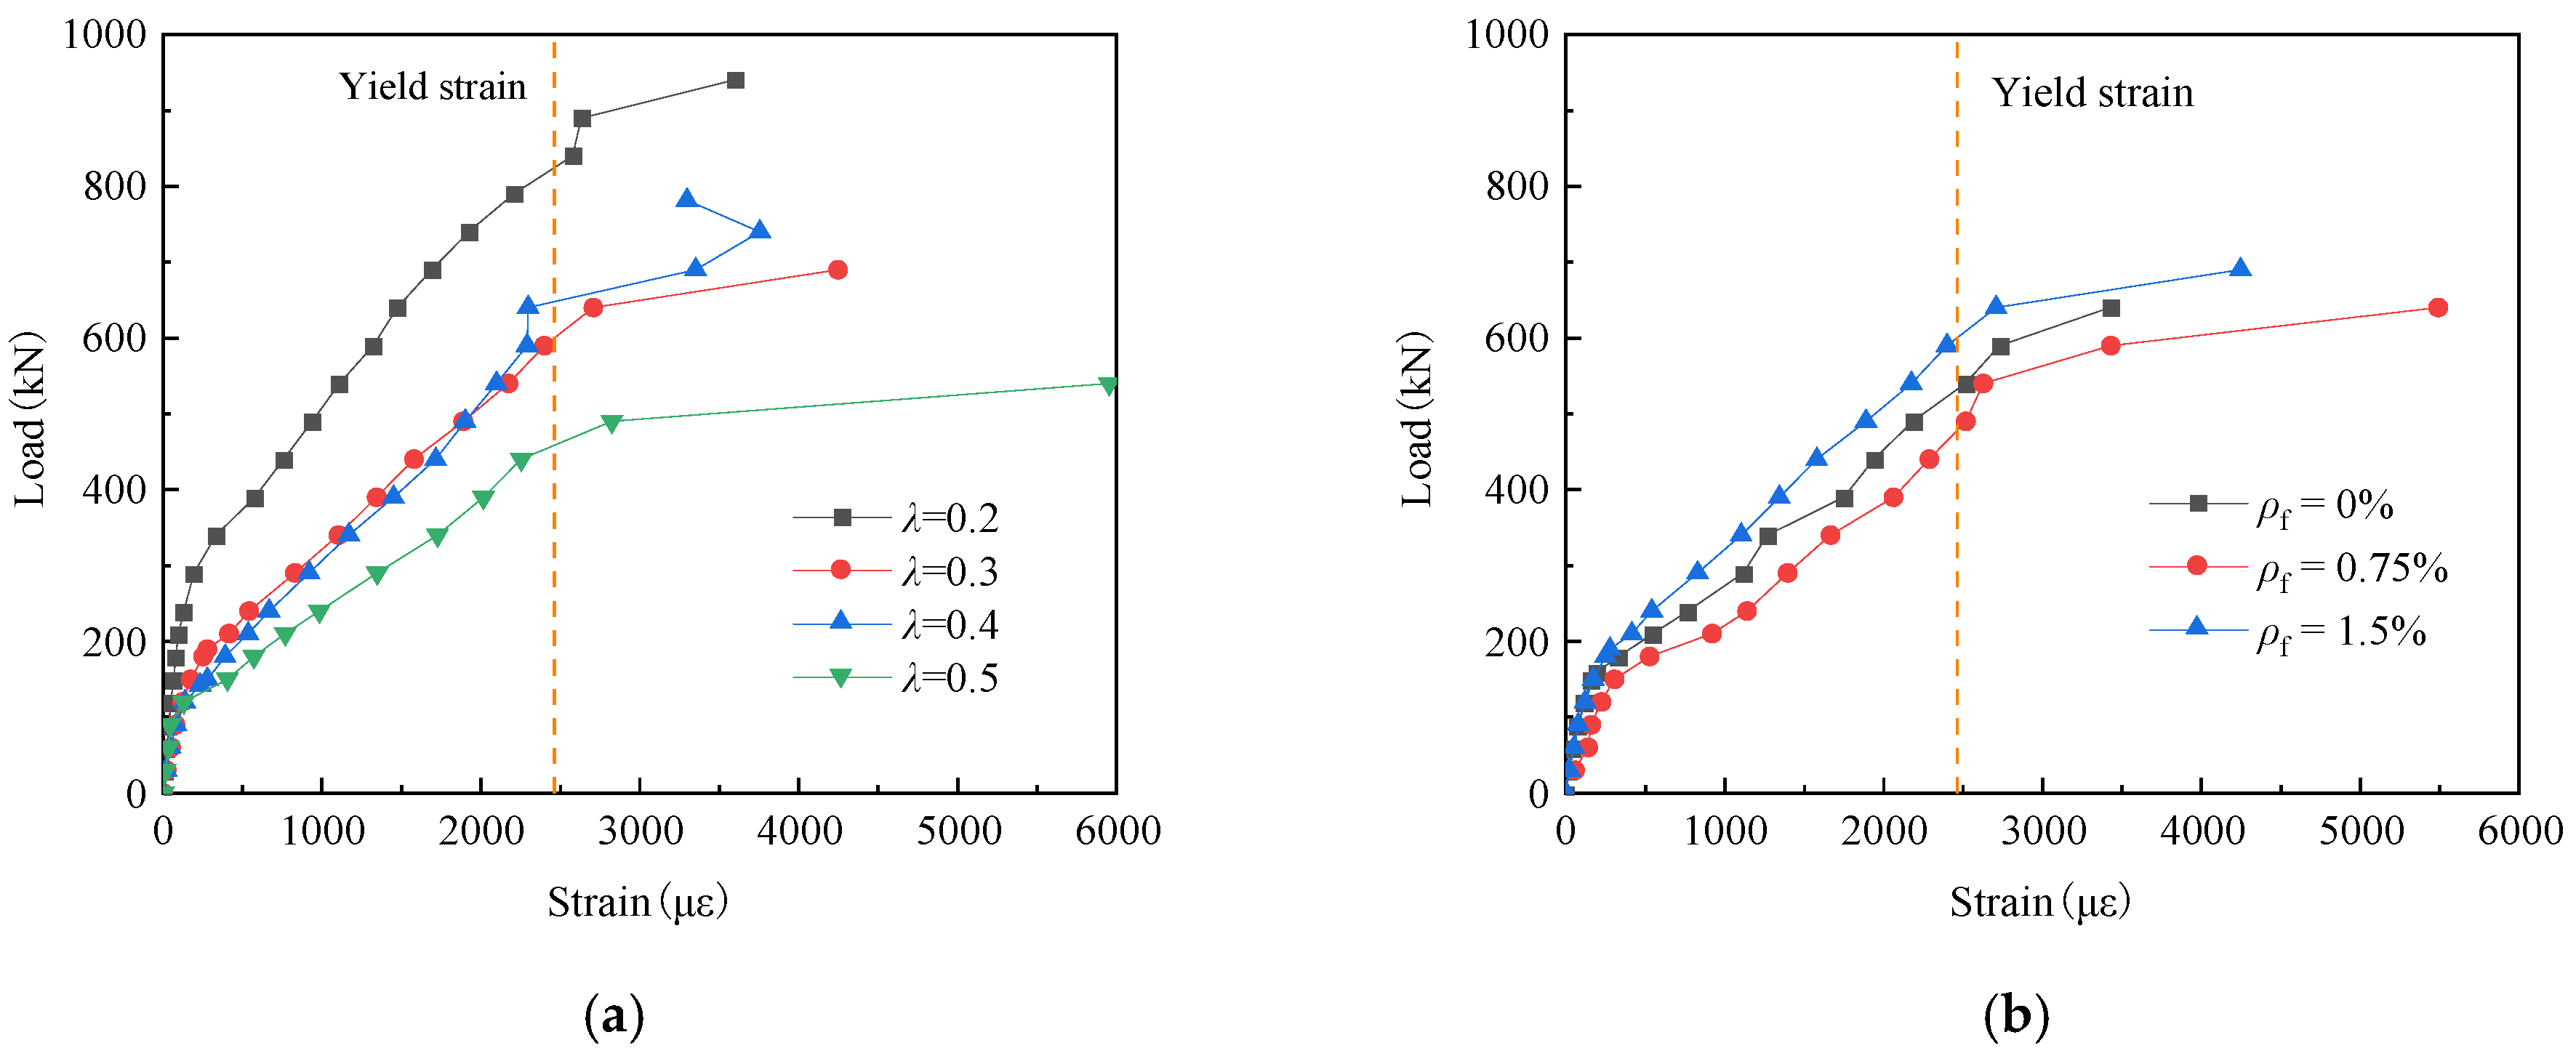
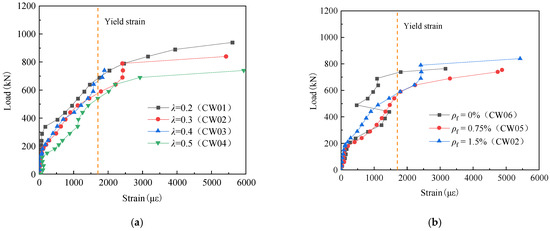
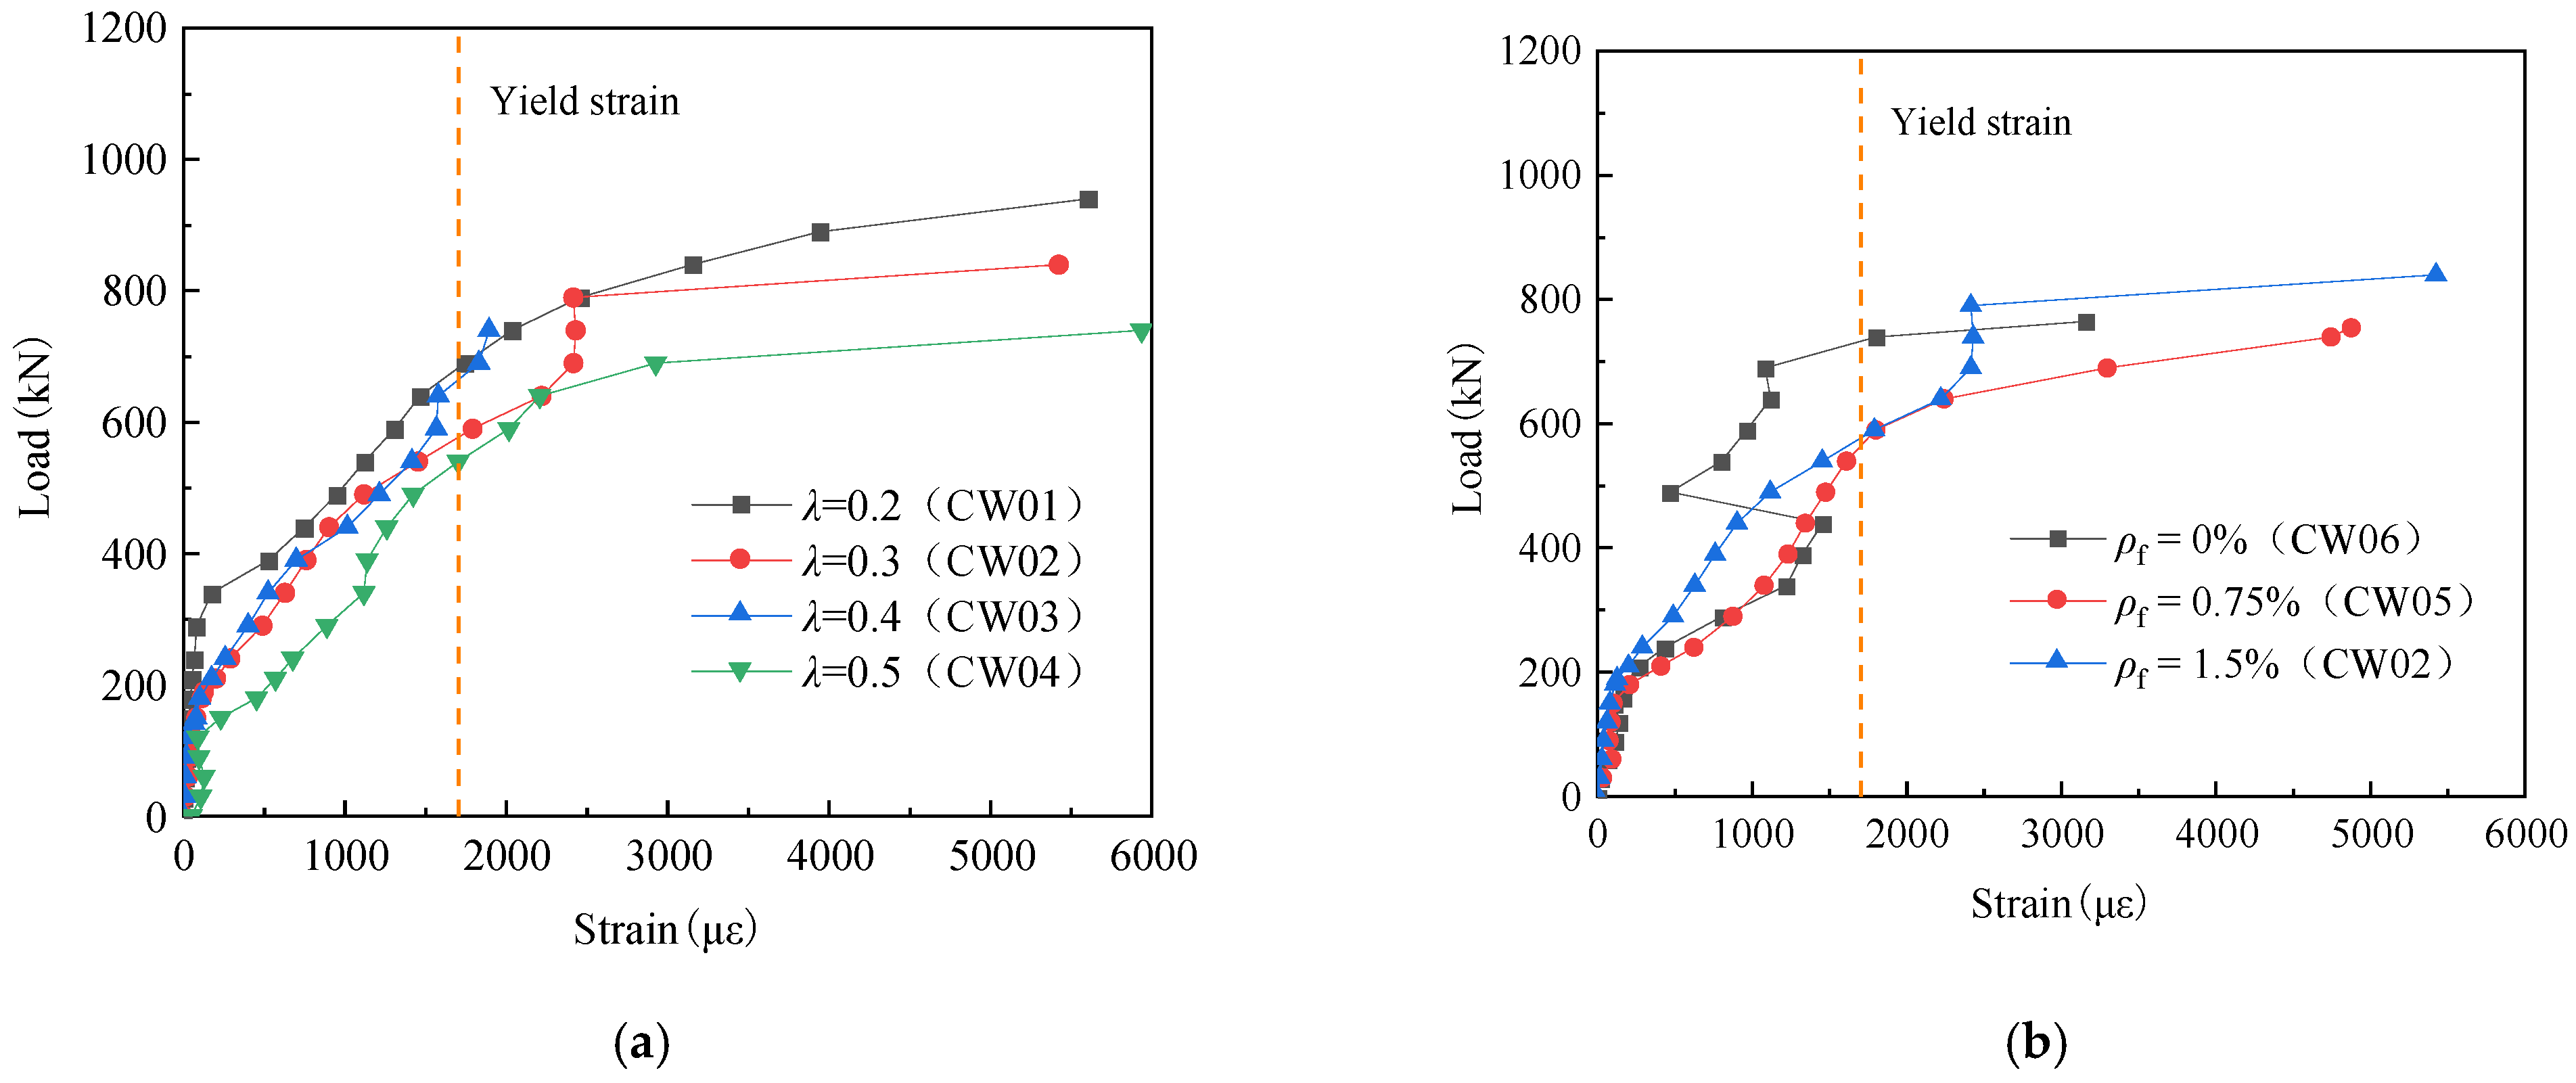
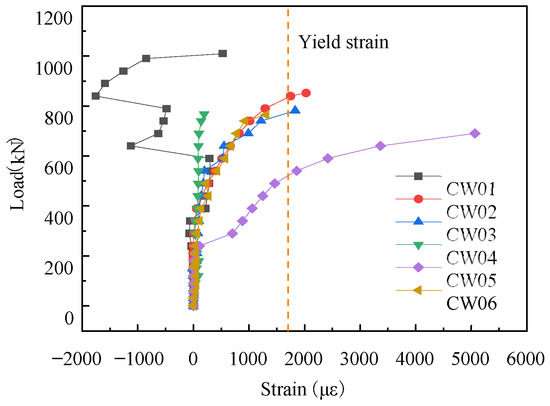
The load–strain relationships for the longitudinal reinforcement are graphically detailed in Figure 6, where the vertical axis quantifies the load sustained by a single corbel flank. As illustrated, prior to ultimate structural failure, all SFRHSC corbels with shear span-to-depth ratios ranging between 0.2 and 0.5 universally achieved the yield state across their longitudinal reinforcement. This outcome perfectly fulfills the initial experimental design objectives; furthermore, the yielding status of the longitudinal reinforcement serves as a preliminary indicator for diagnosing the specimen’s prevailing failure mode. During the initial loading phase (prior to reaching approximately 40% of the ultimate load), the strain within the longitudinal reinforcement remained relatively marginal, implying that the applied forces were predominantly resisted by the SFRHSC matrix. Accompanied by the initiation and propagation of concrete cracking, the strain in the longitudinal reinforcement experienced a rapid escalation. This phenomenon is fundamentally driven by a stress redistribution mechanism, whereby a fraction of the load is transferred directly to the longitudinal reinforcement following the onset of matrix fracture. Referring to Figure 6a, under equivalent load levels, the strain in the longitudinal reinforcement demonstrates a positive correlation with the shear span-to-depth ratio. This trend substantiates that the flexural contribution of the longitudinal reinforcement is progressively magnified as the shear span-to-depth ratio expands. Concurrently, the threshold load required to trigger yielding in the longitudinal reinforcement exhibits an inverse relationship with the shear span-to-depth ratio. These observations consequently deduce that variations in this geometric parameter comprehensively govern both the initiation and subsequent development of cracks. Based on the graphical evidence in Figure 6b, under identical loading conditions, specimens incorporating a 1.5% steel fiber volume fraction display lower strain in the longitudinal reinforcement compared to their counterparts with 0% and 0.75% contents. This behavioral variance is governed by the crack-arresting mechanism of the included steel fibers, which inherently restricts progressive fracture propagation and thereby empowers the SFRHSC to endure a greater proportion of the applied load.
Figure 6.
Load–strain relationship of the longitudinal reinforcement. (a) Shear span-to-depth ratio ; (b) steel fiber volume fraction .
3.2.2. Stirrup Strain
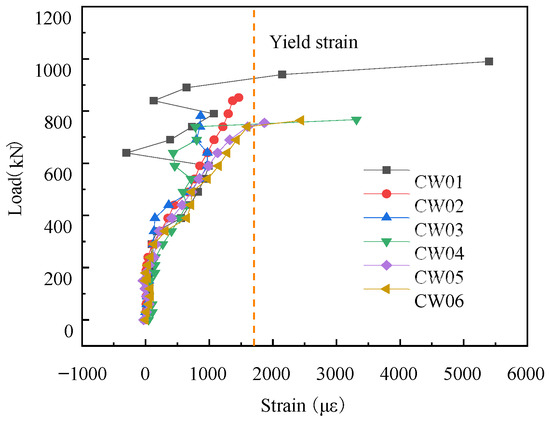
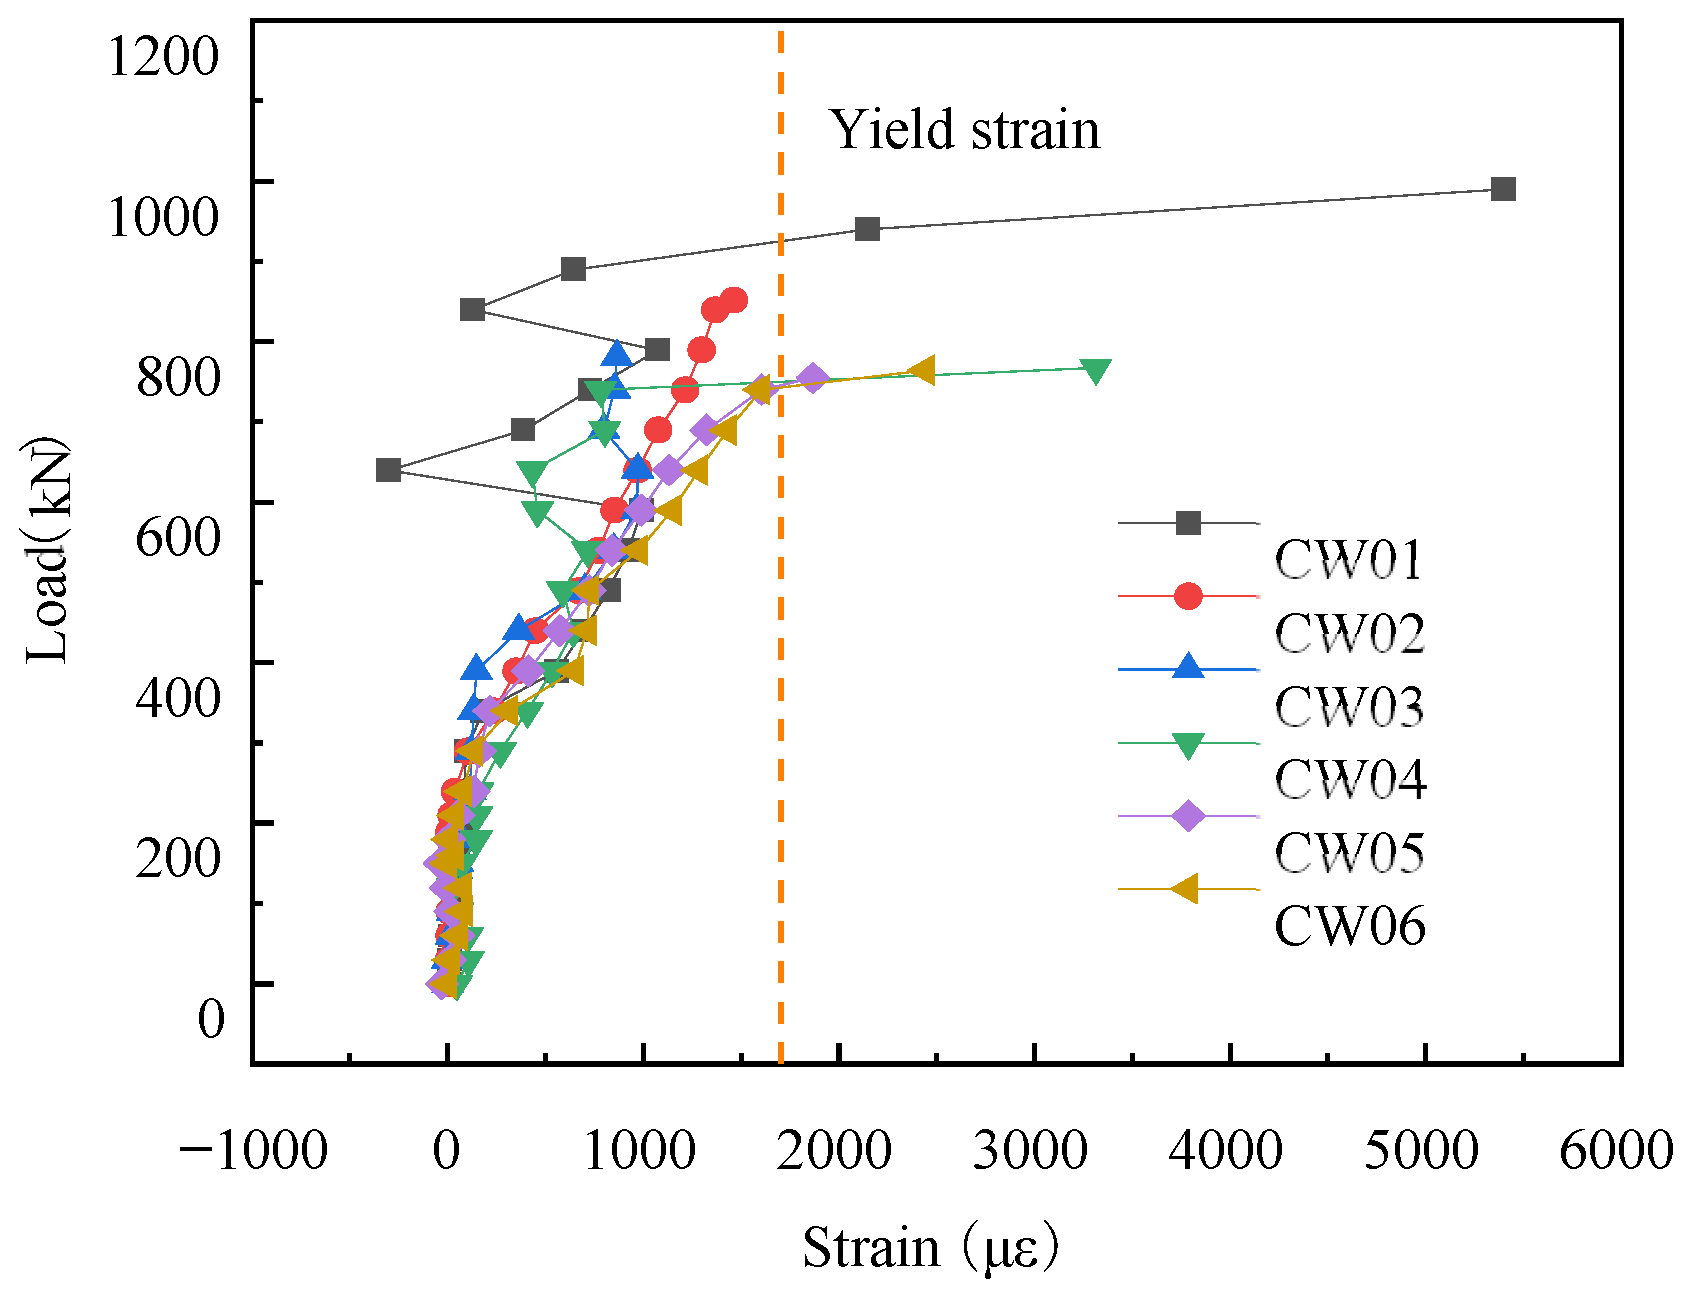
The load–strain relationships for the horizontal stirrups are graphically depicted in Figure 7, Figure 8 and Figure 9, where the vertical axis quantifies the load sustained by a single side of the corbel. As illustrated, upon structural failure, the primary layer of stirrups across all corbel specimens characterized by shear span-to-depth ratios between 0.2 and 0.5 surpassed the yield strain threshold. Conversely, portions of the stirrups in the second and third layers failed to attain the yield state. During the initial loading stage, stirrup strains were relatively small, indicating behavior within the elastic range. As cracks initiated and propagated, stirrup strains increased rapidly. This is primarily attributed to the stirrups carrying a greater share of the load following concrete cracking. An examination of the strain profiles across various layers of stirrups within specimen CW01 reveals a distinct behavior in the lower horizontal stirrups. Specifically, once the applied force exceeded 50% of the ultimate load, the strain measured in the lower horizontal stirrups shifted from a positive to a negative value. This transition signifies a fundamental stress reversal within these stirrups, pivoting from a tension-dominated to a compression-dominated state, which rigorously corroborates the macroscopic stress distribution intrinsic to the corbel. As depicted in Figure 7a, when subjected to equivalent load levels, the strain recorded in the horizontal stirrups increases progressively with the shear span-to-depth ratio. This positive trend confirms that the structural contribution of the horizontal stirrups is substantially enhanced at larger shear span-to-depth ratios. Furthermore, Figure 7b demonstrates that during the early loading stage, an elevated steel fiber volume fraction precipitates a corresponding reduction in the stirrup strain. This mitigation can be ascribed to the fracture-bridging effect provided by the steel fibers, which effectively bolsters the global load-bearing capacity of the SFRHSC matrix. Notably, upon the applied load reaching the 440 kN threshold, an abrupt discontinuity was observed in the stirrup strain trajectory of specimen CW06; this sudden variation is a direct physical consequence of localized redistributions within the internal stress field.
Figure 7.
Load–strain relationship of the first-layer stirrups. (a) Shear span-to-depth ratio ; (b) steel fiber volume fraction .
Figure 8.
Load–strain relationship of the second-layer stirrups.
Figure 9.
Load–strain relationship of the third-layer stirrups.
3.3. Concrete Strain
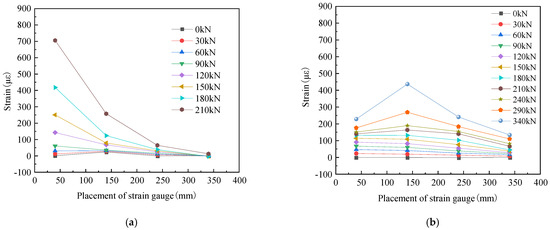
As visually delineated, specimen CW02 is adopted as a representative paradigm to elucidate the concrete strain profiles across both the normal and inclined sections of the SFRHSC corbel when subjected to external loading. An assessment of the resulting plots demonstrates that the concrete strain developing along the normal section exhibits a markedly higher intensity compared to the strain responses recorded on the inclined section.
This suggests that the stress distribution field near the normal section is denser and undergoes more dramatic changes compared to the inclined section. The concrete strain on both sections decreases with increasing distance from the loading point, a consequence of the changing moment arm. Observations derived from Figure 10a indicate that, prior to the onset of cracking, the strain developed within the normal section of the SFRHSC corbel remains marginal and exhibits a fundamentally linear correlation, thereby conforming to the plane section assumption. As the applied load continues to amplify, however, the concrete strain measured at this normal section transitions into a distinctly non-linear growth pattern, ultimately invalidating the aforementioned plane section assumption. Consequently, this behavior confirms that introducing steel fibers fails to rectify the inherent non-conformity of the corbel’s normal section to the plane section assumption, a phenomenon that corroborates the empirical deductions reported by Fattuhi et al. [30,31]. According to Figure 10b, the concrete strain increment on the inclined section remains marginal during the preliminary loading phase. However, once the load surpasses a specific threshold, the strain amplification becomes notably distinct, essentially mirroring the strain mechanics inside the inclined concrete strut. From a holistic standpoint, the concrete strain evolution across the inclined section of the SFRHSC corbel is characterized by a diminished degree of systematic regularity relative to the highly structured patterns observed in the normal section; this discrepancy is attributed to the highly complex stress conditions active within the inclined concrete strut.
Figure 10.
Spatial mapping of the concrete strain profiles corresponding to Specimen CW02. (a) Strain variations across the normal section; (b) strain variations across the inclined section.
3.4. Load-Deflection Curves
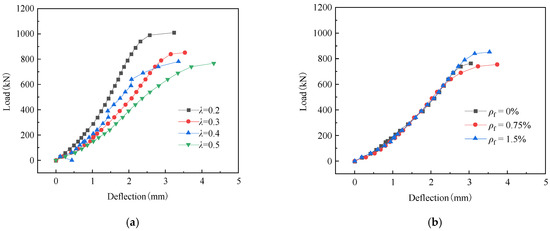
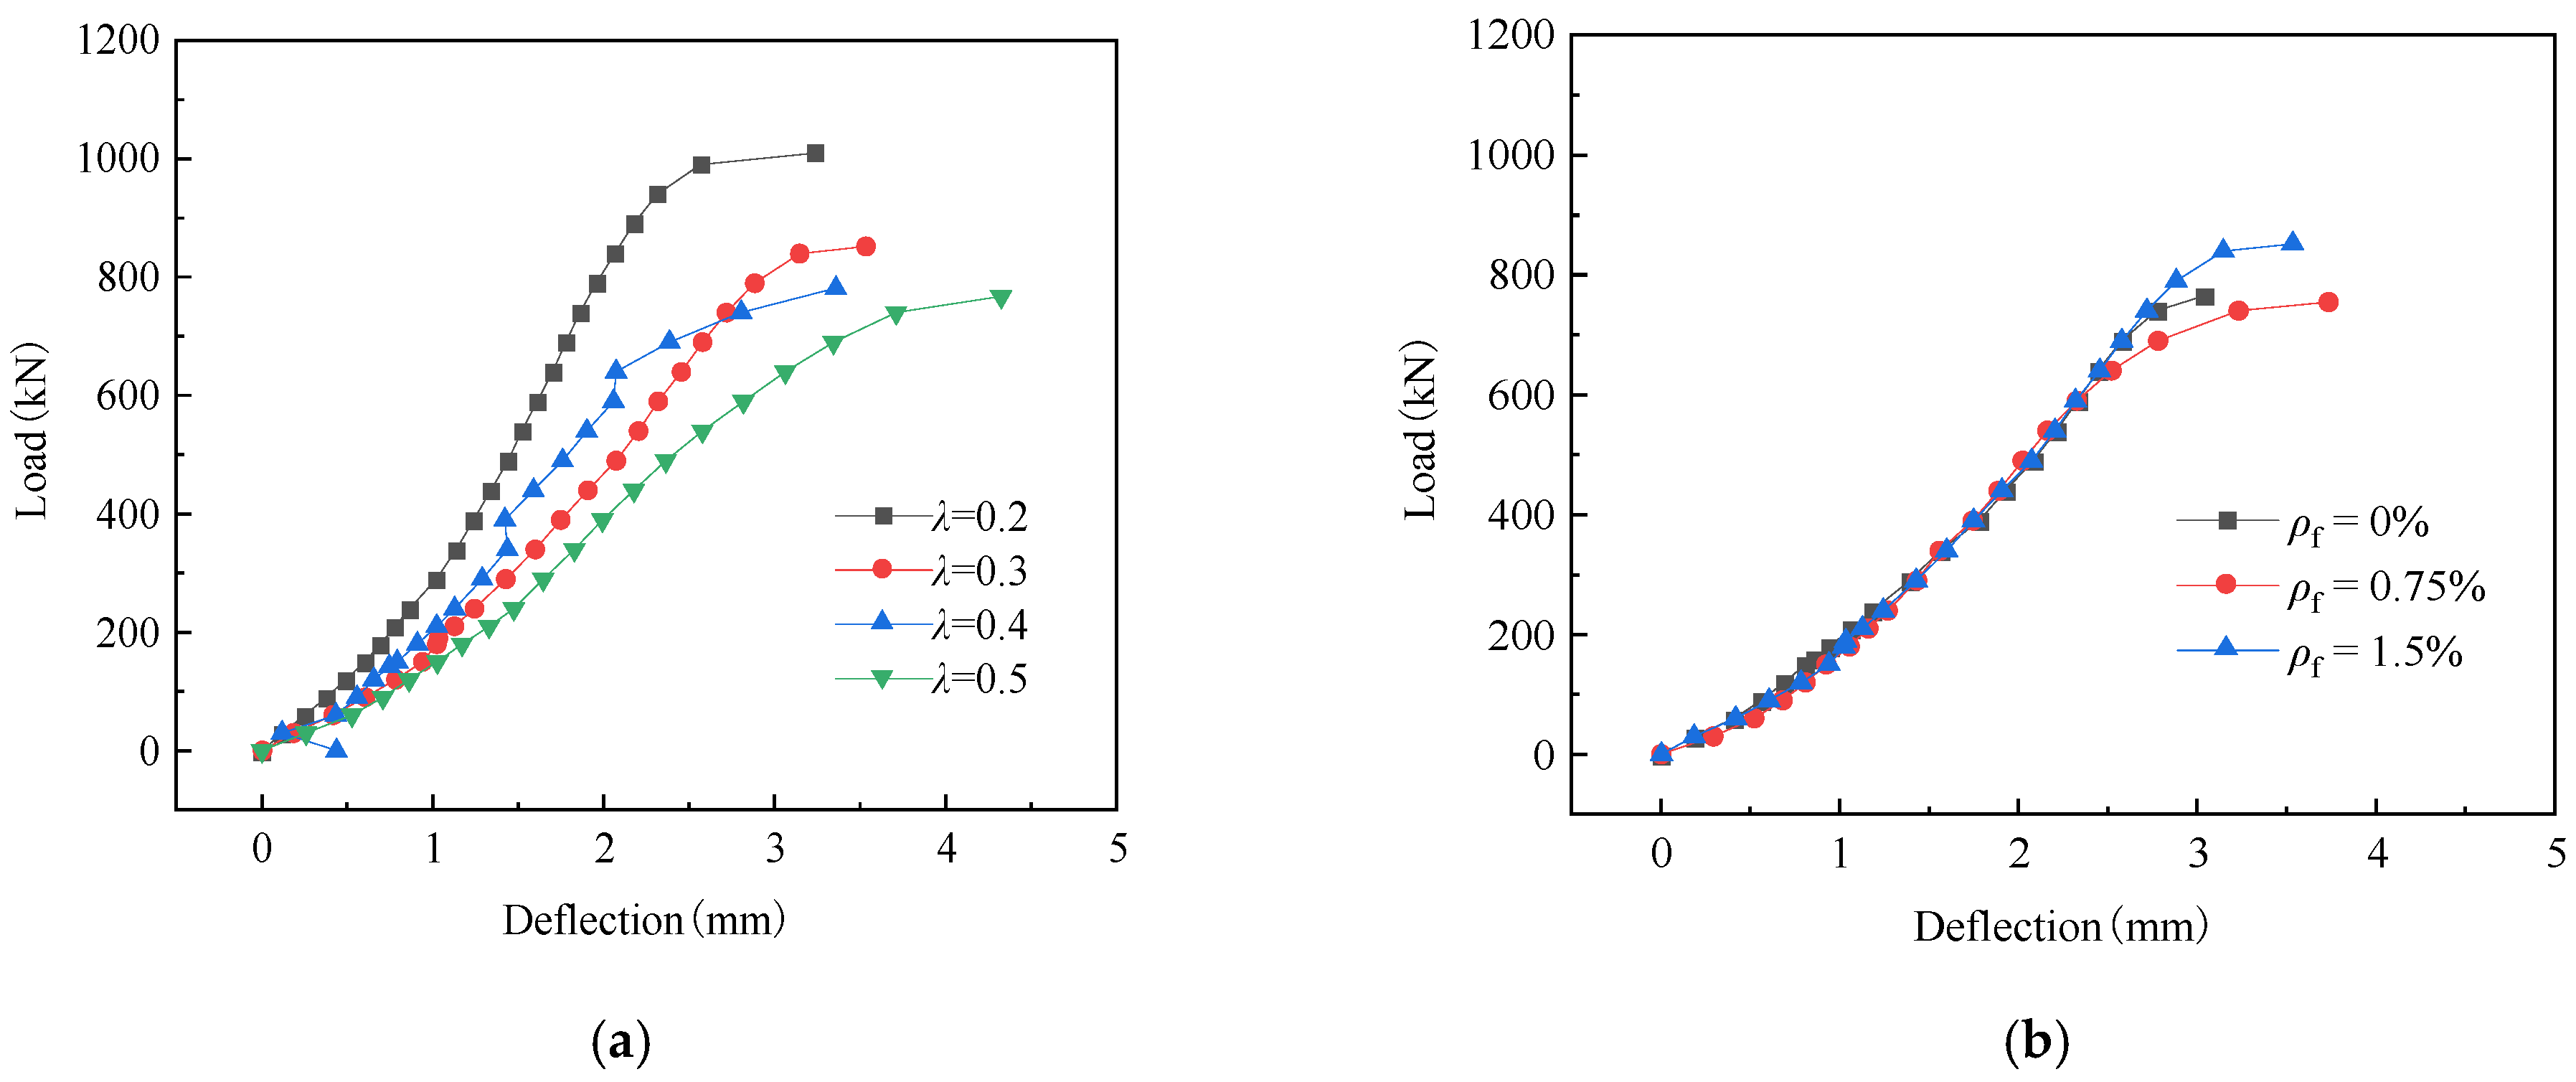
The load-induced deflection trajectories of the corbel specimens, evaluated across varying shear span-to-depth ratios, are graphically captured in Figure 11a. An analysis of these curves reveals that, when subjected to equivalent loading intensities, the overarching trend of the deflection scales upward progressively as the shear span-to-depth ratio is enlarged. Furthermore, throughout the preliminary application of force, a distinctly linear proportionality is maintained between the load and the resulting deflection, thereby confirming that the structural elements are operating within their elastic stage. As failure approaches, the relationship becomes nonlinear, signifying that the specimens enter the elastoplastic stage accompanied by substantial deformation. Figure 11b illustrates the variation in deflection for corbel specimens with different steel fiber volume fractions. As shown, the load-deflection curves for specimens with varying fiber contents are all smooth. In the early loading phase, these curves nearly overlap and exhibit an approximately linear relationship. With continued loading up to failure, the curves display nonlinear characteristics and gradually diverge. The curve for the specimen with a 1.5% steel fiber volume fraction became steeper, exhibiting smaller deflection under the same load compared to specimens with 0% and 0.75% fiber content. This indicates that increasing the steel fiber volume fraction increased the stiffness of the corbels, thereby reducing overall deformation and decreasing the mid-span deflection of the specimens.
Figure 11.
Load-deflection relationship. (a) Shear span-to-depth ratio ; (b) steel fiber volume fraction .
4. Calculation Method for Shear Capacity of Corbels
4.1. Strut-and-Tie Model for Corbels
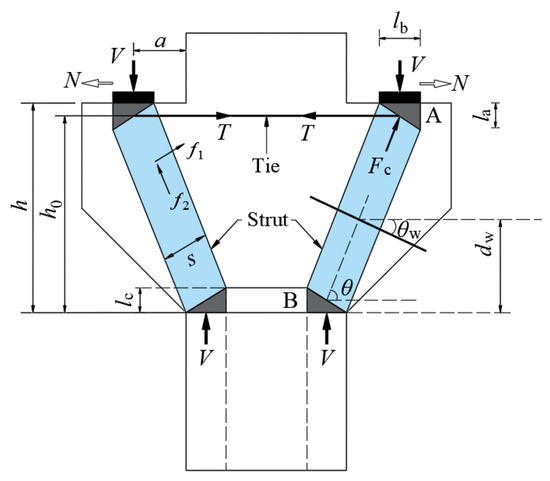
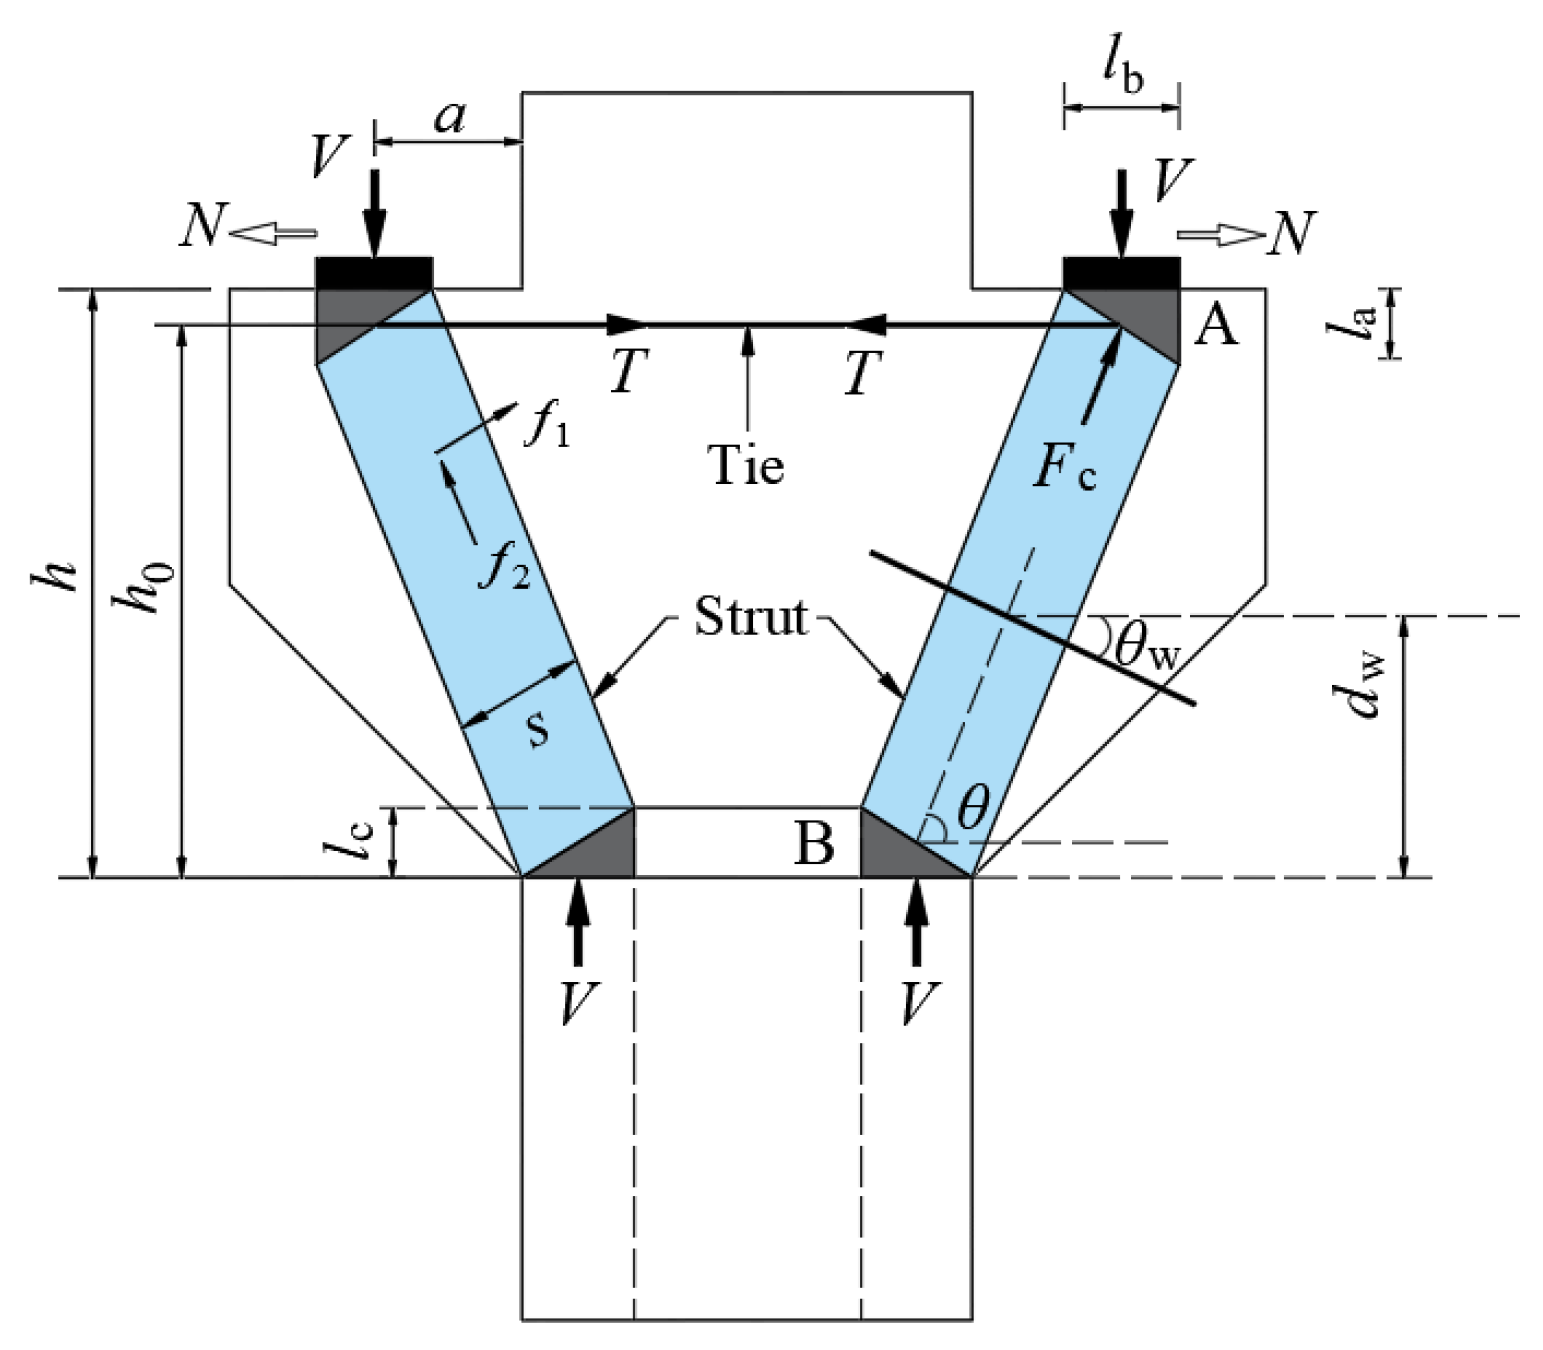
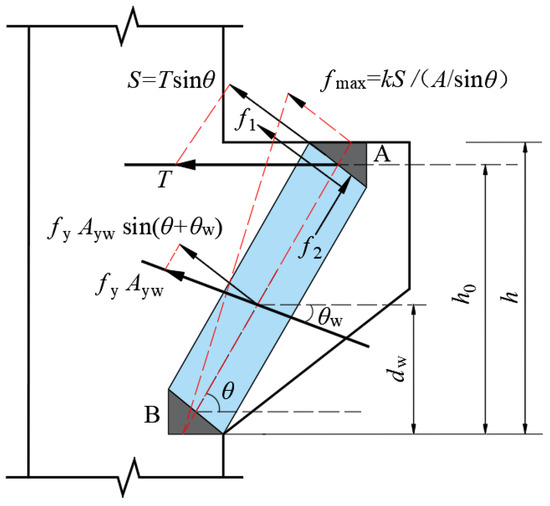
In the context of deep flexural members like corbels, prior to the genesis of diagonal fractures, the applied shear is sustained collectively by the shear reinforcement, the dowel action, the aggregate interlock at the interface, and the uncracked concrete in the compression zone. Subsequent to the emergence of inclined cracks within the shear span, the internal force transmission is predominantly governed by a tie-arch mechanism, a behavioral shift that fundamentally invalidates the conventional plane section assumption [32]. When subjected to a vertical load V, the upper nodal zone anchoring the concrete inclined strut experiences a complex interplay between the principal tensile stress and the principal compressive stress , as visually depicted in Figure 1. Acting orthogonally to the strut axis, the transverse principal tensile stress precipitates the splitting failure of this compressive element; concurrently, the axial principal compressive stress propagating along the strut dictates its eventual diagonal compression failure. Grounded in the classical Mohr–Coulomb failure criterion, the current study develops a tailored STM dedicated to the top nodal zone of the corbel (see Figure 12). This analytical framework explicitly accommodates the pronounced softening effect induced by the biaxial tension-compression stress state inherent to the top nodal zone of the concrete strut. Furthermore, the formulated model postulates a homogeneous stress field permeating both the width and length dimensions of the strut, treating the nodal zone as operating under a state of hydrostatic stress. Consequently, the linear interaction characterizing the relationship between and within this uppermost nodal zone can be mathematically articulated utilizing the subsequent failure criterion [33].
where and are the principal tensile and compressive stresses, respectively, in the top nodal zone of the concrete strut; is the combined tensile strength in the direction of , accounting for the contributions of both reinforcement and concrete; and is the cylinder compressive strength of concrete.
Figure 12.
Schematic of the STM for corbel calculation.
By formulating the force equilibrium conditions governing the top nodal zone A within the inclined concrete strut, the subsequent mathematical relationship is derived:
where is the compressive force in the concrete inclined strut; V and N are the vertical and horizontal loads applied to the corbel, respectively (for this experimental program, only vertical load was applied, N = 0); is the horizontal tensile force in the longitudinal reinforcement tie; and θ is the angle between the inclined strut and the horizontal tie, calculated as follows:
where is the height of the corbel; is the horizontal distance between the vertical load and the edge of the supporting column; is the width of the loading plate; and are the heights of the nodal zones at the top and bottom of the inclined strut, respectively. The height of the bottom nodal zone, , can be determined from the equilibrium conditions at node B.
To simplify the calculation of the proposed model, a geometric simplification is introduced, setting , wherein the parameter explicitly defines the effective depth of the corbel. Concurrently, the variable is assigned to quantify the shear span intrinsic to the structural element. As a direct consequence of these mathematical premises, the evaluation of Equation (4) proceeds via the ensuing formulation:
4.1.1. Calculation of the Principal Compressive Stress
Referring to the visual schematic presented in Figure 13, the principal compressive stress , oriented along the trajectory of the inclined strut within the top nodal zone, is calculated as follows:
where is the cross-sectional area of the concrete inclined strut, taken according to the American code ACI 318-19 [14]; and is the width of the corbel section.
Figure 13.
Principal stress state in the top nodal zone of the inclined strut.
4.1.2. Calculation of the Principal Tensile Stress
An analysis of the geometric configurations depicted in Figure 13 yields the ensuing formulation for the principal tensile stress , which acts orthogonally to the concrete inclined strut:
where is the cross-sectional area of the corbel; and is the non-uniform distribution coefficient for the component of the tie force acting in the direction of the principal tensile stress. Assuming a triangular distribution, the value of is taken as 2 [33]. Consequently, .
4.1.3. Calculation of the Combined Tensile Strength
The parameter represents the composite tensile capacity, which explicitly integrates the tension-resisting capabilities provided by the top longitudinal reinforcement, the horizontal stirrups, and the SFRC matrix. Specifically, this global parameter aggregates the individual stress components and —originating from the top longitudinal reinforcement and the horizontal stirrups, respectively—which are vectorially projected onto the axis of the principal tensile stress . Furthermore, it incorporates , denoting the intrinsic tensile strength exhibited by the SFRC within the nodal zone. The quantitative evaluation of this combined capacity is executed through Equation (9):
where , , and are the tensile strength contributions from the longitudinal reinforcement, the horizontal stirrups, and the SFRC, respectively.
According to the study by Tan et al. [34], and are determined as follows:
where and are the yield strengths of the longitudinal tensile reinforcement and the horizontal stirrups, respectively; and are the cross-sectional areas of the top longitudinal reinforcement and the horizontal stirrups, respectively; is the angle between the stirrups and the horizontal axis (in this paper, ); is the vertical distance from the intersection point of the horizontal stirrups with the centerline of the inclined strut to the bottom of the corbel; and is the effective depth.
is the tensile strength of SFRC considering the effect of steel fibers. Based on the design philosophy for SFRC structures [29] is determined as follows:
where is the tensile strength of the plain concrete matrix; is the influence factor for the tensile strength of SFRC, taken as 0.84 in this study [29]; and is the characteristic value of steel fiber content, calculated as . Here, is the steel fiber volume fraction, and and are the length and diameter (or equivalent diameter) of the steel fibers, respectively.
Therefore, Equation (9) can be reformulated as:
4.1.4. Calculation of Shear Capacity for SFRC Corbels
By simultaneously solving Equations (1)–(3), (7), and (8), the formula for calculating the shear capacity V of the corbel is obtained as follows:
4.2. Modification Considering Size Effect
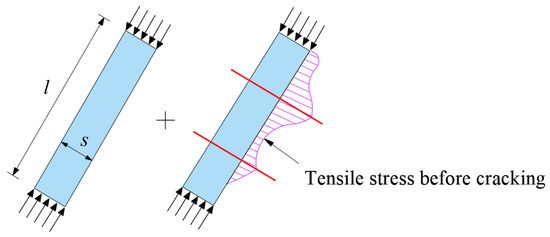
The size effect delineates the phenomenon wherein the mechanical performance metrics of a material or structural component—principally characterized by nominal strength—diminish as its geometric dimensions enlarge. Research by Tan and Cheng has shown that the size effect in deep flexural members primarily stems from two sources (as illustrated in Figure 14) [34]. (1) The geometric dimensions of the concrete compression strut, namely its length and width; and (2) the boundary conditions of the strut, primarily considering the diameter and spacing of distributed web reinforcement. The following modification is applied to .
Figure 14.
Geometric dimensions and boundary conditions of the compression strut.
4.2.1. Geometric Size Modification Factor
To streamline the computational process, the SFRC diagonal strut within the STM is isolated and conceptualized as a column enduring uniaxial compressive stress, entirely omitting the shear bond interface with the adjacent concrete matrix. Through rigorous statistical analysis, Kim et al. [35] formulated a size-effect equation governing the compressive strength of cylinders under uniaxial loading:
where and denote the height and diameter of the cylinder, respectively.
Using the method of analogical reasoning, Equation (15) is extended to the concrete inclined strut by replacing and with the strut length and width , respectively. This leads to the modification factor for the concrete strut strength:
4.2.2. Boundary Condition Modification Factor
Fundamentally, the boundary condition of a diagonal strut is defined by the spacing and diameter of the intersecting web reinforcement. Furthermore, Collins and Kuchma [36] established that the shear strength of deep flexural members operates as a function of crack width, a parameter intrinsically linked to the longitudinal reinforcement spacing. Relevant research indicates that the beneficial effect of web reinforcement on the shear performance of the strut is inversely proportional to the maximum spacing of the reinforcement and proportional to the size of the reinforced concrete region (dependent on ). Therefore, to quantify the contribution of the web reinforcement, a boundary condition modification factor accounting for its influence on the size effect is proposed.
where is the influence factor related to specific reinforcement grade and concrete strength; is the minimum diameter of web reinforcement; and is the maximum spacing of the web reinforcement.
Consequently, substituting the modification factors and into Equation (14) yields the calculation model for the shear capacity of SFRC corbels, considering the size effect, as given in Equation (19):
5. Verification Examples
To predict the shear capacity, the formulated calculation model and STM-based international standards were utilized to evaluate the six SFRHSC corbels tested herein alongside 18 SFRC corbels extracted from the literature [28]. The outcomes of the comparative assessment juxtaposing the empirically measured results against the analytically calculated values are tabulated in Table 4. The tabulated data reveals the following: (1) The average experimental-to-calculated ratios derived from the ACI 318-19, CSA A23.3-19, and EN 1992-1-1 codes equal 1.399, 1.508, and 1.451, yielding respective variances of 0.012, 0.018, and 0.057. Consequently, the STM provisions within these national standards considerably underestimate the actual shear capacity of the SFRHSC corbels. (2) Conversely, the formulated shear capacity calculation model yields a mean experimental-to-calculated ratio of 1.048 with a minimal variance of 0.004, signifying a strong correlation between the theoretical computations and empirical test results. Possessing explicit mechanical significance, the established model proves highly applicable for predicting and calculating the shear capacity of reinforced SFRHSC corbels.
Table 4.
Comparison of Experimental and Calculated Shear Capacity of Corbels.
6. Conclusions
Drawing upon empirical data derived from the shear testing of six SFRHSC corbels subjected to concentrated loading, this study dissects the structural failure sequence alongside the strain evolution mechanics within both the reinforcement and the concrete matrix. Predicated on the Mohr–Coulomb failure criterion and accommodating the softening behavior of the SFRC, a SSTM addressing the upper nodal region of the corbel was established, upon which a size effect correction was subsequently executed. The formulated shear capacity calculation model, alongside various STM-based national codes, was deployed to forecast the shear capacities of the six fabricated specimens and 18 additional units sourced from the literature [28]. A rigorous comparative analysis was then executed between the theoretical predictions and the experimental outcomes. The principal findings are summarized below:
- Empirical investigations reveal that, upon the integration of steel fibers, the shear-induced fracture distribution morphology in SFRHSC corbels closely parallels that observed in conventional concrete specimens. The structural degradation trajectory fundamentally evolves through three sequential phases: initial crack inception, continuous fracture penetration, and ultimate failure. Moreover, the inclusion of these metallic fibers effectively mitigates the inherent brittleness characterizing the shear failure of such structural elements.
- At the ultimate failure state of the SFRHSC corbels, comprehensive yielding is universally attained in the longitudinal tension reinforcement, complemented by localized yielding among the horizontal stirrups. The recorded steel strains demonstrate a proportional escalation relative to the shear span-to-depth ratio, confirming that the flexural participation of the rebars magnifies as this geometric parameter expands. Furthermore, an increment in the steel fiber dosage precipitates a decline in reinforcement strain; this underlying behavior is governed by the fracture-bridging effect of the fibers, which effectively upgrades the global load-carrying capacity of the SFRHSC matrix.
- Concrete strains across both the normal and inclined sections of the SFRHSC corbels exhibit a sequential top-to-bottom reduction. Prior to structural cracking, the strain along the normal section is minimal and strictly linear, fulfilling the plane section assumption. Under escalating load increments, however, this concrete strain shifts to a non-linear growth trajectory, did not follow the plane section assumption. Ultimately, this behavior confirms that the integration of steel fibers fails to alter the inherent non-compliance of the corbel’s normal section with the plane section assumption.
- Evaluations comparing the formulated SFRHSC shear capacity calculation model against STM-based provisions from ACI 318-19, EN 1992-1-1, and CSA A23.3-19 demonstrate that the national codes yield mean experimental-to-calculated ratios of 1.399, 1.508, and 1.451, with respective variances of 0.012, 0.018, and 0.057. These metrics indicate highly conservative calculation outcomes. In contrast, the established shear capacity calculation model for SFRHSC corbels produces a mean ratio of 1.048 alongside a variance of 0.004. This confirms that the theoretical predictions align intimately with the empirical results while exhibiting minimal dispersion. By comprehensively accounting for the softening effect and size effect of the SFRC, this model possesses a definitive theoretical foundation and clear mechanical significance, thereby offering a valid theoretical reference for refining the structural design of SFRHSC corbels.
Author Contributions
Conceptualization, D.P. and S.L.; Methodology, H.L., D.P. and Q.L.; Software, D.P.; Validation, D.P. and Q.L.; Formal analysis, D.P.; Investigation, D.P.; Resources, D.P. and S.L.; Data curation, D.P. and Q.L.; Writing—original draft, H.L. and D.P.; Writing—review & editing, D.P. and S.L.; Visualization, D.P.; Supervision, S.L.; Project administration, D.P.; Funding acquisition, S.L. All authors have read and agreed to the published version of the manuscript.
Funding
This research was funded by the National Natural Science Foundation of China (No. 52179133, No. U1404526).
Data Availability Statement
The original contributions presented in this study are included in the article. Further inquiries can be directed to the corresponding authors.
Conflicts of Interest
The authors declare no conflict of interest. The funders had no role in the design of the study; in the collection, analyses, or interpretation of data; in the writing of the manuscript; or in the decision to publish the results.
Nomenclature
| steel fiber volume fraction, dimensionless. | |
| cube compressive strength of concrete, MPa. | |
| axial compressive strength of concrete, MPa. | |
| tensile strength of concrete, MPa. | |
| linear elastic modulus of concrete, MPa. | |
| the cross-sectional area of longitudinal reinforcement, mm2. | |
| yield strength of reinforcement, MPa. | |
| elastic modulus of reinforcement, MPa. | |
| ultimate strength of reinforcement, MPa. | |
| yield strain of reinforcement, dimensionless. | |
| shear span-to-depth ratio, dimensionless. | |
| vertical load applied to the corbel, kN. | |
| principal tensile stress in the top nodal zone of the concrete strut, MPa. | |
| principal compressive stress in the top nodal zone of the concrete strut, MPa. | |
| combined tensile strength in the direction of , accounting for the contributions of both reinforcement and concrete, MPa. | |
| cylinder compressive strength of concrete, MPa. | |
| compressive force in the concrete inclined strut, kN. | |
| angle between the inclined strut and the horizontal tie. | |
| horizontal load applied to the corbel, kN. | |
| horizontal tensile force in the longitudinal reinforcement tie, kN. | |
| height of the nodal zone at the top of the inclined strut, mm. | |
| height of the nodal zone at the bottom of the inclined strut, mm. | |
| width of the loading plate, mm. | |
| total depth of corbel section, mm. | |
| effective depth of corbel section, mm. | |
| horizontal distance between the vertical load and the edge of the supporting column, mm. | |
| width of the corbel section, mm. | |
| cross-sectional area of the concrete inclined strut, mm2. | |
| cross-sectional area of the corbel, mm2. | |
| tensile strength of the longitudinal reinforcement, MPa. | |
| tensile strength of the horizontal stirrups, MPa. | |
| tensile strength of the steel fiber-reinforced concrete, MPa. | |
| yield strength of longitudinal reinforcement, MPa. | |
| yield strength of horizontal stirrups, MPa. | |
| cross-sectional area of longitudinal reinforcement, mm2. | |
| cross-sectional area of horizontal stirrups, mm2. | |
| angle between the stirrups and the horizontal axis. | |
| vertical distance from the intersection point of the horizontal stirrups with the centerline of the inclined strut to the bottom of the corbel, mm. | |
| tensile strength of the plain concrete matrix, MPa. | |
| influence factor for the tensile strength of SFRC, dimensionless. | |
| characteristic value of steel fiber content, dimensionless. | |
| length of the steel fiber, mm. | |
| diameter (or equivalent diameter) of the steel fiber, mm. | |
| height of the cylinder, mm. | |
| diameter of the cylinder, mm. | |
| strut length, mm. | |
| strut width, mm. | |
| modification factor for the concrete strut strength, dimensionless. | |
| minimum diameter of web reinforcement, mm. | |
| maximum spacing of the web reinforcement, mm. | |
| boundary condition modification factor accounting for the influence of web reinforcement on the size effect, dimensionless. | |
| influence factor related to specific reinforcement grade and concrete strength, dimensionless. | |
| test shear strength capacity, kN. | |
| calculated shear capacity, kN. |
References
- Chetchotisak, P.; Teerawong, J.; Yindeesuk, S. Modified interactive strut-and-tie modeling of reinforced concrete deep beams and corbels. Structures 2022, 45, 284–298. [Google Scholar] [CrossRef] [Scilit]
- Ramadhan Yousif, A. Prediction of ultimate load capacity of high-strength reinforced concrete corbels. Al-Rafidain Eng. J. 2009, 17, 12–27. [Google Scholar] [CrossRef] [Scilit]
- Gao, D.; Zhu, H.; Xu, L.; Zhang, Q. Experimental study on the normal section bearing capacity of steel fiber reinforced concrete corbels. J. Hydroelectr. Eng. 2005, 24, 68–72. [Google Scholar]
- Fattuhi, N.I. Strength of SFRC corbels subjected to vertical load. J. Struct. Eng. 1990, 116, 701–718. [Google Scholar] [CrossRef] [Scilit]
- Fattuhi, N.I. Strength of FRC corbels in flexure. J. Struct. Eng. 1994, 120, 360–377. [Google Scholar] [CrossRef] [Scilit]
- Campione, G.; La Mendola, L.; Mangiavillano, M.L. Steel fiber-reinforced concrete corbels: Experimental behavior and shear strength prediction. ACI Struct. J. 2007, 104, 570. [Google Scholar] [CrossRef] [Scilit]
- Kurtoglu, A.E.; Gulsan, M.E.; Abdi, H.A.; Kamil, M.A.; Cevik, A. Fiber reinforced concrete corbels: Modeling shear strength via symbolic regression. Comp. Concr. 2017, 20, 1–10. [Google Scholar]
- Gao, J.; Qiu, H.X.; Jiang, Y.S. Discussion on the calculation method of steel fiber reinforced high-strength concrete corbels. J. Southeast Univ. 1993, 23, 41–46. [Google Scholar]
- Gao, D.; Zhao, J.; Zhu, H. Experimental study on the shear bearing capacity of steel fiber reinforced concrete corbels. J. Build. Struct. 2006, 27, 100–106. [Google Scholar]
- Li, S.; Zhang, F.; Zhang, Z.; Huang, F.; Jia, M.; Liu, Z.; Xie, W. Experimental study on the shear behavior of steel fiber reinforced high-strength concrete corbels. J. Build. Struct. 2020, 41, 151–159. [Google Scholar]
- Schlaich, J.; Schäfer, K.; Jennewein, M. Toward a consistent design of structural concrete. PCI J. 1987, 32, 74–150. [Google Scholar] [CrossRef] [Scilit]
- Wilson, H.R.; Yousefpour, H.; Brown, M.D.; Bayrak, O. Investigation of Corbels Designed According to Strut-and-Tie and Empirical Methods. ACI Struct. J. 2018, 115, 813–824. [Google Scholar]
- He, Z.Q.; Liu, Z.; Ma, Z.J. Investigation of Load-Transfer Mechanisms in Deep Beams and Corbels. ACI Struct. J. 2012, 109, 471–480. [Google Scholar] [CrossRef] [Scilit]
- ACI Committee 318. Building Code Requirement for Structure Concrete (ACI318-19) and Commentary; American Concrete Institute: Farmington Hills, MI, USA, 2021. [Google Scholar]
- EN 1992-1-1:2004; Eurocode 2. Design of Concrete Structures. Design of Concrete Structures. British Standards Institution: London, UK, 2004.
- CSA A23. 3-19; Design of Concrete Structures. Canadian Standards Association: Toronto, ON, USA, 2019.
- Ali, M.A.; White, R.N. Consideration of compression stress bulging and strut degradation in truss modeling of ductile and brittle corbels. Eng. Struct. 2001, 23, 240–249. [Google Scholar] [CrossRef] [Scilit]
- Russo, G.; Venir, R.; Pauletta, M.; Somma, G. Reinforced concrete corbels-shear strength model and design formula. ACI Struct. J. 2006, 103, 3. [Google Scholar]
- Hwang, S.J.; Lu, W.Y.; Lee, H.J. Shear strength prediction for reinforced concrete corbels. ACI Struct. J. 2000, 97, 543–552. [Google Scholar] [CrossRef] [Scilit]
- Hwang, S.; Lu, W.; Lee, H. Shear strength prediction for deep beams. ACI Struct. J. 2000, 97, 367–376. [Google Scholar] [CrossRef] [Scilit]
- Hwang, S.J.; Fang, W.H.; Lee, H.J.; Yu, H.W. Analytical model for predicting shear strength of squat walls. J. Struct. Eng. 2001, 127, 43–50. [Google Scholar] [CrossRef] [Scilit]
- Hwang, S.J.; Lee, H.J. Strength prediction for discontinuity regions by softened strut-and-tie model. J. Struct. Eng. 2002, 128, 1519–1526. [Google Scholar] [CrossRef] [Scilit]
- Tan, K.H.; Tang, C.Y.; Tong, K. A direct method for deep beams with web reinforcement. Mag. Concr. Res. 2003, 55, 53–63. [Google Scholar] [CrossRef]
- Kassem, W. Strength prediction of corbels using strut-and-tie model analysis. Int. J. Concr. Struct. Mater. 2015, 9, 255–266. [Google Scholar] [CrossRef] [Scilit]
- Li, S.S.; Peng, D.; Wang, H.; Wang, S.; Liang, R.T.; Jia, W.Z.; Liu, J.C.; Xie, W. Analysis of Shear Model for Steel-Fiber-Reinforced High-Strength Concrete Corbels with Welded-Anchorage Longitudinal Reinforcement. Materials 2023, 16, 4907. [Google Scholar] [CrossRef] [Scilit]
- Mustafa, T.S.; Beshara, F.B.A.; Mahmoud, A.A.; El-Sayed, H.A. An improved strut-and-tie model to predict the ultimate strength of steel fiber-reinforced concrete corbels. Mater. Struct. 2019, 52, 63. [Google Scholar] [CrossRef] [Scilit]
- Zhao, L.Y.; Yao, J.T.; Hu, Y.K. Calculation method for shear capacity of steel fiber reinforced concrete beam-column joints based on improved simplified strut-and-tie model. J. Hunan Univ. 2024, 51, 90–100. [Google Scholar]
- Fattuhi, N.I. Column-load effect on reinforced concrete corbels. J. Struct. Eng. 1990, 116, 188–197. [Google Scholar] [CrossRef] [Scilit]
- CECS 38:2004; Technical Specification for Fiber Reinforced Concrete Structures. China Planning Press: Beijing, China, 2004.
- Fattuhi, N.I. Reinforced corbels made with plain and fibrous concretes. ACI Struct. J. 1994, 91, 530–536. [Google Scholar] [CrossRef] [Scilit] [PubMed]
- Foster, S.J.; Gilbert, R.L. The design of non-flexural members with normal and high-stength concrete. ACI Struct. J. 1996, 93, 3–10. [Google Scholar]
- Wei, H.; Wu, T.; Liu, Y.; Liu, X. Analysis of shear model of deep flexural members considering size effect. Eng. Mech. 2019, 36, 130–136. [Google Scholar]
- Tan, K.H.; Tong, K.; Tang, C.Y. Direct Strut-and-Tie Model for Prestressed Deep Beams. J. Struct. Eng. 2001, 127, 1076–1087. [Google Scholar] [CrossRef] [Scilit]
- Tan, K.H.; Cheng, G.H. Size effect on shear strength of deep beams: Investigating with strut-and-tie model. J. Struct. Eng. 2006, 132, 673–685. [Google Scholar] [CrossRef] [Scilit]
- Kim, J.K.; Yi, S.T.; Park, C.K.; Eo, S.H. Size effect on compressive strength of plain and spirally reinforced concrete cylinders. ACI Struct. J. 1999, 96, 88–94. [Google Scholar] [CrossRef] [Scilit]
- Collins, M.P.; Kuchma, D. How safe are our large, lightly reinforced concrete beams, slabs, and footings? ACI Struct. J. 1999, 96, 482–490. [Google Scholar] [CrossRef] [Scilit]

Disclaimer/Publisher’s Note: The statements, opinions and data contained in all publications are solely those of the individual author(s) and contributor(s) and not of MDPI and/or the editor(s). MDPI and/or the editor(s) disclaim responsibility for any injury to people or property resulting from any ideas, methods, instructions or products referred to in the content. |
© 2026 by the authors. Licensee MDPI, Basel, Switzerland. This article is an open access article distributed under the terms and conditions of the Creative Commons Attribution (CC BY) license.