


Abstract
Inter-module connections are the critical load-transfer components in modular steel buildings (MSBs), whose mechanical behavior directly governs the overall safety and seismic performance of the entire structural system. To address the unresolved issue that the influence of complex loading conditions, especially the coupling effect of biaxial bending, on the load-transfer mechanism and degradation law of bayonet-type self-locking and unlockable connections remains poorly understood, two groups of full-scale quasi-static tests were conducted in this study. Specimen S1 (0°) was designed for the in-plane compression–bending–shear loading condition, while Specimen S2 (45°) was designed for the spatial compression–biaxial bending–shear loading condition. The test results demonstrate that both groups of specimens exhibit typical three-stage mechanical characteristics. The average initial stiffness of Specimen S1 (0°) is 5.47 kN/mm, while that of Specimen S2 (45°) is 6.08 kN/mm. The average ultimate load of S1 (0°) reaches 162.8 kN, and that of S2 (45°) is 164.85 kN. The average ductility coefficient of S1 (0°) and S2 (45°) is 2.79 and 2.14, respectively. Comparative analysis indicates that Specimen S1 (0°) presents superior energy dissipation capacity and ductility, while Specimen S2 (45°) has higher initial stiffness accompanied by faster stiffness degradation in the late loading stage. A high-fidelity refined FE model of the bayonet-type self-locking and unlockable connection was established. The FE analysis results are in good agreement with the test results, with the relative error of the positive flexural bearing capacity controlled within 5%. On this basis, parametric FE analysis was carried out to explore the influence of axial compression ratio on the mechanical performance of the connection. Furthermore, theoretical calculation formulas for the ultimate flexural bearing capacity of the connection under in-plane compression–bending–shear loading and spatial compression–biaxial bending–shear loading were proposed respectively. The calculated results are compared with the test data, with all relative errors within 5%, which verifies that the proposed formulas have favorable prediction accuracy for the ultimate flexural bearing capacity of the connection under both aforementioned complex loading conditions.
1. Introduction
Driven by the “Dual Carbon” goals and the strategy of new building industrialization, modular steel construction (MSC) has experienced rapid development in the construction sector [1]. Inter-module connections are the primary load-transferring components in modular buildings, and their mechanical performance significantly influences the overall structural integrity [2]. Currently, existing inter-module connections in steel modules primarily include welded connections [1], bolted connections [3,4,5], prestressed connections [6,7], and self-locking connections [2,8,9,10]. Extensive experimental studies have been conducted by researchers to investigate the fundamental mechanical properties of steel inter-module connections under uniaxial tension [11], shear [11], and bending [12,13,14,15,16,17], which have revealed the failure modes of these connections under uniaxial loading. For instance, Chen et al. [11,12] conducted basic mechanical performance tests on the proposed rotary inter-module corner connections under tension, shear, and planar uniaxial bending. Dai et al. [14] conducted uniaxial tensile tests on the proposed plug-in self-locking connections. Zhai et al. [16] and Yu et al. [6] conducted in-plane bending tests on bolted-cover plate connections and prestressed connections, respectively. Liu et al. [18] carried out in-plane compression–bending–shear quasi-static tests on column-to-column bolted connections to explore the failure modes and load-transferring mechanisms of inter-module connections. Furthermore, Liu et al. [15,19,20] conducted experimental and theoretical research on the mechanical behavior of in-plane modular bolted connections under combined compression–bending–shear loading. Chen et al. [2,10] performed static and pseudo-static experimental studies on inter-module slider self-locking connections under multi-directional compression–bending–shear loading; additionally, considering the effect of the axial compression ratio, they proposed calculation formulas for the ultimate bending capacity of the connections. However, as evidenced by the existing literature (Figure 1), most studies remain confined to in-plane uniaxial or multiaxial loading analyses. Although Liu et al. [21] have studied the biaxial bending condition of spatial compression–biaxial bending–shear, the comparative studies under spatial complex loading and in-plane complex loading are still insufficient at present. Beyond speed and cost-efficiency, modular construction is increasingly recognized as a vital driver for sustainable development. By shifting over 90% of the construction process to a controlled factory environment, it significantly minimizes on-site waste, noise pollution, and energy consumption, aligning perfectly with the global ‘Dual Carbon’ targets. Furthermore, modular systems offer unparalleled flexibility for urban regeneration. For instance, recent studies have demonstrated the potential of modular buildings to support small trade development and flexible commercial functions within sustainable cities, thereby enhancing urban resilience and circular economy practices [22].
Figure 1.
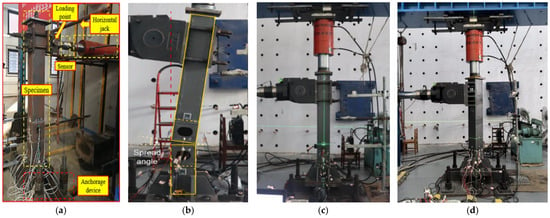
Summary of existing studies on the mechanical performance of inter-module connections. (a) Uniaxial flexural test of a corner-fitting rotary con-nection [12]. (b) Compression–bending–shear test of a bolted connec-tion [20]. (c) Compression–bending–shear test of a sliding-block self-locking connection [10]. (d) Biaxial compression–bending–shear test of a sliding-block self-locking connection [21].
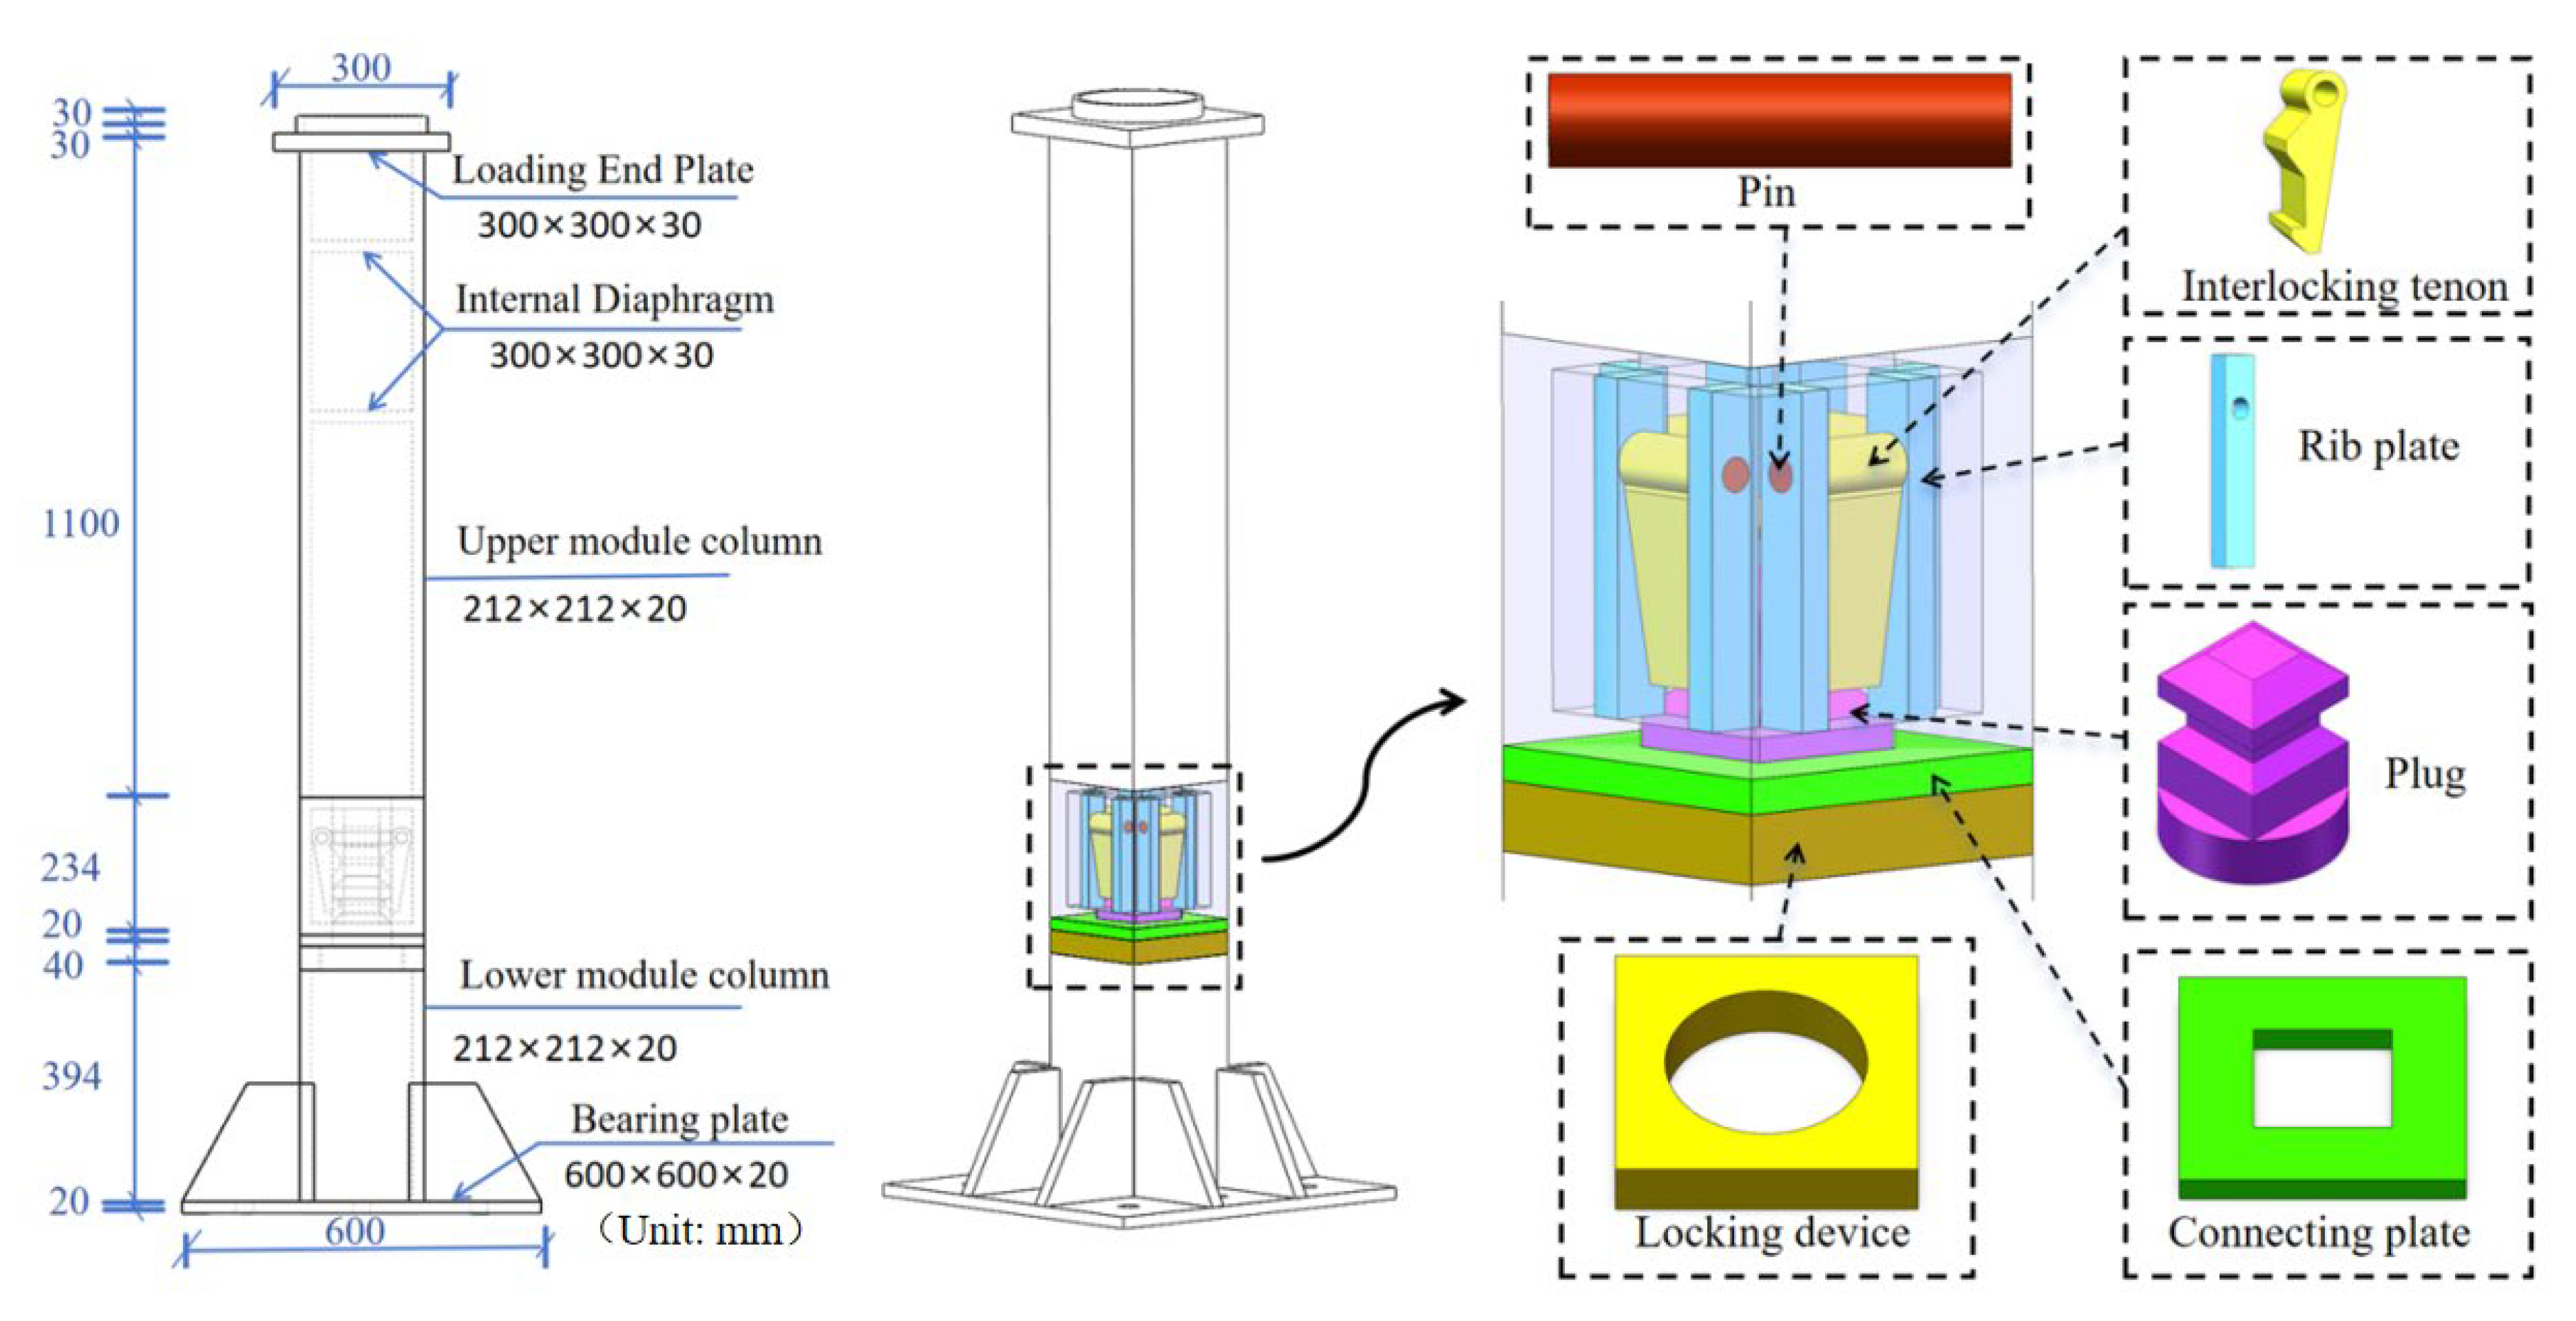
Therefore, this study focuses on the bayonet-type self-locking and unlockable connection previously proposed by our research group [23], as illustrated in Figure 2. Two groups of full-scale specimens were designed and subjected to quasi-static tests. The tests utilized a column-end loading scheme, where horizontal loads were applied along the 0° direction (parallel to the edge of the column cross-section) and the 45° direction (along the diagonal of the column cross-section). This loading protocol was implemented to simulate planar compression–bending–shear and spatial compression–biaxial bending–shear loading effects on the connections, respectively. Through these tests, key mechanical properties of the bayonet-type self-locking and unlockable connections under both loading conditions were obtained, including load-bearing capacity, failure modes, stiffness, strength, ductility, and energy dissipation capacity. Furthermore, a refined finite element (FE) model was established and validated against the experimental results. Based on the validated FE model, a parametric analysis was subsequently conducted. Finally, a simplified mechanical analysis model was developed, and theoretical formulas for predicting the ultimate bending capacity of the connections were proposed.
Figure 2.
Structural details of the bayonet-type self-locking and unlockable connection (Unit: mm).
2. Experimental Program
2.1. Specimen Details
To investigate the mechanical behavior of the bayonet-type self-locking and unlockable inter-module connections under planar compression–bending–shear and spatial compression–biaxial bending–shear loading conditions, two groups of full-scale connection specimens were designed in this study. The specimens consisted of the inter-module connection and the upper and lower modular columns. The modular columns utilized rectangular hollow sections (RHSs) with cross-sectional dimensions of 212 mm × 212 mm × 20 mm. A rectangular end plate measuring 600 mm × 600 mm × 20 mm was welded to the bottom of the lower modular column and anchored to a fixed base using high-strength bolts to ensure reliable experimental boundary conditions. The column thickness, axial compression ratio, and lower corner fitting thickness were kept identical for both groups of specimens. Different bending scenarios were simulated by altering the horizontal loading angle: Specimen S1 had a loading angle of 0°, corresponding to the planar compression–bending–shear loading condition, whereas Specimen S2 had a loading angle of 45°, corresponding to the spatial compression–biaxial bending–shear loading condition. Both groups of specimens were subjected to low-cyclic reversed loading. The specific parameters of the specimens are detailed in Table 1.
Table 1.
Specimen information.
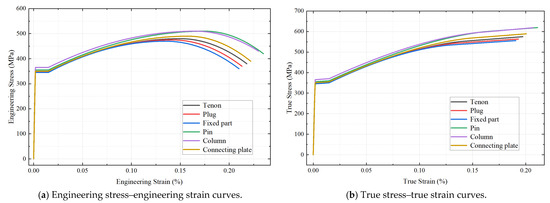
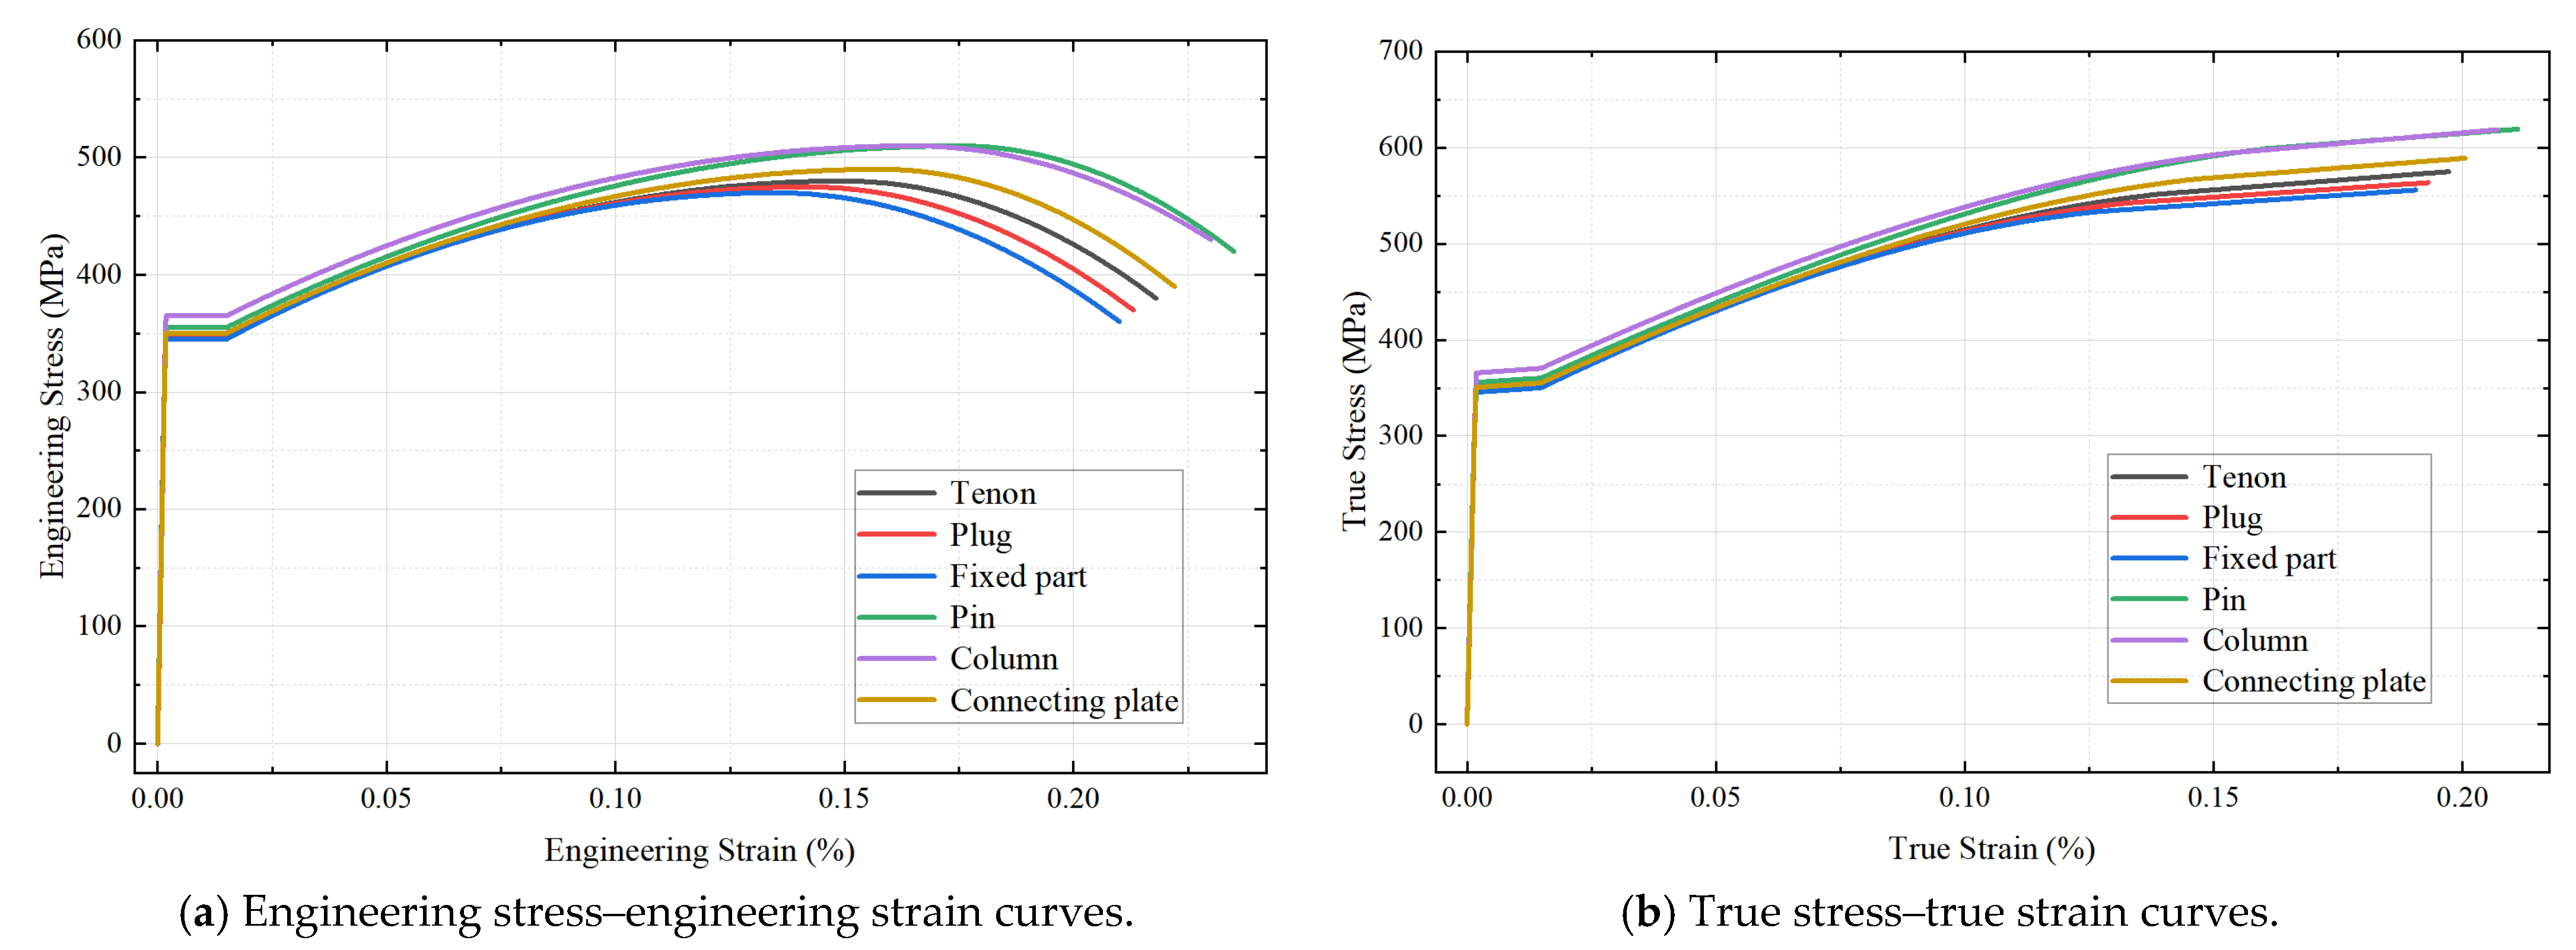
Tensile tests were conducted to determine the mechanical properties of the materials for each component in accordance with the standard GB/T 228.1-2021 [24]. Three identical specimens were tested for each type of material, and the average values were adopted as the representative material parameters. The key mechanical properties, including the elastic modulus, yield strength, ultimate tensile strength, ultimate strain, and elongation of the materials, are summarized in Table 2. The engineering stress–strain curves and true stress–strain curves of the materials for each component are shown in Figure 3.
Table 2.
Material properties.
Figure 3.
Tensile stress—strain curves of the tested materials.
2.2. Loading Protocol and Instrumentation
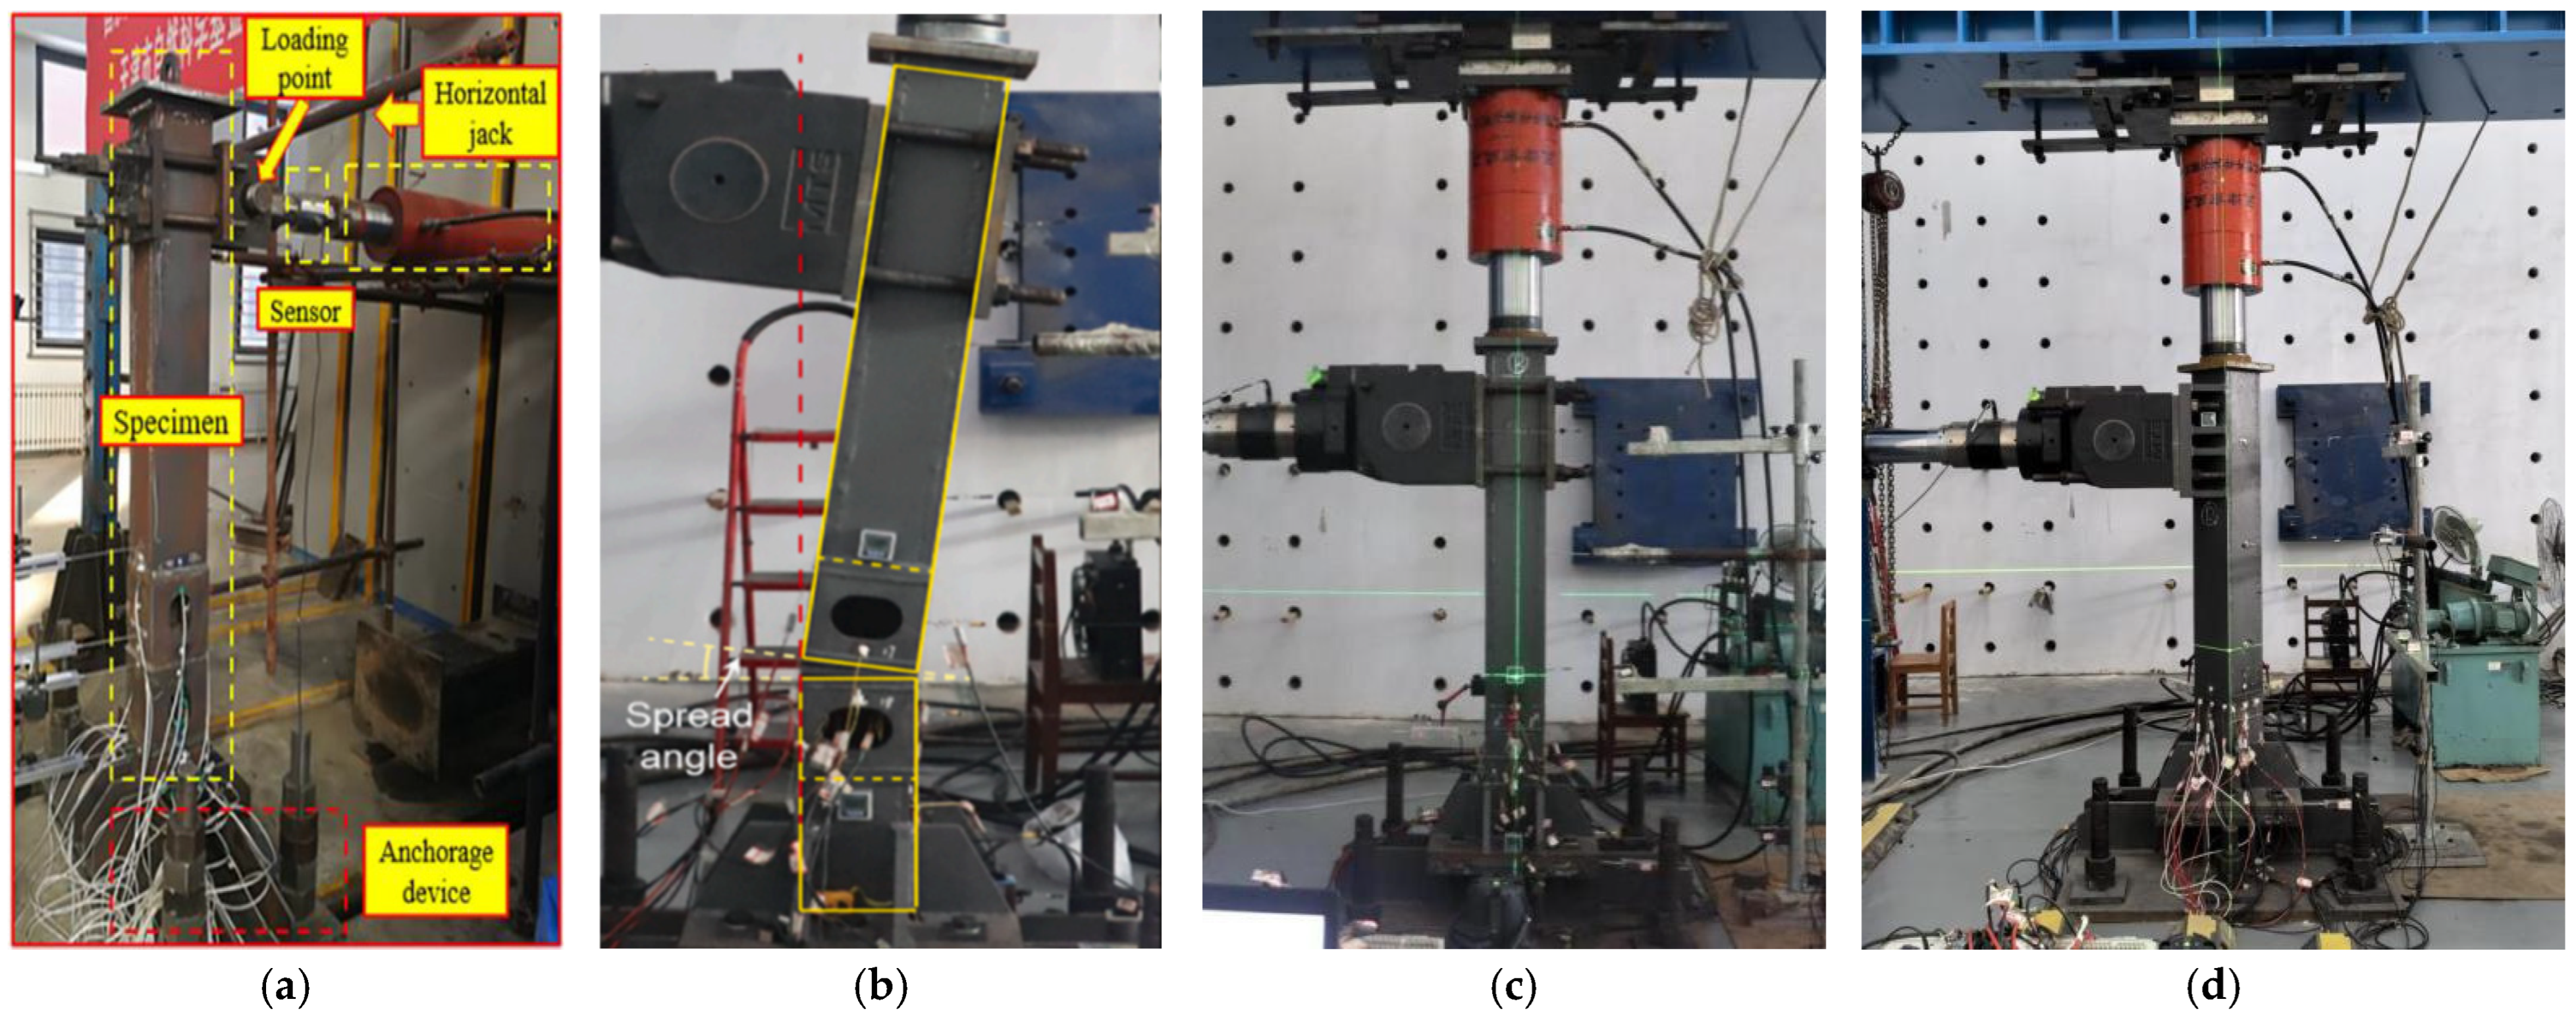
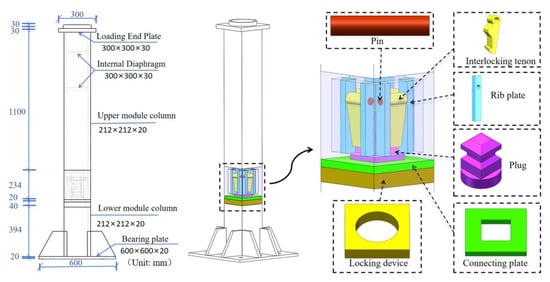
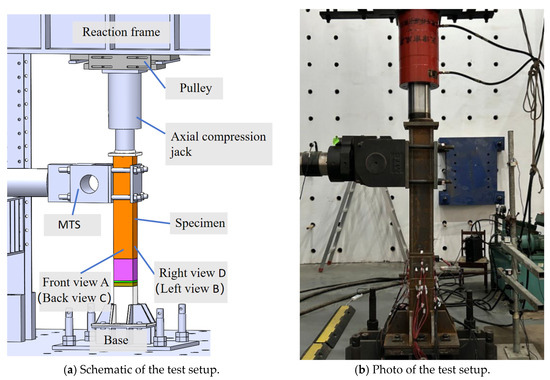
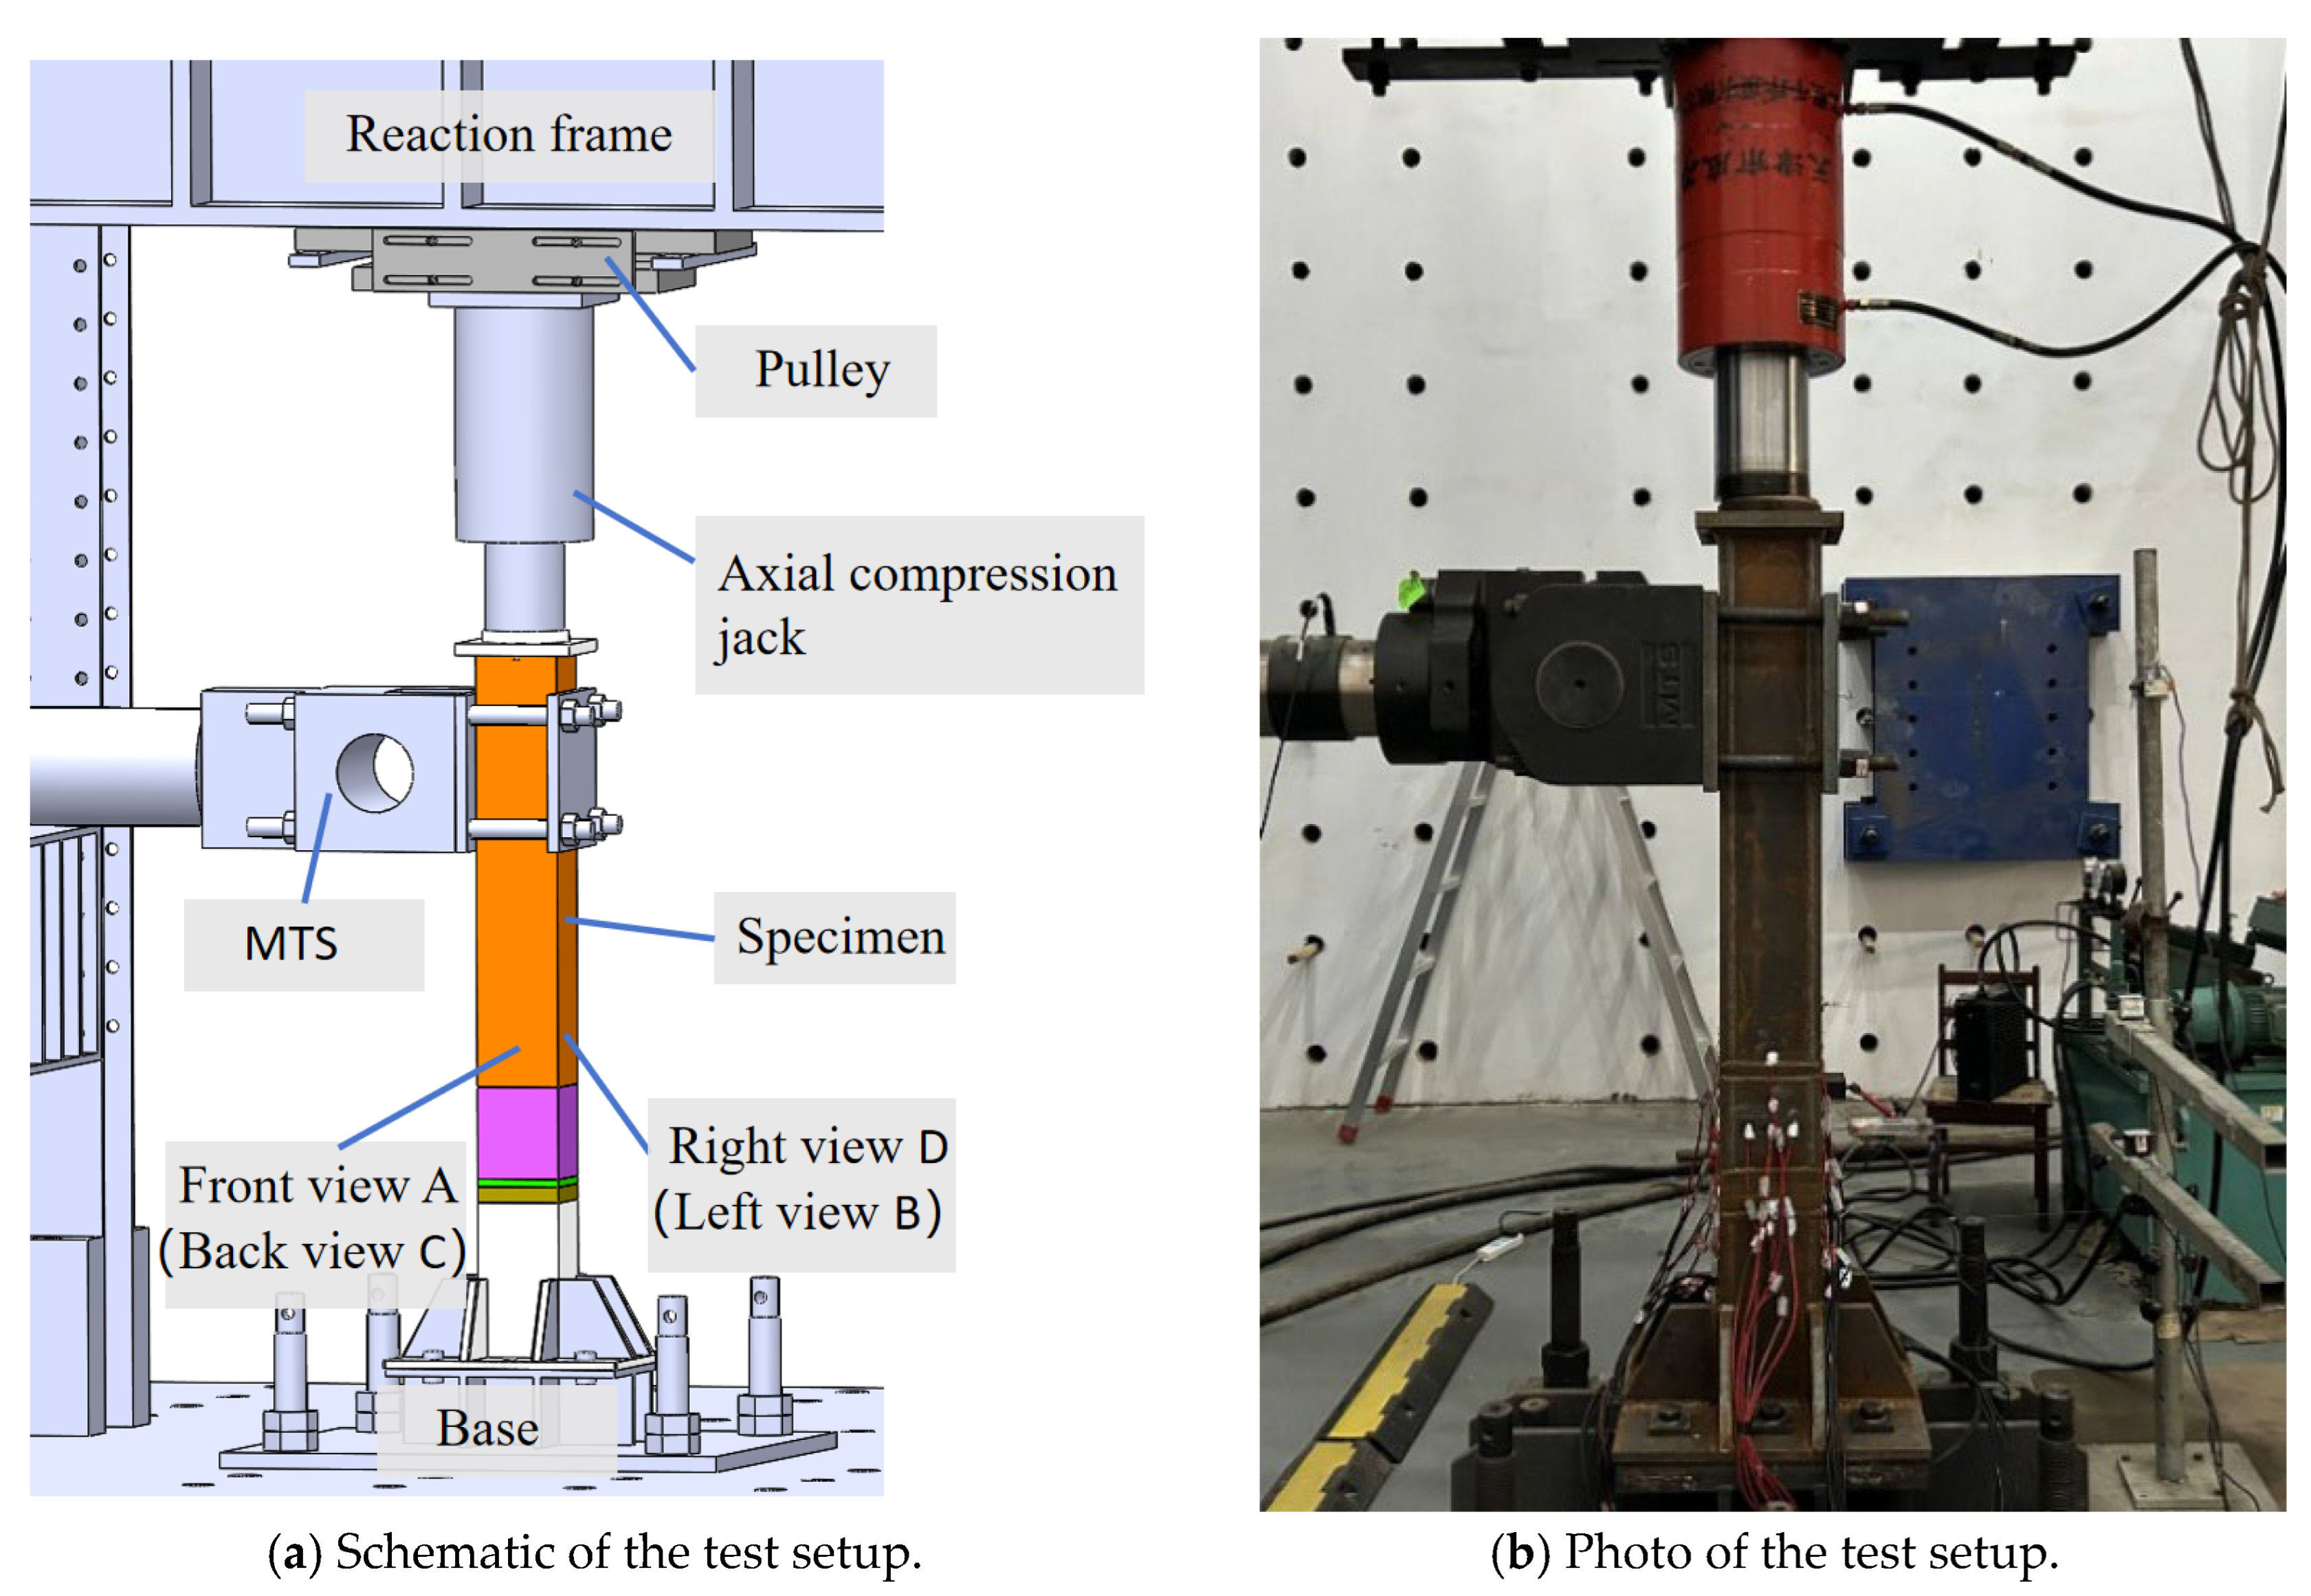
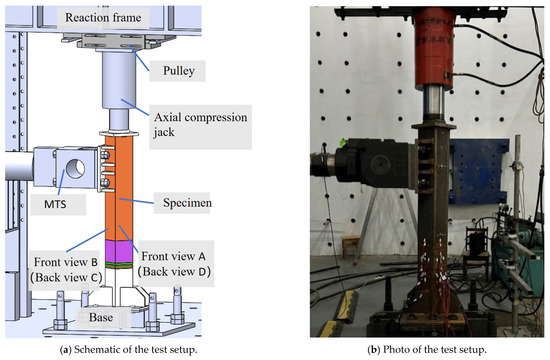
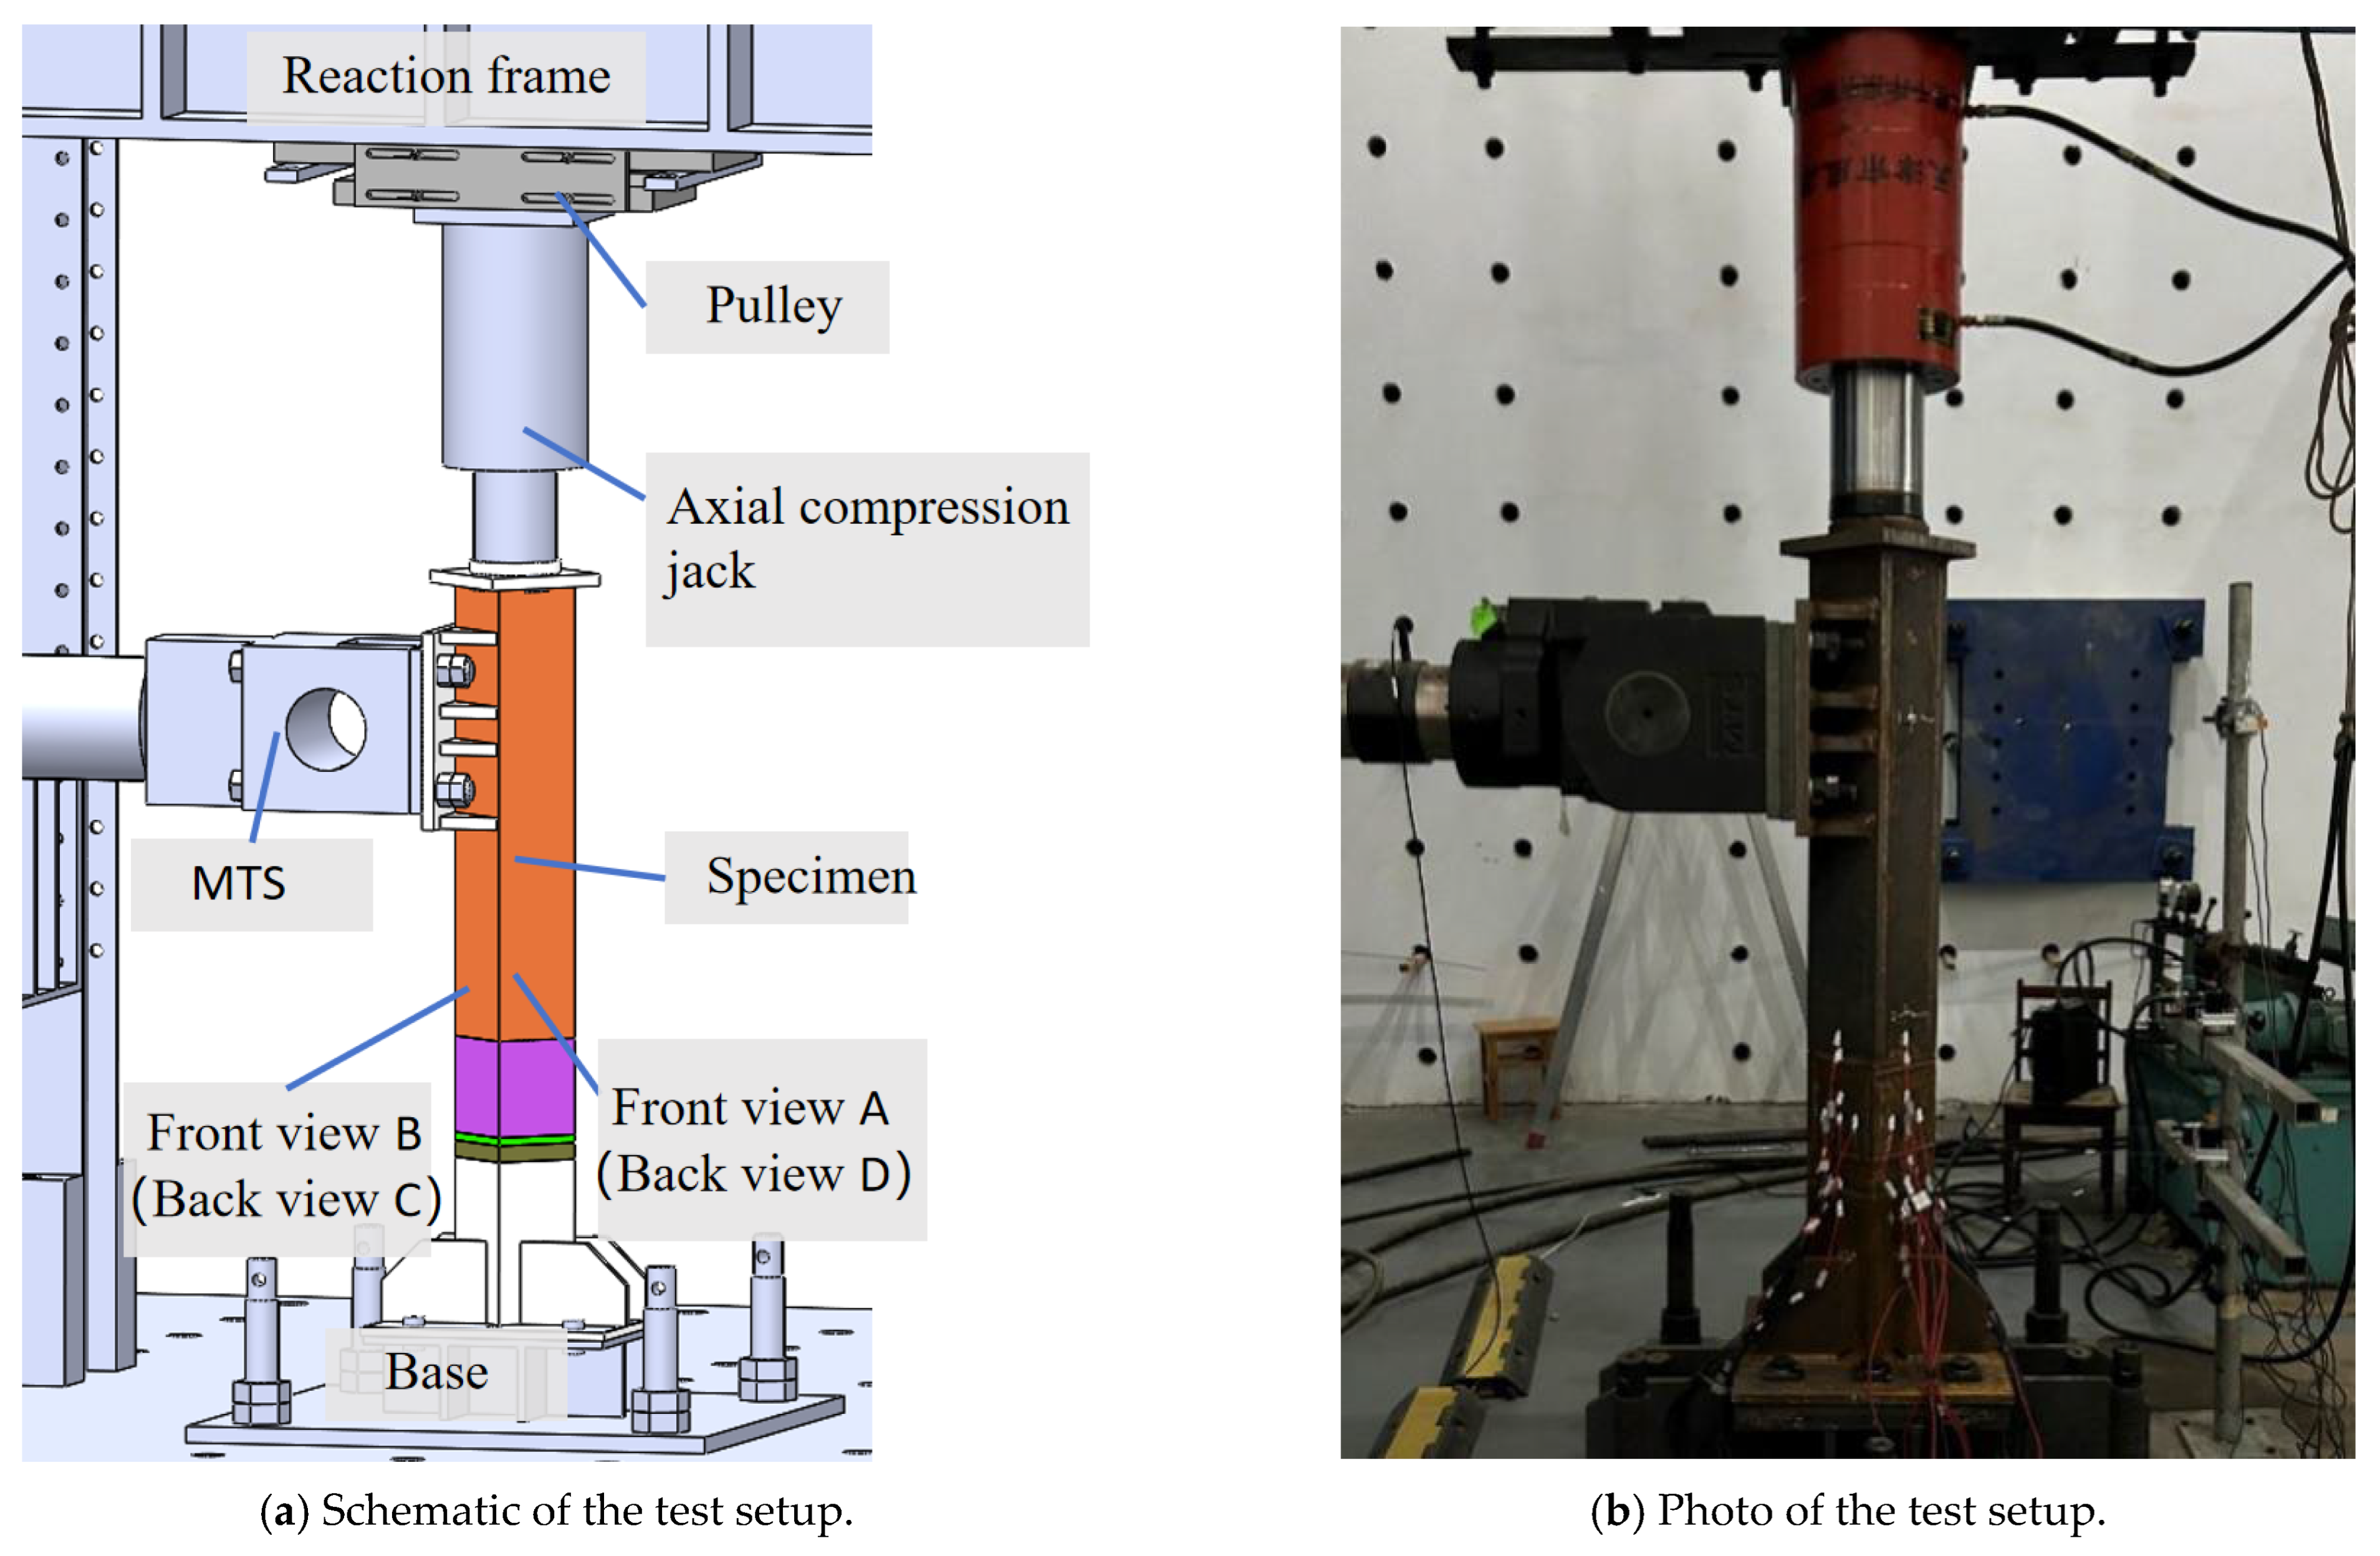
The test setup, as illustrated in Figure 4 and Figure 5, primarily consists of a reaction beam, a sliding support, a vertical hydraulic jack, an MTS actuator, and a fixed base. A column-end loading scheme was adopted for the tests. Following the sub-structuring principle commonly used in connection research [25], the specimen was isolated from a modular frame based on the inflection point assumption. In this study, a loading height of 1.1 m was strategically adopted to achieve a target shear-span ratio. This configuration was specifically designed to concentrate seismic-induced stresses on the self-locking mechanism, ensuring that the connection reaches its ultimate limit state and reveals its intrinsic failure modes before excessive global column yielding occurs. For Specimen S1 (0°), the top of the upper column was connected to the loading end of the MTS actuator using left and right clamping plates along with four long bolts. For Specimen S2 (45°), the connection at the top of the upper column was achieved via a welded end plate and four long bolts. The other end of the MTS actuator was securely anchored to the reaction wall. A vertical hydraulic jack was positioned at the top of the upper column, reacting against the reaction beam through a sliding support. This sliding support allowed free movement along the horizontal loading direction, thereby ensuring that a stable and constant axial compressive load was applied to the specimen throughout the entire loading process. The axial compression ratio for both groups of specimens was set to 0.1, corresponding to a constant axial load of 550 kN. The base plate of the lower column was bolted to the fixed base, which was subsequently rigidly anchored to the strong floor using ground anchor bolts.
Figure 4.
Test setup for specimen S1 (0°).
Figure 5.
Test setup for specimen S2 (45°).
Both groups of specimens were subjected to low-cyclic reversed loading. Initially, a constant axial load was applied to the top of the column and maintained throughout the entire loading process, followed by the application of a lateral load at the column top using an MTS actuator. The low-cyclic reversed loading protocol was established based on the ATC-24 [26] standard, utilizing a displacement control mode that was divided into elastic and plastic stages. Prior to the test, a nominal yield displacement () was pre-estimated through preliminary finite element analysis combined with the measured material properties. It should be clarified that this pre-estimated served solely as a nominal control benchmark to establish a reasonable gradient for the loading amplitude sequence. The actual yield displacement used for calculating the ductility and evaluating the connection’s mechanical indices was subsequently determined from the measured experimental skeleton curves. Before the specimen reached the nominal yield displacement (), amplitude levels of 0.25, 0.5, and 0.7 were applied sequentially, with 2 cycles per level. After yielding, amplitude levels of 1.0, 1.5, and 2.0 were applied, with 3 cycles per level. Once the displacement reached 3 times the yield displacement, amplitude levels of 3.0, 4.0, and 5.0 were applied, with 2 cycles per level. The test was terminated when the bearing capacity dropped to 85% of the peak load or when the specimen exhibited obvious plastic failure.
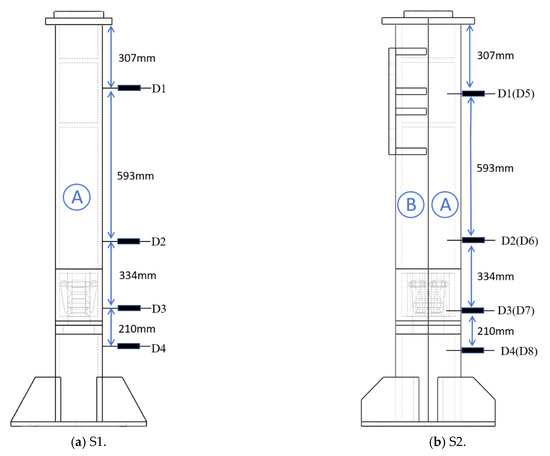
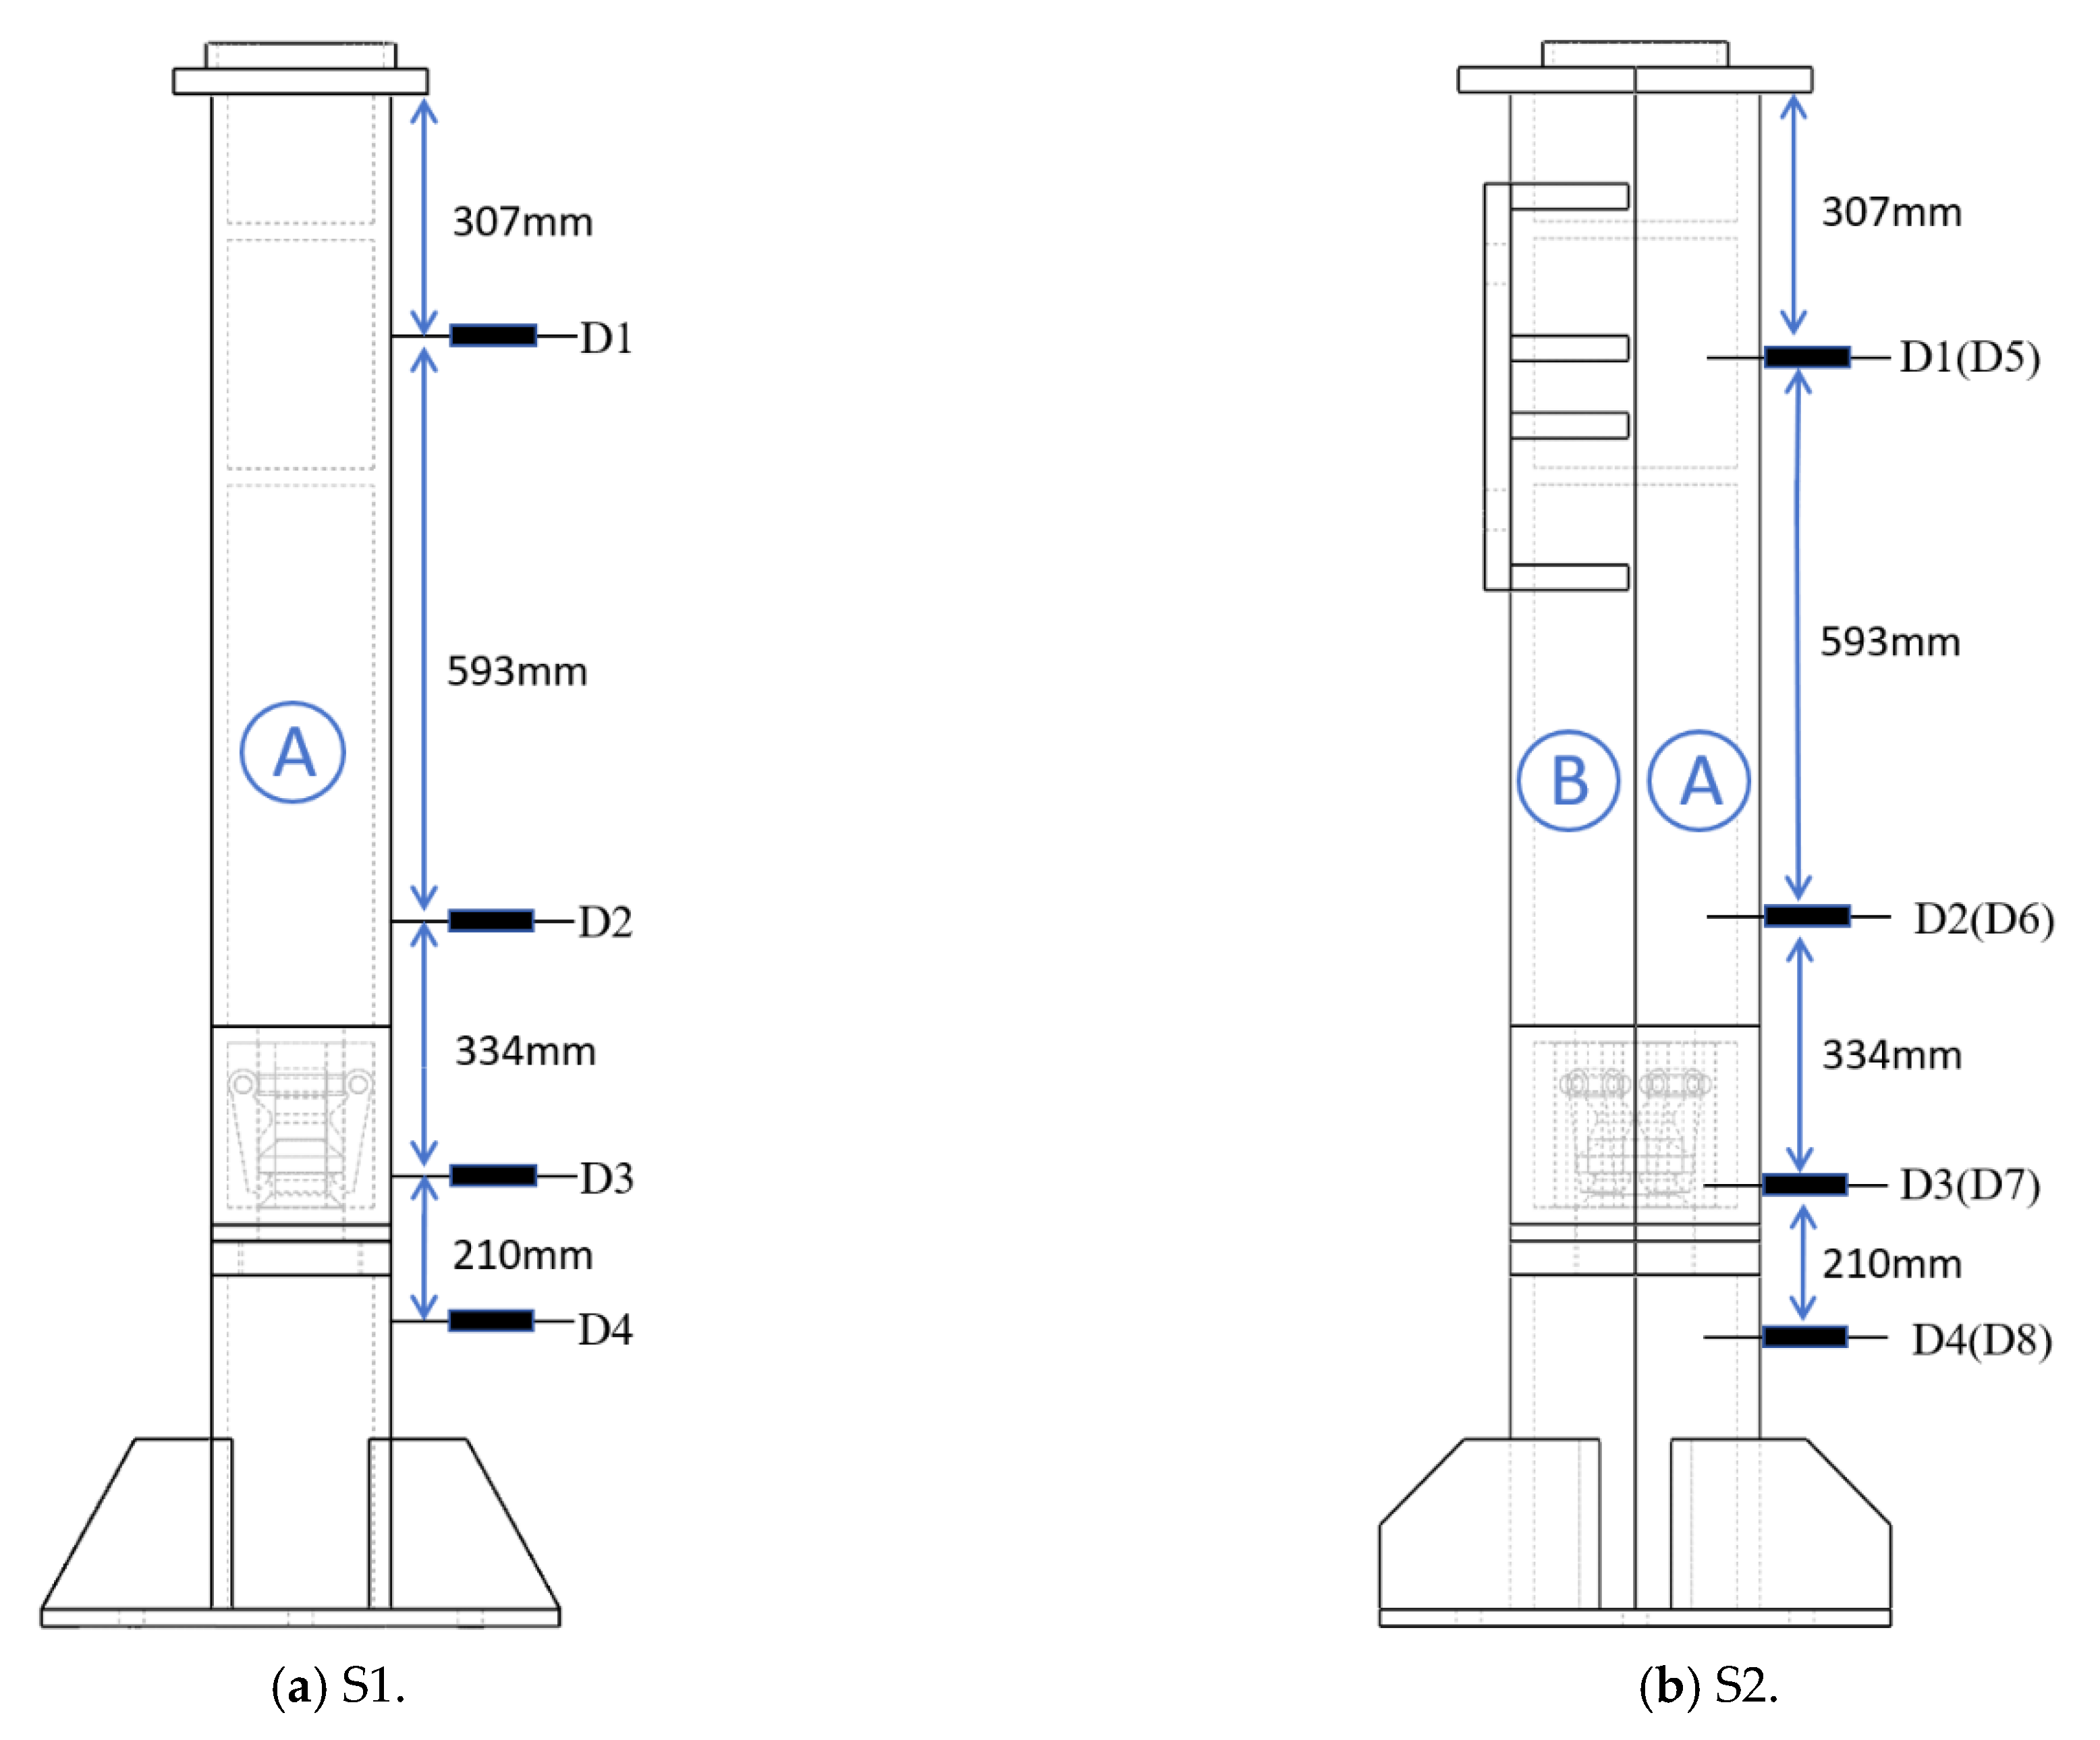
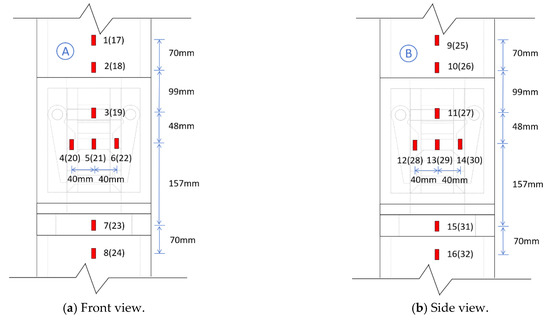
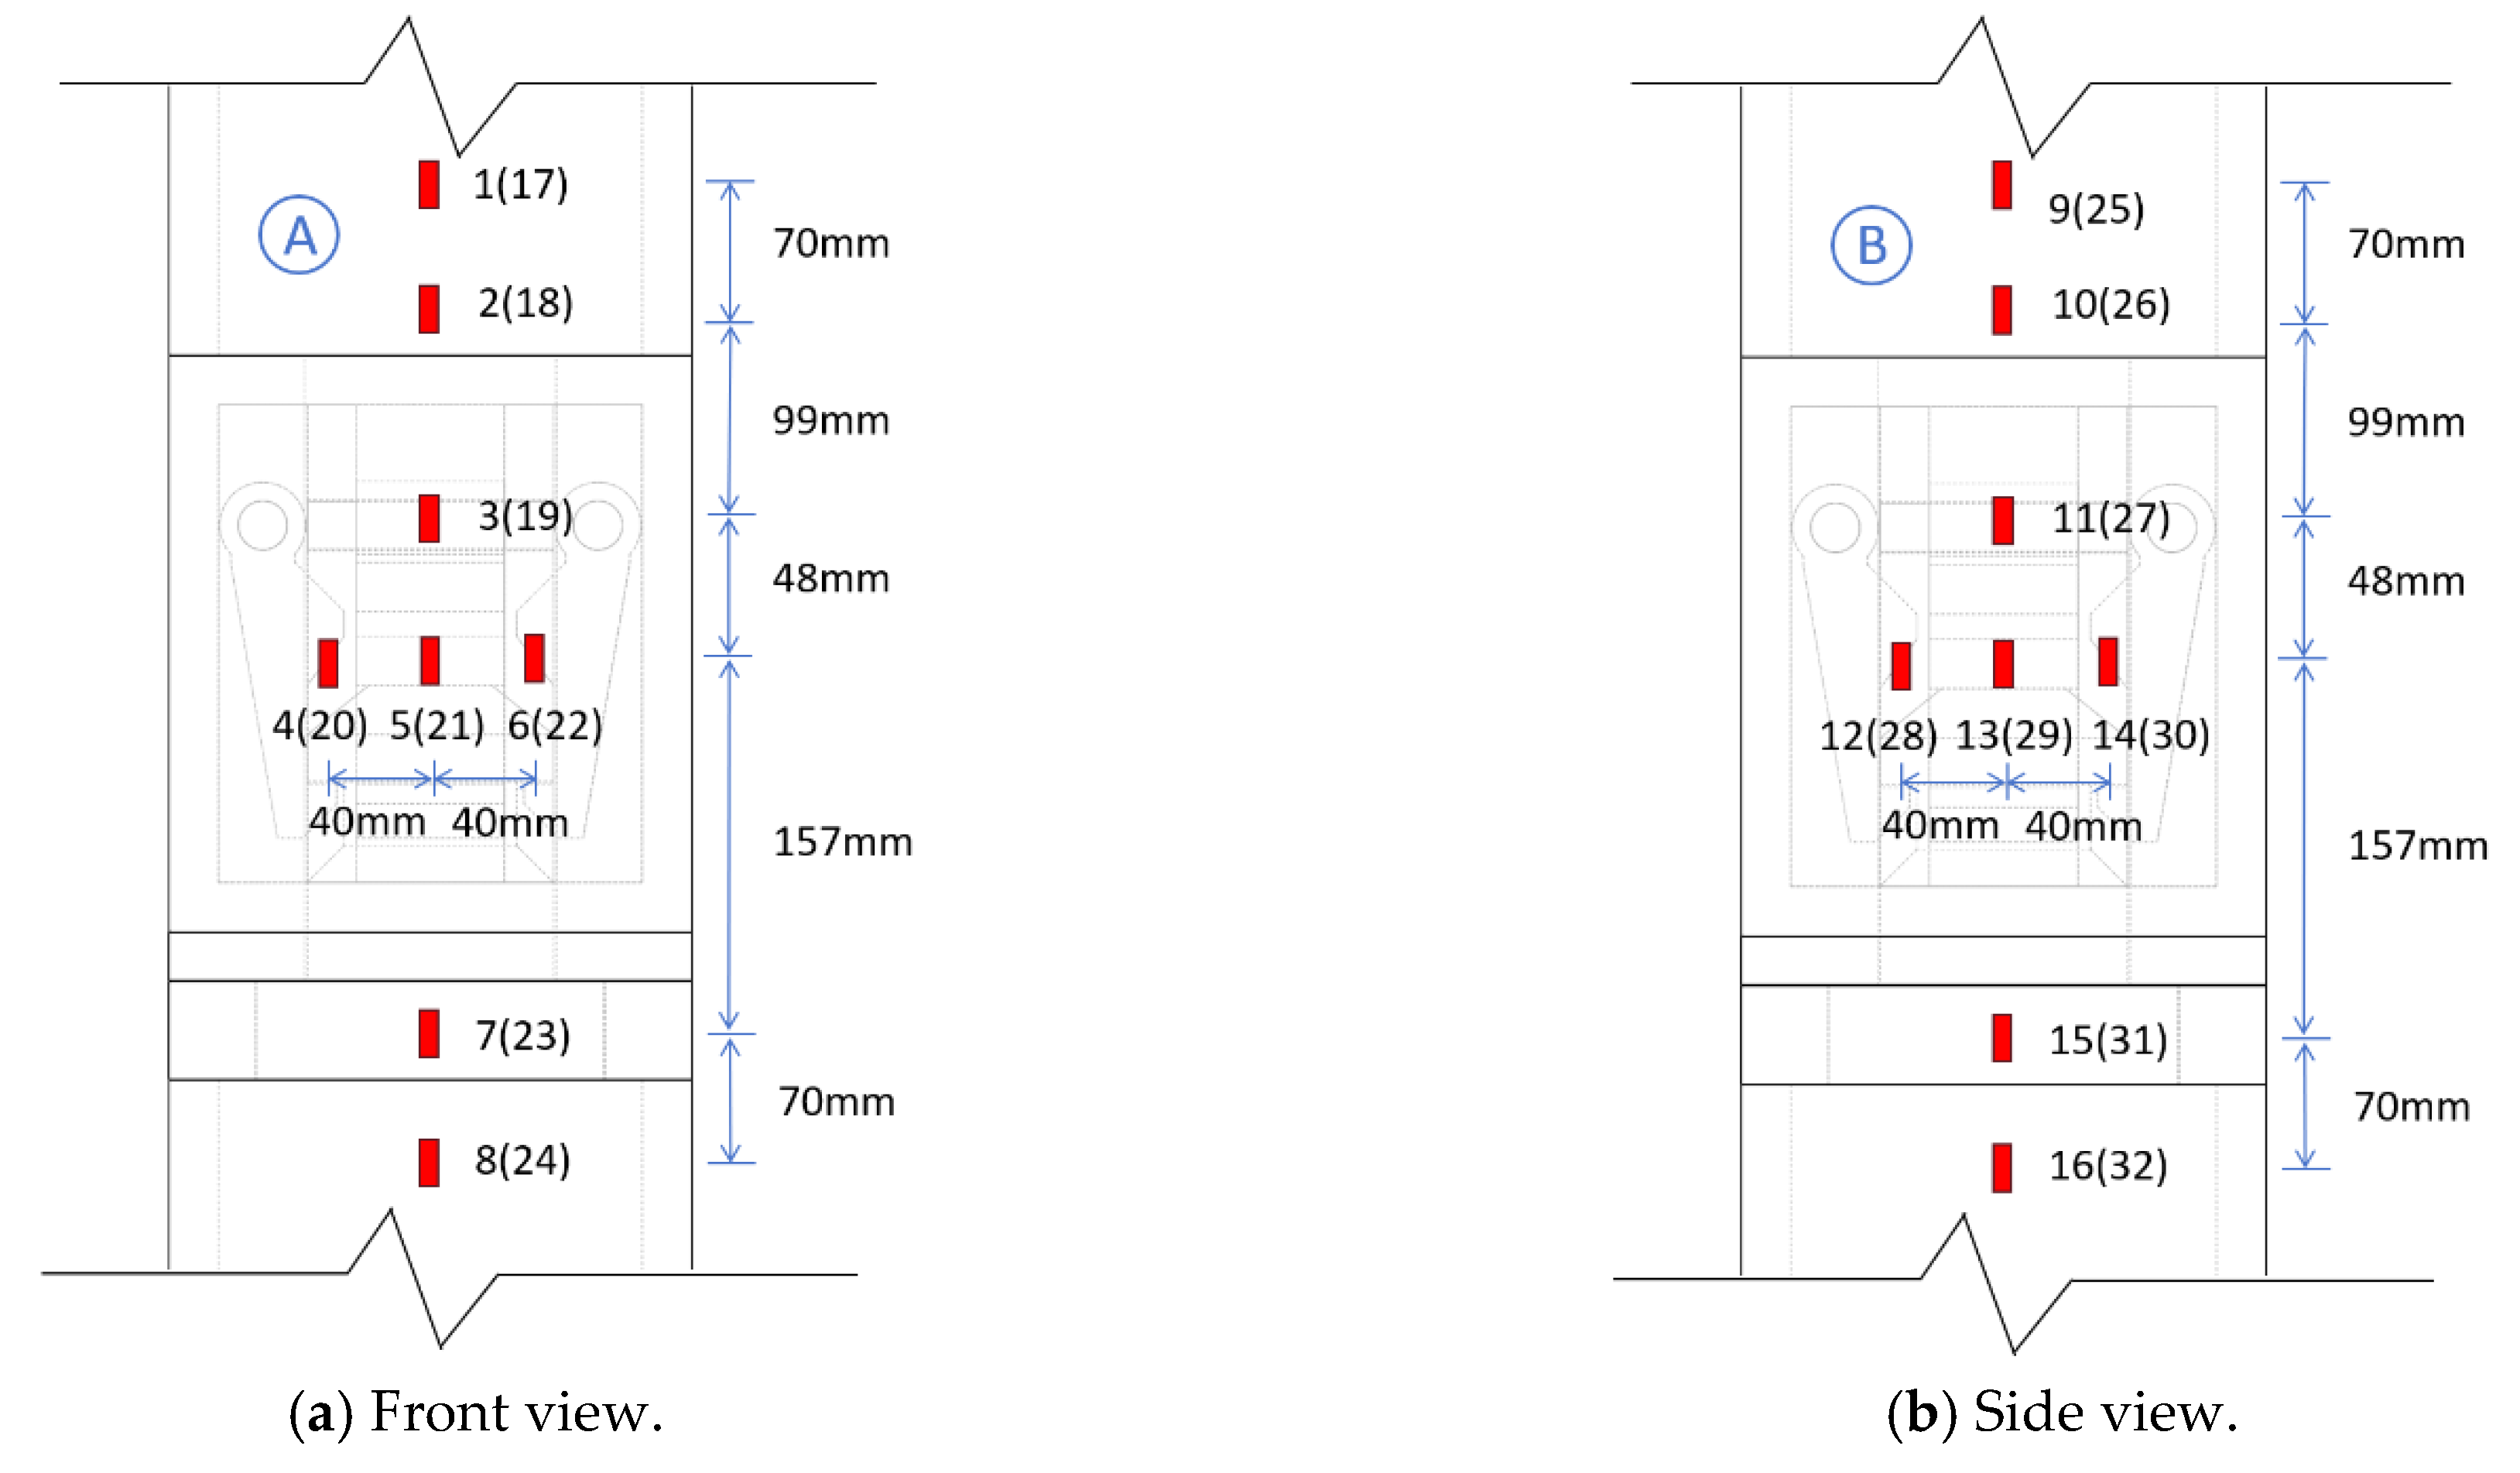
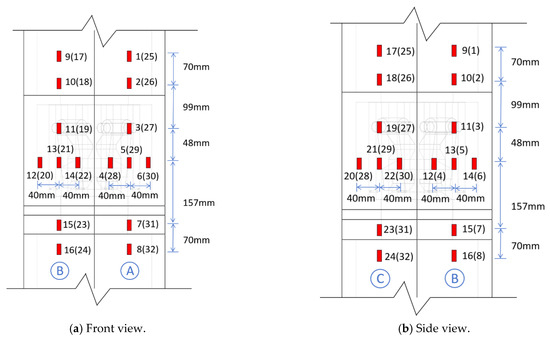
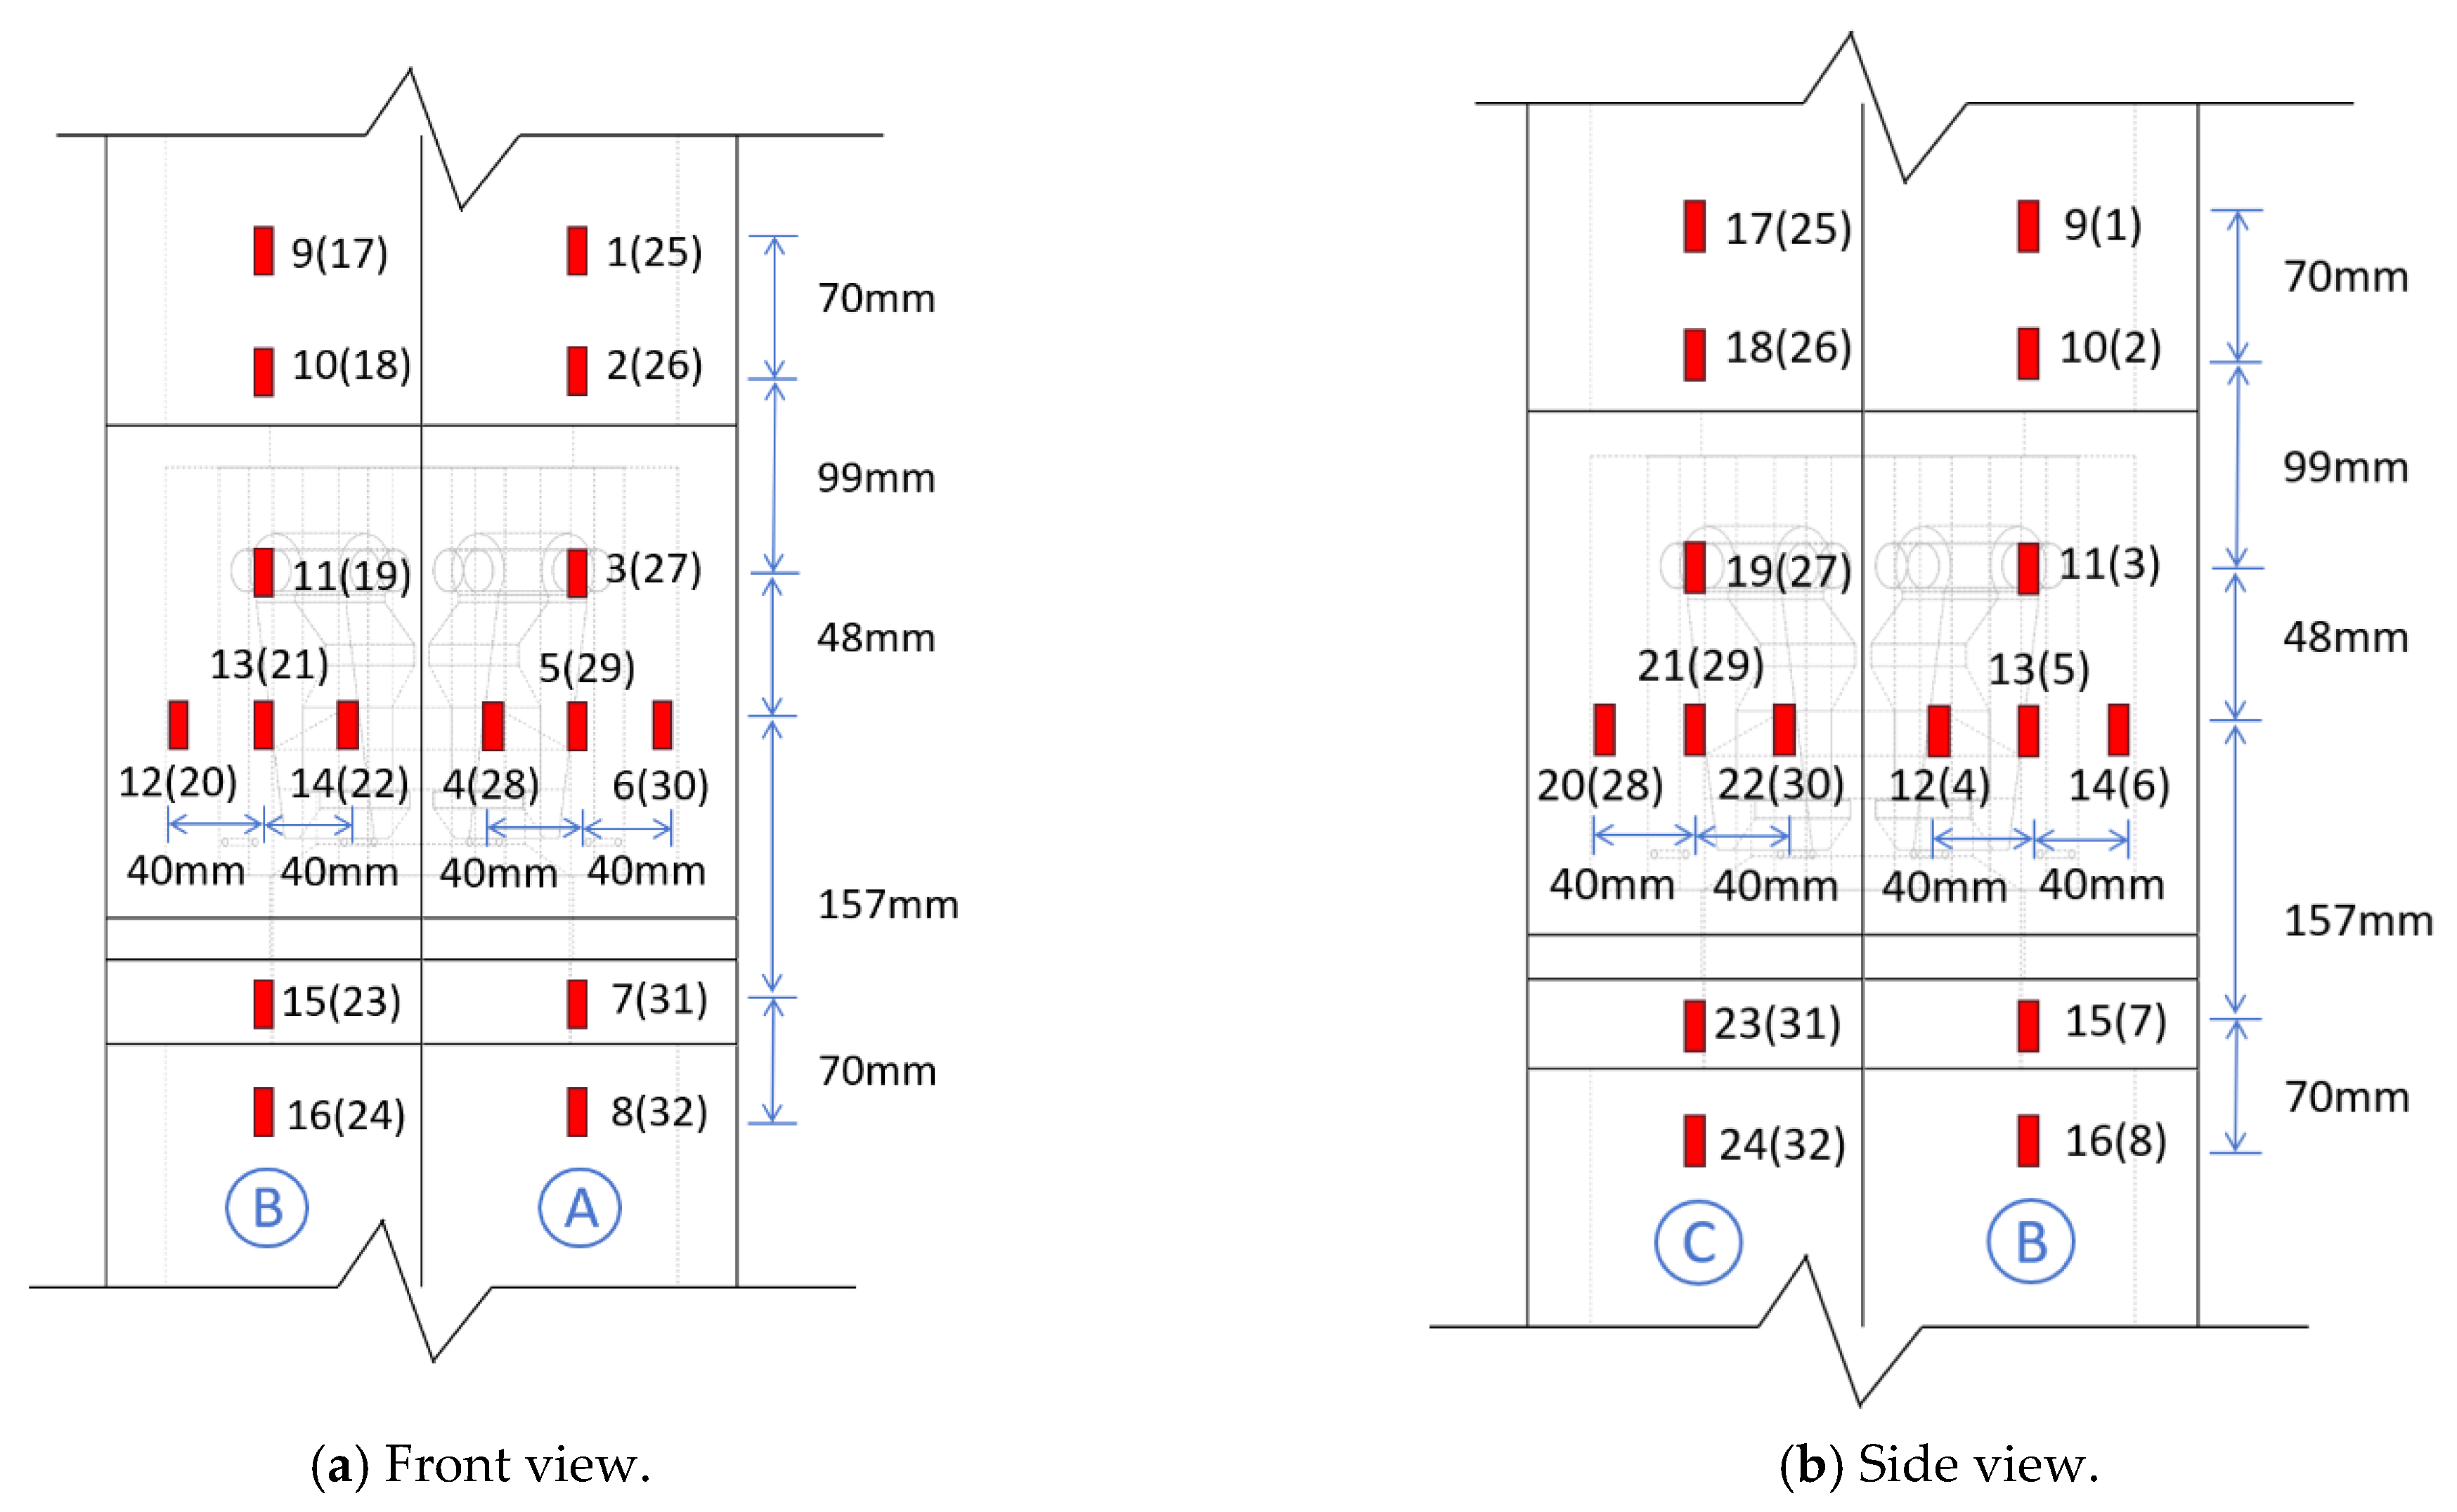
The measurement scheme is illustrated in Figure 6, Figure 7 and Figure 8. The load was recorded by the built-in sensor of the MTS actuator. A total of four Linear Variable Differential Transformers (LVDTs), designated as D1 to D4, were arranged on specimen S1. Specifically, D1 was used to measure the lateral displacement at the column end, D2 and D3 measured the lateral displacements at the lower part of the upper column and the lower part of the upper corner fitting, respectively, and D4 measured the displacement of the lower column. For specimen S2, eight LVDTs (D1–D8) were installed, where D1 and D5 measured the lateral displacement at the column end, D2 and D6 measured the displacement at the lower part of the upper column, D3 and D7 measured the displacement at the lower part of the upper corner fitting, and D4 and D8 measured the displacement of the lower column. Furthermore, 32 strain gauges were deployed at key locations in the connection area to monitor the strain development laws of the connection core region and adjacent components during the loading process.
Figure 6.
Layout of LVDTs.
Figure 7.
Strain gauge layout for specimen S1.
Figure 8.
Strain gauge layout for specimen S2.
3. Experimental Results and Analysis
3.1. Experimental Phenomena
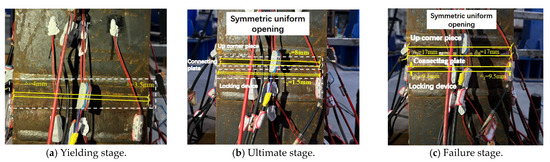
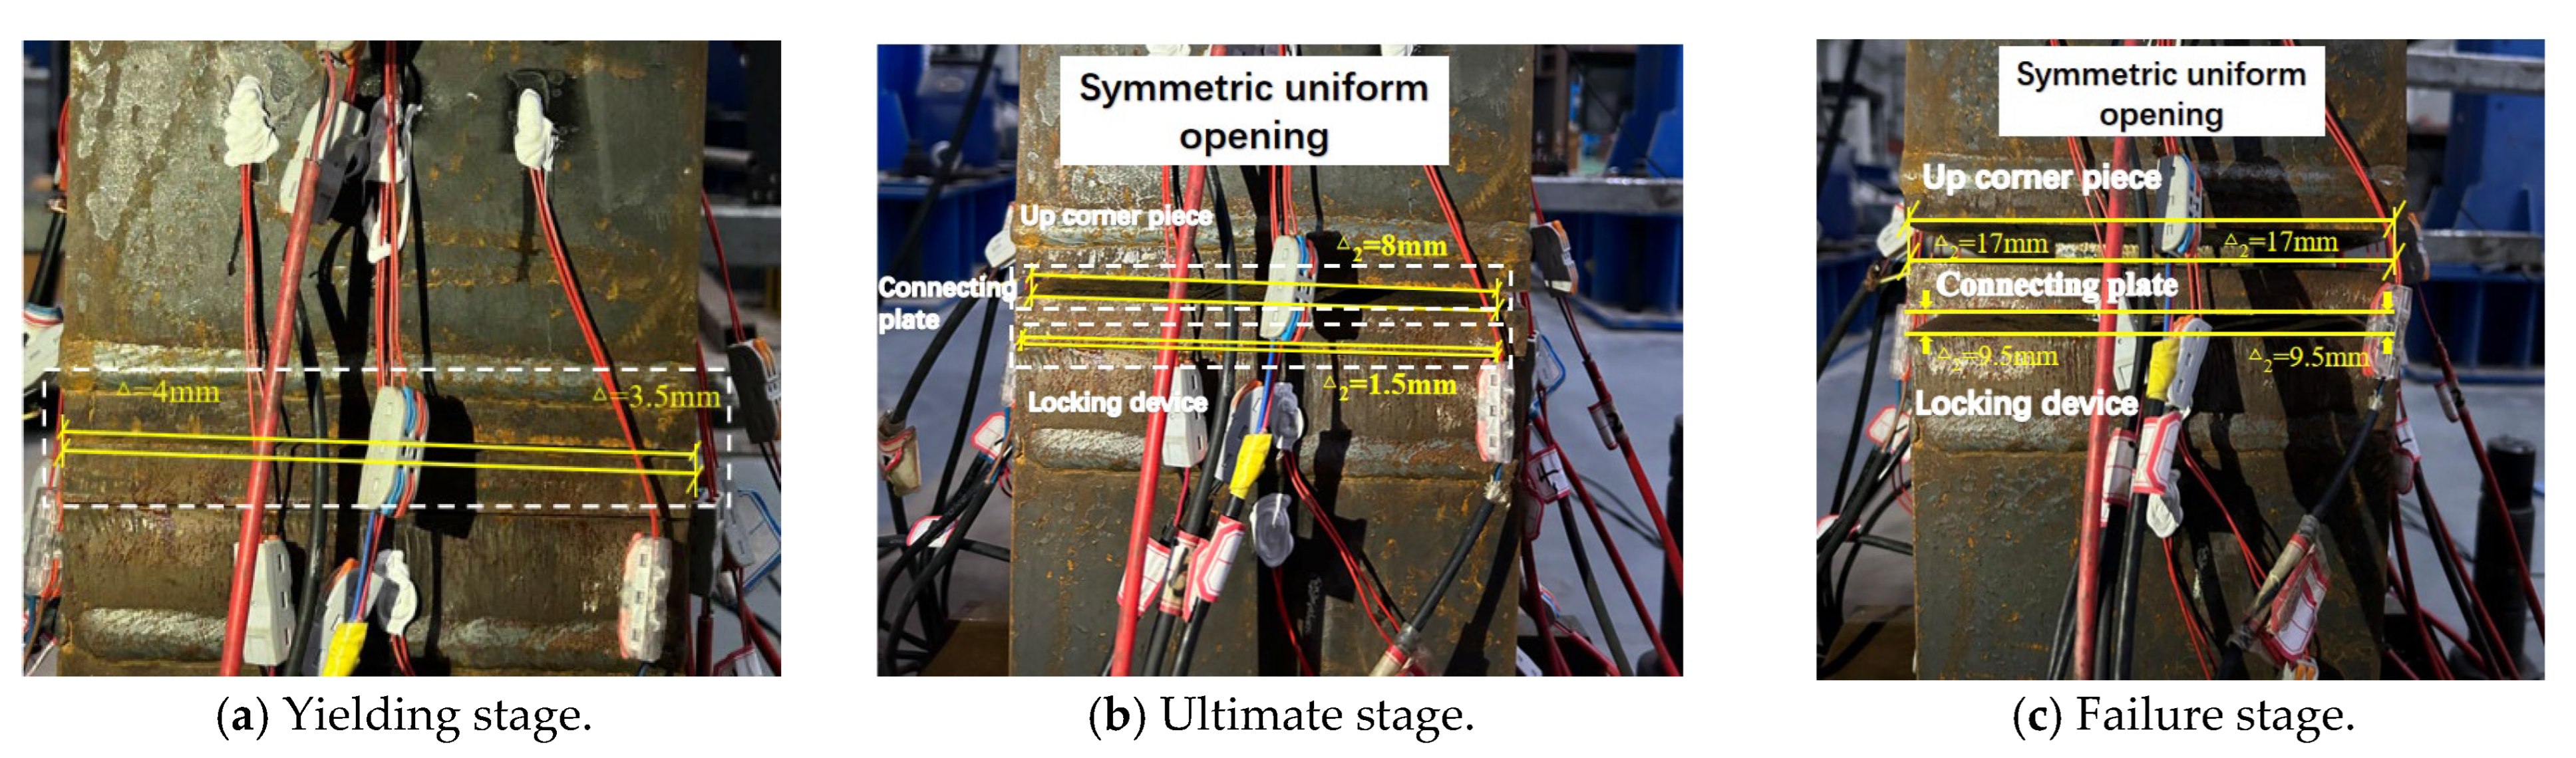
The experimental phenomena of specimen S1 and specimen S2 at each loading stage are shown in Figure 9 and Figure 10. Specimen S1 exhibited no obvious deformation during the initial loading stage, maintaining an overall elastic state. When the positive loading displacement reached +36 mm, the load–displacement curve began to show nonlinear variation, indicating that the connection entered the yield stage. At this point, a slight separation occurred between the upper corner fitting and the connecting plate; the opening gap on the left side of Face B was approximately 4 mm, and about 3.5 mm on the right side. Similarly, when negatively loaded to −36 mm, a slight separation was observed, with the gaps on both the left and right sides of Face D measuring approximately 3.5 mm. As the positive displacement increased to +62 mm, the gaps on the left side of Face B and the right side of Face D both enlarged to about 8 mm. The connection reached its ultimate state, and the positive bearing capacity began to pass its peak. When further loaded to the maximum displacement amplitude of +125 mm, the specimen maintained its overall integrity during the first reversed cycle, with the positive capacity entering a slow descending branch. However, during the tension phase of the second positive cycle at the same amplitude, accompanied by the slip of internal connection surfaces, the positive capacity dropped to 85% of the peak load, marking the end of the test. This phenomenon, characterized by obvious plastic damage accumulation, indicates that after the tension-side tenon experienced large-deflection plastic yielding and reverse compression in the first cycle, local plastic buckling occurred at its geometric interlocking surface. This led to the degradation of geometric constraints at the contact surface, causing tenon slip and the eventual failure of the self-locking connection. Overall, specimen S1 exhibited distinct opening deformation characteristics throughout the loading process, primarily concentrated on Faces B and D.
Figure 9.
Failure phenomena of specimen S1.
Figure 10.
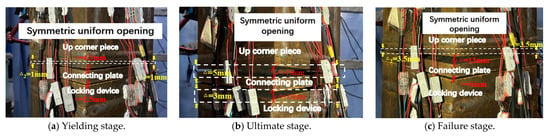
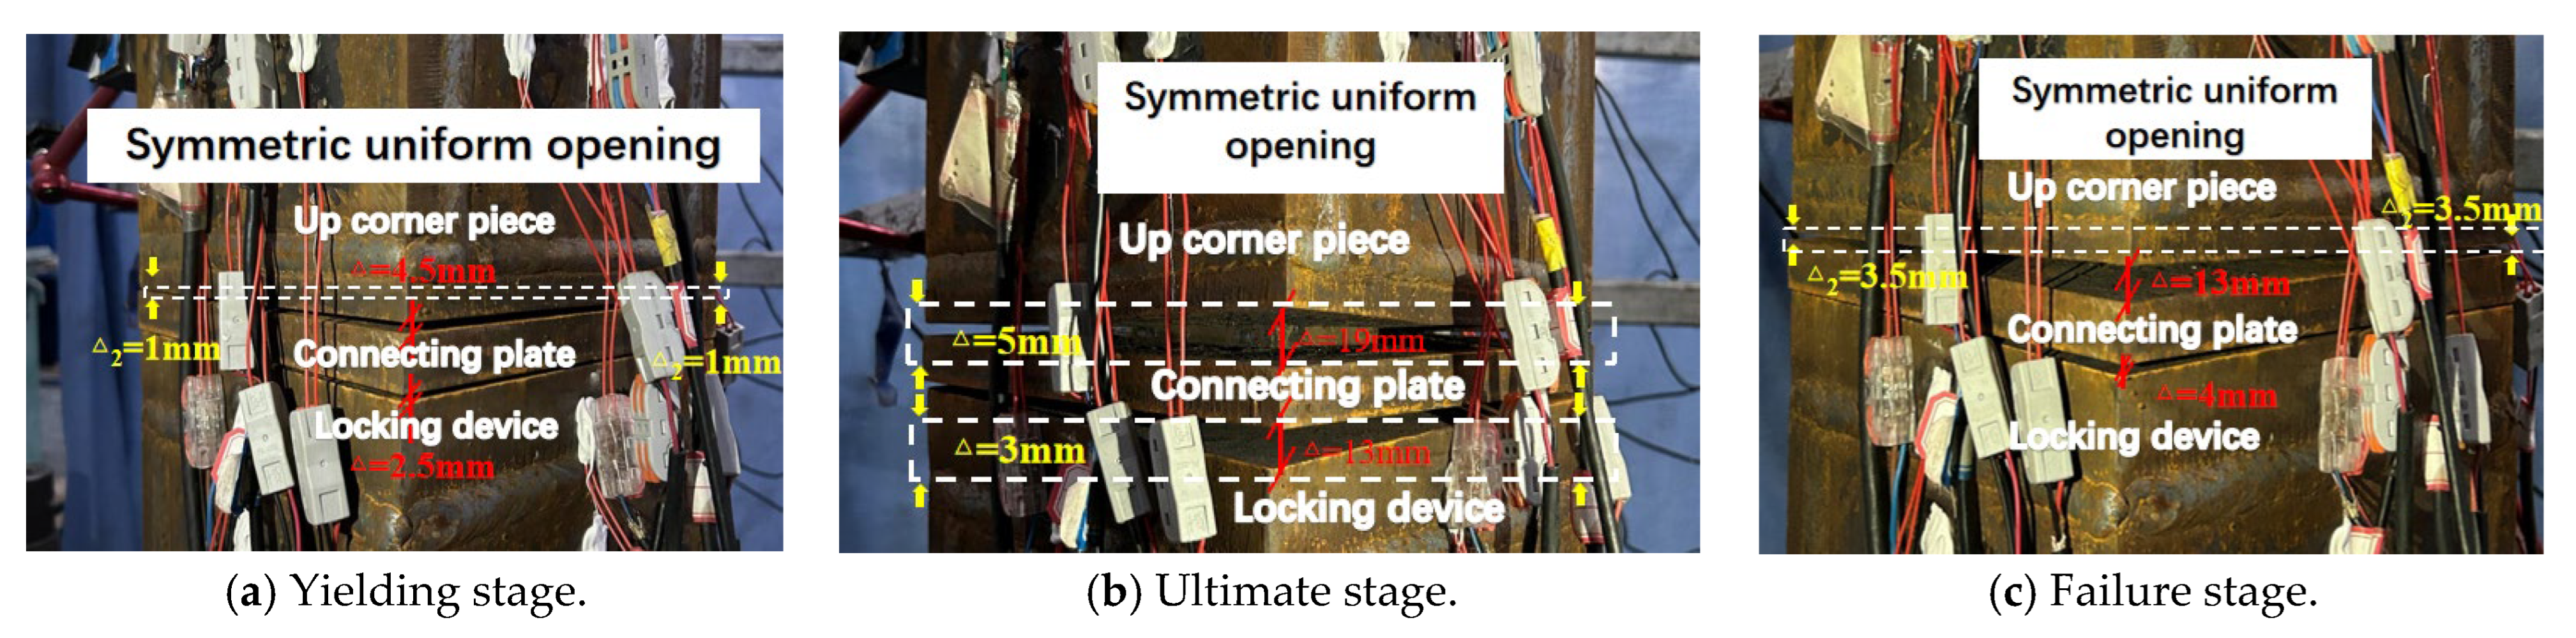
Failure phenomena of specimen S2.
Specimen S2 also remained in an elastic state during the initial loading stage. When the positive displacement reached +43 mm, the load–displacement curve exhibited nonlinearity, and the connection yielded. At this time, a slight separation appeared between the upper corner fitting and the connecting plate. The opening gaps at the A/B and C/D corners were both approximately 1 mm, whereas the gap at the B/C corner had reached about 4.5 mm. When the positive displacement increased to +79 mm, the opening gaps at each corner further developed; the gaps at the A/B and C/D corners were both about 3.5 mm, while the gap at the B/C corner increased to approximately 13 mm, indicating that the connection reached its ultimate state and the capacity began to decrease. Unlike S1, which failed at +125 mm, S2 experienced premature slip failure of the tension-side tenon during the second positive cycle at +106 mm. The capacity dropped below 85% of the ultimate load, and the test was terminated. This observation indicates that the spatial stress state and deformation incompatibility accelerated the plastic wear and geometric degradation of the internal self-locking mechanism. Furthermore, during the negative closing stage, due to spatial biaxial constraints, the tenon failed to fully reset when returning to the cavity, resulting in more complex asymmetrical slip and contact surface reconstruction with the surrounding steel walls. Compounded by the influence of initial assembly tolerances, this irreversible residual deformation caused S2 to exhibit a load-climbing phenomenon where the negative resistance was higher than the positive resistance.
Based on the experimental phenomena of both specimen groups, connection opening is a common feature of this tenon self-locking/unlockable connection under bending. Under the planar compression–bending–shear condition, the opening area primarily extends along the loading plane, presenting relatively clear connection deformation. Conversely, under the spatial compression–biaxial bending–shear condition, the connection opening is more concentrated at local corner regions, demonstrating that spatial loading exacerbates local deformation concentration.
3.2. Hysteretic and Skeleton Curves
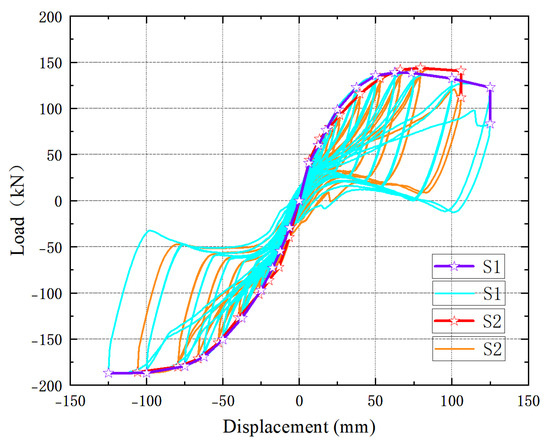
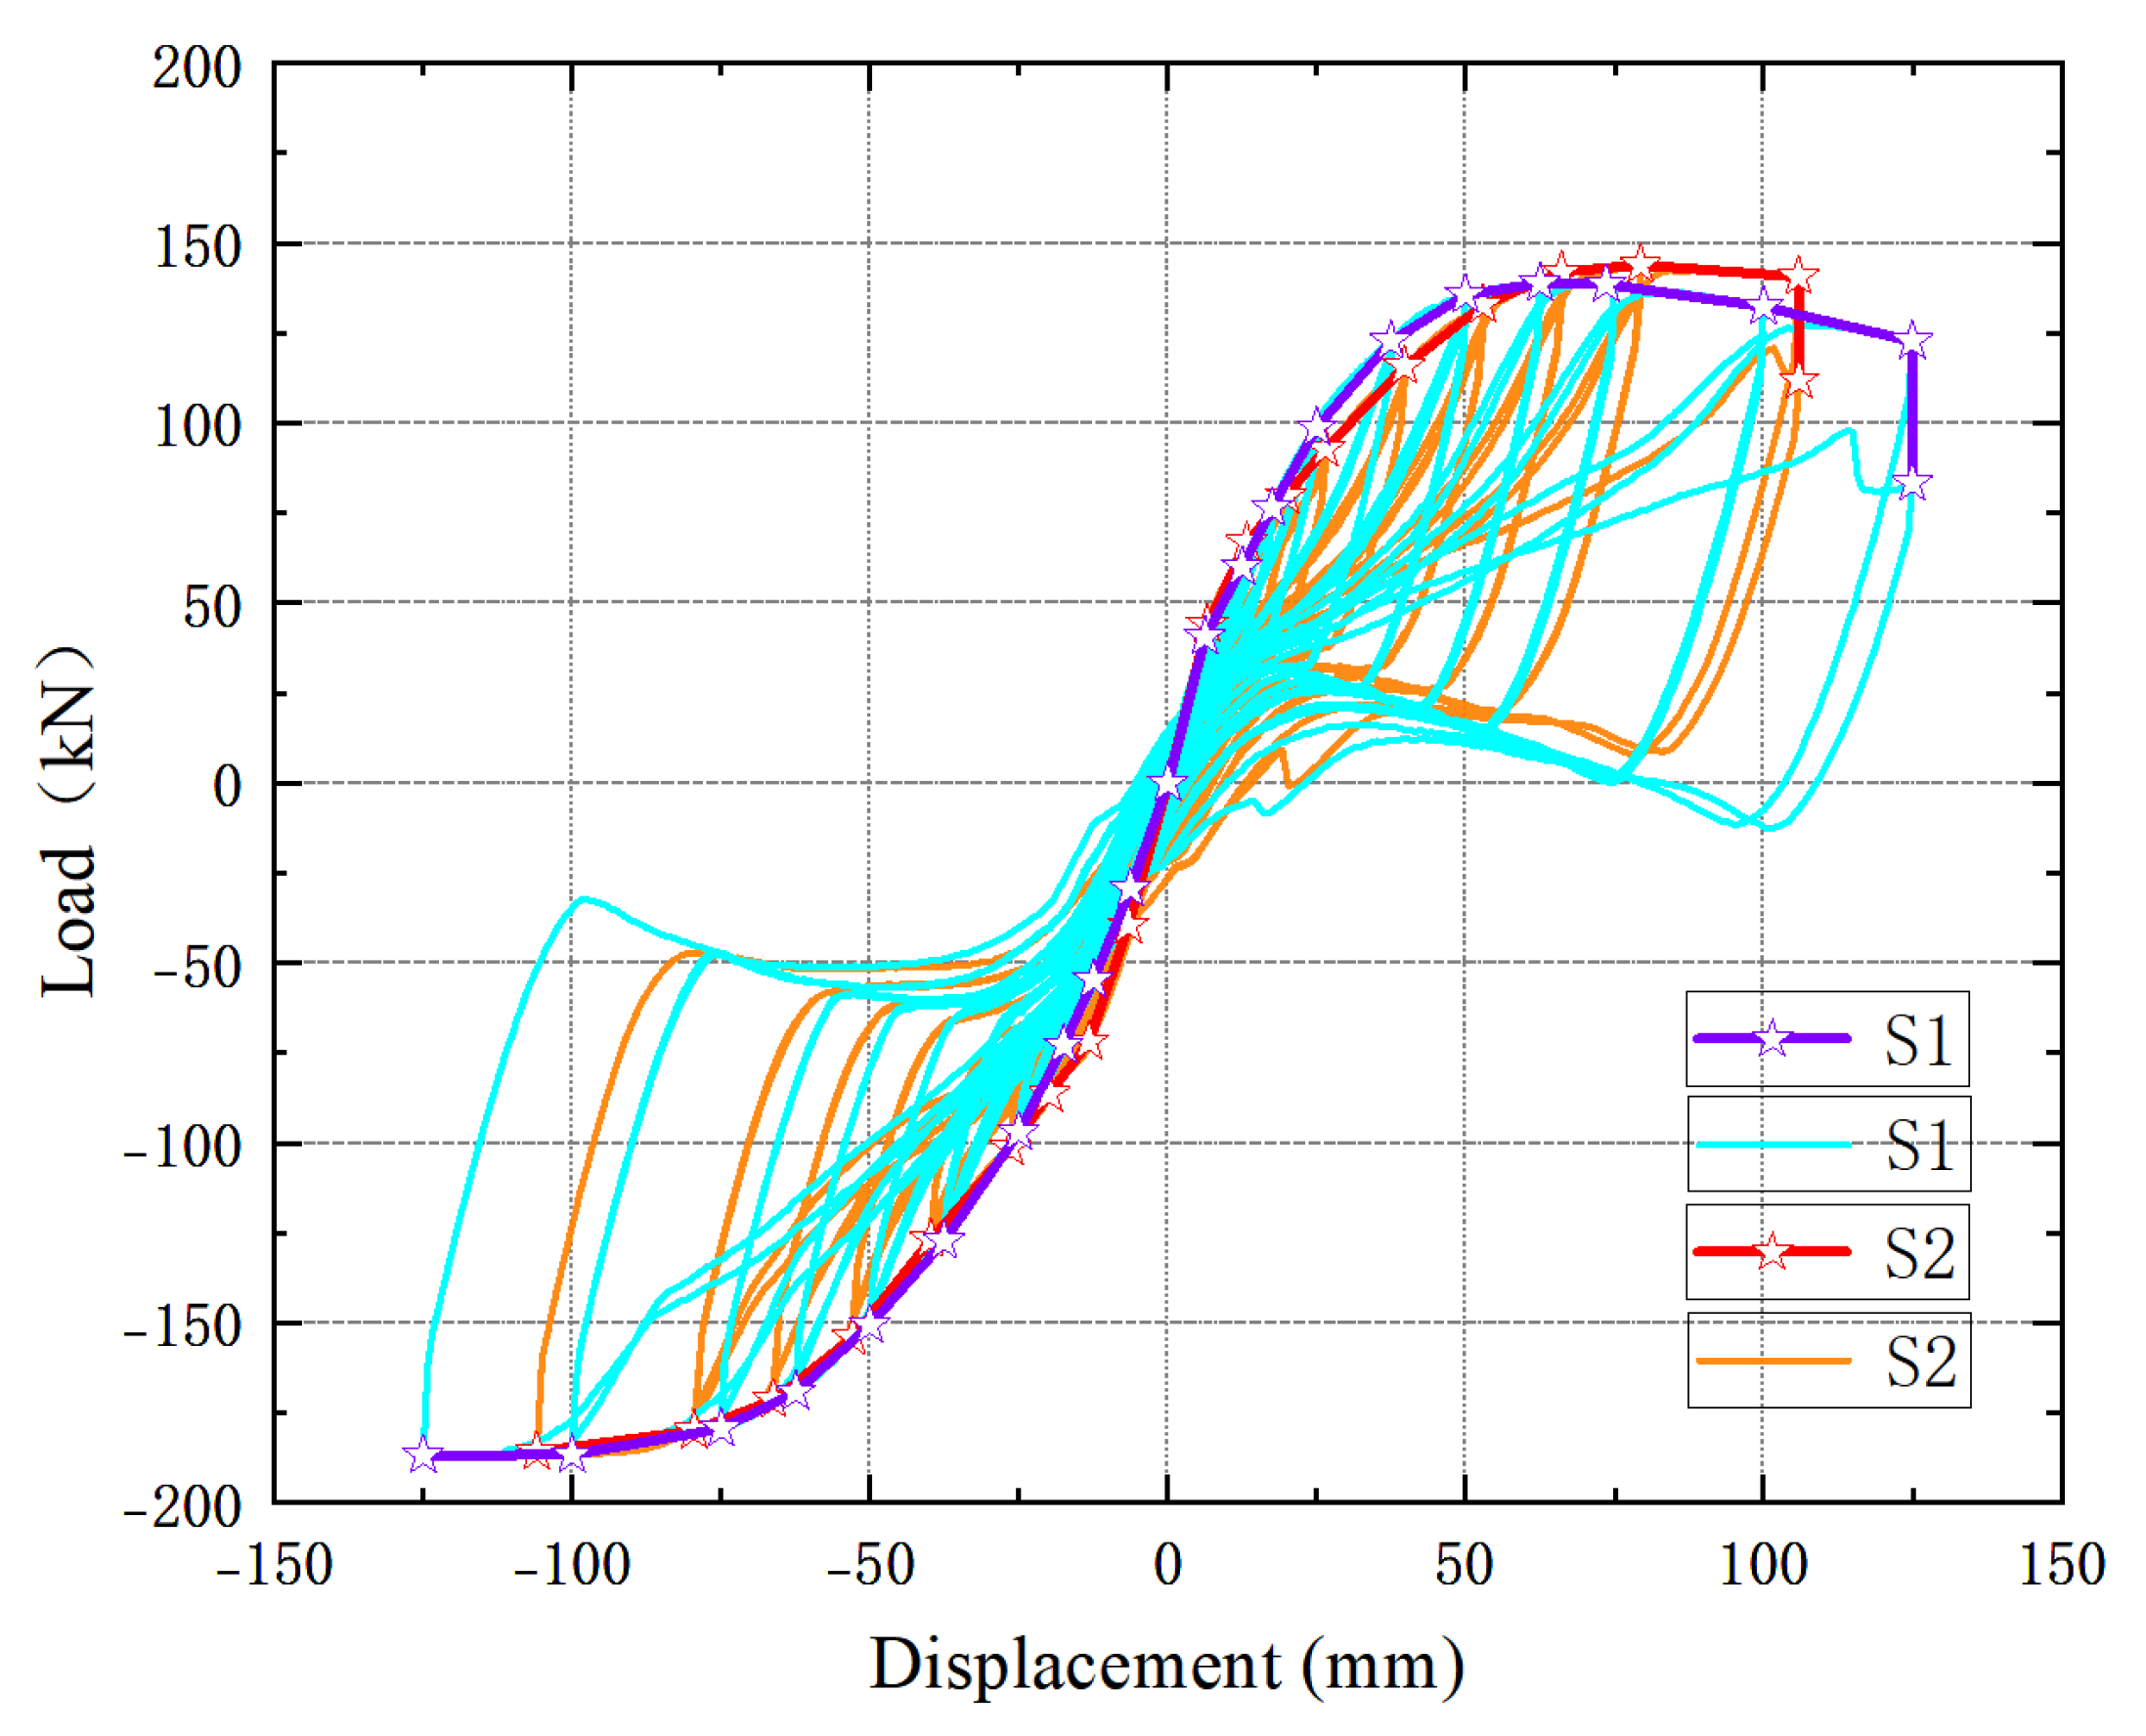
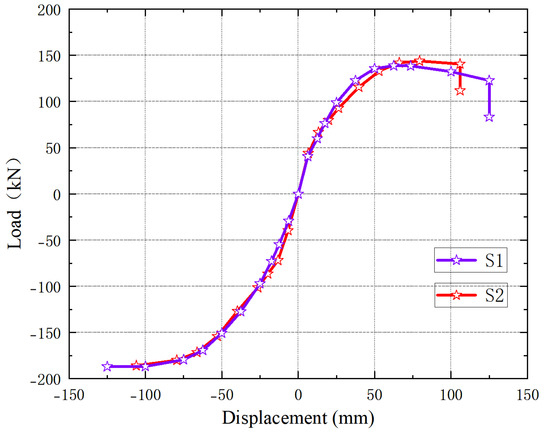
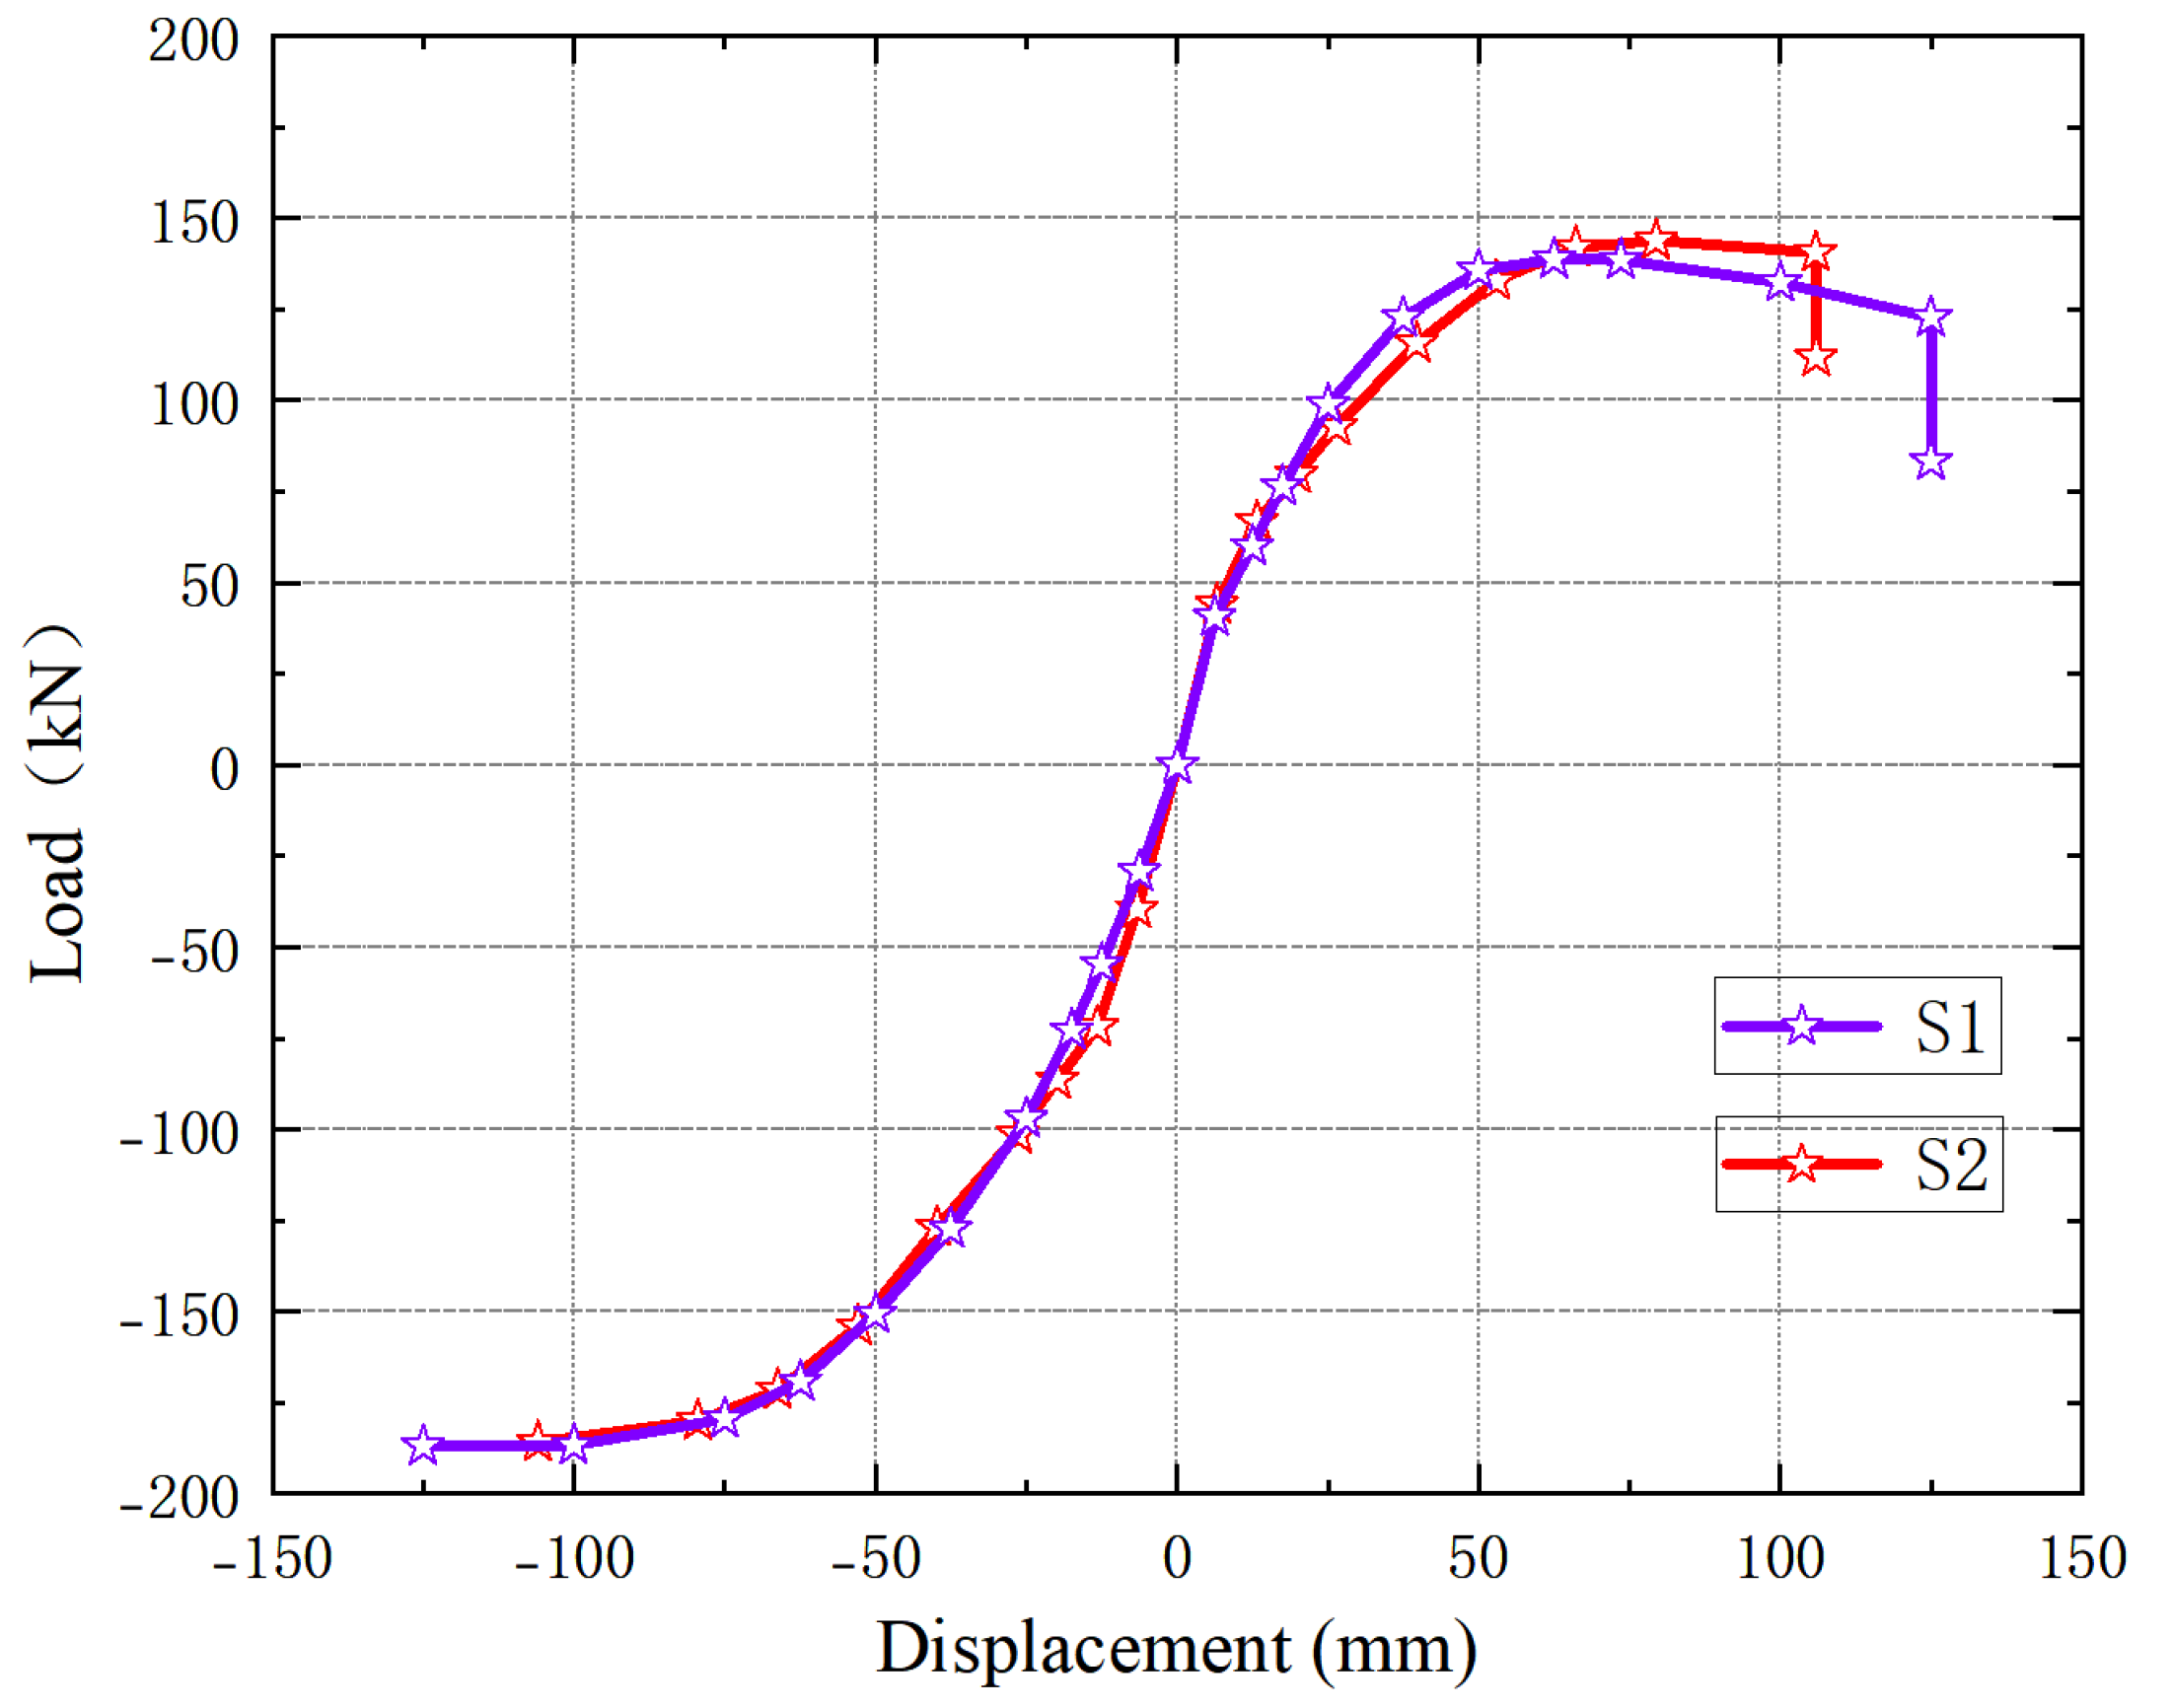
Figure 11 and Figure 12 present the hysteretic and skeleton curves of the two groups of specimens. These curves reflect the bearing capacity, stiffness, deformation capacity, and energy dissipation capacity of the connections under cyclic loading. As shown in the figures, the overall shapes of the hysteretic curves for S1 and S2 are relatively similar. Both exhibit a spindle shape accompanied by a certain pinching effect, indicating that this type of connection possesses favorable plastic deformation and energy dissipation capacities. Judging from the area enclosed by the hysteretic loops, the hysteretic loop area of S1 is generally larger than that of S2, demonstrating that the specimen has a stronger energy dissipation capacity under the planar compression–bending–shear condition. However, as seen from the skeleton curves and Table 3, the average initial stiffness of S2 is 6.08 kN/mm, which is higher than the 5.47 kN/mm of S1. This indicates that the initial deformation resistance of the connection is slightly improved under the spatial compression–biaxial bending–shear condition. The average ultimate loads of the two specimen groups are 162.8 kN and 164.85 kN, respectively. This minor difference suggests that the spatial compression–biaxial bending–shear action does not significantly weaken the ultimate flexural bearing capacity of the connection. Comparing the ductility indices reveals that the average ductility coefficient of S1 is 2.79, higher than the 2.14 of S2, indicating that the spatial loading condition reduces the deformation reserve of the connection. Overall, the connection under the spatial compression–biaxial bending–shear condition has advantages in initial stiffness and ultimate flexural bearing capacity, while its late-stage ductility development and energy dissipation stability are weaker than those under the planar condition.
Figure 11.
Comparison of hysteresis loops between specimens S1 and S2.
Figure 12.
Comparison of backbone curves between specimens S1 and S2.
Table 3.
Initial stiffness and ultimate flexural bearing capacity indices.
It should be noted that the force () and displacement () responses presented in these figures are extrinsic metrics dependent on the specific shear-span (lever arm m, calibrated to the rotational pivot) of the current experimental setup. To evaluate the intrinsic mechanical characteristics of the connections independently of the specimen size, these metrics correspond to the joint bending moment () and rotation angle (). Specifically, the intrinsic connection moment can be derived as (accounting for the second-order effect, which will be detailed in the theoretical derivation in Section 5), and the equivalent rotation angle can be approximated as . Under this intrinsic coordinate system, both specimens demonstrate excellent rotational deformability. For instance, based on the ultimate displacements, the equivalent ultimate rotation angles () for both the planar and spatial loading conditions exceed 0.05 rad, satisfying the ductility requirements for typical semi-rigid steel connections.
It can be seen from Table 3 and the skeleton curves in Figure 12 that the positive ultimate load of Specimen S1 (0°) is 138.7 kN, while its negative ultimate load reaches 186.9 kN; the positive ultimate load of Specimen S2 (45°) is 143.8 kN, while its negative ultimate load is 185.9 kN. To quantitatively assess this loading asymmetry, taking Specimen S1 as an example, the negative ultimate capacity (186.90 kN) is 34.7% higher than its positive counterpart (138.70 kN). Conversely, its negative initial stiffness (4.70 kN/mm) decreases by 24.5% compared to the positive initial stiffness (6.23 kN/mm). This significant asymmetric phenomenon can be explicitly distinguished into two categories of influencing factors:
(1) Physical specimen effects: The physical connections inevitably contain initial assembly gaps. During the reverse (negative) loading phase, which occurs after substantial positive plastic deformation, the tenon fails to return to its absolute geometric neutral position due to irreversible plastic slip. This leads to a complex, asymmetrical stress reconstruction at the contact surfaces, which macroscopically manifests as a delayed stiffness engagement but an eventually enhanced wedging resistance.
(2) Experimental setup effects: The mechanical clearances within the testing apparatus (such as the pin-hole gaps in the MTS actuator during the push–pull transition) and the slight differences in the inherent stiffness of the restraining reaction frame between the pushing and pulling directions superimpose additional external non-ideal boundary conditions.
Ultimately, these comprehensive nonlinear factors, driven jointly by internal physical contact reconstruction and external setup tolerances, cause the asymmetric phenomenon observed in the late loading stage.
This asymmetry reflects that the prefabricated connection is significantly affected by initial manufacturing tolerances and residual slip mechanisms. In engineering design and subsequent numerical analyses, the positive ultimate flexural bearing capacity, which is less influenced by initial defects and load-transmission mechanism errors, should be adopted as a conservative design baseline.
3.3. Strain Analysis
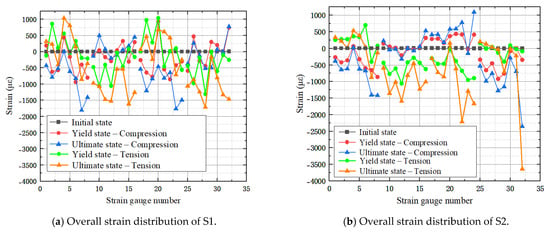
The strain curves of specimen S1 and specimen S2 are shown in Figure 13. For specimen S1, large strains were primarily concentrated around measurement points 4, 20, 7, and 23. Among them, measurement point 4, located at the lower part of the connection core region, was the most typical high-strain location in S1, indicating that this area bore a strong local tension–compression transition effect during the connection opening process. Measurement point 20 was located in the middle of the upper corner fitting, while points 7 and 23 were close to the fixture region. This demonstrates that the connection core region and the areas adjacent to the fixture are the primary stress concentration zones under planar compression–bending–shear loading.
Figure 13.
Strain distribution comparison.
For specimen S2, high strains were mainly concentrated around measurement points 7, 8, and 24. Specifically, points 7 and 8 were located at the fixture and the connection transition zone between the lower column and the fixture, while point 24 was situated at the connection area between the lower column and the fixture. These results indicate that under the spatial compression–biaxial bending–shear loading, stress concentration occurred not only in the connection core load-transfer region but also extended further to the corner opening area and its adjacent column walls, reflecting more complex stress distribution characteristics under spatial load coupling.
Overall, the development area of the connection opening and the adjacent column walls above and below the connection are the critical locations most prone to local stress concentration for this type of connection under bending. In particular, the stress concentration in S1 manifested more prominently as local high strains in the connection core region, whereas the high-strain zones in S2 extended toward the fixture connection transition zone. This also explains, in part, the poorer late-stage deformation compatibility of the connection under the spatial compression–biaxial bending–shear condition.
3.4. Stiffness Degradation, Strength Degradation, and Energy Dissipation Analysis
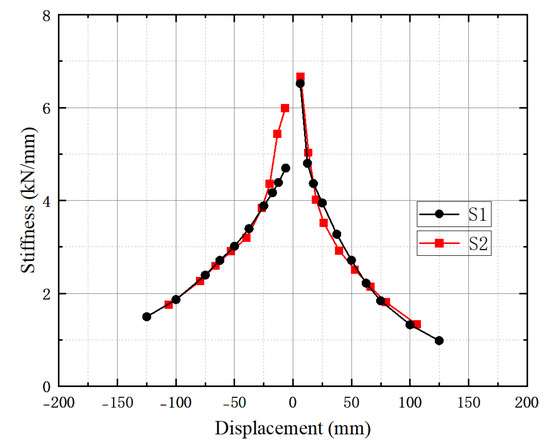
During the low-cyclic reversed loading process, the stiffness of both specimen groups gradually degraded with the increase in displacement amplitude. The cyclic stiffness is represented by the secant slope corresponding to each loading level of the skeleton curve, and its variation law is illustrated in Figure 14. As can be seen from the figure, the initial stiffness of S2 was slightly higher than that of S1, but its late-stage stiffness degradation rate was faster. When the displacement approached 20 mm, the stiffnesses of the two specimen groups gradually became closer. This result indicates that although the spatial compression–biaxial bending–shear action improved the initial deformation resistance of the connection to a certain extent, it also accelerated the late-stage damage accumulation and stiffness degradation.
Figure 14.
Stiffness degradation curves.
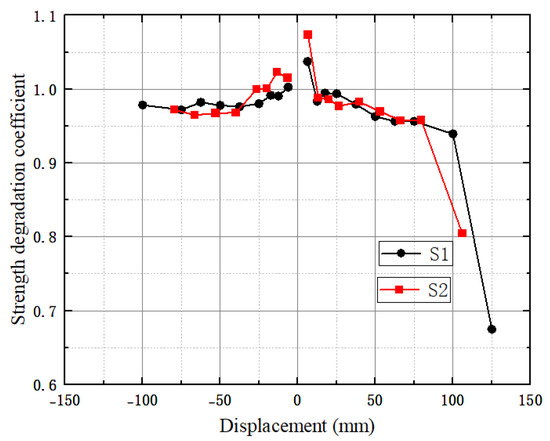
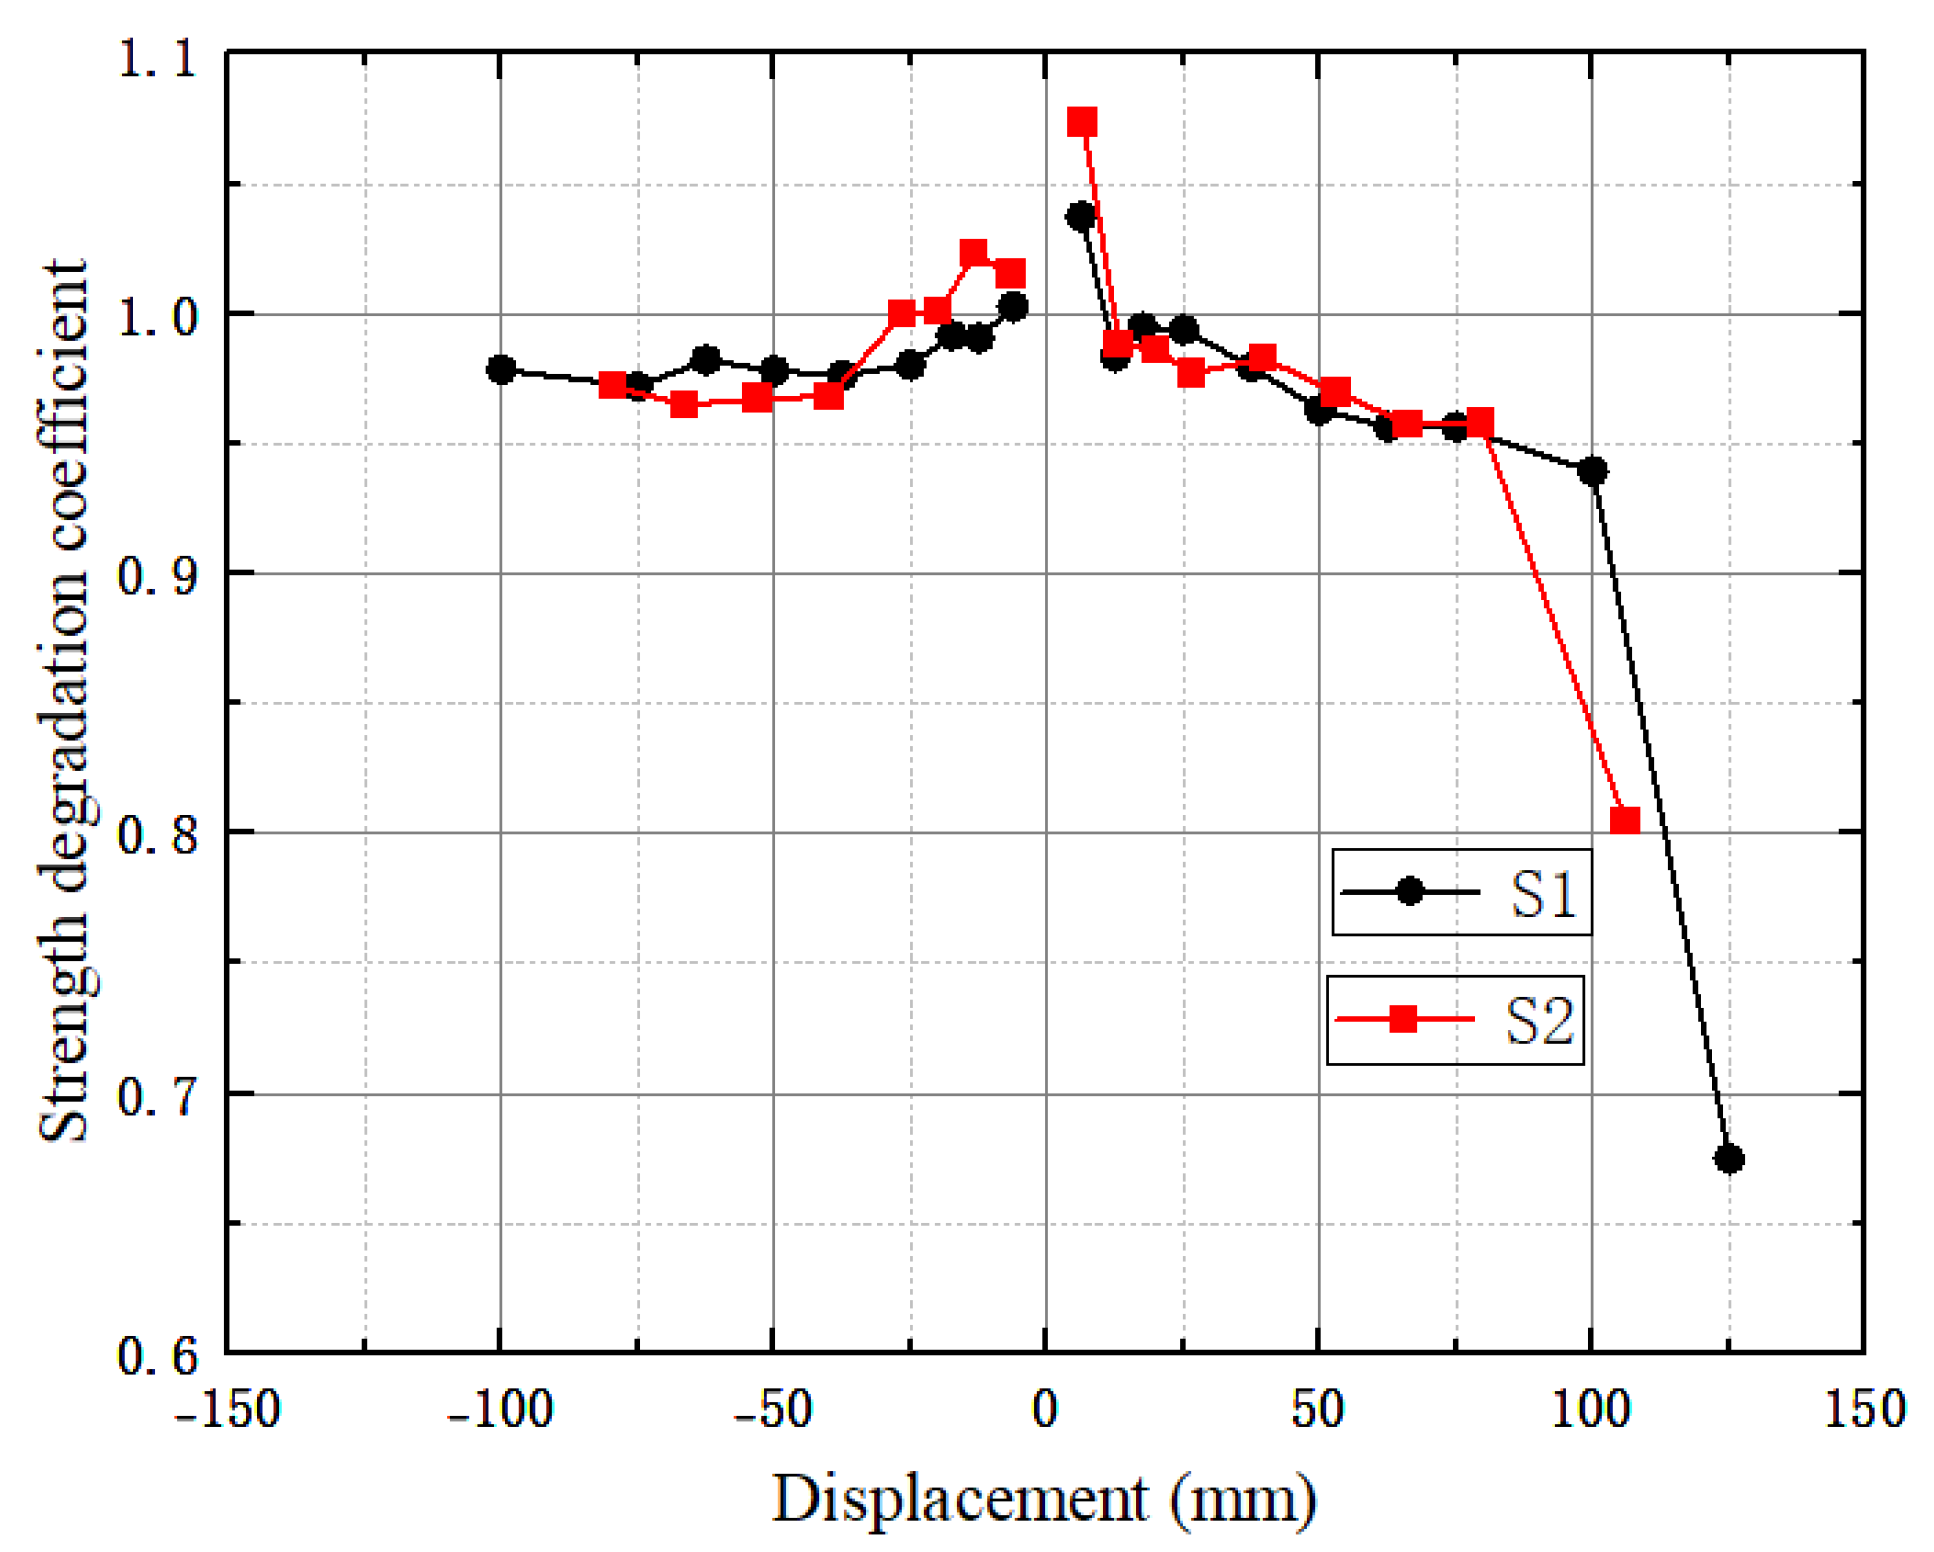
Strength degradation is typically used to indicate the decrease in the bearing capacity of specimens caused by cumulative damage under low-cyclic reversed loading. Figure 15 presents the strength degradation process of the two specimen groups. The results show that both S1 and S2 exhibited obvious strength degradation after reaching the ultimate displacement on the compression side. The minimum strength degradation coefficient of S1 was 0.675, whereas that of S2 was 0.804, indicating that the strength degradation of S1 in this direction was more significant. On the negative loading side, however, neither of the two specimen groups showed obvious strength degradation, with their strength degradation coefficients both remaining above 0.95.
Figure 15.
Strength degradation curves.
In summary, the connection under the spatial compression–biaxial bending–shear condition possesses a higher initial stiffness, but its late-stage stiffness degradation is faster. Conversely, the specimen under the planar compression–bending–shear condition exhibits stronger energy dissipation and ductility capacities, but its strength attenuation in the local compression direction is more prominent. This demonstrates that different bending conditions influence the damage evolution modes and late-stage performance degradation characteristics of the connections.
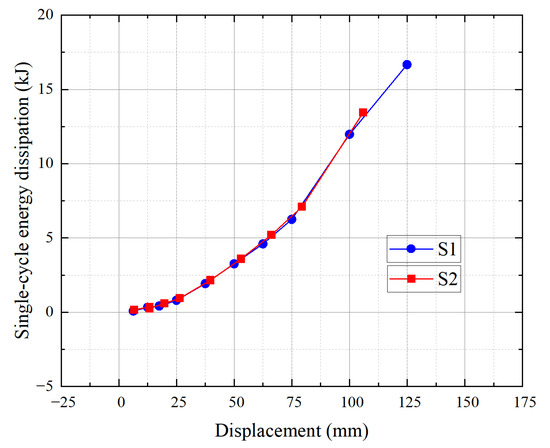
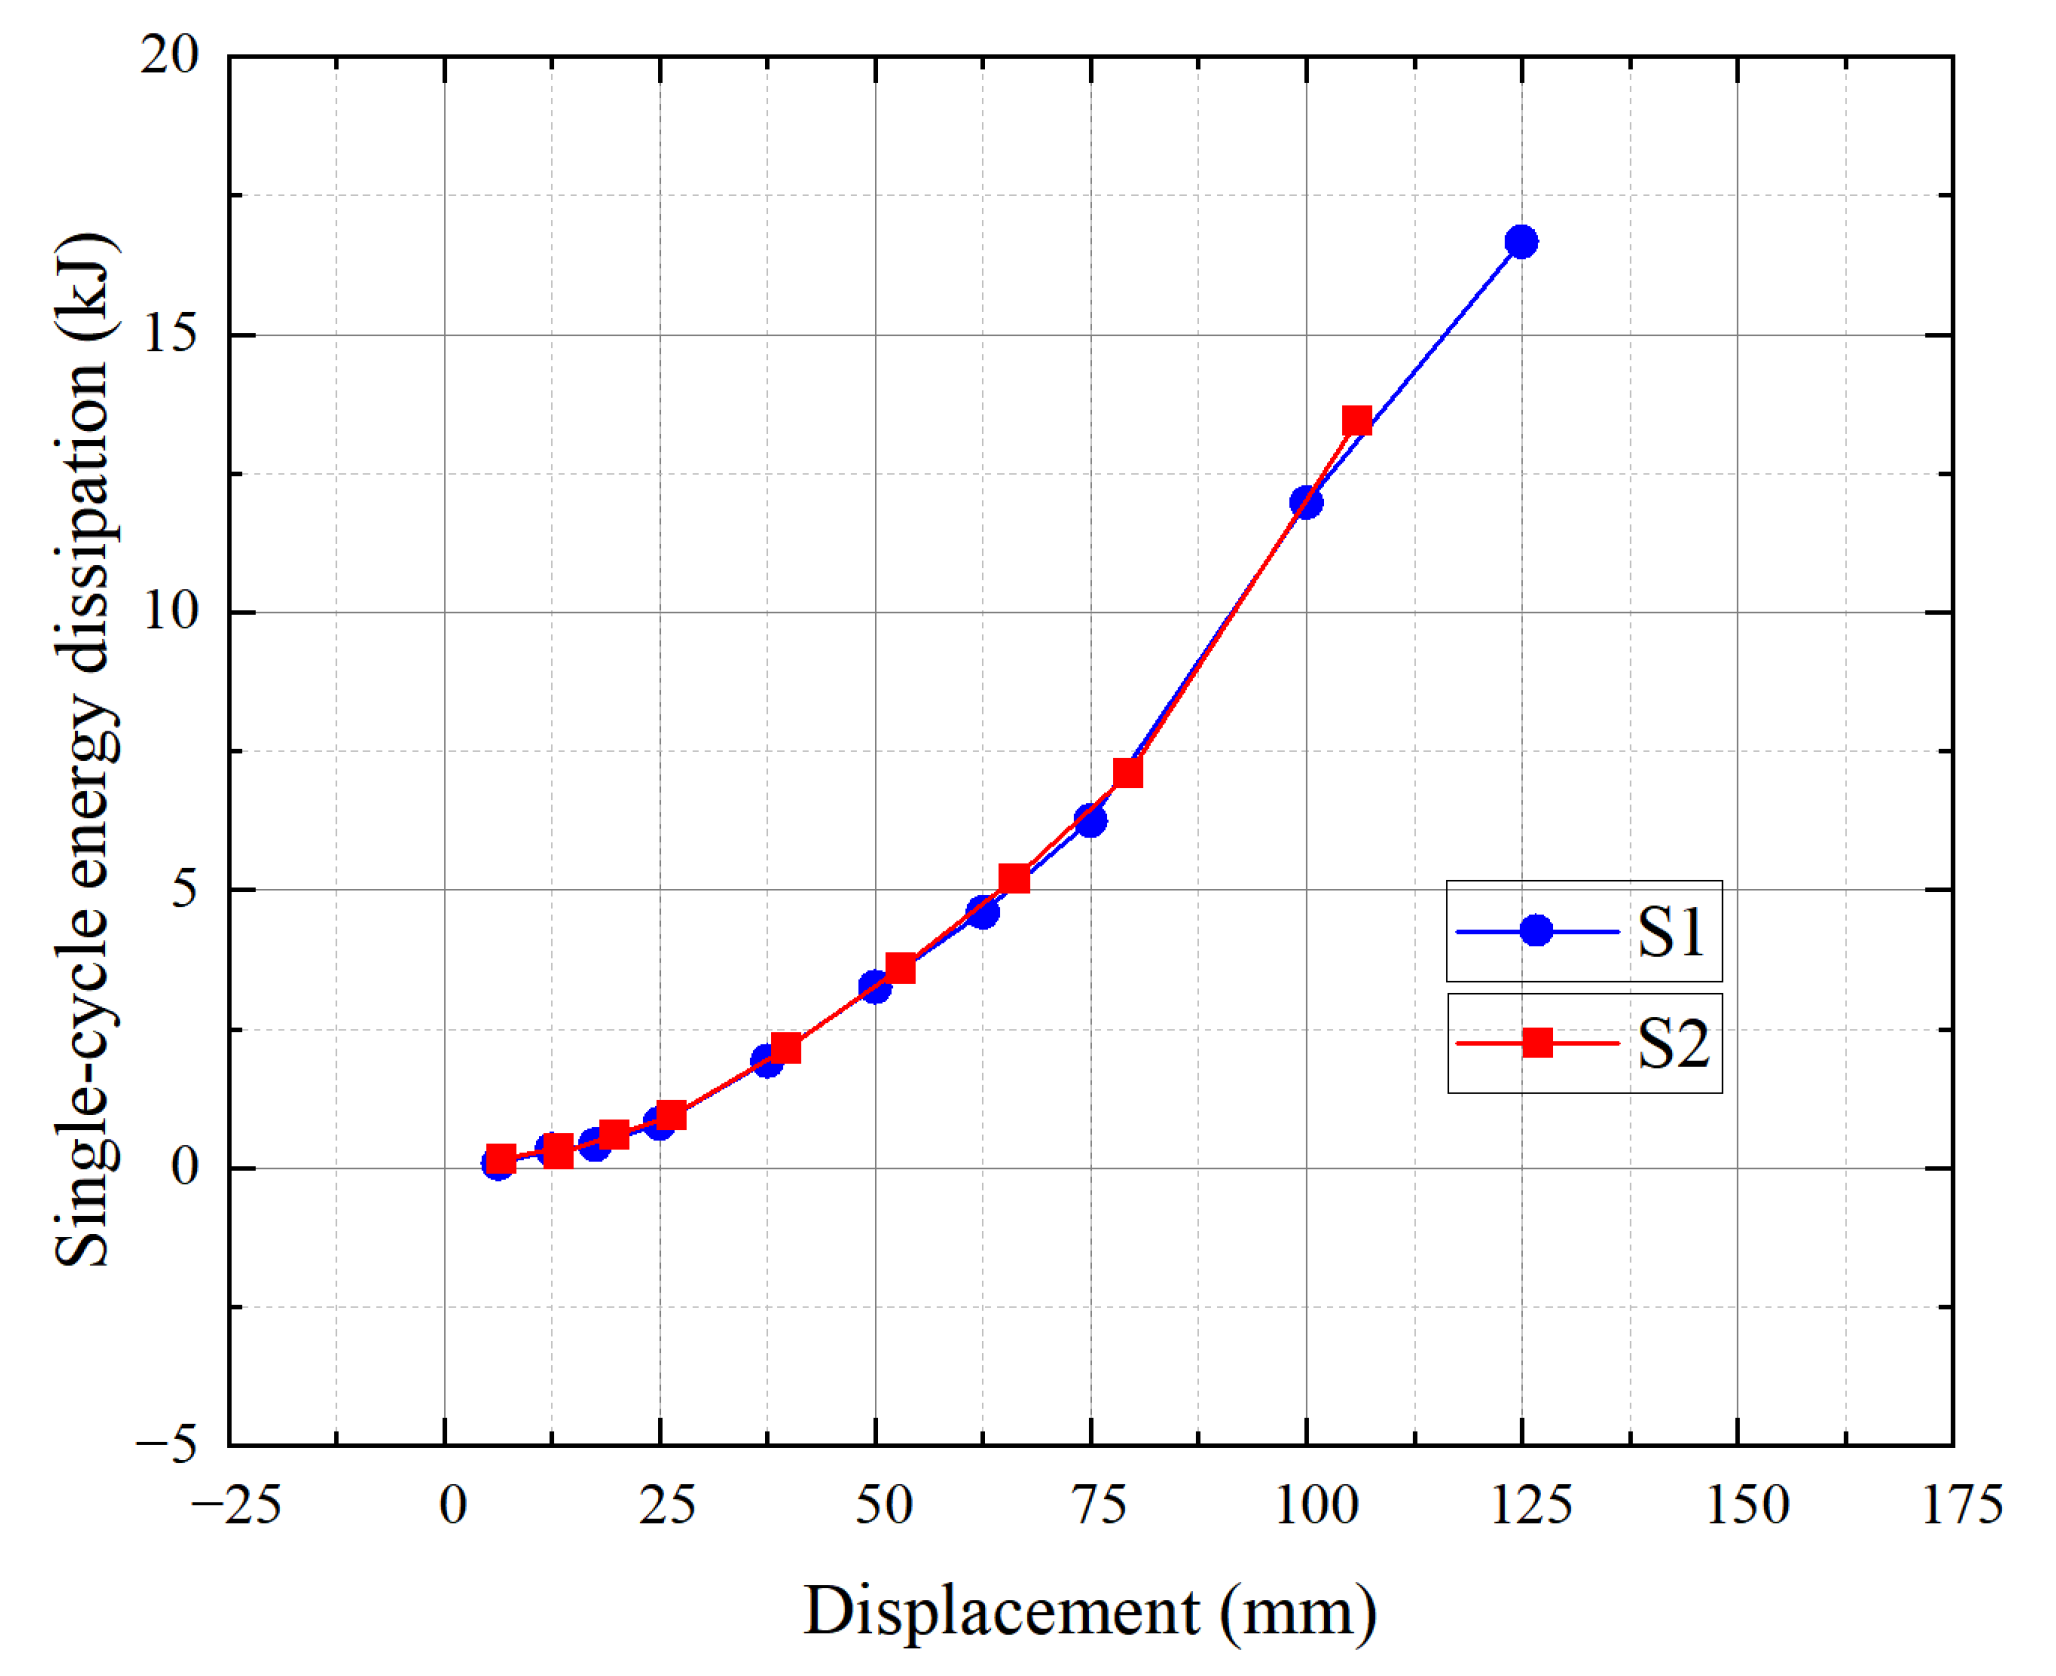
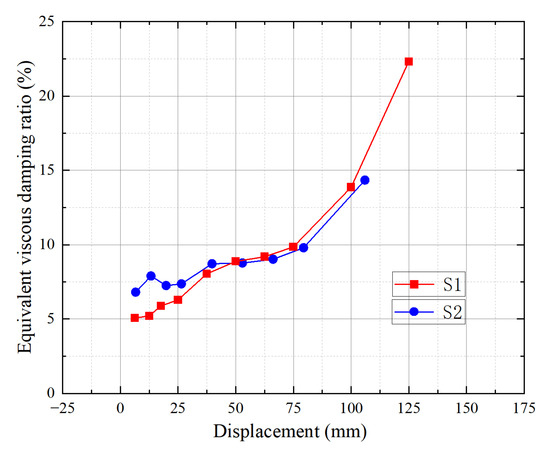
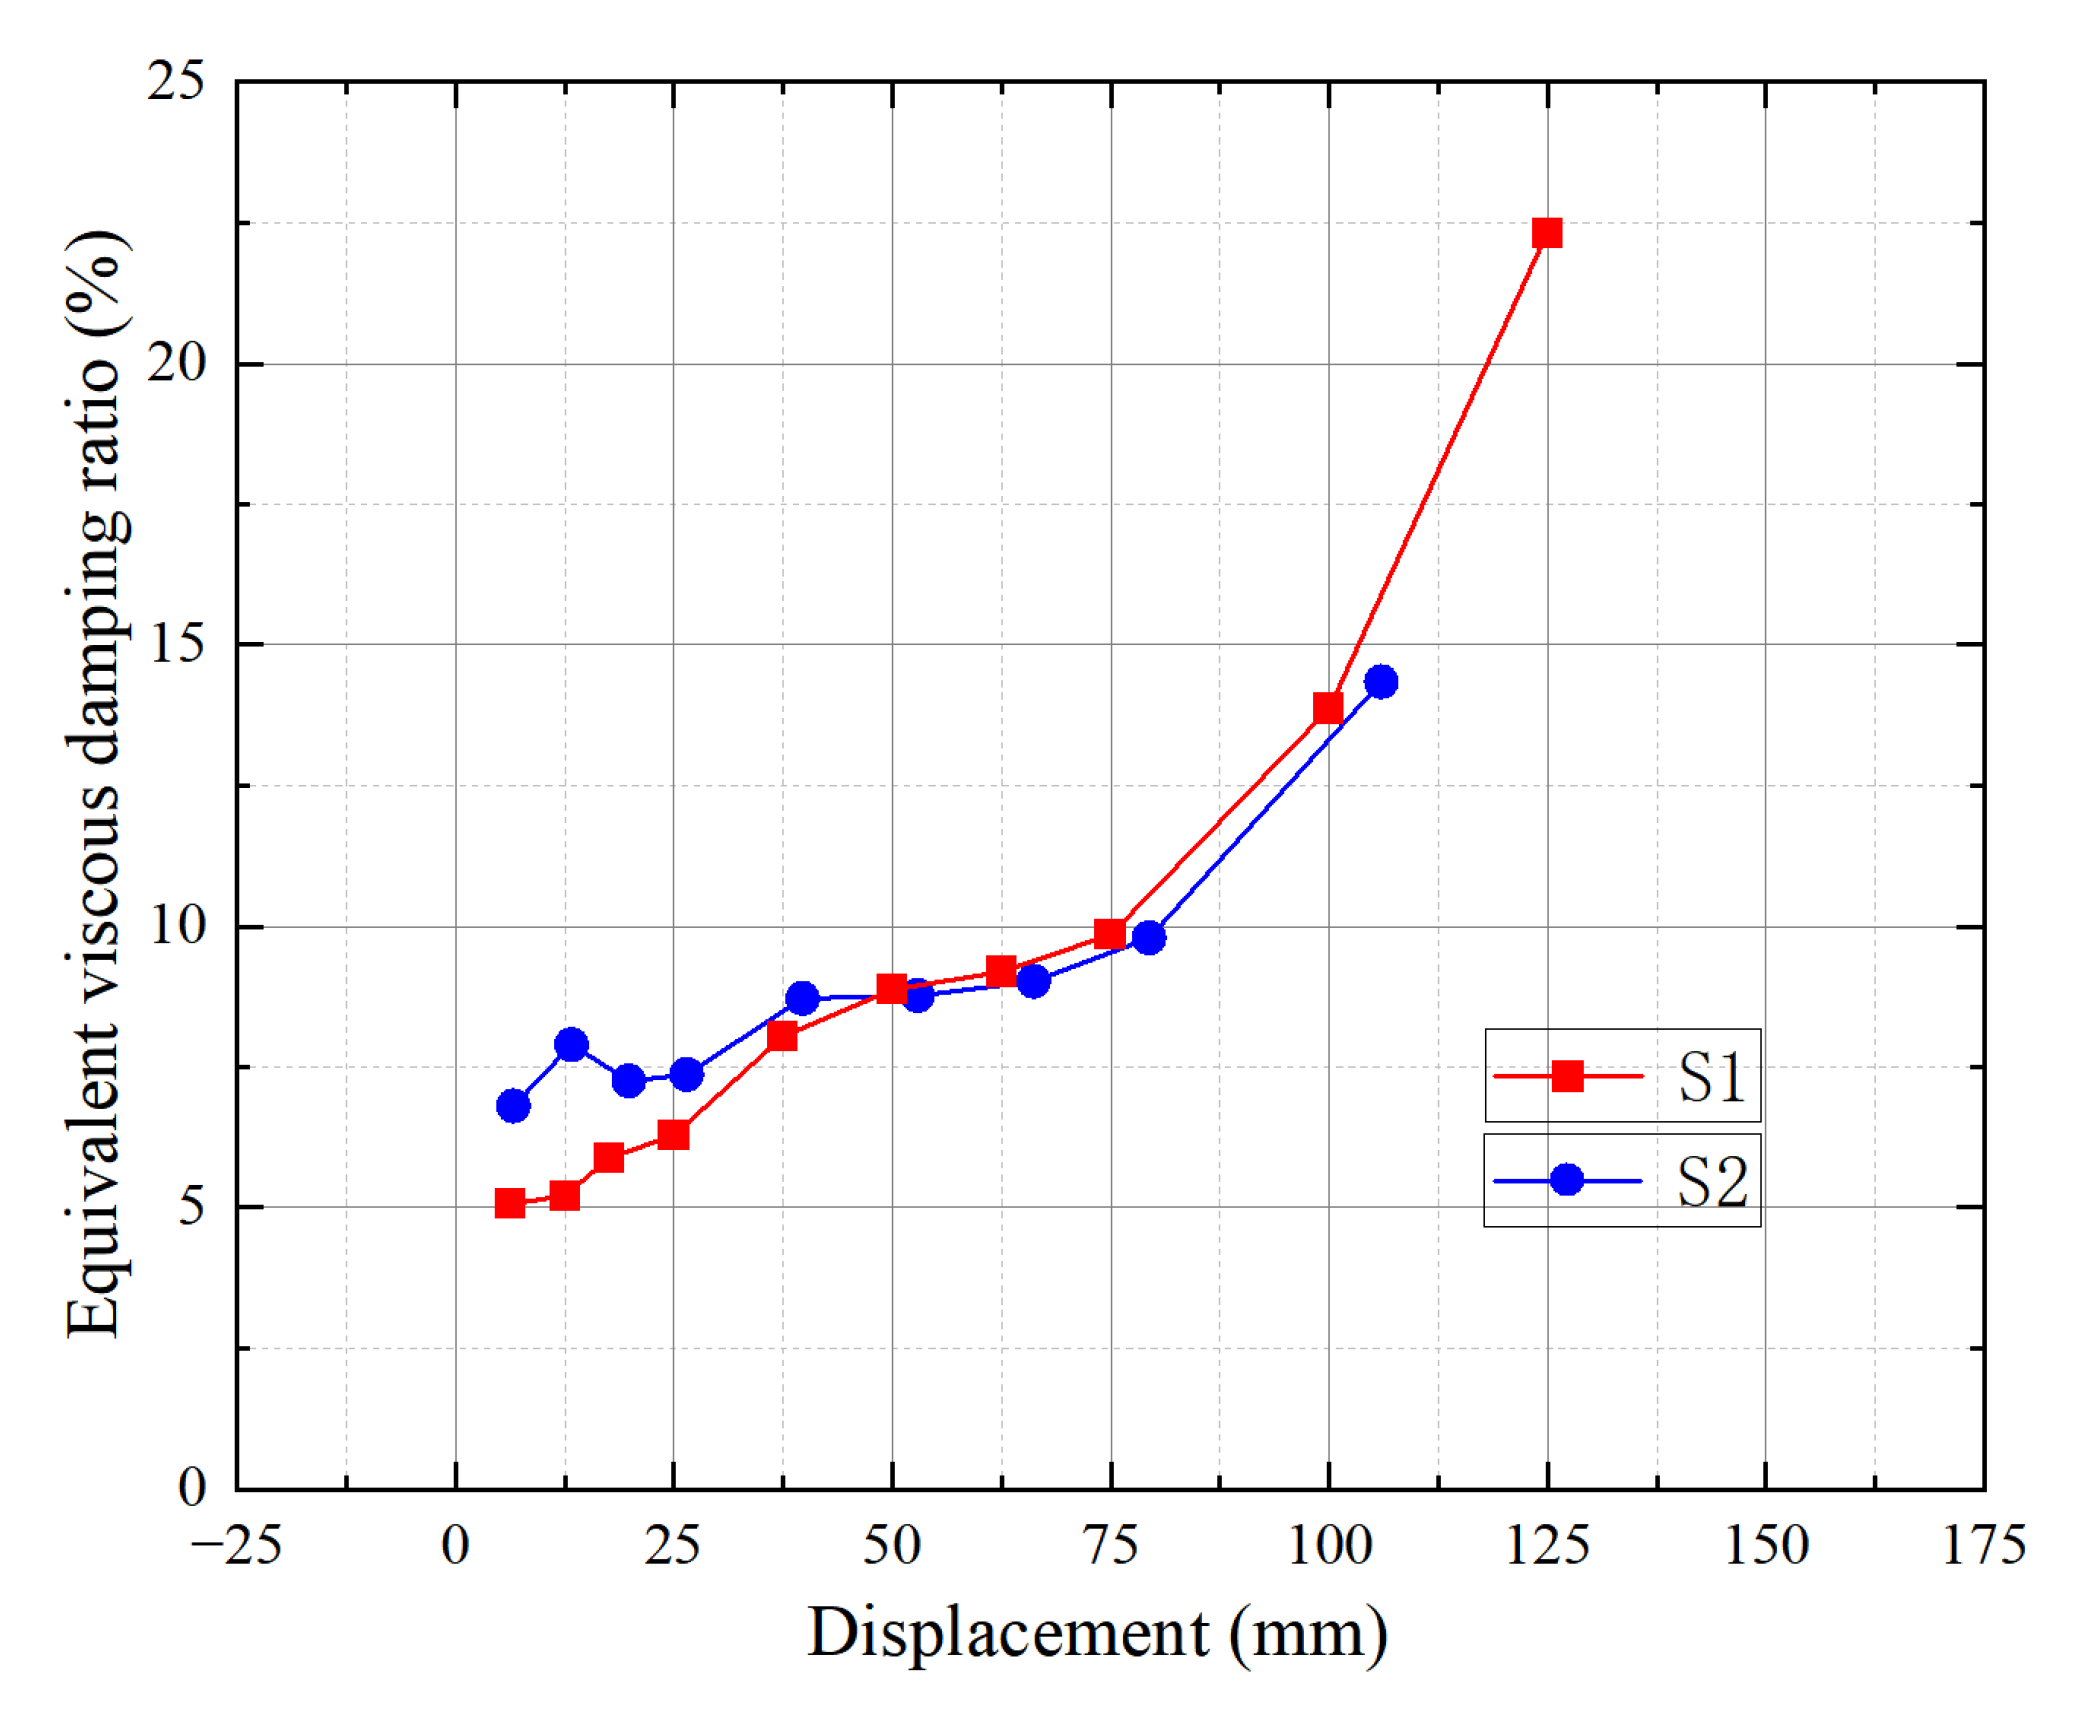
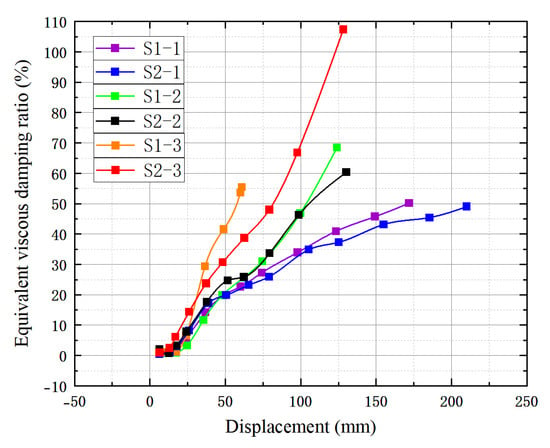
The variation trends of the single-cycle energy dissipation and the equivalent viscous damping coefficient for the two groups of specimens are illustrated in Figure 16 and Figure 17. Overall, both the single-cycle energy dissipation and the equivalent viscous damping coefficient of the two specimen groups gradually increased with the increase in displacement amplitude. The variation trends were consistent, indicating that the energy dissipation capacity of the connection continued to develop after entering the plastic stage. The single-cycle energy dissipation levels of the two groups of specimens were generally close, demonstrating that within the range of experimental parameters in this study, the variation in loading angle had a relatively limited impact on the total energy dissipation capacity of the connection. In the initial loading stage, the equivalent viscous damping coefficient of S2 was slightly higher than that of S1. When the displacement developed to approximately 50 mm, the two values tended to converge. In the late loading stage, however, the equivalent viscous damping coefficient of S2 became lower than that of S1, and its descending trend was more pronounced. This indicates that the energy dissipation capacity of the connection under the spatial compression–biaxial bending–shear condition attenuated more rapidly, resulting in relatively weaker late-stage energy dissipation stability. This phenomenon is consistent with the comparative results of the aforementioned hysteretic curves. The spatial compression–biaxial bending–shear condition did not significantly reduce the ultimate flexural bearing capacity of the connection, but it accelerated the late-stage damage accumulation and performance degradation, thereby weakening the ductility development and energy dissipation capacity.
Figure 16.
Experimental single-cycle energy dissipation.
Figure 17.
Experimental equivalent viscous damping coefficient.
4. Finite Element Modeling and Analysis
4.1. Establishment and Validation of Refined FE Models
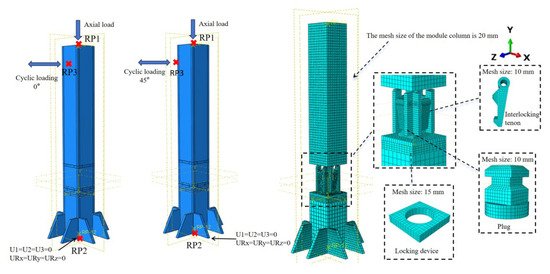
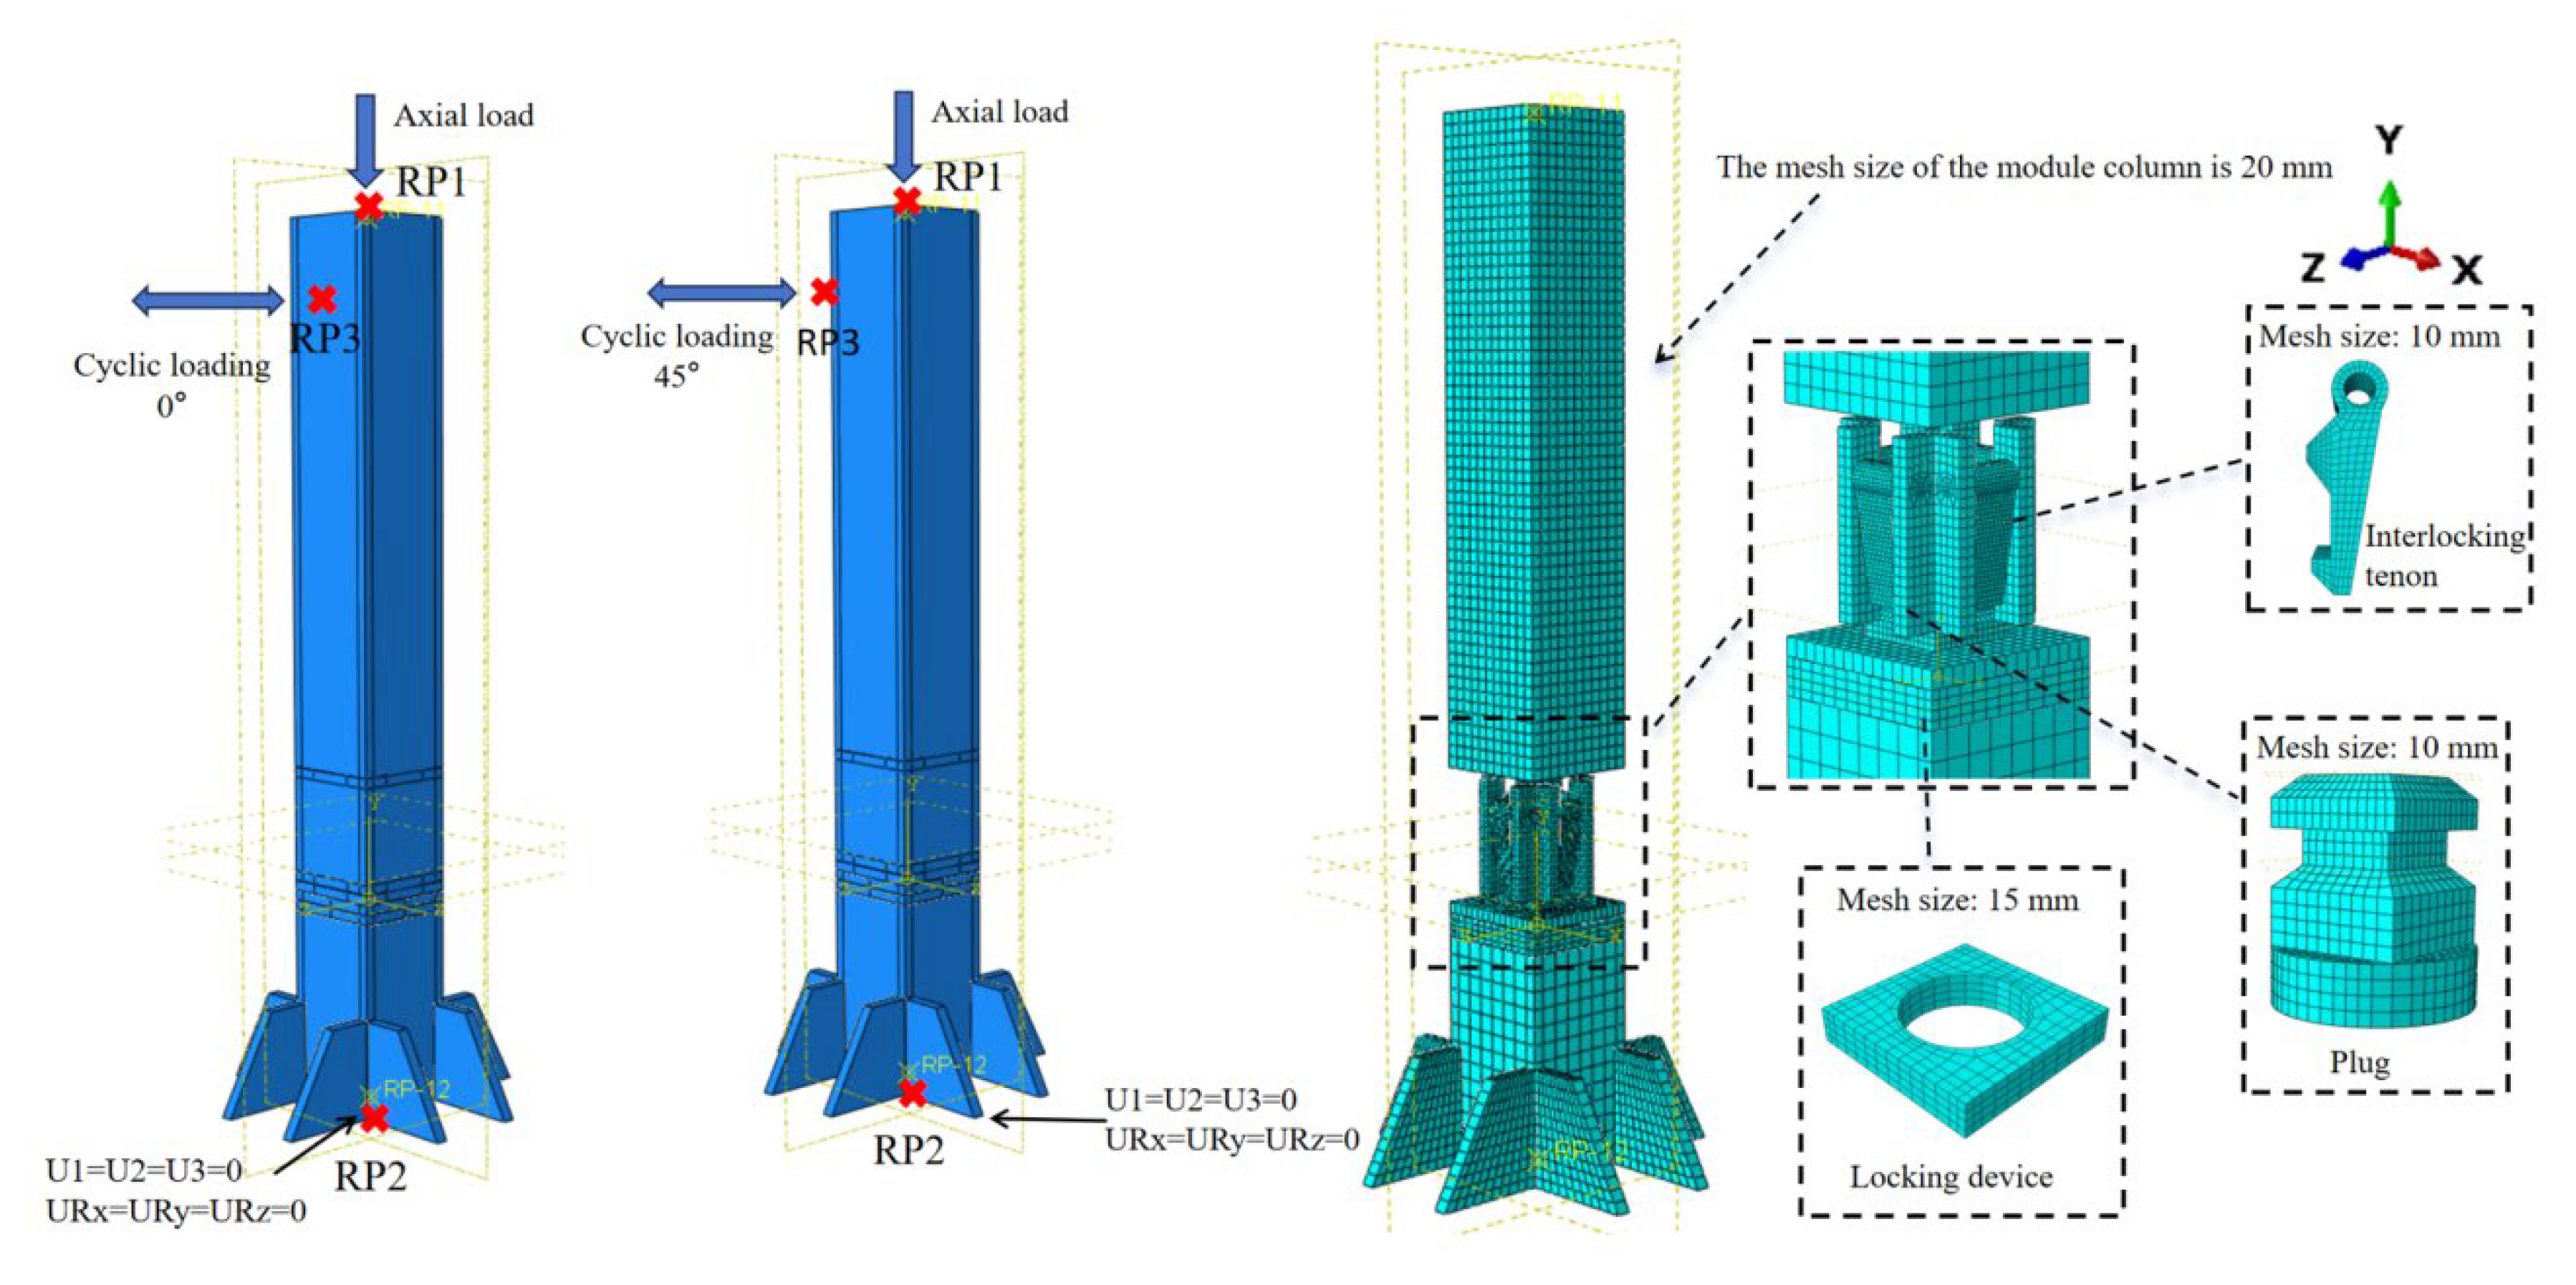
To comprehensively investigate the biaxial bending mechanical behavior of the bayonet-type self-locking and unlockable connection, a refined finite element (FE) model was established for detailed numerical analysis using the general-purpose structural analysis software ABAQUS/Standard (2023). The geometric dimensions of the model were kept strictly consistent with those of the experimental specimens. To accurately simulate the hardening behavior and the Bauschinger effect of the material under cyclic large strains, a trilinear kinematic hardening model combined with the Von Mises yield criterion was adopted. Specifically, this trilinear model was precisely defined using three critical coordinates extracted directly from the true stress–strain curves of the material coupon tests (as presented in Figure 3): the initial yield point, the onset of strain hardening, and the ultimate tensile strength point. It is essential to note that the engineering stress–strain data obtained from the material tensile tests were converted into true stress and logarithmic plastic strain before being inputted into the model to properly account for the large deformation characteristics. Furthermore, to capture the geometric nonlinearity induced by large spatial displacements during the ultimate loading stage, the non-linear geometry (NLGEOM) option was activated in the analysis steps. All components of the model were meshed using three-dimensional eight-node solid reduced integration elements (C3D8R), with a basic global mesh size of 20 mm. To balance computational efficiency and the capture accuracy of local stresses, a rigorous mesh independence verification was conducted. The results indicated that when the mesh size of the tenon core load-transfer region and the contact surfaces of the corner fittings was refined to 10 mm, the stress gradient distribution tended to be stable.
Regarding the settings of contact and boundary conditions, the weld connection areas were simulated using Tie constraints to ensure the continuity of load transfer. The contact interfaces between the remaining components were all modeled using the Surface-to-surface contact algorithm. The normal behavior of the contact surfaces was defined as ‘Hard’ contact, which effectively prevents mesh penetration in the compression zones while allowing for potential surface separation (opening) in the tension zones. For the tangential behavior, a ‘Penalty’ friction formulation with a constant friction coefficient of 0.3 was implemented. This formulation accounts for the relative slip between components (such as the tenon and the socket) by allowing macroscopic sliding whenever the interfacial shear stress exceeds the frictional resistance, thereby capturing the complex slip–stick transition observed in the tests. The boundary conditions and loading protocol of the finite element model were kept highly consistent with the experimental conditions. A reference point, RP-1, was coupled at the top of the upper module column to apply a constant vertical axial load, and another reference point, RP-3, was set at the predetermined horizontal loading height to apply displacement loading. The calculation process was divided into two analysis steps: first, the initial vertical axial load was applied and stabilized under force control; subsequently, it was switched to displacement control to apply the horizontal reversed cyclic load (details of the model mesh, boundaries, and loading conditions are shown in Figure 18).
Figure 18.
Mesh, boundary conditions, and loading setup of the refined FEM.
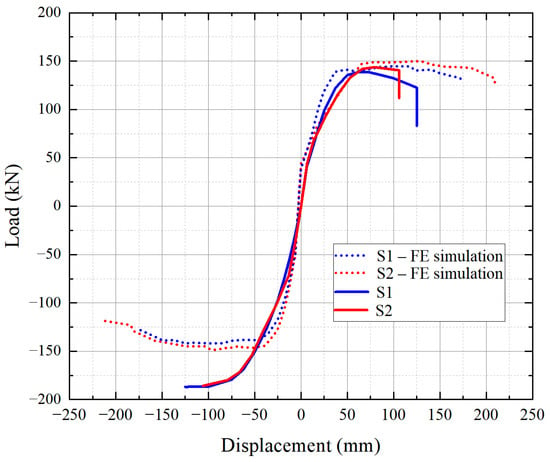
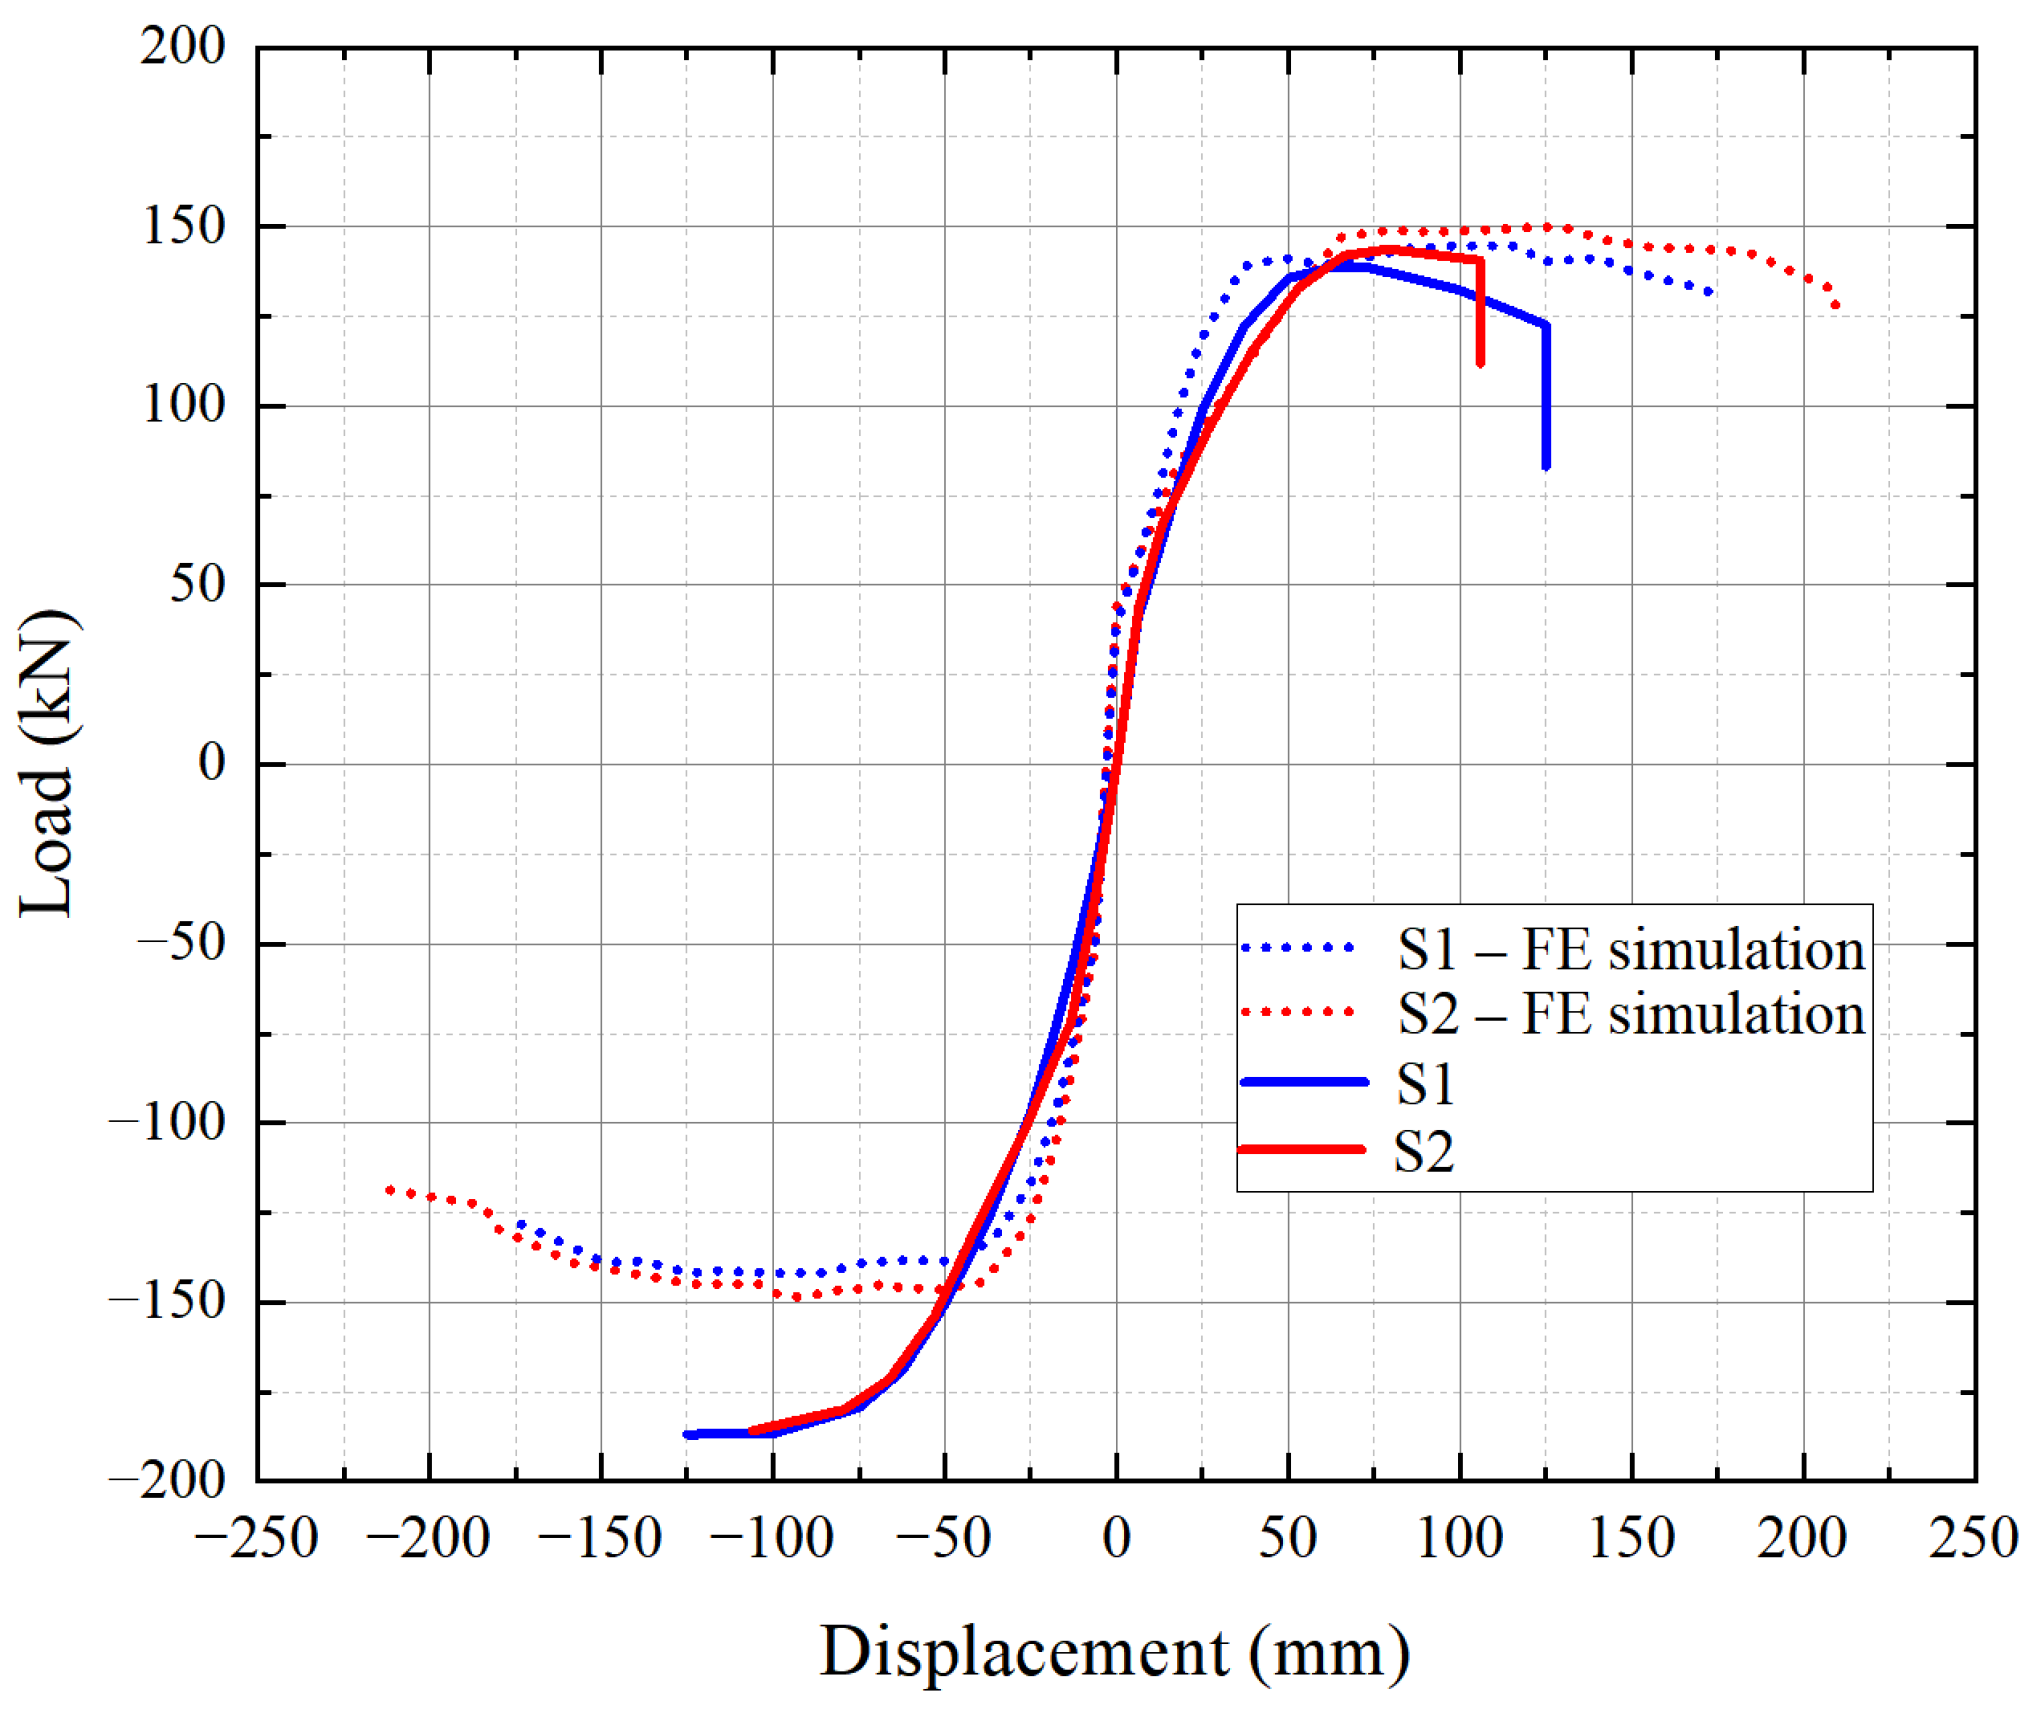
As shown in Figure 19 and Table 4, the finite element model exhibits high prediction accuracy for the positive loading stage, with the errors of the positive ultimate bearing capacity for both S1 and S2 being within 5%. To ensure the scientific rigor of the numerical results, this study adopted a multi-dimensional validation strategy that extends beyond a single experimental configuration. Beyond the global load–displacement agreement, the 3D structural response was further validated by comparing the multi-point displacements captured by LVDTs and the localized strain development laws. Similar to advanced 3D modelling strategies utilized for validating the deflections of temporary excavation support plates [27], our approach relies on high-fidelity solid elements to capture the geometric intricacies of the structural system. However, a key distinction lies in the validation focus: while plate-like structures prioritize the accuracy of 3D deflection fields, the validation of self-locking connections must prioritize the high-nonlinear contact–slip transitions and energy dissipation characteristics at the interlocking interfaces. The favorable agreement across multiple scales (load, displacement, and strain) confirms that the established FE model is a reliable tool for further parametric investigation. This indicates that after eliminating unpredictable initial defects, the finite element model can relatively accurately reflect the flexural mechanism and ultimate bearing capacity of the connection.
Figure 19.
Comparison between experimental and FEM results.
Table 4.
Comparison of capacity and stiffness between tests and FEM.
It is worth noting that the prediction error of the finite element model for the negative loading stage is relatively large. The simulated values of the negative ultimate bearing capacity for S1 and S2 are 24% and 20.1% lower than the experimental values, respectively. It should be emphasized that the current FE model was intentionally constructed using idealized geometry without incorporating random manufacturing imperfections. This approach aims to establish a deterministic “theoretical design baseline” that strictly corresponds to the analytical formulas derived in Section 5. While incorporating stochastic geometric tolerances and friction variations would better simulate individual physical specimens, it falls outside the scope of establishing a generalized engineering design lower bound. Consequently, while the adopted trilinear model is relatively basic and may introduce minor localized deviations under complex cyclic loading compared to advanced models (such as the Chaboche model), this significant unidirectional deviation is primarily caused by the non-ideal boundaries and macroscopic initial defect effects that are unavoidable in physical tests:
- (1)
- Initial manufacturing tolerances and asymmetrical assembly gaps: The finite element model is established based on the assumptions of perfect geometric alignment and absolute symmetrical contact. However, in the actual physical specimens, limited by machining accuracy, assembly gaps are inevitably reserved between the tenon and the socket. After the compression side is pressed tightly during positive loading, the initial gap distribution on the other side becomes extremely uneven during reverse loading, leading to a difference between the experimentally measured reverse initial stiffness and that of the model.
- (2)
- Irreversible slip and contact reconstruction under cyclic loading: After experiencing the positive large-displacement plastic stage, local residual deformation has occurred at the root of the tenon in the physical specimens. When subjected to negative loading, the self-locking component cannot perfectly return to its initial neutral position like an ideal elastic body in the finite element model. This physical failure to fully reset, along with asymmetrical slip, causes the actual contact stress area and force-transfer lever arm during reverse loading to be reconstructed, triggering an enhancement of the local bearing capacity.
- (3)
- Possible systemic bias of the testing apparatus: Mechanical gaps during the push-pull transition of the actuator and the slight initial eccentricity of the reaction frame also amplify the measured negative values to a certain extent.
In summary, the idealized finite element model does not reflect the complex initial conditions during negative loading, which simultaneously indicates that the model is not interfered with by random manufacturing tolerances and asymmetrical residual slip. Therefore, this model is completely reliable in predicting the safe bearing capacity of the connection (i.e., the positive data) and can serve as a robust baseline model for subsequent parametric analysis.
Limitations of the numerical approach: It must be explicitly stated that the current finite element approach is subject to certain limitations. By adopting idealized geometric assumptions, the model neglects the stochastic influence of initial manufacturing imperfections, such as surface roughness, pin-hole clearances, and non-uniform assembly tolerances. These micro-factors are the dominant contributors to the observed 20–24% discrepancy during the negative loading phase, where the physical specimens benefit from complex contact reconstruction and residual frictional wedging. While the current model provides a highly accurate and conservative baseline for predicting the positive ultimate capacity—the primary safety index for structural design—it should be used with caution when evaluating localized second-order stiffness responses under highly irregular cyclic loading. Future studies involving stochastic modeling are required to further quantify these micro-geometric sensitivities.
4.2. Parametric Analysis
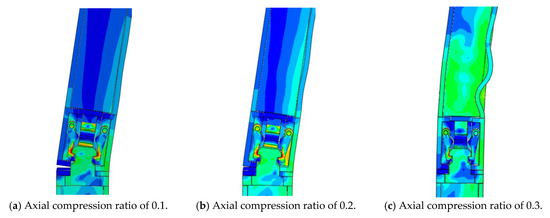
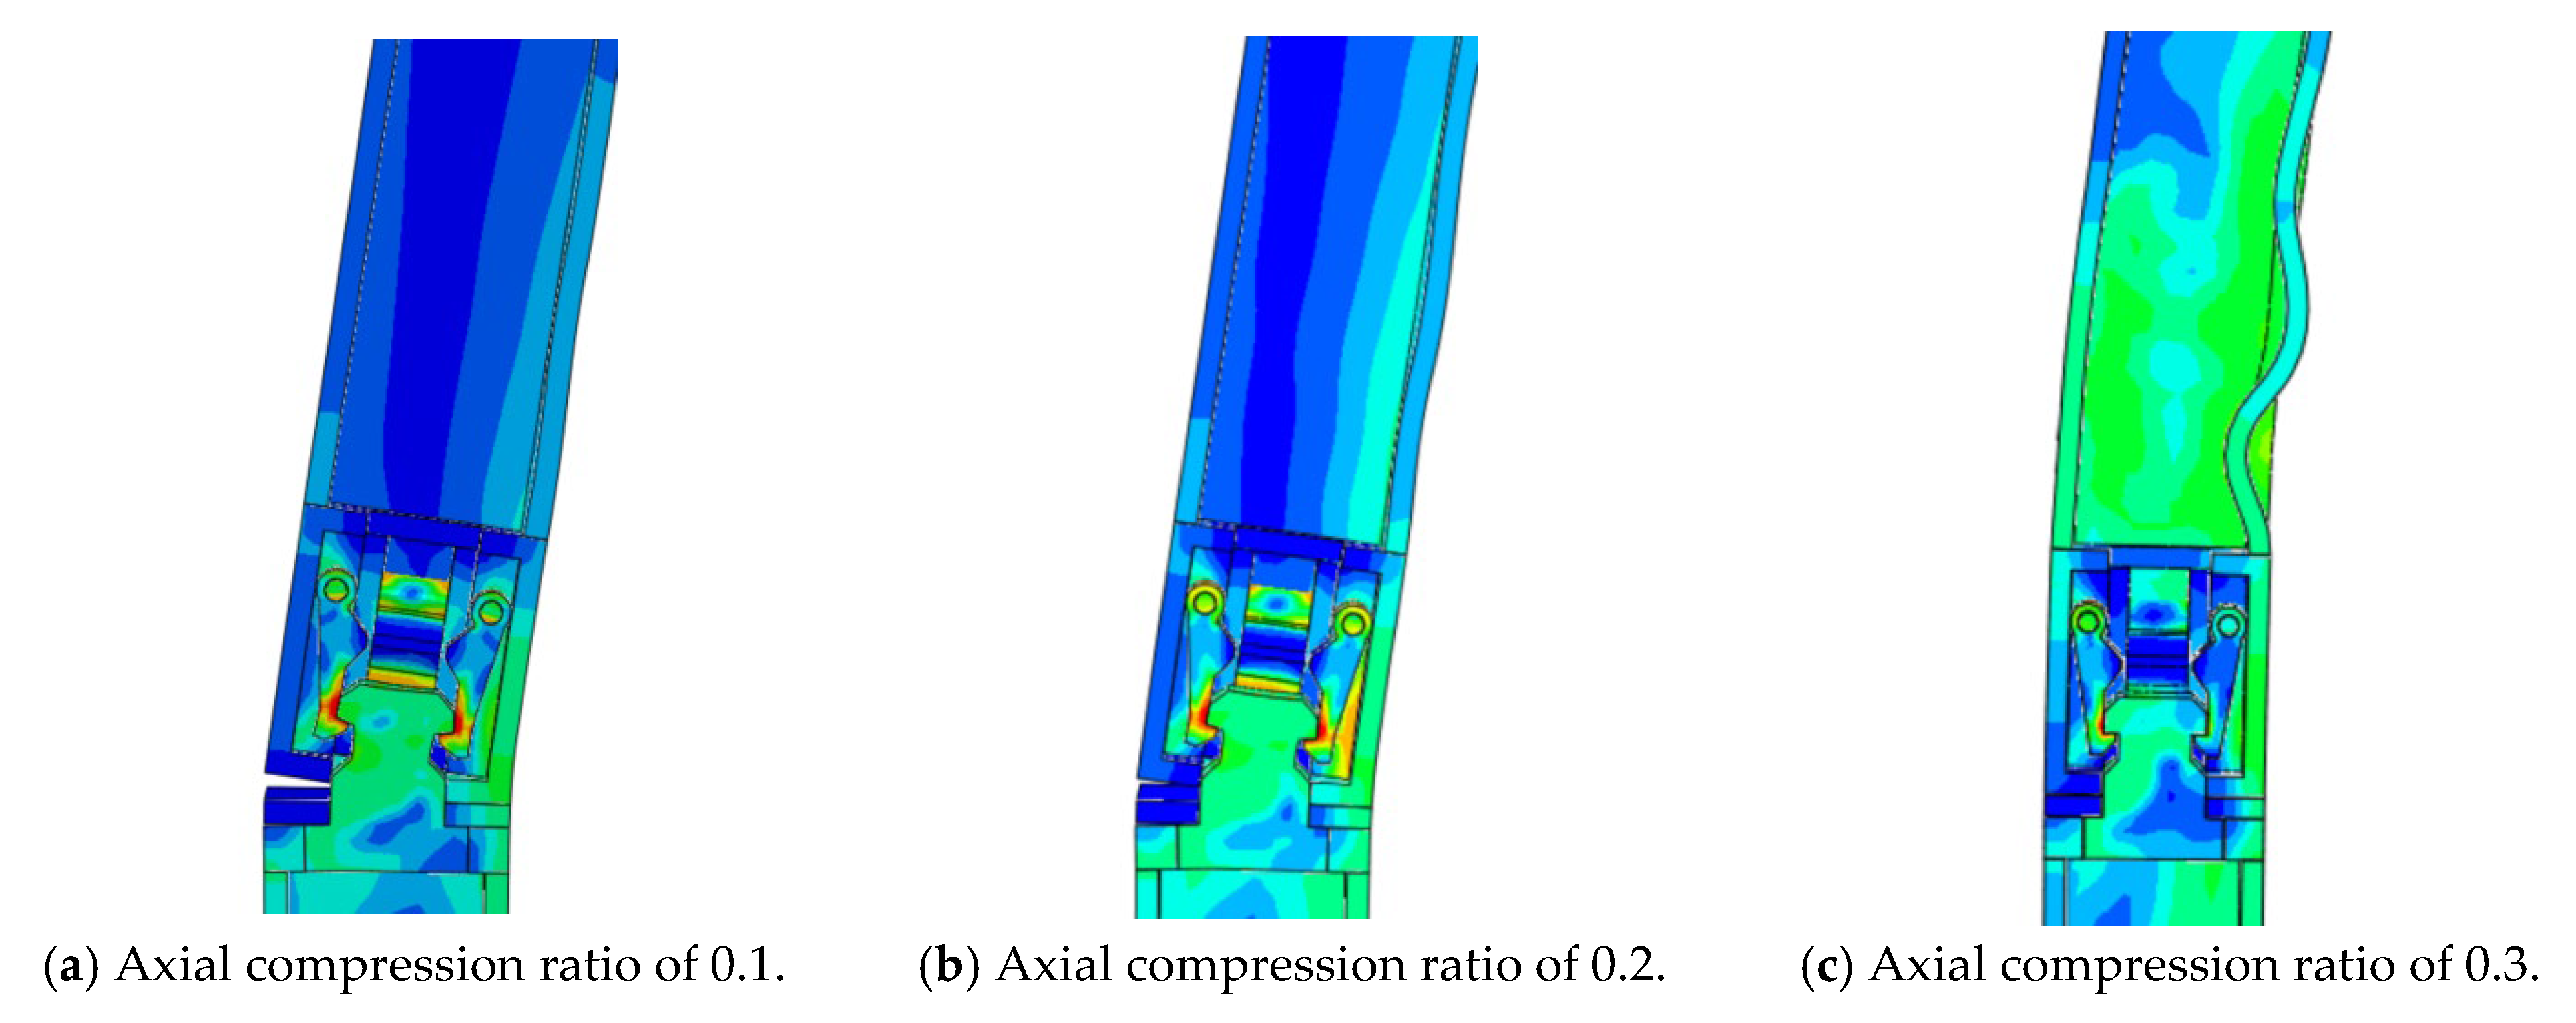
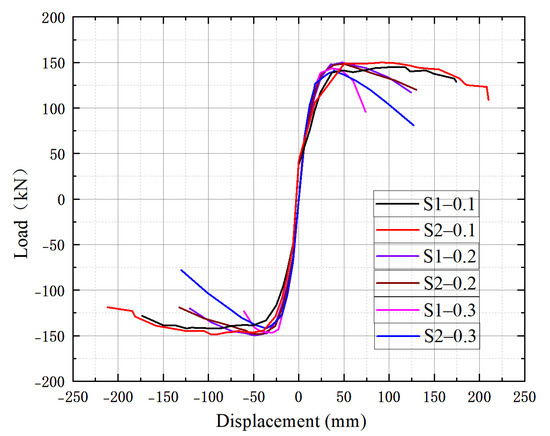
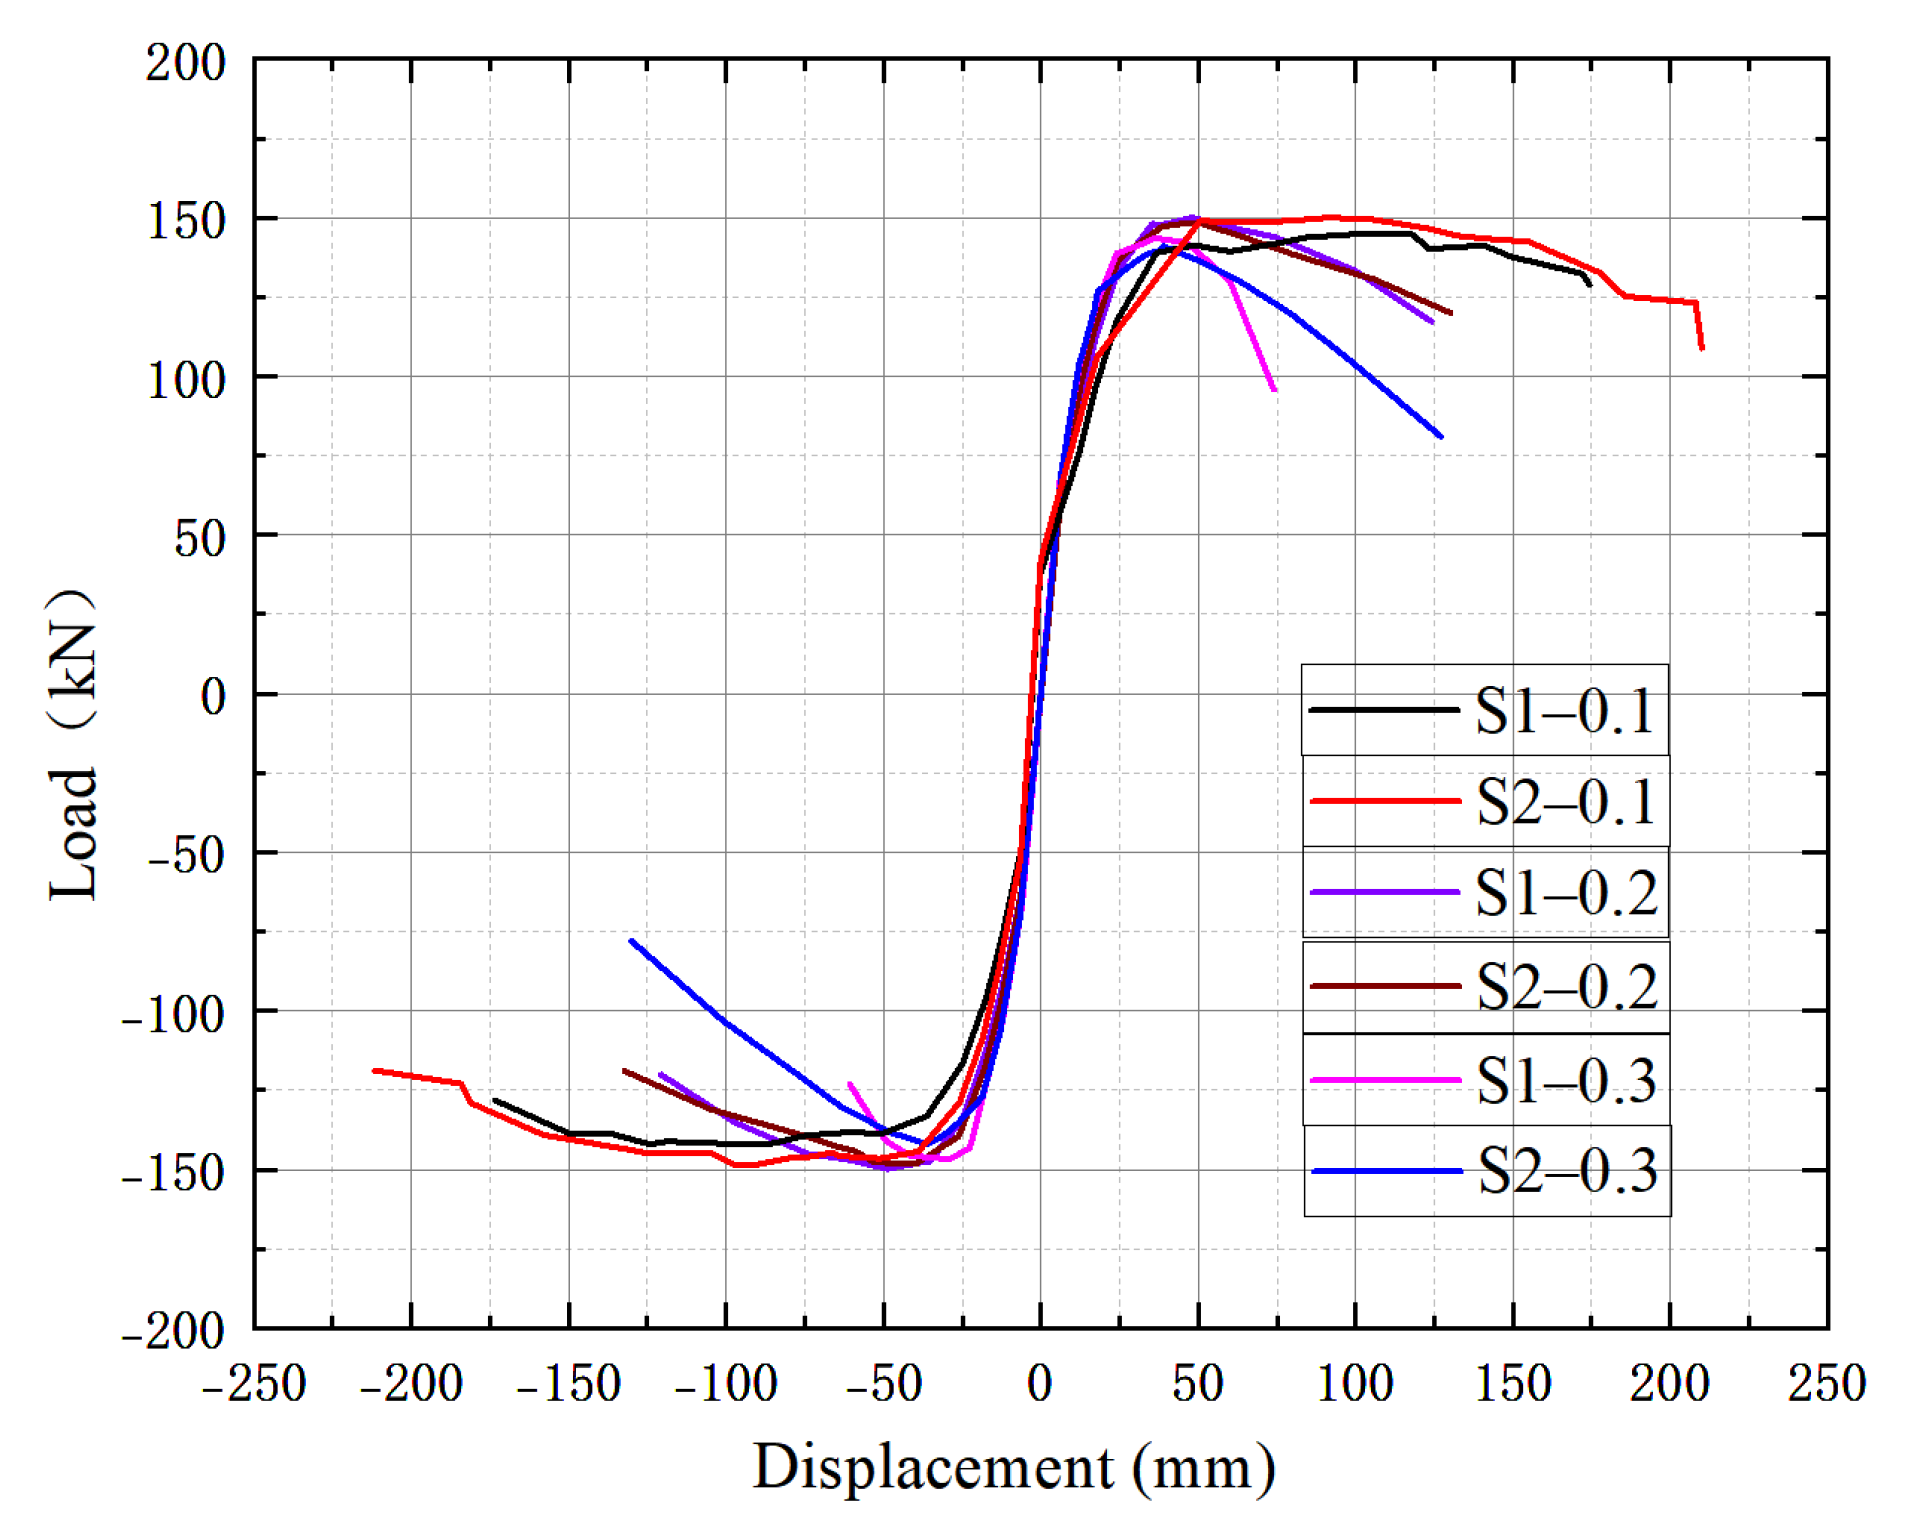
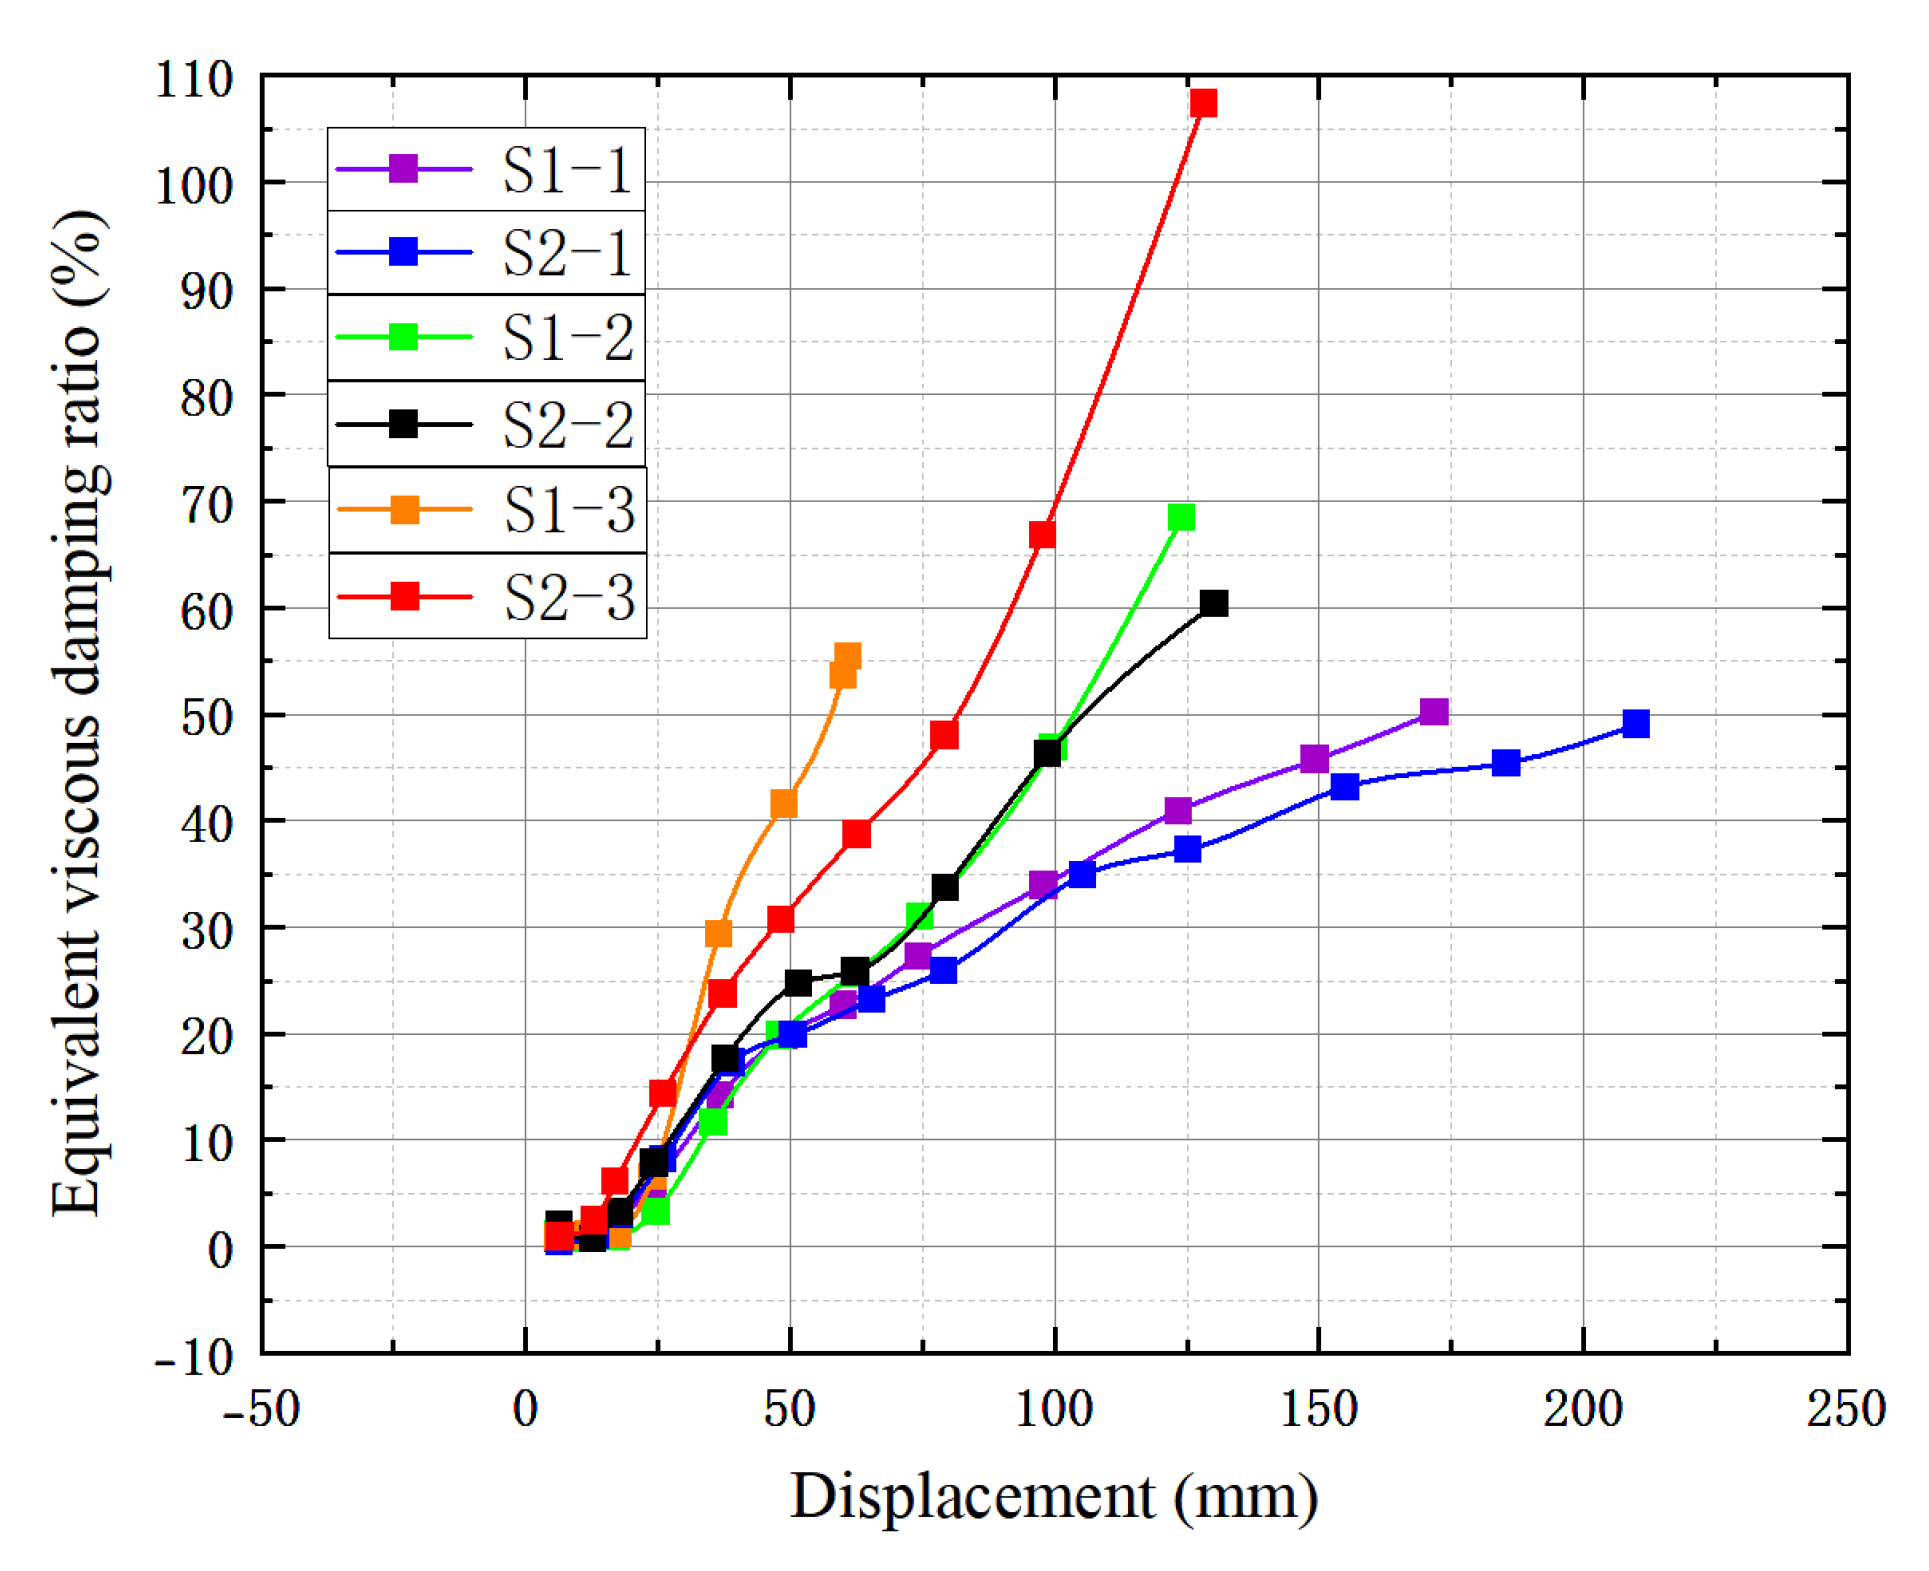
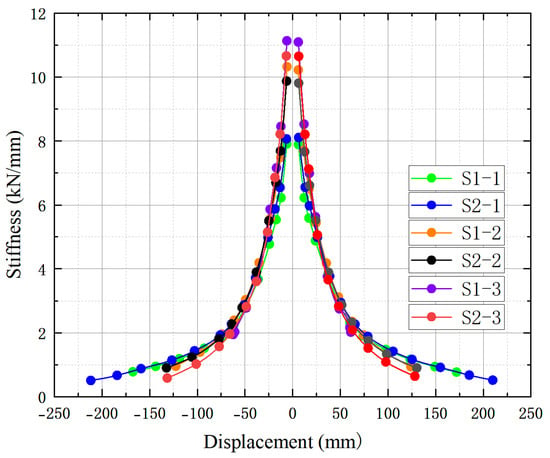
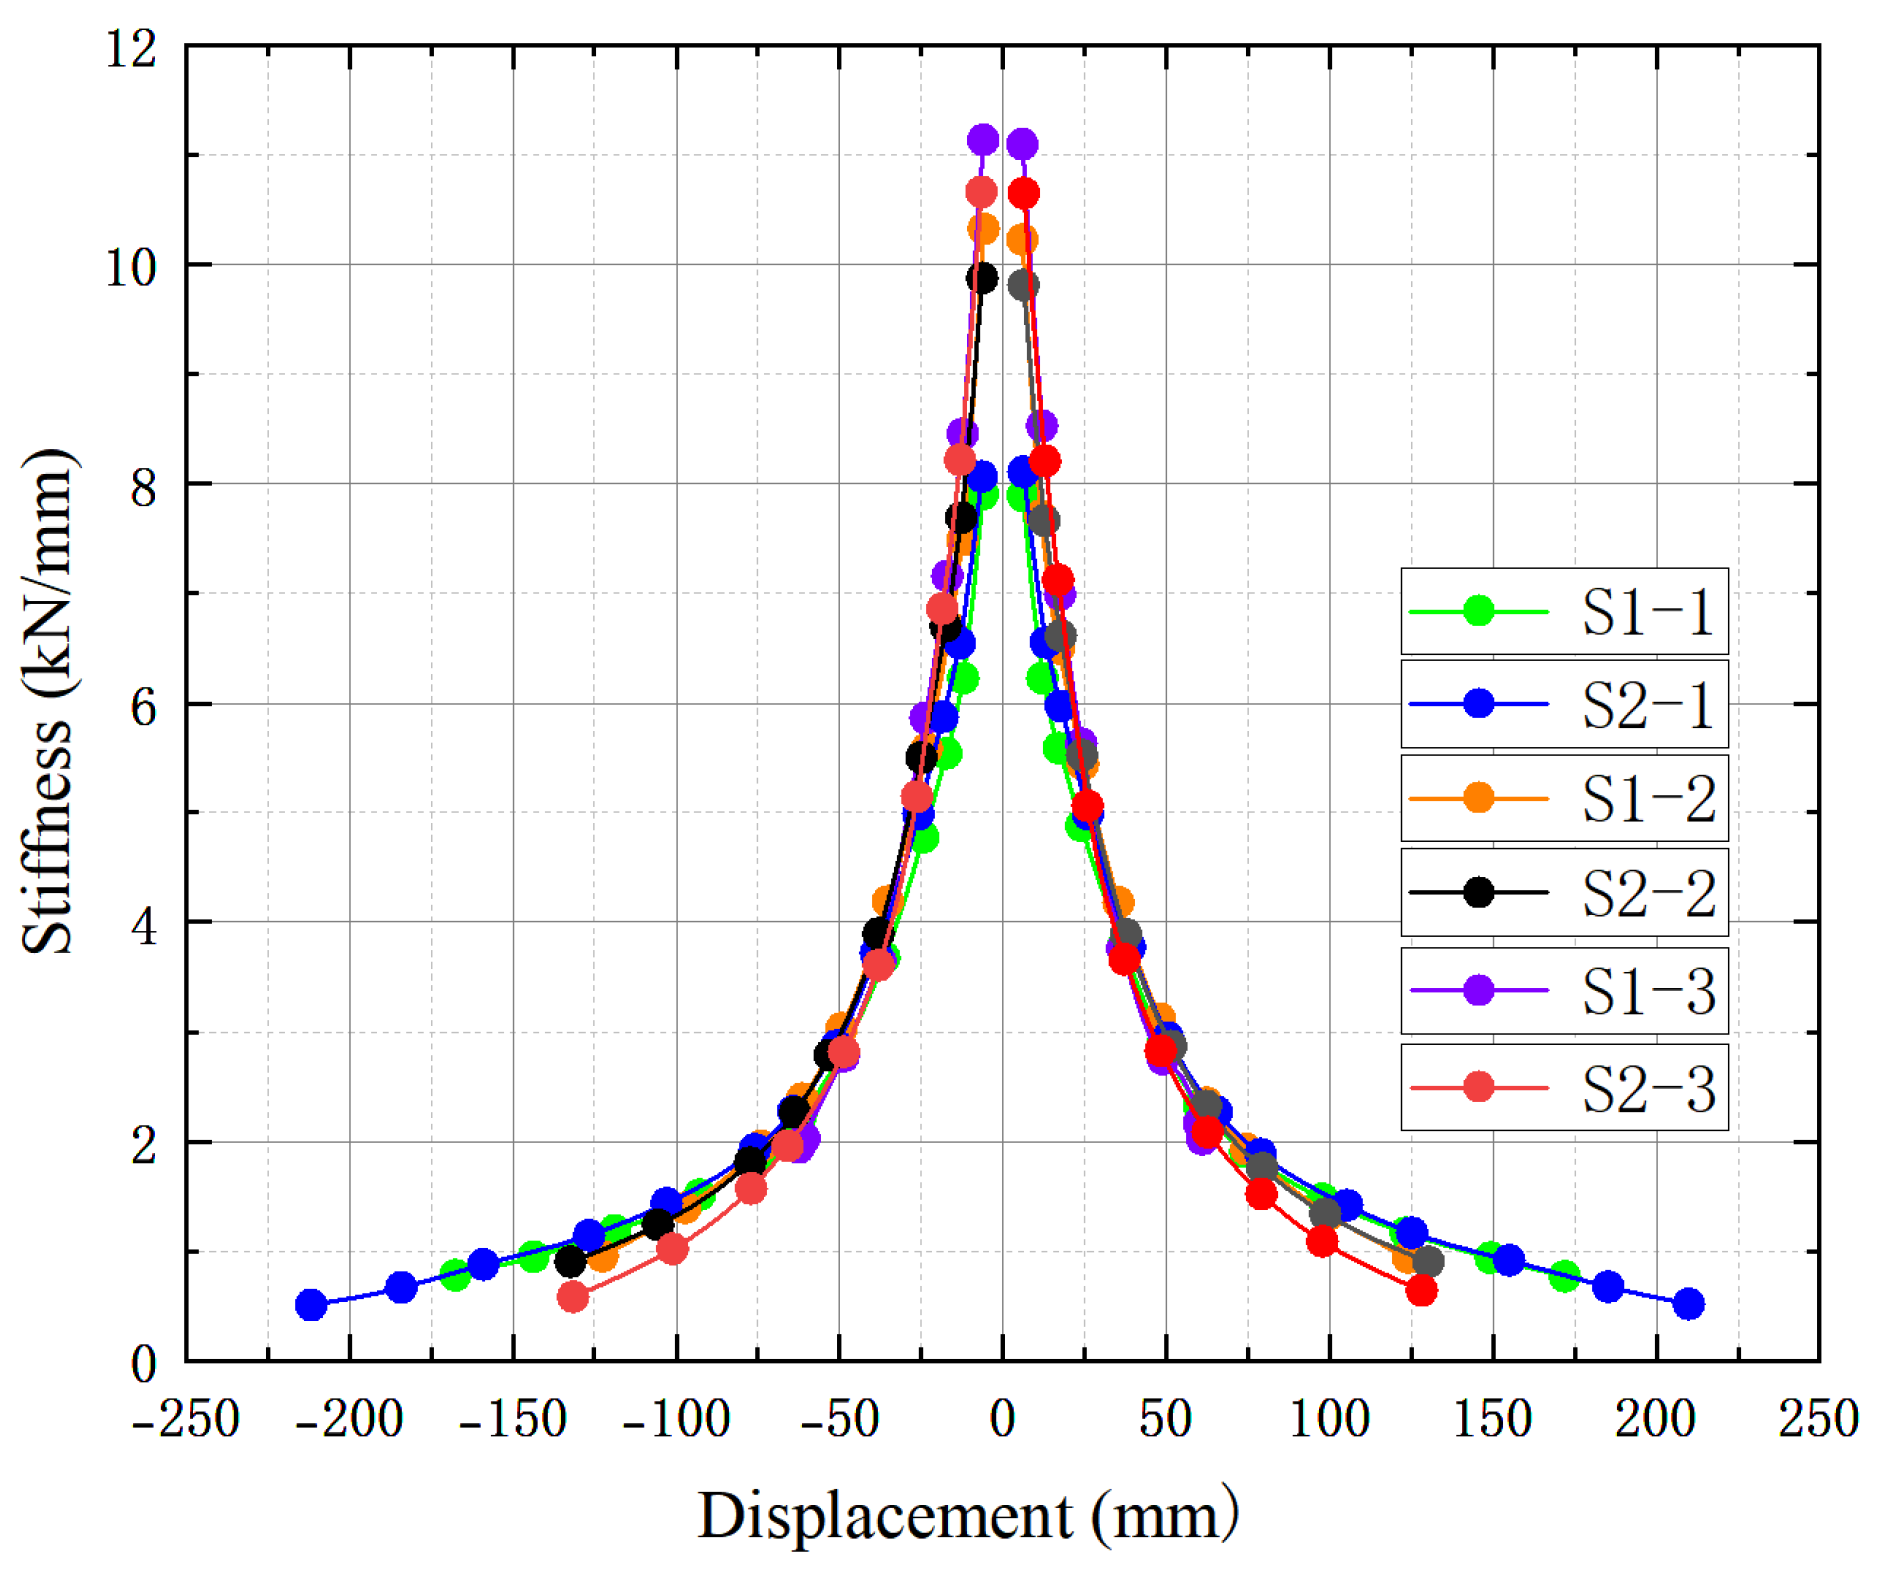
To further evaluate the influence of the axial compression ratio on the mechanical performance of the connection, a parametric analysis was conducted based on the experimentally validated finite element model. The axial compression ratios were set to 0.1, 0.2, and 0.3, with corresponding axial compressive loads of 550 kN, 1100 kN, and 1650 kN. The specimens were sequentially designated as S1-1, S1-2, and S1-3 and S2-1, S2-2, and S2-3. The stress contours under different axial compression ratios are shown in Figure 20.
Figure 20.
Stress contours under different axial compression ratios.
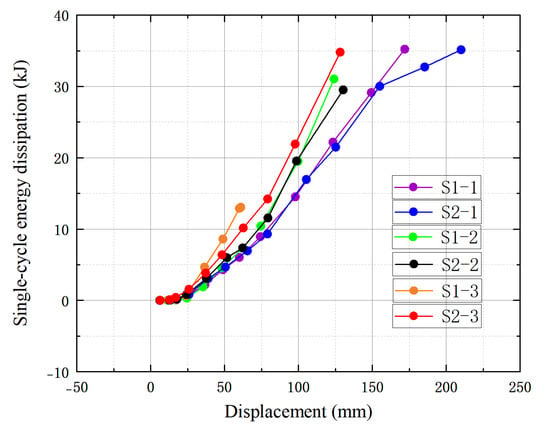
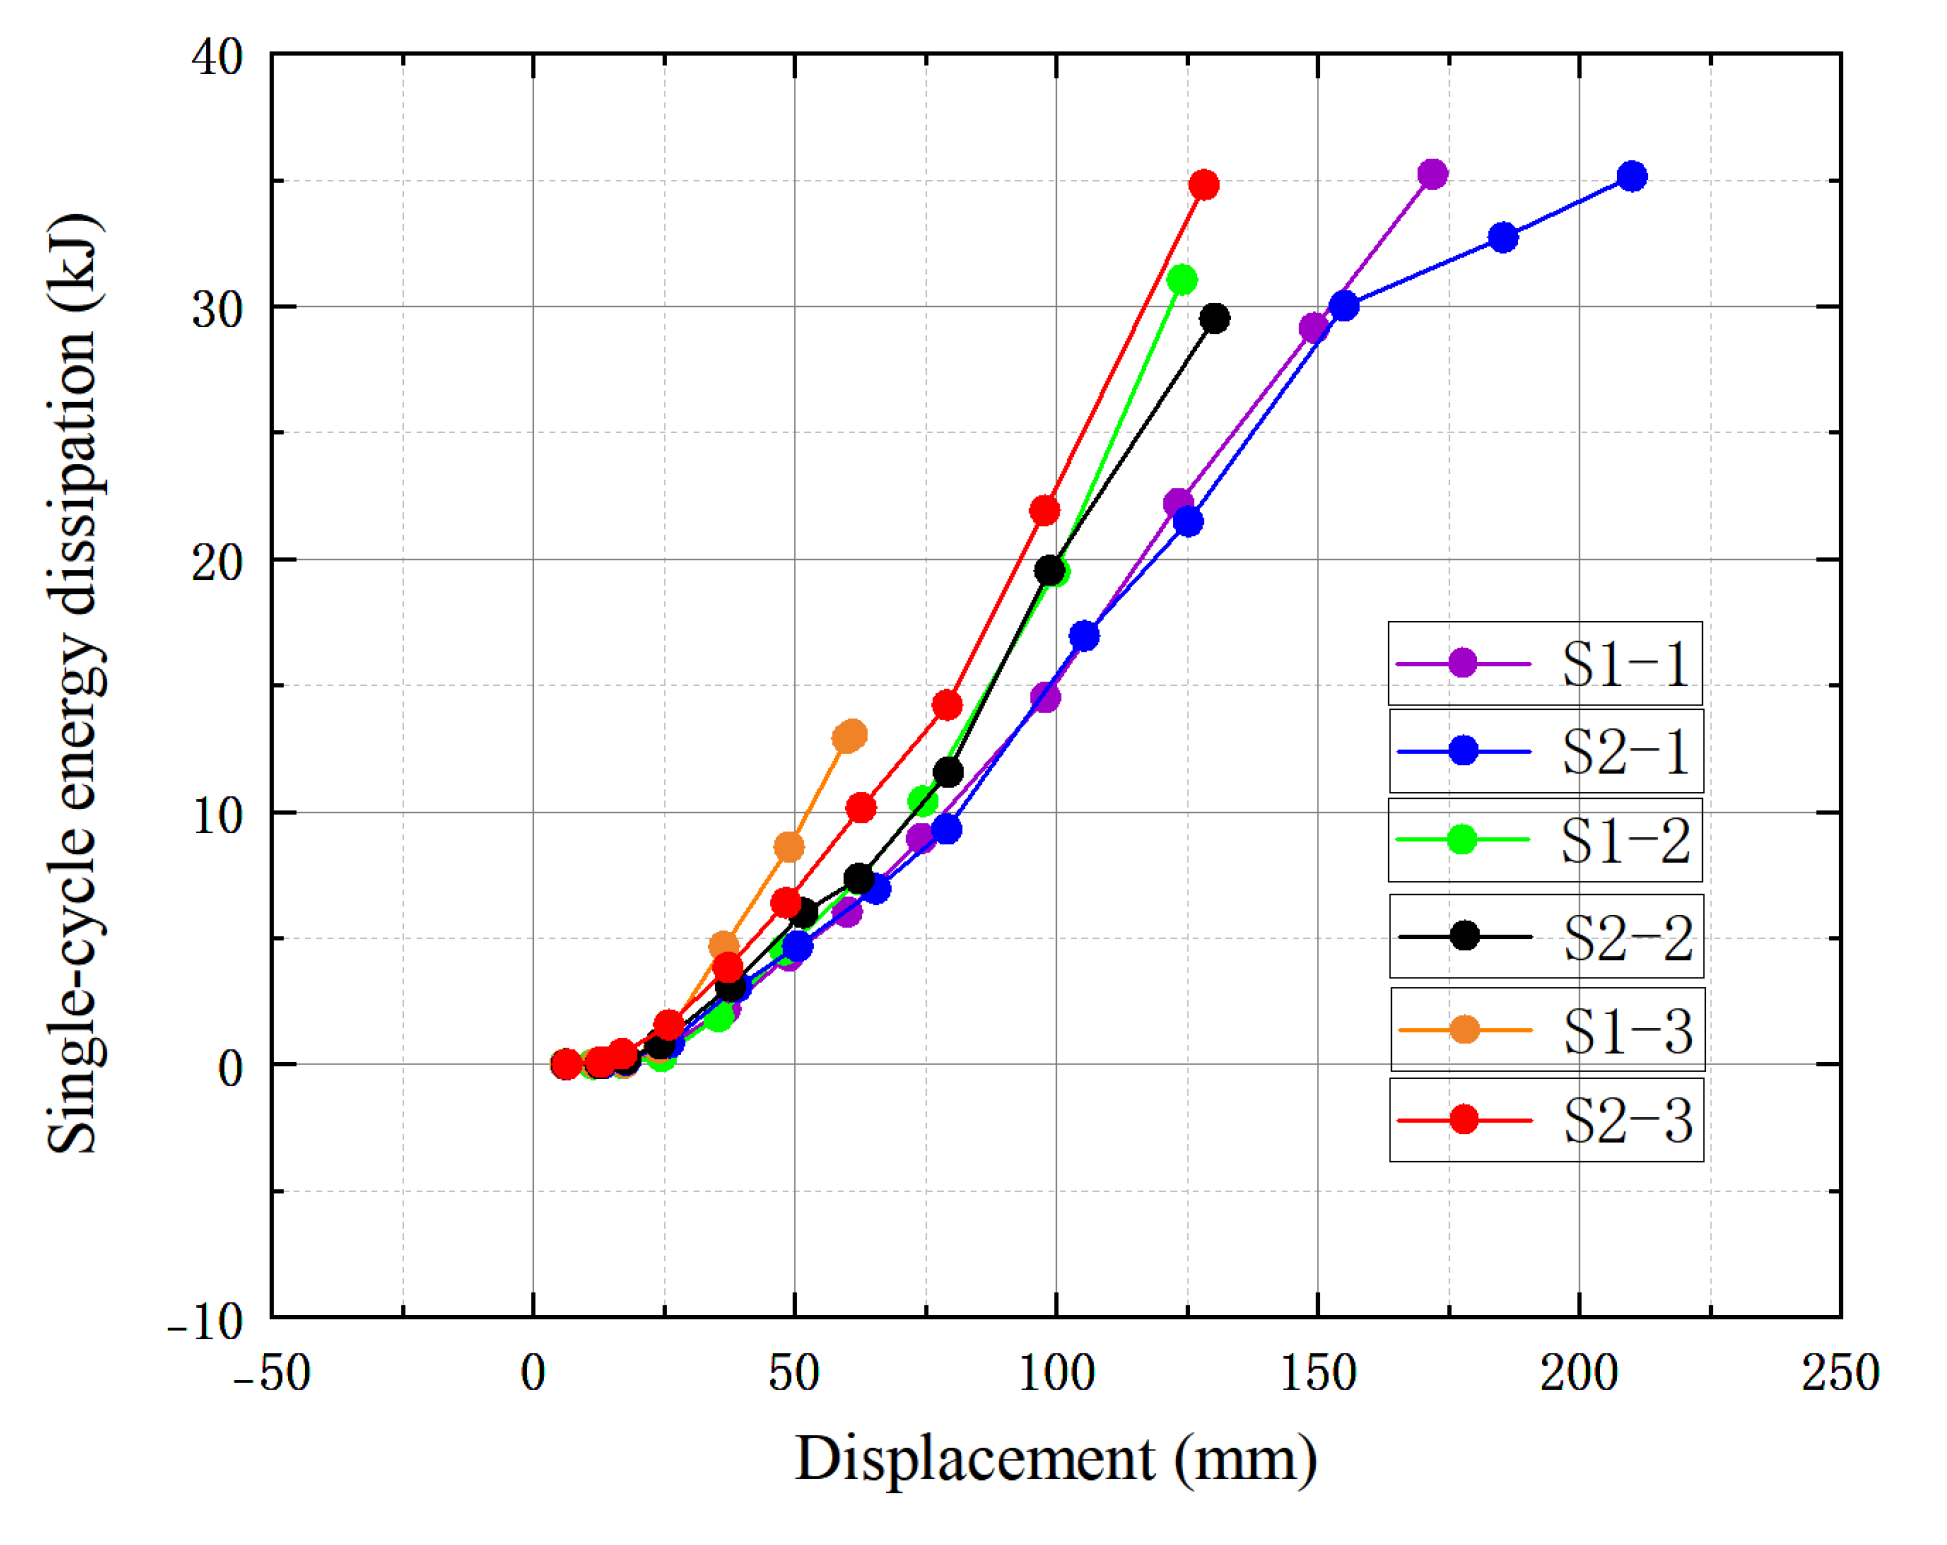
Figure 21, Figure 22, Figure 23 and Figure 24 present the skeleton curves, single-cycle energy dissipation, equivalent viscous damping coefficients, and stiffness degradation laws of the connections under different axial compression ratios, respectively. The results indicate that as the axial compression ratio increases, the initial stiffness and overall load-carrying level of the connection exhibit an increasing trend. Simultaneously, the single-cycle energy dissipation and equivalent viscous damping coefficient increase accordingly, demonstrating that the axial compressive load can enhance the deformation resistance and energy dissipation capacity of the connection. However, an increase in the axial compression ratio accelerates the late-stage stiffness degradation rate, indicating that a larger axial compressive load expedites local damage accumulation. In summary, the axial compression ratio exerts a coupled “stiffness-increasing, energy-dissipating, and degradation-accelerating” effect on the connection. Therefore, a comprehensive consideration among bearing capacity, energy dissipation, and ductility is required in engineering design.
Figure 21.
Backbone curves.
Figure 22.
FE-simulated single-cycle energy dissipation.
Figure 23.
FE-simulated equivalent viscous damping coefficient.
Figure 24.
Stiffness degradation.
As can be observed from the skeleton curves, when the axial compression ratio is elevated from 0.1 to 0.2, the ultimate bearing capacity improves to some extent; however, when it is further increased from 0.2 to 0.3, the overall ultimate flexural load does not continue to grow significantly and even decreases slightly. Extracting and analyzing the finite element stress contour maps reveals that in the late loading stage under higher axial compression ratio conditions, the plastic yield region has visibly shifted from the connection core region to the upper module steel tube column, where significant compression-bending yielding occurs in the column cross-section. This phenomenon reveals the transfer mechanism of the system’s failure mode: on the one hand, the increase in axial compressive load enhances the clamping moment generated on the end-plate contact surface during the flexural process of the connection’s self-locking mechanism; on the other hand, it significantly weakens the effective ultimate flexural bearing capacity of the steel tube column due to the second-order effect ( effect) and the axial force–bending moment () interaction. When the axial compression ratio is relatively large, the weak link of the system successfully transitions from connection opening failure to column plastic energy dissipation, thereby presenting a relatively ideal “strong connection-weak column” seismic yield mechanism.
Furthermore, while this section primarily investigates the macroscopic influence of the axial compression ratio, it is acknowledged that micro-parameters such as initial geometric imperfections, assembly tolerances, and interfacial friction conditions also play crucial roles in the mechanical performance of self-locking connections. As analyzed in Section 4.1, initial assembly tolerances and complex stick–slip friction mechanisms are the primary drivers for the asymmetric load-climbing phenomena and finite element deviations observed during the reverse loading stages. Small variations in geometric imperfections may alter the initial contact state of the interlocking tenons, while different friction conditions could affect the energy dissipation area of the hysteresis loops. Because these micro-parameters are inherently random and highly sensitive to manufacturing processes, evaluating them requires a comprehensive stochastic parametric framework. Therefore, systematically quantifying the sensitivity of the connection’s cyclic performance to these geometric and frictional uncertainties will be a key focus of our future numerical investigations.
5. Theoretical Model for Ultimate Flexural Bearing Capacity
5.1. Derivation of Ultimate Flexural Bearing Capacity Formula for the Connection Under Planar Compression–Bending–Shear Loading
5.1.1. Basic Assumptions and Failure Mechanism Judgment
Based on the experimental phenomena and finite element results, an obvious opening phenomenon occurs between the upper corner fitting, the connecting plate, and the fixture of the self-locking connection under the ultimate flexural state. At this time, the connecting tenons on the tension side bear the primary pull-out tensile forces, while the end plate and column walls on the compression side bear the primary compressive reaction forces. The finite element results indicate that the dominant failure mode of the tenons on the opening side is tensile yielding along the longitudinal axis of the column, accompanied by significant large-deformation characteristics. Therefore, under the ultimate flexural state, the connection can be simplified into a static tension–compression equilibrium system consisting of a “tension-zone tenon group” and a “compression-zone end plate (local bearing),” with the external constant axial compressive load concurrently providing a resisting moment.
To establish a simplified analytical model for the ultimate bearing capacity suitable for engineering design and safety assessment, the following basic mechanical assumptions are made: (1) After the large-deformation opening of the connection, tension and compression zones with clear mechanical boundaries are formed, and the residual friction force after the tension-side base plate loses contact is ignored. (2) The core tensile capacity in the tension zone is provided by the tenon group. Its resistance must be accurately calibrated based on the measured constitutive properties of the material, taking into account the “strain hardening effect” under large deformations. (3) The compression zone is the local bearing area of the end plate and column walls. It is necessary to strictly follow the true physical structural boundaries of the connection, such as the central opening and solid wall thickness limits, to conduct area distribution and centroid reconstruction, and to adopt a bearing strength enhancement factor under local confinement. (4) This model aims to solve for the ultimate flexural bearing capacity controlled by the self-locking connection’s internal resisting moment system. By eliminating the interference caused by non-ideal initial manufacturing tolerances and random assembly gaps, the derivation of the lower-bound solution is strictly targeted at the positive ultimate flexural state where the force-transfer mechanism is clear, thereby providing a conservative reference for practical engineering.
5.1.2. Establishment of General Analytical Model for Ultimate Flexural Bearing Capacity
(1) Equivalent yield tensile force of tenons in the tension zone
Let the width of the critical section at the tenon root be , the thickness be , and its individual cross-sectional area be . Based on the rigid-plastic constitutive assumption, the basic ultimate yield tensile force of a single tenon is defined as:
where is the measured uniaxial tensile yield strength of the material. (Note: Given that this novel self-locking connection utilizes high-precision CNC machining, the initial interlocking gap between the tenon and the socket is extremely small, significantly reducing the uncoordinated deformation effect of the tenon group in tension. Therefore, no additional group reduction penalty is applied under the basic yield state to restore the true physical yield baseline.)
(2) Plastic neutral axis and compression zone height of the cross-section
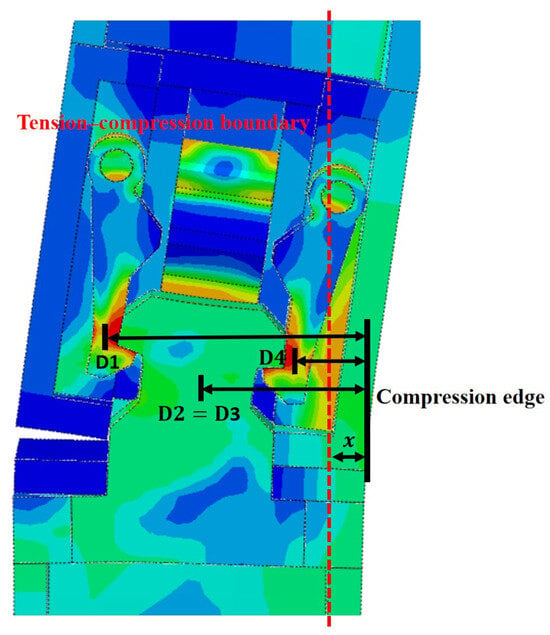
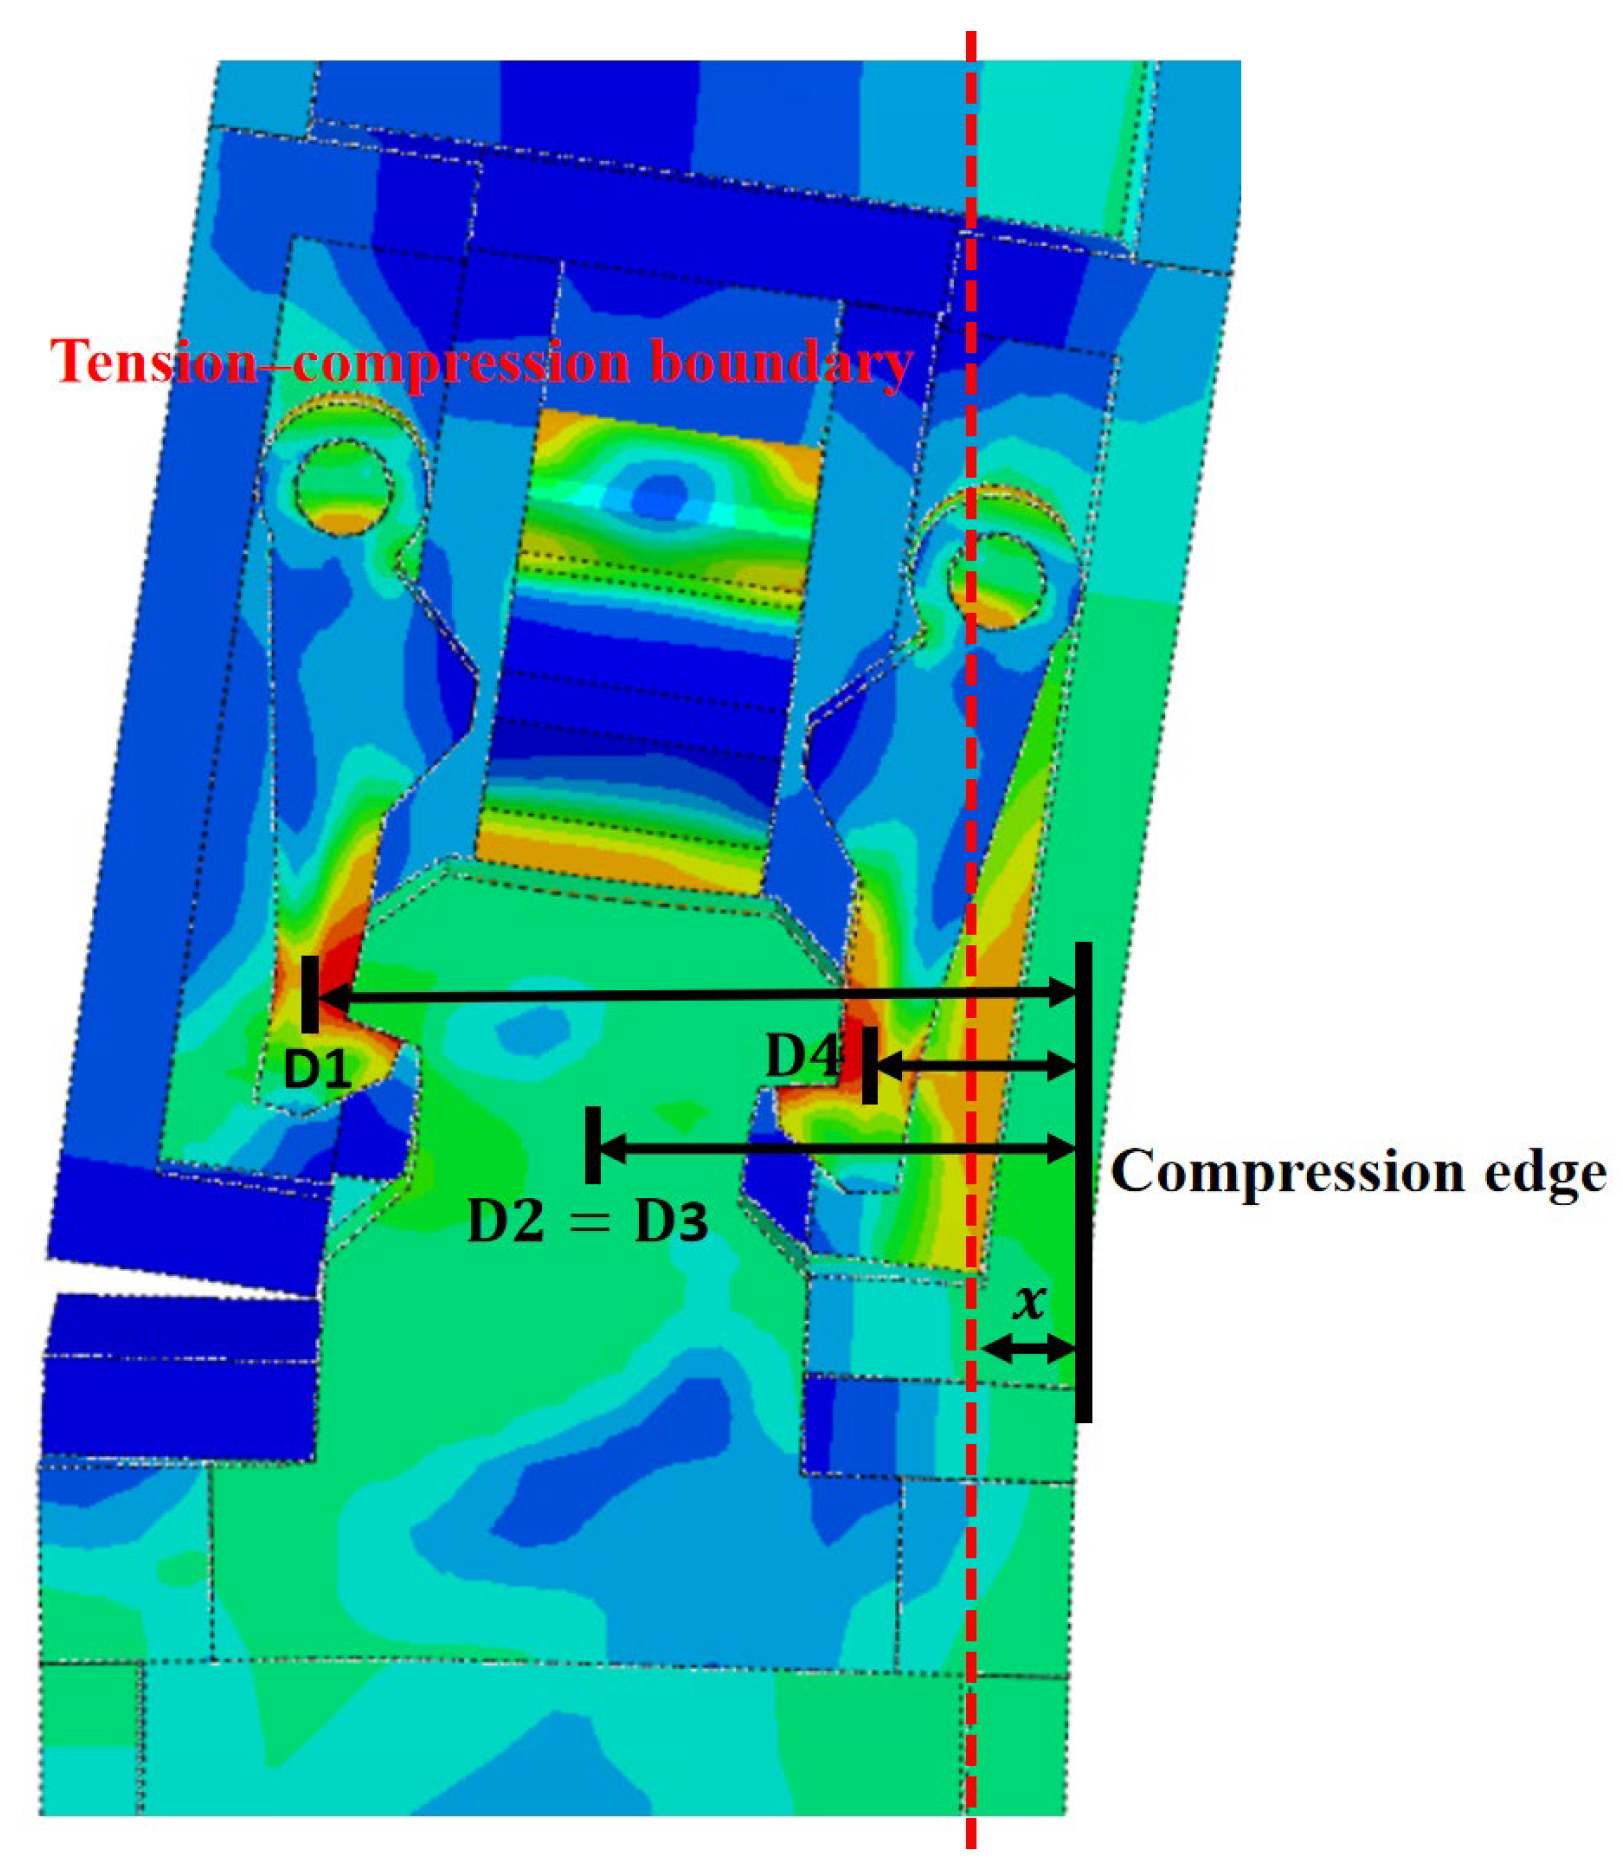
Four groups of tenons are arranged inside the tested connection specimen, distributed in an orthogonal symmetric “1-2-1” layout, as shown in Figure 25. Under the unidirectional ultimate flexural state, all four groups of tenons are located in the tension zone and exert their equivalent tensile capacities. At the ultimate failure state, the cross-section must satisfy the vertical (axial) static equilibrium condition . That is, the sum of the external constant axial compressive load and the total tensile force of the 4 tenons must be balanced by the total compressive reaction force provided by the compression zone:
Figure 25.
Schematic of tension–compression zoning and geometric definitions at the ultimate bending state of the connection under 0° condition.
Assuming the compression zone is not weakened by the central opening and is taken as an equivalent rectangular stress block, then (where is the column width, is the depth of the compression zone, and is the local bearing strength of the end plate). Substituting this into the above equation, the depth of the tension–compression boundary under ideal conditions can be explicitly obtained:
(3) General analytical solution for unidirectional ultimate flexural bearing capacity of the connection
To eliminate the influence of the unknown resultant force in the compression zone from the moment equilibrium equation, the geometric centroid of the equivalent compression zone (located at a distance of from the extreme compression edge) is taken as the rotational pivot for taking moments. According to the geometric symmetry of the connection layout, the physical distances from the geometric center of each row of tenons to the extreme compression edge are sequentially defined as (1 at the far end), and (2 in the middle, where due to symmetry), and (1 at the near end). Additionally, the external axial compressive load initially acts at the geometric centroid of the column cross-section (at a distance of from the edge).
Establishing the moment equilibrium equation about the rotational pivot, the unidirectional ultimate flexural bearing capacity of the connection is the sum of the internal resisting moments of each tensile component and the eccentric moment of the axial compressive load, gives:
Based on the geometric symmetry of the connection structure (satisfying and ), substituting into the above equation and extracting the common factor, the general theoretical analytical formula for the unidirectional ultimate flexural bearing capacity under an ideal contact state can be derived:
It should be pointed out that the analytical solution Equation (5) is a general mechanical baseline solution established based on ideal geometry. In the actual large-deformation ultimate failure of this connection, accompanied by enormous horizontal displacement, the system will generate a significant second-order additional bending moment ( effect). Simultaneously, the local force-transmission structural details (opening and wall thickness) will restrict the shape of the compression zone, and the material on the tension side will experience extremely strong strain hardening. Therefore, in actual capacity assessment, “material hardening constitutive modifications” and “physical geometric reconstruction” must be introduced based on this general framework. The specific theoretical verification is detailed below.
5.1.3. Comparison and Verification Between Theoretical Solutions and Experimental Results and Mechanism Discussion
To verify the accuracy of the aforementioned theoretical model, the measured data of the unidirectional flexural specimen (S1, constant axial compressive load ) were extracted for validation. The geometric parameters of the cross-section are: column width and individual tenon cross-sectional area . The physical lever arms of each row of tenons are , , and . The local bearing strength of the end plate is taken as .
(1) Measured material strain hardening and effective tenon force correction
According to the measured material property data (Table 2), the initial uniaxial tensile yield strength of the tenon material is , and the ultimate tensile strength reaches as high as , with the ultimate-to-yield strength ratio () reaching a highly significant 1.38. If only the initial yield point is conservatively adopted, the basic yield tensile force of a single tenon is . However, in the ultimate failure state, the horizontal displacement of the specimen reaches up to 62.47 mm, causing the connection to open drastically. The tenons on the tension side have deeply surpassed the yield plateau and entered the “strain hardening” stage. To conform to the actual situation of large-deformation reserve resistance for materials with high ultimate-to-yield strength ratios, a strain hardening coefficient (far below the material’s ultimate potential of 1.38, conforming to the actual safety baseline) is introduced for the 4 groups of tenons under tension. The true ultimate tensile force of a single tenon after correction is:
(2) Accurate calculation of theoretical ultimate flexural bearing capacity and reconstruction of U-shaped compression zone
Based on the vertical static equilibrium equation , the total compressive reaction force required to be provided by the equivalent compression zone is:
Assuming a full solid cross-section, the depth of the equivalent rectangular compression zone is:
Verification of physical structural boundary and centroid correction:
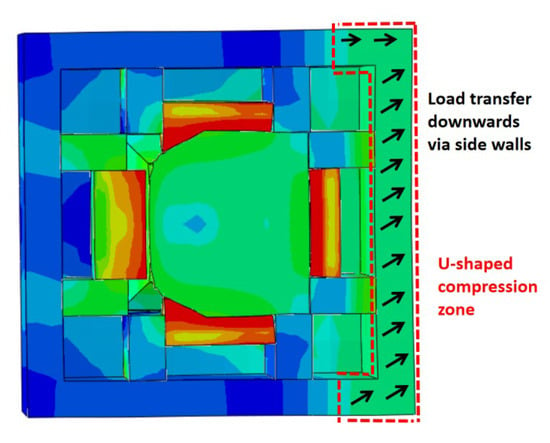
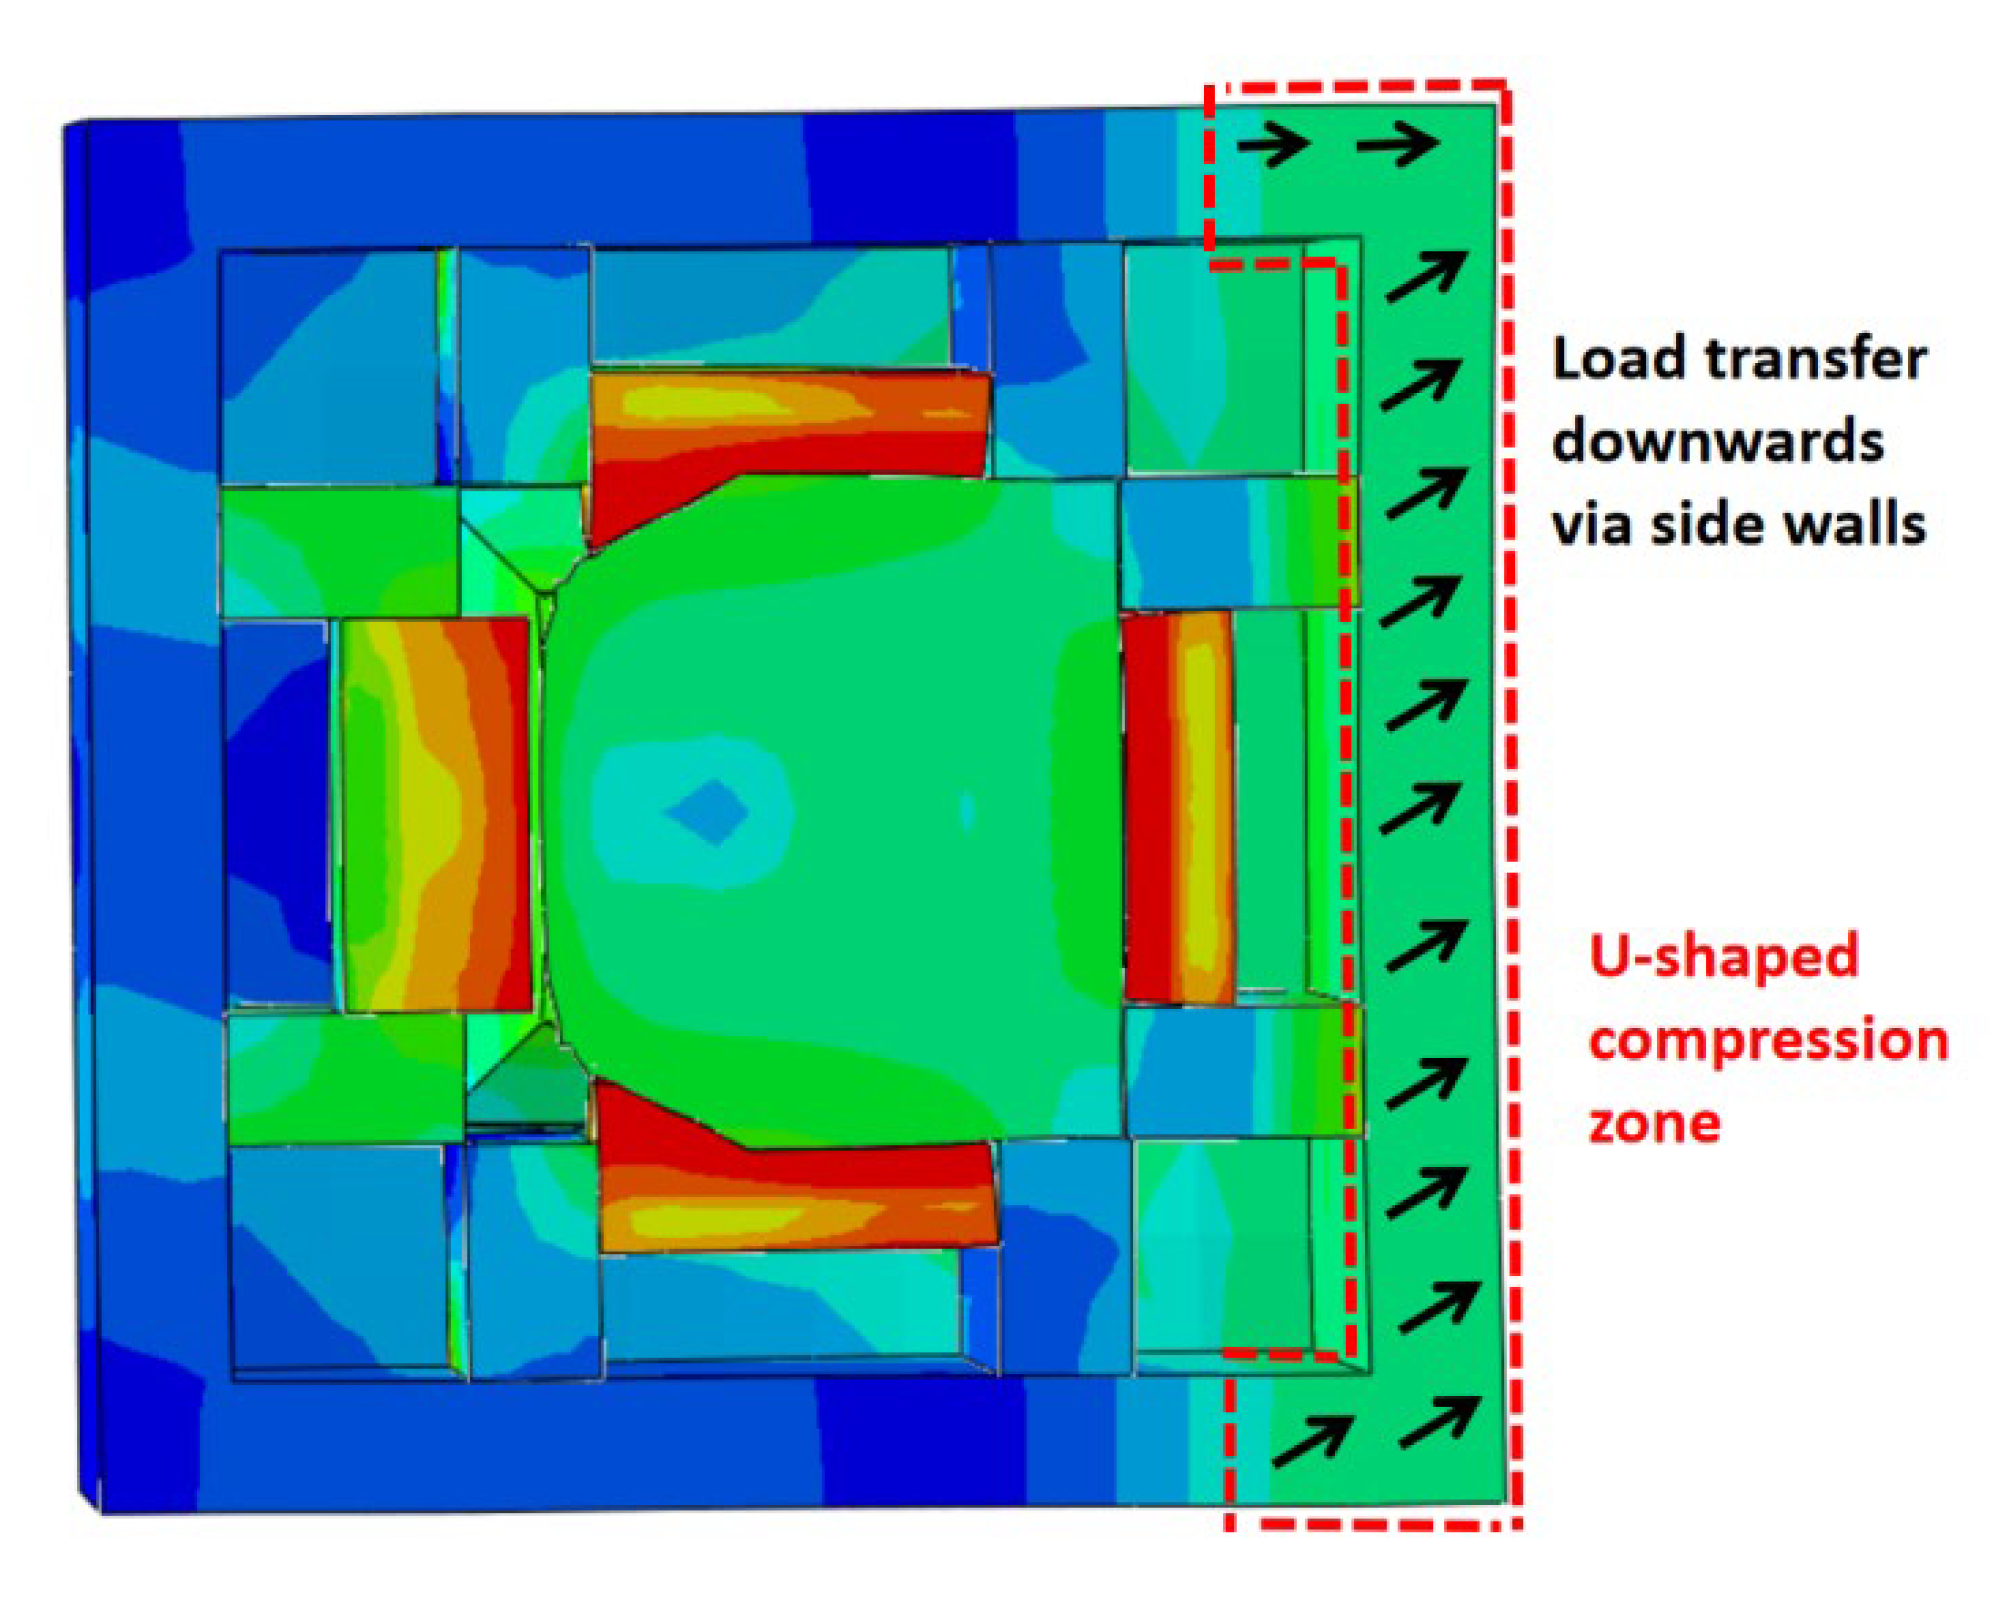
Calculations show that (the thickness of the edge solid column wall). This indicates that under the extreme bearing state, the ideal rectangular compression zone has exceeded the 20 mm thickness of the edge solid column wall. Constrained by the local force-transmission structural details, the excess bearing area deficit (425.44 ) must extend inward along the 20 mm thick lateral column walls at both ends (the extension length is calculated as 10.64 mm), transforming the true compression zone from a rectangular to a U-shaped area, as shown in Figure 26.
Figure 26.
Schematic diagram of the U-shaped compression zone.
Through geometric integral reconstruction, the perpendicular distance from the area-equivalent centroid (rotational pivot) of this U-shaped compression band to the extreme compression edge is , which represents a minor deviation of 0.51 mm compared to the ideal solid rectangular centroid of 10.88 mm. By substituting this true U-shaped centroid coordinate for in the general formula, the 0° theoretical ultimate flexural bearing capacity is obtained:
(3) Coplanar pivot calibration and effect verification. When benchmarking against the experimental measured values, the strict mechanical principle of coplanar moment calculation must be followed. There is a vertical height difference of 61 mm between the critical section of the tensioned tenon of this specimen and the compression surface of the upper corner fitting’s base plate. Under large deformation, the true physical axis of rotation of the system is located on the plane where the compression base plate resides. Therefore, the actual effective thrust lever arm of the actuator is corrected to: (). Under the measured ultimate state, the unidirectional horizontal thrust is , and the horizontal displacement is . Considering the second-order additional bending moment ( effect) induced by large deformation, the ultimate experimental external moment acting on the true pivot of the connection is:
Mechanism conclusion: Comparing the theoretically analytical internal resisting moment of 176.50 kN·m (which considers material strain hardening and the U-shaped compression zone) with the measured ultimate external moment of 176.94 kN·m (which includes the coplanar pivot calibration and the second-order effect), the error is merely 0.25%. This demonstrates that this theoretical formula provides a mechanical lower-bound design baseline and possesses a high-precision prediction capability for the ultimate capacity of the spatial self-locking connection.
5.2. Derivation of Ultimate Flexural Bearing Capacity Formula for Connection Under Spatial Compression–Biaxial Bending–Shear Loading
5.2.1. Compression Zone and Lever Arm Analysis
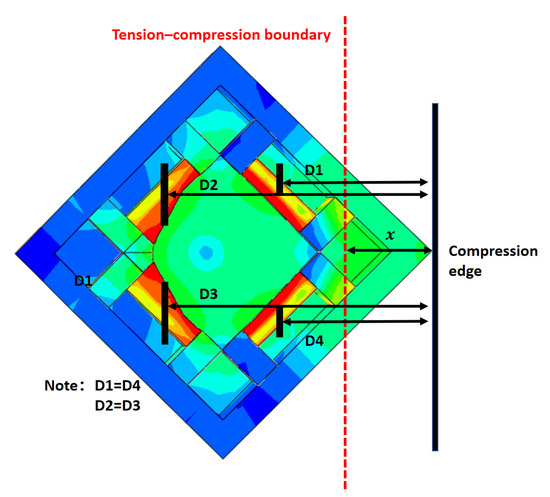
To establish the effective lever arms of each component to the extreme compression corner, a 45° projection coordinate system is first established. Given the column width and taking the geometric center of the column cross-section as the origin, the coordinates of the extreme compression corner are (106, 106). The physical diagonal distance from the initial application point of the external constant axial load to this corner is .
Under the 45° coordinate projection, the 4 groups of tenons that were distributed in a “1-2-1” pattern under unidirectional bending (all 68 mm away from the column geometric center) are reorganized into a classic “2-2” double-row tension layout based on spatial symmetry, as shown in Figure 27. The effective physical lever arms of each row of tenons projected to the extreme compression corner along the diagonal direction are calculated as follows:
Figure 27.
Schematic of tension–compression zoning and geometric definitions at the ultimate bending state of the connection under 45° condition.
Proximal tension row (2 sets of connectors): The projected distance is .
Distal tension row (2 sets of connectors): The projected distance is .
5.2.2. Material Strain Hardening and Effective Tenon Force Correction
According to the plane section assumption for structural large deformation, under a 45° spatial rotation, the macroscopic tensile displacement of the far-end tenon row is almost twice that of the near-end tenon row. This implies a significant difference in the depth to which the two rows of tenons enter the material strain-hardening stage at the ultimate state.
Based on the measured material data (ultimate-to-yield strength ratio ) and the basic yield tensile force of a single tenon , this paper introduces stepped strain hardening coefficients for refined resistance allocation:
Far-end tenon row (more severe deformation): The hardening coefficient is taken as (still retaining a safety margin), and the corrected individual tensile force is .
Near-end tenon row (smaller deformation, but already deeply into the hardening stage): The hardening coefficient is taken as , and the corrected individual tensile force is .
5.2.3. Establishment of L-Shaped Compression Zone and Neutral Axis Verification
Based on the vertical static equilibrium condition , under the ultimate state with non-synchronous hardening of the 4 tenons, the total compressive reaction force required to be provided by the compression zone is:
Taking the local bearing strength , the required effective bearing area surges to .
Mathematical solution of compression zone boundary:
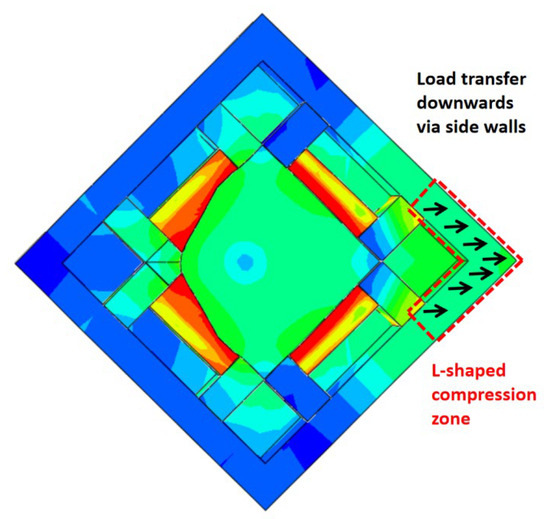
Constrained by the opening at the center of the corner fitting’s base plate and the surrounding wall thickness limit , the compression zone cannot form a solid triangle but instead evolves into an L-shaped compression zone along the compression corner, as shown in Figure 28. Assuming the total physical length of this L-shaped band extending along both side edges is , the area equation is:
Figure 28.
Schematic diagram of the L-shaped compression zone.
Solving this yields the full compression length along a single edge. Connecting the extreme points at both ends yields the true tension–compression boundary (plastic neutral axis). Its 45° perpendicular depth from the compression corner is:
Verification of physical mechanism: Because the true neutral axis depth , this analytical result proves from a geometric level that all four tenons are located outside the compression zone, meaning all are in the tension zone. This result excludes the possibility that rib plates might exist within the compression zone and transmit pressure to the upper corner fitting’s base plate, establishing the rationality of the peripheral L-shaped edge bearing. This successfully verifies the phenomenon observed in the finite element simulation where all 4 groups of tenons were in the tensile yield zone.
Centroid shift in the L-shaped compression zone:
Since the compression area is not a solid triangular region, the resultant force centroid of this L-shaped compression band moves inward to a distance of projected along the diagonal from the compression corner. This physical centroid shift, caused by true structural characteristics, reduces the internal lever arm of the tension system and limits the ultimate flexural bearing capacity of the connection under compression–biaxial bending–shear conditions.
Based on this centroid coordinate , the final effective internal lever arms are calculated:
Far-end tenon lever arm: .
Near-end tenon lever arm: .
External axial load lever arm: .
5.2.4. Ultimate Flexural Bearing Capacity Formula for Connection Under Compression–Biaxial Bending–Shear
Establishing the moment equilibrium equation about the equivalent L-shaped centroid, the theoretical ultimate flexural bearing capacity of specimen S2 (under 45° bending) is obtained:
Coplanar pivot calibration and experimental verification:
Similarly, taking the compression base plate with a 61 mm height difference as the true physical rotational pivot, the effective thrust lever arm of the actuator is corrected to (). The measured ultimate thrust under biaxial bending is , and the spatial ultimate diagonal displacement increases to . Considering the second-order effect, the true external ultimate moment borne by the connection cross-section is:
Mechanism and conclusion discussion: Comparing the theoretical predicted value (192.23 kN·m) with the measured ultimate value including the second-order effect (191.62 kN·m), the error is 0.32%. This relatively small error reveals the evolution logic of the self-locking connection under compression–biaxial bending–shear loading: On one hand, the physical restriction formed by the 20 mm wall thickness causes the centroid shift in the L-shaped compression zone, physically limiting the possibility of the internal resisting moment proportionally enlarging as the diagonal stretches. On the other hand, the material strain hardening induced by spatial large deformation provides excellent ductile reserve capacity for the connection. The combined action of both makes the actual ultimate flexural bearing capacity reach an upper limit of 191.62 kN·m. By integrating geometric effects (), physical structural constraints (L-shaped reconstruction), and material nonlinear evolution (), the general analytical theory constructed in this chapter provides a reference for the refined design and safety assessment of spatial self-locking connections.
6. Conclusions
Targeting the mechanical performance of steel modular buildings under complex loads, this study conducted a systematic investigation into a self-developed tenon self-locking and unlockable connection. The main conclusions drawn are as follows:
- (1)
- Performance under Planar Loading: A full-scale low-cyclic reversed loading test under the planar compression–bending–shear condition was completed. The overall hysteretic curve of the specimen exhibited a spindle shape accompanied by a certain pinching effect, demonstrating that the connection possesses favorable plastic deformation and energy dissipation capacities under planar loading. During the loading process, a separation phenomenon occurred between the upper corner fitting and the connecting plate. The opening mode under planar loading manifested as a uniform opening mode within the primary loading plane.
- (2)
- Performance under Spatial Loading: A full-scale low-cyclic reversed loading test under the spatial compression–biaxial bending–shear condition was also conducted. The overall hysteretic curve similarly exhibited a spindle shape with a pinching effect, indicating comparable plastic deformation and energy dissipation capacities. A separation phenomenon was also observed between the upper corner fitting and the connecting plate; however, the opening mode under spatial loading was a non-uniform opening mode, characterized by a large opening gap at the loading corner that gradually decreased along both sides.
- (3)
- Numerical Simulation and Parametric Analysis: A refined finite element analysis (FEA) model was established, and the numerical results agreed well with the experimental data, with the error of the positive ultimate flexural bearing capacity being within 5%. The critical axial compression ratio for the failure mode transition of the connection under compression–bending–shear action was identified to be approximately 0.20 to 0.25.
- (4)
- Theoretical Analytical Models: Calculation formulas for the ultimate flexural bearing capacity of the connection under both planar compression–bending–shear and spatial compression–biaxial bending–shear actions were proposed. Compared with the experimental results, the theoretical predictions yielded errors within 5% for the planar condition and within 5% for the spatial condition, respectively. This demonstrates that the proposed analytical formulas possess relatively accurate prediction capabilities for the connection’s ultimate flexural bearing capacity under complex loading states.
- (5)
- A comparative test analysis was completed for connections under in-plane complex loading (compression–bending–shear) and spatial complex loading (compression–biaxial bending–shear) conditions. The results indicate that under in-plane compression–bending–shear, specimens exhibit stronger energy dissipation and ductility capacities, yet strength attenuation in the local compression direction is significantly faster. Furthermore, spatial compression–biaxial bending–shear action reduces the connection’s deformation reserve; although it possesses a higher initial stiffness, its late-stage stiffness degradation and energy dissipation attenuation are more rapid, yielding relatively weaker late-stage energy dissipation stability.
7. Limitations and Future Research
- (1)
- Due to the high cost and technical complexity of full-scale spatial testing, this study was constrained to two representative specimens (S1 and S2). Future research will focus on expanding the experimental dataset to provide a more robust statistical evaluation of the self-locking joint’s performance.
- (2)
- The current investigation primarily addressed the effects of loading angles and axial compression ratios. However, in real engineering systems, load interactions are highly complex [25]. Future stochastic finite element analysis (FEA) will systematically evaluate random micro-parameters, including initial geometric imperfections, assembly tolerances, and varying friction conditions, to capture these complexities more accurately [27].
- (3)
- While the FEA predictions for positive loading show high accuracy, discrepancies in the negative loading phase (20–24%) indicate the limitations of idealized models. Unlike advanced 3D modeling used for deflection validation in other structural components [28], our idealized geometry cannot fully capture irreversible plastic slip and contact reconstruction. Subsequent modeling will incorporate stochastic imperfections to improve prediction fidelity.
- (4)
- The proposed analytical formulas are derived based on idealized mechanical assumptions and are currently applicable to low-to-moderate axial compression ratios (n ≤ 0.3). To bridge the gap between theoretical mechanics and safe engineering practice, a resistance reduction factor () of 0.85–0.90 is recommended to account for geometric non-idealities and assembly tolerances.
- (5)
- This study focused on the mechanical behavior at the component level to establish a foundation for the interlocking mechanism. Future work will investigate the interaction between these joints and the global modular integrated construction (MiC) frame [29]. Specifically, the role of the joint as a structural “regulator” in internal force redistribution and lateral drift control will be explored in conjunction with high-performance steel members [30].
- (6)
- The “unlockable” nature of the proposed self-locking connection supports rapid assembly and non-destructive disassembly, making it a cornerstone for sustainable urban development [22]. Future investigations will evaluate its performance in high-cycle reusability scenarios, such as emergency medical facilities and temporary commercial spaces, to promote modular building potential in sustainable cities.
Author Contributions
Conceptualization, methodology, and funding acquisition, X.L.; project administration, and supervision, Y.L.; writing—original draft and formal analysis, F.L.; visualization, software, H.L.; writing—review and editing and data curation, C.L.; formal analysis and data curation, X.H.; visualization and writing—review and editing, X.Y. All authors have read and agreed to the published version of the manuscript.
Funding
This research was sponsored by the National Natural Science Foundation of China (Grant No. 52578230); the Research Project of Basic Scientific Research Fund for Provincial Universities in Hebei Province (KY2024018); and the Teacher–Student Collaborative Innovation Project of Bohai Campus, Hebei Agricultural University (2024-BHXT-04).
Data Availability Statement
The original contributions presented in this study are included in the article. Further inquiries can be directed to the corresponding authors.
Conflicts of Interest
The authors declare no conflicts of interest.
References
- Lacey, A.; Chen, W.; Hao, H.; Kaiming, B. Structural response of modular steel-building composite floors under extreme in-plane loading. J. Constr. Steel Res. 2019, 158, 446–458. [Google Scholar]
- Chen, Z.; Liu, X.; Liu, Y.; Tang, J.; Wang, J. Hysteresis performance and force-transferring mechanism of a novel inter-module sliding-block self-locking connection. J. Constr. Steel Res. 2025, 231, 109617. [Google Scholar] [CrossRef] [Scilit]
- Lyu, Y.-F.; Li, G.-Q.; Cao, K.; Zhai, S.-Y.; Li, H.; Chen, C.; Wang, Y.-Z. Behavior of splice connection during transfer of vertical load in full-scale corner-supported modular building. Eng. Struct. 2021, 230, 111698. [Google Scholar] [CrossRef] [Scilit]
- Wang, Y.; Xia, J.; Ma, R.; Xu, B.; Wang, T. Experimental study on the flexural behavior of an innovative modular steel building connection with installed bolts in the columns. Appl. Sci. 2019, 9, 3468. [Google Scholar] [CrossRef] [Scilit]
- Liu, Y.; Tang, J.; Chen, Z.; Liu, J.; Degefe, A.T. A review on the mechanical properties of MSBs based on discontinuous members. J. Constr. Steel Res. 2025, 228, 109388. [Google Scholar] [CrossRef] [Scilit]
- Yu, Y.J.; Chen, Z.H.; Chen, A.Y. Experimental study of a pretensioned connection for modular buildings. Steel Compos. Struct. 2019, 31, 217–232. [Google Scholar]
- Deng, F.E.; Wang, H.Y.; Zong, L.; Zhang, Z. Seismic behavior of a novel liftable connection for modular steel buildings: Experimental and numerical studies. Thin-Walled Struct. 2024, 197, 111563. [Google Scholar] [CrossRef] [Scilit]
- Deng, F.E.; Du, P.Y.; Gao, D.J.; Zhang, Z. Seismic performance of an innovative self-centering and repairable connection with SMA bolts in modular steel construction. Thin-Walled Struct. 2024, 205, 112377. [Google Scholar] [CrossRef] [Scilit]
- Nadeem, G.; Safiee, N.A.; Abu Bakar, N.; Karim, I.A.; Nasir, N.A.M. Experimental and numerical study of self-locking adaptable inter connection for modular steel structures. J. Build. Eng. 2023, 65, 105723. [Google Scholar] [CrossRef] [Scilit]
- Liu, X.; Chen, Z.; Liu, Y.; Tang, J.; Degefe, A.T. Mechanical properties of detachable self-locking connection between vertical thin-walled steel modules under compression-bending-shear loading. Thin-Walled Struct. 2025, 214, 113385. [Google Scholar] [CrossRef] [Scilit]
- Chen, Z.; Wang, J.; Liu, J.; Cong, Z. Tensile and shear performance of rotary inter-module connection for modular steel buildings. J. Constr. Steel Res. 2020, 175, 106367. [Google Scholar] [CrossRef] [Scilit]
- Chen, Z.; Liu, Y.; Zhong, X.; Liu, J. Rotational stiffness of inter-module connection in mid-rise modular steel buildings. Eng. Struct. 2019, 196, 109273. [Google Scholar] [CrossRef] [Scilit]
- Deng, E.-F.; Zong, L.; Ding, Y.; Dai, X.-M.; Lou, N.; Chen, Y. Monotonic and cyclic response of bolted connections with welded cover plate for modular steel construction. Eng. Struct. 2018, 167, 407–419. [Google Scholar] [CrossRef] [Scilit]
- Dai, X.-M.; Zong, L.; Ding, Y.; Li, Z.-X. Experimental study on seismic behavior of a novel plug-in self-lock connection for modular steel construction. Eng. Struct. 2019, 181, 143–164. [Google Scholar] [CrossRef] [Scilit]
- Jiang, J.; Chen, Z.; Liu, Y.; Liu, X.; Lu, G.; Lin, X. Experimental and numerical investigation on the seismic behavior of a novel bolted inter-module connection. J. Constr. Steel Res. 2025, 224, 109101. [Google Scholar] [CrossRef] [Scilit]
- Zhai, S.-Y.; Lyu, Y.-F.; Cao, K.; Li, G.-Q.; Wang, W.-Y.; Chen, C. Experimental-numerical investigation and design of bolted-cover plate connections under bending for modular steel buildings. J. Build. Eng. 2023, 75, 107057. [Google Scholar] [CrossRef] [Scilit]
- Yang, C.; Chen, H.; Wang, X.; Wang, Q.; Zhang, B.; Ou, J. Pull-out performance of grouting sleeve connection with short studs shear keys in modular steel building. J. Build. Eng. 2024, 84, 108553. [Google Scholar] [CrossRef] [Scilit]
- Liu, X.; He, X.; Wang, H.; Zhang, A. Compression-bend-shearing performance of column-to-column bolted-flange connections in prefabricated multi-high-rise steel structures. Eng. Struct. 2018, 160, 439–460. [Google Scholar] [CrossRef] [Scilit]
- Wang, X.; Lu, G.; Liu, Y.; Chen, Z.; An, Q.; Wang, X. Lateral stiffness of modular steel connection with semi-rigid bolted intra-module connection. J. Build. Eng. 2024, 97, 110668. [Google Scholar] [CrossRef] [Scilit]
- Jiang, J.; Liu, Y.; Wang, X.; Chen, Z. Flexural performance of a novel bolted inter-module connection affected by corner fitting openings. J. Build. Eng. 2024, 98, 111390. [Google Scholar] [CrossRef] [Scilit]
- Liu, X.; Chen, Z.; Liu, Y.; Wang, J.; Zhou, K. Mechanical behavior of an inter-module slider self-locking connection subject to the biaxial bending load. Eng. Struct. 2026, 350, 122033. [Google Scholar]
- Siewczyńska, M.; Siewczyński, B.; Grzelczak, A.; Szymczak-Graczyk, A.; Ksit, B. Modular Buildings as a Potential for Small Trade Development in a Sustainable City. Sustainability 2025, 17, 5958. [Google Scholar] [CrossRef] [Scilit]
- Liu, X.; Meng, Q.; Xu, L.; Liu, Y.; Tian, X. Modular steel buildings based on self-locking-unlockable connections seismic performance analysis. Buildings 2025, 15, 678. [Google Scholar]
- GB/T 228.1-2021; Metallic Materials-Tensile Testing-Part 1: Method of Test at Room Temperature. Standards Press of China: Beijing, China, 2021.
- Shi, G.; Jiang, S.; Zhang, N.; Hou, L.; Zhao, H. Seismic performance of double-sided plate-reinforced connections between steel beams and built-up box columns. Thin-Walled Struct. 2025, 208, 112872. [Google Scholar] [CrossRef] [Scilit]
- ATC-24; Guidelines for Cyclic Seismic Testing of Components of Steel Structures. Applied Technology Council: Redwood City, CA, USA, 1992.
- Gogolik, S.; Kopras, M.; Szymczak-Graczyk, A.; Tschuschke, W. Experimental evaluation of the size and distribution of lateral pressure on the walls of the excavation support. J. Build. Eng. 2023, 73, 106831. [Google Scholar] [CrossRef] [Scilit]
- Kopras, M.; Buczkowski, W.; Szymczak-Graczyk, A.; Walczak, Z.; Gogolik, S. Experimental Validation of Deflections of Temporary Excavation Support Plates with the Use of 3D Modelling. Materials 2022, 15, 4856. [Google Scholar] [CrossRef] [Scilit] [PubMed]
- Zhang, C.; Zhao, H.; Shi, G.; Wang, Q.; Wang, F.; Zhang, N.; Qian, H. Experimental investigation on seismic performance of modular integrated construction with photovoltaic glass curtain walls. J. Build. Eng. 2026, 118, 114975. [Google Scholar] [CrossRef] [Scilit]
- Shi, G.; Zhao, H.; Gao, Y. Experimental study on triple grades hybrid high-performance steel structure (TGHSS): Members and joints. Eng. Struct. 2022, 273, 115109. [Google Scholar] [CrossRef] [Scilit]

Disclaimer/Publisher’s Note: The statements, opinions and data contained in all publications are solely those of the individual author(s) and contributor(s) and not of MDPI and/or the editor(s). MDPI and/or the editor(s) disclaim responsibility for any injury to people or property resulting from any ideas, methods, instructions or products referred to in the content. |
© 2026 by the authors. Licensee MDPI, Basel, Switzerland. This article is an open access article distributed under the terms and conditions of the Creative Commons Attribution (CC BY) license.