


Abstract
Energy efficiency retrofits are widely promoted for public buildings, yet evidence from large-scale real-world projects remains limited compared with simulation-based assessments. This study leverages measured pre- and post-retrofit operational data from 530 public building retrofit projects across 11 provinces/municipalities in China to quantify realized energy-saving performance and screening-level cost-effectiveness across building types and climate zones. Wilcoxon and Kruskal–Wallis tests were employed to ensure statistical rigor. Retrofit measures were grouped into seven categories (e.g., HVAC, lighting, envelope, monitoring/management), and a median-based four-quadrant framework was employed to characterize investment–savings profiles by climate zone and building function. Across the full sample, mean energy use intensity decreased by 19.1%, with 99.2% of projects achieving positive savings. Savings varied markedly by building type: commercial and hotels achieved the highest savings intensities (26.5–28.0 kWh/(m2·a)), while education and cultural buildings generally showed lower gains, with some projects having < 10 kWh/(m2·a). Technology performance exhibited distinct climate and building suitability. Envelope retrofits were most effective in the Cold and Hot Summer–Cold Winter zones (13.30–22.06 kWh/(m2·a)) but yielded limited benefits in the Hot Summer–Warm Winter zone (~1.73 kWh/(m2·a)). HVAC and lighting upgrades delivered comparatively stable savings across climates and building types and dominated retrofit portfolios. Based on these findings, we propose a tiered strategy: prioritizing HVAC and envelope upgrades for high-load sectors while focusing on low-cost optimizations for educational facilities to mitigate investment risks. The findings provide large-scale empirical evidence to support climate- and building-specific retrofit prioritization and investment decision-making under real-world operating conditions.
1. Introduction
1.1. Background
Faced with the dual challenges of global warming and the ongoing energy transition, energy conservation and emission reduction in the building sector have become central to sustainable development. The building sector accounts for roughly 36% of global energy use and greenhouse gas emissions. Within this sector, public buildings, characterized by large floor areas, long operating hours, and complex building systems, offer substantial potential for energy retrofits. Systematically advancing energy retrofits in public buildings is therefore not only an effective means of alleviating energy and environmental pressures but also a key pathway for implementing China’s “dual-carbon” strategy and accelerating the green and low-carbon transformation of urban and rural construction [1]. These efforts carry significant practical and strategic value [2,3]. However, in actual engineering projects, scientifically evaluating the true effect and economic efficiency of energy-saving retrofits still faces significant challenges. The operation of buildings is affected by many factors such as climate conditions, user behavior, and system operation strategies, resulting in a high degree of uncertainty in energy-saving effects. Therefore, constructing an energy-saving retrofit evaluation method based on actual operating data is of great significance for improving the scientific nature of technology selection and the reliability of investment decisions.
1.2. Literature Review
To date, research on retrofit pathways and effectiveness evaluation for public buildings has still largely relied on simulation-based approaches. Building energy modeling (BEM) and urban building energy modeling (UBEM) are widely applied to quantify the energy-saving potential of retrofit technologies and measures [4,5,6,7]. Typical studies employ tools such as EnergyPlus and DeST to test alternative retrofit packages and compare multiple scenarios under specified assumptions regarding building geometry, envelope properties, system parameters, and operating conditions [8,9,10,11,12,13,14,15].
Simulation-based studies on energy retrofits for public buildings emerged earlier in Europe and North America. For example, Jradi et al. investigated an office building in Denmark and evaluated eight retrofit options using dynamic simulations [10]. By combining measures such as heating setpoint optimization, high-efficiency LED lighting, envelope insulation, and daylight controls, the annual energy use was reduced to 70.44 kWh/m2; with an additional 20 kWp photovoltaic system, it further decreased to 41.39 kWh/m2. William et al. conducted a systematic assessment of hospital retrofit options from the perspectives of energy, environmental, and economic performance, and compared the applicability as well as the advantages and limitations of alternative technical solutions [16].
In recent years, simulation-based studies on public-building energy retrofits in China have grown rapidly, with an emphasis on estimating energy-saving potential at the level of representative buildings or regional building stocks. Cao et al. compared four retrofit packages for an office building in Tianjin using energy simulations and systematically examined differences in energy savings and the robustness of alternative technology combinations [8]. Wang et al. investigated retrofit options for old residential buildings in Nanjing, considering measures such as envelope upgrades, HVAC efficiency improvements, and operational parameter adjustments [17]. Their simulations indicate a potential 18.52% reduction in overall energy use across five central districts, corresponding to an annual saving of approximately 260.43 GWh. Shi et al. simulated retrofit measures for a hospital ward in Shenzhen and reported that a combined strategy of green roofs and external wall insulation not only delivered favorable economic performance but also improved annual thermal comfort by 17.1% while achieving annual energy savings of 9.81% [18].
Such approaches are flexible for early-stage option screening and have become a mainstream pathway in retrofit research. Nevertheless, simulation outcomes are sensitive to model inputs, operational assumptions, and boundary-condition specifications, and therefore may not fully capture the complexity of real buildings under actual operating environments [19,20,21]. As a result, substantial gaps are often observed between simulated savings and realized post-retrofit performance, which can undermine the credibility of retrofit evaluation and the effectiveness of investment decisions [22,23,24].
By contrast, measurement-based retrofit evaluations can characterize energy performance under real climatic and operational conditions and are thus more directly relevant to practice [25,26,27]. However, most measurement-based studies remain case-specific, focusing on individual buildings, specific regions, or single building types [28,29,30]. At the single-building or small-sample level, several studies have quantified retrofit impacts using measured energy consumption before and after interventions. For example, Elzbieta et al. combined statistical datasets and field surveys and applied multilevel analysis to assess energy efficiency levels, retrofit barriers, and policy drivers for residential buildings in Poland [28]. Huo et al. examined a representative building case, proposed suitable optimization technologies, and provided practical recommendations for effective energy retrofits in existing residential buildings [29]. Martin et al. validated simulation results against measured pre- and post-retrofit energy use for a multi-story residential building in Sweden [30]. Faidra et al. identify systematic deviations between simulated predictions and realized energy savings based on measured data from residential buildings in the Netherlands [31]. While these studies provide valuable evidence of real-world retrofit performance, their conclusions are often constrained by limited sample sizes, which hinders generalization to broader building stocks.
At the regional scale or for specific building types, several studies have leveraged measured data to quantify retrofit outcomes and identify key determinants. Ainhoa et al. examined technical and social barriers to energy retrofits in district-heated buildings through case studies of two social-housing neighborhoods in Pamplona, Spain [26]. Liu et al. evaluated retrofit impacts associated with heat-exchange stations, secondary distribution networks, and building envelopes using measured space-heating energy consumption before and after renovation in a northern Chinese city [27]. Cao et al. developed a comprehensive evaluation scheme for retrofit performance in existing residential buildings based on measured heating-season data from Cold regions [32]. While these studies provide credible evidence for specific regions or building categories, their focus on a single climate zone or a narrow set of building types limits the ability to reveal how retrofit performance varies across climates and diverse building stocks.
In recent years, research on building energy conservation retrofitting has been gradually shifting towards an integrated, data-driven framework. Recent studies have explored methods for utilizing multi-source data and automated platforms to support the selection of retrofitting schemes and the optimization of implementation timing [33,34]. Meanwhile, the integration of digital twin technology with zero-energy building strategies is considered an important pathway to achieving sustainable and climate-resilient urban development [35]. These studies reflect a trend towards integrating data analysis, life-cycle cost assessment, and carbon reduction mechanisms into a unified analytical framework. However, despite significant methodological progress, measurement-based research remains limited by issues such as limited sample sizes, concentrated research subjects, and insufficient climate zone coverage. Moreover, systematic cross-comparisons of retrofit effectiveness across multiple climate zones and building types within a unified data framework are still scarce. Existing studies also tend to emphasize energy savings alone, with less attention to the joint effects of building type characteristics, climate responsiveness, and economic performance. This limitation reduces the practical value of current evidence for technology selection and investment decision-making in public-building retrofits.
1.3. Objectives and Contributions
To address these gaps, this paper compiles real-world operational data from more than 500 public-building energy retrofit projects in China, forming a dataset that spans multiple climate zones and building types. Using pre- and post-retrofit energy consumption comparisons, we conduct a systematic evaluation of retrofit effectiveness in public buildings. We further quantify differences in realized energy-saving performance across technologies from both climate zone and building type perspectives, and incorporate economic metrics to assess input–output efficiency.
The main innovations and contributions are as follows: through large-scale measured data analysis, this study overcomes the limitations of small-sample studies and conducts systematic cross-climate and cross-building-type comparisons within a unified framework, thereby enhancing the universality and reliability of the findings. Furthermore, a multi-dimensional comprehensive evaluation framework is established to examine the actual energy-saving performance and applicability of different retrofit measures from the dual perspectives of climate zone and building type, revealing their climate adaptability and building suitability. A four-quadrant economic analysis method is also proposed, which uses the median values of investment intensity and savings intensity to classify projects, enabling an intuitive judgment of input–output relationships and offering stronger comparability and applicability than traditional methods. Finally, the study identifies energy-saving optimization pathways and potential risks for different climate zones and building types, providing robust data support for technology selection and investment decision-making.
2. Methodology
2.1. Data Collection and Preparation
This study compiles an initial sample of more than 600 public-building energy retrofit projects from 11 provinces/municipalities/autonomous regions in China. Data were obtained primarily from the Ministry of Housing and Urban–Rural Development Public Building Energy Management Information System, which collects and stores project-level submissions from participating cities, including building attributes, pre-/post-retrofit energy-consumption records, implemented measures, and retrofit costs. The extracted building-level attributes include building type, renovated floor area (m2), energy use intensity (EUI), pre-/post-retrofit observation windows, implemented retrofit measures, and retrofit investment cost (CNY).
Data preparation consists of three steps: project screening, energy data harmonization, and defining pre- and post-retrofit periods. Specifically, the observation windows were defined as 12 consecutive months of operational data immediately preceding the start of construction and 12 consecutive months following project acceptance, respectively, to ensure that a complete seasonal cycle is captured and to neutralize the influence of seasonal fluctuations. Projects with missing energy records or without completion within the statistical window were excluded. To improve data quality, we further removed outliers and implausible observations with extreme or physically unreasonable energy-saving intensity (energy savings per unit area). Energy consumption in the information system is reported in terms of physical energy use and comprehensive energy consumption. To ensure consistent units across projects and energy carriers, all energy forms were converted into a kWh-equivalent (kWh-eq) using the conversion factors specified in the General Rules for Calculating Comprehensive Energy Consumption (GB/T 2589–2020) [36]. After screening and harmonization, 530 projects with both pre- and post-retrofit energy records were retained; among them, 296 projects provided measure-level information with explicitly reported savings by retrofit measure. All analyses were conducted using annualized indicators (e.g., annual EUI and annual energy savings) to mitigate biases caused by unequal observation-window lengths across projects. Notably, this study focuses on realized performance associated with implemented retrofit measures in real operation, rather than estimating the intrinsic performance of individual technologies under controlled conditions.
2.2. Indicator Definitions and Calculations
To quantify energy performance and cost-effectiveness of public-building energy retrofits, four core indicators were used: energy use intensity (EUI), energy savings intensity (annual savings per unit area), investment intensity (investment per unit area), and cost per unit of energy saved.
Energy use intensity (EUI) is a fundamental metric describing building energy consumption, defined as the ratio of annual energy use to floor area. Changes in EUI from the pre- to post-retrofit period reflect the improvement in energy efficiency.
where is the building’s annual total energy use converted into kWh-equivalent (kWh-eq), and is the floor area used for normalization (m2). In this study, refers to the renovated floor area reported for each project.
Energy savings intensity. To control for differences in building size, annual energy savings were normalized by floor area:
where is annual energy savings per unit area ([kWh/(m2·a)); and are the annual energy use in the pre-retrofit (baseline) and post-retrofit periods, respectively (kWh-eq); and is the annual energy savings (kWh-eq).
Investment intensity. Investment intensity characterizes the capital input of retrofits and is defined as:
where I is the total retrofit investment (CNY) and is the investment per unit area (CNY/m2). This indicator facilitates comparisons of cost levels across building types and retrofit packages.
Cost per unit of energy saved. The cost per unit of energy saved reflects the investment required to save one unit of annual energy and serves as a simple input–output indicator:
where is expressed in CNY/kWh. Lower values indicate higher cost-effectiveness of the implemented measures.
To explore the determinants of public-building energy retrofit outcomes, the project samples were classified along three dimensions: climate zone, building function, and retrofit measure category.
Following China’s climate zoning scheme, projects were grouped into three representative climate zones: the Cold Zone, the Hot Summer–Cold Winter (HSCW) Zone, and the Hot Summer–Warm Winter (HSWW) Zone. In this dataset, projects located in Beijing, Tianjin, Shandong, Shanxi were categorized as the Cold Zone; those in the Yangtze River Basin (e.g., Zhejiang, Anhui, Jiangsu, Shanghai, and Chongqing) were categorized as the HSCW Zone; and those in southern coastal provinces such as Guangdong and Fujian were categorized as the HSWW Zone.
Building-type classification follows the Standard for Energy Consumption of Civil Buildings (GB/T 51161–2016) [37]. The 530 valid samples were grouped into six representative public-building categories according to their primary use: office, education, healthcare, commercial, hotel, and cultural buildings. These categories correspond to typical public-building uses, including government and enterprise offices, teaching and research buildings, hospital outpatient/clinical buildings, commercial and retail facilities, accommodation and catering facilities, and public cultural-service buildings.
Retrofit measure categories. Retrofit measures reported in the project documents were grouped into seven categories: (i) Lighting upgrades, including replacement with high-efficacy lamps/fixtures, optimization of distribution and control circuits, and deployment of intelligent lighting controls; (ii) HVAC system upgrades, focusing on improvements to chillers and air-/water-side distribution systems to enhance heat/cold delivery efficiency and overall system COP; (iii) Energy monitoring and management systems, including sub-metering and energy management platforms for real-time monitoring and control; (iv) Hot water and heating systems, such as boiler and DHW system upgrades and the installation of intelligent temperature controls; (v) Renewable energy integration, including solar PV, solar water-heating, and ground-source heat pump applications; (vi) Envelope retrofits, targeting thermal performance improvements of walls, roofs, doors, and windows; and (vii) Other measures, including efficiency upgrades of building-specific equipment where applicable.
2.3. Statistical Analysis
To evaluate the significance of energy-saving performance and intergroup differences across the 530-building sample, this study performs a rigorous assessment of the statistical properties and quality of the data to ensure the scientific validity of subsequent analyses. A normality test using the Shapiro–Wilk test was first performed on the pre- and post-retrofit energy use intensity (EUI) and the resulting energy savings. The W statistic for normality is defined as:
where are the ordered sample observations and are weights based on the means and variances of the order statistics. The results significantly reject the null hypothesis of normal distribution (p < 0.001), confirming a characteristic long-tail distribution and justifying the use of non-parametric methods.
Consequently, the Wilcoxon signed-rank test was utilized to compare the annualized EUI before and after retrofitting to verify the effectiveness of the interventions. The Z statistic is calculated as:
where and represent the EUI before and after retrofitting, respectively, and denotes the rank of the absolute difference. Test results demonstrate that the effectiveness of energy retrofits is highly significant across the full sample (Z = 19.79, p < 0.001).
Furthermore, to investigate variation patterns across building types and climate zones, the Kruskal–Wallis H test was performed, defined as:
where N is the total sample size, k is the number of groups, and is the sum of ranks for the group.
The analysis shows highly significant differences across building types (= 87.71, p < 0.0001) and climate zones ( = 10.22, p = 0.006), validating that retrofit outcomes are strongly constrained by regional climatic conditions and functional attributes. For variables exhibiting significant differences, Dunn’s test was applied as a post hoc procedure to identify specific pairs with statistically distinct potentials. All tests were two-tailed with the significance level () set at 0.05. In summary, the measured data employed in this study are statistically robust and valid, providing a reliable foundation for subsequent analysis.
3. Results and Discussion
3.1. Comparison of Pre- and Post-Retrofit Energy Use Intensity
This section summarizes the statistical characteristics of energy use for the 530 selected public buildings with pre- and post-retrofit records. We first compare energy use intensity (EUI) across building types.
To ensure statistical rigor given the inherent high dispersion of real-world operational data, the Shapiro–Wilk test was first employed to assess the normality of energy use intensity (EUI) and energy savings. The results significantly reject the null hypothesis of a normal distribution (p < 0.0001), confirming a typical long-tail distribution. Consequently, non-parametric tests were adopted to provide robust evidence for retrofit effectiveness and heterogeneity.
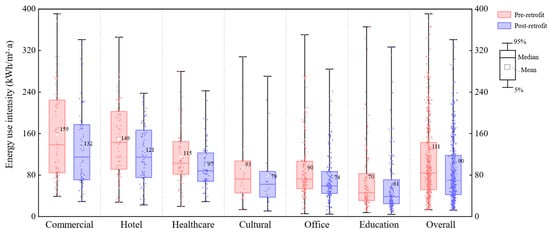
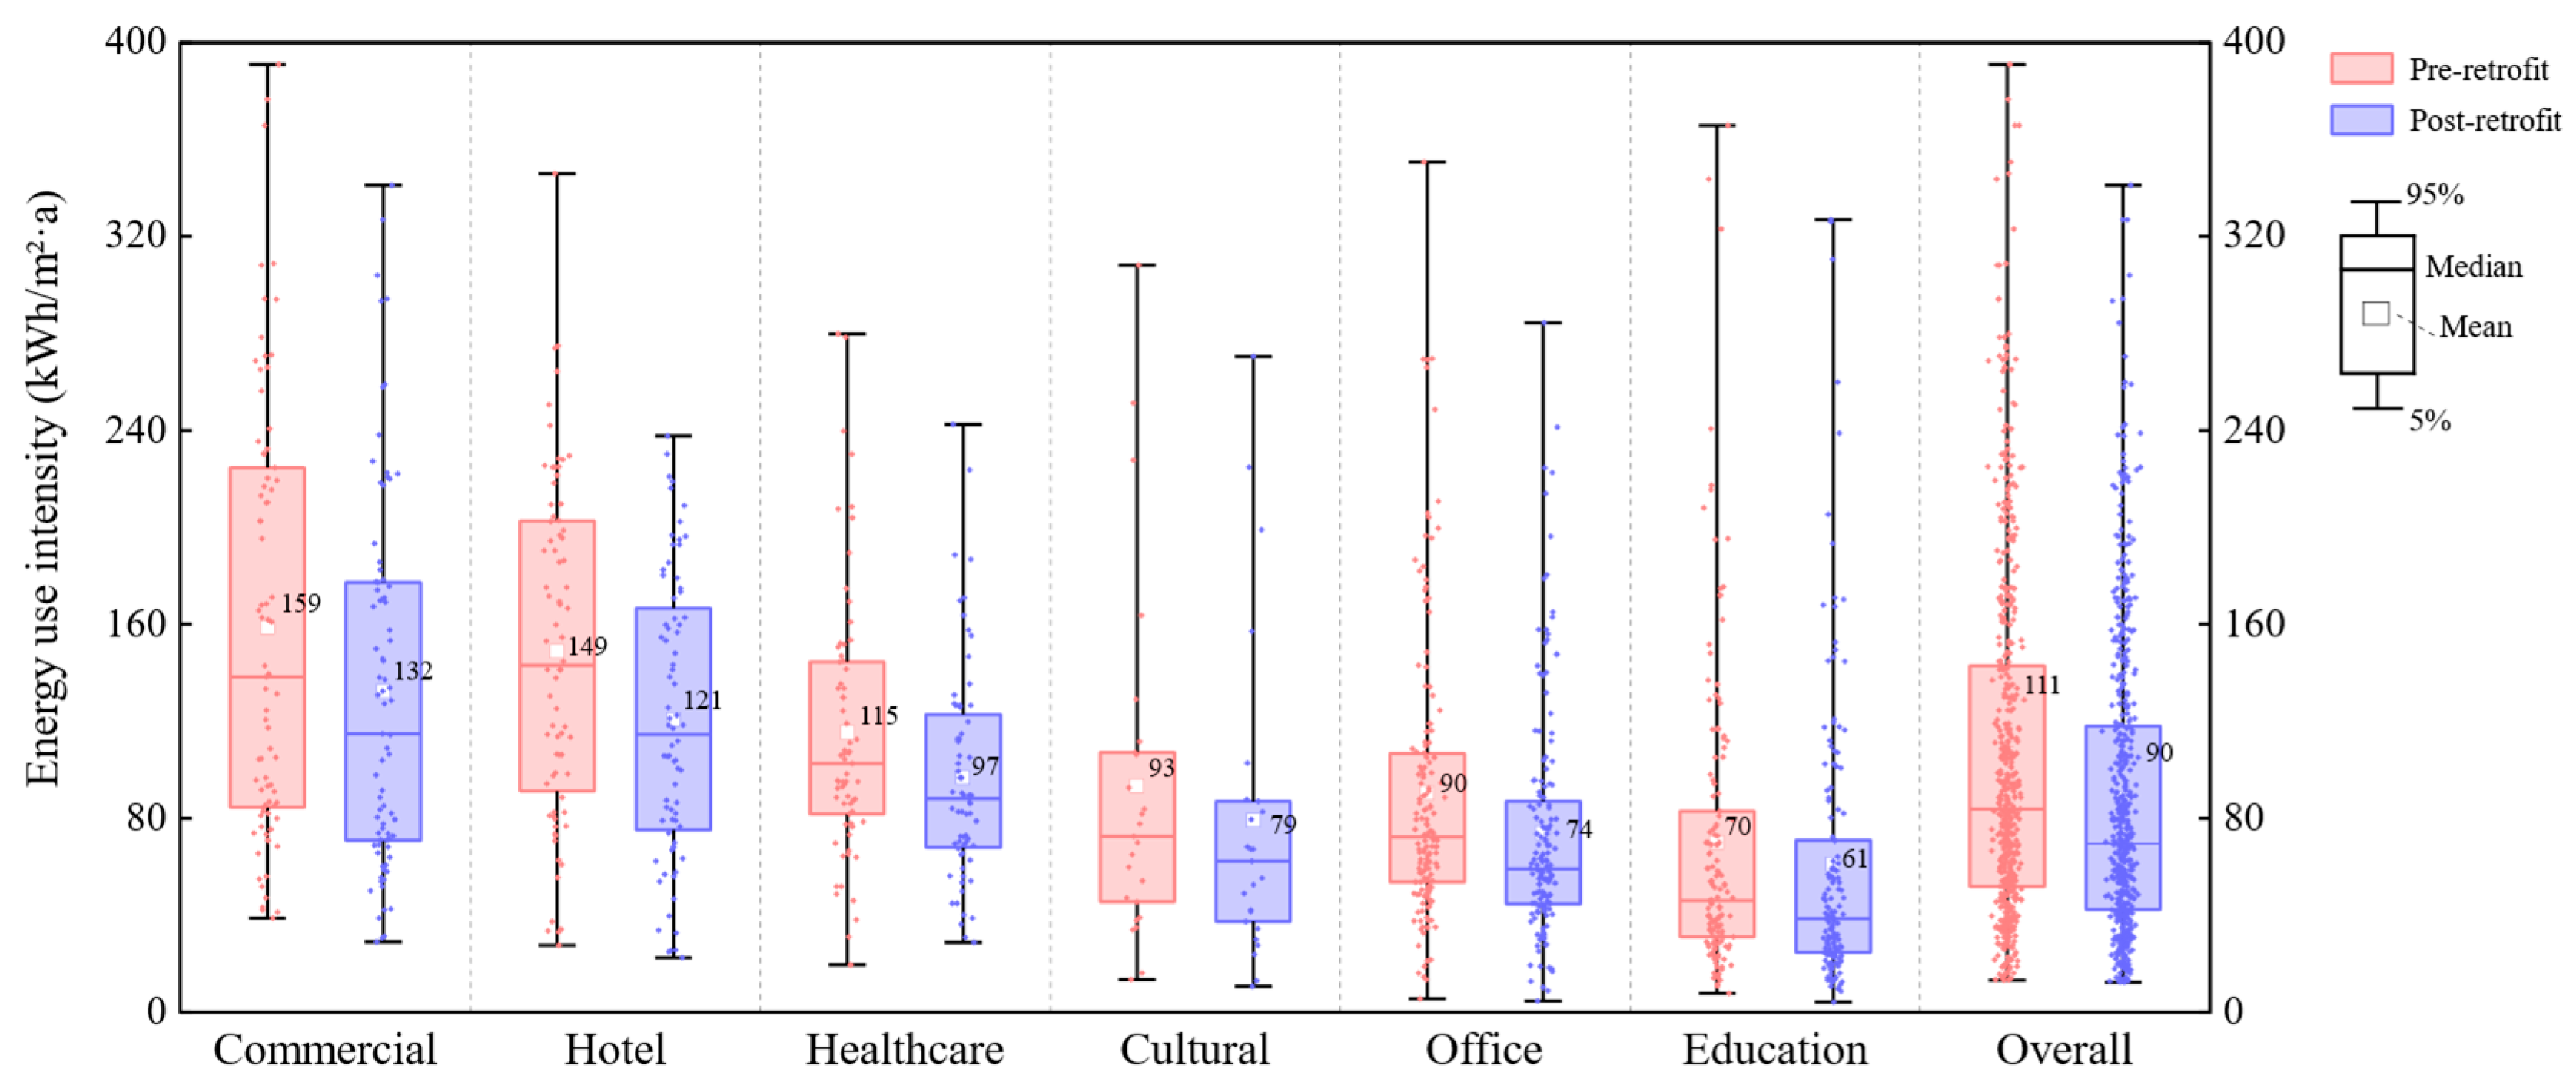
As shown in Figure 1, baseline EUI differs markedly by building type, following the general order: commercial > hotels > healthcare buildings > cultural buildings > office buildings > education buildings. Kruskal–Wallis H tests confirm that these differences in saving potential across building types are highly significant (H = 87.71, p < 0.0001). Commercial and hotels exhibit the highest baseline EUI, averaging 159 and 149 kWh/(m2·a), respectively. After retrofits, their mean EUI decreased to 132 and 121 kWh/(m2·a), corresponding to area-normalized savings of 26.5 and 28.0 kWh/(m2·a). These are the largest average savings intensities among the six building categories, suggesting that buildings with higher baseline energy use tend to achieve larger absolute reductions on an area-normalized basis. By comparison, healthcare, cultural, office, and education buildings show lower baseline EUI and smaller savings intensities, with mean post-retrofit savings of 18.41, 14.28, 16.49, and 9.05 kWh/(m2·a), respectively. Data show that buildings with higher baseline energy use tend to achieve larger absolute reductions. Post hoc tests, shown in Table 1, further verify that the savings for commercial and hotel buildings are significantly higher than those for education and office buildings.
Figure 1.
Energy use intensity (EUI) before and after retrofits by building type.
Table 1.
Post hoc (Dunn’s Test) pairwise comparison results.
Although education buildings generally exhibit a narrower EUI distribution, a small number of cases still fall in the upper tail. A closer examination of these high-quantile cases indicates that they are associated with medical university facilities whose functional mix and operating profiles differ substantially from conventional teaching buildings. Medical university facilities often include laboratory and research spaces, affiliated teaching hospitals, and advanced experimental platforms. These spaces are typically equipment-intensive, operate for extended hours, and require stricter indoor environmental control, leading to substantially higher EUI than that of general education buildings.
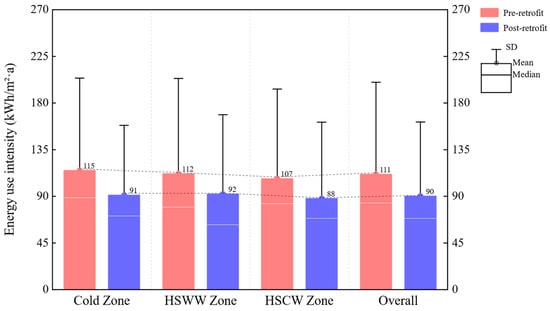
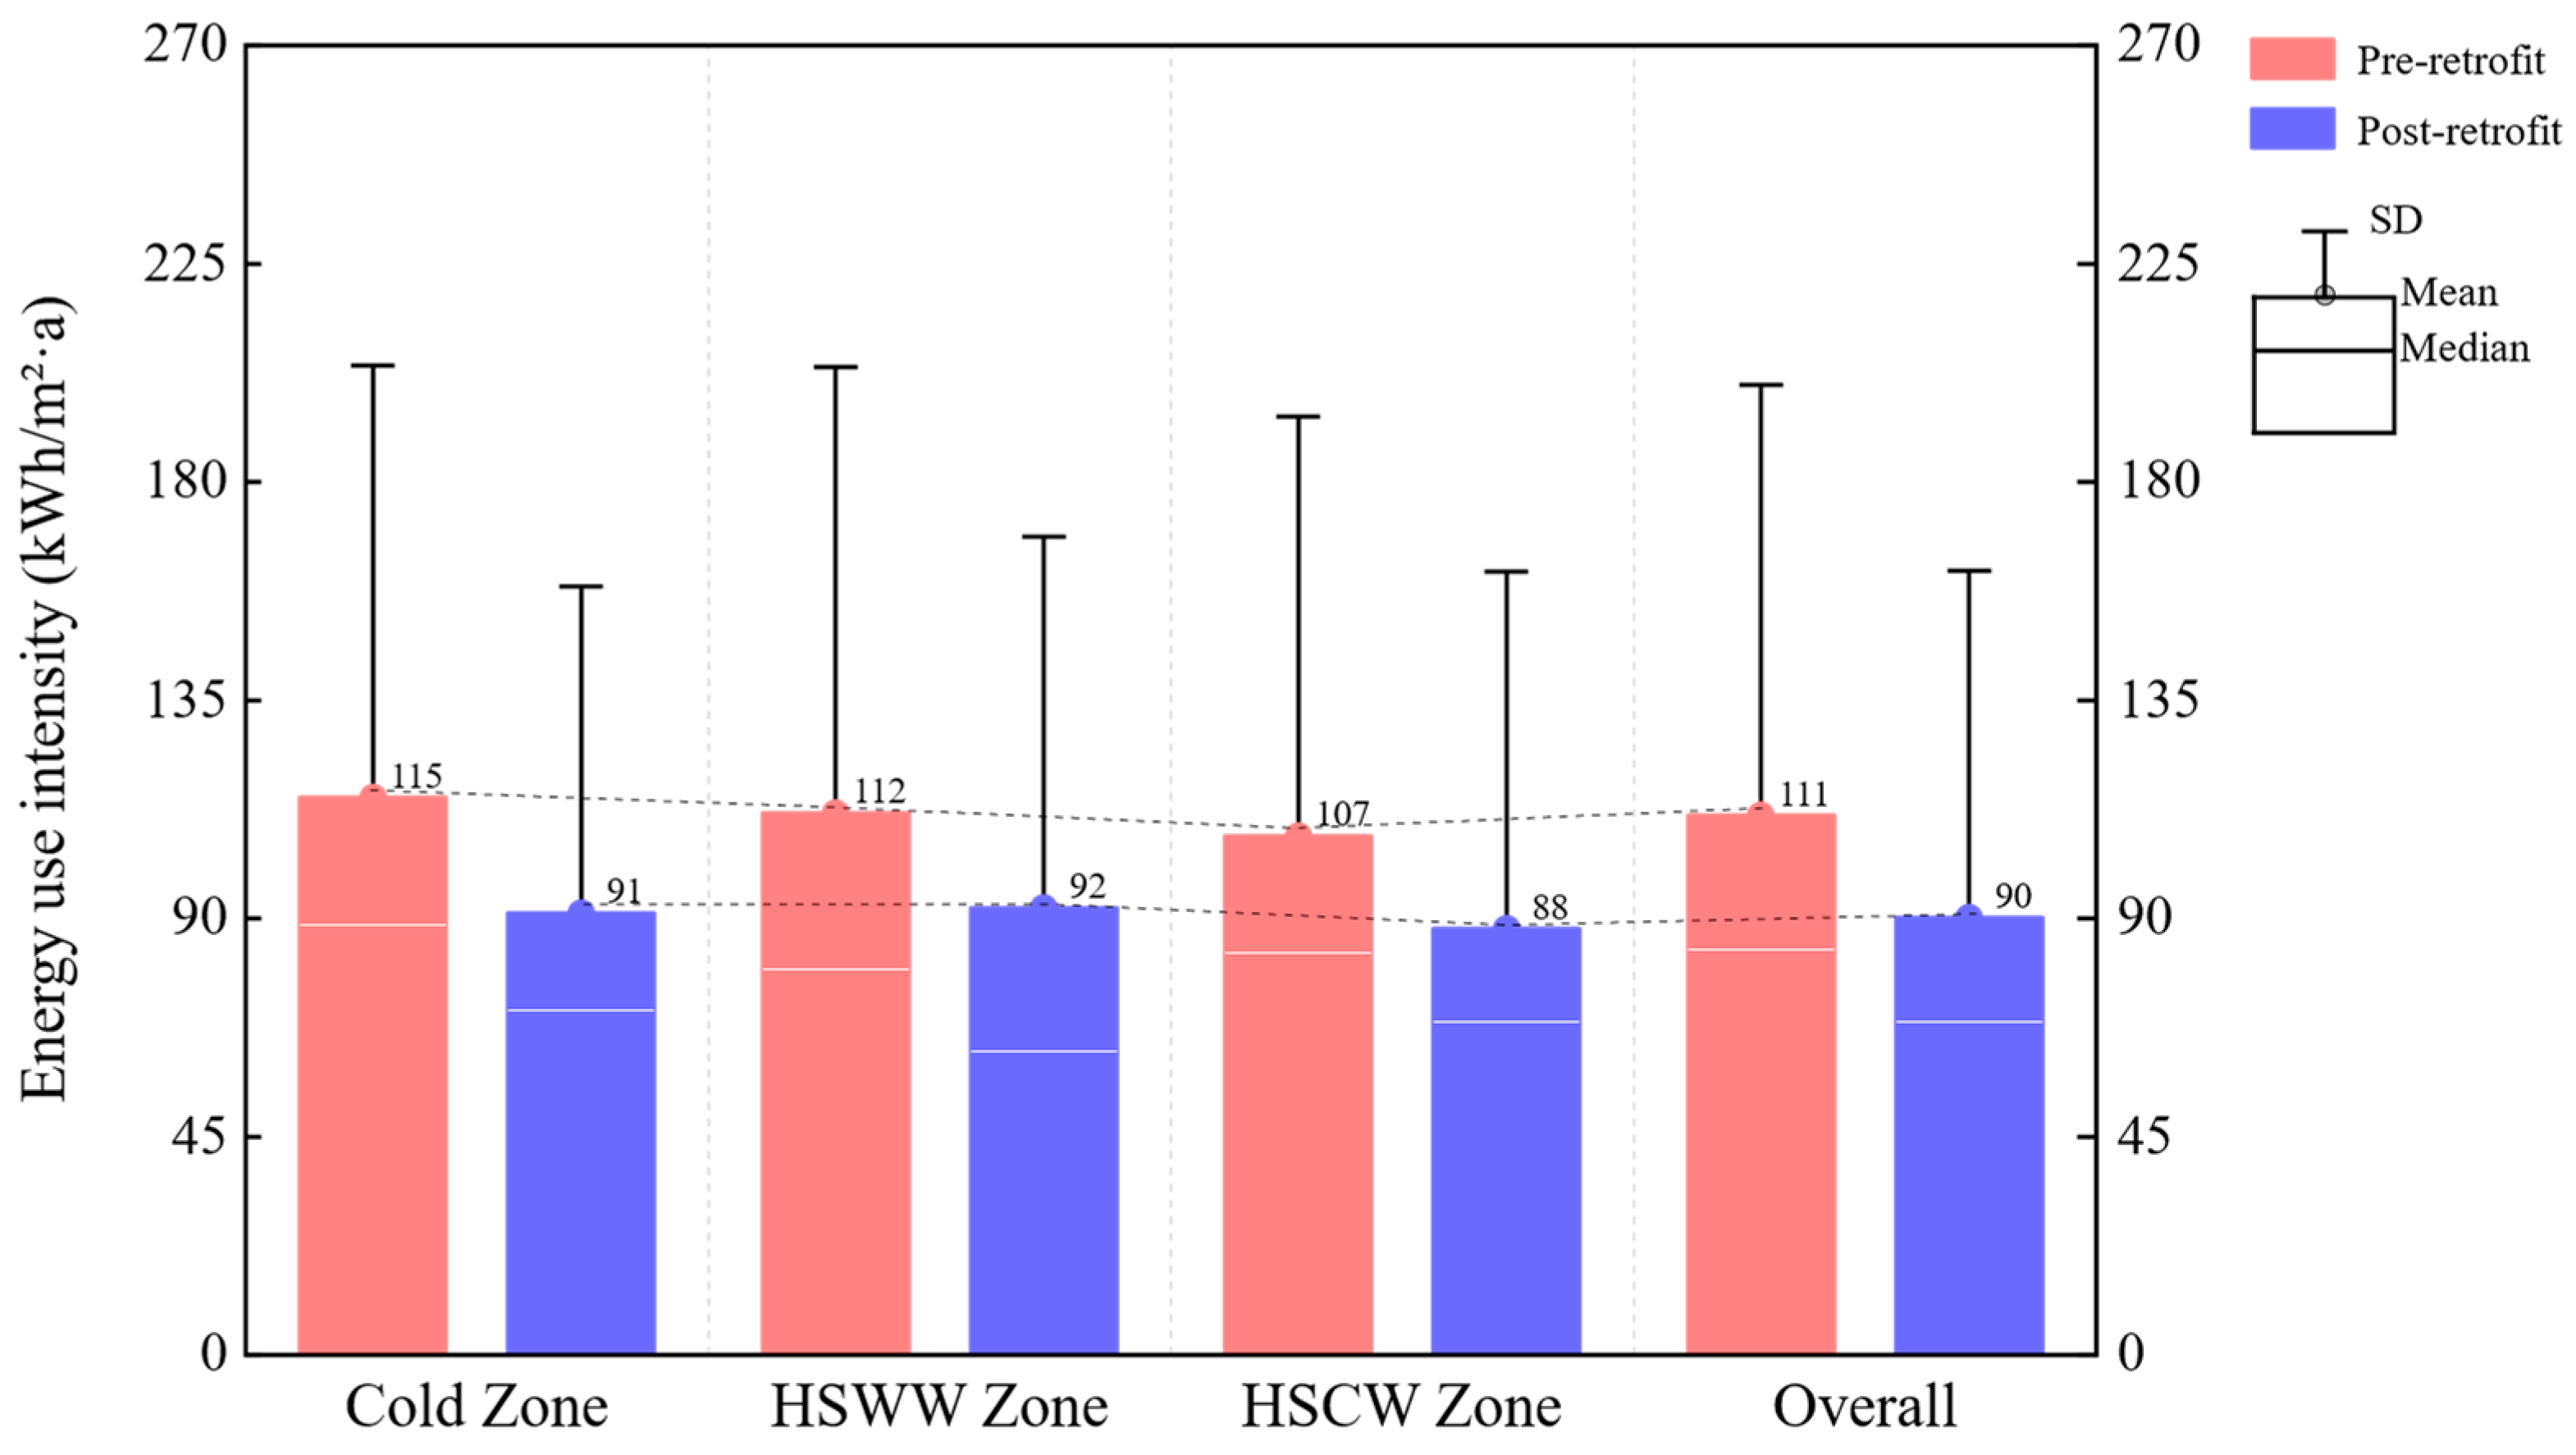
Figure 2 compares EUI before and after retrofits across the three climate zones. Overall, public buildings exhibit lower EUI after the retrofit interventions. For the full sample, mean EUI decreased from 111.28 ± 88.61 to 90.09 ± 71.53 kWh/(m2·a), corresponding to a 19.03% reduction in the mean value. As detailed in Table S1, the Wilcoxon signed-rank test shows that energy consumption significantly decreased across 526 buildings (99.2% of the sample), demonstrating a highly significant statistical effect (Z = 19.79, p < 0.001). The post-retrofit decrease in dispersion (as reflected by the smaller standard deviation) suggests reduced variability in energy use among buildings alongside the overall reduction in EUI.
Figure 2.
Energy use intensity (EUI) before and after retrofits across climate zones. (The dotted line represents the trend of average (Mean) and median (Median) EUI within the three climate zones).
Figure 2 compares EUI across the three climate zones, where Kruskal–Wallis H tests also reveal significant differences (H = 10.22, p = 0.006). The data reveals a “North–South high, central low” trend in saving potential. Climate zone stratification further reveals differences in baseline EUI. Before retrofits, the Cold Zone showed the highest mean EUI (114.91 ± 88.93 kWh/(m2·a)), followed by the Hot Summer–Warm Winter (HSWW) Zone (111.71 ± 91.52 kWh/(m2·a)) and the Hot Summer–Cold Winter (HSCW) Zone (106.93 ± 87.81 kWh/(m2·a)). After retrofits, mean EUI declined in all three zones, to 91.09 ± 67.16 (Cold), 92.09 ± 76.21 (HSWW), and 87.81 ± 73.45 kWh/(m2·a) (HSCW). These changes correspond to mean EUI reductions of approximately 20.8% (Cold), 17.8% (HSWW), and 17.8% (HSCW). Overall, consistent post-retrofit reductions were observed across climate zones, with the largest relative decrease occurring in the Cold Zone. Post hoc analysis, shown in Table 1, shows a significant difference between the Cold Zone and the HSCW Zone (p = 0.005), validating the advantage of retrofitting high heating loads. However, no significant difference was observed between the Cold Zone and the HSWW Zone (p = 0.228), proving that high-efficiency cooling and hot water systems in the south also yield substantial saving potential. Furthermore, given the high dispersion of the empirical data, this study calculates the 95% confidence intervals for the means. The results (Table S2) show that the 95% confidence intervals do not overlap significantly, further confirming the statistical robustness of the above inter-group comparison conclusions.
3.2. Adoption Patterns and Combined Effects of Retrofit Measures
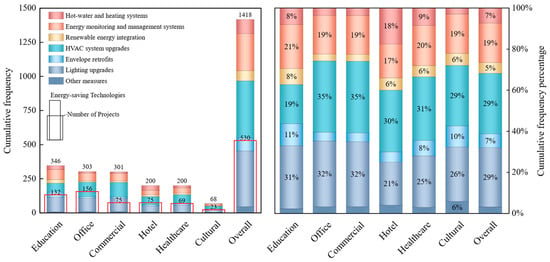
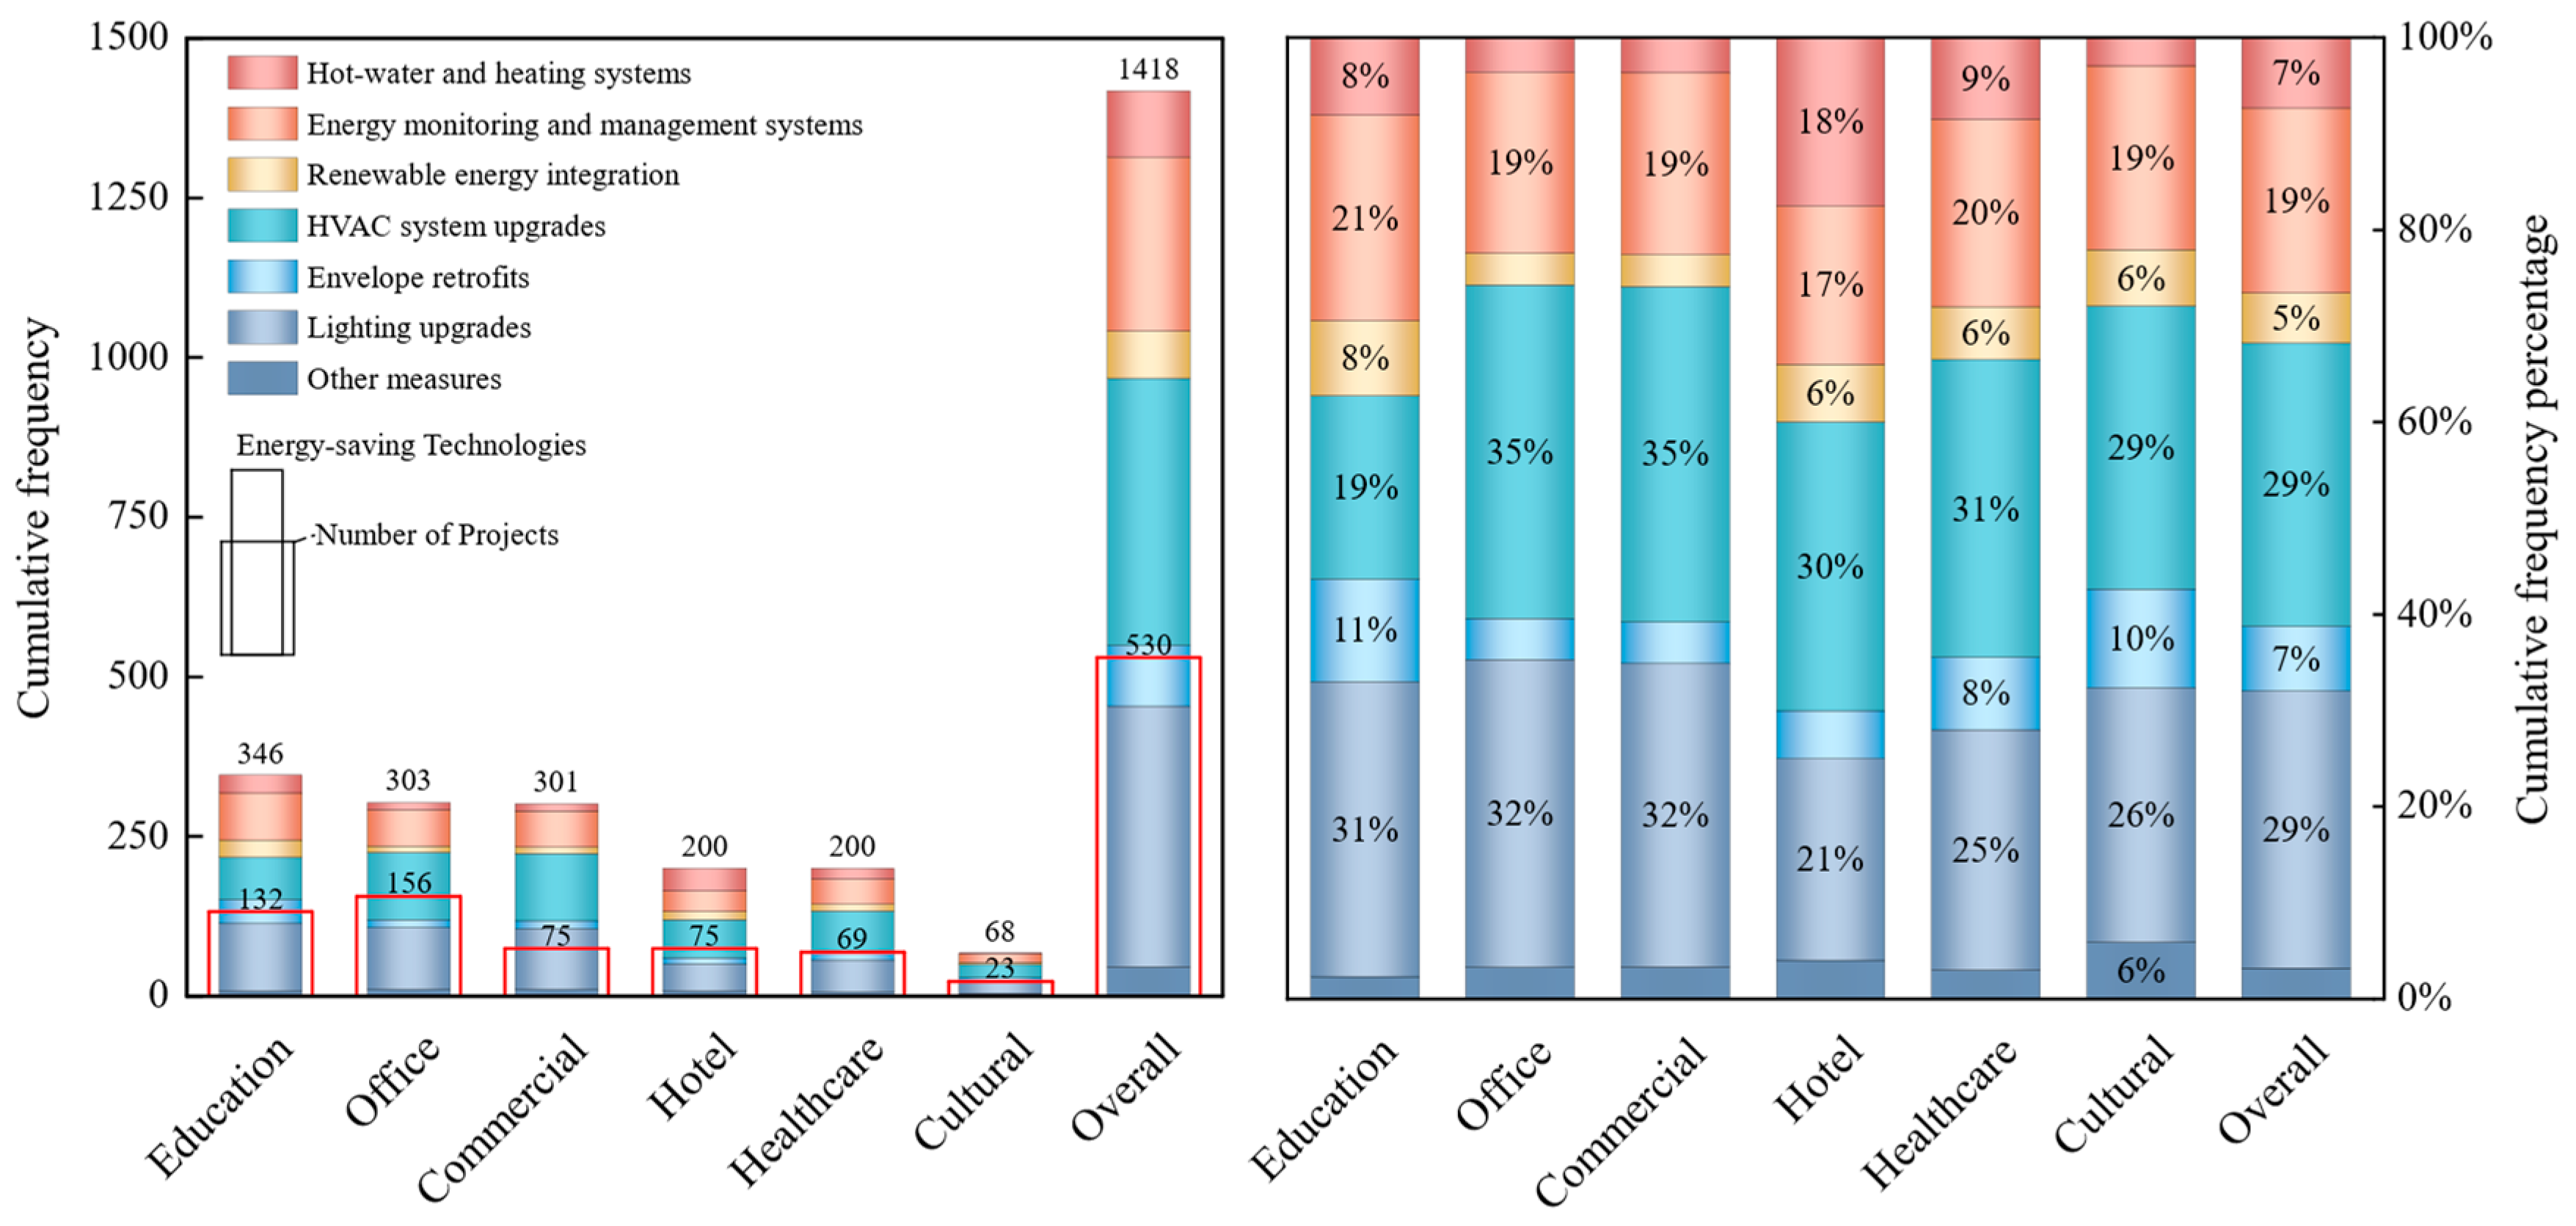
Figure 3 summarizes the adoption of retrofit measures across building types and indicates broadly similar technology portfolios among different categories of public buildings. Lighting upgrades and HVAC system upgrades are the most commonly deployed measures and represent the largest shares across all building types, with a combined proportion typically ranging from 55% to 65%. The adoption rate of energy monitoring and management systems (e.g., sub-metering and platform deployment) is relatively stable, generally between 15% and 25%. By contrast, domestic hot water and heating upgrades, envelope retrofits, renewable energy integration, and other measures are applied less frequently—often accounting for <10% in most building types—suggesting that they are primarily used as supplementary options tailored to specific building conditions.
Figure 3.
Adoption rates of retrofit measure categories across building types.
From the perspective of measure counts versus project counts, the total number of implemented measures is approximately three times the number of projects for each building type. This reflects the fact that a typical project packages multiple measures, with most projects adopting around 2–3 retrofit measures. For example, hotel projects commonly implement portfolios such as “HVAC upgrade + lighting upgrade + HW & Heating” or “HVAC system upgrade + lighting upgrade + energy monitoring and management systems”. These patterns highlight a core–auxiliary implementation logic, where one or two dominant measures form the backbone of the retrofit package and additional measures are selected to complement building-specific needs.
To formally bridge the numerical differences between the total sample (N = 530) and the technology subsample (N = 296), this study conducts a quantitative balance test. Statistical results (Table S3) show that the subsample maintained a very high degree of consistency with the total sample in terms of “building type” composition ( = 1.55, p = 0.9074), thus quantitatively confirming the representativeness of the technology attribution analysis in the functional dimension. Therefore, this study defines the measured values of N = 530 as the performance benchmark, and the decomposed data of N = 296 as the technology path attribution reference.
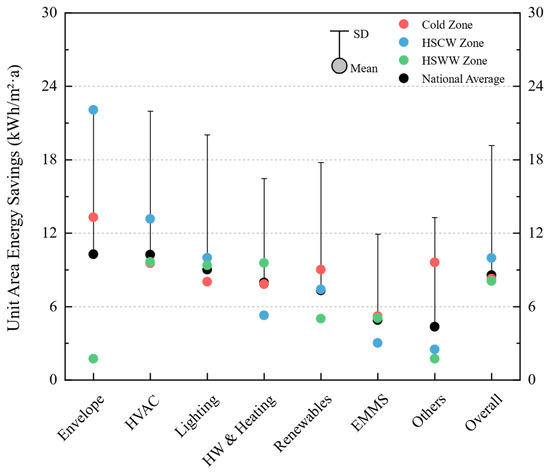
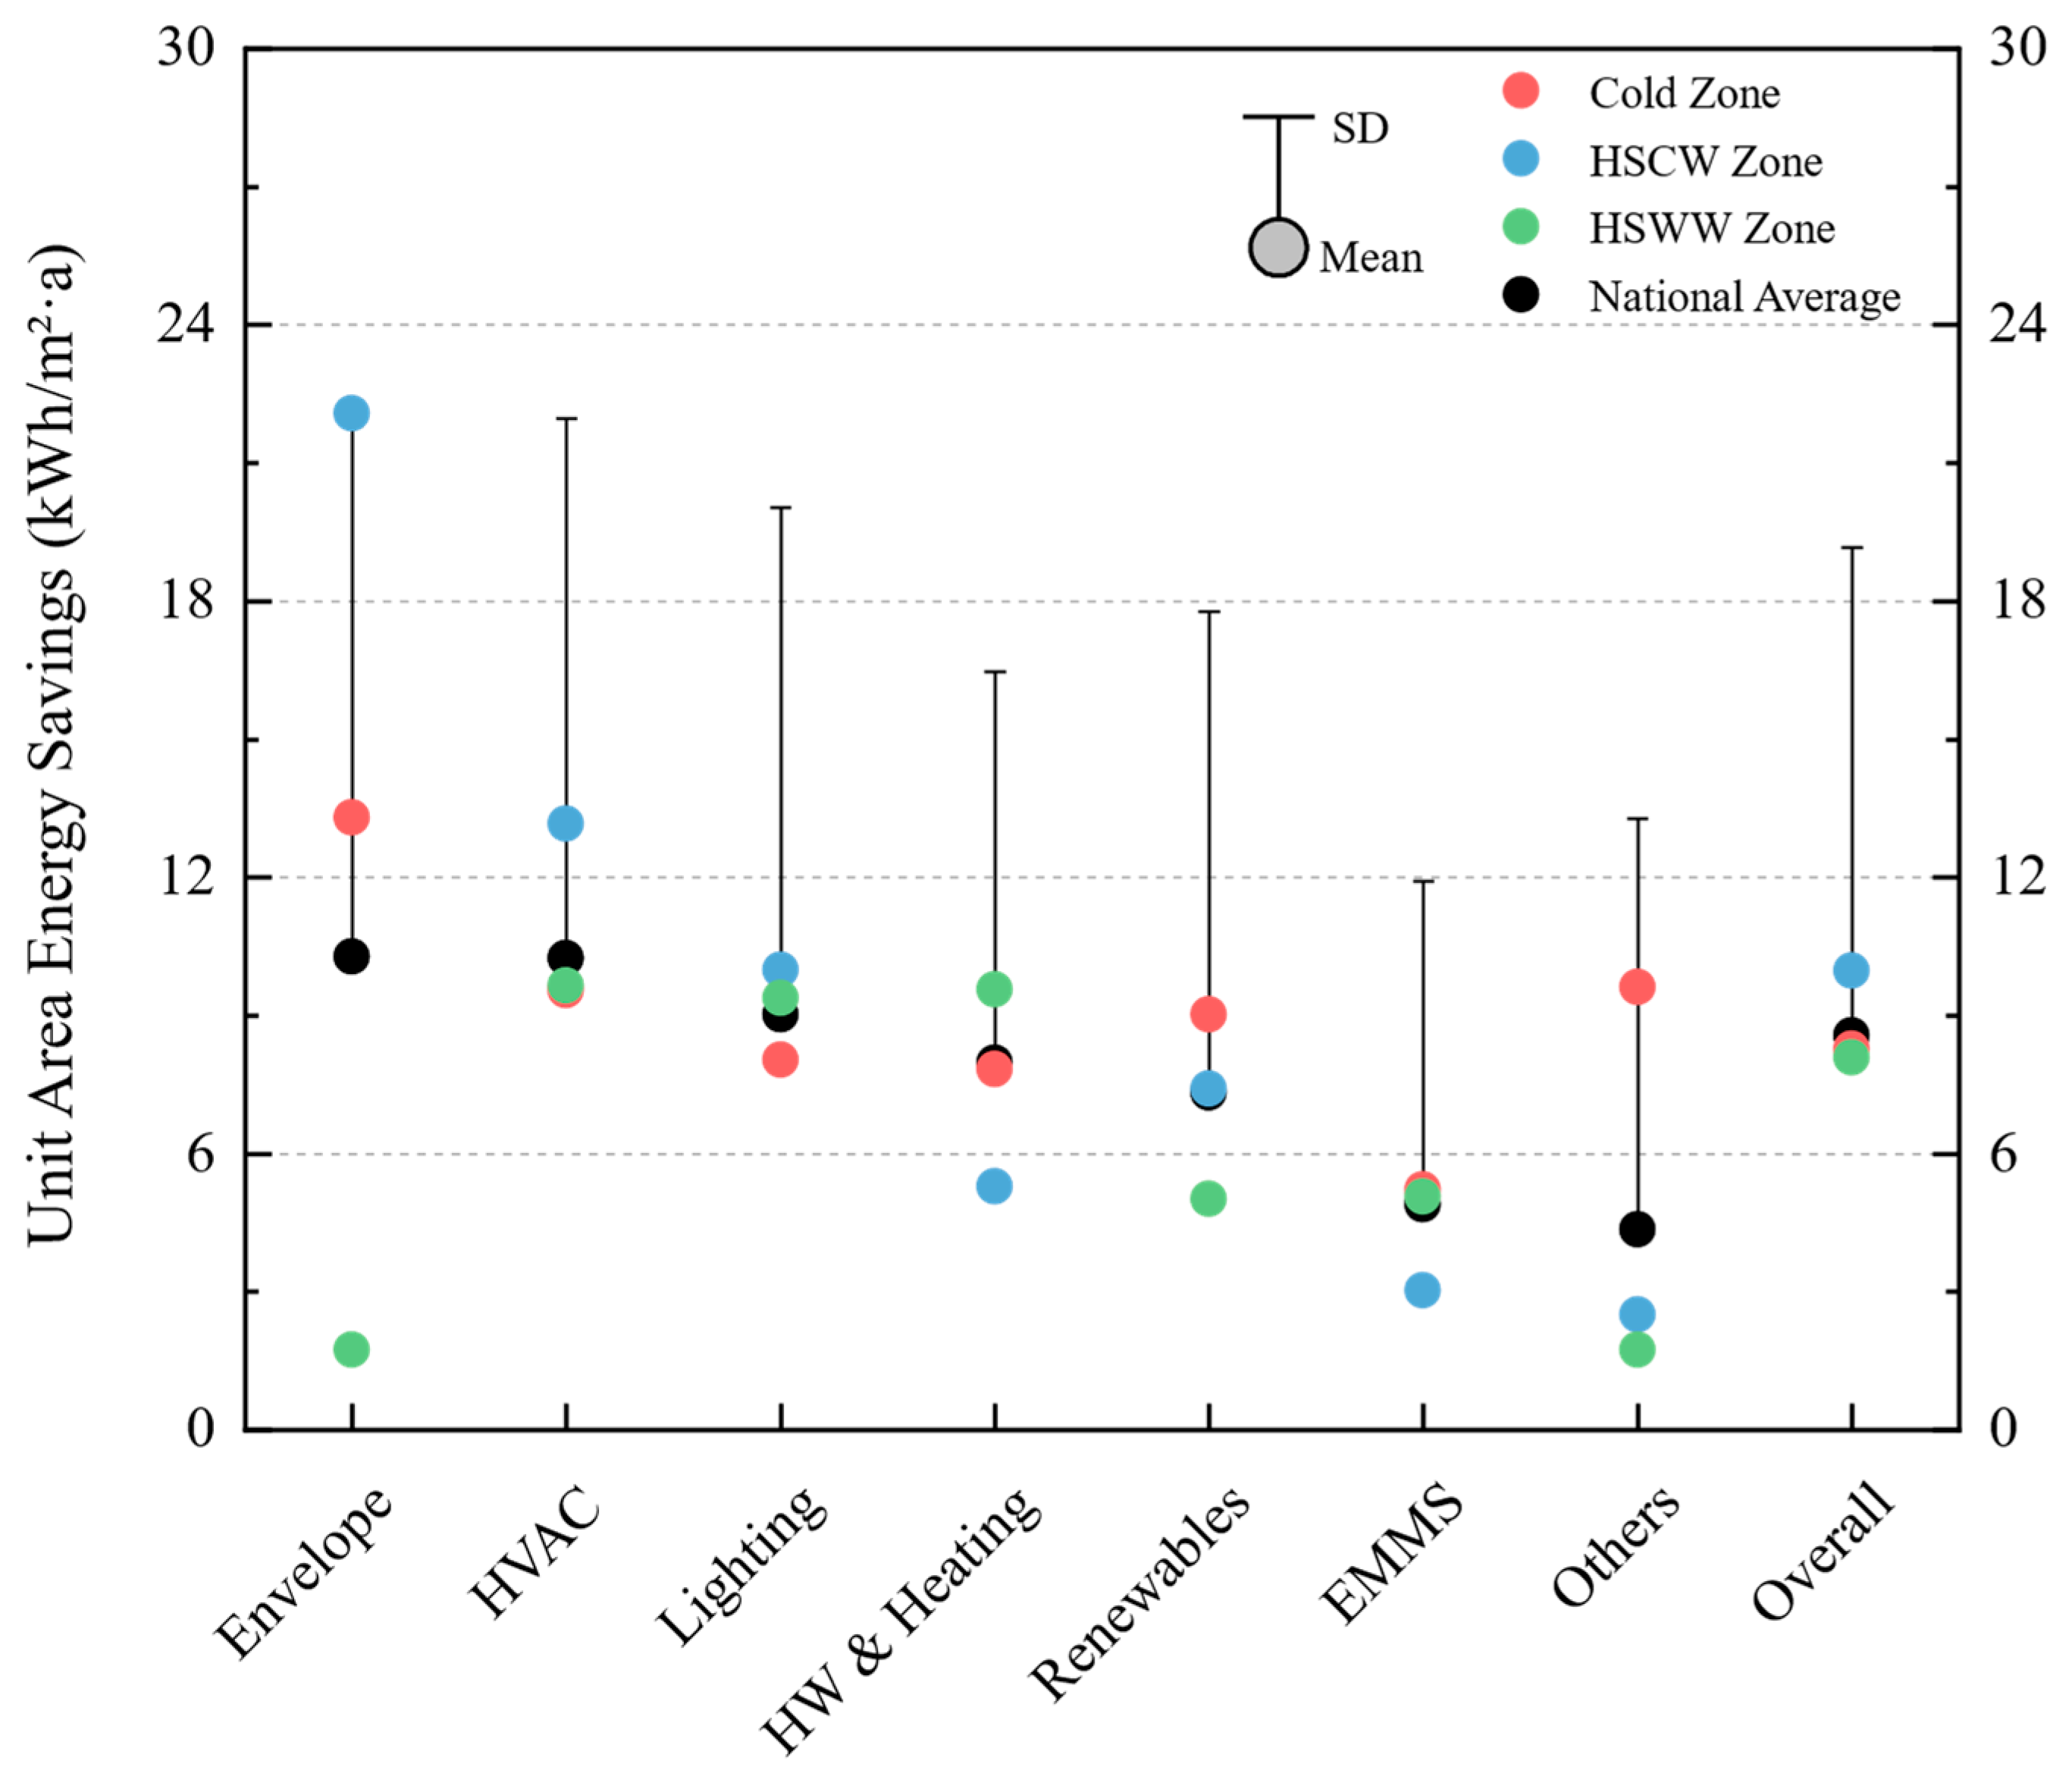
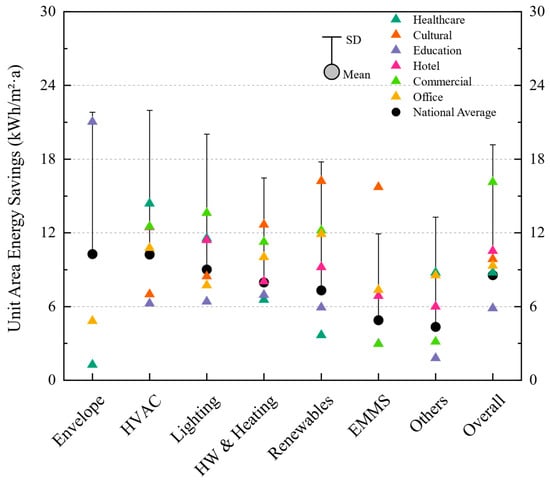
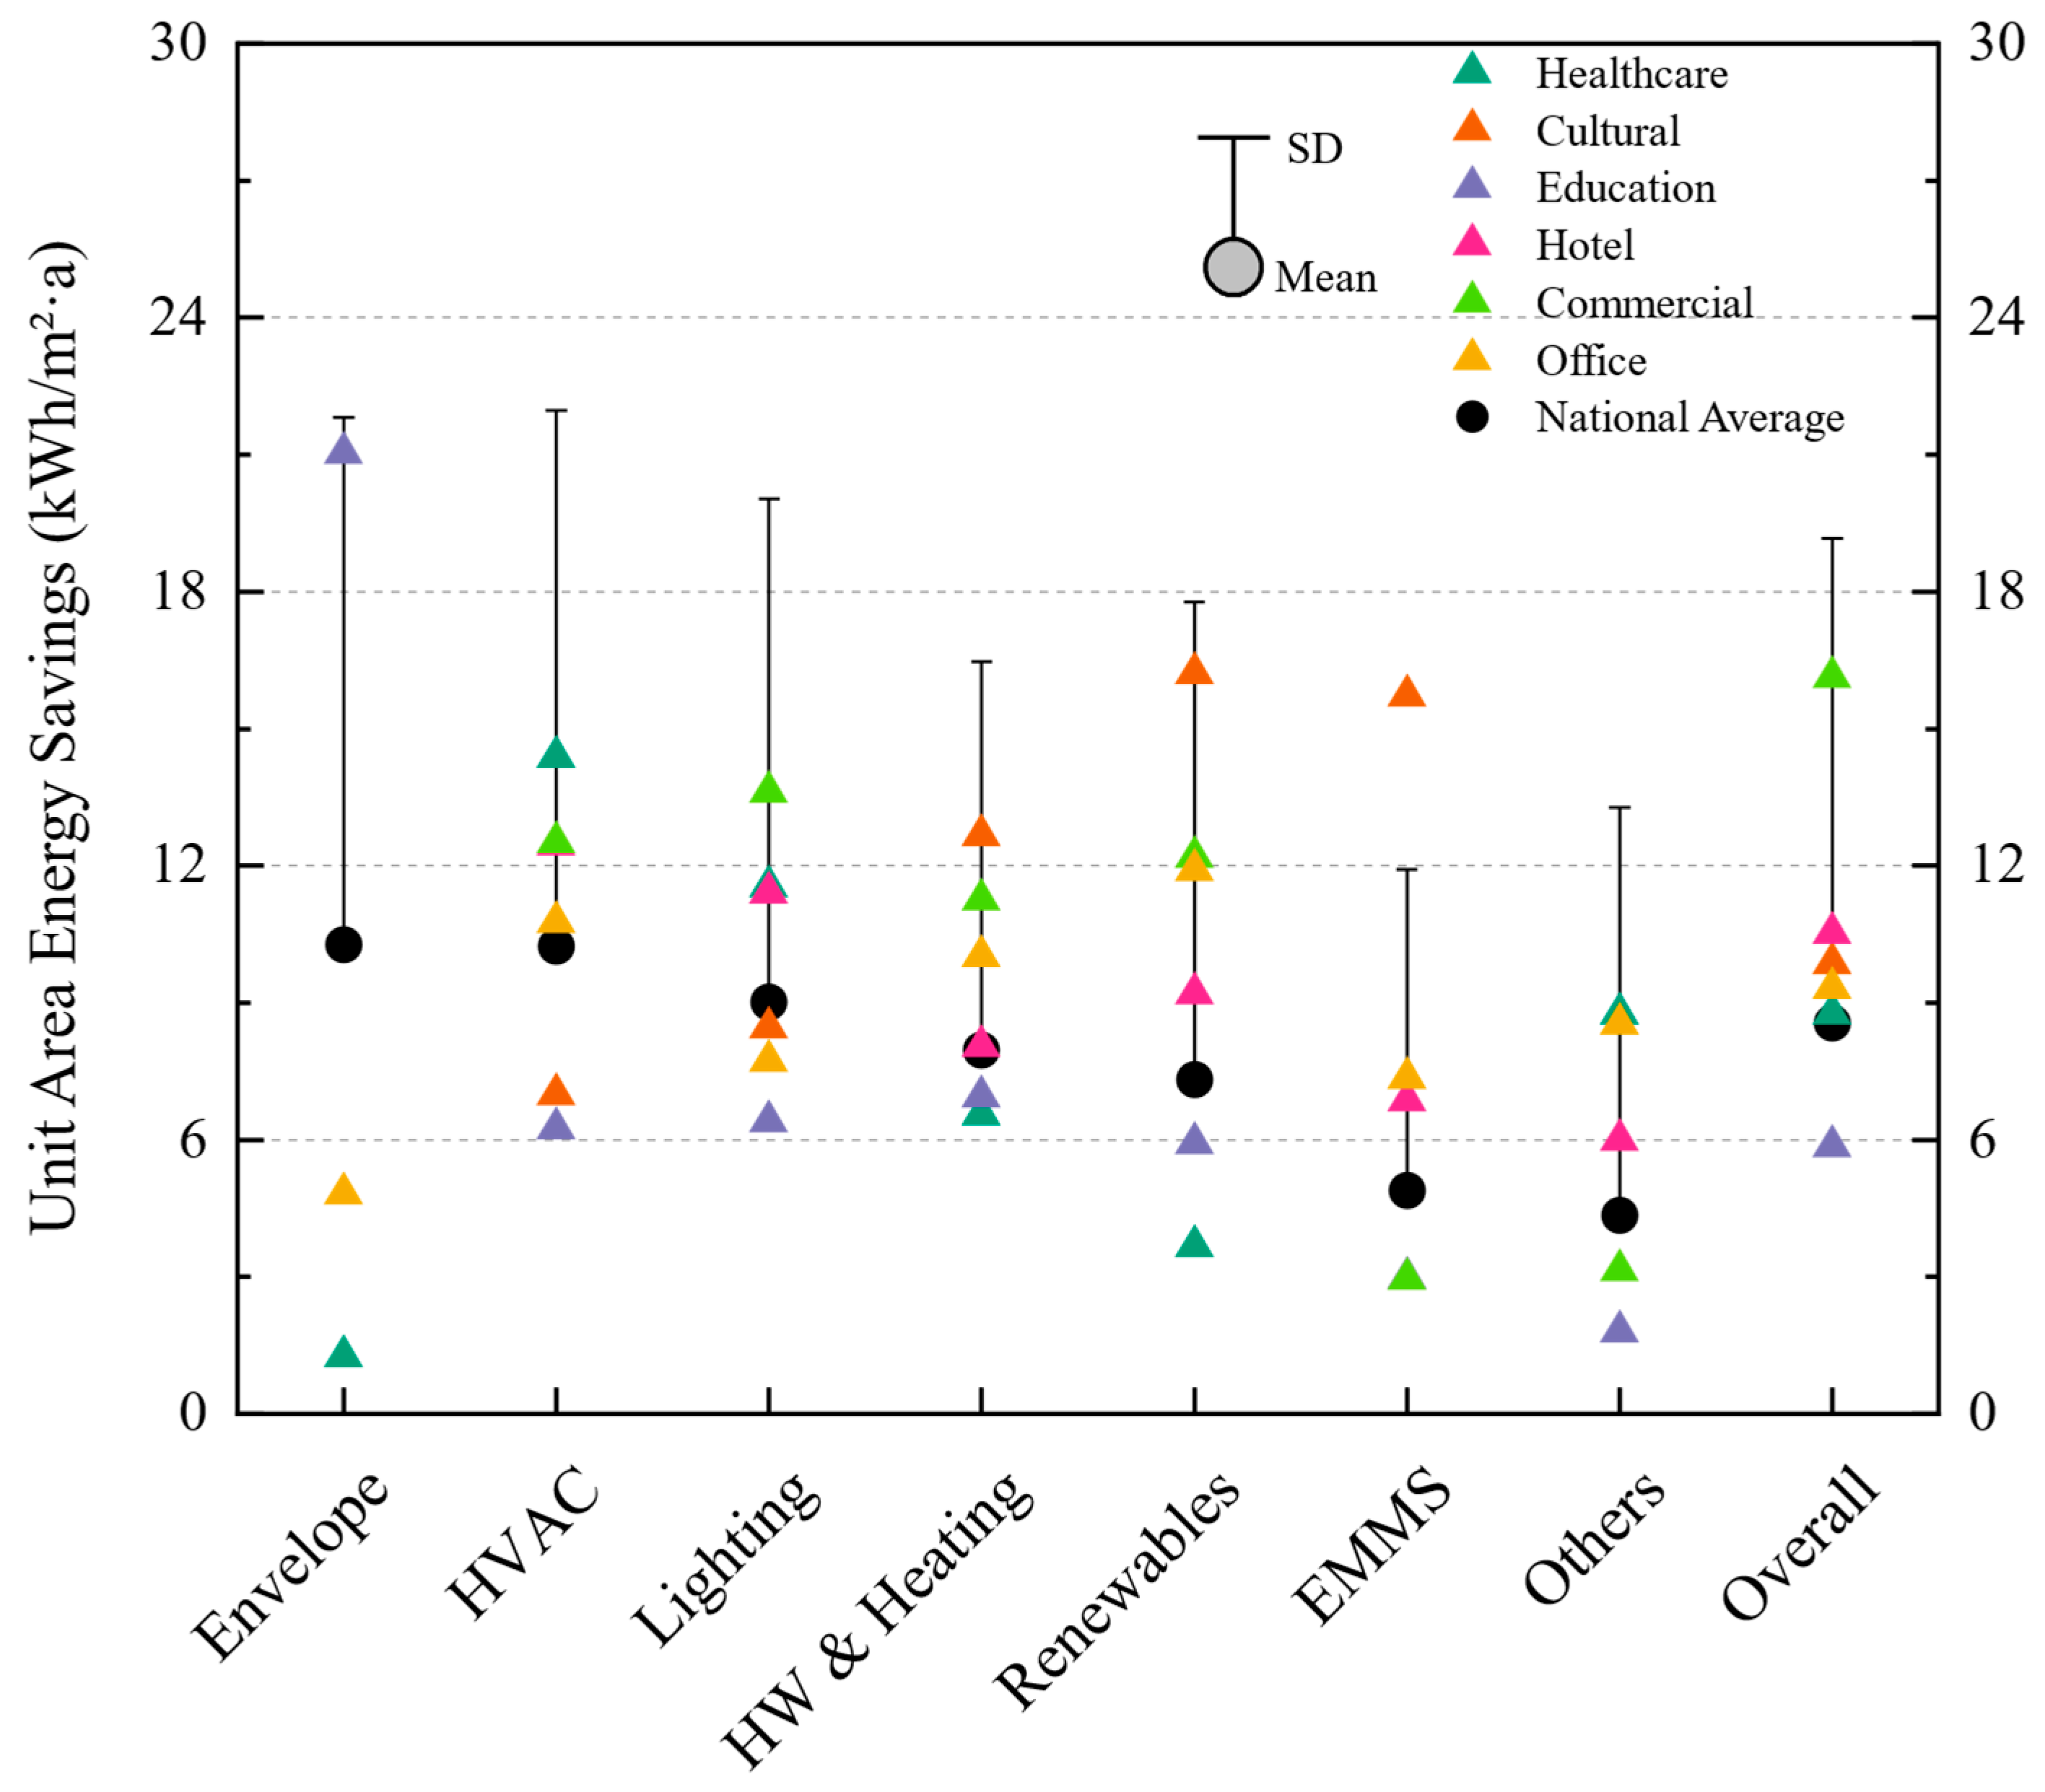
To ensure the accuracy of technology attribution, the quantification of saving intensities is derived from a subset of 296 projects that provided verified, measure-level energy audit reports. Across this sub-sample, average savings intensities vary by technology and climate. As shown in Figure 4, Envelope retrofits show the highest mean area-normalized savings (10.27 kWh/(m2·a)), closely followed by HVAC upgrades (10.23 kWh/(m2·a)). Lighting upgrades, domestic hot water and heating system upgrades, and renewable energy integration yield mean savings intensities of 9.02, 7.96, and 7.31 kWh/(m2·a), respectively. By comparison, EMMS and other measures exhibit lower mean savings intensities, at 4.89 and 4.35 kWh/(m2·a), respectively. As illustrated in Figure 3, lighting and HVAC measures are adopted most frequently and account for the largest shares in retrofit portfolios. Consistent with this, they contribute substantial average savings. In contrast, envelope retrofits are implemented less often but are associated with comparatively high savings intensity.
Figure 4.
Area-normalized savings of retrofit measure categories across climate zones (EMMS: energy monitoring and management systems; HW and heating: hot water and heating systems).
Technology performance also varies by climate zone. Envelope retrofits exhibit strong climate dependence: mean savings intensities reach 13.30 kWh/(m2·a) in the Cold Zone and 22.06 kWh/(m2·a) in the Hot Summer–Cold Winter (HSCW) Zone, far exceeding those of other measure categories, whereas the mean value is only 1.73 kWh/(m2·a) in the Hot Summer–Warm Winter (HSWW) Zone. This pattern is consistent with the larger heating loads (or combined heating–cooling demands) in colder or mixed climates, where envelope improvements can yield larger reductions in thermal losses/gains. HVAC upgrades show relatively consistent savings across the three climate zones, ranging from 9.55 to 13.16 kWh/(m2·a), with the highest mean savings observed in the Cold Zone. Lighting upgrades also display stable performance across climates (8.03–9.97 kWh/(m2·a)), indicating broad applicability. Domestic hot water and heating upgrades are particularly effective in the HSWW Zone (9.55 kWh/(m2·a)), where they are most commonly deployed in hotel buildings (often with catering functions). Renewable energy integration, EMMS, and other measures show relatively better performance in the Cold Zone, although the latter two categories remain lower in savings intensity overall. Taken together, the results suggest distinct climate adaptability across measure categories: envelope retrofits are more favorable in the Cold and HSCW zones, HVAC and lighting upgrades are broadly applicable across climates, and HW and heating are more targeted for HSWW projects.
As shown in Figure 5, area-normalized savings associated with different retrofit measure categories vary markedly across building types. Envelope retrofits were reported only for a subset of projects/building categories; among those, education buildings exhibit the highest mean savings (21.03 kWh/(m2·a)), whereas office and healthcare buildings show lower mean values (4.82 and 1.26 kWh/(m2·a), respectively). HVAC upgrades were implemented across all building types and deliver the largest mean savings in commercial, healthcare buildings, and hotels (12.52, 14.38, and 12.46 kWh/(m2·a), respectively). Lower HVAC-related savings are observed for education and cultural buildings, suggesting that HVAC retrofit benefits depend on cooling/heating loads as well as operational and occupancy characteristics.
Figure 5.
Area-normalized savings of retrofit measure categories by building type (EMMS: energy monitoring and management systems; HW and heating: hot water and heating systems).
Lighting upgrades are most effective in commercial buildings and hotels, achieving mean savings of 13.61 and 11.41 kWh/(m2·a), respectively, which exceed the sample-wide average (7.72 kWh/(m2·a)). Healthcare and cultural buildings show comparable lighting-related savings (approximately 8.50–11.20 kWh/(m2·a)), while office and education buildings exhibit lower values. Domestic hot water and heating upgrades and renewable energy integration yield moderate savings overall. HW and heating are more pronounced in hotels and cultural buildings but remain limited in other types. Renewable energy integration performs best in cultural buildings (16.21 kWh/(m2·a)), while other building types achieve mean savings ranging from 3.66 to 12.18 kWh/(m2·a). EMMS and other auxiliary measures generally contribute smaller savings on average; however, comparatively higher values are observed in cultural buildings and hotels (15.71 and 6.86 kWh/(m2·a), respectively), potentially reflecting building-specific applications and a limited number of relevant cases.
Aggregating across measures, total area-normalized savings also differ by building type. Commercial buildings achieve the highest overall savings intensity (16.14 kWh/(m2·a)), followed by hotels (10.51 kWh/(m2·a)) and cultural buildings (9.87 kWh/(m2·a)). Office and healthcare buildings fall in the mid-range, with mean savings of 9.32 and 8.75 kWh/(m2·a), respectively. Education buildings show the lowest overall savings (5.86 kWh/(m2·a)). Overall, commercial buildings with high baseline energy intensity and extended operating hours tend to exhibit larger post-retrofit savings, whereas education buildings may have more limited savings due to concentrated occupancy schedules and partial vacancy during winter and summer breaks.
3.3. Economic Evaluation and Adaptation Strategies
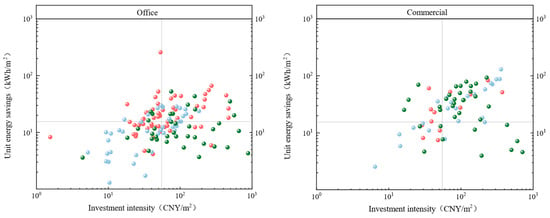
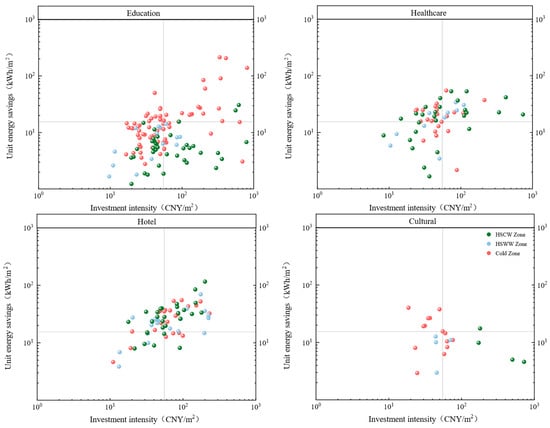
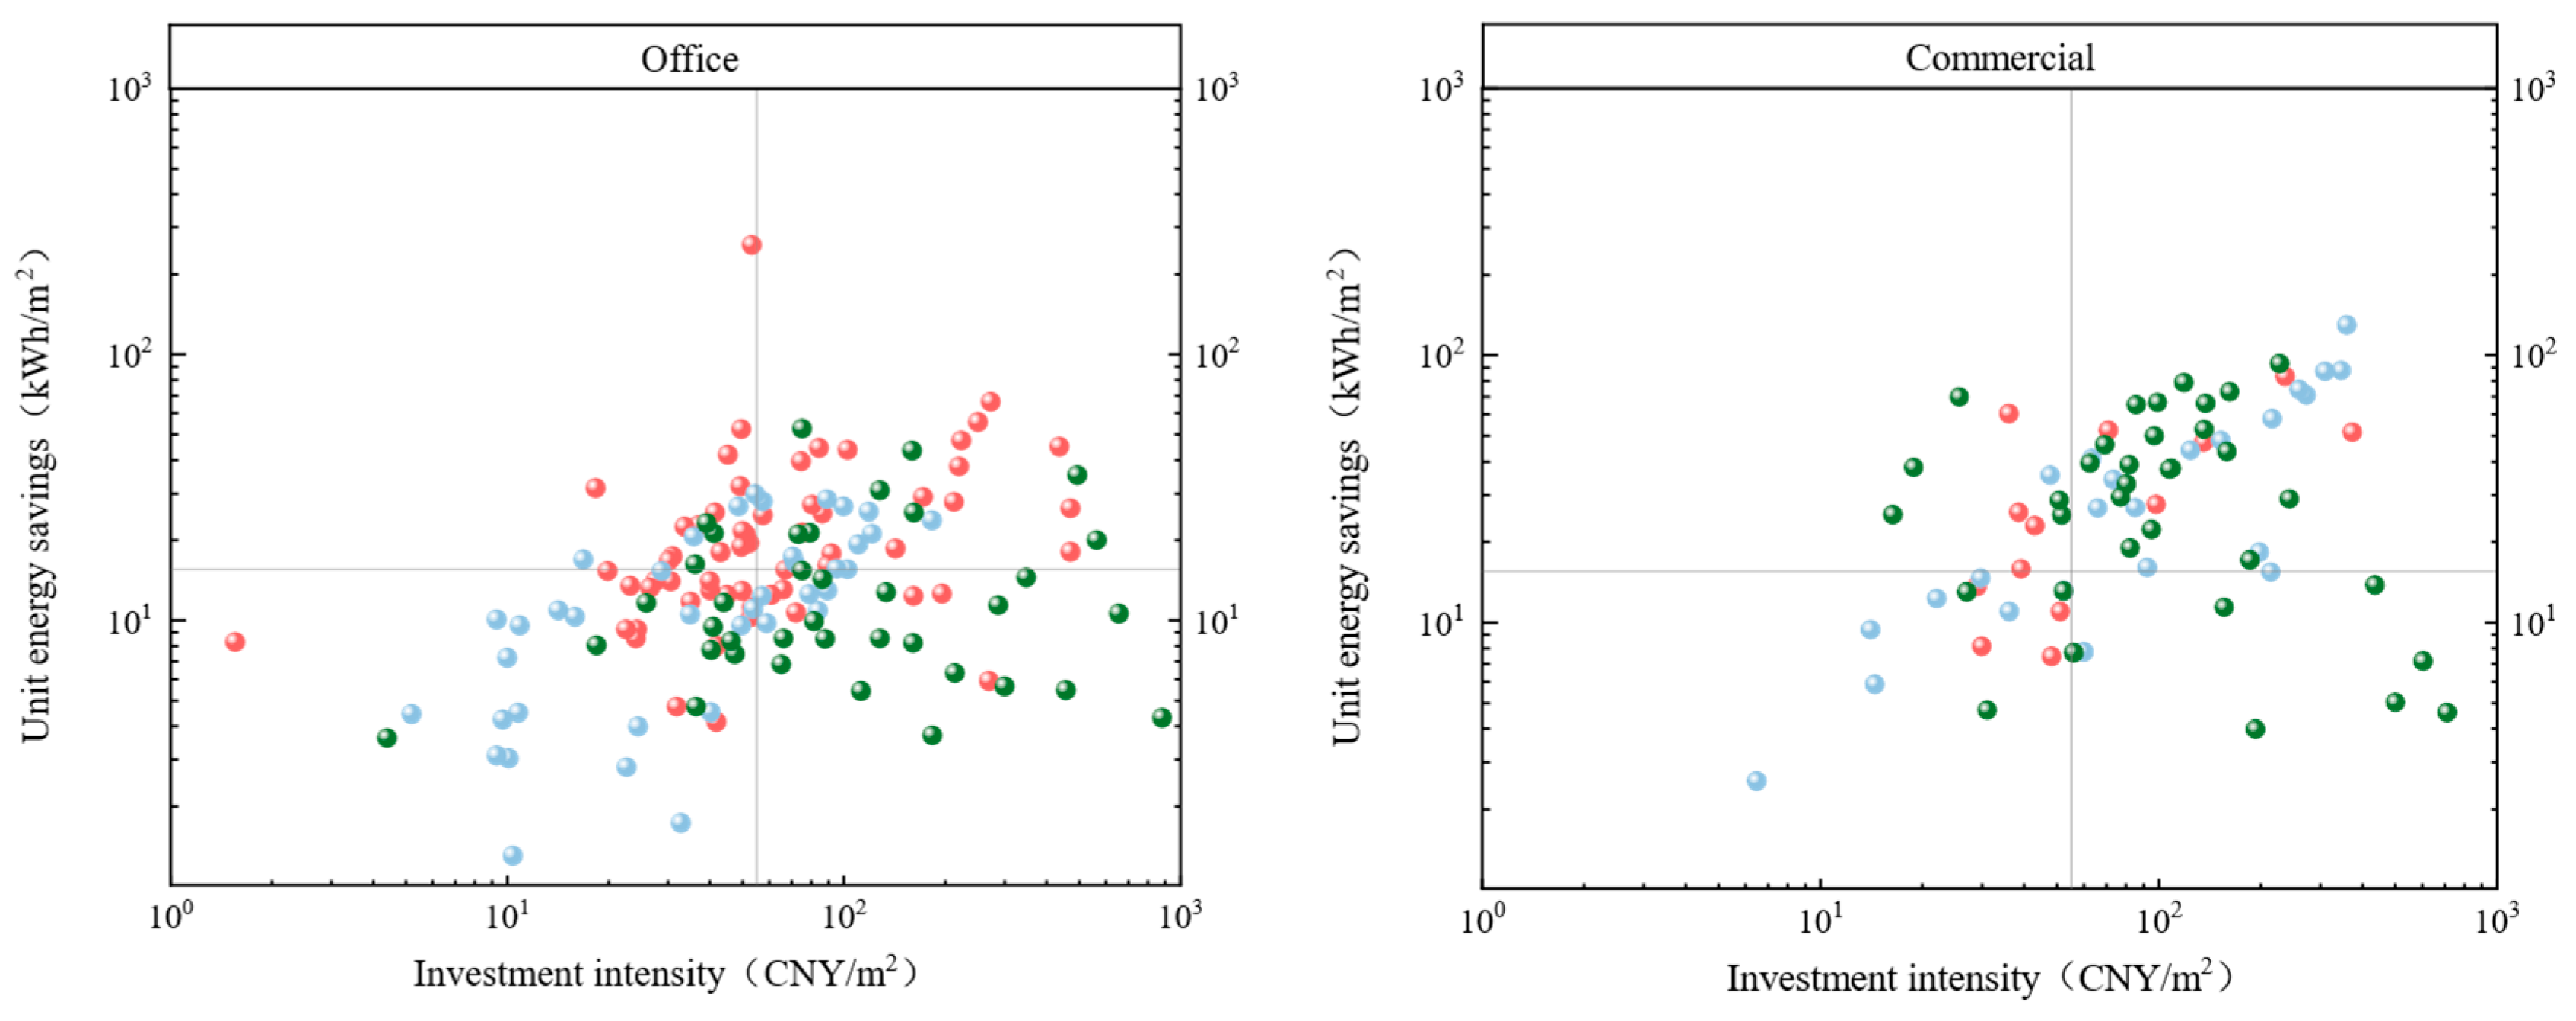
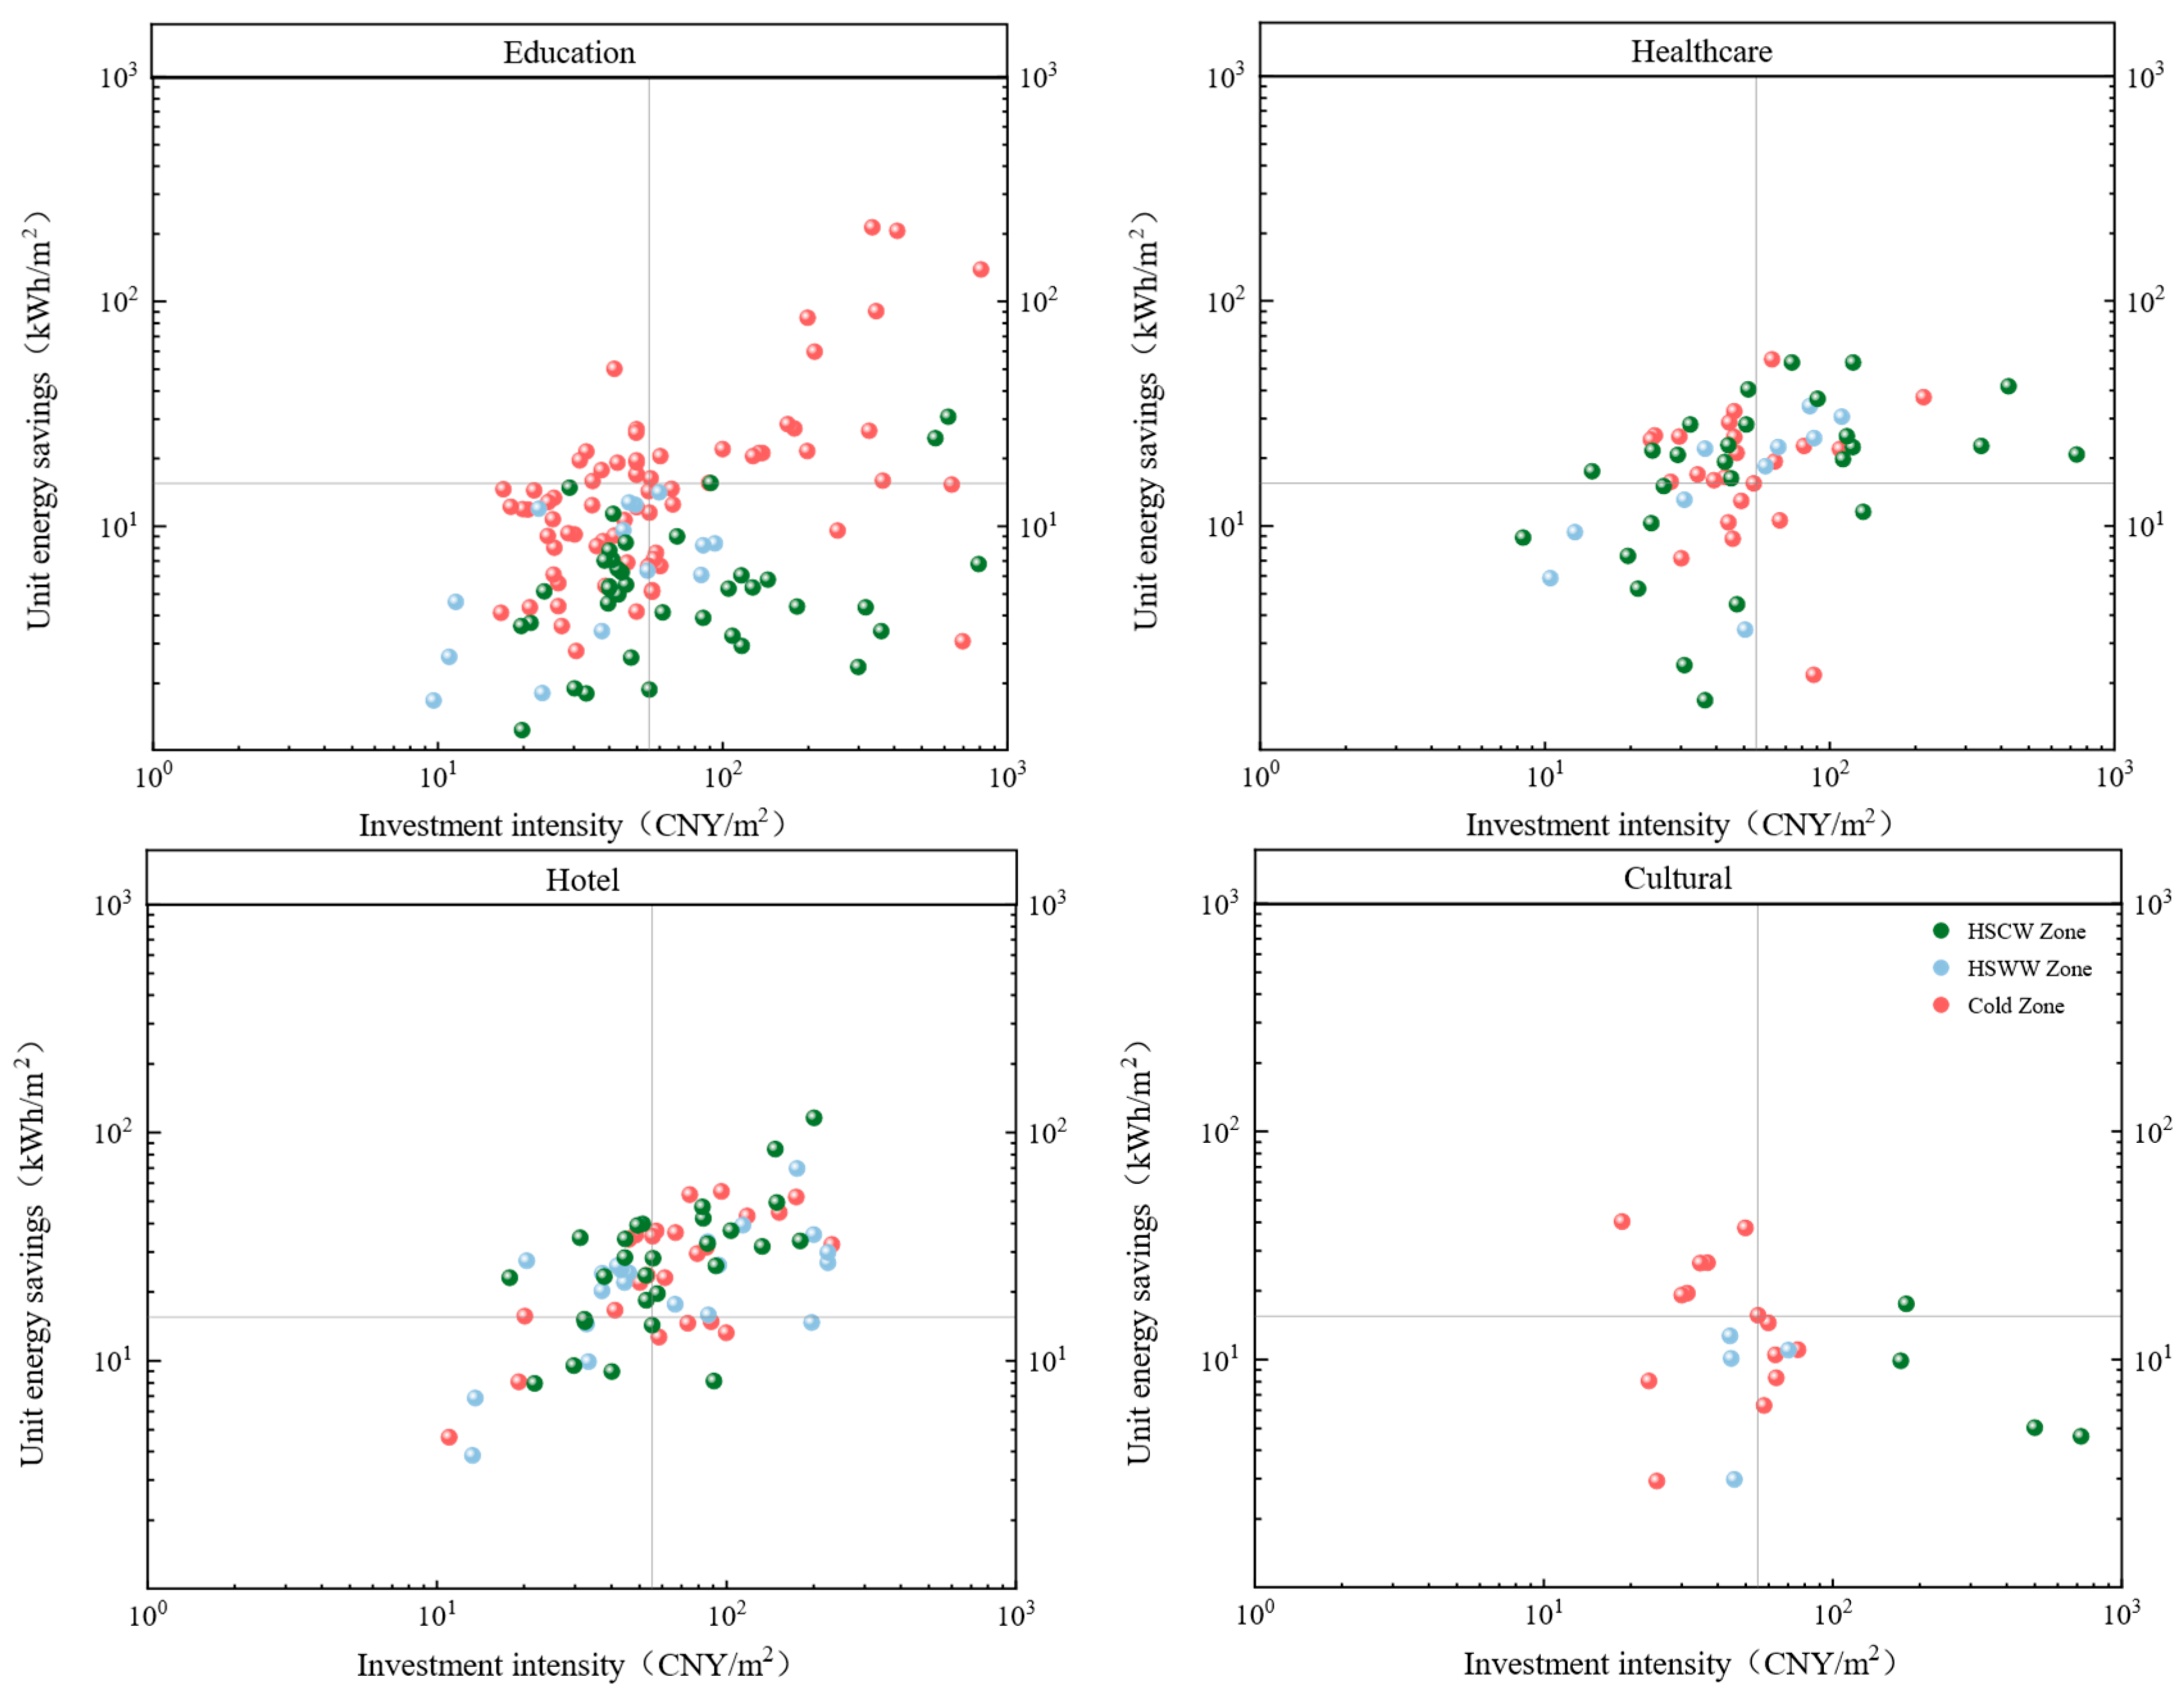
The four-quadrant analysis in Figure 6 uses the sample medians of savings intensity and investment intensity as thresholds to characterize input–output profiles across building types and climate zones. Specifically, the median investment intensity is 57.38 CNY/m2 and the median savings intensity is 15.32 kWh/(m2·a), which define high vs. low investment and high vs. low savings. In Figure 6, Quadrants I–IV correspond to high investment–high savings, low investment–high savings, low investment–low savings, and high investment–low savings, respectively.
Figure 6.
Investment intensity vs. savings intensity by building type and climate zone.
Commercial buildings consistently achieve high savings intensities across all three climate zones (approximately 32.80–36.15 kWh/(m2·a), well above the sample median), with investment intensities mainly ranging from 94.88 to 153.28 CNY/m2. In each climate zone, more than half of mall projects fall into the high-savings quadrants, and no high-investment/low-savings cases are observed in the Cold Zone. This distribution suggests robust cost-effectiveness and a low likelihood of unfavorable input–output outcomes for mall retrofits.
Hotel projects (including those with catering functions where applicable) show patterns broadly similar to commercial buildings, and in some zones exhibit even more favorable profiles. Their savings intensities are typically concentrated between 25 and 32 kWh/(m2·a), while investment intensities are mostly below 80 CNY/m2, close to or below the sample median. Notably, in the Hot Summer–Cold Winter (HSCW) Zone, Quadrant IV projects account for only 3.57%, indicating a relatively low risk of high investment coupled with limited savings.
Office buildings exhibit pronounced climate-dependent heterogeneity. In the Cold Zone, the mean savings intensity is 25.75 kWh/(m2·a) with a mean investment intensity of 96.21 CNY/m2; Quadrant II (low investment–high savings) accounts for 31.67%, implying a relatively manageable risk profile. In the Hot Summer–Warm Winter (HSWW) Zone, the share of Quadrant III (low investment–low savings) increases to 42.11%, suggesting limited retrofit gains in many projects. In the HSCW Zone, Quadrant IV accounts for 44.74%, with a high mean investment intensity of 170.42 CNY/m2 but a mean savings intensity of only 14.32 kWh/(m2·a), indicating a mismatch between investment and realized savings for office retrofits in this climate context.
Healthcare buildings show comparatively stable economic performance across zones. Mean savings intensities range from 17.61 to 23.63 kWh/(m2·a). Mean investment intensity is around 55 CNY/m2 in the Cold and HSWW Zones, but increases to 112.78 CNY/m2 in the HSCW Zone, implying weaker cost-effectiveness there. By contrast, cultural and education buildings tend to exhibit less favorable economic viability. In the HSCW Zone, all cultural building projects fall into Quadrant IV, with a very high mean investment intensity (394.90 CNY/m2) but a low mean savings intensity (9.92 kWh/(m2·a)). In the HSWW zone, Quadrant III accounts for 75.00% of cultural building projects, indicating limited savings in many cases. Education buildings show a high share of Quadrant III projects across all zones (55.26% in the HSCW Zone). Meanwhile, Quadrant IV accounts for 36.84% in the HSCW Zone, with low mean savings (6.68 kWh/(m2·a)) but relatively high mean investment (130.36 CNY/m2), suggesting room to improve retrofit efficiency.
Taken together, the quadrant distributions and group-level investment/savings statistics indicate that retrofit cost-effectiveness is jointly constrained by climate zone and building type. Overall, the HSCW Zone shows the highest investment intensities and the largest between-type disparities. Cultural buildings, in particular, exhibit exceptionally high investment intensity (394.90 CNY/m2) relative to other building types in the same zone, implying comparatively low input–output efficiency. In contrast, the Cold and HSWW zones show lower overall investment levels and more comparable economic performance across building types. These findings suggest that retrofit programs should prioritize building categories with robust and consistently favorable profiles (e.g., commercial and hotels), while strengthening technology suitability screening and investment intensity control for cultural, education, and certain office projects to reduce the risk of poor cost-effectiveness.
3.4. Comparison with Existing Simulation and Empirical Studies
Overall, the findings of this study show good agreement with existing simulation-based and empirical studies, while also revealing the gap between idealized predictions and actual engineering performance. The average energy use intensity of 19.03% falls within the range reported in simulation studies [12], confirming the effectiveness of current retrofit strategies at the macro level. However, compared with ideal optimization scenarios reported in large-scale simulations [38], the measured performance is more moderate, mainly due to practical constraints such as simplified technology combinations, construction quality variations, equipment degradation, and occupant behavior uncertainties. This uncertainty can be further explained by the research of Madrazo et al., who developed a data-driven platform and pointed out that operational inconsistencies and misaligned renovation timing often prevent buildings from reaching their theoretical maximum efficiency [33].
In terms of technical pathways, the observed climate sensitivity of envelope retrofits is consistent with previous studies. Significant energy-saving benefits are confirmed in Cold and Hot Summer–Cold Winter zones [13,39], while limited performance in the Hot Summer–Warm Winter Zone further supports the conclusion that envelope strategies must be adapted to local climatic conditions. This aligns further with the findings of Alexakis et al. that state the effectiveness of retrofit measures is related to climate zone and building type, requiring a “climate-sensitive” approach to avoid poor performance in humid or temperate regions [40]. Meanwhile, high energy-saving potential in commercial buildings and hotels aligns with prior findings on high-load buildings, reinforcing the robustness of energy-saving performance in energy-intensive building types.
From an economic perspective, the four-quadrant analysis reveals systematic differences in investment efficiency across climate zones and building types, which is consistent with previous cost–benefit studies [17]. Compared with earlier small-sample research, this study extends the conclusions using large-scale measured data. In addition, the superior economic performance of active technologies and their shorter payback periods further validate simulation-based conclusions [41], while highlighting their critical role in improving both energy efficiency and investment stability in real-world retrofit projects. Compared to previous small-sample studies, this study expands its conclusions using large-scale measured data. While current research employs complex algorithms (such as NSGA-II) to balance investment and energy conservation, the “median four-quadrant framework” established by this study using large-sample empirical data provides an intuitive and practical empirical tool for rapidly screening cost-effective solutions. Furthermore, the introduction of a data-driven dynamic economic evaluation model more accurately identifies the cost-effectiveness of renovations at different stages for representative building complexes, providing strong analytical support for our cross-regional empirical data [42].
3.5. Limitations and Perspectives
This study is subject to several limitations that should be considered when interpreting the findings. First, the dataset is based on project-level operational records, and detailed sub-metering, end-use breakdowns, and time-resolved information (e.g., occupancy, schedules, control settings) are not consistently available across projects. Such constraints contribute to the numerical variations between the project-level (N = 530) and measure-level (N = 296) analyses, and specifically limit the feasibility of constructing complex multi-objective optimization models that require high-resolution input parameters. As a result, the analysis focuses on observed pre-/post-retrofit changes and screening-level comparisons, and the measure-level results—especially for multi-measure retrofit packages—should be interpreted as associations rather than strictly causal effects. Second, the lengths of pre- and post-retrofit observation windows vary among projects, and potential confounders such as weather variability and operational changes (e.g., business hours, service intensity) may affect the estimated savings. Third, the economic evaluation is based on upfront investment intensity and realized annual savings intensity; it does not explicitly account for discounting, measure lifetimes, O&M changes, or local energy prices, and therefore serves as a relative cost-effectiveness screening rather than a full life-cycle assessment.
Despite these limitations, the study provides a large-scale, cross-climate, and real-world evidence base that complements simulation-driven research and supports climate- and building-specific prioritization of retrofit measures. Future work will benefit from integrating higher-resolution monitoring (sub-metering and end-use data), harmonized weather normalization, and life-cycle economic metrics (e.g., NPV/LCC or levelized cost of conserved energy), as well as employing statistical designs (e.g., matching or regression with richer covariates) to strengthen causal inference and technology attribution.
To enhance the scalability and policy relevance of this research, future studies should combine building energy efficiency with emerging carbon finance instruments. Specifically, introducing the CCER methodology can provide a key funding mechanism for large-scale building decarbonization [43]. Furthermore, shifting from single energy-saving retrofits to a systematic “ecological pathway” encompassing electrification and building-integrated photovoltaics (BIPV) is essential for achieving China’s carbon neutrality goals [44]. From a methodological perspective, introducing high-resolution sub-metering data and user-defined occupancy comfort thresholds will help design more resilient retrofit schemes to cope with extreme climate events and long-term energy price fluctuations [45].
4. Conclusions
Using measured pre- and post-retrofit operational data from more than 500 public-building projects in China, this study quantifies real-world energy-saving performance and cost-effectiveness across climate zones and building types. Overall, mean energy use decreased by ~19%, with area-normalized savings typically in the range of 7–36 kWh/(m2·a), and the largest reductions were observed in the Cold Zone. Savings differed markedly by building function: commercial buildings and hotels achieved the highest savings intensities (26.5–28.0 kWh/(m2·a)), whereas education and cultural buildings generally showed lower gains, with some projects having < 10 kWh/(m2·a).
Retrofit measures exhibited clear climate and building suitability. Envelope retrofits were most effective in the Cold and Hot Summer–Cold Winter zones (13.30–22.06 kWh/(m2·a)) but provided limited benefits in the Hot Summer–Warm Winter zone (~1.73 kWh/(m2·a)). HVAC and lighting upgrades delivered relatively consistent savings across climates and building types, forming the dominant retrofit pathways in practice.
A median-based quadrant screening using savings and investment intensities highlights strong heterogeneity in economic profiles. Commercial buildings and hotels show robust input–output performance across climates (>70% high-savings projects), while cultural, education, and some office retrofits are more prone to low-savings outcomes and require stricter technology suitability screening and investment control. Overall, the results provide large-scale empirical evidence to support building- and climate-specific retrofit prioritization and investment decision-making.
Based on these findings, we propose a tiered retrofit strategy to optimize investment efficiency and decarbonization outcomes. Stakeholders should prioritize comprehensive retrofits for commercial and hotel buildings, given their robust energy-saving potential and consistently favorable economic profiles. For building types with lower realized gains, such as education and cultural facilities, a more cautious investment approach is required, emphasizing stricter technology suitability screening and operational management over high-intensity capital inputs to avoid poor cost-effectiveness. Furthermore, from a policy perspective, technological pathways must be climate-differentiated: envelope thermal enhancements should be primarily incentivized in the Cold and HSCW zones, whereas high-efficiency HVAC and lighting upgrades should be promoted as reliable baseline measures across all regions. These evidence-based recommendations provide a rational framework for resource allocation, helping to bridge the gap between theoretical simulation potential and realized operational performance in China’s building sector.
Supplementary Materials
The following supporting information can be downloaded at: https://www.mdpi.com/article/10.3390/buildings16101877/s1, Figure S1: Flowchart of the statistical analysis methodology; Table S1: Wilcoxon Signed-Rank Test Results for the Full Sample; Table S2: Statistical Summary of Energy Use Intensity (EUI) Pre and Post Retrofitting; Table S3: Comparison of Building Type Composition based on Balance Test Results.
Author Contributions
Conceptualization, J.L.; methodology, Q.L., L.Q., and J.L; investigation, Y.W., X.Z., G.S., Q.L., L.Q., and J.L.; writing—original draft preparation, Y.W., X.Z., and J.L.; visualization, G.S.; supervision, J.L.; funding acquisition, Q.L. All authors have read and agreed to the published version of the manuscript.
Funding
This research was supported by the National Science and Technology Major Project (No. 2024ZD1004305) and the National Natural Science Foundation of China (No. 52374113).
Data Availability Statement
The data presented in this study are available on request from the corresponding author. The data are not publicly available due to privacy restrictions related to building energy records.
Conflicts of Interest
The authors declare no conflict of interest.
References
- Chen, Y.; Guo, M.; Chen, Z.; Chen, Z.; Ji, Y. Physical energy and data-driven models in building energy prediction: A review. Energy Rep. 2022, 8, 2656–2671. [Google Scholar] [CrossRef] [Scilit]
- Valdiserri, P.; Biserni, C. Energy performance of an existing office building in the northern part of Italy: Retrofitting actions and economic assessment. Sustain. Cities Soc. 2016, 27, 65–72. [Google Scholar] [CrossRef] [Scilit]
- Xu, G.; Zang, L.; Schwarz, P.; Yang, H. Achieving China’s carbon neutrality goal by economic growth rate adjustment and low-carbon energy structure. Energy Policy 2023, 183, 113817. [Google Scholar] [CrossRef] [Scilit]
- Zhang, Y.H.; Hu, K.; Yang, Y.K.; Li, D.P.; Deng, T.; Hu, Z.P.; Xu, Y.Z. Energy-Saving and Decarbonization Design Optimization for School Canteen Buildings: A Case Study in Nanjing. Buildings 2025, 15, 455. [Google Scholar] [CrossRef] [Scilit]
- Liu, Y.; Chen, D.P.; Wang, J.X.; Dai, M.F. Energy-Saving and Ecological Renovation of Existing Urban Buildings in Severe Cold Areas: A Case Study. Sustainability 2023, 15, 12985. [Google Scholar] [CrossRef] [Scilit]
- Zhang, X.X.; Nie, S.Y.; He, M.G.; Wang, J.F. Energy-saving renovation of old urban buildings: A case study of Beijing. Case Stud. Therm. Eng. 2021, 28, 101632. [Google Scholar] [CrossRef] [Scilit]
- Gao, B.; Zhu, X.Y.; Ren, J.; Ran, J.Y.; Kim, M.K.; Liu, J.Y. Multi-objective optimization of energy-saving measures and operation parameters for a newly retrofitted building in future climate conditions: A case study of an office building in Chengdu. Energy Rep. 2023, 9, 2269–2285. [Google Scholar] [CrossRef] [Scilit]
- Wang, W.; Zhu, L.; Zhang, J.; Zhu, X.; Yan, Z.; Cao, M. Evaluation of energy retrofits for existing office buildings through uncertainty and sensitivity Analyses: A case study of Tianjin, China. Energy Build. 2025, 331, 115363. [Google Scholar] [CrossRef] [Scilit]
- Wan, S.Y.; Ding, G.C.; Runeson, G.; Liu, Y.S. Sustainable Buildings’ Energy-Efficient Retrofitting: A Study of Large Office Buildings in Beijing. Sustainability 2022, 14, 1021. [Google Scholar] [CrossRef] [Scilit]
- Jradi, M.; Veje, C.; Jørgensen, B.N. Deep energy renovation of the Mærsk office building in Denmark using a holistic design approach. Energy Build. 2017, 151, 306–319. [Google Scholar] [CrossRef] [Scilit]
- Sun, W.; Chen, L.; Zhang, Y.; Suolang, B.; Yuan, L.; Liu, K.; Xia, Y.; Chen, Y. Thermal comfort and energy-saving retrofits: An empirical study in high-altitude regions. Case Stud. Therm. Eng. 2025, 72, 106220. [Google Scholar] [CrossRef] [Scilit]
- Xu, P.; Shen, Y.; Chen, L.; Mao, J.; Chang, E.; Ji, Y. Assessment of energy-saving technologies retrofitted to existing public buildings in China. Energy Effic. 2015, 9, 67–94. [Google Scholar] [CrossRef] [Scilit]
- Zhang, M.; Liu, F.; Liu, Q.; Zhang, F.; Li, T. Climate Adaptation Analysis and Comfort Optimization Strategies for Traditional Residential Buildings in Hot-Summer, Cold-Winter Regions: A Case Study in Xuzhou, China. Sustainability 2024, 16, 3411. [Google Scholar] [CrossRef] [Scilit]
- Lamberti, G.; Contrada, F.; Kindinis, A. Exploring adaptive strategies to cope with climate change: The case study of Le Corbusier’s Modern Architecture retrofitting. Energy Build. 2024, 302, 113756. [Google Scholar] [CrossRef] [Scilit]
- Qu, K.; Chen, X.; Wang, Y.; Calautit, J.; Riffat, S.; Cui, X. Comprehensive energy, economic and thermal comfort assessments for the passive energy retrofit of historical buildings—A case study of a late nineteenth-century Victorian house renovation in the UK. Energy 2021, 220, 119646. [Google Scholar] [CrossRef] [Scilit]
- William, M.A.; Elharidi, A.M.; Hanafy, A.A.; Attia, A.; Elhelw, M. Energy-efficient retrofitting strategies for healthcare facilities in hot-humid climate: Parametric and economical analysis. Alex. Eng. J. 2020, 59, 4549–4562. [Google Scholar] [CrossRef] [Scilit]
- Wang, P.; Ji, C.; Yu, P.; Huang, L. A procedure set to construct the optimal energy saving retrofit strategy for old residential buildings in China. J. Renew. Sustain. Energy 2023, 15, 025101. [Google Scholar] [CrossRef] [Scilit]
- Shi, Y.; Wang, R.; Chen, P. Multi-criteria decision-making approach for energy-efficient renovation strategies in hospital wards: Balancing energy, economic, and thermal comfort. Energy Build. 2023, 298, 113575. [Google Scholar] [CrossRef] [Scilit]
- Gan, W.N.; Li, X.L.; Fang, J.Z.; Feng, C. Influence of input uncertainty on the 1-D hygrothermal simulation of composite walls in China. Build. Simul. 2025, 18, 19–32. [Google Scholar] [CrossRef] [Scilit]
- Sharifi, M.; Kouti, A.; Shamsi, M.H.; Guo, R.; Saelens, D. Propagating epistemic uncertainties in planning and design of energy efficient districts. Sustain. Cities Soc. 2025, 130, 106520. [Google Scholar] [CrossRef] [Scilit]
- Heo, Y.; Choudhary, R.; Augenbroe, G.A. Calibration of building energy models for retrofit analysis under uncertainty. Energy Build. 2012, 47, 550–560. [Google Scholar] [CrossRef] [Scilit]
- Luo, L.; Wei, H.; Lin, Z.; Wu, J.; Wang, W.; Sun, Y. Multi-objective optimal energy-efficient retrofit determination using hybrid urban building energy model: Considering uncertainties between models. Build. Simul. 2024, 18, 183–206. [Google Scholar] [CrossRef] [Scilit]
- Wei, Y.; Xia, L.; Pan, S.; Wu, J.; Zhang, X.; Han, M.; Zhang, W.; Xie, J.; Li, Q. Prediction of occupancy level and energy consumption in office building using blind system identification and neural networks. Appl. Energy 2019, 240, 276–294. [Google Scholar] [CrossRef] [Scilit]
- Abd Rahman, N.M.; Lim, C.H.; Fazlizan, A. Optimizing the energy saving potential of public hospital through a systematic approach for green building certification in Malaysia. J. Build. Eng. 2021, 43, 103088. [Google Scholar] [CrossRef] [Scilit]
- Du, X.G.; Liu, X.; Gao, F.; Zhou, Z.H. Energy saving and low carbon oriented renovation framework for educational buildings with Tianjin University case study. Sci. Rep. 2025, 15, 28822. [Google Scholar] [CrossRef] [Scilit] [PubMed]
- Arriazu-Ramos, A.; Monge-Barrio, A.; Bellod, J.S.M.; Martínez, P.G.; Gutiérrez, A.S.-O. Difficulties in the energy renovation processes of district heating buildings. Two case studies in a temperate climate. Sustain. Cities Soc. 2021, 75, 103246. [Google Scholar] [CrossRef] [Scilit]
- Xin, L.; Chenchen, W.; Chuanzhi, L.; Guohui, F.; Zekai, Y.; Zonghan, L. Effect of the energy-saving retrofit on the existing residential buildings in the typical city in northern China. Energy Build. 2018, 177, 154–172. [Google Scholar] [CrossRef] [Scilit]
- Szymanska, E.J.; Kubacka, M.; Wozniak, J.; Polaszczyk, J. Analysis of Residential Buildings in Poland for Potential Energy Renovation toward Zero-Emission Construction. Energies 2022, 15, 9327. [Google Scholar] [CrossRef] [Scilit]
- Huo, H.; Deng, X.; Wei, Y.; Liu, Z.; Liu, M.; Tang, L. Optimization of energy-saving renovation technology for existing buildings in a hot summer and cold winter area. J. Build. Eng. 2024, 86, 108597. [Google Scholar] [CrossRef] [Scilit]
- Eriksson, M.; Akander, J.; Moshfegh, B. Development and validation of energy signature method—Case study on a multi-family building in Sweden before and after deep renovation. Energy Build. 2020, 210, 109756. [Google Scholar] [CrossRef] [Scilit]
- Filippidou, F.; Nieboer, N.; Visscher, H. Effectiveness of energy renovations: A reassessment based on actual consumption savings. Energy Effic. 2018, 12, 19–35. [Google Scholar] [CrossRef] [Scilit]
- Cao, H.; Liu, X.; Feng, G.; Wang, C.; Huang, K.; Hou, X.; Chen, J. Research on the evaluation of the renovation effect of existing energy-inefficient residential buildings in a severe cold region of China. Energy Build. 2024, 312, 114184. [Google Scholar] [CrossRef] [Scilit]
- Madrazo, L.; Sicilia, Á.; Calvo, A.; Pascual, J.; Mont, E.; Mylonas, A.; Ibañez Iralde, N.S. Retabit: A Data-Driven Platform for Urban Renewal and Sustainable Building Renovation. Energies 2025, 18, 3895. [Google Scholar] [CrossRef] [Scilit]
- Liang, L.; Li, X.; Liu, S.; Guo, Z.; Tang, S.; Wen, B. Integrating Computer Vision and GIS for Large-Scale Morphological Mapping and Driving Force Analysis of Vernacular Courtyard Dwellings. Buildings 2026, 16, 1118. [Google Scholar] [CrossRef] [Scilit]
- Bibri, S.E.; Huang, J.; Omar, O.; Kenawy, I. Synergistic integration of digital twins and zero energy buildings for climate change mitigation in sustainable smart cities: A systematic review and novel framework. Energy Build. 2025, 333, 115484. [Google Scholar] [CrossRef] [Scilit]
- GB/T 2589-2020; General Rules for Calculation of Comprehensive Energy Consumption. Standardization Administration of China: Beijing, China, 2020.
- GB 51161-2016; Code for Thermal Design of Civil Building. China Architecture & Building Press: Beijing, China, 2016.
- Yang, Q.; Lu, W.-Z.; Xu, F.; Luo, X.; Wen, B. A passive strategy for energy-saving retrofitting of courtyard dwellings and its climatic adaptability. Energy Build. 2026, 352, 116811. [Google Scholar] [CrossRef] [Scilit]
- Li, Z.; Gao, Y.; Wu, Y.; Geng, Q. Economic Evaluation and Sustainable Optimisation of Envelope Parameters of Building Energy-Efficiency Design Standards in Cold Regions: A Case Study of Shijiazhuang, China. Sustainability 2025, 17, 9065. [Google Scholar] [CrossRef] [Scilit]
- Alexakis, K.; Komninou, S.; Kokkinakos, P.; Askounis, D. Climate-Sensitive Building Renovation Strategies: A Review of Retrofit Interventions Across Climatic and Building Typologies. Sustainability 2025, 17, 8187. [Google Scholar] [CrossRef] [Scilit]
- Yang, Q.; Xu, F.; Lu, W.-z.; Yang, Z.; Bai, Y.; Wen, B. Green renovation and multi-objective optimization of Tibetan courtyard dwellings. Build. Environ. 2025, 279, 113071. [Google Scholar] [CrossRef] [Scilit]
- Zhan, X.; Zhang, W.; Chen, R.; Bai, Y.; Wang, J.; Deng, G. Non-dominated sorting genetic algorithm-II: A multi-objective optimization method for building renovations with half-life cycle and economic costs. Build. Environ. 2025, 267, 112155. [Google Scholar] [CrossRef] [Scilit]
- Wu, S.; Sun, K.; Bi, Y.; Shi, M.; Yu, L. Carbon reduction potential of housing retrofits: Evidence from China. Renew. Sustain. Energy Rev. 2024, 200, 114580. [Google Scholar] [CrossRef] [Scilit]
- Hu, S.; Jiang, Y.; Yang, X.; Pan, Y.; Rong, X.; Hao, B.; Yang, Z.; Zhang, Y.; Yan, D. Ecological Pathway to Achieve Carbon Neutrality in China’s Building Sector. Engineering 2025, 53, 40–57. [Google Scholar] [CrossRef] [Scilit]
- Rehman, H.u.; Ramesh, R. Implication of building renovation and renewable integration on the energy resilience in the Nordic climate: Techno-economic analysis using questionnaire-based thresholds. Energy Build. 2026, 350, 116633. [Google Scholar] [CrossRef] [Scilit]

Disclaimer/Publisher’s Note: The statements, opinions and data contained in all publications are solely those of the individual author(s) and contributor(s) and not of MDPI and/or the editor(s). MDPI and/or the editor(s) disclaim responsibility for any injury to people or property resulting from any ideas, methods, instructions or products referred to in the content. |
© 2026 by the authors. Licensee MDPI, Basel, Switzerland. This article is an open access article distributed under the terms and conditions of the Creative Commons Attribution (CC BY) license.