


Abstract
Giant cantilevered tree-shaped steel structures are highly susceptible to cumulative deformation and geometric deviation during staged construction due to their complex spatial configuration, long cantilever characteristics, and nonlinear load transfer mechanisms. To address these challenges, this study investigates deformation monitoring and control of such structures based on 3D laser scanning, taking the “Tree of Life” project as a representative case. A high-precision full-field monitoring system is established to acquire multi-stage point cloud data throughout the construction process. The collected data are registered with the BIM model to quantify spatial deviations and track the deformation evolution of key structural components. Meanwhile, a staged preloading–unloading strategy is implemented to simulate operational loads, reconstruct load transfer paths, and regulate structural deformation during construction. Based on continuous field measurements, the deformation characteristics of different structural regions, including ring beams, rotating platforms, and trunk–branch systems, are systematically analyzed. The results indicate that the structure exhibits a pronounced global torsional deformation pattern. The displacement of ring beams ranges from 40.35 mm to 80.15 mm, while the maximum local displacement reaches 131.37 mm in geometrically complex regions, primarily attributed to the coupling effects of complex geometry, long cantilever action, stiffness discontinuity, and load concentration. Furthermore, deformation exhibits a progressive and stage-dependent accumulation pattern under sequential loading–unloading processes. The proposed monitoring and control approach achieves millimeter-level accuracy and enables effective feedback for construction adjustment and deviation mitigation. The integration of 3D laser scanning with staged load regulation provides a reliable technical framework for deformation monitoring and control of complex cantilevered steel structures. While the findings are based on a single complex project, further validation on additional cases is required to fully establish the general applicability of the proposed framework, although its integration of 3D monitoring, BIM registration, and staged load regulation suggests potential transferability to other large-scale cantilevered steel structures with similar geometric complexity.
1. Introduction
In recent years, the use of giant cantilevered tree-shaped steel structures has become increasingly common in landmark architectural projects. However, due to the complexity of their structural systems, the massive scale of individual components, the uncertainty of load transfer paths, and the limited collaborative deformation capacity between the cladding panels and the primary steel framework, such structures are highly prone to significant cumulative deformation during construction. This issue becomes especially critical during the cladding installation phase, where deformation control presents considerable challenges. Without effective management, excessive deformation can lead to misalignment at cladding joints, cracking at connection interfaces, and warping of decorative panels. According to relevant Chinese standards for metal and glass curtain walls (e.g., JGJ 336-2016, GB/T 21086-2007) [1,2], the allowable tolerance for joint misalignment is typically within 2–3 mm. Even relatively small structural deformations can exceed these stringent tolerances, making effective deformation control critical for architectural quality.
Deformation control in such structures is further complicated by the staged construction process and the progressive application of loads during installation, which may lead to cumulative deformation and geometric deviations in long cantilever components. These factors induce strong nonlinear and time-dependent responses, which traditional static control methods often fail to address effectively. In recent years, extensive research has been conducted both in China and abroad to address deformation control in complex steel structures, focusing primarily on construction sequencing, welding techniques, and joint design. For example, Yao et al. [3] performed finite element analyses to track stress and displacement evolution during key construction stages, proposing feedback-based sequence optimization strategies to enhance structural safety. Zhao Xiaokang et al. [4] and Lan Liangyun et al. [5] demonstrated that welding sequence significantly affects deformation and residual stress in T-joints and steel frames, with alternating bilateral welding shown to reduce distortion and maintain symmetry. Guo Xiaoming et al. [6] developed reinforced cantilever beam joint designs using steel clamps and embedded bolts, introducing an equivalent strength substitution model to minimize construction deformation. Zhang Xin et al. [7] and Yao et al. [8] further advanced deformation control by optimizing bolted connections through pre-tensioned reverse stretching methods, validated by numerical simulations and field measurements to improve connection accuracy and overall deformation performance.
Meanwhile, the influence of temperature variation on the mechanical performance and deformation behavior of steel structures has been extensively studied, highlighting the significance of temperature compensation techniques in refined construction management. Shi Yongwei et al. [9] investigated the effects of thermal fluctuations on steel properties and deformation, and provided practical design and thermal control recommendations based on case analyses. Liu Jun et al. [10] proposed strategies such as elastic supports, optimized truss geometries and slopes, and segmented construction, which effectively reduced thermal stress in large-span roof structures. He Cheng et al. [11], adopting a biomimetic approach, employed finite element analysis to assess hexagonal grid beams and cast steel joints, demonstrating their efficacy in minimizing thermal internal forces and construction complexity. Fan Zhong et al. [12] emphasized the sensitivity of ultra-long structures to ambient temperature and solar radiation, and revealed that traveling wave effects significantly amplify internal forces; accordingly, they recommended zoned design and construction scheduling adjustments. Wang Xiuli et al. [13] focused on deformation mechanisms under non-uniform temperature fields, advocating for measures such as temperature gaps to mitigate structural responses.
Experimental studies offer empirical insights into structural responses under varying conditions, serving as a vital complement to theoretical research. N. Konkong et al. [14] investigated the buckling behavior of cold-formed steel cantilever trusses through model testing and finite element analysis, proposing a buckling length factor model that incorporates member stiffness, and identified conservatism in current design standards—thereby enhancing deformation control theories. Li et al. [15] conducted six sets of model tests on dual-sided rigid composite cantilever steel-concrete beams, demonstrating the contribution of the bottom concrete slab to load-bearing capacity and stiffness, and proposed a deformation calculation model with improved predictive accuracy. Garcia et al. [16] developed a nonlinear large-deflection contact mechanics model to study Hook and Loop materials, validated its accuracy through physical tests, and proposed a linearized force–displacement equation for deformation control of novel hooked structures. Li et al. [17] utilized total stations, GPS, and fiber Bragg grating (FBG) sensors to monitor displacement and strain in real-time during construction, and optimized construction parameters through numerical simulation, thereby improving deformation control precision. Erdélyi J et al. [18] integrated high-precision total stations, 3D laser scanning, and IoT sensing systems to perform real-time monitoring, and established an error correction model and collaborative control framework to ensure the safety of ultra-long cantilever structures. BARBOSA C. et al. [19] monitored key components of tree-like cantilevered steel structures under loading using multiple technologies, and proposed dynamic adjustment strategies based on monitoring data to ensure accuracy and construction safety. Zhu et al. [20] applied FBG sensors, total stations, and 3D laser scanning to monitor structural deformation and, combined with numerical simulation, optimized construction parameters to enhance both structural safety and construction quality. Therefore, the integration of 3D laser scanning with real-time monitoring technologies has become a critical approach for acquiring high-precision deformation data and enabling dynamic feedback during the construction of complex steel structures.
Moreover, significant progress has been made in deformation prediction of steel structures through finite element analysis, machine learning algorithms, and inverse analysis techniques. Zhou M. et al. [21] developed a numerical simulation method for non-uniform, time-varying temperature fields in long-span steel structures and revealed the substantial impact of cumulative thermal effects during construction. Li J. J. et al. [22] investigated the mechanical degradation of steel wires under various corrosion forms, showing that pitting corrosion has a more pronounced effect on strength and stiffness. Sun S. N. et al. [23] integrated BIM and numerical simulations to enhance structural performance evaluation and information management of radial gate systems. Song et al. [24] analyzed displacement responses in complex prestressed steel structures, validating the safety of inclined columns and prestressed beams. Teng J. et al. [25] employed full-process monitoring to accurately capture structural responses during unloading and closure stages. With the advancement of digital technologies, intelligent construction control of steel structures has been continuously improved. Liu C. T. et al. [26] achieved millimeter-level precision detection and model updating by integrating laser scanning with BIM. Sun W. X. et al. [27] proposed a point-cloud-based intelligent monitoring method, significantly enhancing the accuracy of quality control. Chen Y. et al. [28] improved design precision and construction drawing efficiency of complex steel structures via parametric BIM modeling. Bu H. et al. [29] addressed key technical challenges in robotic welding, advancing intelligent and standardized quality control. Shi L. Z. et al. [30] applied digital twin technology to enable real-time modeling and feedback during construction. Huang Y. Q. et al. [31] developed a computer-vision-based, non-contact deflection monitoring system capable of multi-point, high-precision dynamic tracking for large-scale structures. Du Y. Z. et al. [32] introduced an adaptive focused feature detection network to enhance surface defect recognition accuracy. Duan T. et al. [33] established a comprehensive quality control process for key components, covering embedding, welding, corrosion and fire protection. Cao D. Q. et al. [34] constructed a risk evolution network for construction, providing a scientific basis for systematic risk identification and early warning in complex steel structures. These studies collectively offer crucial theoretical foundations and technical strategies for high-precision deformation control throughout the lifecycle of massive and complex steel structures. Despite the widespread use of 3D laser scanning in structural monitoring, most existing studies focus on final geometric accuracy rather than the progressive deformation evolution under staged loading–unloading processes. Moreover, few studies have quantitatively characterized the coupled global torsional and local displacement patterns in giant cantilevered tree-shaped steel structures. To address these gaps, this study tests the hypothesis that a staged preloading–unloading strategy can actively regulate deformation accumulation and reduce final geometric deviations. The novelty lies in: (1) establishing a time-dependent deformation evolution model based on multi-stage point cloud data; (2) proposing a preloading–unloading–reloading control strategy; and (3) revealing the coupling mechanism between global torsion and local stiffness discontinuity.
The methodological foundation of this study is further supported by several recent advances in related fields. He et al. [35] demonstrated that negative-stiffness vibration absorbers can effectively reduce vibration amplitude through passive control, highlighting the importance of control strategies in structural response regulation. Yang et al. [36] developed a Bayesian substructure identification framework that accounts for measurement uncertainty, providing useful insights for uncertainty quantification in structural analysis. Zou et al. [37] explored the integration of in situ monitoring data with operational decision-making, emphasizing the value of real-time monitoring in construction control. These studies collectively provide relevant theoretical and methodological perspectives that support the development of the present work.
This study makes three distinctive contributions that go beyond a mere combination of existing technologies: (1) A staged preloading–unloading–reloading control strategy. Unlike conventional passive monitoring that detects deviations after they occur, this strategy actively induces pre-deformation and reconstructs load transfer paths during construction, addressing the unique “facade-first, load-bearing-later” construction sequence. (2) Revelation of coupled global torsional–local deformation patterns. While previous studies have reported component-level deformations, the coupled global torsional and local deformation behavior of tree-shaped cantilevered structures has not been quantitatively characterized. Our full-field point cloud analysis reveals a pronounced clockwise torsional trend across the entire structure and demonstrates how stiffness discontinuities and geometric complexity amplify local deformations. (3) A closed-loop “3D monitoring–BIM deviation–feedback control” framework, this framework uniquely integrates point cloud to BIM registration with active load regulation, enabling a paradigm shift from passive inspection to proactive deformation management.
Building upon these contributions, this study establishes a deformation monitoring and control framework for giant cantilevered tree-shaped steel structures using 3D laser scanning technology. A high-precision monitoring system integrating multi-station scanning with construction-stage load control is developed to address deformation challenges during installation. Through point cloud–BIM registration, millimeter-level deformation identification of complex curved surfaces is achieved. Based on measured data, the spatial deformation characteristics and rotational trends of the ring-beam system and branch structures are analyzed. Relying on a representative engineering project, the proposed framework integrates construction simulation with field monitoring data, providing technical support for precision construction and deformation control of similar large-scale irregular steel structures.
2. Project Overview
2.1. General Information
The China Resources International Cultural and Commercial Center project is located in the core area of Qujiang New District, Xi’an, adjacent to Yanzhan Road to the north, Chang’an South Road to the east, and Huixin Road to the west, positioned along the historic central axis of the millennium-old city. The project covers a total area of approximately 92,000 m2, with a total investment of about 9 billion RMB [38]. It aims to create a landmark urban complex that integrates historical heritage, cultural arts, green ecology, and future technologies.
Among the overall development, the Tree of Life is the signature architectural centerpiece. Drawing inspiration from the ancient ginkgo tree at the Guanyin Temple in Xi’an, the design merges modern construction techniques with ecological concepts, embodying the philosophy of harmony between city and nature. Figure 1 shows the architectural rendering of the Tree of Life.
Figure 1.
The architectural rendering of the tree of life.
2.2. Structural System and Morphological Features
The Tree of Life building, reaching a total height of 57 m, is recognized as the world’s first vertical park integrating a complete ecosystem. Its form simulates a giant, flourishing tree, composed of 60 steel leaf panels at different elevations, recreating seven ecological landscapes ranging from grasslands to deserts.
Structurally, the Tree of Life adopts an “external frame + tension ring beam + internal frame” system. The use of 100 mm thick Q460GJC ultra-thick plates allows for “structural slimming” by employing small-section members. The external tension ring beam connects all the leaf panels, forming a large spring-like load-carrying system. Each individual leaf panel weighs approximately 45 tons, with a maximum cantilever length of 17 m. The overall schematic of the tension ring beam is shown in Figure 2.
Figure 2.
The overall schematic of the tension ring beam.
A statistical analysis of the geometric types of the steel skin panels, based on a total of 432 discretized panel units defined in the BIM-based modeling scheme, reveals that flat panels, singly curved panels, and doubly curved panels account for 12.7%, 7.0%, and 80.3%, respectively, highlighting the high degree of geometric complexity. The distribution of these panel types is shown in Figure 3.
Figure 3.
The distribution of panel types.
Functionally and structurally, the Tree of Life can be divided into six major platform systems, including the core tube top platform (RT), top platform (PT), rotating platforms between middle and top levels (ST), middle-level platform leaves (PM), and spiral rising leaves from the basement to the middle levels (SB), as illustrated in Figure 4.
Figure 4.
Schematic diagram of leaf and platform area division.
Due to the significant complexity of the steel cladding system, the surface units are standardized and numbered for monitoring and simulation purposes. Table 1 lists the numbering and corresponding descriptions. All elevation values listed in Table 1 are measured relative to the base slab level. Each of these components serves a critical role in ensuring construction positioning accuracy, deformation control, and load transfer. The construction workflow of the facade structure is illustrated in Figure 5, including structural hoisting, 3D scanning-based modeling, scaffolding erection, facade installation, and subsequent structural finishing works.
Table 1.
List of element numbers and meanings for the covering system of the tree of life.
Figure 5.
Construction process of the facade structure of the “Tree of Life” project.
2.3. Structural Design Specifications
The structural design of the “Tree of Life” follows the Chinese standard “Code for Design of Steel Structures” (GB 50017-2017) [39]. The primary steel material is Q 460 GJC ultra-thick plates (thickness up to 100 mm) for the main frame, and Q 355B for secondary members. Key material properties include: yield strength fy ≥ 460 MPa for Q 460 GJC, tensile strength fu = 550–720 MPa, and elastic modulus E = 206 GPa.
The design load combinations are defined as follows:
where DL includes self-weight (25.0 kN/m3 for concrete slabs, 78.5 kN/m3 for steel), LL includes operational live load (5.0 kN/m2) and green roof load (2.5 kN/m2), and CL represents staged preloading loads equivalent to operational conditions. These combinations follow GB 50017-2017 [39] and GB 50009-2012 [40].
Ultimate Limit State (ULS): 1.3 DL + 1.5 LL
Serviceability Limit State (SLS): 1.0 DL + 1.0 LL
Construction stage: 1.2 DL + 1.4 CL
For weld connections, full-penetration butt welds are adopted for primary load-carrying members, classified as Grade I per GB 50661-2011 [41], with 100% ultrasonic testing (UT) for quality assurance. Fillet welds for secondary members are Grade II. High-strength bolts (Grade 10.9) are used for bolted connections, with pre-tensioning force applied according to GB 50017-2017 specifications. Bolt holes are drilled to ensure dimensional accuracy within ±1.0 mm. These design specifications ensured the structural integrity of the giant cantilevered tree-shaped steel structure during construction.
3. Micro-Deformation Control Method for the Facade Construction of Giant Cantilevered Tree-Shaped Steel Structures
3.1. Load and Unload Methods Under Simulated Operational Loads
To address the deformation control challenges arising from the “facade-first, load-bearing-later” construction sequence of the Life Tree project, this study proposes a coordinated strategy of equivalent preloading and full-process counterweight layout. Prior to facade installation, simulated loads representing operational conditions—such as slab weight and landscaping—are applied to induce pre-deformation and internal force release.
3.1.1. Preloading Mechanism and Simplified Load Calculation
As a representative ultra-high-rise steel structure with long-span cantilevers, the “Tree of Life” project features a façade system subject to multiple load types, including self-weight, landscaping loads, and operational live loads. Due to its unconventional “facade-first, load-bearing-later” construction sequence, the structure is prone to complex deformation responses caused by temporal mismatch during loading. To address this, a three-stage load control strategy—“preloading–unloading–reloading”—was proposed.
The three-stage load control process is implemented with explicit transition criteria based on structural response monitoring. Stage I (Preloading): Loads are gradually applied to simulate the design operational load. The loading process is controlled incrementally, and the stage is terminated when either of the following criteria is met: (a) the measured displacement at key monitoring points (PT-20, PM-6, SB17-3) reaches ≥95% of the target deformation predicted by the FE model; or (b) the displacement increment between successive loading steps falls below 1 mm/day over three consecutive monitoring sessions. Stage II (Unloading): A partial unloading of 30–50% of the maximum applied load is conducted to release residual stresses and evaluate structural recoverability. This stage is completed when the displacement variation over a 24 h hold period is less than 2 mm, indicating that rebound deformation has become negligible. Stage III (Reloading): The load is reapplied to the full target level. The structure is considered stable if the displacement variation between the first and second loading cycles is within 5% at all critical monitoring nodes.
Firstly, the load transfer path was reconstructed through finite element analysis, clarifying a complete load-bearing chain composed of the main structural frame, floor slabs, facade substructure, and decorative panels. Equivalent loads were applied during the facade installation stage to simulate operational loading conditions through preloading. Secondly, a spatial frame model was developed in SAP2000, incorporating material and geometric nonlinearity. The key loading parameters were defined as follows: floor self-weight of 25.0 kN/m3, landscaping soil weight of 13.0 kN/m3, railing line load of 2.0 kN/m, and live load of 5.0 kN/m2. The above loading parameters are determined with reference to relevant design standards, including the Chinese code for load of building structures (GB 50009-2012) [40], and are consistent with commonly adopted values in engineering practice. The equivalent surface loads were computed using the Monte Carlo method with 100,000 randomized scenarios, and the resulting error was controlled within 5%, meeting the required engineering accuracy.
The input parameters, probability distributions, and simulation procedure of the Monte Carlo process are described as follows. The primary input variables include floor self-weight, soil cover load, live load, and façade-related loads. The mean values of these parameters are determined based on design specifications and engineering experience, while their variability is considered to reflect construction uncertainties. In this study, the loads are assumed to follow normal or uniform distributions depending on their characteristics. For example, material self-weight is modeled using a normal distribution with a coefficient of variation of 0.05, whereas live loads are represented using a uniform distribution within ±20% of the mean value. Latin hypercube sampling was employed to generate a total of 100,000 random samples to ensure statistical stability of the simulation results. The convergence of the simulation is evaluated by monitoring the variation in the mean equivalent load with increasing sample size. It is observed that the results become stable when the number of samples exceeds approximately 80,000, and the final error is controlled within 5% (relative error of the total equivalent load per structural platform), which satisfies engineering accuracy requirements. To verify the reliability of the simulation, the calculated equivalent loads are compared with deterministic estimates based on standard load combinations. The comparison shows good agreement, indicating that the Monte Carlo simulation provides a reasonable representation of the load effects during construction.
Using Platform ST-1 as an example, the total preload applied to platform ST-1 (approximately 3255 t) was determined by integrating the equivalent surface loads over the corresponding areas of all sub-regions listed in Table 2. Specifically, the load of each sub-region was calculated as the product of the equivalent surface load (qi, kN/m2) and its corresponding area (Ai, m2). The total preload was then obtained by summing all sub-region contributions:
where qi is the equivalent surface load of sub-region i and Ai is the corresponding area. The resulting total load was subsequently converted into discrete loading modules for field implementation.
Total Load = Σ (qi × Ai)
Table 2.
Partial load calculation process for platform ST-1.
Considering the vertical overlap of “leaf” components and the constraints of transport paths, a refined load arrangement and unloading strategy was developed to ensure the continuity and safety of the structural stress state at all construction stages, while effectively alleviating schedule pressure in subsequent phases. In addition, the FE model was further used to predict structural displacements for selected critical nodes, enabling a direct comparison with field-measured results.
The equivalent surface loads obtained from the FE model were converted into discrete loading modules for field implementation. Specifically, the total load assigned to each structural segment was first calculated by multiplying the equivalent surface load (kN/m2) by the corresponding area. Subsequently, this total load was divided by the capacity of a single loading module to determine the required number of modules. The modules were then arranged according to the structural geometry and load distribution characteristics, as illustrated in Figure 6 and Figure 7, ensuring that the applied loads closely approximate the spatial distribution of the equivalent surface loads.
Figure 6.
First-stage preload distribution layout of platform ST-1.
Figure 7.
Second-stage unloading weight distribution of platform ST-1.
3.1.2. Layout of Load-Bearing Structures and Design of Anchoring System
During the construction loading process, simulating operational loads, a systematic design of the layout strategy and anchoring system is required to ensure the stability, accuracy, and interdisciplinary coordination of the load blocks. The design primarily covers five aspects: selection and optimization of loading modules, layout strategy refinement, anchoring system configuration, adaptive handling of cross-disciplinary construction, and techniques to improve loading density.
- (1)
- Selection and Optimization of Loading Modules
Based on the equivalent load values of each region obtained from structural finite element analysis, different specifications of standard loading modules are selected for optimized combination. Commonly used loading module cross-sectional dimensions include 200 mm × 1000 mm × 1000 mm, 300 mm × 1000 mm × 1000 mm, and 400 mm × 1000 mm × 1000 mm, with the standard module construction shown in Figure 8. By stacking and combining modules of different specifications, precise load matching in the construction area is achieved while also ensuring ease of on-site installation and construction safety.
Figure 8.
Schematic diagram of standard module structure.
- (2)
- Layout Strategy and Construction Path Control
The placement of loading blocks generally proceeds from the core area of the structure outward, with a crane and steel ropes used for batch lifting. The arrangement sequence should follow the principle of structural stability to avoid concentrated loads being applied to cantilever sections without adequate support. In addition, to accommodate the needs of subsequent multi-disciplinary construction, some areas use elevated placement for loading blocks. This not only facilitates the layout of civil engineering, fire protection, mechanical and electrical, and plumbing systems, but also reserves operational space for later unloading and maintenance. The structure of the elevated loading block is shown in Figure 9.
Figure 9.
Schematic diagram of the elevated structure of the loading block.
- (3)
- Anchoring System Design for Load Blocks
To ensure component stability and resistance to slippage during loading operations, the anchoring system typically employs full-welded No. 8 channel steel in combination with ear plate positioning. Weld seams are maintained at approximately 4 mm in height to ensure reliable force transfer and rigid node connections. In complex or peripheral areas, additional measures such as steel pin inserts and short-nail anchoring can be incorporated to enhance slip resistance and improve secondary adjustability.
- (4)
- Adaptive Loading Measures in Special Structural Zones
For areas that are obstructed by structural components (such as blades or railings) or have limited space where the lifting path cannot reach, high-density small steel ingots with dimensions such as 150 mm × 150 mm × 300 mm are used, and are placed and anchored manually. This method is not only flexible for small spaces but also facilitates phased unloading and coordinated lifting control. A physical sample of the custom small unit loading is shown in Figure 10.
Figure 10.
Physical model of customized, special small unit loading sample.
3.2. Deformation Early Warning Technology for Steel Structure Cover Based on 3D Monitoring
With the increasing complexity of architectural structures and the rising demand for construction precision, traditional two-dimensional measurement methods are no longer sufficient for spatial geometry recognition, real-time deformation control, and construction validation in high-complexity steel structure projects. Three-dimensional monitoring technology, with its high accuracy and full-space data acquisition capabilities, provides critical technical support for deformation warning and control during the cladding construction of steel structures.
3.2.1. Fundamental Principles and Classification of 3D Monitoring Technologies
Three-dimensional (3D) monitoring is a high-precision measurement technique based on the acquisition, analysis, and feedback of spatial point cloud data. It primarily relies on high-accuracy instruments such as total stations, laser scanners, and laser trackers to capture structural geometry in real time. This information is integrated with 3D modeling and inversion analysis to reconstruct spatial deformation and predict structural trends. Laser scanners are generally categorized into two types: pulse-based and phase-based. The former calculates distances by measuring the round-trip time of laser pulses, making it suitable for long-range monitoring; the latter uses phase differences between emitted and received beams, achieving millimeter-level accuracy for short-range precision applications.
Depending on the data acquisition method and monitoring objectives, 3D monitoring technologies are classified into four categories: laser scanning (for global surface data of complex geometries), laser tracking (for sub-millimeter monitoring of sensitive key points), high-precision total station monitoring (for periodic observation of control and free points), and 3D photogrammetry with image recognition (for large-scale appearance tracking and auxiliary modeling using UAV imaging and AI techniques).
3.2.2. Development of 3D Monitoring System and Error Control Strategy for Steel Structure Construction
To achieve full-process deformation monitoring and early warning during facade installation, a systematic 3D monitoring framework is established, including “point layout—data acquisition—model reconstruction—error diagnosis—feedback warning.” A multi-level control network is implemented: the primary network covers the entire structure with an error within 0.6 mm, while secondary points reach 1 mm accuracy at the component level. These accuracy values are determined based on the measurement configuration and network adjustment procedures adopted in this study, reflecting the achievable precision under the given survey conditions. The control network was established and adjusted in accordance with standard surveying practices (GB 50026-2020) [42] to ensure internal consistency and stability. Field validation was carried out using 12 control points, yielding a linear closure error of 0.8 mm and an angular closure error of ±3.2″, which confirms that the primary control network accuracy is within ±0.6 mm. For the secondary points, verification was conducted through eight repeated measurements at 10 representative nodes, resulting in a standard deviation of ±0.9 mm, which is consistent with the stated accuracy of ±1.0 mm. Key locations such as free ends and joints are equipped with reflective prisms and laser targets. Point cloud data are collected via terrestrial and handheld scanners, registered and modeled using specialized software, and compared with the BIM model to determine geometric deviations.
Point cloud registration was performed using a hybrid approach combining coarse alignment and fine registration. First, an initial alignment was conducted using several manually selected corresponding feature points between the point cloud and the BIM model to provide a reliable initial pose for the ICP algorithm. Subsequently, the iterative closest point (ICP) algorithm was applied for fine registration to minimize the distance between corresponding point sets. To mitigate potential local optima issues of ICP, the registration results were manually inspected by checking the alignment of characteristic structural features such as ring-beam edges, node intersections, and platform boundaries. In addition, several control points measured by a total station were used as independent references to verify the registration accuracy. The final registration error was controlled within 2 mm. Structural errors are decomposed into translational, rotational, and scaling deviations. A four-level control chain—primary network, layout points, component nodes, and facade joints—forms a closed-loop correction system. Time-series analysis and filtering (e.g., polynomial fitting, moving average, Kalman filter) are applied to extract key displacements and rotations, supporting precise correction and on-site adjustment.
The incorporation of the temporal module and attention mechanism is not only intended to improve predictive performance, but also to provide a more physically meaningful representation of deformation evolution in the tree-like cantilevered steel structure. The temporal module captures the sequential accumulation of deformation during staged construction, reflecting the time-dependent characteristics of load application and structural response. Meanwhile, the attention mechanism enables the model to adaptively focus on critical stages and regions, such as long cantilever branches and key nodes, which are more sensitive to stiffness variation and load asymmetry. This enhances the interpretability of the model by linking learned feature importance to underlying structural behavior. Therefore, the proposed framework contributes to a more mechanistic understanding of construction-induced deformation, beyond purely data-driven prediction. It should be noted that the ‘temporal module’ and ‘attention mechanism’ in this study are conceptual data processing strategies for deformation tracking and critical node prioritization, not trainable neural network components. Hence, no model training or pre-training is required.
3.2.3. 3D Monitoring System and Equipment Configuration for Steel Facade Construction
During the construction of the façade of the Xi’an “Tree of Life” steel structure, a high-precision 3D monitoring system was established to meet the demanding deformation monitoring requirements of the ultra-long cantilever structure under load. The system integrates spatial positioning, deformation acquisition, data fusion, and safety warning functions through multiple advanced instruments, enabling real-time monitoring and accurate control throughout the construction process. The main equipment configuration of the monitoring system is detailed in Table 3.
Table 3.
Main equipment configuration of the monitoring system for the life tree project.
The core device is a high-precision total station (RTS112SR6), capable of monitoring horizontal displacements with an accuracy of ±1.0 mm. It is complemented by a Trimble X7 3D laser scanner, which supports high-resolution modeling and deformation mapping, allowing for visual representation of spatial structural changes. To improve layout accuracy and BIM integration, a BIM layout robot and Bosch GOL32D level were employed, ensuring precise vertical displacement measurements. Additionally, various auxiliary instruments—including laser rangefinders, laser plummets, and magnetic plumb lines—are deployed in constrained or boundary areas to supplement micro-deformation monitoring.
3.2.4. Point Cloud to BIM Integration and Ground Truth Validation
To ensure replicability, the point cloud–BIM integration follows a four-step procedure. First, coordinate unification: all point cloud data are georeferenced using ground control points (GCPs), and the BIM model is exported in the same coordinate system (WGS 84/UTM zone 49N). Second, coarse alignment: three corresponding point pairs (scan vs. BIM) are manually selected at identifiable features (e.g., column corners, ring beam intersections). Third, fine registration: the Iterative Closest Point (ICP) algorithm is applied with a point-to-plane distance metric, maximum iterations = 200, and convergence tolerance = 1 × 10⁻⁶, until the root mean square error (RMSE) falls below 2 mm. Fourth, ground truth validation: following the validation framework of Sharafat et al. [43,44,45], who used terrestrial laser scanning as ground truth for SLAM-generated point clouds, this study employs high-precision total station measurements at 10 key control nodes as the ground truth. The maximum deviation between ICP-registered point clouds and total station measurements is ±2.5 mm (RMSE = 1.8 mm), confirming registration accuracy within engineering tolerance (<3 mm).
4. Application Effect Analysis of Micro-Deformation Control Method in Steel Structure Covering Construction Based on 3D Monitoring
4.1. 3D Laser Scanning-Based Deformation Analysis Method for the Steel Structure of the “Tree of Life” Project
To accurately capture the subtle deformation responses of the “Tree of Life” steel structure during construction, the Trimble X7 terrestrial 3D laser scanning system was employed for multi-angle and multi-station data acquisition. This scanner offers outstanding distance and angular accuracy (±2 mm for distance, ±21″/s for angle), with a distance noise of less than 3 mm within 60 m. Its high-resolution imagery (3840 × 2746 pixels) supports 158 MP data in fast mode and up to 316 MP in high-precision mode, meeting the demands of complex curved-surface modeling and deformation tracking. The registered and merged point cloud modeling results are shown in Figure 11.
Figure 11.
3D scanning model of the “tree of life” project.
Given the complex curvature and frequent occlusions of the “Tree of Life” structure, a redundant multi-angle, multi-station layout strategy was implemented to enhance point cloud coverage and accuracy. Adequate overlap between scanning stations ensured high-density and consistent point cloud fusion. Optimized scan paths and station placement were crucial for improving the precision of micro-deformation monitoring.
The 3D laser scanning model of the “Tree of Life” structure is segmented into distinct regions, including the top platform of the core tube (RT), the topmost platform (PT), the mid-to-upper-level rotating blades (ST), the mid-level platform blades (PM), the spirally ascending blades (SB), and the trunk and branch-like structures. Scanning stations are strategically placed based on the structural characteristics and geometric features of each region to enable high-precision registration between the laser point cloud and the BIM model. The alignment results between the laser-scanned point cloud and the BIM design model are illustrated in Figure 12, where the numbers indicate the displacement of the corresponding monitoring nodes and the different colors distinguish the relative magnitude of the displacement.
Figure 12.
Registration results between the laser-scanned point cloud and the BIM design model.
Taking the top-level platform (PT) as an example, the axial line of the ring beam was first extracted from the point cloud data, followed by contour-based reconstruction to generate a reverse BIM model. In the PT region, the maximum deviation from the BIM design model is approximately 34 mm under self-weight, and the entire ring beam exhibits a clockwise rotational trend. In contrast, the average nodal displacement reaches 40.35 mm, representing the total structural deformation. It should be noted that these two values describe different quantities: the former refers to the deviation relative to the reference geometry, while the latter represents the absolute displacement magnitude. The results indicate a significant out-of-plane rotational response of the platform. To provide a visual overview of the global deformation pattern, Figure 13 summarizes the average and maximum displacements of ring beams in the PT, ST, PM, and SB regions. As shown in Figure 13, the displacement magnitudes increase progressively from the PT region to the SB region. Among them, the PM and SB regions exhibit larger deformation magnitudes and stronger non-uniformity, which can be attributed to their central position, larger structural span, and more complex load transfer paths. In the trunk and branch-like regions, a similar rotational trend is observed, while the vertical deformation remains relatively small.
Figure 13.
Comparison of average and maximum displacements of ring beam systems across different structural regions (PT, ST, PM, and SB).
4.2. Deformation Analysis of Ring Beam Systems
4.2.1. PT Region (Top Platform)
The PT region, located at the top of the core tube, serves as the elevation control benchmark for the entire structural system. This region comprises 24 analysis nodes, sequentially numbered from PT-1 to PT-24 (Figure 14). Following point cloud–BIM registration, displacement extraction and statistical analysis were conducted for all 24 nodes (Figure 15).
Figure 14.
Schematic diagram of node numbering for the PT region analysis.
Figure 15.
Deformation of the most critical nodes and adjacent nodes in the PT region ring beam.
The point cloud analysis results indicate that nodes PT-20 and PT-22 exhibit the most significant displacement responses, with total displacements of 65.06 mm and 63.96 mm, respectively. The maximum vertical displacement reaches 23.13 mm, suggesting a noticeable deflection trend due to the coupling of upper loads and construction disturbances. The average displacement of all PT nodes is approximately 40.35 mm. The entire PT ring beam exhibits a clockwise rotational trend, indicating a significant out-of-plane rotational response of the platform. Based on the displacement distribution, PT-20 and PT-22 are identified as critical nodes for deformation monitoring. It is recommended that local adjustments or pre-camber measures be implemented during subsequent construction stages to compensate for and control these deformations.
4.2.2. ST Region (Rotating Blades)
The ST region ring beam is located on the rotating blades between the mid-level and top-level platforms. It is a critical component connecting the trunk to the supporting structure, and its deformation directly influences the stability and precision of the trunk and branches. In the 3D model, each rotating blade has 4 analysis nodes, resulting in a total of 56 analysis nodes across 14 rotating blades, sequentially numbered from ST1-1 to ST14-4. The specific layout of these analysis nodes is visually presented in Figure 16. The 3D displacements of the 56 nodes, extracted through laser scanning, are shown in Figure 17.
Figure 16.
Schematic of the node numbering in the ST region.
Figure 17.
Deformation of the most critical nodes and adjacent nodes in the ST region ring beam.
The data indicate that nodes ST7-2 and ST9-2 exhibit the most significant deformation, with maximum displacements of 77.49 mm and 80.08 mm, respectively. The highest vertical displacement reaches 17.09 mm, indicating a pronounced rotational trend of the structure. The ST ring beam shows an overall clockwise torsional response. This behavior is consistent with the combined effects of constrained support conditions at the rotating platform and uneven load application during construction. To further quantify these influences, a simplified parametric analysis was conducted using a SAP2000 model, in which two key parameters were varied: (1) support stiffness (±20% of the nominal value), and (2) load distribution pattern (sequential versus uniform installation). The results show that a 20% reduction in support stiffness increases the clockwise displacement at node ST7-2 by approximately 18%, while non-uniform load application leads to an increase of approximately 12%. When both factors are combined, the displacement increases by about 30%. These findings indicate that both factors significantly affect the torsional response, with support stiffness playing a more dominant role and load asymmetry acting as an amplifying factor. Based on these observations, it is recommended that stiffness correction and deformation leveling be implemented prior to structural closure to ensure proper geometric alignment.
4.2.3. PM Region (Mid-Level Platform)
The PM region ring beam serves as the core load-bearing unit of the mid-level platform, playing a crucial role in ensuring the coordinated performance of the upper and lower platforms. A total of 22 node displacement data points were extracted during the scanning analysis, sequentially labeled from PM-1 to PM-22 (Figure 18). The most critical node displacements and their adjacent nodes were analyzed (Figure 19).
Figure 18.
Schematic diagram of node numbering in the PM region.
Figure 19.
Deformation of the most unfavorable node and its adjacent nodes in the PM region ring beam.
According to the data in Figure 19, Nodes PM-6 and PM-12 exhibit the most significant total displacements, reaching 128.62 mm and 123.68 mm, respectively—well above the regional average of approximately 75 mm. This indicates pronounced non-uniform deformation, likely resulting from localized stress concentrations or stiffness discrepancies along the structural boundaries. The 3D point cloud model further reveals that the ring beam exhibits an overall clockwise torsional tendency, accompanied by substantial vertical deflection, with a maximum vertical displacement of 91.60 mm. It is recommended that subsequent optimization measures include improved stiffness compatibility among nodes and adjustments to the position of the neutral axis to enhance structural performance and control deformation.
4.2.4. SB Region (Spiral Ascending)
The SB region spans the helical ascending segment from the basement to the mid-level platform, characterized by complex geometry and variable load paths. Based on laser point cloud data and reverse modeling analysis, a total of 68 monitoring points were extracted and sequentially numbered from SB1-1 to SB17-4 (Figure 20). The deformation values of the most critical node and its adjacent nodes are presented in Figure 21.
Figure 20.
Schematic diagram of node numbering in the SB region.
Figure 21.
Deformation values of the most unfavorable node and its adjacent nodes in the ring beam of the SB region.
As shown in Figure 21, node SB17-3 exhibited the maximum displacement of 131.37 mm, with both horizontal and vertical deformations reaching high levels (80.54 mm and 87.17 mm, respectively). The deformation pattern in this region is strongly influenced by the coupling effect of the long cantilevered and helical layout, leading to pronounced rigid-body rotational tendencies and localized settlement behavior.
Compared with the PT, ST, and PM regions, the SB region exhibits the largest deformation magnitude and the strongest non-uniformity. A progressive increase in deformation is observed from the top platform (PT) to the lower and more geometrically complex regions (PM and SB). This trend reflects the combined effects of increasing cantilever length, reduced stiffness constraints, and more complex load transfer paths.
According to the Chinese steel structure design code (GB 50017-2017) [39], the allowable deflection for cantilever members is typically limited to L/125. For the maximum cantilever length of 17 m in this study, the corresponding allowable deformation is 136 mm. All measured deformations fall below this limit, with values of 65.06 mm in the PT region, 80.08 mm in the ST region, 128.62 mm in the PM region, and 131.37 mm in the SB region. It can be observed that the PM and SB regions approach the code-specified limit, indicating that while the structural performance remains within acceptable bounds, these regions operate relatively close to the allowable threshold and therefore require careful monitoring during construction.
4.3. 3D Deformation Analysis of the Trunk and Branches
As the iconic elements of the mega cantilevered tree-shaped steel structure, the trunk and branches play a crucial role in both the aesthetic appearance and structural integrity. Their deformation not only affects the overall visual harmony of the structure but may also compromise its safety and stability. In particular, significant deformation tends to occur during the unloading phase. Therefore, analyzing the impact of loading and unloading on the overall behavior of the trunk and branches is essential for developing effective deformation control strategies during construction.
The overall 3D deformation monitoring results of the trunk and branches are illustrated in Figure 22. Displacement data of individual trunk and branch components were extracted during the construction process, and a comprehensive analysis of their overall deformation was conducted. The maximum deformation values along each axis for both the trunk and branches are summarized in Table 4.
Figure 22.
Overall 3D monitoring results of the trunk and branches.
Table 4.
Maximum deformation along each axis of the trunk and branches.
Based on the 3D monitoring results of the various regions, the ring beam structures generally exhibit a clockwise displacement trend during the construction stage. The average deformation of platform ring beams ranges from 40.35 mm to 80.15 mm, with the PM platform showing the most pronounced deformation due to its large span and central location.
Although the vertical (Z-direction) displacement in the trunk and branch region is relatively smaller, their overall rotational trend aligns with the deformation direction of the platform ring beams, forming a coupled rotational effect. The maximum displacement reaches 120.10 mm, with an average displacement of approximately 55 mm.
This deformation behavior indicates a typical nonlinear response and a globally coordinated rotational trend during the loading–unloading cycles. Based on the observed deformation characteristics, the installation of local reinforcement at critical nodes (e.g., PT-20, ST9-2, PM-12, SB17-3) is proposed as a potential control measure. These measures were not implemented during the current project, and their effectiveness will be evaluated in future studies. In addition, a three-tiered control strategy is recommended for construction simulation and load guidance, including pre-deviation control, high-frequency monitoring, and error leveling, to ensure geometric accuracy and shape consistency during the installation of the exterior cladding.
4.4. Time-Series Deformation Analysis
To quantitatively assess deformation evolution during construction, five representative control nodes were monitored across five construction stages: Stage I (initial state after main structure completion), Stage II (after preloading), Stage III (after first-stage unloading), Stage IV (after cladding installation), and Stage V (final state after complete unloading). The selected nodes include PT-20 (top platform), PM-6 (mid-level platform, maximum deformation region), SB17-3 (spiral ascending region), ST9-2 (rotating blade), and trunk node 7.
Table 5 summarizes the cumulative deformation at each stage for these five nodes. The results show that deformation increased progressively throughout construction, with the most significant increments occurring during cladding installation (Stage IV). Notably, the staged preloading–unloading strategy successfully regulated deformation accumulation, as evidenced by the moderate increase between Stage II and Stage III compared to the uncontrolled Scenario.
Table 5.
Time-series deformation of representative control nodes across construction stages.
The deformation progression at node PM-6 increased from 0 mm (Stage I) to 128.62 mm (Stage V), with the largest single-stage increment of 16.9 mm occurring during cladding installation (Stage IV). The preloading stage (Stage II) induced approximately 66.6% of the final deformation for this node, while the subsequent unloading (Stage III) resulted in a relatively smaller increment (12.8 mm), demonstrating the effectiveness of the staged control strategy in managing deformation accumulation.
The observed reduction in deformation is directly associated with the implementation of the staged preloading–unloading strategy, indicating a causal relationship between the control measures and deformation mitigation. Previous studies [46] mainly focus on deformation monitoring and prediction; the proposed method integrates real-time monitoring with deformation control, enabling both accurate measurement and effective mitigation of structural deformation. This combined monitoring–control framework provides improved effectiveness compared to conventional passive monitoring approaches.
4.5. Uncertainty Analysis and Measurement Validation
To further assess the reliability of the deformation monitoring results, the uncertainty propagation from measurement errors to the calculated deformation is briefly discussed. The primary sources of uncertainty in this study include: (1) measurement errors from the 3D laser scanning system, (2) registration errors between point cloud data and the BIM model, and (3) instrument precision limitations from total station measurements. These uncertainties may propagate through the data processing workflow and affect the final deformation results, particularly in large-span cantilever structures where cumulative effects may become significant.
To validate measurement accuracy, representative control points were selected for comparison between 3D laser scanning data and independent total station measurements. The results show a mean absolute error of approximately 0.8 mm and a maximum deviation below 1.5 mm, indicating good agreement between the two methods.
In this study, several measures were taken to control and evaluate the overall measurement accuracy. First, all instruments were calibrated prior to data acquisition, and the nominal measurement accuracy was within the millimeter range. Second, selected key monitoring points were independently measured using a total station, which served as reference (“ground truth”) data for validation. The comparison between different measurement methods indicates that the deviations remain within an acceptable engineering tolerance, supporting the reliability of the reported deformation results. Similar validation strategies have been widely adopted in deformation measurement studies. For example, digital image correlation (DIC)-based measurements have been validated against extensometers, showing good agreement and acceptable error levels [47]. This further supports the use of independent measurement systems as reference data for reliability assessment.
Considering instrument accuracy, point cloud noise, and registration errors, the overall measurement uncertainty is estimated to be within ±2–3 mm. The smallest non-zero displacement reported in this study is 6.24 mm. This value is approximately 2–3 times larger than the estimated measurement uncertainty, indicating that even the smallest reported deformation is statistically distinguishable from measurement noise. For larger deformations (e.g.,65.06–131.37 mm), the signal-to-uncertainty ratio ranges from 20 to 65, confirming the statistical significance of all reported deformation values with high confidence. Regarding the vertical displacement components, the smallest observed value is 2.13 mm (node PT-21). This value is comparable to the estimated measurement uncertainty of ±2–3 mm. However, this represents a single displacement component rather than the total displacement; the total displacement at node PT-21 is 43.22 mm, which is significantly larger than the uncertainty. Thus, the presence of measurement noise does not compromise the validity of the reported deformation patterns.
The point cloud registration was performed using the Iterative Closest Point (ICP) algorithm. The residual errors were statistically analyzed, yielding a mean registration error of approximately 1.2 mm, a root mean square (RMS) error of 1.5 mm, and a maximum residual below 2.0 mm. These results confirm the stability and convergence reliability of the registration process.
To improve the statistical rigor of the analysis, basic statistical indicators are introduced to evaluate the deformation results. The mean and standard deviation of the measured deformation are calculated to characterize the overall trend and variability. In addition, 95% confidence intervals are estimated to assess the uncertainty range of the deformation results. Furthermore, the deformation reduction before and after the implementation of the control strategy is compared, indicating a consistent decrease in deformation. This supports the effectiveness of the proposed method.
4.6. Comparison Between Measured and FE-Predicted Deformations
To further validate the reliability of the proposed monitoring and simulation framework, a comparison between field-measured displacements and FE-predicted results was conducted for representative critical nodes. Based on the 3D scanning results, nodes PT-20, ST9-2, PM-6, and SB17-3 were selected due to their significant deformation responses. The corresponding FE predictions were obtained from the SAP2000 model under equivalent loading conditions. As shown in Table 6, the FE-predicted displacements are generally in good agreement with the measured values, with relative errors ranging from 5% to 8%. The FE model successfully captures the overall deformation pattern, including the increasing displacement trend from PT to SB regions.
Table 6.
Comparison between measured and FE-predicted displacements at critical nodes.
Notably, larger discrepancies are observed in the SB region, which can be attributed to the complex helical geometry and coupled deformation mechanisms, including torsion, bending, and local settlement effects. In addition, construction-stage factors such as welding deformation, temporary supports, and load redistribution are not fully represented in the numerical model. Overall, the FE model demonstrates reasonable predictive capability for global deformation trends, although local discrepancies remain due to modeling simplifications and construction uncertainties.
4.7. Limitations and Future Work
Despite the demonstrated effectiveness of the proposed method, several limitations should be acknowledged. (1) Scalability: The current monitoring framework was validated on a single project with a height of 57 m and a cantilever length of 17 m. While the methodological framework is transferable, the practical implementation—including scanner placement, number of scanning stations, and point cloud processing parameters—may require adjustment for structures with significantly different scales (e.g., taller buildings or longer cantilevers). Future work should validate the method on a diverse range of structural typologies to establish quantitative guidelines for parameter scaling. (2) Cost: The proposed system requires a 3D laser scanner, a high-precision total station, and specialized software for point cloud processing and BIM integration. While these costs are justifiable for large-scale landmark projects, they may be prohibitive for smaller or budget-constrained projects. Future work could explore cost-effective alternatives, such as terrestrial photogrammetry or mobile scanning devices, for lower-budget applications. (3) Implementation challenges for other projects: First, the staged preloading–unloading strategy requires project-specific calibration of load magnitudes and sequences based on structural analysis. Second, successful point cloud–BIM registration depends on the availability of a detailed BIM model and clearly identifiable geometric features for coarse alignment. Third, the proposed method assumes uninterrupted scanner access and stable environmental conditions; adverse weather or restricted site access may hinder data collection. Environmental factors such as temperature variation and wind loads were not quantitatively incorporated into the deformation analysis. While these factors may influence structural behavior, this study focused on construction-stage deformation control under controlled monitoring conditions. Future work will include a quantitative assessment of environmental effects and the development of standardized workflows to facilitate broader adoption.
In addition to the 3D laser scanning and BIM-based workflow developed in this study, the reconstructed as-built geometry can be further integrated into finite element (FE) models for advanced nonlinear analysis. Such integration enables the incorporation of geometric imperfections and construction-induced deviations into structural simulations, which are critical factors influencing stability and failure behavior. Previous studies have demonstrated that geometric imperfections obtained from measurement or scanning play a decisive role in accurately predicting buckling behavior and deformation responses of steel members. For instance, experimental and numerical investigations on asymmetric steel columns have shown that FE models calibrated with realistic geometric conditions can reliably reproduce load–displacement responses and failure modes [48]. Similarly, in studies on retrofitted steel members, initial imperfections derived from 3D scanning were directly incorporated into nonlinear FE analyses, leading to high agreement between simulation and experimental results in terms of deformation patterns and ultimate capacity [49]. Moreover, recent research on structural retrofitting has highlighted that the stability performance of compression members is highly sensitive to parameters such as slenderness ratio, stiffness enhancement, and initial geometric defects, and that these effects can be effectively quantified through parametric FE analysis [50]. Therefore, extending the proposed point cloud–BIM framework to include FE-based nonlinear analysis represents a promising direction for future work. This integration would enable not only accurate deformation monitoring but also performance-based evaluation and predictive assessment of structural stability under realistic construction conditions.
4.8. Practical Value and Engineering Implications
In the context of construction monitoring and control of complex cantilevered steel structures, the proposed method demonstrates practical value in several aspects. First, the staged preloading–unloading strategy enables proactive deformation control during construction, reducing deformations by approximately 15–35% compared to uncontrolled scenarios. This effectively mitigates cladding joint misalignment and connection cracking, which are critical quality concerns in complex steel structures. Second, the 3D laser scanning–based monitoring framework achieves millimeter-level accuracy (±0.6 mm for the primary control network) and provides full-field deformation visualization, allowing engineers to identify critical nodes (e.g., PT-20, PM-6, SB17-3) that require targeted monitoring. Third, the comparison between measured deformations and finite element predictions validates the numerical model, supporting more reliable construction planning.
These results demonstrate that the proposed method is not only theoretically sound but also operationally feasible. The overall workflow—including multi-station scanning, point cloud–BIM registration, and staged load regulation—can be directly applied or adapted to similar large-scale cantilevered steel structures, such as airport terminals, stadium canopies, and industrial facilities with complex spatial geometries.
5. Conclusions
This study addresses the deformation control challenges of the “Tree of Life” ultra-long overhanging tree-shaped steel structure during complex construction stages. By leveraging high-precision 3D scanning technology, a comprehensive monitoring and control system was established, integrating data acquisition, deformation reconstruction, early warning, and error correction. Based on theoretical modeling, field measurement, and feedback analysis, the study yields the following key conclusions and innovations:
- (1)
- The proposed monitoring approach achieved high measurement accuracy, with ±0.6 mm for the primary control network and ±1.0 mm for secondary points, as verified through field validation. The results demonstrate that deformation monitoring based on point cloud–BIM integration is capable of capturing complex spatial deformation patterns in large-scale cantilevered steel structures. The analysis further reveals that regions such as PM and SB exhibit relatively larger displacements and are more challenging to control during construction, highlighting the importance of targeted monitoring in these areas. Compared with conventional surveying methods, the proposed approach provides improved spatial resolution and better support for construction control and deformation assessment.
- (2)
- Key regions of the structure exhibit pronounced torsional deformation and spatial displacement, primarily governed by component layout and load transmission paths. Analysis reveals a clockwise torsional trend across the structure. Platform ring beams experience horizontal displacements between 28.95 mm and 91.30 mm, with a peak vertical displacement of 23.13 mm in the PT area and a maximum overall spatial displacement of 65.06 mm. The PM region shows the most severe deformation, attributed to long cantilever spans, concentrated loads, and insufficient connection stiffness. These results highlight the critical role of structural configuration in deformation behavior. The comparison between FE predictions and field measurements confirms that the numerical model can reasonably capture both global deformation trends and local displacement characteristics.
- (3)
- Point cloud-based inversion and alignment with BIM effectively identify deviations between as-built and design conditions. By extracting component centerlines and profiles from high-precision point cloud data and aligning them with the BIM model, geometric deviations arising during construction are intuitively visualized. This method is particularly effective in detecting lifting errors, welding deviations, and accumulated deformation in super-long cantilevered structures, offering valuable technical support for construction accuracy control and shape correction.
- (4)
- Structural deformation is strongly coupled with spatial configuration, with distinct deformation patterns observed in different structural node zones. Deformation is mainly concentrated in areas of abrupt load path changes and complex geometric nodes, such as rotating blades, trunk-branch junctions, and platform edges. In the rotating blade zones, uneven cantilever lengths and frequent changes in cross-sectional geometry lead to significant torsion and asymmetric deformation. In the platform area, stiffness discontinuities and component convergence contribute to local deformation concentrations. These patterns emphasize the dominant role of spatial geometry in controlling global stiffness distribution and deformation modes.
Although this study is based on a specific complex architectural project, the proposed monitoring and control framework is not limited to this particular structure. The methodology, including 3D laser scanning-based deformation monitoring, point cloud–BIM integration, and staged construction control, can be extended to other large-span, irregular, and cantilevered steel structures with similar geometric and construction characteristics. It is acknowledged that the quantitative results presented in this study are case-specific and may vary depending on structural form, loading conditions, and construction sequence. However, the overall approach and workflow provide a generalizable reference for deformation monitoring and control in complex spatial structures. Similar perspectives have been discussed in previous studies [51], where engineering case-based investigations are used to develop transferable methodologies and practical frameworks for broader applications. Therefore, the contribution of this study lies not only in the specific project results, but also in the establishment of a systematic monitoring and feedback mechanism applicable to similar engineering scenarios.
Author Contributions
Conceptualization, W.Z. and T.Y.; data curation, W.Z.; methodology, C.J.; software, F.Y.; validation, T.Y.; formal analysis, X.T.; investigation, C.J.; resources, J.G.; writing—original draft preparation, Z.Z. and X.T.; writing—review and editing, Z.Z.; visualization, Y.W.; supervision, F.Y.; project administration, J.G.; funding acquisition, Y.W. All authors have read and agreed to the published version of the manuscript.
Funding
This research was supported by the National Key R&D Program of China (Project No. 2023YFC3009300). The funding organization had no role in the study design, data collection and analysis, decision to publish, or preparation of the manuscript.
Data Availability Statement
The data that support the findings of this study are available from the corresponding author upon reasonable request.
Conflicts of Interest
Authors Weicheng Zhang, Yuan Wang, Caiji Jiang, Jing Guo and Fan Yang were employed by the China Construction Dongfang Decoration Co., Ltd. The remaining authors declare that the research was conducted in the absence of any commercial or financial relationships that could be construed as a potential conflict of interest.
References
- JGJ 336-2016; Technical Code for Engineering of Artificial Panel Curtain Wall. Ministry of Housing and Urban-Rural Development of the People’s Republic of China: Beijing, China, 2016.
- GB/T 21086-2007; Curtain Wall for Building. Standardization Administration of the People’s Republic of China: Beijing, China, 2007.
- Yao, G.; Li, R.; Yang, Y.; Cai, X.; Zhou, Y.; Zhou, C.; Lei, T. Analysis of Mechanical Properties during Construction Stages Reflecting the Construction Sequence for Long-Span Spatial Steel Structures. Buildings 2024, 14, 2389. [Google Scholar] [CrossRef] [Scilit]
- Zhao, X.K.; Zhang, H.; Yao, Z.; Hou, G. Effect of Welding Sequence on Deformation and Residual Stress in T-Joint Welded Connections. MW Met. Form. 2020, 02, 50–55. [Google Scholar]
- Lan, L.; Shao, G.; Zhang, Y.; Wang, Y. Influence of Welding Sequence on Residual Stress and Deformation of T-Joint of Q690 Steel. J. Northeast. Univ. 2020, 41, 1741–1746. [Google Scholar]
- Guo, X.; Liu, Y.; Xie, Y.; Wang, X. Joint Design and Construction of Enlarge Steel Cantilever Beam. Constr. Technol. 2014, 43, 59–61. [Google Scholar]
- Zhang, X.; Han, S.; Zhou, G.; Liu, T. Research and Application of Mechanical Properties of Continuous Cantilever Concrete Structure Supporting Platform. Constr. Technol. 2022, 51, 106–113. [Google Scholar]
- Yao, W.; Hao, Z.; Feng, Z.; Yang, L.; Dong, L.; Min, B. Construction Method and Process Optimization of Prestress Reverse Tensioning for Large-Span Bidirectional Suspension Steel Roof Structures. Adv. Civ. Eng. 2024, 2024, 1668290. [Google Scholar] [CrossRef] [Scilit]
- Shi, Y.; Li, L. Analysis of the Influence of Temperature on the Stability of Building Steel Structures. Technol. Mark. 2019, 26, 176–177. [Google Scholar]
- Liu, J.; Liu, Y.; Li, G.; Jing, J.; Liu, P. Temperature stress analysis and measures of large-span steel roof structure of National Exhibition and Convention Center in Shanghai. Build. Struct. 2020, 50, 40–45. [Google Scholar]
- He, C. Structural design of steel roofs supported by dendritie columns at the First Peoples’ Hospital of Honghe Prefecture. Build. Struct. 2022, 52, 1131–1136. [Google Scholar]
- Fan, Z.; Liu, X.; Liu, T.; Gao, S.; Chai, H.; Han, W.; Yang, H.; Wang, J.; Yang, S.; Liu, J. Study on temperature and traveling wave effect of super-long structure of Terminal 2 of Jinan Yaoqiang Airport. J. Build. Struct. 2022, 44, 1–13. [Google Scholar]
- Wang, X.; Luo, X.; Xun, B. Temperature effect of long span steel roof considering special environment. Spat. Struct. 2024, 30, 53–60. [Google Scholar]
- Konkong, N.; Aramraks, T.; Phuvoravan, K. Buckling Length Analysis for Compression Chord in Cold-Formed Steel Cantilever Truss. Int. J. Steel Struct. 2017, 17, 775–787. [Google Scholar] [CrossRef] [Scilit]
- Li, Y.; Xing, W.; Kong, Q.; Ren, P.; Ding, J.; Li, Y. Experimental and Theoretical Study on Mechanical Properties of Steel-Concrete Double-Sided Composite Cantilever Beams. Structures 2021, 30, 101–114. [Google Scholar] [CrossRef] [Scilit]
- Garcia, G.A.; Wakumoto, K.M.; Brown, J.J. Large-Deflection Nonlinear Mechanics of Curved Cantilevers under Contact Point Loading. J. Appl. Mech.-Trans. 2021, 88, 121004. [Google Scholar] [CrossRef] [Scilit]
- Li, S.; Zhu, S.; Xu, Y.-L.; Chen, Z.-W.; Li, H. Long-Term Condition Assessment of Suspenders under Traffic Loads Based on Structural Monitoring System: Application to the Tsing Ma Bridge. Struct. Control Health Monit. 2012, 19, 82–101. [Google Scholar] [CrossRef] [Scilit]
- Blišťan, P.; Molčíková, S.; Hurčíková, V. Advances and Trends in Geodesy, Cartography and Geoinformatics. In Proceedings of the 10th International Scientific and Professional Conference on Geodesy, Cartography and Geoinformatics (GCG 2017), Demänovská Dolina, Low Tatras, Slovakia, 10–13 October 2017; CRC Press: London, UK, 2018. [Google Scholar]
- Barbosa, C.; Martins, R.; Alves, C.; Faro, P. Monitoring and Control of the Longest Suspension Bridge in Brazil during Its Complex Rehabilitation Process. In Proceedings of the Fifth Conference on Smart Monitoring Assessment and Rehabilitation of Civil Structures, Potsdam, Germany, 27–29 August 2019. [Google Scholar]
- Zhu, Y.; Sun, D.; Guo, H.; Shuang, M. Fine Analysis for Non-Uniform Temperature Field and Effect of Railway Truss Suspension Bridge under Solar Radiation. J. Constr. Steel Res. 2023, 210, 108098. [Google Scholar] [CrossRef] [Scilit]
- Zhou, M.; Fan, J.; Liu, Y.; Zhang, J.; Duan, X.; Lei, S. Non-Uniform Temperature Field and Effect on Construction of Large-Span Steel Structures. Autom. Constr. 2020, 119, 103339. [Google Scholar] [CrossRef] [Scilit]
- Li, J.; Zhang, X. Steel Wire Mechanical Property Degradation Study Based on Numerical Simulation. Adv. Mater. Sci. Eng. 2022, 2022, 2207585. [Google Scholar] [CrossRef] [Scilit]
- Sun, S.; Zhang, R.; Liu, X.; Liu, C.; Wang, A. Numerical Simulation and Application of Radial Steel Gate Structure Based on Building Information Modeling under Different Opening Degrees. Water 2024, 16, 636. [Google Scholar] [CrossRef] [Scilit]
- Song, X. Construction Analysis and Monitoring of Complex Prestressed Steel Structure. ce/papers 2025, 8, 1386–1394. [Google Scholar] [CrossRef] [Scilit]
- Teng, J.; Lu, W.; Cui, Y.; Zhang, R. Temperature and Displacement Monitoring to Steel Roof Construction of Shenzhen Bay Stadium. Int. J. Struct. Stab. Dyn. 2016, 16, 1640020. [Google Scholar] [CrossRef] [Scilit]
- Lu, C.; Wang, L.; Yang, Z.; Liu, X.; Zhang, X.; Wu, L. The Application of Laser-Scanning-Based BIM Technology in Large Steel Structure Engineering for Environmental Protection. Math. Probl. Eng. 2022, 2022, 4665141. [Google Scholar] [CrossRef] [Scilit]
- Sun, W.; Wang, J.; Jin, F.; Li, G.; Xu, F. Intelligent Construction Monitoring Method for Large and Complex Steel Structures Based on Laser Point Cloud. Buildings 2023, 13, 1749. [Google Scholar] [CrossRef] [Scilit]
- Chen, Y.; Zheng, S. Advances in Transdisciplinary Engineering; IOS Press: Amsterdam, The Netherlands, 2024. [Google Scholar]
- Bu, H.; Cui, X.; Huang, B.; Peng, S.; Wan, J. Research Review and Future Directions of Key Technologies for Welding Robots in the Construction Industry. Buildings 2024, 14, 2261. [Google Scholar] [CrossRef] [Scilit]
- Shi, L.; Ding, Y.; Cheng, B. Development and Application of Digital Twin Technique in Steel Structures. Appl. Sci. 2024, 14, 11685. [Google Scholar] [CrossRef] [Scilit]
- Huang, Y.; Feng, R.; Zhong, C.; Tong, X.; Shao, X.; Gu, L.; Hui, Z. Computer Vision-Based Real-Time Deflection Monitoring of Complex and Sizeable Steel Structures. Eng. Struct. 2024, 305, 117752. [Google Scholar] [CrossRef] [Scilit]
- Du, Y.; Chen, H.; Fu, Y.; Zhu, J.; Zeng, H. AFF-Net: A Strip Steel Surface Defect Detection Network via Adaptive Focusing Features. IEEE Trans. Instrum. Meas. 2024, 73, 3398131. [Google Scholar] [CrossRef] [Scilit]
- Duan, T.; Duan, T.; Chen, Y.; Lu, R. Construction Technology of Steel Structures in Large Public Buildings. Adv. Comput. Eng. Technol. Res. 2024, 1, 67–72. [Google Scholar] [CrossRef] [Scilit]
- Cao, D.; Cheng, L. Risk Accumulation Assessment Method for Building Construction Based on Complex Network. Eng. Constr. Archit. Manag. 2025, 32, 1522–1545. [Google Scholar] [CrossRef] [Scilit]
- He, D.; Yang, N.; Liu, Y.; Xu, H.; Li, G.; Duan, Z.; Wang, T. Nonlinear Vibration and Vibration Transmission of Roll Controlled by Negative Stiffness Vibration Absorbers. Mech. Syst. Signal Process. 2026, 245, 113872. [Google Scholar] [CrossRef] [Scilit]
- Yang, J.; Liu, Y.; Lu, X.; Wang, T. An Adaptive Measurement-Based Substructure Identification Framework for Dynamic Response Reconstruction. Mech. Syst. Signal Process. 2025, 239, 113277. [Google Scholar] [CrossRef] [Scilit]
- Zou, B.; Yin, J.; Zhang, W.; Long, X. Fractal Analysis of Limestone Damage under Successive Impact by Shield Disc Cutters. Eng. Fract. Mech. 2025, 322, 111163. [Google Scholar] [CrossRef] [Scilit]
- Xi’an Public Resources Trading Center. Pre-Qualification Announcement for the First Section of Xi’an China Resources International Cultural and Commercial Center Project. Available online: https://sxggzyjy.xa.gov.cn/jydt/001001/001001001/001001001001/20220419/4028883e801823c8018028bfda472965.html (accessed on 19 April 2022).
- GB 50017-2017; Standard for Design of Steel Structures. Ministry of Housing and Urban-Rural Development of the People’s Republic of China: Beijing, China, 2017.
- GB 50009-2012; Load Code for the Design of Building Structures. Ministry of Housing and Urban-Rural Development of the People’s Republic of China: Beijing, China, 2012.
- GB 50661-2011; Code for Welding of Steel Structures. Ministry of Housing and Urban-Rural Development of the People’s Republic of China: Beijing, China, 2011.
- GB 50026-2020; Standard for Engineering Surveying. Ministry of Housing and Urban-Rural Development of the People’s Republic of China: Beijing, China, 2020.
- Benrouba, F.; Sharafat, A.; Ullah, A.; Seo, J. Autonomous Productivity Measurement NDT-SLAM-Based Algorithm for Excavator Earthwork Operations. KSCE J. Civ. Eng. 2025, 168, 105789. [Google Scholar] [CrossRef] [Scilit]
- Cho, H.S.; Latif, K.; Sharafat, A.; Seo, J. Multi-Modal Excavator Activity Recognition Using Two-Stream CNN-LSTM with RGB and Point Cloud Inputs. Appl. Sci. 2025, 15, 8505. [Google Scholar] [CrossRef] [Scilit]
- Sharafat, A.; Khan, M.S.; Latif, K.; Seo, J. BIM-Based Tunnel Information Modeling Framework for Visualization, Management, and Simulation of Drill-and-Blast Tunneling Projects. J. Comput. Civ. Eng. 2021, 35, 04020068. [Google Scholar] [CrossRef] [Scilit]
- Yin, Q.; Tan, X.; Hu, Z.; Huang, M. Measurement and Analysis of Deformation of Underlying Tunnel Induced by Foundation Pit Excavation. Adv. Civ. Eng. 2023, 2023, 8897139. [Google Scholar] [CrossRef] [Scilit]
- Luo, Y.X.; Dong, Y.L.; Yang, F.Q.; Lu, X.Y. Ultraviolet Single-Camera Stereo-Digital Image Correlation for Deformation Measurement up to 2600 °C. Exp. Mech. 2024, 64, 1343–1355. [Google Scholar] [CrossRef] [Scilit]
- Shi, G.; Liu, C.; Zhang, Z.; Zhou, L.; Zhao, H. Investigations on Buckling Behavior of Asymmetric L-Shaped Box-T Section Columns under Eccentric Compression. Thin-Walled Struct. 2025, 211, 113047. [Google Scholar] [CrossRef] [Scilit]
- Zhou, S.; Shi, G.; Wang, S.; Zhou, L.; Zhao, H. Retrofitting of Circular Steel Tubes against Overall Buckling Using Stiffened Sleeves: Simulation and Design. J. Constr. Steel Res. 2026, 236, 109999. [Google Scholar] [CrossRef] [Scilit]
- Shi, G.; Zhou, S.; Wang, S.; Zhao, H. Retrofitting of Circular Steel Tubes against Overall Buckling Using Stiffened Sleeves: Concept and Experiments. Thin-Walled Struct. 2025, 208, 112868. [Google Scholar] [CrossRef] [Scilit]
- Yao, D.; Zhang, L.; Liu, H.; Liu, M.; Wang, L.; Xu, M. Deformation Monitoring and Stress Distribution Prediction of 3D-Printed Hydroxyapatite Scaffolds. Int. J. Bioprint. 2024, 10, 4460. [Google Scholar] [CrossRef] [Scilit]


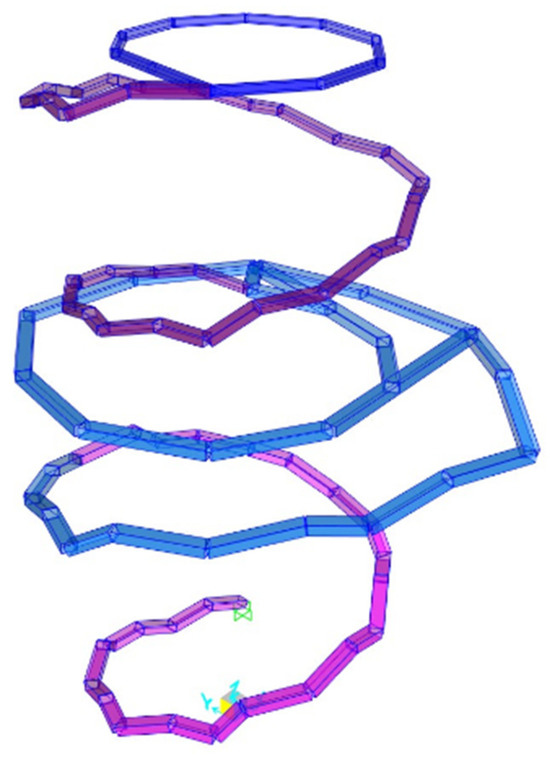
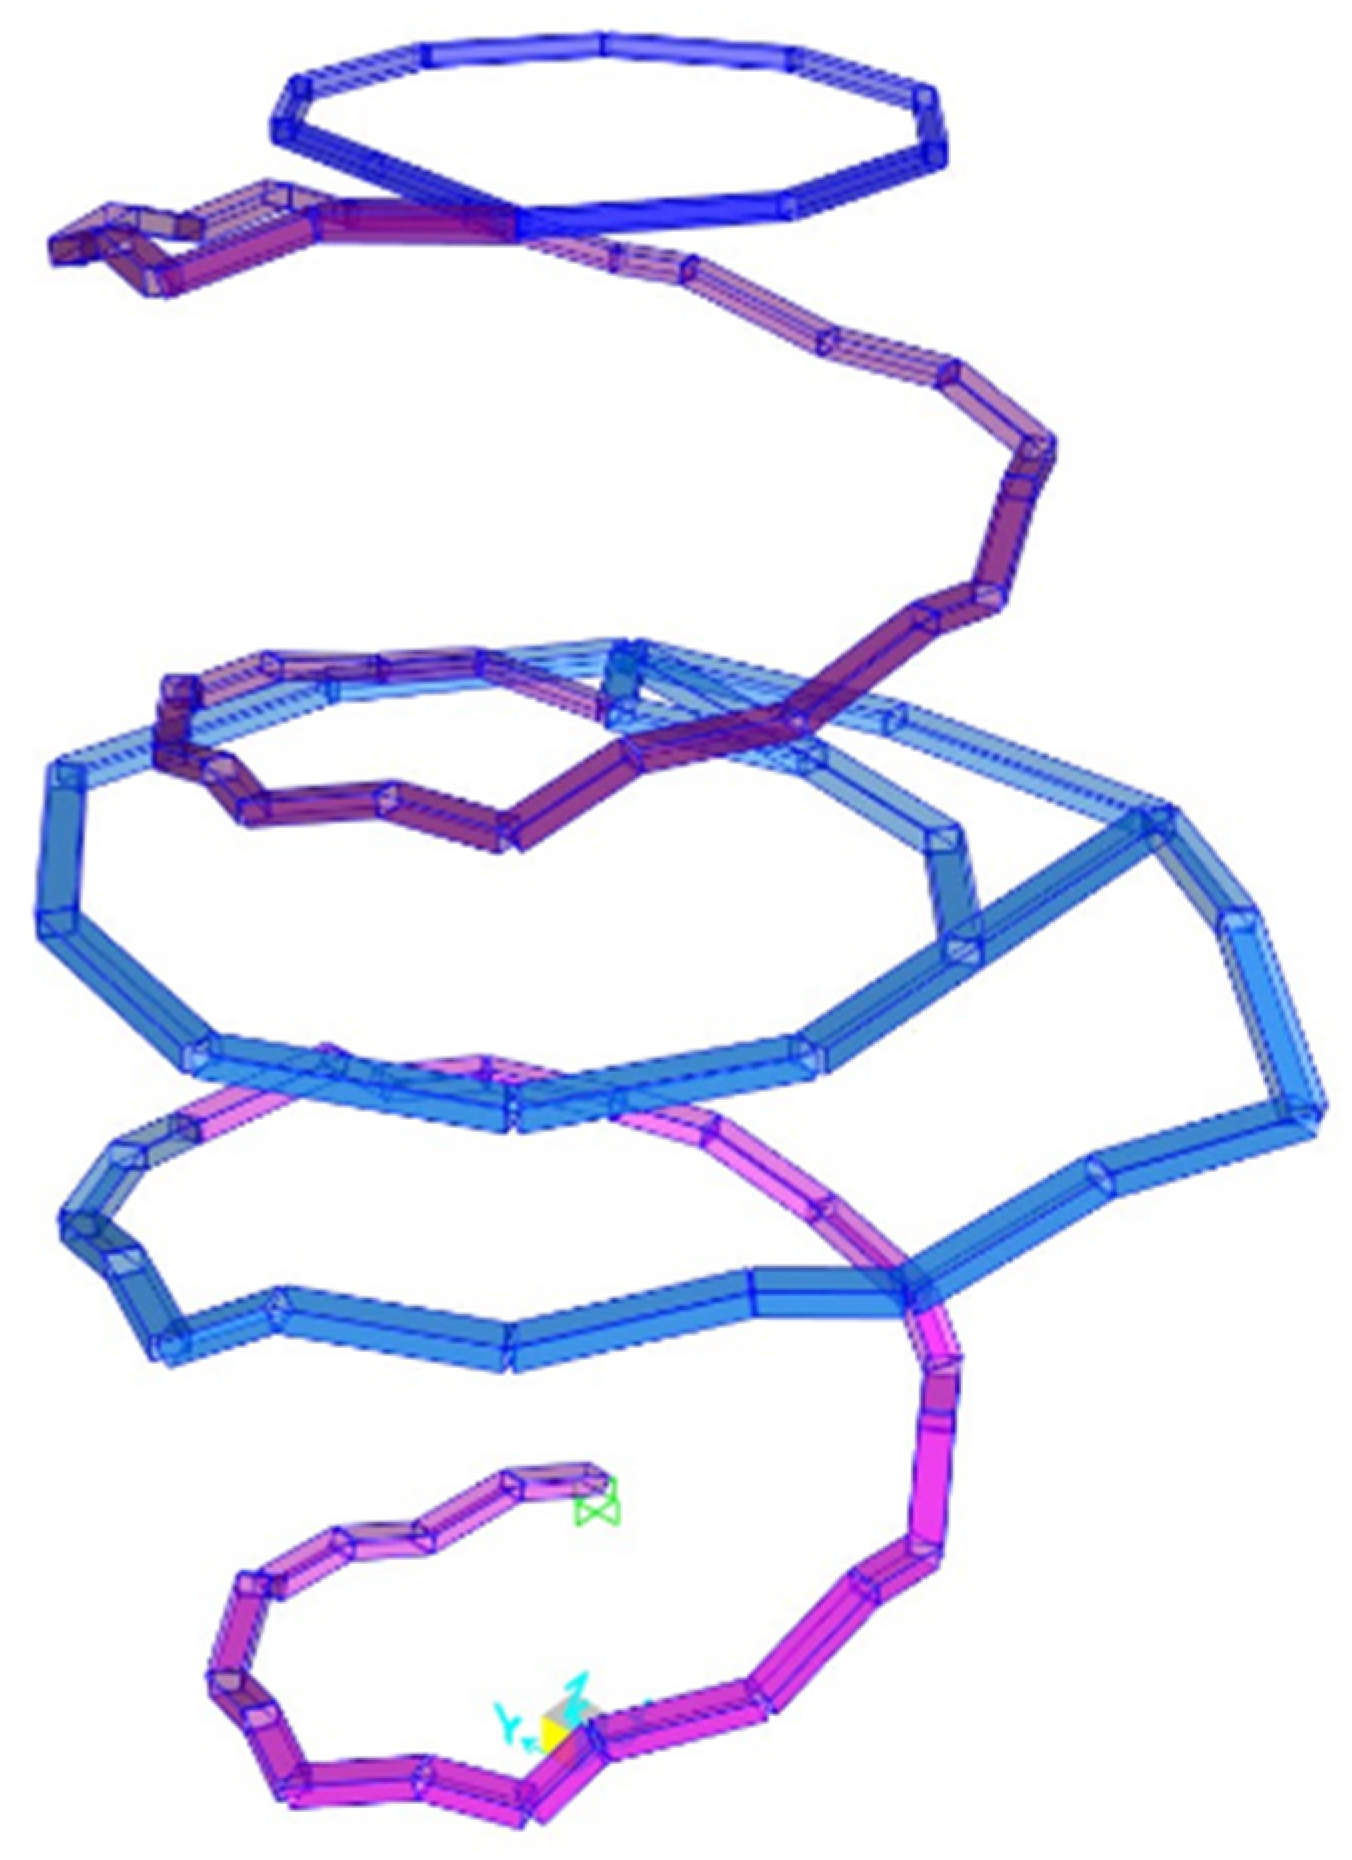
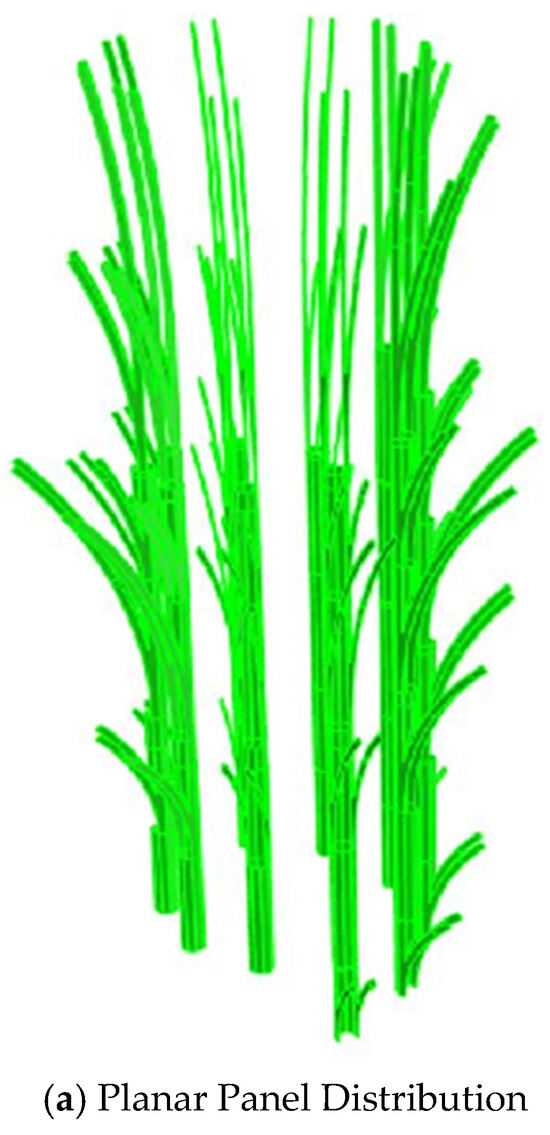
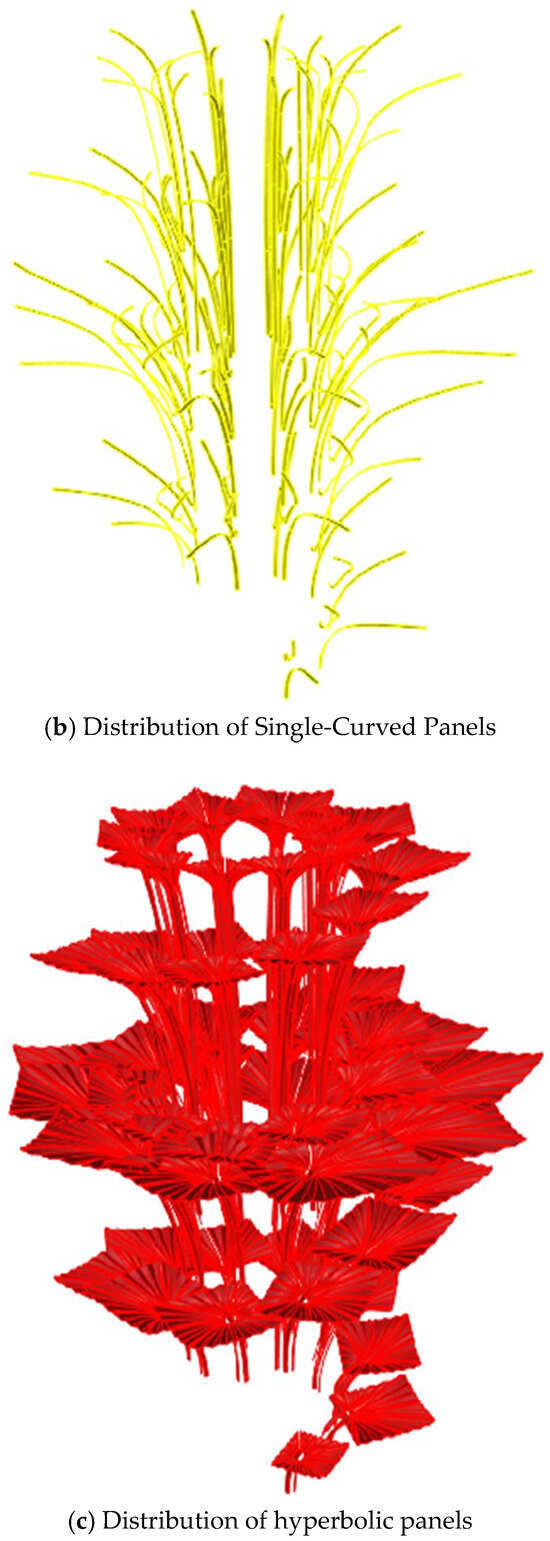
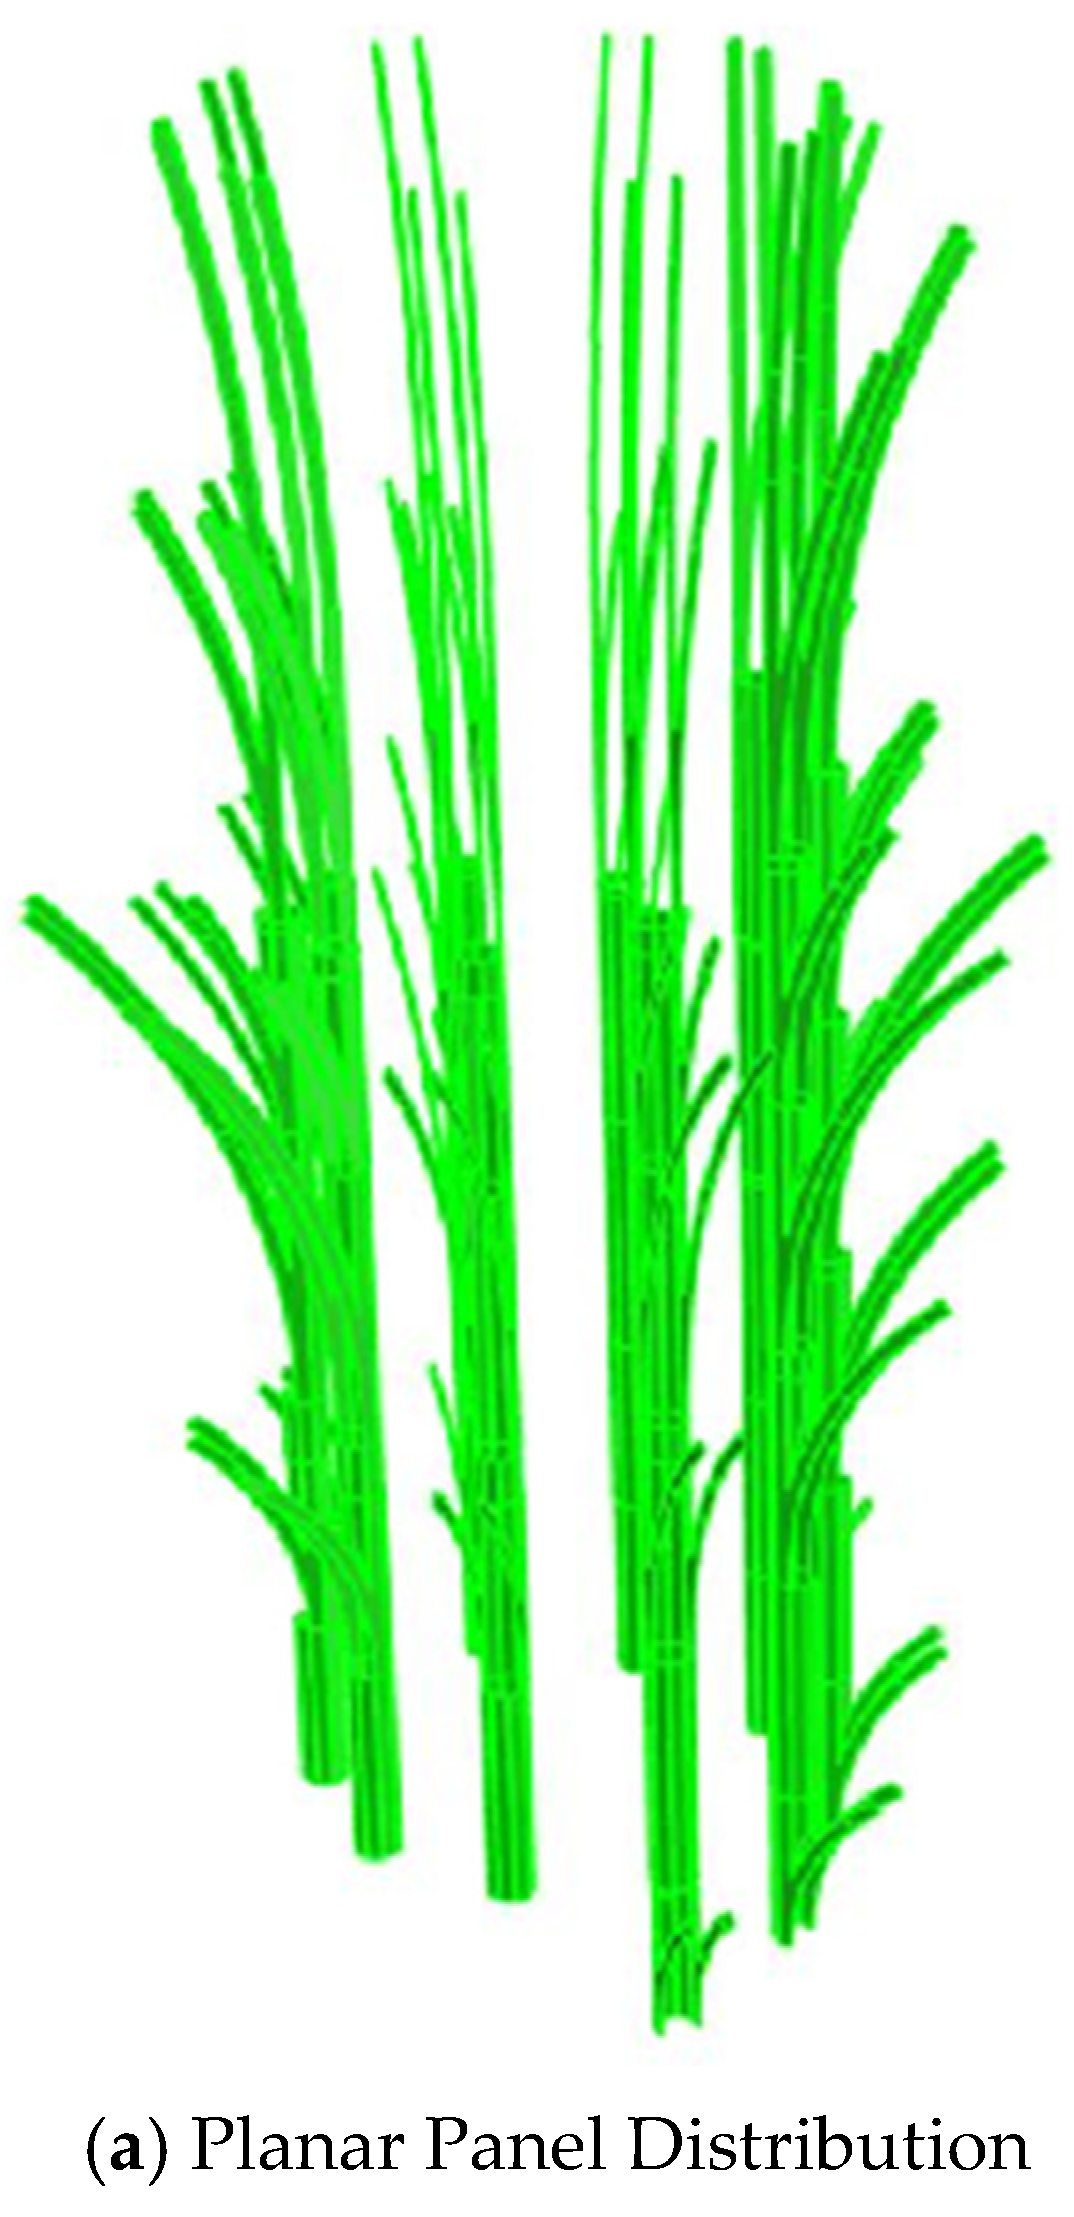
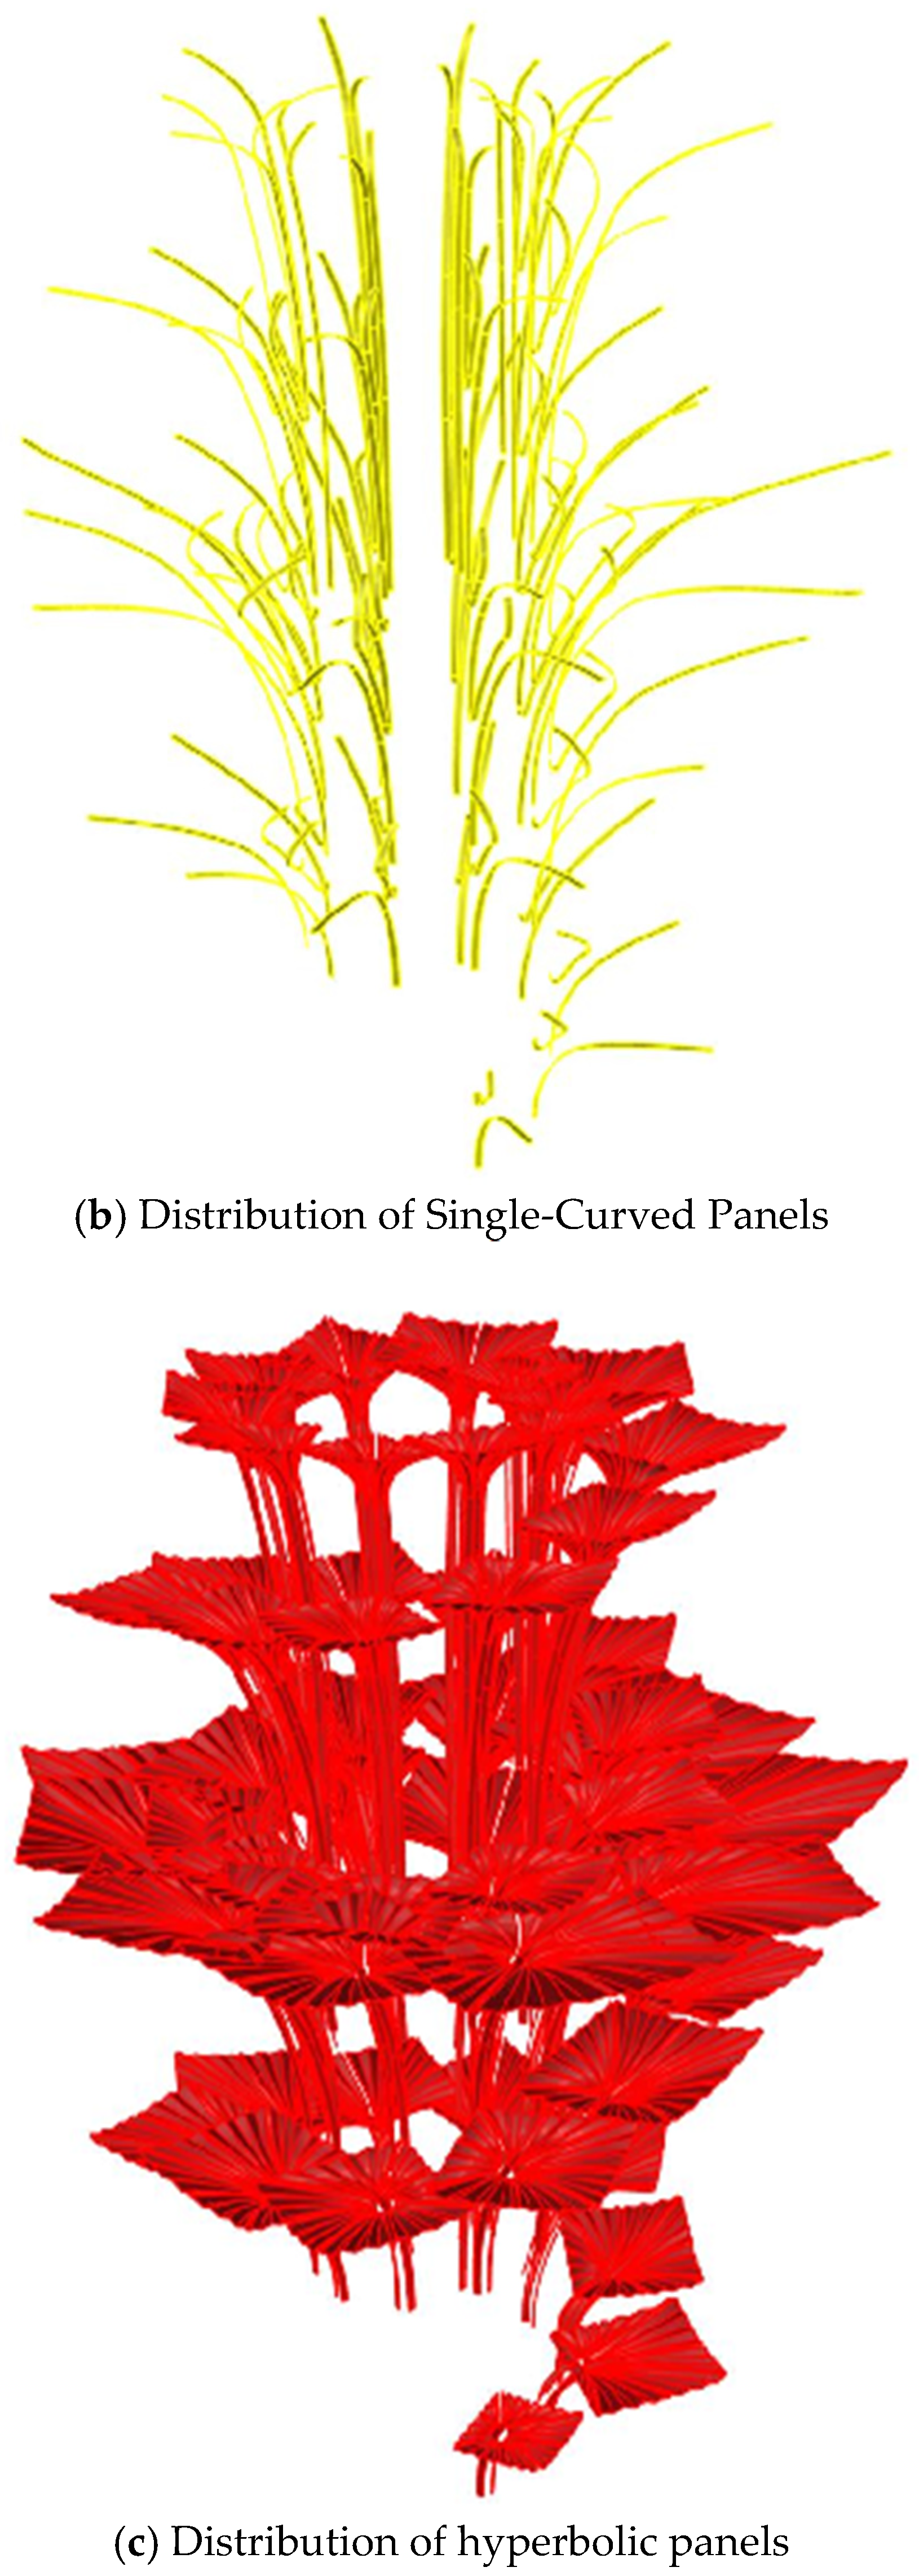
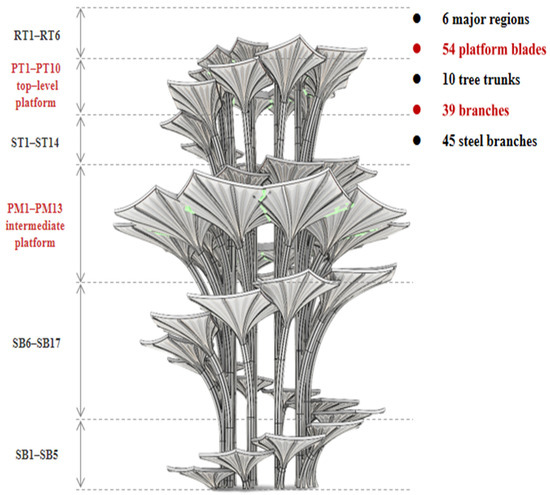
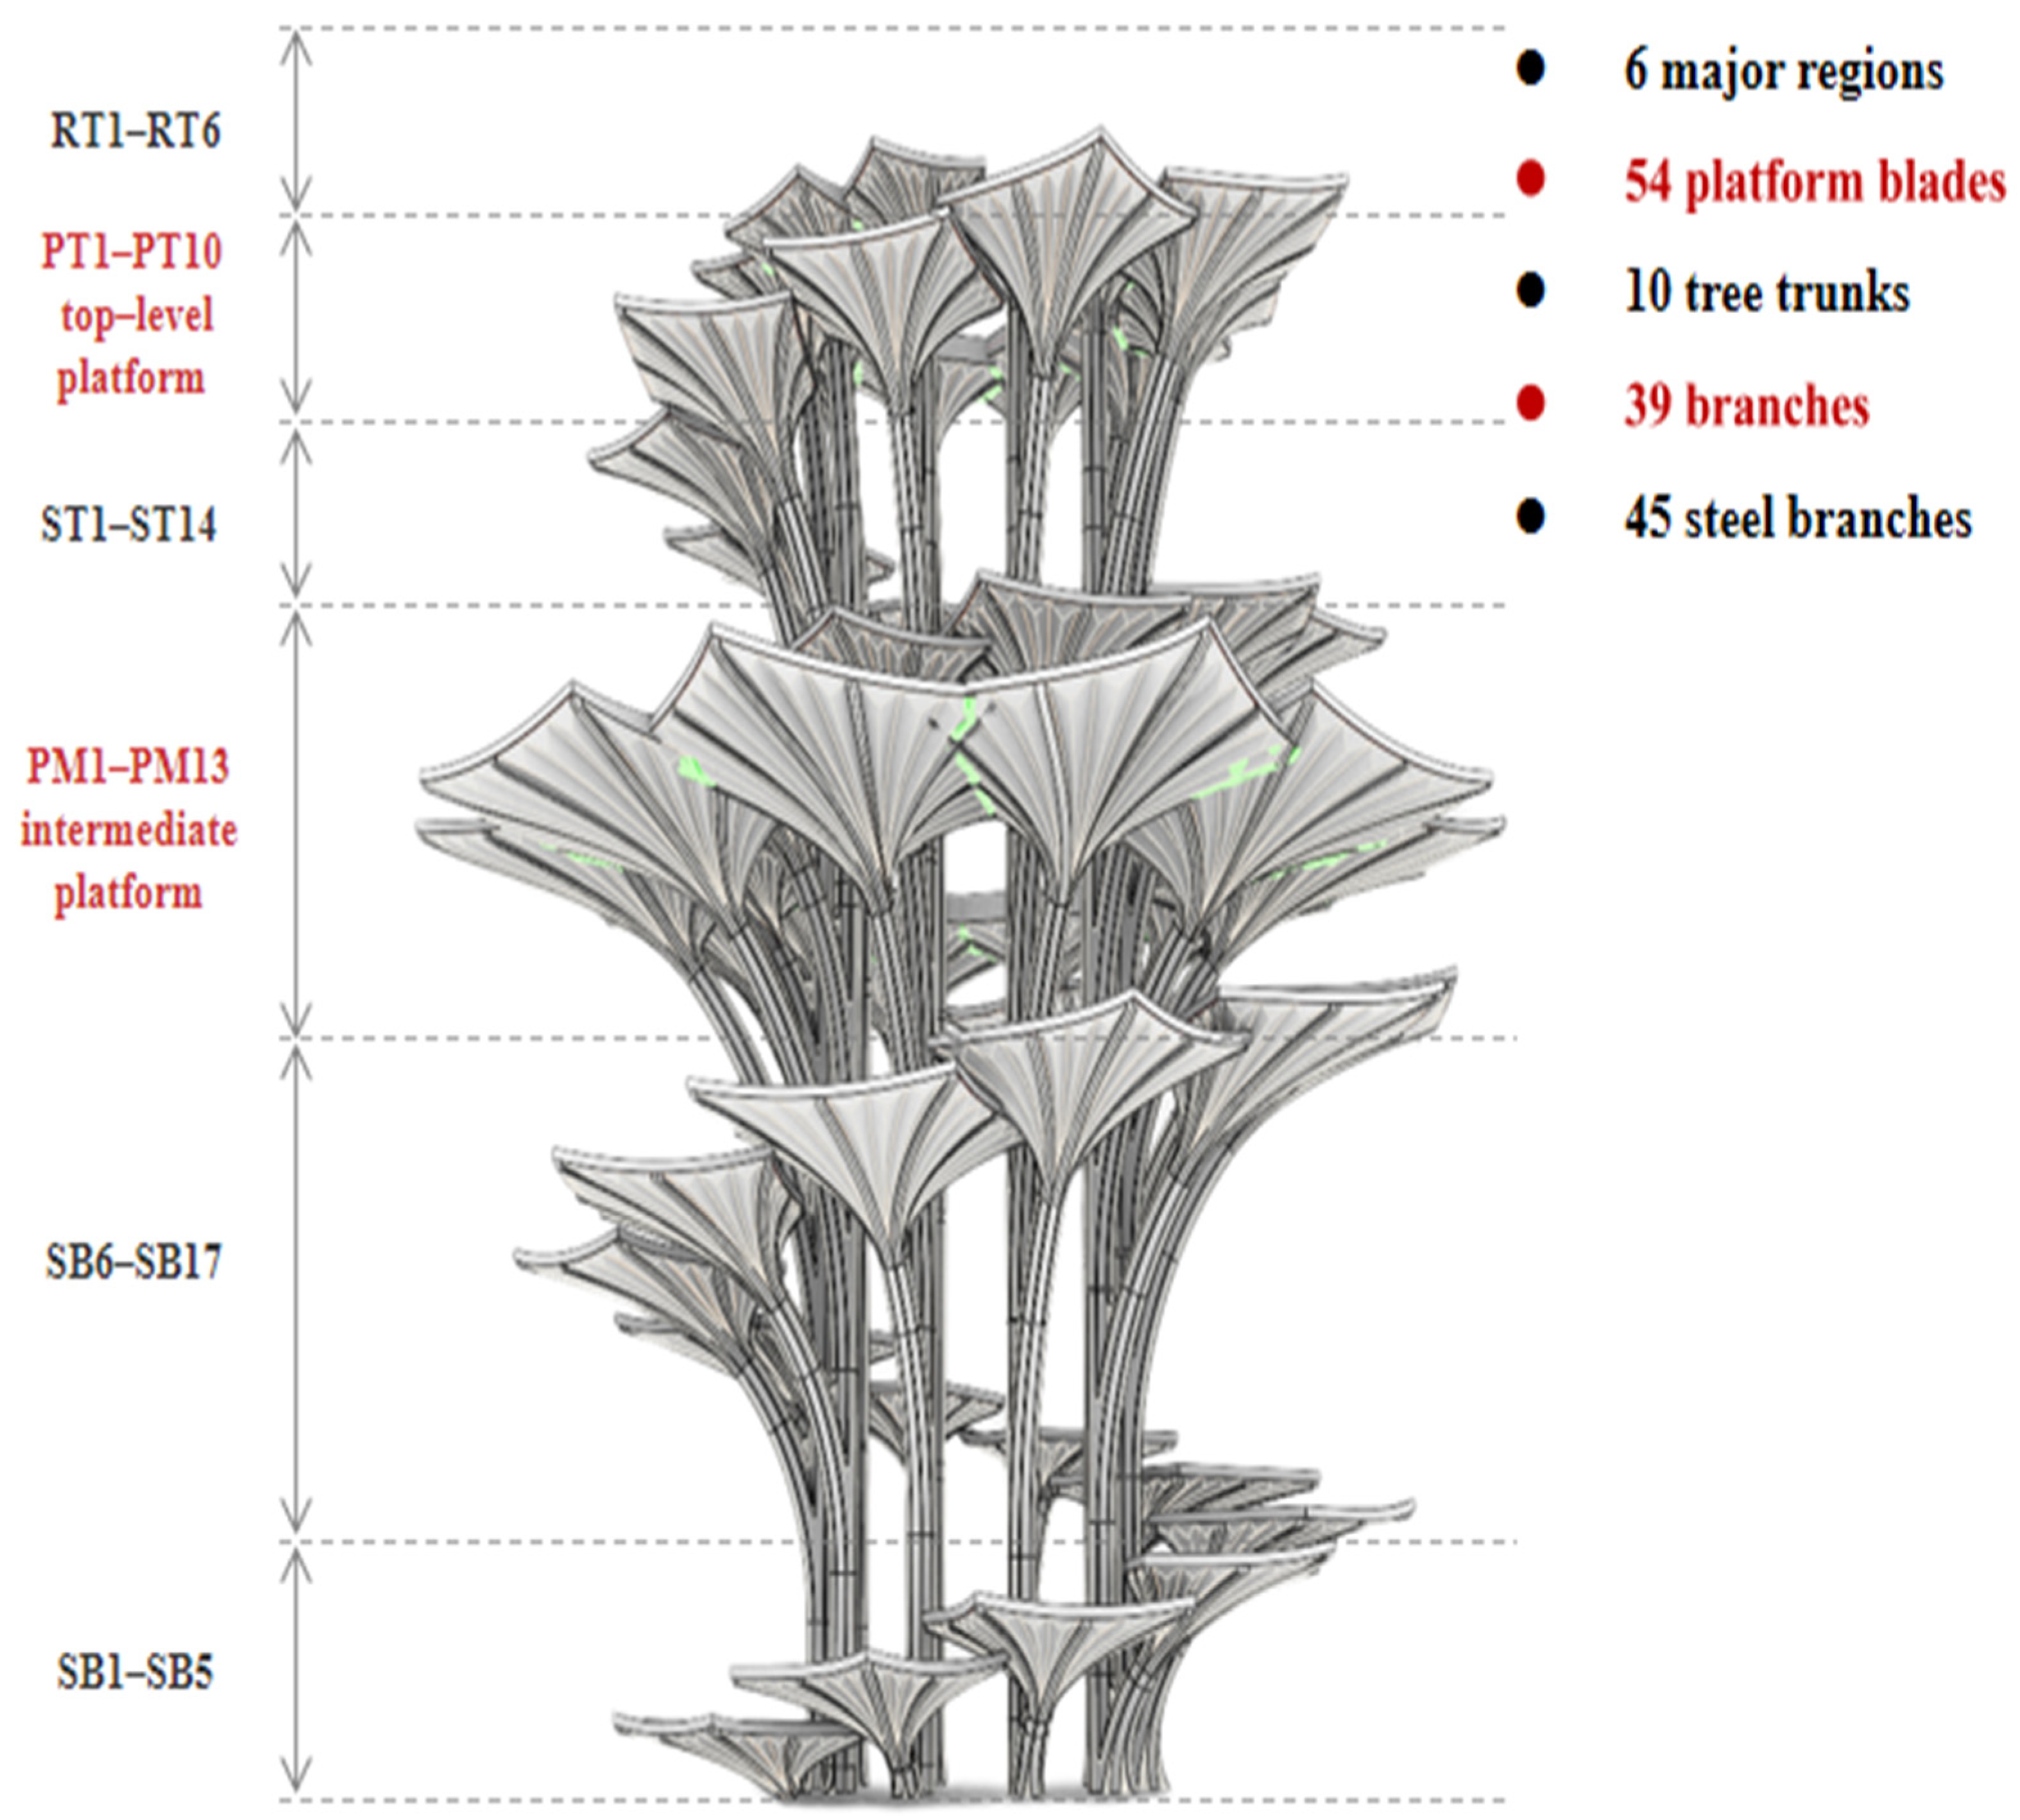
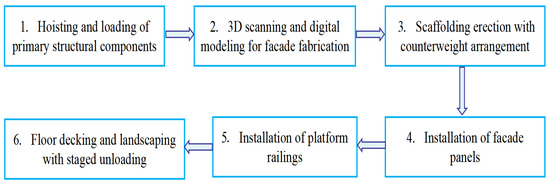
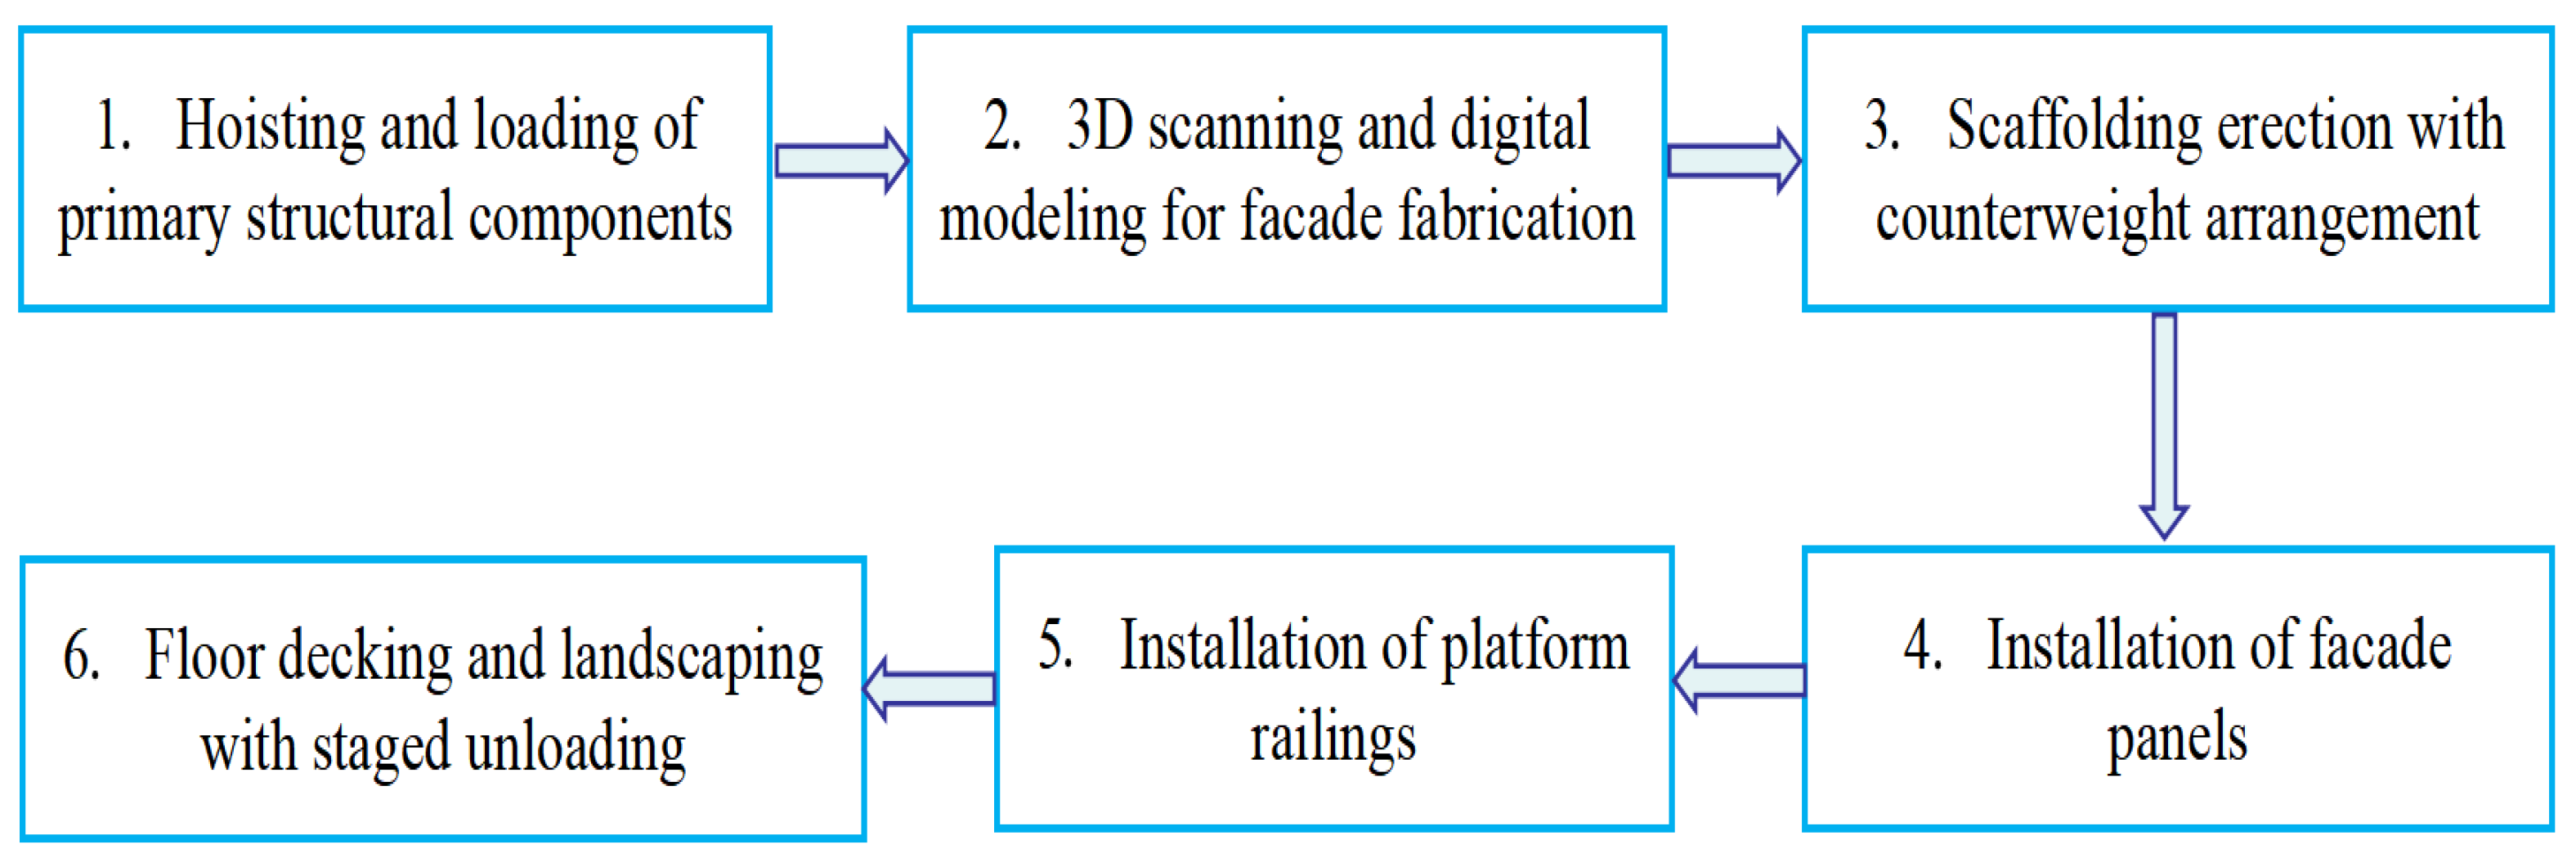
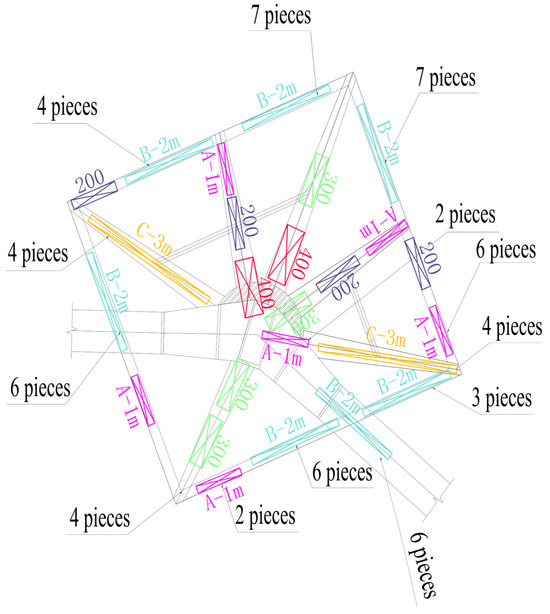
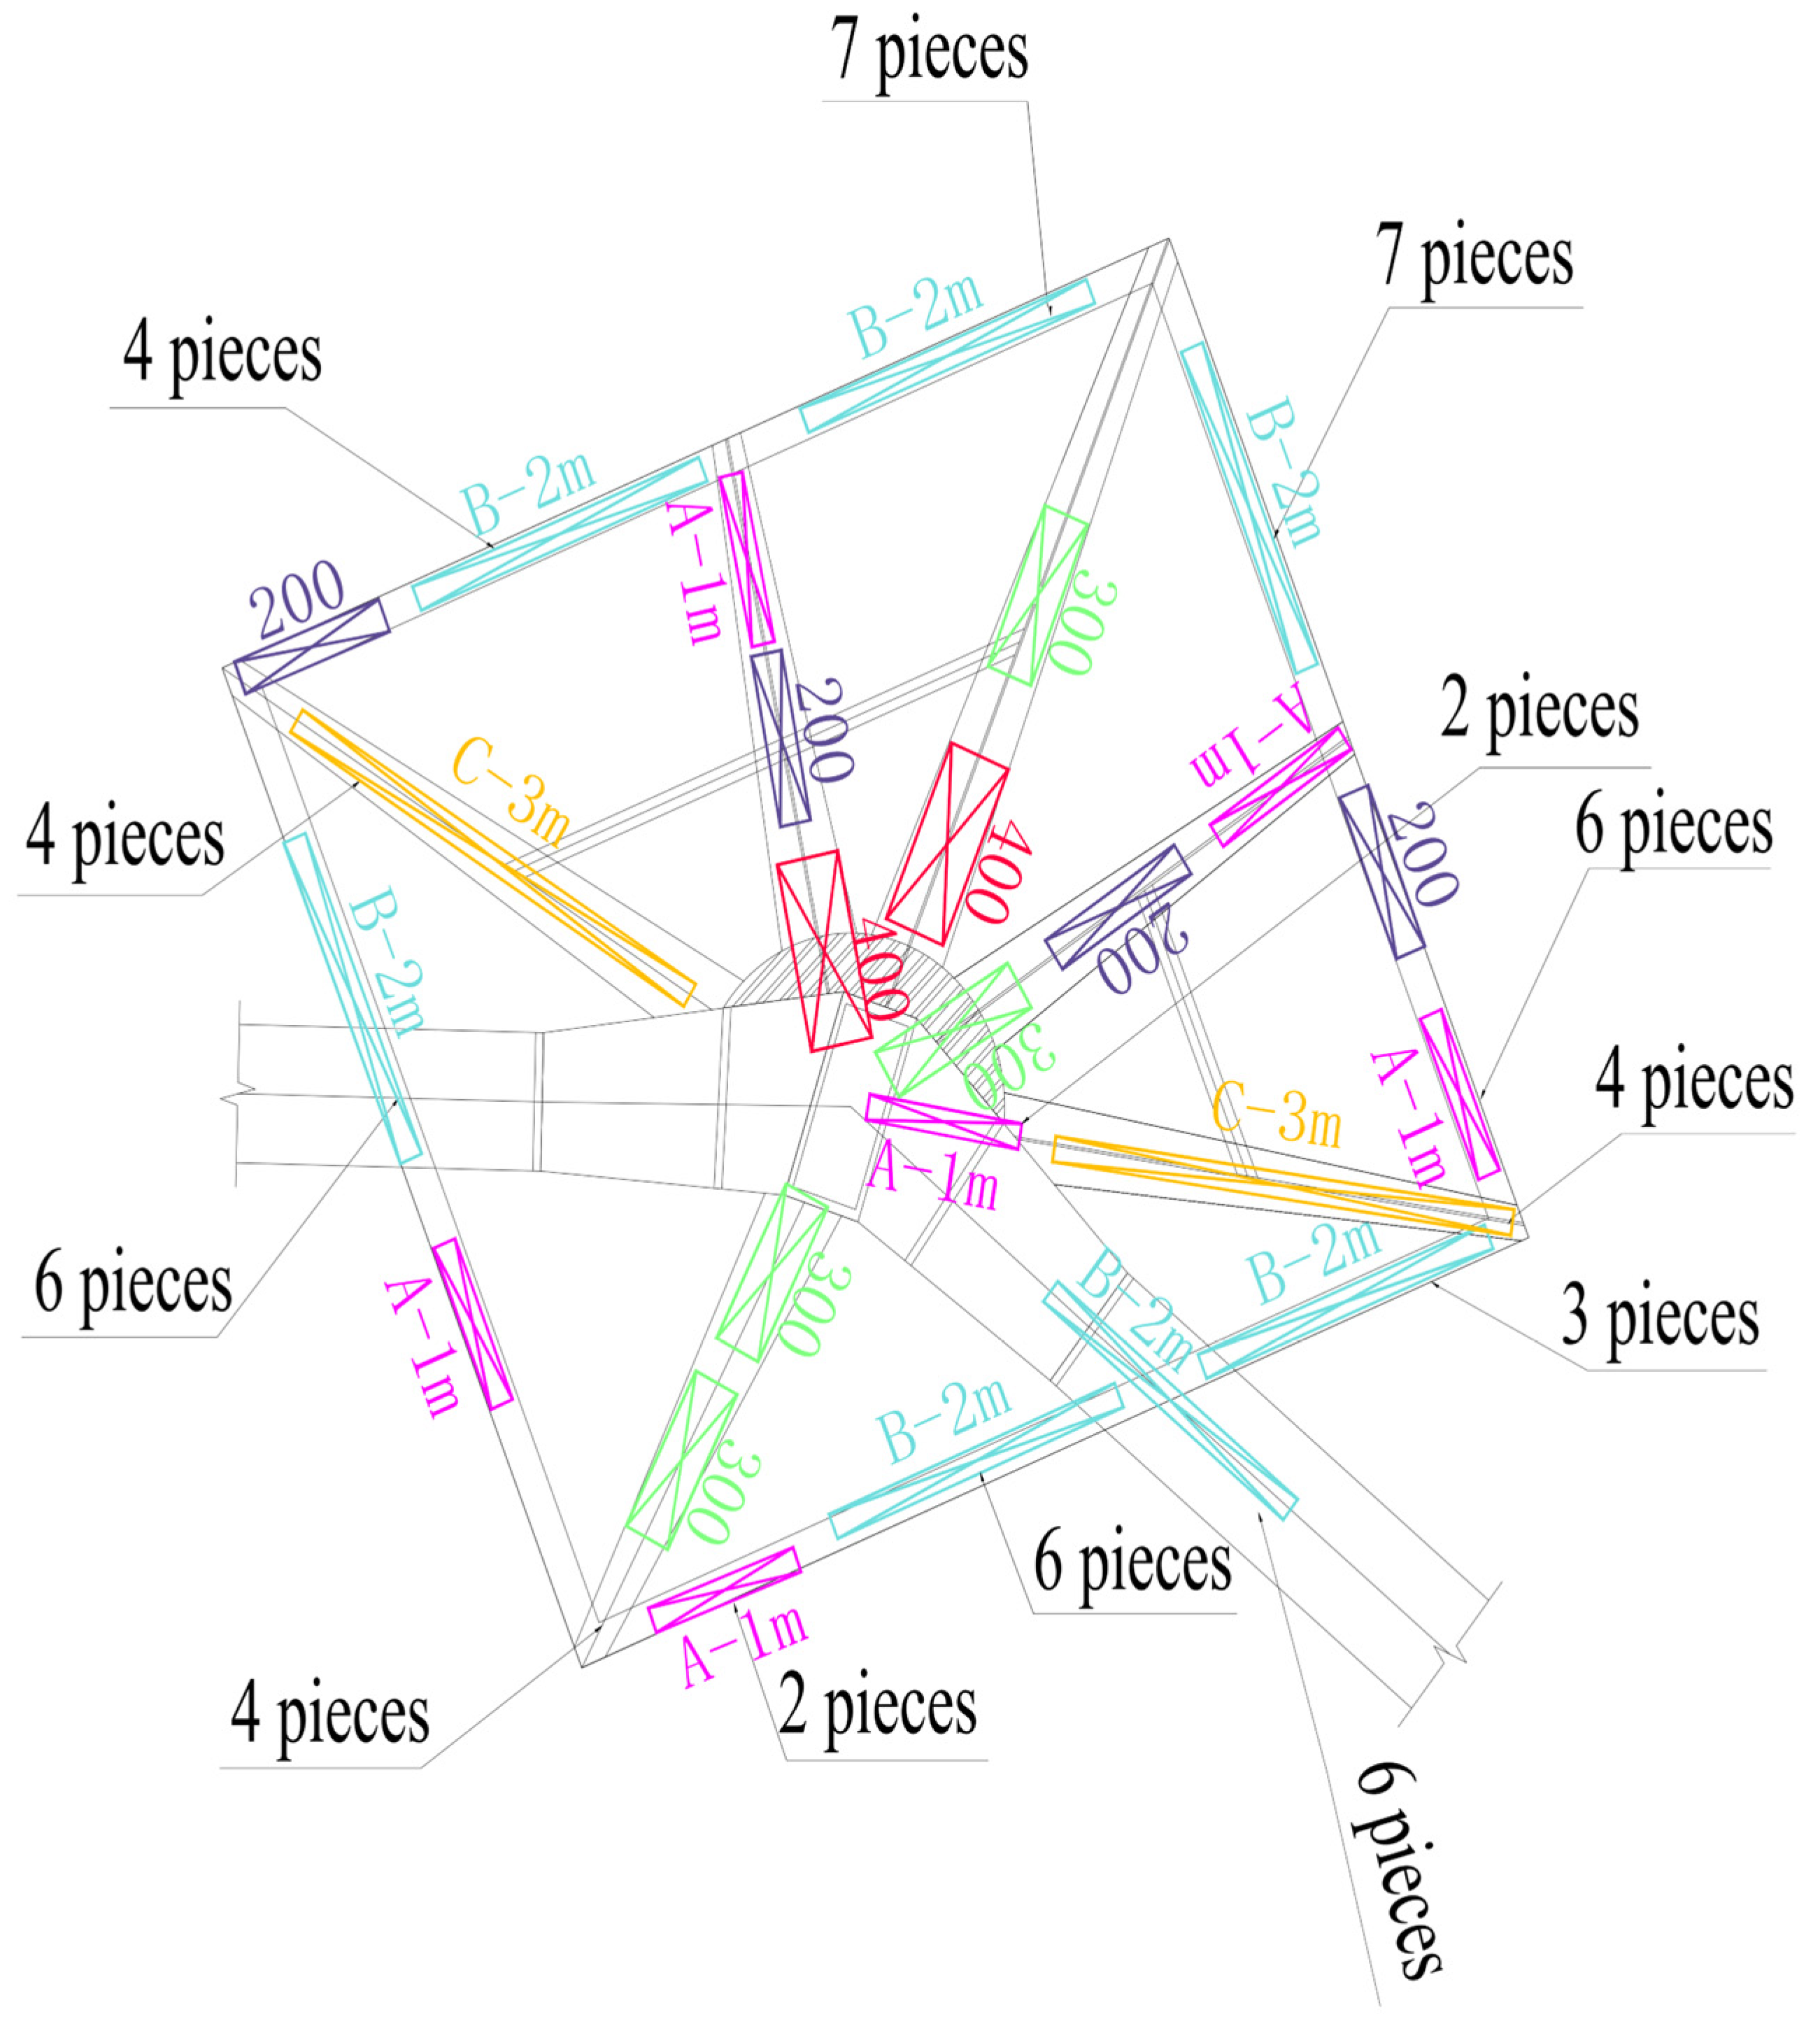
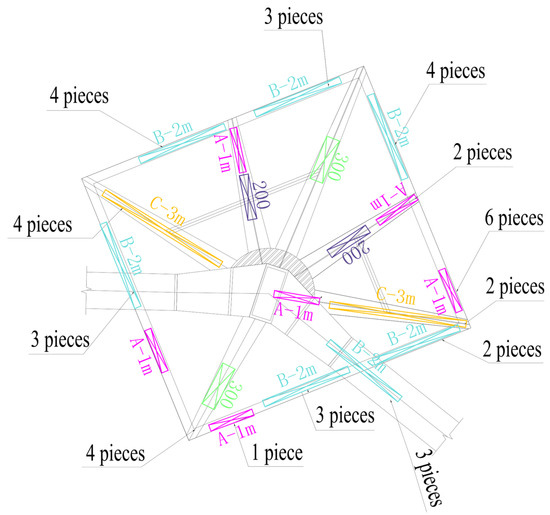
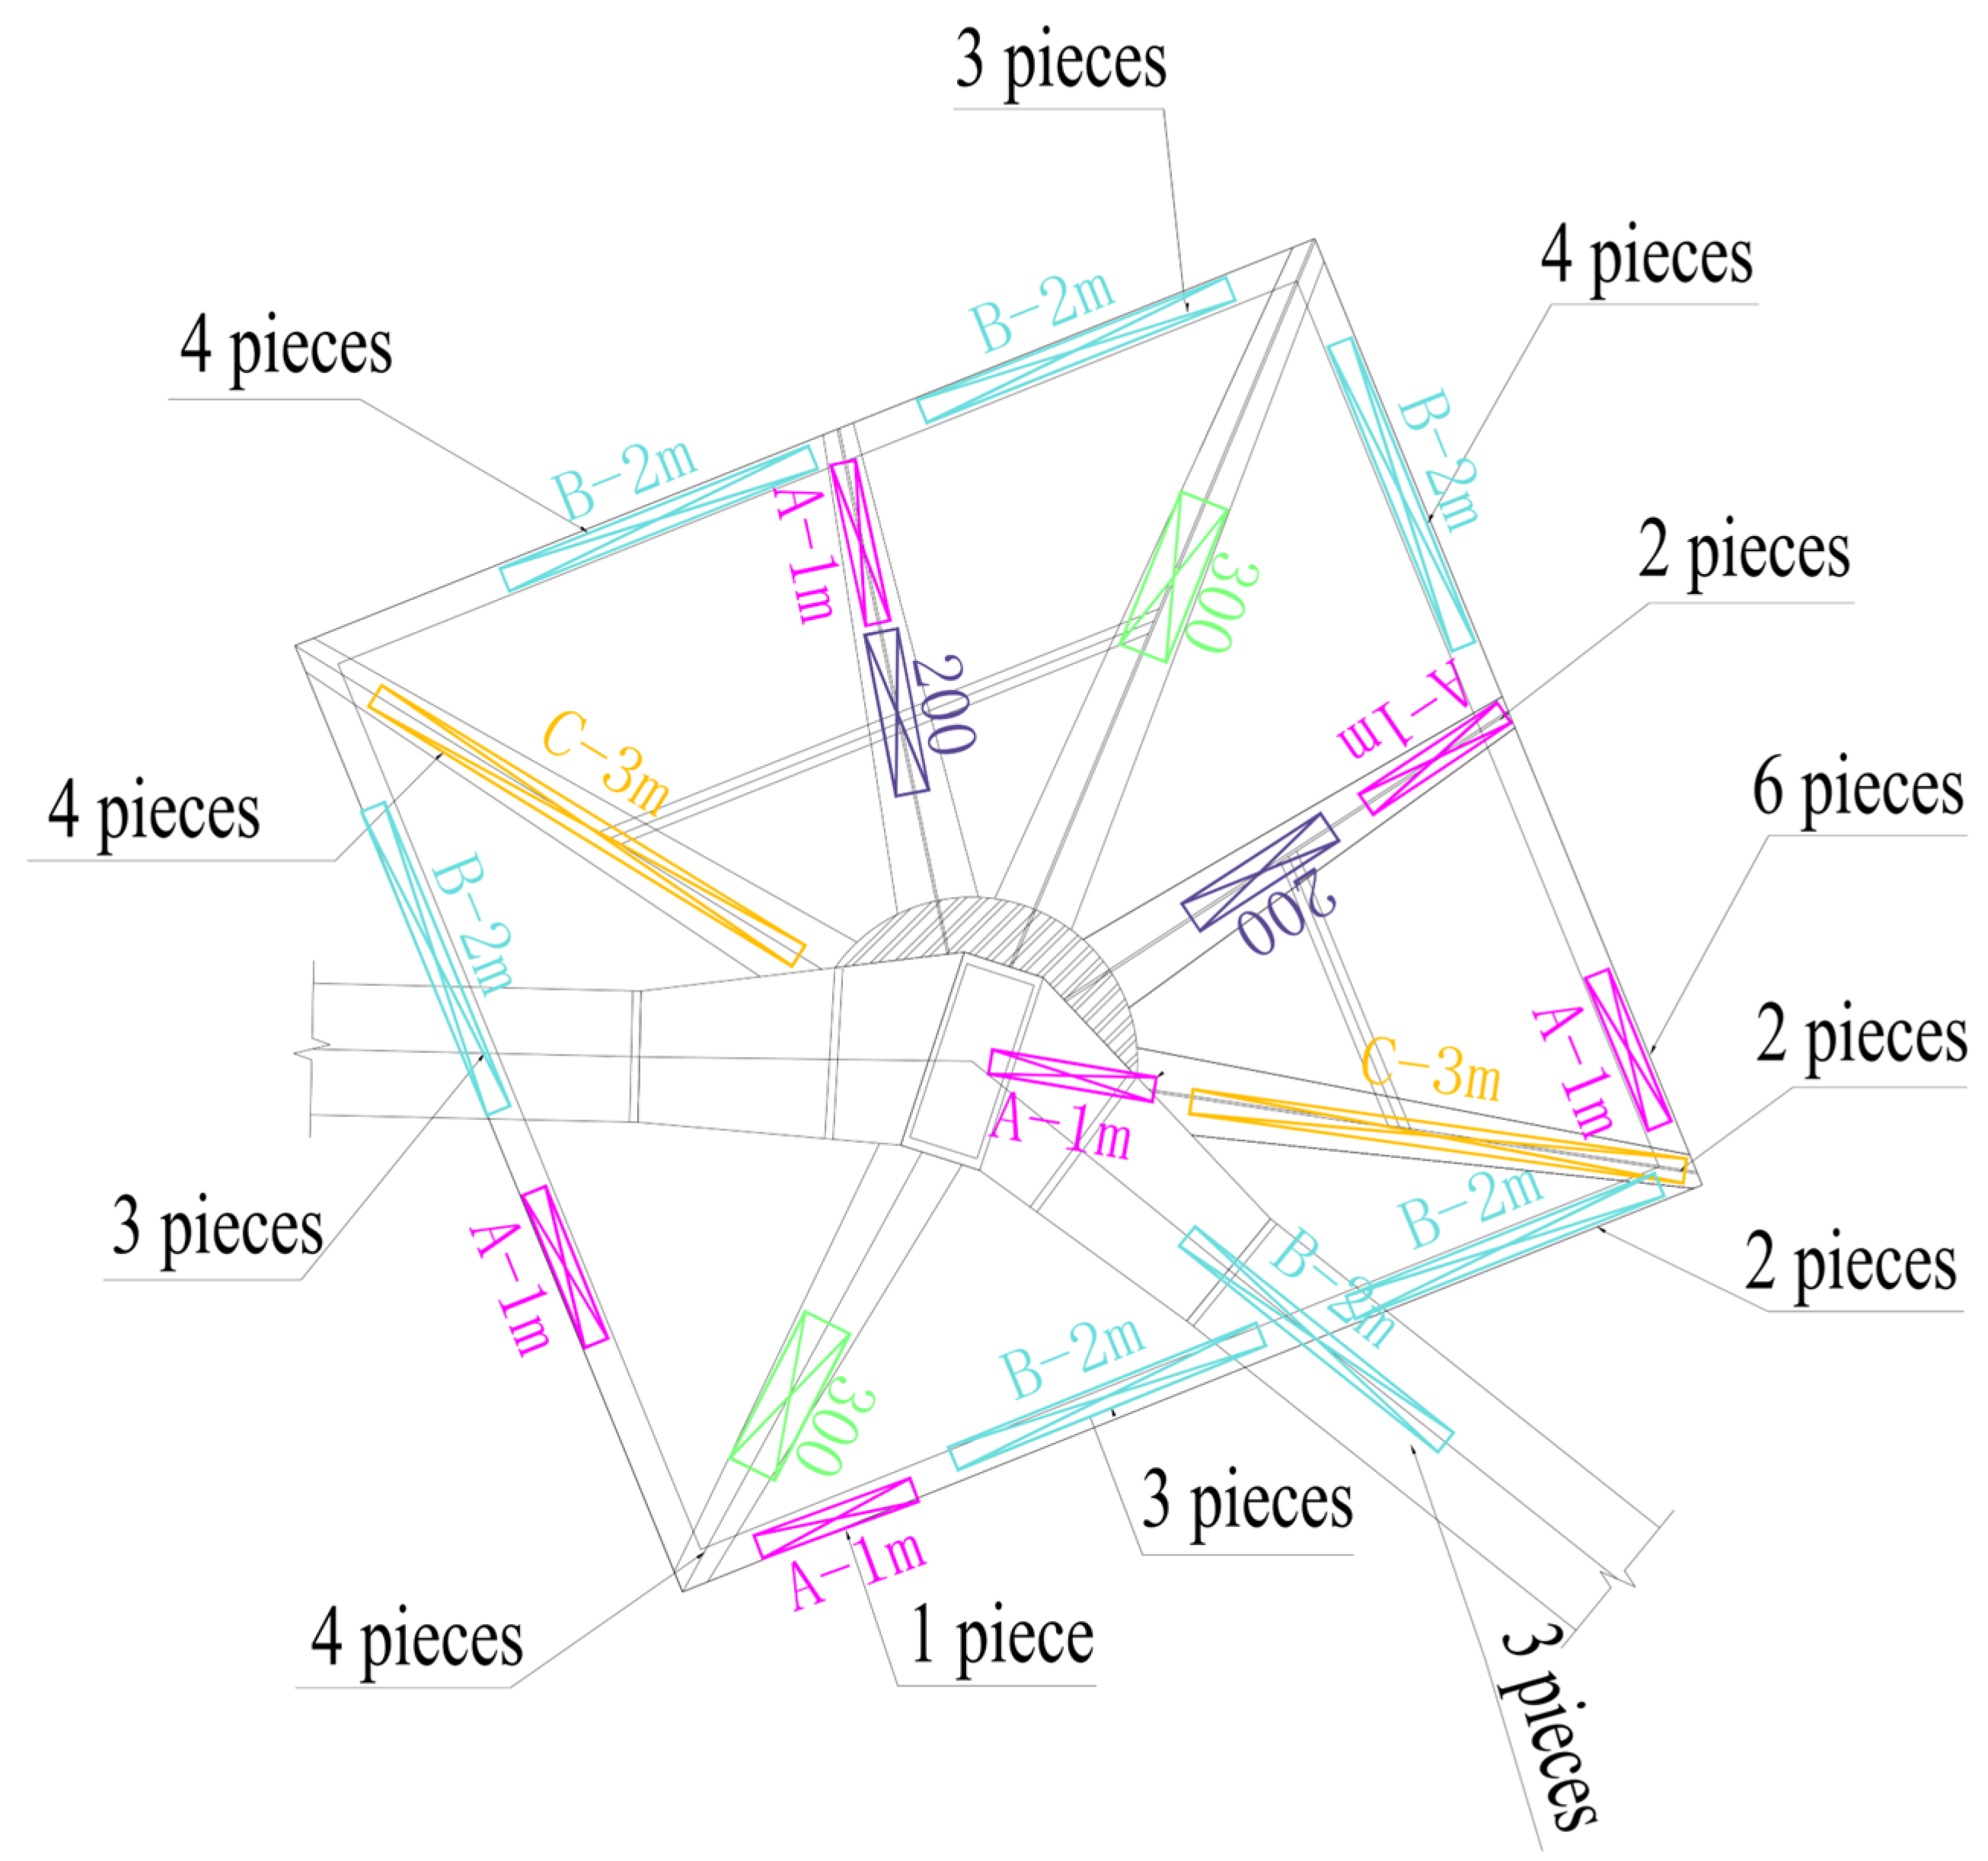
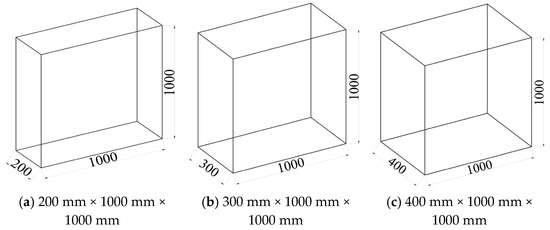
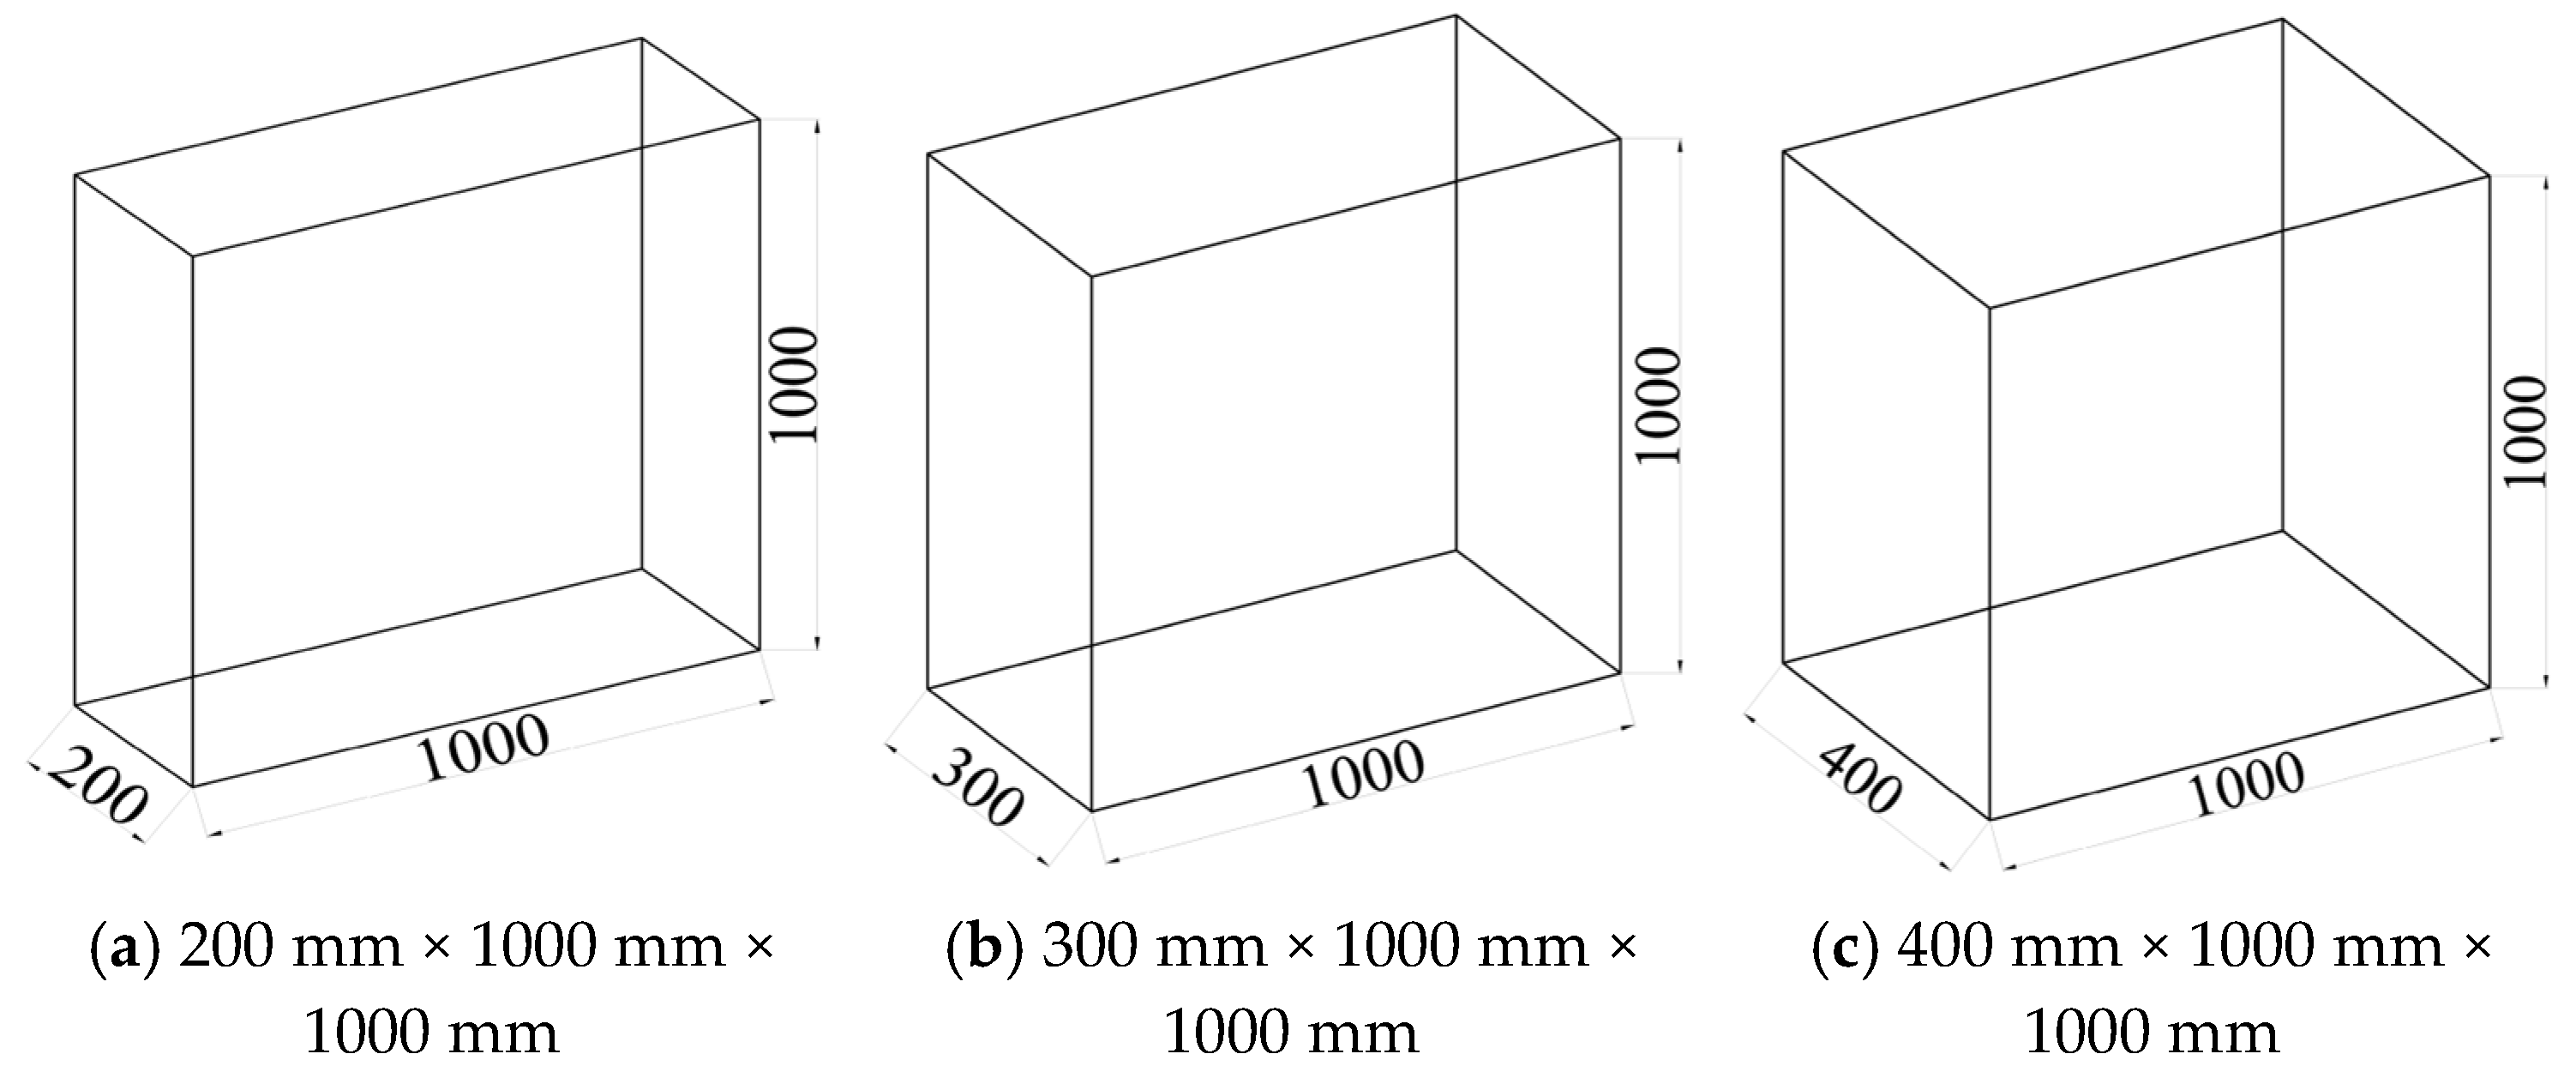
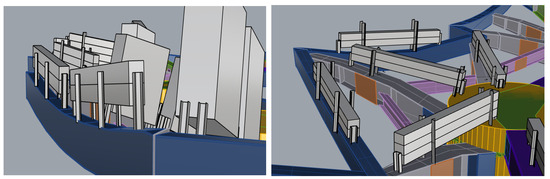
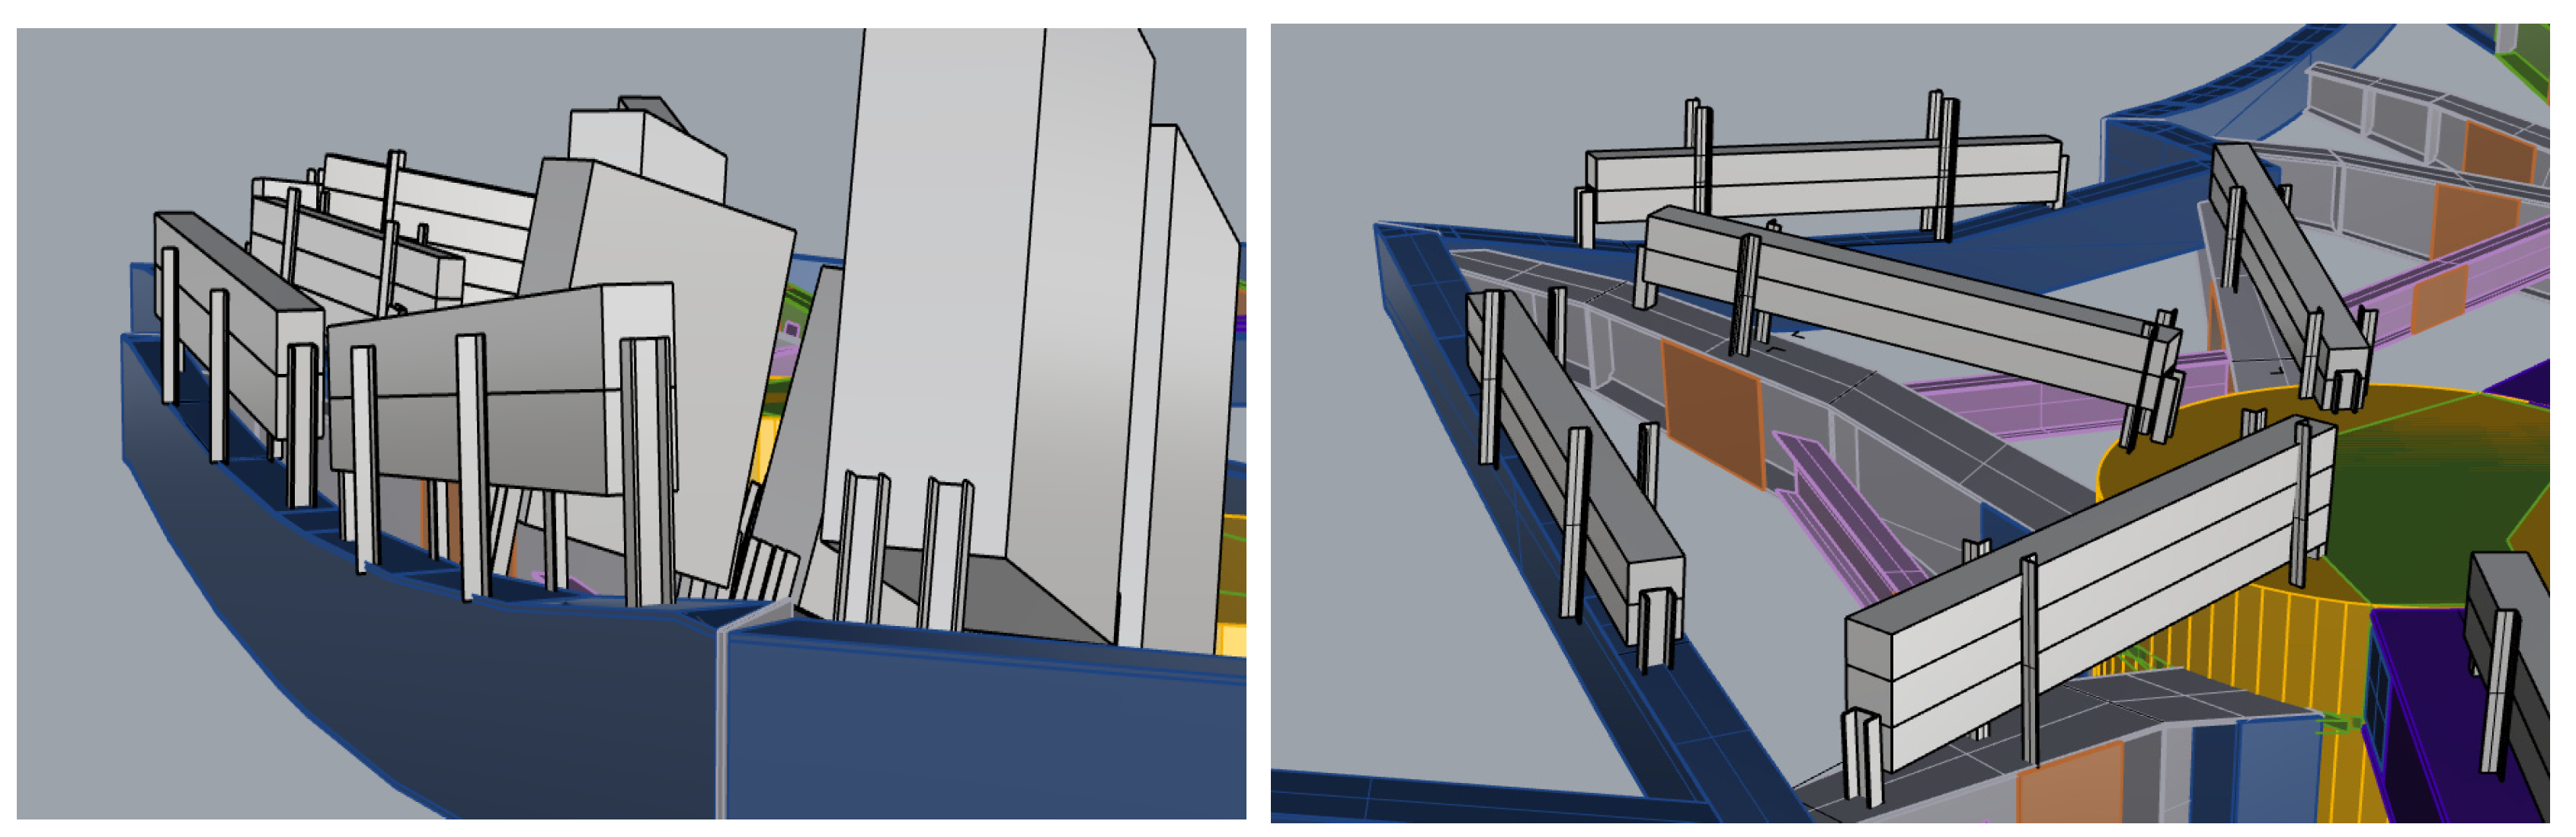
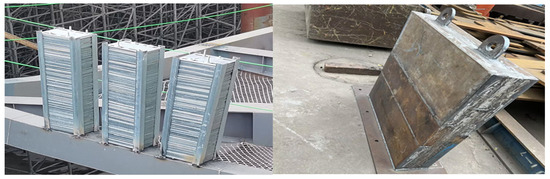
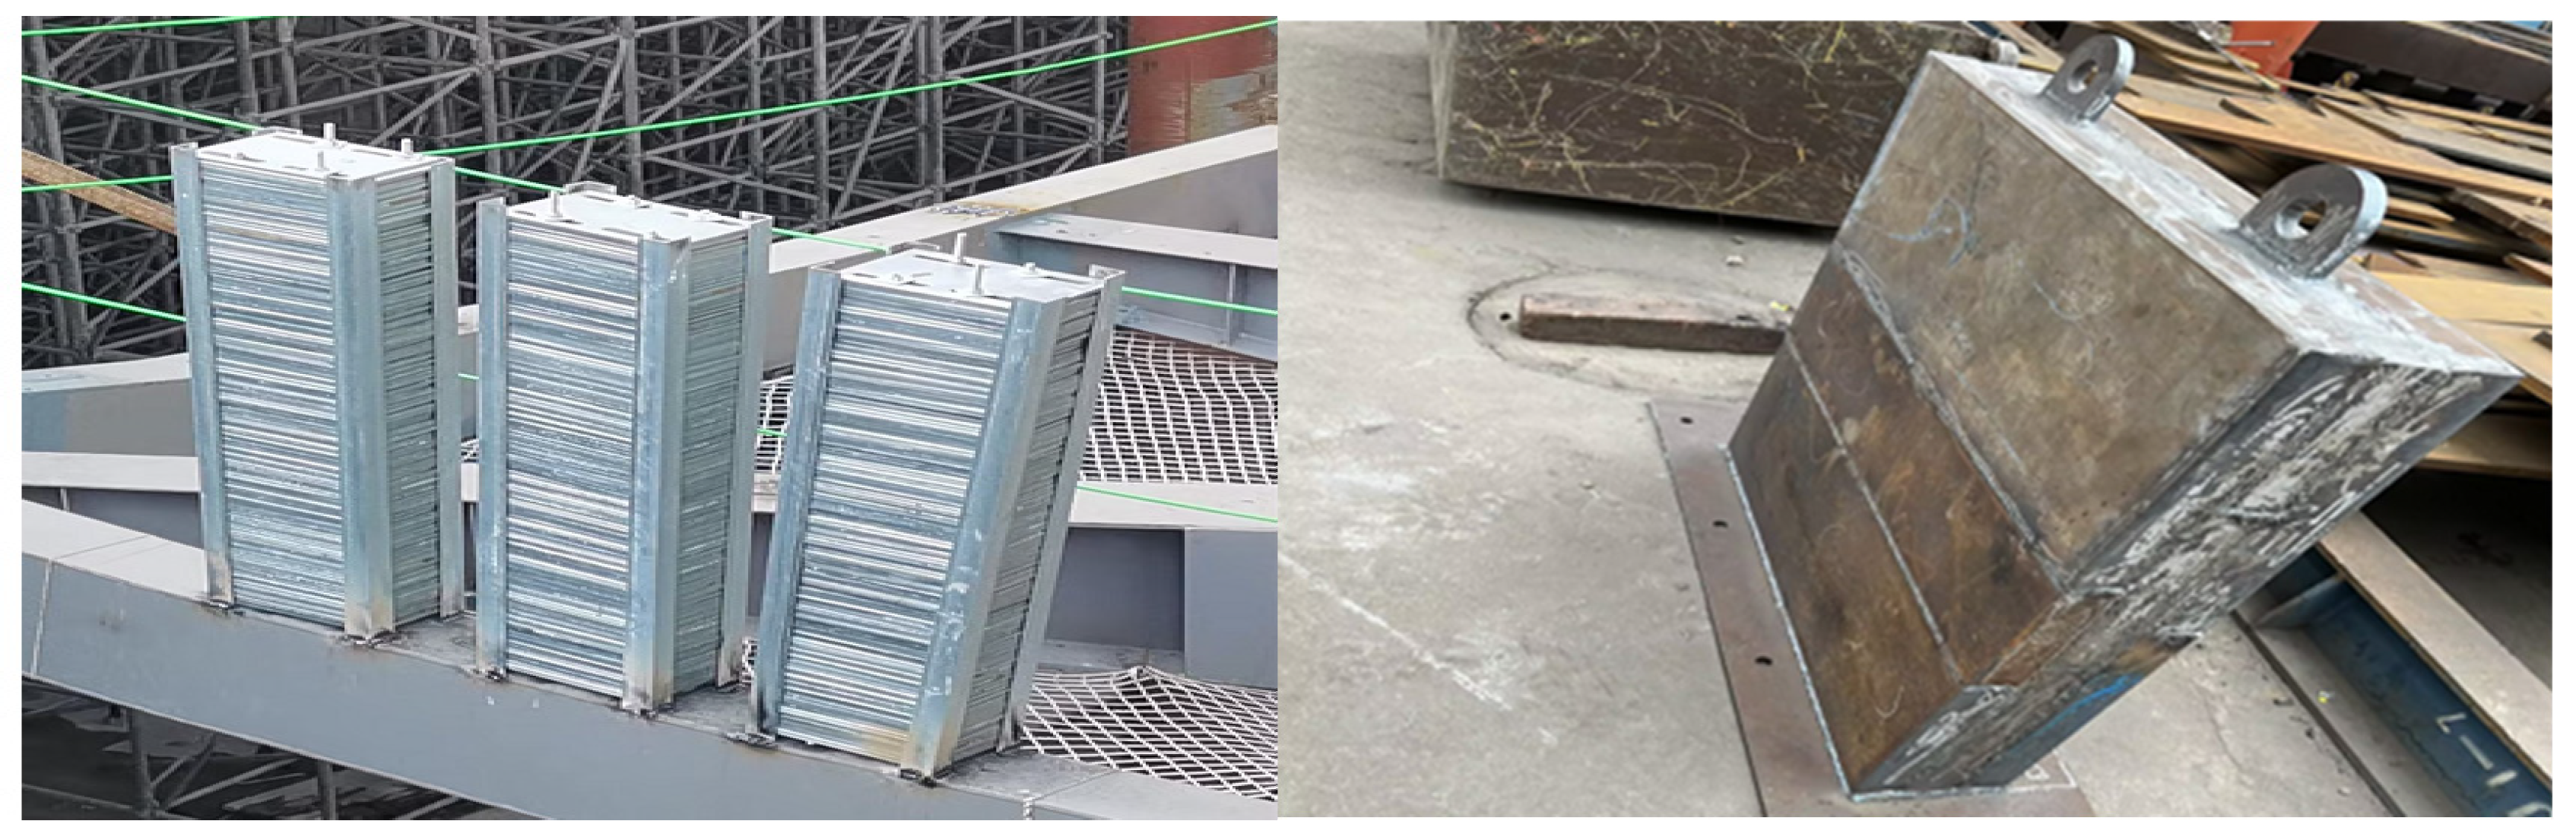
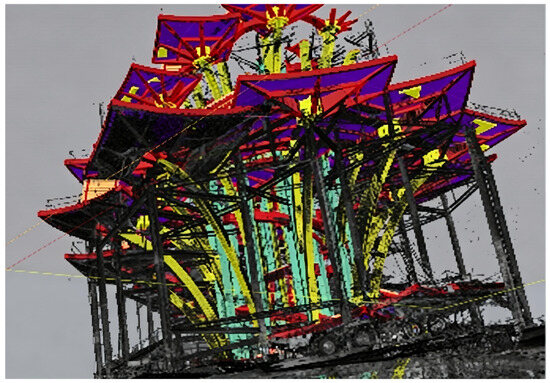
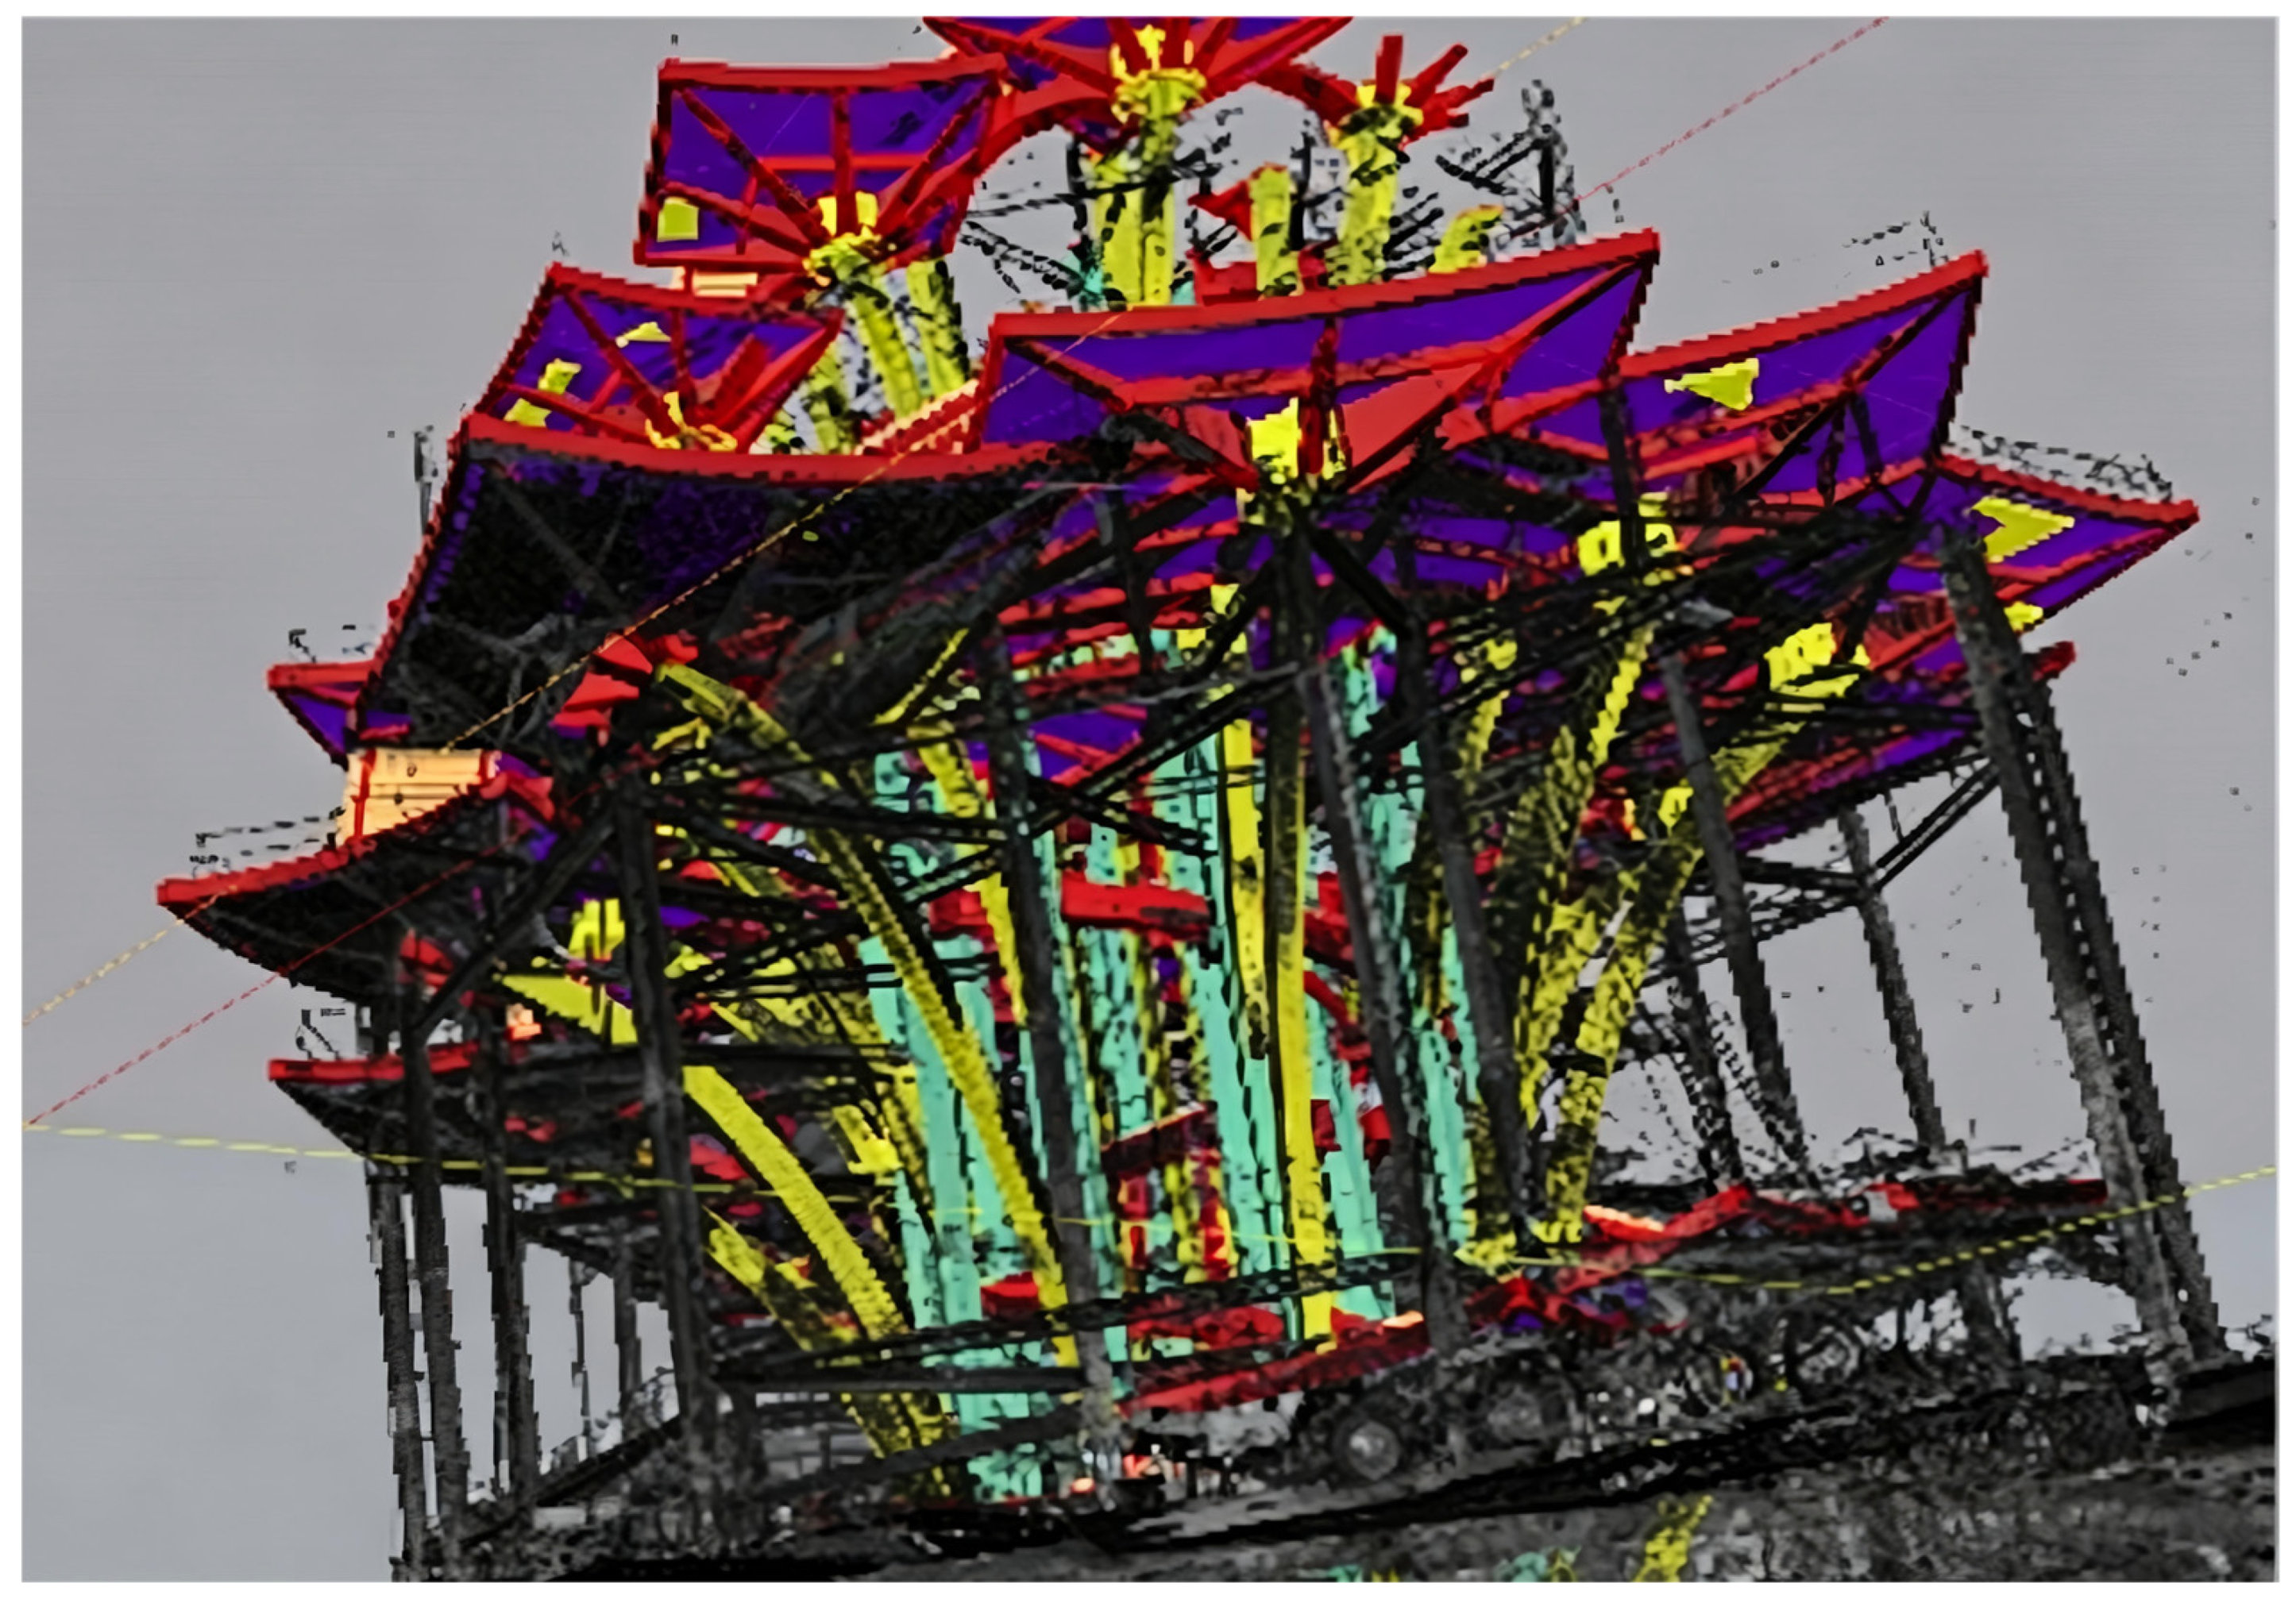
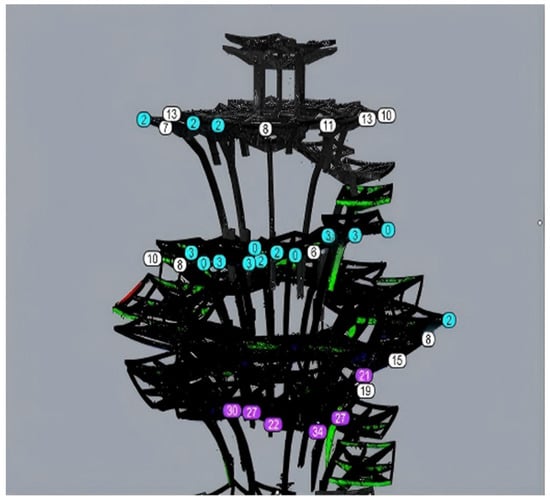
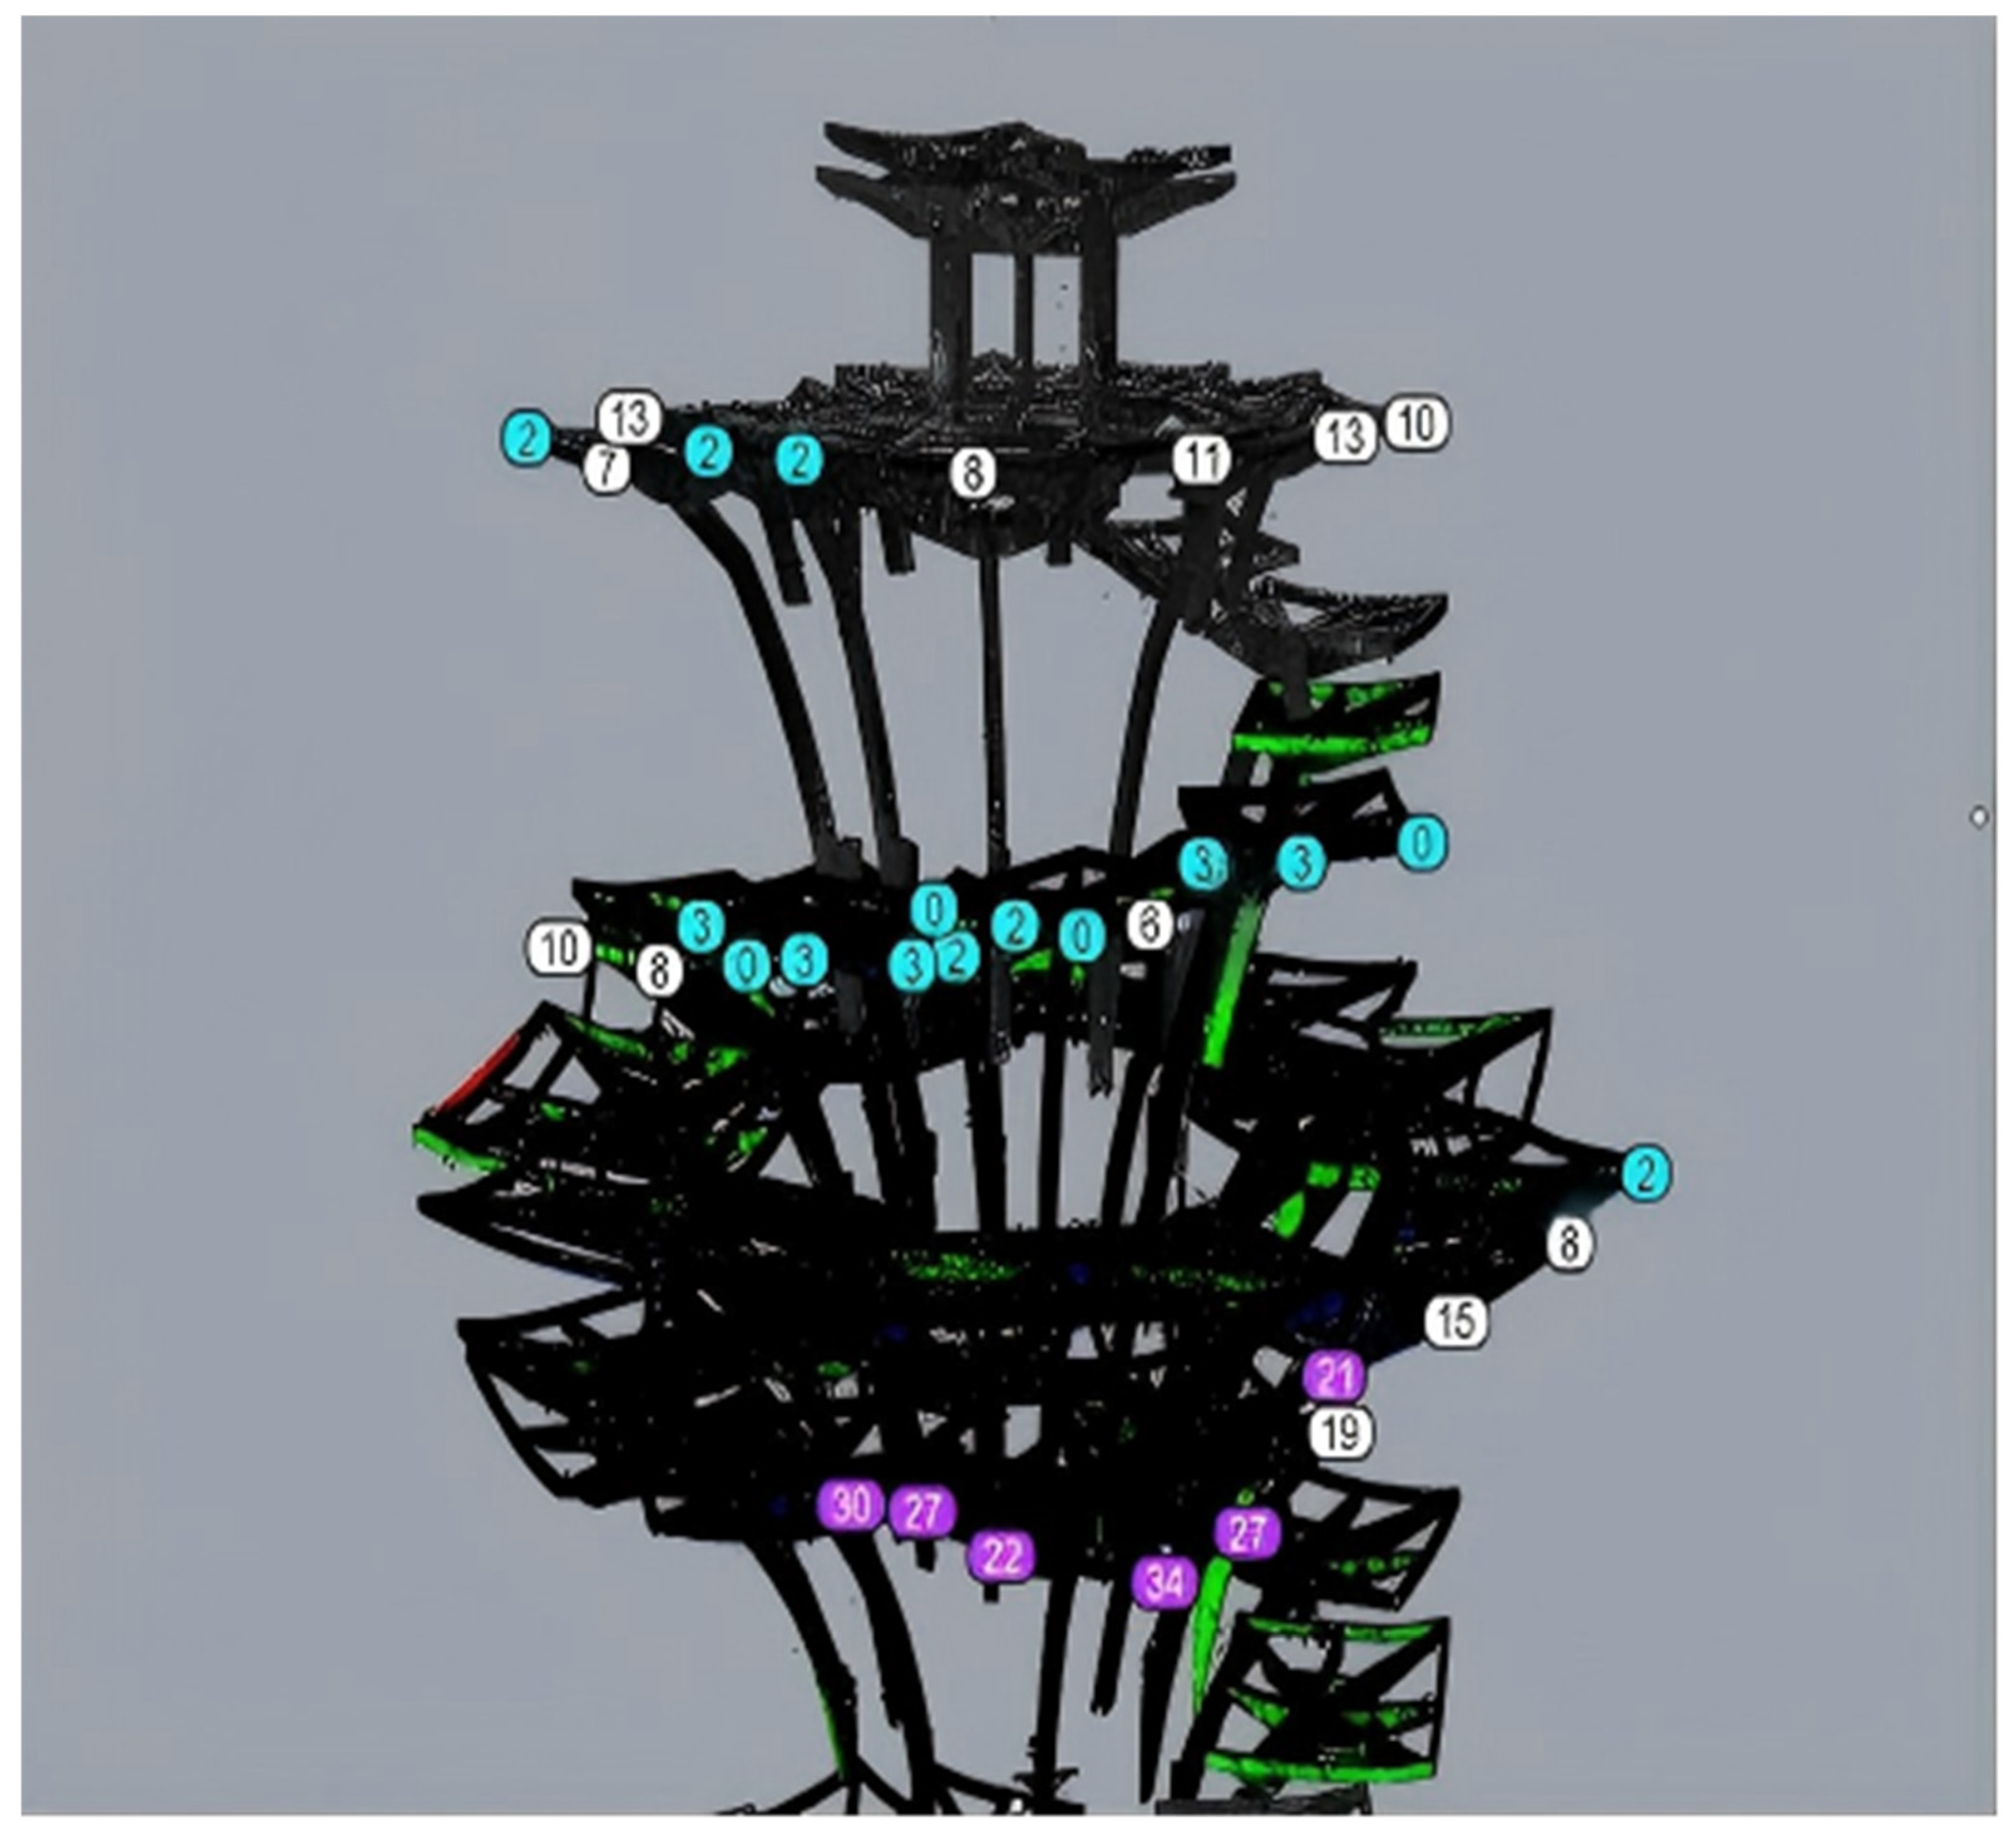
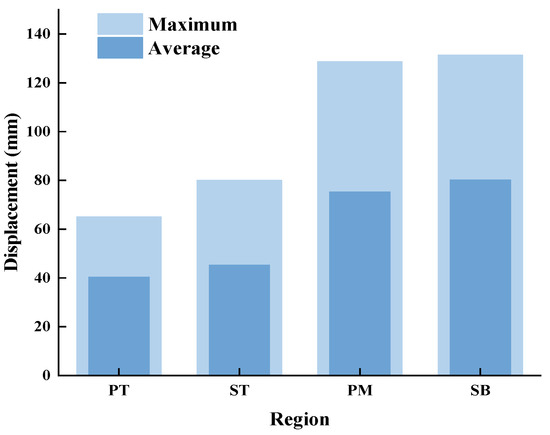
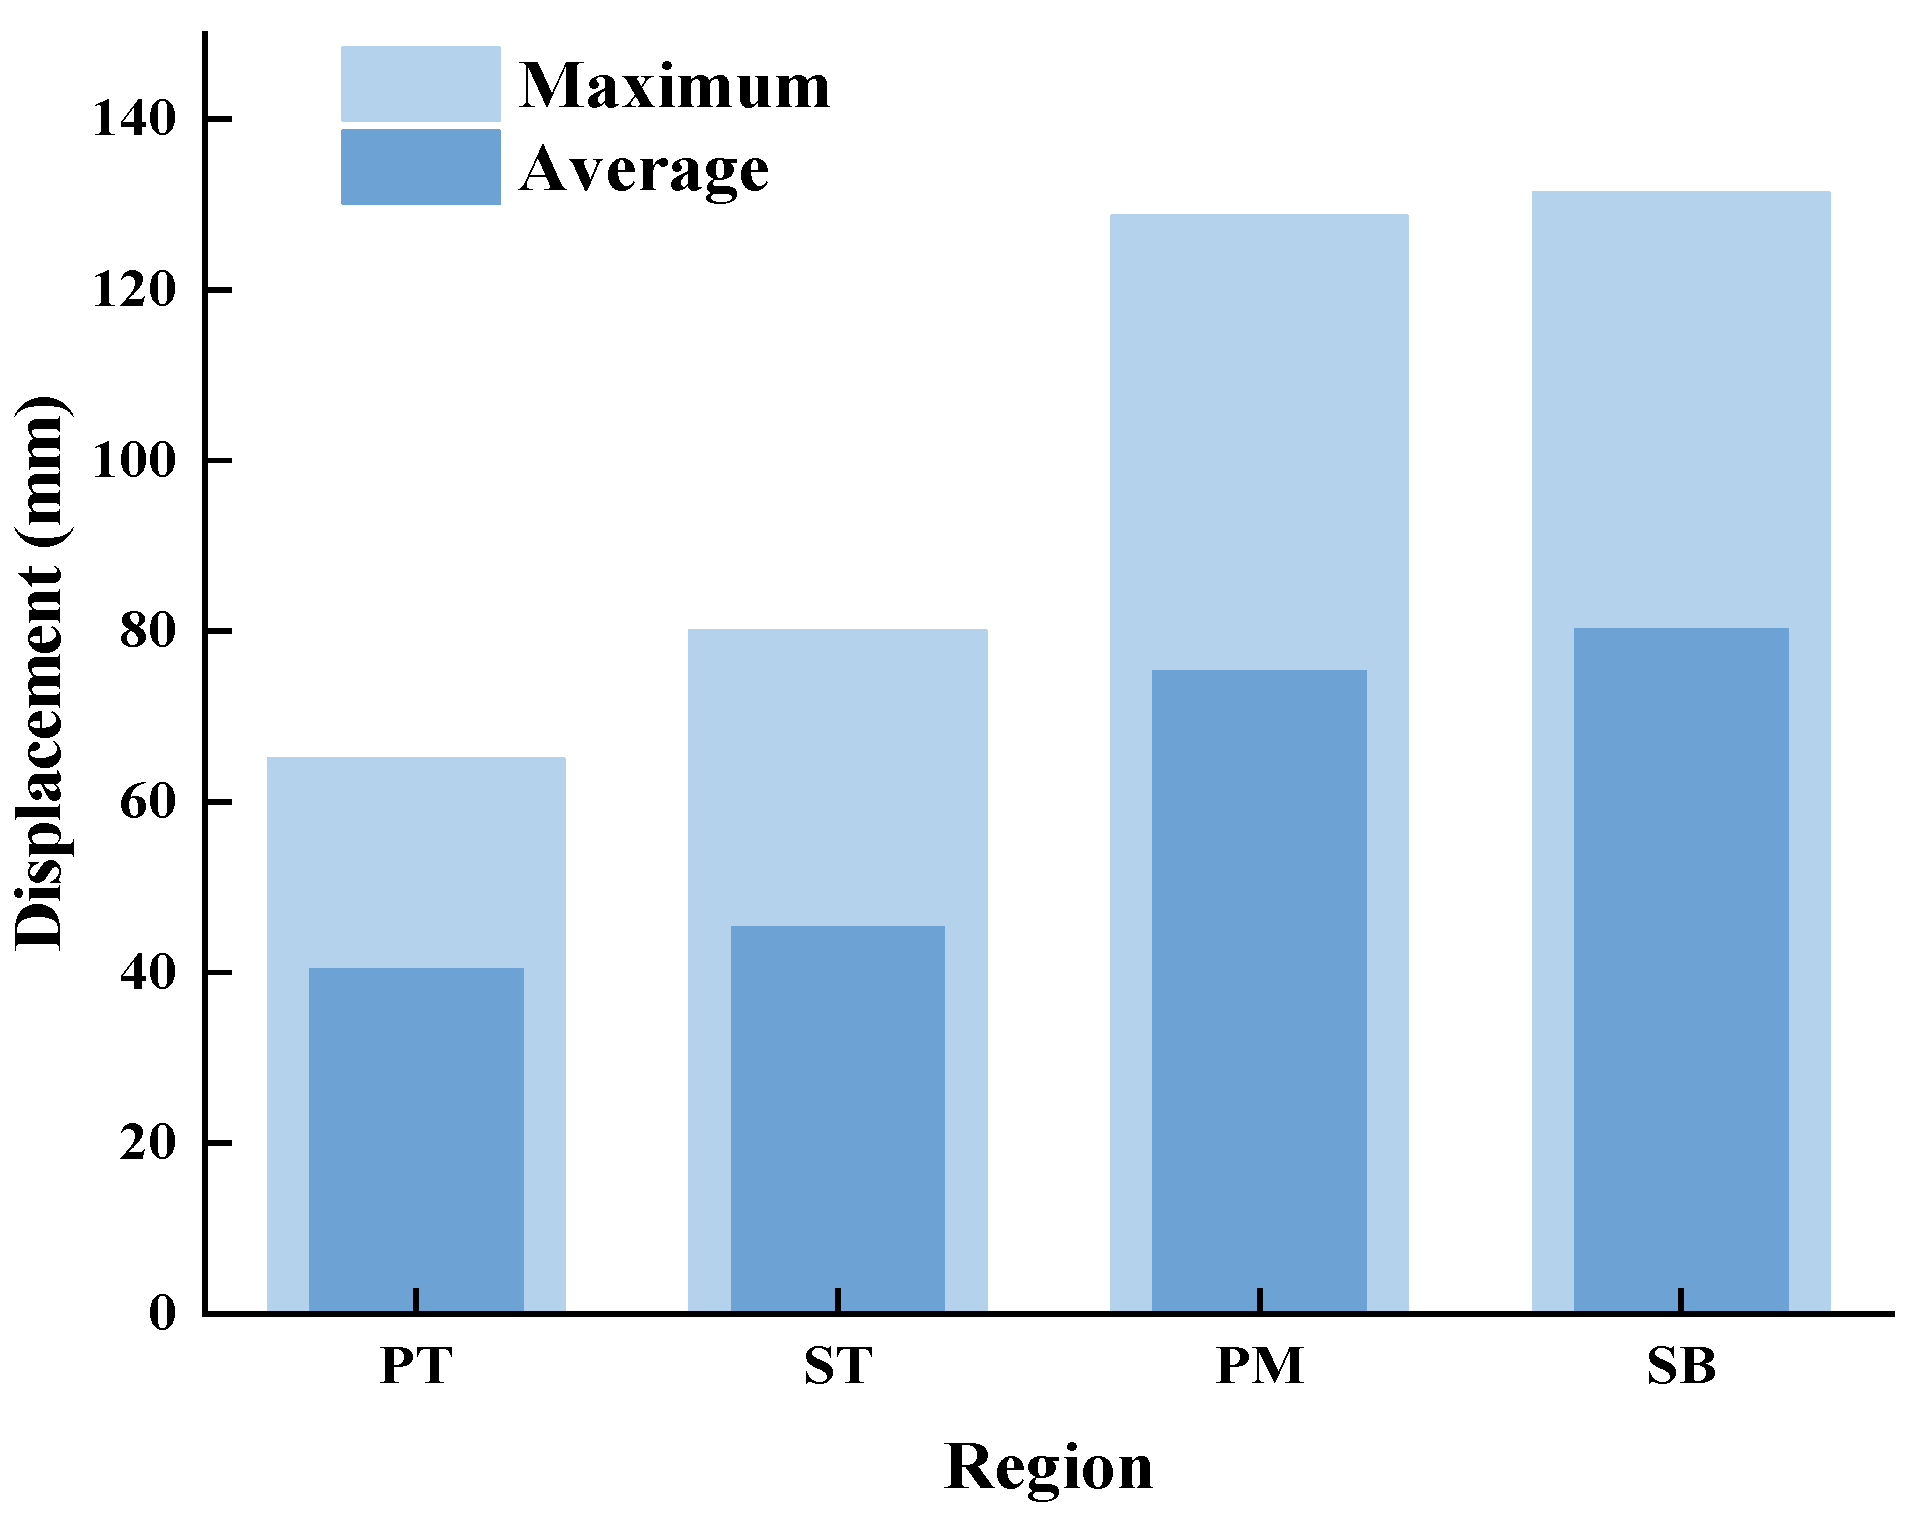
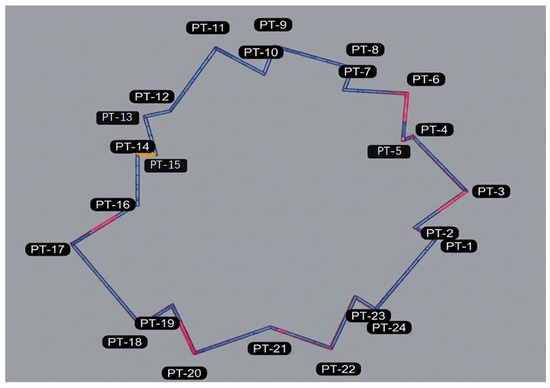
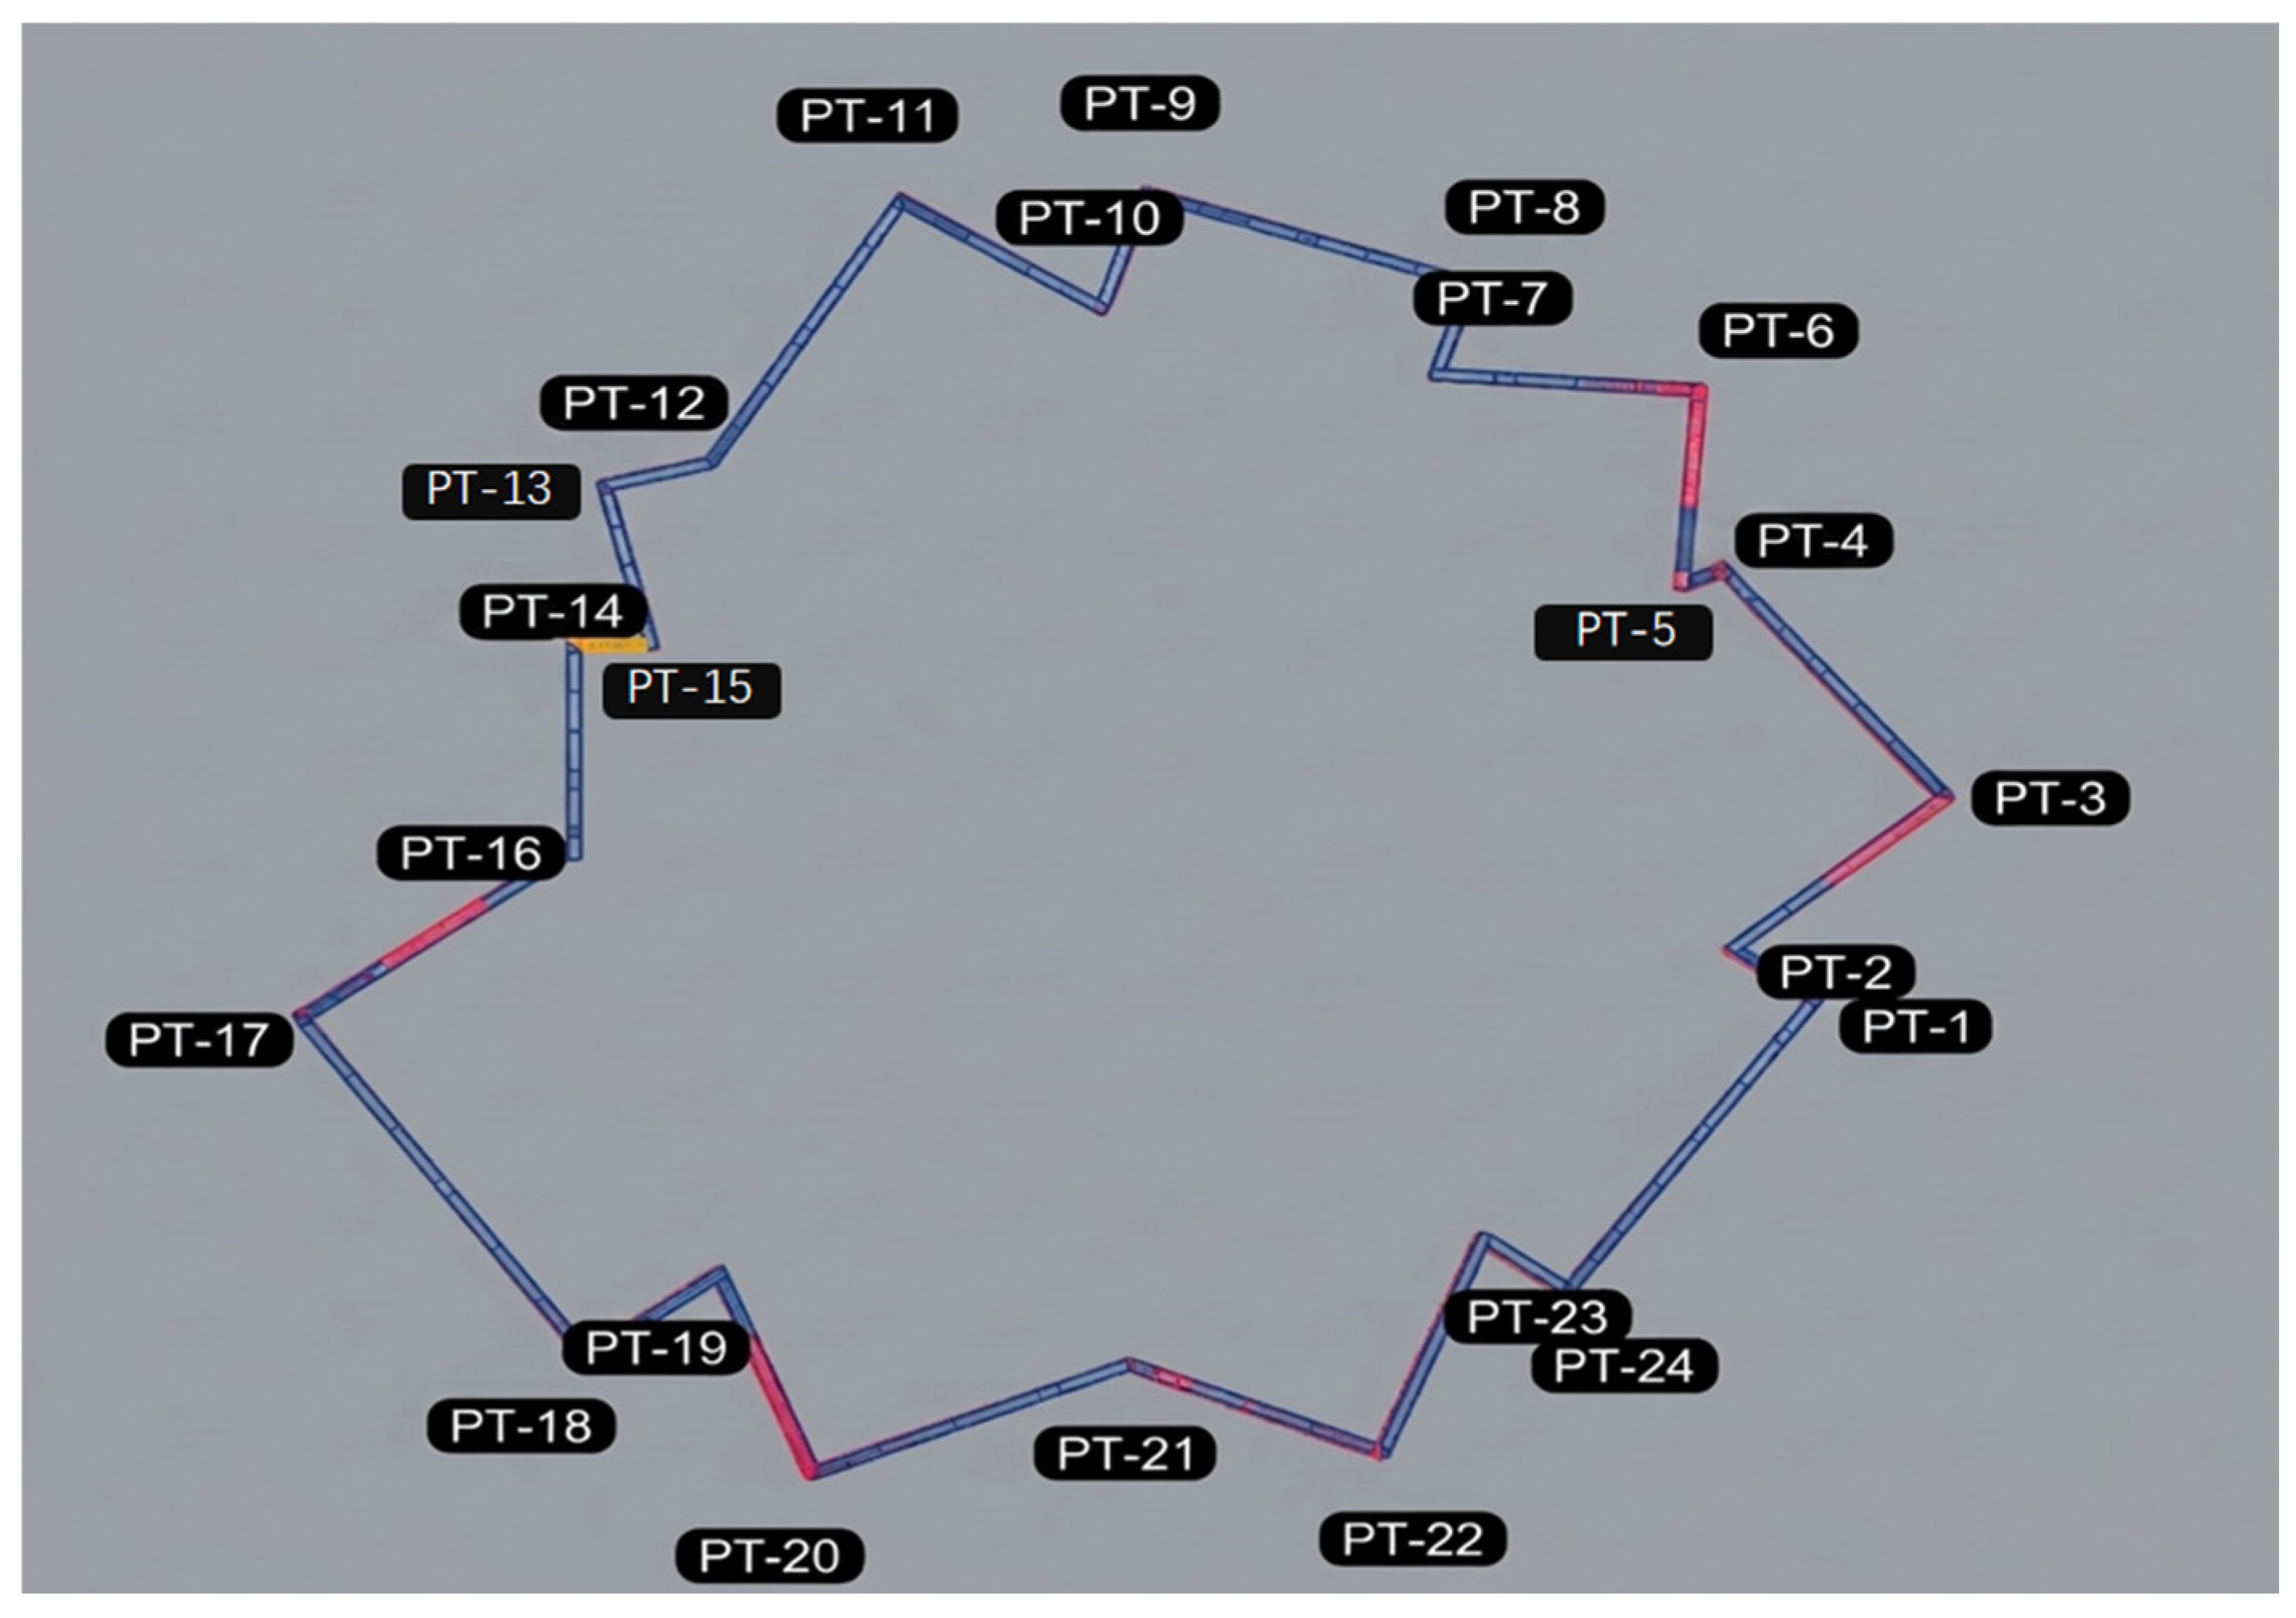
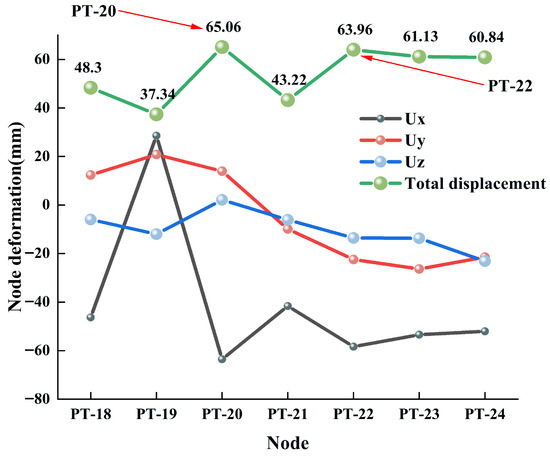
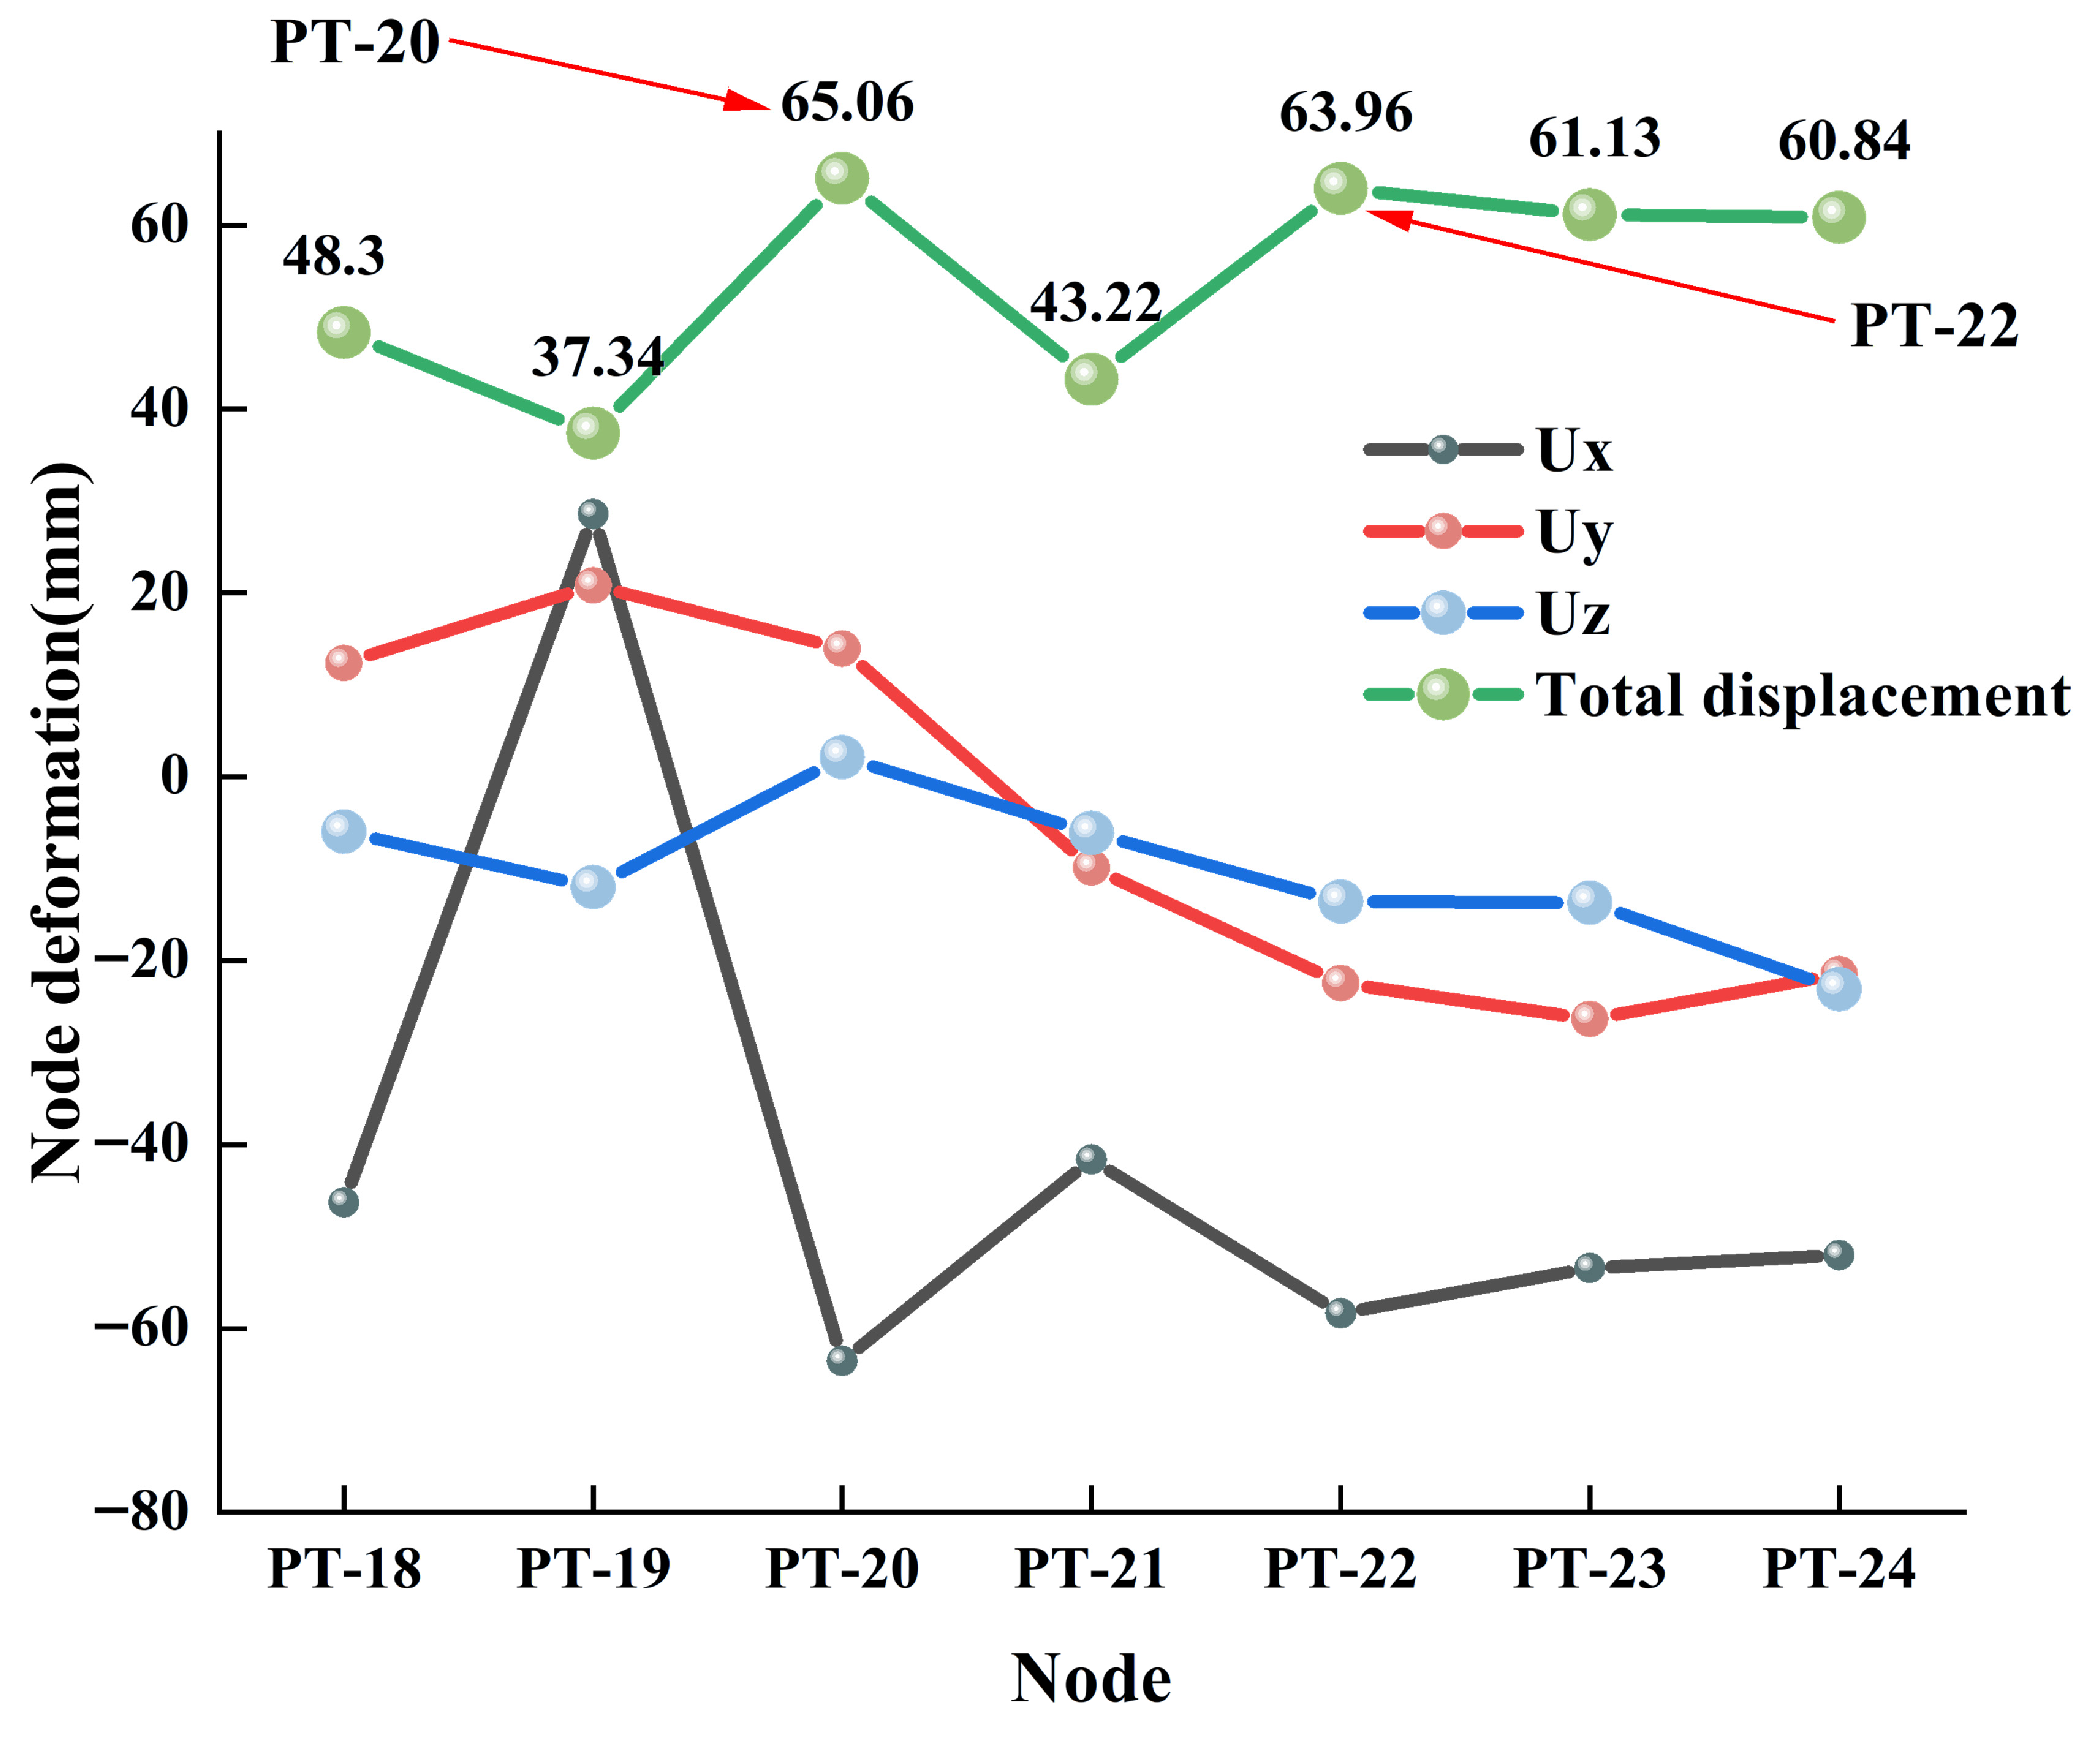
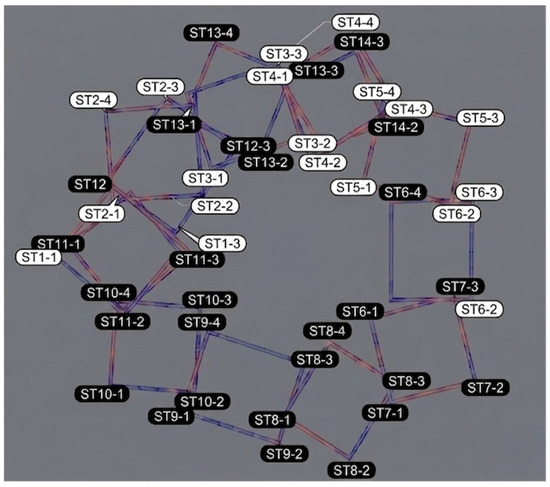
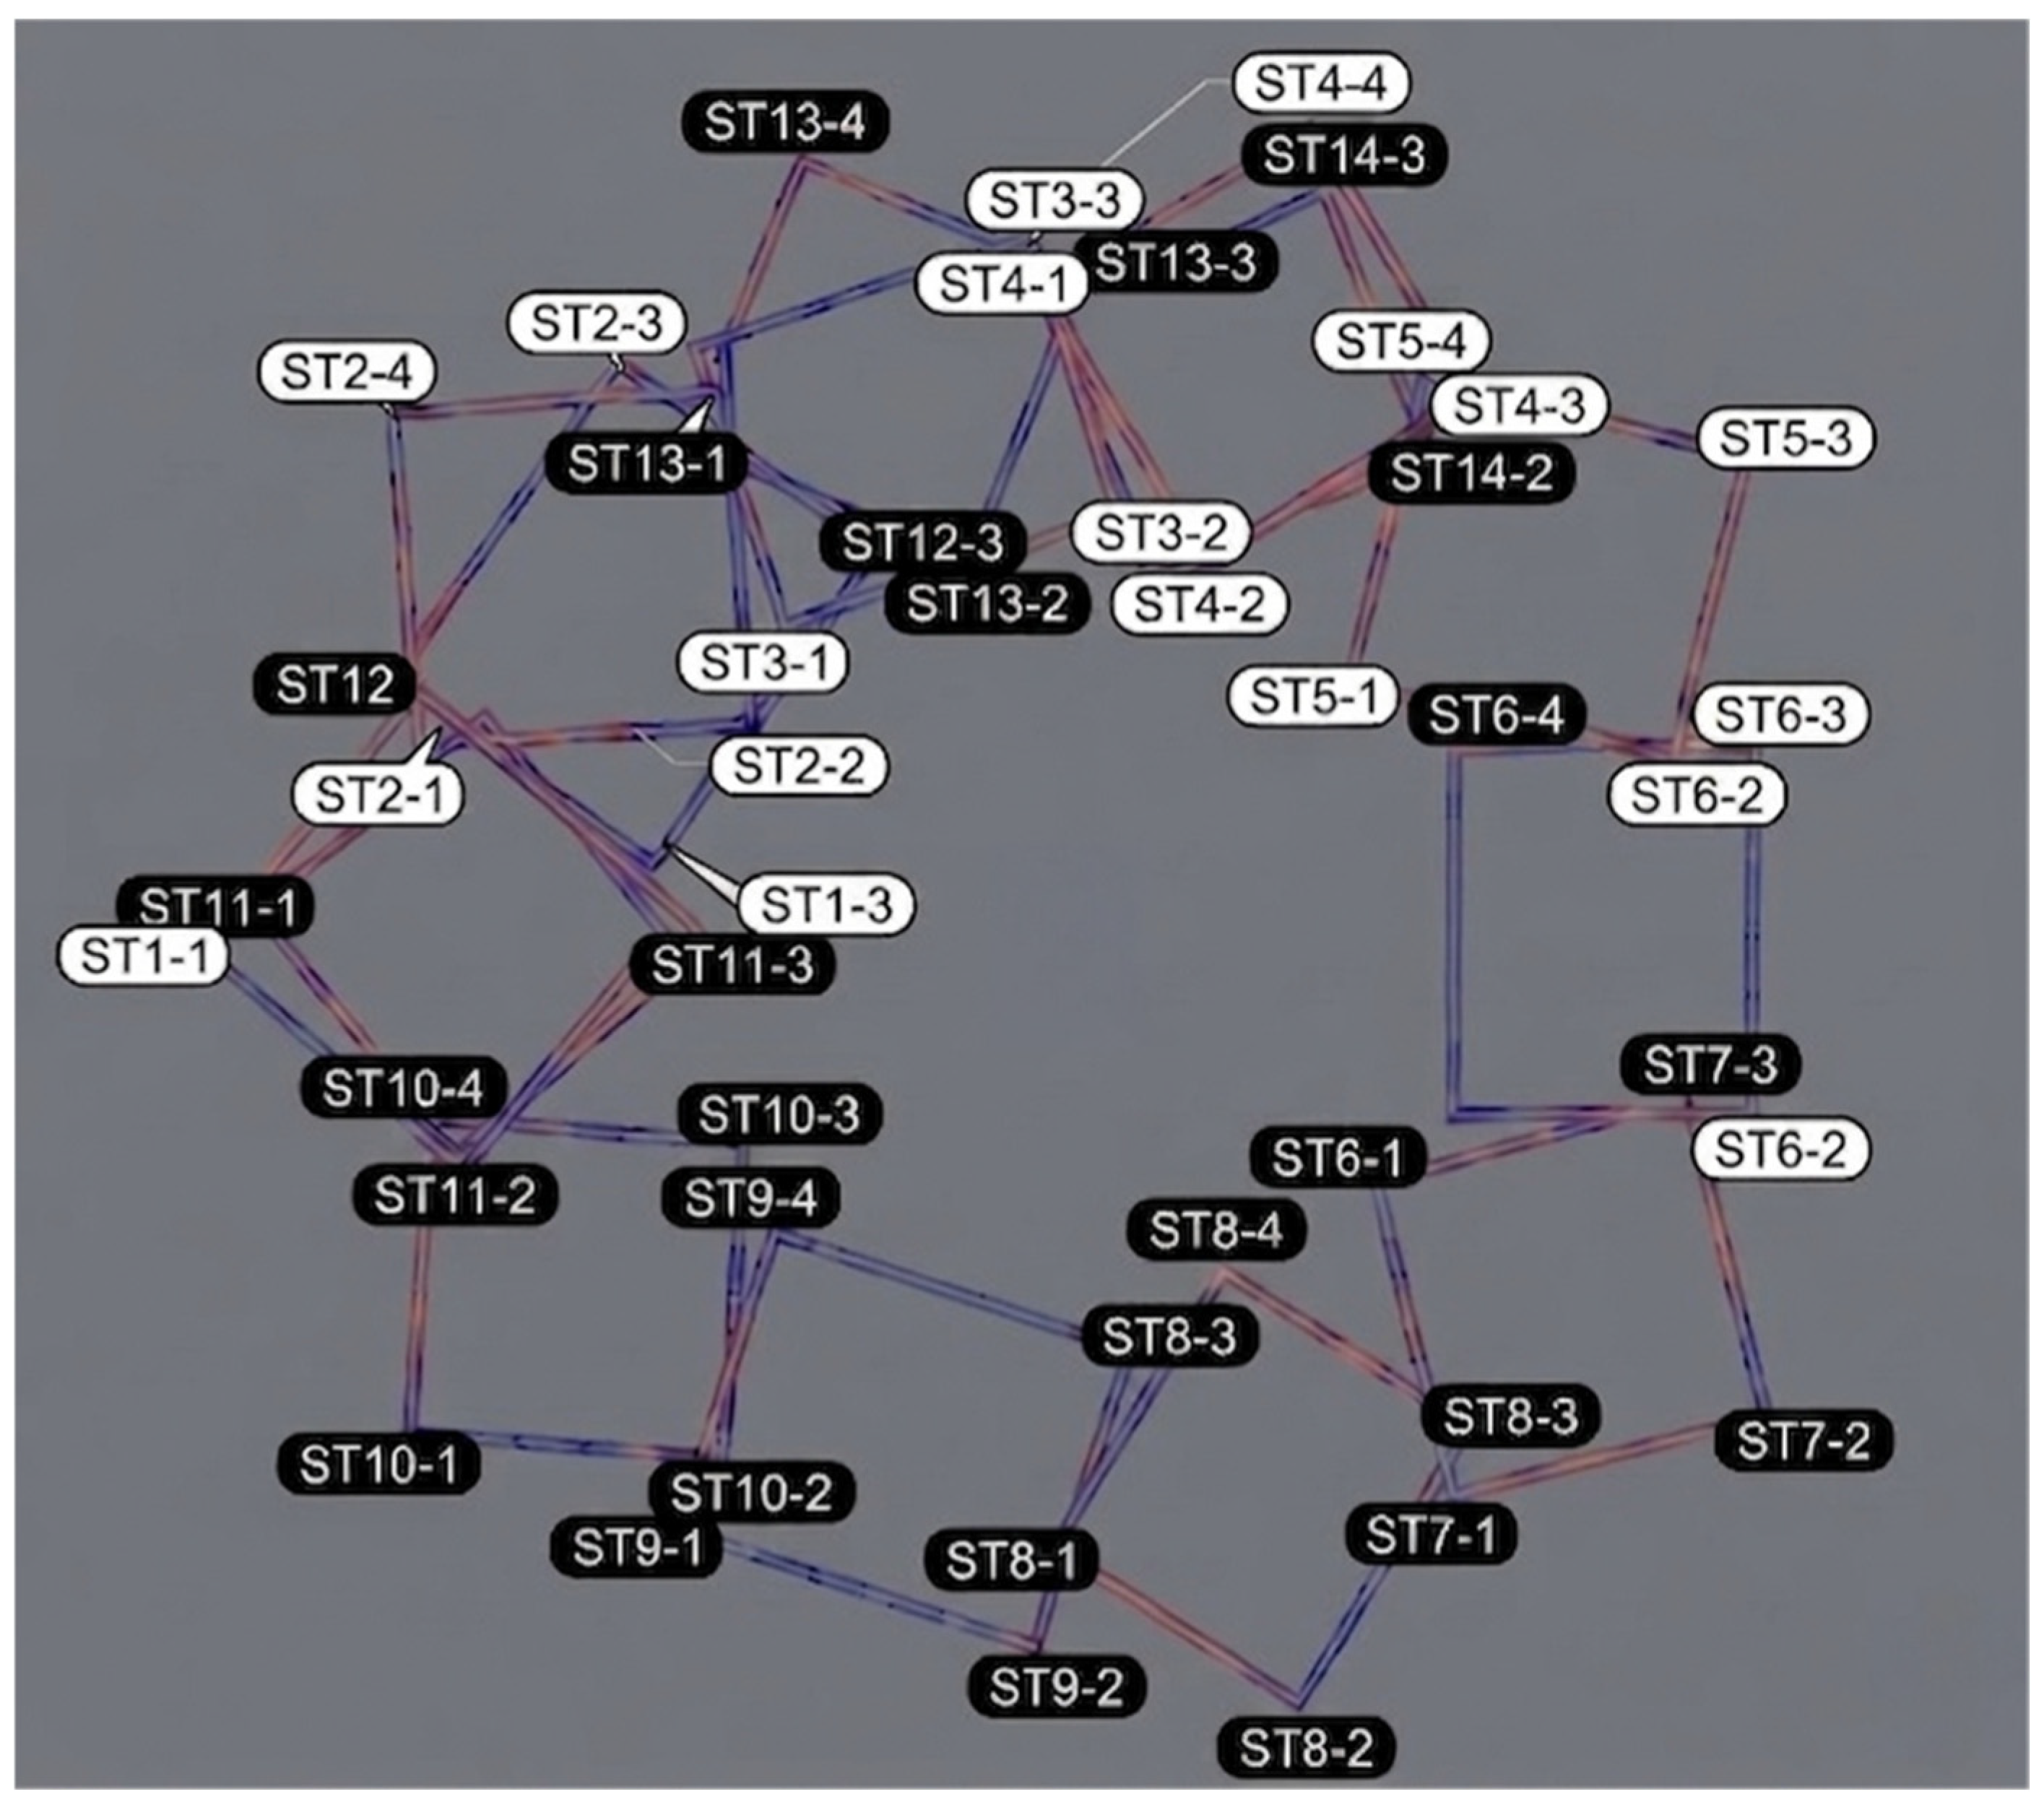
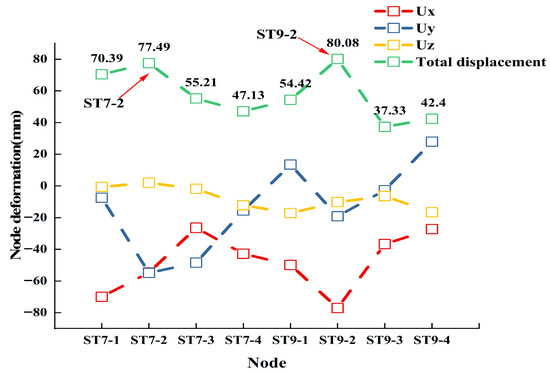
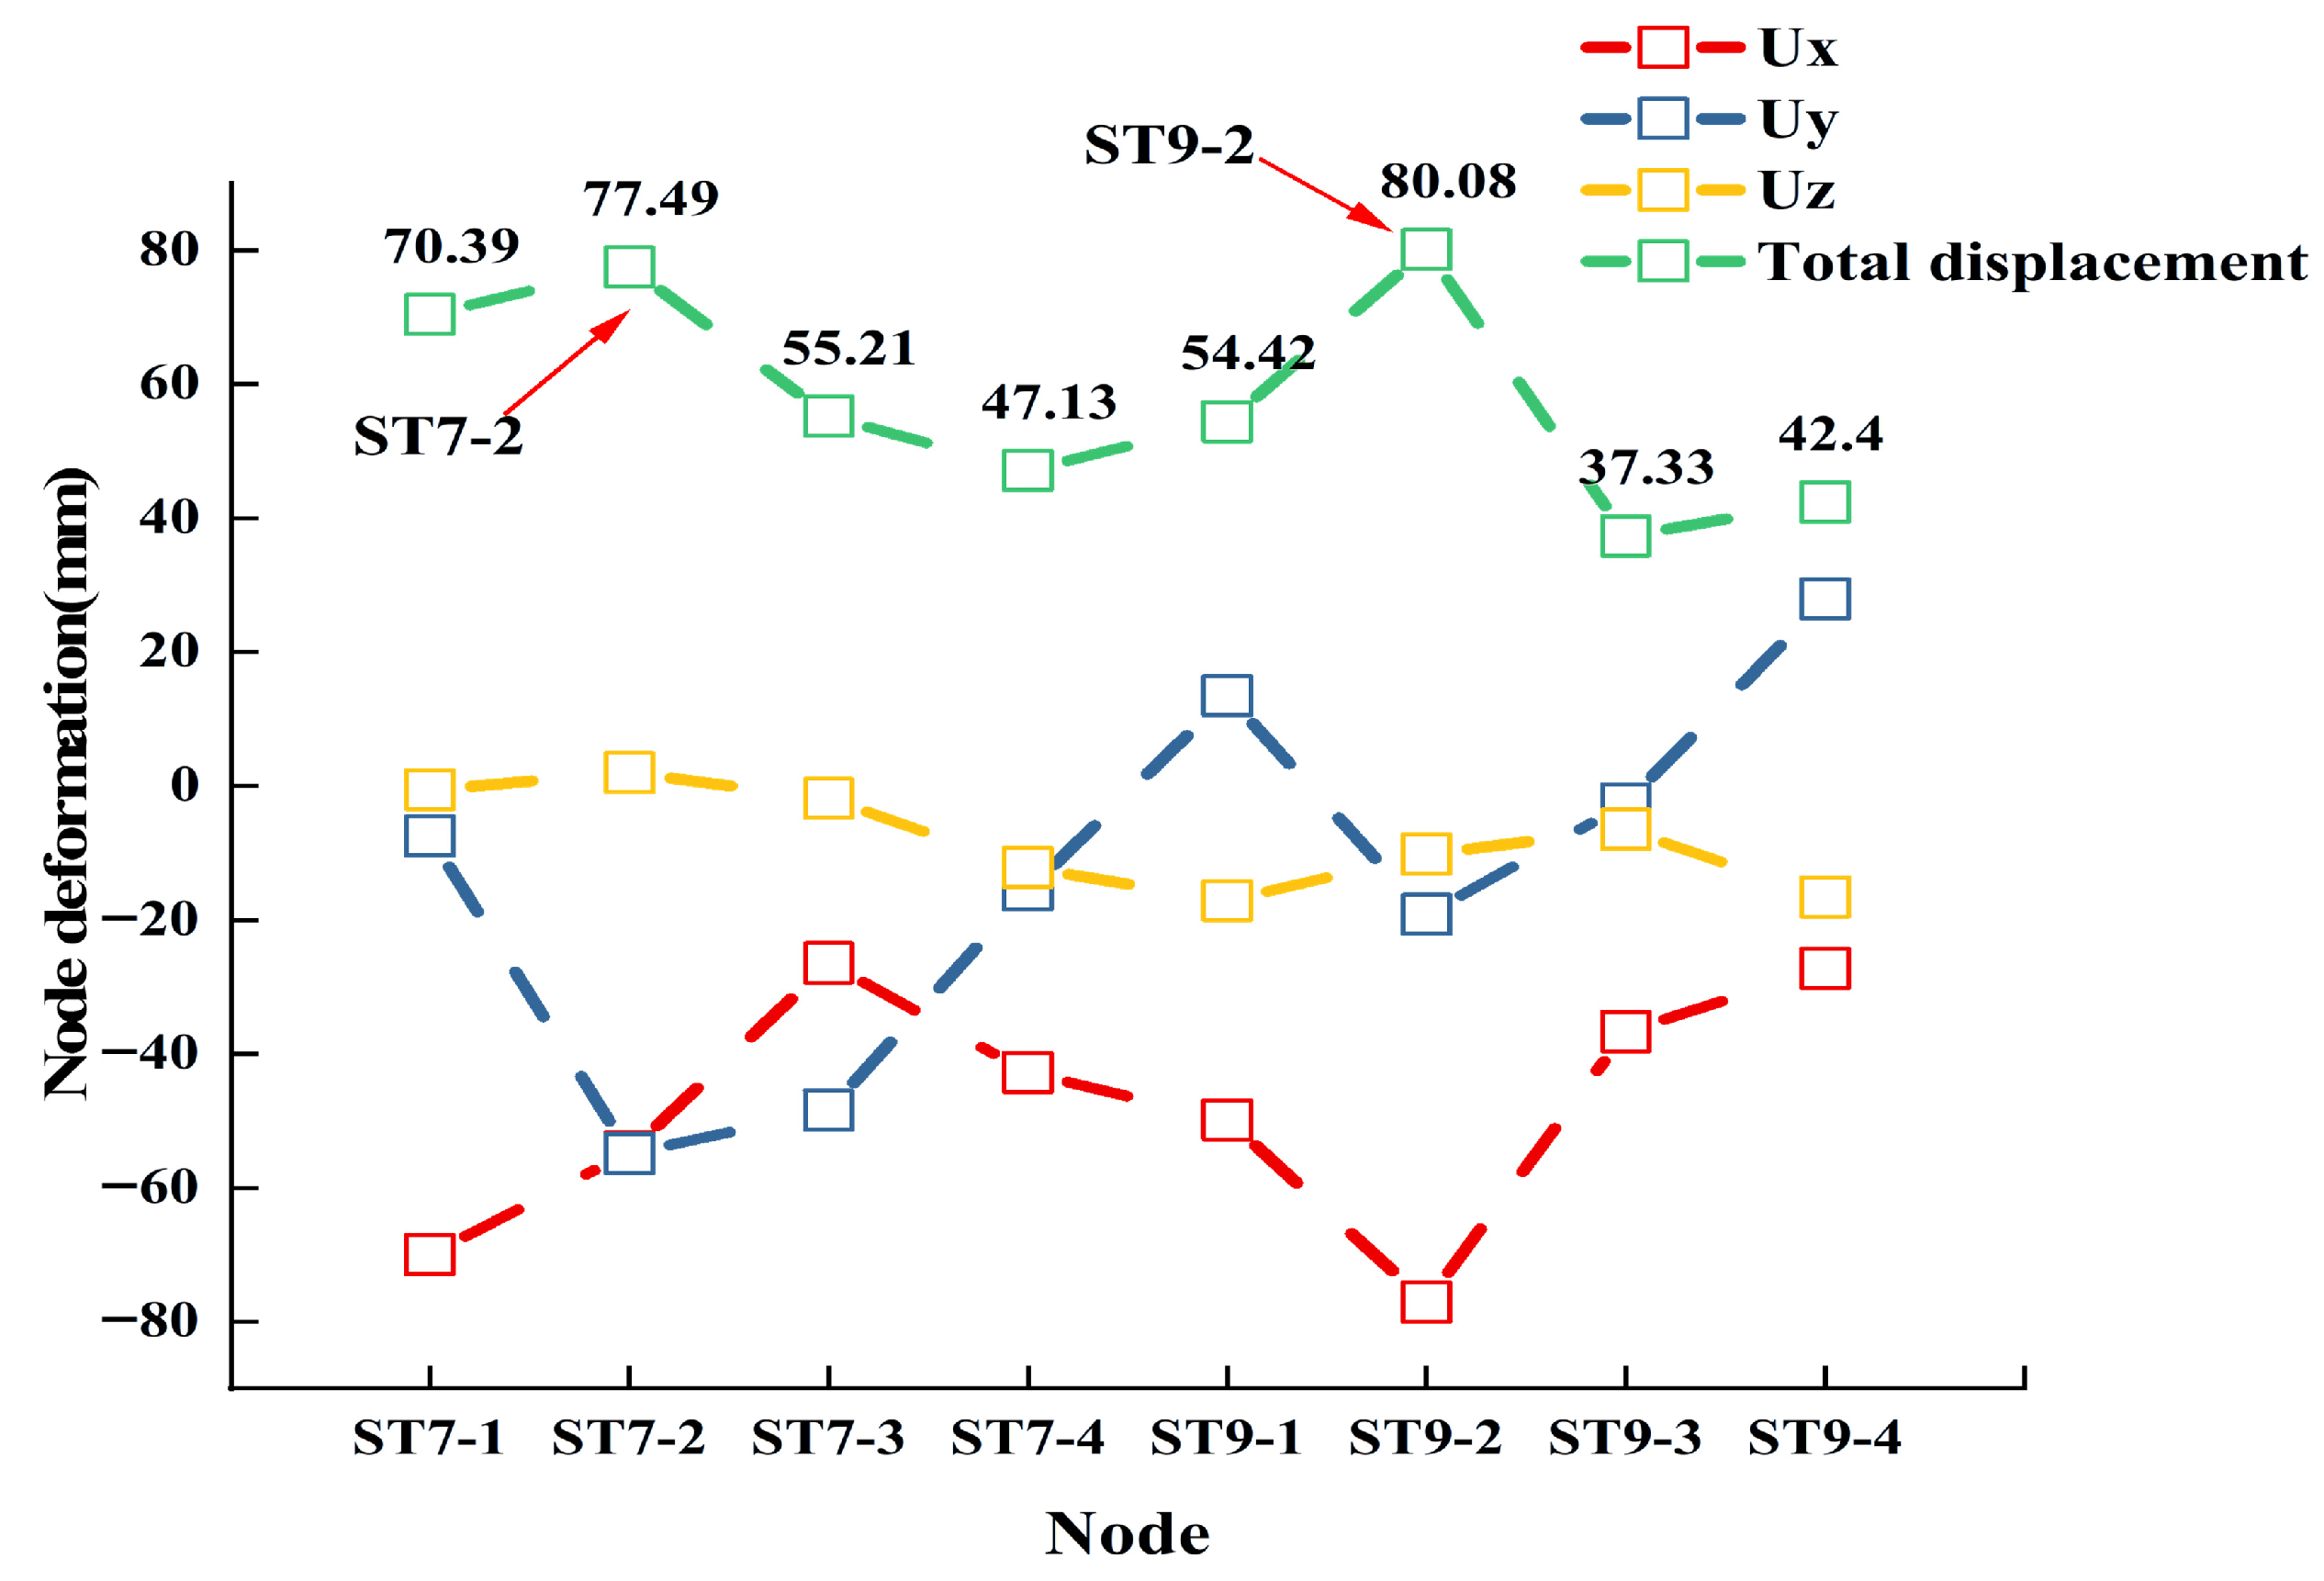
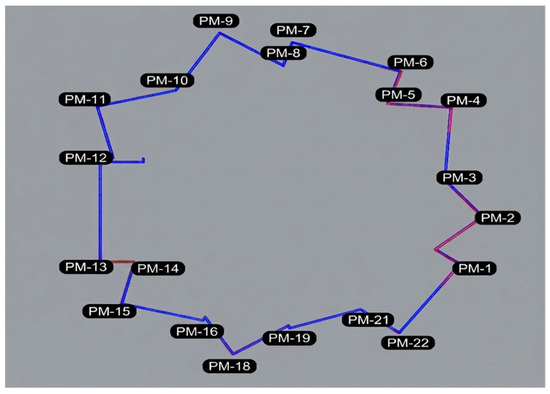
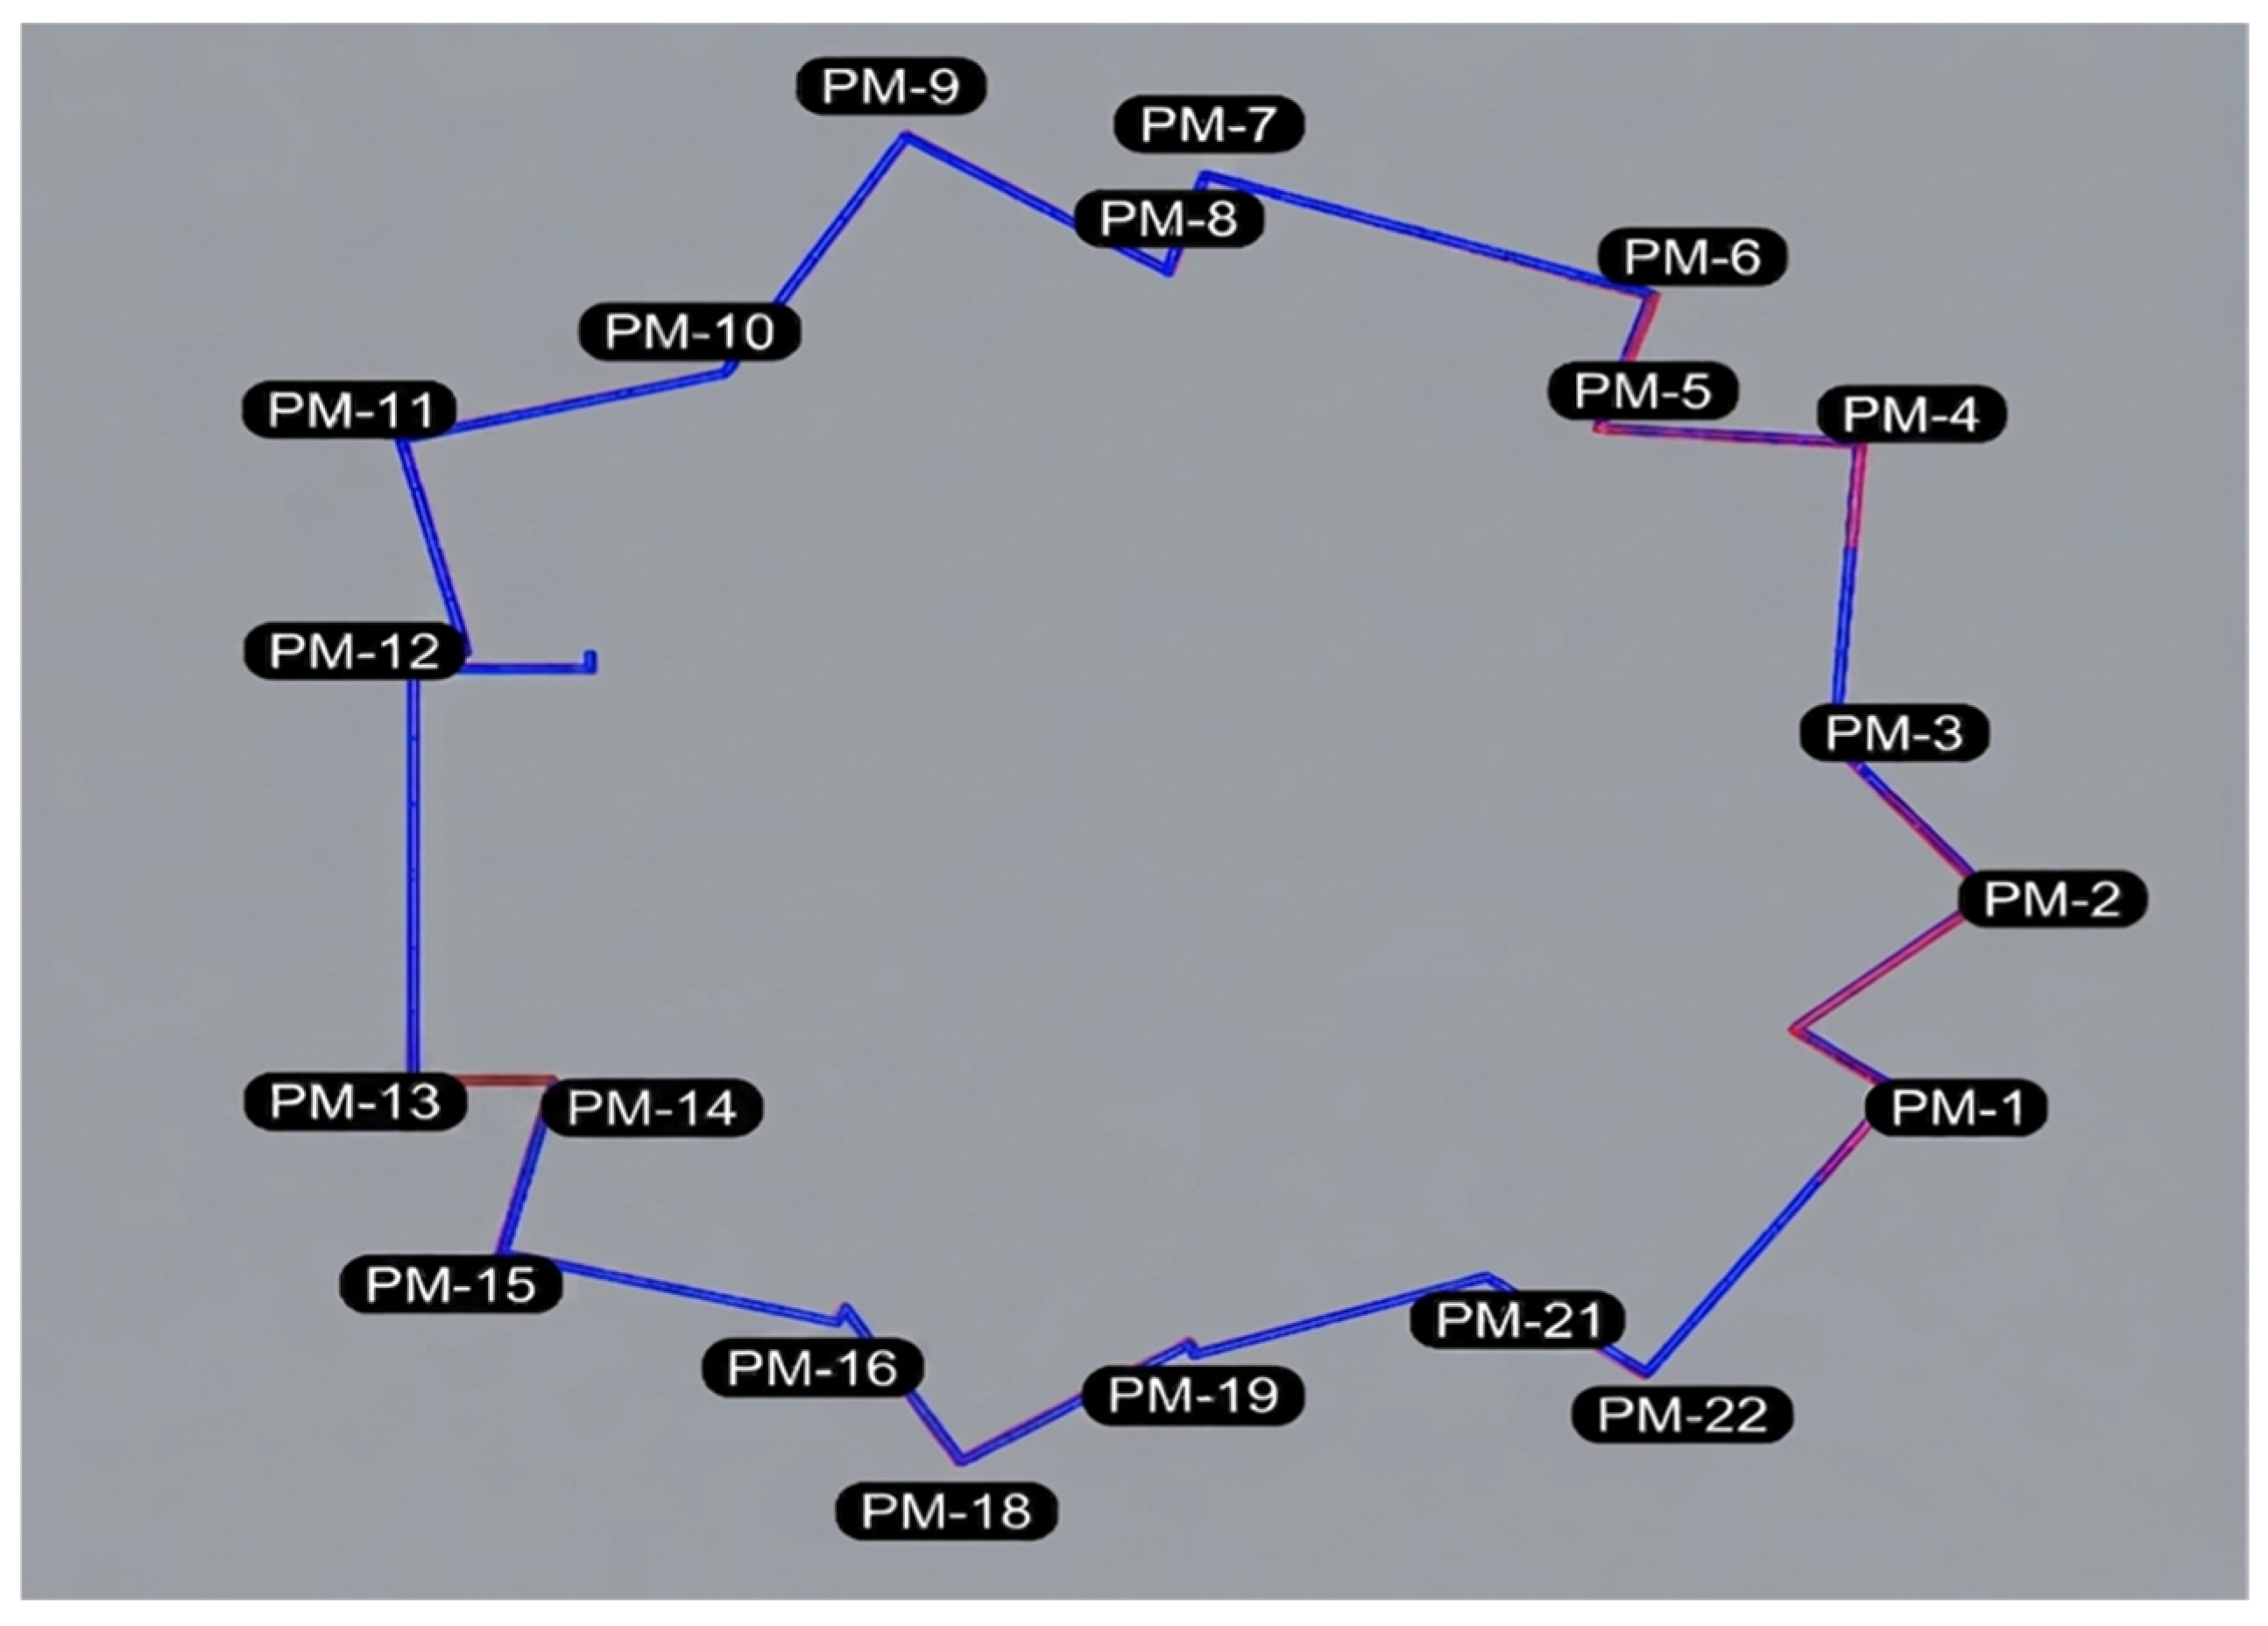
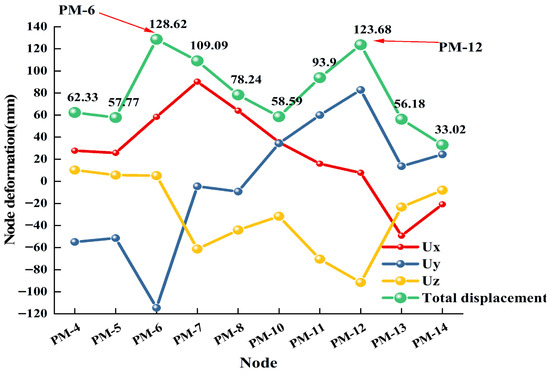
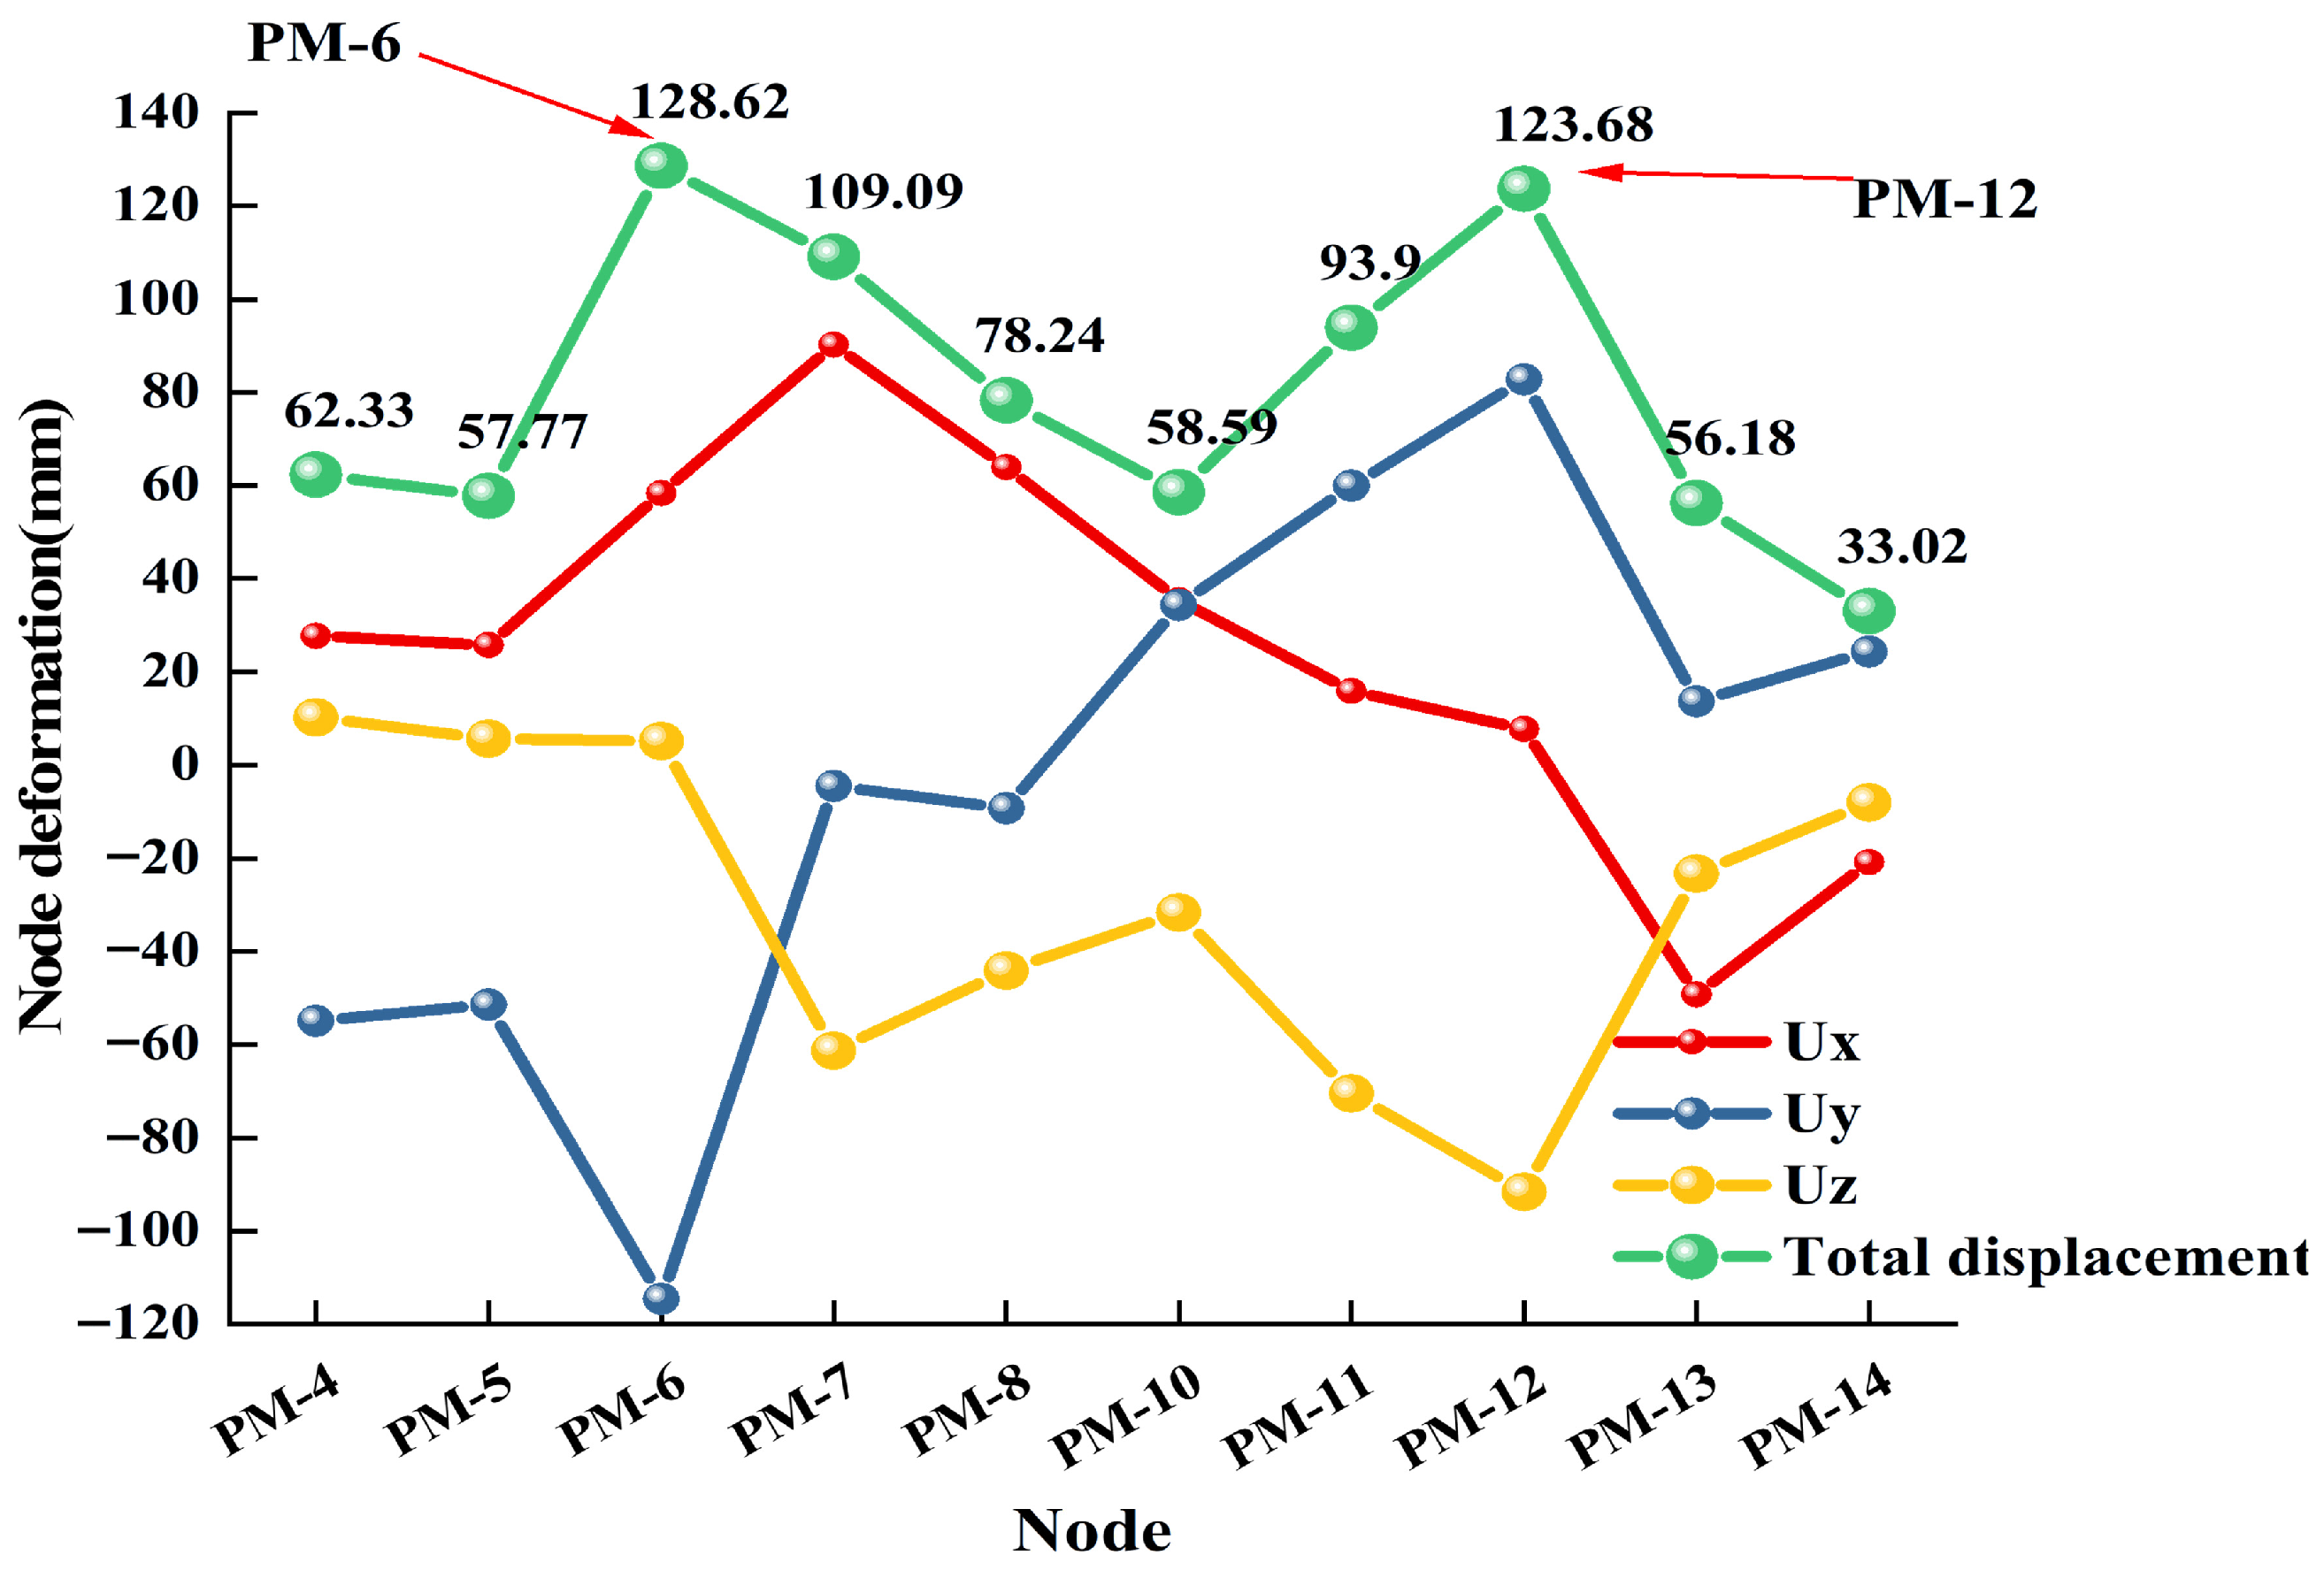
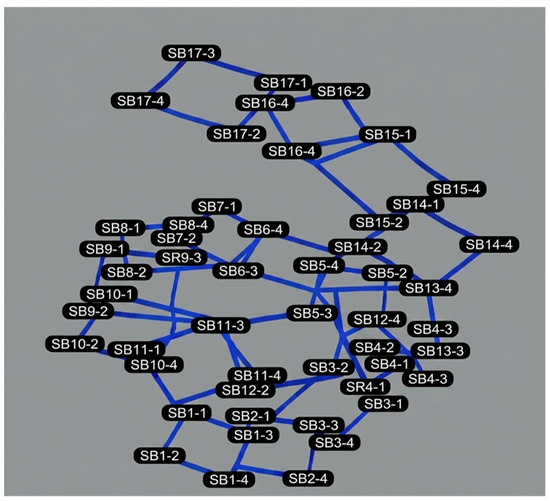
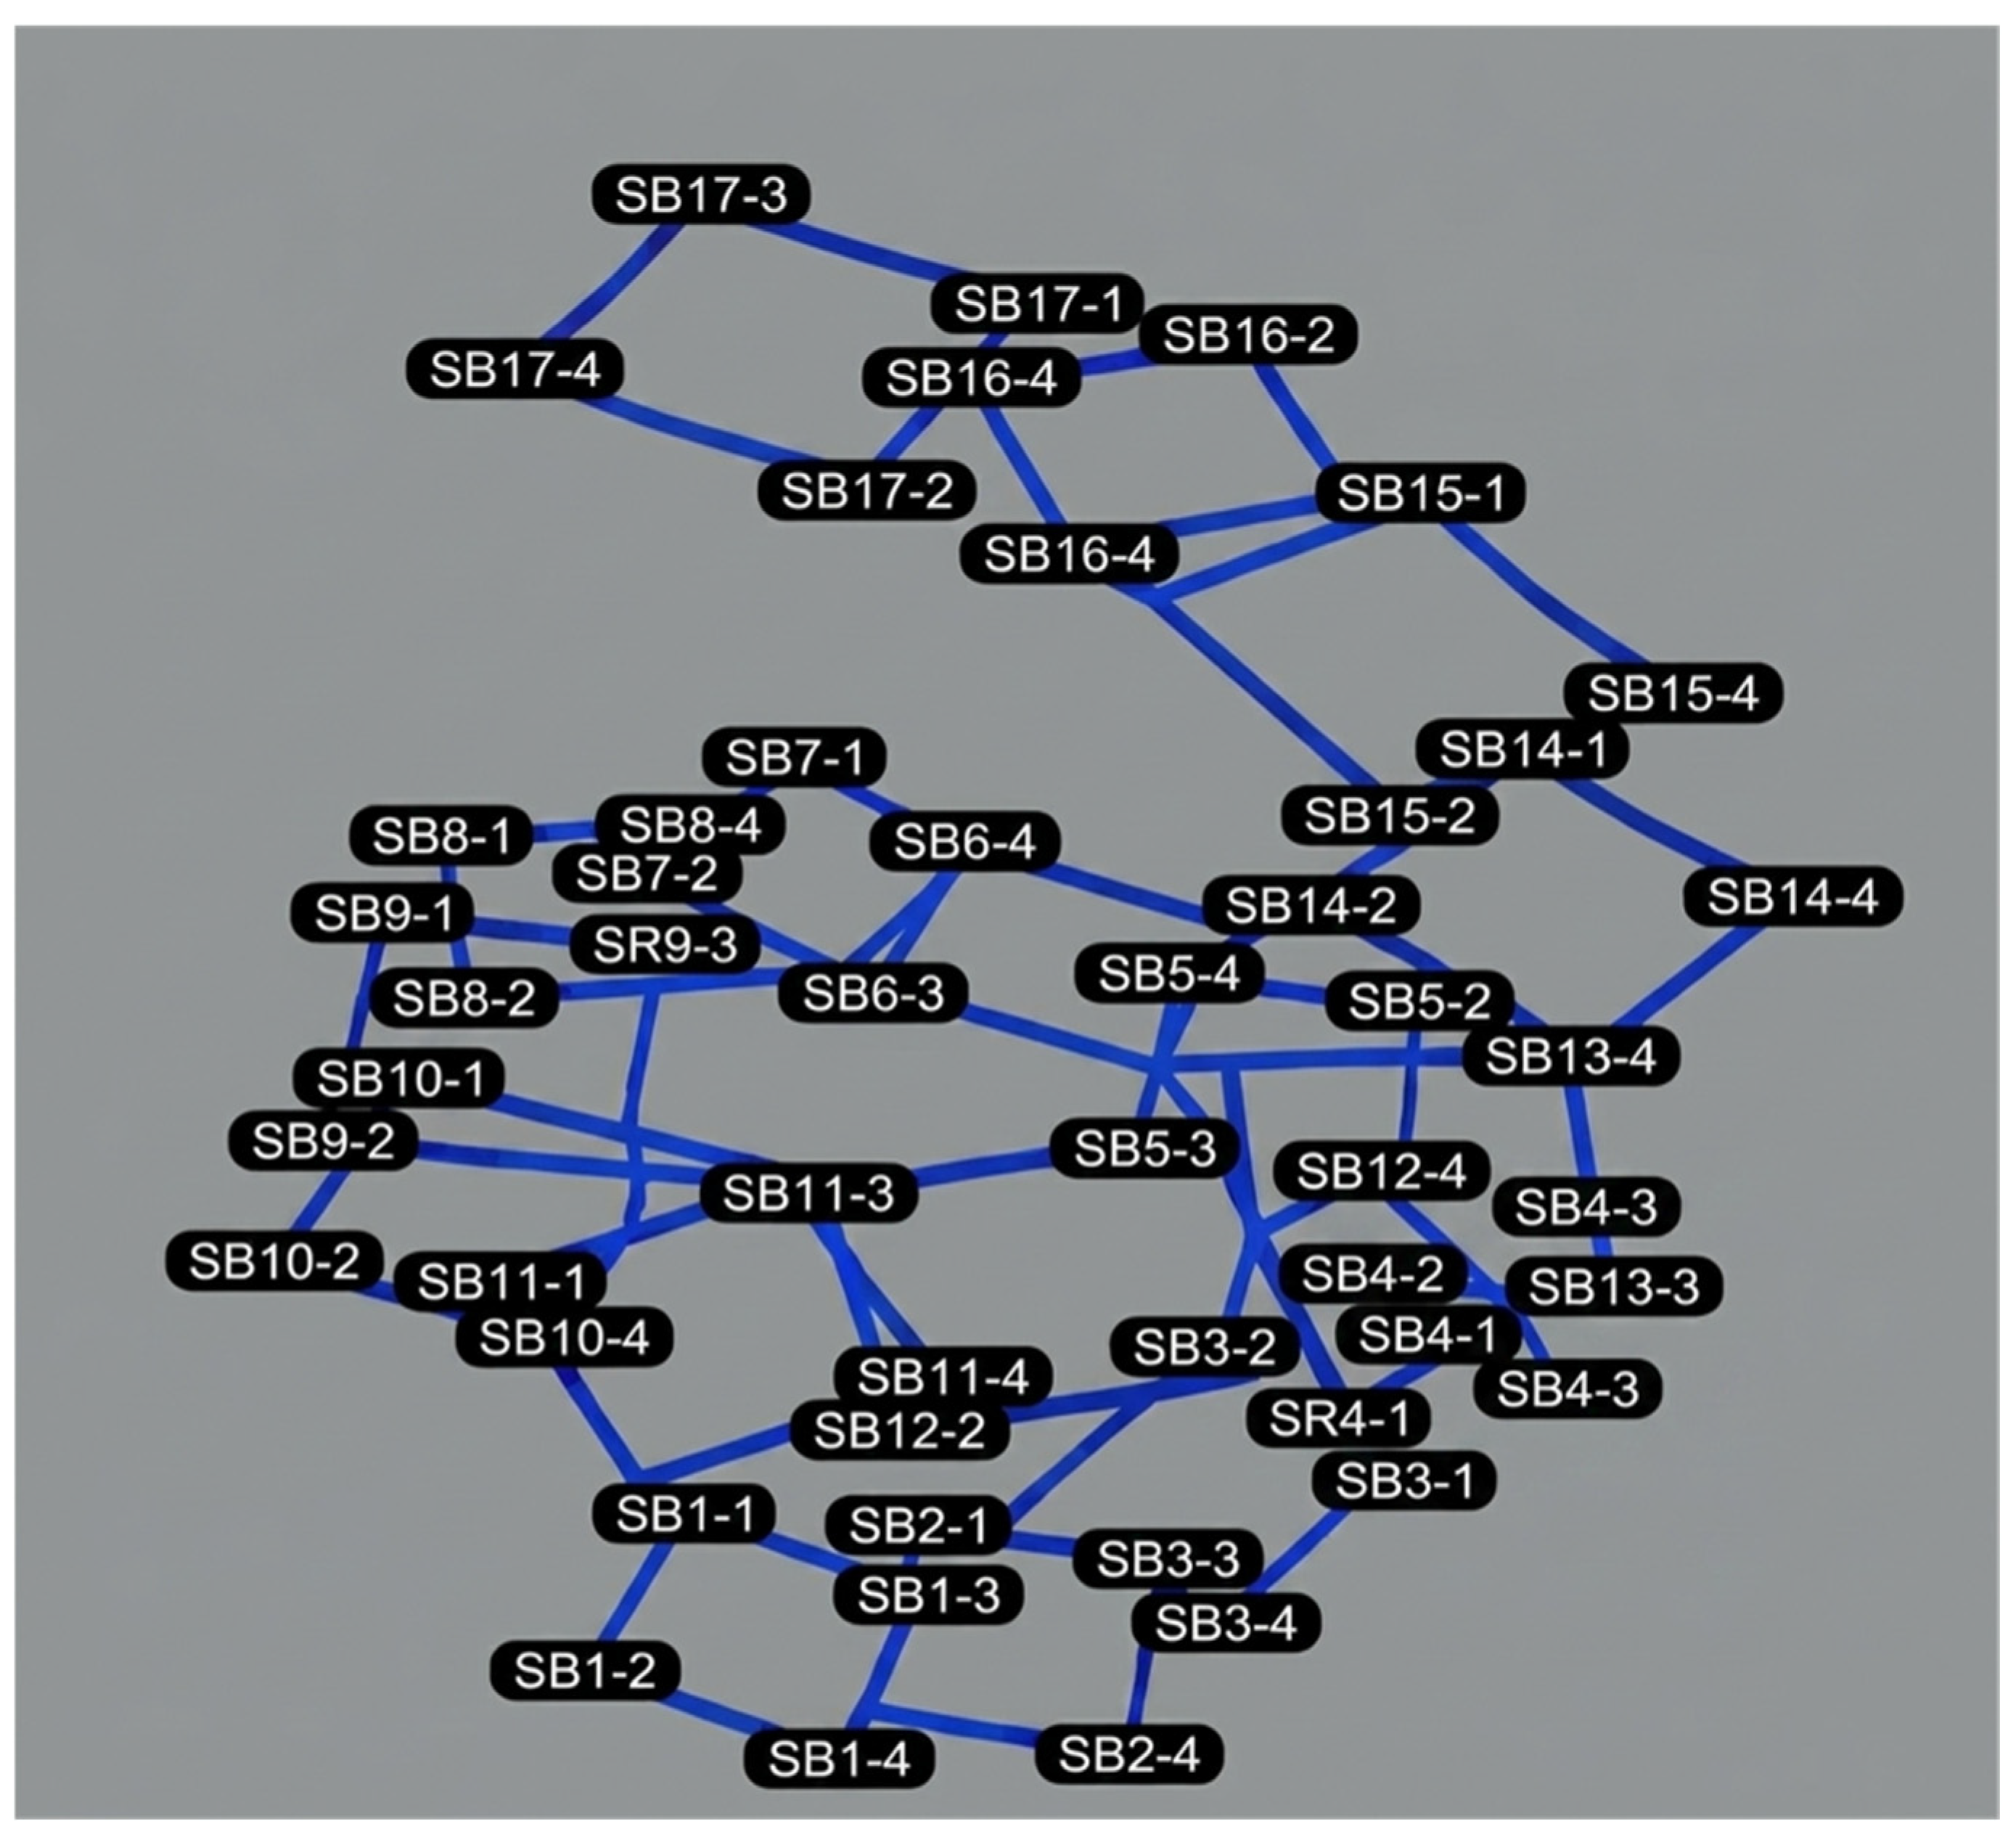
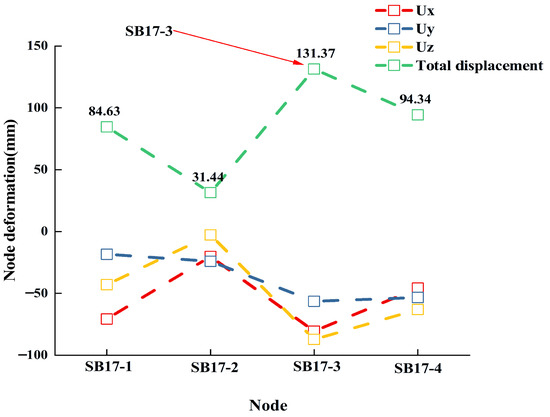
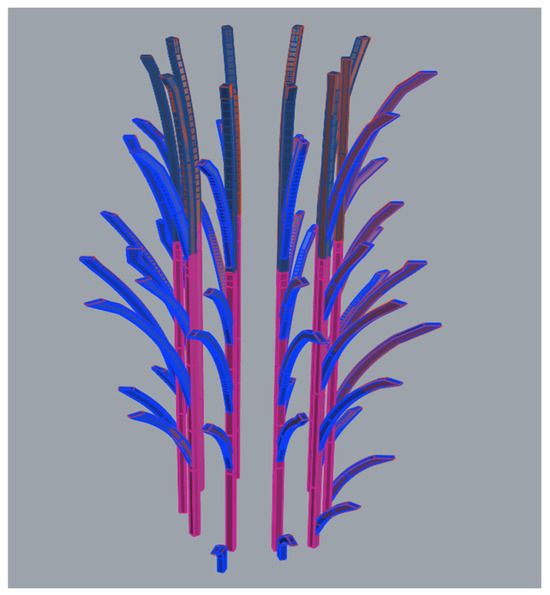







Disclaimer/Publisher’s Note: The statements, opinions and data contained in all publications are solely those of the individual author(s) and contributor(s) and not of MDPI and/or the editor(s). MDPI and/or the editor(s) disclaim responsibility for any injury to people or property resulting from any ideas, methods, instructions or products referred to in the content. |
© 2026 by the authors. Licensee MDPI, Basel, Switzerland. This article is an open access article distributed under the terms and conditions of the Creative Commons Attribution (CC BY) license.