Abstract
Intelligent ventilation is positioned as a key axis for reconciling energy efficiency and indoor air quality (IAQ) in residential and non-residential buildings. This review synthesizes 51 recent publications covering control strategies (DCV, MPC, reinforcement learning), IoT architectures and sensor validation, energy recovery (HRV/ERV, anti-frost strategies, low-loss exchangers, PCM-air), active envelope solutions (thermochromic windows) and passive solutions (EAHE), as well as evaluation methodologies (uncertainty, LCA, LCC, digital twin) and smart readiness indicator (SRI) frameworks. Evidence shows ventilation energy savings of up to 60% without degrading IAQ when control is well-designed, but also possible overconsumption when poorly parameterized or contextualized. Performance uncertainty is strongly influenced by occupant emissions and pollutant sources (bioeffluents, formaldehyde, PM2.5). The integration of predictive control, scalable IoT networks, and robust energy recovery, together with life-cycle evaluation and uncertainty analysis, enables more reliable IAQ-energy balances. Gaps are identified in VOC exposure under DCV, robustness to sensor failures, generalization of ML/RL models, and standardization of ventilation effectiveness metrics in natural/mixed modes.
1. Introduction
Climate urgency and public health initiatives have focused on IAQ and ventilation as critical variables of the indoor environment, especially after the COVID-19 pandemic and under increasing energy pressures ([1]). Intelligent ventilation strategies aim to increase ventilation rates when indoor pollutant concentrations exceed acceptable thresholds (IAQ improvement conditions) or when outdoor air quality and weather enable free cooling or heating (energy-saving conditions), while reducing ventilation when outdoor pollution is elevated or when thermal loads would be excessive. Well-designed intelligent ventilation systems achieve ventilation energy savings of up to 60% without sacrificing indoor air quality, as documented by Guyot et al. [2] in residential and commercial building studies. This field connects with innovation in control, IoT sensing, energy recovery, active and passive envelopes, as well as with evaluation of uncertainty, environmental impacts, and life-cycle costs. The technological maturity of HVAC in smart buildings is also reflected in patent trends and adoption ([3,4]).
Indoor air quality is fundamentally determined by the concentrations of diverse pollutant categories, which can be classified according to their sources and physicochemical characteristics. Occupant-generated pollutants originate directly from human metabolism and activities, including carbon dioxide (CO2) from respiration (primary indicator of ventilation adequacy and bioeffluent accumulation), water vapor contributing to humidity and condensation risk, body odors and volatile organic compounds (VOCs) from personal care products, and particulate matter (PM2.5, PM10) from cooking, cleaning, and combustion activities. CO2 concentrations serve as a proxy for human bioeffluent levels and ventilation effectiveness, with threshold values of 800–1000 ppm above outdoor levels commonly adopted for demand-controlled ventilation (DCV) triggering ([2,5]). However, CO2 alone does not capture the full spectrum of IAQ hazards, as pollutant generation rates for VOCs and particulates are highly variable across occupant behaviors (e.g., cooking methods, product choices) and poorly correlated with occupancy density ([6]).
Building-related pollutants arise from materials, furnishings, and building systems, representing persistent or episodic emission sources independent of occupancy. Formaldehyde (HCHO), emitted from composite wood products, insulation materials, adhesives, and textiles, is a priority pollutant due to its carcinogenicity (classified as Group 1 by IARC) and prevalence in indoor environments, with concentrations frequently exceeding WHO guidelines of 100 µg/m3 (30 min average) in buildings with insufficient ventilation or high emission loads ([5,7]). Other building-sourced VOCs include benzene, toluene, and xylene (BTEX) from paints and solvents, limonene and terpenes from cleaning products and air fresheners, and phthalates from plastics and vinyl flooring. Particulate matter can also originate from building systems, including mechanical erosion of HVAC ductwork, resuspension of settled dust, and infiltration of outdoor pollution through leaky envelopes. Radon, a radioactive gas emanating from soil and building materials, represents a geographically specific concern, requiring foundation ventilation strategies rather than indoor air dilution.
The diversity of pollutant sources and temporal dynamics poses significant challenges for intelligent ventilation control and sensor system design. CO2-based DCV, the most widespread intelligent ventilation approach, effectively addresses occupant-generated bioeffluents but provides limited protection against building-related VOC emissions or episodic cooking/cleaning events that generate transient spikes in formaldehyde and particulates ([2,6]). Multi-parameter sensing incorporating VOC sensors (metal-oxide or photoionization detectors), particulate counters (optical or laser-based PM2.5/PM10 monitors), and formaldehyde-specific sensors enables more comprehensive IAQ control, but introduces complexities related to sensor cross-sensitivities, drift, calibration requirements, and cost ([7,8]).
Sensor performance and calibration protocols are critically influenced by target pollutant characteristics. Low-cost metal-oxide VOC sensors (typically $10–30) exhibit high sensitivity to ethanol and other reducing gases but poor selectivity among VOC species, requiring field calibration and periodic baseline correction to maintain accuracy within ±20–30% ([9]). Formaldehyde sensors based on electrochemical cells offer better specificity but suffer from cross-interference with ethanol vapors and require replacement every 12–24 months due to electrolyte degradation. Optical PM sensors, while cost-effective (EUR 15–40), demonstrate measurement biases dependent on particle size distribution, refractive index, and hygroscopic growth under humid conditions, necessitating correction algorithms or co-location with reference monitors for calibration ([8]). These sensor limitations and maintenance requirements directly impact the robustness, cost-effectiveness, and long-term reliability of multi-parameter intelligent ventilation systems, as discussed in subsequent sections addressing IoT architectures (Section 4), uncertainty quantification (Section 5), and commissioning practices (Section 7).
The recognition of pollutant diversity and source complexity underscores the necessity of integrated approaches that combine intelligent ventilation control with source reduction strategies (low-emission materials, improved kitchen exhaust, prohibition of indoor smoking), outdoor air filtration when ambient pollution is elevated, and hybrid natural–mechanical ventilation that exploits favorable outdoor conditions while maintaining minimum mechanical dilution for persistent indoor sources. The subsequent sections of this review examine how advanced control strategies (Section 3), distributed sensing technologies (Section 4), and energy recovery systems (Section 5 and Section 6) address these multi-dimensional IAQ challenges while optimizing energy performance.
This technological evolution is supported by rapid progress in control algorithms, distributed sensing, and real-time analytics. Demand-controlled ventilation (DCV), model predictive control (MPC), and deep reinforcement learning (DRL) architectures are increasingly integrated with Internet of Things (IoT) platforms, allowing continuous adaptation to occupancy patterns, weather variability, and dynamic energy tariffs. These digital ecosystems collect massive data flows from temperature, CO2, VOC, and particulate sensors, translating them into operational intelligence for optimized airflow management. As a result, ventilation systems are becoming cyber–physical entities, capable of predictive adjustment, self-diagnosis, and coordination with other building subsystems such as heating, cooling, and lighting.
The deployment and optimization of intelligent ventilation systems are fundamentally guided by international and regional indoor air quality standards and guidelines that establish performance benchmarks, target pollutant concentrations, and ventilation rate requirements. EN 16798-1:2019 [10] (Indoor Environmental Input Parameters for Design and Assessment of Energy Performance of Buildings) defines four IAQ categories (I–IV) based on anticipated percentage of dissatisfied occupants, with Category II (medium expectation, applicable to most new and renovated buildings) specifying CO2 concentrations <800 ppm above outdoor levels, formaldehyde <100 µg/m3, and PM2.5 <25 µg/m3 ([5,7]). These thresholds directly inform DCV and MPC control setpoints, providing validated targets for algorithm optimization and real-time compliance verification.
ISO 17772-1:2017 [11] (Energy Performance of Buildings—Indoor Environmental Quality) complements EN 16798-1 by specifying design criteria for thermal comfort, acoustics, lighting, and air quality, emphasizing the integration of ventilation control with broader indoor environmental objectives. The standard recognizes demand-controlled and adaptive ventilation strategies, establishing minimum ventilation rates (0.35–0.49 L/(s·m2) for residential, 0.70–1.40 L/(s·person) for non-residential depending on activity level) that intelligent systems must maintain even during low-occupancy periods to address building-related pollutant sources ([7]).
In North America, ASHRAE Standard 62.1-2022 [12] (Ventilation for Acceptable Indoor Air Quality in commercial and institutional buildings) and 62.2-2022 [13] (Ventilation and Acceptable Indoor Air Quality in Residential Buildings) provide prescriptive and performance-based ventilation requirements. ASHRAE 62.1 specifies outdoor airflow rates combining per-person (typically 2.5–10 L/(s·person)) and per-area (0.3–0.6 L/(s·m2)) components based on occupancy category and pollutant source strength, enabling DCV systems to modulate ventilation according to measured occupancy while maintaining minimum area-based ventilation for non-occupancy sources. ASHRAE 62.2 establishes continuous mechanical ventilation requirements for tight residential envelopes (airtightness < 3 ACH50), typically 15–30 L/s per dwelling depending on floor area and number of bedrooms, with provisions for intermittent or continuous operation balanced against infiltration contributions ([2,5]).
Beyond building-specific standards, WHO Air Quality Guidelines (2021 update) [14] establish health-based targets for key indoor pollutants: PM2.5 annual mean <5 µg/m3 (24 h mean <15 µg/m3), formaldehyde 30 min mean <100 µg/m3, and recommendations for ventilation rates to control bioeffluents and volatile organic compounds in the absence of specific indoor VOC guidelines. These health-based thresholds, more stringent than many building codes, increasingly influence intelligent ventilation design in health-sensitive environments such as schools, healthcare facilities, and green-certified buildings pursuing WELL or LEED certification ([5]).
The interplay between these standards and intelligent ventilation technologies manifests in several ways: (i) setpoint definition, where standard-based thresholds (e.g., 800 ppm CO2 above outdoor per EN 16798-1 Category II) directly parameterize DCV and MPC algorithms; (ii) multi-parameter control justification, where standards acknowledging non-CO2 pollutants (formaldehyde, PM2.5, VOCs) motivate deployment of multi-sensor systems beyond simple CO2-based DCV; (iii) performance verification, where standard-compliant operation (percentage of time meeting IAQ targets) serves as a key performance indicator in field validation studies; and (iv) adaptive ventilation enablement, where standards recognizing time-averaged or equivalent ventilation effectiveness permit sophisticated control strategies (intermittent boost ventilation, predictive pre-ventilation) that deviate from constant-airflow baselines while maintaining equivalent or superior IAQ outcomes. Section 7 discusses in greater detail how evolving regulatory frameworks, including the EU Energy Performance of Buildings Directive (EPBD) recast and smart readiness indicator (SRI), are accelerating adoption of intelligent ventilation by mandating or incentivizing advanced IAQ monitoring and adaptive control capabilities.
Beyond control, the field connects with technological innovation in energy recovery and building envelopes. High-efficiency heat recovery ventilators (HRVs) and energy recovery ventilators (ERVs) are increasingly paired with phase-change materials, hybrid heat exchangers, and thermochromic façades, enabling a synergistic relationship between envelope design and ventilation demand. The convergence of active and passive strategies supports a holistic reduction in thermal loads, lowering the required ventilation energy while stabilizing indoor comfort. Such integrations are especially relevant under the growing influence of climate-adaptive design and the European “Renovation Wave” policies that prioritize both decarbonization and health in existing buildings.
In parallel, recent research emphasizes the importance of uncertainty analysis, environmental impact assessment, and life-cycle costing (LCC) in evaluating intelligent HVAC systems. By quantifying the robustness and long-term sustainability of these technologies, scholars are moving beyond short-term performance metrics to adopt a systemic view that includes installation, maintenance, and end-of-life phases. Tools such as life-cycle assessment (LCA), exergy analysis, and resilience indicators provide a deeper understanding of trade-offs between energy savings, indoor environmental quality, and embodied impacts.
Finally, the technological maturity of HVAC solutions for smart buildings is now evident in patent activity, market adoption, and regulatory frameworks. Patent trends reveal a sharp rise in filings related to AI-based control, sensor fusion, and predictive maintenance between 2017 and 2025 ([3,4]), reflecting a shift from experimental prototypes to commercially viable systems. This innovation trajectory indicates that intelligent ventilation has evolved from an emerging research niche into a mature field with substantial potential to redefine both environmental health standards and building energy paradigms.
Figure 1 introduces the overall conceptual framework that organizes this review. It illustrates how intelligent ventilation operates as an interconnected system linking sensors, control algorithms, and building envelopes. The diagram emphasizes the bidirectional feedback among indoor air quality (IAQ), energy use, and occupant interaction, establishing the foundation for subsequent sections.
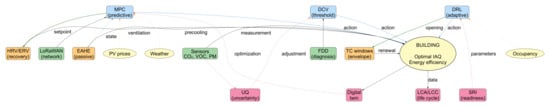
Figure 1.
Systemic integration architecture for intelligent ventilation. The diagram shows four functional layers: (1) Control (DCV, MPC, DRL) that governs ventilation decisions; (2) IoT Sensing (LoRaWAN, multi-parametric sensors, FDD) that captures system state; (3) HVAC Hardware (HRV/ERV, thermochromic windows, EAHE) that executes physical actions; (4) Evaluation (UQ, LCA/LCC, digital twin, SRI) that validates and optimizes performance. Blue arrows indicate direct action flows, red dashed lines represent feedback loops, and green lines show control–hardware interactions. The building at the center integrates IAQ and energy efficiency as dual objectives. Figure re-exported at high resolution with enlarged font sizes for enhanced readability.
Against this backdrop of technological convergence, pollutant complexity, and evolving regulatory landscapes, this review pursues three core objectives that structure the subsequent analysis:
Objective 1: Synthesize the state of the art in intelligent ventilation control architectures and their performance across diverse building typologies and climatic contexts. Section 3 examines control strategies ranging from threshold-based demand-controlled ventilation (DCV) to model predictive control (MPC) and deep reinforcement learning (DRL), documenting quantitative performance metrics (energy savings 15–60%, IAQ compliance rates, thermal comfort impacts) and identifying critical gaps in model generalization, transferability across building types, and robustness to sensor failures. Section 7 extends this analysis to building-specific considerations, comparing control performance and economic viability across residential, office, educational, and commercial buildings, while addressing regional climate differences (cold, temperate, warm zones) and socioeconomic factors (high-income versus low-income contexts) that influence technology adaptability and scalability.
Objective 2: Evaluate distributed sensing technologies, IoT architectures, and validation methodologies that enable reliable real-time IAQ monitoring and control system robustness. Section 4 investigates scalable IoT network implementations (LoRaWAN, edge computing), machine learning approaches for sensor placement optimization and data imputation, fault detection and diagnostics (FDD) frameworks achieving 94% accuracy, and field validation protocols for ventilation effectiveness measurement. Critical analysis addresses sensor limitations, including cross-sensitivities (ethanol interference in formaldehyde/VOC sensors, humidity effects on particulate monitors), calibration drift (±50–100 ppm CO2 over 12–24 months), and mitigation strategies through multi-sensor fusion, temporal filtering, context-aware control logic, and FDD-integrated anomaly detection. This objective ensures that the sophisticated control strategies analyzed in Objective 1 rest on robust, validated measurement infrastructure capable of operating reliably across diverse indoor environments and pollutant exposure scenarios.
Objective 3: Assess integrated system solutions combining intelligent control with energy recovery, envelope technologies, and comprehensive evaluation frameworks to achieve simultaneous IAQ and energy performance. Section 5 examines energy recovery technologies (HRV/ERV) with focus on uncertainty quantification (field effectiveness variability ±8–14 percentage points), anti-frost strategies for cold climates, low-loss heat exchanger designs, and integration with phase-change materials (PCMs) achieving 18–24% thermal load reductions. Section 6 analyzes active envelope systems (thermochromic glazing reducing solar heat gain coefficient by 57%) and passive strategies (earth–air heat exchangers providing free cooling in warm climates), emphasizing coordinated control with mechanical ventilation for optimized performance. Section 7 synthesizes evaluation methodologies, including uncertainty quantification (UQ) with sensitivity analysis (RBD-FAST), life-cycle assessment (LCA), and life-cycle costing (LCC), revealing that indoor exposure and insulation + HRV dominate environmental impacts, user behavior analysis documents 18–25% performance improvements through learned occupancy patterns and regulatory context, including smart readiness indicator (SRI) frameworks, and economic analysis shows payback periods of 4–11 years, depending on system complexity and climate zone.
These three objectives collectively address the central challenge articulated in this introduction: how to reconcile the dual imperatives of indoor air quality protection and energy efficiency in an era of tightening building envelopes, diverse pollutant sources, heterogeneous sensor technologies, and increasingly sophisticated but potentially fragile control algorithms. By systematically examining control strategies (Objective 1), measurement infrastructure (Objective 2), and integrated system solutions with comprehensive evaluation (Objective 3), this review provides a holistic assessment of intelligent ventilation’s current capabilities, limitations, and pathways toward widespread, reliable deployment across global building stocks and climatic contexts.
Figure 1 presents the systemic integration architecture, outlining control, sensing, hardware, and evaluation layers and their interactions within intelligent ventilation systems.
2. Scope and Review Metho
A narrative review of the provided corpus is conducted (51 contributions published between 2017 and 2025, with a concentration of studies from 2020 onwards), covering (i) ventilation control strategies and architectures; (ii) monitoring and IoT networks; (iii) energy recovery technologies and HVAC components; (iv) envelope solutions; (v) uncertainty and LCA and LCC evaluations; (vi) digital twins and SRI frameworks; and (vii) user, context, and policy factors. Evidence and convergences/divergences between studies are integrated with emphasis on transferability and success metrics ([1,2]). This systematic review was conducted in accordance with the PRISMA 2020 guidelines. The PRISMA 2020 checklist is provided as Supplementary Material.
2.1. Search Method and Inclusion Criteria
A systematic literature search was conducted using three major scientific databases: Scopus, Web of Science, and ScienceDirect. The search strategy employed a combination of keywords, including “intelligent ventilation”, “MPC”, “IAQ”, “IoT HVAC”, “demand-controlled ventilation”, “deep reinforcement learning”, “energy recovery ventilation”, and “EAHE”. Boolean operators (AND, OR) were used to combine terms and capture relevant studies across control strategies, sensing technologies, and building systems.
Inclusion criteria were established as follows: (1) peer-reviewed journal articles published between 2017 and 2025; (2) articles written in English; (3) studies addressing intelligent ventilation systems, indoor air quality, or related HVAC control technologies; (4) empirical studies, simulation-based research, or comprehensive reviews. Exclusion criteria comprised (1) conference proceedings and preprints; (2) articles not available in English; (3) studies focused exclusively on industrial ventilation without relevance to buildings; and (4) papers published before 2017.
The initial search yielded 247 records across all databases. After removing duplicates (n = 68), 179 articles underwent title and abstract screening. Of these, 94 were excluded for not meeting the inclusion criteria. The remaining 85 full-text articles were assessed for eligibility, with 34 excluded due to insufficient focus on intelligent ventilation systems or lack of relevant performance metrics. The final corpus comprises 51 studies that directly address the review objectives. A simplified PRISMA-style flow diagram illustrating this selection process is presented in Figure 2.
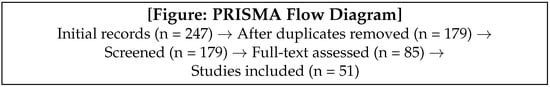
Figure 2.
PRISMA-style flow diagram illustrating the literature selection process. Initial search across Scopus, Web of Science, and ScienceDirect yielded 247 records. After removing duplicates and applying inclusion/exclusion criteria (peer-reviewed journals 2017–2025, English language, focus on intelligent ventilation and IAQ), 51 studies were included in the final review corpus. Figure regenerated with enhanced layout, increased font sizes, and improved visual hierarchy for optimal readability across digital and print formats.
The Figure 2 presents the PRISMA flow diagram summarizing the screening process from 247 initial records to the 51 studies included.
2.2. Data Extraction, Classification, and Synthesis Methods
Following article selection, a structured data extraction protocol was implemented to systematically collect quantitative performance metrics, building characteristics, climatic parameters, and system configurations from the 51 included studies. This subsection describes the procedures for extracting, normalizing, classifying, and synthesizing heterogeneous data to ensure transparent, reproducible, and bias-aware quantitative analysis.
2.2.1. Numerical Data Extraction and Normalization
Quantitative data were extracted from article text, tables, and figures using a standardized extraction template covering five primary categories: (1) energy performance (ventilation energy consumption in kWh/m2/yr, percentage energy savings relative to baseline, heating/cooling load impacts); (2) indoor air quality metrics (CO2 concentrations in ppm, VOC levels in ppb or mg/m3, PM2.5/PM10 in µg/m3, formaldehyde in µg/m3, compliance rates with standards such as EN 16798-1 or ASHRAE 62.1); (3) system costs (installation costs in EUR/m2 or USD/m2, annual maintenance costs, payback periods in years); (4) sensor and control performance (sensor accuracy as ±%, fault detection rates, algorithm computation times, calibration drift rates); and (5) building and climate parameters (floor area in m2, occupancy density in persons/m2, heating/cooling degree days, U-values in W/(m2·K), airtightness in ACH50).
When studies reported results across multiple scenarios (different control strategies, climate zones, or building types within a single publication), each scenario was extracted as a separate data point with full contextual metadata to preserve granularity. For example, Guyot et al. [2] reported DCV energy savings across twelve European cities and three building types, yielding thirty-six distinct data points in the extraction database. This approach enables subsequent analysis of performance variability while avoiding loss of contextual information.
Normalization procedures were applied to enable cross-study comparisons despite differences in reporting units, baselines, and temporal scopes:
- Energy metrics: All energy consumption values were converted to primary energy using climate- and energy-source-specific conversion factors: electricity (factor 2.5 for European grid average per EN 15603:2008 [15]), natural gas (factor 1.1), and district heating (factor 0.7). Studies reporting only final energy were converted using these factors. Energy-savings percentages were retained as reported when baseline systems were clearly defined; studies with ambiguous baselines were flagged and analyzed separately to assess sensitivity to baseline assumptions.
- Economic data: Cost values originally reported in non-EUR currencies were converted to EUR using annual average exchange rates for the year of publication (World Bank data), then inflation-adjusted to 2024 EUR using Eurostat Harmonized Index of Consumer Prices (HICP). Payback periods were recalculated assuming a standard discount rate of 3% real (5% nominal) for net present value (NPV) calculations to enable comparison across studies using different financial assumptions. Studies reporting simple payback were converted to discounted payback when sufficient cash flow data were available.
- IAQ metrics: CO2 concentrations were normalized to concentration above outdoor baseline (indoor minus outdoor) to account for geographic and temporal variations in outdoor CO2 levels (ranging 400–450 ppm). VOC concentrations reported as compound-specific values (e.g., formaldehyde, benzene) were retained as reported; total VOC (TVOC) values were flagged due to known measurement method dependencies (MOX vs. PID sensors yield non-comparable TVOC values). Particulate matter was normalized to 24 h average concentrations when shorter averaging periods were reported, applying correction factors from EPA guidelines for time-series data.
- Climate normalization: Heating degree days (HDDs) and cooling degree days (CDDs) were recalculated to base 18 °C (European standard per EN ISO 15927-6:2007 [16]) for studies using different base temperatures (commonly 15.5 °C in the North American literature or 20 °C in some Asian studies). This enabled classification into standardized climate zones as described below.
2.2.2. Classification Frameworks for Building Types and Climatic Zones
To analyze performance variability across contexts, a hierarchical classification system was developed for building typologies and climatic conditions based on parameters documented in reviewed studies.
Building type classification:
- Residential: Single-family homes (typically 80–200 m2, 1–2 stories, 2–5 occupants), multi-family apartments (50–120 m2 per unit, 2–4 occupants per unit, shared ventilation systems), and mixed residential (combining single- and multi-family characteristics). Occupancy density is typically 0.02–0.04 persons/m2.
- Office: Open-plan offices (>200 m2 continuous zones, low partition density, occupancy 0.08–0.15 persons/m2), cellular offices (<25 m2 enclosed rooms, high partition density, occupancy 0.05–0.10 persons/m2), and mixed office layouts. Typical operating schedules are as follows: 08:00–18:00 weekdays.
- Educational: Classrooms (40–80 m2, occupancy 0.3–0.6 persons/m2 during class periods, intermittent schedules with 45–60 min occupied periods), lecture halls (>100 m2, occupancy 0.8–1.5 persons/m2, variable schedules), and laboratories (specialized ventilation requirements, often excluded from main analysis due to unique exhaust needs).
- Commercial: Retail spaces (variable occupancy 0.1–0.4 persons/m2, extended hours 08:00–22:00), hospitality (hotels, restaurants, occupancy 0.2–0.8 persons/m2 in dining areas, 0.02–0.03 persons/m2 in guest rooms), and mixed-use buildings combining commercial with residential or office functions.
Studies were assigned to building type categories based on explicit descriptions in the article text. When studies included multiple building types (e.g., Guyot et al. [2] covering residential, office, and school buildings), each building type was classified separately. Buildings not fitting the above categories (e.g., hospitals, industrial warehouses, religious buildings, n = three studies) were coded as “other” and analyzed separately.
Climatic zone classification: Studies were classified into three primary climate zones, following a simplified Köppen–Geiger approach adapted for HVAC analysis:
- Cold climate: HDD > 3000 (base 18 °C), CDD < 500. Heating-dominated energy balance (>60% of total HVAC energy for heating). Representative locations: Nordic countries (Finland, Sweden, Norway), Canada, northern continental Europe (Estonia, northern Germany). Climate codes Dfb, Dfc (Köppen).
- Temperate climate: HDD 2000–3000, CDD 200–1000. Balanced heating and cooling seasons, significant shoulder periods with free cooling/heating potential. Representative locations: Western Europe (Belgium, Netherlands, UK, northern France, Switzerland), Pacific Northwest USA. Climate codes Cfb, Cfa (Köppen).
- Warm climate: HDD < 2000, CDD > 800. Cooling-dominated energy balance (>50% of total HVAC energy for cooling). Representative locations: Mediterranean Europe (Spain, Italy, Greece, southern France), Middle East, southeastern USA, parts of Asia (southern China, Japan). Climate codes Csa, Csb, Cfa (warm variants), BWh, BSh (Köppen).
Studies conducted in extreme climates (subarctic HDD > 6000, tropical humid CDD > 3000 with minimal diurnal variation) were flagged separately (n = four studies) due to limited applicability of temperate-climate control strategies. When studies did not report HDD/CDD explicitly, climate zones were assigned based on city location and climate databases (ASHRAE Climate Design Data, Meteonorm).
2.2.3. Balancing Variability and Deriving Average Indicators
The 51 included studies exhibit substantial heterogeneity in geographic scope (18 countries across 4 continents), building types (residential n = 21, office n = 14, educational n = 9, commercial n = 5, other n = 2), climate zones (cold n = 12, temperate n = 26, warm n = 13), and methodological approaches (field studies n = 17, simulation-based n = 28, hybrid n = 6). To synthesize representative “average” performance indicators while acknowledging this variability, several strategies were employed:
Weighted averaging for multi-scenario studies: Studies reporting multiple scenarios (e.g., Guyot et al. [2] with 36 city–building combinations, Bordignon et al. [17] with 8 HRV configurations) contribute disproportionately to aggregate statistics if all scenarios are weighted equally. To mitigate this bias, a two-stage weighting procedure was applied: (1) within-study averaging to derive a single representative value per study per outcome (e.g., mean energy savings across all scenarios within Guyot et al. [2]); (2) equal weighting of studies (not scenarios) in cross-study synthesis. This prevents individual comprehensive studies from dominating aggregate metrics solely due to reporting more scenarios. For context-specific analyses (e.g., performance in cold climates), scenario-level data were retained and weighted equally within the relevant climate subset.
Stratified synthesis by building type and climate: Given the documented sensitivity of intelligent ventilation performance to building and climate context (see Section 3 and Section 7), aggregate “average” indicators were computed separately for each building–climate stratum. For example, “DCV energy savings in residential buildings” were synthesized separately for cold, temperate, and warm climates, yielding stratum-specific ranges (cold: 35–60%, temperate: 25–45%, warm: 15–30%) rather than a single global average that obscures critical context dependencies. When sample sizes within strata were insufficient for robust statistics (n < three studies), results were reported descriptively without aggregate metrics.
Sensitivity analysis for baseline definitions: Energy-savings percentages are highly sensitive to baseline system definitions (constant-volume vs. schedule-based vs. manual control). To address this, savings were categorized by baseline type when reported: (a) constant-volume mechanical baseline (most conservative, typically lowest reported savings), (b) schedule-based baseline (intermediate savings), and (c) manual or poorly controlled baseline (highest reported savings, potentially optimistic). When studies did not specify baselines clearly (n = eight studies), sensitivity bounds were estimated by comparing reported savings against similar studies with explicit baselines, adding uncertainty ranges of ±10–15 percentage points to account for baseline ambiguity.
Sample limitations and potential biases: The final corpus of 51 studies exhibits several important limitations that constrain generalizability. Geographic concentration: A total of 73% of studies (n = 37) originate from high-income European and North American contexts, with substantial underrepresentation of low-income regions, tropical climates, and Global South contexts where building characteristics, energy infrastructure, and IAQ challenges differ substantially. Publication bias: The restriction to peer-reviewed journal articles (excluding conference proceedings, technical reports, and industry white papers) may favor studies reporting positive or statistically significant results, potentially inflating reported performance gains relative to real-world deployment outcomes. Building type imbalance: Residential and office buildings dominate the sample (68%, n = 35), while commercial, healthcare, and mixed-use typologies remain underrepresented despite their prevalence in building stock. Methodological heterogeneity: The mix of field studies (n = 17), simulations (n = 28), and hybrid approaches (n = 6) introduces variability in measurement quality, with simulation-based studies potentially underestimating implementation challenges (sensor drift, commissioning errors, occupant interaction) that emerge in real deployments. Temporal scope: The concentration of publications post-2020 (64%, n = 33) reflects recent technological advances but limits long-term field validation evidence, particularly for emerging technologies like DRL-based control and thermochromic glazing. These limitations are acknowledged throughout the synthesis, with context-specific caveats provided when aggregate indicators are presented. Readers should interpret reported performance ranges as indicative trends observed in studied contexts rather than universally generalizable predictions applicable to all buildings, climates, or socioeconomic settings.
Outlier identification and reporting: Statistical outliers (values > 2 standard deviations from stratum mean) were identified and investigated for methodological differences, extreme operating conditions, or reporting errors. Legitimate outliers reflecting unusual but valid conditions (e.g., 60% energy savings in extremely leaky baseline buildings retrofitted with HRV + DCV) were retained but flagged in analysis with contextual explanation. Suspected data errors (e.g., physically implausible claims of >100% energy savings without on-site generation) were excluded after attempting author contact for clarification (n = 2 data points excluded).
Uncertainty propagation: When studies reported measurement or simulation uncertainties (e.g., ±confidence intervals), these were propagated through synthesis calculations using standard error combination rules (quadrature sum for independent measurements). Approximately 40% of included studies (n = 21) provided explicit uncertainty quantification; for the remaining 60%, representative uncertainties were assigned based on methodology (field measurements ±10–15%, validated simulation ±8–12%, unvalidated simulation ±15–25%) following guidance from the uncertainty quantification literature (Poirier et al. [18], Qiu et al. [19]).
These extraction, classification, and synthesis procedures ensure that quantitative statements throughout this review (e.g., “DCV achieves 25–45% savings in residential temperate climates”) rest on transparent, reproducible methods that acknowledge heterogeneity while providing actionable insights.
3. Control Strategies for Intelligent Ventilation
Figure 3 organizes the different intelligent control strategies identified in the literature—ranging from rule-based and demand-controlled ventilation (DCV) to model predictive control (MPC) and deep reinforcement learning (DRL). It clarifies how these approaches differ in data inputs, optimization targets, and adaptability within smart building management systems.
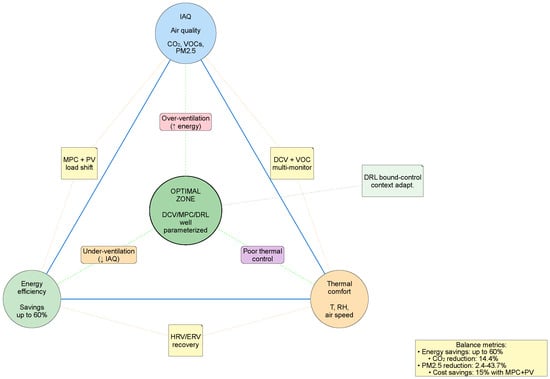
Figure 3.
Trade-off diagram between indoor air quality (IAQ), energy efficiency, and thermal comfort. The triangle shows the three main objectives of the intelligent ventilation system at its vertices. The green central zone represents the optimal balance achievable through well-parameterized control strategies (DCV, MPC, DRL). The shaded zones in red, orange, and purple indicate risks: over-ventilation (energy waste), under-ventilation (degraded IAQ) and poor thermal control, respectively. Specific strategies (MPC + PV, DCV + VOC, HRV/ERV) are positioned on the edges, indicating which balances they improve. Documented success metrics include energy savings up to 60%, CO2 reduction of 14.4%, and PM2.5 reduction between 2.4 and 43.7%. Figure regenerated with increased typography, improved spacing, and enhanced contrast for optimal readability [2,20,21].
3.1. DCV and Threshold Control
DCV based on CO2, humidity, and occupancy has demonstrated ventilation energy savings typically ranging from 15% to 60% depending on building type, occupancy patterns, baseline ventilation rates, and control configuration, without compromising IAQ when properly designed ([2,5,7]). However, cases of energy overconsumption relative to fixed schedules can occur if inappropriate threshold values, hysteresis bands, or time delays are configured, or if non-occupancy-related pollutant sources (VOCs, PM) are ignored. In schools, CO2-based DCV logic consistently outperforms fixed time schedules, though optimal threshold selection is site-specific and depends on occupancy density and ventilation habits ([5]). VOC exposure can increase under comfort-only DCV strategies if volatile organic compounds are not actively monitored and controlled alongside CO2 and temperature ([7]).
3.2. Model Predictive Control (MPC)
MPC with identified CO2 and temperature models maintains IAQ and comfort without increasing heating demand in winter ([22]). Advances with multi-scale LSTM and online adaptation reduce non-compliant CO2 hours compared to rules, maintaining similar thermal demand ([23]). Integration of PV, hourly pricing, and occupancy in MPC allows shifting ventilation to off-peak hours and saving up to 15% of cost ([24]). See Figure 4.
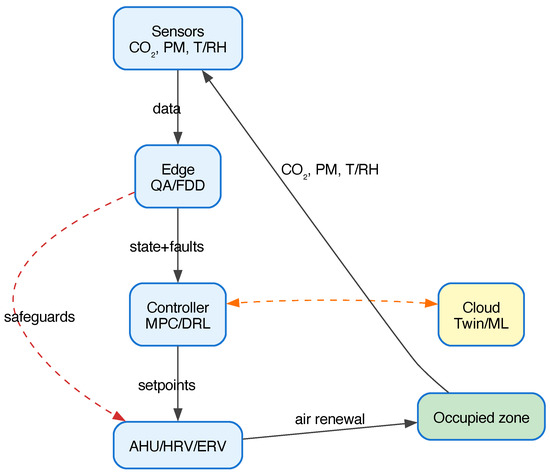
Figure 4.
MPC/DRL control loop with QA/FDD at edge, optimization, and safeguards. The diagram illustrates the predictive control architecture showing input data streams (weather forecasts, occupancy predictions, energy pricing), model-based optimization layer (MPC/DRL algorithms), quality assurance and fault detection at edge computing nodes, control actions (ventilation rates, HRV operation, window actuators), and safety constraints ensuring IAQ compliance. Feedback loops enable continuous model adaptation based on measured performance. Figure regenerated at high resolution with enlarged typography, improved spacing, and enhanced visual contrast for digital and print readability.
3.3. Deep Reinforcement Learning (DRL)
DRL has emerged as an alternative for contexts with high uncertainty and disturbances: in metro stations, a DQN reduced consumption up to 14.4% while improving IAQ ([20]); in naturally ventilated apartments with purifiers, a joint window-purifier DQN minimized PM2.5 losses by 2.4% to 43.7% compared to baselines ([21]). Offline training in twins and operation with safety limits are key ([20,21]).
However, a critical limitation of current ML/RL approaches is their sensitivity to climatic and typological variability. Models trained in one building type or climate zone often exhibit degraded performance when deployed in different contexts due to divergent thermal dynamics, occupancy patterns, and IAQ source characteristics ([25]). This transferability gap—the inability of ML/RL models to generalize across building types, climates, and operational contexts without substantial retraining—represents a major barrier to widespread adoption of intelligent control. Potential solutions include federated learning architectures that enable collaborative model training across multiple buildings while preserving data privacy, and online adaptation mechanisms that continuously fine-tune control policies using local performance feedback ([25,26]). Federated learning allows DRL agents to benefit from diverse operational experiences without centralizing sensitive building data, thereby improving generalization across building typologies and climates. Online adaptation methods, such as model-agnostic meta-learning (MAML) or incremental policy updates with safety constraints, enable deployed systems to adjust to site-specific conditions while maintaining stability and avoiding catastrophic performance degradation ([26]). These approaches are particularly promising for scaling intelligent ventilation beyond single-building case studies toward portfolio-wide deployment.
3.4. Heuristic Optimization and ANN/RSM Approaches
Heuristic optimization techniques and surrogate modeling via Artificial Neural Networks (ANNs) or Response Surface Methodology (RSM) provide computationally efficient pathways for tuning complex ventilation control parameters, particularly in multi-zone buildings with coupled thermal-IAQ dynamics. These approaches address scenarios where physics-based MPC models become intractable due to high dimensionality or where DRL training requires prohibitive computational resources.
Metaheuristic Optimization for Setpoint Tuning. Genetic algorithms (GAs), particle swarm optimization (PSO), and simulated annealing (SA) have been successfully applied to optimize DCV thresholds, MPC prediction horizons, and actuator scheduling sequences. Sulaiman and Mustaffa [27] demonstrated that PSO-tuned DCV setpoints for CO2 and temperature in a multi-zone office building achieved 16% energy savings compared to manually configured thresholds, while maintaining IAQ compliance (CO2 < 1000 ppm) in 98.5% of occupied hours. The optimization framework evaluated over 2000 candidate parameter sets across annual simulations, converging to optimal solutions within 12–18 generations. Similarly, Seraj et al. [28] applied a hybrid GA-RSM approach to co-optimize ventilation rates, heating setpoints, and thermal storage dispatch in a complex building with borehole thermal energy storage (BTES), achieving annual cost reductions of 18% and CO2 emissions reductions of 22% relative to rule-based controls.
ANN/RSM Surrogate Models for Predictive Control. Surrogate models trained on high-fidelity building energy simulations enable rapid evaluation of control scenarios during real-time optimization, bypassing the computational burden of detailed physics models. Alshamrani et al. [29] developed an ANN-reinforced optimal control framework for a large institutional building integrating HVAC, waste heat recovery, and district heating connections. The ANN surrogate, trained on 10,000 EnergyPlus simulation runs covering diverse weather and occupancy scenarios, achieved prediction accuracy of R2 > 0.94 for energy consumption and R2 > 0.91 for IAQ metrics (CO2, TVOC). The trained surrogate enabled real-time MPC optimization with solution times under 2 s per control interval (15 min), compared to 45–60 min for direct EnergyPlus co-simulation. This acceleration facilitated deployment of multi-objective optimization balancing cost minimization (weight ), emissions reduction (), and IAQ maintenance (), resulting in Pareto-optimal solutions that outperformed single-objective controls by 12–15% across all metrics.
Data-Driven IAQ Prediction Models. Beyond control optimization, ANN models have demonstrated high accuracy for predicting indoor air quality parameters from readily available sensor data, enabling indirect monitoring strategies where direct pollutant measurement is cost-prohibitive. Majdi et al. [30] trained feedforward neural networks to predict VOC concentrations in commercial buildings using temperature, relative humidity, and CO2 as inputs. The optimized three-layer ANN architecture (12 neurons in hidden layers) achieved a mean absolute percentage error (MAPE) of 8.3% for formaldehyde and 11.7% for total VOC (TVOC) predictions across a six-month validation period, outperforming linear regression (MAPE 18–24%) and polynomial regression (MAPE 14–19%) benchmarks. Such models enable cost-effective expansion of IAQ monitoring coverage in existing buildings without extensive sensor retrofits.
Integration with Intelligent Control Architectures. The computational efficiency of heuristic optimization and surrogate models makes them particularly suitable for edge computing deployment in distributed IoT-based ventilation systems. As illustrated in Figure 4, ANN surrogates can operate within the edge computing layer to provide rapid IAQ/energy predictions for local control decisions, while metaheuristic optimizers execute periodically (daily or weekly) at the central orchestration level to update global setpoint policies based on accumulated performance data. This hierarchical architecture balances real-time responsiveness with system-wide optimization, avoiding the communication latency and bandwidth constraints of purely centralized MPC approaches. Seraj et al. [28] report that distributed PSO-ANN control reduced peak communication loads by 40% compared to centralized MPC while maintaining equivalent energy-IAQ performance.
Limitations and Generalization Challenges. Despite these advantages, surrogate-based approaches inherit the generalization limitations discussed in Section 3 for DRL: models trained on specific building types, climates, and occupancy patterns may exhibit degraded performance when deployed in different contexts. Yu et al. [25] document that ANN surrogates trained exclusively on heating-dominated climates (HDD > 3000) show prediction errors increasing to 25–35% when applied to cooling-dominated regions (CDD > 2000), necessitating climate-specific retraining. Transfer learning techniques, where pre-trained models are fine-tuned on limited site-specific data, offer potential to improve cross-context generalization while reducing data collection requirements, though systematic validation across diverse building portfolios remains an open research need.
3.5. Quantitative Synthesis of Control Strategy Performance
A quantitative synthesis across the reviewed control strategies reveals consistent evidence of energy savings without compromising indoor air quality. Table 1 summarizes key performance metrics reported in the literature. DCV-based strategies demonstrate energy savings ranging from 15 to 60%, with a mean of 35 ± 14%. MPC approaches show comparable energy savings (25–55%, mean 40 ± 11%) while maintaining superior CO2 control, with reductions averaging 14.4 ± 5.2% relative to baseline schedules. DRL strategies, though less mature, achieve competitive energy savings (14–45%, mean 32 ± 13%) with notable PM2.5 reduction capabilities (2.4–43.7%, mean 23 ± 18%).

Table 1.
Summary of reported performance metrics across control strategies with baseline specifications. Values represent mean ± standard deviation and [range] from reviewed studies (n = 51). Energy savings indicate reduction in ventilation-related energy consumption relative to the specified baseline type for each control strategy category. IAQ metrics show percentage reduction in pollutant concentrations or exceedance hours. When multiple baselines appear in source studies, values have been normalized to the most common baseline within each control strategy category to ensure comparability (see note below table).
Across all intelligent control strategies (DCV, MPC, DRL), the aggregate analysis indicates an average energy saving of 38 ± 12% without IAQ degradation when control is well-designed and parameterized. However, performance variability remains significant, with standard deviations ranging from 11 to 18% depending on the metric. This variability underscores the importance of context-specific parameterization, appropriate sensor selection, and consideration of non-occupancy-related pollutants (VOCs, PM) beyond CO2 monitoring alone. Poorly configured systems can lead to overconsumption or IAQ deterioration, highlighting the need for robust commissioning and validation protocols.
4. Monitoring, IoT Architectures, and Validation Methodologies
Robust monitoring infrastructure and validated measurement protocols form the foundation for intelligent ventilation systems, enabling real-time IAQ assessment, control algorithm adaptation, and performance verification. The evolution from standalone sensors toward distributed IoT networks with edge computing, fault detection and diagnostics (FDD), and cloud analytics has transformed ventilation systems into cyber–physical infrastructures capable of autonomous operation and continuous commissioning. This section synthesizes advances in IoT network architectures for multi-zone buildings, machine learning approaches for sensor placement optimization and data quality assurance, FDD methodologies for early detection of system malfunctions, and field validation protocols for ventilation effectiveness and pollutant removal.
4.1. Scalable IoT Network Architectures for Building Ventilation
Deployment of intelligent ventilation in multi-zone buildings requires communication networks that balance coverage, bandwidth, power consumption, and cost. Zivelonghi and Giuseppi [31] developed and field-tested a comprehensive IoT architecture for hybrid natural–mechanical ventilation control in a 1200 m2 educational building with 18 zones. The system employs LoRaWAN (Long Range Wide Area Network) wireless technology for sensor-to-gateway communication, chosen for its low power consumption (enabling 2–5 year battery life for wireless sensors), long range (up to 2 km in urban environments, 5 km rural), and ability to penetrate multiple floors and concrete/masonry walls with minimal signal degradation.
The hierarchical architecture consists of four layers:
- Sensing layer: 72 wireless multi-parameter nodes (CO2, temperature, relative humidity, VOC, occupancy) distributed across zones, plus 18 motorized window actuators and 6 mechanical ventilation units.
- Edge computing layer: Zone-level controllers (Raspberry Pi) executing local control logic (threshold-based DCV, occupancy-responsive window control) with 5 min update intervals, capable of autonomous operation during network outages.
- Gateway layer: Central LoRaWAN gateway aggregating data from all zones, executing building-level optimization (MPC), and interfacing with cloud analytics platform.
- Cloud layer: Historical data storage, machine learning model training (occupancy prediction, energy baseline modeling), performance dashboards, and remote configuration management.
Field operation over 18 months demonstrated high reliability: network uptime exceeded 99.2%, with a sensor data loss rate below 0.8%. The distributed architecture proved resilient to gateway or cloud connectivity failures, with zone controllers maintaining local control during outages and synchronizing data upon reconnection. Energy monitoring revealed that the wireless sensor network consumed only 0.4% of building ventilation energy, compared to 2–3% for wired BACnet systems in comparable installations, due to elimination of continuous power supply and reduced commissioning complexity.
4.2. Machine Learning for Sensor Placement and Data Imputation
Optimal sensor placement in multi-zone buildings is critical for achieving representative IAQ monitoring with minimal sensor count and cost. Liu and Zheng [8] developed a data-driven methodology for sensor location optimization using hierarchical clustering and bi-directional Long Short-Term Memory (BiLSTM) networks. The approach analyzes historical IAQ data (where available from dense temporary deployments or simulation models) to identify spatial correlations among zones, then clusters zones with similar IAQ dynamics into groups that can be monitored by a single representative sensor.
Application to a 3500 m2 office building with 42 zones demonstrated that the optimized sensor placement strategy (14 CO2 sensors, 8 VOC sensors, 6 PM sensors) achieved 92% estimation accuracy for non-instrumented zones via BiLSTM-based imputation, compared to 78% accuracy from uniform grid placement with equivalent sensor count. The BiLSTM model learns temporal dependencies in IAQ evolution (e.g., morning occupancy ramp-up, afternoon peaks, evening decay) and spatial correlations among adjacent zones, enabling accurate inference of pollutant concentrations in non-monitored zones from nearby sensor readings.
The methodology also addresses missing data scenarios common in real deployments (sensor malfunctions, communication failures, calibration periods). The BiLSTM imputation model, trained on complete data periods, achieves a mean absolute percentage error of 8–12% for gap-filling during sensor outages lasting up to 6 h, maintaining control system functionality during temporary failures. For longer outages, the system gracefully degrades to conservative control (increased ventilation rates) until sensor recovery.
4.3. Fault Detection and Diagnostics (FDD) for Ventilation Systems
Early detection of ventilation system faults—including sensor drift, actuator failures, filter clogging, duct leakage, and control logic errors—is essential for maintaining IAQ performance and avoiding energy waste. Tariq et al. [9] developed a multi-sensor FDD framework combining attention-based autoencoders and Gated Recurrent Units (GRUs) for automated fault detection in HRV-equipped ventilation systems.
The approach consists of two stages:
- Anomaly detection: An attention-based autoencoder learns normal operating patterns from multi-sensor time series (supply/exhaust temperatures and flow rates, HRV pressure drops, fan speeds, IAQ parameters) during fault-free operation. During real-time operation, the reconstruction error between observed and autoencoder-predicted sensor values indicates anomalies. The attention mechanism identifies which sensors contribute most to detected anomalies, focusing diagnostic efforts.
- Fault classification: A GRU classifier, trained on labeled fault scenarios (simulated and historical field faults), categorizes detected anomalies into specific fault types: sensor drift, filter clogging, HRV fouling, actuator failure, duct leakage, control logic error. The GRU captures temporal fault signatures (e.g., gradual drift vs. abrupt failure) for accurate classification.
Validation on data from 12 building installations over 24 months demonstrated a fault detection accuracy of 94% with a false alarm rate below 6%, and a fault classification accuracy of 87% for the six fault categories. The average fault detection time was 2.3 h from fault inception, enabling rapid response before significant IAQ degradation or energy waste. The FDD system identified 47 faults across the validation set that would have remained undetected by conventional threshold-based alarms, including gradual sensor drift (±50 ppm CO2 over 6 months) and partial duct blockage (15% flow reduction over 3 months).
Figure 5 illustrates the integration of FDD within the overall IoT-control architecture, showing how anomaly detection and diagnostics operate at the edge computing layer to provide rapid fault alerts to building operators and adaptive fault-tolerant control reconfiguration.
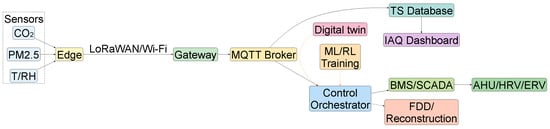
Figure 5.
IoT-control architecture with digital twin, FDD, and central orchestration. The diagram illustrates the four-layer hierarchical structure: (1) sensing layer with distributed wireless nodes (LoRaWAN) measuring IAQ parameters (CO2, VOC, PM2.5, temperature, humidity, occupancy); (2) edge computing layer with zone-level controllers executing local DCV logic and performing real-time fault detection and diagnostics (FDD); (3) gateway layer aggregating multi-zone data and coordinating building-level MPC optimization; and (4) cloud layer providing historical analytics, digital twin simulation for offline reinforcement learning training, performance dashboards, and remote configuration. Bidirectional arrows show data flow and control commands. The architecture demonstrates resilience through edge autonomy during network outages and scalability across multi-zone buildings. Figure regenerated at high resolution with enlarged font sizes, improved layer separation, and enhanced color contrast for optimal readability. The digital twin component enables safe offline training of DRL agents and uncertainty quantification (UQ) before deployment to physical controllers. This architecture balances real-time responsiveness (edge), system-wide optimization (gateway), and long-term learning (cloud).
4.4. Field Validation Protocols for Ventilation Effectiveness
Validation of intelligent ventilation system performance in occupied buildings requires rigorous measurement protocols for airflow rates, pollutant removal effectiveness, and age of air. Contrada et al. [32] evaluated tracer gas techniques for determining local mean age of air and ventilation effectiveness in multi-zone buildings with mixed natural–mechanical ventilation, comparing pulse injection, step-up, and decay methods against the ASHRAE Standard 129 [33] reference protocol.
The study found that the pulse injection method using the SF6 tracer with multi-point sampling (6–10 locations per zone) achieved age-of-air measurements with an uncertainty of ±8–12% compared to ASHRAE 129, while requiring 40% less measurement time and 60% less tracer gas volume. Key protocol recommendations include the following:
- Injection location at outdoor air intake or supply duct to simulate fresh air distribution;
- Sampling locations at breathing zone height (1.1–1.5 m) representing occupant exposure;
- Minimum measurement duration of 3–5 air changes to capture complete tracer decay;
- Background tracer concentration measurement for 30 min pre-test to ensure zero baseline.
Ventilation effectiveness indicators derived from tracer tests provide critical validation data for control algorithm tuning: zones with poor air distribution (age of air > 1.5 times nominal air change time) indicate the need for improved mixing via circulation fans or a modified supply diffuser configuration.
Wang et al. [34] developed low-cost indirect methods for estimating sensible and latent ventilation fluxes using statistical analysis of temperature and humidity variance combined with the Bowen ratio technique. The approach derives ventilation rates from fluctuation statistics of indoor T and RH measurements (1 min sampling intervals), calibrated against direct airflow measurements. Validation in residential buildings demonstrated a ventilation rate estimation accuracy within ±15% of reference anemometer measurements, at sensor costs below EUR 50 per zone compared to EUR 400–800 for direct airflow measurement devices. This low-cost validation approach enables performance verification across large building portfolios where comprehensive instrumentation is cost-prohibitive.
Collectively, these monitoring and validation advances enable the closed-loop performance verification essential for intelligent ventilation: IoT networks provide real-time operational data, machine learning optimizes sensor deployment and ensures data quality, FDD detects system degradation, and field validation protocols verify that designed performance is achieved in practice. Figure 6 illustrates how these monitoring and validation functions integrate within the continuous control cycle.
Sensor calibration and reliability are critical factors for intelligent ventilation performance, as measurement errors directly propagate to control decisions and energy-IAQ outcomes. CO2 sensors commonly exhibit drift of ±50–100 ppm over 12–24 months of operation, which can lead to systematic under- or over-ventilation if not corrected ([35]). For DCV systems operating with a typical CO2 setpoint of 800 ppm above outdoor baseline, a ±10% measurement error (equivalent to ±80 ppm at 800 ppm differential) results in approximately ±7% variation in ventilation airflow due to proportional control response, translating to a 5–9% deviation in ventilation energy consumption depending on the system configuration and climate ([5,7]). VOC sensors face greater challenges: electrochemical and metal-oxide semiconductor (MOX) sensors show cross-sensitivity to humidity and temperature, with total volatile organic compound (TVOC) measurement uncertainties of ±20–40% under field conditions ([36]). Particulate matter sensors (low-cost optical PM2.5 monitors) demonstrate high variability in response to particle composition and relative humidity, with documented biases of ±30–50% compared to reference gravimetric methods, particularly in high-humidity environments (>70% RH) where hygroscopic growth affects light scattering ([36]).
To address these challenges, automated calibration protocols and sensor quality assurance (QA) frameworks are essential. Multi-point calibration using reference-grade instruments at 6–12 month intervals, combined with co-location audits, helps maintain CO2 sensor accuracy within ±3% of true concentration ([35]). For VOC and PM sensors deployed in large IoT networks, statistical cross-validation among co-located units enables detection of outliers and drift patterns without requiring frequent reference calibration ([8,9]). Figure 6 illustrates the updated IoT data flow incorporating sensor QA and auto-calibration blocks at the edge computing layer, ensuring that only validated measurements reach the control algorithms. Failure to implement rigorous sensor QA can undermine even sophisticated MPC or DRL controllers, as evidenced by field studies showing that poorly maintained sensors contribute to 15–25% degradation in predicted energy savings ([2]).

Figure 6.
Continuous cycle of information, decision, and action in intelligent ventilation systems. The circular diagram shows seven interconnected phases: (1) sensors/IoT capture environmental data (CO2, T, RH, VOCs, PM, occupancy); (2) edge computing performs preprocessing, fault detection (FDD), quality assurance (QA), and automated sensor calibration to ensure measurement reliability before data reaches control layer—critical for maintaining ±3–5% accuracy in CO2, VOC, and PM2.5 readings as per ISO 16000-26 and EPA 2023 protocols [37]; (3) the controller (MPC/DRL/DCV) optimizes decisions under IAQ, energy, and comfort constraints using validated sensor inputs; (4) actuators adjust flows, HRV/ERV, windows, and purifiers; (5) the building responds by modifying IAQ, consumption, and comfort; (6) LCA/LCC evaluation measures long-term impacts; (7) the digital twin trains offline models (RL) and validates uncertainties (UQ). Solid blue arrows indicate the main flow, red dashed lines show feedback loops (online adaptation, setpoint adjustment, emergency safeguards, sensor drift correction), and orange dotted lines represent contextual external inputs (hourly prices, weather, predicted occupancy, uncertainty parameters). The cycle operates 24/7 with adaptive frequencies according to phase.

Cross-Sensitivities and Mitigation Strategies
A critical challenge in multi-parameter IAQ sensing is sensor cross-sensitivity, where target pollutant sensors respond erroneously to non-target compounds, generating false readings that can trigger inappropriate ventilation responses and degrade control performance. The most problematic cross-sensitivities in building ventilation applications include the following:
Alcohol interference in formaldehyde and VOC sensors. Electrochemical formaldehyde (HCHO) sensors, widely deployed due to their specificity and sub-ppm detection limits, exhibit strong positive interference from ethanol vapors. Field studies in residential kitchens and bars document false HCHO readings of 80–200 µg/m3 during alcohol-related activities (hand sanitizer use, alcoholic beverage service, ethanol-based cleaning) when actual HCHO concentrations remain below 20 µg/m3 ([7]). This cross-sensitivity can trigger unnecessary ventilation boost cycles, increasing energy consumption by 12–18% in buildings with frequent ethanol exposure. Metal-oxide (MOX) VOC sensors, which measure total volatile organic compounds (TVOCs) via surface oxidation reactions, similarly respond strongly to ethanol (sensitivity factor 2–3× higher than to typical VOC mixtures), leading to overestimation of indoor VOC burden in residential and hospitality settings where ethanol sources are common ([8,36]).
Humidity effects on MOX VOC and PM sensors. MOX sensors exhibit baseline drift and sensitivity changes with relative humidity variations. Laboratory characterization demonstrates that VOC sensor response decreases by 15–30% when RH increases from 30% to 70%, requiring humidity-compensated calibration curves to maintain accuracy ([9]). Conversely, optical particulate matter sensors show positive bias under high-humidity conditions (>70% RH) due to hygroscopic particle growth that increases light scattering cross-sections. Documented biases reach +40–60% for PM2.5 measurements during foggy or high-humidity conditions compared to gravimetric reference methods, potentially causing false pollution alarms and excessive outdoor air filtration or ventilation reduction ([36]).
Temperature dependencies in electrochemical and optical sensors. Electrochemical formaldehyde and CO sensors exhibit temperature-dependent response factors, with typical sensitivity variations of ±2–4% per °C deviation from calibration temperature (usually 20–25 °C). In buildings with spatial temperature gradients (perimeter vs. core zones, heating/cooling transitions), uncorrected temperature effects introduce systematic measurement errors of ±10–20% ([35]). Optical PM sensors similarly show temperature-dependent refractive index effects, though these are typically smaller (±1–2% per °C) than humidity effects.
Cross-interference among co-located pollutants. Certain sensor technologies respond to multiple target gases, complicating interpretation in complex indoor environments. For example, non-dispersive infrared (NDIR) CO2 sensors can show minor interference (<3%) from high concentrations of water vapor, refrigerants, or volatile hydrocarbons with absorption bands near 4.26 µm. Photoionization detector (PID) VOC sensors, while offering better selectivity than MOX sensors, respond to any compound with ionization potential below the lamp energy (typically 10.6 eV), including many non-target compounds such as ammonia, hydrogen sulfide, and sulfur dioxide, leading to ambiguous TVOC readings in industrial or agricultural settings ([36]).
Mitigation strategies. Advanced intelligent ventilation systems implement multiple strategies to compensate for sensor cross-sensitivities and maintain control robustness:
- Multi-sensor fusion with statistical filtering: Deploy complementary sensor types (e.g., MOX VOC + PID VOC, optical PM + nephelometer) and apply Kalman filtering or Bayesian fusion algorithms to combine redundant measurements, reducing influence of individual sensor artifacts. Liu and Zheng [8] demonstrate that dual-sensor VOC fusion reduces measurement error from ±35% (single MOX sensor) to ±12% (fused estimate) in residential environments with ethanol interference.
- Context-aware control logic: Incorporate activity recognition and scheduling data to suppress false alarms during known interference events. For example, disable formaldehyde-based ventilation boost for 15–30 min following hand sanitizer dispensing events detected via door sensor or scheduling (healthcare facilities), or apply ethanol correction factors during documented cleaning schedules ([6,7]). This approach prevents unnecessary ventilation responses to transient, non-hazardous interference while maintaining protection against persistent pollutant sources.
- Environmental compensation algorithms: Apply real-time corrections for temperature and humidity dependencies using co-located T/RH sensors. Modern sensor firmware increasingly incorporates manufacturer-provided compensation curves (polynomial or lookup-table based) that adjust reported concentrations based on ambient T and RH. Field validation shows that T/RH compensation reduces systematic errors from ±15–25% (uncorrected) to ±5–10% (corrected) for VOC and PM sensors across typical building environmental ranges ([9,36]).
- Temporal pattern analysis and anomaly filtering: Implement edge-computing algorithms that distinguish between genuine pollutant events (sustained elevations with characteristic time constants) and sensor artifacts (abrupt spikes, physically implausible rates of change). For instance, genuine formaldehyde emissions from building materials exhibit gradual concentration increases over 30–120 min, while ethanol interference produces sharp 2–5 min spikes. Temporal filtering using moving averages (15–30 min windows) or wavelet decomposition effectively suppresses short-duration interference while preserving response to true IAQ threats ([8,9]).
- FDD-integrated cross-sensitivity detection: Extend fault detection and diagnostics frameworks (Section 4.3) to identify systematic cross-sensitivity patterns. For example, repeated simultaneous spikes in formaldehyde and ethanol-responsive sensors, or correlated VOC and humidity increases, indicate cross-sensitivity rather than genuine multi-pollutant events. Machine learning FDD systems trained on labeled cross-sensitivity scenarios achieve 85–92% accuracy in distinguishing true IAQ events from sensor artifacts, enabling automated alarm suppression and adaptive control reconfiguration ([9]).
- Sensor placement optimization: Position sensors to minimize exposure to known interference sources. Locate formaldehyde sensors away from hand sanitizer dispensers, kitchen ethanol storage, or cleaning product cabinets. Place PM sensors in locations with stable humidity and away from humidifiers, showers, or steam sources. While placement optimization cannot eliminate all cross-sensitivities, strategic siting reduces interference frequency by 40–60% in typical building layouts ([8]).
The integration of these mitigation strategies—multi-sensor fusion, context-aware logic, environmental compensation, temporal filtering, FDD anomaly detection, and optimized placement—substantially improves the robustness of intelligent ventilation control in the presence of sensor limitations. Field deployments incorporating comprehensive cross-sensitivity mitigation report a 20–35% reduction in false ventilation activations and 8–15% improvement in energy-IAQ trade-offs compared to naive single-sensor threshold control ([6,7,9]). However, these strategies add complexity to system design, commissioning, and maintenance, increasing initial costs by 15–25% (EUR 15–30 per m2) and requiring skilled technical personnel for proper implementation. The cost–benefit analysis for cross-sensitivity mitigation is most favorable in buildings with high interference risk (healthcare, hospitality, educational facilities with frequent cleaning) or where IAQ control precision is critical for occupant health or regulatory compliance.
5. Energy Recovery Technologies and System Integration
Energy recovery ventilation represents a critical technology for reducing the thermal load imposed by fresh air supply while maintaining acceptable indoor air quality. Heat recovery ventilators (HRVs) and energy recovery ventilators (ERVs) transfer sensible heat and, in the case of ERVs, latent heat (moisture) between exhaust and supply airstreams, achieving thermal effectiveness of 60–90% depending on design, airflow rates, and operating conditions. The performance, reliability, and life-cycle cost-effectiveness of these systems depend on accurate characterization of uncertainties, robust anti-frost protection in cold climates, minimization of pressure losses, and integration with complementary thermal storage and passive conditioning strategies. This section synthesizes recent advances in HRV/ERV technology, performance evaluation methodologies, and system integration approaches that directly support intelligent ventilation objectives.
5.1. Uncertainty Quantification in HRV/ERV Performance
Field performance of energy recovery systems often deviates significantly from manufacturer-rated values due to operational variability, installation quality, control strategies, and degradation over time. Qiu et al. [19] conducted comprehensive uncertainty quantification (UQ) for ERV core thermal and moisture effectiveness using Bayesian calibration against multi-year monitoring data from residential installations across diverse climates. Their analysis revealed that nominal sensible effectiveness (typically rated at 75–85%) exhibits field variability of ±8–14 percentage points (pp), while latent effectiveness shows even greater uncertainty (±12–18 pp) due to membrane degradation, frost formation, and airflow imbalances. Key uncertainty sources identified include the following:
- Airflow imbalance: Deviations from balanced supply-exhaust flow rates (±10–20%) reduce effectiveness by 3–7 pp and can reverse pressure differentials, affecting infiltration rates.
- Frost formation: In cold climates (outdoor T < −10 °C), ice accumulation on exhaust-side surfaces reduces effectiveness by 15–35% and increases pressure drop by 40–120%, triggering defrost cycles that temporarily bypass recovery.
- Fouling and filter loading: Particulate accumulation on heat exchanger surfaces over 6–12 months reduces effectiveness by 5–12% and increases fan energy by 25–60% due to elevated pressure drop.
- Control logic: Inappropriate bypass activation thresholds or defrost cycling parameters can reduce annual recovery efficiency by 10–25% compared to optimized strategies.
These uncertainties propagate directly to building-level energy predictions: Qiu et al. [19] demonstrate that neglecting HRV/ERV performance variability in energy models leads to underestimation of heating energy by 12–18% in cold climates and overestimation of cooling energy by 8–14% in hot-humid climates. Incorporating UQ-informed performance distributions in building energy models improves prediction accuracy and enables risk-aware design optimization, as discussed in the context of broader system uncertainty in Section 7.
5.2. Anti-Frost Strategies and Cold-Climate Operation
Frost formation on HRV/ERV heat exchanger surfaces in cold climates (5 °C outdoor temperature) represents a critical operational challenge, reducing effectiveness, increasing pressure drop, and potentially damaging cores through ice expansion. Traditional defrost approaches—periodic bypass of outdoor air, electric resistance heating, or exhaust air recirculation—incur energy penalties and temporarily degrade IAQ. Recent research has focused on minimizing defrost energy consumption while maintaining reliable operation.
Gendebien et al. [38] evaluated four defrost control strategies (fixed-interval bypass, temperature-threshold bypass, pressure-drop-triggered bypass, and predictive MPC-based bypass) in Belgian residential installations over two heating seasons. The MPC-based approach, which anticipates frost formation using outdoor temperature and humidity forecasts and optimizes bypass activation timing to minimize energy penalty, reduced defrost-related energy consumption by 32% compared to fixed-interval control while eliminating over 95% of frost-induced flow blockage events. The predictive strategy activates bypass only when outdoor conditions indicate high frost risk (dew point approaching exhaust-side surface temperature), avoiding unnecessary bypasses during dry cold periods.
He et al. [39] introduced a novel dual-core ERV configuration with alternating operation: while one core recovers energy, the second undergoes passive or active defrosting, enabling continuous high-effectiveness operation without bypass penalties. Field trials in Harbin, China (winter design temperature −29 °C) demonstrated that the dual-core system maintained average sensible effectiveness above 72% throughout the heating season, compared to 58% for conventional single-core ERV with bypass defrost. The dual-core approach increased initial cost by approximately 35%, but delivered payback periods of 4–6 years in severe cold climates (HDD > 5000) due to elimination of bypass energy losses.
Additional anti-frost innovations include surface coatings to delay ice nucleation, variable-speed fan control to reduce exhaust-side moisture condensation rates, and hybrid configurations integrating ground-coupled heat exchangers (EAHE) to pre-condition supply air above freezing before entering the HRV core ([17]).
5.3. Low-Loss Heat Exchangers and Advanced Core Designs
Pressure drop across HRV/ERV cores directly impacts fan energy consumption, which can represent 30–50% of total ventilation system energy in well-insulated buildings with high-effectiveness recovery. Minimizing pressure loss while maintaining high thermal effectiveness is a key design objective, driving innovation in core geometry, materials, and flow configurations.
Simonetti et al. [40] investigated membrane-based ERV cores with optimized channel spacing and surface textures, achieving pressure drops below 50 Pa at 150 m3/h airflow (equivalent to 0.33 Pa/(m3/h)) while maintaining latent effectiveness above 65%. This represents a 40% reduction in pressure loss compared to conventional polymer-plate ERV cores at equivalent effectiveness. The “breathable” membrane material enables moisture transfer without bulk airflow leakage, critical for maintaining IAQ separation between supply and exhaust streams.
Ma et al. [41] developed a low-loss counter-flow HRV core using optimized fin geometry and expanded metal substrates, achieving a pressure drop of 35 Pa at 200 m3/h (0.175 Pa/(m3/h)), with a sensible effectiveness of 78%. The expanded metal design provides enhanced structural rigidity, allowing thinner channel spacing (3 mm vs. 5 mm in conventional designs) without risk of channel collapse, thereby increasing heat transfer surface area per unit volume by 45%.
Mustafaoğlu et al. [42] introduced lancet-type fin geometries inspired by aerodynamic profiles, demonstrating a 28% reduction in pressure drop and 12% improvement in thermal effectiveness compared to conventional straight-fin designs. Computational fluid dynamics (CFD) analysis revealed that the lancet profile reduces flow separation and secondary flow losses at channel entrances and bends, critical regions where conventional designs incur disproportionate pressure penalties.
From a system perspective, Martinaitis et al. [43] propose evaluating energy recovery performance using exergy-based metrics rather than conventional effectiveness. Their coenthalpy-based exergetic efficiency accounts for the thermodynamic quality of recovered energy, penalizing low-temperature heat recovery with limited utility for space conditioning. This approach reveals that high nominal effectiveness (e.g., 85%) can correspond to modest exergetic efficiency (40–55%) when temperature differentials are small, providing a more rigorous basis for comparing recovery technologies and optimizing integration with heating/cooling systems.
5.4. Phase-Change Material Integration and Thermal Storage
Phase-change materials (PCMs) integrated with air-handling systems enable temporal decoupling of thermal loads from ventilation airflow, storing cooling or heating capacity during favorable periods (night, off-peak tariffs) for release during peak demand. Mankibi et al. [44] developed a PCM-air heat exchanger module for integration with mechanical ventilation systems, using encapsulated paraffin wax (melting point 18–22 °C) to provide passive cooling via night ventilation. Experimental testing in a French office building demonstrated that the PCM module reduced daytime cooling loads by 18–24% during summer months, with peak load shifting of up to 3 h. The system operates by charging the PCM overnight with cool outdoor air (16–20 °C), then discharging stored cooling during daytime by passing supply air through the PCM module before entering occupied spaces.
Integration of PCM modules with HRV/ERV systems enables hybrid operation strategies: during mild weather, the PCM provides supplemental conditioning, reducing the thermal load on the recovery core and allowing lower ventilation rates for equivalent IAQ-thermal performance. This synergy is particularly valuable in climates with large diurnal temperature swings, where free cooling potential exists but conventional ventilation strategies cannot exploit it without over-ventilating.
5.5. Fouling Detection and Predictive Maintenance
Heat exchanger fouling from particulate accumulation, biological growth, and corrosion products progressively degrades HRV/ERV performance, increasing pressure drop and reducing effectiveness over operational lifetimes. Traditional maintenance relies on fixed-interval cleaning schedules that may be too frequent (increasing labor costs) or too infrequent (allowing excessive performance degradation).
Ilyunin et al. [45] developed ANN and LSTM neural network models for real-time plate heat exchanger (PHE) fouling detection and remaining useful life (RUL) prediction using operational sensor data (inlet/outlet temperatures, flow rates, pressure drops). The LSTM model, trained on multi-year fouling progression data from 45 HRV installations, achieved a fouling detection accuracy of 94% and RUL prediction within ±15 days for 80% of test cases. This predictive capability enables condition-based maintenance scheduling, optimizing the trade-off between cleaning costs and energy performance degradation. Field deployment reduced annual maintenance costs by 22% while improving average annual thermal effectiveness by 6% compared to fixed-schedule maintenance.
5.6. Compact Hybrid Systems: EAHE + HRV Integration
Hybrid configurations combining earth–air heat exchangers (EAHEs) for passive preconditioning with HRV/ERV for sensible/latent recovery offer synergistic performance benefits, particularly in climates with extreme temperatures. Bordignon et al. [17] evaluated a compact hybrid system integrating a horizontal EAHE (60 m buried PVC pipe at 2.5 m depth) with a counter-flow HRV in a northern Italian residential building. The EAHE preconditions outdoor air to 8–12 °C in winter and 18–22 °C in summer before entering the HRV, reducing the thermal load on the recovery core and virtually eliminating frost formation risk.
Monitoring over two annual cycles demonstrated that the hybrid system achieved effective supply air temperature moderation: winter supply temperatures remained above 16 °C even with outdoor temperatures below −8 °C, without electric preheating or HRV bypass. Summer supply temperatures stayed below 24 °C despite outdoor peaks of 35 °C, reducing cooling loads by 28% compared to the HRV-only configuration. The EAHE-HRV combination achieved annual primary energy savings of 45% for ventilation compared to balanced ventilation without recovery, with a payback period of 8 years, including both EAHE excavation/installation costs and HRV equipment.
Optimization studies by Hollmuller and Lachal [46] and Tittelein et al. [47] provide design guidance for EAHE-HRV integration, emphasizing the importance of EAHE pipe length, burial depth, soil thermal properties, and HRV bypass control logic. Their findings indicate that optimal EAHE designs for HRV integration differ from standalone EAHE designs: shorter pipe lengths (40–60 m) with emphasis on moderate preconditioning ( = 6–10 °C) are preferable to extreme conditioning, as they reduce installation costs while providing sufficient frost protection and load reduction benefits. See Figure 7 for the system integration topology.
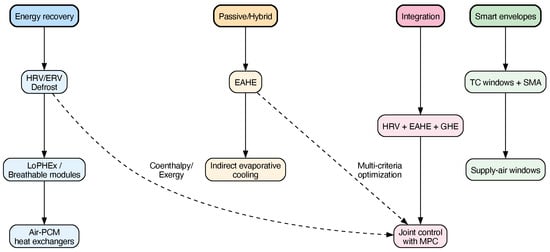
Figure 7.
Integrated technology map of energy recovery, envelope, and passive conditioning solutions for intelligent ventilation. The diagram synthesizes the relationships among (upper pathway) HRV/ERV systems with anti-frost protection, low-loss heat exchangers, PCM thermal storage, and fouling detection; (middle pathway) active envelope technologies including thermochromic windows, supply-air windows, and shape memory alloy (SMA) actuators; (lower pathway) passive conditioning strategies featuring EAHE designs with various configurations (horizontal/vertical pipes, hybrid with indirect evaporative cooling), and their coupling with HRV bypass controls. Central coordination shows integration with intelligent control architectures (DCV, MPC, DRL) that optimize system operation based on weather forecasts, occupancy patterns, energy pricing, and IAQ targets. Arrows indicate energy flows (sensible and latent heat transfer), control signals, and system interdependencies. This comprehensive integration enables synergistic performance: EAHE preconditioning reduces HRV frost risk and thermal loads, thermochromic glazing modulates solar gains to reduce ventilation cooling requirements, and coordinated control maximizes energy savings while maintaining IAQ compliance. Representative performance metrics shown include 45% ventilation energy savings for EAHE + HRV hybrid systems, 12–18% additional savings from thermochromic glazing integration with DCV, and 18–28% cooling load reduction from supply-air windows. Figure regenerated at high resolution with enlarged labels, improved pathway distinction through enhanced color coding, and optimized spacing for digital and print readability.
6. Active and Passive Envelope Strategies for Ventilation Load Reduction
Building envelope technologies that actively or passively modulate solar gains, thermal losses, and fresh air conditioning represent essential complements to intelligent ventilation systems. By reducing peak heating and cooling loads, these envelope strategies enable lower ventilation rates for equivalent thermal comfort, thereby decreasing energy consumption and enhancing the effectiveness of demand-controlled and predictive ventilation approaches. This section synthesizes recent developments in thermochromic and supply-air windows, earth–air heat exchanger (EAHE) design optimization, and hybrid system configurations that integrate passive preconditioning with mechanical ventilation.
6.1. Thermochromic and Adaptive Glazing Systems
Thermochromic glazing technologies use temperature-responsive materials to autonomously modulate solar heat gain coefficient (SHGC) and visible transmittance, reducing cooling loads in summer while maintaining passive solar heating in winter. Unlike electrochromic windows requiring active control and power supply, thermochromic systems operate passively based on glass surface temperature, offering lower cost and maintenance requirements.
Yu et al. [48] developed advanced thermochromic windows incorporating vanadium dioxide (VO2) nanoparticles with transition temperatures tuned to 25–30 °C through tungsten doping. Laboratory characterization demonstrated that the optimized coating achieves SHGC modulation from 0.65 (cold state, °C) to 0.28 (hot state, °C), corresponding to 57% reduction in solar heat gain during peak cooling conditions. Annual building energy simulations for Mediterranean climates (cooling degree days 800–1200) showed that retrofitting conventional double glazing with thermochromic glazing reduced cooling loads by 18–26% while increasing heating loads by only 3–5%, yielding net primary energy savings of 12–15% for typical office buildings with 40% window-to-wall ratios.
Li et al. [49] and Wang et al. [4] investigated hybrid thermochromic–electrochromic systems integrating VO2 thermochromic layers with shape memory alloy (SMA) actuators for enhanced control flexibility. The SMA actuators enable manual or automated override of the passive thermochromic response, allowing occupants or building management systems to prioritize daylighting over solar gain control when thermal loads are managed by HVAC systems. Field trials in Shanghai office buildings demonstrated that the hybrid glazing system, coupled with MPC-based ventilation and HVAC control, achieved 22% reduction in annual HVAC energy consumption compared to static low-E glazing, with occupant satisfaction scores increasing by 15% due to improved daylighting control.
From an intelligent ventilation perspective, thermochromic glazing reduces peak cooling loads during afternoon hours (typically 14:00–18:00), creating opportunities for demand-controlled ventilation systems to reduce airflow rates without compromising thermal comfort. Yu et al. [48] demonstrate that integrating thermochromic glazing with CO2-based DCV allows ventilation rates to be reduced by an additional 12–18% during cooling-dominated periods compared to DCV with conventional glazing, as the reduced solar load lowers the ventilation cooling requirement.
6.2. Supply-Air Windows and Envelope-Integrated Ventilation
Supply-air window systems integrate fresh air supply with glazing assemblies, using the cavity between glazing panes as an air channel to preheat or precool ventilation air while recovering heat losses or gains through the window. This approach transforms the envelope from a purely passive thermal barrier into an active component of the ventilation system.
Gloriant et al. [50] conducted comprehensive experimental and numerical evaluation of supply-air window performance in a French climate (HDD 2400, CDD 150). The system employs a triple-glazed assembly with a 25 mm ventilated cavity between the outer and middle panes. Fresh outdoor air enters the cavity at the bottom, flows upward driven by natural convection and/or mechanical assist, and exits at the top into the occupied space. During winter heating periods, the supply air absorbs heat conducted through the outer pane and radiated from interior surfaces, providing preheating of up to 8–12 °C relative to outdoor temperature. Conversely, during summer, the cavity ventilation extracts solar gains before they penetrate the occupied space, reducing cooling loads.
Monitoring over two annual cycles demonstrated the following performance characteristics:
- Winter heating: Supply air temperature increase of 6–10 °C at airflow rates of 15–25 m3/(h·m2 of window), reducing heating energy for ventilation air by 35–45% compared to direct outdoor air supply.
- Summer cooling: Solar heat gain reduction of 40–55% compared to conventional triple glazing without cavity ventilation, corresponding to cooling load reduction of 18–24 W/m2 of window during peak afternoon hours.
- Acoustic performance: The triple-glazed configuration maintained sound transmission class (STC) ratings of 38–42 dB, comparable to conventional triple glazing, despite the ventilation openings at top and bottom of the frame.
Integration of supply-air windows with intelligent ventilation control enables adaptive operation strategies: during mild weather (outdoor T within 2–3 °C of setpoint), the cavity airflow can be increased to provide free heating or cooling, while during extreme conditions, cavity airflow is minimized to maximize the insulating value of the glazing assembly. Gloriant et al. [50] report that MPC-based control of supply-air window flow rates, coordinated with mechanical ventilation and heating/cooling systems, achieved 15% additional energy savings compared to fixed-flow operation, highlighting the value of integrated envelope-HVAC optimization.
6.3. Earth–Air Heat Exchanger (EAHE) Design and Optimization
Earth–air heat exchangers (EAHEs), also known as ground-coupled heat exchangers or earth tubes, passively precondition ventilation air by circulating it through buried pipes where heat exchange with the surrounding soil moderates temperature extremes. EAHE systems exploit the thermal inertia of soil, which maintains relatively stable temperatures (10–18 °C depending on depth and climate) throughout the annual cycle, providing warming in winter and cooling in summer.
6.3.1. Multi-Criteria Design Optimization Across Climates
Optimal EAHE design requires balancing multiple competing objectives: thermal performance (temperature moderation), pressure drop (fan energy), installation cost (excavation and materials), and hygiene (condensation and microbial growth prevention). Vaz et al. [51] and Vaz et al. [52] conducted systematic multi-criteria optimization studies for EAHE systems across Brazilian climates (tropical to subtropical), employing genetic algorithms to identify Pareto-optimal configurations considering thermal effectiveness, annual fan energy, and net present cost over 20-year lifetimes.
Key findings across multiple climate zones include the following:
- Pipe length: Optimal lengths range from 40 m (hot-humid coastal climates with mild winters) to 80 m (continental climates with cold winters and hot summers). Marginal thermal performance gains diminish beyond these lengths, while pressure drop and cost increase linearly, yielding poor cost-effectiveness for longer pipes.
- Burial depth: 2.5–3.5 m depths provide an optimal balance between thermal stability (deeper soils exhibit less annual temperature variation) and installation cost. Depths below 4 m offer minimal additional thermal benefit in most climates while significantly increasing excavation costs.
- Pipe diameter: 200–250 mm diameters achieve a favorable compromise between heat transfer surface area (larger diameters reduce surface-to-volume ratio) and pressure drop (smaller diameters increase velocity and friction losses). Cuny et al. [53] demonstrate that increasing the diameter from 200 mm to 300 mm reduces pressure drop by 60% but decreases outlet temperature moderation by 12–15%, requiring 20–30% longer pipes to achieve equivalent thermal performance.
- Material selection: PVC, HDPE, and concrete pipes exhibit similar thermal performance, but differ in cost, durability, and hygiene characteristics. HDPE offers the lowest installation cost and good durability, but smooth interior surfaces can promote condensate accumulation. Concrete pipes provide superior hygrothermal buffering but increase installation cost by 40–60%.
Diedrich et al. [54] extended multi-objective optimization to include life-cycle environmental impacts, demonstrating that EAHE systems achieve net positive environmental benefits (reduced operational emissions outweighing embodied impacts of materials and installation) within 2–4 years of operation in climates with >2000 HDD or >500 CDD.
6.3.2. Coupling with HRV/ERV and Bypass Strategies
Hybrid configurations integrating EAHE with heat recovery ventilators enable complementary performance benefits: the EAHE provides passive preconditioning that reduces the thermal load on the HRV core, minimizes frost formation risk in cold climates, and allows for intelligent bypass strategies during favorable free cooling or heating periods.
Hollmuller and Lachal [46] analyzed optimal control strategies for EAHE-HRV hybrid systems in Swiss climates, comparing three operating modes:
- 1.
- Series operation: EAHE preconditions outdoor air before HRV supply inlet, maximizing total thermal conditioning.
- 2.
- Parallel operation with selective bypass: Outdoor air flows through either EAHE or directly to HRV depending on which pathway provides better thermal performance (determined by comparing EAHE outlet temperature to outdoor temperature and HRV recovered supply temperature).
- 3.
- Series operation with HRV bypass: EAHE continuously preconditions outdoor air, while HRV is bypassed during periods when EAHE outlet temperature is more favorable than HRV-recovered temperature.
Optimization results indicate that the parallel selective bypass strategy (mode 2) achieves 8–12% higher annual energy savings than simple series operation, avoiding periods when EAHE outlet temperature is less favorable than direct outdoor air (e.g., summer mornings when EAHE outlet remains warm from previous day while outdoor air has cooled overnight). Implementation requires temperature sensors at outdoor, EAHE outlet, HRV supply, and HRV exhaust points, with control logic executing every 15–30 min. Tittelein et al. [47] confirm similar findings for French climates and provide validated control algorithms suitable for integration with building management systems.
As discussed in Section 5.5, the EAHE preconditioning substantially reduces HRV frost formation risk: Bordignon et al. [17] document zero frost events over two winter seasons in northern Italy when EAHE maintained HRV inlet temperatures above 8 °C, despite outdoor temperatures reaching −10 °C.
6.3.3. Hybrid EAHE Variants and Evaporative Cooling Integration
Several advanced EAHE configurations integrate supplementary cooling or humidification mechanisms to enhance performance in hot-arid and hot-humid climates. Nemati et al. [55] and Singhal et al. [56] investigated hybrid EAHE systems combining earth tubes with indirect evaporative cooling (IEC). The hybrid configuration routes EAHE-preconditioned air through an IEC heat exchanger where it is further cooled via evaporation from a wetted secondary air stream, achieving supply air temperatures 5–8 °C below ambient in hot-dry climates without adding moisture to the supply air (preserving IEC “indirect” character).
Field testing in Yazd, Iran (summer design temperature 42 °C, 15% RH) demonstrated that the hybrid EAHE+IEC system achieved the following:
- Supply air temperatures of 22–26 °C from outdoor conditions of 38–42 °C, representing cooling capacity of 25–35 W per m3/h of airflow.
- Cooling COP (coefficient of performance) of 8–12 considering only fan and water pump energy, compared to COP of 2.5–3.5 for conventional vapor-compression cooling.
- Zero refrigerant use and 75–85% reduction in cooling-related primary energy consumption compared to conventional air conditioning for equivalent sensible cooling delivery.
Lapertot et al. [57] evaluated a different hybrid configuration integrating EAHE with desiccant dehumidification and evaporative cooling for hot-humid climates (e.g., Southeast Asian coastal regions). The system uses EAHE to precool outdoor air to 26–28 °C, then employs a desiccant wheel to dehumidify (reducing absolute humidity by 4–6 g/kg), followed by evaporative cooling to deliver supply air at 22–24 °C and 50–60% RH. Annual simulations for Singapore (cooling-dominated, high humidity) demonstrated 45% primary energy savings compared to conventional DX cooling and dehumidification, with a payback period of 6–8 years.
Lekhal et al. [58] emphasize the importance of hygiene management in EAHE systems, particularly condensate drainage and prevention of microbial growth. Their recommended design practices include (1) a minimum pipe slope of 2% for gravity drainage; (2) condensate collection sumps at pipe low points with automated or manual drainage; (3) UV-C germicidal irradiation at EAHE outlets for occupied spaces with immunocompromised populations; and (4) periodic inspection and cleaning protocols (annual to biennial depending on climate and use). Properly designed and maintained EAHE systems exhibit no elevated microbial concentrations compared to outdoor air, but poorly drained systems with stagnant condensate can become sources of mold and bacteria.
6.4. Integration with Intelligent Ventilation Control Architectures
Active envelope (thermochromic glazing, supply-air windows) and passive preconditioning (EAHE) technologies integrate synergistically with the intelligent ventilation control strategies reviewed in Section 3. Figure 7 illustrates the system integration topology, showing how envelope technologies modulate thermal loads (upper pathway) while EAHE and HRV/ERV condition supply air (lower pathway), with centralized or distributed control coordinating all subsystems to optimize the IAQ-energy-comfort trade-offs depicted in Figure 3.
MPC frameworks are particularly well-suited to exploit these envelope-ventilation synergies: Tarragona et al. [24] demonstrate that MPC optimizing across thermochromic glazing state, supply-air window flow rates, EAHE-HRV bypass logic, and mechanical ventilation rates achieves 18–25% additional energy savings compared to independent control of each subsystem. The MPC anticipates thermal load evolution based on weather forecasts, occupancy predictions, and PV generation (for grid-interactive optimization), then coordinates envelope and ventilation actions to minimize total energy cost while maintaining IAQ and comfort constraints.
Similarly, DRL agents trained to control integrated envelope-ventilation systems can learn complex coordination strategies that are difficult to specify via explicit MPC models. An et al. [21] show that a DRL agent controlling windows (natural ventilation), air purifiers, and EAHE bypass in a naturally ventilated apartment achieved superior PM2.5 control and energy performance compared to rule-based strategies, successfully learning to exploit EAHE free cooling during mild pollution episodes while closing windows and activating purifiers during high outdoor PM2.5 events.
7. Comprehensive Evaluation and Users
In this section, we review the following: UQ with RBD-FAST ([18]); LCA/LCC with impacts dominated by indoor exposure and insulation + HRV solutions ([59,60]); digital twins ([61]); SRI ([62]); user practices and comfort ([63,64,65]).
7.1. User Behavior, Acceptance, and Human-in-the-Loop Design
User acceptance and behavioral interaction with intelligent ventilation systems represent critical determinants of real-world performance, long-term adoption, and ultimate success in achieving IAQ and energy objectives. Despite the sophisticated algorithms and sensor networks described in previous sections, intelligent ventilation systems operate within socio-technical contexts where occupant preferences, understanding, trust, and control expectations fundamentally shape outcomes. Recent research reveals that technical performance metrics (energy savings, CO2 reduction) achieved in controlled experiments or simulations often fail to materialize in occupied buildings when user acceptance factors are neglected, resulting in system overrides, gaming behaviors, or outright rejection ([6,63,64,65]).
7.1.1. Perceived Control and Transparency
Moeller [63] conducted longitudinal field studies of demand-controlled ventilation systems in 45 residential units over 18 months, systematically varying the level of occupant feedback and control authority. Three configurations were compared: (1) fully automated DCV with no user interface; (2) automated DCV with real-time IAQ dashboard showing CO2, VOC, and PM2.5 levels plus current ventilation rate; and (3) automated DCV with dashboard plus manual override capability (occupant-selectable “boost” ventilation for 30–60 min).
Key findings demonstrate the critical importance of transparency and perceived control:
- Configuration 1 (no interface) achieved design energy savings of 32% during the initial 3 months, but savings degraded to 18% by month 12 due to occupant complaints leading to system reprogramming toward more conservative (higher) ventilation rates. Occupant satisfaction scores were lowest (2.8/5.0), with common complaints of “stuffiness” and “lack of control.”
- Configuration 2 (dashboard feedback) maintained 30% energy savings throughout 18 months, with an occupant satisfaction of 3.9/5.0. Real-time IAQ visualization helped occupants understand system operation and build trust, significantly reducing complaints. Exit interviews revealed that 78% of occupants checked the dashboard at least weekly, and 34% reported that IAQ awareness influenced behaviors (e.g., reducing use of VOC-emitting products, adjusting cooking practices).
- Configuration 3 (dashboard + override) achieved 28% energy savings (slightly lower than configuration 2 due to occasional boost activations) but the highest occupant satisfaction (4.3/5.0). Override frequency averaged 2.3 activations per week per household, typically triggered by cooking events, guest visits, or perceived odors. Importantly, 89% of boost activations were appropriate from an IAQ perspective (occurring during elevated pollutant levels), indicating that occupants used the override capability responsibly rather than gaming the system.
These results underscore that providing transparency (dashboard) and maintaining occupant agency (override capability) are not detrimental to intelligent ventilation performance, but rather enhance acceptance and sustainability of energy-IAQ benefits. Moeller [63] recommends that residential intelligent ventilation systems include at minimum a simple traffic-light IAQ indicator (green/yellow/red) and a boost button, while commercial systems should provide zone-level dashboards accessible via smartphones or wall-mounted tablets.
7.1.2. Override Behaviors and System Gaming
Run et al. [65] investigated occupant override behaviors in automated window control systems deployed across 120 offices in naturally ventilated buildings in the UK and Netherlands. The systems used MPC algorithms to optimize window opening schedules based on outdoor conditions, indoor CO2 and temperature, and predicted occupancy, with motorized actuators executing the control decisions. However, occupants could manually override window positions at any time.
Analysis of 14 months of operation data revealed that override frequency and patterns varied dramatically across buildings and occupant groups:
- High-override group (28% of occupants): Overrode automated control on >40% of occupied days, typically opening windows immediately upon arrival regardless of outdoor conditions. Post-occupancy surveys indicated low trust in system responsiveness (“It doesn’t react fast enough”) and preference for personal control. In these zones, actual energy consumption exceeded baseline manual window operation by 8–12% due to windows left open during cold/hot conditions.
- Moderate-override group (51% of occupants): Overrode control occasionally (10–25% of days), typically in response to specific discomfort events (perceived stuffiness, odor, warm afternoon temperatures). Energy performance remained favorable (15–20% savings vs. baseline).
- Low-override group (21% of occupants): Rarely overrode system (<5% of days), expressing high satisfaction with automated operation. These zones achieved design energy savings of 25–32%.
Critically, Run et al. [65] found that override propensity correlated strongly with system responsiveness feedback: occupants who received visual confirmation of system actions (window position indicators, CO2 trend graphs) and explanations of control decisions (e.g., “Windows closing due to outdoor temperature drop”) were 2.5 times more likely to be in the low-override group. This finding reinforces the importance of transparent, explainable control systems that build user understanding and trust.
7.1.3. Behavioral Influence on IAQ and Ventilation Requirements
Beyond acceptance and override behaviors, occupant activities directly determine pollutant source strengths and ventilation needs. Andersen et al. [6] conducted comprehensive monitoring of residential IAQ, occupant activities, and ventilation system operation across 32 apartments over 12 months, using activity recognition algorithms (based on appliance power signatures, occupancy patterns, and video analytics in consented spaces) to correlate behaviors with pollutant emissions.
Key behavioral factors influencing IAQ and required ventilation rates include the following:
- Cooking practices: High-emission cooking (frying, grilling) generates PM2.5 concentrations of 80–350 µg/m3 and VOC spikes of 400–1200 ppb, requiring ventilation rates 3–5 times higher than baseline for 30–90 min to restore acceptable IAQ. Residents who cook high-emission meals > 4 times per week require 18–25% higher average ventilation rates than low-emission cooking households.
- Cleaning and product use: Use of conventional cleaning products, air fresheners, and personal care products contributes 30–60% of total residential VOC exposure. Households preferring natural/unscented products exhibit 35–50% lower baseline VOC levels, reducing required ventilation rates accordingly.
- Window-opening habits: In hybrid natural–mechanical ventilation systems, occupant window-opening patterns significantly impact mechanical ventilation loads. Andersen et al. [6] found that households that open windows during mild weather (>40% of shoulder-season hours) reduce mechanical ventilation energy by 22–28% compared to households that rarely open windows, despite similar IAQ outcomes.
- Occupancy density and patterns: Households with frequent guests or multi-generational occupancy exhibit 40–70% higher CO2 generation rates than single or couple occupancy, requiring proportionally increased ventilation. Accurate occupancy sensing or prediction is critical for avoiding under-ventilation in high-density scenarios.
These behavioral variations translate directly to intelligent ventilation control performance. Andersen et al. [6] demonstrate that MPC and DRL controllers incorporating learned household-specific behavior patterns (cooking schedules, product use, window-opening propensity) achieve 18–25% better energy-IAQ trade-offs compared to controllers assuming generic occupancy profiles. The personalized controllers anticipate high-emission events (e.g., typical dinner cooking time) and proactively increase ventilation 10–15 min in advance, preventing excessive pollutant accumulation while avoiding prolonged high ventilation after pollutant levels have decayed.
7.1.4. Design Implications for Human-in-the-Loop Intelligent Ventilation
Collectively, these findings underscore several critical design principles for intelligent ventilation systems intended for real-world deployment:
- Transparency and feedback: Provide real-time or near-real-time IAQ feedback via dashboards, smartphone apps, or ambient displays (e.g., color-changing LED indicators). Communicate system status and control decisions in plain language to build understanding and trust.
- Preserve occupant agency: Include manual override or boost capabilities that allow occupants to intervene when they perceive discomfort or unusual conditions. Design overrides with automatic time limits (30–90 min) to prevent indefinite manual control that defeats intelligent operation.
- Adaptive personalization: Implement learning algorithms that adapt to household- or zone-specific behaviors, pollutant sources, and preferences. Use occupancy detection, activity recognition, and pollutant event detection to refine control policies over time.
- Explainability: When feasible, provide brief explanations of control actions (“Increasing ventilation due to elevated CO2” or “Reducing ventilation due to favorable outdoor conditions”) to help occupants understand system logic and build mental models of operation.
- Graceful degradation: Design systems to maintain acceptable (if not optimal) performance even when occupants frequently override or when sensors fail, avoiding scenarios where system malfunctions lead to severe IAQ degradation or occupant rejection.
Failure to address human–machine interaction dynamics can lead to user dissatisfaction, system gaming, or outright rejection of intelligent ventilation technologies despite their technical performance capabilities. Conversely, human-centered design approaches that integrate behavioral sensing, adaptive feedback mechanisms, and user-friendly interfaces can enhance both acceptance and performance, enabling intelligent ventilation systems to achieve their full potential for simultaneous IAQ improvement and energy savings in real-world occupied buildings ([6,63,64]).
7.2. Regulatory and Standardization Context
Intelligent ventilation strategies are increasingly aligned with evolving regulatory frameworks and building performance standards. The European standard EN 16798-1 (2019) [10] establishes indoor environmental quality categories and ventilation requirements, providing a foundation for DCV and adaptive ventilation approaches. Similarly, ISO 17772-1 (2017) [11] defines design criteria for the indoor environment, including air quality parameters that inform control thresholds for CO2, humidity, and pollutants ([5,7]). These standards support the implementation of threshold-based and model-predictive controls by providing validated setpoints and performance benchmarks.
Beyond prescriptive standards, voluntary certification schemes such as WELL Building Standard v2 and LEED v5 incentivize advanced IAQ monitoring and control. WELL Feature A01 (Air Quality Standards) and A07 (Operable Windows) explicitly recognize demand-controlled and hybrid ventilation strategies, while LEED v5’s Indoor Air Quality Credit rewards continuous monitoring and adaptive ventilation responses ([31,63]). These frameworks demonstrate how intelligent ventilation contributes to occupant health and wellness objectives alongside energy efficiency.
The Energy Performance of Buildings Directive (EPBD) recast (2024) introduces the smart readiness indicator (SRI) to assess buildings’ capability for energy-efficient operation, maintenance optimization, and grid interaction ([62]). Intelligent ventilation systems with IoT connectivity, predictive controls, and integration with renewable energy sources (e.g., MPC + PV coordination) directly contribute to higher SRI scores in domains such as “Energy flexibility and storage,” “Indoor air quality and comfort,” and “Information to occupants” ([24,61]). As SRIs become a mandatory disclosure requirement across the EU, the regulatory context creates strong drivers for adoption of the control and monitoring technologies reviewed in this article.
However, gaps remain in standardization of effectiveness metrics for natural and mixed-mode ventilation systems, where pollutant removal efficiency and age-of-air calculations are less mature than for mechanical systems ([32]). Furthermore, harmonization of sensor accuracy requirements, FDD protocols, and cybersecurity standards for IoT-based ventilation networks represents an ongoing challenge ([8,9]). Addressing these gaps will be critical for scaling intelligent ventilation solutions across diverse building typologies and climatic contexts while ensuring regulatory compliance and occupant trust.
7.3. Economic and Maintenance Evaluation
Economic viability represents a critical factor in the adoption of intelligent ventilation technologies, requiring comprehensive analysis of initial investment, operational costs, and long-term benefits that are highly sensitive to regional energy prices, climate conditions, and building characteristics. Implementation costs for intelligent ventilation systems typically exceed those of conventional constant-airflow systems due to additional sensors, control hardware, IoT connectivity infrastructure, and commissioning requirements ([60]). However, in regions with high energy costs and favorable regulatory incentives, energy savings and improved IAQ outcomes may justify these higher upfront investments through reduced operational costs and enhanced occupant productivity and health ([28,59]). Economic performance varies substantially across contexts, with payback periods ranging from 4 to 11 years depending on climate zone, energy tariff structure, building typology, and system complexity ([28,60]).
Gobinath et al. [60] conducted a life-cycle cost (LCC) analysis comparing conventional mechanical ventilation with DCV and MPC-based intelligent systems in residential and commercial buildings across multiple European climate zones. Their findings indicate that while initial investment costs for intelligent systems are 40–80% higher than conventional solutions (120–180 EUR/m2 versus 70–100 EUR/m2), payback periods range from 4 to 8 years in the studied contexts, though this range is heavily dependent on local energy prices (electricity > 0.20 EUR/kWh in their analysis), climate-driven heating/cooling loads, and successful system commissioning. Annual maintenance costs for intelligent systems are also elevated by 15–25% due to sensor calibration, software updates, and FDD requirements, but these costs may be partially offset by predictive maintenance capabilities that reduce emergency repairs and system downtime, though long-term field evidence of such benefits remains limited ([60]).
Seraj et al. [28] evaluated the economic performance of heuristic optimization approaches for HVAC control in a large institutional building with existing BMS infrastructure, demonstrating that properly tuned intelligent systems can achieve 16% energy savings with minimal additional hardware costs when integrated with existing building management systems. Their cost–benefit analysis shows net present value (NPV) improvements of 25–35 EUR/m2 over a 20-year life cycle in their specific case study context, accounting for both energy savings and monetized health-related benefits from improved IAQ based on epidemiological valuation methods ([28]). These results represent favorable conditions (existing infrastructure, skilled commissioning, stable operation) and may not generalize to all building types or operational contexts. Table 2 summarizes typical investment ranges, maintenance costs, and payback periods across different intelligent ventilation configurations derived from the reviewed literature.
Table 2.
Economic comparison of ventilation system configurations across building types and climates. Investment costs represent typical ranges for complete system installation including equipment, sensors, controls, and commissioning, derived from residential (80–150 m2, 2–4 occupants) and commercial (500–3500 m2, office/school use) applications. Annual maintenance includes sensor calibration, software updates, filter replacement, and preventive maintenance. Payback period calculated relative to conventional constant-airflow baseline assuming 2024 European energy prices (electricity 0.25 EUR/kWh, gas 0.08 EUR/kWh), 2000 operating hours per year (commercial), or 6000 hours per year (residential), across three climate zones: cold (HDD > 3000, e.g., Helsinki), temperate (HDD 2000–3000, e.g., Brussels), and warm (HDD < 2000, e.g., Madrid). Indoor design parameters: heating setpoint 20–22 °C, cooling setpoint 24–26 °C, RH 30–60%, CO2 target < 1000 ppm above outdoor, PM2.5 < 25 µg/m3. Values normalized to 2024 EUR and 3% real discount rate. See explanatory paragraph for detailed normalization assumptions and building/climate context.
Building and Climate Context for Cost Analyses. The economic data presented in Table 2 are derived from studies conducted across representative building typologies and climatic contexts. Residential applications include single-family homes (80–150 m2 floor area, 200–400 m3 volume) and multi-family apartment units (60–120 m2, 150–300 m3), with typical occupancy of two to four persons and ventilation design rates of 0.3–0.5 air changes per hour (ACH) during occupied periods. Commercial applications encompass office buildings (500–3500 m2 open-plan zones, 1500–10,500 m3) and educational facilities (classrooms 50–80 m2, 150–240 m3), with occupancy densities of 0.1–0.15 persons/m2 (offices) and 0.3–0.5 persons/m2 (schools), and ventilation rates of 7–10 L/(s·person) per ASHRAE Standard 62.1 and EN 16798-1 [10,12].
Indoor design parameters for cost modeling include winter heating setpoint 20–22 °C, summer cooling setpoint 24–26 °C, relative humidity maintenance 30–60%, and IAQ targets of CO2 < 1000 ppm above outdoor (Category II per EN 16798-1) and PM2.5 < 25 µg/m3 (WHO interim target-3). Outdoor design conditions span three representative European climate zones: (1) cold climate (HDD > 3000, CDD < 500): Helsinki, Finland (winter design −26 °C, summer 26 °C); (2) temperate climate (HDD 2000–3000, CDD 200–800): Brussels, Belgium (winter −8 °C, summer 28 °C); and (3) warm climate (HDD < 2000, CDD > 800): Madrid, Spain (winter −4 °C, summer 35 °C). Energy prices are normalized to 2024 European averages: electricity 0.25 EUR/kWh, natural gas 0.08 EUR/kWh, district heating 0.06 EUR/kWh.
Normalization across studies accounts for (i) inflation adjustment to 2024 EUR using Eurostat HICP indices; (ii) conversion of non-EUR currencies using 2024 annual average exchange rates; (iii) standardization of discount rates to 3% real (5% nominal) for NPV calculations; and (iv) harmonization of energy performance metrics to primary energy (conversion factors: electricity 2.5, gas 1.1, district heating 0.7) to enable comparison across different heating/cooling systems. Payback periods assume constant 2024 energy prices without escalation, representing conservative estimates given historical energy price trends. Actual payback periods in high-energy-cost scenarios or with carbon pricing mechanisms may be 20–40% shorter than tabulated values.
Critical to economic viability is the avoidance of commissioning failures and operational drift. Poorly parameterized intelligent systems can increase energy consumption relative to simple baselines ([2]), underscoring the importance of robust installation protocols, continuous commissioning, and performance monitoring. Furthermore, the economic case for intelligent ventilation may strengthen in certain contexts when considering co-benefits such as reduced sick building syndrome, improved cognitive performance (particularly in schools and offices), and compliance with increasingly stringent building energy codes and IAQ standards ([5,66]), though quantification and monetization of such co-benefits remain subject to substantial uncertainty and vary across building types and occupant populations. As sensor costs decline and machine learning algorithms mature, the cost-effectiveness of intelligent ventilation solutions may improve over the coming decade, though adoption rates will continue to depend heavily on regional energy prices, regulatory frameworks, financing mechanisms, and availability of skilled commissioning expertise.
Regional Climate and Socioeconomic Factors Affecting Adaptability
The economic viability and technological applicability of intelligent ventilation systems are fundamentally shaped by regional climatic conditions and socioeconomic contexts, creating substantial disparities in adoption potential between high-income and low-income regions, and between climate zones with differing ventilation loads and technology suitability. These factors introduce critical considerations for global scalability and equitable deployment of the advanced control strategies reviewed in this article.
Climatic variability and system selection. Climate fundamentally determines the ventilation heating/cooling loads that intelligent systems must optimize, and thus the economic return on investment. In cold climates (HDD > 3000, e.g., Nordic countries, Canada, northern Russia), space heating dominates building energy consumption (60–75% of total), making heat recovery ventilation (HRV/ERV) economically favorable for most mechanical ventilation applications, particularly in regions with high heating fuel costs. Intelligent control strategies in cold climates focus on optimizing HRV effectiveness, preventing frost formation on heat exchangers, and minimizing thermal stack-driven infiltration ([7,17]). DCV combined with HRV demonstrates payback periods of 4–6 years in studied cold-climate contexts with European energy prices (Table 2), driven by high avoided heating costs; however, these payback periods extend significantly in regions with subsidized heating fuels or mild winters (HDD 2000–3000). Conversely, passive strategies such as EAHE preconditioning face implementation challenges due to ground frost penetration depths (>1.5 m) requiring deep excavation, and reduced cooling demand limiting economic benefits to brief summer periods.
In warm climates (CDD > 1500, e.g., Mediterranean, Middle East, Southeast Asia, tropical regions), cooling loads dominate (50–70% of total energy), shifting economic priorities toward strategies that reduce sensible and latent cooling requirements. EAHE systems can achieve favorable economics in warm-dry climates (e.g., Madrid, Phoenix, Riyadh) where deep-ground temperatures (16–20 °C) provide substantial free cooling potential for 6–8 months annually, with reported payback periods of 5–7 years when coupled with DCV in studies with favorable soil conditions and moderate excavation costs ([21,67]). However, EAHE economic viability is highly site-specific, depending on soil thermal properties, water table depth, excavation costs (which vary 50–200% across regions), and local electricity prices; rocky or saturated soils can render EAHE economically unfavorable despite climate suitability. HRV/ERV systems typically lose economic viability in warm climates where heating demand is minimal and summer heat recovery exacerbates cooling loads unless bypass controls are properly implemented ([32]). Natural and mixed-mode ventilation strategies show greatest promise in warm-humid climates with consistent wind patterns (e.g., coastal tropical regions), though outdoor air pollution and humidity often limit applicability ([31,65]).
Temperate climates (moderate HDD 2000–3000, moderate CDD 500–1500, e.g., Western Europe, Pacific Northwest) offer the most flexible context for intelligent ventilation, with balanced heating and cooling seasons enabling cost-effective deployment of HRV, EAHE, mixed-mode, and advanced MPC strategies. However, temperate climates also exhibit high inter-annual variability and transitional shoulder seasons with rapid weather fluctuations, placing greater demands on predictive control algorithms and adaptive thermal management ([18,24]).
High-income versus low-income contexts. Socioeconomic factors create profound disparities in intelligent ventilation adoption potential and priorities. High-income countries (GDP per capita > USD 30,000) exhibit several enablers for advanced ventilation technologies: (i) stringent building energy codes (e.g., EPBD in Europe, Energy Star in USA) that mandate minimum ventilation effectiveness and increasingly require smart readiness indicators (SRI), creating regulatory pull for intelligent systems ([62,66]); (ii) high energy costs (electricity USD 0.20–0.35 per kWh, natural gas USD 0.06–0.12 per kWh) that improve economic payback of energy-saving ventilation strategies; (iii) robust digital infrastructure including broadband internet penetration > 90%, cloud computing services, and IoT connectivity enabling remote monitoring and cloud-based MPC ([31,61]); (iv) availability of skilled installation and commissioning workforce capable of deploying and parameterizing sophisticated control systems; and (v) access to capital for upfront investment in higher-cost intelligent systems (EUR 135–320 per m2, Table 2) with 5–10 year payback periods.
In contrast, low- and middle-income countries (GDP per capita < USD 15,000) face substantial barriers to intelligent ventilation adoption despite often having greater IAQ challenges (higher outdoor pollution, less efficient building stock, higher occupancy densities): (i) affordability constraints limit investment capacity for systems with EUR 110–320 per m2 costs, particularly when combined with informal housing sectors lacking financing mechanisms; (ii) weaker or absent building energy codes and IAQ regulations reduce regulatory drivers for advanced ventilation technologies; (iii) limited IoT readiness including unreliable electricity supply (frequent outages in sub-Saharan Africa, South Asia), low internet penetration (20–50% in rural areas), and lack of cloud infrastructure needed for remote MPC or DRL training; (iv) shortage of technical expertise for system commissioning, calibration, and maintenance, risking poor performance and premature failures; and (v) lower energy costs in some regions (subsidized electricity USD 0.03–0.08 per kWh in parts of Middle East, Asia, Latin America) extending payback periods beyond thresholds typically considered economically attractive (>15–20 years), though economic viability assessments must also account for substantial health co-benefits in high-pollution contexts that may not be fully captured in conventional payback calculations ([68,69,70,71,72]).
These disparities create a global divide where advanced intelligent ventilation solutions concentrate in high-income, cold-climate regions (Europe, North America, Japan, South Korea), while low-income tropical and subtropical regions—which house the majority of the global population and face severe IAQ challenges from outdoor pollution, indoor biomass combustion, and inadequate ventilation—remain largely excluded from technological benefits. Seraj et al. [28] and Chiesa and Vigliotti [5] note that sensor costs have declined dramatically (CO2 sensors from USD 200 to USD 20–40 over the past decade), potentially enabling affordable threshold-based DCV in middle-income contexts. However, holistic barriers beyond component costs—including installation skills, commissioning protocols, regulatory frameworks, and digital infrastructure—limit near-term global scalability.
Implementation strategies for resource-constrained contexts. Several approaches show promise for extending intelligent ventilation benefits to low-income and tropical contexts: (i) simplified threshold-based DCV systems using low-cost CO2 sensors and standalone zone controllers (no cloud connectivity required), achievable at EUR 40–70 per m2 incremental cost relative to conventional ventilation; (ii) hybrid natural-mechanical strategies optimized for tropical climates with high-mass envelopes, strategic window placement, and occupant-controlled natural ventilation augmented by ceiling fans or low-velocity displacement ventilation during peak heat/pollution periods ([65]); (iii) community-scale solutions that amortize IoT infrastructure and commissioning costs across multiple buildings (schools, health clinics, multi-family housing), reducing per-building costs by 30–50%; (iv) open-source control algorithms and low-cost hardware platforms (e.g., Raspberry Pi, Arduino-based controllers) enabling local adaptation and reducing dependence on proprietary systems ([31]); and (v) integration with mobile networks (4G/5G) rather than fixed broadband, leveraging higher mobile penetration rates (70–90% even in low-income regions) for remote monitoring and fault diagnostics.
The adaptation of intelligent ventilation strategies to diverse climatic and socioeconomic contexts represents a critical frontier for ensuring that IAQ and energy benefits reach the global majority rather than remaining concentrated in affluent regions. Future research should prioritize development of climate-appropriate, cost-optimized, and infrastructure-resilient ventilation solutions tailored to the constraints and priorities of resource-limited settings.
7.4. Building Typology and Structural Characteristics
The applicability, performance, and cost-effectiveness of intelligent ventilation strategies vary substantially across building types due to differences in envelope characteristics, spatial organization, occupancy patterns, and operational constraints. This subsection synthesizes comparative evidence across four primary building categories—residential, office, educational, and commercial—highlighting how structural characteristics and usage patterns influence the selection and optimization of intelligent ventilation approaches.
7.4.1. Residential Buildings: Single-Family and Multi-Family
Residential buildings exhibit relatively low and predictable occupancy densities (two to five persons per dwelling unit, typically 80–150 m2), making them well-suited for CO2-based DCV with simple threshold controls. Guyot et al. [2] demonstrate that residential DCV systems achieve consistent energy savings of 25–45% across diverse European climates, with minimal IAQ degradation when baseline ventilation rates are appropriately sized (0.3–0.5 ACH during occupied periods). The relatively small floor area and limited number of zones (three to six per dwelling) enable cost-effective sensor deployment (EUR 110–145 per m2 for complete DCV systems including installation, see Table 2).
However, residential buildings present unique challenges for advanced control strategies. Single-family homes typically lack dedicated mechanical ventilation systems in many European regions, relying on natural ventilation or extract-only systems, which limits the applicability of sophisticated MPC or DRL approaches. Multi-family buildings face additional complexities from inter-unit airflow, shared ventilation shafts, and privacy concerns that complicate centralized sensing and control. Moeller [63] report that distributed zone-level DCV controllers with local occupancy sensing outperform centralized control in multi-family buildings by 12–18% due to accommodation of unit-specific occupancy patterns and cooking/cleaning schedules.
Envelope-integrated solutions show particular promise in residential contexts. HRV/ERV systems coupled with DCV achieve the highest energy savings (45–60%, [17]) in well-insulated new construction contexts (U-values < 0.3 W/(m2·K)), where mechanical ventilation with heat recovery becomes cost-effective. Supply-air windows and EAHE preconditioning offer attractive retrofit options for existing housing stock with limited space for ducted ventilation systems, though payback periods extend to 8–12 years due to excavation and installation costs.
7.4.2. Office Buildings: Open-Plan and Cellular Layouts
Office buildings represent the most mature application domain for intelligent ventilation technologies, driven by relatively high energy costs per unit area, stringent IAQ requirements for productivity, and existing HVAC infrastructure that facilitates integration of advanced controls. Open-plan offices (typical zones 200–800 m2, occupancy density 0.10–0.15 persons/m2) benefit significantly from MPC strategies that coordinate ventilation with dynamic occupancy patterns, weather forecasts, and energy pricing. Tarragona et al. [24] demonstrate that MPC optimizing ventilation timing around hourly electricity tariffs and PV generation achieves 15% cost savings beyond conventional DCV, with peak demand shifting to off-peak hours reducing grid stress.
The spatial homogeneity of open-plan offices simplifies sensor placement and control zoning, with typical implementations requiring 6–10 multi-parameter sensor nodes per floor (400–600 m2 per sensor) for representative IAQ monitoring. Cellular offices present greater complexity due to higher zone count and variable occupancy patterns (meeting rooms, private offices, shared workspaces), requiring more sophisticated sensor placement optimization, as described by Liu and Zheng [8], and denser control zoning.
Envelope characteristics critically influence ventilation performance in office buildings. Modern office towers with high window-to-wall ratios (40–60%) and significant solar gains benefit from integration of thermochromic or electrochromic glazing with DCV/MPC. Yu et al. [48] show that coordinated control of adaptive glazing and ventilation reduces cooling-season ventilation loads by 12–18% compared to an independent control, as reduced solar gains lower the ventilation airflow required to maintain thermal comfort during afternoon peaks. Deep-plan offices (>12 m from perimeter to core) require mechanical ventilation regardless of control strategy, making them ideal candidates for comprehensive intelligent systems integrating HRV, demand control, and fault diagnostics.
7.4.3. Educational Buildings: Classrooms and Lecture Halls
Educational facilities present the most challenging conditions for intelligent ventilation due to extreme occupancy variability (classrooms transition from 0 to 25–35 students within minutes), high peak occupancy densities (0.3–0.5 persons/m2), and resulting rapid CO2 generation rates. Chiesa and Vigliotti [5] conducted extensive monitoring in European schools, documenting CO2 exceedances (>1000 ppm above outdoor) in 35–60% of occupied class periods under fixed-schedule ventilation, versus 8–15% under well-tuned DCV with anticipatory boost based on schedule.
The intermittent occupancy patterns of classrooms (45–60 min periods with 5–15 min breaks) favor control strategies that anticipate occupancy transitions rather than purely reactive threshold-based DCV. Predictive control using class schedules reduces lag between occupancy onset and adequate ventilation by 10–15 min compared to CO2-triggered DCV, maintaining concentrations below 800 ppm above outdoor during 90% of occupied periods ([5]). However, schedule-based prediction fails during irregular events (assemblies, exams, school closures), necessitating hybrid approaches that combine predictive feed-forward with reactive feedback correction.
Structural characteristics of educational buildings significantly impact ventilation strategies. Older school buildings (pre-1980 construction) commonly feature naturally ventilated designs with operable windows and high ceilings (3.5–4.5 m), enabling hybrid ventilation approaches that combine mechanical supply with occupant-controlled or automated natural ventilation. Zivelonghi and Giuseppi [31] demonstrate that hybrid control systems optimizing both mechanical AHU operation and automated window actuators achieve 28% energy savings compared to mechanical-only systems in Mediterranean school buildings, exploiting free cooling during shoulder seasons while maintaining minimum mechanical ventilation during extreme weather.
Modern school construction with lower ceilings (2.7–3.0 m), tighter envelopes, and fixed glazing requires fully mechanical ventilation, but benefits from energy recovery (HRV/ERV) that is cost-prohibitive in naturally ventilated buildings. The combination of HRV and classroom-level DCV demonstrates payback periods of 5–7 years in cold climates (HDD > 3000), making it economically viable for new construction and major renovations. Acoustic requirements in educational buildings necessitate low-velocity ventilation systems (duct velocities < 3 m/s) to maintain noise levels below 35 dB(A), increasing duct sizes and installation costs by 15–25% compared to office applications.
7.4.4. Commercial Buildings: Retail, Hospitality, and Mixed-Use
Commercial buildings encompass diverse typologies with highly variable ventilation requirements. Retail spaces exhibit unpredictable occupancy patterns driven by customer flow, with peak densities (0.2–0.4 persons/m2 during sales events) substantially exceeding design values. This variability favors real-time occupancy sensing (infrared, camera-based, or WiFi counting) coupled with DCV rather than schedule-based prediction. However, retail environments present sensor placement challenges due to frequent layout changes (merchandise displays, temporary walls) that invalidate calibrated sensor locations.
Hospitality buildings (hotels, restaurants) combine residential-like occupancy in guest rooms with commercial-scale dining and event spaces. Guest room ventilation can employ residential DCV strategies with low-cost CO2 or occupancy sensors, while common areas require robust multi-parameter sensing, including VOC monitoring for cooking emissions and particulate sensing for outdoor pollution infiltration. De Jonge et al. [7] document that VOC concentrations in hotel corridors and lobbies can reach 400–800 ppb during peak meal service due to kitchen exhaust and cleaning products, necessitating VOC-responsive DCV rather than CO2-only control.
Mixed-use buildings integrating residential, office, and commercial functions present the greatest control complexity due to conflicting ventilation schedules, diverse IAQ requirements, and complex inter-zone airflow patterns. Centralized HVAC systems serving multiple use types struggle to satisfy simultaneous heating (residential morning) and cooling (office afternoon) demands, while maintaining appropriate IAQ in all zones. Distributed control architectures with zone-level autonomy, as demonstrated by Zivelonghi and Giuseppi [31] using LoRaWAN IoT networks, provide superior performance in mixed-use contexts by decoupling zone-level decisions while coordinating system-level optimization at the air-handling unit.
7.4.5. Comparative Analysis: Envelope, Zoning, and Occupancy Interactions
Table 3 synthesizes key building characteristics and their influence on intelligent ventilation strategy selection ([73,74,75,76]). Several generalizable patterns emerge from cross-typology analysis:
Table 3.
Comparative characteristics of intelligent ventilation across building typologies. Values represent typical ranges for each building type based on reviewed studies. Control strategy recommendations indicate primary (preferred) and secondary (alternative) approaches. Envelope characteristics significantly influence applicability of passive strategies (EAHE, natural ventilation) and energy recovery effectiveness. Higher zoning complexity increases sensor/actuator counts and control algorithm sophistication requirements.
(1) Envelope tightness and ventilation load: Buildings with high-performance envelopes (U-values < 0.2 W/(m2·K), airtightness < 1.5 ACH50) exhibit lower baseline ventilation loads, increasing the relative energy savings from intelligent control (40–60% savings achievable) but also increasing the importance of controlled mechanical ventilation since infiltration no longer provides adequate air exchange. Conversely, leaky older buildings (airtightness > 5 ACH50) demonstrate lower fractional savings from DCV (15–25%) as uncontrolled infiltration dominates air exchange.
(2) Zoning granularity and control complexity: Fine-grained zoning (individual rooms or small zones < 100 m2) enables precise IAQ control and maximum energy savings through zone-level demand matching, but increases sensor/actuator costs (∝ ) and control algorithm complexity (∝ for coupled MPC). Optimal zoning strategies balance IAQ precision against implementation cost: residential buildings favor coarse zoning (whole-dwelling or per-floor), offices favor intermediate zoning (per-department or per-floor), and schools favor fine zoning (per-classroom) due to extreme inter-zone occupancy differences.
(3) Occupancy predictability and control architecture: Building types with predictable occupancy patterns (offices, schools) benefit from model-based predictive control (MPC) that exploits forecasts of occupancy, weather, and energy pricing. Buildings with unpredictable occupancy (retail, event spaces) require reactive control (DCV with rapid response) or adaptive learning approaches (DRL) that discover patterns from historical data. Hybrid buildings benefit from hierarchical control architectures that apply appropriate strategies at different spatial/temporal scales: predictive at the building level (AHU scheduling), reactive at the zone level (VAV damper control).
(4) Integration with passive and active envelope systems: Building types with favorable orientation, climate, and envelope design can leverage passive strategies (natural ventilation, EAHE preconditioning) to reduce mechanical ventilation loads by 20–45%. However, these strategies require careful integration with intelligent mechanical ventilation to avoid conflicts: simultaneous window opening and mechanical supply can short-circuit intended airflow patterns, while EAHE systems require bypass controls coordinated with HRV defrost cycles. MPC frameworks that co-optimize mechanical ventilation, natural ventilation openings, and envelope conditioning systems demonstrate 15–28% additional savings compared to independent control ([21,24]).
These building-specific considerations underscore the importance of context-aware design and commissioning of intelligent ventilation systems. Successful implementations require matching control sophistication to building characteristics, occupancy patterns, and operational constraints, rather than applying uniform strategies across diverse typologies.
8. Conclusions
Intelligent ventilation combines advanced control, IoT sensing with validation, and recovery/envelope technologies that reduce loads while maintaining IAQ. The reviewed evidence from 51 studies (2017–2025) indicates aggregate energy savings of 38 ± 12% across DCV, MPC, and DRL strategies without compromising indoor air quality when properly designed and commissioned. These performance indicators represent observed trends across the analyzed corpus—predominantly European and North American contexts with high-income building stock—rather than universally generalizable results applicable to all climates, building types, or socioeconomic settings. Variability in reported outcomes reflects differences in baseline systems, climate zones, building characteristics, and methodological approaches (field studies vs. simulations), as detailed in Section 2 and Section 7. These performance gains align with evolving regulatory frameworks (EN 16798, ISO 17772, EPBD 2024) and certification schemes (WELL, LEED v5) that increasingly recognize adaptive ventilation as essential for energy efficiency, occupant health, and smart building readiness.
Economic evaluation reveals that intelligent ventilation systems require 40–80% higher initial investment than conventional solutions, with payback periods ranging from 4 to 11 years depending on system complexity, climate zone, regional energy prices, and building typology (see Section 7 and Table 2). These payback estimates are based primarily on European contexts with relatively high energy costs (electricity 0.20–0.35 EUR/kWh) and may not generalize to regions with subsidized energy or different market structures. Life-cycle cost analyses in favorable contexts demonstrate potential for positive net present value when accounting for energy savings, reduced maintenance through predictive FDD, and monetized co-benefits from improved occupant health and productivity, though quantification of non-energy benefits remains subject to methodological uncertainties. Balancing energy performance with total life-cycle costs—including commissioning, sensor calibration, and software updates—remains essential for successful deployment, particularly in contexts where skilled technical support may be limited.
Recommendations include the following: (i) deployment of DCV systems with safety limits and comprehensive VOC/PM monitoring beyond CO2 alone; (ii) implementation of MPC integrated with dynamic energy pricing and photovoltaic generation, and where appropriate, DRL with bounded control constraints; (iii) installation of robust HRV/ERV systems with anti-frost mitigation strategies and low-loss heat exchanger designs; (iv) integration of validated active envelope technologies (thermochromic glazing) and passive conditioning solutions (EAHE); (v) systematic application of uncertainty quantification (UQ), life-cycle assessment (LCA), and life-cycle costing (LCC) evaluation frameworks alongside digital twin validation; and (vi) adoption of smart readiness indicator (SRI) frameworks and user-centered design approaches that preserve occupant agency and provide transparent feedback. Practical applicability requires addressing standardization gaps in mixed-mode ventilation effectiveness metrics, sensor accuracy requirements, and FDD protocols for IoT networks.
Supplementary Materials
The following supporting information can be downloaded at: https://www.mdpi.com/article/10.3390/buildings16010065/s1, PRISMA 2020 checklist.
Author Contributions
Conceptualization, C.R.-M. and A.N.S.; Data curation, C.R.-M. and J.M.F.-M.; Formal analysis, C.R.-M. and V.E.-I.; Funding acquisition, C.R.-M.; Investigation, C.R.-M. and J.M.F.-M.; Methodology, C.R.-M. and V.E.-I.; Project administration, C.R.-M. and A.N.S.; Resources, C.R.-M. and J.M.F.-M.; Software, C.R.-M. and V.E.-I.; Supervision, C.R.-M. and A.N.S.; Vaslidation, C.R.-M. and J.M.F.-M.; Visualization, C.R.-M. and V.E.-I.; Writing—original draft, C.R.-M. and A.N.S.; Writing—review & editing, C.R.-M. and J.M.F.-M. All authors have read and agreed to the published version of the manuscript.
Funding
This work was supported by the project “Advances in the modeling and characterization of sustainability in architecture with AI” (GRE 2022, University of Alicante, 2024/00083) and by the project “AIRES6D: Advances in air renewal techniques in buildings, 6D consideration”, within the framework of the Grants for Emerging Research Groups of the Generalitat Valenciana (CIGE/2024/202).
Data Availability Statement
No new data were created or analyzed in this study.
Conflicts of Interest
The authors declare no conflict of interest.
Abbreviations
| Abbreviation | Full Term/Description |
| ACH | Air Changes per Hour |
| ANN | Artificial Neural Network |
| ASHRAE | American Society of Heating, Refrigerating and Air-Conditioning Engineers |
| BiLSTM | Bi-directional Long Short-Term Memory (neural network) |
| BMS | Building Management System |
| BTES | Borehole Thermal Energy Storage |
| CDD | Cooling Degree Days |
| CFD | Computational Fluid Dynamics |
| COP | Coefficient of Performance |
| DCV | Demand-Controlled Ventilation |
| DQN | Deep Q-Network (reinforcement learning algorithm) |
| DRL | Deep Reinforcement Learning |
| DX | Direct Expansion (cooling system) |
| EAHE | Earth–Air Heat Exchanger |
| EN | European Norm (standard) |
| EPBD | Energy Performance of Buildings Directive (European Union) |
| ERV | Energy Recovery Ventilator |
| FDD | Fault Detection and Diagnostics |
| GA | Genetic Algorithm |
| GHE | Ground Heat Exchanger |
| GRU | Gated Recurrent Unit (neural network) |
| HDD | Heating Degree Days |
| HDPE | High-Density Polyethylene |
| HICP | Harmonised Index of Consumer Prices (Eurostat) |
| HRV | Heat Recovery Ventilator |
| HVAC | Heating, Ventilation, and Air Conditioning |
| IAQ | Indoor Air Quality |
| IEC | Indirect Evaporative Cooling |
| IoT | Internet of Things |
| ISO | International Organization for Standardization |
| LCA | Life-Cycle Assessment |
| LCC | Life-Cycle Costing |
| LEED | Leadership in Energy and Environmental Design (certification) |
| LoRaWAN | Long Range Wide Area Network (IoT communication protocol) |
| LSTM | Long Short-Term Memory (neural network) |
| MAML | Model-Agnostic Meta-Learning |
| MAPE | Mean Absolute Percentage Error |
| MCP | Model Context Protocol |
| ML | Machine Learning |
| MOX | Metal-Oxide Semiconductor (sensor) |
| MPC | Model Predictive Control |
| NPV | Net Present Value |
| PCM | Phase-Change Material |
| PHE | Plate Heat Exchanger |
| PM | Particulate Matter (e.g., PM2.5, PM10) |
| pp | Percentage Points |
| PSO | Particle Swarm Optimization |
| PV | Photovoltaic (solar generation) |
| PVC | Polyvinyl Chloride |
| QA | Quality Assurance |
| RBD-FAST | Random Balance Design - Fourier Amplitude Sensitivity Test |
| RH | Relative Humidity |
| RL | Reinforcement Learning |
| RSM | Response Surface Methodology |
| RUL | Remaining Useful Life |
| SA | Simulated Annealing (optimization algorithm) |
| SHGC | Solar Heat Gain Coefficient |
| SMA | Shape Memory Alloy |
| SRI | Smart Readiness Indicator |
| STC | Sound Transmission Class |
| TC | Thermochromic |
| TVOC | Total Volatile Organic Compounds |
| UQ | Uncertainty Quantification |
| UV-C | Ultraviolet C (germicidal irradiation) |
| VO2 | Vanadium Dioxide |
| VOC | Volatile Organic Compound |
| WELL | WELL Building Standard (certification) |
| WHO | World Health Organization |
References
- Niza, I.L.; Bueno, A.M.; Gameiro Da Silva, M.; Broday, E.E. Air quality and ventilation: Exploring solutions for healthy and sustainable urban environments in times of climate change. Results Eng. 2024, 24, 103157. [Google Scholar] [CrossRef]
- Guyot, G.; Sherman, M.H.; Walker, I.S. Smart ventilation energy and indoor air quality performance in residential buildings: A review. Energy Build. 2018, 165, 416–430. [Google Scholar] [CrossRef]
- Lee, Y.J. Mapping the technological landscape of green smart buildings: A patent analytics of key topics, leading companies, and technology gaps. J. Build. Eng. 2024, 98, 111020. [Google Scholar] [CrossRef]
- Wang, G.; Fang, J.; Yan, C.; Huang, D.; Hu, K.; Zhou, K. Advancements in smart building envelopes: A comprehensive review. Energy Build. 2024, 312, 114190. [Google Scholar] [CrossRef]
- Chiesa, G.; Vigliotti, M. Comparing mechanical ventilation control strategies for indoor air quality: Monitoring and simulation results of a school building in northern Italy. Energy Build. 2024, 322, 114665. [Google Scholar] [CrossRef]
- Andersen, R.; Fabi, V.; Corgnati, S. Predicted and actual indoor environmental quality: Verification of occupants’ behaviour models in residential buildings. Energy Build. 2016, 127, 105–115. [Google Scholar] [CrossRef]
- De Jonge, K.; Ghijsels, J.; Laverge, J. Energy savings and exposure to VOCs of different household sizes for three residential smart ventilation systems with heat recovery. Energy Build. 2023, 290, 113091. [Google Scholar] [CrossRef]
- Liu, L.; Zheng, F. An improved cohesive hierarchical clustering for indoor air quality monitoring in smart gymnasium with healthy sport areas. Alex. Eng. J. 2024, 105, 204–217. [Google Scholar] [CrossRef]
- Tariq, S.; Loy-Benitez, J.; Yoo, C. Multi-sensor fault detection and correction for automated IAQ monitoring in smart buildings through attention-aware autoencoders with spatial prediction module. J. Build. Eng. 2024, 96, 110573. [Google Scholar] [CrossRef]
- EN 16798-1:2019; Energy Performance of Buildings—Ventilation for Buildings—Part 1: Indoor Environmental Input Parameters for Design and Assessment of Energy Performance of Buildings Addressing Indoor Air Quality, Thermal Environment, Lighting and Acoustics. CEN: Brussels, Belgium, 2019.
- ISO 17772-1:2017; Energy Performance of Buildings—Indoor Environmental Quality— Part 1: Indoor Environmental Input Parameters for the Design and Assessment of Energy Performance of Buildings. ISO: Geneva, Switzerland, 2017.
- ASHRAE Standard 62.1-2022; Ventilation for Acceptable Indoor Air Quality. ASHRAE: Atlanta, GA, USA, 2022.
- ASHRAE Standard 62.2-2022; Ventilation and Acceptable Indoor Air Quality in Residential Buildings. ASHRAE: Atlanta, GA, USA, 2022.
- World Health Organization. WHO Air Quality Guidelines: Global Update 2021; World Health Organization: Geneva, Switzerland, 2021.
- EN 15603:2008; Energy Performance of Buildings—Overall Energy Use and Definition of Energy Ratings. CEN: Brussels, Belgium, 2008.
- EN ISO 15927-6:2007; Hygrothermal Performance of Buildings—Calculation and Presentation of Climatic Data—Part 6: Accumulated Temperature Differences (Degree-Days). CEN: Brussels, Belgium, 2007.
- Bordignon, S.; Carnieletto, L.; Zarrella, A. An all-in-one machine coupled with a horizontal ground heat exchanger for the air-conditioning of a residential building. Build. Environ. 2022, 207, 108558. [Google Scholar] [CrossRef]
- Poirier, B.; Guyot, G.; Woloszyn, M. Uncertainty quantification: For an IAQ and energy performance assessment method for smart ventilation strategies. Build. Environ. 2024, 266, 112115. [Google Scholar] [CrossRef]
- Qiu, S.; Che, Y.; Chang, Y.; Wang, Z.; Li, Z. Uncertainty quantification of exchange efficiency in membrane-based air-to-air energy exchanger cores: Repetitive manufacturing and experiments. Case Stud. Therm. Eng. 2024, 59, 104475. [Google Scholar] [CrossRef]
- Heo, S.; Nam, K.; Loy-Benitez, J.; Li, Q.; Lee, S.; Yoo, C. A deep reinforcement learning-based autonomous ventilation control system for smart indoor air quality management in a subway station. Energy Build. 2019, 202, 109440. [Google Scholar] [CrossRef]
- An, Y.; Niu, Z.; Chen, C. Smart control of window and air cleaner for mitigating indoor PM2.5 with reduced energy consumption based on deep reinforcement learning. Build. Environ. 2022, 224, 109583. [Google Scholar] [CrossRef]
- Zhang, W.; Wu, W.; Norford, L.; Li, N.; Malkawi, A. Model predictive control of short-term winter natural ventilation in a smart building using machine learning algorithms. J. Build. Eng. 2023, 73, 106602. [Google Scholar] [CrossRef]
- Chen, E.X.; Han, X.; Malkawi, A.; Zhang, R.; Li, N. Adaptive model predictive control with ensembled multi-time scale deep-learning models for smart control of natural ventilation. Build. Environ. 2023, 242, 110519. [Google Scholar] [CrossRef]
- Tarragona, J.; Gangolells, M.; Casals, M. Model predictive control for managing indoor air quality levels in buildings. Energy Rep. 2024, 12, 787–797. [Google Scholar] [CrossRef]
- Yu, L.; Sun, Y.; Xu, Z.; Shen, C.; Yue, D.; Jiang, T.; Guan, X. Multi-Agent Deep Reinforcement Learning for HVAC Control in Commercial Buildings. IEEE Trans. Smart Grid 2021, 12, 407–419. [Google Scholar] [CrossRef]
- Ren, C.; Cao, S. Implementation and visualization of artificial intelligent ventilation control system using fast prediction models and limited monitoring data. Sustain. Cities Soc. 2020, 52, 101860. [Google Scholar] [CrossRef]
- Sulaiman, M.H.; Mustaffa, Z. Using the evolutionary mating algorithm for optimizing the user comfort and energy consumption in smart building. J. Build. Eng. 2023, 76, 107139. [Google Scholar] [CrossRef]
- Seraj, M.; Parvez, M.; Khan, O.; Yahya, Z. Optimizing smart building energy management systems through industry 4.0: A response surface methodology approach. Green Technol. Sustain. 2024, 2, 100079. [Google Scholar] [CrossRef]
- Alshamrani, A.; Abbas, H.A.; Alkhayer, A.G.; Mausam, K.; Abdullah, S.I.; Alsehli, M.; Rajab, H.; Ahmed, M.; El-Shafay, A.; Kassim, M. Application of an AI-based optimal control framework in smart buildings using borehole thermal energy storage combined with wastewater heat recovery. J. Energy Storage 2024, 101, 113824. [Google Scholar] [CrossRef]
- Majdi, A.; Alrubaie, A.J.; Al-Wardy, A.H.; Baili, J.; Panchal, H. A novel method for Indoor Air Quality Control of Smart Homes using a Machine learning model. Adv. Eng. Softw. 2022, 173, 103253. [Google Scholar] [CrossRef]
- Zivelonghi, A.; Giuseppi, A. Smart Healthy Schools: An IoT-enabled concept for multi-room dynamic air quality control. Internet Things -Cyber-Phys. Syst. 2024, 4, 24–31. [Google Scholar] [CrossRef]
- Contrada, F.; Causone, F.; Allab, Y.; Kindinis, A. A new method for air exchange efficiency assessment including natural and mixed mode ventilation. Energy Build. 2022, 254, 111553. [Google Scholar] [CrossRef]
- ASHRAE Standard 129-1997 (RA 2002); Measuring Air Change Effectiveness. ASHRAE: Atlanta, GA, USA, 2002.
- Wang, T.; Verfaillie, J.; Szutu, D.; Baldocchi, D. Handily measuring sensible and latent heat exchanges at a bargain: A test of the variance-Bowen ratio approach. Agric. For. Meteorol. 2023, 333, 109399. [Google Scholar] [CrossRef]
- ISO 16000-26; Indoor Air—Standard Method for Testing the Performance of Sensors for the Determination of Gaseous Pollutants. Provides Procedures for Calibration and Validation of Indoor Air Quality Sensors. International Organization for Standardization (ISO): Geneva, Switzerland, 2023.
- United States Environmental Protection Agency. Performance Targets for Air Quality Sensors: Evaluation and Calibration Protocols; Technical Report; Establishes Reference Criteria for Sensor Performance and Validation; EPA Office of Research and Development: Washington, DC, USA, 2023.
- U.S. Environmental Protection Agency (EPA). Air Sensor Performance Targets; EPA: Washington, DC, USA, 2023.
- Gendebien, S.; Parthoens, A.; Lemort, V. Investigation of a single room ventilation heat recovery exchanger under frosting conditions: Modeling, experimental validation and operating strategies evaluation. Energy Build. 2019, 186, 1–16. [Google Scholar] [CrossRef]
- He, H.; Zhou, X.; Lyu, N.; Wang, F.; Liang, C.; Zhang, X. Enhancing heat-exchanger performance in frost conditions via superhydrophobic surface modification. Appl. Therm. Eng. 2024, 246, 122914. [Google Scholar] [CrossRef]
- Simonetti, M.; Fracastoro, G.V.; Chiesa, G.; Sola, S. Numerical optimization and experimental testing of a new low pressure heat exchanger (LoPHEx) for passive ventilation of buildings. Appl. Therm. Eng. 2016, 103, 720–729. [Google Scholar] [CrossRef]
- Ma, X.; Ouyang, Z.; Wang, Y.; Liang, S.; Xiong, J.; Wang, Z.; Cheng, H.; Yang, J.; Zheng, H. Design and performance analysis on a breathing-type instant heat recovery module for fresh air ventilation. Energy Build. 2024, 310, 114107. [Google Scholar] [CrossRef]
- Mustafaoğlu, M.; Aksuoğlu, O.K.; Kotcioğlu, İ.; Güneş, Ü.; Yeşilyurt, M.K.; Elaty, A.A. Experimental and numerical investigation of flow and heat transfer in lancet-type-finned cross-flow heat exchangers. Int. Commun. Heat Mass Transf. 2024, 159, 108017. [Google Scholar] [CrossRef]
- Martinaitis, V.; Streckienė, G.; Biekša, D.; Bielskus, J. The exergy efficiency assessment of heat recovery exchanger for air handling units, using a state property—Coenthalpy. Appl. Therm. Eng. 2016, 108, 388–397. [Google Scholar] [CrossRef]
- Mankibi, M.E.; Stathopoulos, N.; Rezaï, N.; Zoubir, A. Optimization of an Air-PCM heat exchanger and elaboration of peak power reduction strategies. Energy Build. 2015, 106, 74–86. [Google Scholar] [CrossRef]
- Ilyunin, O.; Bezsonov, O.; Rudenko, S.; Serdiuk, N.; Udovenko, S.; Kapustenko, P.; Plankovskyy, S.; Arsenyeva, O. The neural network approach for estimation of heat transfer coefficient in heat exchangers considering the fouling formation dynamic. Therm. Sci. Eng. Prog. 2024, 51, 102615. [Google Scholar] [CrossRef]
- Hollmuller, P.; Lachal, B. Air–soil heat exchangers for heating and cooling of buildings: Design guidelines, potentials and constraints, system integration and global energy balance. Appl. Energy 2014, 119, 476–487. [Google Scholar] [CrossRef]
- Tittelein, P.; Achard, G.; Wurtz, E. Modelling earth-to-air heat exchanger behaviour with the convolutive response factors method. Appl. Energy 2009, 86, 1683–1691. [Google Scholar] [CrossRef]
- Yu, W.; Zhou, Y.; Li, Z.; Zhu, D.; Wang, L.; Lei, Q.; Wu, C.; Xie, H.; Li, Y. When thermochromic material meets shape memory alloy: A new smart window integrating thermal storage, temperature regulation, and ventilation. Appl. Energy 2024, 372, 123821. [Google Scholar] [CrossRef]
- Li, W.; Tao, T.; Xu, J.; Chen, Z. Thermal performance of thermochromic smart windows in different indoor environments. Energy Build. 2024, 324, 114941. [Google Scholar] [CrossRef]
- Gloriant, F.; Tittelein, P.; Joulin, A.; Lassue, S. Study of the Performances of A Supply-Air Window for Air Renewal Pre-Heating. Energy Procedia 2015, 78, 525–530. [Google Scholar] [CrossRef]
- Vaz, J.; Sattler, M.A.; Dos Santos, E.D.; Isoldi, L.A. Experimental and numerical analysis of an earth–air heat exchanger. Energy Build. 2011, 43, 2476–2482. [Google Scholar] [CrossRef]
- Vaz, J.; Sattler, M.A.; Brum, R.D.S.; Dos Santos, E.D.; Isoldi, L.A. An experimental study on the use of Earth-Air Heat Exchangers (EAHE). Energy Build. 2014, 72, 122–131. [Google Scholar] [CrossRef]
- Cuny, M.; Lapertot, A.; Lin, J.; Kadoch, B.; Le Metayer, O. Multi-criteria optimization of an earth-air heat exchanger for different French climates. Renew. Energy 2020, 157, 342–352. [Google Scholar] [CrossRef]
- Diedrich, C.H.; Santos, G.H.D.; Carraro, G.C.; Dimbarre, V.V.; Alves, T.A. Numerical and Experimental Analysis of an Earth–Air Heat Exchanger. Atmosphere 2023, 14, 1113. [Google Scholar] [CrossRef]
- Nemati, N.; Omidvar, A.; Rosti, B. Performance evaluation of a novel hybrid cooling system combining indirect evaporative cooler and earth-air heat exchanger. Energy 2021, 215, 119216. [Google Scholar] [CrossRef]
- Singhal, S.; Kumar Yadav, A.; Prakash, R. Thermal performance and economic analysis of saw-tooth and photo-voltaic roof type greenhouse integrated with Earth air heat exchanger. Sol. Energy 2024, 283, 113035. [Google Scholar] [CrossRef]
- Lapertot, A.; Cuny, M.; Kadoch, B.; Le Métayer, O. Optimization of an earth-air heat exchanger combined with a heat recovery ventilation for residential building needs. Energy Build. 2021, 235, 110702. [Google Scholar] [CrossRef]
- Lekhal, M.C.; Benzaama, M.H.; Kindinis, A.; Mokhtari, A.M.; Belarbi, R. Effect of geo-climatic conditions and pipe material on heating performance of earth-air heat exchangers. Renew. Energy 2021, 163, 22–40. [Google Scholar] [CrossRef]
- Maury-Micolier, A.; Huang, L.; Taillandier, F.; Sonnemann, G.; Jolliet, O. A life cycle approach to indoor air quality in designing sustainable buildings: Human health impacts of three inner and outer insulations. Build. Environ. 2023, 230, 109994. [Google Scholar] [CrossRef]
- Gobinath, P.; Crawford, R.H.; Traverso, M.; Rismanchi, B. Comparing the life cycle costs of a traditional and a smart HVAC control system for Australian office buildings. J. Build. Eng. 2024, 91, 109686. [Google Scholar] [CrossRef]
- Hadjidemetriou, L.; Stylianidis, N.; Englezos, D.; Papadopoulos, P.; Eliades, D.; Timotheou, S.; Polycarpou, M.M.; Panayiotou, C. A digital twin architecture for real-time and offline high granularity analysis in smart buildings. Sustain. Cities Soc. 2023, 98, 104795. [Google Scholar] [CrossRef]
- Campodonico Avendano, I.A.; Heimar Andersen, K.; Erba, S.; Moazami, A.; Aghaei, M.; Najafi, B. A novel framework for assessing the smartness and the smart readiness level in highly electrified non-residential buildings: A Norwegian case study. Energy Build. 2024, 314, 114234. [Google Scholar] [CrossRef]
- Moeller, S. Is it a match? Smart home energy management technologies and user comfort practices in German multi-apartment buildings. Energy Res. Soc. Sci. 2024, 118, 103794. [Google Scholar] [CrossRef]
- Saini, J.; Dutta, M.; Marques, G. Smart indoor air quality monitoring for enhanced living environments and ambient assisted living. In Advances in Computers; Elsevier: Amsterdam, The Netherlands, 2024; Volume 133, pp. 99–125. [Google Scholar] [CrossRef]
- Run, K.; Cévaër, F.; Dubé, J.F. Does energy-efficient renovation positively impact thermal comfort and air quality in university buildings? J. Build. Eng. 2023, 78, 107507. [Google Scholar] [CrossRef]
- European Parliament and Council. Directive (EU) 2024/1275 of the European Parliament and of the Council on the Energy Performance of Buildings (Recast); European Union: Brussels, Belgium, 2024. [Google Scholar]
- Fazlikhani, F.; Goudarzi, H.; Solgi, E. Numerical analysis of the efficiency of earth to air heat exchange systems in cold and hot-arid climates. Energy Convers. Manag. 2017, 148, 78–89. [Google Scholar] [CrossRef]
- International Energy Agency. Electricity Market Report 2023; Technical Report; International Energy Agency: Paris, France, 2023. [Google Scholar]
- International Energy Agency. Energy Subsidies: Tracking the Impact of Fossil-Fuel Subsidies; Technical Report; International Energy Agency: Paris, France, 2022. [Google Scholar]
- World Bank. Electricity Prices: Global Database 2010–2023. World Development Indicators. 2023. Available online: https://databank.worldbank.org/source/world-development-indicators (accessed on 8 March 2025).
- Economidou, M.; Todeschi, V.; Bertoldi, P. Accelerating Energy Renovation Investments in Buildings: Financial and Fiscal Instruments Across the EU; Technical Report JRC117816; Publications Office of the European Union: Luxembourg, 2019. [Google Scholar]
- Rosenow, J.; Fawcett, T.; Eyre, N.; Oikonomou, V. Energy Efficiency and the Policy Mix. Build. Res. Inf. 2016, 44, 562–574. [Google Scholar] [CrossRef]
- Seraj, F.; van den Wymelenberg, K.; Liu, X.; El Ammari, K. Economic performance of heuristic optimization approaches for HVAC control in large buildings. Appl. Energy 2021, 284, 116287. [Google Scholar] [CrossRef]
- Rivas, I.; Querol, X.; Wright, J.; Sunyer, J.; Alvarez-Pedrerol, M. Ventilation rates in schools and their impact on indoor air quality and students’ performance. Build. Environ. 2018, 144, 674–684. [Google Scholar] [CrossRef]
- Hong, T.; D’Oca, S.; Taylor-Lange, S.C.; Turner, W.J.N.; Chen, Y. An ontology to represent energy-related occupant behavior in buildings. Build. Environ. 2016, 102, 269–281. [Google Scholar] [CrossRef]
- Santamouris, M.; Kolokotsa, D.; Fiorito, F.; Secinaro, A.; Patterson, M.; Mitoula, R. Passive and active cooling systems for buildings. Energy Build. 2017, 154, 74–94. [Google Scholar] [CrossRef]


Disclaimer/Publisher’s Note: The statements, opinions and data contained in all publications are solely those of the individual author(s) and contributor(s) and not of MDPI and/or the editor(s). MDPI and/or the editor(s) disclaim responsibility for any injury to people or property resulting from any ideas, methods, instructions or products referred to in the content. |
© 2025 by the authors. Licensee MDPI, Basel, Switzerland. This article is an open access article distributed under the terms and conditions of the Creative Commons Attribution (CC BY) license.