1. Introduction
In the context of rapid urbanization, the impact of the built environment on residents’ health has become a crucial topic in the fields of geography, urban planning, and public health. Health is not only influenced by individual physiological characteristics and behavioral habits but is also strongly constrained by the structural features and spatial quality of the residential environment [
1]. According to the World Health Organization, the core of a healthy city lies in promoting residents’ physical and mental well-being through rational spatial planning and the equitable provision of public services [
2]. With the implementation of the “Healthy China 2030” strategy, investigating the influence patterns of built community environment characteristics on residents’ health holds significant theoretical and practical implications for achieving sustainable urban development and improving public health governance [
3]. Although a growing body of research has examined the built environment–health relationship from multiple perspectives, existing studies remain fragmented in terms of analytical scale, data integration, and modeling approaches. In particular, many studies focus on either objective spatial indicators or subjective perceptions in isolation, and predominantly rely on linear statistical models, limiting a comprehensive understanding of how complex built environment characteristics jointly influence residents’ health. Therefore, there is a clear need for an integrated and interpretable analytical framework that combines subjective and objective environmental factors while capturing nonlinear effects.
Numerous studies have explored the complex impacts of the built environment on residents’ health from multiple perspectives, including spatial morphology [
4], functional structure [
5], and environmental perception [
6]. Overall, the built environment affects health outcomes through several mediating pathways, such as physical activity [
7], social interaction [
8], psychological experience [
9], and environmental exposure [
10]. Existing research has demonstrated that access to urban green spaces can mitigate the adverse effects of high-density development on mental health [
11], while the availability of green spaces moderates this relationship by alleviating the negative impacts of residential density [
12]. Communities characterized by strong street connectivity and high transport accessibility encourage social engagement, thereby reducing loneliness and psychological stress [
13]. Moreover, the accessibility and visual presence of green spaces significantly enhance mental well-being and subjective happiness [
14]. Additionally, the spatially balanced distribution of commercial services, recreational facilities, and healthcare resources is regarded as a crucial spatial guarantee for health equity [
15]. Collectively, these studies indicate that the structural attributes of the built environment not only shape residents’ behavioral opportunities and patterns of social interaction but also profoundly influence health perception and quality of life [
16,
17,
18].
Beyond the aforementioned material and spatial attributes, interdisciplinary studies have further highlighted that the visual and cognitive properties of the built environment influence mental health through subconscious processing pathways. Michael Mehaffy [
19], Alexandros Lavdas [
20], and Nikos Salingaros [
21,
22] have argued that spatial order, pattern languages, and human-scaled design contribute to emotional stability and psychological comfort. Research by Justin Hollander and Ann Sussman [
23,
24,
25,
26] indicates that public art, visual interest at the block scale, façade texture, and street-level environmental design can directly or indirectly shape human behavior and experiential responses. Richard P. Taylor [
27] demonstrated that fractals with moderate complexity exert significant effects on reducing visual stress, enhancing cognitive functioning, and promoting relaxation. According to Nir Buras [
28], automated fractal processing is fundamental to generating an immediate positive environmental impression, which, through continuous feedback loops, substantially improves walkability, navigational ease, and social interaction—ultimately exerting long-term benefits on residents’ health and well-being, such as stress reduction and fatigue relief. Studies by Cleo Valentine [
29,
30] further show that the visual experience of architecture can directly yield profound physiological health benefits. While these visual-cognitive perspectives broaden the theoretical boundaries of how the built environment affects health, the micro-scale data on which they rely—such as streetscape image analysis, eye-tracking measurements, and façade-texture extraction—do not align with the community-level analytical scale adopted in the present study. Therefore, this study focuses on quantifiable subjective perceptions and objective spatial characteristics as its core variables, while positioning visual-cognitive mechanisms as an important direction for future research that integrates micro-scale and multi-scale environmental analyses.
Despite the valuable insights provided by existing studies into the relationship between the built environment and health, several limitations remain. First, research integrating subjective perceptions with objective measures of the built environment is still limited. Many studies focus primarily on quantifying the built environment through objective indicators while neglecting differences in residents’ subjective experiences and cognitive perceptions [
31], making it difficult to fully uncover the complex interactions between environment and health. Second, traditional statistical models are largely based on linear assumptions, which fail to capture the nonlinear relationships, threshold effects, and interactions among environmental factors, potentially leading to an oversimplification of the observed environmental impacts [
32]. Moreover, built environment indicators often exhibit spatial multicollinearity and high-dimensional complexity, which increase the difficulty of model fitting and interpretation [
33]. Therefore, a key research direction lies in developing high-performance and interpretable modeling approaches that can elucidate the mechanisms through which the built environment influences health while comprehensively accounting for both subjective and objective factors.
Over the past few years, the application of machine learning methods in health geography and urban studies has provided new solutions to the challenges mentioned above. Ensemble learning models such as Random Forest (RF) [
34], Gradient Boosting Decision Tree (GBDT) [
35], and Extreme Gradient Boosting (XGBoost) [
36] have been widely applied in environmental health analysis due to their strengths in nonlinear modeling, high-dimensional data processing, and feature importance identification [
37,
38]. In particular, the XGBoost model achieves efficient iterative optimization by integrating multiple weak learners, offering a balance between predictive accuracy and model stability [
39,
40,
41,
42,
43]. With the rise of explainable artificial intelligence (XAI), the SHAP (SHapley Additive exPlanations) method—grounded in Shapley value theory—quantifies the marginal contribution and direction of influence of each variable within a model, thereby addressing the “black-box” problem of traditional machine learning approaches [
44,
45,
46] and providing a novel tool for understanding interactions among variables in complex systems.
Based on this, the present study focuses on the central urban area of Wuhan and integrates questionnaire surveys with multi-source geographic information data to construct a comprehensive set of subjective and objective built environment indicators. The XGBoost model is employed to achieve nonlinear fitting and prediction of residents’ self-rated health, while the SHAP algorithm is applied to reveal the importance, directional influence, and threshold effects of each variable. The study aims to: (1) quantitatively assess the relative influence of subjective and objective built environment characteristics on residents’ self-rated health; (2) uncover the nonlinear relationships and potential threshold effects of built environment variables; (3) analyze the local interactions among key environmental factors and their combined effects on health perception. By integrating machine learning with spatial analysis methods, this research seeks to theoretically advance a multidimensional understanding of the relationship between the built environment and health, and to provide practical scientific evidence for health-oriented community planning and urban renewal.
2. Materials and Methods
To systematically examine the influence of built community environment characteristics on residents’ self-rated health, this study was designed across three levels: data collection, variable construction, and model analysis. At the data level, residents’ health perceptions and the objective and subjective characteristics of the built community environment were obtained through a combination of questionnaire surveys and multi-source geospatial data, providing multidimensional data support for empirical analysis. At the indicator construction level, GIS spatial analysis and statistical modeling techniques were employed to extract, quantify, and standardize built environment elements, thereby establishing a comprehensive indicator system encompassing accessibility to transportation, land use mix, and availability of public service facilities. At the model analysis level, the XGBoost model was applied to nonlinearly fit and predict residents’ self-rated health. Furthermore, the SHAP algorithm was utilized for model interpretability analysis, revealing differences in the effects of objective and subjective built environment factors on residents’ health perceptions across spatial scales in terms of feature contributions, directional influences, and threshold effects.
2.1. Study Area Overview
This study focuses on the central urban area of Wuhan, China. Wuhan is a national central city and a key hub in the Yangtze River Economic Belt, characterized by a typical megacity form and a highly concentrated built environment. The central urban area comprises seven administrative districts—Jiang’an, Jianghan, Qiaokou, Hanyang, Wuchang, Qingshan, and Hongshan—which represent the most functionally dense and socially active parts of the city. In recent years, as the urban spatial structure has been continuously optimized and functions updated, significant spatial disparities have emerged within the central area in terms of land use intensity, transportation accessibility, and the provision of public service facilities, providing a representative context for exploring the complex relationships between the built environment and residents’ health.
Following principles of diversity in community type, spatial location, and population characteristics, 25 representative communities within the central urban area of Wuhan were selected as study samples (see
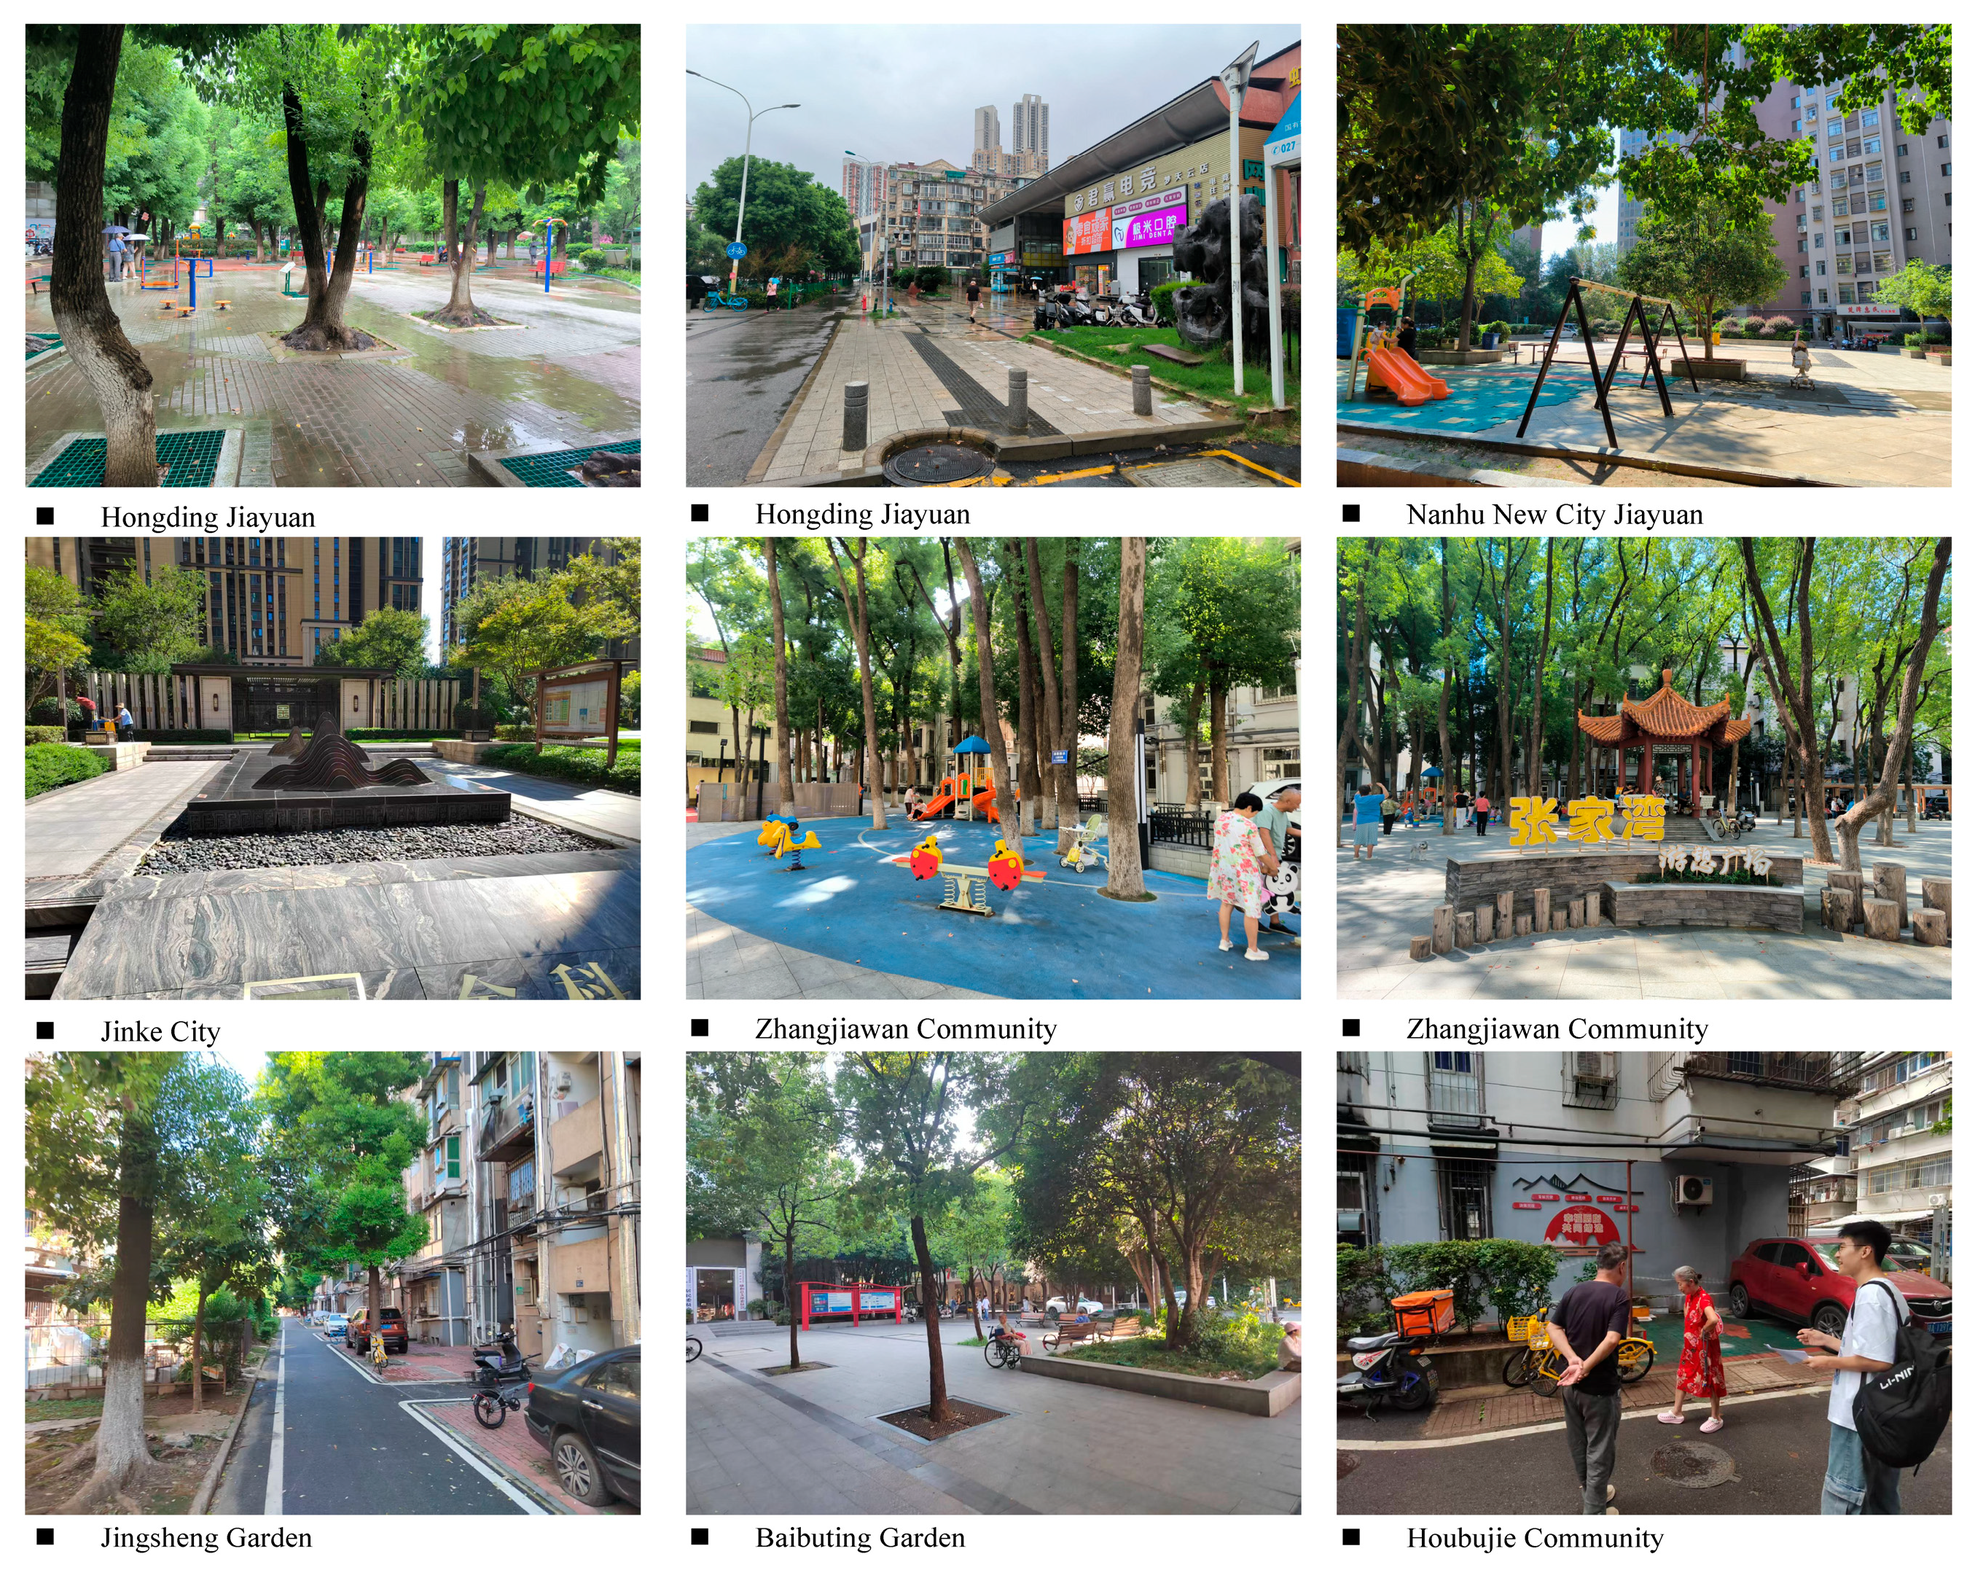
Figure 1). These communities include old residential neighborhoods, commercial housing estates, and affordable housing complexes, reflecting both the spatial characteristics of different stages of central area development and variations in built environment quality and socio-economic structure. Through systematic surveys and spatial measurements of these communities, a comprehensive understanding of the built environment characteristics and their influence on residents’ self-rated health in Wuhan’s central urban area can be achieved. To provide a more intuitive understanding of the built environment characteristics and everyday life in the selected communities, a collage of representative field photographs is presented in
Figure 2.
2.2. Data Sources
The data for this study primarily comprised questionnaire survey data and geospatial data. The survey was conducted in 2025 across 25 sampled communities in Wuhan, with the basic types, names, and definitions of these communities presented in
Table 1.
Considering the substantial variation in community types within the study area, irregular residents’ schedules, and the limited population of individual communities, a convenience sampling approach was employed. On-site surveys were conducted at fixed community locations with residents approached randomly, and questionnaires were additionally distributed at community party and service centers to ensure coverage of permanent residents aged 16 and above across different age groups and occupations.
A total of 300 questionnaires were distributed, and after data cleaning and logical consistency checks that removed invalid responses, 242 valid questionnaires were retained. Given that the primary objective of this study is to accurately uncover the nonlinear relationships between the built environment and health—rather than to conduct traditional parameter-based inference—multilevel modeling was not employed, and all observations were treated as independent. Although the sample size is relatively limited, it covers 25 communities, allowing the data to capture variations in health perception across different built-environment contexts at the community scale. This sampling scope is sufficient to support pattern recognition within the machine learning framework. Detailed descriptive statistics of the built-environment variables are provided in
Appendix A Table A1; the basic quantitative characteristics of the selected communities are summarized in
Appendix A Table A2.
To ensure data quality, all questionnaires were subjected to missing-value removal, logical consistency verification, and variable standardization after data entry, and were subsequently used for model training and interpretive analysis. Given the use of convenience sampling and the model’s emphasis on explaining built-environment and subjective-perception variables, this study is exploratory in nature. The findings primarily aim to uncover the associative structures and nonlinear relationships linking the built environment and subjective perceptions to residents’ health perception.
Objective built environment indicators were extracted at the community level, with a 1000 m buffer constructed around each sample point to define the spatial scope for analysis. This scale is widely used in built environment and health research to define the “walkable neighborhood,” encompassing the typical daily activity range within a 10–15 min walk for most residents. As this study aimed to provide a consistent and comparable structural characterization of overall built community environment features rather than precisely measuring individual travel paths, applying a uniform 1000 m spatial buffer ensured methodological consistency across different communities and avoided potential biases arising from variations in road network quality or topography. Spatial analysis tools, including ArcGIS 10.6 and Python 3.9.1, were employed to calculate various environmental indicators using buffer-based statistics, such as street intersection density, transportation station density, land use mix, number of recreational facilities, and distance to the nearest transit station, thereby quantitatively characterizing the structural features of the community’s built environment. The geospatial data were sourced from multiple geographic information databases, including road network data, Points of Interest (POI) data, land use data, and remote sensing imagery. Urban POI data were primarily obtained from the Amap platform, and ArcGIS 10.6 was used to extract facility distributions within each community and its buffer zone. Road network data were obtained from OpenStreetMap, supporting the calculation of street intersection density and transit accessibility. After georeferencing, vectorization, and spatial overlay processing, these multi-source spatial datasets provided high-precision built environment data to support subsequent quantitative analyses based on interpretable machine learning models.
2.3. Variable Description
In this study, residents’ self-rated health was treated as the dependent variable, while built environment characteristics served as independent variables, which were further categorized into objective built environment indicators and subjective perception indicators (
Table 2). Residents’ self-rated health was obtained through the questionnaire survey by asking, “Overall, how would you rate your health?” Responses were measured on a four-point Likert scale ranging from 1 (very poor) to 4 (very good). This variable reflects individuals’ subjective assessment of their own health and is widely used as a health measure in health geography and social epidemiology studies. The four-point scale was chosen for two main reasons: first, it provides sufficient granularity to capture variations in residents’ health perceptions while avoiding information loss due to overly coarse classification; second, compared to five- or seven-point scales, it reduces the use of neutral options, enhancing decisiveness and discrimination in responses, thereby improving data validity and comparability.
Objective built environment indicators were derived from GIS spatial analysis and POI data to describe the spatial structure and functional accessibility of communities. These indicators included street intersection density, transportation station density, land use mix, number of recreational facilities, and distance to the nearest transit station. Subjective built environment indicators were constructed based on residents’ perception data and were also measured using a four-point Likert scale (1 = very dissatisfied, 4 = very satisfied). These indicators captured residents’ satisfaction with community medical services, transportation convenience, cultural and recreational facilities, green spaces, and commercial service facilities. By integrating both objective and subjective dimensions of the built environment, a more comprehensive understanding of the community environment’s impact on residents’ self-rated health can be achieved.
2.4. Model Construction and Interpretability Analysis
To investigate the influence of built community environment characteristics on residents’ self-rated health, the XGBoost model was employed for nonlinear fitting and predictive analysis. XGBoost is an ensemble learning algorithm based on the gradient boosting framework, which iteratively trains multiple decision trees and combines them with weighted averaging to enhance predictive performance. Compared with traditional Random Forest or GBDT models, XGBoost offers clear advantages in computational efficiency, regularization control, and model interpretability. The model demonstrates stable performance when handling high-dimensional, multicollinear, and nonlinear variables, and it can automatically manage missing values and categorical variables, making it suitable for modeling complex urban environment and health data. The objective function of XGBoost consists of a loss function and a regularization term, balancing model fitting accuracy and complexity to prevent overfitting. Its general form can be expressed as:
In the formula, represents the prediction error term, and denotes the regularization term, which penalizes excessively complex tree structures.
During model training, to prevent overfitting of the XGBoost predictive model, the algorithm’s parameters were carefully tuned. The sample data were randomly split into training and testing sets based on their distribution (80% training, 20% testing). Five-fold cross-validation was employed to ensure model accuracy, while grid search was used to identify the optimal parameters. The model was trained for 200 iterations. The optimal parameters were set as follows: maximum tree depth = 7, minimum child weight = 1, minimum loss reduction = 0.1, subsample rate = 0.8, column sample rate = 0.8, and learning rate = 0.1, balancing predictive performance and computational efficiency.
To enhance the interpretability of the model results, the SHAP method was employed to explain the outputs of XGBoost. SHAP is based on the Shapley value principle from game theory, quantifying the marginal contribution of each feature to the model’s predictions, thereby characterizing feature importance and directional effects. Its mathematical expression is:
where
denotes the model prediction,
is the average baseline value, and
represents the SHAP value of the feature. Positive SHAP values indicate a positive contribution of the feature to increasing self-rated health, whereas negative SHAP values suggest an inhibitory effect on health perception. In combination with partial dependence plots, SHAP can reveal nonlinear relationships and potential threshold effects between built environment variables and residents’ health.
2.5. Model Validation and Accuracy Assessment
To assess the effectiveness of the XGBoost model in predicting residents’ self-rated health, it was compared with several other machine learning models, including LightGBM, Ridge regression, Support Vector Machine (SVM), Multilayer Perceptron (MLP), and Logistic Regression. Model performance was evaluated using Accuracy, Precision, Recall, and F1 score to comprehensively measure predictive capability. During model training, all models were applied to the same training and testing set split (80% training, 20% testing) with consistent parameter settings to ensure a fair comparison.
As shown in
Table 3, XGBoost exhibited excellent performance on the training set (Accuracy = 0.89, Precision = 0.94, Recall = 0.89, F1 = 0.91) and maintained a high level on the testing set (Accuracy = 0.80, Precision = 0.84, Recall = 0.80, F1 = 0.81), demonstrating strong generalization capability. Compared with other models, XGBoost clearly outperformed Ridge regression, SVM, MLP, and Logistic Regression on the testing set. Traditional regression and shallow neural network models showed relatively low F1 scores on the testing set, such as Ridge regression (0.58), SVM (0.65), MLP (0.52), and Logistic Regression (0.57), indicating limitations in handling high-dimensional, nonlinear, and multicollinear features between built community environment and residents’ self-rated health. LightGBM achieved an F1 score of 0.77 on the testing set, performing well but slightly below XGBoost. Considering the performance across both training and testing sets, XGBoost is capable of effectively modeling nonlinear relationships and high-dimensional features, while also demonstrating robustness to multicollinearity and missing values. The model training results are stable and highly reliable, making XGBoost suitable as the core model for analyzing the impact of built community environment on residents’ self-rated health in this study.
3. Results and Findings
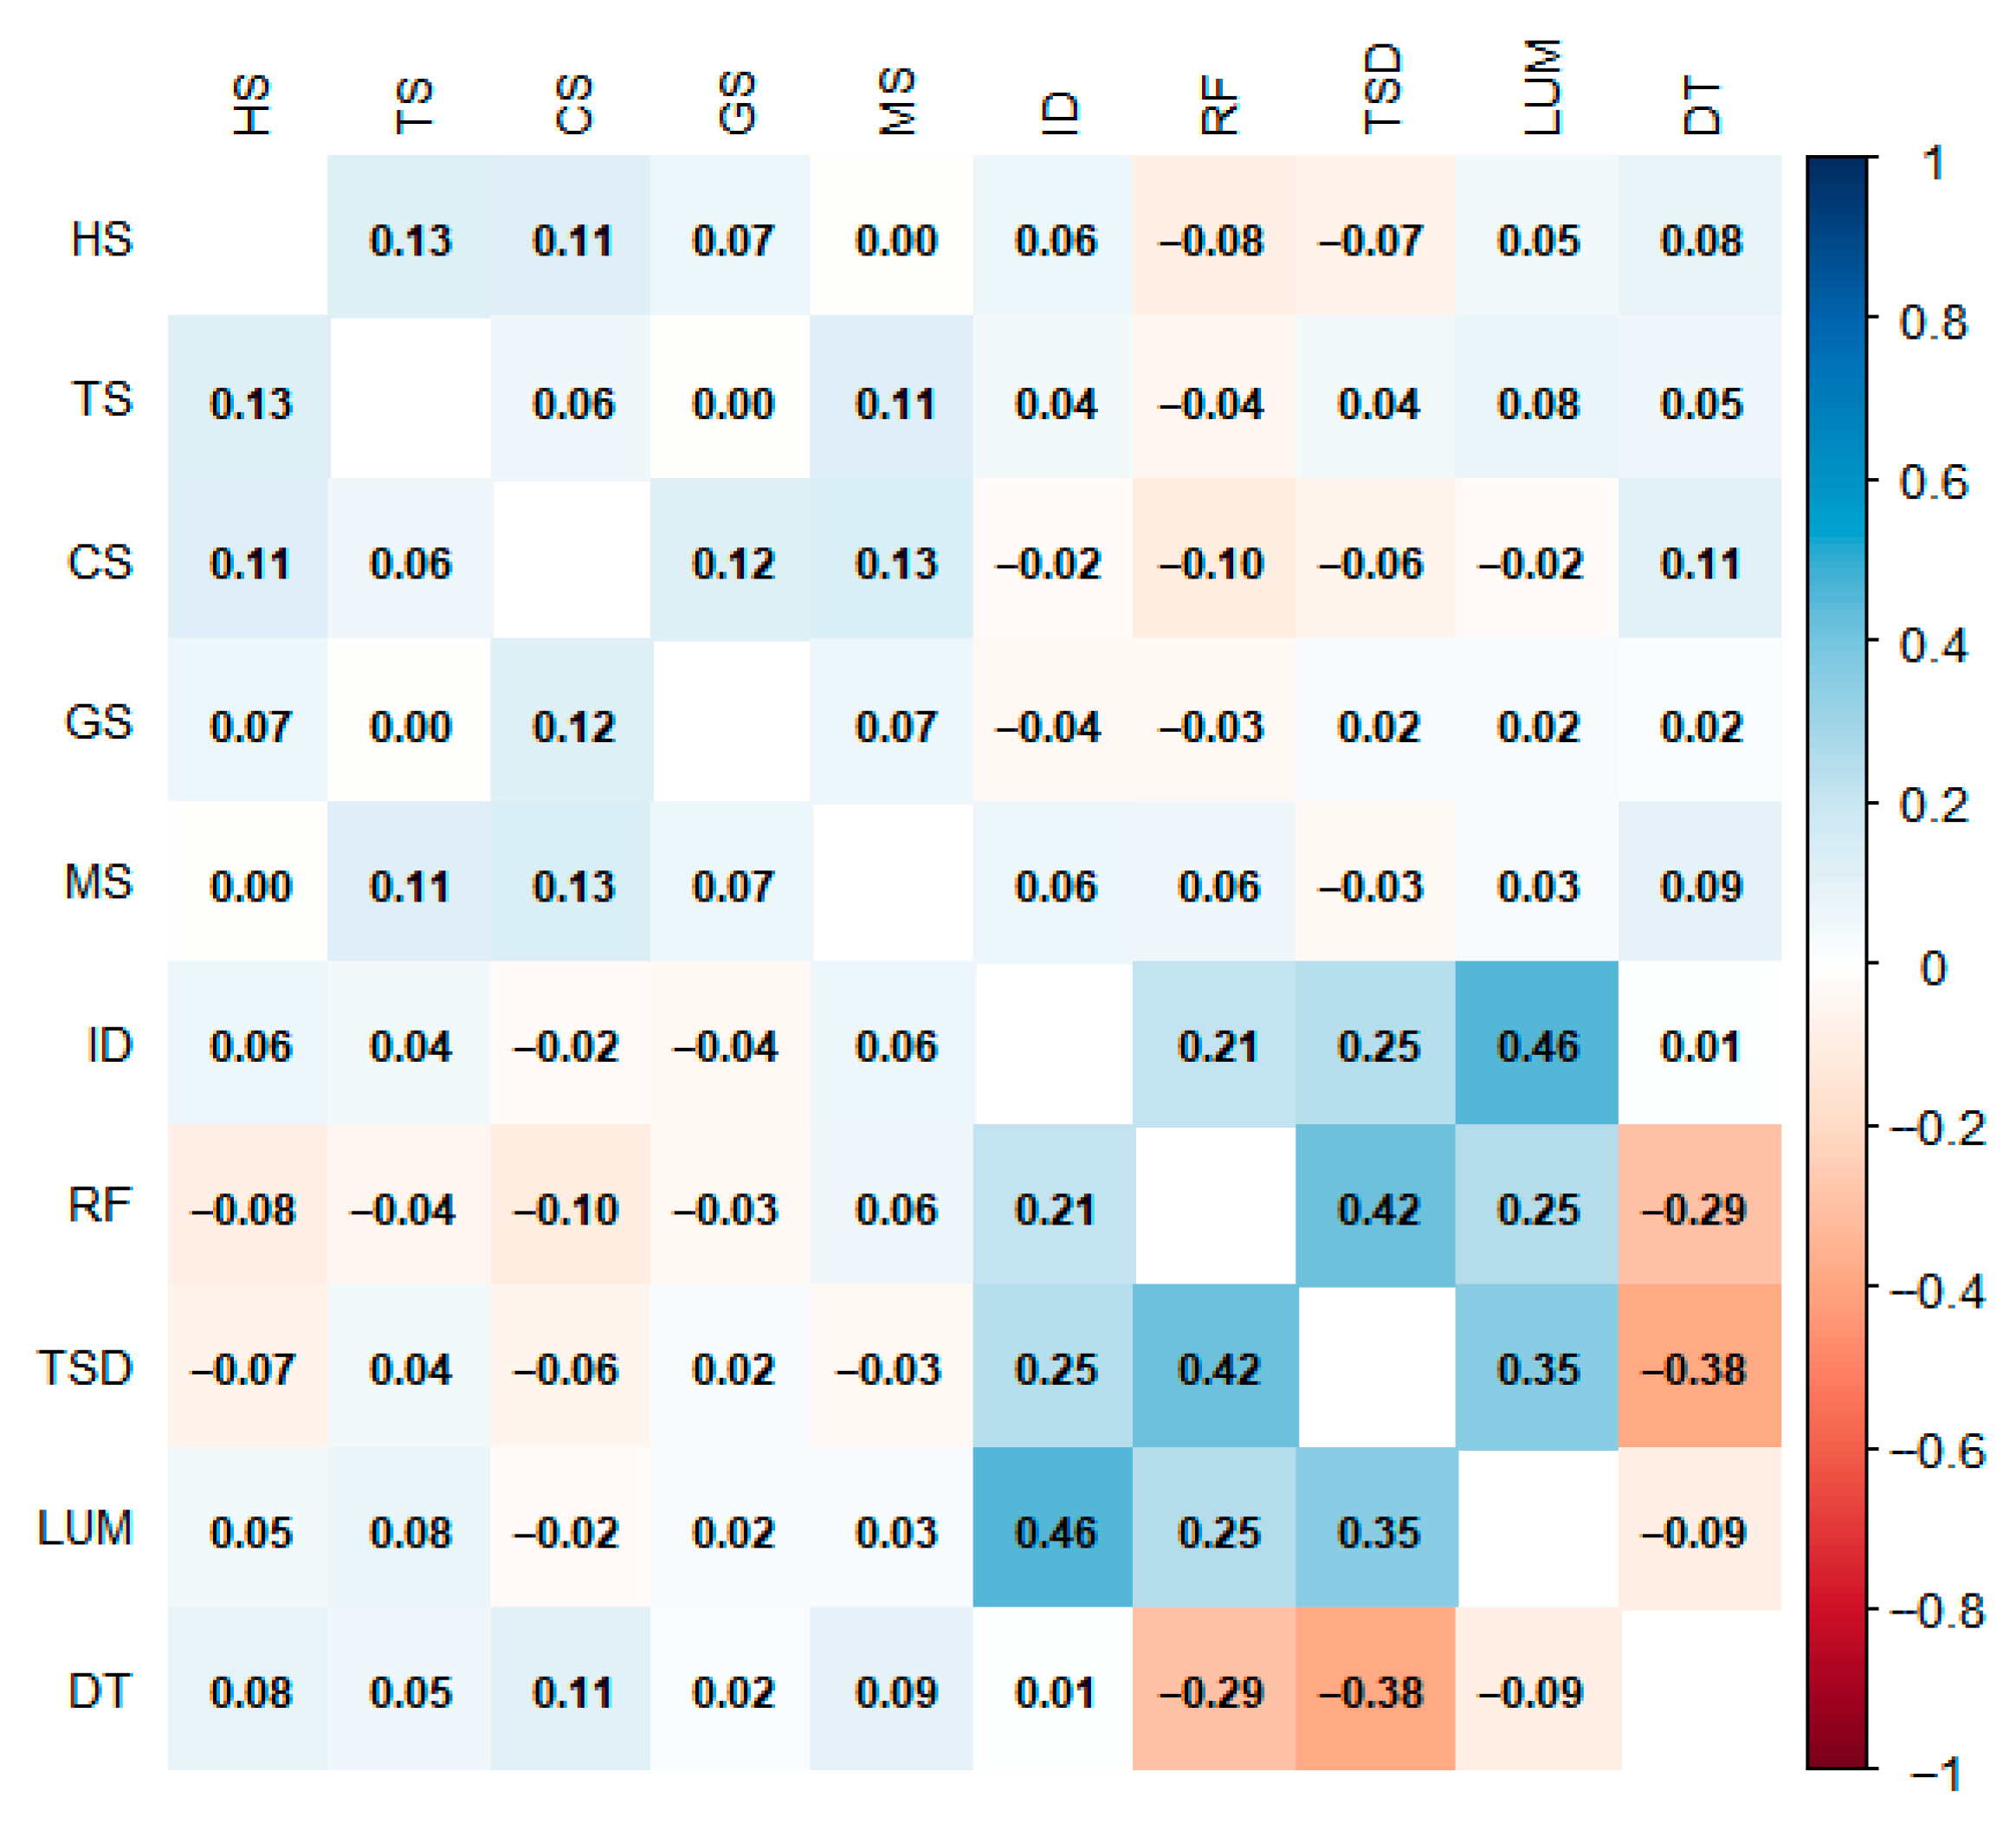
To examine potential multicollinearity among the explanatory variables, Pearson correlation analysis was conducted on subjective and objective built environment indicators (see
Figure 3). The results indicated that all correlation coefficients were well below the commonly accepted threshold of 0.7, suggesting the absence of severe multicollinearity. This implied that each variable represented a distinct dimension of the built environment, providing complementary rather than redundant information.
In addition to Pearson correlation analysis, variance inflation factor (VIF) tests were conducted to further assess multicollinearity in a multivariate context. The VIF values for all explanatory variables were below the conventional threshold of 5, indicating that multicollinearity was not severe and unlikely to bias model estimation. This result provides further support for retaining all subjective and objective built environment indicators in the subsequent analysis.
Furthermore, it should be noted that the XGBoost model employed in this study is relatively robust to multicollinearity due to its tree-based ensemble structure, which does not rely on linear parameter estimation. Therefore, even in the presence of moderate nonlinear dependencies or high-dimensional interactions, the potential impact of variable redundancy on model performance and interpretation is limited. Accordingly, all variables were retained for the XGBoost–SHAP analysis to comprehensively examine the associations between built environment characteristics and residents’ self-rated health.
3.1. Description of Resident Sample Characteristics
Table 4 presented the distribution of the sample’s basic socio-economic and residential characteristics. In terms of demographic features, the gender distribution was relatively balanced, with males accounting for 51.2% and females 48.8%. The age structure indicated that the 31–40, 41–50, and 51–60 age groups constituted the majority of the sample, representing 22.7%, 21.5%, and 24.4%, respectively, totaling 68.6%. Notably, residents aged 61 and above accounted for 11.6%, suggesting that the study population covered multiple life stages from middle adulthood to older age, thus reflecting health status across different lifecycle phases. Regarding education, the largest group had completed high school or vocational secondary school (30.6%), followed by those with a bachelor’s degree (24.0%) and an associate degree (17.4%), indicating an overall medium-to-high education level.
From a socio-economic perspective, retirees constituted the largest occupational group, accounting for 32.2%, which aligned with the sample’s age structure. Individual entrepreneurs and freelancers accounted for 9.5% and 7.4%, respectively, reflecting the diversity of employment types. Monthly income was primarily concentrated in the 2000–5000 CNY (31.4%) and 5000–10,000 CNY (24.4%) ranges, consistent with the sample’s educational attainment and occupational characteristics. Regarding housing, 54.5% of respondents owned one property, 14.0% owned multiple properties, and only 20.7% were renters, indicating a high overall homeownership rate, which may have positively influenced residents’ sense of community belonging and long-term health outcomes.
In terms of residential patterns and transportation characteristics, the sample demonstrated strong community stability. A total of 62.8% of respondents had lived in their current community for more than 10 years, with the 10–15 year group being the most concentrated (35.1%), providing a solid basis for observing cumulative health effects of the built environment. In terms of travelling by transport, 63.6% of respondents did not own a private car, a characteristic that may have been related to the high proportion of retired people in the sample, but also reflected the fact that the study area may have had better accessibility by public transport or was pedestrian friendly, all of which could have had an indirect effect on health by influencing the level of physical activity of the population. The sample was characterized by a predominance of middle-aged and older adults, moderate educational attainment, strong residential stability, high homeownership, and low vehicle ownership. In summary, the sample exhibited balanced distributions in terms of gender, age, education, occupation, and income, encompassing diverse social groups and residential types, and thus provided a reliable data foundation for examining the relationship between built community environment and residents’ self-rated health.
3.2. Influence of Subjective and Objective Built Environment on Self-Rated Health
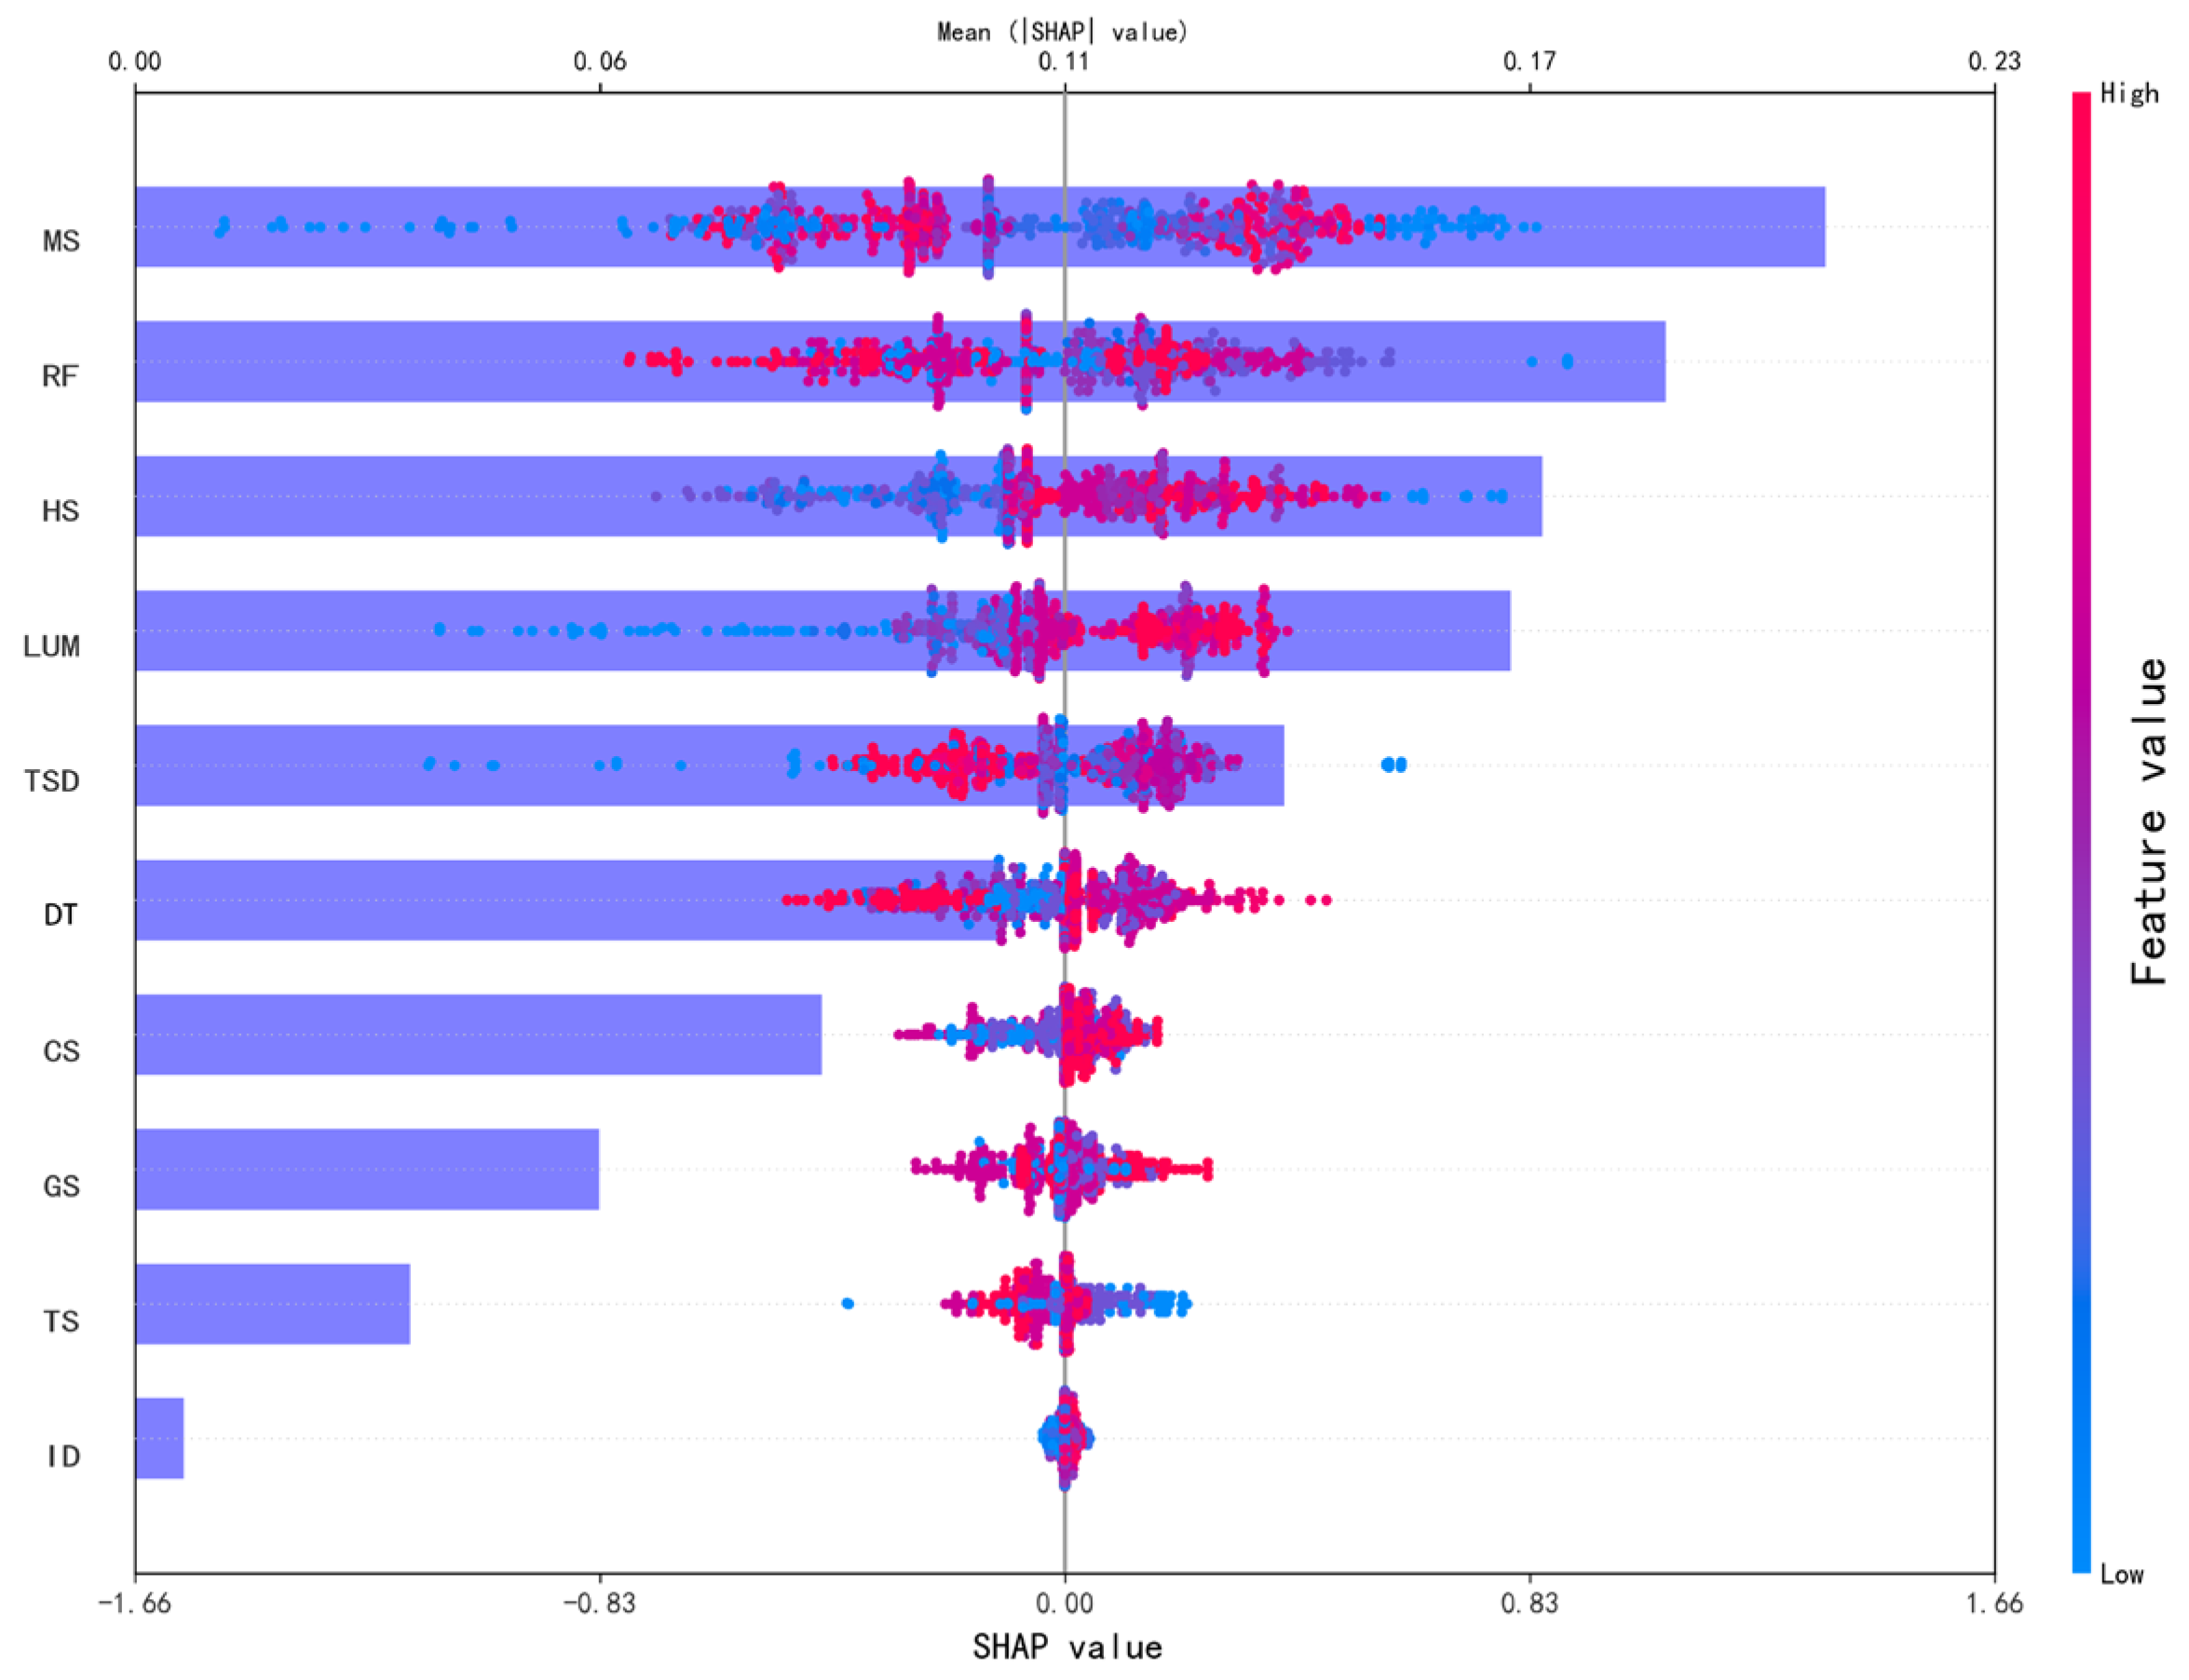
The explanatory model visualized the prediction results of the XGBoost model. By calculating the SHAP values of each variable,
Figure 4 presented the global importance ranking and the distribution of positive and negative associations for all explanatory variables. The horizontal axis represented the SHAP values, where positive values indicated that the corresponding feature contributed to improved self-rated health, whereas negative values reflected a suppressive effect. The color of each scatter point corresponded to the magnitude of the feature value, with red representing higher values and blue representing lower values.
In terms of overall variable importance, measured by mean absolute SHAP values, satisfaction with commercial services (MS) showed the highest contribution to the model’s prediction of self-rated health, ranking first among all explanatory variables. This highlighted the strong association between community life convenience and positive health experiences. Notably, objective built-environment indicators occupied a substantial proportion of the top-ranked variables, indicating that spatial structure and functional configuration of communities were closely related to residents’ health perceptions. Among these, RF was the second most important objective indicator. Measured by the number of parks, green spaces, and plazas within a 1 km radius of the community, RF exhibited relatively high SHAP values with a positive relationship (high-value red points concentrated on the positive axis), suggesting that higher accessibility of public recreational spaces corresponded with potential opportunities for leisure activities and psychological restoration, thereby reflecting a pronounced “green health effect”.
Following closely was subjective satisfaction with community healthcare services (HS), indicating, as shown in
Figure 4, that residents’ evaluations of healthcare accessibility and service quality were significant predictors of their health perceptions. Land use mix (LUM), another core objective environmental factor, exhibited a SHAP value distribution suggesting that communities with diverse functions and rich land-use types tended to be associated with better residents’ health perception. This finding aligned with the “accessibility–vitality” theory, which posits that diversified land use improves travel convenience and daily activity engagement, potentially promoting physical and mental well-being. Additionally, while the public transit station density (TSD) and satisfaction with transportation convenience (TS) differed in overall importance ranking, they displayed a consistent trend, suggesting that both objective and subjective transportation accessibility factors were jointly relevant to residents’ health perceptions. In contrast, the distance to the nearest transit station (DT) showed high values primarily in the negative region of the plot, indicating that greater distance was associated with lower self-rated health.
In summary, the SHAP model results revealed the multidimensional associations between the built environment and self-rated health. Commercial services, recreational green spaces, and healthcare services constituted the core factors contributing to the prediction of health. Notably, the distance to transit stations demonstrated a negative relationship. These findings highlighted that, in the context of healthy urban planning, it was not sufficient to focus solely on increasing the “quantity” of physical spaces such as green areas and transit nodes; equal attention needed to be given to enhancing the “quality” of service facilities and optimizing residents’ subjective experiences, thereby providing a basis for effective translation from environmental improvements to health promotion.
3.3. Nonlinear Relationships and Threshold Effects
To identify the nonlinear effects and potential threshold behaviors of built environment features on residents’ self-rated health, scatter plots at the variable level were generated based on the SHAP model results. This approach allowed for a clear visualization of the relationship between variable values and their contributions to the model output, facilitating the identification of complex nonlinear response patterns. To enhance trend identification, locally weighted scatterplot smoothing (LOWESS) curves were applied to highlight the variation in SHAP values across different variable ranges and to identify potential key inflection points or threshold intervals. A reference line at SHAP = 0 was included to more clearly delineate the critical points at which a variable’s influence shifts from negative to positive. This approach enables a systematic characterization of the nonlinear response of residents’ health perception to built environment factors, providing empirical support for understanding the health effects of community environment optimization.
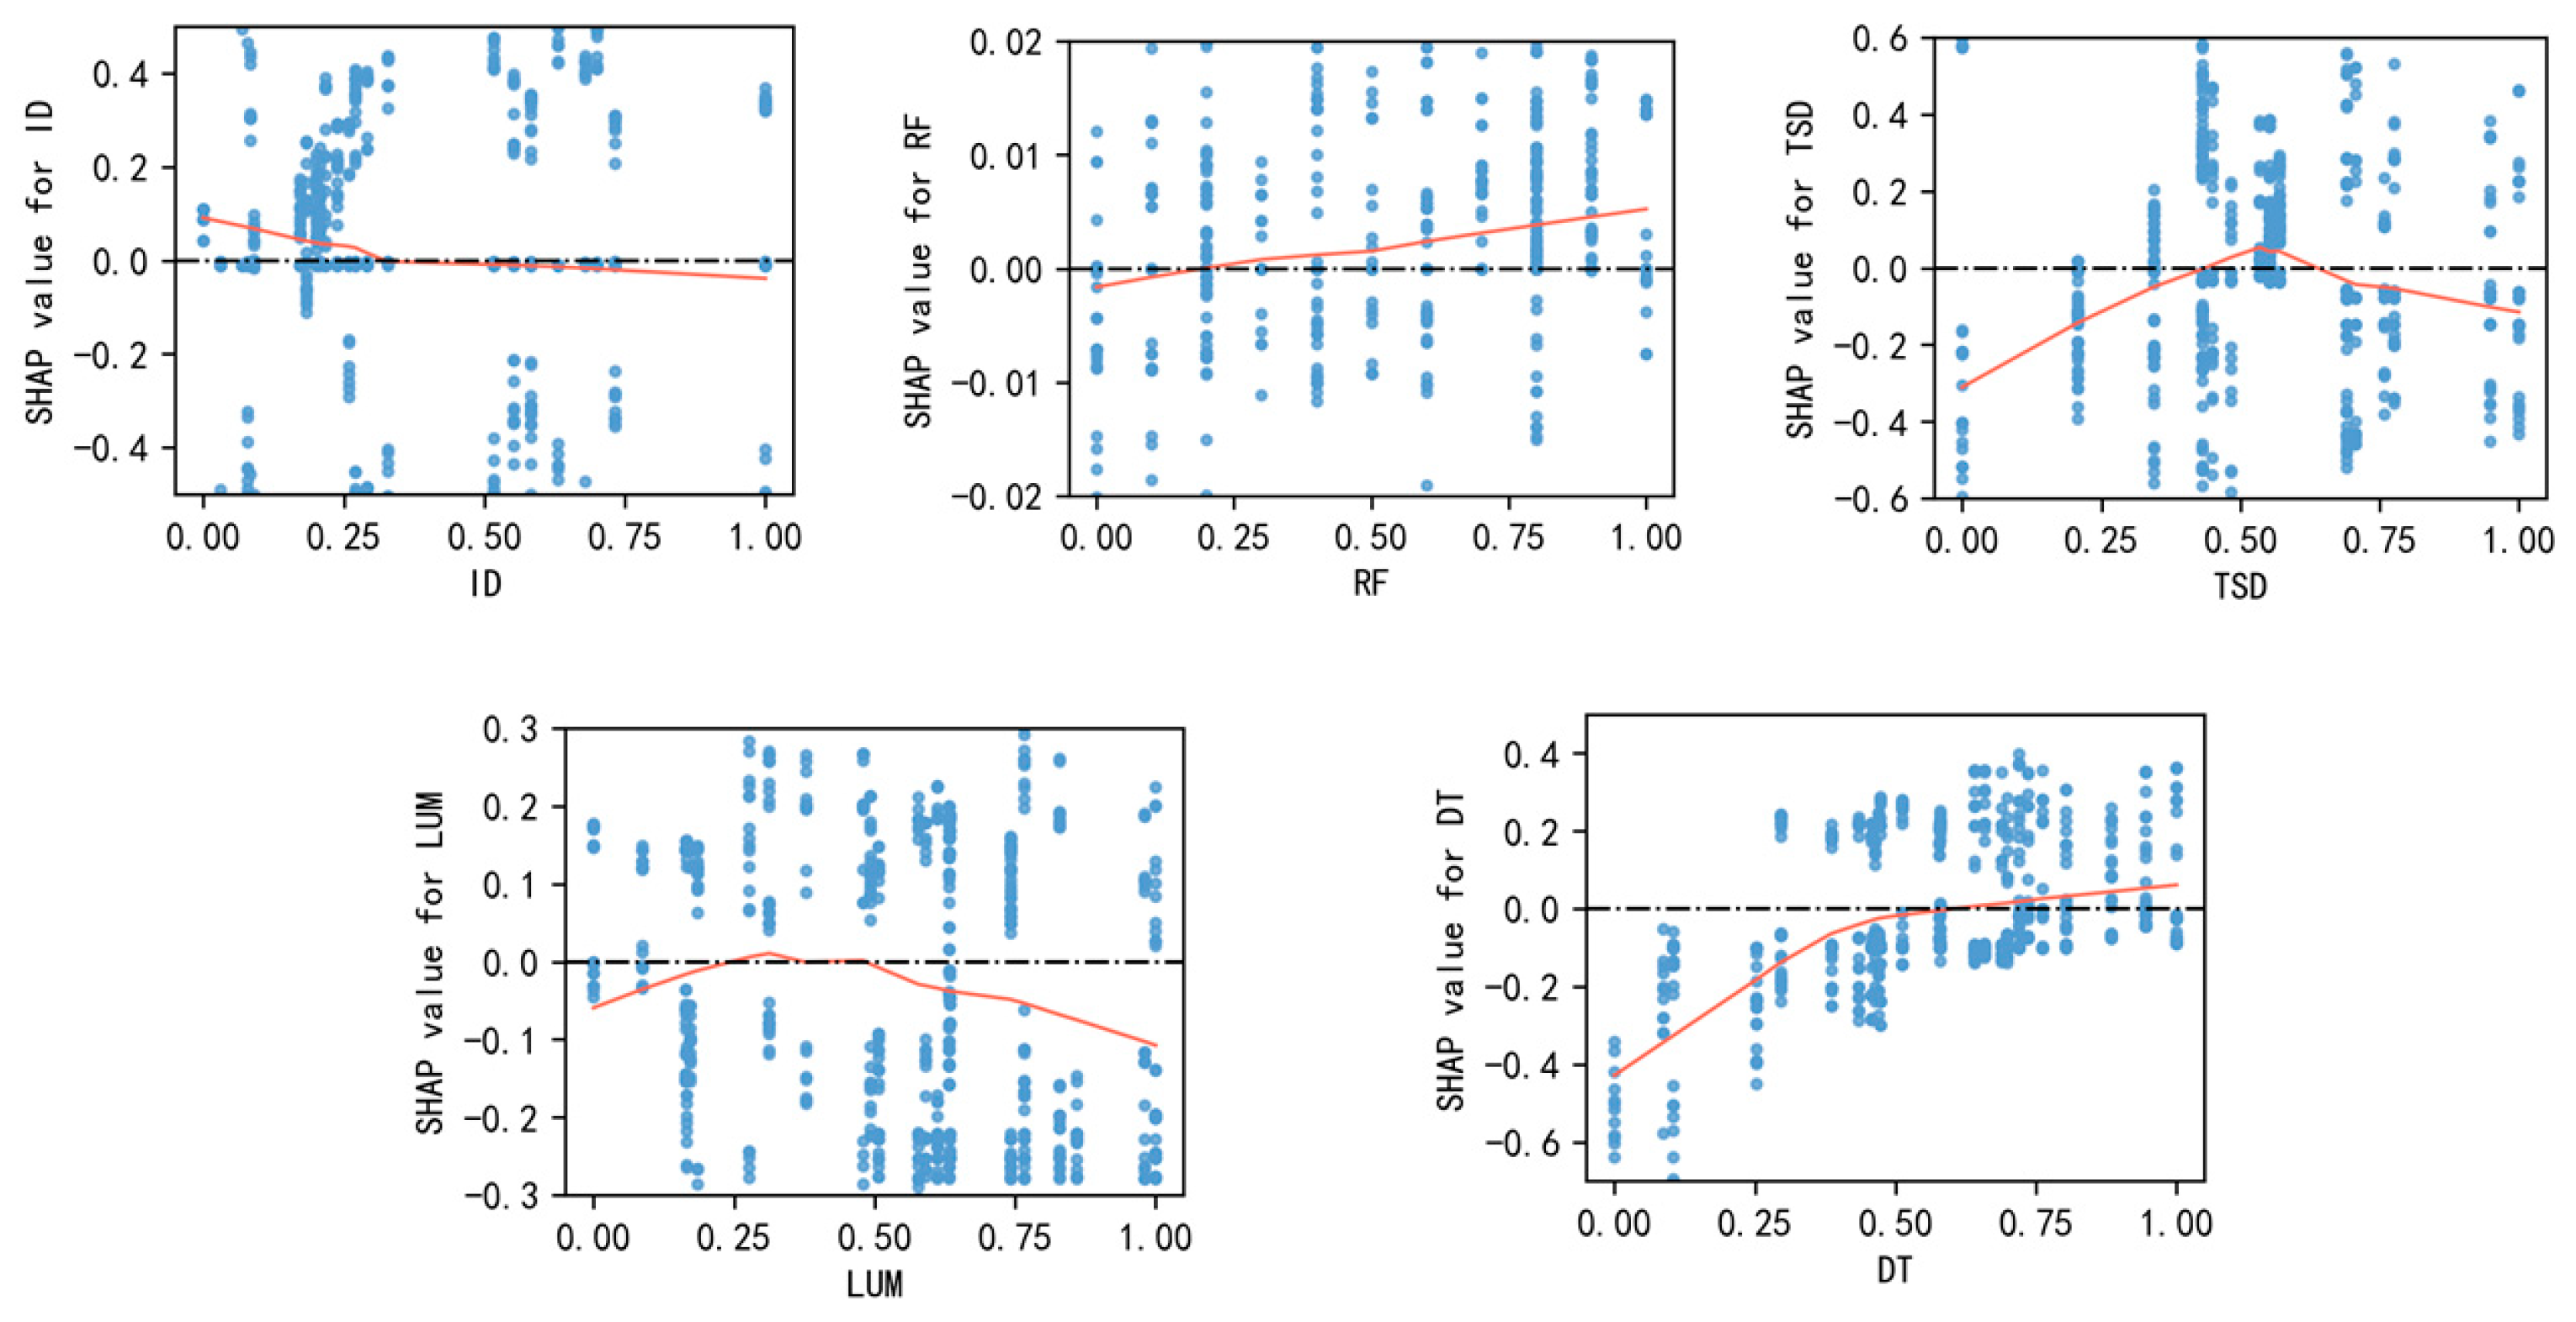
For the objective built environment variables shown in
Figure 5, Min–Max normalization was applied to enhance comparability across variables with different units, mapping their values to the 0–1 range. Consequently, the horizontal axis represented relative positions rather than the original physical quantities. In contrast, the subjective built environment variables in
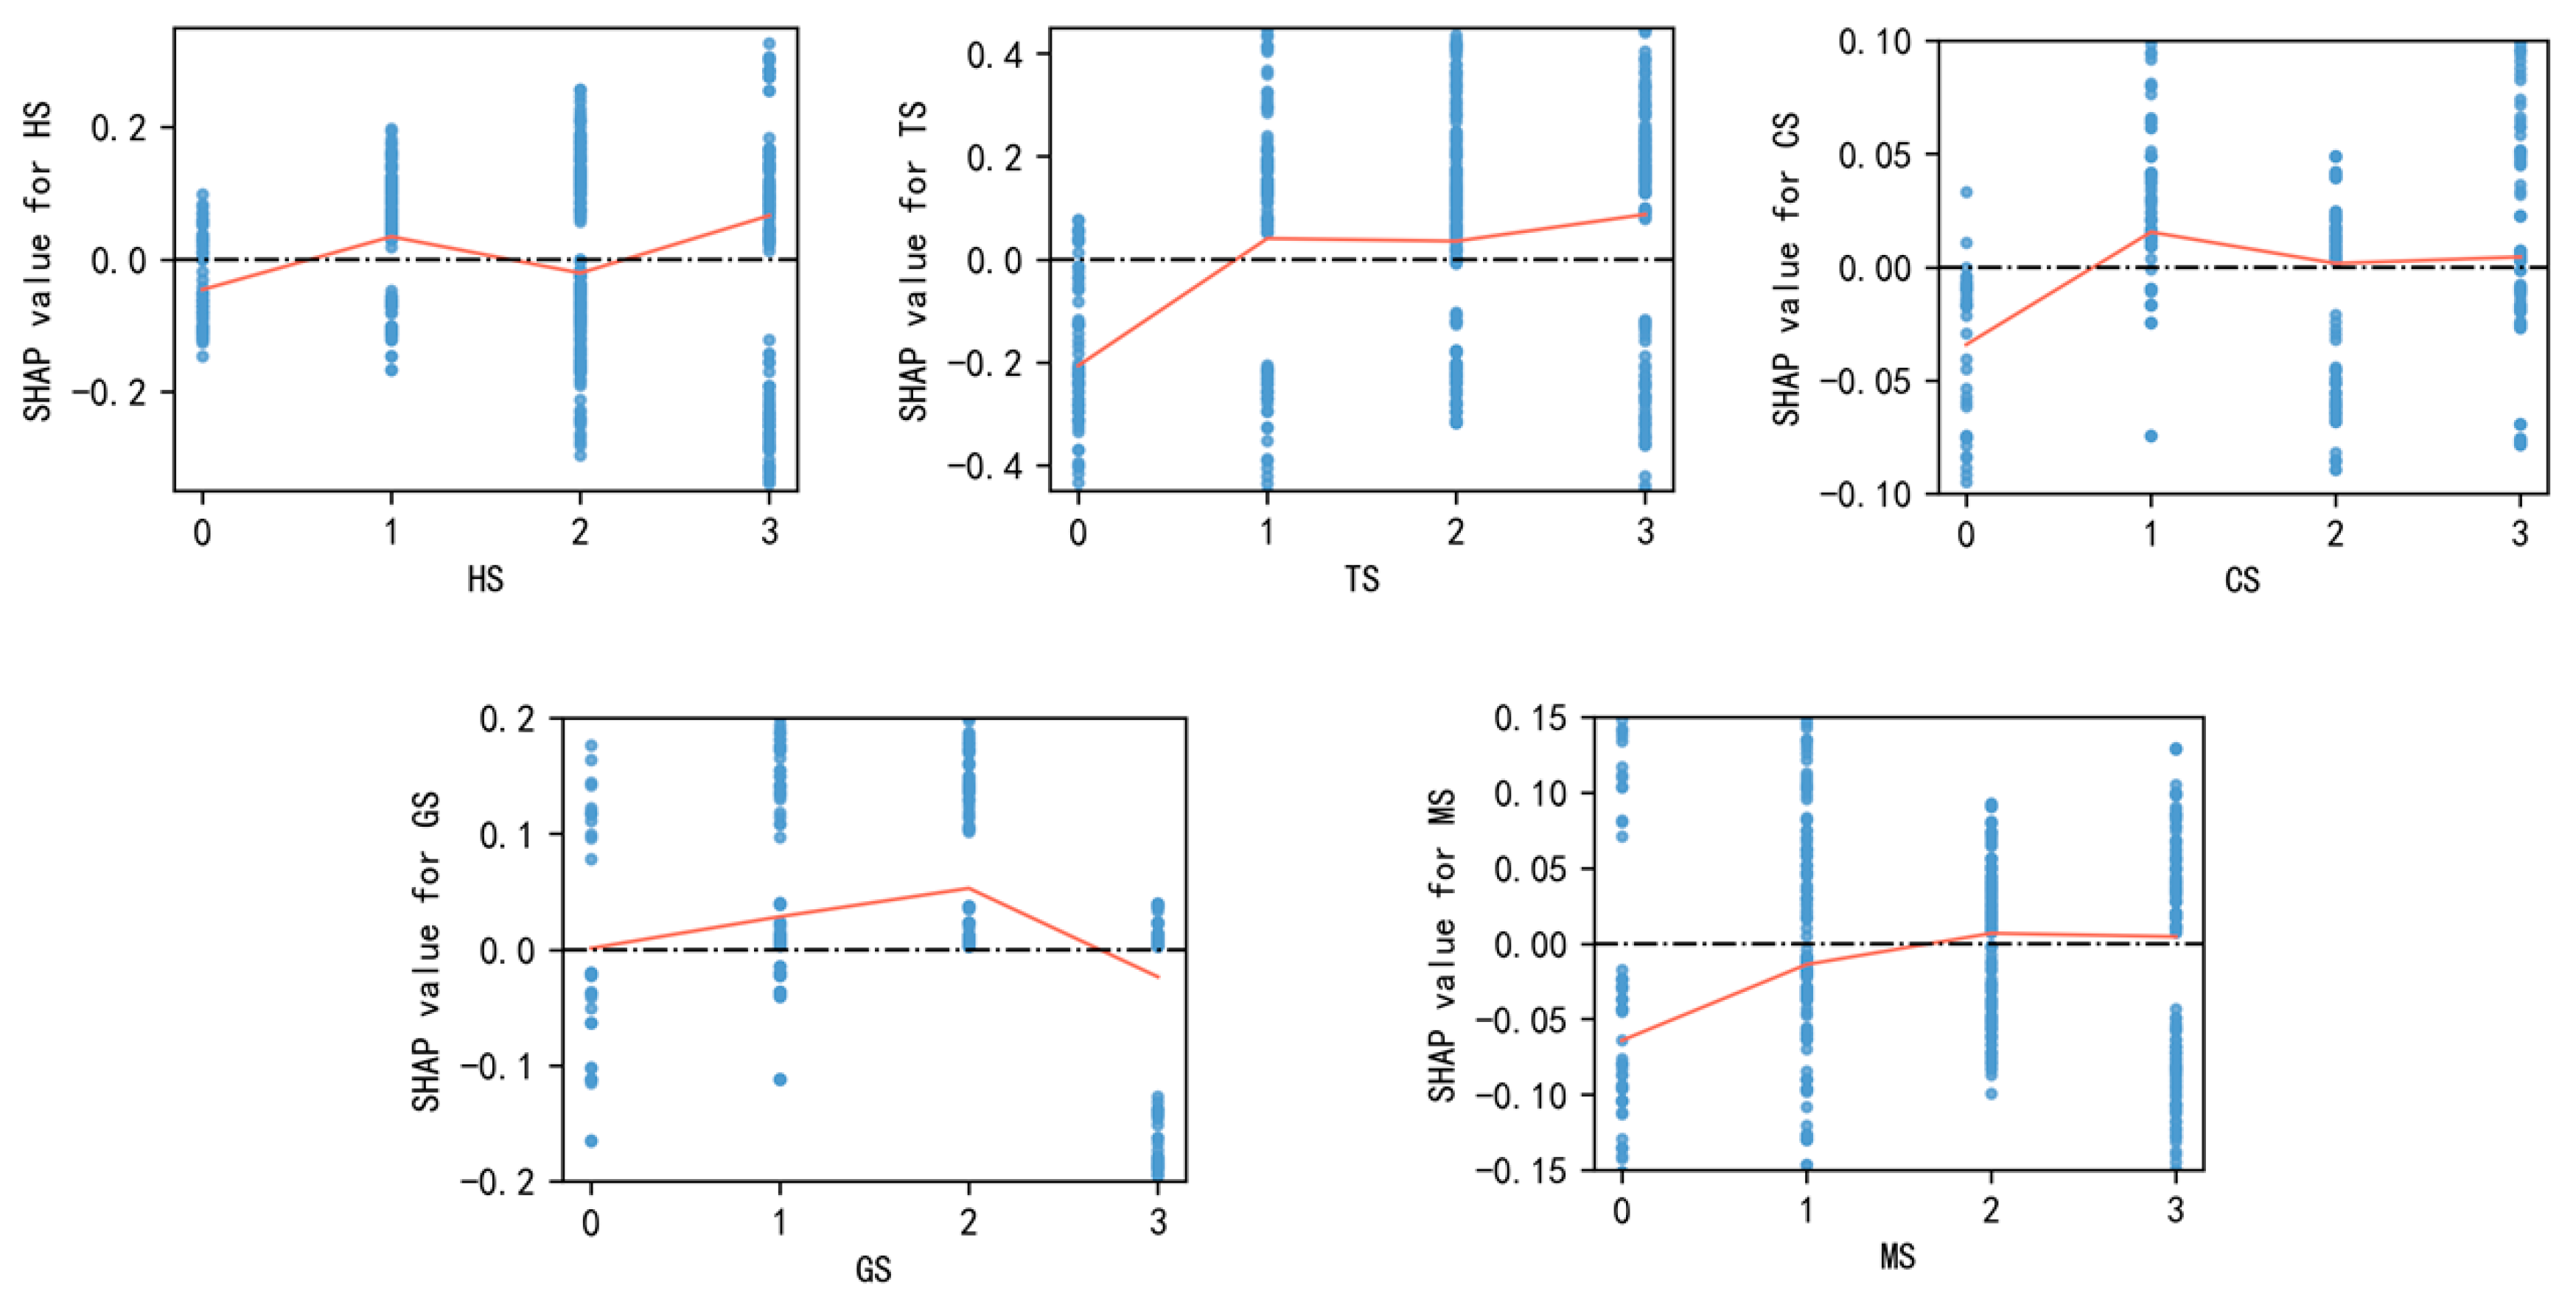
Figure 6 were derived from a questionnaire using a four-level satisfaction scale (0–3), corresponding to “very dissatisfied,” “dissatisfied,” “satisfied,” and “very satisfied”. As these variables were inherently ordinal with discrete levels and carried distinct semantic meaning, the original scale was retained in the SHAP analysis without normalization, resulting in a horizontal axis displaying discrete values of 0, 1, 2, and 3. Unlike continuous objective variables, these discrete ordinal variables appeared as four vertically aligned clusters of points in the SHAP scatter plots, with the LOWESS smoothing curve reflecting the average contribution of each satisfaction level to the predicted health outcome. In the scatter plots, the vertical axis represented the SHAP values of the corresponding variables, where positive and negative values indicated a promoting or inhibiting effect on predicted health, respectively, and the magnitude reflected the strength of the variable’s influence. Given that different variables contributed to the model to varying degrees, the vertical axis scales of the subplots were not standardized. Preserving the original ranges allowed for a more complete presentation of nonlinear trends and effect magnitudes, avoiding the attenuation of critical gradient features that could result from uniform scaling.
3.3.1. Objective Built Environment Variables
Based on the SHAP scatter plots shown in
Figure 5, objective built environment variables generally exhibited significant nonlinear relationships and threshold effects with residents’ self-rated health. Land use mix exhibited an inverted “U”-shaped relationship with residents’ self-rated health. When the land use mix fell within approximately 0.40–0.60, the LOWESS curve reached its peak, with positive SHAP values of maximum magnitude. When the value was below approximately 0.40 or above approximately 0.60, SHAP values declined markedly and trended toward negative. This indicated that overly concentrated or overly dispersed functional areas reduced daily life convenience and overall environmental livability. The number of recreational facilities (RF) displayed a significant positive correlation with health, and SHAP values continued to rise at medium-to-high levels (approximately above 0.5), suggesting that sufficient green space resources enhanced residents’ psychological recovery and physical activity, thereby improving health perception. Public transit station density (TSD) exhibited a slightly positive nonlinear relationship with self-rated health. At low transit density, perceived health was markedly lower; as density increased to approximately 0.45–0.55, the positive effect plateaued, indicating that moderate transit accessibility improved travel convenience, while excessively dense infrastructure introduced potential negative effects such as noise and congestion. Street intersection density (ID) showed a weak negative correlation with health, as the SHAP values remained slightly below zero across most of the value range, possibly reflecting the adverse impacts of traffic complexity and safety risks on health perception. Distance to the nearest transit station (DT) demonstrated a pronounced threshold effect; SHAP values increased sharply when the distance was below approximately 0.3, indicating that shorter walking distances significantly enhanced travel convenience and health perception, while beyond this threshold, the promoting effect stabilized and gradually declined.
In summary, the influence of objective built environment variables on residents’ health perception was not linearly incremental but exhibited an “optimal range” effect. Based on the inflection points of the LOWESS curves and the intersections where SHAP values transitioned from negative to positive, approximate threshold ranges for each variable were identified. Moderate land use mix, appropriate transit accessibility, and sufficient green space constituted constitute key conditions for shaping a health-friendly built community environment.
3.3.2. Subjective Built Environment Variables
As shown in
Figure 6, subjective perception variables generally exhibited a positive relationship between increasing satisfaction and enhanced health perception, although the response magnitudes and nonlinear patterns varied across variables. The positive effect of transportation convenience on health was the most pronounced. When satisfaction increased from 0 to 1, SHAP values rapidly shifted from negative to positive, indicating that improving transportation from “very dissatisfied” to “basic satisfaction” produced a substantial enhancement in health perception. Subsequent increases from 1 to 3 exhibited a slower rise, suggesting the presence of diminishing marginal returns. Transportation satisfaction (TS) demonstrated the clearest threshold effect: as satisfaction increased from 0 to 1, SHAP values showed a marked jump, indicating that even minimal improvements in perceived transportation quality significantly enhanced health perception. Beyond level 1, the marginal effect diminished, reflecting that the health-promoting impact was primarily concentrated during the transition from low to moderate satisfaction.
Community healthcare satisfaction (HS) and cultural/recreational facility satisfaction (CS) exhibited a relatively gradual upward trend. However, low satisfaction levels (0) generally corresponded to negative SHAP values, indicating that dissatisfaction with healthcare or recreational facilities weakened residents’ health perceptions. In the 2–3 range, SHAP values for both variables remained slightly positive, reflecting a sustained but limited health-promoting effect. Green space satisfaction (GS) displayed more pronounced nonlinear changes. SHAP values increased moderately as satisfaction rose from 0 to 1, peaking at level 2, which indicated that moderately satisfactory green space provision exerted the strongest positive effect on health perception. Beyond level 2, the trend slightly declined, suggesting that additional benefits of higher green space satisfaction were limited, reflecting mild diminishing returns. Commercial service satisfaction (MS) exhibited a relatively stable positive monotonic increase, with the most pronounced rise occurring from 0 to 1, highlighting the importance of basic commercial service availability for health perception. As satisfaction increased to levels 2–3, the positive effect gradually plateaued.
Overall, the nonlinear relationships observed in subjective perception variables indicate that residents’ health depends not only on the material conditions of the objective built environment but also on their subjective evaluations of environmental quality and service levels. Enhancing residents’ satisfaction with community services and facilities, particularly through foundational improvements in areas with low ratings, is likely to more effectively promote health perception.
3.4. Local Interaction Effects
To reveal the synergistic mechanisms between subjective and objective built environment variables, the interaction effects of all variable pairs were computed based on SHAP interaction values, and their distributions were visualized. To facilitate interpretation and highlight the main patterns,
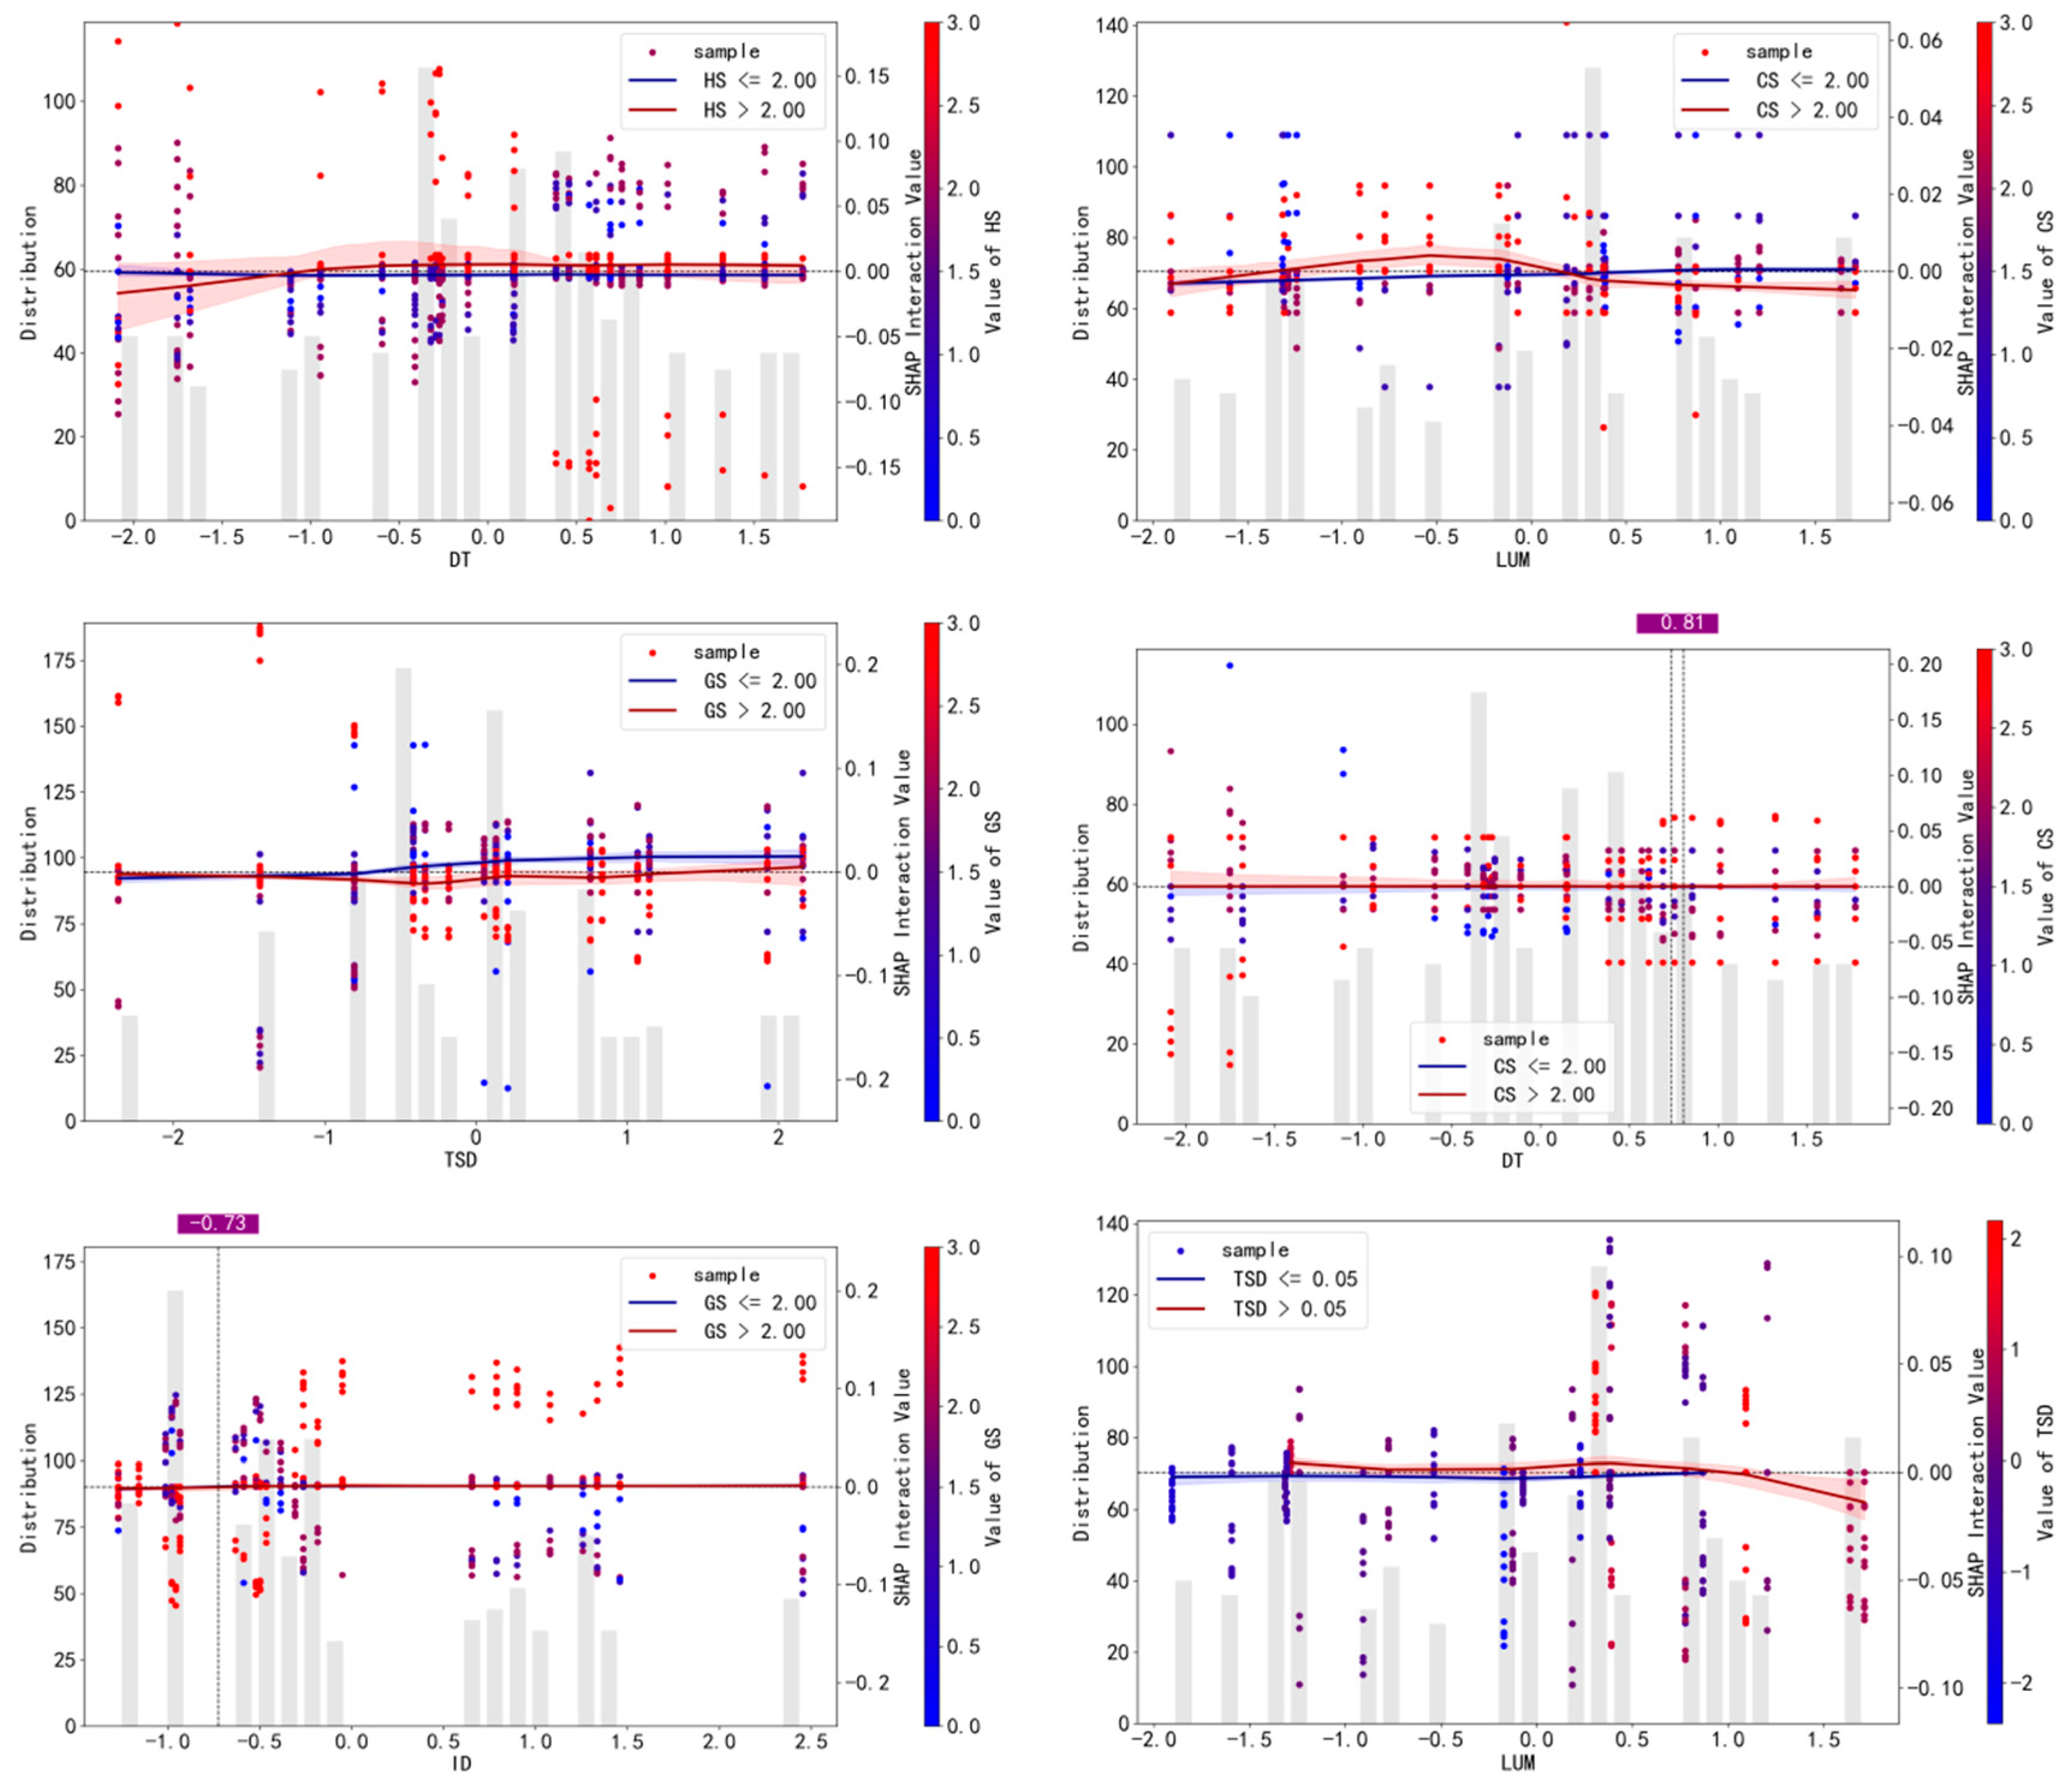
Figure 7 presents only those variable pairs with notable interaction effects and representative interaction patterns. The selection of variable pairs followed the principles of significance and readability: the mean interaction strength of each pair was calculated from the SHAP interaction value matrix, and the top six pairs were retained. This procedure ensured that the displayed interactions were statistically meaningful while avoiding excessive visual complexity.
Each subplot in
Figure 7 adopts the form of a SHAP dependence plot to illustrate the local interaction effects of variable pairs. Three key dimensions are represented: the X-axis denotes the actual value of the first variable in the pair; the Y-axis displays the SHAP interaction value, which indicates the marginal contribution of the pair to the model output (i.e., the predicted self-rated health); and the color of each point represents the value of the second variable, ranging from blue to red as its magnitude increases. By examining the stratified color patterns of the scatter points and the trend curves fitted using LOWESS, nonlinear coupling relationships between variables could be identified, and the response patterns of perceived health under different feature combinations could be captured.
Variables related to transportation accessibility exhibited notable compound effects. The interaction plot between distance to the nearest transit station (DT) and satisfaction with healthcare services (HS) showed that when residents expressed higher satisfaction with community healthcare, proximity to transit facilities exerted a stronger positive effect on self-rated health. Conversely, when healthcare services were perceived as less satisfactory, the positive impact of transportation accessibility on health perception became substantially weaker. This suggests an amplifying effect of the spatial coupling between transportation and healthcare resources in shaping health cognition, where favorable transport conditions enhance healthcare accessibility and strengthen residents’ sense of health attainment. The interaction between land use mix (LUM) and satisfaction with cultural and recreational facilities (CS) indicated that residents reported significantly higher self-rated health in communities with a high degree of land-use diversity and favorable evaluations of recreational amenities. This suggests that the health effects of LUM operate primarily through enhancing residents’ experiences with cultural and recreational facilities within the community. A highly mixed land-use pattern not only provides diverse activity venues but also improves accessibility and satisfaction with recreational facilities, thereby strengthening social interaction, elevating psychological well-being, and fostering positive health perceptions. The key mechanism lies in the fact that a high degree of land-use mix creates an enabling spatial environment that supports residents’ use of high-quality recreational amenities. A more mixed urban fabric allows cultural and recreational activities (as captured by CS) to be more easily integrated into residents’ daily activity chains—such as commuting, shopping, and leisure—substantially increasing the efficiency and frequency of facility use, and consequently amplifying the health-promoting effects of recreational resources.
Regarding the coupling between objective and subjective environments, the interaction effects of TSD–GS and ID–GS exhibited pronounced nonlinear characteristics. In
Figure 7, the overall TSD–GS interaction was relatively weak but showed distinct contextual differences: when TSD was at a low level, the interaction values for both high- and low-satisfaction samples were close to zero, indicating that under conditions of insufficient transit station density, the positive effect of green-space satisfaction on health was constrained by accessibility, limiting the realization of subjective experience. As TSD increased to medium or higher levels, the interaction values for high-GS samples rose accordingly, suggesting that the health-promoting effect of green-space experience depends on adequate transit accessibility; the subjective quality of green space manifests a true health impact only when it is sufficiently accessible.
In contrast, the ID–GS interaction emphasized the coordination between street network structure and green-space experience. When ID was low, the difference in interaction values between high- and low-GS samples was minimal, reflecting that in poorly connected street networks, the convenience and perceived safety of green-space use are limited, preventing subjective satisfaction from effectively translating into health benefits. As ID increased to a reasonable level of connectivity, the interaction values for high-GS samples gradually exceeded those of low-GS samples, indicating that well-connected street networks enhance green-space accessibility and usability, allowing residents’ satisfaction with green spaces to be more fully translated into health perception. Overall, these two sets of interaction effects illustrated the complementary role of objective and subjective environments in health outcomes: objective infrastructure determines whether residents can conveniently and safely access and use green spaces, while subjective perception reflects the quality of the actual experience; together, they jointly promote improvements in health perception.
The analysis of local interaction effects revealed the synergistic interplay between subjective and objective built-environment factors across different spatial scales. The integrated optimization of transportation, functional mix, and green-space elements can substantially enhance residents’ health perception, while the coupling between public services and environmental perception plays a key role in explaining individual health disparities. These findings emphasize that health-oriented community planning should prioritize coordinated layouts of transportation, ecological, and public service systems to achieve synergistic optimization of spatial structure and residents’ perception, thereby promoting a health-oriented urban planning transition.
4. Discussion
4.1. Comparison with Previous Studies
The findings of this study are generally consistent with existing research on the relationship between the built environment and residents’ health, while extending previous work in terms of modeling methods and explanatory pathways [
47,
48,
49]. Prior studies have widely indicated that built environment factors, such as transportation accessibility, green space distribution, and the density of public service facilities, indirectly influence health by affecting residents’ travel patterns, lifestyles, and psychological states [
50,
51,
52]. Compared with traditional regression models and shallow neural networks, XGBoost demonstrates superior predictive performance and stability, making the variable importance ranking and marginal effect analyses more reliable. By applying the XGBoost and SHAP methods, this study reveals the nonlinear influence patterns and threshold ranges of these environmental factors on self-rated health, indicating that the effects of the built environment on health are not simply linear accumulations but exhibit clear conditional and context-dependent characteristics. From a theoretical perspective, this finding complements existing research by refining the implicit linear or monotonic assumptions and emphasizing the relative advantages of “moderately accessible” and “functionally balanced” environments in shaping health perceptions.
Unlike previous studies that focused exclusively on objective spatial variables [
53], this study incorporates residents’ subjective perceptions into the analytical framework. Although subjective perceptions and self-rated health are both self-reported measures and may exhibit a certain degree of correlation, the nonlinear modeling results indicate that residents’ satisfaction retains substantial independent explanatory power even when multiple objective built environment variables are simultaneously included. In some cases, its importance ranking approaches or even exceeds that of several objective indicators. At the conceptual level, this result supports a more holistic interpretive pathway, suggesting that residents’ health perceptions are not determined solely by physical spatial conditions but emerge from the interaction between objective environmental attributes and everyday experiences and evaluations. Accordingly, subjective perception indicators should not be regarded as simple reflections of self-rated health but rather as measures capturing residents’ comprehensive assessments of environmental quality, thereby complementing aspects of lived experience that objective spatial indicators alone cannot fully represent.
Methodologically, traditional studies have largely relied on linear regression or structural equation models [
54], which, although capable of explaining general trends, struggle to capture complex interactions and nonlinear relationships among variables [
55,
56,
57]. This study applied interpretable machine learning models to achieve high-precision fitting of high-dimensional features, and employed SHAP values to visualize model outputs, providing a novel approach that balances predictive accuracy with interpretability for health geography research. Compared with regression-based results, the variable importance ranking and marginal contributions revealed in this study were more stable, particularly for transportation, land use mix, and recreational green space, which exhibited pronounced nonlinear boundary effects. This indicates that medium-level environmental factors, often overlooked in traditional models, may play critical roles under specific conditions, offering a more nuanced perspective for future research. Overall, by integrating subjective and objective indicators within a unified analytical framework and incorporating interpretable machine learning techniques, this study quantifies and verifies the nonlinear effects of the built environment on self-rated health. The findings provide robust and interpretable empirical support for existing theories in spatial health research and contribute to their refinement and validation. From an empirical perspective, this study serves primarily as a supplement and elaboration to prior findings rather than a fundamental revision of established conclusions.
4.2. Theoretical and Practical Implications
This study, adopting a dual perspective of subjective and objective built environments, systematically examined the complex relationships between community spatial characteristics and residents’ self-rated health, providing new empirical support and methodological insights for health geography and urban health research. At the theoretical level, the study reveals the nonlinear effects and potential threshold behaviors through which built-environment elements shape residents’ health perceptions, thereby overcoming the limitations of traditional linear models in interpreting complex urban systems. The findings indicate that residents’ health is influenced not only by direct effects of the objective built environment but also closely linked to their subjective perceptions of the community, demonstrating that health outcomes are the result of interactions between spatial attributes and psychological cognition. This discovery extends the research perspective on the “environment–health” relationship, emphasizing the need to incorporate individual perception into explanatory frameworks and advancing built environment research from unidimensional spatial analysis toward multidimensional cognitive-coupling analysis.
Practically, the results provide significant implications for urban planning and health-oriented community development. The study shows that transportation accessibility, functional land use mix, and the spatial configuration of recreational green spaces positively influence residents’ health, suggesting that improving public transit convenience, optimizing land use structures, and enhancing open green space systems are key pathways for health-oriented spatial planning. Moreover, the significance of subjective perception indicators in the models indicates that enhancing residents’ satisfaction with community healthcare, recreational, and commercial facilities is crucial for promoting health perception. In community renewal and governance, policymakers should consider residents’ psychological experiences and behavioral feedback alongside spatial optimization to establish a planning system oriented toward residents’ needs. These findings provide quantifiable spatial decision-making evidence for healthy city development, indicating that future urban health management should integrate improvements in both objective environmental conditions and subjective experiences to achieve dual objectives of spatial equity and health well-being.
4.3. Limitations and Future Research Directions
By integrating multi-source data and applying interpretable machine learning methods such as SHAP, this study yielded valuable insights into how built community environments shaped residents’ self-rated health. However, several limitations remained, and the findings should be interpreted with caution, offering directions for future research:
(1) The sample size in this study was limited, covering only 25 communities in Wuhan and yielding 242 valid questionnaires, with convenience sampling and a cross-sectional design adopted. These factors restricted the external validity and causal inference of the findings and made it difficult to capture the dynamic changes in residents’ health. Future research may expand the sample size, employ random sampling or longitudinal designs, and incorporate multi-period and multi-scale data to enhance the robustness and spatiotemporal explanatory power of the conclusions.
(2) Residents were nested within communities, forming a typical multilevel structure; however, the model in this study treated all observations as independent, which may have underestimated standard errors and overestimated model performance. Moreover, although information on gender, age, education, income, and housing conditions was collected, these sociodemographic covariates were not included in the model, potentially leading to an overestimation of built-environment effects. Future research should consider incorporating multilevel or mixed-effects models to distinguish variance at the community and individual levels, while including key sociodemographic characteristics. It is also important to explore heterogeneous responses to built environment interventions across population groups to support equity considerations in healthy city policies. In addition, the model results in this study remained dependent on the chosen algorithm and feature inputs; future work may apply alternative machine learning methods for robustness checks to further verify the stability and generalizability of variable importance rankings.
(3) A 1000 m Euclidean buffer was used to extract built-environment indicators, primarily to ensure consistency across communities and to capture structural characteristics, rather than to precisely model individual travel routes or times. Euclidean buffer zones have limitations when applied to complex road networks or areas with significant topographical variation. Where conditions permit, future approaches may employ network buffers based on road networks, travel time isochrones, and terrain friction models to more accurately reflect residents’ accessibility and activity patterns.
(4) The subjective built-environment measures used in this study may have been affected by individual cognition, psychosocial factors, and cultural backgrounds, introducing potential biases. Differences in the use, viewing perspectives, and functional preferences of built-environment features such as urban green spaces or pedestrian areas may also lead to heterogeneous health benefits. Furthermore, key behavioral and social pathway variables—including physical activity (e.g., walking frequency, exercise duration) and social interaction (e.g., frequency of neighbor communication, social network density)—were not incorporated into the model. Future studies should improve data collection to include these variables and apply structural equation modeling (SEM) or bootstrap mediation analysis to formally examine the complete “built environment—behavioral/social pathways—health” process, thereby enhancing theoretical depth and explanatory power.
5. Conclusions
Based on survey data from 25 communities in Wuhan and multi-source geospatial datasets, this study constructed a comprehensive index system of subjective and objective built environment indicators and systematically analyzed the mechanisms through which built community environment characteristics affect residents’ self-rated health using interpretable machine learning methods. The analysis revealed complex relationships between built environment variables and health perception from the perspectives of nonlinear effects, threshold effects, and local interaction effects. The main conclusions of the study are as follows:
First, the impact of the built community environment on residents’ health is not a simple linear accumulation of individual dimensions, but rather the result of nonlinear coupling between subjective and objective factors. The study shows that while objective physical attributes provide the material foundation for health, residents’ subjective evaluations of these environmental elements (e.g., satisfaction with commercial services or healthcare) exhibit stronger explanatory power in predicting health outcomes. This finding underscores that neglecting individuals’ environmental perceptions in healthy city research may lead to underestimating or misjudging environmental health benefits. Genuine healthy community development must go beyond the creation of physical spaces and focus on the interaction between people and their environment, enhancing legibility, safety, and sense of belonging to achieve a deeper human–environment alignment.
Second, contrary to the traditional “more is better” linear assumption, this study finds that indicators such as land-use mix and transit station density exhibit specific threshold ranges. Moderate functional diversity and transit connectivity enhance health perception, but once a certain threshold is exceeded, negative effects such as overcrowding and environmental stress may offset the associated convenience benefits. This conclusion provides quantitative guidance for avoiding “too much of a good thing” in high-density urban development.
Third, interpretable artificial intelligence (XAI) provides methodological support for “precision governance” in complex urban systems. By combining XGBoost with SHAP, this study successfully demystifies the black-box model, not only quantifying the contribution of each factor but also finely characterizing local interaction features among variables. This penetrative analysis—from macro-level patterns to micro-level mechanisms—enables the formulation of differentiated policies. Future urban governance should fully leverage such data-intelligent tools, moving from standardized, “one-size-fits-all” planning toward evidence-based design and precision interventions, thereby promoting a fundamental shift in urban planning paradigms from being “space-centered” to “health-centered”.