


Abstract
To investigate the stability evolution pattern of deep-cutting slopes during staged excavation, on-site monitoring was conducted on the lateral displacement, anchor bolt axial force, and anchor cable anchoring force of the deep-cutting slope at Section EK1 + 640 of the Zhengxi Expressway. Additionally, FLAC3D was employed to study the impact of anchor cable anchoring force loss on slope stability. The research results indicate the following: During the staged excavation, the middle and lower parts of the slope exhibited significant lateral displacement, with a maximum displacement amplitude reaching 26.3 mm; as the monitoring period progressed, the axial force of anchor bolts located in the lower part of each slope stage gradually exceeded that of those in the upper part, and the closer an anchor bolt to the top of each slope stage, the smaller the increment in its axial force; for anchor cables installed at the top of each slope stage, the anchoring force loss rate reached 16.4%, which was significantly higher than that of cables in other positions. Meanwhile, these anchor cables were more significantly affected by environmental changes and construction disturbances, and the loss of anchor cable anchoring force exerted a notable influence on the slope’s overall stability.
1. Introduction
During the excavation of cutting slopes, it is necessary to remove the rock and soil above the designed slope surface. As excavation proceeds, the rock mass that was originally deeply buried becomes exposed. This process not only disrupts the initial stress state of the slope but also accelerates the weathering process of the newly exposed rock mass [1,2,3]. Additionally, for deep-cutting slopes constructed through staged excavation, with the advancement of excavation work, factors such as unloading damage of the rock mass, construction disturbance, and changes in the original applied loads of the slope will all exert adverse effects on the existing stability of the slope [4,5,6,7].
Deep-cutting slope excavation represents a progressively disturbing process in which stress redistribution evolves continuously. On the one hand, the excavation scope continuously expands, leading to an increase in the unloading influence zone. On the other hand, blasting with explosives is often adopted for cutting slope excavation. Under the impact of blasting loads, the joint fissures in the rock mass develop rapidly, and the existing support structures are also affected [8]. Sasahara [9,10] monitored the displacement changes of slopes during multi-stage excavation. Through the analysis of measured data, he summarized the creep deformation behaviors of the slope during and post-excavation, and on this basis, established an evaluation model for excavation-induced instability of slopes. Li [11] developed analytical models via PLAXIS 3D and GeoStudio software based on practical engineering cases. These models were employed to conduct comparative analyses of slope deformation and internal forces of supporting structures under the condition of identical slope height but varying slope angles and platform widths. Zhou [12,13,14] and his colleagues took an open-pit slope as the research object, investigating its failure mechanism and stability under excavation and unloading conditions. Based on fracture mechanics theory and rock strength damage criteria, they established a simplified mechanical model for slope excavation. Meanwhile, combined with the structural characteristics of the slope, they analyzed the dynamic damage process of the slope under excavation disturbance. Yang [15] used the finite difference software FLAC3D to simulate the excavation of high and steep slopes, studying their deformation modes and failure mechanisms caused by staged excavation. The research showed that during the staged excavation of high and steep slopes, their deformation characteristics can be summarized as the processes of “sliding–bending–shearing”. Qu [16] considered the effects of excavation unloading, rainfall, and rock layer rupture; established a finite element analysis model for high slopes; and conducted fluid–solid coupling numerical simulation analysis on the slopes. This study elucidates the failure mechanism of high slopes under the combined action of excavation unloading and rainfall. Prestressed anchor rods and cables have been widely used in road cut slope support engineering due to their high strength, convenient construction, and high cost-effectiveness. Anchor (rod)/cable frame beam structure is one of the commonly used forms of supporting structures [17,18,19]. During the excavation of cutting slopes, both the existing stability of the slope and the prestress of anchor rods and cables will change [20,21,22], and these changes will directly affect the safety and durability of the anchorage structure [23,24,25].
In addition, slope stability is also susceptible to complex load conditions. Wen [26] investigated the stability and failure mechanisms of slopes under combined actions of excavation, seismic excitation, and rainfall, and pointed out that during excavation, the slope surface near weak interlayers exhibits displacement discontinuity and stress concentration, while seismic loads can further amplify the displacement and acceleration in these vulnerable zones. Bennouna [27] and his colleagues carried out research on the wedge stability of fractured soft rock slopes subjected to seismic loads with different incident directions, revealing that the interaction between fracture geometry and dynamic load orientation exerts a significant influence on slope failure behavior. It is thus evident that slope stability issues triggered either by excavation activities or external vibrations share similar mechanical sensitivities.
At present, most deep-cutting slopes are constructed using a multi-stage excavation method. Factors such as construction speed, construction sequence, and support methods all exert influences on slope stability, slope deformation and failure, as well as the stress field. Generally speaking, during the slope excavation process, the adoption of rapid construction techniques to shorten the construction period is conducive to the stability control of the slope [28,29]. However, for multi-stage excavation slopes, rapid construction does not simply mean blindly shortening the construction period. The excavation of the lower-stage slope should be carried out in an orderly manner while ensuring the stability of the upper-stage slope. Timely support for the already excavated upper-stage slope can effectively reduce the risk of instability in the entire slope mass. Otherwise, when the excavation and support construction of the last-stage slope is completed, the anchor cable support of the topmost stage may have already failed due to excessive stress. Therefore, it is extremely necessary to provide support for multi-stage excavation slopes in a timely manner.
In summary, a relatively complete technical system has been formed in the field of graded excavation of deep-cutting slopes. In terms of disturbance mechanisms and stability evolution, the coupling effects of multiple factors such as excavation, blasting, and environment have been clarified, and multi-stage deformation modes and instability evaluation modes have been established; In terms of support technology, the application of anchor rods/cables and other forms of support is becoming increasingly mature, and numerical simulation and parameter inversion techniques have improved the accuracy of design; In terms of construction control, the basic principles and monitoring and warning standards of “graded excavation, graded support, and timely support” have been formed. These achievements provide important technical support for engineering practice and ensure the construction safety of most deep-cutting slope projects. However, there is still room for improvement in the coupling mechanism and dynamic control under complex geological conditions.
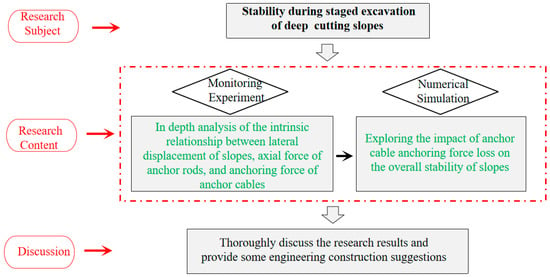
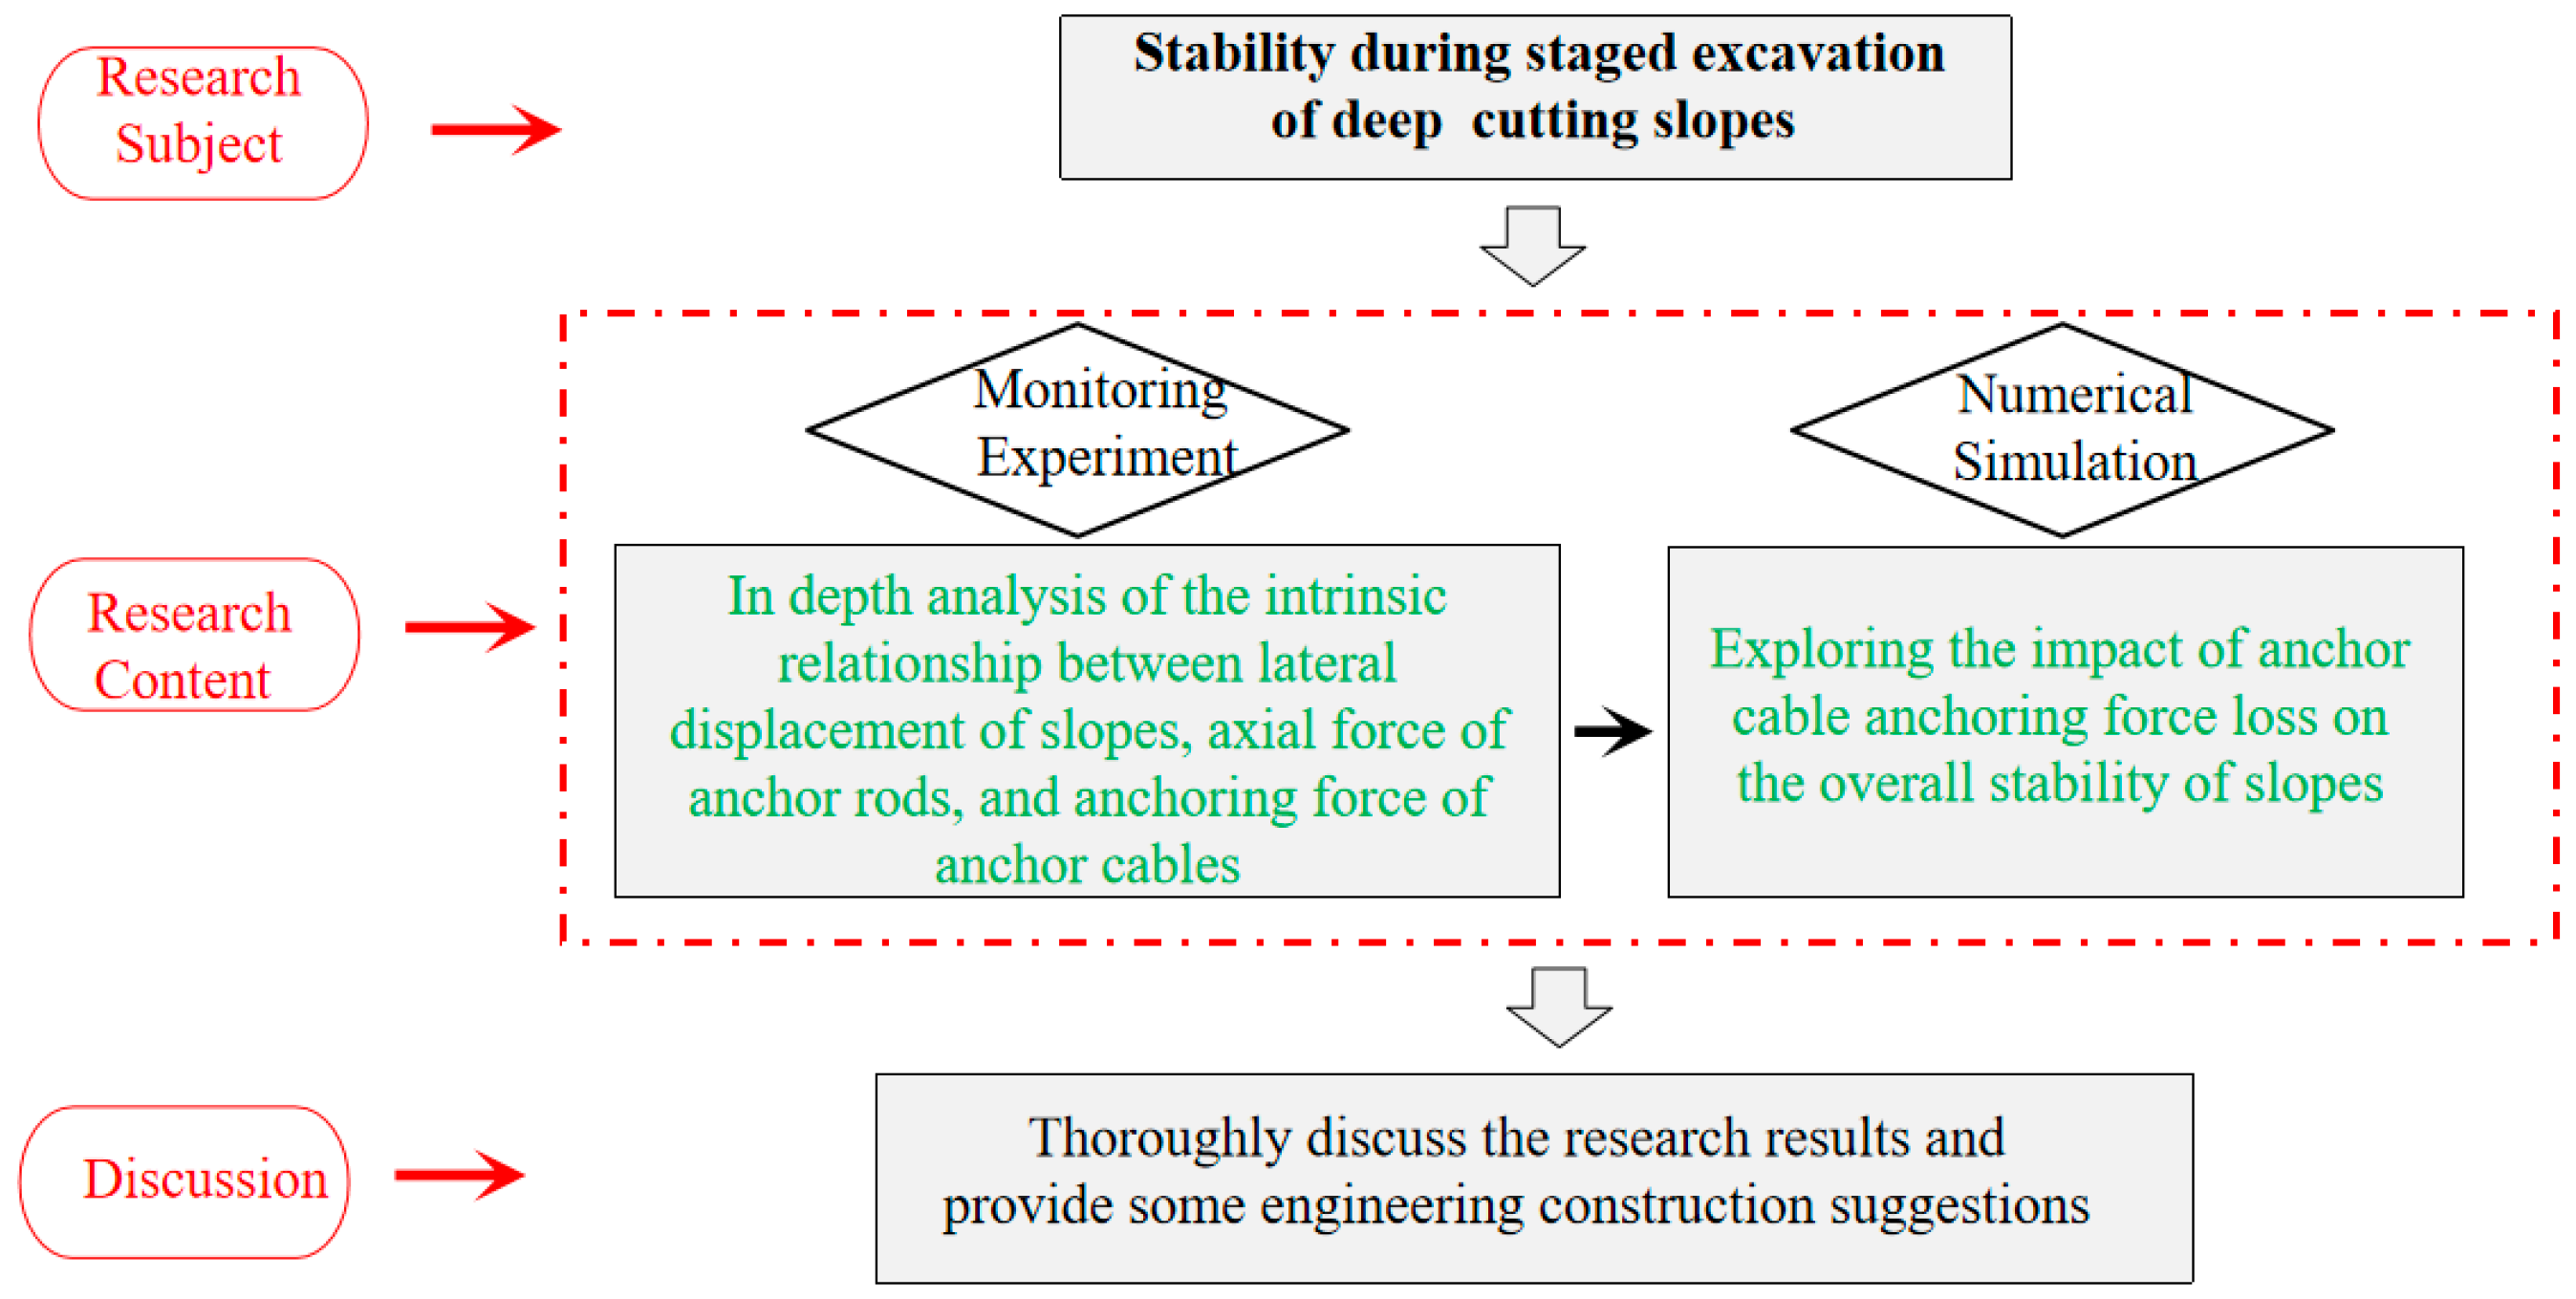
For example, during the staged excavation of deep-cutting slopes, the displacement changes of the slope and the internal force changes of the support structure are not independent of each other. Although numerous scholars have conducted research on slope excavation and unloading through methods such as numerical simulation and laboratory tests, and some have also carried out relevant field tests, most of the field tests are conducted separately, and the experimental data of various parameters are not collected at the same time, making it difficult to explain in detail the inherent relationship between slope displacement changes and internal force changes of support structures. Therefore, this study takes the EK1 + 640 section of the Zhengxi Expressway (Zhengzhou to Xixia) as the case study, conducting on-site experimental research on the variation laws of displacement and internal forces of anchor rods and anchor cables during the staged excavation of a deep-cutting slope. During the on-site testing process, a unified wireless data acquisition system was adopted to automatically collect and store all monitoring data at the same fixed time every day. Based on the acquired monitoring results, an in-depth analysis was performed to reveal the inherent relationships among slope lateral displacement, anchor rod axial force, and anchor cable anchoring force. Meanwhile, the finite difference software FLAC3D is used to explore the influence of anchor cable anchoring force loss on the overall stability of the slope. The schematic diagram of the research framework in this article is shown in Figure 1.
Figure 1.
Schematic diagram of research framework.
2. Project Overview and Monitoring Plan
The EK1 + 560~EK1 + 711 section of Zhengxi Expressway is located in Miaozi Town, Luoyang City. This section is located in the Hongluo River Canyon area, with dangerous terrain and significant undulations, including numerous deep-cut sections. Geologically speaking, the cut section is covered by a relatively thin Quaternary residual slope layer. The underlying rock and soil are divided into two engineering geological layers: fully weathered quartz schist and strongly weathered quartz schist. Within the excavation depth range of the slope, fully weathered quartz schist is the main lithology, and the rock mass parameters are shown in Table 1.
Table 1.
Rock mass parameters.
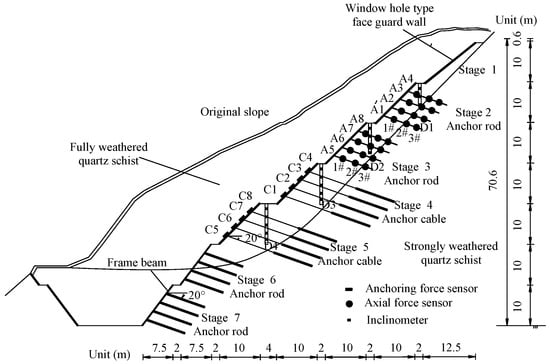
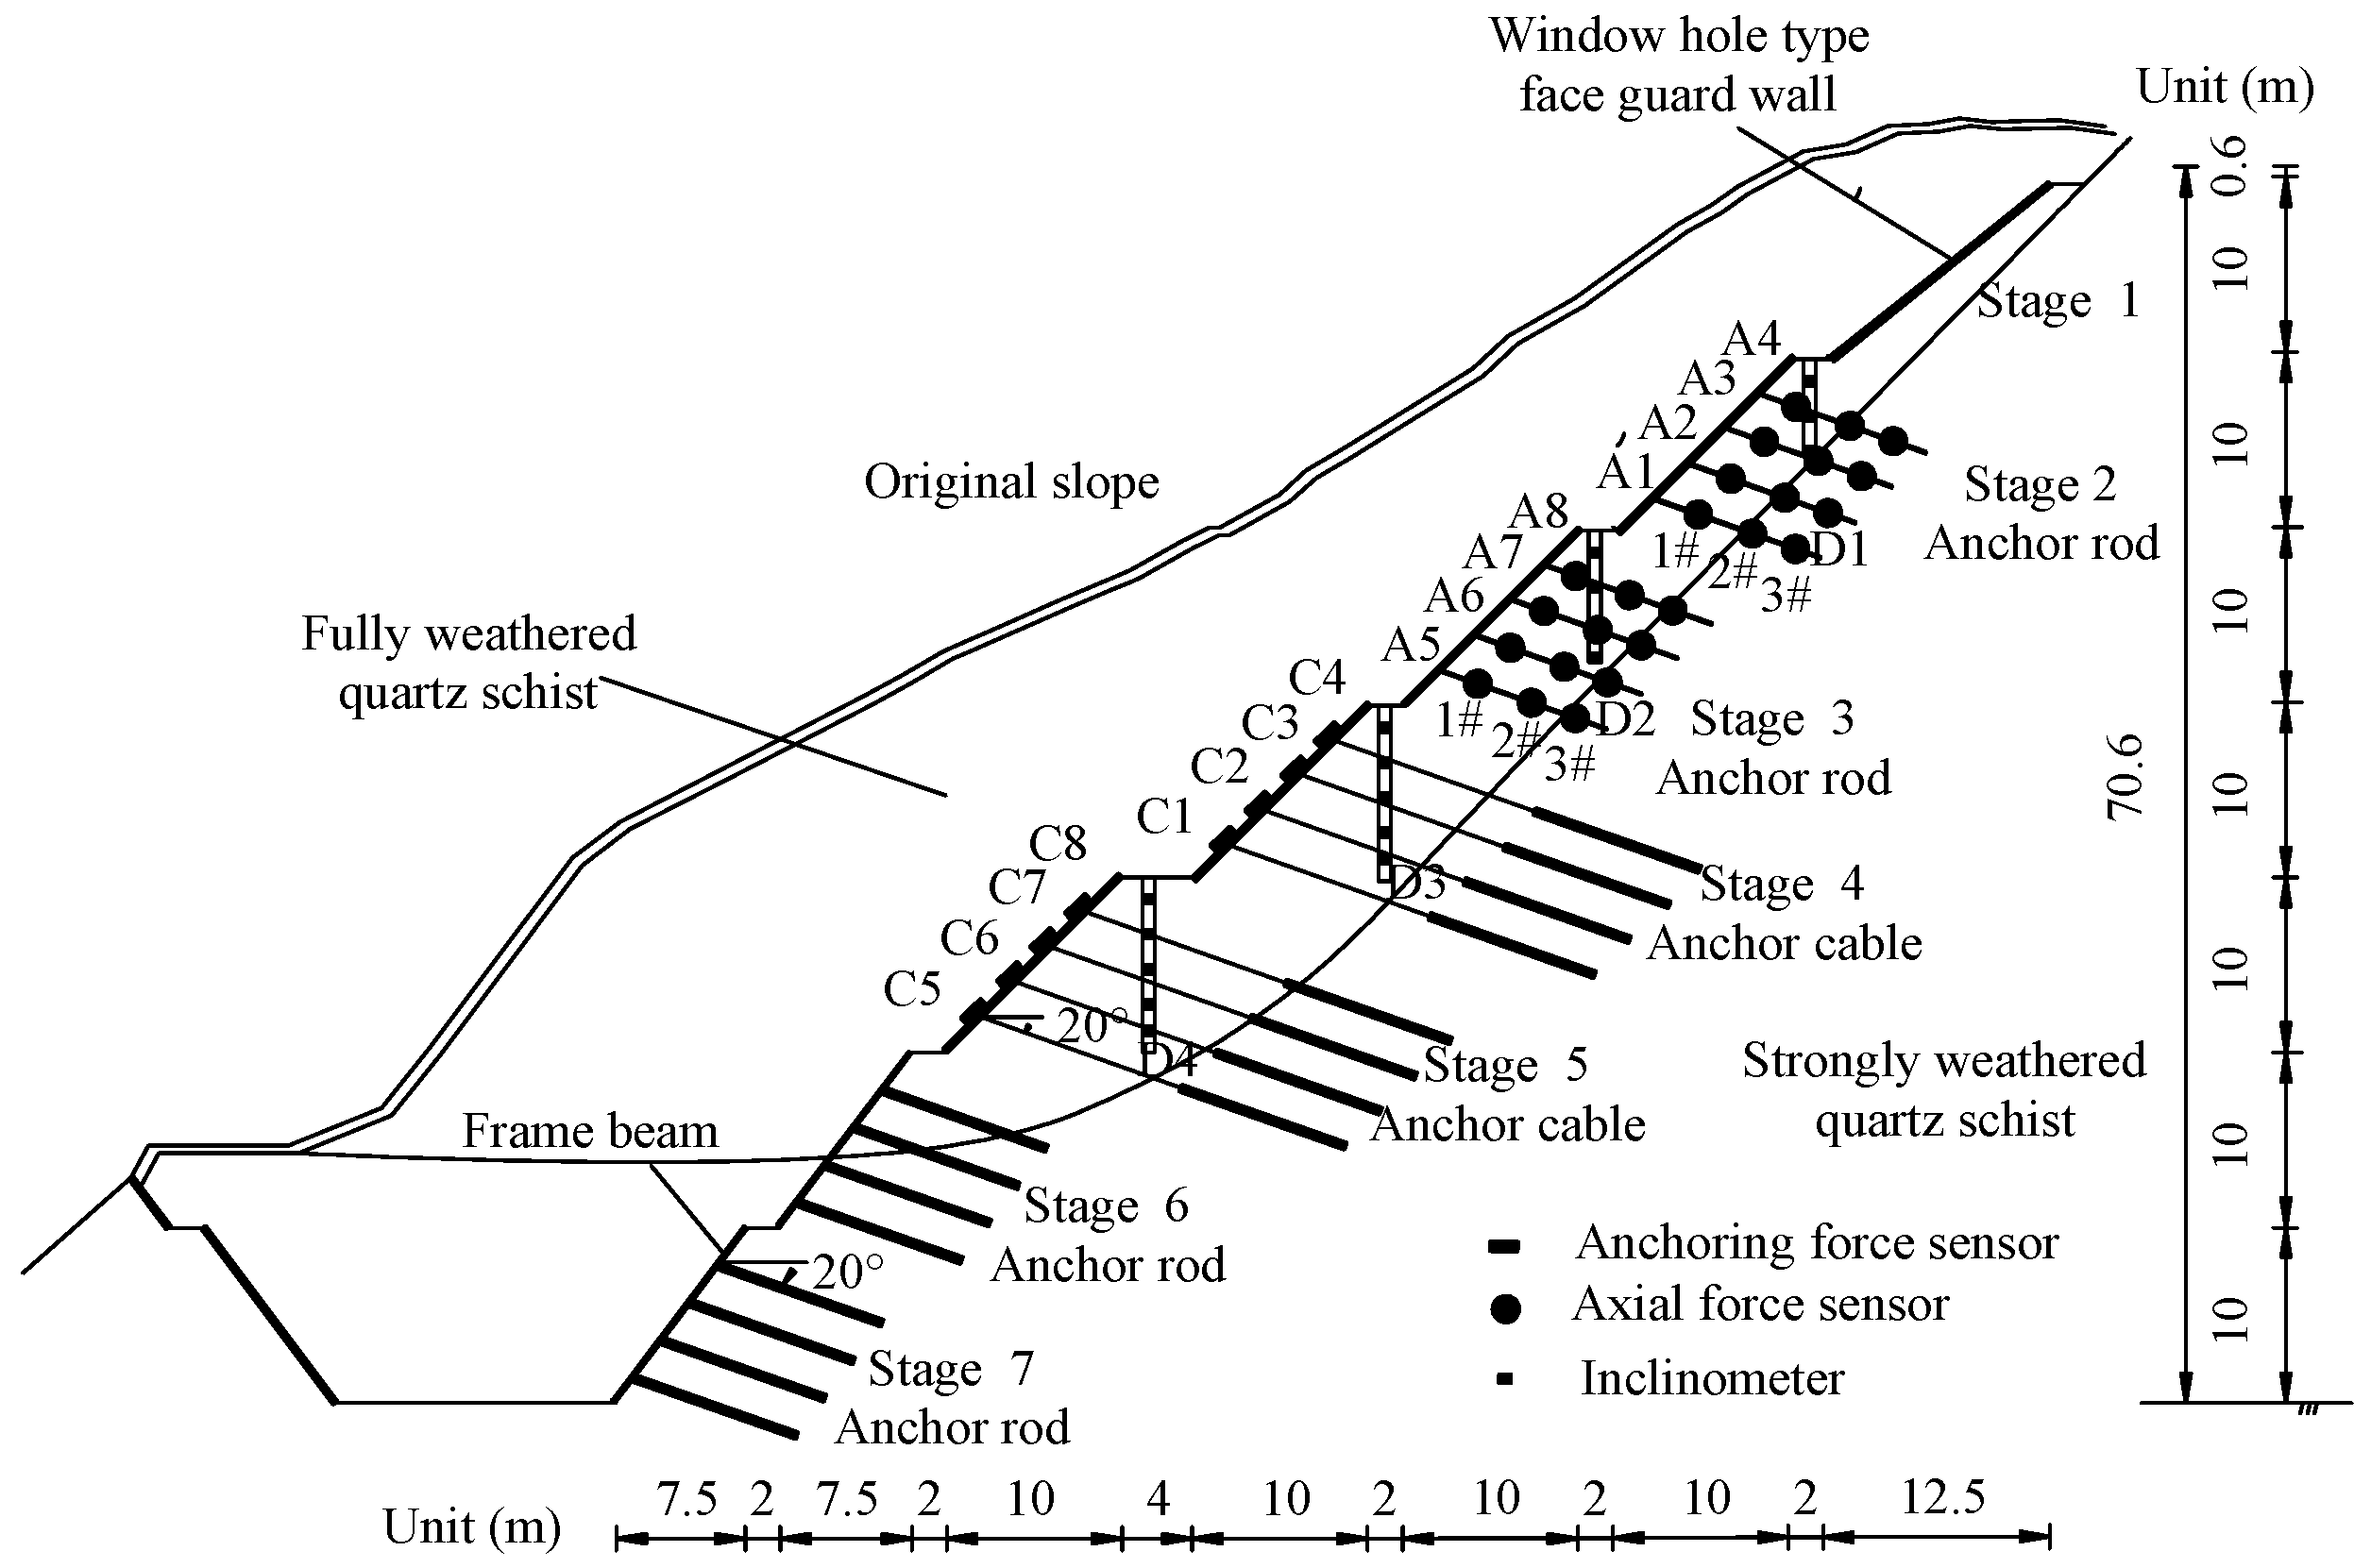
The groundwater in this deep-cutting section is mainly composed of Quaternary loose rock fissure water and bedrock fissure water, supplied by atmospheric precipitation and surface river water infiltration. No groundwater level was found during the geological survey. The EK1 + 640 cross-section was selected as the research object for on-site testing. The height of the road cut slope in this cross-section is 70.6 m, and excavation is carried out in seven stages. The on-site construction adopts the method of “excavation and support at the same time”. The slope support scheme is shown in Figure 1.
1st-stage slope: Supported by a window-type facing wall.
2nd, 3rd, 6th, and 7th-stage slopes: Supported by frame beams combined with prestressed anchor rods. Key parameters of the anchor rods are as follows: length of 9 m, vertical spacing between rods of 2 m, angle with the horizontal of 20°, actual tensioning value of 380 kN/m, material of HRB400 hot-rolled steel bars, diameter of 32 mm, anchor hole diameter of 130 mm, and grouting material of M30 cement mortar.
4th- and 5th-stage slopes: Supported by frame beams combined with prestressed anchor cables. The key parameters of the anchor cable are as follows: total length of 22 m (anchorage section length of 10 m), vertical spacing of 2 m between anchor cables, 20° angle with the horizontal plane, actual tension value of 380 kN/m, anchor hole diameter of 130 mm, and grouting material M40 cement mortar. Each anchor cable consists of four steel strands, each with a diameter of 15 mm, a nominal area of 140 square millimeters, a tensile strength of 1860 megapascals, and an elastic modulus of 1.95 × 10⁵ MPa.
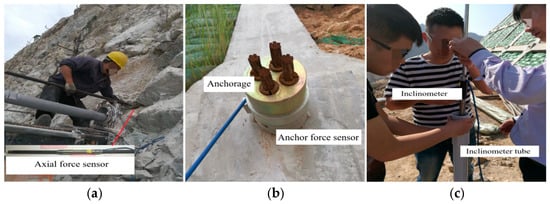
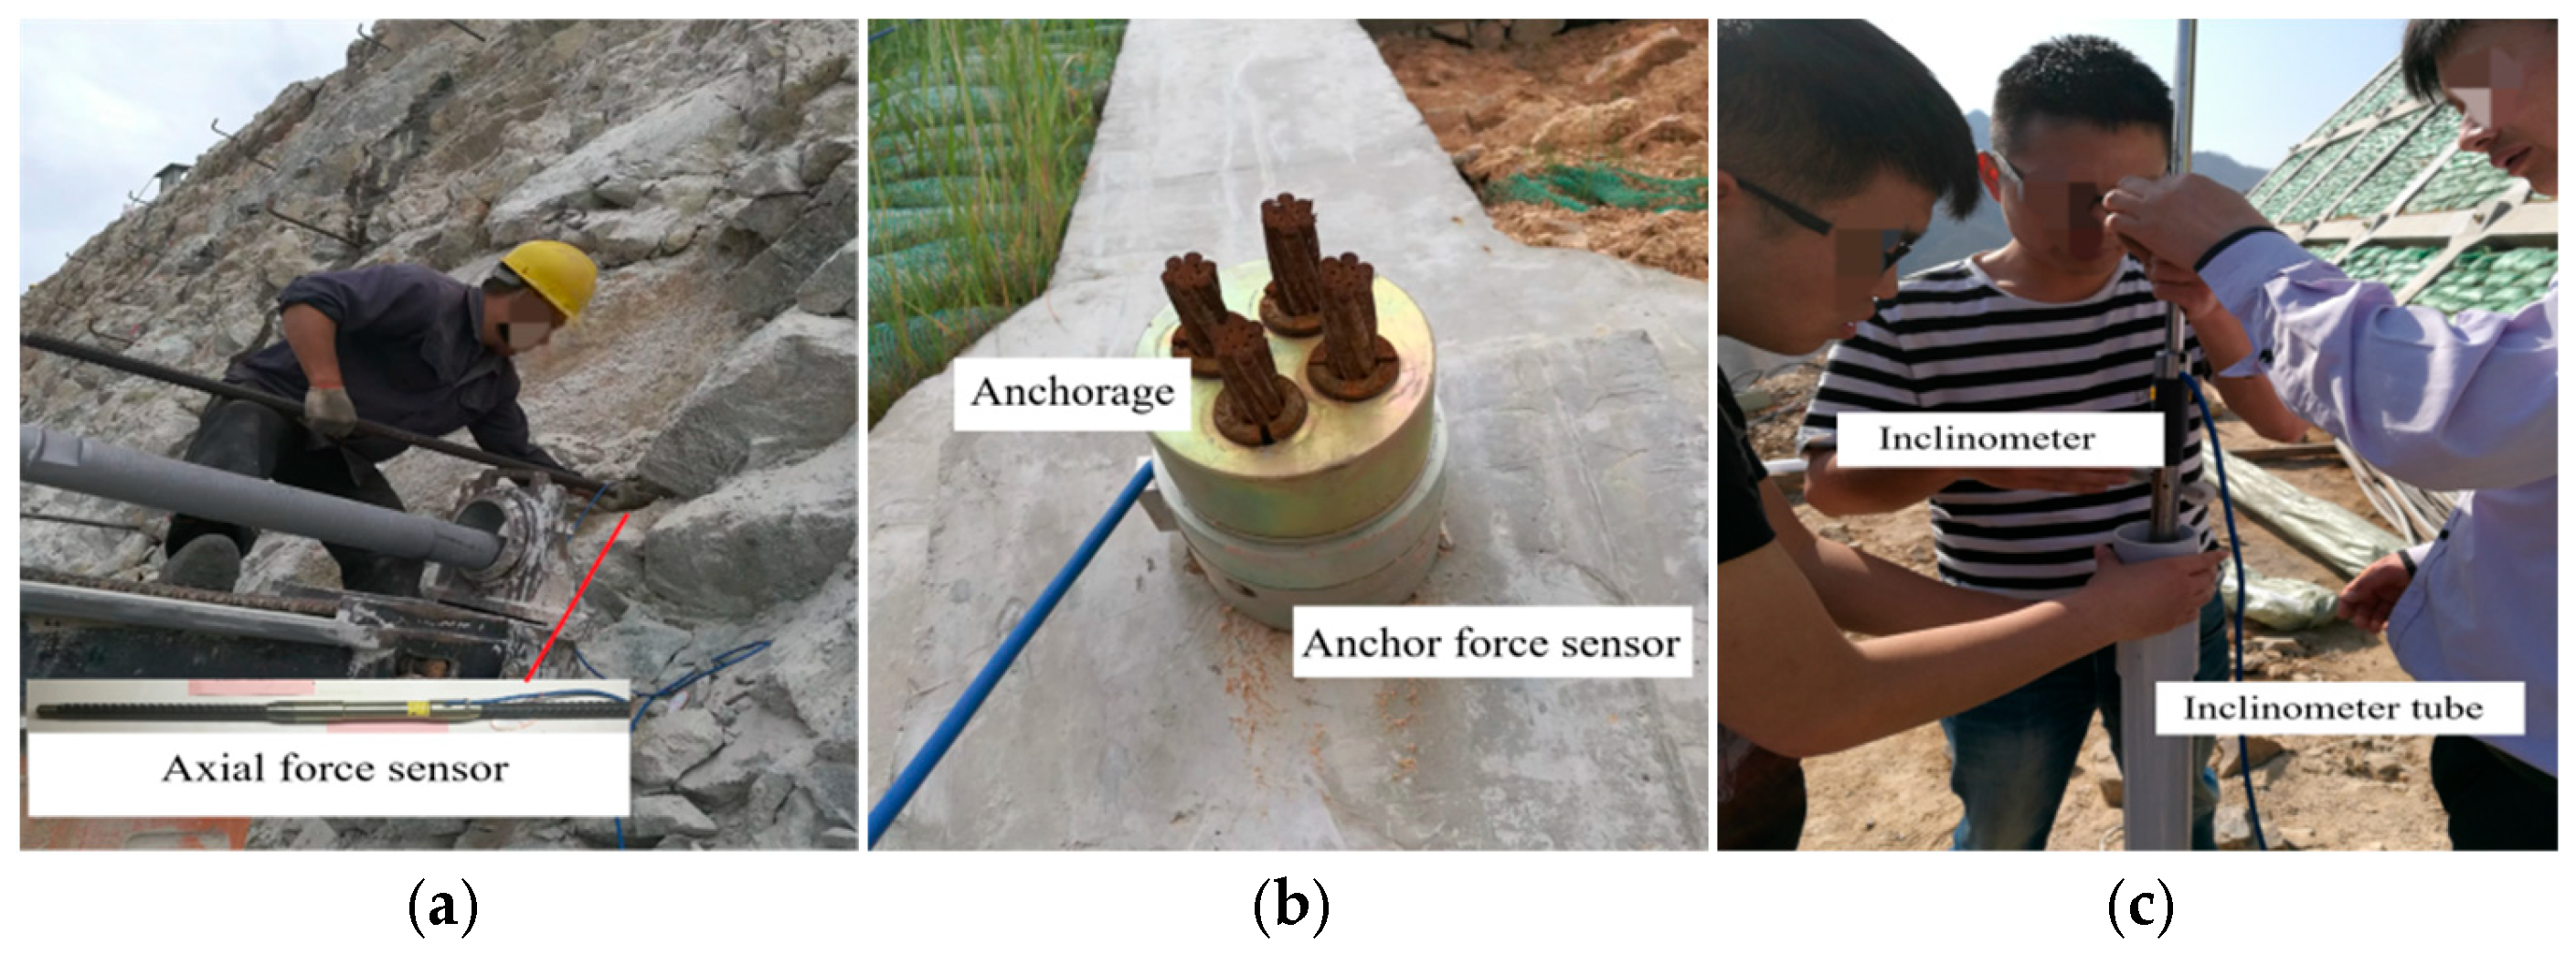
As shown in the monitoring scheme in Figure 2, eight anchor rods on the monitoring cross-sections of the 2nd- and 3rd-stage slopes were replaced with anchor rods pre-installed with anchor rod sensors. Three anchor rod sensors were arranged at equal intervals on each replaced anchor rod, and the parameters of these replaced anchor rods were consistent with those of the original support anchor rods (Figure 3a).
Figure 2.
Support and monitoring scheme of EK1 + 640.
Figure 3.
Component installation: (a) Anchor rod; (b) Anchor cable; (c) Inclinometer.
Before tensioning the eight anchor cables of the 4th- and 5th-stage slopes, an anchor sensor was installed below the anchoring device of each anchor cable (Figure 3b).
Inclinometer devices have been installed on the monitoring sections of the 2nd-stage to 5th-stage slopes. To ensure that the inclinometer tube is located above the rock interface, the following configuration is adopted:
The 2nd-stage slope: The inclinometer tube had a depth of 6 m, with three inclinometers arranged at equal intervals.
The 3rd-stage slope: The inclinometer tube had a depth of 8 m, with four inclinometers arranged at equal intervals.
The 4th- and 5th-stage slopes: The inclinometer tubes had a depth of 10 m, with five inclinometers arranged at equal intervals (Figure 3c).
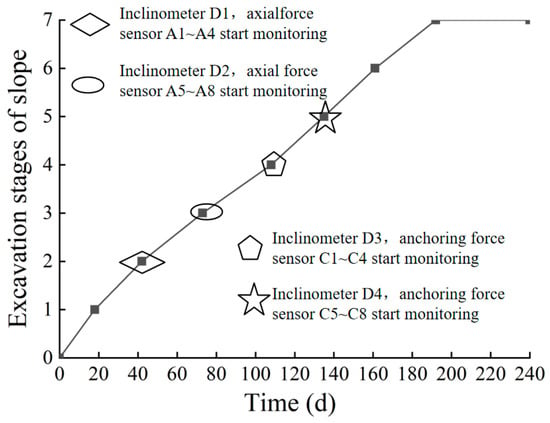
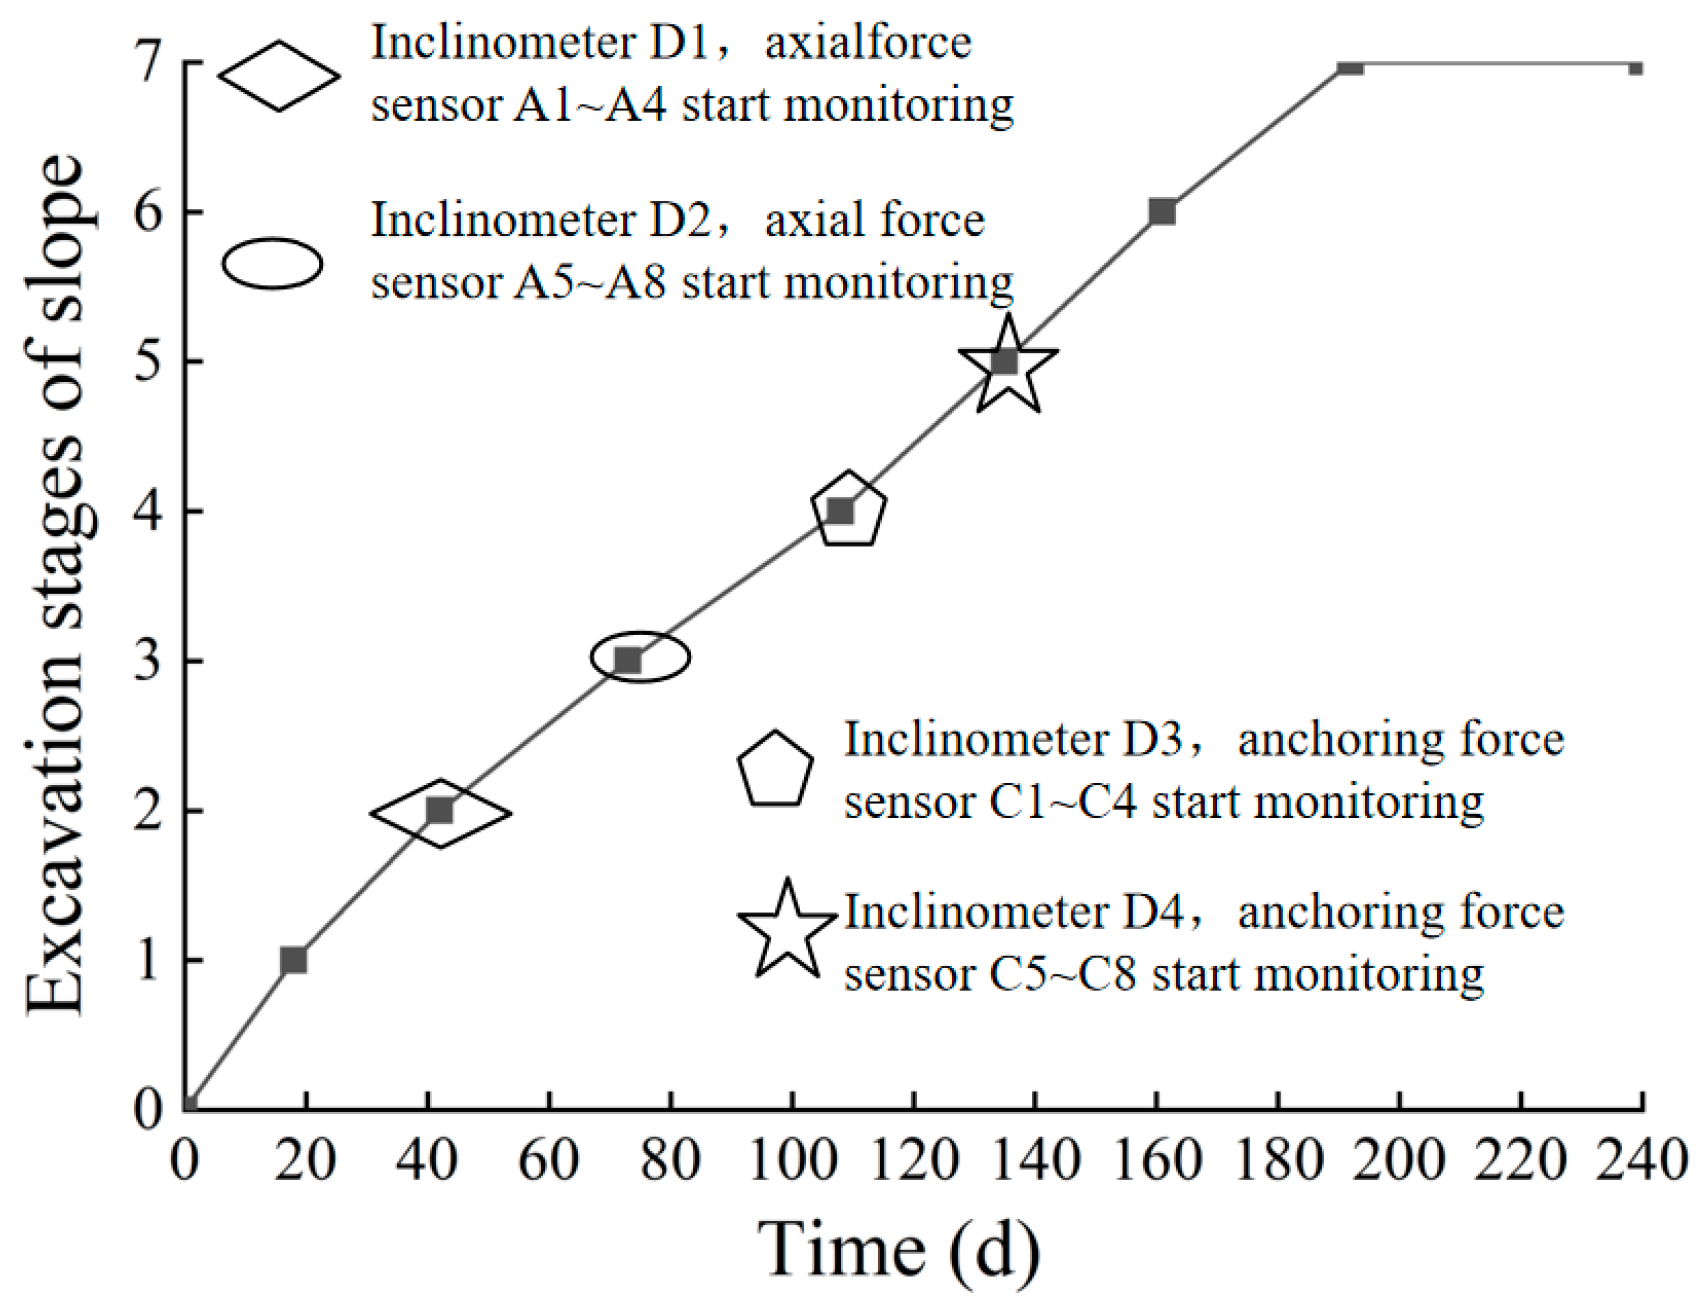
All monitoring components were installed in batches in line with the construction schedule. For the on-site test, monitoring of each slope stage was initiated immediately after the completion of construction for that specific stage. Figure 4 presents the construction and monitoring schedule.
Figure 4.
Construction progress.
The data collection method for monitoring is as follows:
- 1.
- A DSC wireless data transmission and reception terminals were installed on-site, and the signal strength of the components was tested and calibrated.
- 2.
- Utilizing the Internet function of GPRS, an on-site mobile phone module for Internet access was established via a designated domain name.
- 3.
- A computer installed with professional software received data through a wireless network.
Before the start of monitoring, the data-receiving software on the computer was first configured to set the data monitoring to an automatic mode. After configuration, the data acquisition equipment automatically collected and stored data at 6:00 a.m. every day.
3. Analysis of Monitoring Results
3.1. Lateral Displacement of Slope
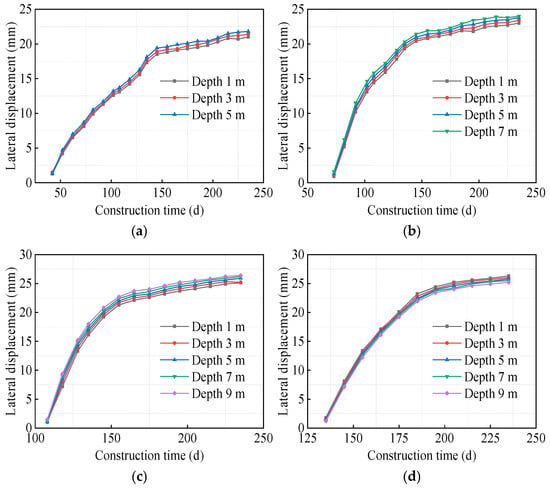
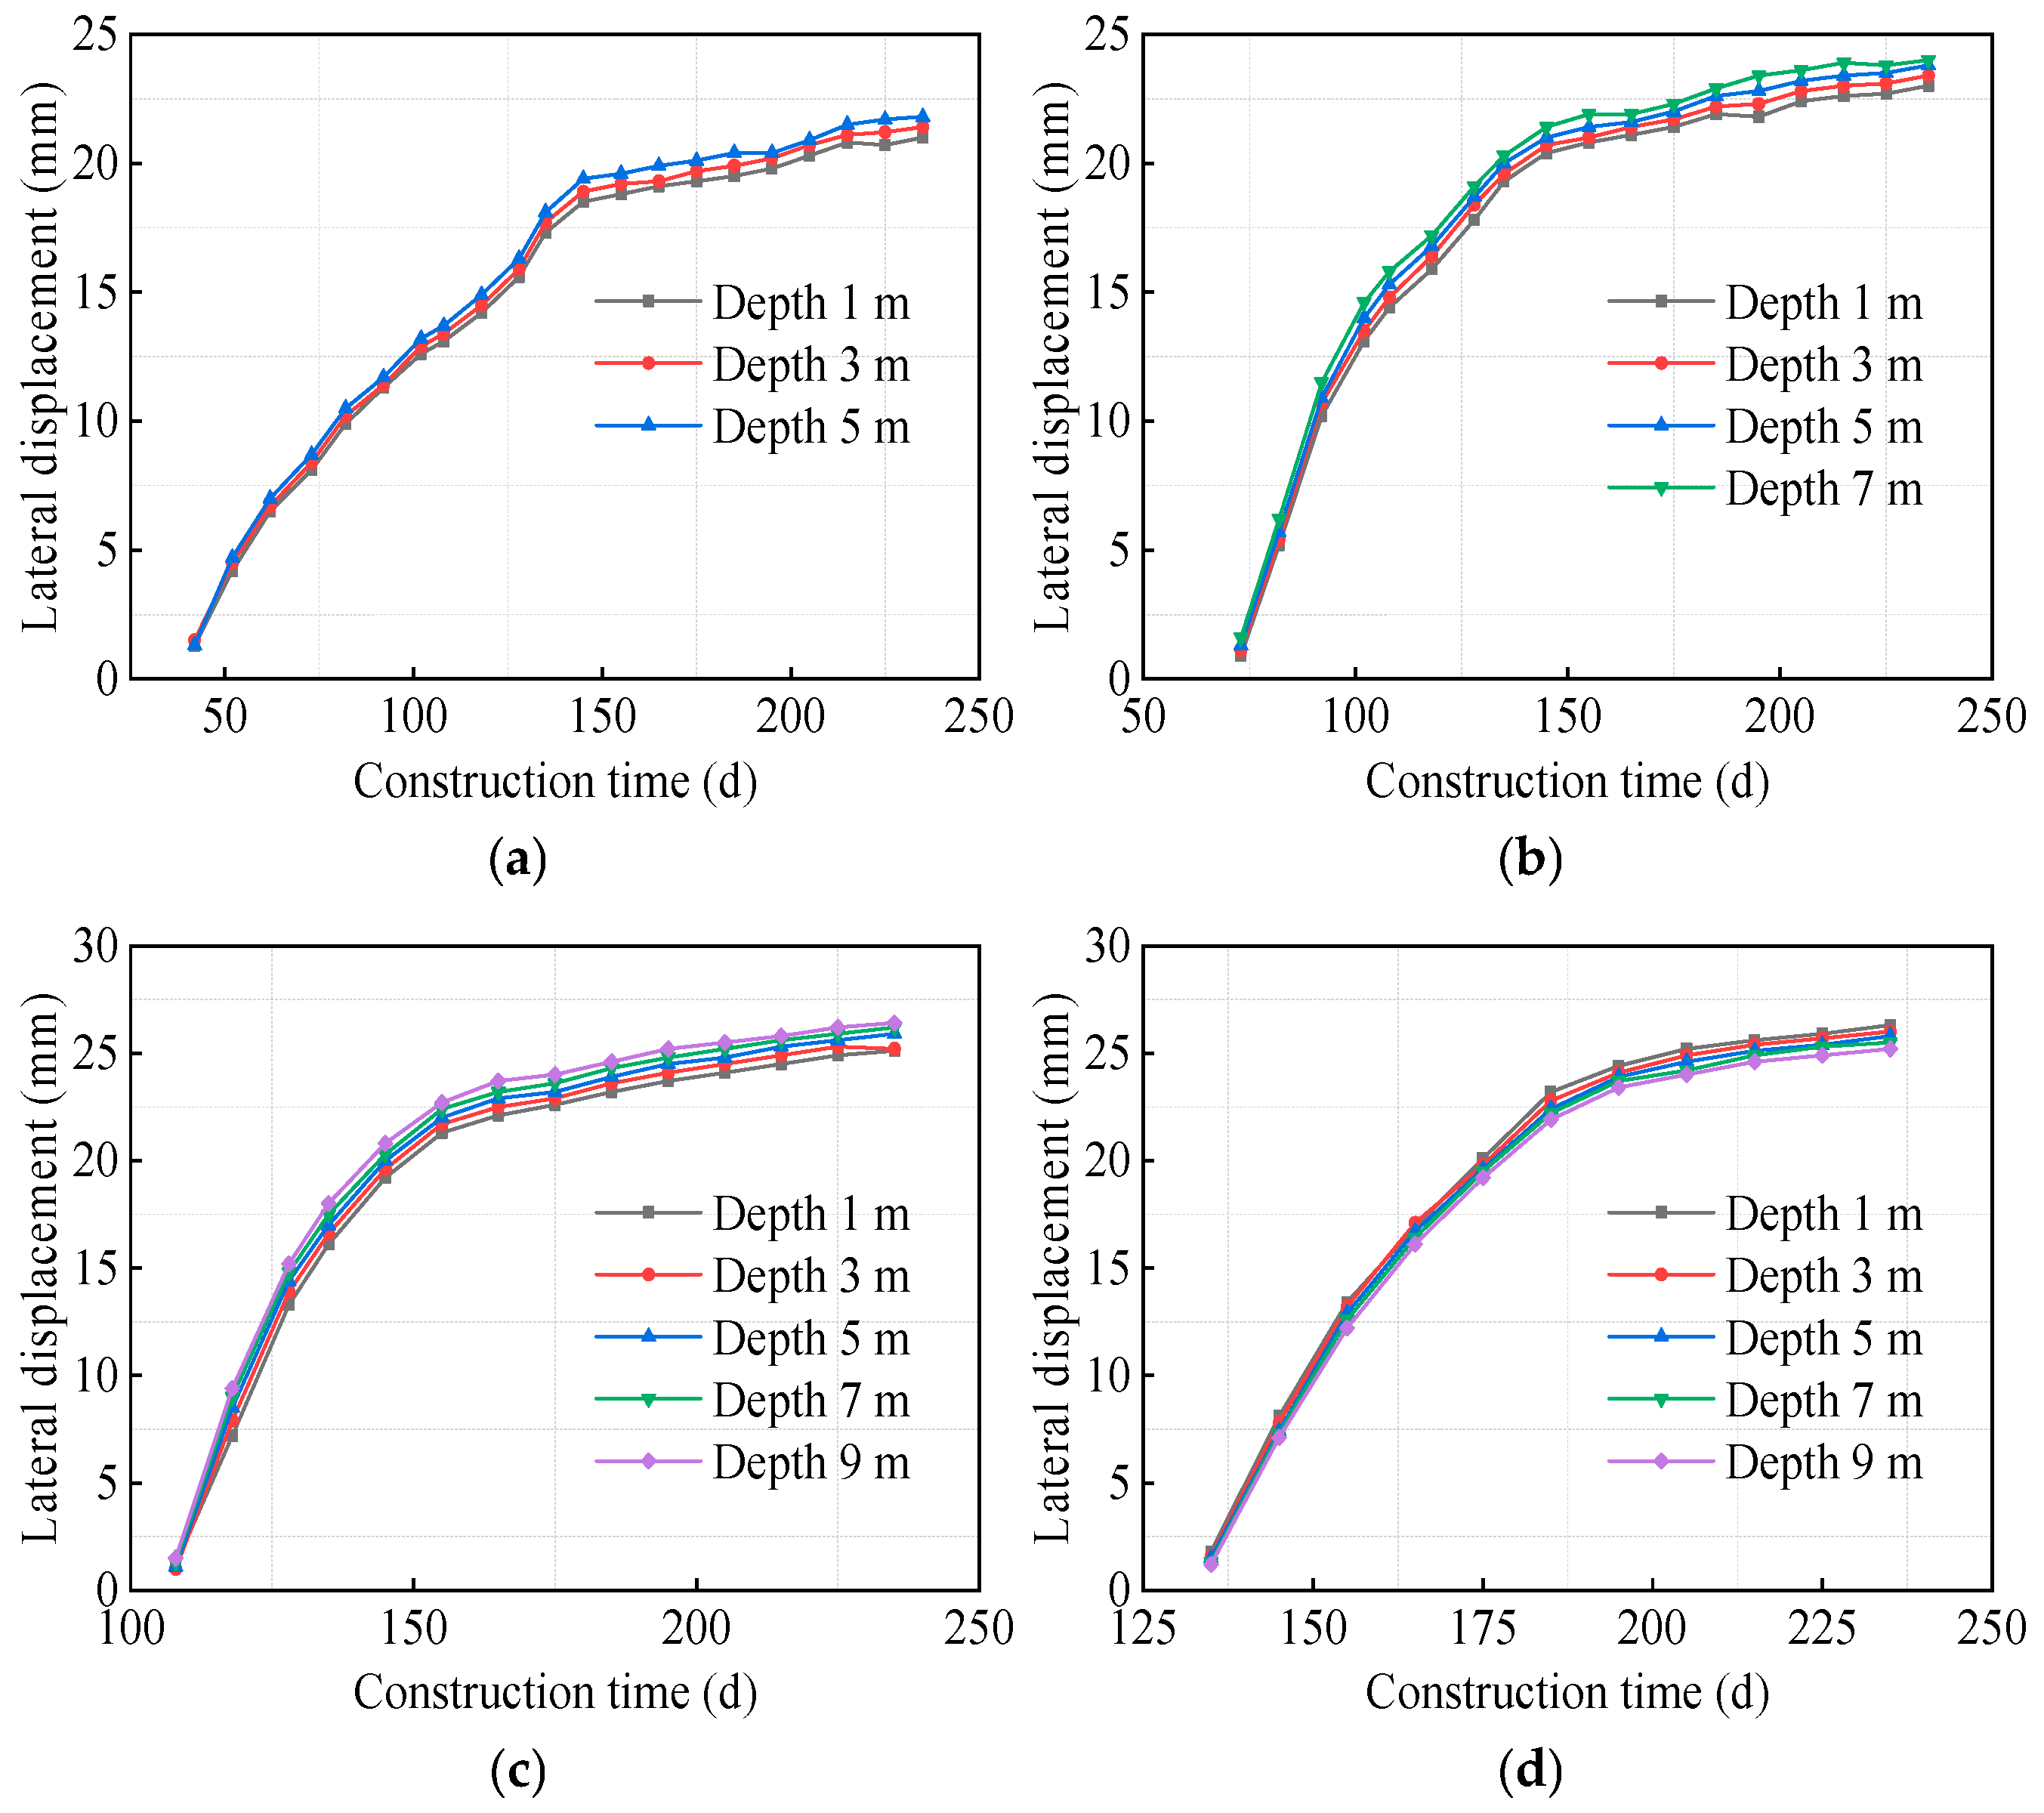
Figure 5 shows the depth–displacement curves of the 2nd- to 5th-stage slopes. As can be seen from the curves, the displacement of each monitored slope increases with the extension of monitoring time. In the early stage of monitoring, the displacement of each monitored slope shows a relatively obvious upward trend; in the later stage of monitoring, the variation trend of displacement gradually slows down.
Figure 5.
Lateral displacement curves of monitoring slopes at all levels: (a) The second-stage slope; (b) The third-stage slope; (c) The fourth-stage slope; (d) The fifth-stage slope.
By comparing with the construction schedule in Figure 3, it can be noted that the displacement monitoring of the 2nd-stage slope started on the 42nd day, while the monitoring of the 3rd, 4th, and 5th-stage slopes began on the 73rd, 108th, and 135th days, respectively. The excavation of the entire cutting slope was completed on the 192nd day. This indicates that the increase in lateral displacement of each monitored slope mainly occurred during the excavation construction of the entire slope.
Furthermore, a further analysis combined with the support scheme in Figure 1 reveals that the 2nd- and 3rd-stage slopes are supported by anchor rods, while the 4th- and 5th-stage slopes adopt anchor cable support. The main function of the anchor rods for the 2nd- and 3rd-stage slopes is to enhance the integrity of the fully weathered rock mass after excavation, preventing local instability above the rock stratum interface. In contrast, the anchor cables for the 4th- and 5th-stage slopes primarily serve to control the overall stability of the cutting slope.
The displacement monitoring positions of the 2nd- and 3rd-stage slopes are mainly located above the rock stratum interface; thus, their displacements were continuously affected by the excavation of the lower-stage slopes. It was not until the completion of the anchor cable support for the 4th- and 5th-stage slopes that the overall stability of the slope was controlled to a large extent, and the displacement changes of the 2nd- and 3rd-stage slopes tended to stabilize. Therefore, the displacement of the 2nd- and 3rd-stage slopes stabilized at approximately the same time, around the 145th day of construction.
Different from the 2nd- and 3rd-stage slopes, the displacements of the 4th- and 5th-stage slopes stabilized around the 165th and 195th days of construction, respectively, showing a sequential order in time. This suggests that the lateral displacements of the 4th- and 5th-stage slopes are more significantly affected by the construction of the two adjacent lower-stage slopes. When the excavation site is far from the monitored slope, the impact of construction disturbance on the lateral displacement of the monitored slope is not obvious.
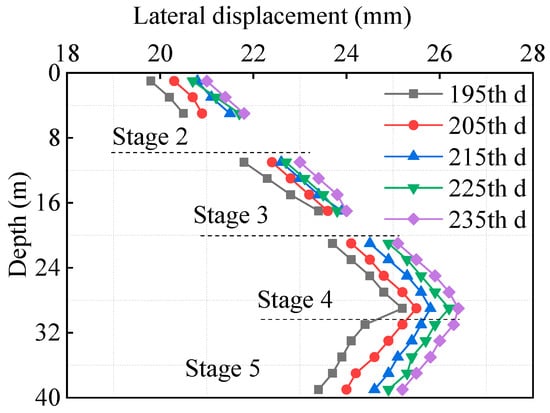
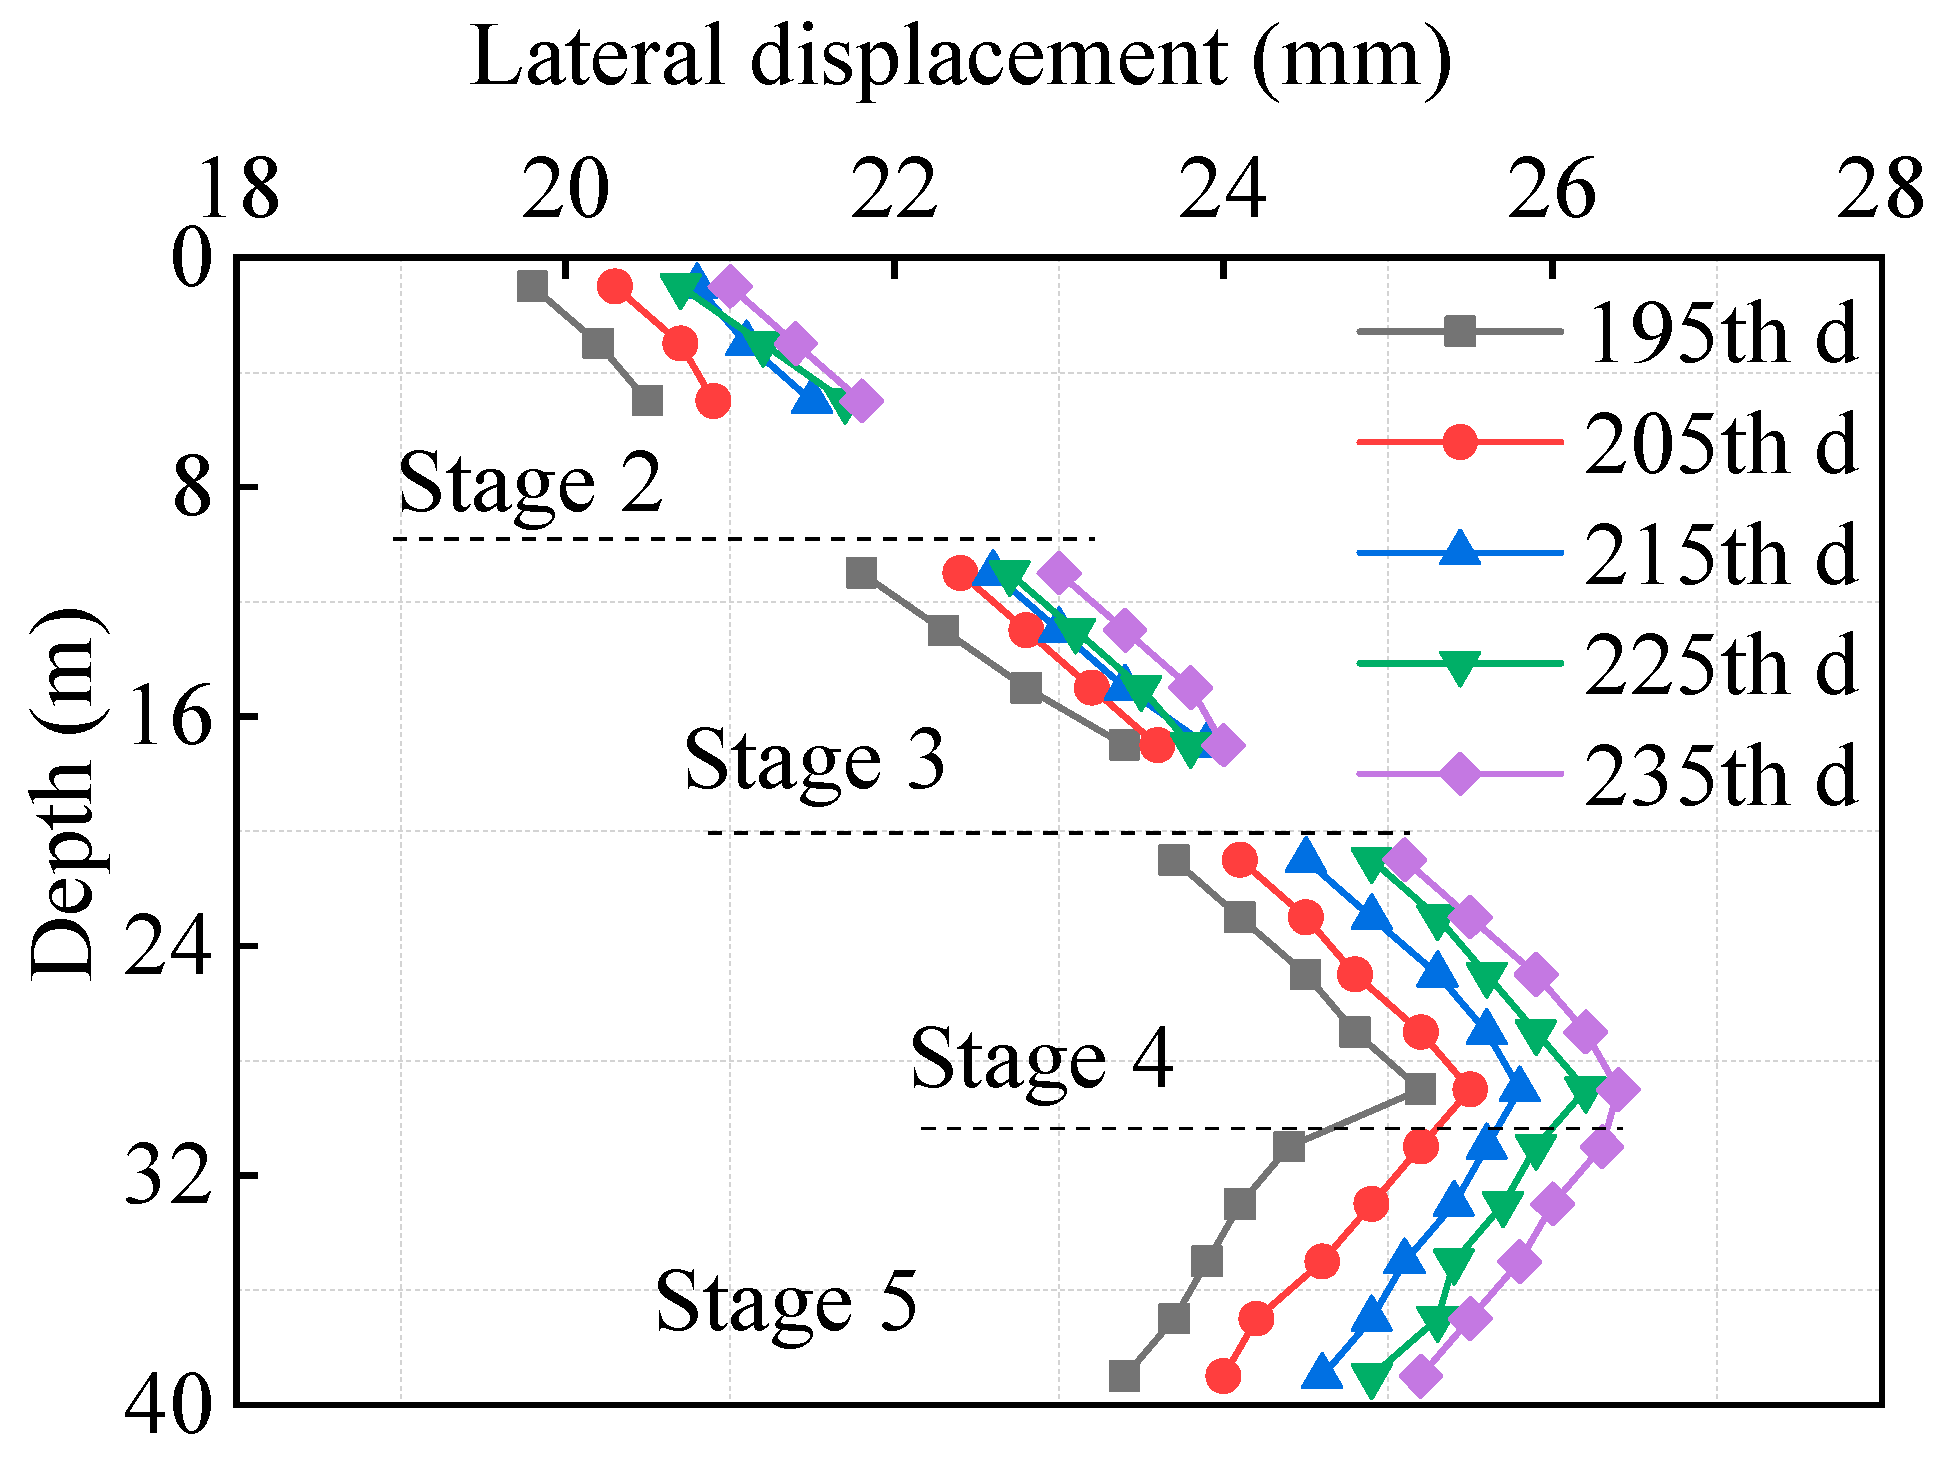
Figure 6 presents the total depth–displacement curves of the 2nd- to 5th-stage slopes. To facilitate the comparison of the distribution law of the slope’s lateral displacement along the entire monitoring depth, the data collected when the displacement variation of each monitored slope had stabilized was selected for analysis.
Figure 6.
Total lateral displacement curve.
As observed from the curves in the figure, throughout the entire monitoring period, the lateral displacement of the slopes first increases and then decreases along the full monitoring depth. Specifically, the maximum lateral displacement of the 2nd-stage slope is approximately 21.9 mm, that of the 3rd-stage slope is about 24.1 mm, and those of the 4th- and 5th-stage slopes are roughly 26.3 mm. It is evident from this that the 4th- and 5th-stage slopes exhibit the largest lateral displacement.
By comparing the positions of the 4th- and 5th-stage slopes in Figure 2, it can be concluded that during the staged excavation of the entire cutting slope, the single-stage slope closer to the slope toe experiences greater lateral earth pressure at the excavated free face. The magnitude of this lateral earth pressure directly affects the lateral displacement of the slope. However, due to the constraint effect of the stratum on the two lowest-stage slopes, the maximum lateral displacement tends to occur in the middle–lower part of the entire cutting slope.
For deep-cutting slopes, excavation disturbance is the primary cause of slope displacement. Therefore, it is necessary to reduce rock mass disturbance through reasonable excavation methods to prevent a sudden surge in displacement. During construction, the method of “excavate a section, support a section” is recommended to prevent sudden displacement of the slope caused by prolonged exposure of the excavated surface of the upper-stage slope. In addition, the above analysis indicates that the middle and lower parts of the entire cutting slope are subject to high lateral earth pressure and prone to the formation of sliding exit points. For similar projects, priority should be given to completing the anchor cable support in this area (e.g., commencing the next stage of excavation only after the tensioning of anchor cables is completed).
3.2. Axial Force on Anchor Rod
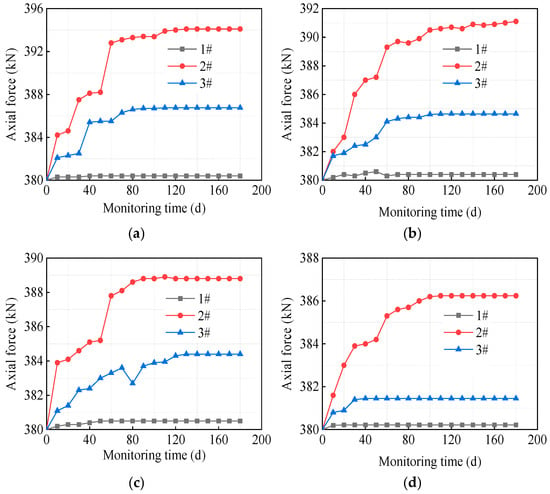
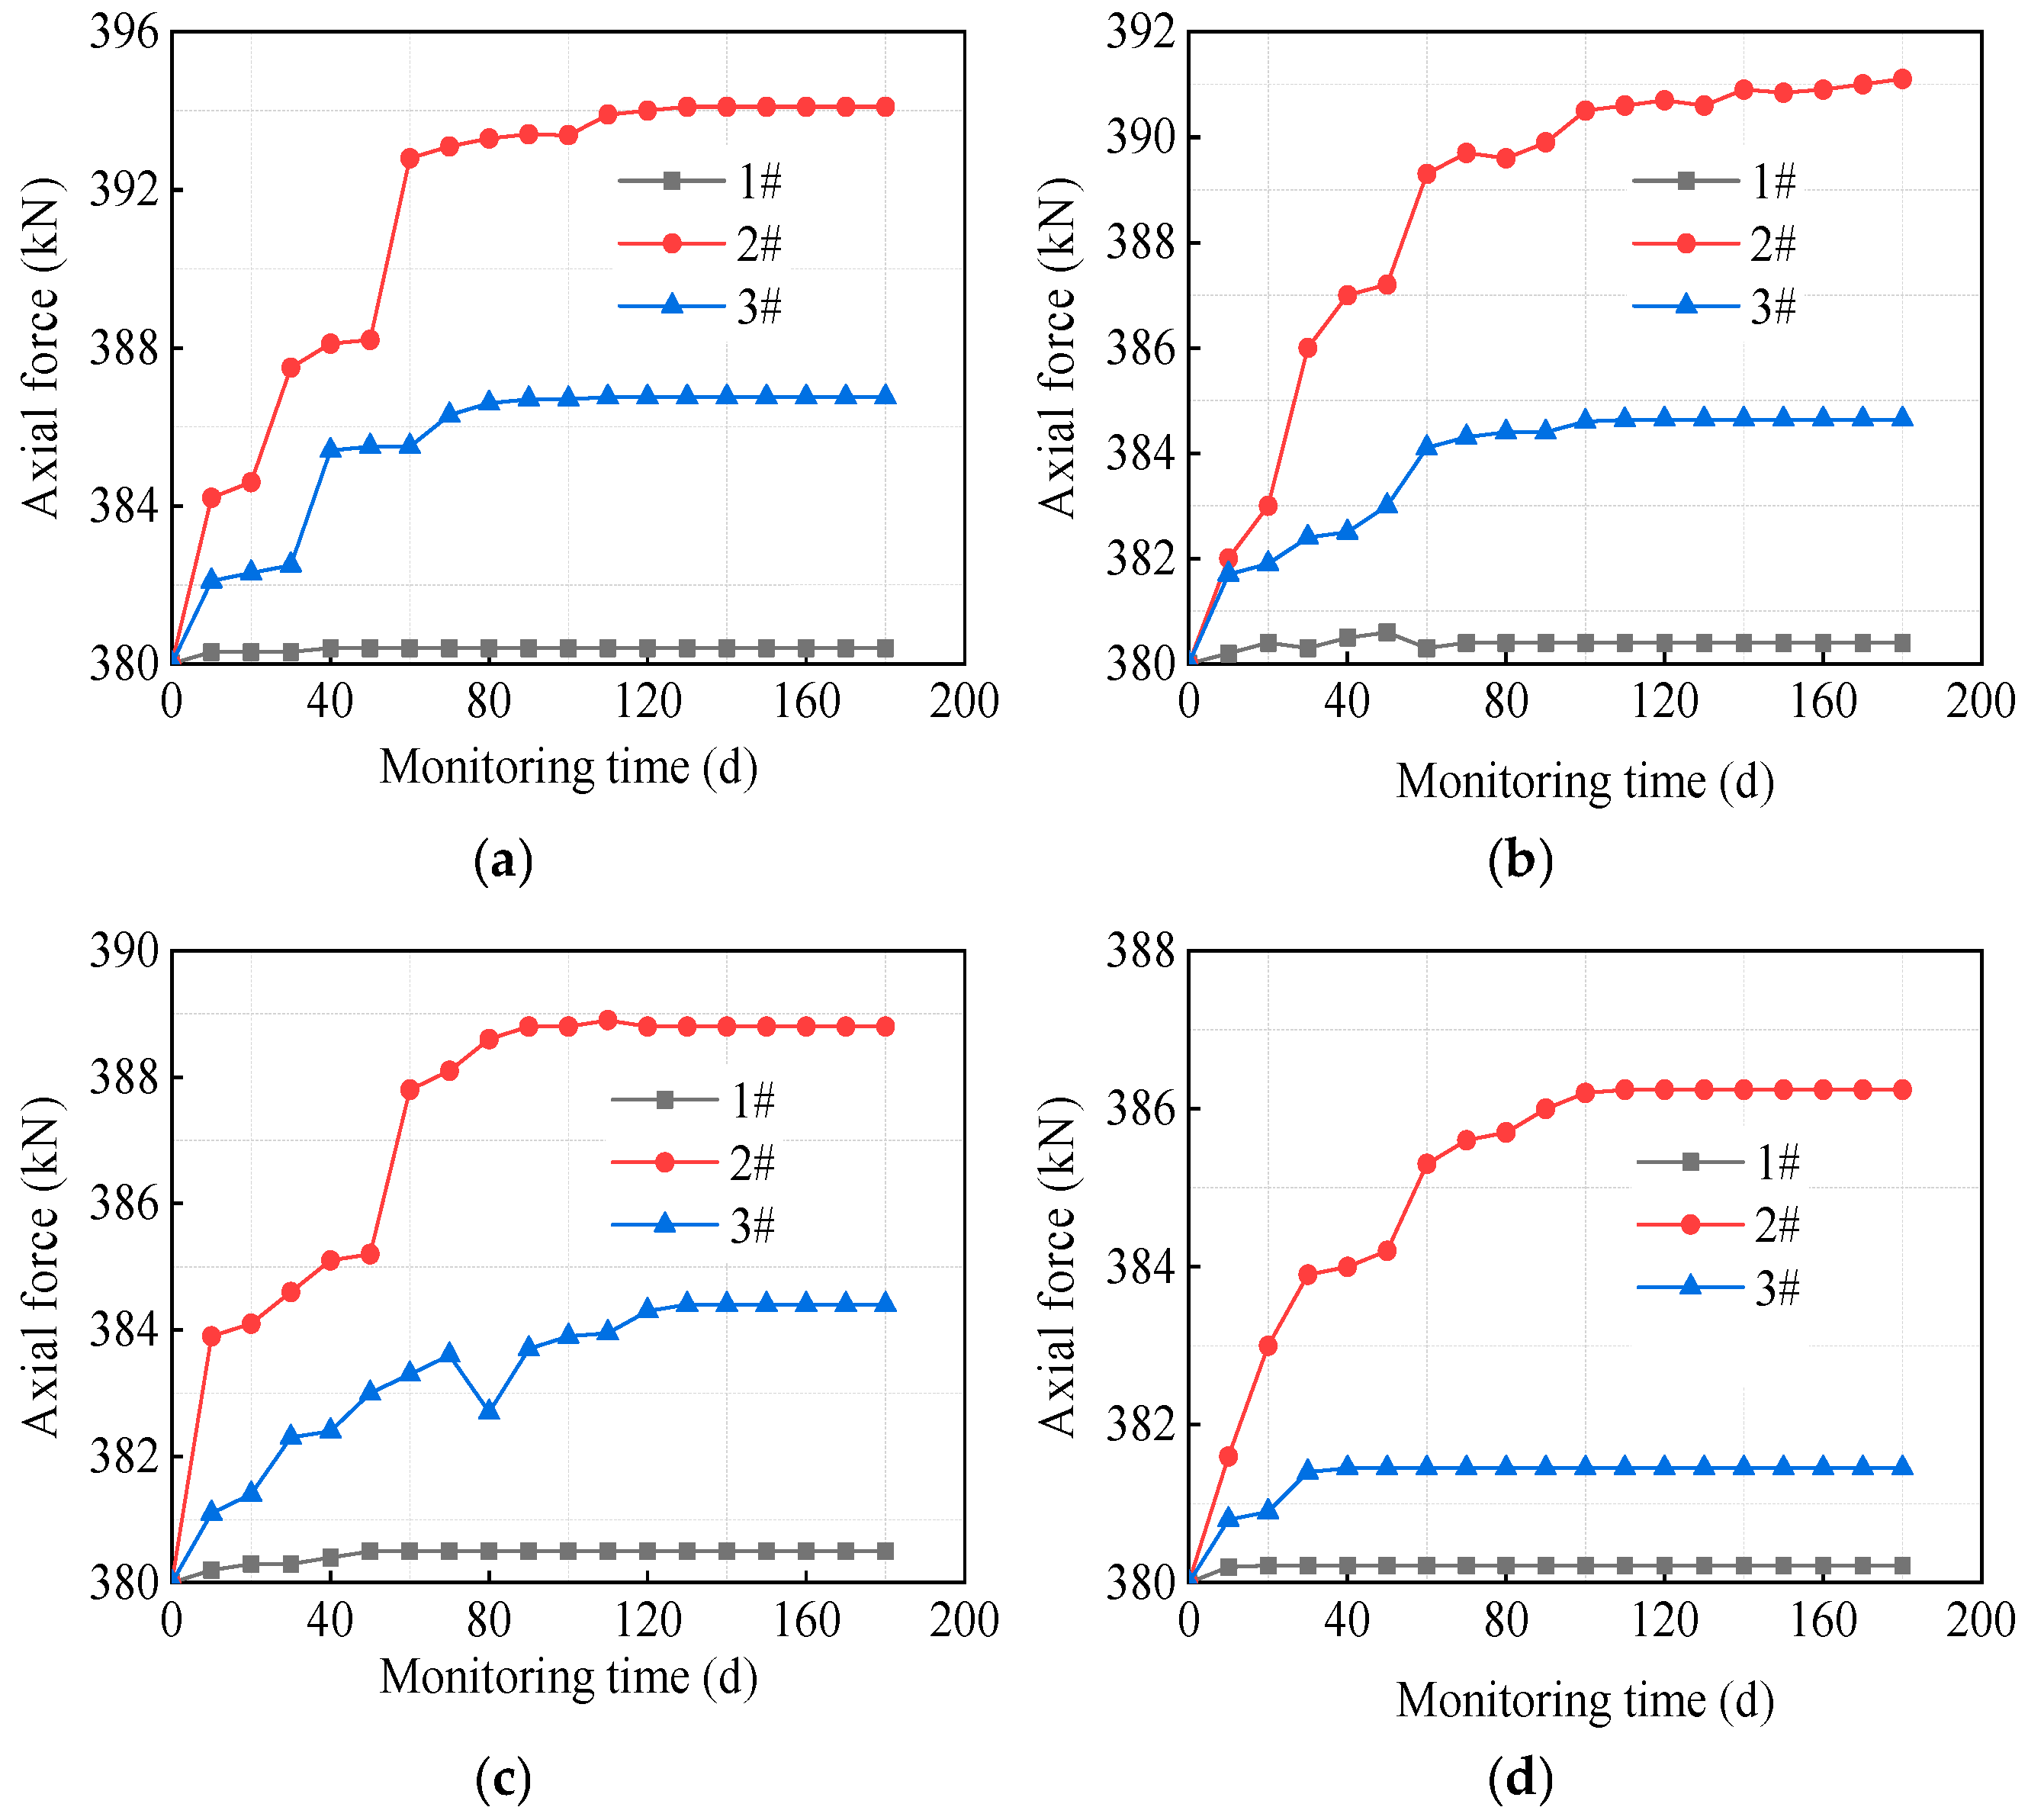
Figure 7 shows the axial force variation curves of each anchor rod in the 2nd-stage slope. Each anchor rod was equipped with three anchor rod sensors, numbered 1#, 2#, and 3# sequentially from the top (near the slope surface) to the bottom of the anchor rod.
Figure 7.
Monitoring curves of axial force of secondary slope anchors: (a) A1; (b) A2; (c) A3; (d) A4.
From the axial force variation curve of a single anchor rod, it can be observed that as the monitoring time progresses, the axial force of the anchor rod gradually increases and then stabilizes. Among the sensors, the axial force variation of Sensor 1# is relatively small, while that of Sensor 2# is the largest. The axial force increment of Sensor 3# is approximately 1/3 to 1/2 of that of Sensor 2#. It is evident from this that during the service period of the anchor rod, the axial tension at the middle part of the anchor rod is the largest, exceeding the force at both ends. Since Sensor 1# is located close to the slope surface, the coupling effect between the anchor rod and the rock mass here is weak due to the influence of grouting quality. Additionally, it is subjected to the opposing self-weight load of the frame beam, resulting in the smallest axial tension at Sensor 1#. While Sensor 3# is also located at the end of the anchor rod, the grout here is more compact, allowing the anchor rod and rock mass to work together more effectively. Consequently, the axial force of the anchor rod at this position also exhibits a considerable increment.
From the overall variation trend of the axial force of each anchor rod in the 2nd-stage slope, the growth rate of the anchor rod’s axial force shows phased changes, with a time span of about 60 days (the construction time of two adjacent lower slopes). Although the variation curves of the maximum axial force of the four anchor rods (A1–A4) are not identical, all curves include a rapid change phase and a slow change phase, with these two phases alternating. This phenomenon should be related to the construction progress: when the excavation speed of the lower-stage slope is fast, the disturbance to the upper-stage slope is strong, leading to a larger lateral displacement of the upper-stage slope within a certain period, and thus a faster growth rate of the axial force of the anchor rods in the upper-stage slope. Similarly, when the excavation speed of the lower-stage slope slows down, the growth rate of the axial force of the anchor rods in the upper-stage slope also begins to decrease.
Furthermore, an analysis combined with the project’s construction progress reveals that the rapid growth of the axial force of each anchor rod in the 2nd-stage slope mainly occurs during the excavation of the 3rd- to 5th-stage slopes. As indicated in the previous analysis, the lateral displacement of the 2nd-stage slope also primarily occurs during this phase. This shows that the variation of the anchor rod’s axial force is directly affected by the slope displacement. After the completion of the support for the 5th-stage slope, the overall stability of the cutting slope is controlled to a large extent, the displacement variation of the 2nd-stage slope gradually stabilizes, and the axial force of each anchor rod in the 2nd-stage slope also enters a slow change phase.
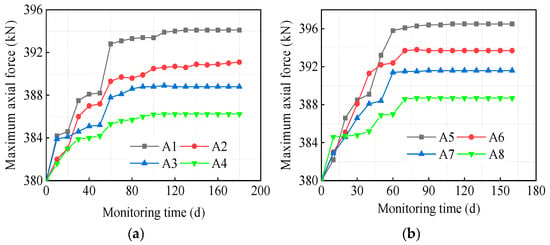
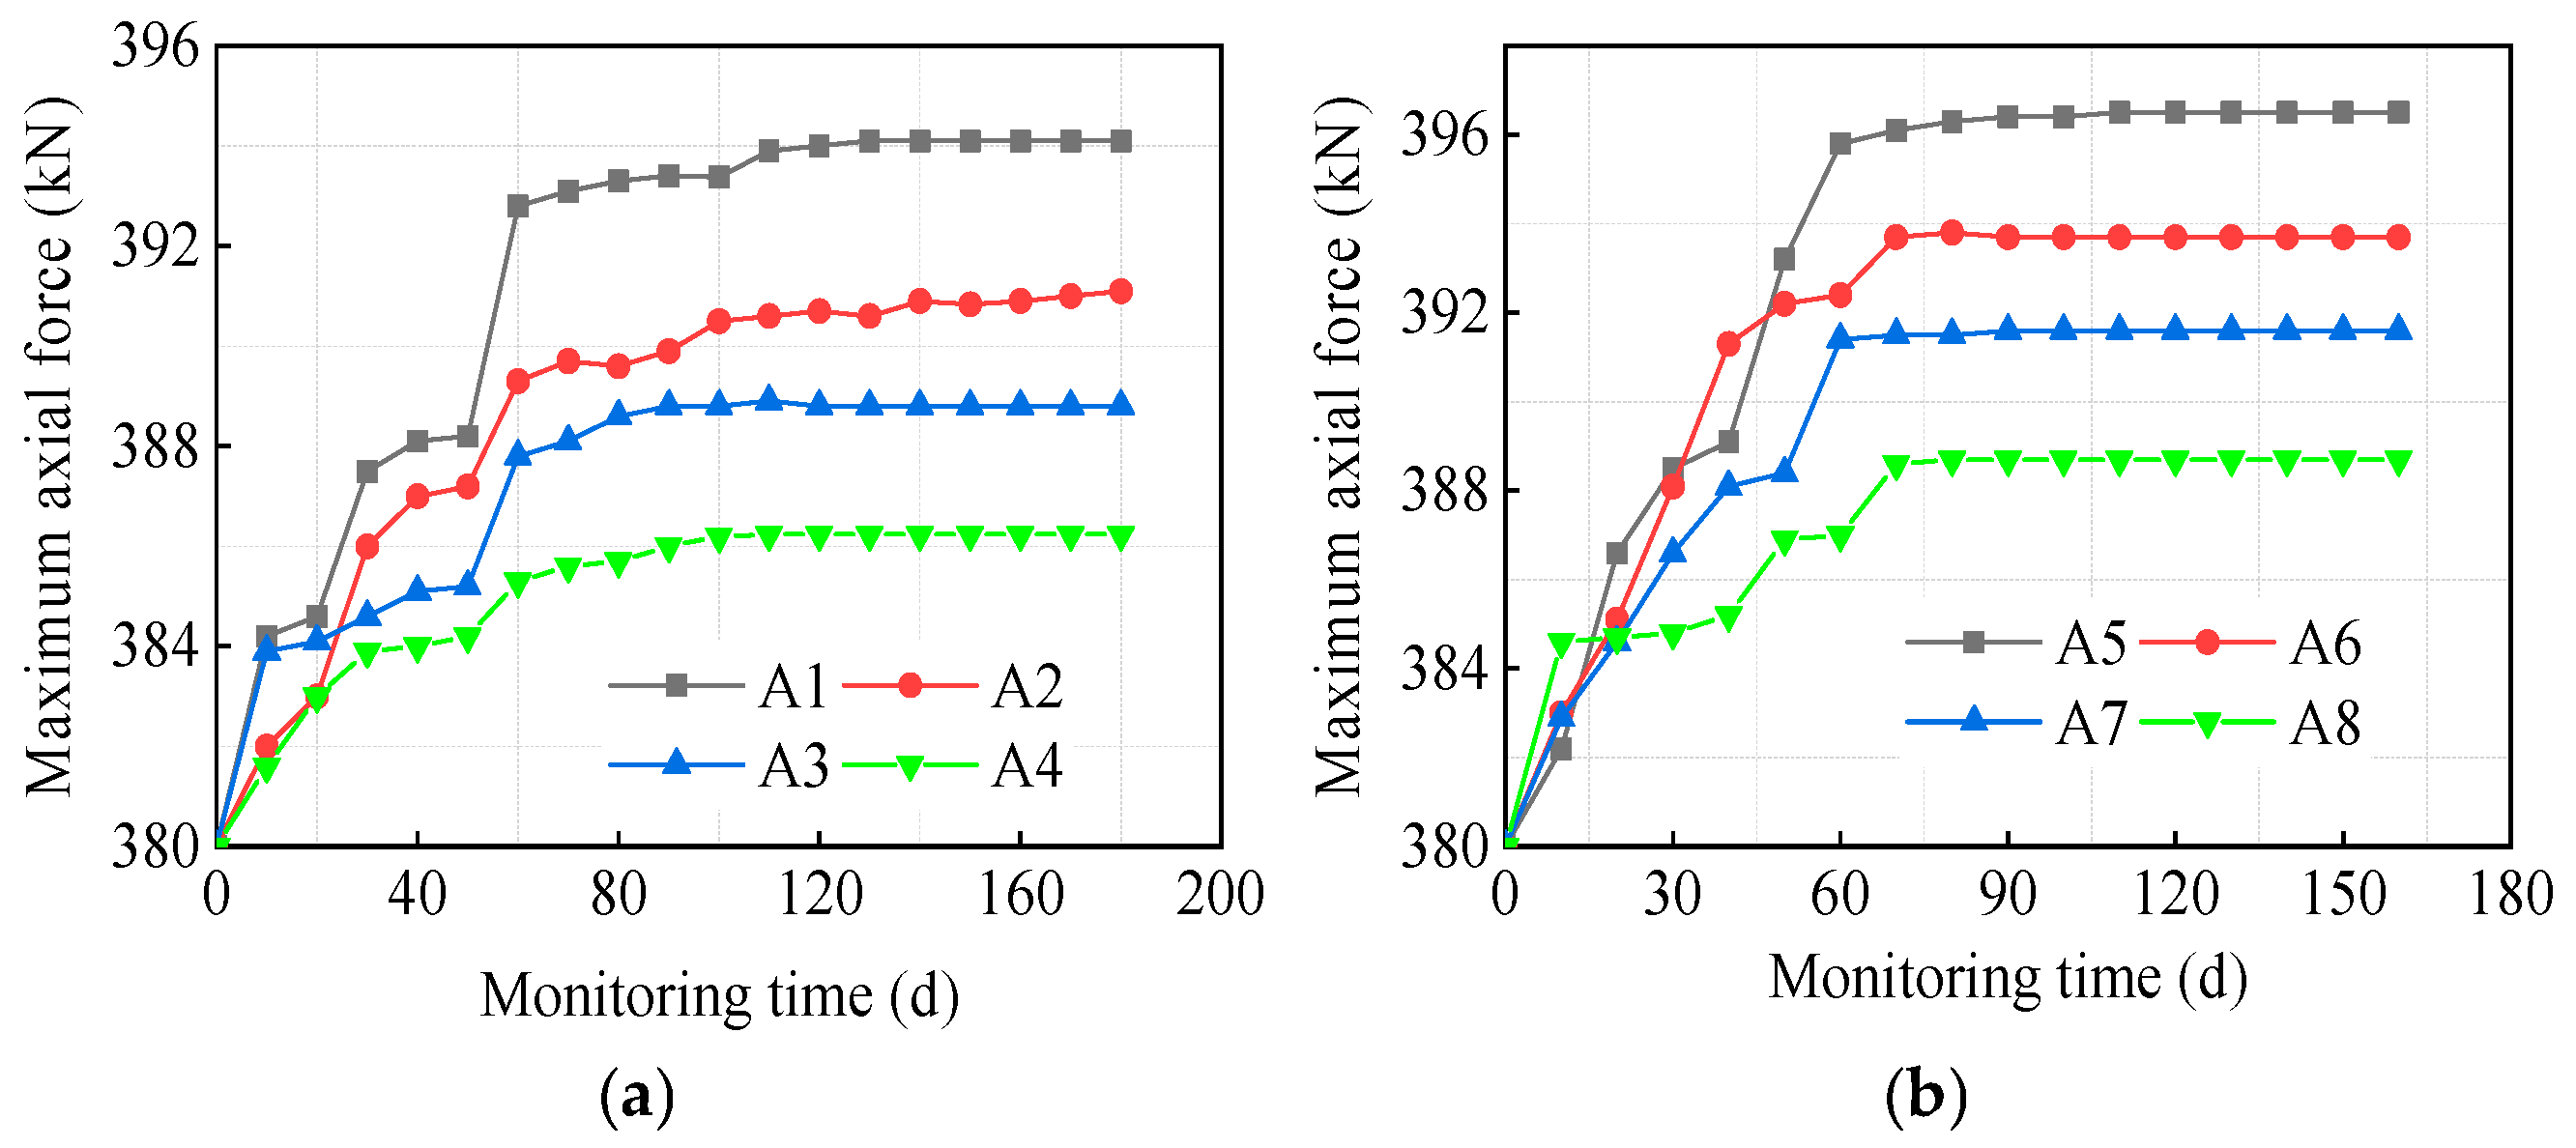
Figure 8 presents the axial force monitoring curves of the anchor rods installed on the secondary and tertiary slopes. To conduct a comparative analysis of the axial force variation patterns of anchor rods at different positions, the maximum axial force of each anchor rod (i.e., the monitoring data from the 2# anchor rod sensor) was selected for analysis.
Figure 8.
Monitoring curves of axial force of anchors: (a) The second-stage slope; (b) The third-stage slope.
As indicated by the anchor rod axial force distribution curves in the figure, the anchor rods for slope support are located at different positions within each slope level, resulting in variations in both their axial force increments and variation patterns. In the early stage of monitoring, the axial forces of all anchor rods within each slope level showed little difference. However, as the monitoring period progressed, the axial forces of the anchor rods in the lower part of each slope level gradually became greater than those in the upper part. Specifically, the closer an anchor rod was to the top of each slope level, the smaller its axial force increment.
Additionally, the distribution curve of lateral displacement along the slope depth (using the monitoring data on Day 145 as an example) in the figure reveals that the lateral displacement of the secondary and tertiary slopes follows a pattern of “smaller at the top and larger at the bottom” along the depth direction. Since the axial force of an anchor rod is primarily influenced by the lateral displacement of the corresponding slope level, the anchor rods at the bottom of each slope level exhibit a larger axial force increment.
From the above analysis, it can be concluded that the rapid increase in the axial force of anchor rods in the 2nd-stage slope is concentrated during the excavation period of the 3rd- to 5th-stage slopes. Moreover, the faster the excavation of the lower-stage slope, the higher the growth rate of displacement and anchor rod axial force in the upper-stage slope. For the excavation of similar slopes, the principle of “lower-stage excavation slower than upper-stage, and middle–lower slope excavation slower than upper slope” can be followed. Specifically, the excavation speed of middle–lower slopes (e.g., the 4th- and 5th-stage slopes) can be appropriately slowed down. After the completion of each stage of excavation, a time interval can be left before starting the next stage of excavation. This provides a “convergence buffer period” for slope displacement and anchor rod stress, thereby reducing the risk of local instability caused by the superposition of disturbances.
3.3. Anchoring Force of Anchor Cable
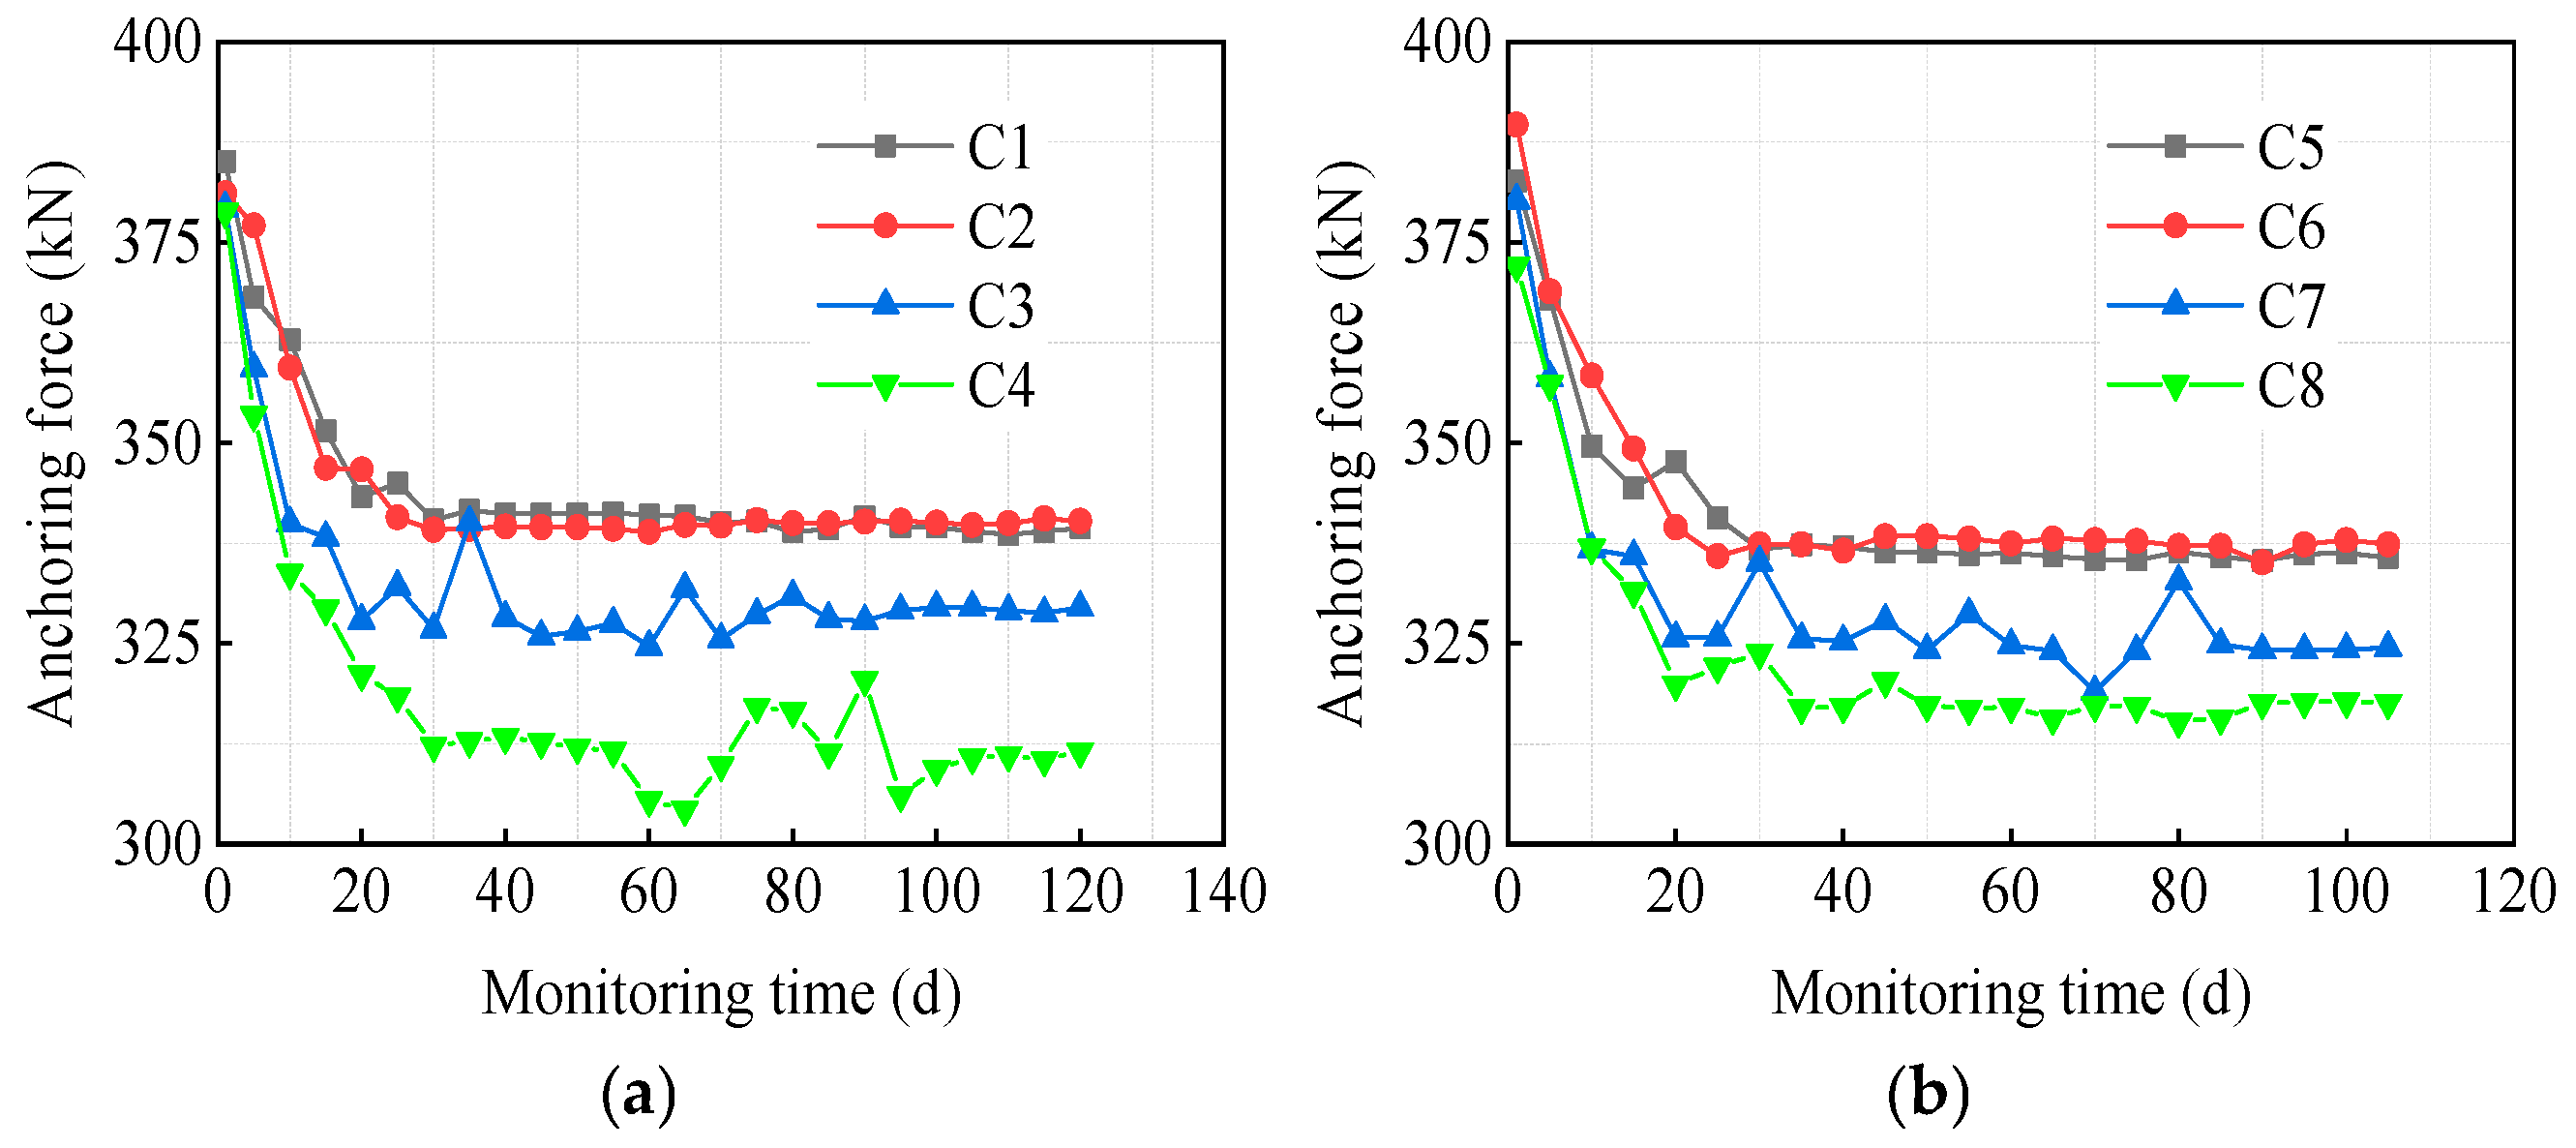
Before tensioning the anchor cables, an anchor cable sensor was installed below the anchor of each anchor cable. Figure 9 shows the monitoring curves of the anchoring force of the anchor cables on the 4th- and 5th-stage slopes.
Figure 9.
Monitoring curves of the anchoring force of the anchor cables: (a) The fourth-stage slope; (b) The fifth-stage slope.
Analysis shows that, unlike the axial force growth of anchor rods, all anchor cables will experience varying degrees of anchoring force loss after tensioning is completed. This is because the axial force variation of the anchor rod is mainly related to the horizontal lateral deformation of a single slope. In contrast, the design length of the anchor cable is 22 m, directly connected to the deep rock mass of the road cut slope. The compression deformation of cracks in deeply weathered rock mass is greater than the horizontal deformation of a single slope, resulting in varying degrees of anchoring force loss in the anchor cable.
It can thus be seen that, compared with anchor rods, anchor cables have a longer acting length and more complex force conditions. The anchoring force of anchor cables is not only related to the lateral deformation of the slope but also to the deformation of the anchorage, the relaxation of the steel strands, the compaction of fractures in the weathered rock mass, and the creep deformation of the rock mass.
Further analysis of the monitoring curves in the figure shows that the values of the stable anchoring forces of anchor cables C1 to C8 are 339.4 kN, 340.3 kN, 329.5 kN, 311.6 kN, 335.7 kN, 337.4 kN, 324.5 kN, and 317 kN, respectively. Among them, the anchoring force losses of anchor cables C4 and C8 are the most significant, with loss rates of about 18.1% and 16.6%, respectively. According to the position of each anchor cable in Figure 1, it can be observed that the anchor cables with relatively large loss of anchoring force are concentrated at the top of each slope. In addition, it can be seen that the anchoring force of the anchor cables acting on the top of each slope also exhibits significant fluctuations, indicating that they are more susceptible to environmental changes and construction interference.
For slopes reinforced with multiple anchor cables, the variation in anchoring force of cables at different positions differs significantly. This can easily lead to uneven stress distribution in the lattice beams, resulting in large tensile stress in the lattice beams and subsequent concrete cracking [22]. Therefore, for similar projects, the connection joints between anchorages and frame beams should be strengthened in the design phase. For instance, additional reinforcing steel bars can be added at the anchorage installation positions on frame beams, and the cross-sectional dimensions can be locally increased (e.g., from 0.4 × 0.4 m to 0.5 × 0.4 m) to enhance crack resistance. Meanwhile, it should be clearly specified that the concrete strength of frame beams must reach over 80% of the designed strength before cable tensioning so as to prevent deformation caused by premature stress application. To reduce the loss of anchor cable anchoring force, re-tensioning can be performed once after the initial tensioning to compensate for the early-stage anchoring force loss of anchor cables.
3.4. Discussion
In existing studies, the displacement of slopes and the internal forces of support structures are often analyzed separately, without a detailed explanation of their inherent relationship. In fact, the three monitoring items—slope lateral displacement, anchor rod axial force, and anchor cable anchoring force—do not exist independently. Instead, they form a dynamic, interrelated system centered on the “slope deformation–support force–stability control” framework, featuring progressive layers and mutual feedback. With the deformation induced by slope excavation disturbance as the core trigger, the three items achieve a balance between force and displacement through the mechanical response of the support structure, jointly maintaining the overall stability of the slope.
First, slope lateral displacement is the core inducement for changes in anchor rod axial force and anchor cable anchoring force. For anchor rod axial force, the core function of anchor rods is to enhance the integrity of fully weathered rock formations and suppress local instability, and this function can only be activated by slope displacement. Monitoring results show that the stage of rapid growth in the axial force of anchor rods in the 2nd-stage slope highly coincides with the excavation period of the 3rd- to 5th-stage slopes. This is precisely because the excavation of lower-stage slopes causes an increase in the lateral displacement of upper-stage slopes, forcing the anchor rods to bear greater axial tension to resist deformation. Moreover, the faster the displacement grows, the higher the growth rate of anchor rod axial force becomes. Meanwhile, the distribution law of lateral displacement—“smaller at the top and larger at the bottom” along the depth—directly leads to significantly greater axial force in the anchor rods at the lower part of each slope stage than those at the upper part. Anchor rods in displacement-concentrated areas need to bear larger loads, forming a corresponding relationship where “displacement gradient determines axial force gradient.”
For anchor cable anchoring force, the purpose of initial tensioning is to proactively control the overall displacement of the slope, while one of the core causes of subsequent anchoring force loss is the deformation difference of deep rock masses. With a length of 22 m and tight connection to deep rock masses, anchor cables are affected by the accumulation of slope lateral displacement (especially in the middle and lower parts of the slope). This accumulation exacerbates the fissure compression deformation of deep weathered rock masses, the relaxation of steel strands, and the deformation of anchorages, ultimately resulting in varying degrees of anchoring force loss. In addition, the more significant anchoring force loss and obvious fluctuation of anchor cables at the slope top are also closely related to the displacement changes in this area caused by construction disturbance.
Second, the mechanical responses of anchor rod axial force and anchor cable anchoring force jointly restrict the lateral displacement of the slope. In the support system, anchor rods focus on addressing local displacement above the rock formation interface, while anchor cables mainly control the overall displacement and stability of the slope. When the 2nd- and 3rd-stage slopes generate lateral displacement due to the excavation of lower-stage slopes, the middle part of the anchor rods experiences maximum axial force due to friction resistance being fully mobilized. Through the “integrated” effect of the grouting body and rock mass, the force induced by local deformation is transmitted to stable rock formations, thereby restricting the continuous increase in displacement. Monitoring data show that the displacement of the 2nd- and 3rd-stage slopes only stabilizes after the completion of anchor cable support for the 4th- and 5th-stage slopes. This confirms that the restriction of local displacement by anchor rods relies on the premise of overall stability.
In numerical simulation and theoretical research, experimental data is the key basis to ensure the rigor of both, and many expanded studies are mostly based on experimental data. In slope stability analysis, key factors affecting stability can be studied to establish a predictive model for slope dynamic stability [30]. As mentioned in the above analysis, for deep road cut slopes, anchor cables are the key to controlling the overall stability of the slope. Some scholars have established a prestress loss model for slope anchor cables and verified the accuracy of the model through experimental data [22,31]. When analyzing the construction stability of deep-cutting slopes, existing models for the loss of prestress force of slope anchor cables can be combined to calculate the prestress loss value of slope anchor cables in order to predict the stability changes of the slope.
4. The Influence of Anchoring Force Loss of Anchor Cables on the Overall Stability of Slopes
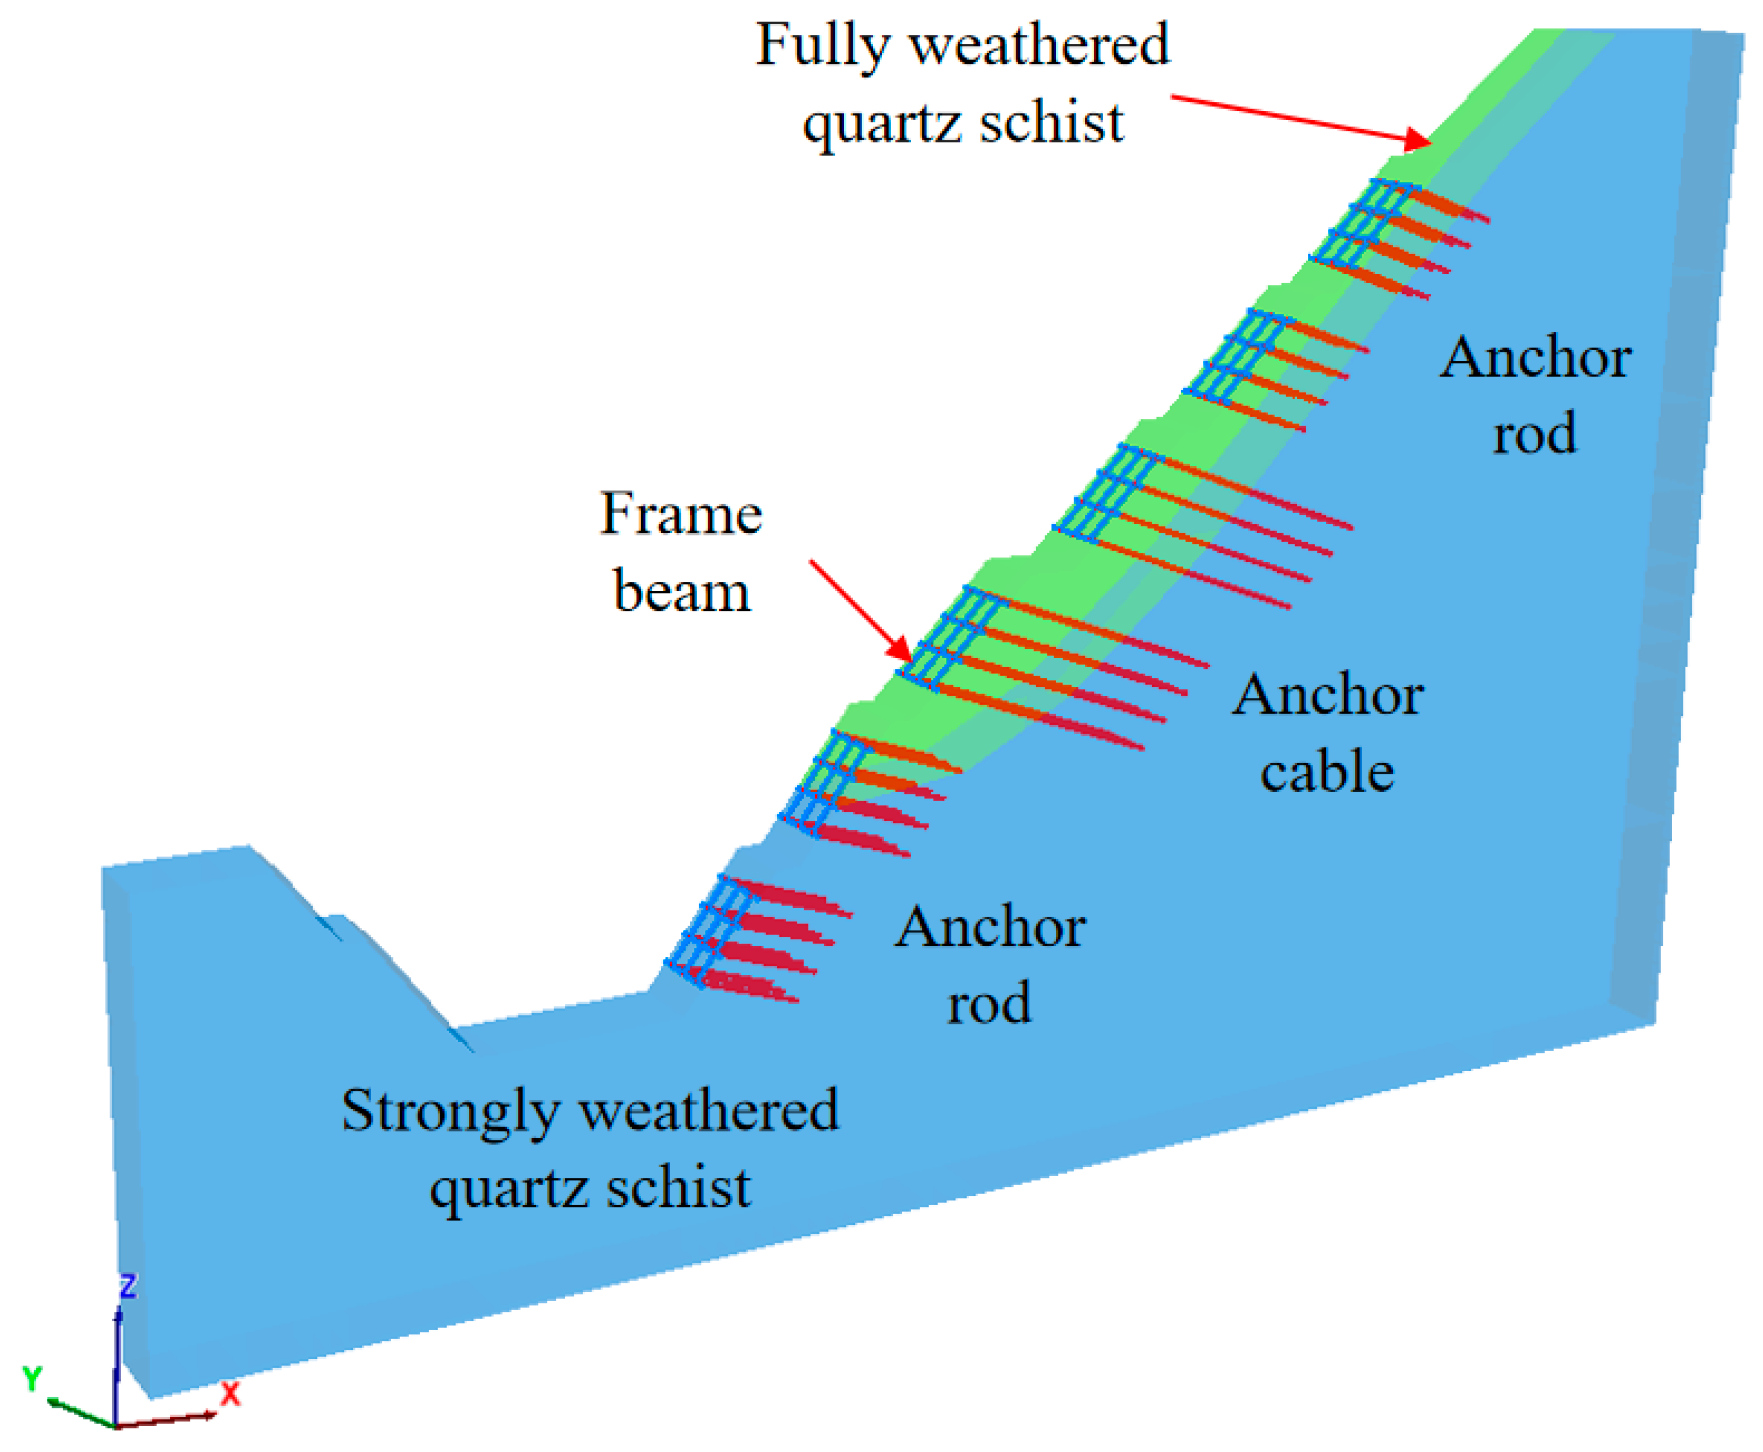
From the above analysis, the anchor rods for the 2nd- and 3rd-stage slopes focus on addressing local displacement above the rock formation interface, while the anchor cables for the 4th- and 5th-stage slopes are crucial for controlling the overall stability of deep-cutting slopes. However, after the completion of construction, the anchoring force of each anchor cable on the 4th- and 5th-stage slopes will experience varying degrees of loss. To analyze the impact of such anchoring force loss on the overall stability of the slopes, the finite difference software FLAC3D was used to establish a 1:1 scale model of the deep-cutting slope after support installation (see Figure 10), with the model having a length of 6 m in the y-direction.
Figure 10.
Numerical analysis model.
In the slope support simulation, both rock bolts and anchor cables were simulated using the built-in Cable element of FLAC3D, while the grid beams were simulated using the built-in Beam element of FLAC3D. The cross-sectional dimension of the grid beams is 400 × 400 mm, and the spacing between grid beams in all directions is 2 m. During the model calculation, the mechanical parameters of the slope rock mass are based on the design data of the construction site (see Table 1); the mechanical parameters of the Cable element are based on the parameters of the rock bolts used in the project; and the mechanical parameters of the Beam element are based on the relevant parameters of C30 reinforced concrete (see Table 2 and Table 3).
Table 2.
Mechanical parameters of cable element.
Table 3.
Mechanical parameters of beam element.
Before the model calculation, boundary conditions were defined as follows: the displacements of all nodes at the bottom of the model were fixed in all directions; nodes on both lateral boundaries were constrained against displacement in the [x]-direction, while nodes on both front–back boundaries were restricted from moving in the [y]-direction. Only the slope surface was retained as a free surface.
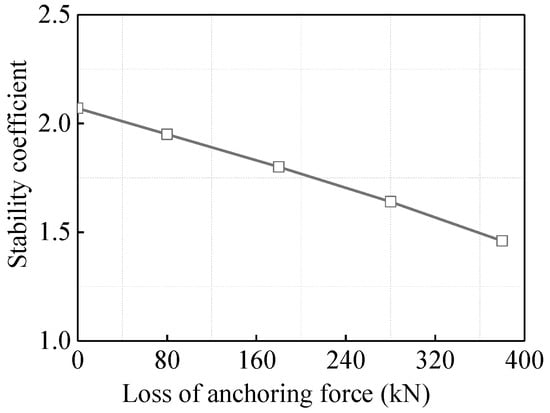
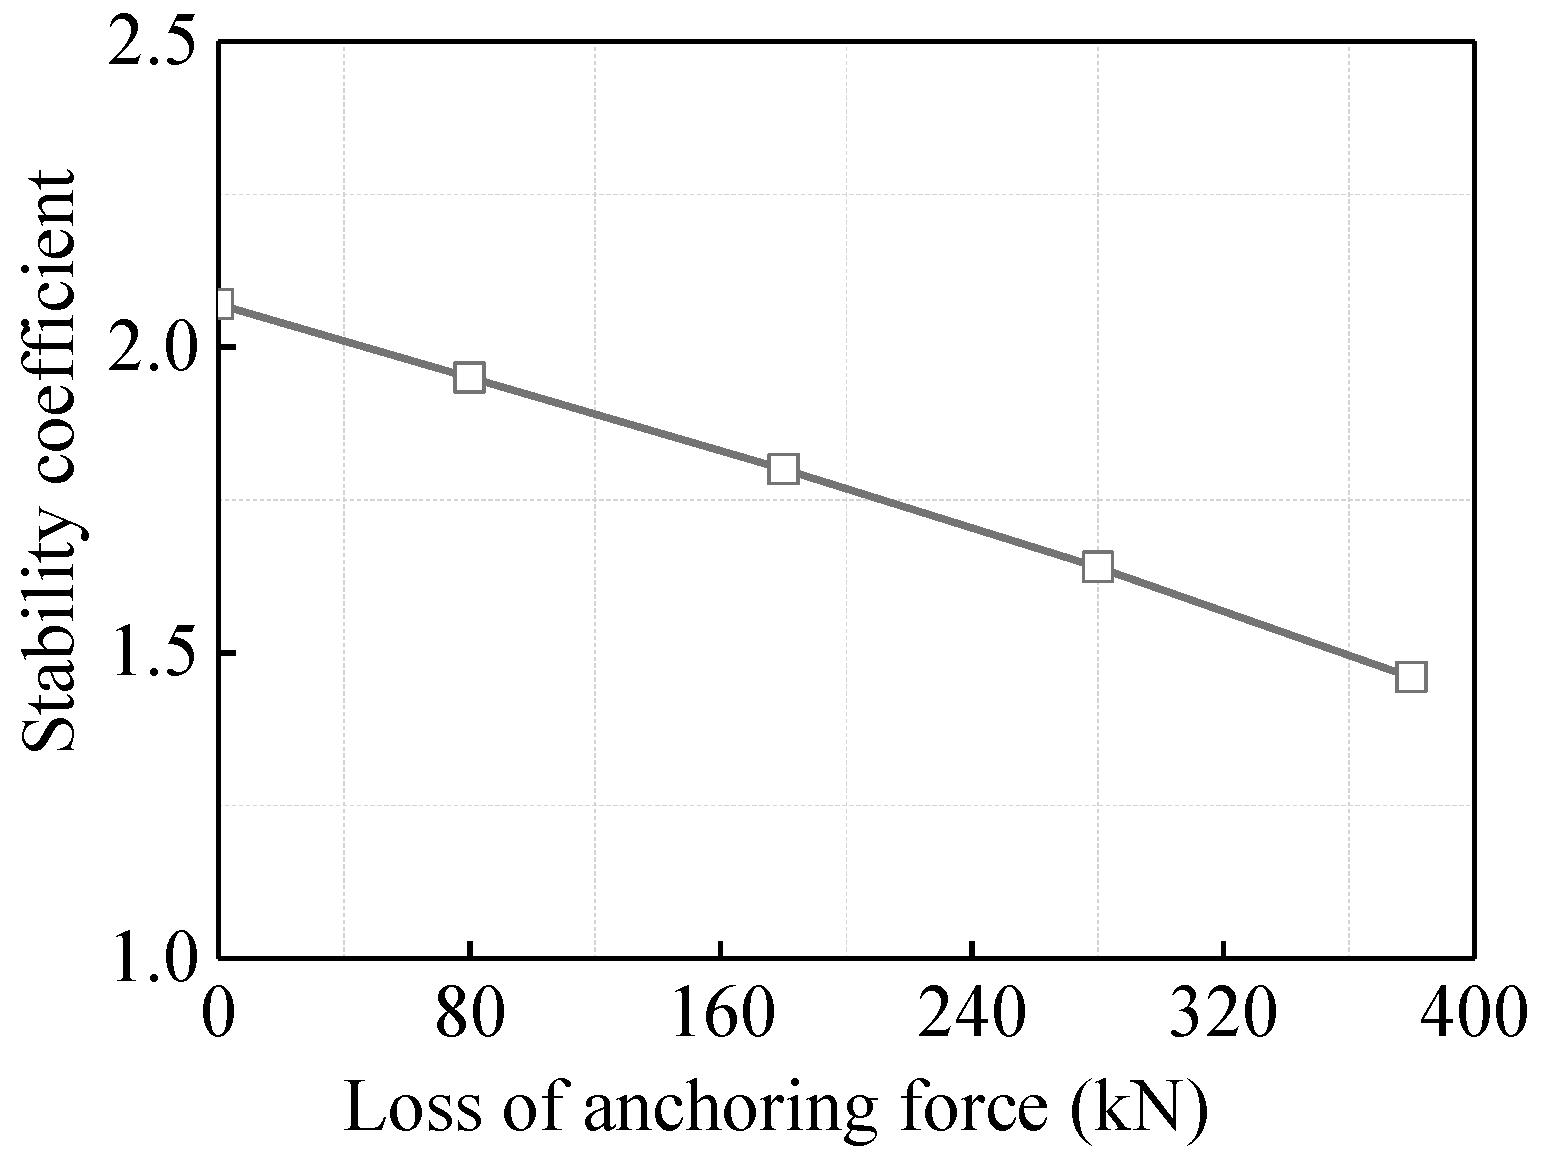
In the numerical calculation, the prestress of the rock bolts was kept constant, and only the prestress of the anchor cables on the 4th- and 5th-stage slopes was adjusted. Since the tensioning of rock bolts and anchor cables in numerical simulation is set in the form of load, the prestress of the anchor cables was analyzed here by substituting it with load (i.e., anchoring force). In the actual project, the actual tension load of the anchor cables on the 4th- and 5th-stage slopes is 380 kN. In this numerical simulation, the tension loads of the anchor cables on the 4th- and 5th-stage slopes were set to 380 kN, 300 kN, 200 kN, 100 kN, and 0 kN, respectively, so as to simulate the changes in slope stability when the anchoring force loss of the anchor cables reaches 0 kN, 80 kN, 180 kN, 280 kN, and 380 kN.
4.1. Horizontal Displacement of Slope
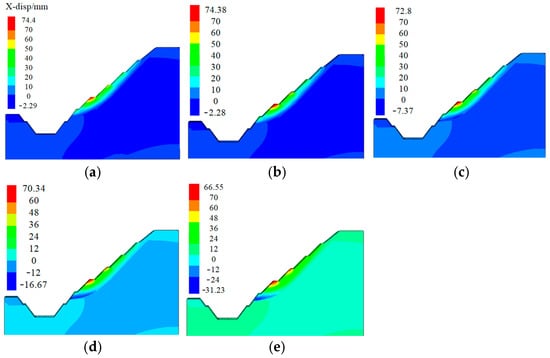
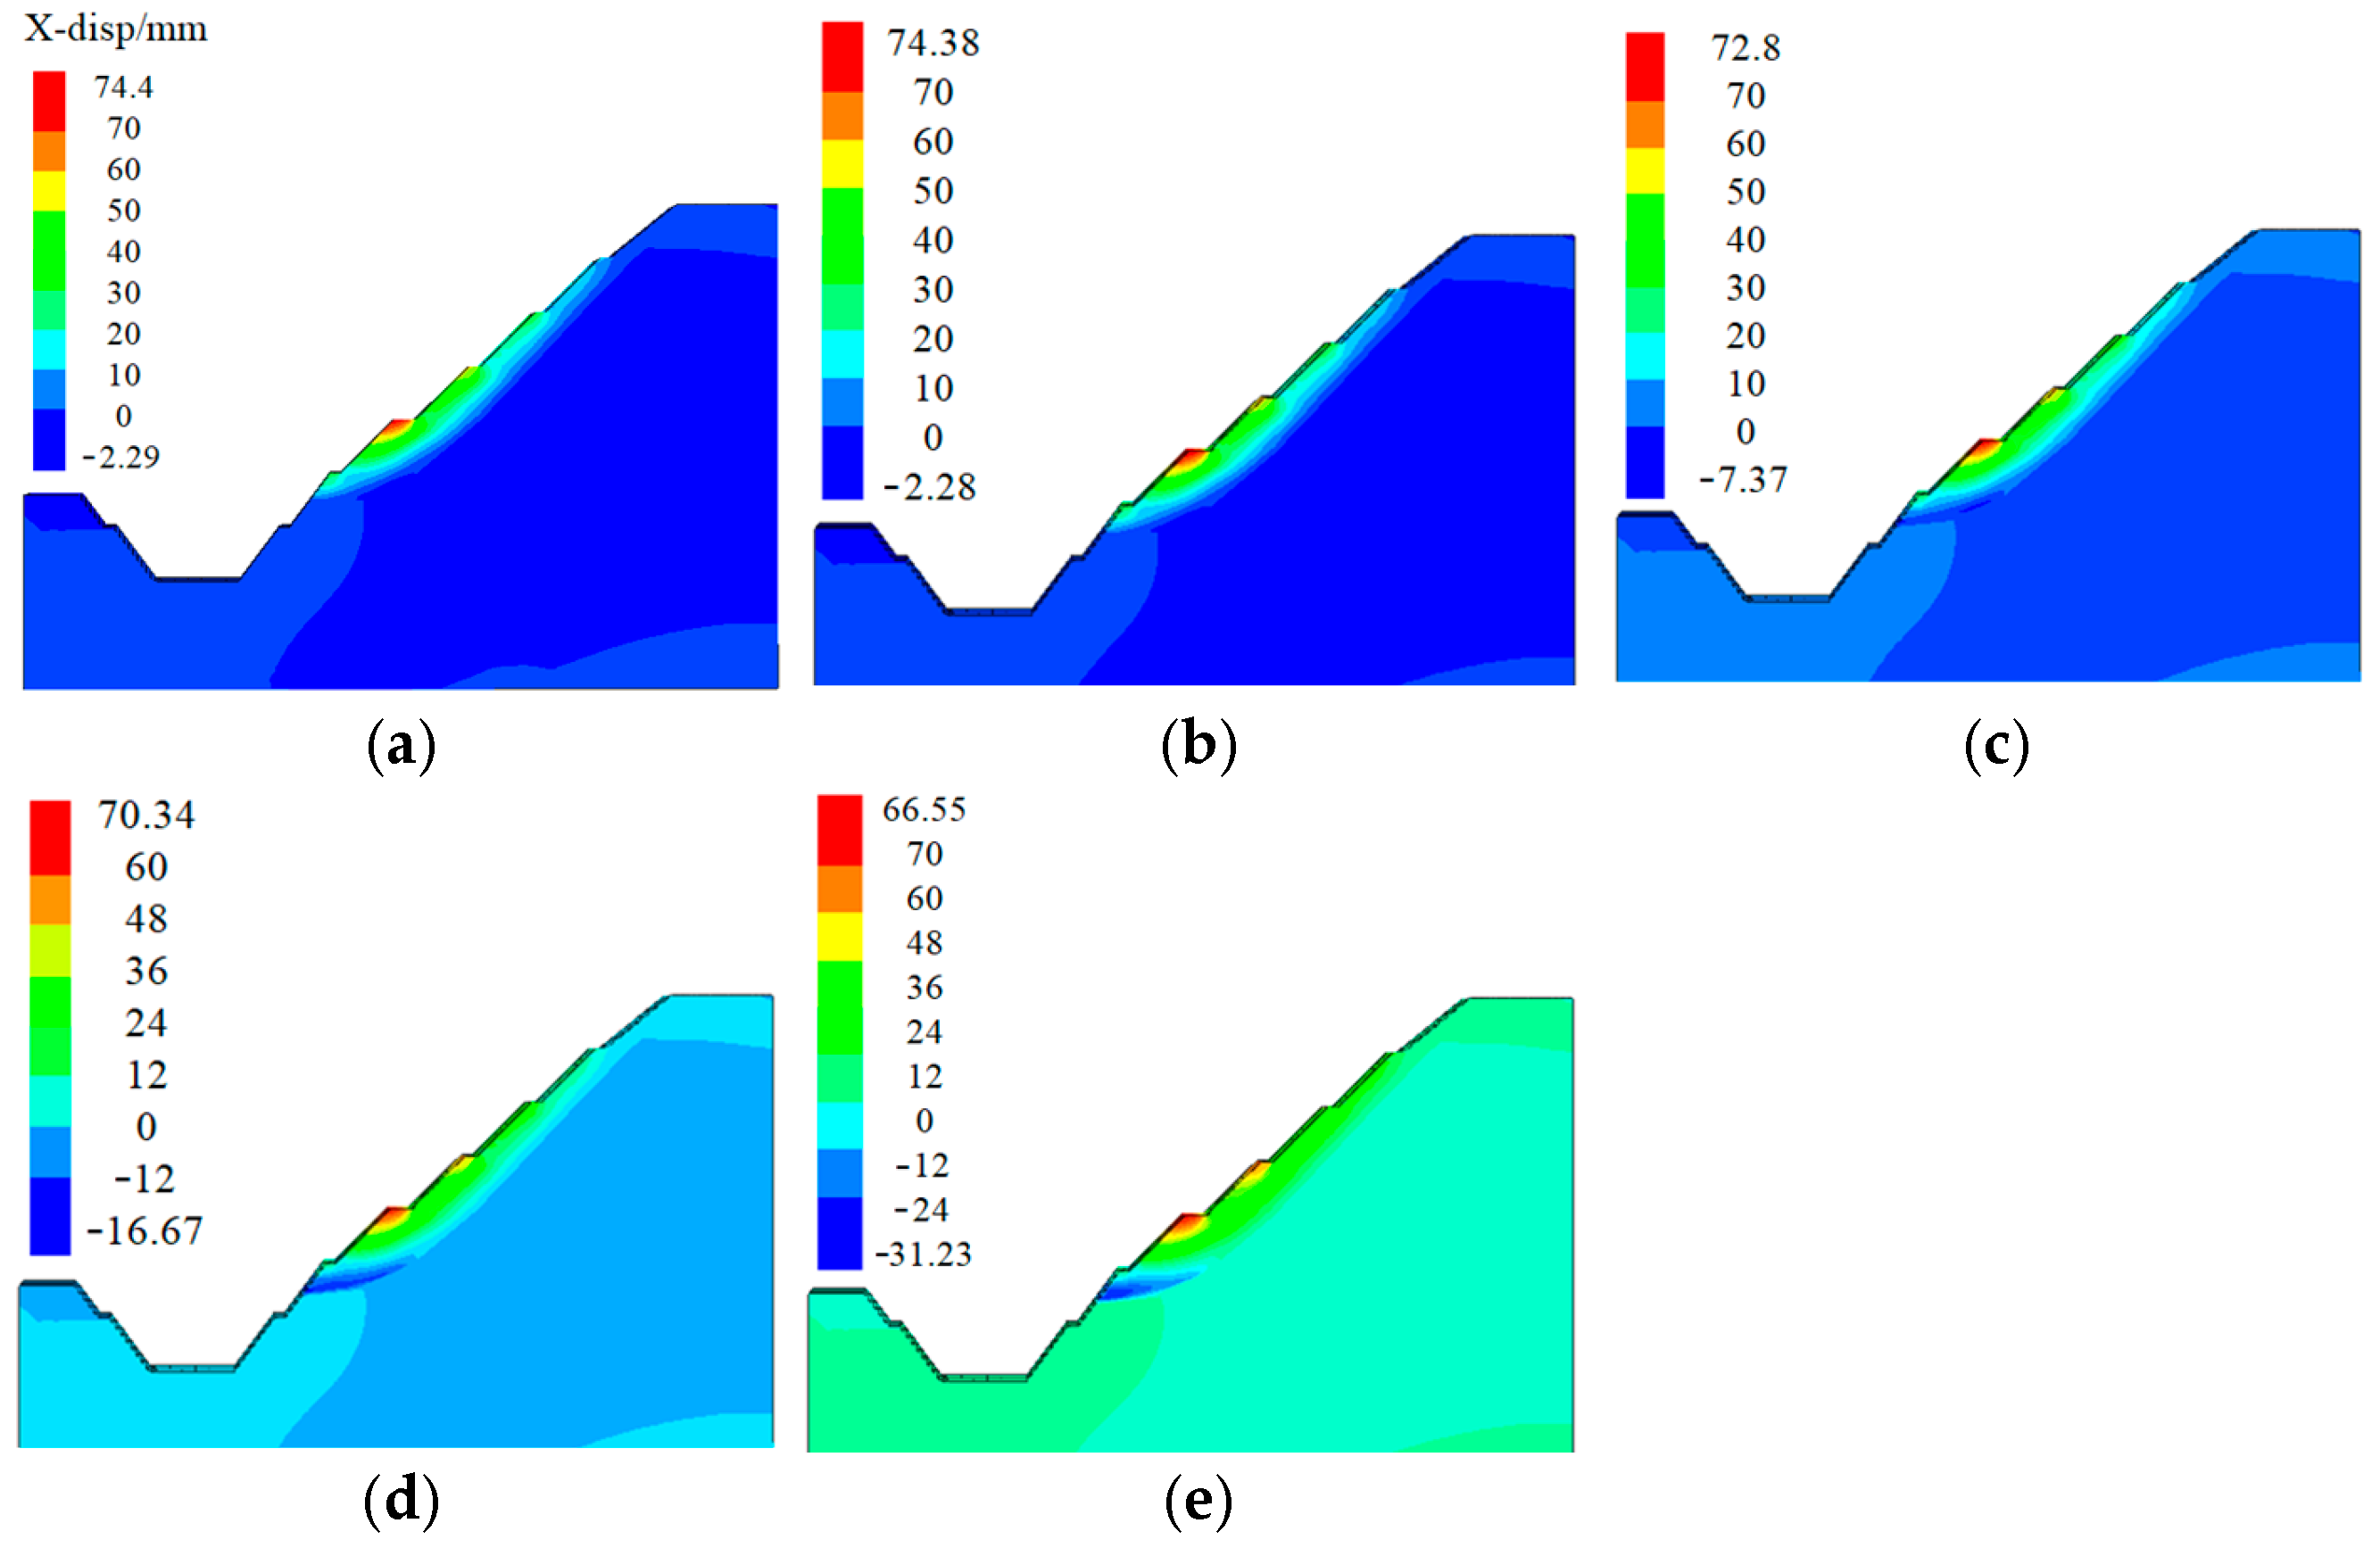
In FLAC3D, the contour maps are presented in layers, meaning that the values on the same horizontal line in the depth direction are the same. To avoid color overlap and affect the presentation of contour maps, the calculation results are presented in the form of slices (sliced at y = 3 m) here. Figure 11 presents the contour maps of slope horizontal displacement under different magnitudes of anchoring force loss. For ease of distinction, the positive displacement values in the contour maps are defined as rebound displacement (i.e., horizontal displacement caused by rebound effects during the excavation process), while the negative displacement values are referred to as sliding displacement.
Figure 11.
Horizontal displacement contour map of slope at different anchoring force losses: (a) Loss 0 kN; (b) Loss 80 kN; (c) Loss 180 kN; (d) Loss 280 kN; (e) Loss 380 kN.
As observed from the contour maps, when there is no anchoring force loss in the anchor cables, the sliding displacement generated across the entire slope is minimal due to the effective support provided by the anchor cables on the 4th- and 5th-stage slopes. However, as the anchor cables start to experience anchoring force loss—and the magnitude of this loss increases—the supporting effect of the anchor cables on the 4th- and 5th-stage slopes gradually weakens. Consequently, the sliding displacement of the entire slope begins to increase steadily, and a distinct sliding displacement zone forms in the middle part of the 6th-stage slope (i.e., at the rock stratum interface).
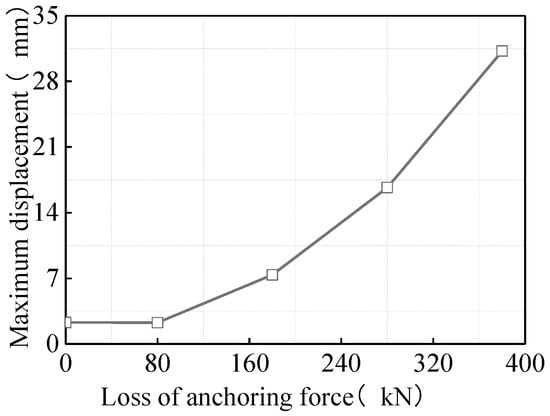
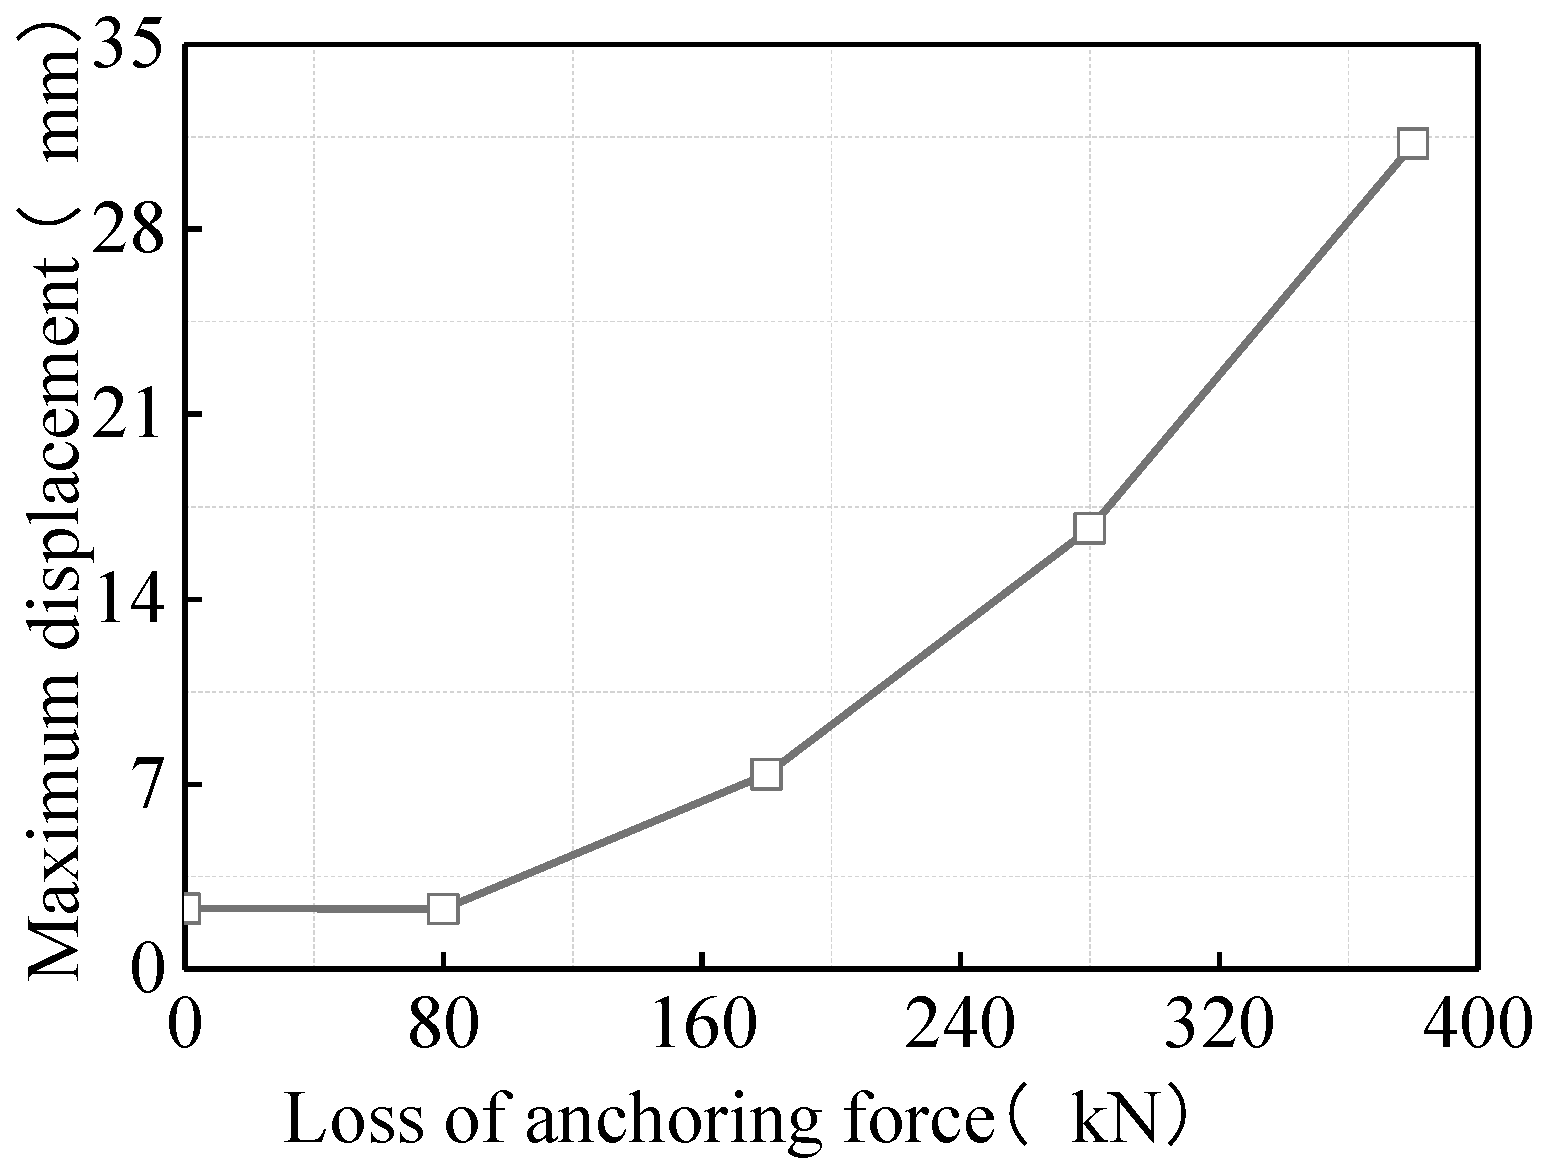
Figure 12 shows the curves of maximum sliding displacement of the slope under different magnitudes of anchor cable anchoring force loss. Although the sliding displacement of the slope increases as the anchoring force loss of the anchor cables on the 4th- and 5th-stage slopes becomes greater, the growth rate of sliding displacement varies at different stages of anchoring force loss. When the anchoring force loss of the anchor cables is less than 180 kN (i.e., the anchoring force loss ratio is less than 50%), the sliding displacement generated by the slope is small and its growth rate is relatively low. However, when the anchoring force loss ratio exceeds 50%, the sliding displacement of the slope begins to increase rapidly.
Figure 12.
Maximum sliding displacement of slope at different anchoring force losses.
In practical engineering, excessive lateral sliding of the slope not only reduces the safety of the project but also affects the normal service of the engineering structure. Therefore, for anchor cables with excessive anchoring force loss, certain prestress compensation measures should be adopted to reduce the potential safety hazards of the project.
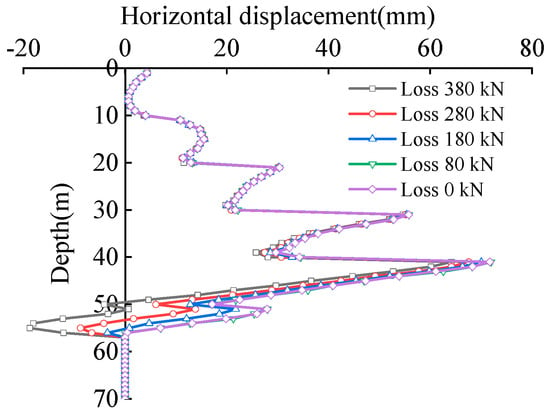
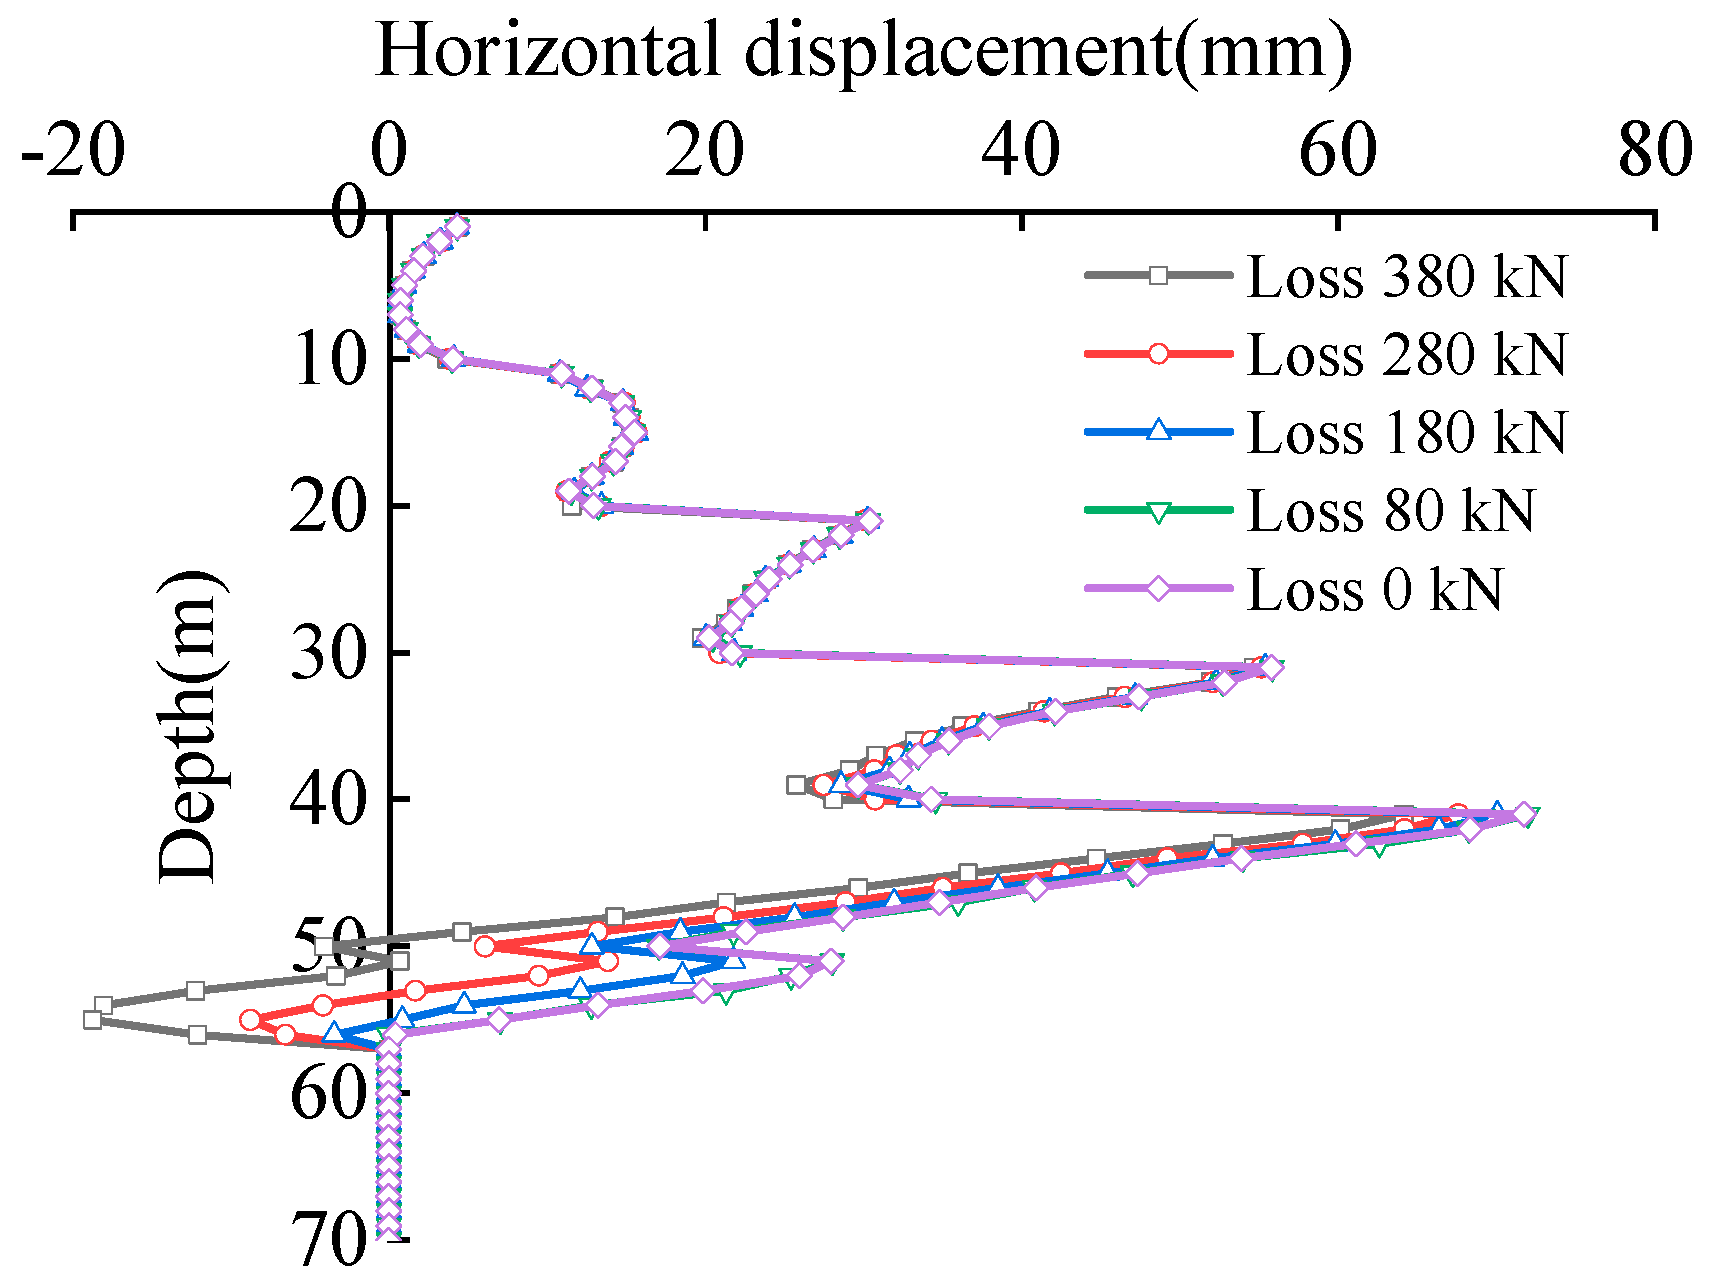
Figure 13 presents the curves of horizontal displacement at the slope surface of each grade under different magnitudes of anchoring force loss. As shown in the figure, when the anchoring force of the anchor cables on the 4th- and 5th-stage slopes is lost, only the horizontal displacement of the 4th- to 6th-stage slopes undergoes significant changes. This indicates that the influence range of anchor cable anchoring force variation on the overall slope horizontal displacement covers the slope grade reinforced by the anchor cables themselves and all slope grades below it.
Figure 13.
Horizontal displacement of slope surfaces at different anchoring force losses.
4.2. Slope Stability
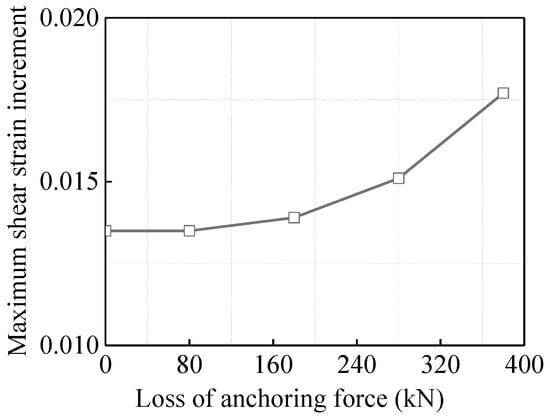
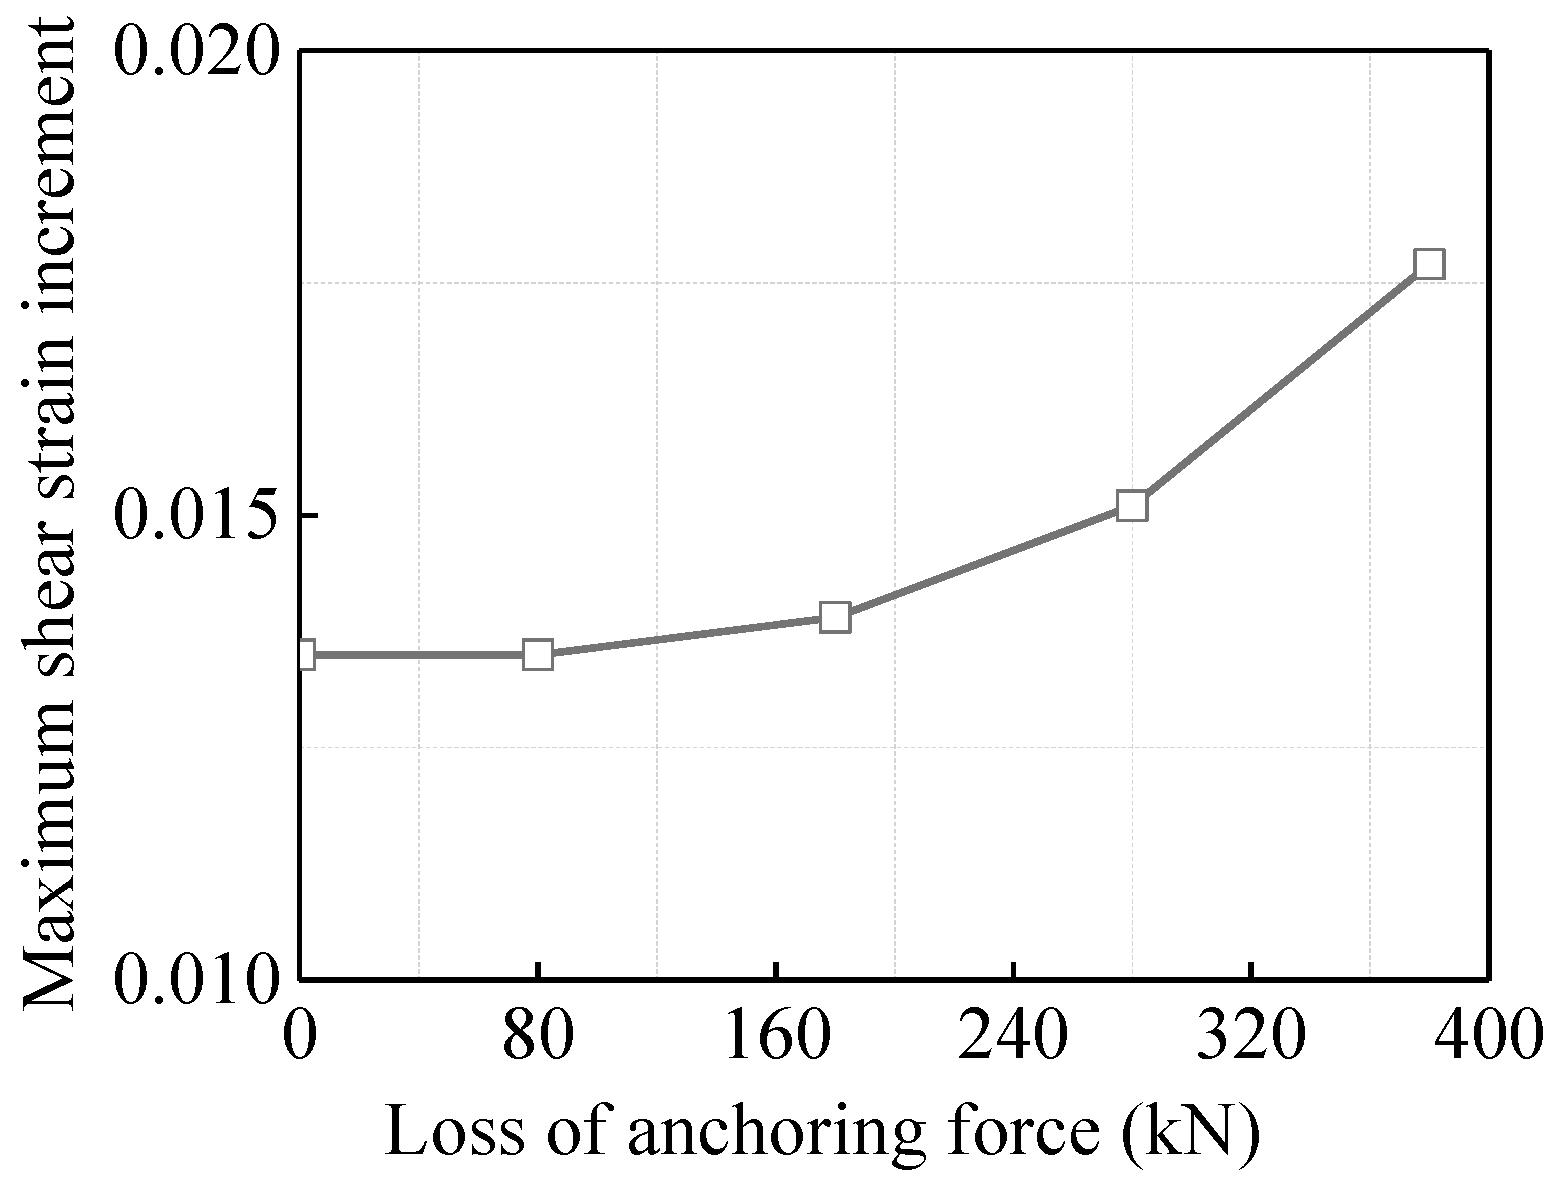
Figure 14 shows the variation curves of the maximum shear strain increment of the slope under different magnitudes of anchoring force loss. The mechanism by which anchor cables function in slope reinforcement is that, through the bonding effect of grout, the anchor cables tightly connect the weak rock strata with the stable rock strata. Therefore, the actual anchoring force of the anchor cables determines the support effect on the weak rock strata.
Figure 14.
The variation curve of the maximum shear strain increment of the slope at different anchoring force losses.
When the anchoring force of the anchor cables is lost, the connection between the weak rock strata and the stable rock strata weakens. Under the self-weight stress of the weak rock strata, the shear strain increment at the rock stratum interface begins to increase. As shown in Figure 14, with the continuous loss of the anchor cable anchoring force, the shear strain increment of the slope increases steadily. Consistent with the variation trend of the maximum sliding displacement, the change rate of the shear strain increment also increases as the magnitude of the anchoring force loss grows.
Figure 15 shows the variation curve of the slope stability coefficient under different magnitudes of anchoring force loss. When there is no anchoring force loss in the anchor cables on the 4th- and 5th-stage slopes, the overall stability coefficient of the slope is 2.07. However, when the anchoring force of these anchor cables is completely lost (reduced to 0 kN), the overall stability coefficient of the slope decreases to 1.46, representing a significant change. Therefore, the effective tensioning of the anchor cables on the 4th- and 5th-stage slopes plays a crucial role in controlling the overall stability of the slope.
Figure 15.
Stability coefficient variation curve of the slope at different anchoring force losses.
5. Conclusions
In order to study the stability evolution mode of deep-cutting slopes during staged excavation, corresponding on-site monitoring experiments were conducted. At the same time, FLAC3D was used to study the influence of anchor cable anchoring force loss on slope stability. The main research conclusions are as follows:
- (1)
- The lateral displacement growth of each slope stage is mainly concentrated during the excavation period. Unlike the second- and third-stage slopes, the lateral displacement of the fourth- and fifth-stage slopes is more significantly affected by the construction of the two adjacent lower-stage slopes. During the staged excavation of deep-cutting slopes, the middle and lower parts of the slope are key areas for displacement control, as they are subject to high lateral earth pressure and prone to the formation of sliding exit points.
- (2)
- The stress distribution of anchor rods follows the law of “concentration in the middle, and greater force at the lower part than the upper part”. Specifically, the axial force of a single anchor rod is maximum in the middle and minimum at the ends. In the later monitoring stage, the axial force of anchor rods at the lower part of each slope stage is significantly greater than that at the upper part, and the axial force increment of anchor rods at the slope top is the smallest. Therefore, for similar projects, the design strength of anchor rods at the upper part of each slope stage can be appropriately reduced and their spacing widened (e.g., from 2 m to 2.5 m), achieving a balance between support costs and safety.
- (3)
- After tensioning, all anchor cables experience varying degrees of anchoring force loss, mainly caused by rock mass fissure compression and anchorage deformation. Among them, the anchor cables at the slope top suffer the greatest anchoring force loss with obvious fluctuations. The influence of anchor cable anchoring force changes on the overall horizontal displacement of the slope is limited to the slope stage reinforced by the anchor cables themselves and all lower-stage slopes.
- (4)
- An anchor cable anchoring force loss exceeding 50% is a critical risk point, which directly weakens the overall stability of the slope. When there is no anchoring force loss, the slope stability coefficient is 2.07; when the anchoring force is completely lost, the coefficient drops to 1.46. This indicates that the effective tensioning of slope anchor cables plays a crucial role in controlling the overall stability of the slope.
Author Contributions
Methodology, K.S. and Z.L.; Software, Z.X.; Validation, K.S., Z.L. and Z.X.; Resources, Z.L.; Writing—original draft, K.S.; Writing—review & editing, Z.X.; Funding acquisition, K.S. and Z.L. All authors have read and agreed to the published version of the manuscript.
Funding
This research was funded by the Foundation for Henan University of Technology High-Level Talent Research Launch Fund Project (No.31401461), Zhengzhou R&D Special Fund Subsidy for Scientific Research Projects (No.31310122) and Zhejiang Province Construction Science and Technology Project (2022K076).
Data Availability Statement
The original contributions presented in this study are included in the article. Further inquiries can be directed to the corresponding author.
Conflicts of Interest
The authors declare no conflicts of interest.
References
- Li, Q.; Wang, Y.M.; Zhang, K.B.; Yu, H.; Tao, Z.Y. Field investigation and numerical study of a siltstone slope instability induced by excavation and rainfall. Landslides 2020, 17, 1485–1499. [Google Scholar] [CrossRef] [Scilit]
- Najib; Fukuda, D.; Kodama, J.I.; Fujii, Y. The Deformation Modes of Rock Slopes due to Excavation in Mountain-Type Mines. Mater. Trans. 2015, 56, 1159–1168. [Google Scholar] [CrossRef] [Scilit]
- Ding, Q.R.; Guo, C.Q.; Fan, X.A.; Liu, X.H.; Gong, X.C.; Zhou, W.; Ma, G. Multi-source monitoring data helps revealing and quantifying the excavation-induced deterioration of rock mass. Eng. Geol. 2023, 325, 107281. [Google Scholar] [CrossRef] [Scilit]
- Liu, F.; Zhang, J.M.; Guo, P.Z.; Liu, W.L.; Wang, Z.Q.; Chen, J.P. The Effect of Excavation Disturbance on the Stability of Bedding Cataclastic Rock Mass High Slope Containing Multimuddy Interlayers. Adv. Civ. Eng. 2024, 2024, 3659021. [Google Scholar] [CrossRef] [Scilit]
- Wu, L.L.; He, K.Q.; Guo, L.; Zhang, J.; Sun, L.N.; Jia, Y.Y. Research on the excavation stability evaluation method of Chaqishan ancient landslide in China. Eng. Fail. Anal. 2022, 141, 106664. [Google Scholar] [CrossRef] [Scilit]
- Chang, Z.G.; Cai, Q.X.; Zhou, W.; Jiskani, I.M.; Wang, R. Effects of the Loading and Unloading Conditions on Crack Propagation in High Composite Slope of Deep Open-Pit Mine. Adv. Civ. Eng. 2019, 2019, 3168481. [Google Scholar] [CrossRef] [Scilit]
- Sibata, T.; Itoh, K.; Kikkawa, N.; Hiraoka, N.; Tamrakar, S.B.; Toyosawa, Y. Analysis of labour accidents caused by slope failure during slope cutting and application of a rapid checklist for risk management in Japan. Int. J. Occup. Saf. Ergon. JOSE 2024, 30, 813–824. [Google Scholar] [CrossRef] [Scilit]
- Zhao, R.X.; Feng, Z.J.; Huo, J.W.; Jiang, G.; Wang, F.C. Stability Analysis of Blasting Excavation for High Rock Slope of Highway Reconstruction and Expansion. Adv. Civ. Eng. 2022, 2022, 5447614. [Google Scholar] [CrossRef] [Scilit]
- Sasahara, K.; Katayama, M.; Ishihama, S.; Hamada, Y. Prediction of the failure of a slope comprising weathered granite soil under multistep excavation based on multidimensional displacement measurements. Landslides 2024, 21, 3119–3136. [Google Scholar] [CrossRef] [Scilit]
- Sasahara, K.; Hiraoka, N.; Kikkawa, N.; Itoh, K. Development of the surface displacement velocity in a full-scale loamy model slope under multistep excavation. Bull. Eng. Geol. Environ. 2021, 80, 4389–4403. [Google Scholar] [CrossRef] [Scilit]
- Li, J.; Zhu, Y.; Ye, S.; Li, N.; Liu, B. Analysis of Multi-Stage Slope Displacement and Internal Force of Supporting Structure of Frame Prestressed Anchor Cable Support. Buildings 2025, 15, 3668. [Google Scholar] [CrossRef] [Scilit]
- Wang, J.M.; Zhou, Z.H.; Chen, C.; Wang, H.; Chen, Z.H. Failure mechanism and stability analysis of an open-pit slope under excavation unloading conditions. Front. Earth Sci. 2023, 11, 1109316. [Google Scholar] [CrossRef] [Scilit]
- Wang, J.M.; Zhou, Z.H.; Dou, W.; Chen, Z.H. Theoretical unloading fracture mechanism and stability analysis of the slope rock masses in open-pit mines. Geomat. Nat. Hazards Risk 2023, 14, 2274810. [Google Scholar] [CrossRef] [Scilit]
- Zhou, Z.H.; Chen, Z.H. Parallel Offset Crack Interactions in Rock under Unloading Conditions. Adv. Mater. Sci. Eng. 2019, 2019, 1430624. [Google Scholar] [CrossRef] [Scilit]
- Yang, Z.Q.; Fan, X.L.; Yang, Y.; Hou, K.P.; Du, J.; Chen, X.G.; Mi, Y.P.; Jiang, C.P.; Zhang, J.; Guo, Y.F. Deformation patterns and failure mechanism of high and steep stratified rock slopes with upper steep and lower gentle style induced by step-by-step excavations. Environ. Earth Sci. 2022, 81, 229. [Google Scholar] [CrossRef] [Scilit]
- Qu, M.L.; Dang, F.N. Numerical Analysis of Instability Mechanism of a High Slope under Excavation Unloading and Rainfall. Appl. Sci. 2022, 12, 7990. [Google Scholar] [CrossRef] [Scilit]
- Hong, Y.; Shao, Z.S.; Wu, K.; Shi, G.B.; Wu, S.S.; Jiang, S. An extended 3D limit analysis of slope stability considering prestressed anchor cables reinforcement. Arch. Civ. Mech. Eng. 2023, 23, 59. [Google Scholar] [CrossRef] [Scilit]
- Yang, W.D.; Wang, X.P.; Liu, N.; Wang, Q. An analytical solution for the time-dependent anchoring force in prestressed cables due to rock creep. Mech. Time Depend. Mater. 2023, 27, 367–399. [Google Scholar] [CrossRef] [Scilit]
- Zhang, J.W.; Li, M.D.; Yi, J.X.; Liu, Z.D. Investigation on the Stability of Fissured Slopes Reinforced with Anchor Cables under Seismic Action. Math. Probl. Eng. 2021, 2021, 9262138. [Google Scholar] [CrossRef] [Scilit]
- Shi, K.Y.; Wu, X.P.; Liu, Z.; Dai, S.L. Coupled calculation model for anchoring force loss in a slope reinforced by a frame beam and anchor cables. Eng. Geol. 2019, 260, 105245. [Google Scholar] [CrossRef] [Scilit]
- Liu, Y.; Lai, J.; Xu, J.B. Study on Slope Monitoring and Stability Based on Bolt-Cable Combined Support. Buildings 2024, 14, 886. [Google Scholar] [CrossRef] [Scilit]
- Shi, K.Y.; Wu, X.P.; Tian, Y.R.; Xie, X.T. Analysis of Re-Tensioning Time of Anchor Cable Based on New Prestress Loss Model. Mathematics 2021, 9, 1094. [Google Scholar] [CrossRef] [Scilit]
- Jia, Z.B.; Tao, L.J.; Bian, J.; Wen, H.; Wang, Z.G.; Shi, C.; Zhang, H.X. Research on influence of anchor cable failure on slope dynamic response. Soil Dyn. Earthq. Eng. 2022, 161, 107435. [Google Scholar] [CrossRef] [Scilit]
- Gao, X.; Jia, J.Q.; Bao, X.H.; Mei, G.X.; Zhang, L.H.; Tu, B.X. Investigation of dynamic responses of slopes in various anchor cable failure modes. Soil Dyn. Earthq. Eng. 2025, 188, 109077. [Google Scholar] [CrossRef] [Scilit]
- Bi, J.F.; Luo, X.Q.; Zhang, H.T.; Shen, H. Stability analysis of complex rock slopes reinforced with prestressed anchor cables and anti-shear cavities. Bull. Eng. Geol. Environ. 2019, 78, 2027–2039. [Google Scholar] [CrossRef] [Scilit]
- Wen, H.; Li, H.L.; Pang, T.; Wu, J.J. Numerical Study on Redbed Slope Stability Under Multi-Factor Conditions. Appl. Sci. 2025, 15, 2502. [Google Scholar] [CrossRef] [Scilit]
- Bennouna, R.; Ouadif, L.; Akhssas, A.; Senhaji, A.S.; Boulaid, G. Wedge stability analysis in fractured soft rock slopes for different orientations of seismic components. Min. Miner. Depos. 2024, 18, 1–8. [Google Scholar] [CrossRef] [Scilit]
- Zheng, H. Analysis Qian Bi Wei Highway K93 Rocky High Slope Stability and Excavation and Reinforcement Numerical Simulation Research. Master’s Thesis, Chengdu University of Technology, Chengdu, China, 2013. [Google Scholar]
- Feng, Z. Numerical Simulation for Excavating Process and Stability Analysis of Bedding Rock Slope. Master’s Thesis, Central South University, Changsha, China, 2008. [Google Scholar]
- Leinauer, J.; Weber, S.; Cicoira, A.; Beutel, J.; Krautblatter, M. An approach for prospective forecasting of rock slope failure time. Commun. Earth Environ. 2023, 4, 253. [Google Scholar] [CrossRef] [Scilit]
- Chen, G.Q.; Chen, T.; Chen, Y.; Huang, R.Q.; Liu, M. A new method of predicting the prestress variations in anchored cables with excavation unloading destruction. Eng. Geol. 2018, 241, 109–120. [Google Scholar] [CrossRef] [Scilit]

Disclaimer/Publisher’s Note: The statements, opinions and data contained in all publications are solely those of the individual author(s) and contributor(s) and not of MDPI and/or the editor(s). MDPI and/or the editor(s) disclaim responsibility for any injury to people or property resulting from any ideas, methods, instructions or products referred to in the content. |
© 2026 by the authors. Licensee MDPI, Basel, Switzerland. This article is an open access article distributed under the terms and conditions of the Creative Commons Attribution (CC BY) license.