Abstract
To enhance construction efficiency and structural stability, this study investigates the mechanical behavior and deformation characteristics of a jacking steel platform system used in the core-tube construction of a supertall building. Field monitoring was conducted on site to record stress, settlement, and inclination during the jacking, construction, and self-climbing stages. A finite element model was developed to simulate the platform’s mechanical response and validated against the field measurements. Results indicate that stress and deformation remained within safe limits throughout all stages, and the vertical deformation difference between the core tube and the outer frame was primarily governed by concrete shrinkage and creep. An improved modular design was proposed to address connection limitations in the steel truss, and cross-section optimization was applied using the stress ratio method. Comparative analysis against the original diamond-type truss baseline showed that the improved system increased overall strength by 5.88% and stiffness by 4.82% while enhancing truss versatility and structural stability. These findings provide a technical basis for the modular design and optimization of jacking steel platform systems, contributing to safer and more efficient construction practices.
1. Introduction
Super high-rise buildings are becoming urban landmarks and symbols of economic strength, reflecting rapid development in major cities. The integral jacking steel platform system has been widely adopted in such projects due to its high structural safety, cost-effectiveness, and advanced construction technology. However, jacking steel platform technology still faces challenges, including high cost, limited adaptability, and complex design, which remain active areas of research.
Jacking steel platforms have significant research value and practical relevance in both structural design and construction. With the rapid development of super-tall buildings and large-span structures, construction imposes stringent requirements on the load-bearing capacity, stability, and safety of steel platforms. Li et al. [1] investigated the application of hydraulic climbing formwork technology in super high-rise buildings utilizing aluminum alloy formwork systems. By integrating lightweight aluminum panels, high-rigidity hydraulic frames, and an intelligent safety monitoring system, they proposed a solution to enhance construction quality and safety. Based on finite element analysis and field tests, the study optimized the climbing support system and path planning. Furthermore, the authors introduced standardized and modular construction methods, which significantly improved the formwork turnover rate and overall construction efficiency. Yao et al. [2] investigated the dynamic characteristics and time-history response of hydraulic climbing formwork under seismic loads. Taking the super high-rise office building of Kunming Wanda Plaza as a case study, they established a finite element model using ANSYS 2022R1 and validated its accuracy by comparing natural frequencies. The study revealed that the formwork system is significantly more sensitive to horizontal seismic excitations than to vertical ones. Consequently, the authors recommended strengthening the connection between the upper platform and the guide rail, as well as enhancing the strength and stiffness of the main platform’s outer members and tripods to optimize seismic performance. Truong et al. [3] proposed an effective method for the safety assessment of steel platforms using Gradient Boosting (GTB) algorithms. They initially generated a dataset using advanced analysis to account for geometric and material nonlinearities. Subsequently, four GTB models were developed to predict the ultimate load-carrying capacity and displacement of the structures, facilitating a comprehensive safety evaluation regarding both strength and serviceability. Chang et al. [4] combined finite element simulations with field monitoring of a jacking steel platform. Strain gauges were placed at high-stress locations, and measurements were compared with simulation results. Verticality of the main columns was monitored to ensure safe construction.
To ensure the safe and stable operation of jacking steel platforms during both construction and lifting stages, real-time on-site monitoring is essential. Such monitoring enables continuous observation of the structural response, facilitates the early detection of potential safety risks, and supports timely preventive measures. In addition, systematically collected field data help validate analytical parameters and provide a reliable basis for the operational management and further optimization of the platform system. Tang et al. [5] used Midas Gen and field testing to evaluate the structural performance of a jacking steel platform, analyzing deformation of eight key members and verifying safety. Critical supports were optimized to enhance local strength. Purba et al. [6] analyzed internal and external structural responses under combined loading using nonlinear finite element methods, examining three loading scenarios to assess structural behavior during the jacking process. Gao et al. [7] conducted deformation monitoring and numerical analysis on a super-tall building. A series of chord-type strain gauges were installed to perform real-time vertical deformation monitoring on floors 10–48. A finite element model was then established to evaluate the effects of concrete quality, construction suspension, and varying humidity levels on the overall deformation. The results indicated that vertical deformation warrants particular attention. Combining practical engineering applications, Wang [8] detailed the deformation characteristics of jacking systems under high wind loads and compared the findings with Chinese national standards. The study recommended suspending construction operations during strong winds, installing wind-resistant guy wires, and strictly preventing asynchronous lifting (differential displacement) during the jacking process.
To bridge the gap between empirical engineering practices and theoretical design methodologies, this study proposes a quantitative modular design framework for super-high-rise jacking platforms. Distinct from research that relies on complex solid element modeling to investigate local stress concentrations, this study focuses on the scientific challenge of ensuring global structural stability and geometric compatibility in variable-section core tubes. Consequently, unlike previous descriptive case studies, this research (1) establishes a standardized 1500 mm modular grid rule to resolve geometric versatility challenges, (2) develops a stress-driven structural optimization strategy to systematically determine the most efficient web arrangement, and (3) validates the numerical model using full-lifecycle field monitoring data, explicitly clarifying the mechanism of vertical deformation differences governed by concrete shrinkage and creep.
2. Project Overview
The main structure of the supertall building consists of a steel tube column frame combined with a reinforced concrete core tube and shear wall composite system. The building has 3 underground floors and 58 aboveground floors, with a standard floor height of 4.2 m. The core tube is approximately square and symmetrically positioned within the main structure, with the outer wall thickness varying across eight segments and the inner wall thickness across four segments. The layout of the core tube structure is illustrated in Figure 1.
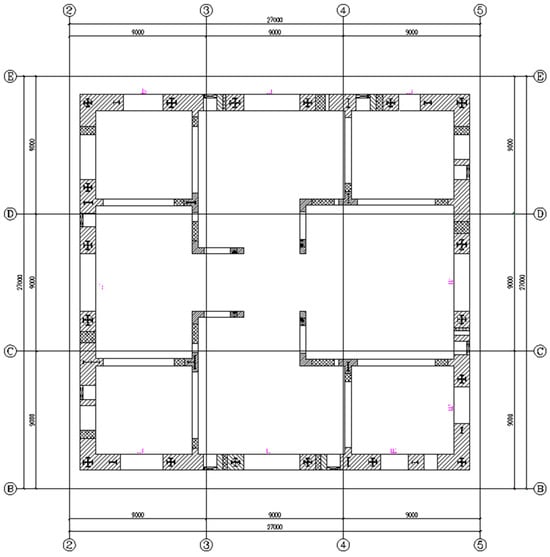
Figure 1.
Plan of core tube structure.
The selection of the column truss follows the overall lifting platform design of the low-point jacking formwork and is intended to carry vertical loads in conjunction with the upper and lower column truss beams. Additionally, the lower column truss beam restrains horizontal displacement at the column base. Functionally, the main trusses serve as the primary load-bearing members, transferring the platform’s self-weight and construction loads to the main columns. The secondary trusses, connected between the main trusses, support the formwork system and distribute the floor construction loads evenly to the main trusses [9,10,11,12]. To accommodate varying floor heights, the upper and lower column trusses are spaced 60–300 mm apart, allowing adjustments for non-standard floor construction. The project includes eight sets of truss supports, each 2.6 m high. Rectangular-section steel is employed, connected with fasteners and installed on both sides of the main truss.
The jacking formwork steel truss platform consists of two main truss beams, each 2.5 m high and 28.3 m long, and 18 secondary trusses, 1.7 m high with varying lengths. All trusses are fabricated from Q355 H-shaped steel. Material properties are listed in Table 1.

Table 1.
Mechanical properties of Q355 steel.
The main truss is supported atop the main column and connected via prefabricated truss modules using high-strength bolts. During fabrication, the connection joints between the secondary and main trusses are prefabricated, and the secondary trusses are assembled on site using high-strength bolts. All web members of both primary and secondary trusses are welded. Key component details of the jacking formwork are presented in Table 2. (In the table, “☐” represents rectangular steel tubes; “○” represents circular steel tubes.)
Table 2.
Section table of key system components of jacking formwork.
3. Numerical Simulation
To more accurately simulate the stress state of the jacking formwork key system, the platform channel steel beam, hanger beam, and formwork beam were included in the finite element model. Regarding the boundary conditions and connection modeling, the welded joints between the main truss members were simulated as rigid nodes (coupling all six degrees of freedom). In contrast, the bolted connections used for the temporary bracing members were simplified as hinged nodes (releasing rotational degrees of freedom). This macro-scale modeling approach effectively captures the global stiffness characteristics and was validated by the close agreement between the simulation results and the field monitoring data. Spatial beam elements were employed to efficiently capture the global stiffness and deformation of the large-span lattice structure. Although bolted interfaces were simplified, this macro-scale idealization is validated by the minimal deviation from on-site monitoring data, confirming that microscopic interface modeling is unnecessary for accurate structural prediction. The overall model configuration is illustrated in Figure 2.
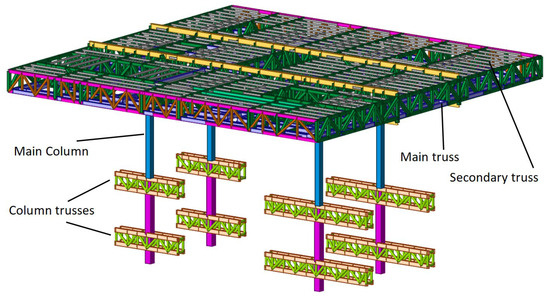
Figure 2.
Diagram of jacking formwork key system model.
3.1. Loads and Boundaries
Based on studies reported in References [12,13,14], the structural analysis of key jacking formwork systems primarily considers dead loads, live loads, and wind loads.
- (1)
- Permanent Loads
The permanent load primarily comprises the self-weight of the structure, the formwork, the hanger, and the hoisting equipment. Table 3 presents the load values for each construction stage.
Table 3.
Load statistics of key system of jacking formwork.
- (2)
- Live Loads
During the construction stage, the live load on the hanging frame walkway is 1.55 kN/m2, accounting for two layers. The live load on the hanger walkway during the jacking and self-climbing stages is 0.5 kN/m2. Similarly, the platform experiences a live load of 1.55 kN/m2 during construction and 0.5 kN/m2 during the jacking and self-climbing stages.
- (3)
- Wind Loads
According to Unified Standard for Reliability Design of Building Structures (GB 50068-2018) [15], the construction stage is classified as a temporary design situation with a design working life of 5 years. Pursuant to Load Code for the Design of Building Structures (GB 50009-2012) [16], temporary structures during construction may adopt a basic wind pressure based on a 10-year return period. For this project in Xi’an, the corresponding wind pressure is 0.25 kN/m2. This reduction is permissible because the probability of encountering maximum design wind speeds during the limited 5-year exposure period is statistically lower than for permanent structures. The model has a rectangular plan, and in accordance with code requirements, only the wind load applied to the long side is considered. The building has a total height of 268.83 m, with a site roughness category of C. The first-order natural vibration period of the key system of the jacking formwork is 2.968 s, corresponding to a frequency of 0.337 Hz. Wind loads were calculated following the relevant provisions in reference [16], and the standard values for different working conditions are summarized in Table 4.
Table 4.
Wind load calculation table.
A sensitivity analysis was performed to evaluate the wind load direction. Given that the platform dimensions are nearly square (28.3 m × 28.5 m), the calculated wind load difference between the two orthogonal directions is less than 1%. Therefore, the wind load acting on the slightly longer side (28.5 m) was selected as the worst-case scenario for analysis, covering the safety requirements for all directions.
- (4)
- Load Combinations
The evaluations considered the simultaneous application of these loads. According to the Standard for Design of Construction (GB 50352-2019) [17], the load combinations were defined as follows: For strength limitation (Ultimate Limit State): S = 1.3 × Dead Load + 1.5 × Live Load + 0.6 × Wind Load. For deformation limitation (Serviceability Limit State): S = 1.0 × Dead Load + 1.0 × Live Load.
- (5)
- Constraint Conditions
The steel truss system operates in three stages, each with distinct boundary conditions. During the construction stage, the lower chord of the main truss is assumed to be rigidly connected to the inner column, outer column, and the upper chord of the column truss. The inner square tube reaches a maximum extension of 7.2 m during concrete pouring, setting the inner column height at 7.2 m, while the ends of the upper and lower column trusses are modeled as hinged supports (Figure 3a). In the jacking stage, the analysis focuses on the inner column at its maximum jacking height of 7.2 m, with boundary conditions identical to those in the construction stage (Figure 3a). During the self-climbing stage, the top of the truss support is rigidly connected to the lower chord of the main girder, and the bottom is a hinged support that restricts horizontal translation (Figure 3b).
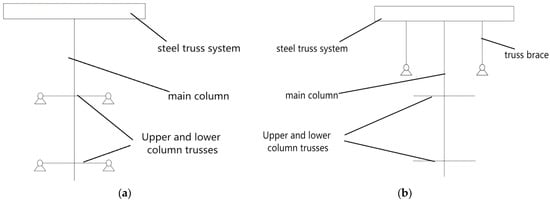
Figure 3.
Simplified schematic diagram of boundary conditions in each working condition stage. (a) Construction stage and jacking stage; (b) promotion stage and hinged support that restricts horizontal translation.
3.2. Finite Element Simulation
A finite element model of the jacking steel platform system was developed using Midas Gen, and simulation analyses were performed to evaluate its strength and deformation under three working conditions. The structure was discretized using spatial beam elements with six degrees of freedom per node (three translational and three rotational). The element formulation is based on Timoshenko beam theory, which accounts for shear deformation effects appropriate for the H-shaped steel sections. Regarding the shape of the approximation, the longitudinal and torsional displacements are interpolated using linear shape functions, while the transverse displacements are approximated using cubic Hermitian polynomials to accurately capture the bending behavior. Considering the low lifting speed and precise synchronous control of the hydraulic jacking system, the dynamic inertial forces during the lifting process are negligible. Therefore, a quasi-static analysis method was adopted for the ‘Jacking Stage’ to effectively represent the transient structural response during the height-changing process. The design strength value is set to 305 MPa in accordance with the Standard for Design of Steel Structures (GB 50017-2017) [18] with components below a stress ratio of 0.70 omitted and those exceeding 0.70 highlighted in red. It is important to note that the removal of these members alters the load transmission paths, leading to internal force redistribution. Therefore, an iterative re-analysis was performed immediately after the topology adjustment. The updated finite element model confirmed that the redistributed loads were effectively borne by the adjacent primary members, and the global stability was maintained without exceeding the design strength limits. The boundary conditions in the FEA model (as shown in Figure 4) were defined to match the actual connection details of the platform. Specifically, the welded joints of the main load-bearing trusses were simulated as rigid connections to reflect their moment-resisting capacity. Conversely, the bolted connections of the temporary support members were simplified as hinged joints to account for their rotational freedom. These assumptions were subsequently validated by the field monitoring results presented in Section 4, where consistency between the simulated and measured data (deviation < 10%) confirmed the accuracy of these boundary conditions for the global structural analysis. Since the jacking platform is a temporary structure strictly controlled by safety coefficients, the maximum calculated stress remains well below the yield strength of the Q355 steel. The structure operates entirely within the linear elastic range throughout the construction, jacking, and climbing stages. Therefore, a linear elastic constitutive model was adopted, as physical nonlinearity (plasticity) does not occur under the design working loads.
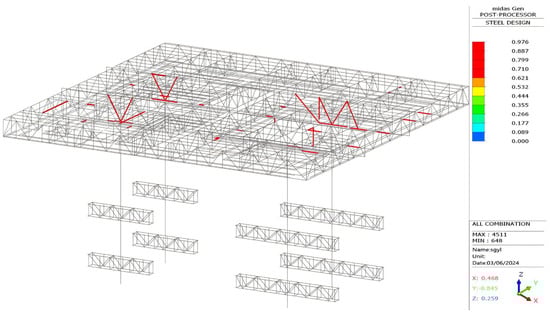
Figure 4.
The overall stress ratio diagram of the structure in the construction stage.
- (1)
- Construction stage
This stage refers to the working state where the platform is stationary, and construction activities such as rebar tying and concrete pouring are in progress. In this phase, the system bears the maximum vertical loads, including the self-weight, equipment weight, and the weight of wet concrete. The boundary conditions in the FEA model were defined to match the actual connection details of the platform. Specifically, the welded joints of the main load-bearing trusses were simulated as rigid connections to reflect their moment-resisting capacity. Conversely, the bolted connections of the temporary support members were simplified as hinged joints to account for their rotational freedom. These assumptions were subsequently validated by the field monitoring results presented in Section 4, where the consistency between the simulated and measured data (deviation < 10%) confirmed the accuracy of these boundary conditions for the global structural analysis. The stress of the jacking steel platform system under construction conditions is shown in Figure 4.
As shown in Figure 4, the members with a stress ratio of more than 0.70 are mainly concentrated on the web members and lower chords near the connection point between the main truss and the main column. The stress ratio of the southwest corner members exceeds 0.9, the maximum value is 0.976, and the maximum stress is 302.56 N/mm2. At the same time, the checking ratio of the members near the connection joint between the hanging frame beam and the secondary truss beam, and the connection joint between the platform channel steel beam and the secondary truss beam is also more than 0.7.
The stress ratio distribution of the jacking steel platform system under construction conditions is presented, as shown in Figure 5.
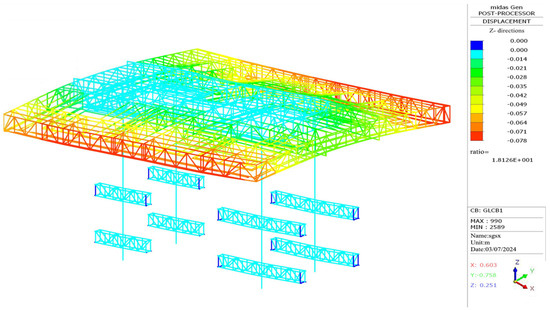
Figure 5.
The overall vertical displacement diagram of the structure in the construction stage.
As shown in Figure 5, the vertical displacement of the cantilever end of the truss in the northeast corner and the middle of the south side is the largest, and the maximum value reaches 78 mm. It is worth noting that this value represents the cumulative settlement measured on-site, which inherently includes the effects of construction tolerances and installation deviations. Although the cumulative magnitude reached 78 mm, the jacking platform relies on a synchronous hydraulic system with an active leveling function. The differential deformation was compensated for by adjusting the cylinder strokes during each lifting operation, ensuring that the platform’s levelness remained within the safe operational range throughout the construction process.
- (2)
- Jacking stage
The stress of the jack-up steel platform system under jack-up conditions is shown in Figure 6.
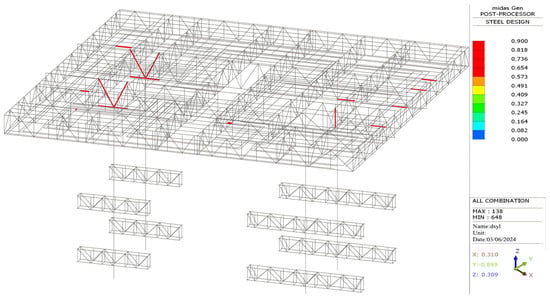
Figure 6.
The overall stress ratio diagram of the structure in the jacking stage.
As shown in Figure 6, compared with the construction stage, the number of members with a stress ratio exceeding 0.70 decreases during the jacking stage. These members are mainly concentrated near the beam-column joints. The maximum stress ratio reaches 0.90, and the maximum stress is 279 N/mm2, occurring at the chord of the southwest column–truss joint.
The stress ratio distribution of the jacking steel platform system under the jacking stage is shown in Figure 7.
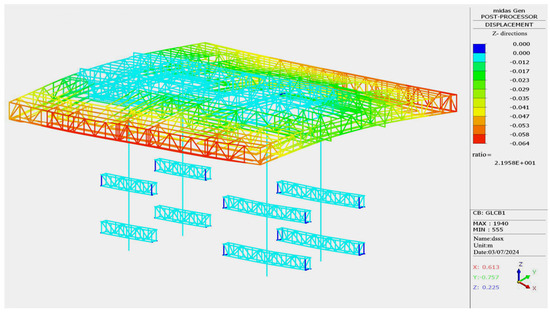
Figure 7.
The overall vertical displacement diagram of the structure in the jacking stage.
As shown in Figure 7, the maximum vertical displacement of the steel truss platform in the jacking stage is 64 mm, which occurs in the mid-span area of the south edge-sealing truss.
- (3)
- Self-Climbing Phase Selection of Sensors
The stress of the jacking steel platform system under the self-climbing condition is shown in Figure 8.
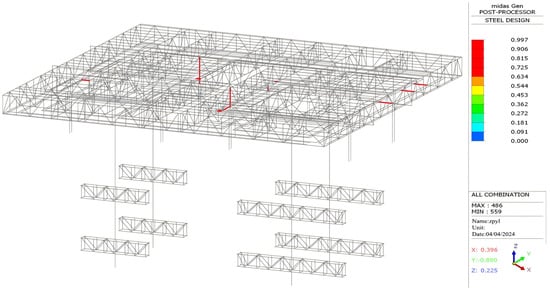
Figure 8.
The overall stress ratio diagram of the structure in the self-climbing stage.
As shown in Figure 8, in the self-climbing stage, the maximum stress ratio is 0.997, which appears on the truss support in the mid-span area of the main truss and the vertical web member near the node of the lower chord of the main truss, and the stress ratio of the other truss support is less than 1.
The stress ratio distribution of the jacking steel platform system under the self-climbing stage is shown in Figure 9.
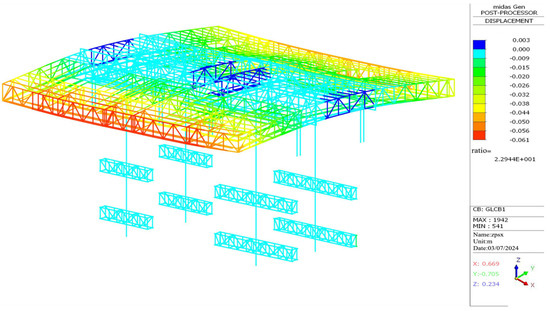
Figure 9.
The overall vertical displacement diagram of the structure in the self-climbing stage.
As shown in Figure 9, the maximum vertical displacement of the truss in the self-climbing stage is 61 mm, which occurs at the farthest end of the secondary truss cantilever on the south side.
4. On-Site Monitoring of the Jacking Steel Platform System
To verify whether the stress characteristics predicted by the finite element analysis of the jacking formwork key system occur under actual service conditions, on-site measurements were conducted to assess the validity of the finite element results [19,20,21]. In addition, the measured stresses were compared with code-specified limits to determine whether the structural members exceeded allowable stress levels during the construction, self-climbing, and jacking stages.
4.1. Monitoring Instruments and Arrangement of Measuring Points
- (1)
- Selection of Sensors
Considering the entire service period of the jacking formwork key system, the core tube wall section between the third and seventh floors has the largest cross-sectional width, requires the most steel bars and members, and involves the highest steel flow and storage on the platform. Consequently, this stage represents the maximum load for the key system and was selected as the primary focus for on-site monitoring.
It is important to note that this study did not involve material-level testing for concrete shrinkage and creep coefficients, nor were specific embedded sensors used for these factors. Instead, the effects of shrinkage and creep were evaluated through the macroscopic vertical deformation monitoring of the core tube and the outer frame. The field monitoring recorded the total cumulative settlement (including elastic deformation, shrinkage, and creep). The specific contribution of shrinkage and creep to the deformation difference was then analyzed by comparing these field measurements with the time-dependent values calculated in the finite element model.
To ensure high-precision data acquisition in the complex outdoor environment, BX120-3AA foil-type resistance strain gauges (nominal resistance , sensitivity coefficient ) were selected; these gauges feature self-temperature compensation matched to the Q355 steel structure to minimize thermal output. A quarter-bridge circuit with a three-wire connection was adopted to effectively eliminate measurement errors caused by lead wire resistance variations over long distances. Signals were transmitted via shielded twisted pair cables to mitigate electromagnetic interference and collected using a DH3816N Static Stress-Strain Measurement System equipped with a 24-bit A/D converter. Furthermore, a moving average filter (window size = 5) was applied to the raw sampling data (0.2 Hz) to effectively eliminate high-frequency environmental noise.
During installation, the protective paint at the attachment locations was removed, and each gauge was adhered and strictly sealed with protective glue to prevent rain erosion. Finally, the mechanical strain () was isolated from the total measured strain () using the temperature compensation formula: = , where is the coefficient of thermal expansion for Q355 steel (1.2 10−5/), is the current temperature, and is the initial reference temperature. Additionally, synchronous temperature monitoring was performed at each measuring point to address complex thermal compensation requirements. The detailed arrangement of the strain gauges is illustrated in Figure 10, Figure 11 and Figure 12.
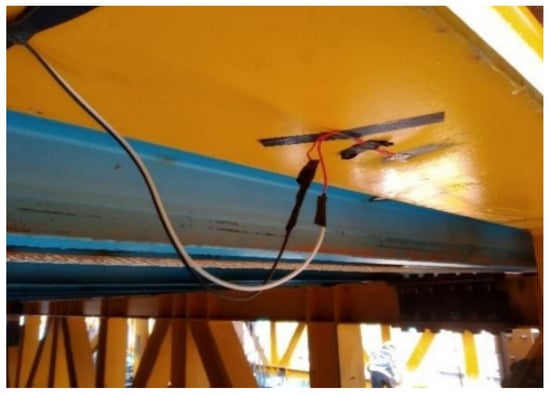
Figure 10.
The layout of the strain gauge.
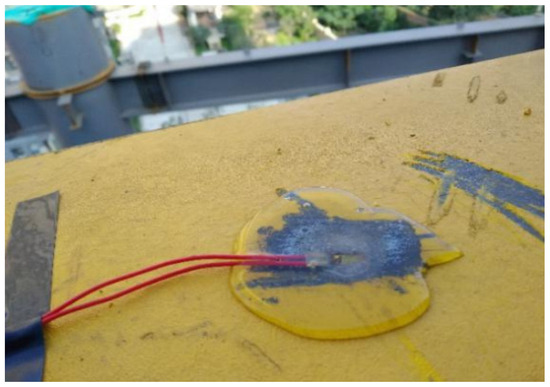
Figure 11.
Schematic of protective coating removal at strain gauge installation location.
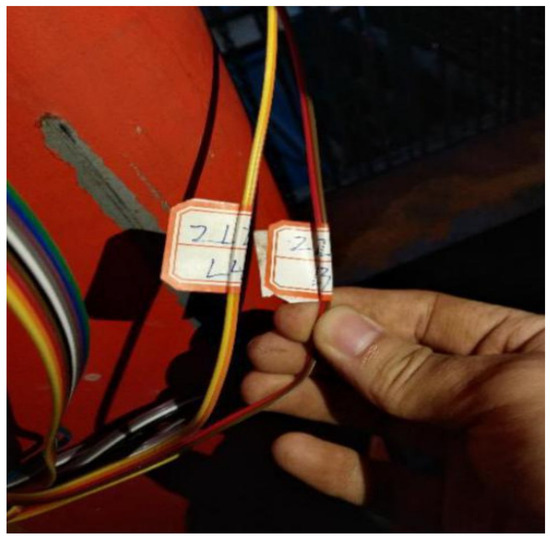
Figure 12.
Schematic diagram of strain gauge labeling.
- (2)
- Arrangement of Measuring Points
The jack-up steel platform system consists of four square steel tube main columns, two primary trusses, and eighteen secondary trusses, forming a nearly square and symmetrical configuration. Main truss No. 1 is supported by columns No. 1 and No. 2, while main truss No. 2 is supported by columns No. 3 and No. 4. In the layout diagram, sub-trusses are labeled C1–C18, main trusses as Z1 and Z2, and main columns as L1–L4, as illustrated in Figure 13.
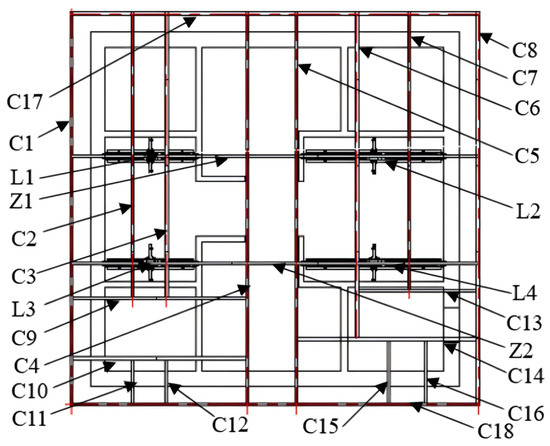
Figure 13.
Layout of jack-up steel platform structure.
According to thee structural characteristics and stress distribution of the integral jacking steel platform system, and guided by finite element analysis results [22,23], the monitoring scope was extended to critical regions. Strain gauges were installed at high-stress beam–column joints and at the connections between main and secondary trusses. Specifically, main trusses No. 1 and No. 2 and secondary trusses No. 3–6 were instrumented. Each upper and lower chord of these trusses was equipped with strain gauges on both surfaces, resulting in 24 measurement points, as illustrated in Figure 14a. Additionally, main columns No. 2 and No. 4 were monitored, with strain gauges mounted on all four sides, totaling 8 measurement points, as shown in Figure 14b.
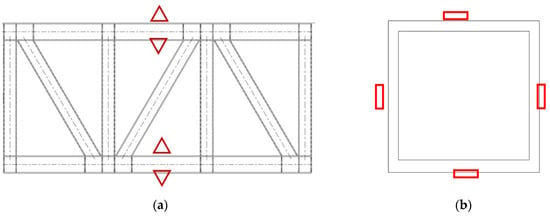
Figure 14.
Layout of jack-up steel platform structure. (a) Layout of measurement points for truss sections; (b) arrangement of measurement points on column section.
To facilitate identification and data analysis, all monitoring points were systematically numbered. For example, in main truss No. 1, the upper surface of the upper chord is labeled ZHJ1-SS, the lower surface of the upper chord as ZHJ1-SX, the upper surface of the lower chord as ZHJ1-XS, and the lower surface of the lower chord as ZHJ1-XX. Similarly, for main column No. 2, the north, south, west, and east sides are designated ZLZ2-N, ZLZ2-S, ZLZ2-W, and ZLZ2-E, respectively.
4.2. System Surveillance and Data Analysis
In this project, an initial start-up test was conducted after all strain gauges were installed, and formal measurements commenced once the readings at each monitoring point had stabilized. To optimize the workflow and improve construction efficiency, the construction stage was subdivided into the reinforcement-binding stage, the formwork installation stage, and the concrete-pouring stage. Accordingly, the operational cycle of the key jacking formwork system proceeded in the following sequence: first the reinforcement-binding stage, followed by the formwork installation stage, then the concrete-pouring stage, after which the jacking stage was carried out, and finally the self-climbing stage.
- (1)
- Construction Stage
The monitoring section of Main Truss 1 includes the upper and lower chords located 1.5 m from the No. 2 main column. The corresponding monitoring data are shown as stress–time curves in Figure 15 and Figure 16.
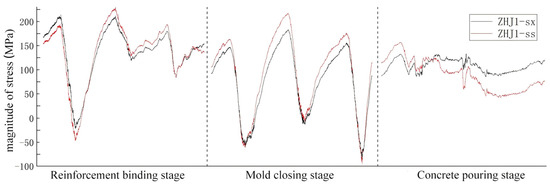
Figure 15.
The stress curve of the upper chord of the main truss 1 in the construction stage.
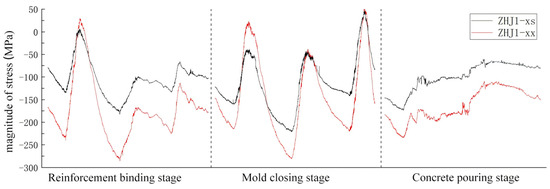
Figure 16.
The stress curve of the lower chord of the main truss 1 in the construction stage.
The figure shows that the stress curves of the upper and lower chords at the monitored truss section are nearly symmetrical, indicating consistent stress responses at the corresponding upper and lower measurement points. During the rebar-binding stage, the stress curves on the upper and lower surfaces of the upper chord of Main Truss 1 almost coincide, suggesting that this chord primarily carries axial force in this stage. In contrast, the remaining stress curves exhibit noticeable separation, implying that the corresponding members experience not only axial stress but also bending or shear effects.
As shown in Figure 17 and Figure 18, during the steel-bar binding stage, the stress curves on the upper and lower surfaces of the upper chord of Secondary Truss 1 exhibit a clear separation, indicating the presence of both axial tensile stress and bending stress. In contrast, the stress curves on the upper and lower surfaces of the lower chord intersect, suggesting that it experiences minimal axial stress but significant bending stress throughout the monitoring period. During the formwork-closing stage, the components are subjected to both axial and bending stresses, and their stress-curve trends remain consistent. In the concrete-pouring stage, the overall stress response becomes more stable compared with that observed during the steel-bar binding and formwork-closing stages.
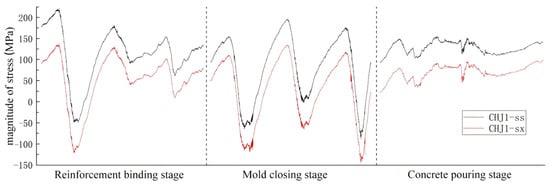
Figure 17.
The stress curve of upper chord of secondary truss 1 in construction stage.
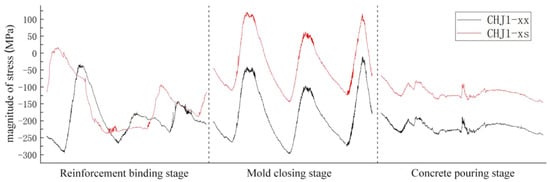
Figure 18.
The stress curve of the lower chord of the secondary truss 1 in the construction stage.
As shown in Figure 19 and Figure 20, during the steel-bar binding and formwork-closing stages, the increased frequency of platform unloading and stacking leads to larger variations in the stress curves on all four sides of the main column. In the subsequent concrete-pouring stage, the platform is subjected only to minor accumulation loads and personnel activity loads, resulting in smoother stress fluctuations. The separation of the stress curves on the east and west sides is particularly pronounced, indicating that the column experiences both compressive and bending stresses. Moreover, the east–west curve separation is considerably greater than that between the south and north sides, demonstrating that the bending stress in the east–west direction is significantly higher.
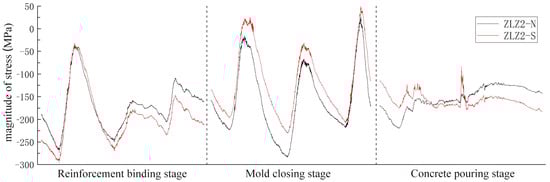
Figure 19.
The stress curve of the north and south sides of the main column 2 in the construction stage.
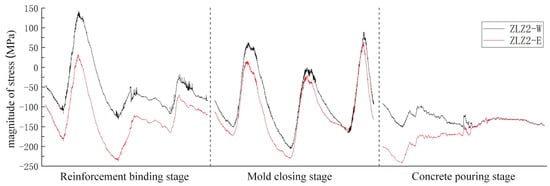
Figure 20.
The east and west side stress curve of the main column 2 in the construction stage.
- (2)
- Lifting and Self-Climbing Phases
Finite element analysis indicates that the stresses in the columns and secondary trusses during the jacking and self-climbing stages are lower than those observed in the construction stage. Consequently, the stress variations of only the main and secondary trusses are analyzed for the jacking and self-climbing stages.
Analysis of the stress curves in Figure 21 and Figure 22 shows that, during the jacking stage, the upper and lower surfaces of the upper chord of Main Truss 1 exhibit nearly coincident stress curves, whereas the lower chord displays more dispersed curves, indicating a smaller bending moment in the upper chord compared to the lower chord. In the self-climbing stage, stresses in both upper and lower chords decrease significantly and stabilize. The stress curves of the member surfaces remain predominantly above and below the 0 N/mm2 line, suggesting that bending stress dominates the internal stress state of the members.
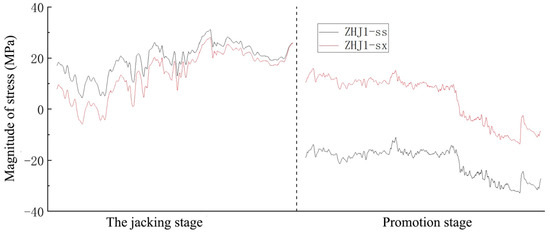
Figure 21.
The stress curve of the upper chord of the main truss 1 in the jacking and self-climbing stages.
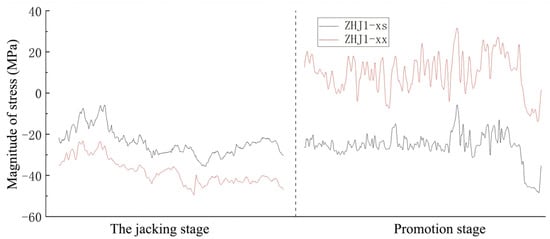
Figure 22.
The stress curve of the lower chord of the main truss 1 in the jacking and self-climbing stages.
Figure 23 and Figure 24 show that, during the jacking stage, the stress interval between the upper and lower surfaces of the lower chord of Secondary Truss 1 is larger than that of the upper chord, indicating higher bending stress in the lower chord. The stress curves of the upper chord remain above 10 MPa, suggesting that its axial force exceeds that of the lower chord. In the self-climbing stage, the upper and lower chord curves exhibit considerable fluctuations, but the overall trend is stable, indicating that the hydraulic system influences the main truss during self-climbing. The large interval between upper and lower surfaces confirms that bending stress predominates in the member.
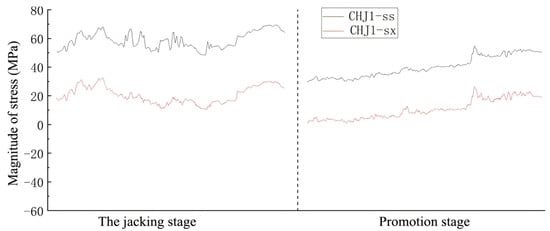
Figure 23.
The stress curve of the upper chord of the secondary truss 1 in the jacking and self-climbing stages.
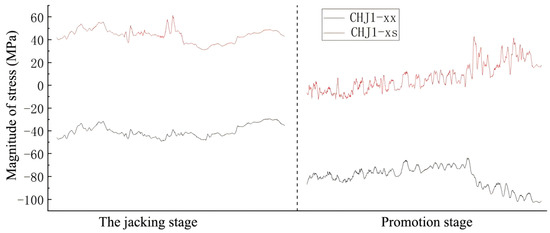
Figure 24.
The stress curve of the lower chord of the secondary truss 1 in the jacking and self-climbing stages.
4.3. Comparison of the Measured Results with the Calculated Results
The calculated and measured values for each monitoring point are summarized, as shown in Table 5.
Table 5.
Summary table of calculated value and measured value.
Comparison between the calculated and measured values indicates that both are higher during the construction stage than in the jacking and self-climbing stages. The finite element analysis results are consistent with this observation. Finite element results indicate that in both the construction and jacking stages, the upper chord of main truss 1 is under tension while the lower chord is under compression, which is corroborated by the field measurements. During the construction stage, the stress ratio of the lower chord of main truss 1 exceeds 0.9, with measured values ranging from 0.21 to 0.92, closely matching the finite element results.
In summary, the field measurements are consistent with the finite element analysis, indicating that the model accurately reflects the actual stress state of the structure and confirms its safety during operation. Although the calculated results align well with the general trends of the measured data, some numerical discrepancies remain evident. For instance, the calculated stress for ZHJ-1ss slightly exceeds the measured maximum. These deviations likely stem from the inherent differences between the theoretical model and the physical structure. First, the FEA model adopts idealized rigid or pinned connections, whereas actual joints possess semi-rigid characteristics that alter internal force distribution. Second, while the theoretical model assumes perfect geometry, the actual structure is subject to initial imperfections and construction tolerances. Finally, the simulation employs conservative standard design loads, whereas field measurements reflect actual loading conditions and inevitable environmental noise, such as temperature fluctuations and vibrations, which are not fully accounted for in the static analysis.
5. Improved Design of the Key Systems of the Jacking Formwork
Due to the unique connection configuration of the steel truss beams in this project, precise numbering, tracking, and management of unassembled truss sections are required, and accurate handling and alignment must be ensured during hoisting. Moreover, the truss modules vary in size, requiring each component drawing to be individually verified during factory fabrication. If the truss modules are designed with modular relationships, the fabrication process can be standardized, significantly improving production efficiency and reducing the manufacturing cost of the jacking formwork key system [24].
5.1. Layout of the Steel Truss Beams of the Key Systems of the Jacking Formwork
The modular layout of the steel truss beams was designed based on the third-floor section of the core tube, which measures 2510 mm × 2610 mm, with an external wall thickness of 1300 mm and an internal wall thickness of 450 mm. Following the modular design principles, a modular plane layout was developed in this study. The design procedure is outlined as follows:
- (1)
- A modular grid was established with a basic module M of 1500 mm, such that the spacing between horizontal and vertical grid lines was uniformly 1500 mm.
- (2)
- The planar layout from the first floor to the top of the core tube was unified onto a single plane, illustrating the distribution of all steel members within the core tube. The relative positions of the steel truss beams and the core tube were summarized, providing the spatial relationships among the steel truss beams, all steel members, and the core tube walls.
- (3)
- The plane layout also summarizes the locations of openings, including material ports, elevator shafts, and reserved positions for tower cranes.
- (4)
- Based on the 1500 mm modular grid, the steel truss beams are adjusted in integer or half-integer multiples of the basic modulus. In the plane layout, the relative spacing between the truss beams and the steel columns is fine-tuned to 450–600 mm according to ergonomic principles, ensuring adequate operational space for the installers of the core tube wall steel members.
- (5)
- Redundant grid lines are removed, and the plane position of the support system is fine-tuned, resulting in a steel truss platform in which the sizes of the primary and secondary beams and the spacing between adjacent beams follow the M and M/2 modular rules, as shown in Figure 25.
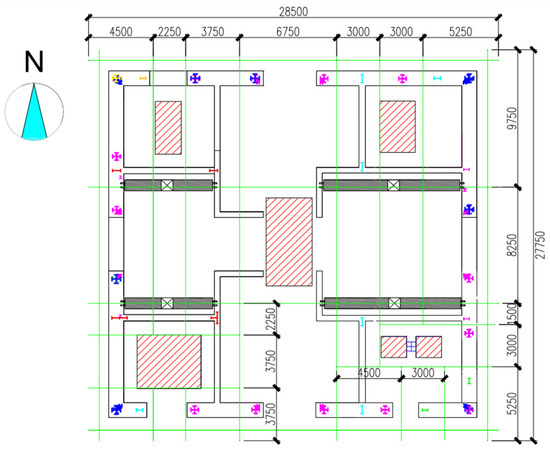 Figure 25. Modularized layout diagram. Finite Element Model of Steel Truss Beam.
5.2. Selection of Steel Truss Beams of the Key Systems of the Jacking Formwork
After determining the layout positions of the truss beams, the web configuration and beam heights also need to be selected. Finite element models of four steel trusses with different web arrangements were established as a control group, and their stress responses were analyzed and compared.
The finite element model employs Q345 steel, with a beam height of 1 m, a length of 3 m, and a cross-sectional dimension of 100 mm × 68 mm × 4.5 mm × 7.6 mm. Hinge supports were applied as boundary conditions, and a uniform load of 10,000 N was applied along the beam. The model setup is illustrated in Figure 26.
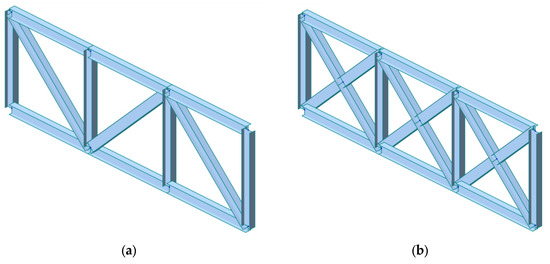
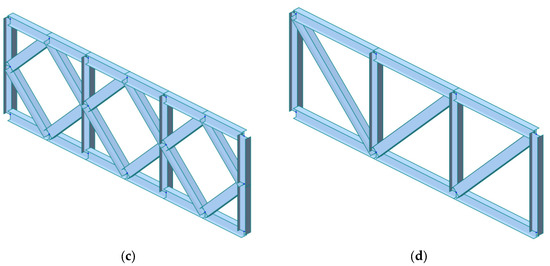
Figure 26.
Finite Element Model of Steel Truss Beam. (a) Truss form of this project; (b) Cross-type truss form; (c) Rhombus truss form; (d) Consider the form of the truss when the connectors in (a) are reversed.
The vertical displacement within the truss plane reflects the bending resistance of the truss chords, while the horizontal displacement indicates the in-plane stability and load-bearing capacity of the truss web. The maximum vertical and horizontal displacements for each truss configuration are summarized in Table 6.
Table 6.
Summary table of mechanical properties of trusses with different web forms.
From Table 5, it can be observed that under identical bar section conditions, Truss(a) exhibits the highest member stress, Truss(d) shows the largest vertical displacement, while Truss(b) has the smallest maximum vertical and in-plane horizontal displacements among the four trusses. This indicates that the overall stiffness of the cross truss is superior to the other three configurations, although its strength is 10.5% lower than that of the diamond truss. In summary, considering stiffness as a primary criterion, the cross truss demonstrates better mechanical performance.
5.3. Optimization of Steel Truss Beams of the Key Systems of the Jacking Formwork
Based on the previous finite element analysis, the steel truss system exhibits the largest response during the construction stage. Therefore, the construction-stage model was improved following the 1500 mm modular rule. The selection of this 1500 mm module is driven by both economic and structural considerations. Economically, it aligns with the standard dimensions of industrial formwork panels and steel gratings, thereby minimizing cutting waste and fabrication costs. Structurally, this grid size corresponds to the layout of the core tube shear walls and the spacing of the embedded anchor points, ensuring that the truss nodes align with the support brackets for effective load transmission. While keeping the original layout, structural form, section size, material, loads, and constraints unchanged, inclined web members were added to convert the non-intersecting truss into an intersecting truss, as shown in Figure 27.
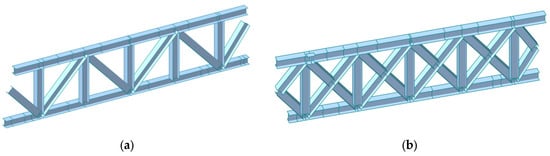
Figure 27.
Three-dimensional comparison diagram of truss beam before and after improvement. (a) Improvement of front truss; (b) Improved truss.
Simultaneously, to enhance the versatility of the steel truss modules and facilitate factory fabrication, the vertical web spacing of the primary and secondary trusses was adjusted to 1500 mm following the modularization principle. The final finite element model, conforming to the 1500 mm modulus rule, is shown in Figure 28.
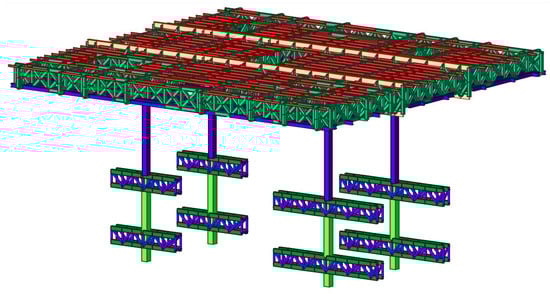
Figure 28.
Modular improved finite element model diagram.
To evaluate the stress state of the structure before and after the web member system improvement, finite element analysis of the key system of the improved jacking formwork was conducted during the construction stage. Most truss beams exhibit a stress ratio below 1, while members with a stress ratio exceeding 1 are primarily located on the chords near the beam-column joints on the east side, with a maximum stress ratio of 1.245. Investigation of the structural self-weight revealed a significant increase, rising from 190.4 t to 223.9 t due to the additional steel consumption, as shown in Figure 29.
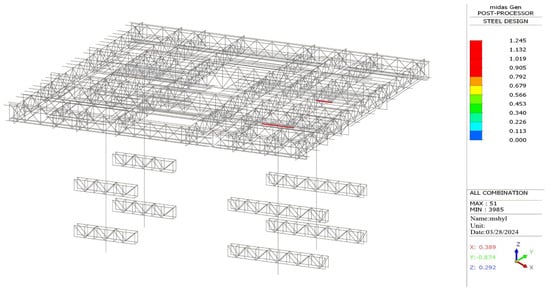
Figure 29.
The overall stress ratio diagram of the structure after the improvement of the web system.
5.4. Section Optimization of Steel Truss Beam
The maximum stress ratio of each member in both the main and secondary trusses is summarized, as presented in Table 7.
Table 7.
Summary Table of Stress Ratios of Each Member After Improvement of Web Member System.
The table indicates that after the improvement, the doubling of web members increases the structure’s self-weight from 190.4 t to 223.9 t, causing the chord stress ratio of the main truss to exceed 1, which violates the specification requirements. Consequently, the stress ratio optimization method [25] was applied to optimize the cross-sections of all truss members. The structural analysis and code check were performed using Midas Gen in strict accordance with the Standard for Design of Steel Structures (GB 50017-2017). It is explicitly confirmed that the ‘stress ratio’ utilized herein represents the maximum value derived from both strength and stability checks. Therefore, the stability coefficients () for compressed members are automatically incorporated to ensure safety against buckling instability. Due to space limitations, this paper details only the optimization process of the main truss chord, while the other members follow the same procedure.
The main truss chord has an initial section size of 350 mm × 200 mm × 8 mm × 12 mm, with a cross-sectional area of 74.08 cm2. Using the full-stress calculation formula, the required section area is 1.245 × 74.08 cm2 = 92.23 cm2. The final section was selected according to the principle of minimum unit weight [26], resulting in an ordinary I-beam section 32c with dimensions 320 mm × 134 mm × 13.5 mm × 15 mm. The optimized section sizes of the steel truss are summarized in Table 8. The table shows that the stress ratio of each truss member is less than 1, satisfying the design requirements. (“[” in the table indicates double channel steel).
Table 8.
Summary Table of Stress Ratios of Each Member After Improvement of Web Member System.
The finite element analysis of the improved jacking formwork steel truss platform is carried out, as shown in Figure 30 and Figure 31.
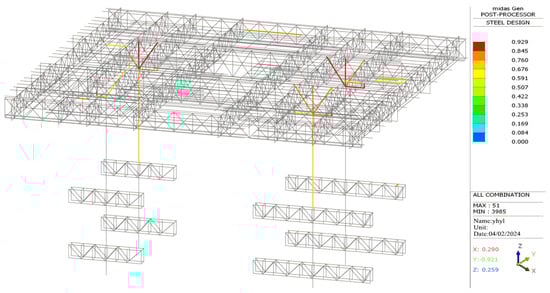
Figure 30.
Schematic Diagram of Stress Distribution After Improvement.
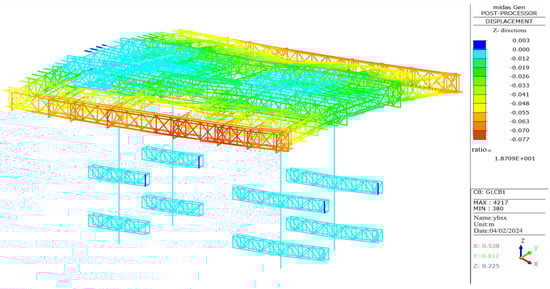
Figure 31.
Schematic Diagram of Overall Vertical Displacement of Truss After Improvement.
The self-weight of the structure decreased from 223.9 t to 205.6 t. This significant reduction in steel tonnage represents a direct optimization of material resource calculations, aligning the structural design with cost-efficiency and sustainability goals. The maximum stress ratio of any component is 0.929, with a maximum stress of 287.99 N/mm2. Components with a stress ratio exceeding 0.70 are primarily concentrated on bars near the main truss–column connections. The vertical displacement of the cantilever end on the south side of the secondary truss is the largest, with a maximum of 77 mm, while the cantilever root displacement is 13 mm, yielding a deflection of 64 mm, which is less than L/250 = 78 mm and thus meets specification requirements. The mid-span displacement of the main truss is 16 mm, the top of the column displaces 9 mm, giving a mid-span deflection of 7 mm < 41.25 mm (L/400), meeting the specification. The maximum displacement of the main truss cantilever end is 22 mm, with a deflection of 14 mm < L/250 = 54 mm, and the mid-span deflection of the column truss is 8 mm < L/400 = 23.38 mm, all satisfying specification limits.
6. Conclusions
This study investigates a jacking steel platform system in a super high-rise project. On-site wireless monitoring and finite element analysis were used to assess stress in the truss and main columns during construction, jacking, and self-climbing. A modular-rule-based design was proposed to replace non-intersecting web trusses, and the stress ratio method optimized the improved truss sections.
- (1)
- The proposed 1500 mm modular grid rule effectively resolves the geometric incompatibility between the core tube and the steel platform. Comparative analysis confirms that the improved cross-web truss system, optimized via the stress ratio method, increases the global strength by 5.88% and stiffness by 4.82% despite a 7.98% increase in steel consumption. This strategy demonstrates that a slight increase in material usage can yield significant gains in standardization and construction efficiency.
- (2)
- Field monitoring indicates a maximum vertical deflection of 68 mm and a maximum column lateral displacement of 33 mm, both within code limits. Crucially, the analysis reveals that the differential vertical deformation between the platform and the core tube is not solely governed by static mechanical loads but is significantly driven by time-dependent concrete shrinkage and creep. This finding highlights the necessity of incorporating rheological material properties into the pre-camber design for super-tall structures.
- (3)
- The consistency between simulation and measurement validates the structural behavior throughout the construction, jacking, and self-climbing stages. The study identifies that the transition from “jacking” to “self-climbing” induces a significant redistribution of internal forces. Specifically, the removal of constraints during the self-climbing phase causes stress ratios in certain main truss members to approach 1.0. Consequently, synchronous self-climbing of all four supports is strictly prohibited, and redundant support strategies are essential to prevent progressive instability due to boundary condition changes.
Author Contributions
Conceptualization, F.Z., S.Y. and G.W.; Data curation, F.Z. and S.Y.; Formal analysis, H.H.; Funding acquisition, F.Z.; Investigation, M.G. and G.W.; Methodology, F.Z.; Project administration, F.Z.; Resources, H.H.; Software, F.Z.; Supervision, F.Z.; Validation, M.G.; Visualization, H.H. and M.G.; Writing—original draft, F.Z., S.Y. and G.W.; Writing—review & editing, F.Z., S.Y. and G.W. All authors have read and agreed to the published version of the manuscript.
Funding
The work was financially supported by the Shaanxi Key Research and Development Program (2024SF2-GJHX-63).
Institutional Review Board Statement
Not applicable.
Data Availability Statement
The original contributions presented in this study are included in the article. Further inquiries can be directed to the corresponding author.
Conflicts of Interest
The authors declare that they have no conflict of interest.
References
- Li, S.; Yu, Z.Q.; Meng, Z.H.; Han, G.Z.; Huang, F.J.; Zhang, D.F.; Zhang, Y.L.; Zhu, W.B.; Wei, D. Study on construction technology of hydraulic climbing formwork for super high-rise building under aluminum formwork system. In IOP Conference Series: Earth and Environmental Science; IOP Publishing: Bristol, UK, 2021; p. 769. [Google Scholar]
- Yao, G.; Guo, H.T.; Yang, Y.; Xiang, C.M.; Soltys, R. Dynamic Characteristics and Time-History Analysis of Hydraulic Climbing Formwork for Seismic Motions. Adv. Civ. Eng. 2021, 2021, 2139153. [Google Scholar] [CrossRef]
- Truong, V.-H.; Vu, Q.-V.; Thai, H.-T.; Ha, M.-H. A robust method for safety evaluation of steel trusses using Gradient Tree Boosting algorithm. Adv. Eng. Softw. 2020, 147, 102825. [Google Scholar] [CrossRef]
- Chang, L.; Zeng, F.K.; Guo, H.Y.; Zhang, Z.Y.; Gao, T. Construction Simulation and Monitoring of the Jacking Steel Truss and Main Column of a Super High-Rise Building. Buildings 2024, 14, 617. [Google Scholar] [CrossRef]
- Tang, J. Study on the Stress Performance of Jacking Steel Platform in Super-High-Rise Buildings. Master’s Thesis, Xi’an University of Technology, Xi’an, China, 2018. [Google Scholar]
- Purba, R.B.; Alie, M.Z.M. Structural Response Analysis of Jack-Up During System Jacking Lifting Process. In IOP Conference Series: Earth and Environmental Science; IOP Publishing: Bristol, UK, 2020; Volume 575, p. 012201. [Google Scholar]
- Gao, F.; Zhou, H.; Liang, H.; Weng, S.; Zhu, H.P. Structural Deformation Monitoring and Numerical Simulation of a Supertall Building during Construction Stage. Eng. Struct. 2020, 209, 110033. [Google Scholar] [CrossRef]
- Wang, G. Research on the Strength of the Attachment Device of the Attached Crane. In IOP Conference Series: Earth and Environmental Science; IOP Publishing: Bristol, UK, 2020; Volume 474, p. 072082. [Google Scholar]
- Wang, S.Q.; Hu, C.X.; Wu, Q.Q. Research on Construction Period Optimization of High-Rise Buildings Based on Integrated Building Platform Applications. Buildings 2025, 15, 3338. [Google Scholar] [CrossRef]
- Luo, D.Y.; Zou, X. Analysis of GMT Composite Material-based Building Formwork. J. Phys. Conf. Ser. 2023, 2510, 012014. [Google Scholar]
- Du, Y.N.; Qin, Z.C.; Guan, C.C.; Feng, D.C. Bayesian model updating of super high-rise building for construction simulation. Struct. Des. Tall Spec. Build. 2024, 33, e2104. [Google Scholar] [CrossRef]
- Liao, L.X.; Yu, Z.X.; Liu, D.; Ye, G.H.; Jin, Y.T.; Zhao, L. The Dynamic Response of the Forming and Working Platform During the Jacking Process. Prog. Steel Build. Struct. 2023, 25, 97–104. [Google Scholar]
- Liu, Y.T.; Chen, W.L.; Huang, S.M.; He, J.W.; Huang, Z.Z. Application of Lightweight Integral Hydraulic Jacking Steel Platform in the Ningbo Manhattan Building Project. Constr. Technol. Chin. Eng. Transl. 2024, 53. [Google Scholar] [CrossRef]
- Hu, C.M.; Liu, Y.H.; Huang, H.; Zhao, S.H.; Liu, X.Z. Application of AHP-Improved Matter-Element Method in Safety Risk Assessment of Integral Steel Platform Jacking Formwork System. Saf. Environ. J. 2024, 24, 33–41. [Google Scholar]
- GB 50068-2018; Unified Standard for Reliability Design of Building Structures. Ministry of Housing and Urban-Rural Development of the People’s Republic of China: Beijing, China, 2018.
- GB 50009-2012; Load Code for the Design of Building Structures. China Architecture & Building Press: Beijing, China, 2012.
- GB 50352-2019; Uniform Standard for Design of Civil Buildings. Ministry of Housing and Urban-Rural Development of the People’s Republic of China: Beijing, China, 2019.
- GB 50017-2017; Standard for Design of Steel Structures. Ministry of Housing and Urban-Rural Development of the People’s Republic of China: Beijing, China, 2017.
- Zhang, Z.Y.; Zeng, F.K.; Liu, J.Q.; Guo, H.Y.; Niu, Y.P.; Du, G.H.; Liu, X.Z. Design and force analysis of steel truss of intelligent construction machine for superhigh-rise buildings. Adv. Eng. Innov. 2025, 16, 1–24. [Google Scholar]
- Kang, Q.; Sun, J.Q.; Lin, B. Wind-Induced Response Analysis of Integral Jacking Steel Platform System in Tianjin Chow Tai Fook Financial Center. Constr. Technol. 2020, 49, 48–51. [Google Scholar]
- Cheng, G.K. Research on Load-Bearing Mechanism and Structural Optimization of Super-High-Rise Jacking Steel Platform. Master’s Thesis, Chongqing Jiaotong University, Chongqing, China, 2023. [Google Scholar]
- Shi, L.B.; Xue, Q.; Lei, F.Y.; Liu, D.; Li, D.; Zhao, X.; Zhou, L.R.; Hou, D.L. Key Technologies for Lightweight Modular Super-High-Rise Formwork System. Constr. Technol. 2020, 49, 129–131. [Google Scholar]
- Dai, T.; Jin, R.; Liu, X. Modular Design of Formwork Truss Platform Based on Modulus Rule. Constr. Technol. 2018, 47, 24–28. [Google Scholar]
- Zou, Y.Q.; Sun, Z.C.; Pan, H.; Tu, W.; Dong, D.D. Parametric Automated Design and Virtual Simulation of Building Machine Using BIM. Buildings 2023, 13, 3011. [Google Scholar] [CrossRef]
- Cheng, G.D. Fundamentals of Engineering Structural Optimization Design; Dalian University of Technology Press: Dalian, China, 2012; pp. 34–52. [Google Scholar]
- Dai, G.X. Steel Structure, 4th ed.; Wuhan University of Technology Press: Wuhan, China, 2012; pp. 284–299. [Google Scholar]


Disclaimer/Publisher’s Note: The statements, opinions and data contained in all publications are solely those of the individual author(s) and contributor(s) and not of MDPI and/or the editor(s). MDPI and/or the editor(s) disclaim responsibility for any injury to people or property resulting from any ideas, methods, instructions or products referred to in the content. |
© 2026 by the authors. Licensee MDPI, Basel, Switzerland. This article is an open access article distributed under the terms and conditions of the Creative Commons Attribution (CC BY) license.