


Abstract
Thermal insulation is essential in lowering the energy consumption of buildings. However, many fossil-based insulation and exterior cladding materials are derived from petrochemical components, which often have adverse ecological impacts. This study explores the effectiveness of integrating sustainable thermal insulation solutions into building design to reduce energy consumption and minimize ecological impact. Focusing on an energy-efficient breakfast house located in Van, Turkey, the project was modeled using Autodesk-Revit software (2023). A comprehensive analysis was conducted by generating eighty alternative scenarios, combining two distinct wall structures, eight fiber-based natural insulation materials, and five wood-based exterior cladding materials. The energy performance of each scenario was evaluated using IES-VE software (2024.1), focusing on annual total energy consumption and CO2 emissions, while accounting for regional climatic conditions and targeted indoor comfort levels. To further refine the selection of optimal materials, a hybrid evaluation was performed using multi-attribute decision approaches, including LODECI, MAXC, and DEPART. These methods provided a systematic framework for comparing the performance of wood-based insulation materials across multiple criteria. In order to verify the accuracy of the proposed multi-attribute decision models, a comparative analysis has been undertaken with other multi-attribute decision methods (COPRAS, ARAS and WASPAS). The study highlights the technical feasibility of incorporating cost-effective, eco-friendly fiber-based and wood-based materials into building envelopes, demonstrating their potential to significantly enhance energy efficiency and reduce environmental impact. By combining advanced simulation tools with robust decision-making methodologies, this research offers a scientifically grounded approach to sustainable architectural design, providing important outputs for future applications in energy-efficient construction.
1. Introduction
Recently, the urgency of addressing global warming and the ongoing energy crisis has significantly highlighted the necessity of energy efficiency. As buildings contribute between 20% and 60% of total energy consumption depending on the region [1], they present a critical opportunity for energy conservation. In dense urban areas, over 40% of the total energy usage is typically allocated to heating and cooling needs [2]. This makes it imperative for the construction industry to adopt environmentally sustainable practices, including the selection of materials and the comprehensive management of a building’s life cycle.
One promising strategy to achieve energy efficiency and reduce dependency on HVAC systems is the integration of advanced technologies and thermal insulation materials into building envelopes. Traditionally, artificial materials such as mineral wool, glass fiber, and polymers dominate the insulation market due to their superior thermal properties [3]. However, these materials are often associated with significant drawbacks, such as the usage of non-renewable sources and the emission of greenhouse gases during production. Additionally, their non-biodegradable nature exacerbates environmental pollution.
To mitigate these issues, the construction sector has increasingly explored natural alternatives for thermal insulation that have minimal environmental impacts across their life cycles. For instance, replacing conventional materials with cellulose fiber insulation has the potential to reduce emissions by approximately 7% and decrease fossil fuel consumption by nearly 40% [4]. Adopting a circular economy approach further offers substantial advantages, such as diminished environmental impact, improved resource security, technological advancements, job creation, and the establishment of new markets. These benefits are driven by the efficient use of natural resources and greater reliance on secondary feedstocks. European initiatives have progressively advanced environmental sustainability, with early directives targeting energy performance in buildings evolving into more comprehensive policies emphasizing product recovery, reuse, and recycling to achieve near-zero energy buildings by 2050 [5].
One of the primary steps toward energy efficiency in the building sector is the strategic utilization of thermally appropriate insulation materials. These materials minimize energy loss by managing the thermal properties of building envelopes [6]. The strategic placement and selection of insulation materials play an important role in maximizing their efficiency, with each material characterized by specific thermal conductivity properties [7]. The advancement of technology and the expansion of industrial capabilities have resulted in the development of a diverse range of insulation materials, which primarily function by retaining internal heat, reducing thermal losses, and mitigating external heat gains through thermal radiation [8]. These materials often exhibit lightweight, porous, or hollow structures filled with gases or air [9]. Examples include mineral and rock wool, aerogels, plastic foams, vacuum insulation materials, and a growing array of bio-based alternatives.
The demand for environmentally friendly products in the construction sector has risen in alignment with the European Community’s Green Deal. Despite this, the market remains heavily reliant on conventional products, overlooking opportunities to repurpose industrial waste materials. Among the most promising alternatives are plant-based fiber materials, which are increasingly recognized for their effectiveness in acoustic and thermal insulation applications for exterior walls [10,11,12]. Fiber-based boards are particularly valued for their rigidity, thermal conductivity, and workability, making them ideal for insulating building envelopes [13]. The selection of appropriate materials ensures both thermal efficiency and durability for end-user applications [14,15]. As environmental awareness continues to grow, natural fiber insulation materials have gained prominence in construction [16]. The evaluation of suitable natural fiber types depends on several criteria, with contemporary assessments often limited to a narrow set of attributes [17]. Prominent low-carbon insulation options, such as flax, wool, and hemp, have been increasingly recognized for their sustainability [18]. Historically, natural materials such as lichen, hemp, linen, hay, reed, and straw were widely used for thermal insulation due to their accessibility and effectiveness [19].
Natural insulation materials provide numerous benefits when used in construction applications [20]. Their renewable and biodegradable properties make them environmentally friendly alternatives to synthetic materials. By repurposing plant-based fiber materials from biowaste, they support a zero-waste approach while reducing landfill burdens [21]. These materials are generally free from toxins and hazardous compounds, enhancing indoor air quality and ensuring safer installation compared to synthetic alternatives [22]. Additionally, their capacity to absorb and release moisture while maintaining insulation efficiency aids in controlling indoor humidity, promoting healthier living spaces. Many natural insulation materials also provide superior acoustic insulation, reducing noise transmission within buildings. Their thermal performance can significantly decrease the energy required for cooling and heating, which typically accounts for a substantial portion of a building’s energy use [23].
The main objective of sustainable construction is to maximize the efficient use of natural resources while minimizing environmental impact [24]. Building design teams are tasked with creating structures that are not only energy-efficient but also incorporate recycled or natural materials and harmonize with their surroundings [25]. The strategic use of natural insulation materials represents a crucial step toward achieving these objectives.
Advances in systems engineering have revolutionized construction process management across the entire lifecycle of buildings. One of the most widely recognized methodologies is Building Information Modelling (BIM), which enables a comprehensive digital representation of essential building components, life-support mechanisms, and data attributes [26]. This digital model serves as a working verification package extensively used for design-related tasks [27]. The systematic approach offered by BIM significantly reduces design errors [28]. Recent developments extend BIM applications to other lifecycle stages, such as the pre-project phase of urban planning or functional validation processes. This involves modeling the design object’s volumes, spatial arrangement, and connectivity to infrastructure networks. The integration of this step into the BIM process forms a critical foundation for subsequent design phases. Efficient development during the urban project phase requires a robust computer network to model hybrid data spaces. Software automation plays a crucial role in ensuring a cohesive and integrated system, dictating interactions between various applications [29]. The availability of detailed information for a site substantially influences its appeal to developers. For comprehensive analyses encompassing energy performance, life cycle assessments, CO2 emissions, renewable energy potential, thermal performance, water usage, lighting, HVAC systems, daylight availability, wind effects, natural ventilation, and cost analysis, numerous simulation tools have been developed over the past two decades [30]. BIM enables the integration of multidisciplinary data within a unified model, facilitating the incorporation of maintainability strategies during the planning phase [31]. Sustainability-focused software based on BIM delivers results significantly faster than conventional methods, offering substantial time and resource savings. These analyses often generate comprehensive BIM models as a valuable by-product. BIM accelerates the generation of architectural drawings while leveraging parametric modification technologies to ensure consistent and coordinated updates across the entire model. This eliminates the need for manual interventions to maintain linkages or update drawings. BIM has become an indispensable tool in structural, engineering, and architectural fields. As green building certification and assessment processes gain traction, BIM presents significant opportunities to support sustainable design practices while reducing certification expenses. Evaluating the efficiency of the proposed methodology necessitates extracting 3D outputs from BIM-generated models [32]. These models must encapsulate information characterizing essential design elements, such as usage patterns and dimensional attributes. Whole-building energy modeling is a versatile and general-purpose technology utilized for real-time building control, green certification, code compliance, utility incentives, tax credit qualification, and the design of both new and retrofitted buildings. It also plays a critical role in large-scale studies aimed at developing building energy efficiency codes and guiding policy decisions. The building design process typically encompasses four stages: preliminary planning, conceptual planning, detailed planning, and developed planning. During the conceptual planning stage, project objectives and design requirements are identified. In the preliminary planning phase, the conceptual design is refined, and factors such as the building envelope, lighting, thermal comfort, building systems, and acoustic design are addressed. The detailed design phase involves further refinement, including the development of space layouts, detailing of external building walls, and integration of ventilation and air conditioning systems, electrical components, structural elements, final material selection, and hydraulic systems. At this stage, comprehensive energy, daylight, and thermal modeling are essential. In the developed planning phase, the preparation of building documentation requirements and protocols is prioritized, necessitating coordination among all disciplines. Failure to achieve this coordination may negatively impact construction and tendering processes [33]. Due to the inherent limitations of traditional building design processes, a more integrated design approach has become imperative. This multidisciplinary process involves collaboration from the earliest design stages, enabling optimized decision-making through iterative feedback loops [34]. Performance targets are established, and stakeholders from various disciplines work collectively to make informed decisions. In the initial design phase, architects often act as team leaders, while engineers provide insights into building performance. Quantity surveyors contribute by integrating material life analyses and technological systems into the design, facilitating healthier cost calculations at an early stage [35]. To conduct building energy modeling effectively, various inputs are required. One critical input is the climate data file for the building’s location. This file encompasses information affecting energy consumption, such as climate zone classification, geographical coordinates, elevation above sea level, and annual temperature and precipitation levels. While many building inputs can be generated through energy modeling-supported simulations, BIM-based modeling software often provides enhanced flexibility and user-friendly interfaces. Essential elements such as building geometry, construction materials, and space types can be efficiently defined using BIM software. Some BIM software allows the modeling of space energy loads and mechanical systems as part of the building energy analysis process. Once all required inputs are established, simulations can be conducted to assess the energy performance of the building.
These inputs, combined with meteorological data specific to the building’s location, are integrated with physical formulae within the building energy modeling program. This process enables the calculation of heat loads, system responses to those loads, and resulting power consumption. Additionally, related metrics such as energy costs and occupant comfort can be assessed. Building energy modeling algorithms typically operate on an hourly basis or at even finer intervals, performing calculations over an entire year. They also account for interactions between various building systems, such as cooling, heating, and lighting, providing a comprehensive analysis of energy dynamics and system efficiencies.
In recent years, the widespread adoption of BIM-based methods has drawn significant attention, particularly in areas such as sustainable building design and energy efficiency analysis. Below are some notable studies conducted within this scope [36]. Eleftheriadis et al. highlighted the limitations of modeling and potential avenues for optimization and analysis of energy-efficient sectoral constructions by employing BEM and BIM methodologies. Their study emphasized the application of BEM and BIM for optimizing and designing sectoral plants [31]. Reychav et al. reviewed recent advancements in energy-efficient building mechanisms using life-cycle analysis theory combined with Building Information Modelling (BIM). Their work focused on decision-making processes related to BIM, addressing code compliance, safety, buildability constraints, and optimization techniques [37]. To enhance existing guidelines and standards, Ghaffarianhoseini et al. analyzed social and cultural sustainability criteria for green building information systems, proposing their inclusion as essential elements for efficiency assessment [38]. After reviewing 96 studies on building energy performance, Lee et al. recommended the adoption of nD BIM applications in hybrid information-based construction management systems throughout the post-design construction life cycle to foster the sustainable performance of buildings [39]. To overcome the limitations of current assessment methods, particularly issues related to time-consuming data conversion and data incompatibility, Alwan et al. developed a green perspective for the LCA of constructions based on BIM, highlighting the embodied ecological impacts [40]. Bonenberg and Wei explored the potential to accelerate the environmental assessment of digitally designed structures by integrating BIM with 3D simulation transfer techniques. They proposed incorporating essential LEED credits into the BIM design process to meet sustainability requirements [41]. Liu et al. demonstrated the effectiveness of BIM as a valuable tool for integrating hybrid natural and technical mechanisms in architectural planning. Their study utilized multidimensional numerical modeling to coordinate multidisciplinary designs and explore green planning concepts within BIM-based sustainable infrastructure [42]. In contrast to traditional approaches, Jalaei and Jrade proposed a BIM-based construction planning optimization methodology to enhance construction sustainability. Their research combined BIM-based analysis with a PSO-driven optimization mechanism to address multi-objective challenges [43]. Wong and Fan introduced a methodology that integrates LCA and BIM tools to streamline the development of sustainable construction projects and assess the ecological impact of buildings [44]. Finally, Gerrish et al. emphasized the role of BIM in enhancing project and construction efficiency by facilitating data transfer processes aimed at achieving sustainability objectives [45]. The aims of some examples of BIM-based research are given in Table 1.
Table 1.
The aims of some examples of BIM-based research.
Although numerous studies have investigated the thermal performance of building envelopes using dynamic energy simulation tools and various multi-criteria decision-making (MCDM) techniques, the existing literature remains limited in three critical aspects. First, prior research predominantly focuses on petrochemical-based insulation materials, while the systematic assessment of eco-friendly fiber-based and wood-based alternatives within simulation-driven frameworks is still scarce. Second, most simulation–MCDM studies employ classical ranking approaches such as AHP, TOPSIS, COPRAS or ARAS, which rely on linear preference structures and lack mechanisms for early dominance detection, compromise-based selection, and robustness verification. Third, no study to date has integrated LODECI, MAXC and DEPART in a sequential hybrid architecture to cross-validate the ranking stability of envelope materials derived from detailed energy simulations. As a result, the literature lacks a reliable decision-making model capable of capturing the complex trade-offs between thermal performance, environmental impact, material density, and operational energy behavior.
This research addresses these gaps by presenting a comprehensive framework for the selection and evaluation of natural fibers and wood-based coating materials. The results demonstrate that the integration of detailed IES-VE simulations with material performance attributes enables more informed decision-making, particularly when regional climatic characteristics are considered. In the second phase, the study evaluates the impact of wood-based exterior cladding using LODECI, MAXC, and DEPART, supported by COPRAS, ARAS, and WASPAS for verification. Additionally, Monte Carlo simulations in MATLAB (R2023b) were employed to examine the influence of potential changes in criterion weights, thereby strengthening the robustness of the evaluation results. By integrating these diverse analytical components, the study identifies the most suitable materials for enhancing building performance in a regionally adaptive manner.
The novelty of this study lies in the methodological integration it introduces. Specifically, a sequential hybrid MCDM architecture combining LODECI, MAXC, and DEPART is applied for the first time to validate and cross-examine material rankings derived from dynamic energy simulations. Unlike conventional linear-ranking models, this tri-method structure enables early dominance detection, compromise-oriented evaluation, and systematic robustness assessment. Furthermore, the framework establishes a direct link between simulation-derived thermal indicators and multi-criteria performance attributes such as density, strength, and operational behavior, forming a holistic and scientifically transparent evaluation pipeline. The incorporation of Monte Carlo–based weight perturbation analysis further enhances reliability—a practice seldom implemented in current material selection research. Together, these components constitute a novel, simulation-driven, and multi-perspective decision-support model that advances existing approaches to sustainable building envelope evaluation.
2. Material Configurations and Design Strategies for Energy Performance in Breakfast Houses
2.1. The Climatic Conditions of Van Province
Van is the fifth-largest province in Turkey by surface area, situated at 38.5012° latitude and 43.3730° longitude. The region’s topography is predominantly defined by high, rugged, and mountainous terrain, which restricts the availability of land suitable for settlement. The climate in Van features harsh winters, while spring witnesses the highest levels of precipitation. Summers are generally hot and dry; however, the cooling effect of Lake Van helps moderate temperatures to some extent. Despite the limited rainfall during the summer months, winds are frequently observed. Van is also a prominent tourist destination, renowned for its distinctive breakfast culture, which has led to the proliferation of breakfast establishments across the city [54]. Figure 1 illustrates the Heating Degree-Day Map of Turkey for January 2024, highlighting Van’s geographical position [54]. Figure 2 presents climate-related data, including average hourly temperatures, temperature fluctuations, and solar elevation and azimuth values for Van. Furthermore, Figure 3 illustrates the annual wind rose, annual wind speed frequency distribution, and seasonal wind rose patterns for winter (January–March) and summer (July–September) in Van [55].
Figure 1.
Turkey heating degree-day map for January 2024 and the location of Van city on the map.
Figure 2.
(a) Climate in Van city, (b) Average hourly temperature in Van, (c) Average high and low temperature in Van, (d) Solar elevation and azimuth in Van.
Figure 3.
Wind rose (annual), wind speed frequency distribution (annual), wind rose (winter January–March) and wind rose (summer July–September) in Van city.
Figure 2 presents a comprehensive climatic characterization of Van city, which forms the basis for the energy and thermal performance simulations conducted in this study. Figure 2a illustrates the general climate profile, including cloud cover, precipitation patterns, humidity levels, and seasonal thermal comfort conditions throughout the year. The categories are presented with explicit month labels on the x-axis and percentage-based climate indicators on the y-axis. Figure 2b shows the average hourly temperature distribution, highlighting the diurnal temperature shifts and identifying periods with warm, cool, or freezing conditions that directly influence the building’s heating and cooling loads. Figure 2b illustrates the average hourly temperature variation, where the x-axis indicates the months of the year and the y-axis represents the time of day (00:00–24:00), supplemented with temperature zones indicated in °C for improved interpretability. Figure 2c provides the annual trend of average high and low temperatures, clearly demonstrating the sharp seasonal temperature gradient between winter and summer, which is a critical factor for envelope insulation performance assessment. Figure 2c displays the annual high and low temperature curves, with the x-axis showing months and the y-axis showing temperature values in °C, with clear numerical markers added to prevent overlapping. Figure 2d depicts the solar elevation and azimuth angles for Van, offering essential information regarding solar gains, façade exposure, and the optimization of shading and building orientation strategies. In Figure 2d, the x-axis represents the months, and the y-axis represents the hour of day, while contour labels indicate solar altitude in degrees.
Figure 3 illustrates the wind characteristics of Van City. The seasonal and annual wind views provide detailed data of the wind climate, essential for accurate passive ventilation and façade design assessments. The annual wind rose (top left) displays the distribution of wind direction and frequency, where the azimuth axis indicates the 16 standard compass directions and the radial axis represents the percentage of occurrence (% of time). The annual wind speed frequency histogram (top right) includes explicit wind speed units in knots on the x-axis and percentage frequency on the y-axis, with expanded axis labels to prevent overlap. The winter (January–March) and summer (July–September) wind roses (bottom left and bottom right) are similarly annotated with directional axes, radial frequency scales, and color-coded wind speed classes.
2.2. Sample Project Design
In this study, a prototype structure was designed to enhance the energy efficiency of breakfast houses, which are prevalent in Van Province, Turkey, by incorporating the region’s unique climatic conditions. To ensure the design complements the local architectural style, wood-like cladding materials were employed for the exterior facades. Five distinct types of wood-based cladding materials were utilized: pine wood, beech wood, oak wood, knot wood, plywood, particleboard, and hardwood fiberboard.
The primary structural material of the building was aerated concrete. In alignment with the region’s authentic architectural characteristics and to improve energy efficiency, eight different natural-based insulation materials were selected: cellulose, coir, flax, hemp, jute, kenaf, recycled cotton, and sheep wool.
The slab design incorporated multiple layers: a reinforced concrete slab on grade, bedding mortar with reinforced screed, protective concrete, XPS insulation, and granite covering.
A total of 40 alternative scenarios were developed by varying the combinations of the specified materials. These scenarios were labeled from Type 1 to Type 40. Additionally, two distinct outer shell configurations were assessed—externally insulated walls and sandwich walls—increasing the total number of alternative scenarios to 80, which were coded from Type 1 to Type 80. Scenarios 1 to 40 represent configurations with externally insulated walls, while scenarios 41 to 80 represent sandwich wall configurations.
The project obtained with Autodesk Revit and obtained with the IES-VE simulation program of the breakfast house designed in Van City is given in Figure 4. Figure 5 illustrates the two distinct exterior wall configurations designed for the breakfast house in Van Province. Table 2 provides the technical specifications of the materials employed in the building design, while Table 3 enumerates the alternative scenarios with varying material configurations. TSE 825 provides the reference ranges and recommended design values for commonly used wall materials, insulation products, and wood-based cladding components in Turkey. All thermal conductivity and density values presented in Table 2 were verified and standardized in accordance with the national thermal insulation guidelines defined in the TSE 825 Thermal Insulation Rules Standard Regulation in Buildings [56]. The material properties used in this study were cross-checked with the tabulated values and allowable ranges specified in TSE 825 to ensure that each parameter reflects realistic, regulation-compliant thermal behavior under local climatic conditions.
Figure 4.
(a) The project of the breakfast house designed in Van city; (b) Modellings of the breakfast house designed by IES-VE software in Van city (winter); (c) Modellings of the breakfast house designed by IES-VE software in Van city (summer), (d) Interface view of IES-VE software.
Figure 5.
Two different exterior wall structures designed for the breakfast house designed for external insulated walls and sandwich walls in Van City.
Table 2.
Technical Operational, thermal, and environmental input parameters used in the IES-VE simulation model.
Table 3.
Technical features of materials used for breakfast house design in Van city [56].
The selection of the two wall structures and the corresponding insulation and cladding materials was guided by their relevance to current construction practice and sustainable building trends. Externally insulated wall systems and sandwich wall systems represent the two most widely implemented façade typologies in Turkey, particularly in residential, commercial, and tourism-oriented buildings; therefore, their inclusion ensures that the simulation scenarios reflect realistic applications rather than hypothetical assemblies. The eight bio-fiber-based insulation materials and five wood-based exterior claddings were selected according to three criteria: (i) their availability and increasing preference within the Turkish construction market in alignment with national energy regulations, (ii) their established role in eco-friendly and low-embodied-carbon building design, and (iii) their suitability for continental and cold climatic conditions similar to the Van region. These materials also reflect broader international trends, as natural fibers and engineered wood products are increasingly adopted in comparable climates across Europe and Central Asia. By spanning a broad range of thermal conductivity, density, and long-term durability characteristics, the selected materials enable a comprehensive assessment of the trade-off between energy performance and sustainable material attributes. These choices display the applicability of the findings to not only Turkey but also other regions employing bio-based façade solutions under similar climatic conditions.
To ensure reproducibility of the IES-VE simulations, all operational and thermal input parameters used in the breakfast house model were standardized according to CIBSE Guide A, ASHRAE 90.1, and TS 825 references. Table 2 summarizes the full set of inputs required to reconstruct the building performance model. The occupancy density was set to 0.15 person/m2, with metabolic gains of 120 W/person for seated activities and an operational schedule between 08:00–23:00. Sensible and latent internal gains from appliances and cooking equipment were applied based on manufacturer data (10.5 W/m2 sensible, 3.2 W/m2 latent). The ventilation strategy followed a mixed-mode approach, with an infiltration rate of 0.55 ACH and mechanical ventilation set to 7 L/s·person during operating hours. HVAC control used a single-zone heating system with a setpoint of 21 °C and heating system efficiency of 0.92. Envelope thermal properties such as U-values, thermal mass, and solar absorptance were matched to the corresponding wall-type definitions used in the MCDM analysis, ensuring consistency between stages.
Comparisons of thermal transmittance (U-values) for all alternative material configurations in external insulation and sandwich wall structures are given in Figure 6. Although all eighty generated façade alternatives were based on physically valid material parameters and remain technically buildable, not every combination reflects the same level of practical feasibility in current construction practice. A feasibility screening was therefore carried out using three criteria: (i) material availability in the local construction market, (ii) compliance with regional façade design standards and durability requirements, and (iii) prevalence of the assembly type in recently completed projects. The results indicate that the majority of alternatives (approximately 70%) correspond to widely used and practically implementable wall assemblies, whereas the remaining combinations represent uncommon but still constructible configurations that help explore a broader design space. Including both typical and less frequent configurations was intentional, as it ensured that the simulation–MCDM framework could systematically examine performance differences across a wide spectrum of feasible envelope solutions rather than restricting the analysis to only the most conventional assemblies.
Figure 6.
Comparison of thermal transmittance (U-values) for all alternative material configurations in (a) external insulation and (b) sandwich wall structures.
Table 4.
Alternative scenarios with different materials used for breakfast house design in Van city.
3. Results and Discussion by IES-VE Simulation
To address the key modelling parameters requested by reviewers, the dynamic thermal simulations in IES-VE were conducted using a consistent set of predefined inputs for occupancy schedules, internal gains, infiltration, HVAC configuration, and control logic. The breakfast house operates with a mixed-use hospitality schedule: occupancy between 08:00 and 22:00, with a peak density of 0.15 persons/m2. Internal heat gains were modeled as 6 W/m2 for occupants, 8 W/m2 for lighting, and 10–12 W/m2 for equipment during operating hours, consistent with ASHRAE comfort and small-commercial building benchmarks. Infiltration was set to 0.5 h−1 during occupied periods and 0.7 h−1 during unoccupied periods, representing typical leakage rates for masonry-insulated wall systems in the region. HVAC was represented by a standard air-to-air heat pump with a coefficient of performance (COP) = 3.1 for heating and EER = 2.8 for cooling, controlled by a dual-setpoint thermostat (20 °C heating, 25 °C cooling). The control strategy followed IES-VE’s default proportional-integral control for system modulation. Thermal properties of wall layers (plaster, insulation, and wood-based cladding) were assigned using manufacturer data or certified literature values, ensuring consistency across all 80 envelope alternatives.
To ensure comparability among the eighty simulated façade scenarios, all input parameters in Autodesk Revit and IES-VE were standardized and verified through a unified calibration procedure. Internal load assumptions—including occupancy density, equipment gains, lighting schedules, and activity levels—were defined in accordance with ASHRAE 90.1 and CIBSE Guide A specifications for restaurant-type spaces and kept constant for all cases. The same IWEC2 climate file for Van (Turkey) was used across the entire dataset to guarantee uniform dynamic weather conditions. Boundary conditions, such as HVAC operation schedules, infiltration rate, ventilation strategy, and thermal setpoints, were assigned using the Apache Systems module and subsequently locked to prevent uncontrolled variations between runs. Prior to conducting the full batch simulation, three randomly selected configurations were tested to verify alignment in heat-gain balance, system energy use, and operative temperature response under baseline conditions. Through this approach, performance differences observed across scenarios result purely from façade-material variations rather than inconsistencies in modeling assumptions.
The total energy usage and total CO2 emission values for the external insulated and sandwich wall structure alternative types are illustrated in Figure 7 and Figure 8, respectively.
Figure 7.
Total energy consumption values of all alternative types (a) External insulated wall alternative types, (b) Sandwich wall alternative types.
Figure 8.
Total CO2 values of all alternative types: (a) External insulated wall alternative types, (b) Sandwich wall alternative types.
The software analysis results conducted via the IES-VE platform revealed significant insights into energy consumption and CO2 emission patterns among the studied alternatives. The findings demonstrated that: The maximum total energy consumption was recorded for Alternative 70, amounting to 22,029 kWh, whereas the minimum total energy consumption was observed for Alternative 19, with a value of 21,706 kWh. The percentage difference between the maximum and minimum energy usage was calculated as 1.49%, indicating relatively stable energy demands across the alternatives.
In terms of CO2 emissions, Alternative 30 and Alternative 70 exhibited the highest emission levels, reaching 9383 kgCO2, while the lowest emissions were associated with Alternative 19 and Alternative 59, each generating 9313 kgCO2. The percentage difference between the highest and lowest emission values was 0.75%, highlighting a narrow but notable variation in environmental impact.
These results suggest that Alternative 19 not only achieves the lowest energy consumption but also minimizes carbon emissions, making it the most energy-efficient and environmentally friendly solution among the studied scenarios. The small percentage differences in energy and emission values underline the consistency of the building envelope designs but also highlight the potential for further optimization through material selection and system adjustments.
The comparative analysis of wall structures and insulation materials in Type 72, Type 59 (sandwich structure), Type 19, and Type 30 (externally insulated) revealed critical findings regarding energy efficiency and environmental impact. The Type 72 (Sandwich Structure) configuration (composed of dual layers of gas concrete (10 cm), recycled cotton insulation, and beech-oak wood finishing) demonstrated superior thermal insulation properties. The use of recycled cotton, a low thermal conductivity material, provided effective resistance to heat flow. This structure’s layered design contributed to minimizing heat transfer, reducing both energy consumption and CO2 emissions. Similar to Type 72 but with hemp insulation instead of cotton, Type 59 (sandwich structure) exhibited slightly lower thermal resistance. Hemp, while offering decent insulation characteristics, has higher thermal conductivity than recycled cotton, which may explain the observed variation. Nonetheless, the combination of gas concrete and particleboard finishing maintained a balanced insulation effect. The Type 19 (externally insulated) structure, comprising 20 cm gas concrete and hemp insulation, highlighted the benefits of externally applied insulation in controlling thermal bridges and heat loss. The particleboard finishing further enhanced structural stability and insulation. The Type 30 (Externally Insulated) configuration used kenaf insulation instead of hemp and was paired with hardwood fiberboard as an external finish. Kenaf, known for its environmental benefits and moderate thermal conductivity, provided a sustainable yet effective insulation solution. However, compared to Type 19, its energy efficiency slightly declined due to material differences.
According to the thermal and environmental performance, the sandwich structures (Type 72 and Type 59) exhibited superior efficiency in terms of thermal resistance and energy conservation due to the multi-layered approach and optimized material selection. The externally insulated configurations (Type 19 and Type 30) offered reliable alternatives, particularly in scenarios requiring robust external wall protection and heat loss management. According to the material efficiency, recycled cotton in Type 72 proved to be the most efficient insulation material, offering high thermal resistance with minimal environmental impact. Kenaf and hemp provided sustainable insulation alternatives but with moderate thermal performance compared to recycled cotton.
While pine, beech, oak, and knot wood exhibit slightly lower energy-efficiency scores in the IES-VE simulation, this outcome is primarily linked to their higher thermal conductivity and density compared to particleboard or hardwood fiberboard. Solid wood species generally conduct heat more readily due to their natural cellular structure, which results in marginally higher heat transfer through the façade under dynamic climate conditions. Therefore, these materials do not achieve the same degree of thermal buffering as lower-density engineered boards.
However, when broader structural and environmental considerations are integrated, these wood species remain highly feasible alternatives. Solid woods such as pine, beech, and oak provide significantly superior durability, moisture resistance, long-term dimensional stability, and mechanical reliability—attributes that are essential for exterior façade applications but are not captured in the thermal simulation stage. Moreover, their lower embodied carbon, natural biodegradability, and compatibility with eco-friendly construction practices increase their environmental value, compensating for their slightly weaker thermal performance. The hybrid evaluation therefore reveals an expected trade-off: although solid woods do not minimize energy consumption to the same extent as engineered wood products, their combination of structural integrity, service life, and environmental benefits requires their classification as appropriate and contextually sound alternatives.
According to the sustainability consideration, the integration of renewable and recycled materials (e.g., hemp, kenaf, and recycled cotton) aligns with green building principles. These materials contribute to the reduction of embodied carbon and promote circular economy practices.
To illustrate the internal validity and temporal behavior of the dynamic modelling structure, Figure 9 presents the detailed energy performance outputs for the best-performing envelope type. As shown in Figure 9a, the annual distribution of electricity and natural gas consumption remains consistent with the operational characteristics of a mixed-use hospitality building. Figure 9b provides the hourly–monthly load profile, demonstrating how external climatic variations and occupancy-driven internal gains influence system demand throughout the year. Finally, Figure 9c visualizes the three-dimensional load surface, highlighting the dynamic interaction between climatic drivers, envelope thermal properties, and HVAC control strategies. Together, these results confirm that the simulation framework accurately captures the hourly energy behavior needed for evaluating the impact of different wall coating materials.
Figure 9.
Dynamic energy performance outputs generated by the IES-VE simulation for the best-performing envelope configuration. (a) Annual distribution of total electricity, total natural gas, and total energy consumption. (b) Hourly and monthly energy load profile showing the temporal variation of electricity and natural gas demand throughout the year. (c) Three-dimensional surface representation of the dynamic heating and cooling loads, illustrating the interaction between outdoor climatic conditions and hourly thermal response of the building.
These findings underscore the critical role of material selection and wall structure configuration in enhancing the thermal efficiency of buildings while minimizing environmental footprints. The results serve as a guide for future studies and practical applications in energy-efficient and sustainable building designs.
The regression line and regression formulation for total energy consumption and total CO2 emission are displayed in Figure 10.
Figure 10.
Regression line and regression formulation for (a) total energy consumption and (b) total CO2.
Regression equation for total energy consumption: y = 0.1058x + 21,910
Where,
y: Total energy consumption (kWh/year).
x: Wall type (numbered from 1 to 80, representing different insulation and construction material combinations).
0.1058: Regression coefficient (slope). This indicates that a one-unit increase in the wall type number will result in a 0.1058-unit increase in total energy consumption.
Regression Equation for Total CO2 emissions: y = 0.0252x + 9357.2
Where,
y: Total CO2 emissions (CO2/year).
x: Wall type (numbered from 1 to 80, representing different insulation and construction material combinations).
0.0252: Regression coefficient (slope). This indicates that a one-unit increase in the wall type number will result in a 0.0252-unit increase in total CO2 emissions.
The optimal coating materials are those that perform well in both thermal energy performance and mechanical–structural attributes. In the first stage of this study, the IES-VE simulation quantifies the dynamic thermal behavior of the alternatives under the climatic characteristics of Zone 4, while in the second stage, the MCDM framework evaluates their mechanical and structural performance. Although this two-step model does not provide a strict mathematical optimization, it effectively filters out materials that perform poorly either thermally or structurally, thereby improving decision quality beyond conventional simulation-only or MCDM-only approaches.
Although particleboard appears among the top-performing alternatives in the IES-VE simulation due to its favorable thermal conductivity and moderate density, this outcome reflects only its operational thermal behavior. The IES-VE platform does not evaluate long-term durability, moisture resistance, biological degradation, or fire performance—areas where particleboard is known to exhibit limitations compared to other wood-based claddings. Therefore, thermal efficiency alone does not imply overall suitability for exterior façade applications. The second-stage MCDM analysis specifically addresses this gap by incorporating mechanical and structural criteria to ensure that thermally efficient yet durability-limited materials do not occupy the top ranks. As demonstrated in the multi-method MCDM comparison, particleboard does not emerge as the best overall alternative, confirming that the proposed hybrid framework successfully distinguishes between thermal behavior and holistic material performance. The annual operational energy cost and total life-cycle carbon emissions for Alternatives 1–80 are summarized in Figure 11.
Figure 11.
(a) Annual Operational Energy Cost (USD/year) for Alternatives 1—80. (b) Total Life-Cycle Carbon Emissions (kg CO2, 50—year) for Alternatives 1—80.
Although the annual operational energy consumption values across the 80 wall alternatives fall within a narrow band (2049–2080 USD/year), the 50-year life-cycle assessment (LCA) reveals substantially more meaningful differences once embodied emissions and the mandatory renewal at year 30 are accounted for. The LCA results for the first 40 alternatives, for example, range from 471,080 kg CO2 (Alt-19) to 474,580 kg CO2 (Alt-30)—a gap of approximately 3500 kg CO2, which is far larger than the 1–2% variation observed in annual energy use. A similar spread is observed among Alternatives 41–80. These findings demonstrate that small differences in operational energy trajectories accumulate over decades, leading to measurable changes in total carbon impact.
Engineered wood-based materials such as hardwood fiberboard and particleboard generally occupy the lower end of the LCA spectrum (≈471,000–472,000 kg CO2), primarily due to their favorable thermal conductivity and resulting reduction in space-heating demand. In contrast, solid wood materials (pine, beech, oak, and knot) exhibit slightly higher embodied emissions at the manufacturing stage. However, their longer service life, greater mechanical stability, and reduced likelihood of replacement significantly mitigate these initial impacts. Consequently, despite being moderately less energy efficient, the total 50-year LCA of solid wood alternatives remains highly competitive, differing by only 1–1.5% from the lowest-emission engineered materials. This demonstrates that operational efficiency alone is not a sufficient indicator of long-term sustainability.
These results collectively reinforce the need to combine dynamic simulation with life-cycle metrics when evaluating façade materials. A material that excels thermally may perform poorly under long-term moisture exposure or require more frequent replacement, thereby increasing its overall carbon footprint. Conversely, a material with slightly higher embodied emissions may outperform others over a 50-year horizon due to superior durability. The integrated IES-VE + LCA approach used in this study prevents misleading conclusions based solely on operational energy and provides a methodologically sound basis for sustainability-related claims.
While the primary ranking in this study is based on operational energy performance and mechanical–structural indicators, the inclusion of embodied carbon and long-term LCA metrics has the potential to partially shift the relative positioning of wood-based materials. The extended 50-year LCA calculations show that materials with slightly higher operational energy consumption—such as solid wood claddings (pine, beech, oak, knot)—may achieve competitive or even superior sustainability scores once durability and renewal frequency are incorporated. In contrast, engineered wood products such as particleboard and hardwood fiberboard, despite their strong thermal behavior in the IES-VE simulation, accumulate higher life-cycle emissions due to resin-intensive manufacturing and shorter replacement cycles. Therefore, a fully LCA-integrated ranking framework might elevate long-lasting natural wood alternatives while moderating the relative performance of engineered materials. This suggests that future material-selection models should holistically integrate both operational and embodied impacts to avoid thermal-efficiency-driven biases in the ranking.
The rankings reported in this study are conditioned by the heating-dominated energy balance of Van, Turkey. In a significantly warmer, cooling-dominated climate, we anticipate systematic shifts in material priorities. Specifically, exterior claddings with low solar absorptance (high short-wave reflectance) and high exterior thermal resistance are likely to be favored to reduce cooling loads and surface heat gain. Thermal mass will be beneficial only where substantial diurnal swings and nighttime ventilation allow effective night cooling; otherwise, lightweight high-R and reflective materials typically perform better for cooling-dominated scenarios. Additionally, moisture resistance, surface emissivity, and fire performance become relatively more important in hot-humid contexts. Consequently, some engineered panels (e.g., fiberboard or particleboard with high reflectance and low absorptance) could improve their relative ranking, whereas certain solid woods might drop if their solar absorptance or dimensional instability under heat/humidity reduces operational performance. We therefore find it important that practitioners reapply the modular hybrid framework with local EPW weather files and appropriately adjusted criterion weights (increasing weight for solar reflectance, moisture resistance, and fire safety) to derive site-specific material rankings.
In addition to operational energy savings, the environmental assessment of natural insulation and cladding materials must also account for their embodied energy (EE) and embodied carbon (EC), as these upstream impacts can significantly influence total life-cycle performance. Although the present study primarily focuses on operational energy demand within a continental climate context, a complementary analysis of material production chains indicates that the eight natural alternatives considered exhibit substantially lower cradle-to-gate emissions compared with conventional petrochemical-based insulation. For instance, wood-derived materials (pine, beec knotwood and particleboard) typically exhibit EE values in the range of 1.5–10 MJ/kg and EC coefficients between −1.2 and +0.45 kgCO2-eq/kg, depending on resin type, kiln-drying conditions, and forest management practices. The presence of biogenic carbon storage—particularly in knotwood and solid hardwood species—results in net-negative or near-zero cradle-to-gate carbon profiles, which substantially offsets the operational emissions associated with heating-dominated climates. Similarly, reed, straw, and other lignocellulosic fibers commonly demonstrate EE levels between 0.7–4 MJ/kg, with specific EC values below 0.1 kgCO2-eq/kg, owing to minimal processing requirements, low-temperature manufacturing, and the absence of petroleum-based binders.
When integrated with whole-building energy simulations, these EE/EC characteristics reveal that operational performance alone does not fully capture long-term sustainability rankings. For example, although particleboard demonstrates superior thermal resistance in the IES-VE simulations, its higher resin-derived EC and elevated embodied energy—arising from pressing, densification and adhesive-curing cycles—reduce its relative advantage when life-cycle burdens are considered. Conversely, materials such as pine or beech–oak, which exhibit marginally higher annual heating loads, often outperform particleboard on a life-cycle basis due to lower embodied burdens, higher biogenic carbon retention, and more favorable end-of-life pathways (e.g., reuse, mechanical recycling, or energy recovery with carbon-neutral profiles). Therefore, a more holistic sustainability justification emerges when embodied carbon storage, resin content, manufacturing intensity, and end-of-life scenarios are integrated into the analysis. Incorporating EE and EC into the MCDM framework—either as additional normalized criteria or through hybrid weighting—would thus enable a more comprehensive life-cycle–oriented material ranking that aligns more closely with current international building sustainability protocols (EN 15978, ISO 14067, Level(s)) [57,58].
4. Methodology
In this study, the performance of wall coating materials will be evaluated using the MCDM model consisting of LODECI (LOgarithmic DEcomposition Of Criteria Importance), MAXC (MAXimum of Criterion), and DEPART (Deviation-Based Pairwise Assessment Ratio Technique) methods. In this section, information about LODECI, MAXC, and DEPART methods is given.
4.1. LODECI Method
The LODECI method was introduced to the literature by Pala [59]). The LODECI method obtains more balanced weights compared to the Entropy and MEREC methods [59]. The steps of this method are presented below [59,60]:
Step 1: The first step is to organize the decision matrix.
Step 2: The values in the decision matrix are normalized with the help of the following equations.
Step 3: Calculate the decomposition values () of the normalized values.
Step 4: The Logarithmic Deviation Value () is calculated for each criterion as follows.
Step 5: Finally, the weight of each criterion is calculated with Equation (6).
4.2. MAXC Method
The steps of the MAXC method are presented below [61]:
Step 1: The decision matrix is organized. The decision matrix is presented in Equation (1).
Step 2: The values in the decision matrix are normalized with the help of the following equation.
Step 3: Obtain the maximum value of each criterion
Step 4: Calculate the distance between the maximum value and the value of each criterion.
Step 5: Calculate the expected distance value for each criterion.
Step 6: The weights of the criteria are calculated as follows:
The weights of the criteria obtained from LODECI and MAXC methods are combined with the following equation [62].
After finding the combined weights of criteria, the DEPART method is used to evaluate the wall coating materials.
4.3. DEPART Method
The steps of the DEPART method are summarized below [63]: Step 1: The decision matrix is organized. The decision matrix is presented in Equation (1).
Step 2: The decision matrix is normalized by Equation (13).
Step 3: This stage involves the computation of the elements within the positive deviations matrix () and the negative deviations matrix ().
where:
Step 4: In this phase, two pairwise matrices of the alternatives are formulated based on the deviations acquired in the preceding step: the pairwise positive deviation ratio matrix () and the pairwise negative deviation ratio matrix ().
where:
If , then .
Step 5: The previously calculated pairwise positive and negative deviation ratio matrices are aggregated according to a parameter specified by the decision-maker () in this step. The aggregated pairwise deviation ratio matrix, denoted as , is derived from the aforementioned aggregation process. The elements of this matrix are determined by the subsequent relationship.
The original study that introduced the DEPART method does not specify any theoretical interval or recommended range for the aggregation parameter . However, in the illustrative example provided by the authors, the parameter is set to = 0.5. To ensure methodological consistency with the original formulation of DEPART, the present study also adopts = 0.5.
Step 6: This step involves calculating the sums of the columns of the aggregated pairwise deviation ratio matrix derived in the preceding phase. These figures denote the overall deviation ratio of each alternative in relation to all other alternatives. These calculations are employed to ascertain the ultimate score for each option.
Step 7: Step 6 yields the column sums and Step 5 computes the aggregated pairwise deviation ratio matrix; the following equation is used to compute the final score for each option.
The options are rated based on their final score, with higher scores indicating a more favorable option.
5. Application
First, a decision matrix containing wall coating materials and the parameters for evaluating these materials is prepared. The parameters used in the study are as follows: Thermal Conductivity (NBO), Density (NBO), Compressive Strength (BO), Bending Strength (BO), Stiffness (BO), and Hardness (BO). The decision matrix is presented in Table 5.
Table 5.
Decision Matrix.
To facilitate reproducibility and to make the computational procedure easier to follow for other researchers, we provide explicit numerical illustrations for the MCDM methods used in this study. For the LODECI and MAXC weighting schemes, all computational steps are demonstrated using criterion Thermal Conductivity as an example, including normalization, intermediate results, and the final derivation of the combined weights.
Similar calculation steps are followed for other criteria to calculate the weights of the criteria for the LODECI and MAXC methods. Table 6 shows the criteria weights obtained from the LODECI () and MAXC () methods and the combined weights () of these methods.
Table 6.
Weights of Criteria.
When combined weights were considered, Thermal Conductivity was determined to be the parameter of highest importance, while Compressive Strength was determined to be the parameter of least importance. After determining the weights of the parameters, the DEPART method is used to evaluate the performance of wall coating materials. The decision matrix is normalised using Equation (13). The normalized decision matrix is presented in Table 7.
Table 7.
Normalized Decision Matrix.
After normalization, Equations (14) and (15) are used to calculate the positive deviations matrix () and the negative deviations matrix (). These matrices are shown in Table 8 and Table 9.
Table 8.
The Positive Deviations Matrix ().
Table 9.
The Negative Deviations Matrix ().
Equations (18) and (19) are used to calculate the pairwise positive deviation ratio matrix () and the pairwise negative deviation ratio matrix (). These matrices are shown in Table 10 and Table 11.
Table 10.
The Pairwise Positive Deviation Ratio Matrix ().
Table 11.
The Pairwise Negative Deviation Ratio Matrix ().
For the DEPART method, a worked example is presented for the value of the Wood (pine) under Thermal Conductivity, showing how the intermediate results and final rankings of the Wall Coating Materials are obtained.
The same procedures are performed for other materials. Table 12 shows the ranking of materials according to the DEPART method.
Table 12.
The Results of DEPART.
According to the results of the DEPART method, wood (plywood) has been determined as the best wall coating material. This material is followed by wood (pine), wood (particleboard), hard wood fiber board, and wood (beech, oak, knot).
In order to verify the accuracy of the proposed MCDM model, a comparative analysis has been undertaken with other MCDM methods (COPRAS, ARAS and WASPAS). The results of the comparative analysis are presented in Figure 9.
As demonstrated in Figure 12, the DEPART method has yielded analogous results to those obtained by other MCDM methods. Consequently, it can be concluded that the DEPART method has yielded the correct results.
Figure 12.
The Comparison Analysis.
To examine the robustness of the DEPART results against potential changes in parameter weights, 50 scenarios were generated using Monte Carlo simulation in MATLAB. In each scenario, the initial weights were randomly perturbed within a feasible variation range while ensuring that the weights remained positive and summed to one. This approach follows common practice in MCDM robustness analyses and allows for a systematic evaluation of the sensitivity of the final rankings to fluctuations in criterion weights.
To assess the robustness of the results, the impact of varying parameter weights was analyzed using a Monte Carlo simulation. In the simulation process, the distribution and ranges of the criterion weights were determined in a structured manner. First, all weight vectors were generated using a bounded random distribution that ensures non-negativity and preserves the condition that all weights sum to one. This approach follows common practice in MCDM robustness analysis, where uncertainty in decision-maker preferences is modeled through random perturbations within a controlled feasible space.
The simulation assumes that decision-makers may assign slightly different importance levels to criteria due to subjective judgment, incomplete information, or changing design priorities. Therefore, the selected distribution captures moderate uncertainty by allowing the weights to vary around their baseline values without departing from realistic ranges used in building design literature. This modeling framework reflects the degree of uncertainty typically observed in architectural and engineering decision environments, where exact weights are rarely known with certainty but generally fluctuate within plausible bounds.
As illustrated in Figure 13, the outcomes are presented for alterations in parameter weights.
Figure 13.
The Results of Sensitivity Analysis.
As illustrated in Figure 13, each material has experienced at least one alteration in its ranking.
This study is limited by the use of only mechanical and physical properties in the evaluation of wood-based cladding materials, as these criteria are the only ones for which consistent, standardized, and simulation-compatible data are available. Important factors such as long-term durability, fire and moisture resistance, maintenance requirements, environmental indicators, and aesthetic considerations were not included due to their high variability and the lack of uniform datasets. Additionally, the weighting process was based on objective numerical normalization rather than stakeholder or expert input, which may reduce context-specific relevance. Future research should expand the decision matrix by incorporating economic, environmental, and durability-related criteria, as well as fire–moisture classifications supported by laboratory testing. Integrating stakeholder-derived weights and applying the framework to different climates and building typologies would further enhance the robustness, generalizability, and practical relevance of the proposed decision model.
6. Limitations and Future Work
Although this study provides valuable insights into the integration of sustainable wall coating materials into energy-efficient building envelopes through a hybrid simulation–MCDM framework, several limitations should be acknowledged to ensure a realistic interpretation of the findings.
First, the energy performance assessment was conducted for a single real-scale building model—a breakfast house located in Van, Türkiye. While the objective of the case study was not to develop a universally prescriptive material recommendation, the results are inherently conditioned by the typology and geometry of the selected building. Future studies should evaluate different architectural typologies (e.g., residential, educational, commercial and public buildings) to determine the consistency of the proposed material selection approach across diverse building functions.
Second, the dynamic thermal simulations were performed based on the climatic characteristics of Climate Zone 4, according to the Turkish Standard TS825 [56]. Although this climate zone includes 31 provinces and approximately 47% of the total land area of Türkiye—therefore offering broad regional applicability—the findings remain climate-dependent. To achieve wider generalization, future research should extend the simulation framework to additional climatic regions, both within Türkiye and internationally, to test the robustness of results under varying meteorological conditions.
Third, the MCDM analysis relied primarily on the physical and mechanical properties of wood-based exterior cladding materials. This decision was intentional to preserve methodological consistency with the energy simulation outputs, which are directly influenced by density, thermal conductivity, and structural performance parameters. However, as the reviewer correctly notes, real-world material selection also depends on additional dimensions such as life-cycle cost, durability, fire and moisture resistance, maintenance requirements, embodied environmental impacts, and aesthetic or contextual considerations. These criteria require comprehensive datasets, region-specific cost information, and stakeholder-derived weighting inputs (e.g., architects, material producers, contractors, and end-users), which were beyond the scope of the current simulation-oriented study. Future work will expand the decision model by integrating these broader sustainability and design-practice dimensions to enhance decision relevance.
Fourth, the weighting procedure in this study was derived from model-based assumptions rather than stakeholder participation. While the inclusion of Monte Carlo simulation provided a robustness check against weight uncertainty, future studies should incorporate participatory weighting techniques (such as AHP pairwise surveys, Delphi panels, or expert elicitation) to better reflect actual design priorities and industry-specific preferences.
Lastly, the hybrid framework applied in this study establishes a complementary—rather than a fully automated optimization—link between simulation and MCDM processes. Future developments may explore surrogate-based optimization models, digital twins, or machine learning–assisted decision systems to further strengthen integration, reduce computational load, and enable real-time material selection support.
Despite these limitations, the findings of this research contribute meaningful evidence toward sustainable wall envelope design and demonstrate the advantages of combining detailed building energy simulation with a hybrid MCDM structure for transparent and data-driven material evaluation.
7. Conclusions
This study integrated dynamic energy simulation (IES-VE) with a hybrid multi-criteria decision-making framework to evaluate natural fiber and wood-based wall coatings. The simulation results showed that particleboard provided the lowest annual energy consumption due to its favorable thermal conductivity and density. However, when mechanical and structural performance was incorporated through LODECI, MAXC, and DEPART, solid wood materials such as pine, beech, oak, and knot ranked competitively, demonstrating that the thermally best material is not necessarily the best overall alternative.
The three recently developed MCDM techniques used in this study—LODECI, MAXC, and DEPART—offer distinct mathematical advantages over classical weighting and ranking approaches. The MAXC method provides a fast and computationally simple structure for determining criterion weights. The LODECI method yields balanced criteria weights. The DEPART method introduces a deviation-ratio-based comparative mechanism that enhances the robustness of the ranking process. By utilizing maximum deviation anchors ( and ) and aggregating pairwise deviation ratios through a tunable parameter, DEPART ensures stability against scaling effects, strengthens sensitivity to performance differences, and minimizes the likelihood of rank reversal.
The hybrid approach successfully distinguished between envelope materials that perform well only in energy behavior and those that maintain balanced thermal, mechanical, and structural performance. The consistency between the main MCDM methods and the verification set (COPRAS, ARAS, WASPAS), supported by Monte Carlo weight perturbation analysis, confirmed the robustness of the rankings.
Overall, the study demonstrates that combining detailed building simulations with a multi-perspective decision framework provides a more reliable basis for sustainable material selection. Future work should incorporate broader environmental criteria, embodied carbon, and long-term durability to fully capture the life-cycle implications of wood-based cladding materials.
Author Contributions
Conceptualization, A.U., Ž.S., İ.A., D.K.D. and F.B.; methodology, A.U. and Ž.S.; validation, A.U. and F.B.; formal analysis, D.K.D.; investigation, İ.A.; resources, data curation, F.B.; writing—original draft preparation, A.U., Ž.S., İ.A., D.K.D. and F.B.; writing—review and editing, A.U., Ž.S., İ.A., D.K.D. and F.B.; visualization, F.B. and D.K.D.; supervision, F.B. All authors have read and agreed to the published version of the manuscript.
Funding
This research received no external funding.
Institutional Review Board Statement
Ethical approval was not applicable to this study, as it did not involve human participants, animals, or any primary data collection requiring consent.
Informed Consent Statement
Not applicable.
Data Availability Statement
The original contributions presented in this study are included in the article. Further inquiries can be directed to the corresponding authors.
Conflicts of Interest
The authors declare no conflicts of interest.
References
- Zhang, Y.; He, C.Q.; Tang, B.J.; Wei, Y.M. China’s energy consumption in the building sector: A life cycle approach. Energy Build. 2015, 94, 240–251. [Google Scholar] [CrossRef] [Scilit]
- Sieminski, A. Annual Energy Outlook 2015; US Energy Information Administration: Washington, DC, USA, 2015.
- Abu-Jdayil, B.; Mourad, A.H.; Hittini, W.; Hassan, M.; Hameedi, S. Traditional, state-of-the-art and renewable thermal building insulation materials: An overview. Constr. Build. Mater. 2019, 214, 709–735. [Google Scholar] [CrossRef] [Scilit]
- Tettey, U.Y.A.; Dodoo, A.; Gustavsson, L. Effects of different insulation materials on primary energy and CO2 emission of a multi-storey residential building. Energy Build. 2014, 82, 369–377. [Google Scholar] [CrossRef] [Scilit]
- European Commission. The European Green Deal. COM(2019) 640 Final; European Commission: Brussels, Belgium, 2019. [Google Scholar]
- Gaujena, B.; Agapovs, V.; Borodinecs, A.; Strelets, K. Analysis of thermal parameters of hemp fibre insulation. Energies 2020, 13, 6385. [Google Scholar] [CrossRef] [Scilit]
- Al-Homoud, M.S. Performance characteristics and practical applications of common building thermal insulation materials. Build. Environ. 2005, 40, 353–366. [Google Scholar] [CrossRef] [Scilit]
- Dylewski, R.; Adamczyk, J. Impact of the degree days of the heating period on economically and ecologically optimal thermal ınsulation thickness. Energies 2021, 14, 97. [Google Scholar] [CrossRef] [Scilit]
- Golder, S.; Narayanan, R.; Hossain, M.R.; Islam, M.R. Experimental and cfd investigation on the application for aerogel ınsulation in buildings. Energies 2021, 14, 3310. [Google Scholar] [CrossRef] [Scilit]
- Bourbia, S.; Kazeoui, H.; Belarbi, R. A review on recent research on bio-based building materials and their applications. Mater. Renew. Sustain. Energy 2023, 12, 117–139. [Google Scholar] [CrossRef] [Scilit]
- Radic, M.; Dodig, M.B.; Auer, T. Green Facades and Living Walls—A Review Establishing the Classification of Construction Types and Mapping the Benefits. Sustainability 2019, 11, 4579. [Google Scholar] [CrossRef] [Scilit]
- He, Y.; Yu, H.; Ozaki, A.; Dong, N.; Zheng, S. An investigation on the thermal and energy performance of living wall system in Shanghai area. Energy Build. 2017, 140, 324–335. [Google Scholar] [CrossRef] [Scilit]
- Hartmann, M.; Alsaad, H.; Mosayebzadeh, M.; Voelker, C. The reduction of building energy demand by a living wall system in a Central European climate. In Proceedings of the BS2023, the 18th Conference of IBPSA, Shanghai, China, 4–6 September 2023. [Google Scholar]
- Garcia, M.; Vera, S.; Bustamante, W.; Rouault, F. Modelling and Validation of two Heat and Mass Transfer Model of Living Walls and Evaluation of Their Impact on the Energy Performance of a Supermarket in a Semiarid Climate. In Proceedings of the BS2019, the 16th Conference of IBPSA, Rome, Italy, 2–4 September 2019. [Google Scholar]
- ASHRAE Standard 140-2020; Method of Test for Evaluating Building Performance Simulation Software. American Society of Heating Refrigerating and Air-Conditioning Engineers (ASHRAE): Peachtree Corners, GA, USA, 2020.
- Annibaldi, V.; Cucchiella, F.; De Berardinis, P.; Gastaldi, M.; Rotilio, M. An integrated sustainable and profitable approach of energy efficiency in heritage buildings. J. Clean. Prod. 2020, 251, 119516. [Google Scholar] [CrossRef] [Scilit]
- Buonomano, A.; Palombo, A. Building energy performance analysis by an in-house developed dynamic simulation code: An investigation for different case studies. Appl. Energy 2014, 113, 788–807. [Google Scholar] [CrossRef] [Scilit]
- Kamel, E.; Memari, A.M. Residential Building Envelope Energy Retrofit Methods, Simulation Tools, and Example Projects: A Review of the Literature. Buildings 2022, 12, 954. [Google Scholar] [CrossRef] [Scilit]
- Gan, V.J.L.; Wong, H.K.; Tse, K.T.; Cheng, J.C.P.; Lo, I.M.C.; Chan, C.M. Simulation-based evolutionary optimization for energy-efficient layout plan design of high-rise residential buildings. J. Clean. Prod. 2019, 231, 1375–1388. [Google Scholar] [CrossRef] [Scilit]
- Foda, M.A.M.; Hegazy, I.R.; El-Azab, M.M.T.; El-Gezawy, L.S.E.-D. Improving the Energy Efficiency of Residential Green Heritage Buildings. Bull. Fac. Eng. Mansoura Univ. 2021, 40, 11–25. [Google Scholar] [CrossRef] [Scilit]
- Mirrahimi, S.; Mohamed, M.F.; Haw, L.C.; Ibrahim, N.L.N.; Yusoff, W.F.M.; Aflaki, A. The effect of building envelope on the thermal comfort and energy saving for high-rise buildings in hot–humid climate. Renew. Sustain. Energy Rev. 2016, 53, 1508–1519. [Google Scholar] [CrossRef] [Scilit]
- Utkucu, D.; Szer, H. Interoperability and data exchange within BIM platform to evaluate building energy performance and indoor comfort. Autom. Constr. 2020, 116, 103225. [Google Scholar] [CrossRef] [Scilit]
- Koriakovtseva, T.A.; Dontsova, A.E.; Nemova, D.V. Mechanical and Thermal Properties of an Energy-Efficient Cement Composite Incorporating Silica Aerogel. Buildings 2024, 14, 1034. [Google Scholar] [CrossRef] [Scilit]
- Terentyev, O.; Tsiutsiura, S.; Honcharenko, T.; Lyashchenko, T. Multidimensional space structure for adaptable data model. Int. J. Recent Technol. Eng. (IJRTE) 2019, 8, 7753–7758. [Google Scholar] [CrossRef] [Scilit]
- Kubba, S. Handbook of Green Building Design and Construction, 2nd ed.; Butterworth-Heinemann: Oxford, UK, 2016. [Google Scholar]
- Honcharenko, T.; Chupryna, Y.; Ivakhnenko, I.; Zinchenco, M.; Tsyfra, T. Reengineering of the construction companies based on BIM-technology. Int. J. Emerg. Trends Eng. Res. 2020, 8, 4166–4172. [Google Scholar] [CrossRef] [Scilit]
- Biancardo, S.A.; Viscione, N.; Cerbone, A.; Dessì, E. BIM-based design for road ınfrastructure: A critical focus on modeling guardrails and retaining walls. Infrastructures 2020, 5, 59. [Google Scholar] [CrossRef] [Scilit]
- Sacks, R.; Eastman, C.; Lee, G.; Teicholz, P. BIM Handbook: A Guide to Building Information Modeling for Owners, Designers, Engineers, Contractors, and Facility Managers, 3rd ed.; John Wiley & Sons: Hoboken, NJ, USA, 2018; p. 688. [Google Scholar]
- Mihaylenko, V.; Honcharenko, T.; Chupryna, K.; Andrashko, Y.; Budnik, S. Modeling of spatial data on the construction site based on multidimensional ınformation objects. Int. J. Eng. Adv. Technol. 2019, 8, 3934–3940. [Google Scholar] [CrossRef] [Scilit]
- Waqar, A.; Othman, I.; Hayat, S.; Radu, D.; Khan, M.B.; Galatanu, T.F.; Almujibah, H.R.; Hadzima-Nyarko, M.; Benjeddou, O. Building Information Modeling-Empowering Construction Projects with End-to-End Life Cycle Management. Buildings 2023, 13, 2041. [Google Scholar] [CrossRef] [Scilit]
- Eleftheriadis, S.; Mumovic, D.; Greening, P. Life cycle energy efficiency in building structures: A review of current developments and future outlooks based on BIM capabilities. Renew. Sustain. Energy Rev. 2017, 67, 811–825. [Google Scholar] [CrossRef] [Scilit]
- Zichen, M.; Riazi, S.R.M. The Application Barriers and Development Prospects of Building Information Technology (BIM) in China’s Construction Industry. Int. J. Acad. Res. Account. Financ. Manag. Sci. 2024, 14, 496–504. [Google Scholar] [CrossRef] [Scilit]
- Xu, J.; Teng, Y.; Pan, W.; Zhang, Y. BIM-integrated LCA to automate embodied carbon assessment of prefabricated buildings. J. Clean. Prod. 2022, 374, 133894. [Google Scholar] [CrossRef] [Scilit]
- Available online: https://www.energy.gov/eere/buildings/about-building-energy-modeling (accessed on 2 September 2025).
- Yari, M.; Kalbasi, R.; Thi, N.H.; Afrand, M. Incorporating PCMs and thermal insulation into building walls and their competition in building energy consumption reduction. Case Stud. Therm. Eng. 2024, 63, 105398. [Google Scholar] [CrossRef] [Scilit]
- Gourlis, G.; Kovacic, I. building ınformation modelling for analysis of energy efficient industrial buildings—A case study. Renew. Sustain. Energy Rev. 2017, 68, 953–963. [Google Scholar] [CrossRef] [Scilit]
- Reychav, I.; Maskil Leitan, R.; McHaney, R. Sociocultural sustainability in green building information modeling. Clean Technol. Environ. Policy 2017, 19, 2245–2254. [Google Scholar] [CrossRef] [Scilit]
- Ghaffarianhoseini, A.; Tookey, J.; Ghaffarianhoseini, A.; Naismith, N.; Azhar, S.; Efimova, O.; Raahemifar, K. Building Information Modelling (BIM) uptake: Clear benefits, understanding its implementation, risks and challenges. Renew. Sustain. Energy Rev. 2017, 75, 1046–1053. [Google Scholar] [CrossRef] [Scilit]
- Emmanuel, I.; Danquah, E.O.; Ukpoju, E.A.; Obasa, J.; Olola, T.M.; Enyejo, J.O. Use of Building Information Modeling (BIM) to Improve Construction Management in the USA. World J. Adv. Res. Rev. 2024, 23, 1799–1813. [Google Scholar] [CrossRef] [Scilit]
- Alwan, Z.; Greenwood, D.; Gledson, B. Rapid LEED evaluation performed with BIM based sustainability analysis on a virtual construction Project. Constr. Innov. 2015, 15, 134–150. [Google Scholar] [CrossRef] [Scilit]
- Bonenberg, W.; Wei, X. Green BIM in Sustainable Infrastructure. Procedia Manuf. 2015, 3, 1654–1659. [Google Scholar] [CrossRef] [Scilit]
- Liu, S.; Meng, X.; Tam, C. Building information modeling based building design optimization for sustainability. Energy Build. 2015, 105, 139–153. [Google Scholar] [CrossRef] [Scilit]
- Jalaei, F.; Jrade, A. Integrating Building Information Modeling (BIM) and energy analysis tools with green building certification system to conceptually design sustainable buildings. J. Inf. Technol. Constr. 2014, 19, 494–519. [Google Scholar]
- Wong, K.; Fan, Q. Building information modelling (BIM) for sustainable building design. Facilities 2013, 31, 138–157. [Google Scholar] [CrossRef] [Scilit]
- Ozarisoy, B.; Altan, H. Low-energy design strategies for retrofitting existing residential buildings in Cyprus. Proc. Inst. Civ. Eng.-Eng. Sustain. 2019, 172, 241–255. [Google Scholar]
- Edwards, R.; Lou, E.; Bataw, A.; Kamaruzzaman, S.; Johnson, C. Sustainability-led design: Feasibility of ıncorporating whole-life cycle energy assessment into bım for refurbishment projects. J. Build. Eng. 2019, 24, 100697. [Google Scholar] [CrossRef] [Scilit]
- Chen, P.; Nguyen, T. A BIM-WMS ıntegrated decision support tool for supply chain management in construction. Autom. Constr. 2019, 98, 289–301. [Google Scholar] [CrossRef] [Scilit]
- Sun, H.; Park, Y. CO2 Emission Calculation Method during Construction Process for Developing BIM-Based Performance Evaluation System. Appl. Sci. 2020, 10, 5587. [Google Scholar] [CrossRef] [Scilit]
- Piselli, C.; Romanelli, J.; Di Grazia, M.; Gavagni, A.; Moretti, E.; Nicolini, A.; Cotana, F.; Strangis, F.; Witte, H.; Pisello, A. An ıntegrated HBIM simulation approach for energy retrofit of historical buildings ımplemented in a case study of a medieval fortress in Italy. Energies 2020, 13, 2601. [Google Scholar] [CrossRef] [Scilit]
- Guo, K.; Li, Q.; Zhang, L.; Wu, X. BIM-based green building evaluation and optimization: A case study. J. Clean. Prod. 2021, 320, 128824. [Google Scholar] [CrossRef] [Scilit]
- Wong, J.K.W.; Zhou, J. Enhancing environmental sustainability over building life cycles through green BIM: A review. Autom. Constr. 2015, 57, 156–165. [Google Scholar] [CrossRef] [Scilit]
- Lee, S.; Tae, S.; Roh, S.; Kim, T. Green template for life cycle assessment of buildings based on building information modeling: Focus on embodied environmental impact. Sustainability 2015, 7, 16498–16512. [Google Scholar] [CrossRef] [Scilit]
- Abanda, F.; Byers, L. An ınvestigation of the ımpact of building orientation on energy consumption in a domestic building using emerging BIM (Building Information Modelling). Energy 2016, 97, 517–527. [Google Scholar] [CrossRef] [Scilit]
- Available online: https://www.mgm.gov.tr/VERIDEGERLENDIRME/gun-derece.aspx?g=aylik&m=06-00&y=2017&a=01 (accessed on 17 November 2025).
- Available online: https://weatherspark.com/y/102775/Average-Weather-in-Van-Turkey-Year-Round (accessed on 17 November 2025).
- TSE 825; Thermal Insulation Rules Standard Regulation in Buildings. Turkish Standards Institute: Ankara, Turkey, 2015.
- EN 15978:2011; Sustainability of Construction Works—Assessment of Environmental Performance of Buildings—Calculation Method. CEN: Brussels, Belgium, 2011.
- ISO/TS 14067; Greenhouse Gases—Carbon Footprint of Products—Requirements and Guidelines for Quantification and Communication (Technical Specifications). International Organization for Standardization: Geneve, Switzerland, 2013.
- Pala, O. Assessment of the social progress on European Union by logarithmic decomposition of criteria importance. Expert Syst. Appl. 2024, 238, 121846. [Google Scholar] [CrossRef] [Scilit]
- Pala, O.; Atçeken, Ö.; Omurtak, H.; Şimşir, B. BİST Çimento Sektöründe LODECI ve CRADIS ile Finansal Performans Analizi. Alanya Akad. Bakış 2024, 8, 956–970. [Google Scholar] [CrossRef] [Scilit]
- Gligorić, Z.; Görçün, Ö.F.; Gligorić, M.; Pamucar, D.; Simic, V.; Küçükönder, H. Evaluating the deep learning software tools for large-scale enterprises using a novel TODIFFA-MCDM framework. J. King Saud Univ. Comput. Inf. Sci. 2024, 36, 102079. [Google Scholar] [CrossRef] [Scilit]
- Zavadskas, E.K.; Podvezko, V. Integrated determination of objective criteria weights in MCDM. Int. J. Inf. Technol. Decis. Mak. 2016, 15, 267–283. [Google Scholar] [CrossRef] [Scilit]
- Keshavarz-Ghorabaee, M.; Amiri, M.; Zavadskas, E.K.; Antucheviciene, J. Simulation-Aided Analysis of a Deviation-Based Pairwise Assessment Ratio Technique (DEPART) for MCDM. Int. J. Comput. Commun. Control 2025, 20, 7038. [Google Scholar] [CrossRef] [Scilit]
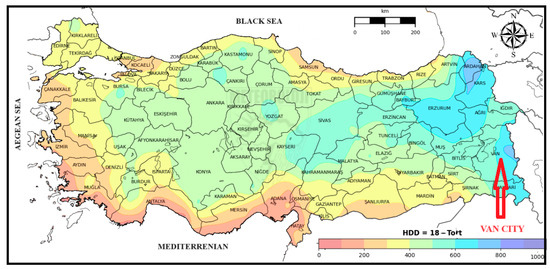
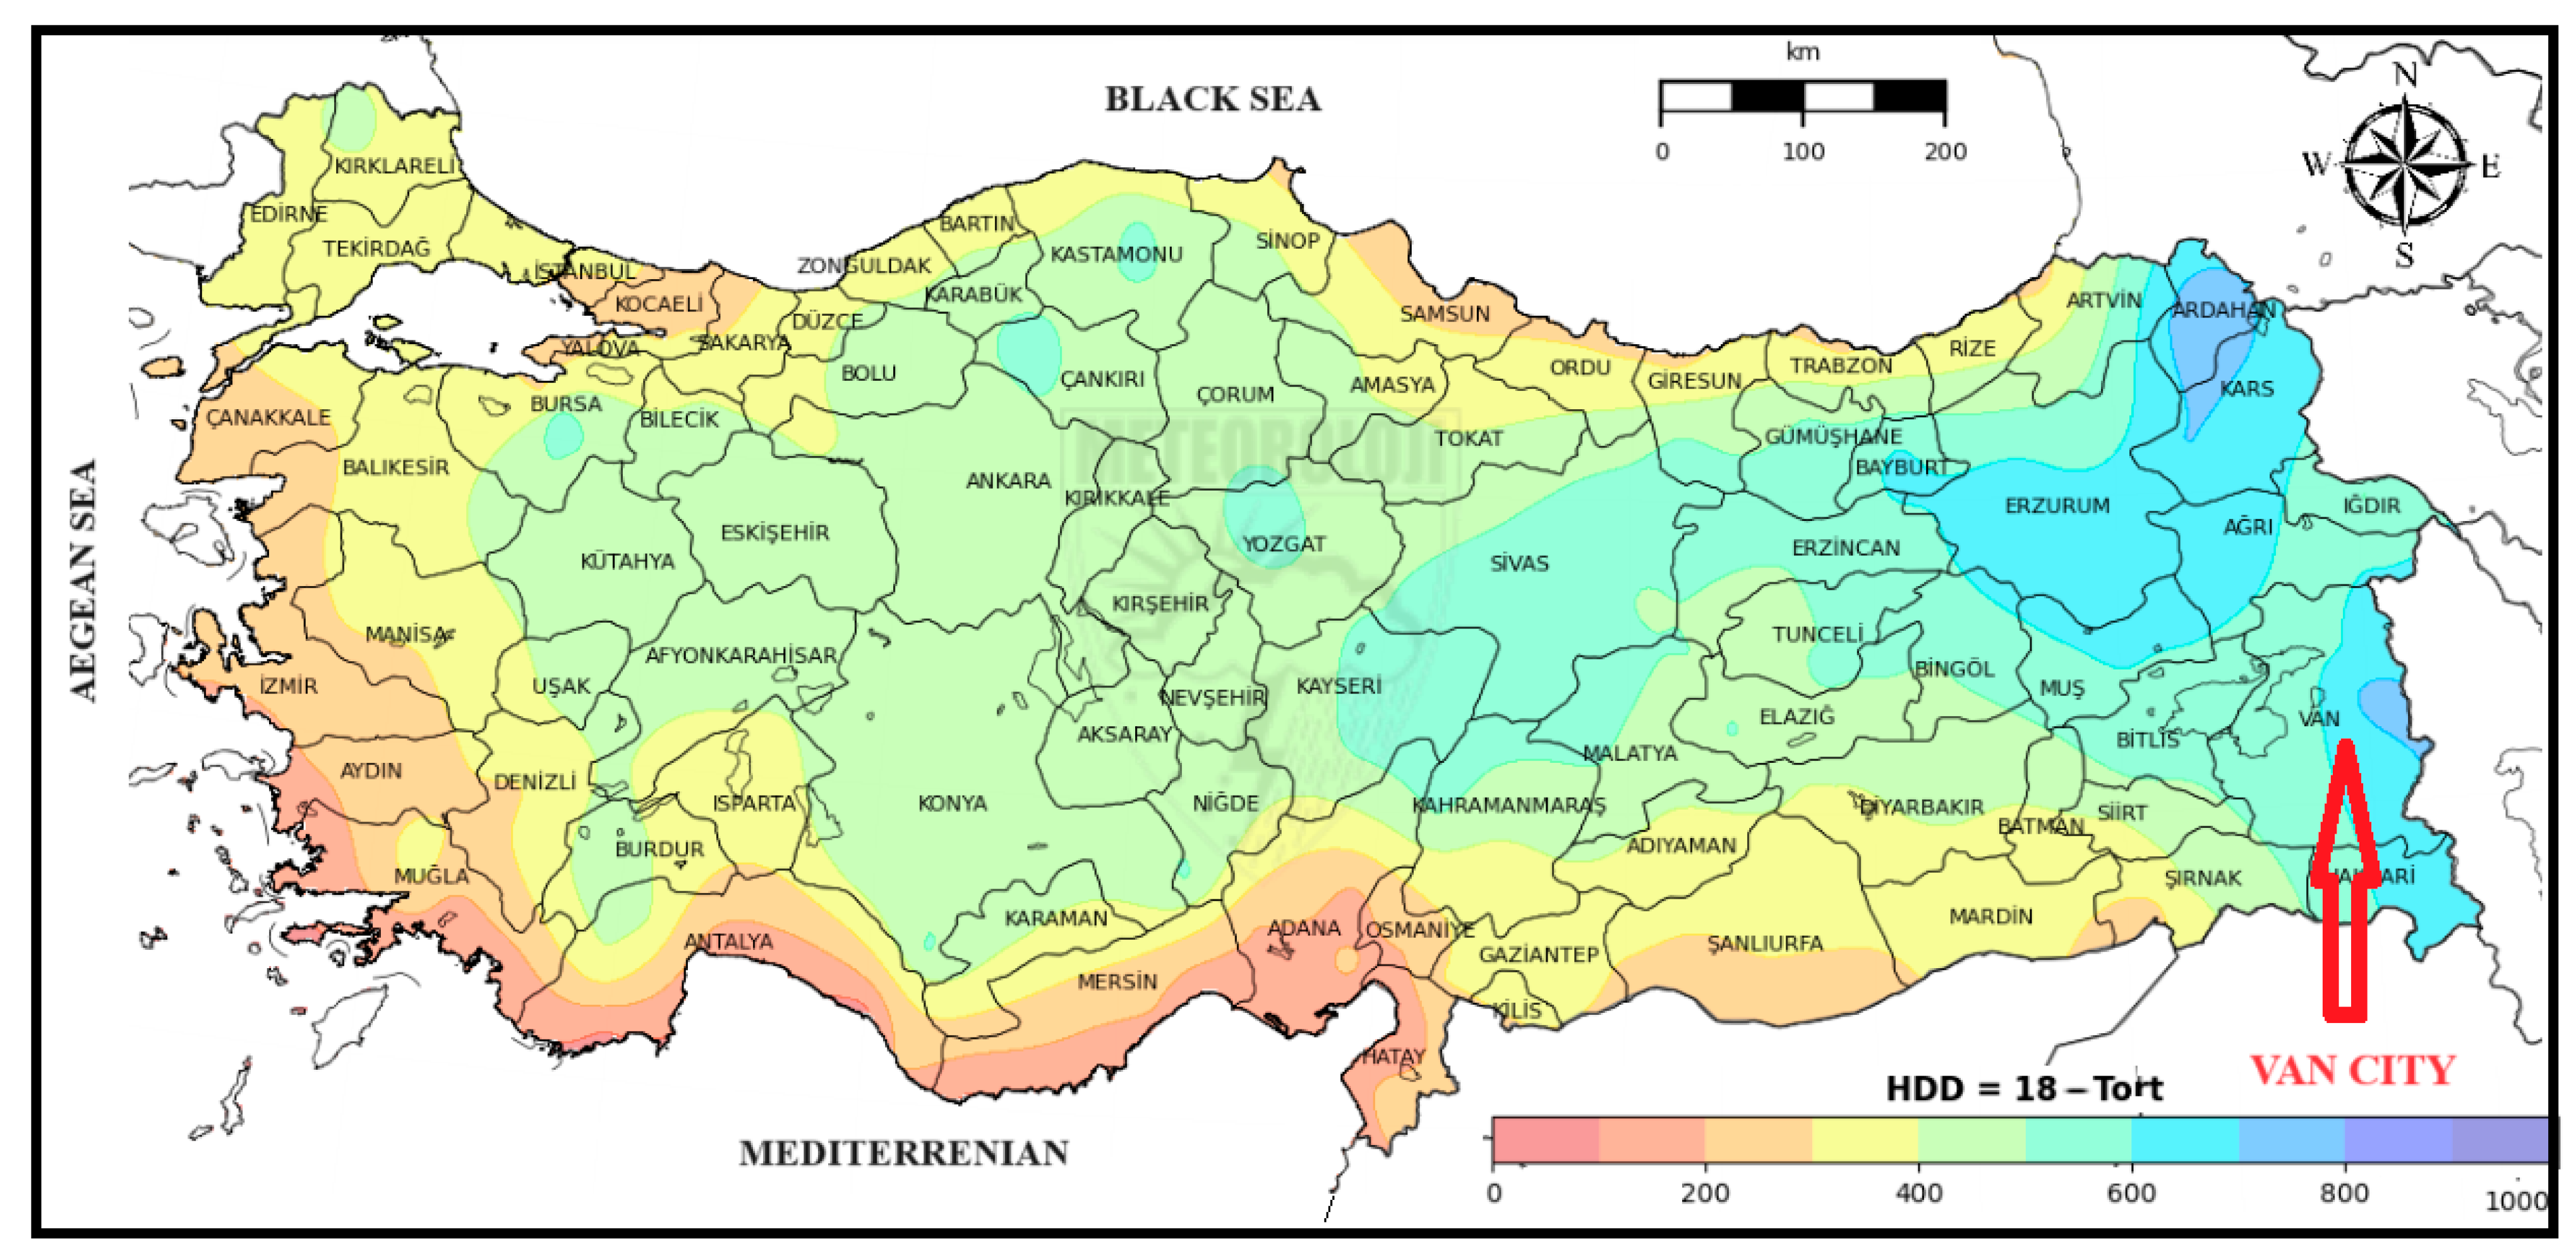
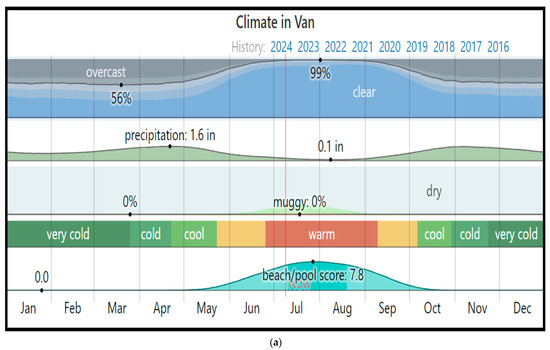
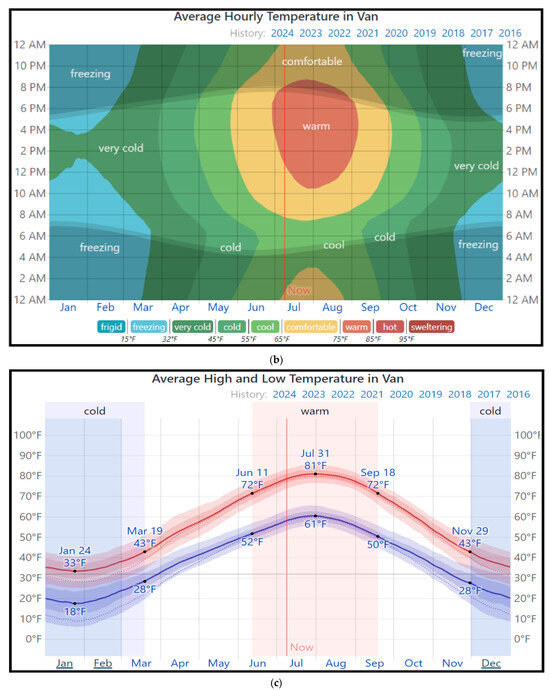
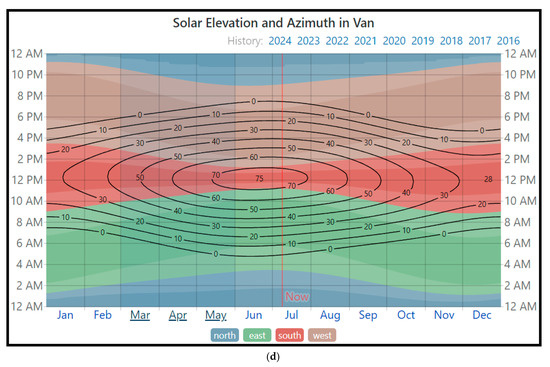
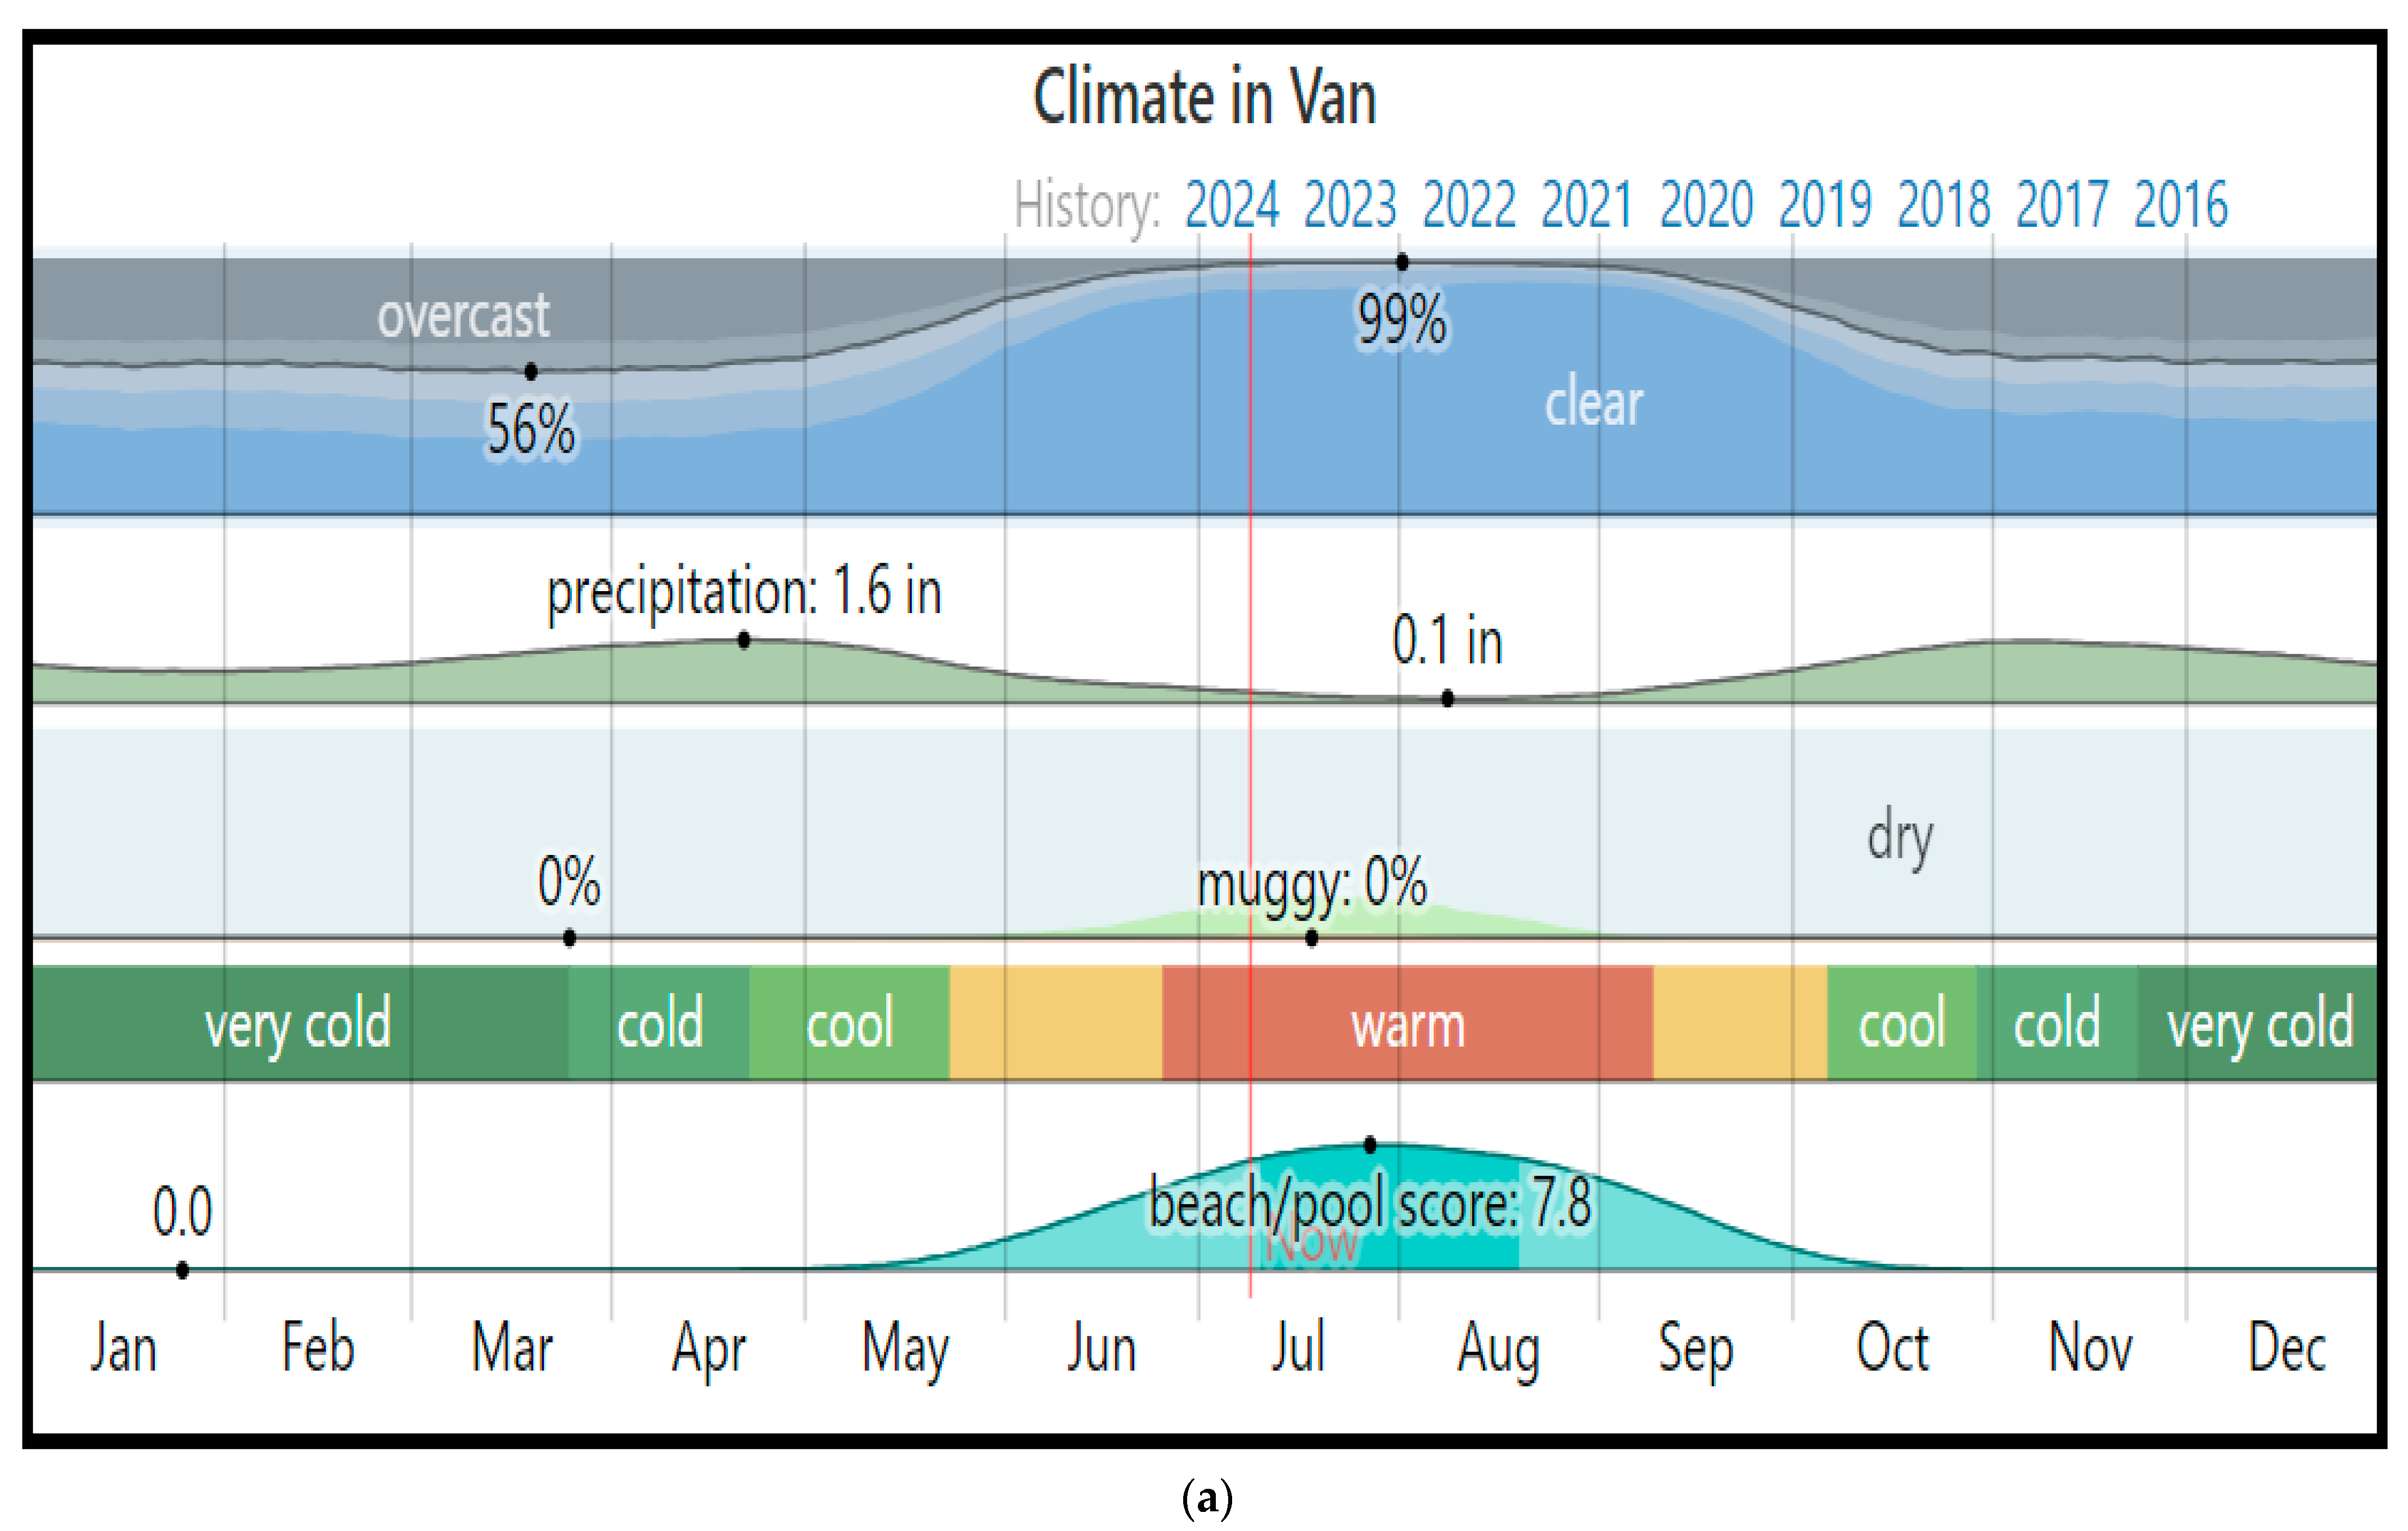
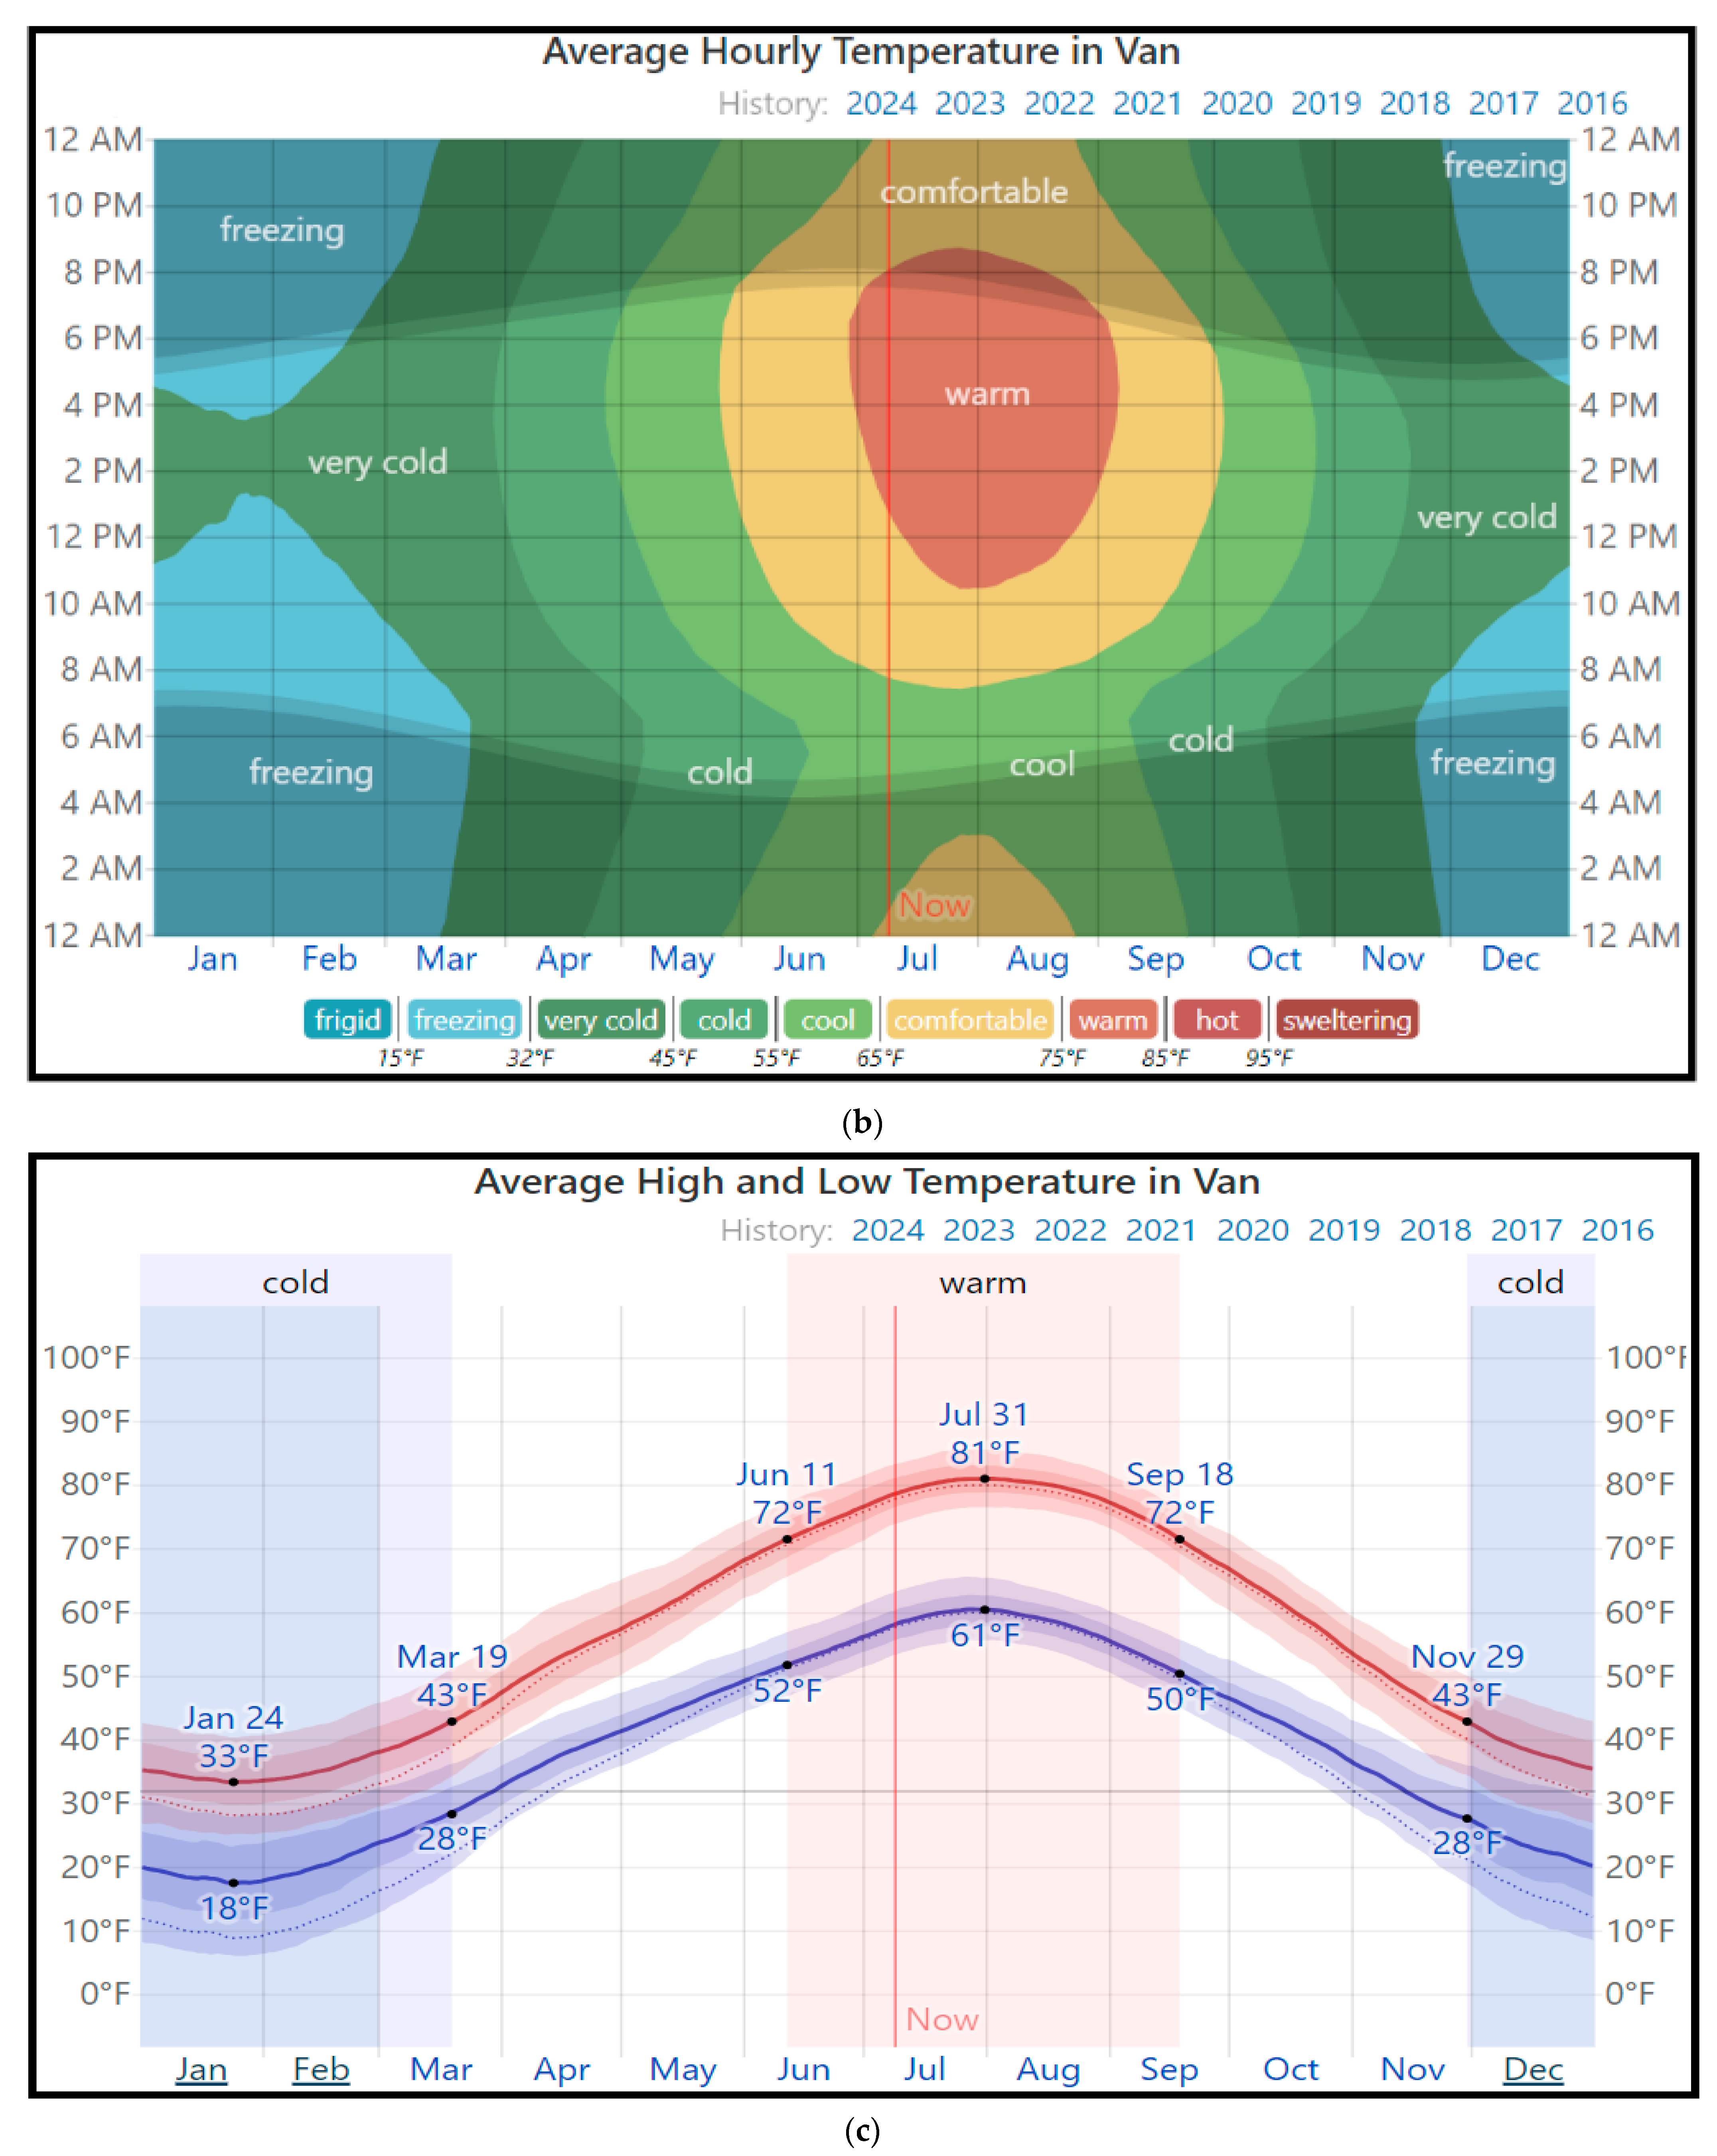
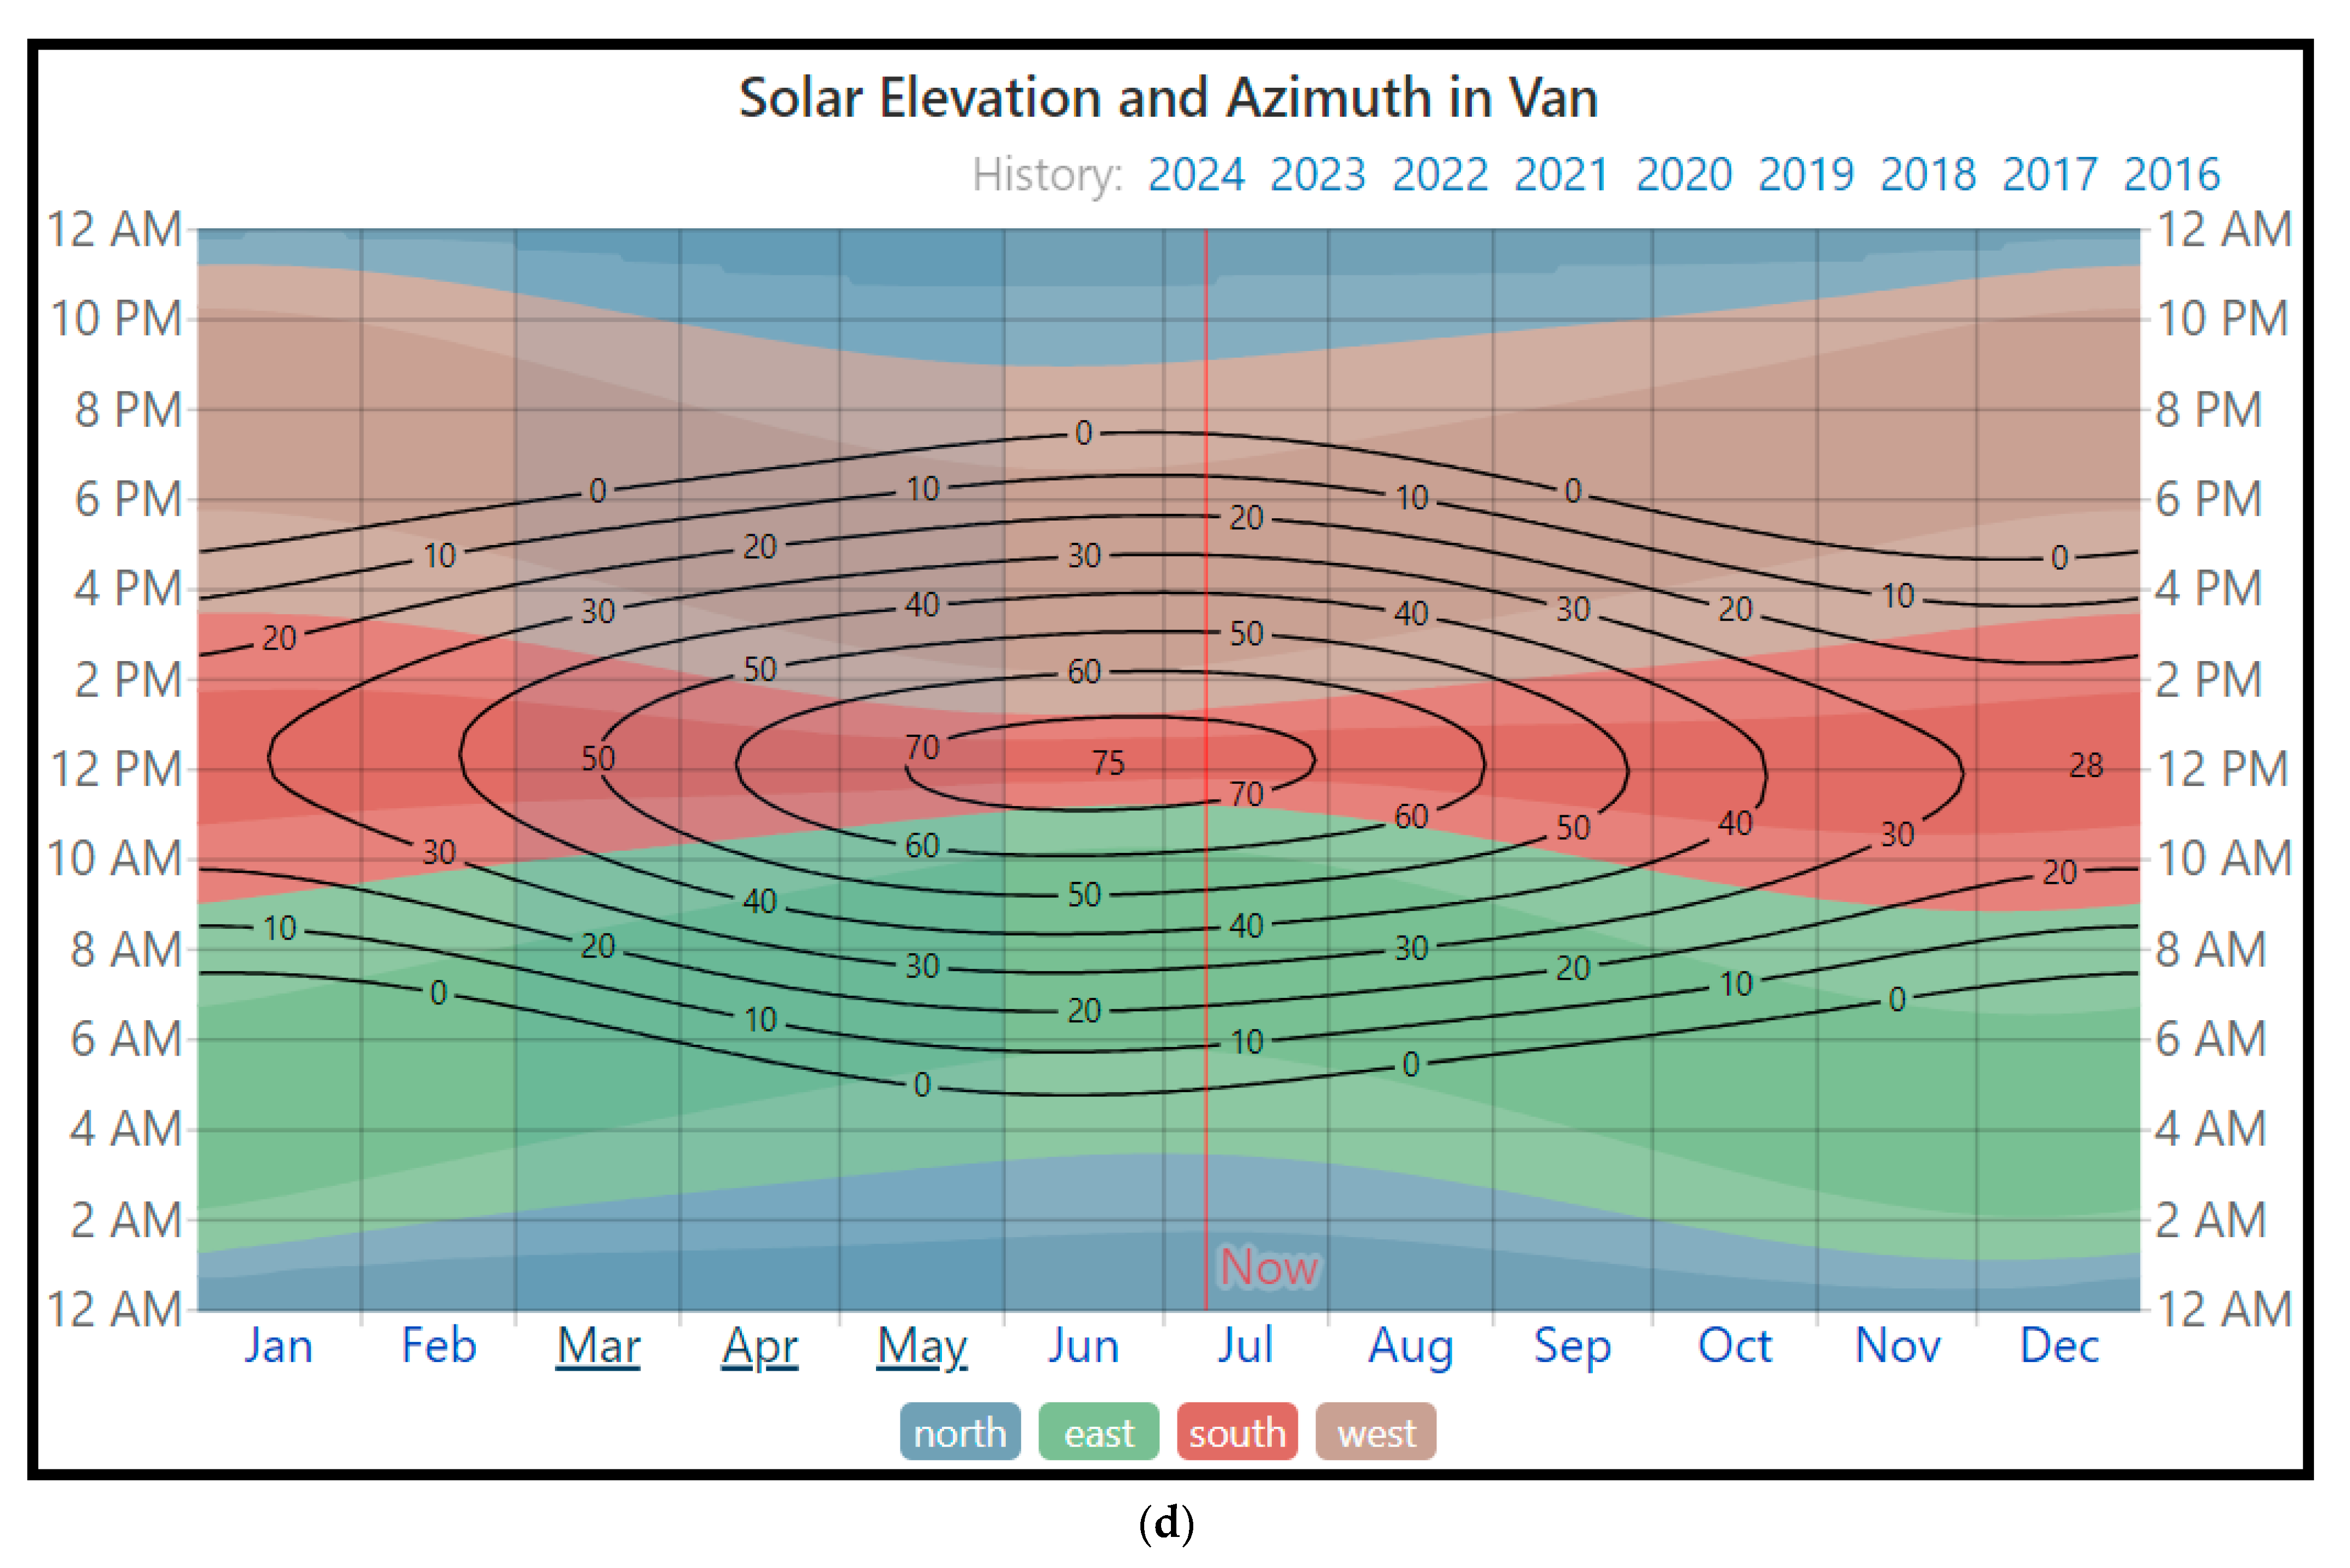
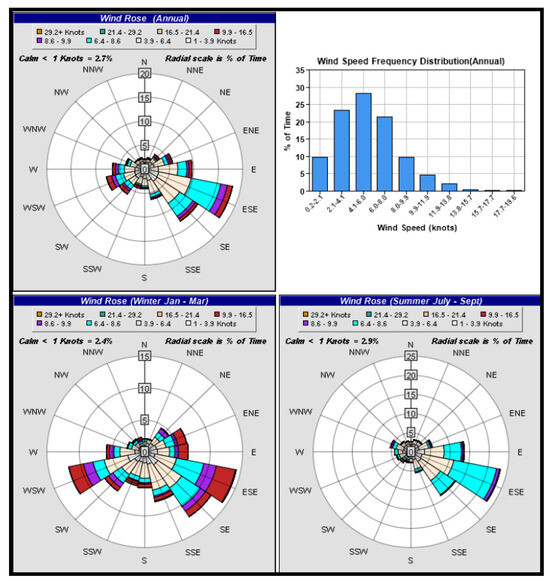
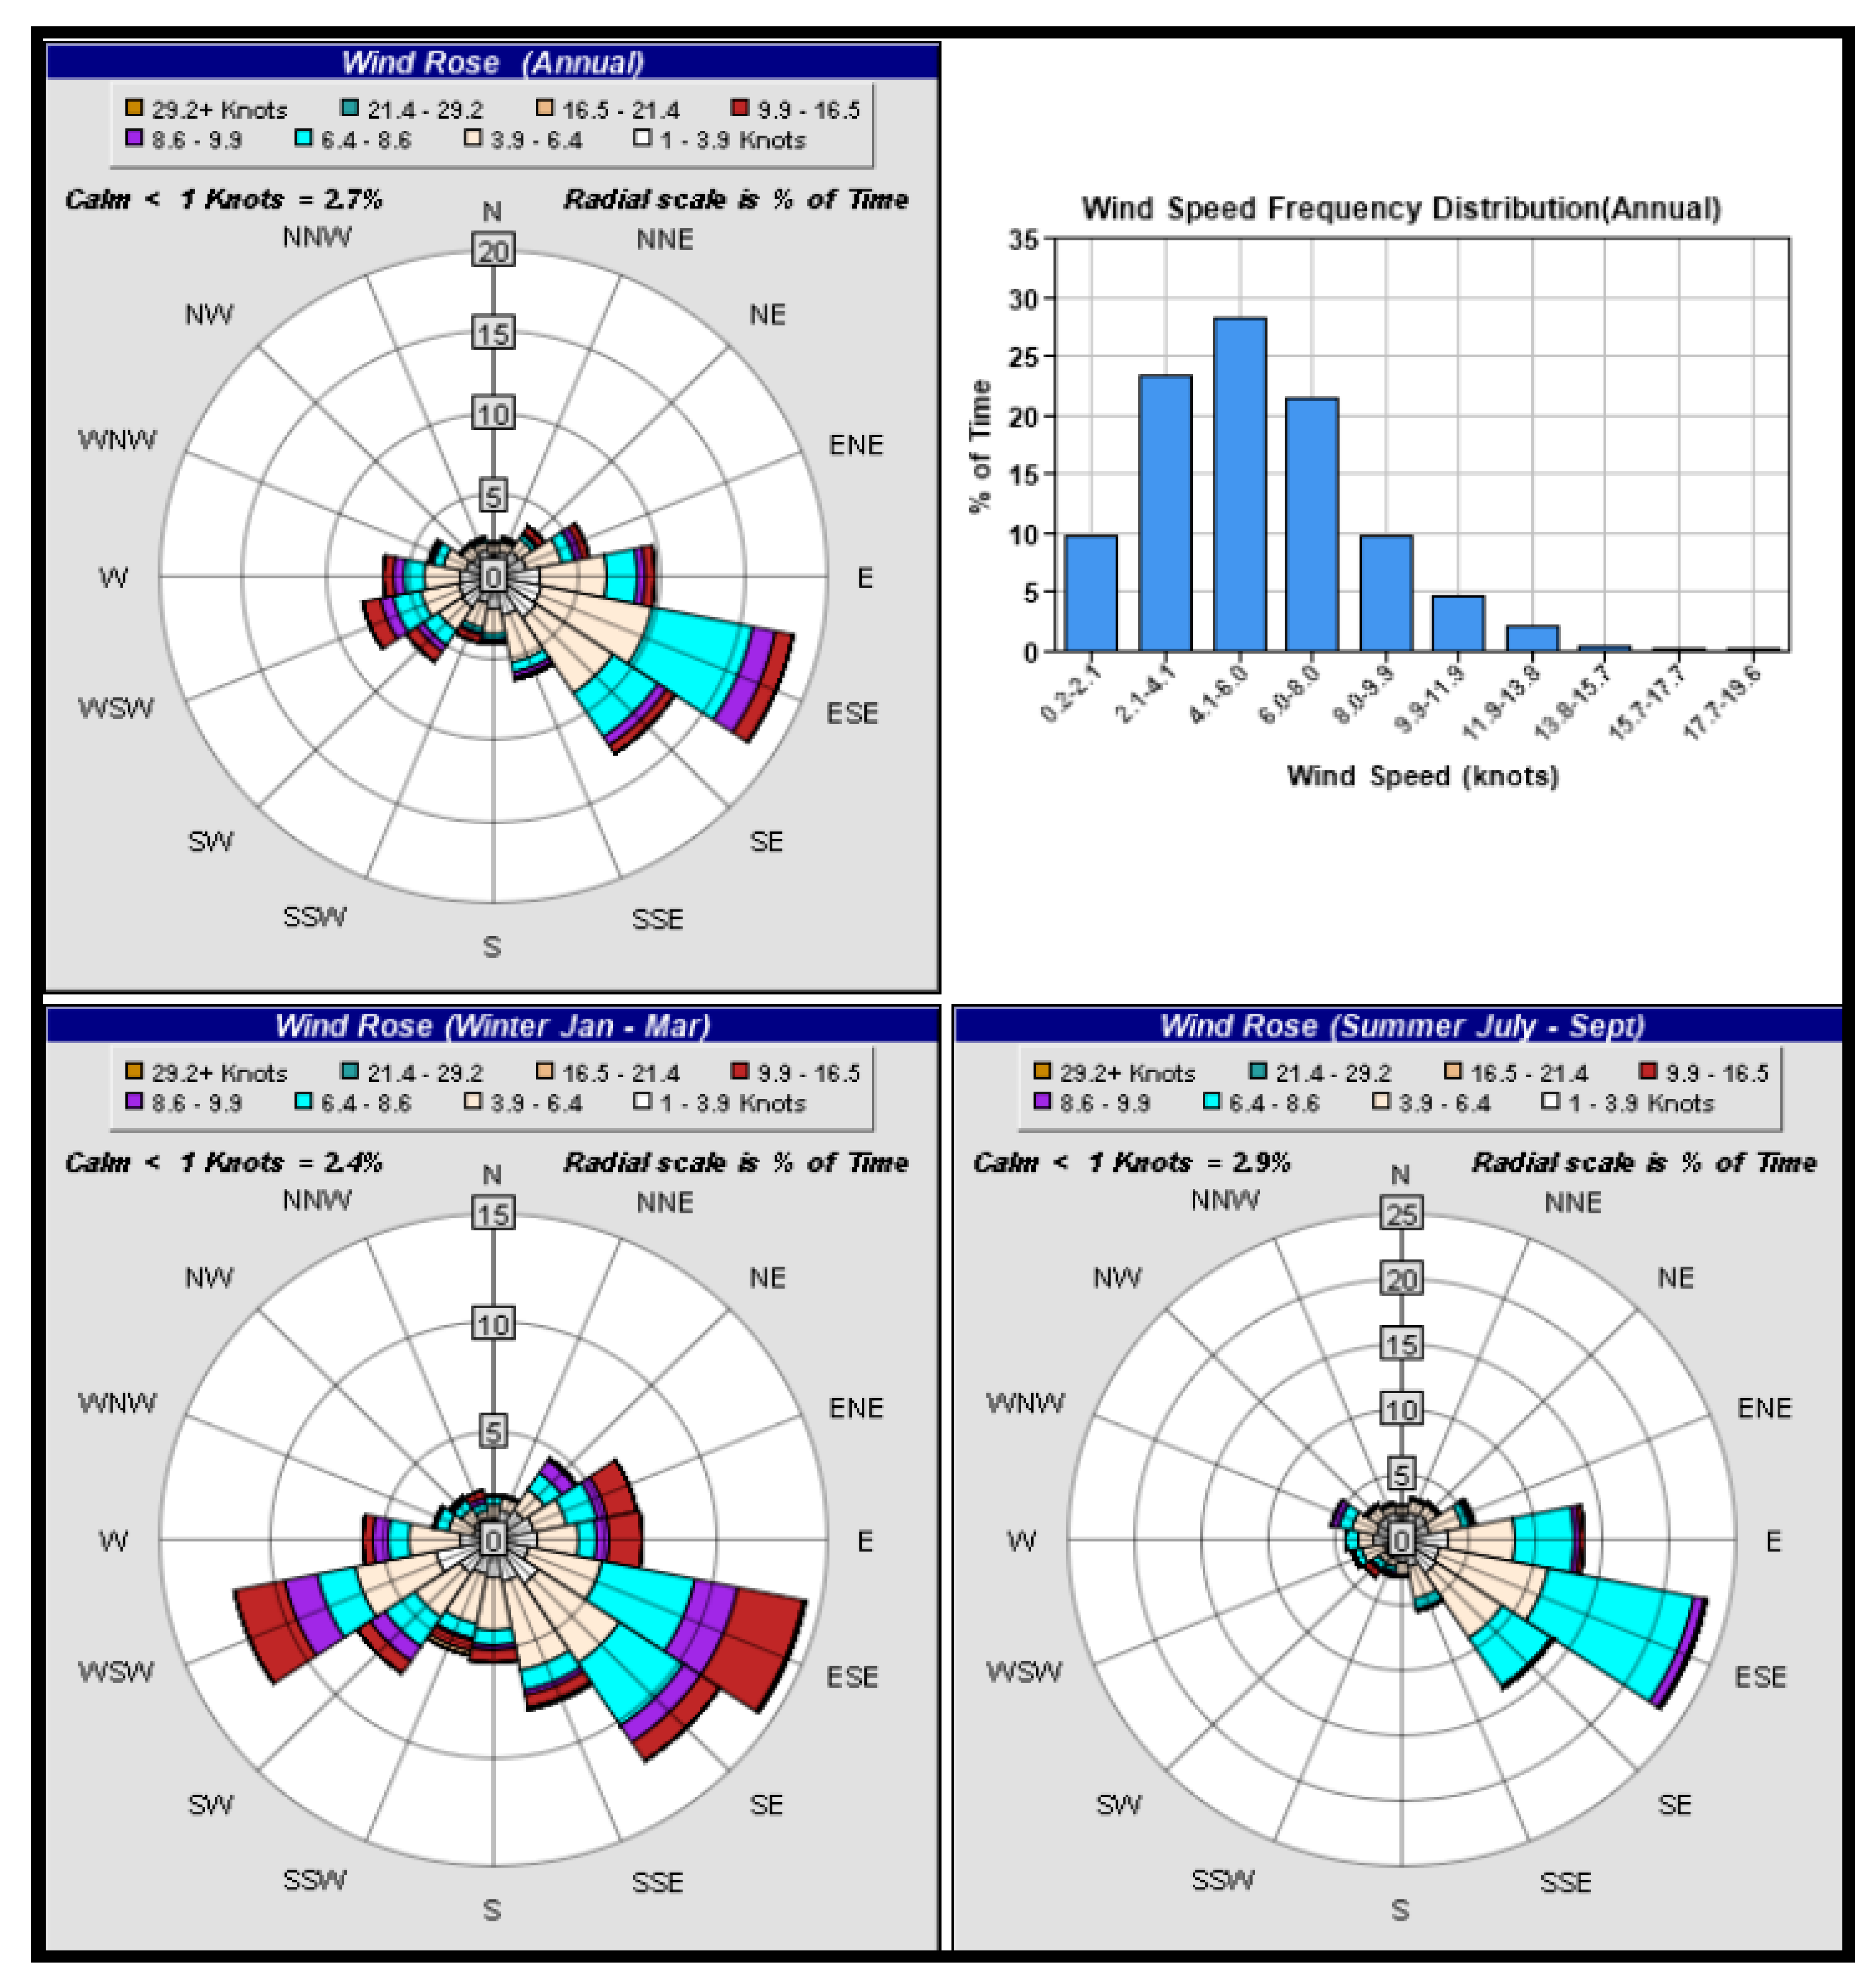
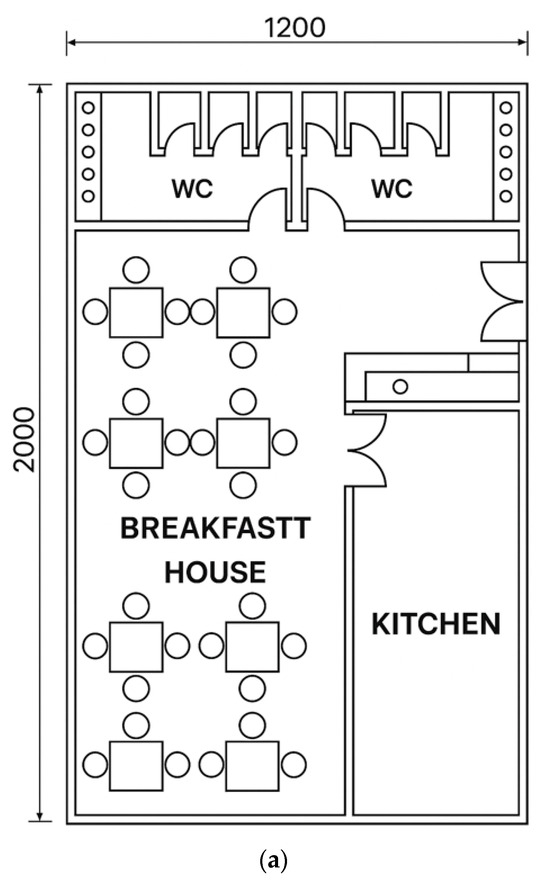
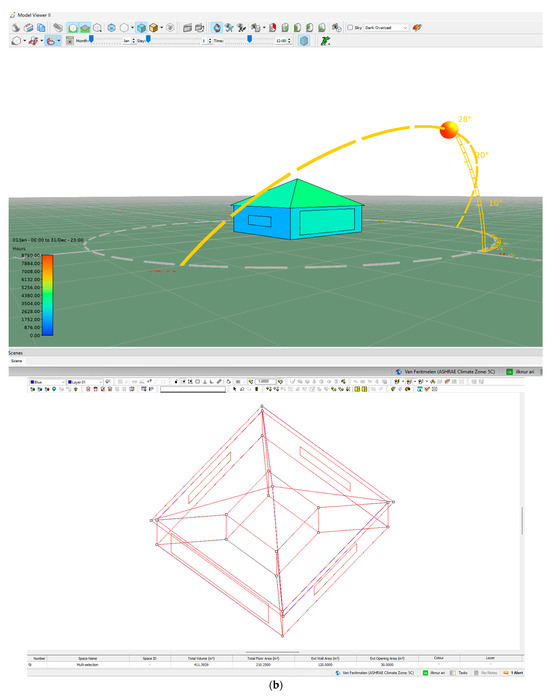
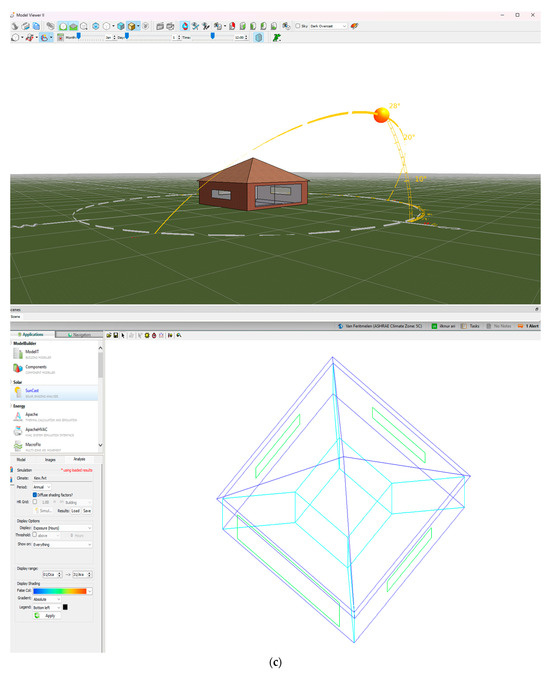
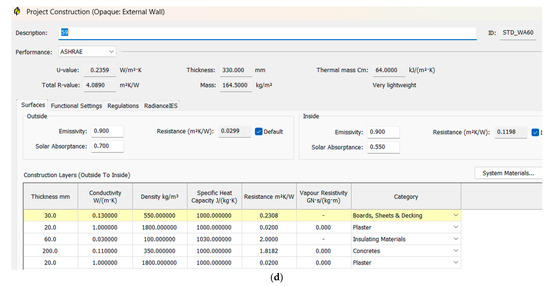
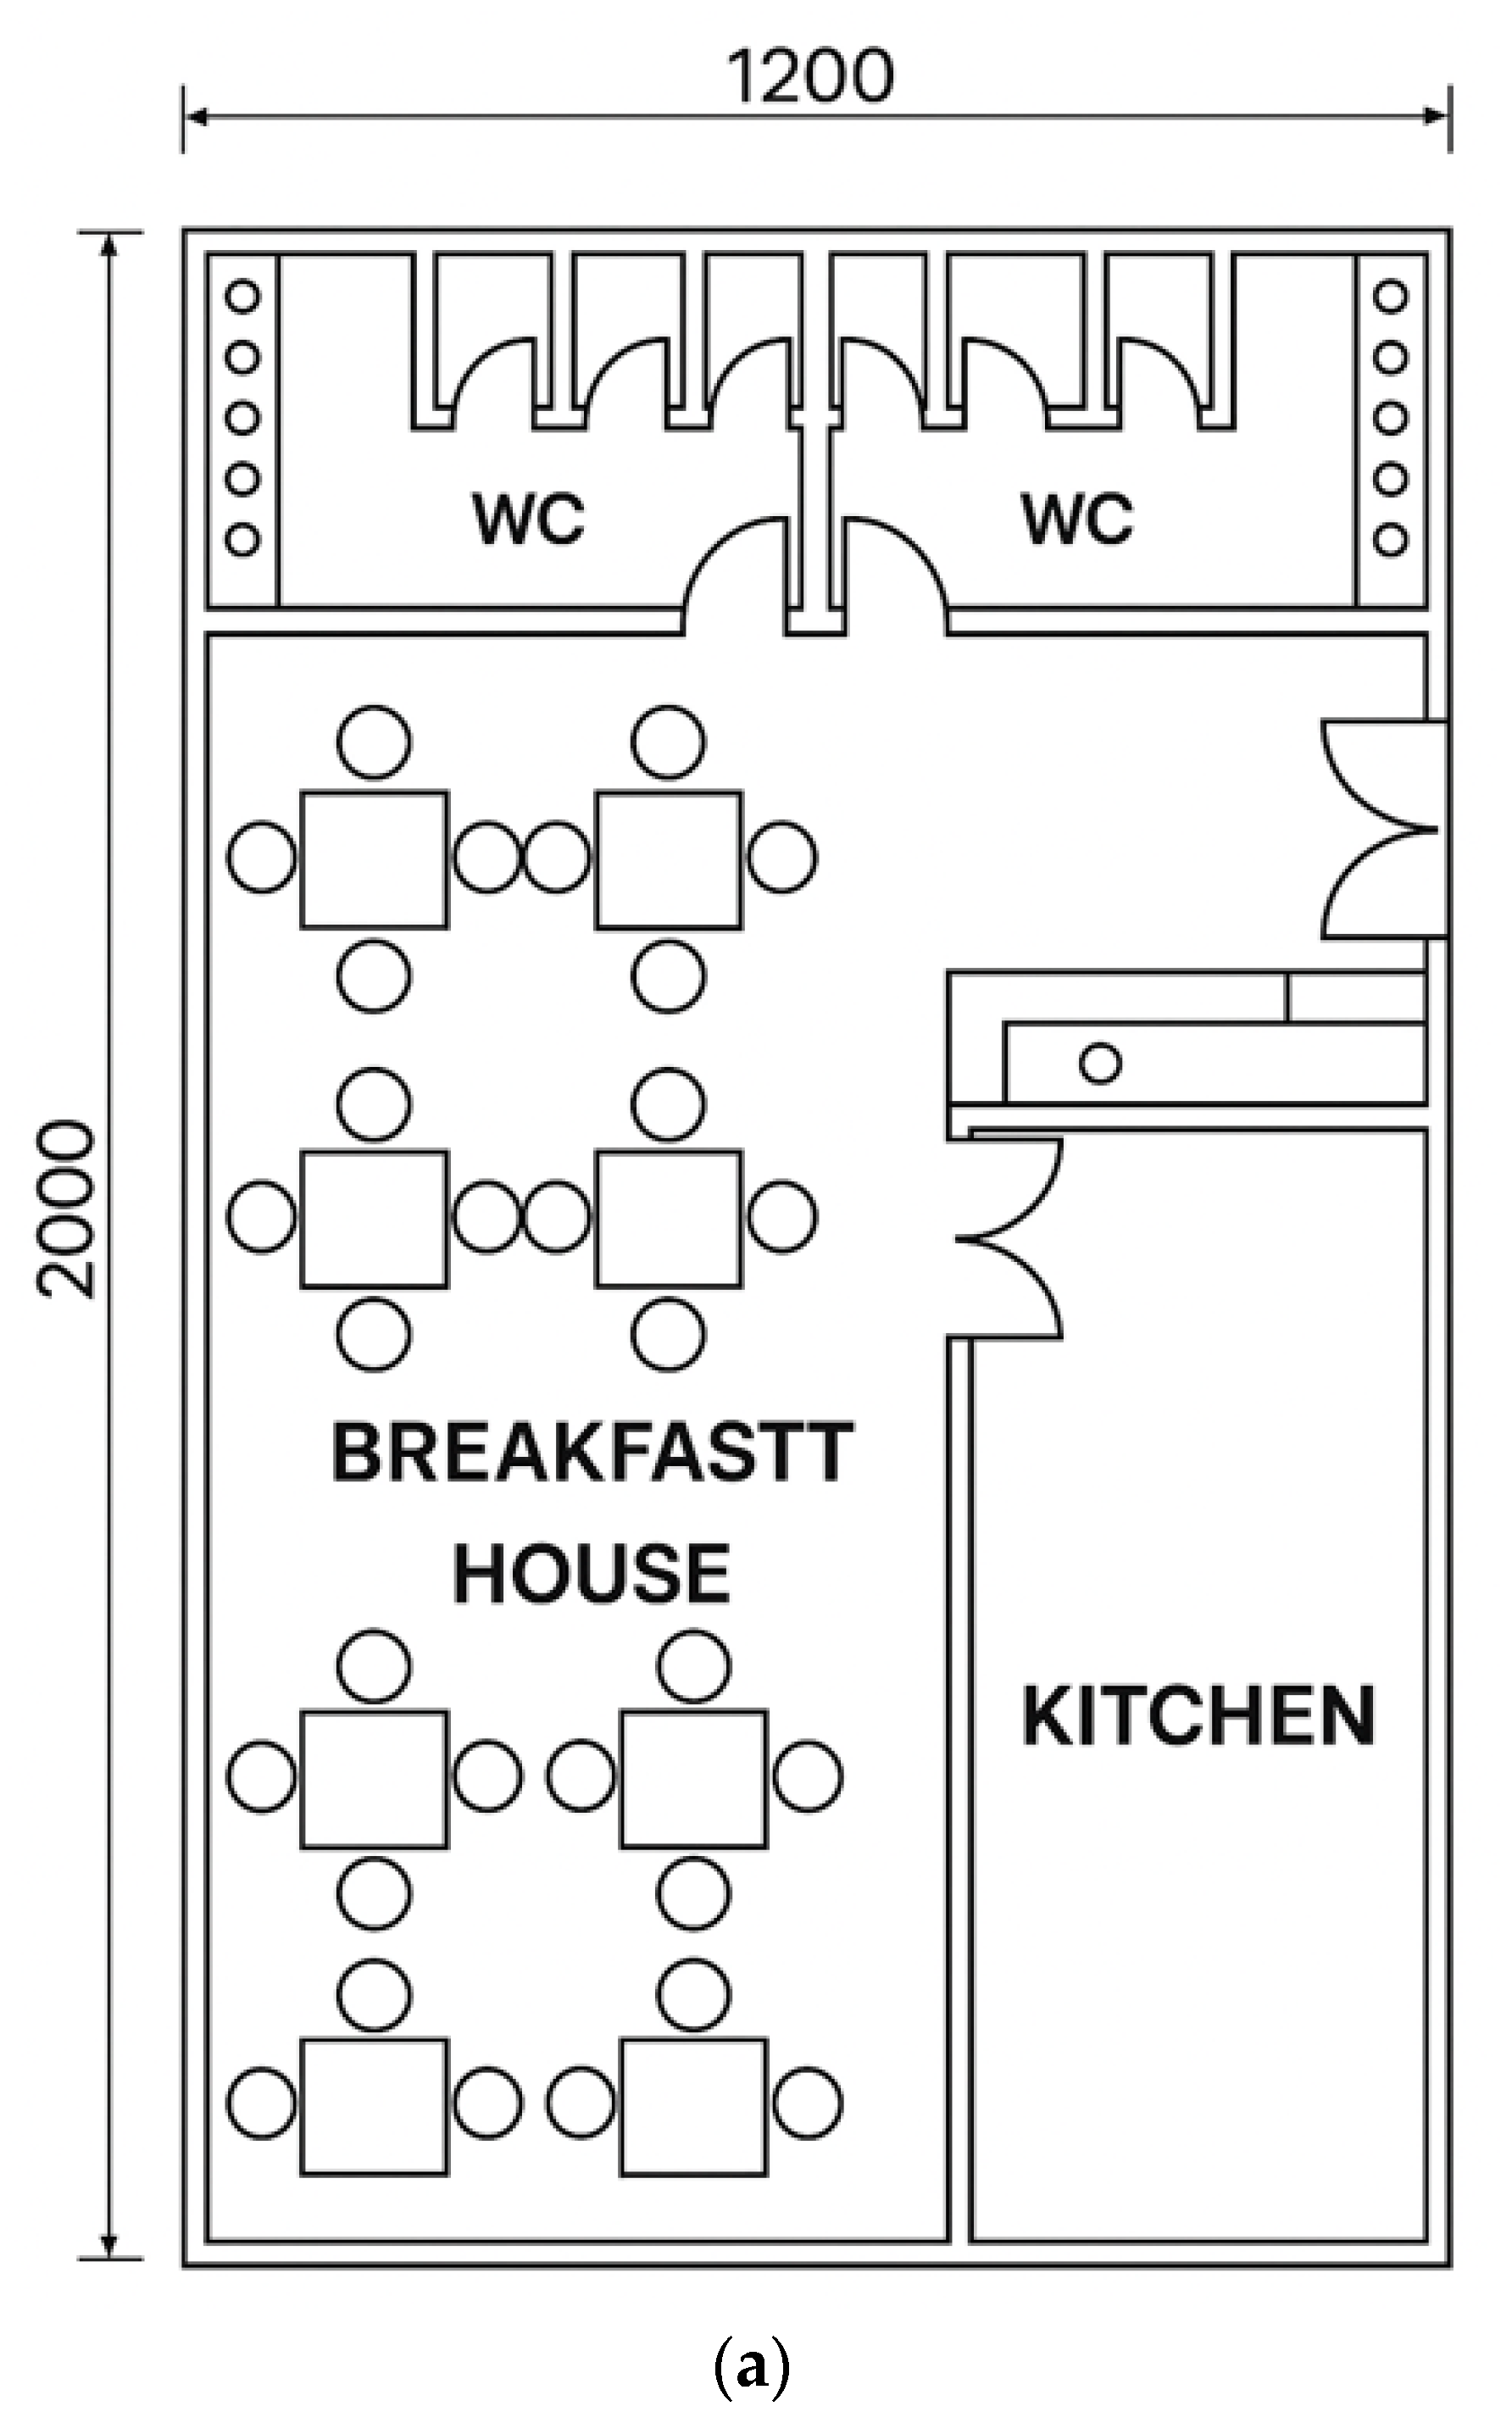
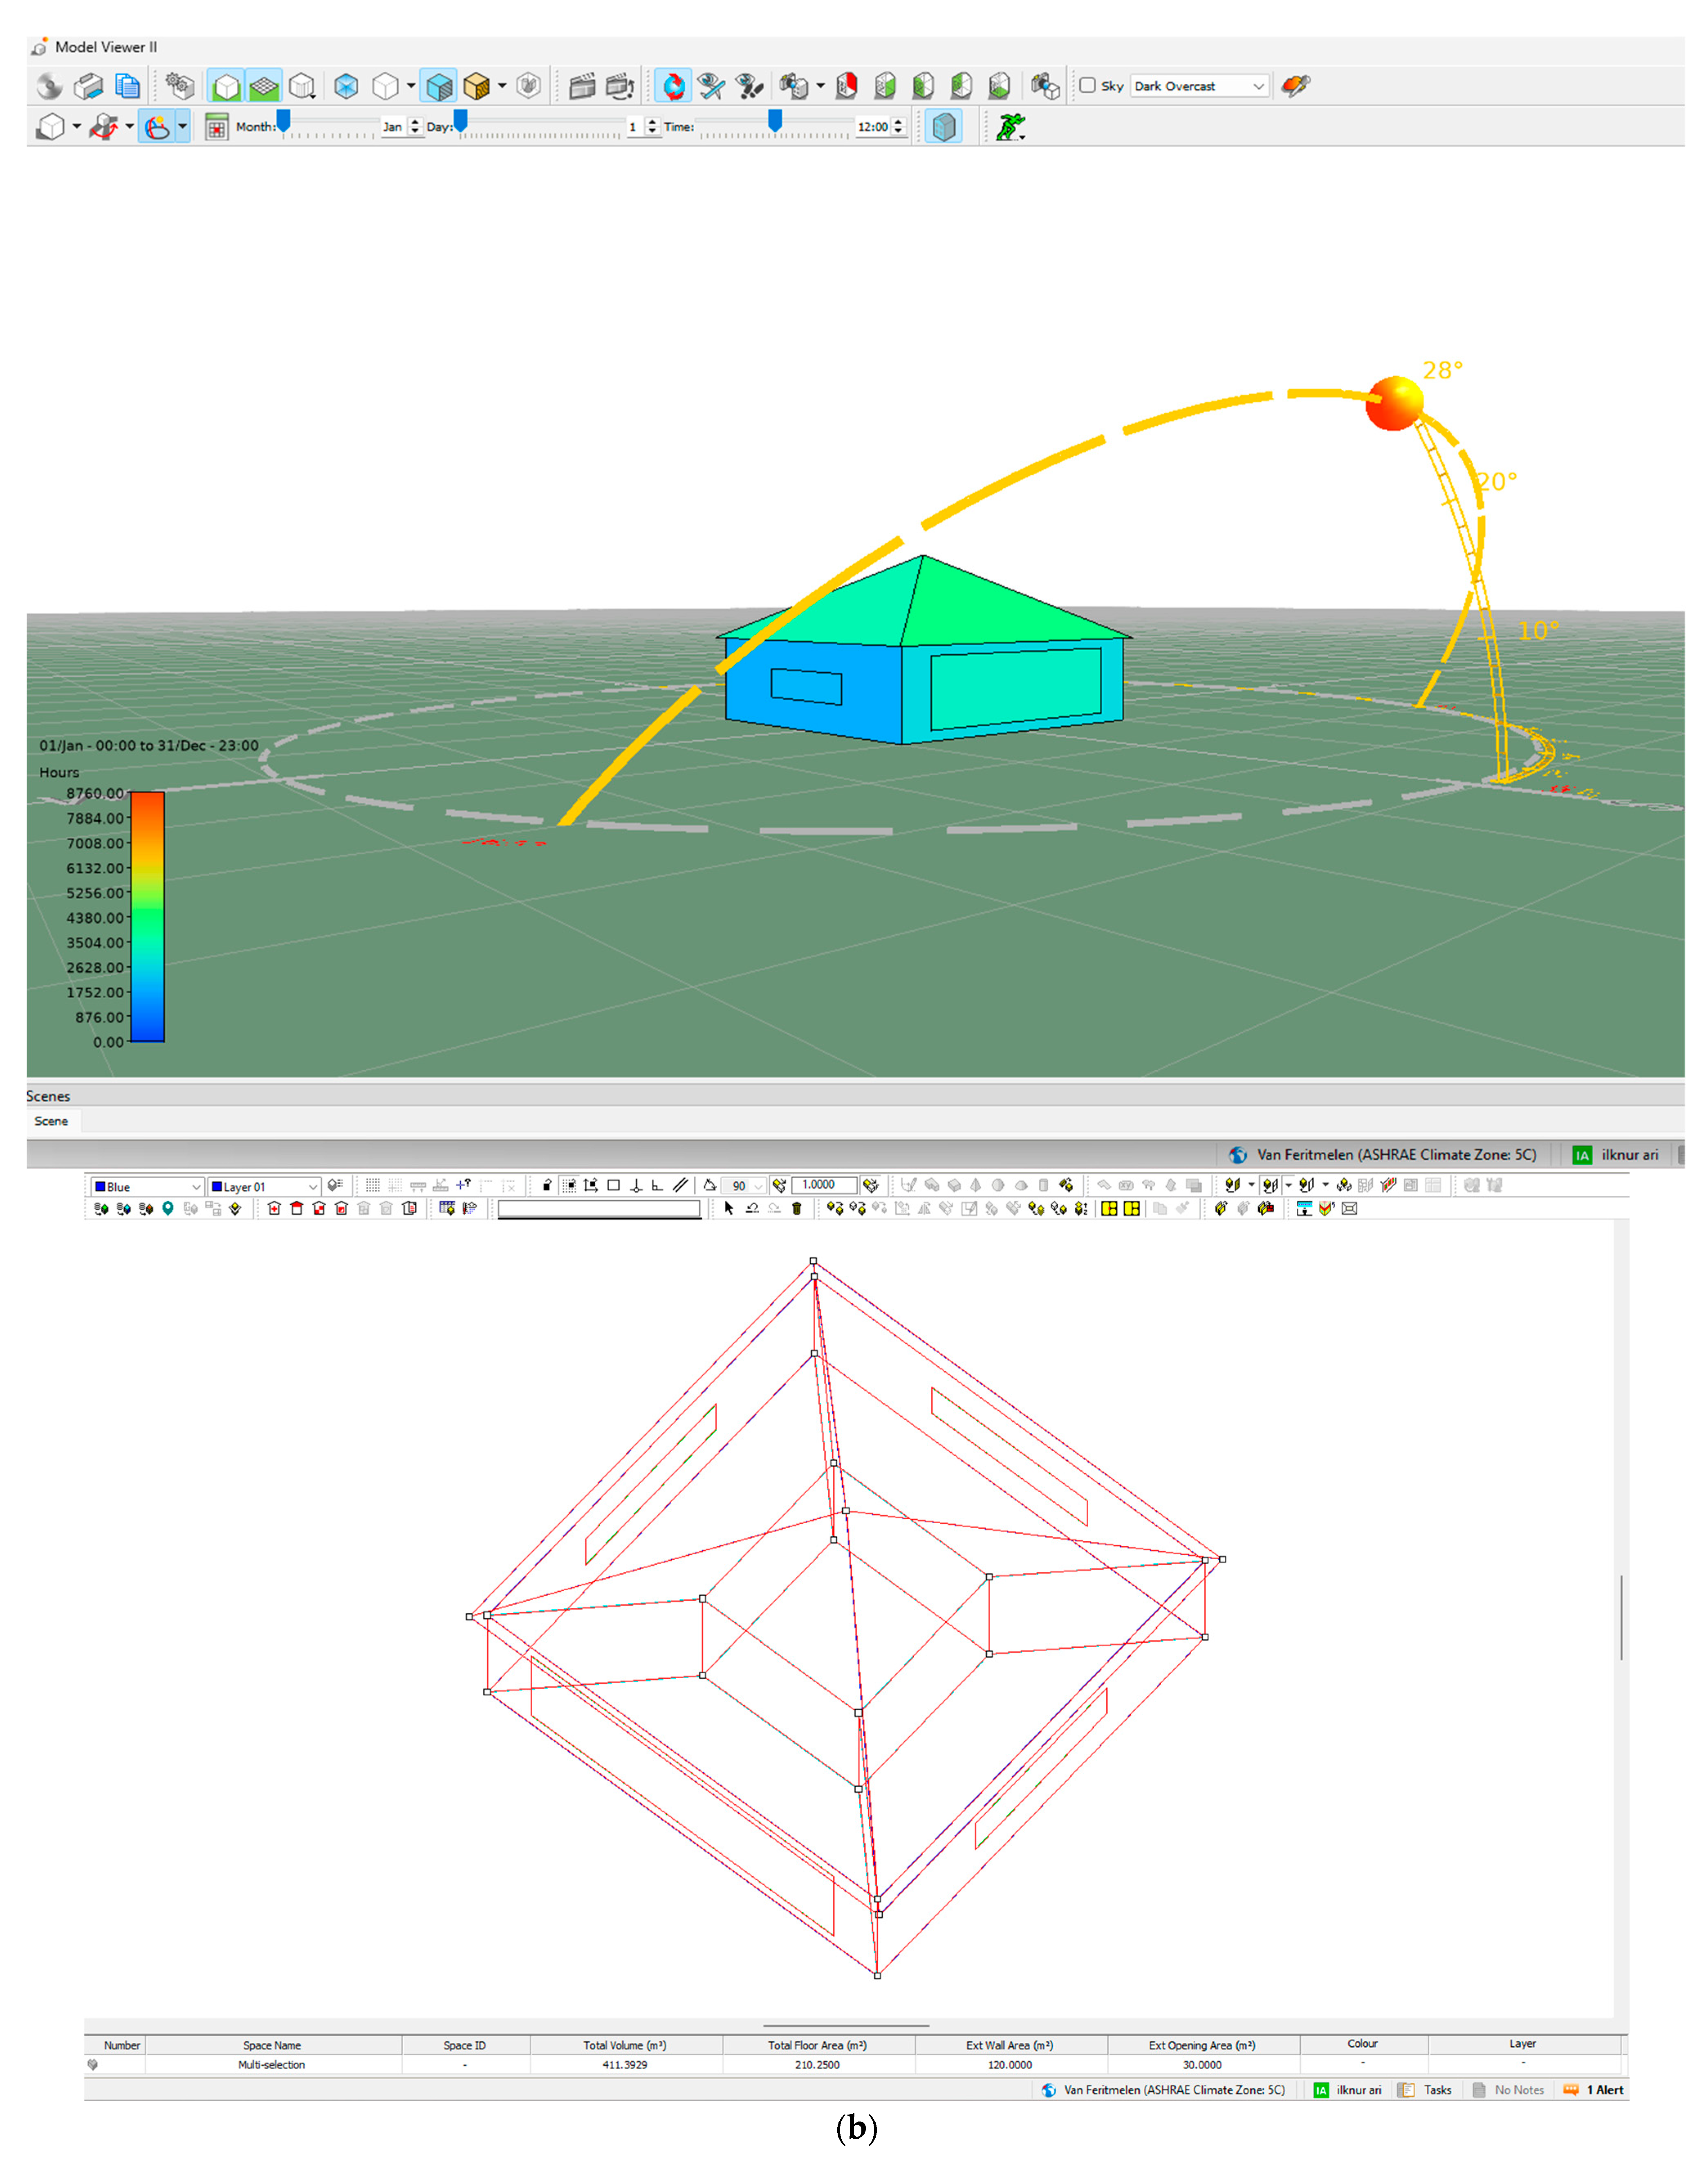
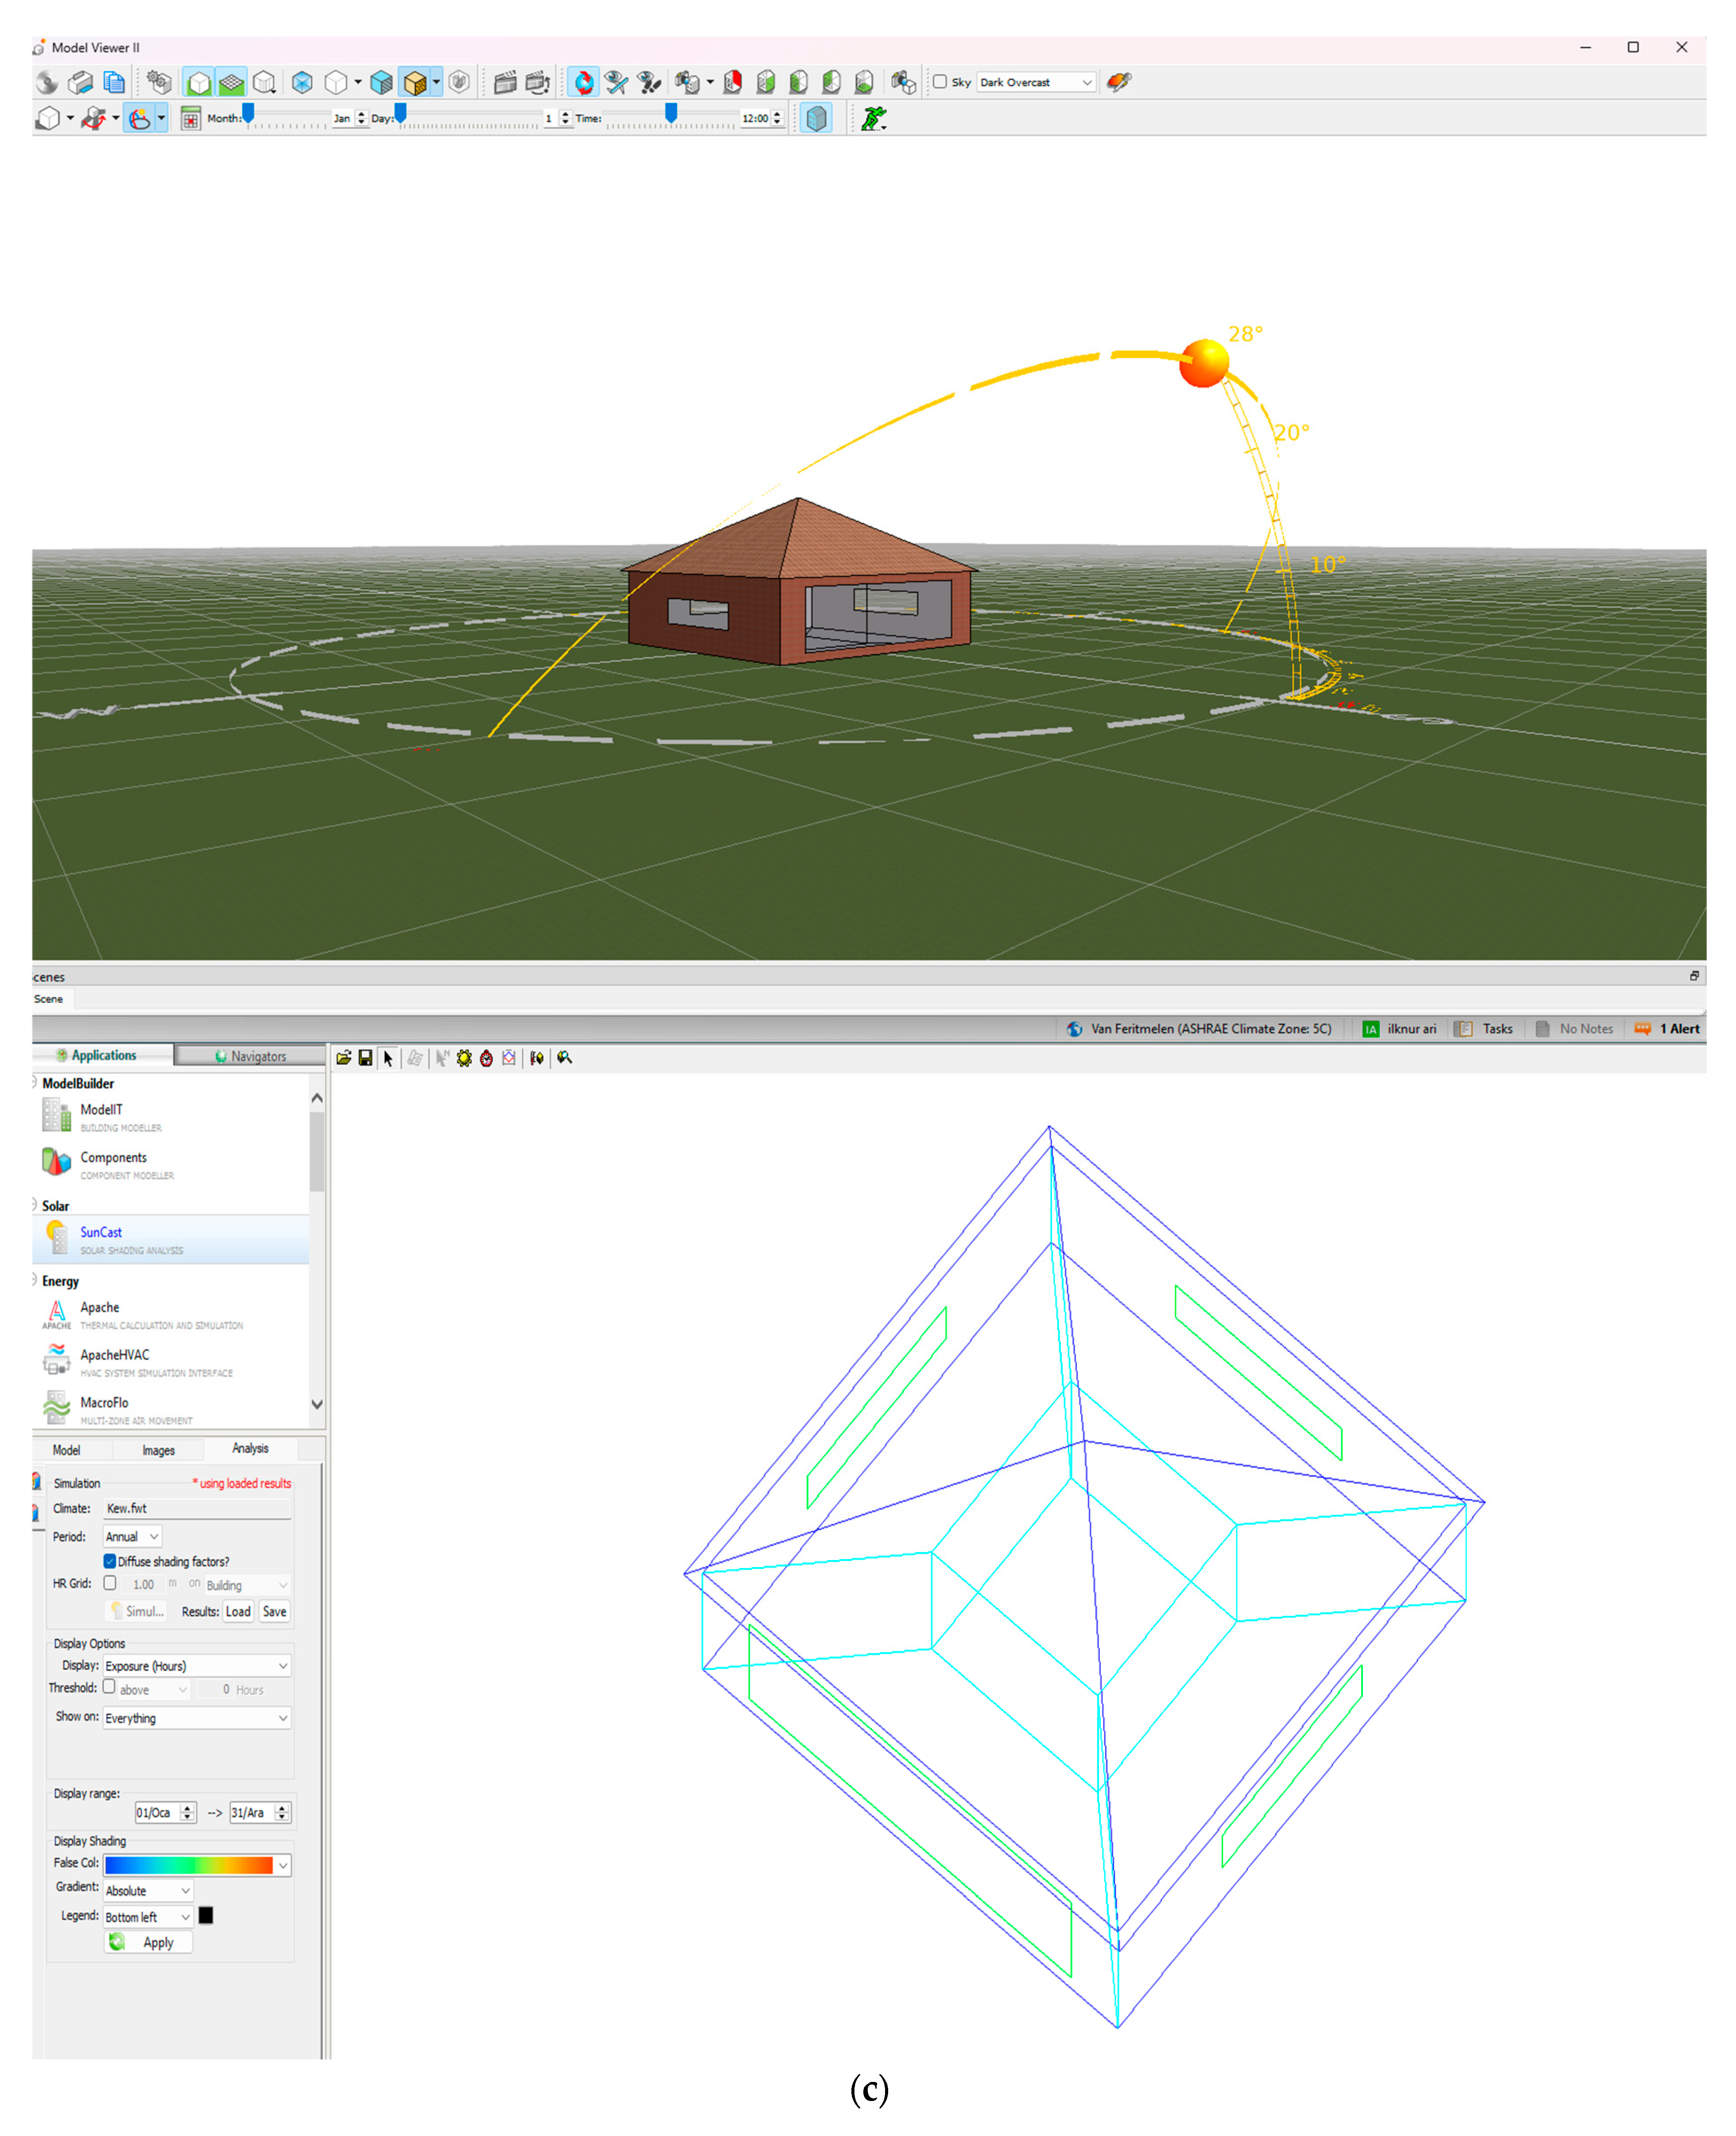
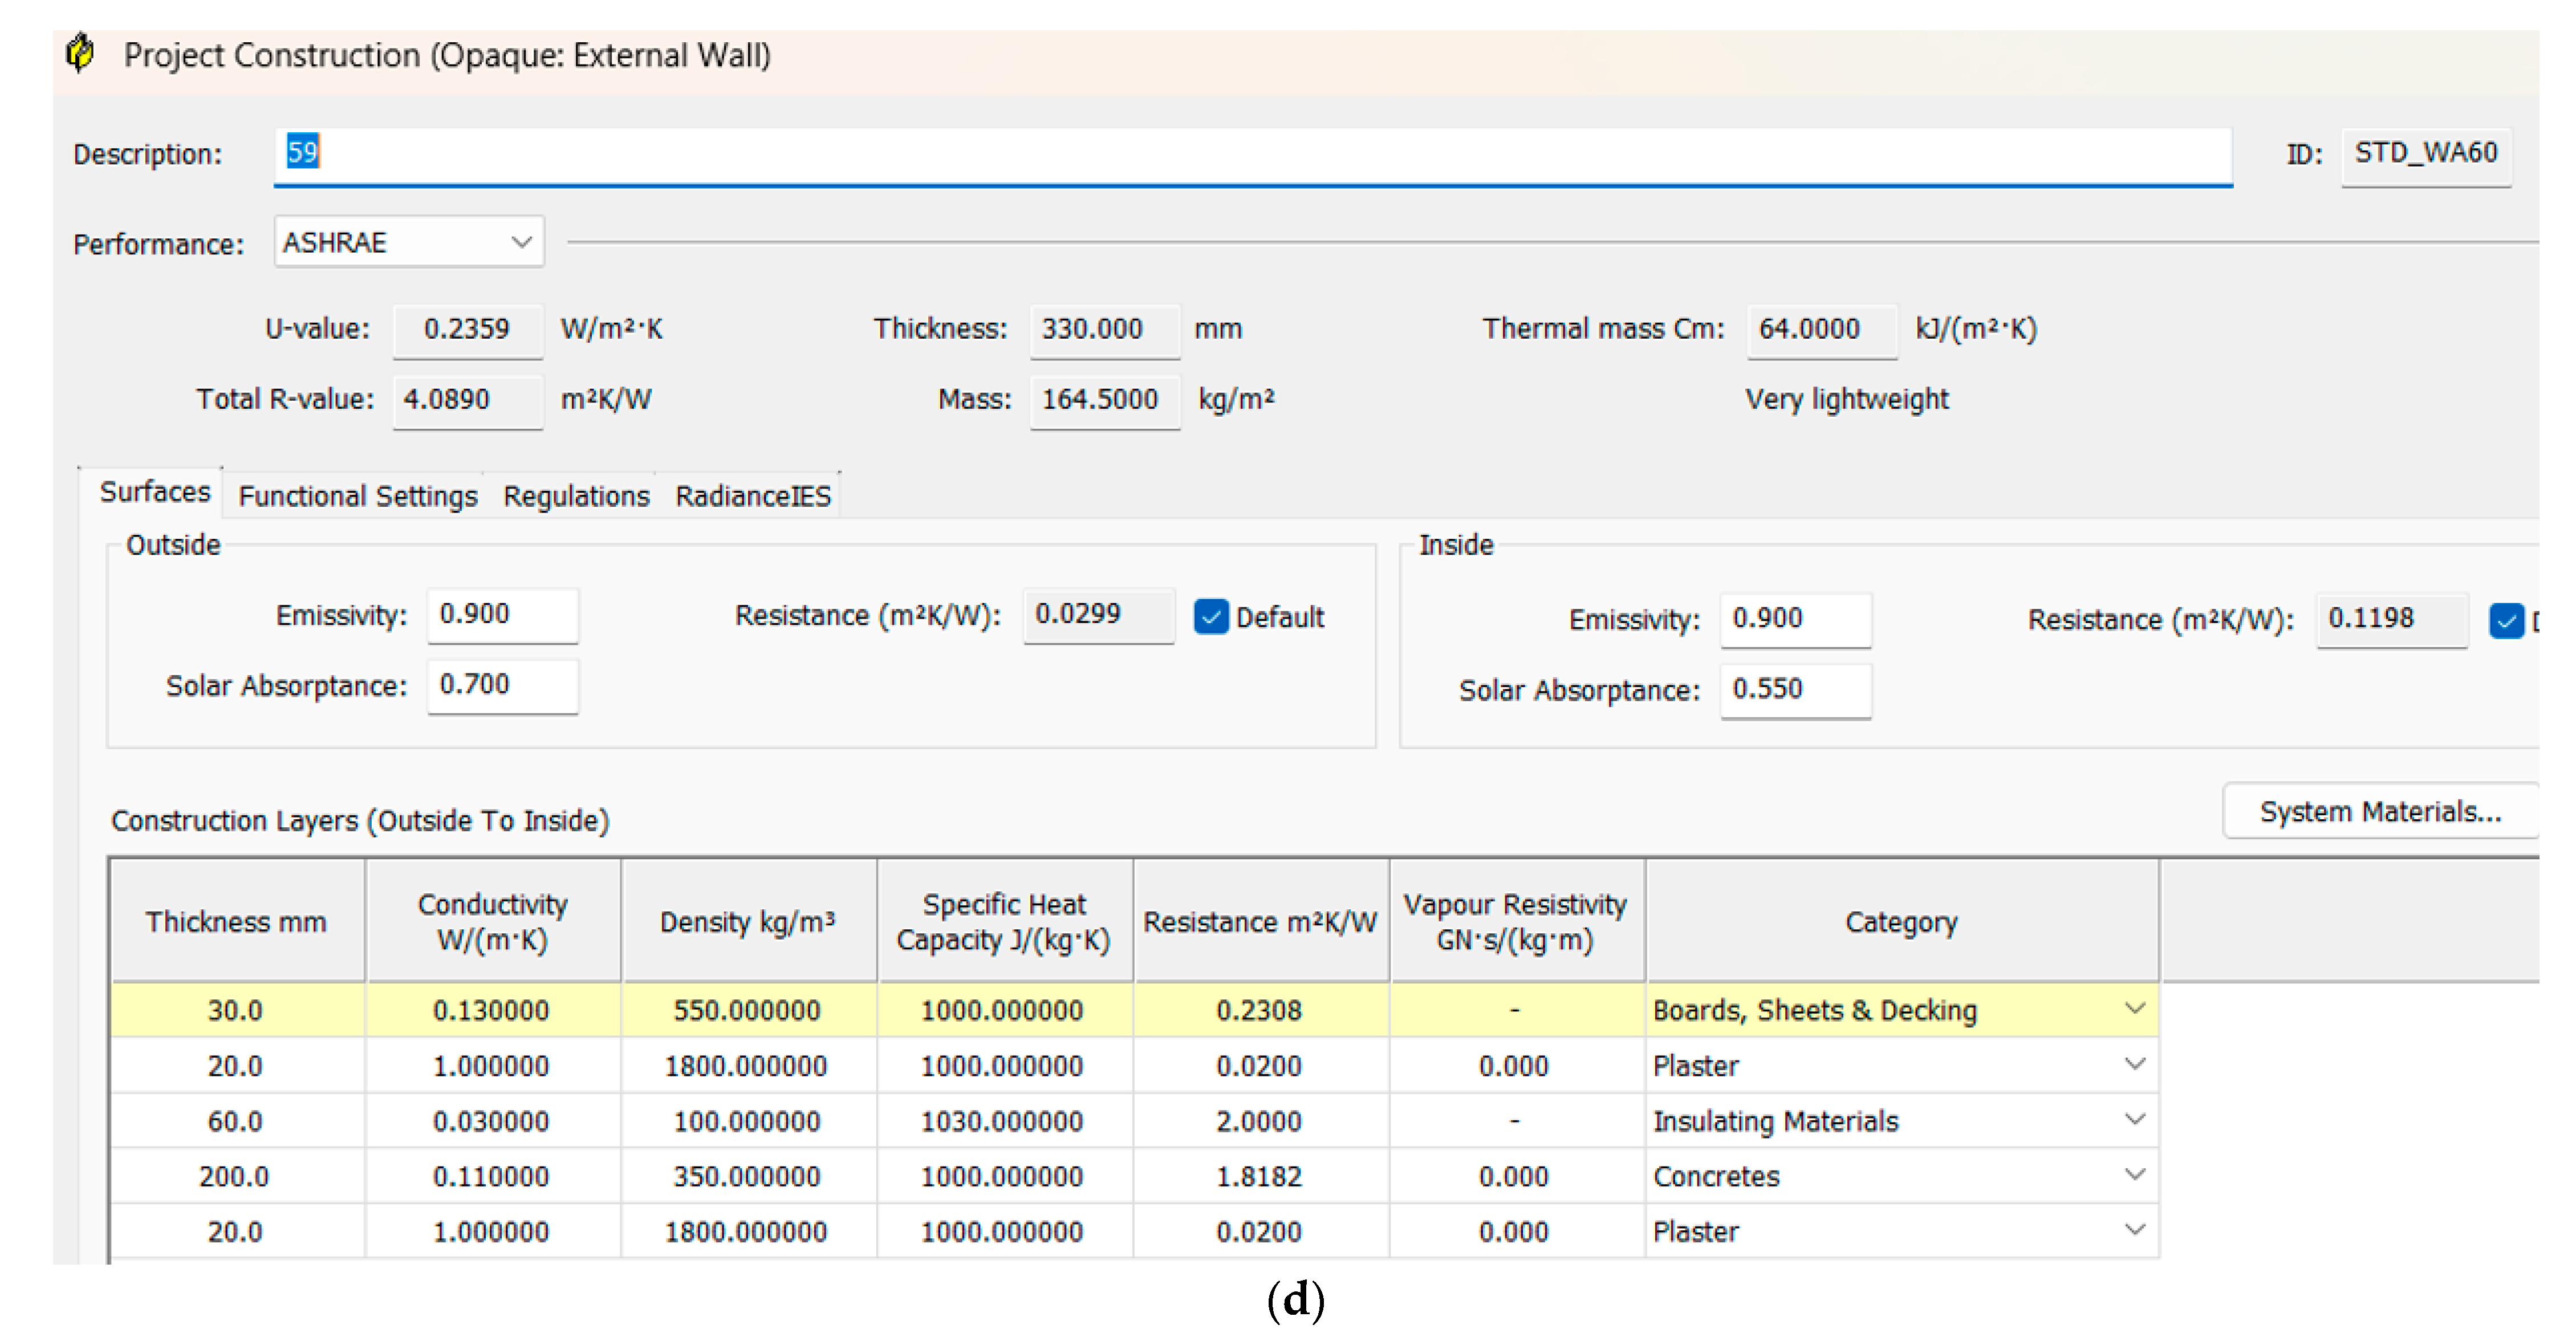
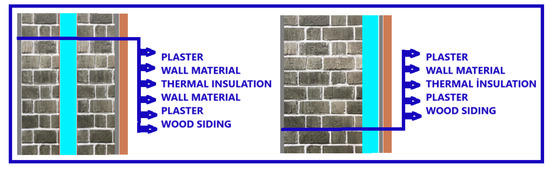
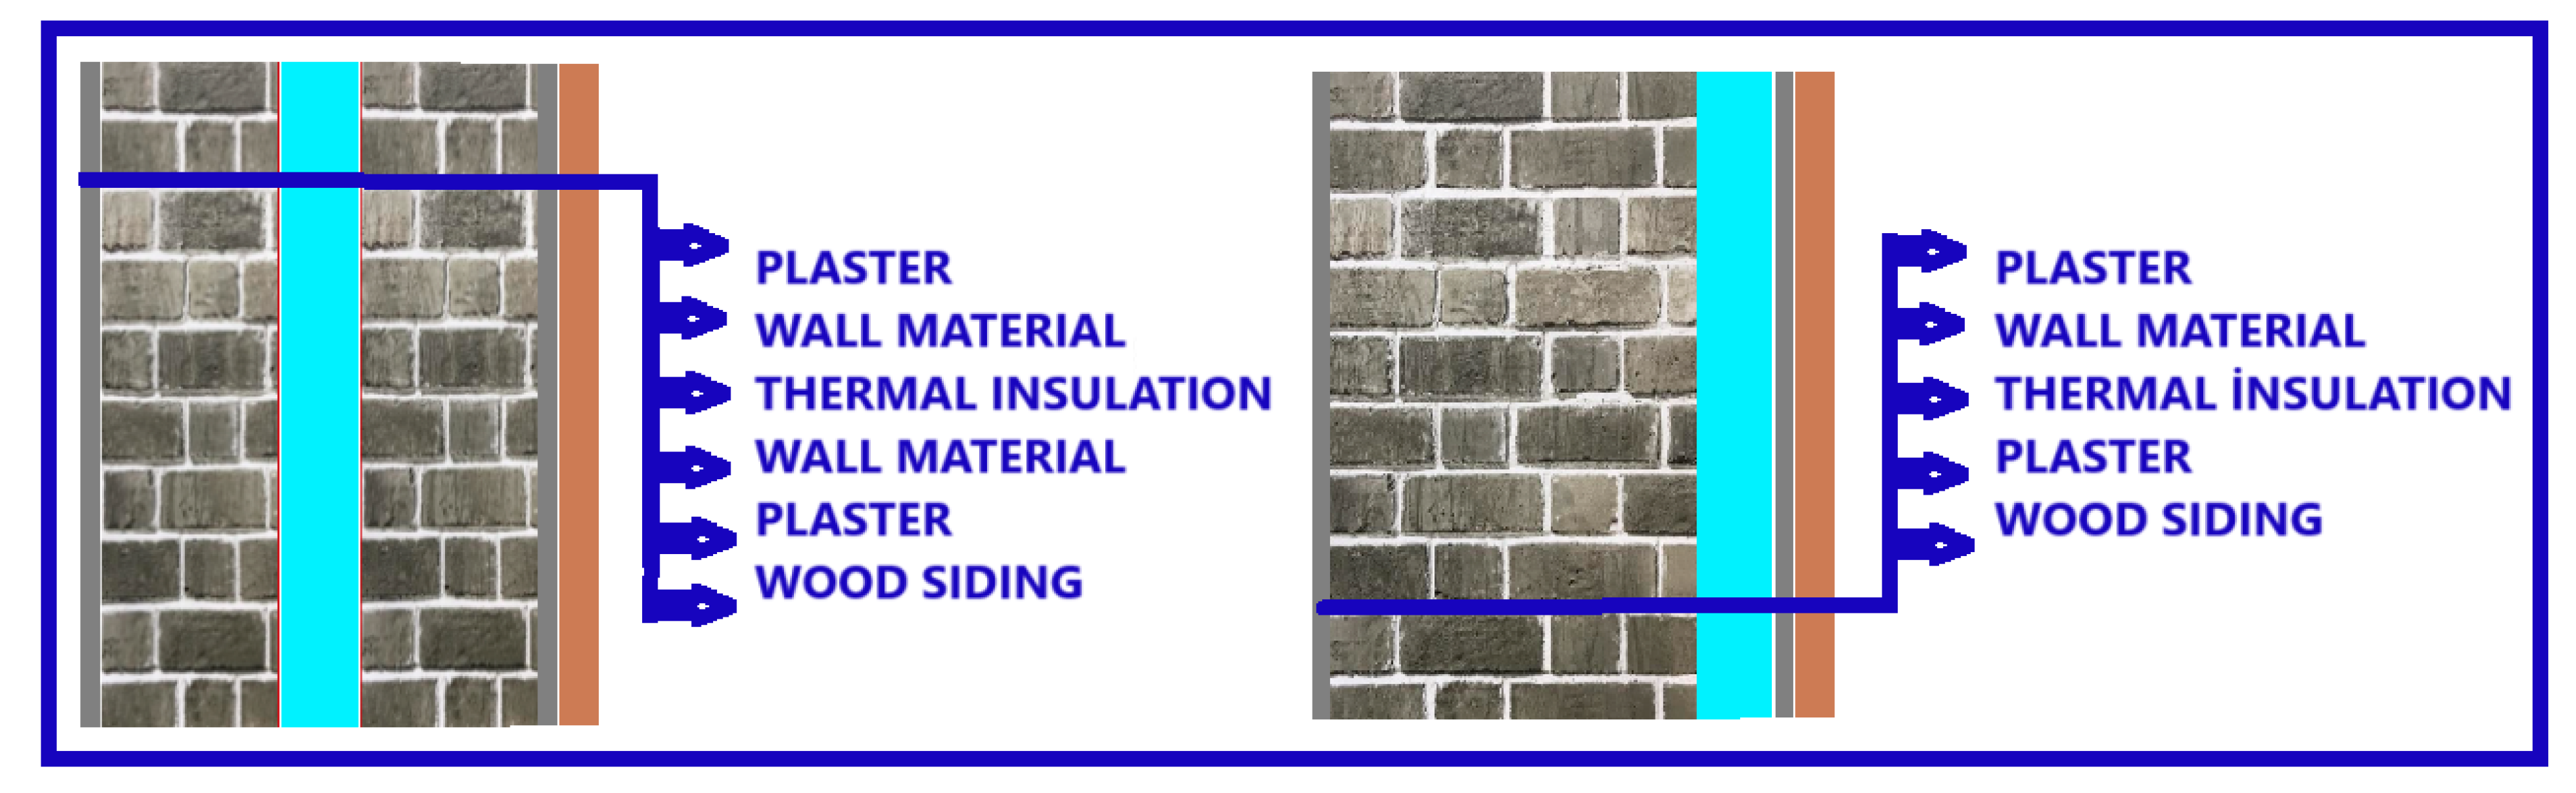
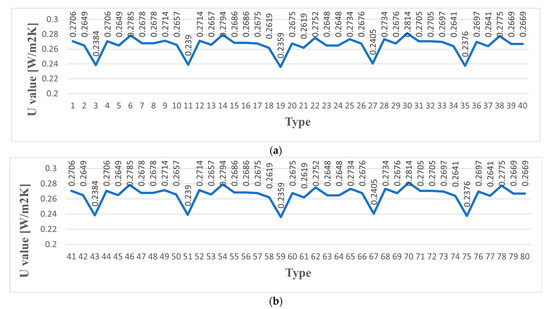
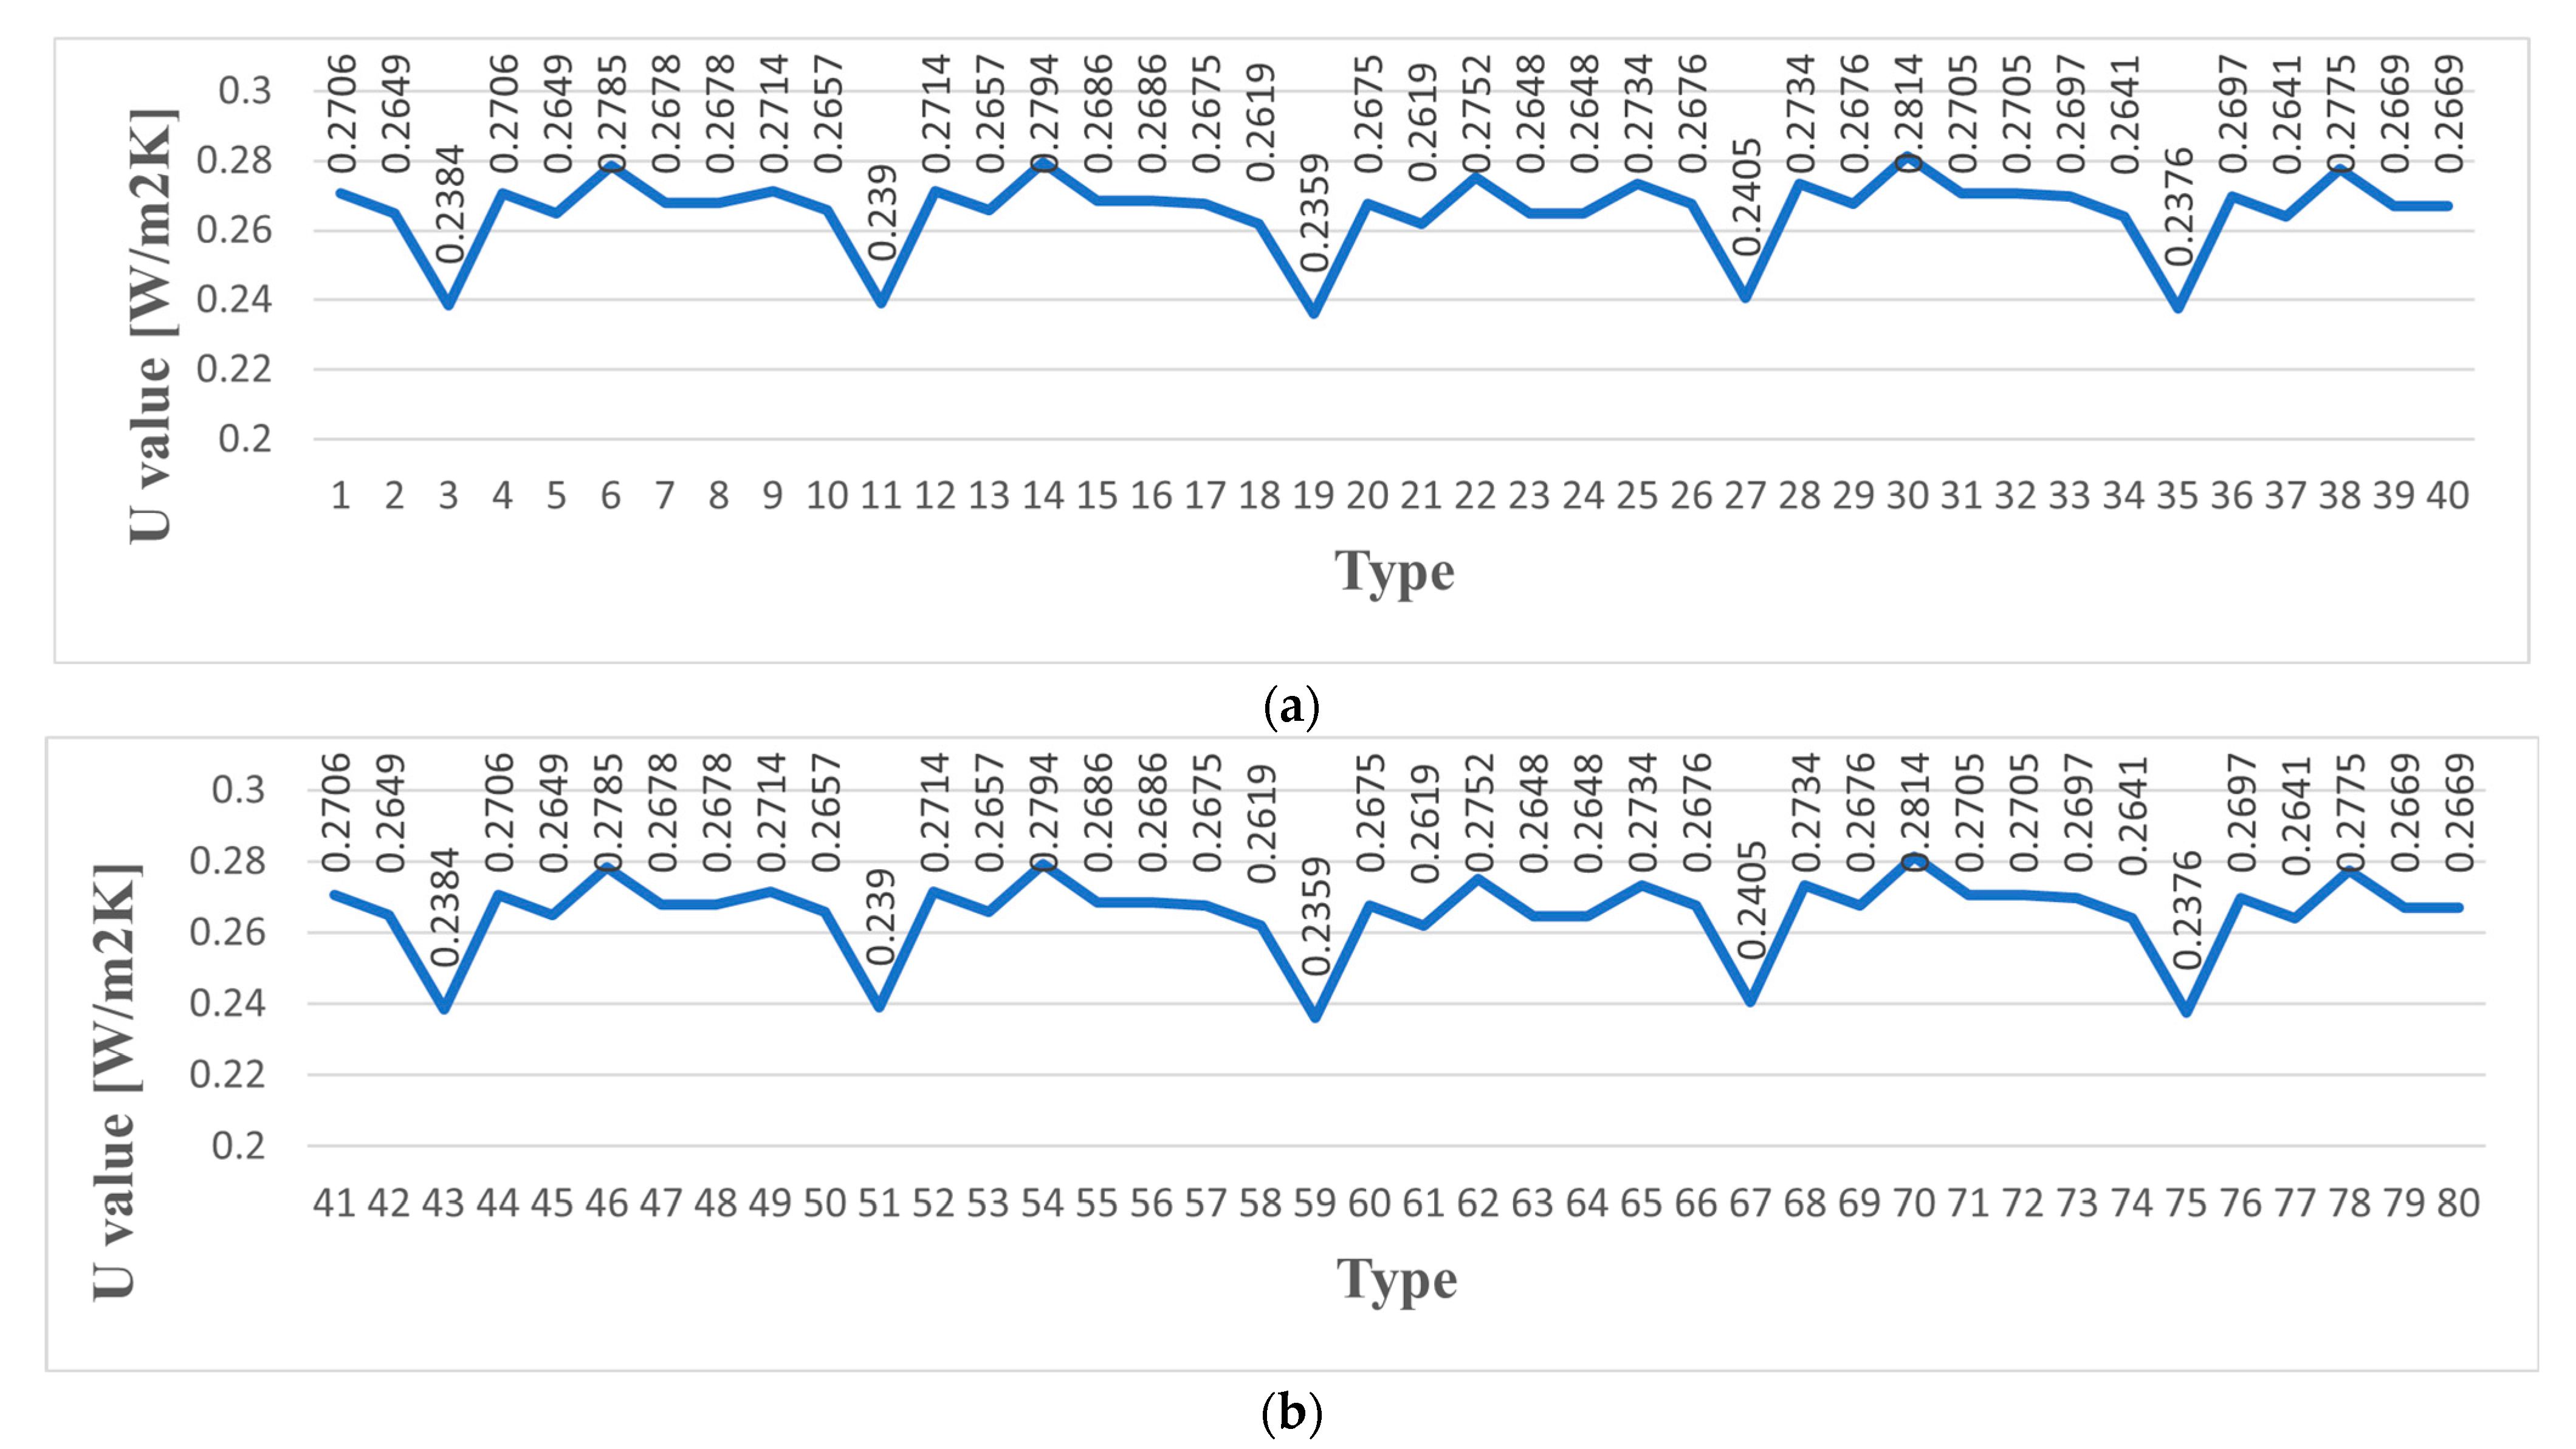
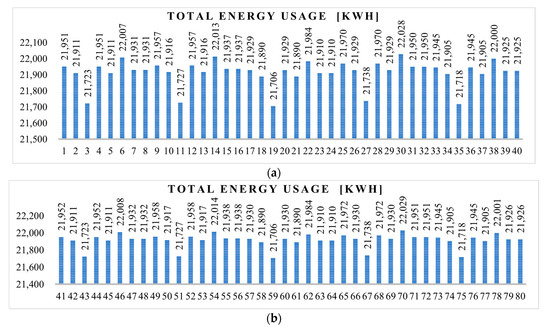
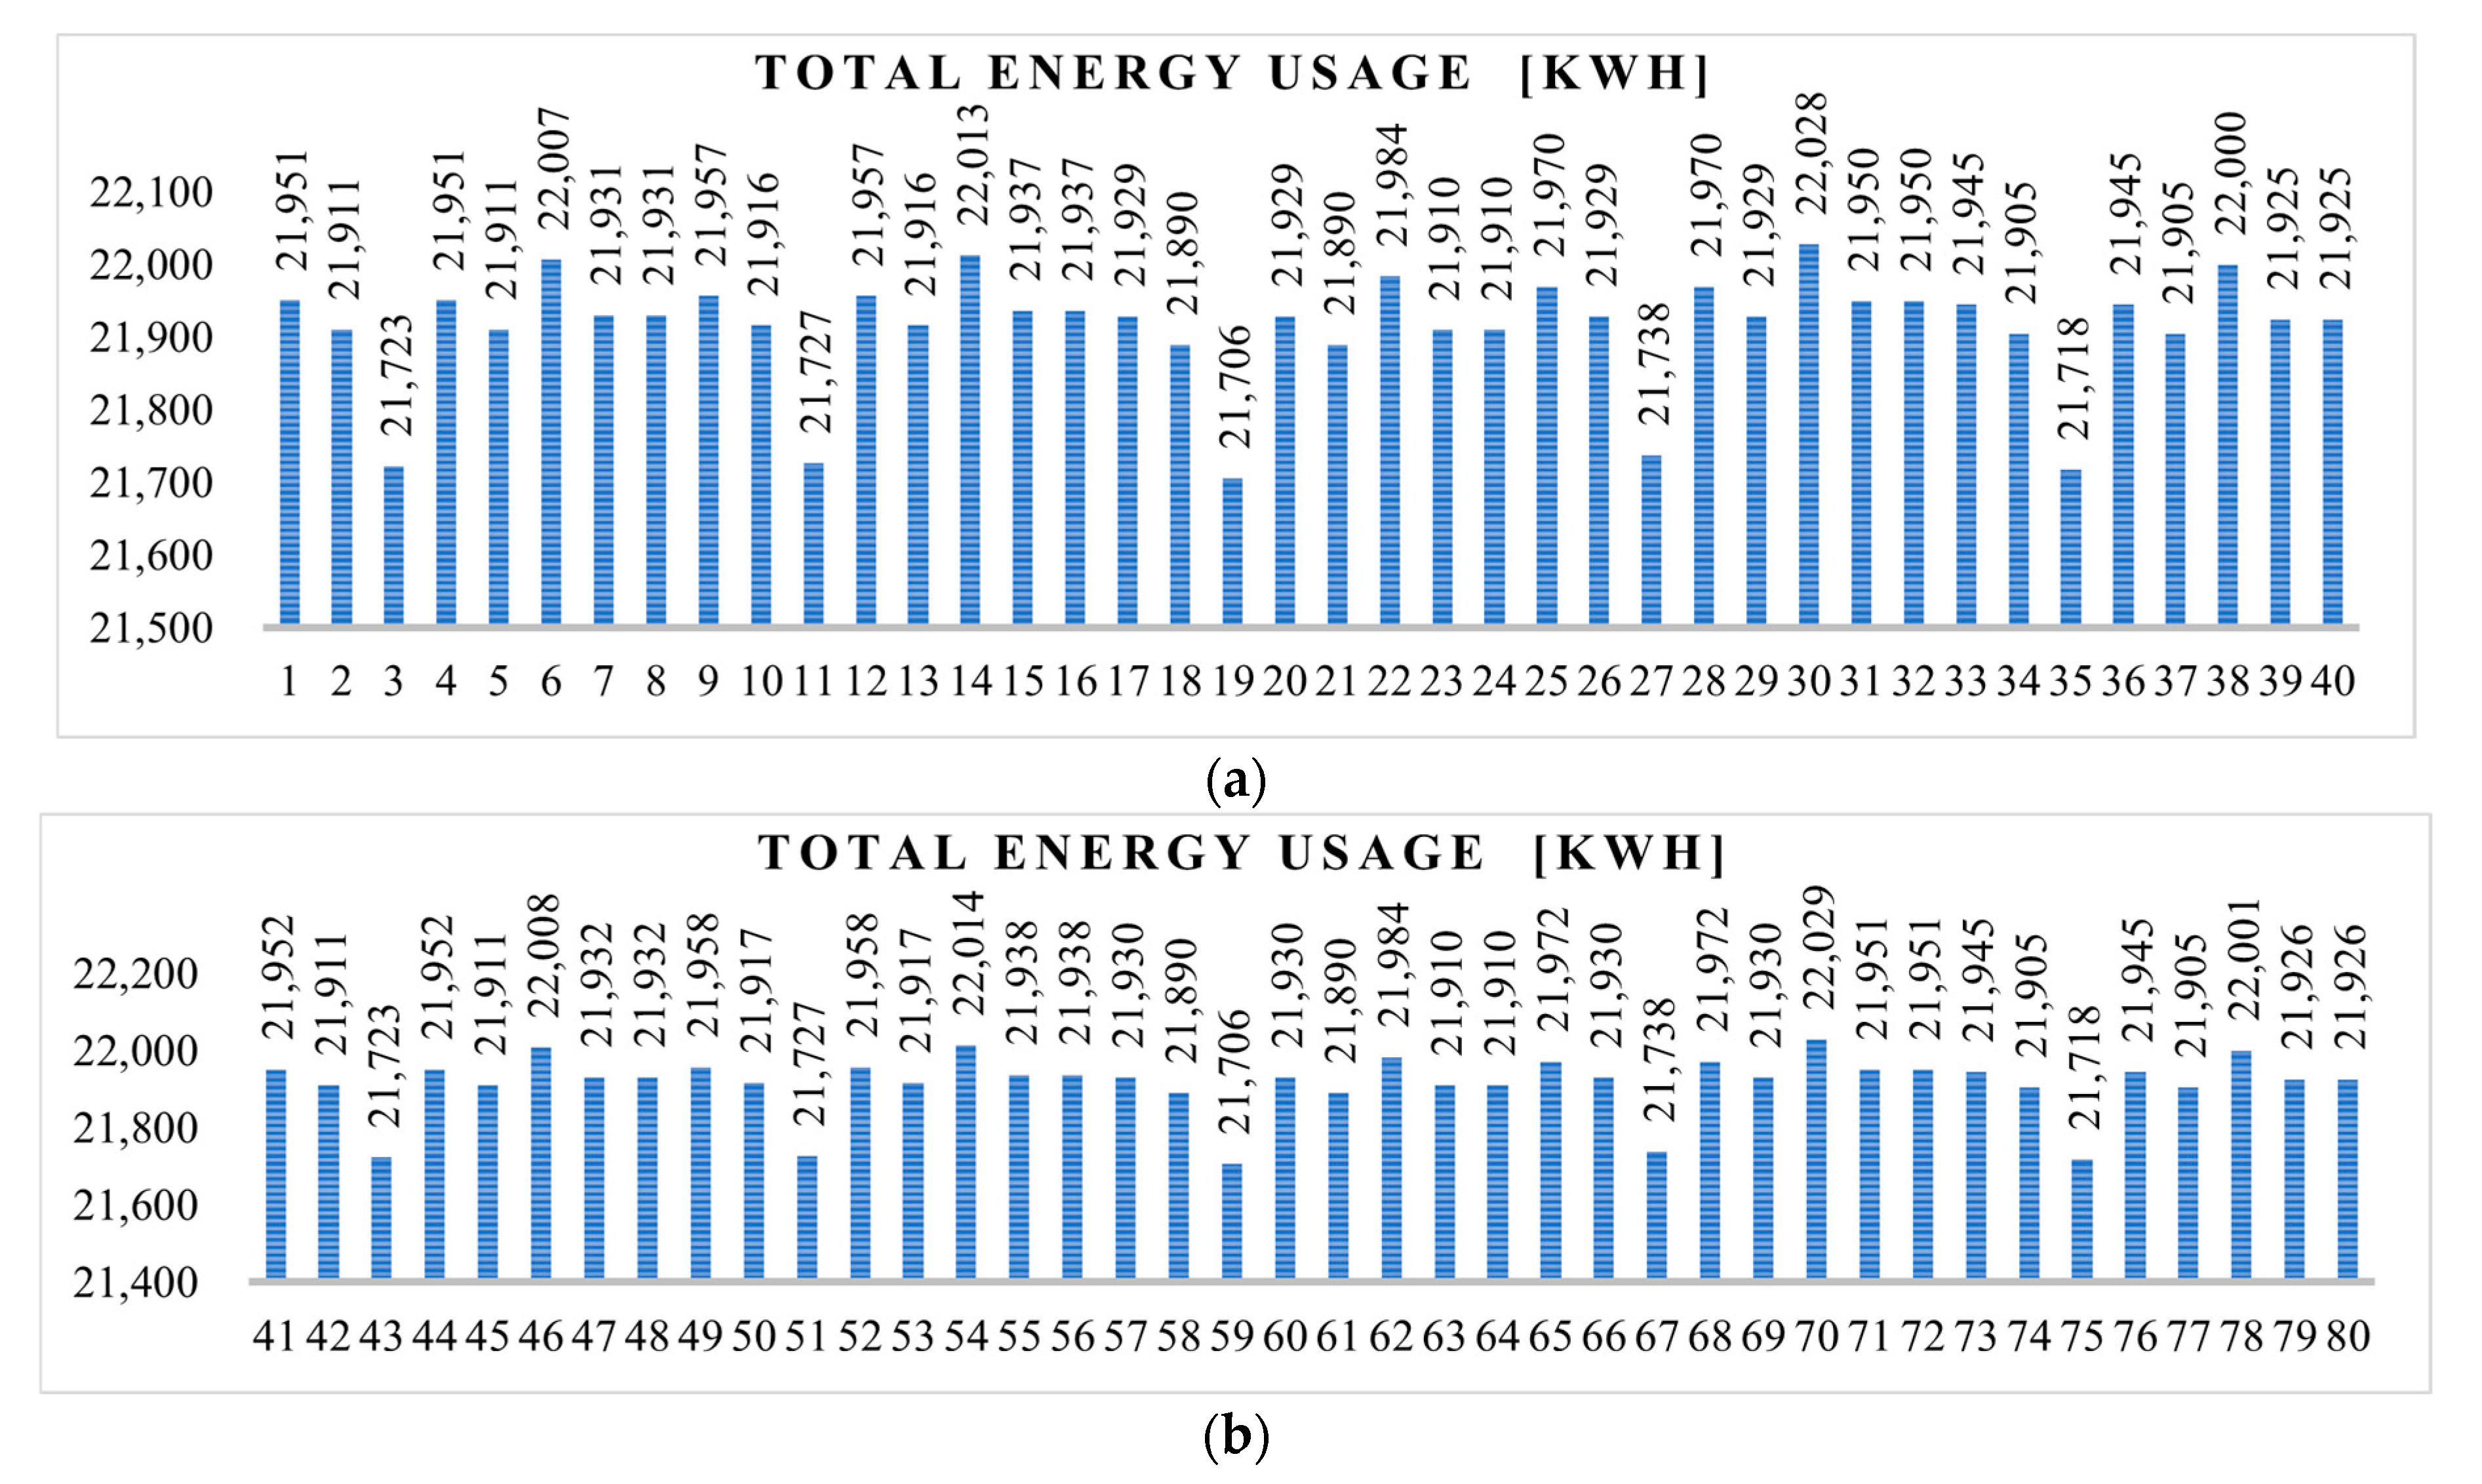
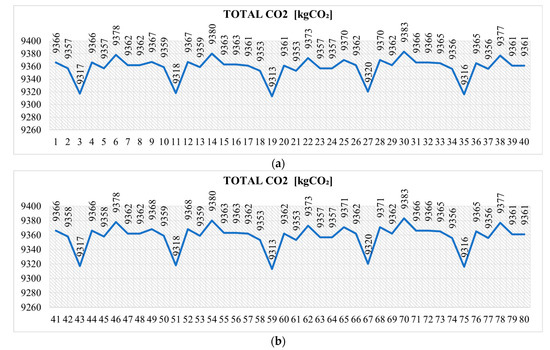
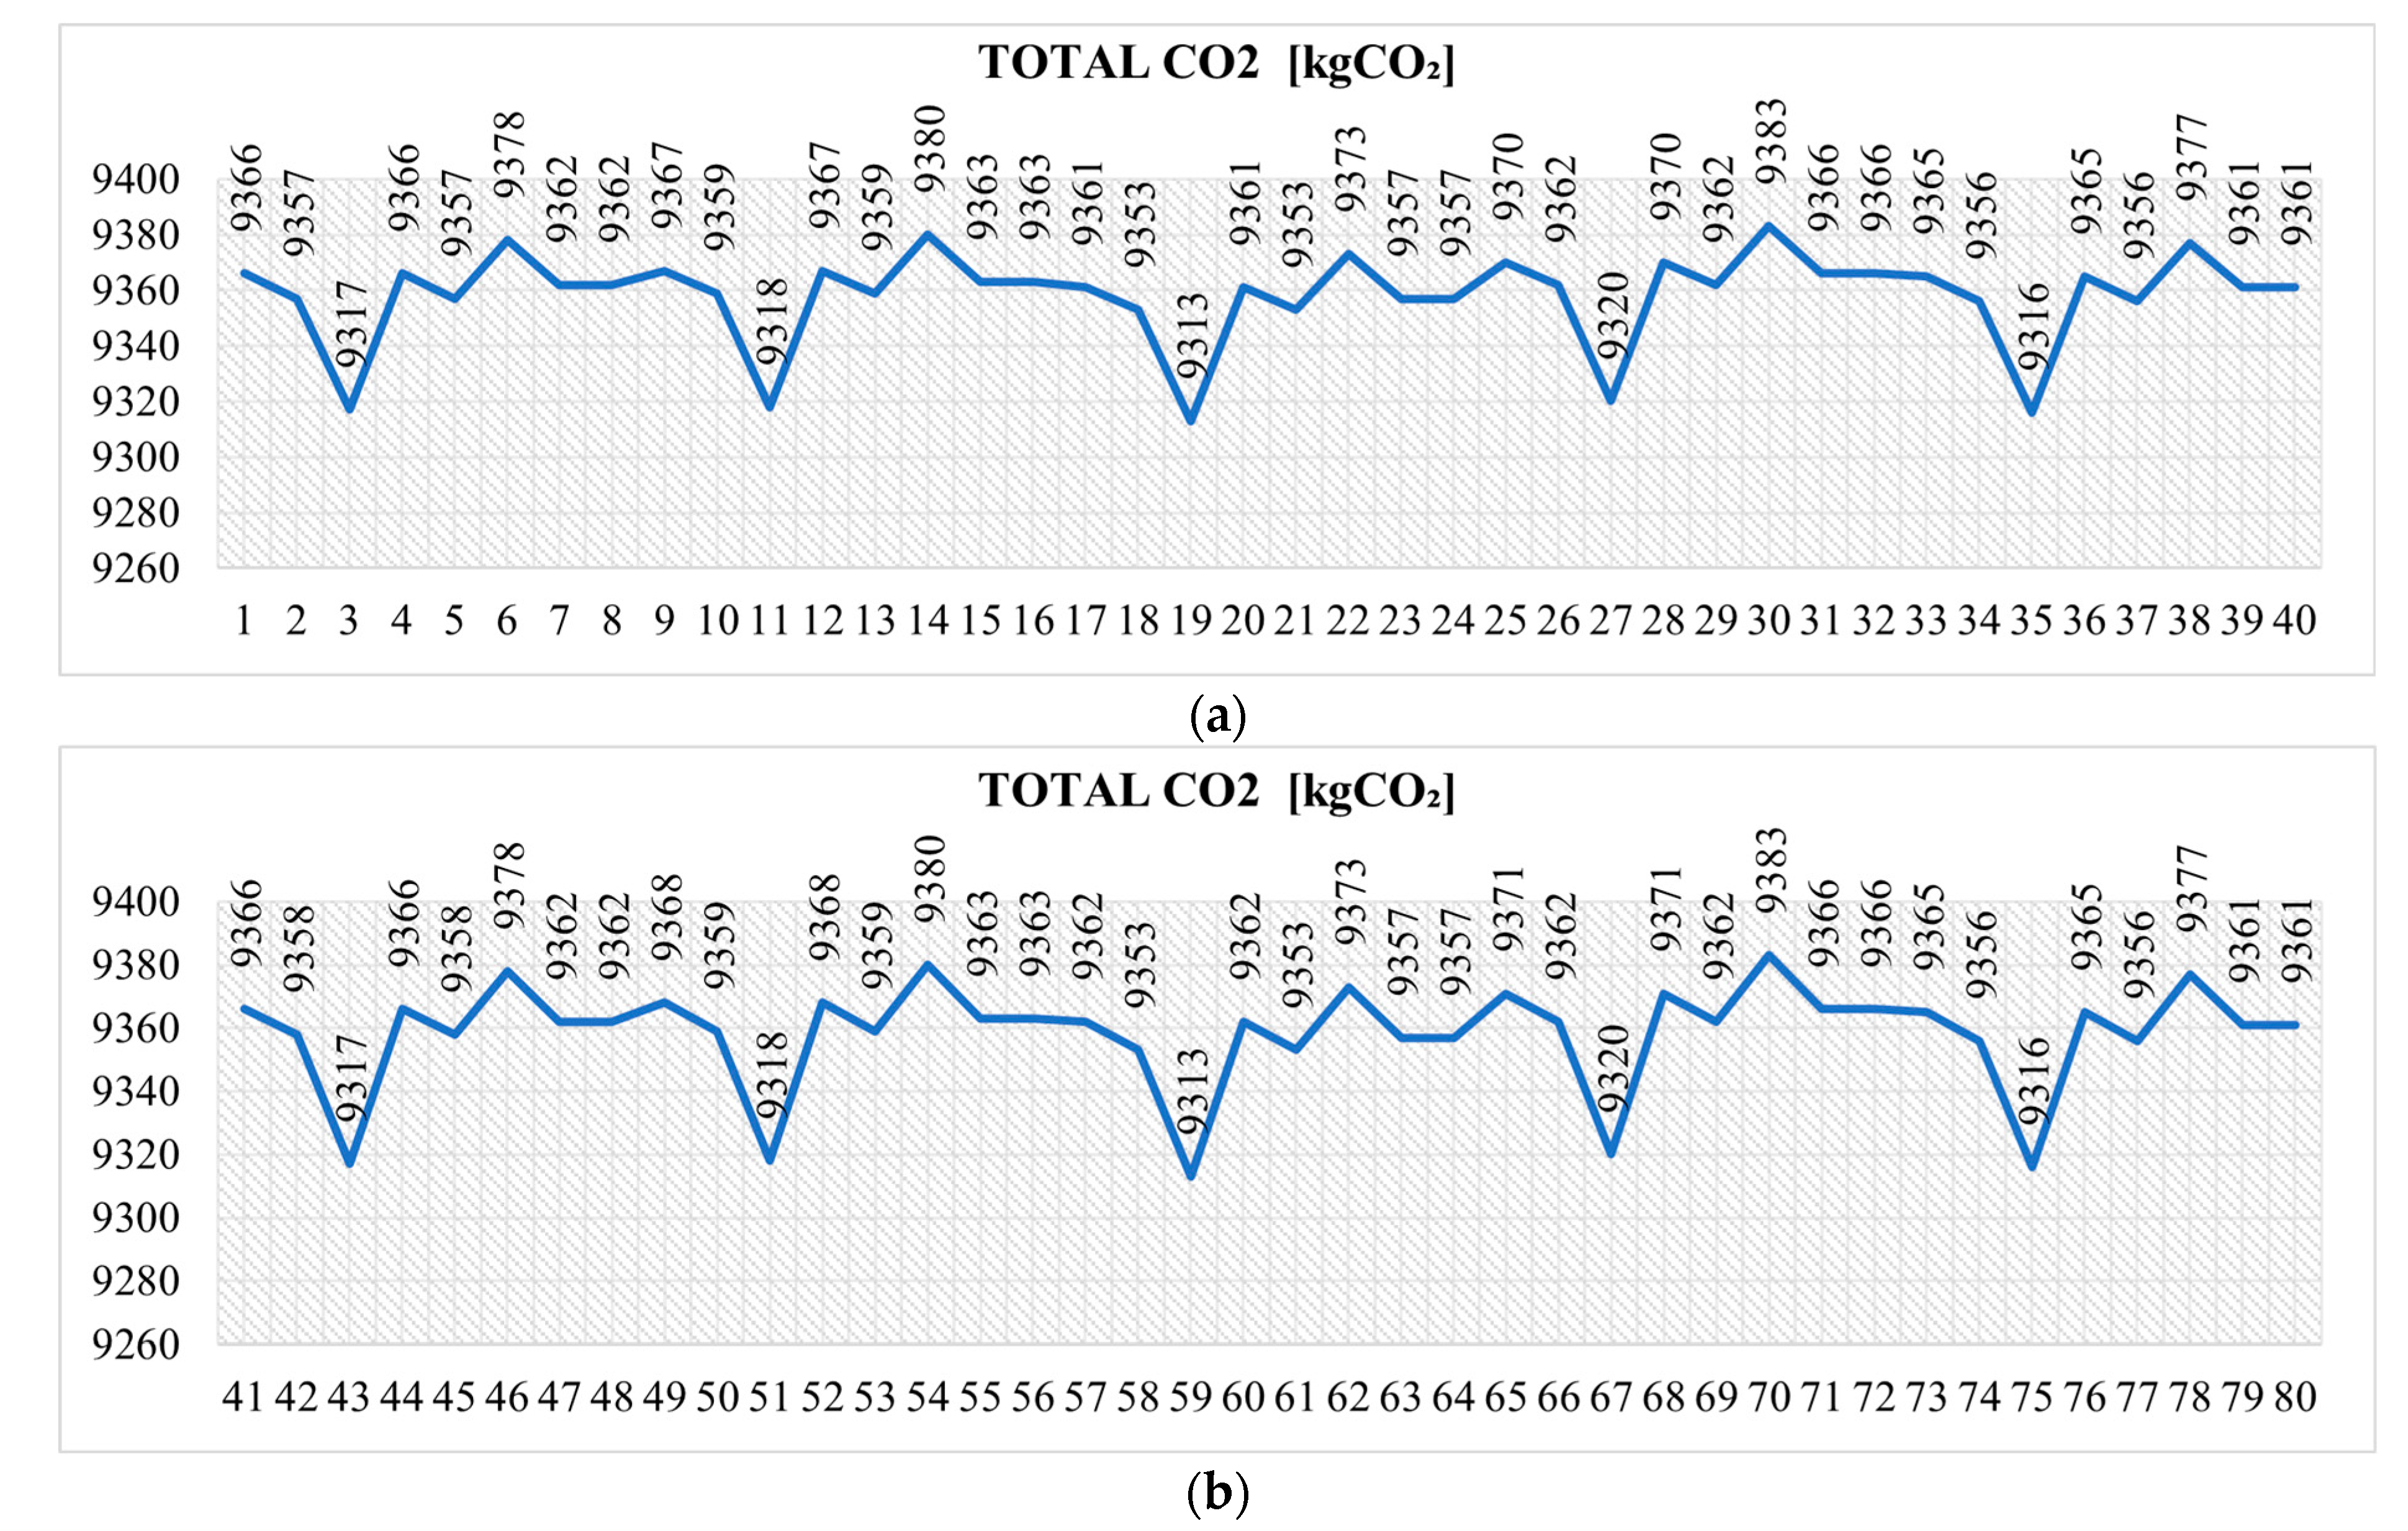
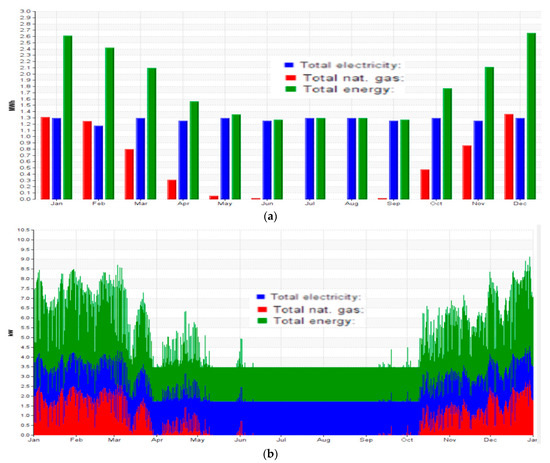
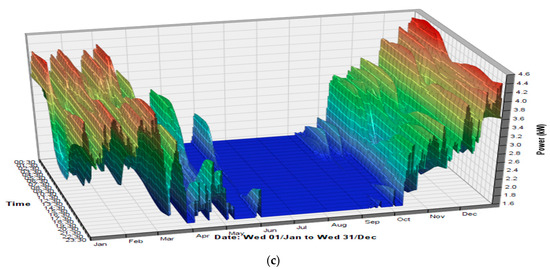
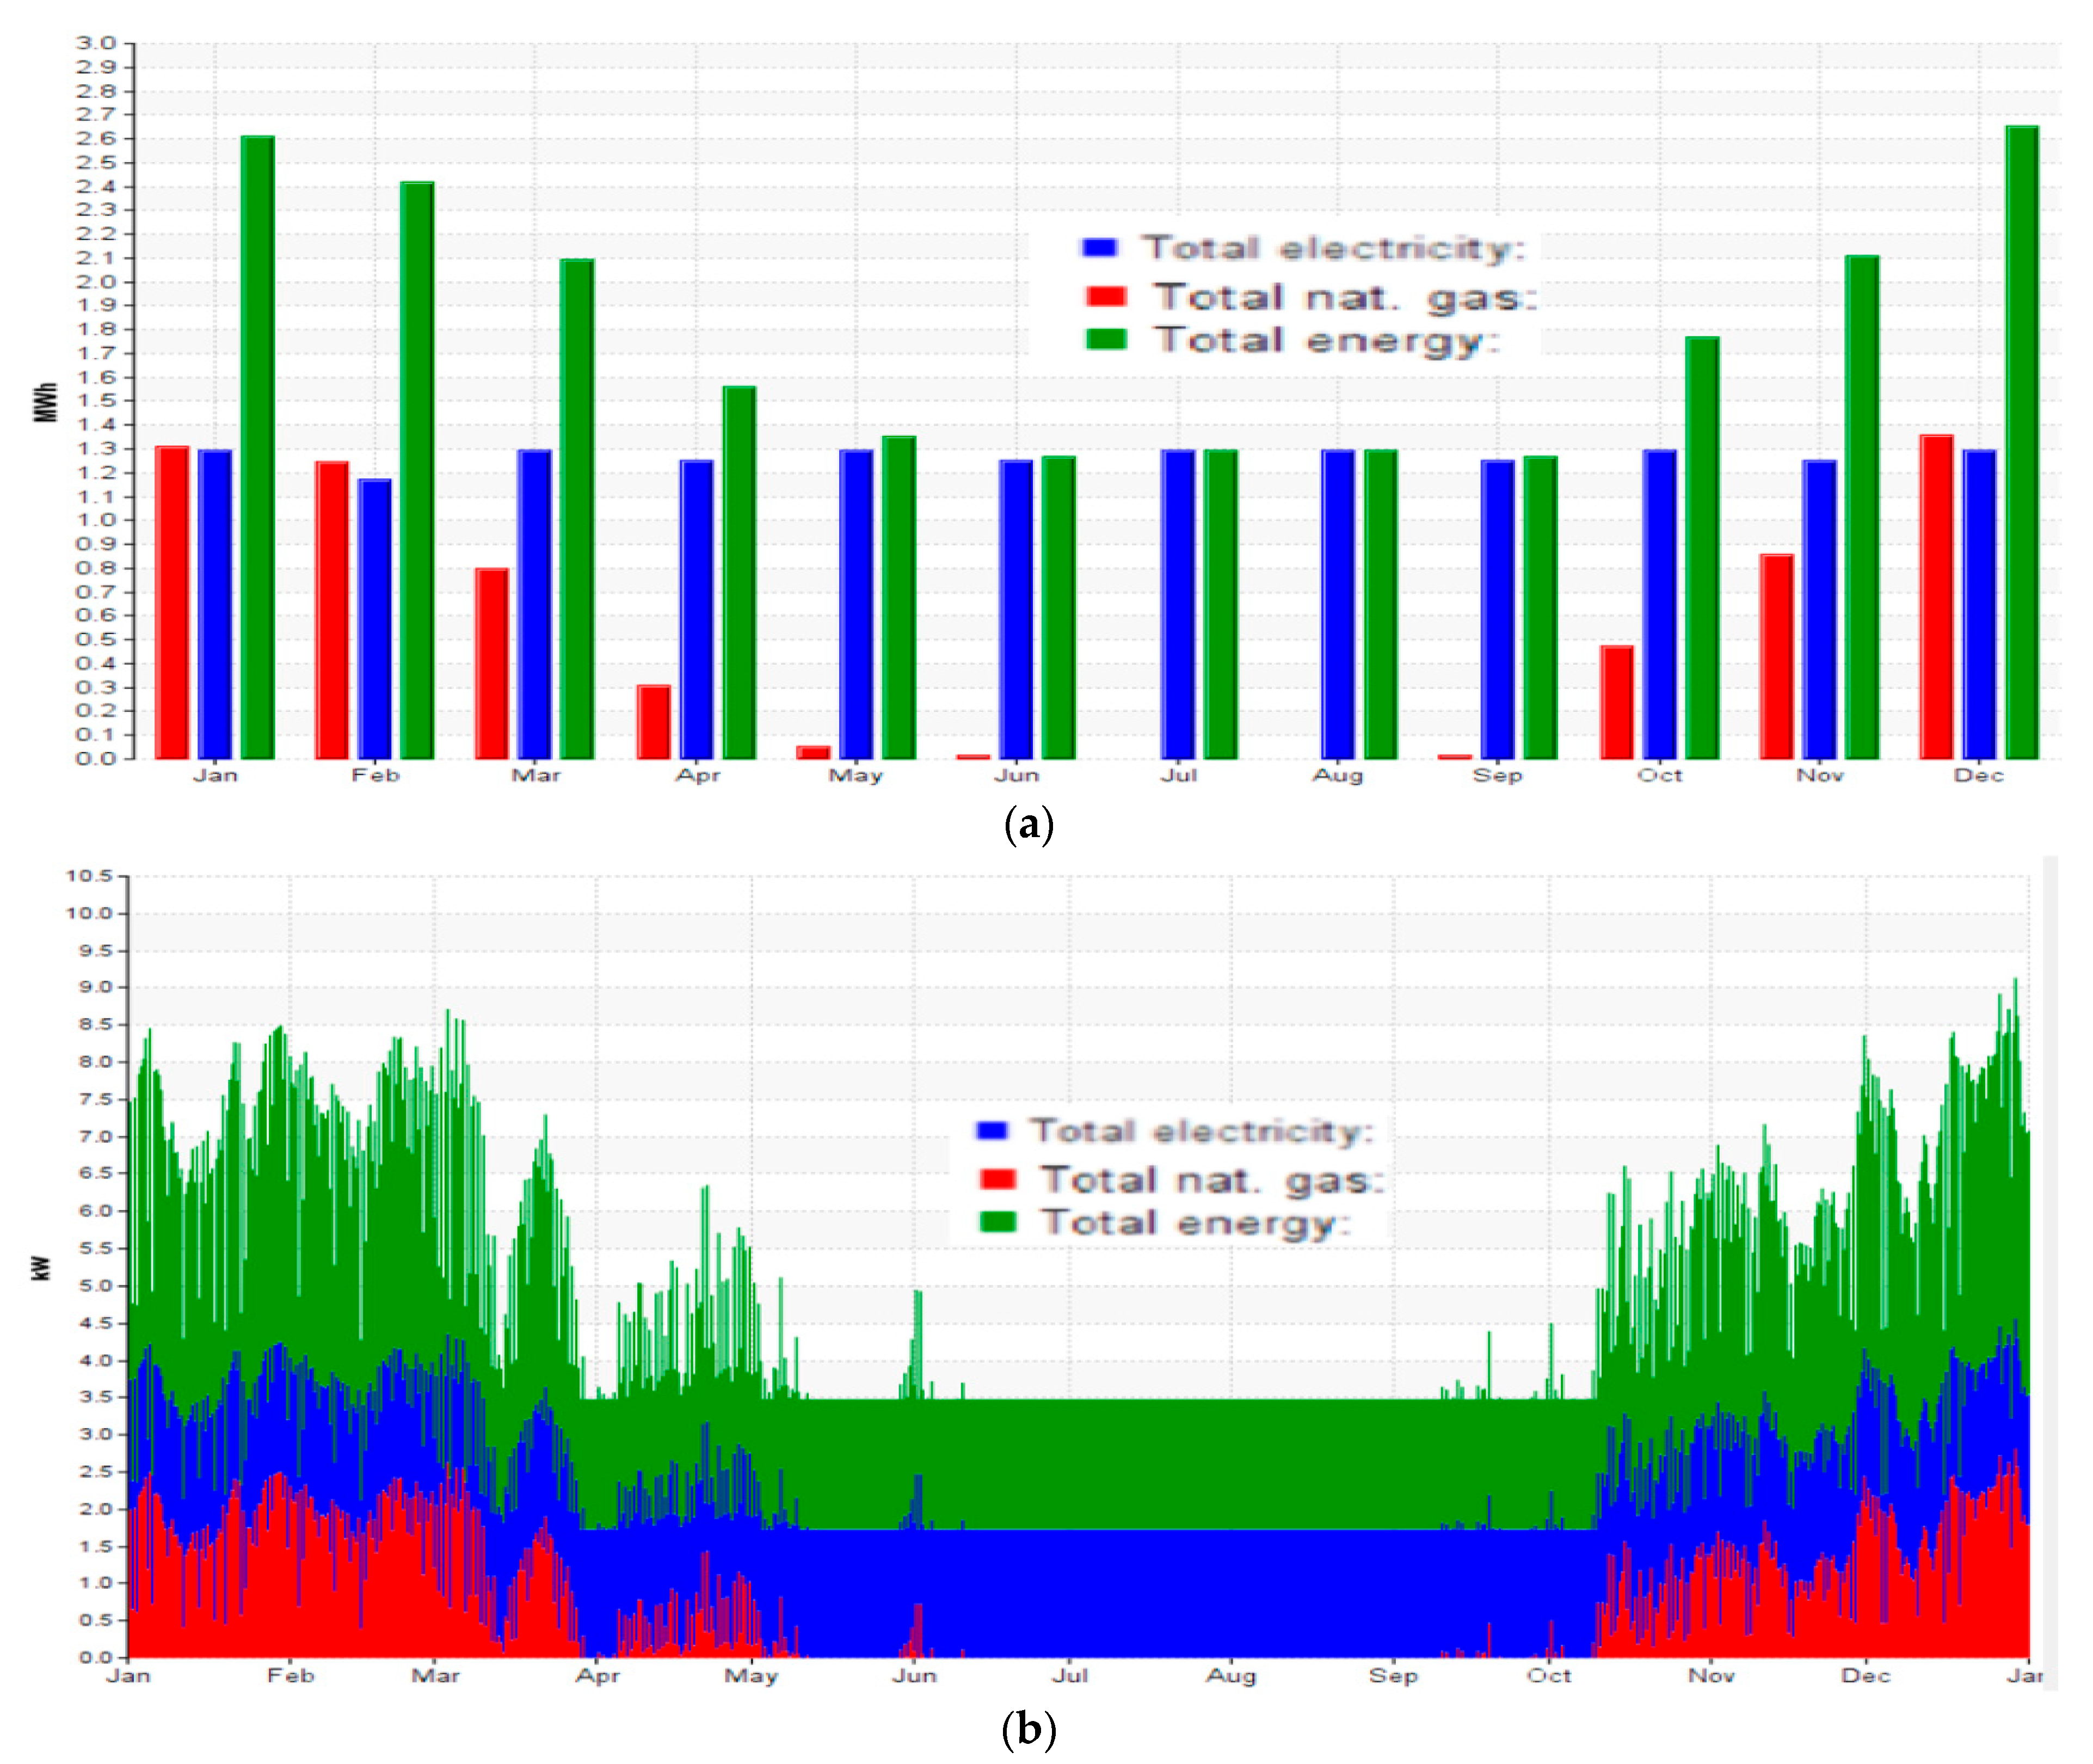
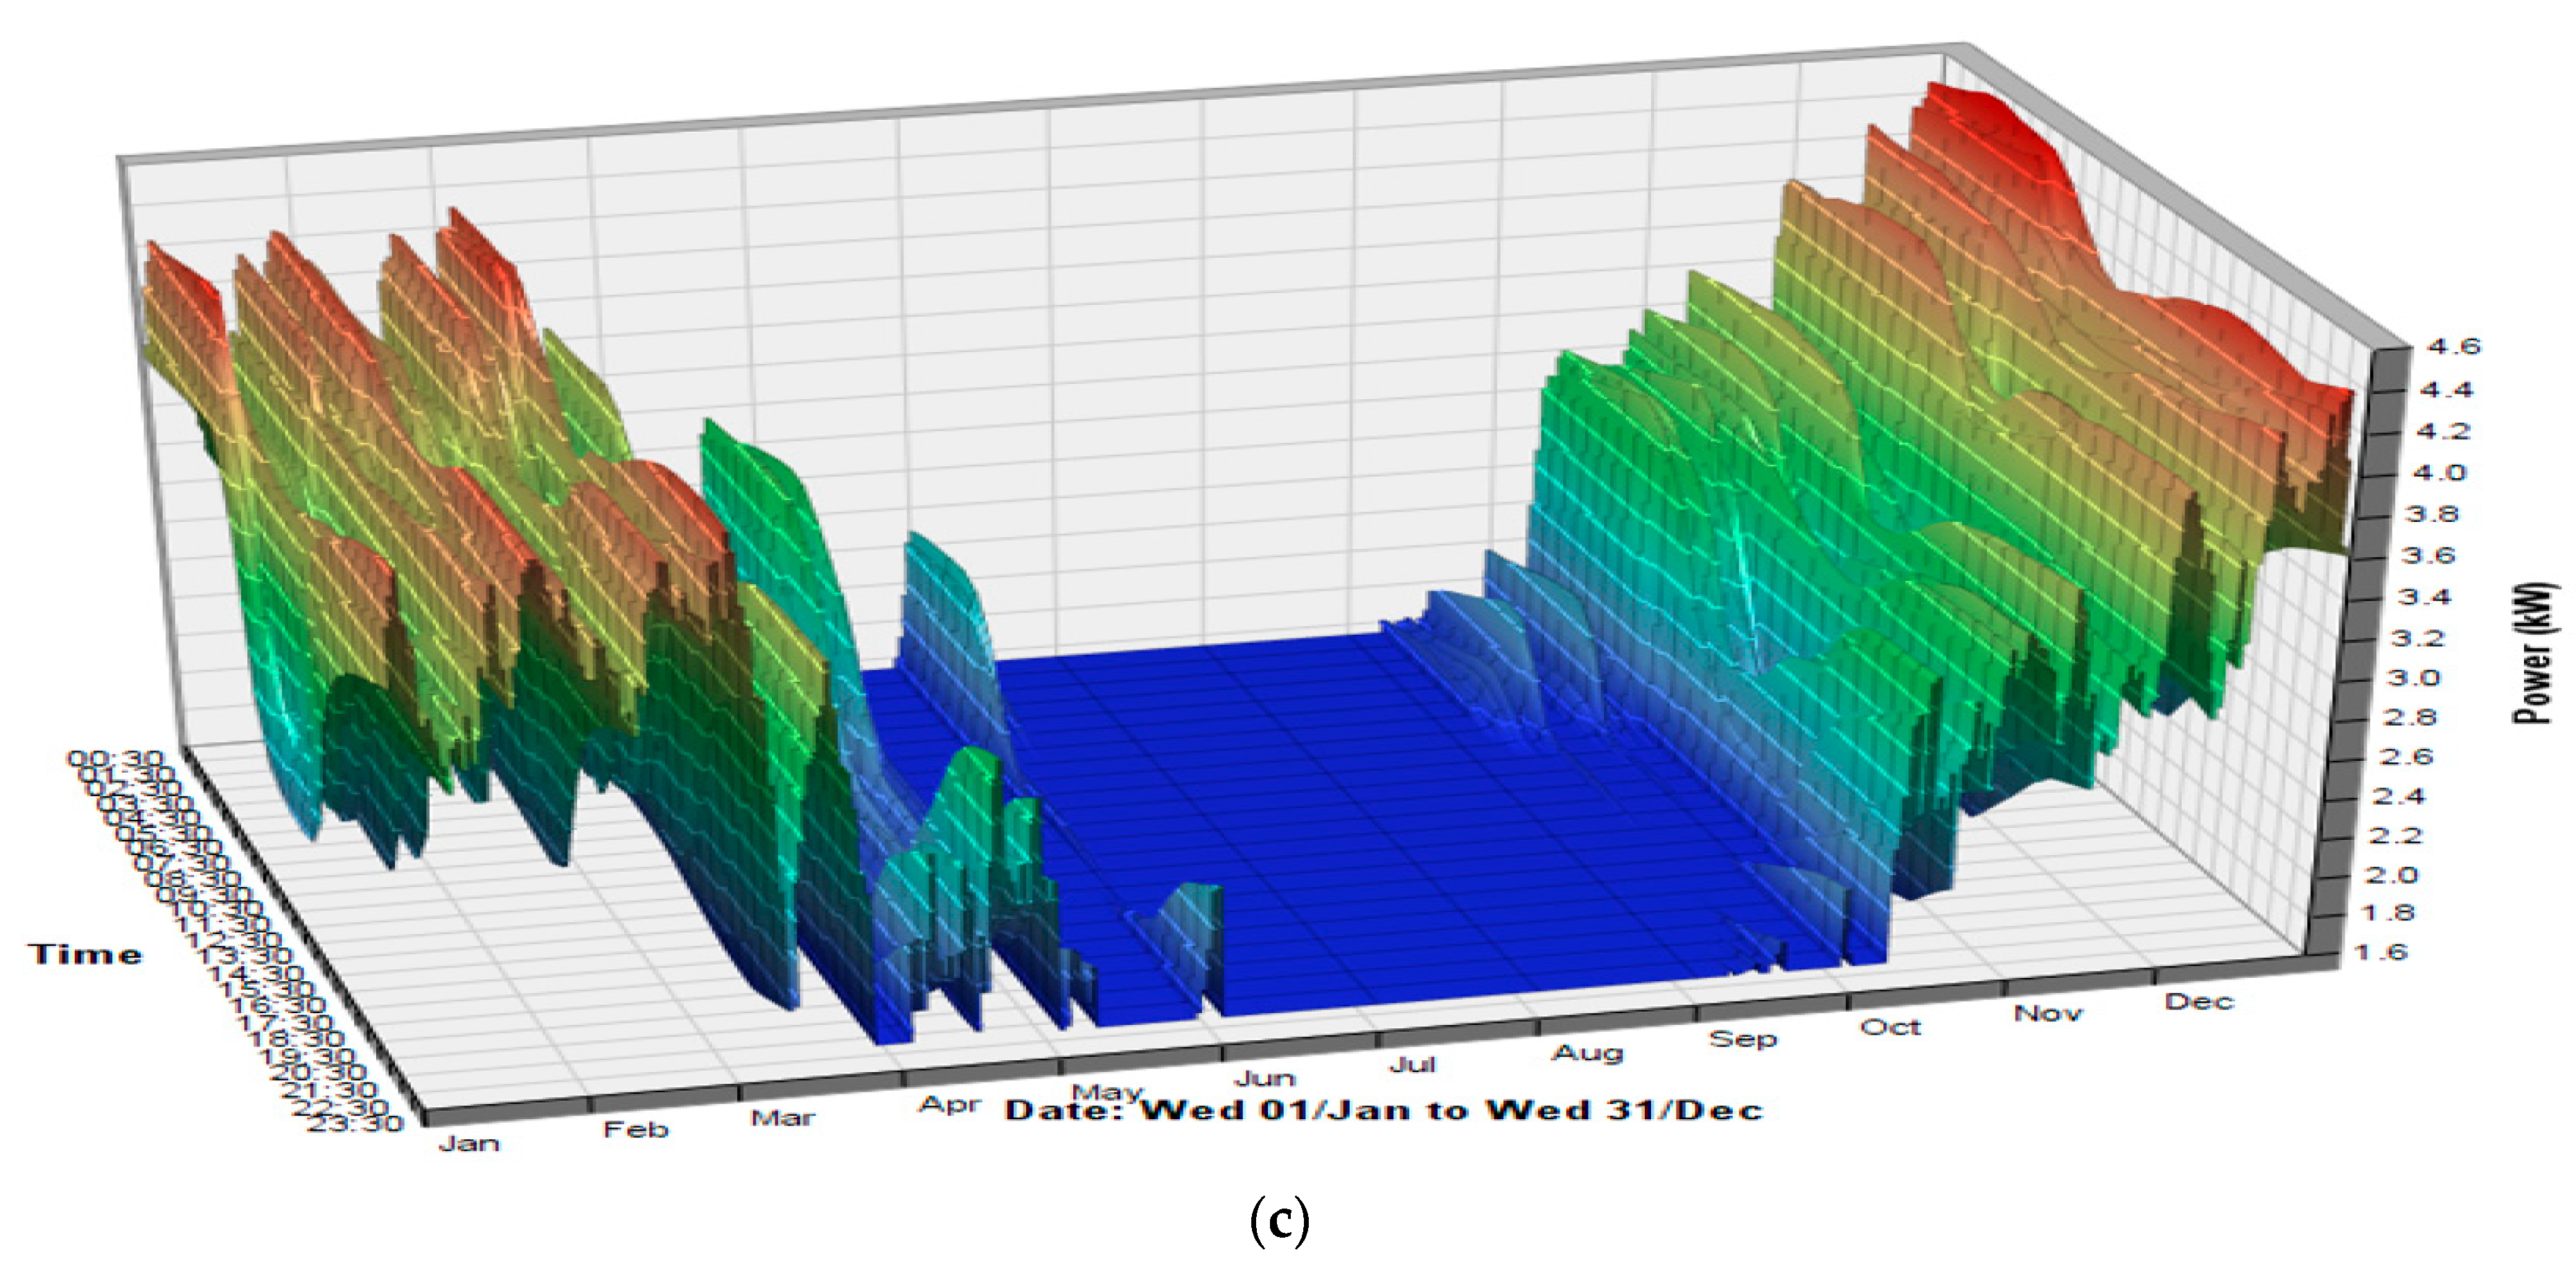
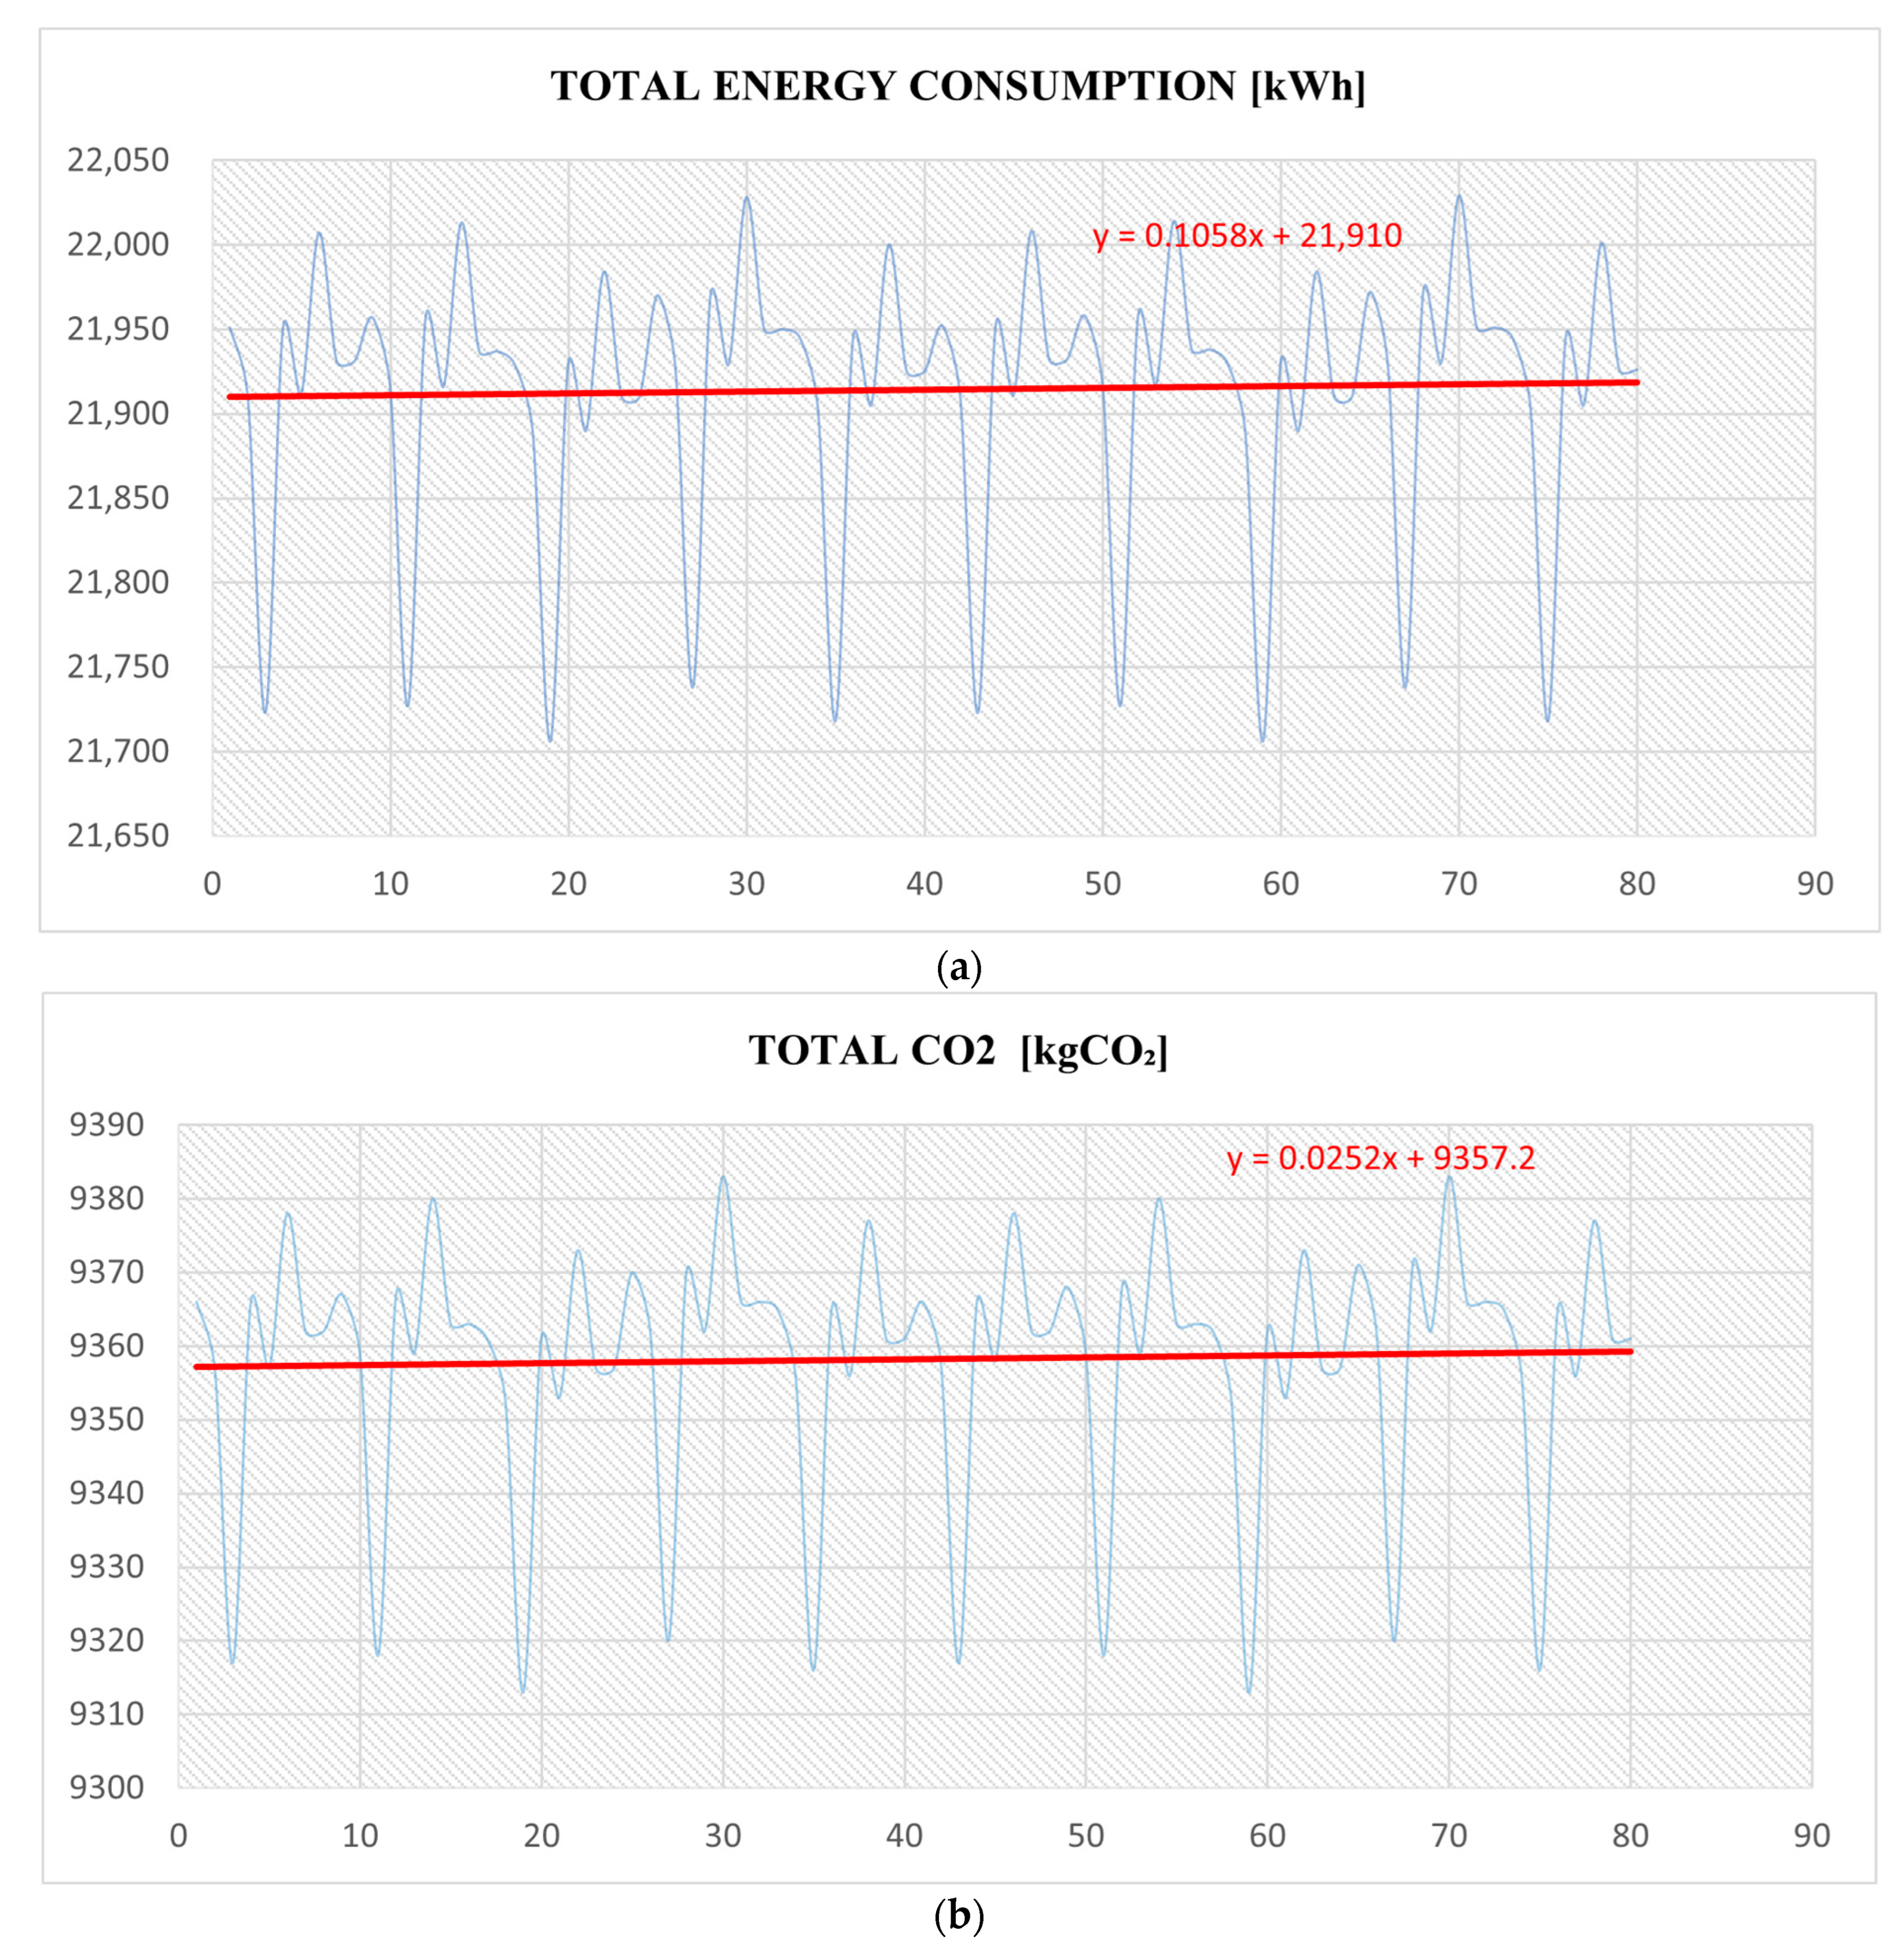
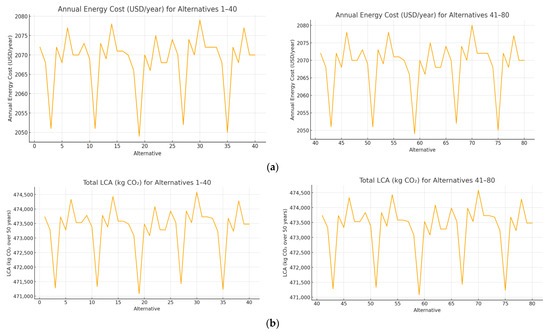
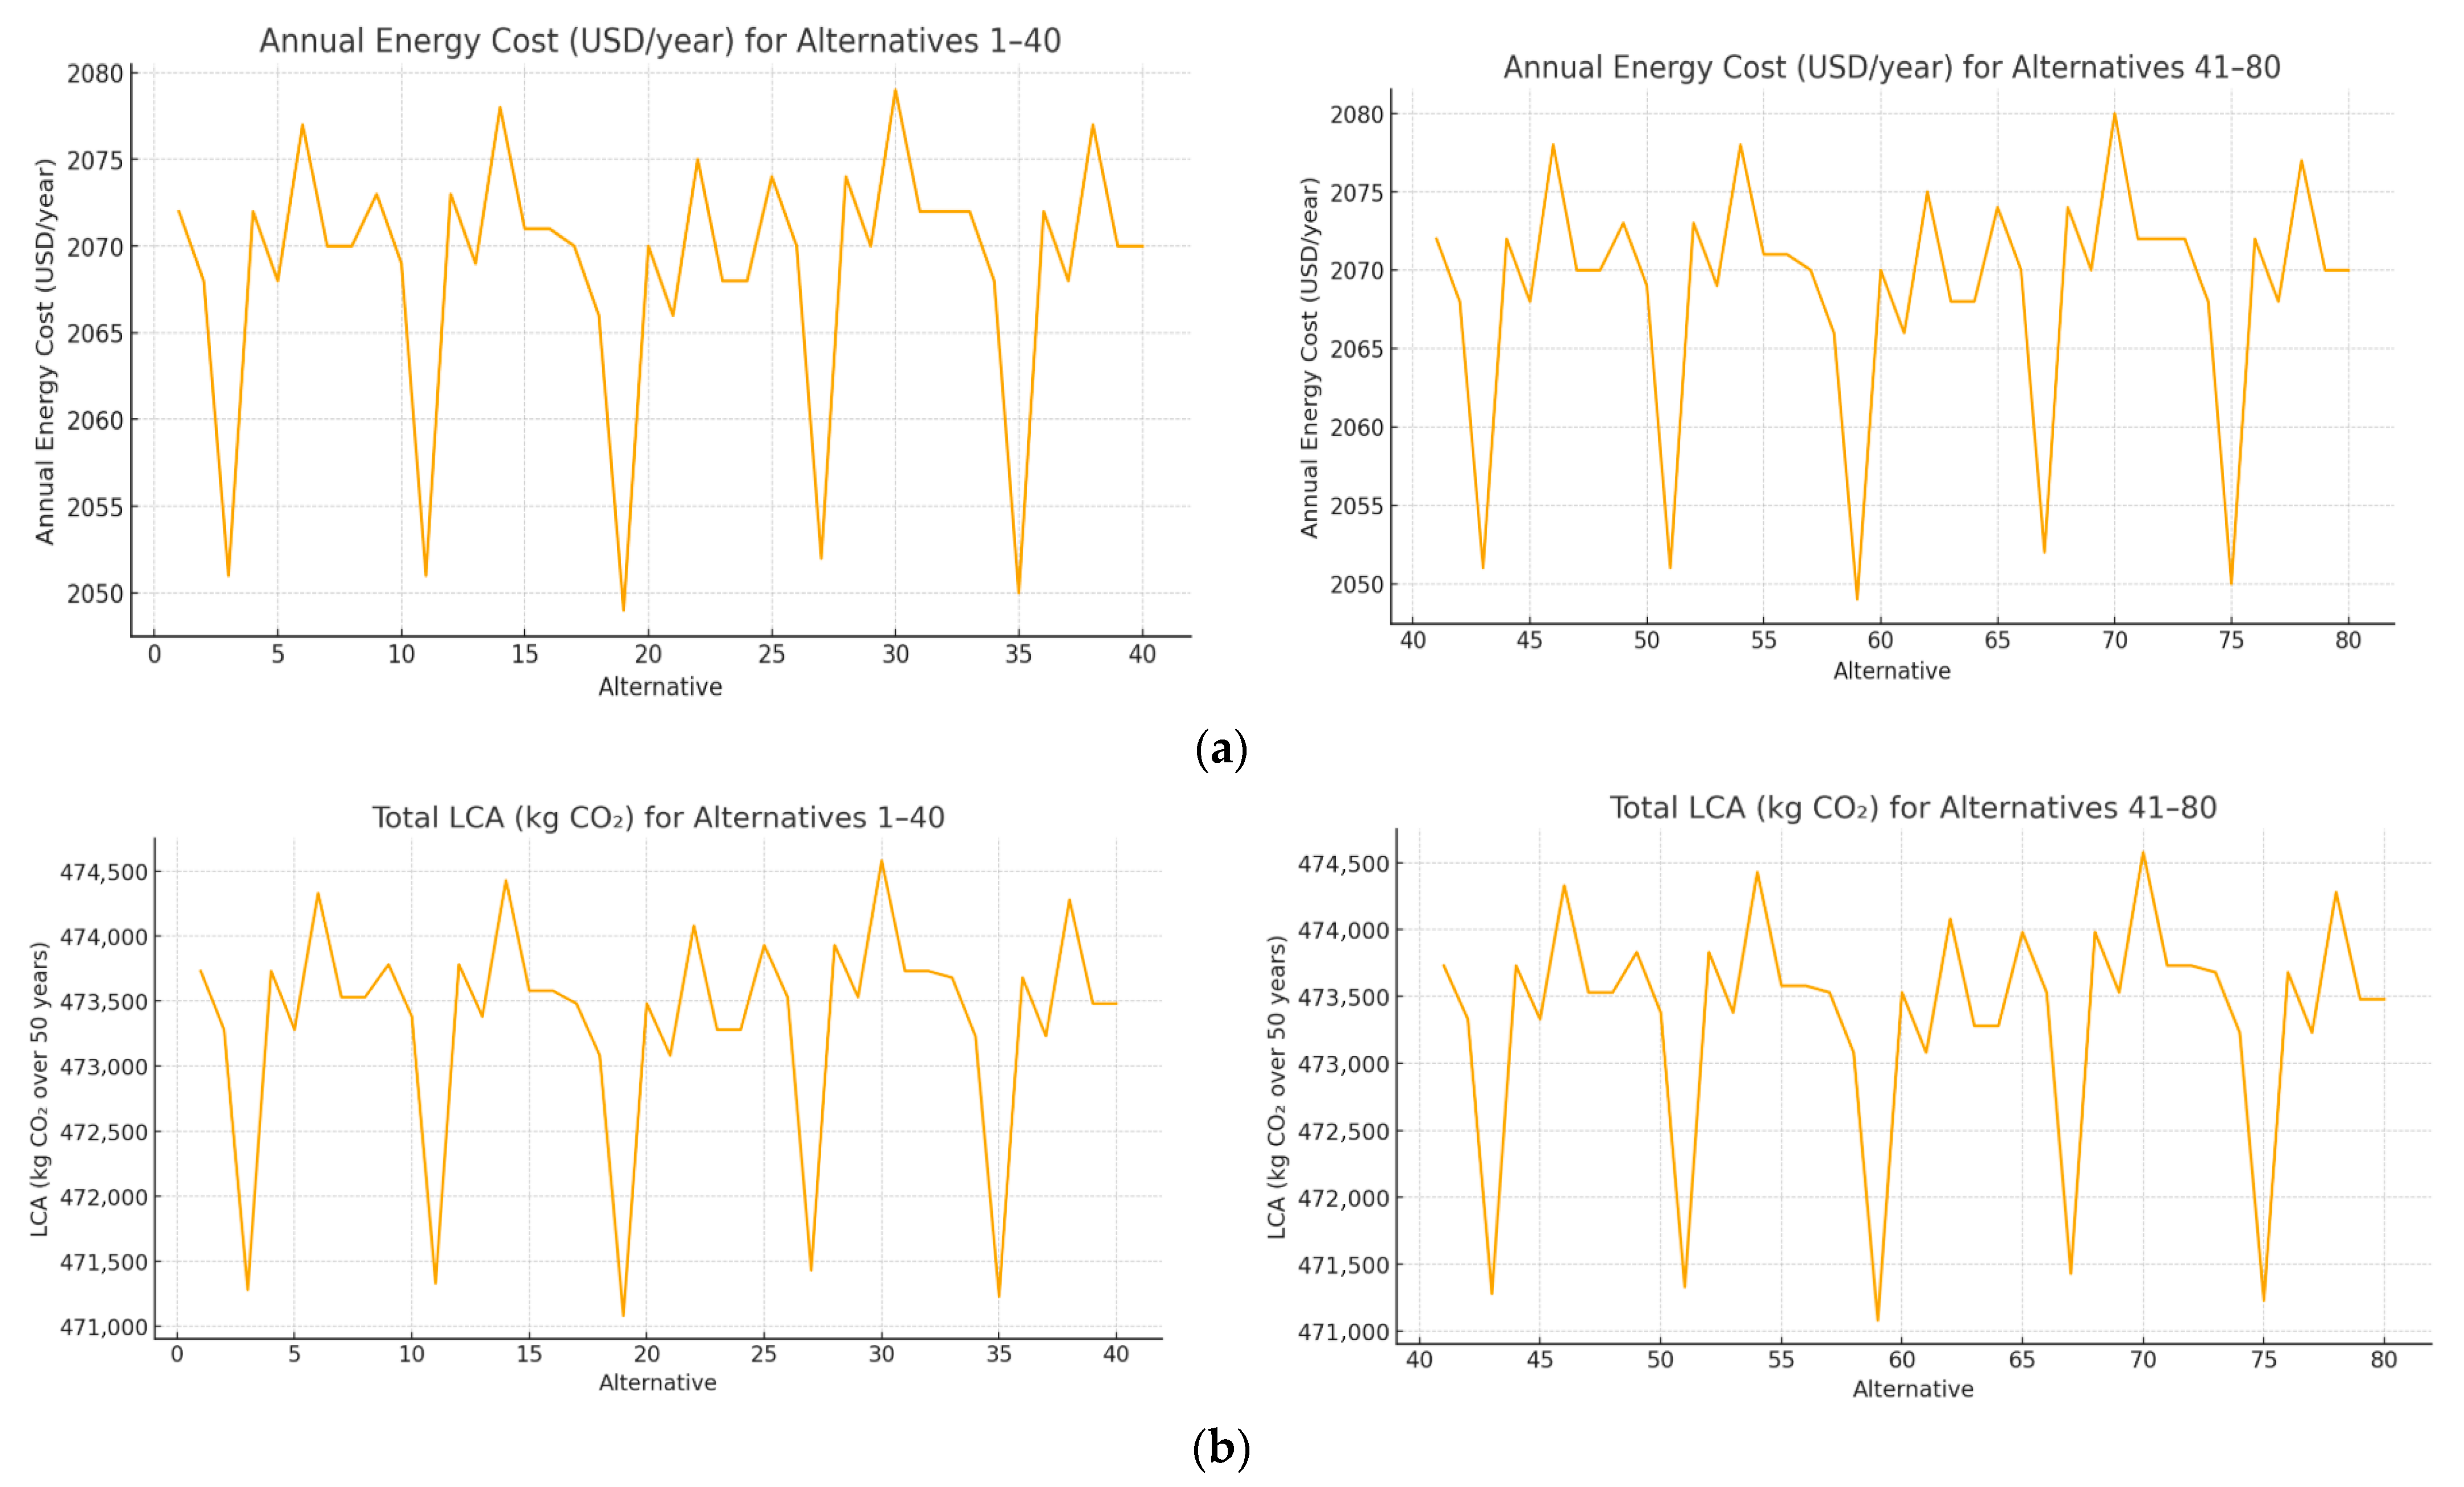
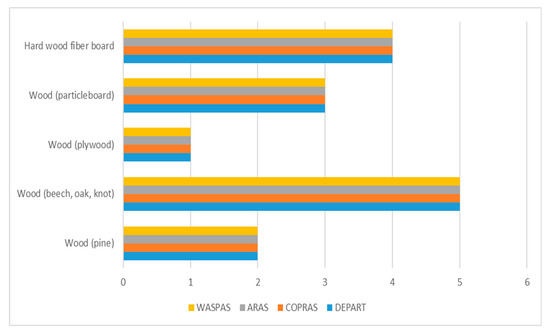
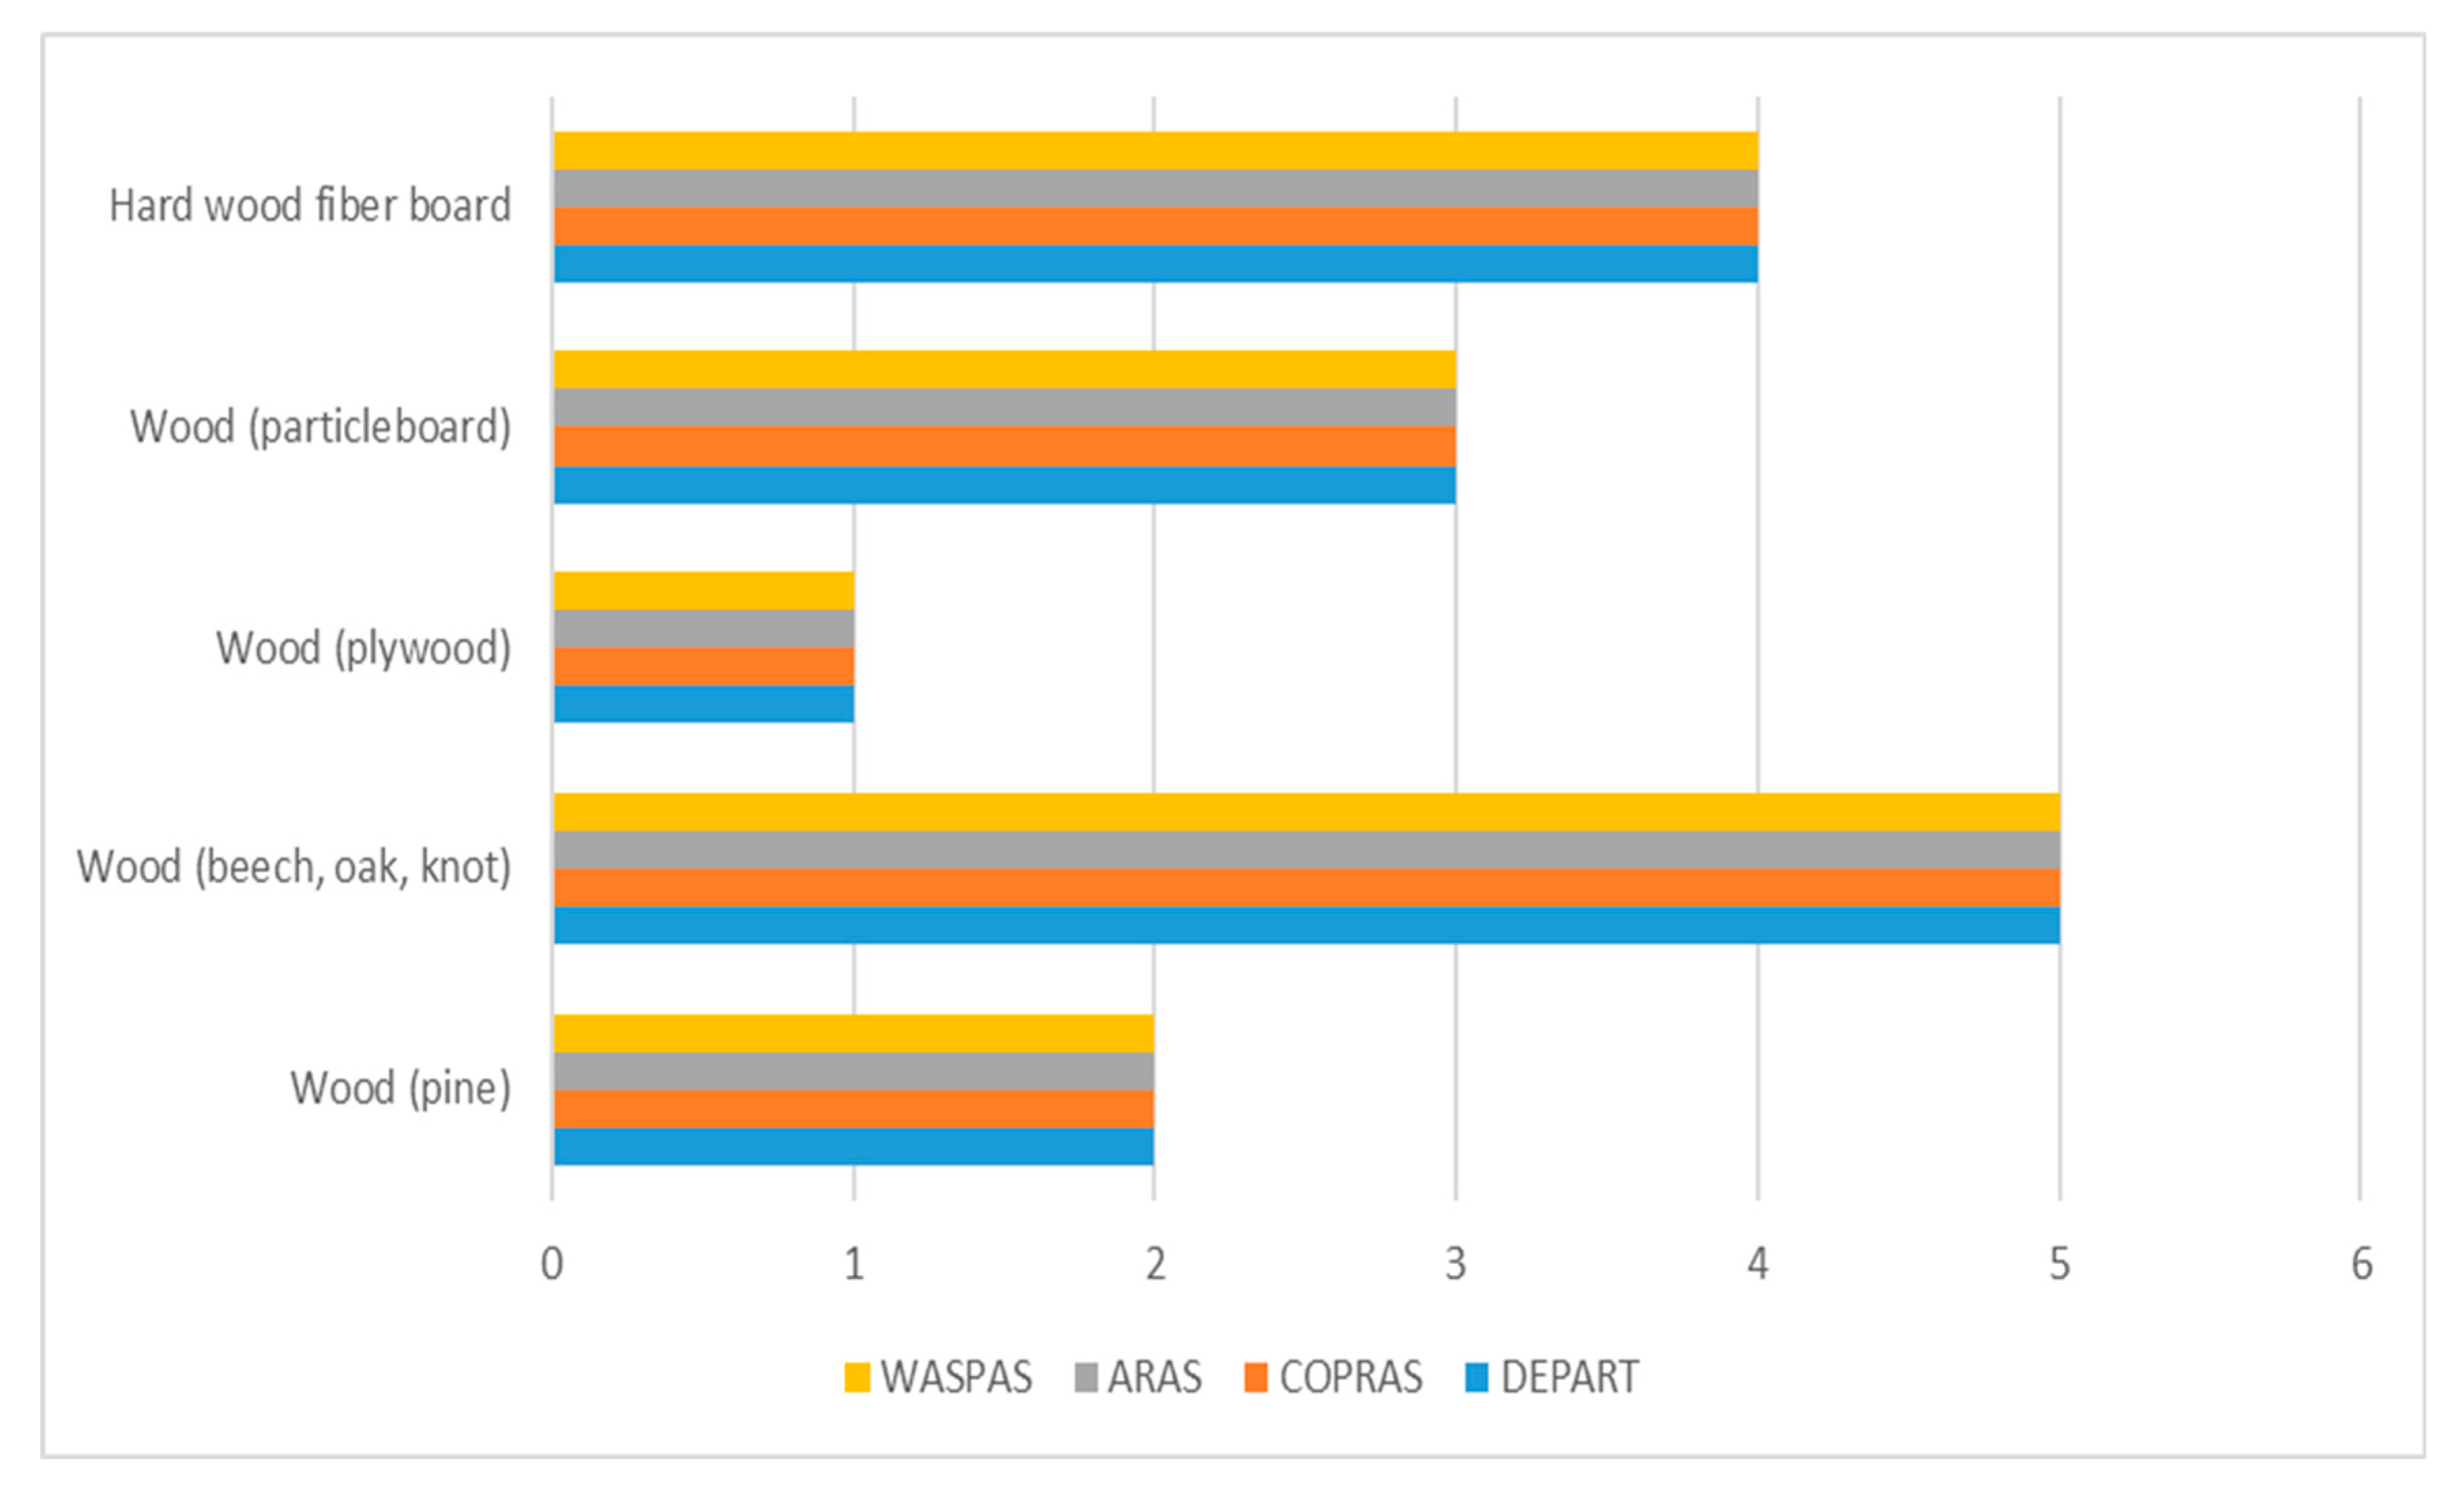
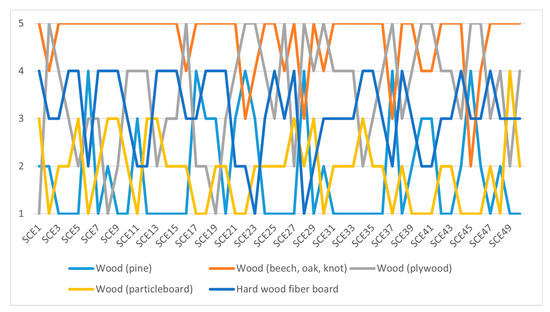
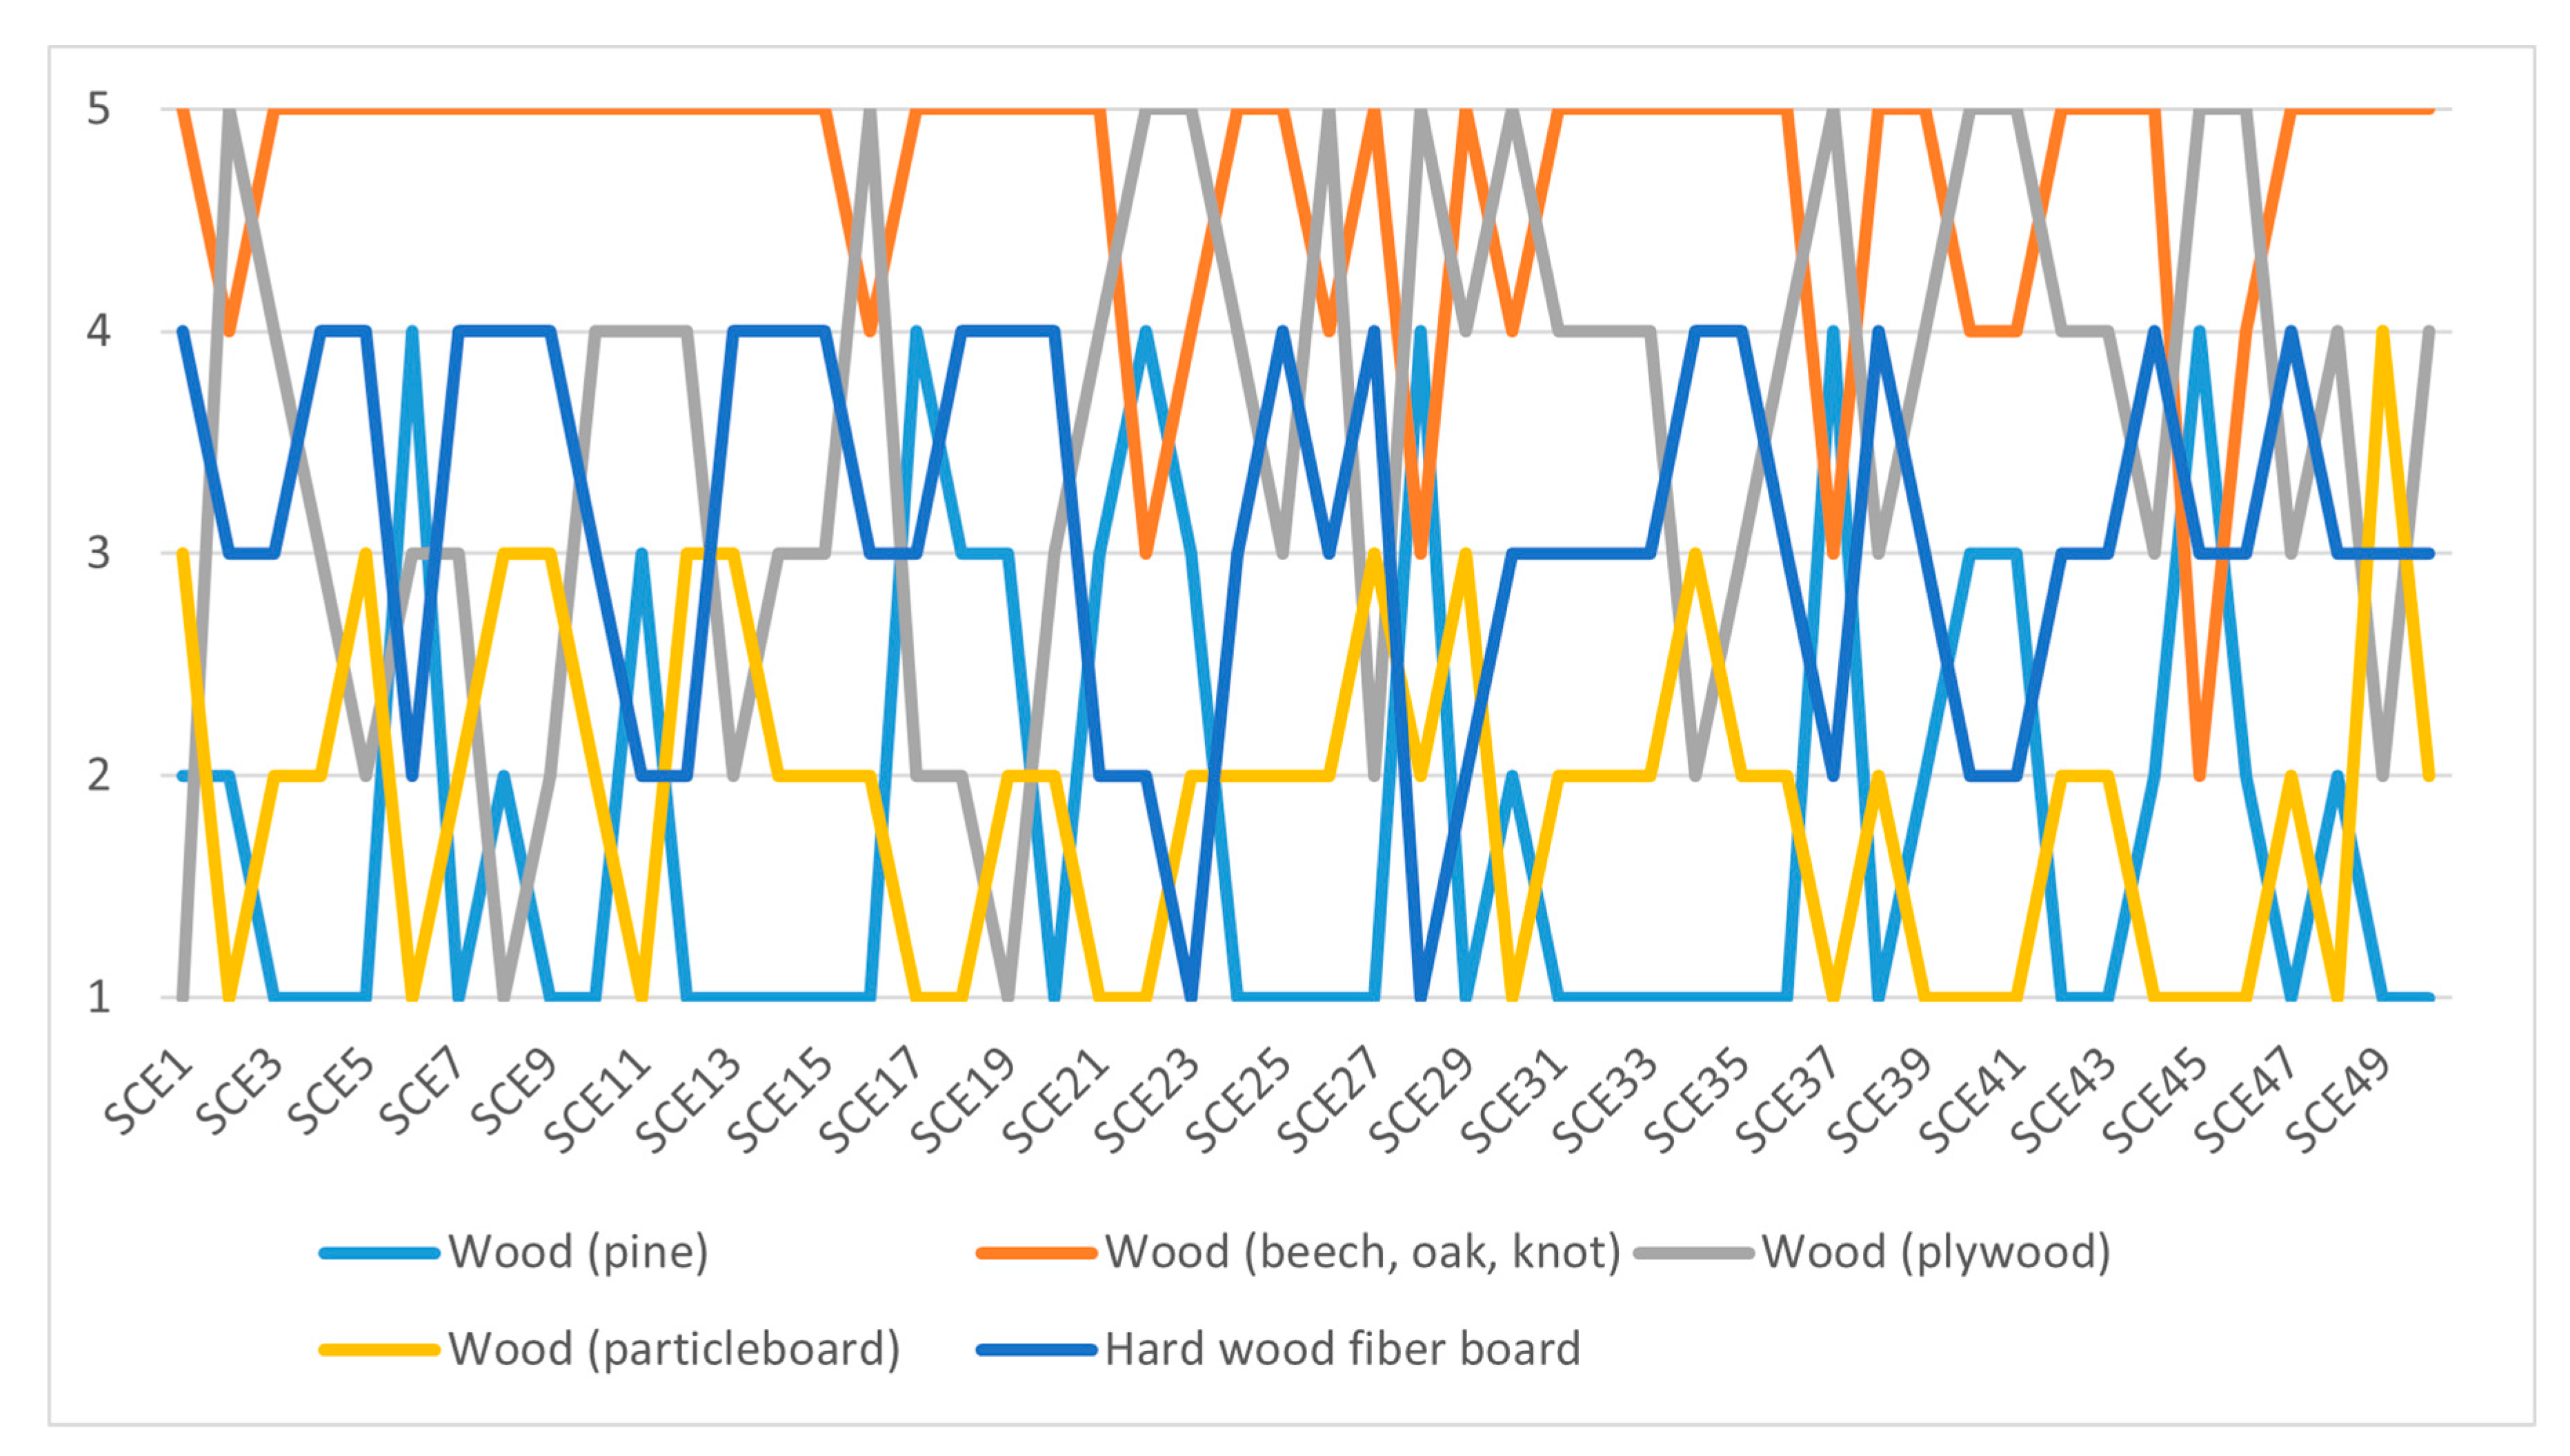

Disclaimer/Publisher’s Note: The statements, opinions and data contained in all publications are solely those of the individual author(s) and contributor(s) and not of MDPI and/or the editor(s). MDPI and/or the editor(s) disclaim responsibility for any injury to people or property resulting from any ideas, methods, instructions or products referred to in the content. |
© 2025 by the authors. Licensee MDPI, Basel, Switzerland. This article is an open access article distributed under the terms and conditions of the Creative Commons Attribution (CC BY) license.